Exhibit 99.2 KNX 3Q19 Earnings Presentation 1
Disclosure This presentation, including documents incorporated herein by reference, will contain forward- looking statements within the meaning of Section 27A of the Securities Act of 1933, as amended and Section 21E of the Securities Exchange Act of 1934, as amended. Such forward-looking statements are made pursuant to the safe harbor provisions of the Private Securities Litigation Reform Act of 1995. Forward-looking statements are subject to risks and uncertainties that could cause actual results to differ materially from those contemplated by the forward-looking statements. Please review our disclosures in filings with the United States Securities and Exchange Commission. Non-GAAP Financial Data This presentation includes the use of adjusted operating income, operating ratio, adjusted operating ratio, adjusted net income, adjusted earnings per share, adjusted pre-tax income, return on net tangible assets and free cash flow, which are financial measures that are not in accordance with United States generally accepted accounting principles (“GAAP”). Each such measure is a supplemental non-GAAP financial measure that is used by management and external users of our financial statements, such as industry analysts, investors and lenders. While management believes such measures are useful for investors, they should not be used as a replacement for financial measures that are in accordance with GAAP. In addition, our use of these non-GAAP measures should not be interpreted as indicating that these or similar items could not occur in future periods. In addition, adjusted operating ratio excludes trucking segment fuel surcharges from revenue and nets these surcharges against fuel expense. 2

Disclosure On September 8, 2017, pursuant to the Agreement and Plan of Merger, dated as of April 9, 2017, by Swift Transportation Company (“Swift”), Bishop Merger Sub, Inc., a direct wholly owned subsidiary of Swift, (“Merger Sub”), and Knight Transportation, Inc. (“Knight”), Merger Sub merged with and into Knight, with Knight surviving as a direct wholly owned subsidiary of Swift (the “2017 Merger”). Knight was the accounting acquirer and Swift was the legal acquirer in the 2017 Merger. In accordance with the accounting treatment applicable to the 2017 Merger, throughout this presentation, the reported results do not include the results of operations of Swift and its subsidiaries on and prior to the 2017 Merger date of September 8, 2017 (the “2017 Merger Date”). However, where indicated, certain historical information of Swift and its subsidiaries on and prior to the 2017 Merger Date, including their results of operations and certain operational statistics (collectively, the “Swift Historical Information”), has been provided. Management believes that presentation of the Swift Historical Information will be useful to investors. The Swift Historical Information has not been prepared in accordance with the rules of the Securities and Exchange Commission, including Article 11 of Regulation S-X, and it therefore does not reflect any of the pro forma adjustments that would be required by Article 11 of Regulation S-X. The Swift Historical Information does not purport to indicate the results that would have been obtained had the Swift and Knight businesses been operated together during the periods presented, or which may be realized in the future. 3
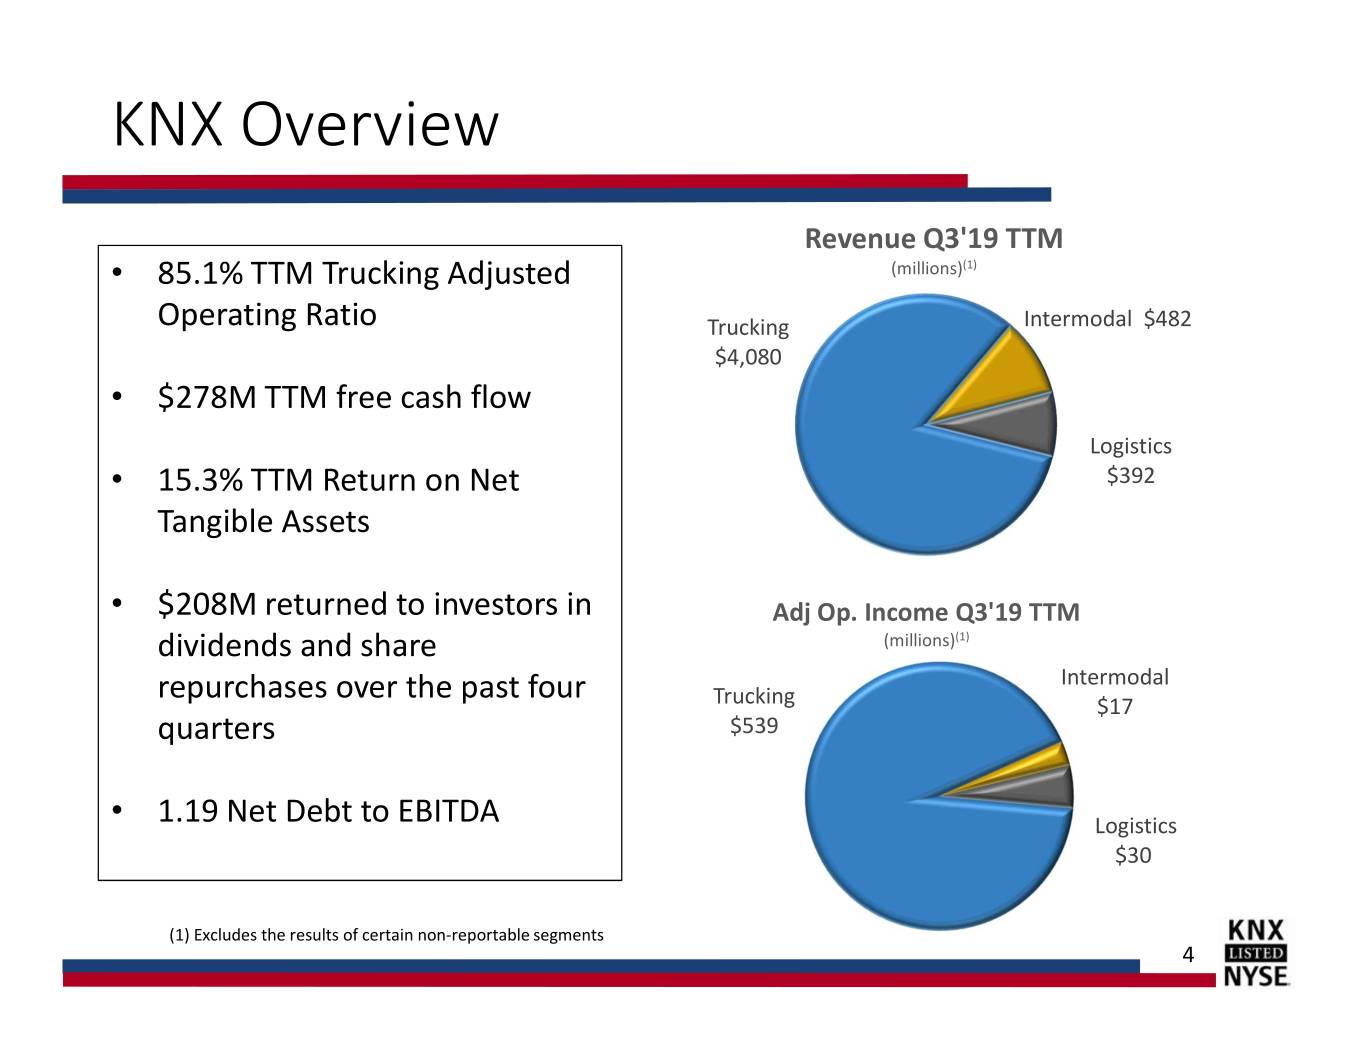
KNX Overview Revenue Q3'19 TTM • 85.1% TTM Trucking Adjusted (millions)(1) Operating Ratio Trucking Intermodal $482 $4,080 • $278M TTM free cash flow Logistics • 15.3% TTM Return on Net $392 Tangible Assets • $208M returned to investors in Adj Op. Income Q3'19 TTM dividends and share (millions)(1) repurchases over the past four Intermodal Trucking $17 quarters $539 • 1.19 Net Debt to EBITDA Logistics $30 (1) Excludes the results of certain non-reportable segments 4
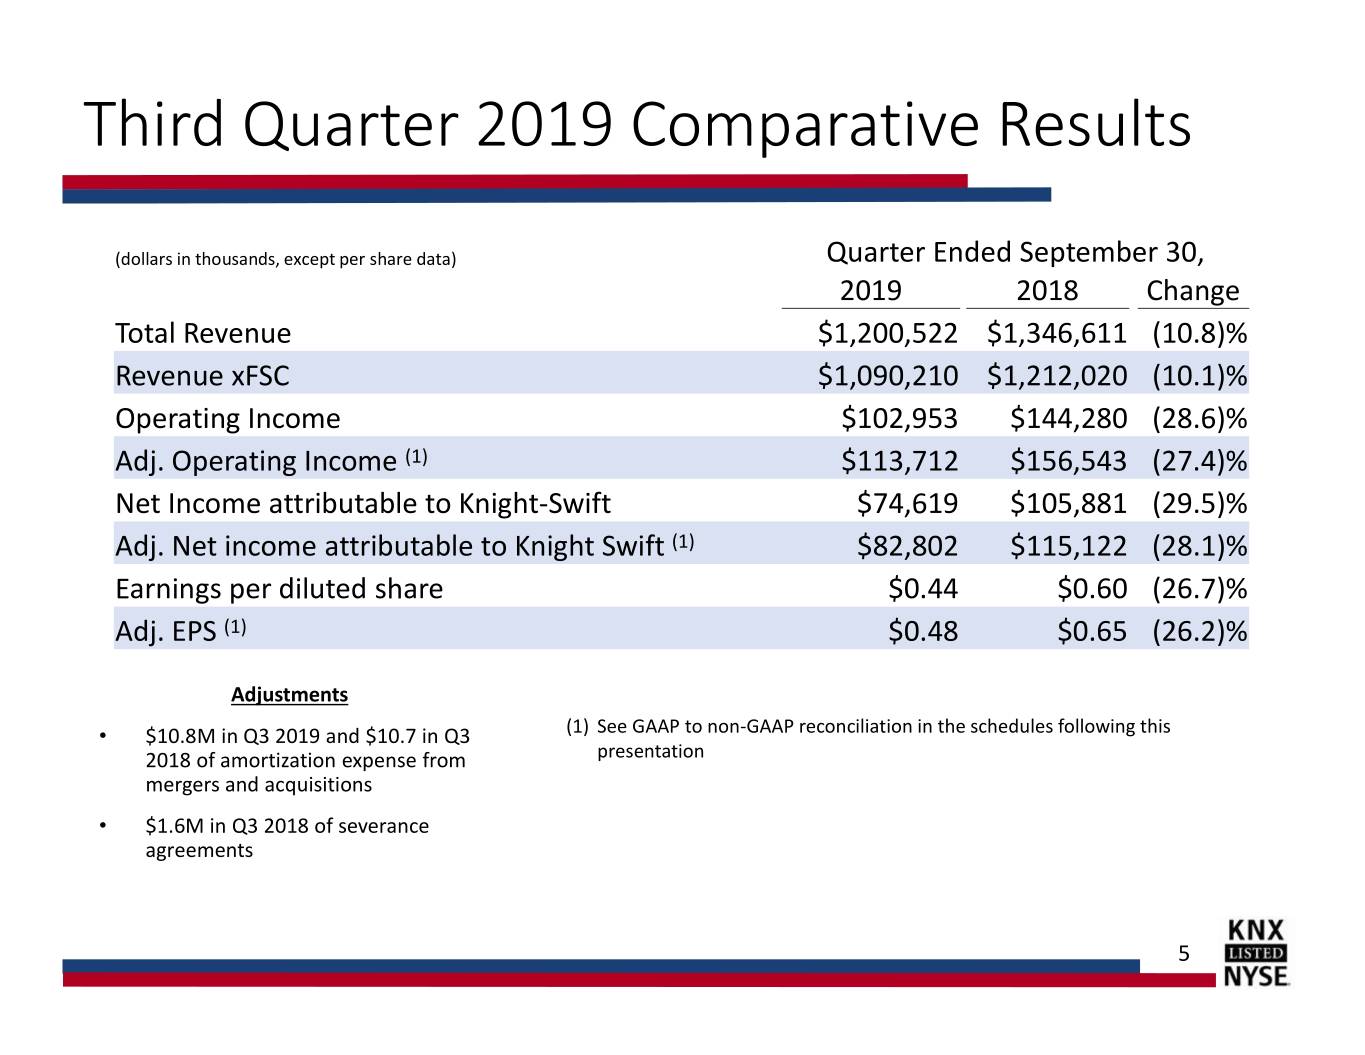
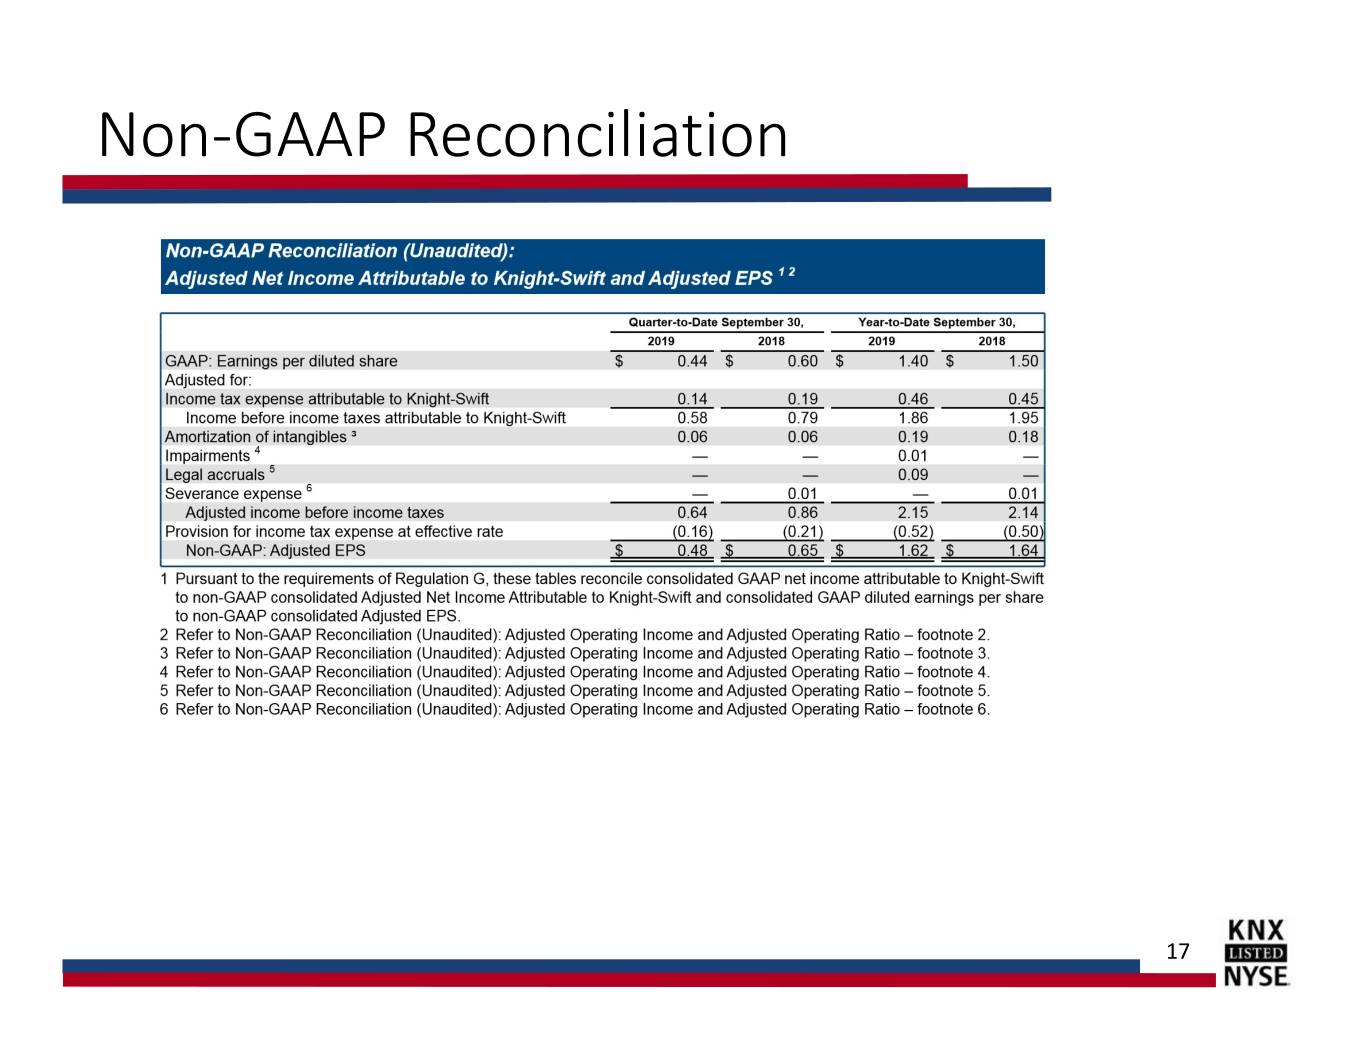
Third Quarter 2019 Comparative Results (dollars in thousands, except per share data) Quarter Ended September 30, 2019 2018 Change Total Revenue $1,200,522 $1,346,611 (10.8)% Revenue xFSC $1,090,210 $1,212,020 (10.1)% Operating Income $102,953 $144,280 (28.6)% Adj. Operating Income (1) $113,712 $156,543 (27.4)% Net Income attributable to Knight-Swift $74,619 $105,881 (29.5)% Adj. Net income attributable to Knight Swift (1) $82,802 $115,122 (28.1)% Earnings per diluted share $0.44 $0.60 (26.7)% Adj. EPS (1) $0.48 $0.65 (26.2)% Adjustments • $10.8M in Q3 2019 and $10.7 in Q3 (1) See GAAP to non-GAAP reconciliation in the schedules following this 2018 of amortization expense from presentation mergers and acquisitions • $1.6M in Q3 2018 of severance agreements 5

Operating Performance – Trucking Trucking Financial Metrics (dollars in thousands) • 87.5% Adjusted Operating Ratio Q3’19 Q3’18 Change in Q3 2019 compared to 84.9% Revenue xFSC $ 876,385 $ 936,301 (6.4)% the previous year Operating Income $ 109,409 $ 140,592 (22.2)% • Tractor count of 18,899 during Q3 Adjusted Operating Income(1) $ 109,758 $140,944 (22.1)% 2019 is virtually unchanged from Operating Ratio 88.9% 86.9% 200 bps the prior year Adjusted Operating Ratio(1) 87.5% 84.9% 260 bps • 87.0% Swift Truckload Adj. Operating Ratio Trucking Operating Statistics • 83.7% Knight Truckload Adj. Operating Ratio Q3’19 Q3’18 Change Average revenue per Tractor $ 46,372 $ 49,524 (6.4)% • 2.7% reduction in revenue Average Tractors 18,899 18,906 0.0% excluding fsc per loaded mile from Q3 2018 Average Trailers 57,899 60,215 (3.9)% Miles per Tractor 23,397 24,402 (4.1)% (1) See GAAP to non-GAAP reconciliation in the schedules following this presentation. 6
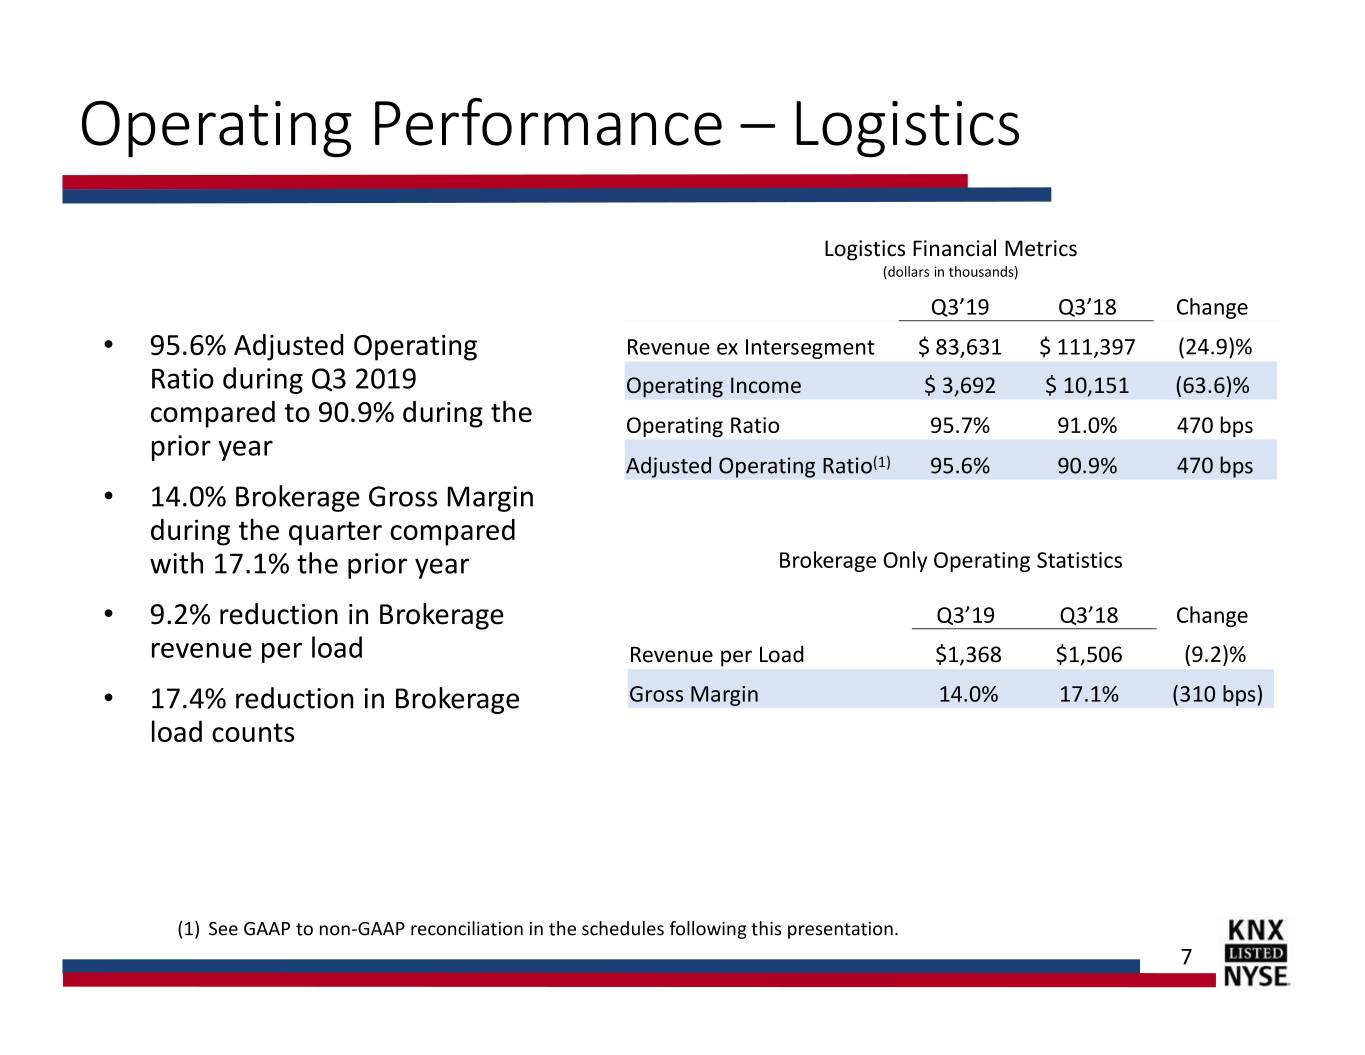
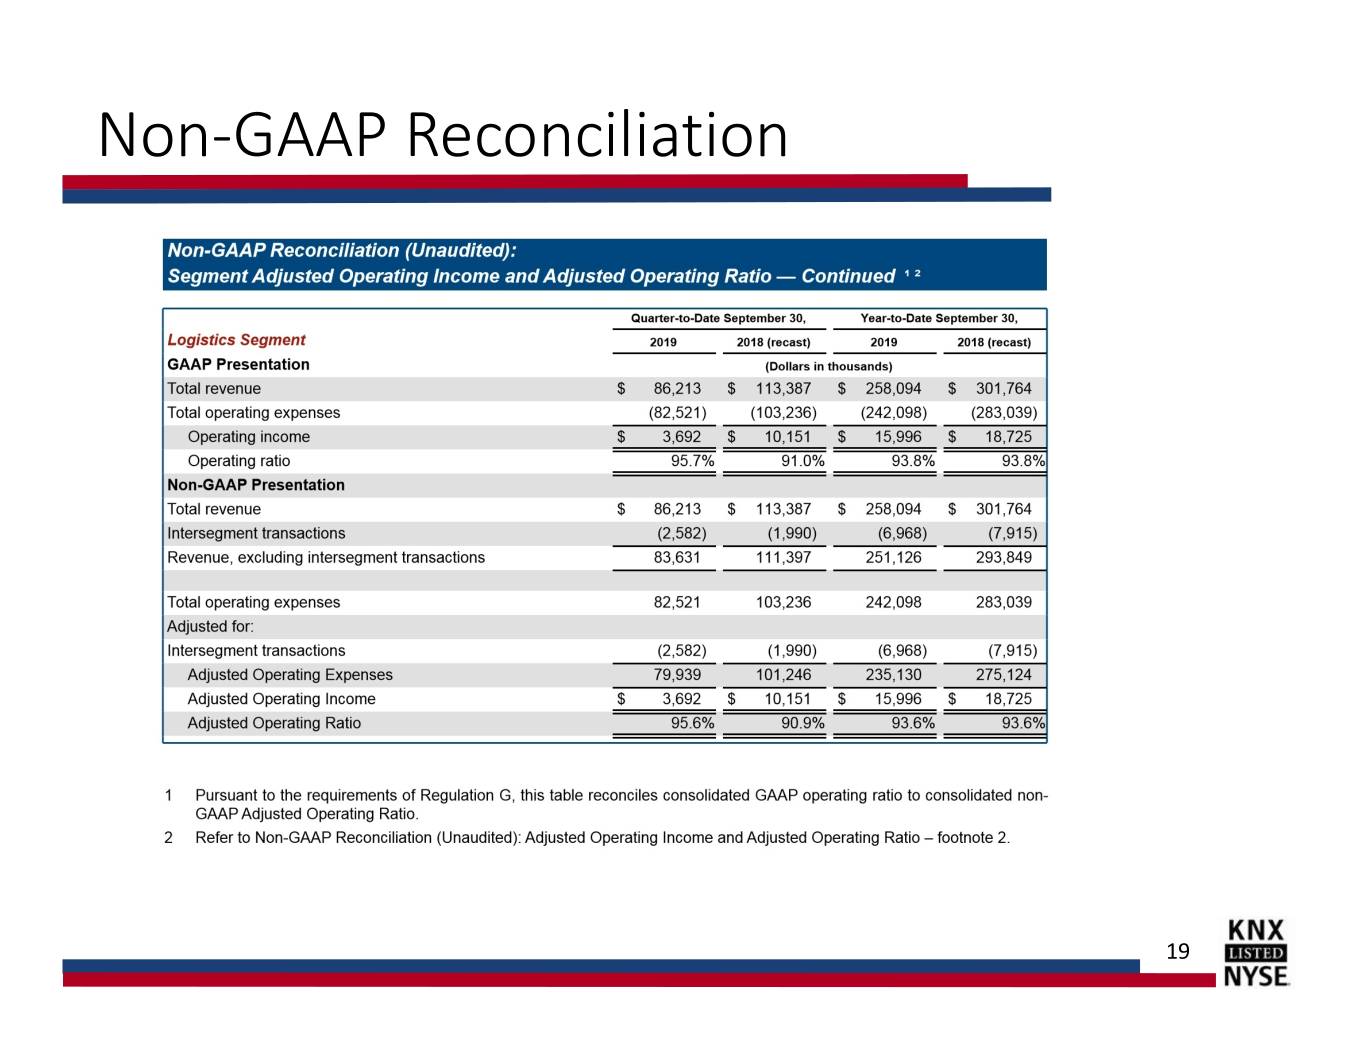
Operating Performance – Logistics Logistics Financial Metrics (dollars in thousands) Q3’19 Q3’18 Change • 95.6% Adjusted Operating Revenue ex Intersegment $ 83,631 $ 111,397 (24.9)% Ratio during Q3 2019 Operating Income $ 3,692 $ 10,151 (63.6)% compared to 90.9% during the Operating Ratio 95.7% 91.0% 470 bps prior year Adjusted Operating Ratio(1) 95.6% 90.9% 470 bps • 14.0% Brokerage Gross Margin during the quarter compared with 17.1% the prior year Brokerage Only Operating Statistics • 9.2% reduction in Brokerage Q3’19 Q3’18 Change revenue per load Revenue per Load $1,368 $1,506 (9.2)% • 17.4% reduction in Brokerage Gross Margin 14.0% 17.1% (310 bps) load counts (1) See GAAP to non-GAAP reconciliation in the schedules following this presentation. 7
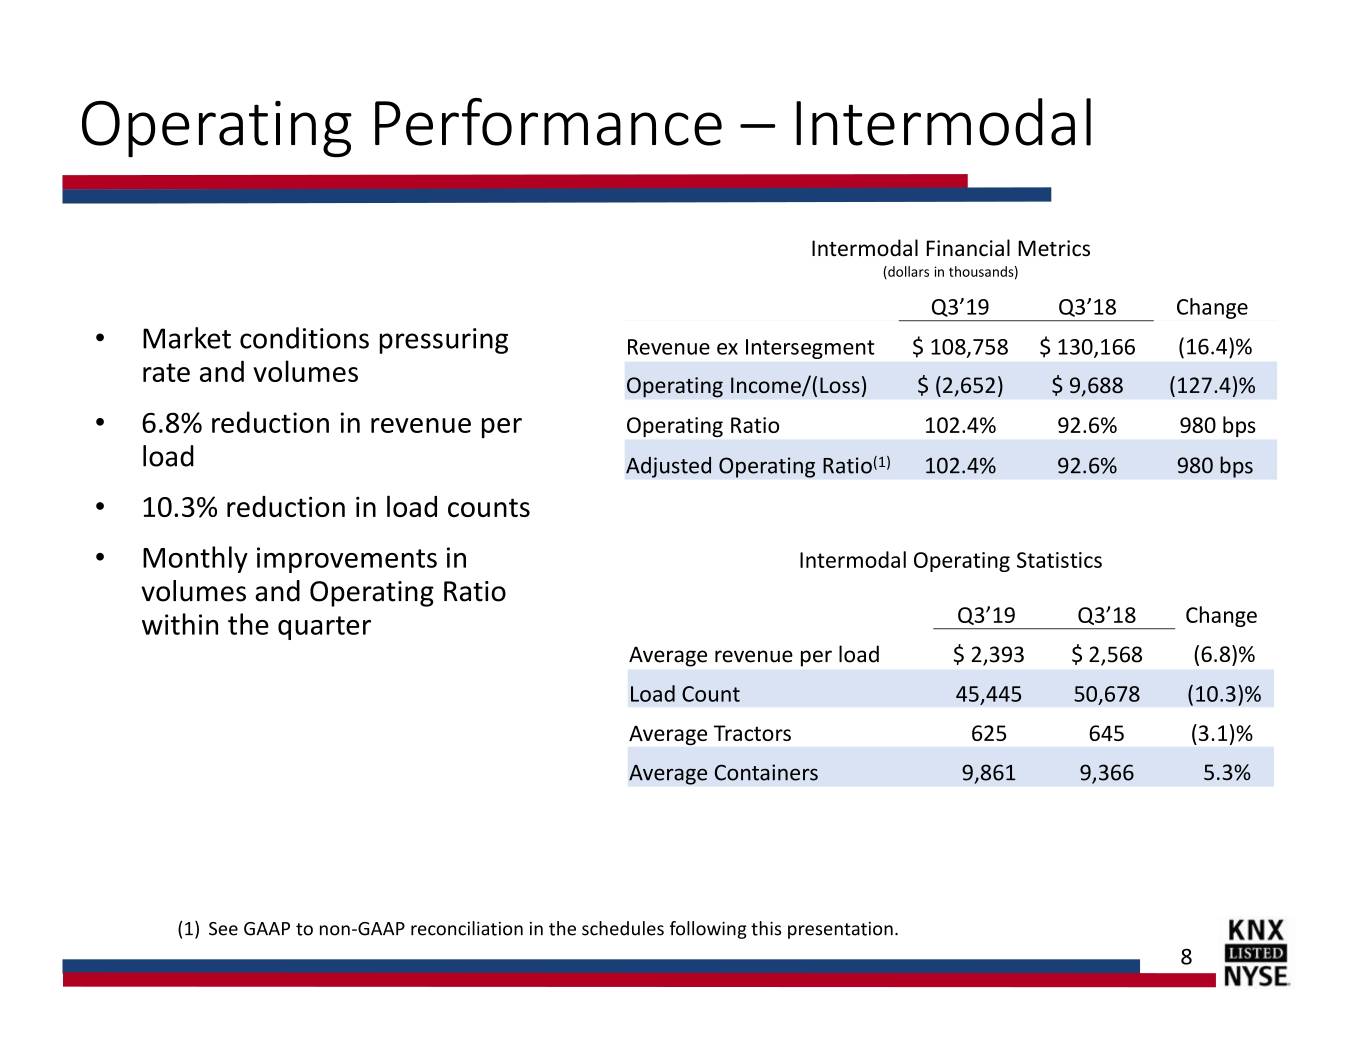
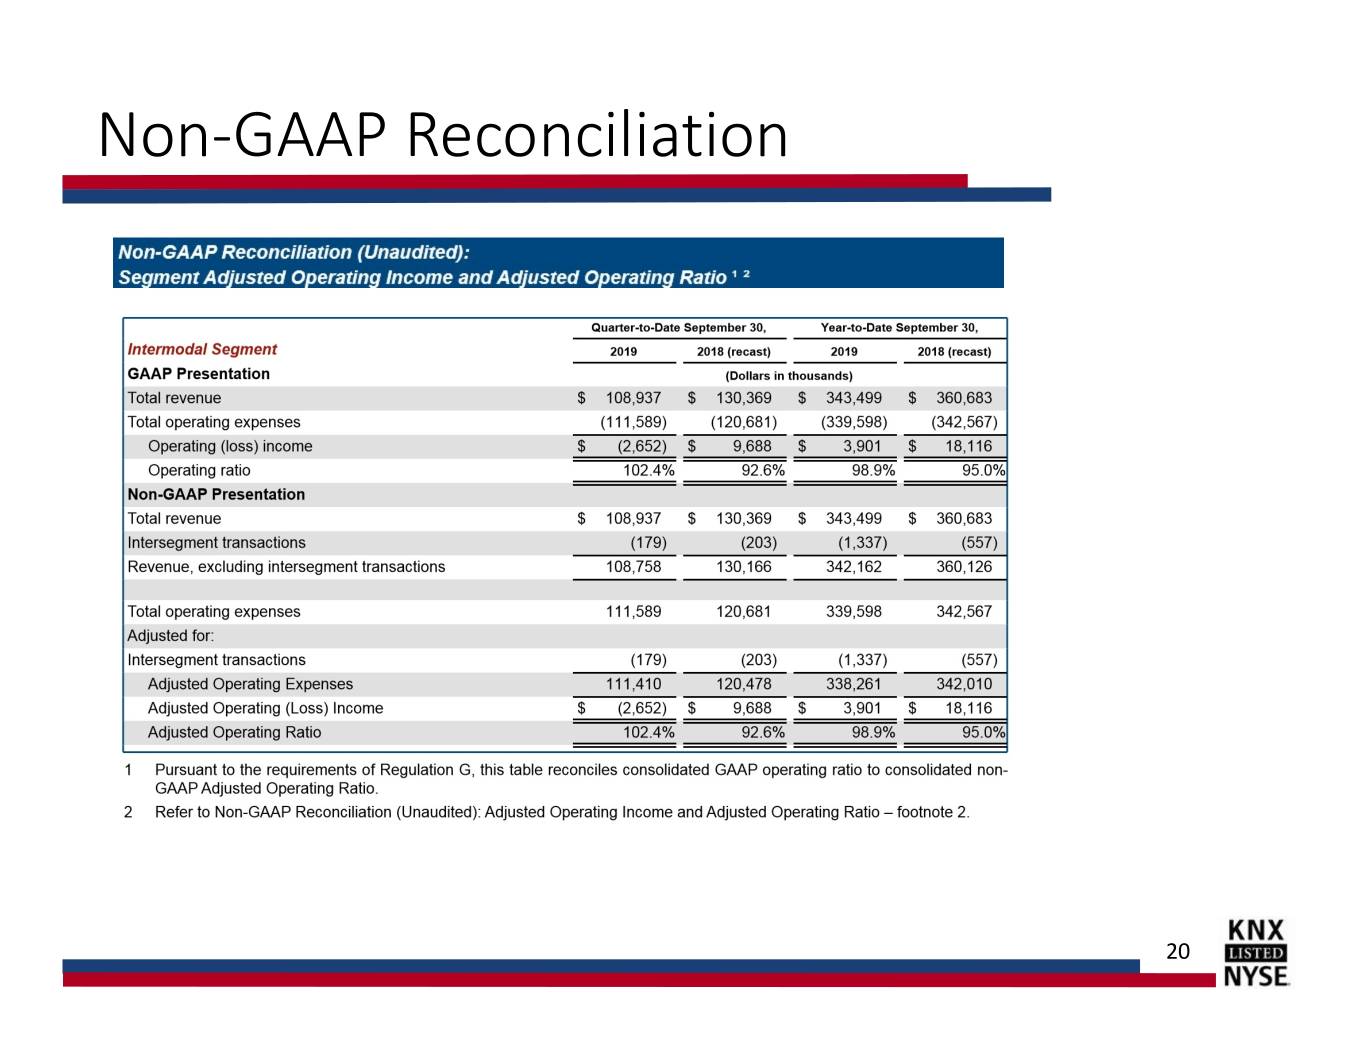
Operating Performance – Intermodal Intermodal Financial Metrics (dollars in thousands) Q3’19 Q3’18 Change • Market conditions pressuring Revenue ex Intersegment $ 108,758 $ 130,166 (16.4)% rate and volumes Operating Income/(Loss) $ (2,652) $ 9,688 (127.4)% • 6.8% reduction in revenue per Operating Ratio 102.4% 92.6% 980 bps load Adjusted Operating Ratio(1) 102.4% 92.6% 980 bps • 10.3% reduction in load counts • Monthly improvements in Intermodal Operating Statistics volumes and Operating Ratio within the quarter Q3’19 Q3’18 Change Average revenue per load $ 2,393 $ 2,568 (6.8)% Load Count 45,445 50,678 (10.3)% Average Tractors 625 645 (3.1)% Average Containers 9,861 9,366 5.3% (1) See GAAP to non-GAAP reconciliation in the schedules following this presentation. 8

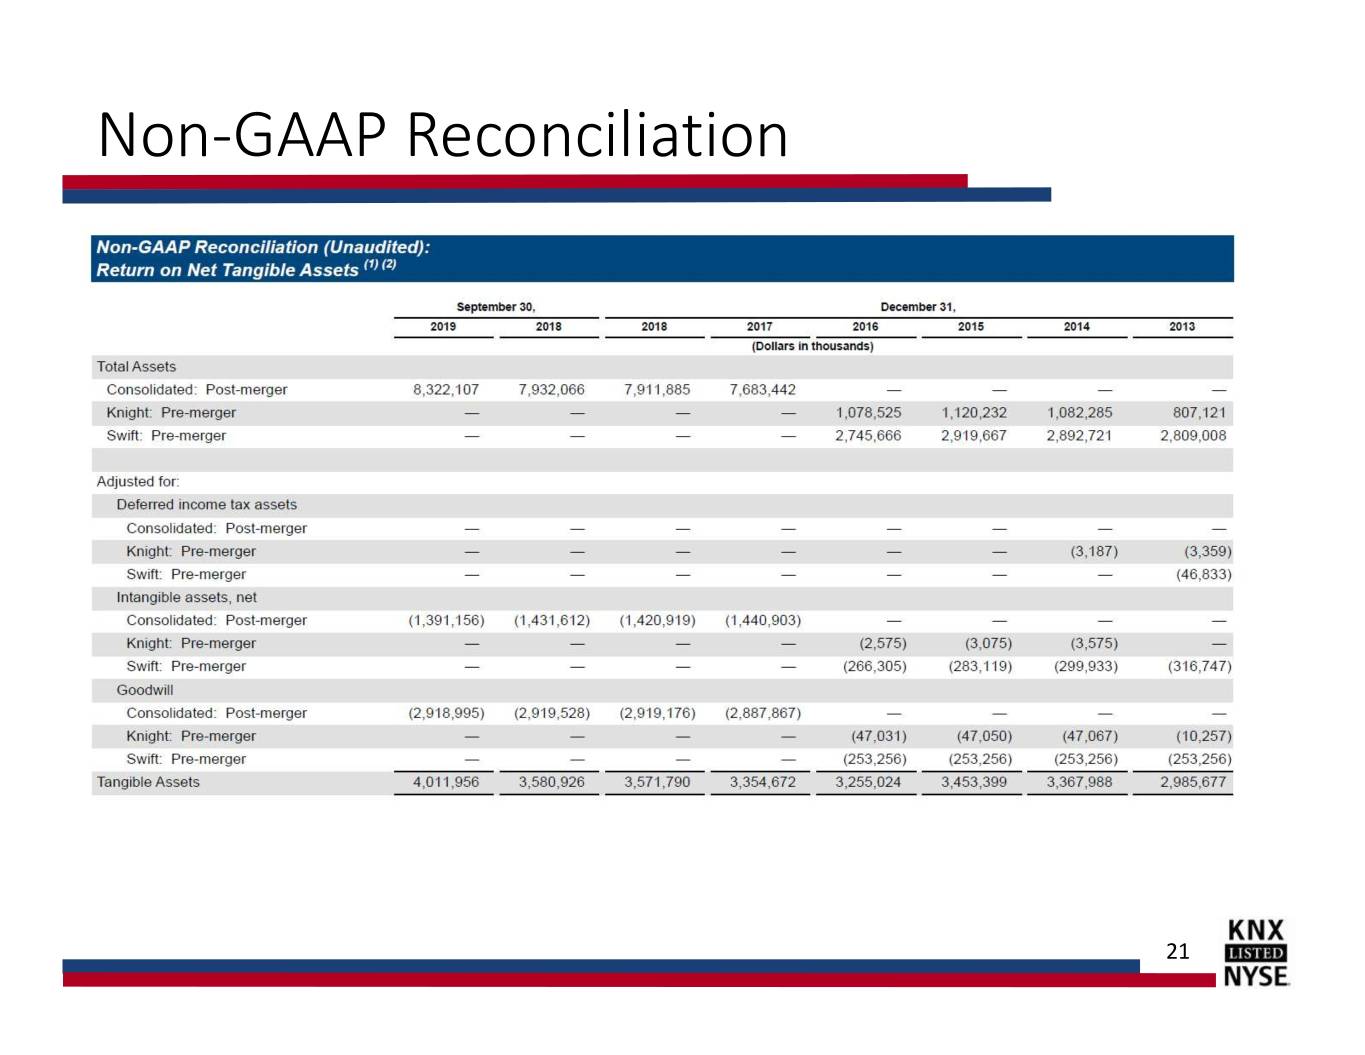
Significant Value Creation TTM vs Adjusted Pretax Income (1)(2) prior years (in millions) $700 • $599M $587M Knight-Swift $600 $535M continues to $500 $479M $392M $400 generate $313M $300 meaningful income $200 12/31/2014 12/31/2015 12/31/2016 12/31/2017 12/31/2018 9/30/2019 • 15.3% TTM Return TTM on Net Tangible Return on Net Assets (1)(2) Assets 22% 17.0% 17% 15.3% 11.4% 11.8% 12% 9.4% 7.5% 7% 2% 12/31/2014 12/31/2015 12/31/2016 12/31/2017 12/31/2018 9/30/2019 TTM (1) See GAAP to non-GAAP reconciliation in the schedules following this release. (2) Historical information prior to the Swift merger in Sept 2017 has not been prepared in accordance with the rules of the United States Securities and Exchange Commission, including Article 11 of Regulation S-X, and it therefore does not reflect any of the pro forma adjustments that would be required by Article 11 of Regulation S-X. The Swift Historical Information does not purport to indicate the results that would have been obtained had the Swift and Knight businesses been operated together during the period presented, or which may be realized in the future. 9
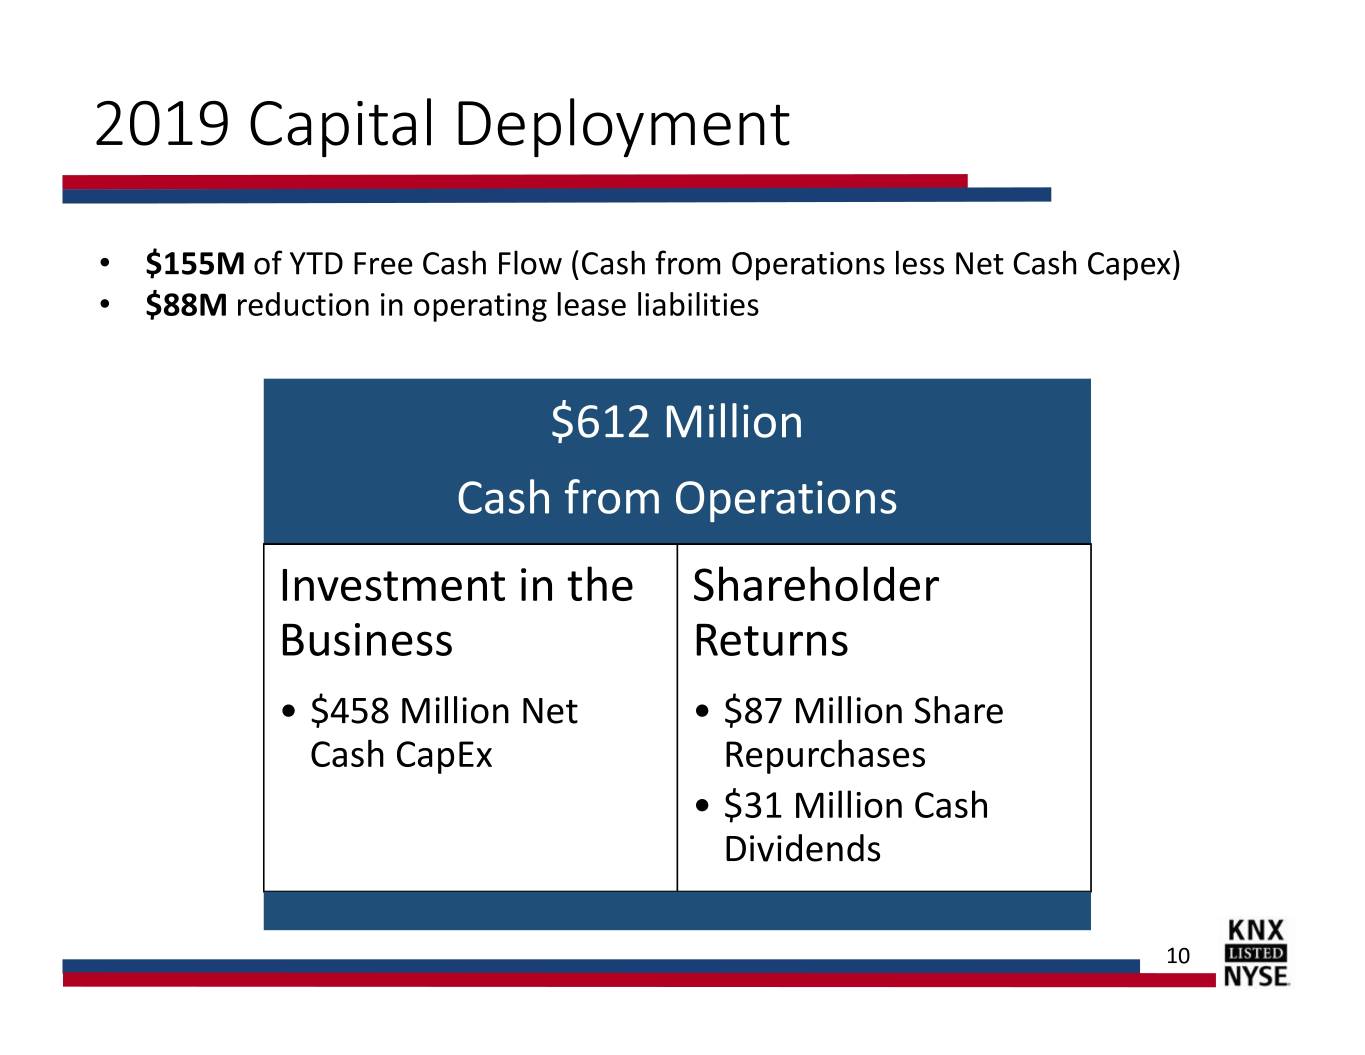
2019 Capital Deployment • $155M of YTD Free Cash Flow (Cash from Operations less Net Cash Capex) • $88M reduction in operating lease liabilities $612 Million Cash from Operations Investment in the Shareholder Business Returns • $458 Million Net • $87 Million Share Cash CapEx Repurchases • $31 Million Cash Dividends 10
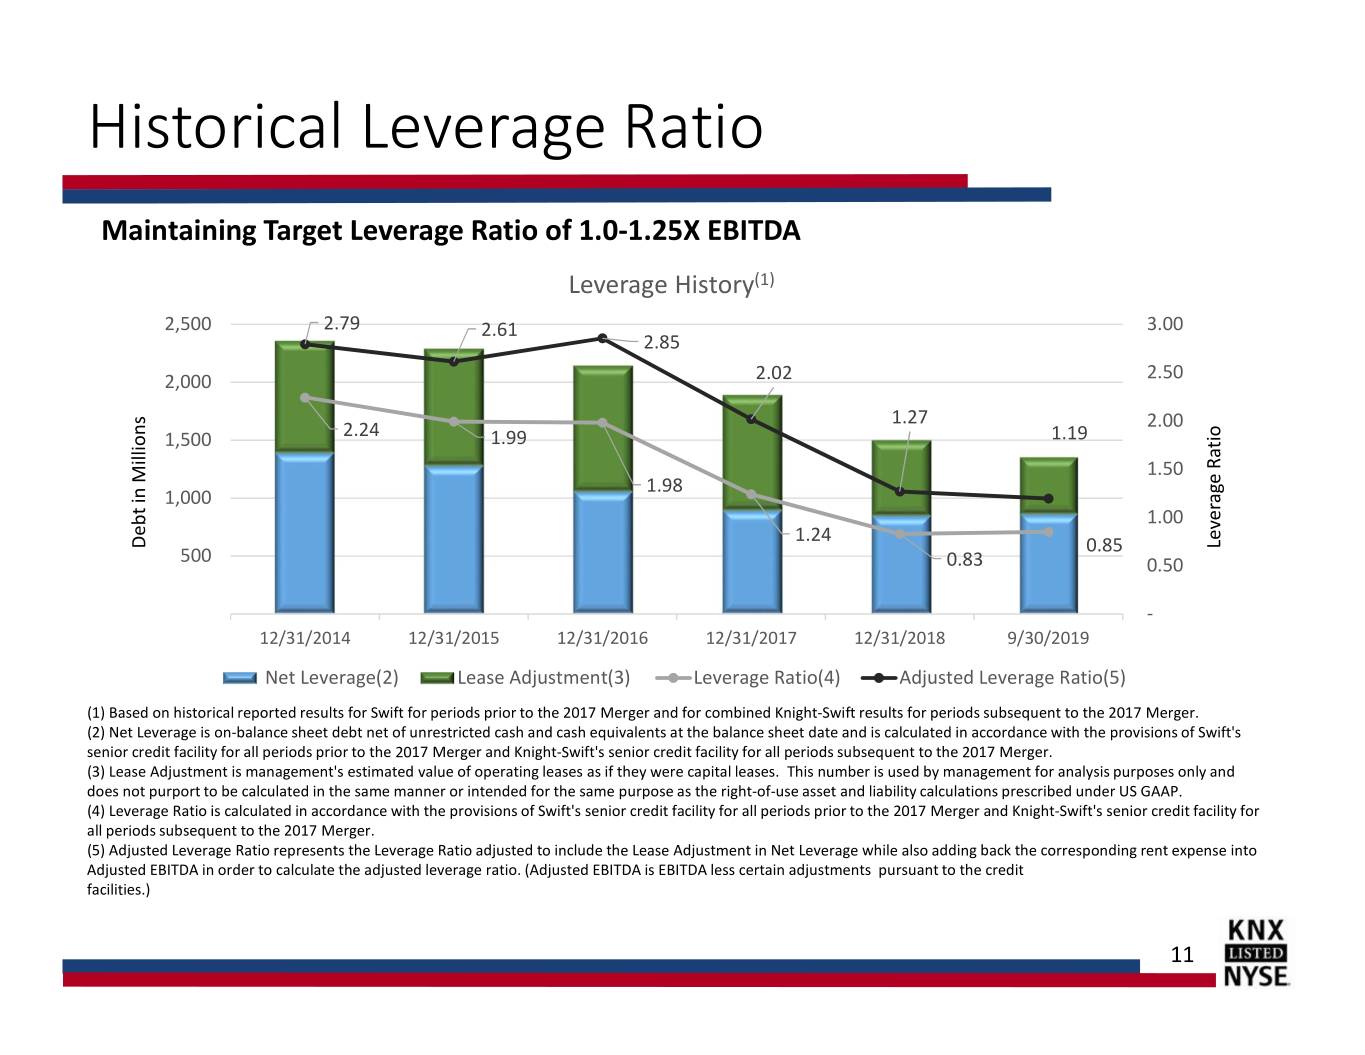
Historical Leverage Ratio Maintaining Target Leverage Ratio of 1.0-1.25X EBITDA Leverage History(1) 2,500 2.79 2.61 3.00 2.85 2,000 2.02 2.50 1.27 2.00 1,500 2.24 1.99 1.19 1.50 1.98 1,000 1.00 1.24 Debt Debt in Millions 0.85 Leverage Ratio 500 0.83 0.50 - 12/31/2014 12/31/2015 12/31/2016 12/31/2017 12/31/2018 9/30/2019 Net Leverage(2) Lease Adjustment(3) Leverage Ratio(4) Adjusted Leverage Ratio(5) (1) Based on historical reported results for Swift for periods prior to the 2017 Merger and for combined Knight-Swift results for periods subsequent to the 2017 Merger. (2) Net Leverage is on-balance sheet debt net of unrestricted cash and cash equivalents at the balance sheet date and is calculated in accordance with the provisions of Swift's senior credit facility for all periods prior to the 2017 Merger and Knight-Swift's senior credit facility for all periods subsequent to the 2017 Merger. (3) Lease Adjustment is management's estimated value of operating leases as if they were capital leases. This number is used by management for analysis purposes only and does not purport to be calculated in the same manner or intended for the same purpose as the right-of-use asset and liability calculations prescribed under US GAAP. (4) Leverage Ratio is calculated in accordance with the provisions of Swift's senior credit facility for all periods prior to the 2017 Merger and Knight-Swift's senior credit facility for all periods subsequent to the 2017 Merger. (5) Adjusted Leverage Ratio represents the Leverage Ratio adjusted to include the Lease Adjustment in Net Leverage while also adding back the corresponding rent expense into Adjusted EBITDA in order to calculate the adjusted leverage ratio. (Adjusted EBITDA is EBITDA less certain adjustments pursuant to the credit facilities.) 11
2020 Market Outlook Signs of industry capacity reductions • Significantly less new truck and trailer orders • Increased new truck order cancellations • Weak used equipment market • Transportation failures on the rise • Driver employment trending negative 1st Half of 2020 • Freight market continues to be pressured • Fewer and less attractive non-contract opportunities • Acquisition opportunities 2nd Half of 2020 • Freight market to inflect positively • Increased spot and non-contract opportunities 12
Q4 2019 & Q1 2020 Guidance • Expected Adjusted EPS for the fourth quarter 2019 of $0.62 - $0.65 • Expected Adjusted EPS for the first quarter 2020 of $0.42 - $0.46 Guidance Assumptions • Revenue per loaded mile will be negative year over year as we lap prior year contract rate increases with less favorable non contract opportunities • Seasonal but less robust Q3 to Q4 trends • The unfavorable year-over-year percent changes in miles per tractor will lessen • Year over year margin deterioration • Tax rate of 25-26% • Full year expected 2019 net cash capex of $550M - $575M These estimates represent Management’s best estimates based on current information available. Actual results may differ materially from these estimates. We would refer you to the Risk Factors sections of the Company’s annual report for a discussion of the risks that may affect results. 13
Appendix 14

Non-GAAP Reconciliation 15
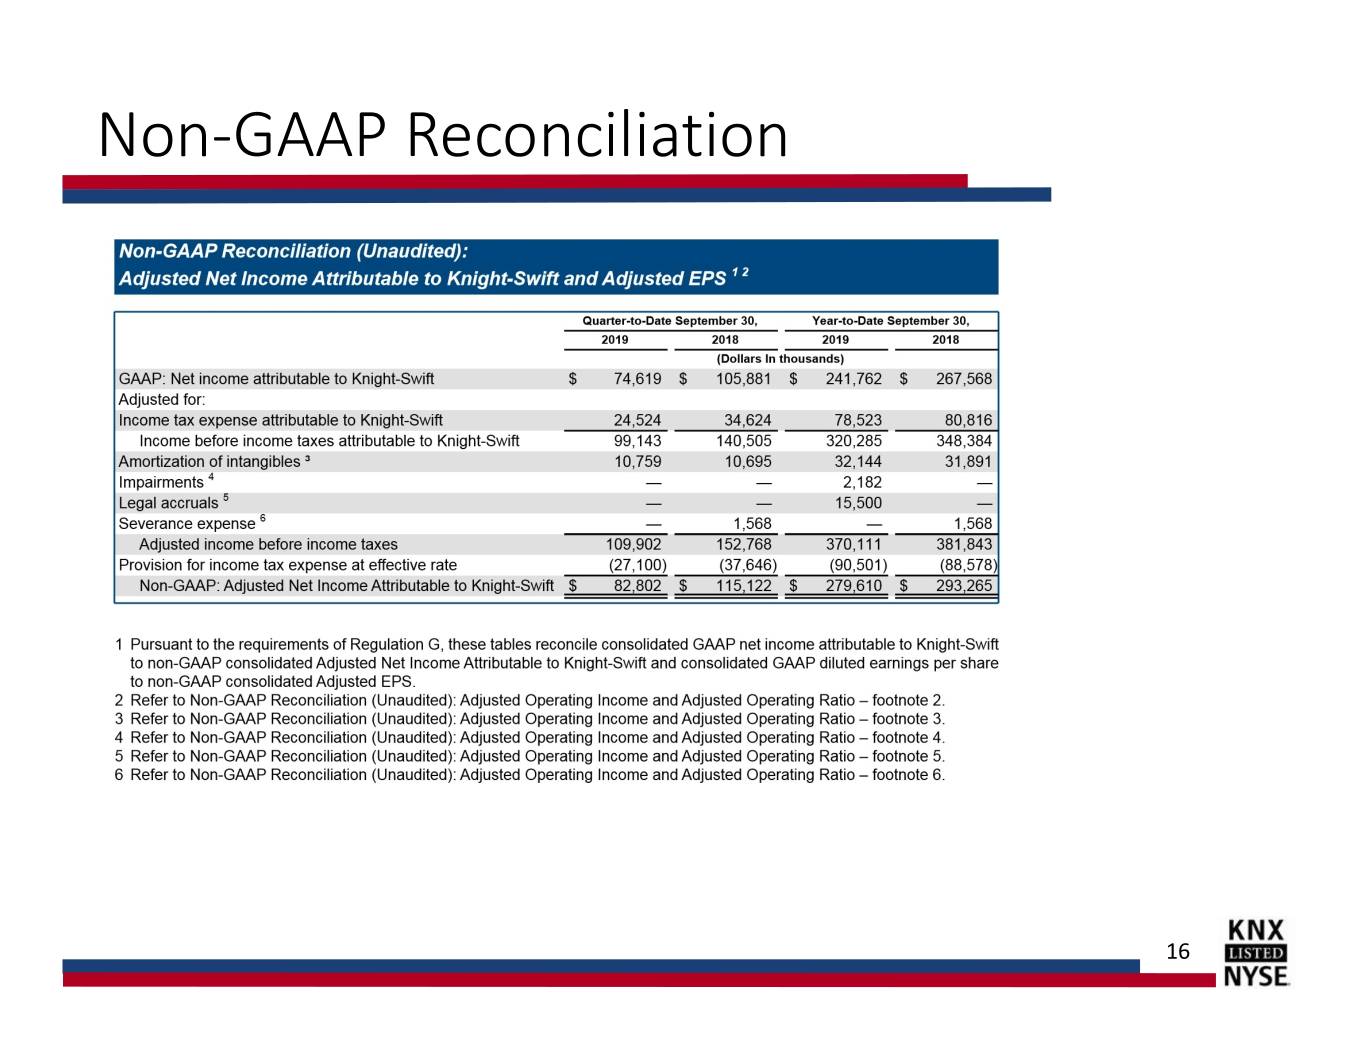
Non-GAAP Reconciliation 16
Non-GAAP Reconciliation 17

Non-GAAP Reconciliation 18
Non-GAAP Reconciliation 19
Non-GAAP Reconciliation 20
Non-GAAP Reconciliation 21
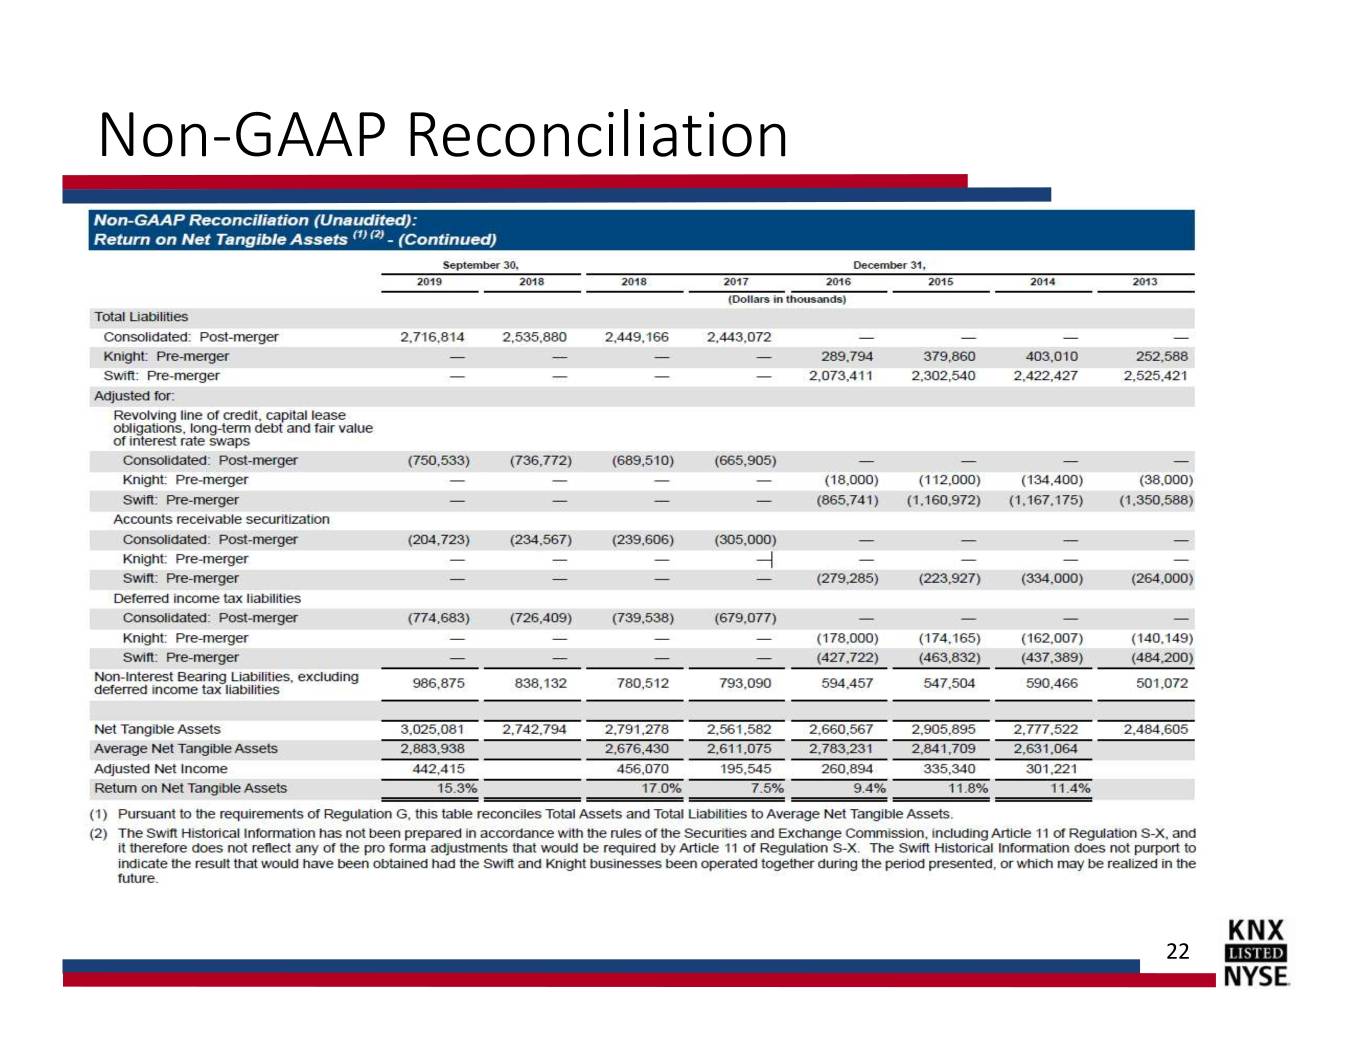
Non-GAAP Reconciliation 22
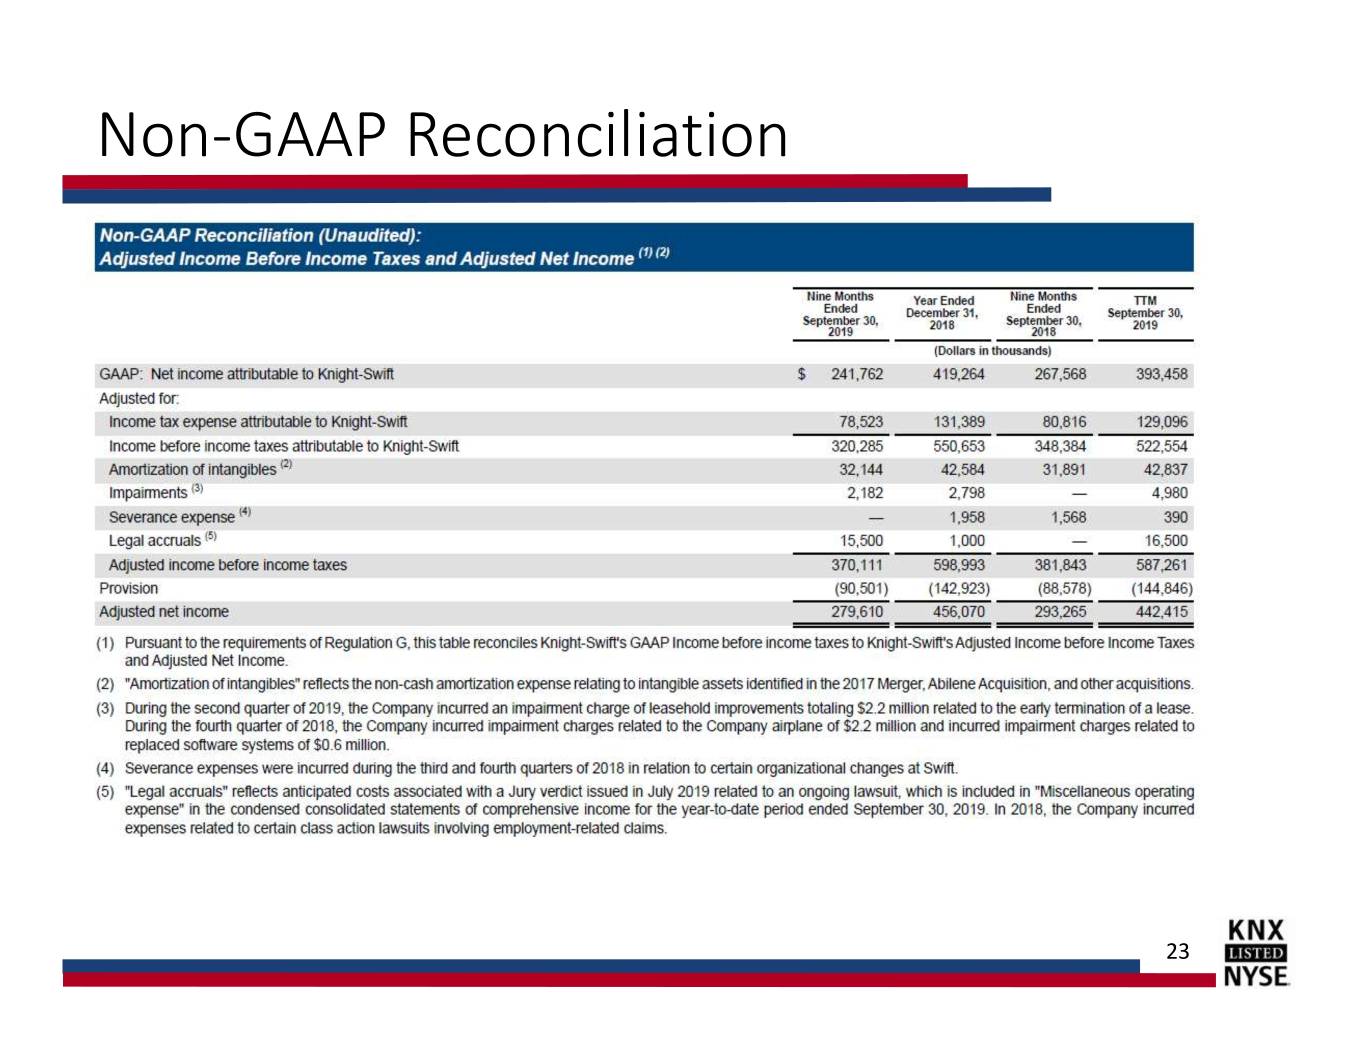
Non-GAAP Reconciliation 23
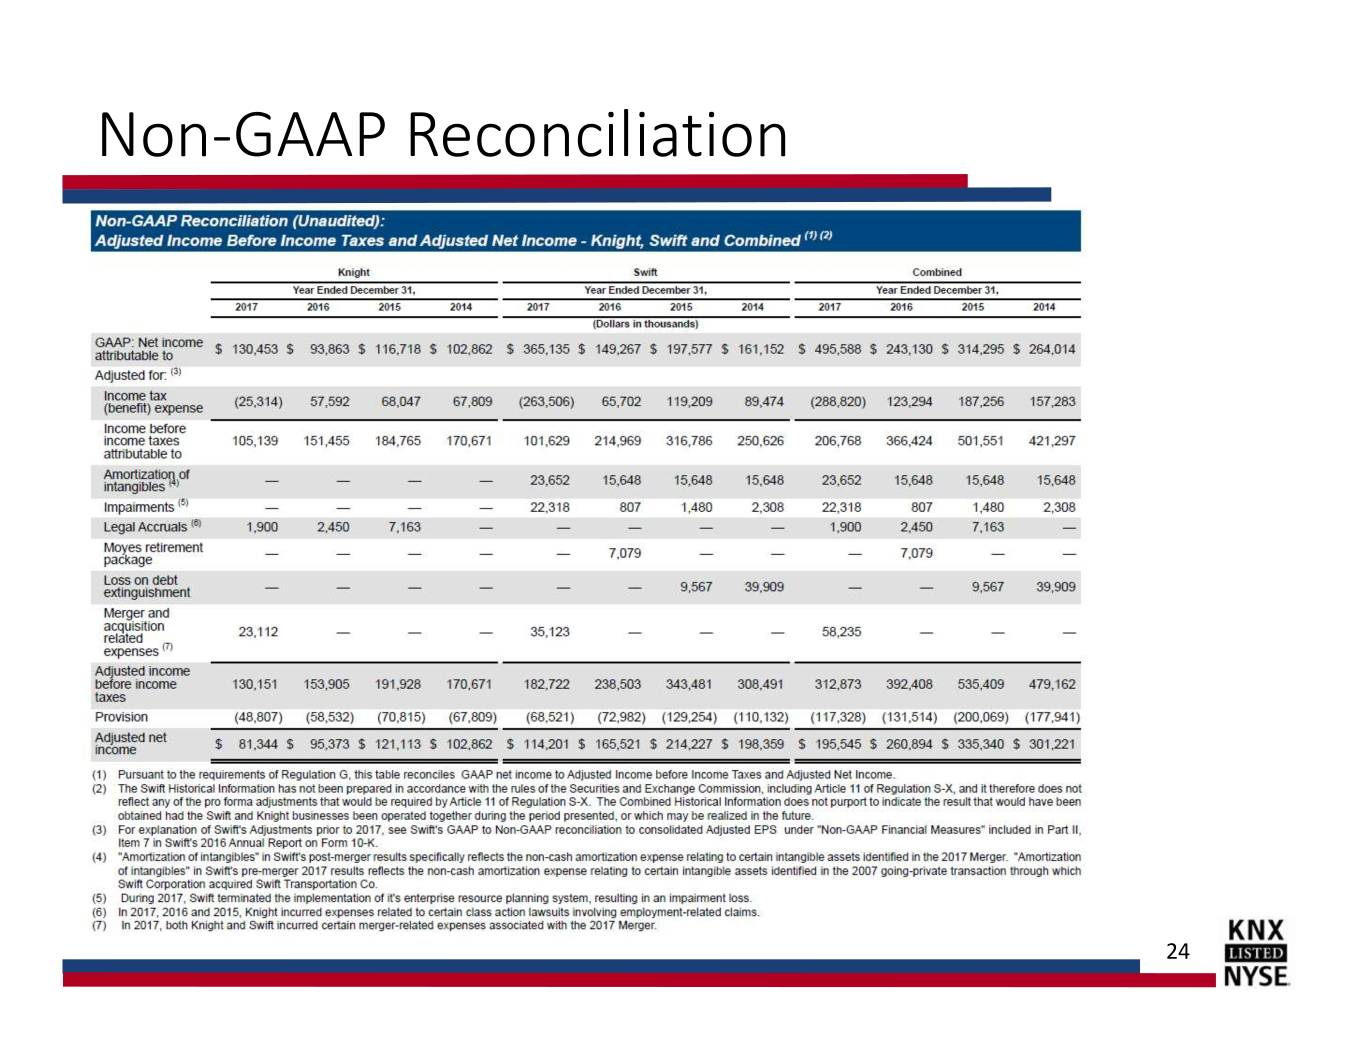
Non-GAAP Reconciliation 24


