Exhibit 99.2

2 Disclosure This presentation, including documents incorporated herein by reference, will contain forward-looking statements within the meaning of Section 27A of the Securities Act of 1933, as amended and Section 21E of the Securities Exchange Act of 1934, as amended. Such forward-looking statements are made pursuant to the safe harbor provisions of the Private Securities Litigation Reform Act of 1995. Forward-looking statements are subject to risks and uncertainties that could cause actual results to differ materially from those contemplated by the forward-looking statements. Please review our disclosures in filings with the United States Securities and Exchange Commission. Non-GAAP Financial Data This presentation includes the use of adjusted operating income, operating ratio, adjusted operating ratio, adjusted earnings per share, adjusted income before taxes, adjusted operating expenses, return on net tangible assets, and free cash flow, which are financial measures that are not in accordance with United States generally accepted accounting principles (“GAAP”). Each such measure is a supplemental non-GAAP financial measure that is used by management and external users of our financial statements, such as industry analysts, investors and lenders. While management believes such measures are useful for investors, they should not be used as a replacement for financial measures that are in accordance with GAAP. In addition, our use of these non-GAAP measures should not be interpreted as indicating that these or similar items could not occur in future periods. In addition, adjusted operating ratio excludes truckload and LTL segment fuel surcharges from revenue and nets these surcharges against fuel expense.

3 Adjustments • $16.2M in Q2 2022 and $12.0M in Q2 2021 of amortization expense from mergers and acquisitions • ($2.0)M in Q2 2022 and $0.9M in Q2 2021 of legal accrual expense • $0.7M in Q2 2021 of transaction fees related to UTXL and ACT 1 See GAAP to non-GAAP reconciliation in the schedules following this presentation KNX Q2 2022 Comparative Results 2 Q2 2022 results include the $33.8M pre-tax (or $0.16 after-tax GAAP and Adjusted EPS) impact from unrealized mark-to-market losses in our investment in Embark Technology 1,316 1,961 2Q21 2Q22 Total Revenue + 49.1% 1,213 1,695 2Q21 2Q22 Revenue xFSC + 39.7% 191 326 2Q21 2Q22 Operating Income + 70.5% 205 340 2Q21 2Q22 Adj. Operating Inc. 1 + 66.1% 153 219 2Q21 2Q22 Net Income 2 + 43.6% 163 230 2Q21 2Q22 Adj. Net Income 1 2 + 41.2% $0.92 $1.35 2Q21 2Q22 Earnings Per Share 2 + 46.7% $0.98 $1.41 2Q21 2Q22 Adj. EPS 1 2 + 43.9% In m ill io ns Continued strong performance despite changing freight market In m ill io ns In m ill io ns
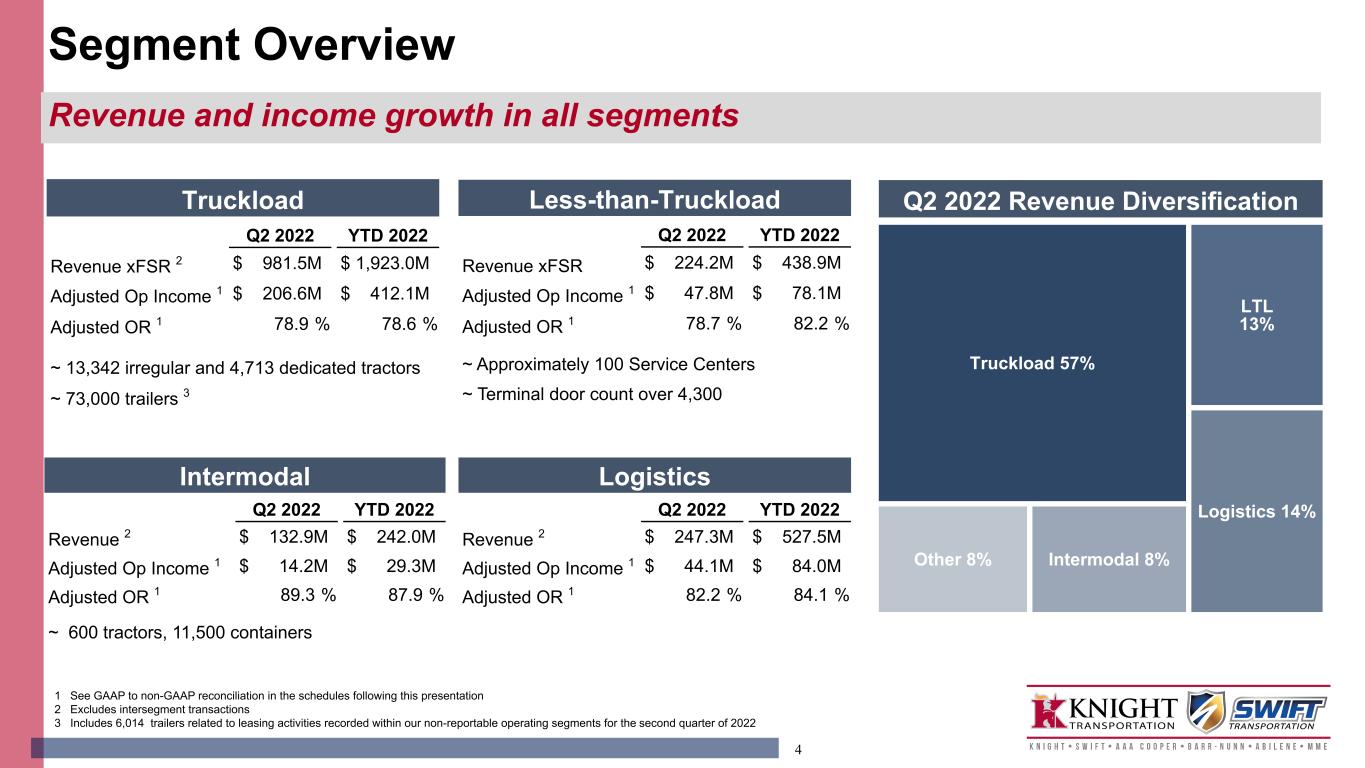
4 Truckload 981.5 57.3 % LTL 224.2 13.1 % Logistics 247.3 14.4 % Intermodal 132.9 7.8 % Other 128.1 7.5 % 1714 1 See GAAP to non-GAAP reconciliation in the schedules following this presentation 2 Excludes intersegment transactions 3 Includes 6,014 trailers related to leasing activities recorded within our non-reportable operating segments for the second quarter of 2022 Truckload Q2 2022 YTD 2022 Revenue xFSR 2 $ 981.5 M $ 1,923.0 M Adjusted Op Income 1 $ 206.6 M $ 412.1 M Adjusted OR 1 78.9 % 78.6 % ~ 13,342 irregular and 4,713 dedicated tractors ~ 73,000 trailers 3 Intermodal Q2 2022 YTD 2022 Revenue 2 $ 132.9 M $ 242.0 M Adjusted Op Income 1 $ 14.2 M $ 29.3 M Adjusted OR 1 89.3 % 87.9 % ~ 600 tractors, 11,500 containers Logistics Q2 2022 YTD 2022 Revenue 2 $ 247.3 M $ 527.5 M Adjusted Op Income 1 $ 44.1 M $ 84.0 M Adjusted OR 1 82.2 % 84.1 % Less-than-Truckload Q2 2022 YTD 2022 Revenue xFSR $ 224.2 M $ 438.9 M Adjusted Op Income 1 $ 47.8 M $ 78.1 M Adjusted OR 1 78.7 % 82.2 % ~ Approximately 100 Service Centers ~ Terminal door count over 4,300 Q2 2022 Revenue Diversification Truckload 57% LTL 13% Logistics 14% Other 8% Intermodal 8% Segment Overview Revenue and income growth in all segments
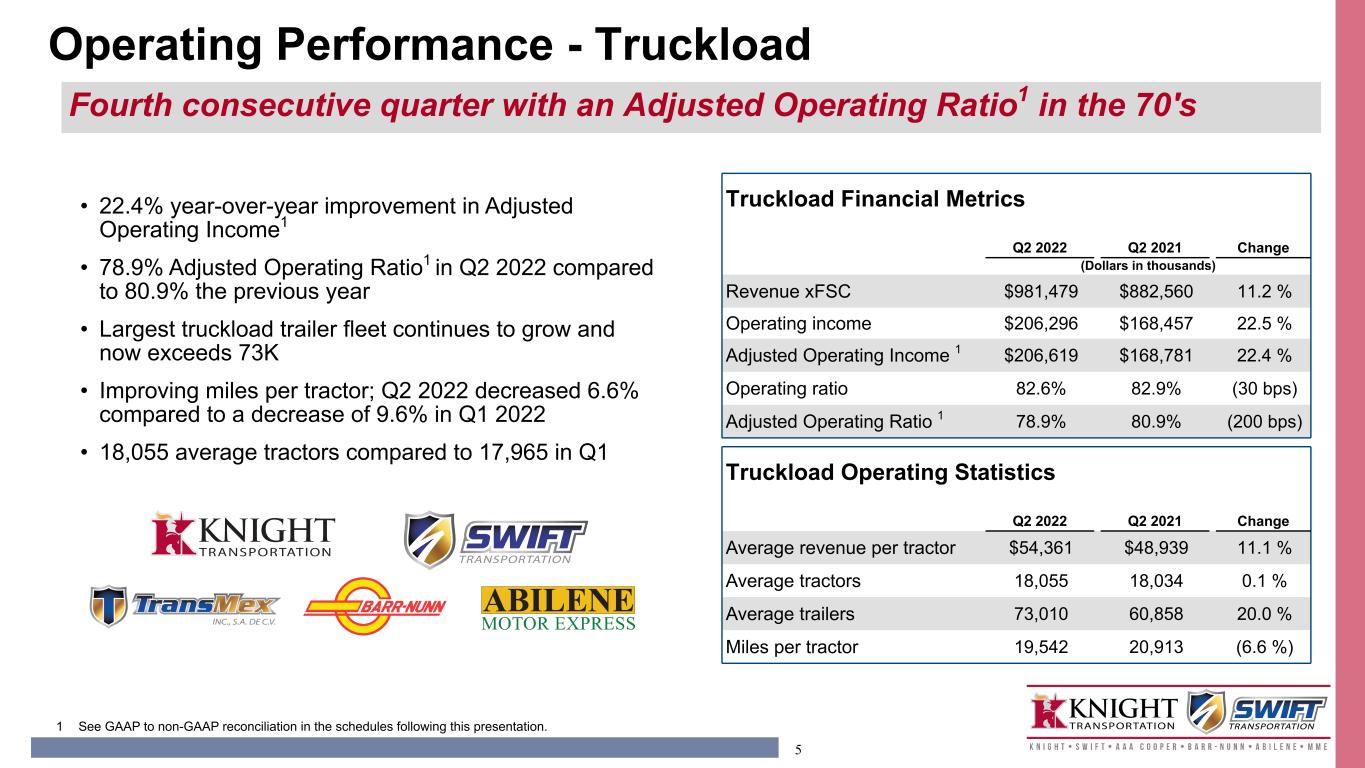
5 • 22.4% year-over-year improvement in Adjusted Operating Income1 • 78.9% Adjusted Operating Ratio1 in Q2 2022 compared to 80.9% the previous year • Largest truckload trailer fleet continues to grow and now exceeds 73K • Improving miles per tractor; Q2 2022 decreased 6.6% compared to a decrease of 9.6% in Q1 2022 • 18,055 average tractors compared to 17,965 in Q1 1 See GAAP to non-GAAP reconciliation in the schedules following this presentation. Truckload Operating Statistics Q2 2022 Q2 2021 Change Average revenue per tractor $54,361 $48,939 11.1 % Average tractors 18,055 18,034 0.1 % Average trailers 73,010 60,858 20.0 % Miles per tractor 19,542 20,913 (6.6 %) Truckload Financial Metrics Q2 2022 Q2 2021 Change (Dollars in thousands) Revenue xFSC $981,479 $882,560 11.2 % Operating income $206,296 $168,457 22.5 % Adjusted Operating Income 1 $206,619 $168,781 22.4 % Operating ratio 82.6% 82.9% (30 bps) Adjusted Operating Ratio 1 78.9% 80.9% (200 bps) Operating Performance - Truckload Fourth consecutive quarter with an Adjusted Operating Ratio1 in the 70's
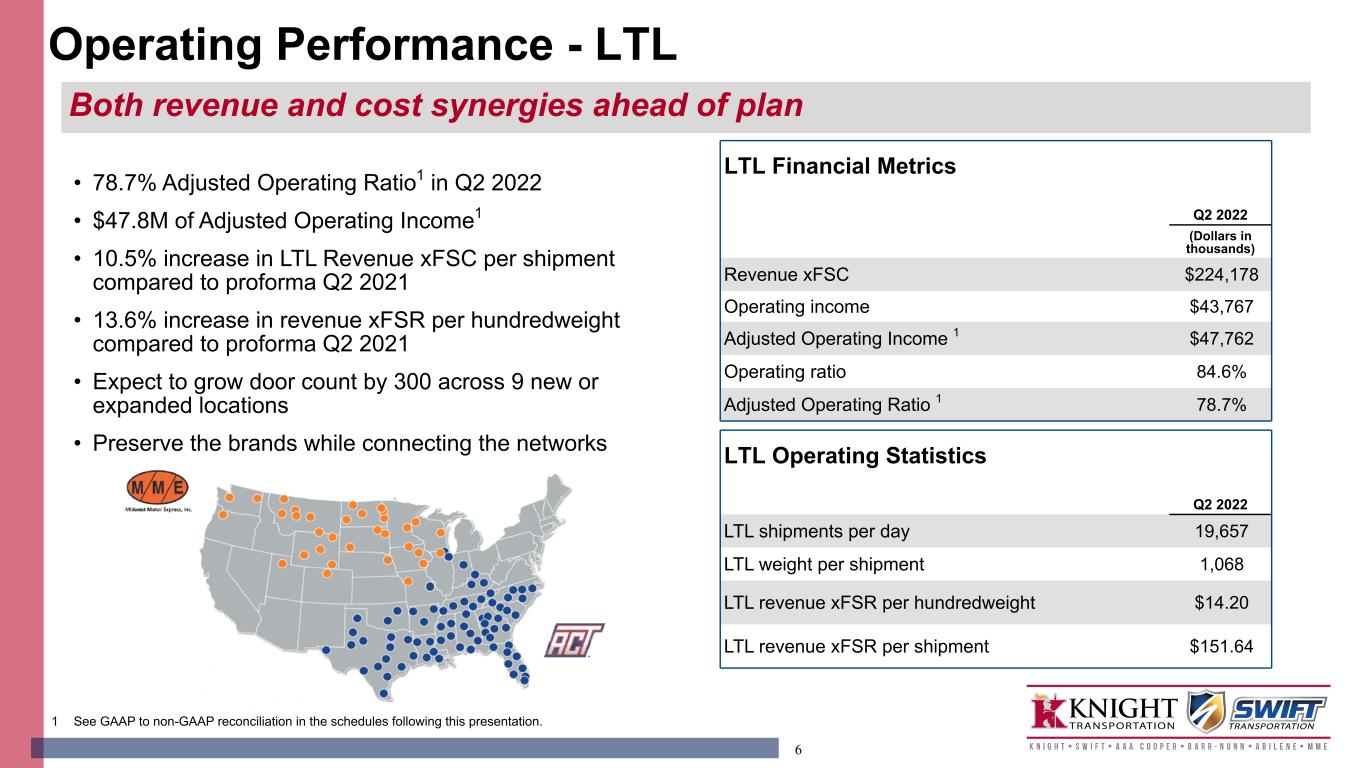
6 • 78.7% Adjusted Operating Ratio1 in Q2 2022 • $47.8M of Adjusted Operating Income1 • 10.5% increase in LTL Revenue xFSC per shipment compared to proforma Q2 2021 • 13.6% increase in revenue xFSR per hundredweight compared to proforma Q2 2021 • Expect to grow door count by 300 across 9 new or expanded locations • Preserve the brands while connecting the networks LTL Operating Statistics Q2 2022 LTL shipments per day 19,657 LTL weight per shipment 1,068 LTL revenue xFSR per hundredweight $14.20 LTL revenue xFSR per shipment $151.64 1 See GAAP to non-GAAP reconciliation in the schedules following this presentation. LTL Financial Metrics Q2 2022 (Dollars in thousands) Revenue xFSC $224,178 Operating income $43,767 Adjusted Operating Income 1 $47,762 Operating ratio 84.6% Adjusted Operating Ratio 1 78.7% Operating Performance - LTL Both revenue and cost synergies ahead of plan
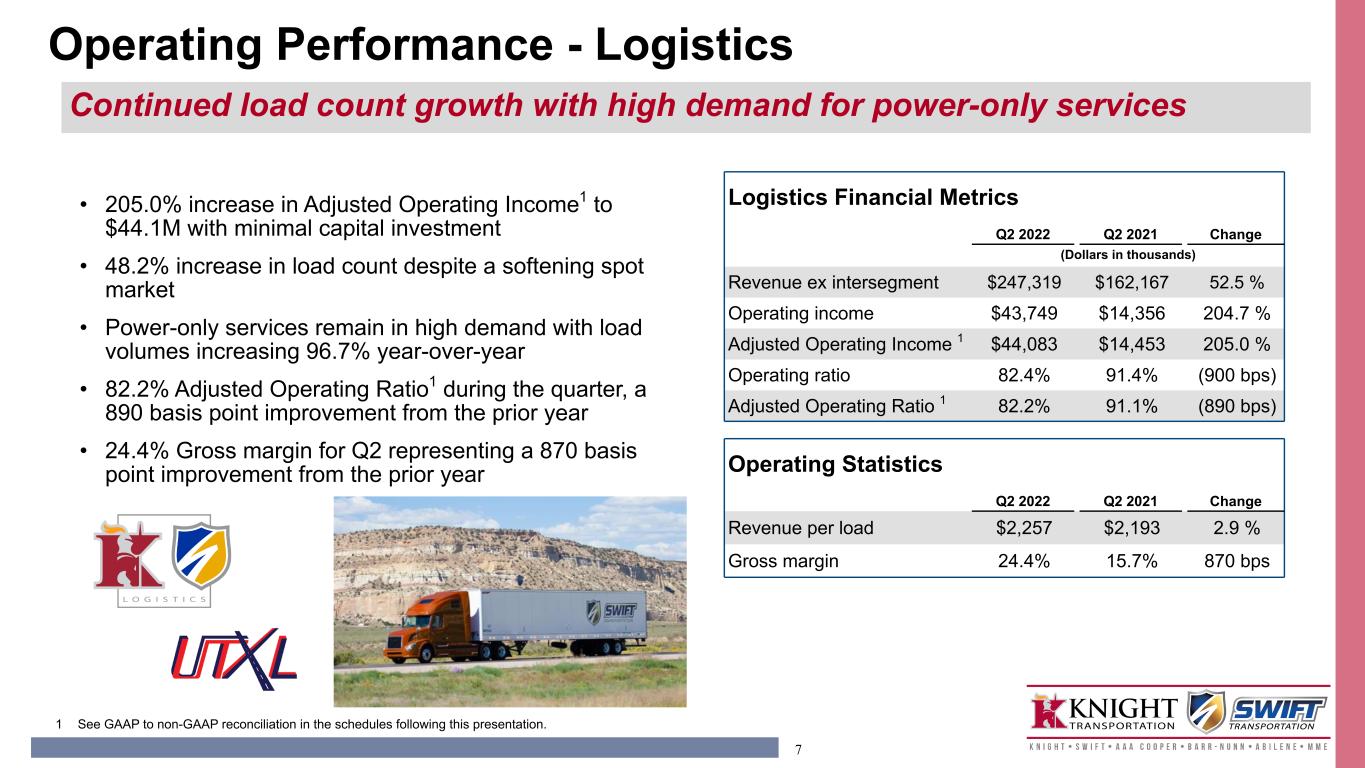
7 • 205.0% increase in Adjusted Operating Income1 to $44.1M with minimal capital investment • 48.2% increase in load count despite a softening spot market • Power-only services remain in high demand with load volumes increasing 96.7% year-over-year • 82.2% Adjusted Operating Ratio1 during the quarter, a 890 basis point improvement from the prior year • 24.4% Gross margin for Q2 representing a 870 basis point improvement from the prior year 1 See GAAP to non-GAAP reconciliation in the schedules following this presentation. Operating Statistics Q2 2022 Q2 2021 Change Revenue per load $2,257 $2,193 2.9 % Gross margin 24.4% 15.7% 870 bps Logistics Financial Metrics Q2 2022 Q2 2021 Change (Dollars in thousands) Revenue ex intersegment $247,319 $162,167 52.5 % Operating income $43,749 $14,356 204.7 % Adjusted Operating Income 1 $44,083 $14,453 205.0 % Operating ratio 82.4% 91.4% (900 bps) Adjusted Operating Ratio 1 82.2% 91.1% (890 bps) Operating Performance - Logistics Continued load count growth with high demand for power-only services
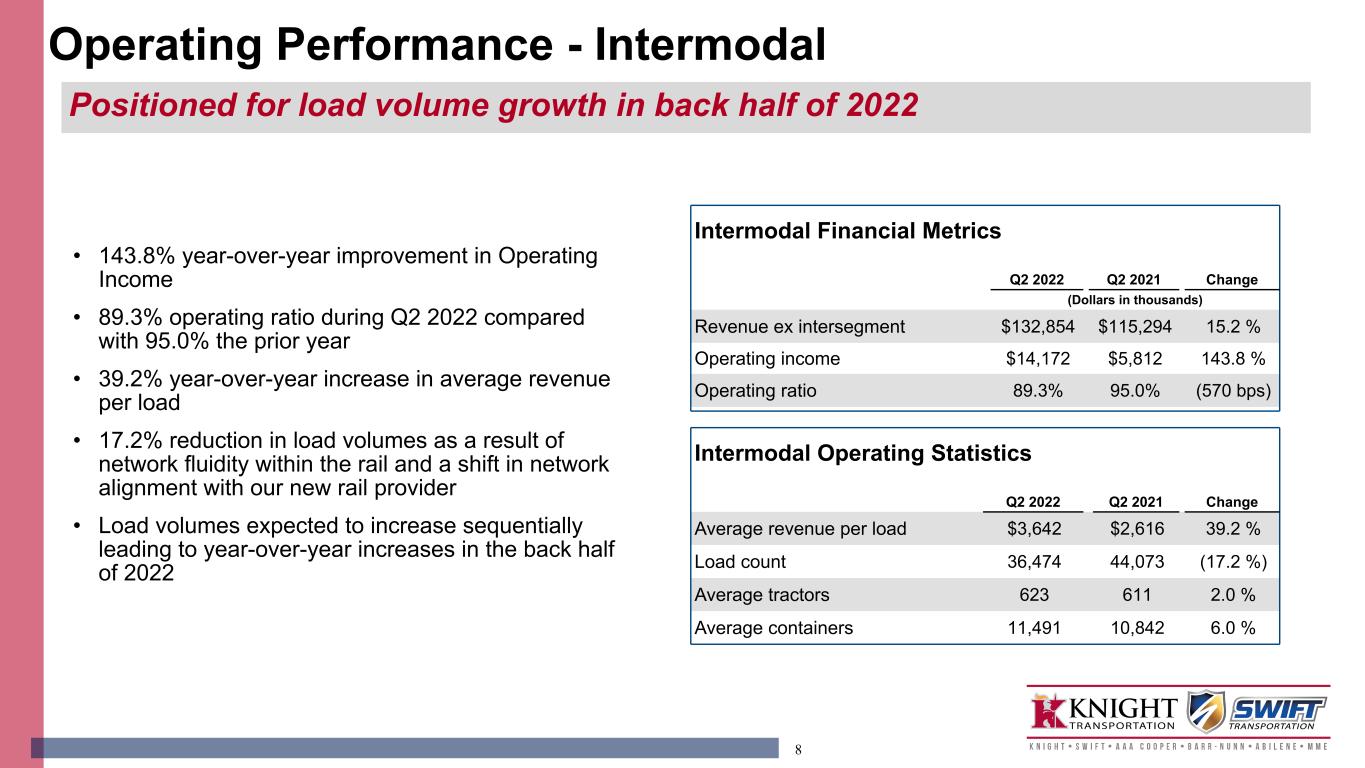
8 • 143.8% year-over-year improvement in Operating Income • 89.3% operating ratio during Q2 2022 compared with 95.0% the prior year • 39.2% year-over-year increase in average revenue per load • 17.2% reduction in load volumes as a result of network fluidity within the rail and a shift in network alignment with our new rail provider • Load volumes expected to increase sequentially leading to year-over-year increases in the back half of 2022 Intermodal Operating Statistics Q2 2022 Q2 2021 Change Average revenue per load $3,642 $2,616 39.2 % Load count 36,474 44,073 (17.2 %) Average tractors 623 611 2.0 % Average containers 11,491 10,842 6.0 % Intermodal Financial Metrics Q2 2022 Q2 2021 Change (Dollars in thousands) Revenue ex intersegment $132,854 $115,294 15.2 % Operating income $14,172 $5,812 143.8 % Operating ratio 89.3% 95.0% (570 bps) Operating Performance - Intermodal Positioned for load volume growth in back half of 2022
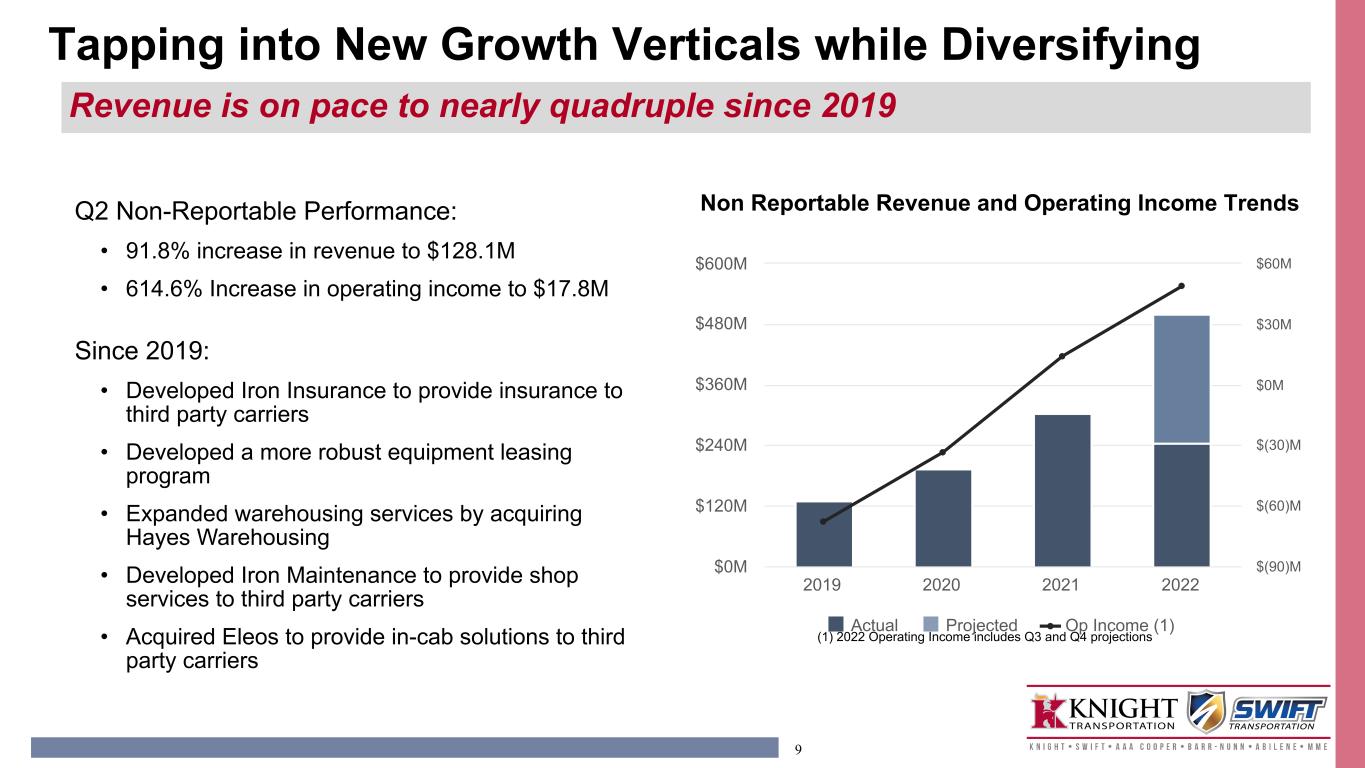
9 Q2 Non-Reportable Performance: • 91.8% increase in revenue to $128.1M • 614.6% Increase in operating income to $17.8M Since 2019: • Developed Iron Insurance to provide insurance to third party carriers • Developed a more robust equipment leasing program • Expanded warehousing services by acquiring Hayes Warehousing • Developed Iron Maintenance to provide shop services to third party carriers • Acquired Eleos to provide in-cab solutions to third party carriers Tapping into New Growth Verticals while Diversifying Revenue is on pace to nearly quadruple since 2019 Actual Projected Op Income (1) 2019 2020 2021 2022 $0M $120M $240M $360M $480M $600M $(90)M $(60)M $(30)M $0M $30M $60M (1) 2022 Operating Income includes Q3 and Q4 projections Non Reportable Revenue and Operating Income Trends
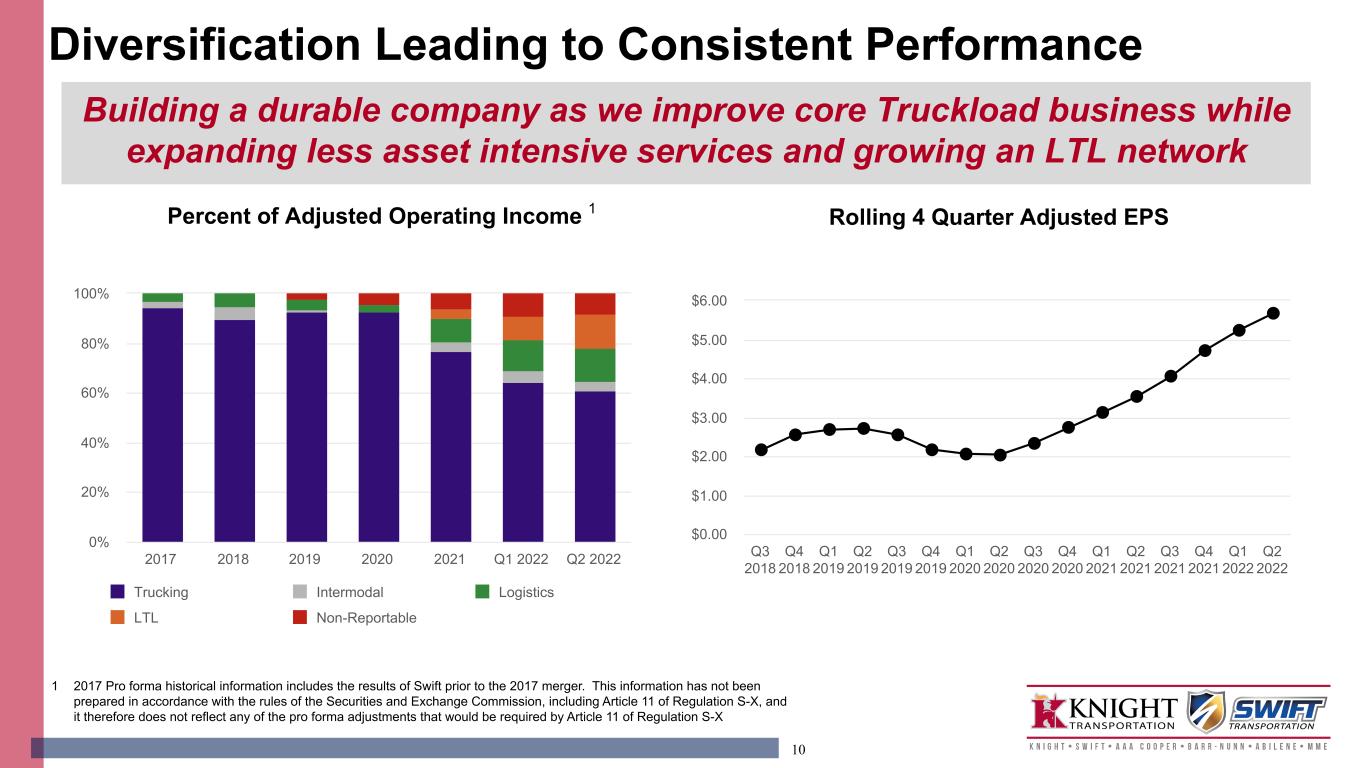
10 Trucking Intermodal Logistics LTL Non-Reportable 2017 2018 2019 2020 2021 Q1 2022 Q2 2022 0% 20% 40% 60% 80% 100% Q3 2018 Q4 2018 Q1 2019 Q2 2019 Q3 2019 Q4 2019 Q1 2020 Q2 2020 Q3 2020 Q4 2020 Q1 2021 Q2 2021 Q3 2021 Q4 2021 Q1 2022 Q2 2022 $0.00 $1.00 $2.00 $3.00 $4.00 $5.00 $6.00 Percent of Adjusted Operating Income 1 Rolling 4 Quarter Adjusted EPS 1 2017 Pro forma historical information includes the results of Swift prior to the 2017 merger. This information has not been prepared in accordance with the rules of the Securities and Exchange Commission, including Article 11 of Regulation S-X, and it therefore does not reflect any of the pro forma adjustments that would be required by Article 11 of Regulation S-X Diversification Leading to Consistent Performance Building a durable company as we improve core Truckload business while expanding less asset intensive services and growing an LTL network

11 TTM Free Cash Flow 2018 - Q2 2022 2018 Q4 2019 Q1 2019 Q2 2019 Q3 2019 Q4 2020 Q1 2020 Q2 2020 Q3 2020 Q4 2021 Q1 2021 Q2 2021 Q3 2021 Q4 2022 Q1 2022 Q2 $0M $250M $500M $750M $1,000M $1,250M Year-to-Date 2022: • Generated Free Cash Flow1 of $528.7M and $1,097.8M TTM • Increased dividend 20% to $0.12 generating a total return to shareholders of $39.7M • Repurchased $300M of shares • Paid down $86.2M in long-term debt and leases ◦ $38.8M in long-term debt ◦ $27.6M in finance lease liabilities ◦ $19.8M operating lease liabilities 1 See GAAP to non-GAAP reconciliation in the schedules following this presentation. 1 Capital Allocation Strong free cash flow provides flexibility in capital deployment
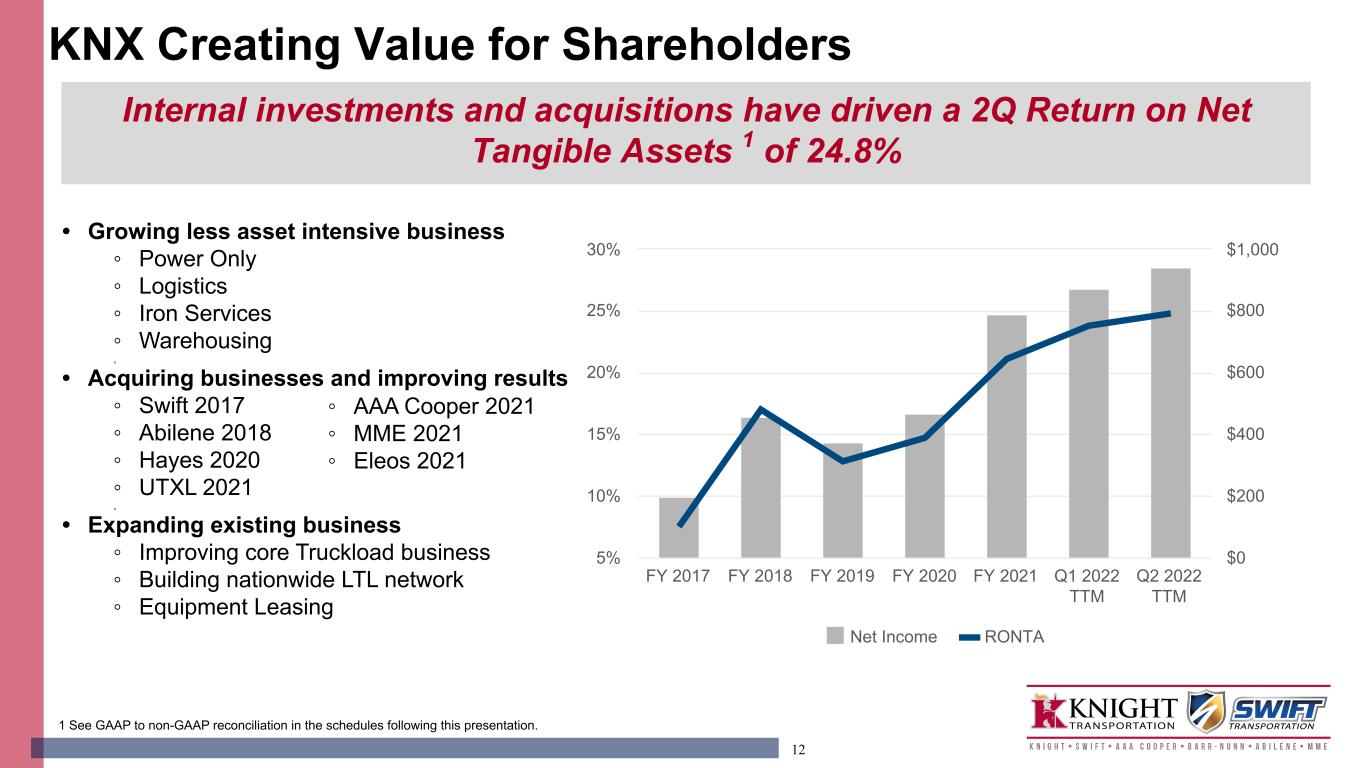
12 • Growing less asset intensive business ◦ Power Only ◦ Logistics ◦ Iron Services ◦ Warehousing ◦ • Acquiring businesses and improving results ◦ Swift 2017 ◦ Abilene 2018 ◦ Hayes 2020 ◦ UTXL 2021 ◦ • Expanding existing business ◦ Improving core Truckload business ◦ Building nationwide LTL network ◦ Equipment Leasing 1 See GAAP to non-GAAP reconciliation in the schedules following this presentation. Net Income RONTA FY 2017 FY 2018 FY 2019 FY 2020 FY 2021 Q1 2022 TTM Q2 2022 TTM 5% 10% 15% 20% 25% 30% $0 $200 $400 $600 $800 $1,000 KNX Creating Value for Shareholders Internal investments and acquisitions have driven a 2Q Return on Net Tangible Assets 1 of 24.8% ◦ AAA Cooper 2021 ◦ MME 2021 ◦ Eleos 2021

13 • Overall consumer demand moderates • Continued decline in non-contract opportunities • Less visibility on peak season surge • Strong demand for trailer pools continue • Depressed spot rates combined with higher fuel, maintenance and equipment costs disincentivize new entrants and pressure highly leveraged carriers • LTL demand remains strong with increases in revenue per hundredweight remaining in the double digits year-over-year • Sourcing and retaining drivers improves but remains challenging • Inflationary pressure on equipment, maintenance, labor and other cost items continue • Used equipment market normalizes as the year progresses Market Outlook 2nd Half 2022
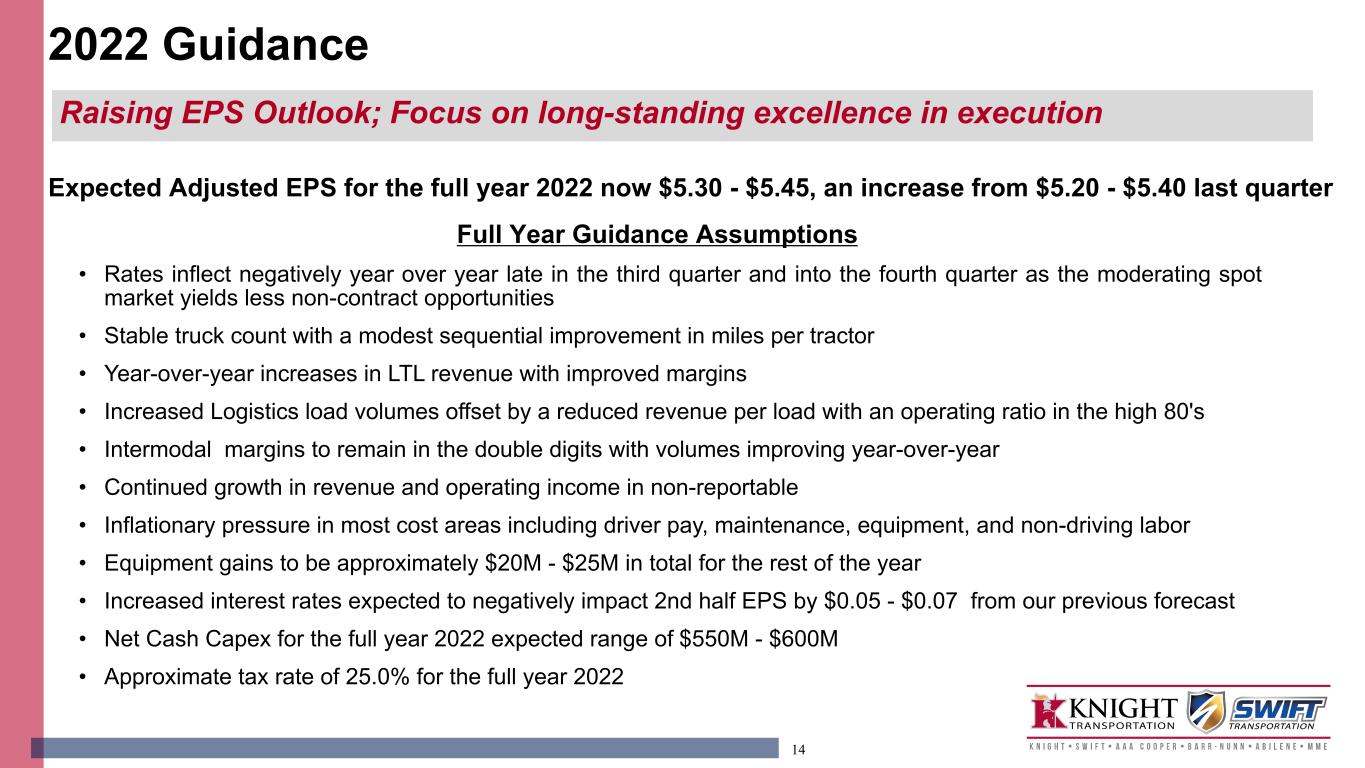
14 Expected Adjusted EPS for the full year 2022 now $5.30 - $5.45, an increase from $5.20 - $5.40 last quarter Full Year Guidance Assumptions • Rates inflect negatively year over year late in the third quarter and into the fourth quarter as the moderating spot market yields less non-contract opportunities • Stable truck count with a modest sequential improvement in miles per tractor • Year-over-year increases in LTL revenue with improved margins • Increased Logistics load volumes offset by a reduced revenue per load with an operating ratio in the high 80's • Intermodal margins to remain in the double digits with volumes improving year-over-year • Continued growth in revenue and operating income in non-reportable • Inflationary pressure in most cost areas including driver pay, maintenance, equipment, and non-driving labor • Equipment gains to be approximately $20M - $25M in total for the rest of the year • Increased interest rates expected to negatively impact 2nd half EPS by $0.05 - $0.07 from our previous forecast • Net Cash Capex for the full year 2022 expected range of $550M - $600M • Approximate tax rate of 25.0% for the full year 2022 2022 Guidance Raising EPS Outlook; Focus on long-standing excellence in execution
Appendix
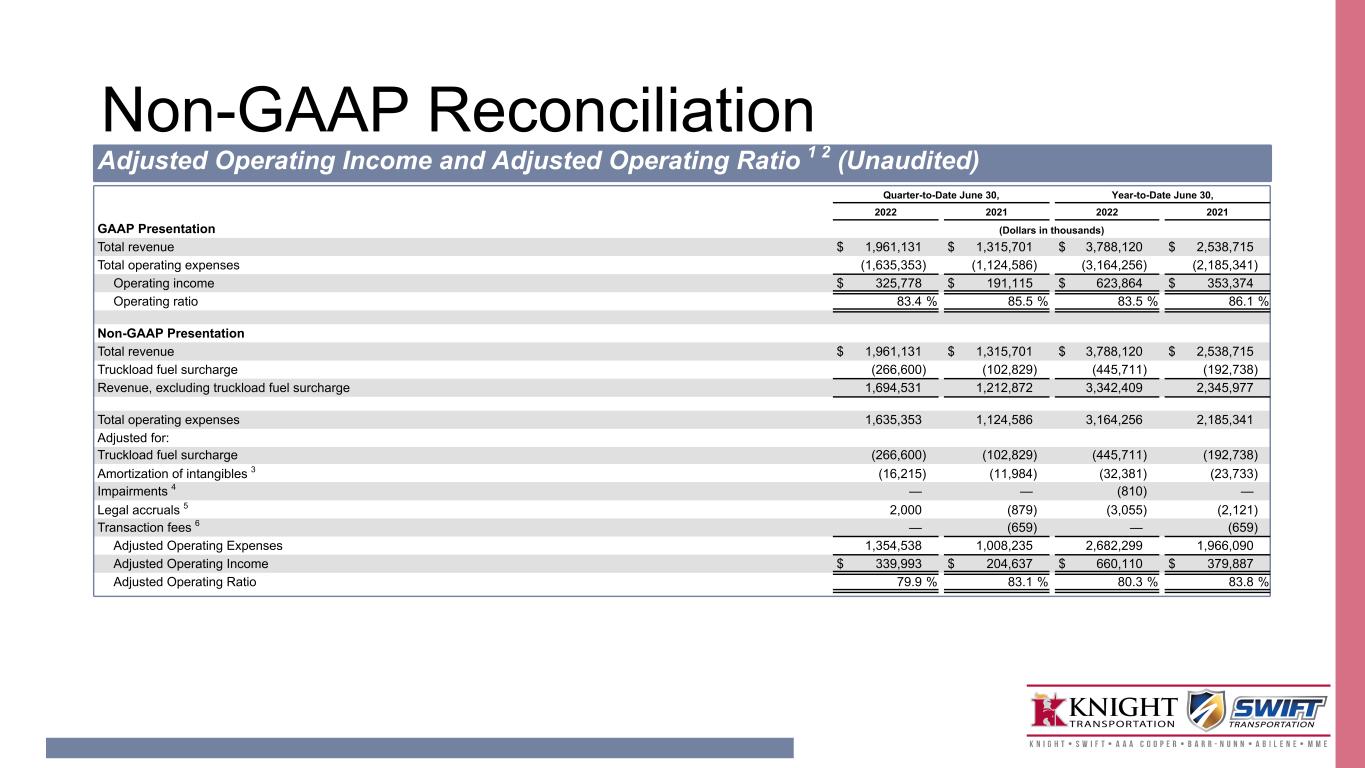
Non-GAAP Reconciliation Adjusted Operating Income and Adjusted Operating Ratio 1 2 (Unaudited) Quarter-to-Date June 30, Year-to-Date June 30, 2022 2021 2022 2021 GAAP Presentation (Dollars in thousands) Total revenue $ 1,961,131 $ 1,315,701 $ 3,788,120 $ 2,538,715 Total operating expenses (1,635,353) (1,124,586) (3,164,256) (2,185,341) Operating income $ 325,778 $ 191,115 $ 623,864 $ 353,374 Operating ratio 83.4 % 85.5 % 83.5 % 86.1 % Non-GAAP Presentation Total revenue $ 1,961,131 $ 1,315,701 $ 3,788,120 $ 2,538,715 Truckload fuel surcharge (266,600) (102,829) (445,711) (192,738) Revenue, excluding truckload fuel surcharge 1,694,531 1,212,872 3,342,409 2,345,977 Total operating expenses 1,635,353 1,124,586 3,164,256 2,185,341 Adjusted for: Truckload fuel surcharge (266,600) (102,829) (445,711) (192,738) Amortization of intangibles 3 (16,215) (11,984) (32,381) (23,733) Impairments 4 — — (810) — Legal accruals 5 2,000 (879) (3,055) (2,121) Transaction fees 6 — (659) — (659) Adjusted Operating Expenses 1,354,538 1,008,235 2,682,299 1,966,090 Adjusted Operating Income $ 339,993 $ 204,637 $ 660,110 $ 379,887 Adjusted Operating Ratio 79.9 % 83.1 % 80.3 % 83.8 %
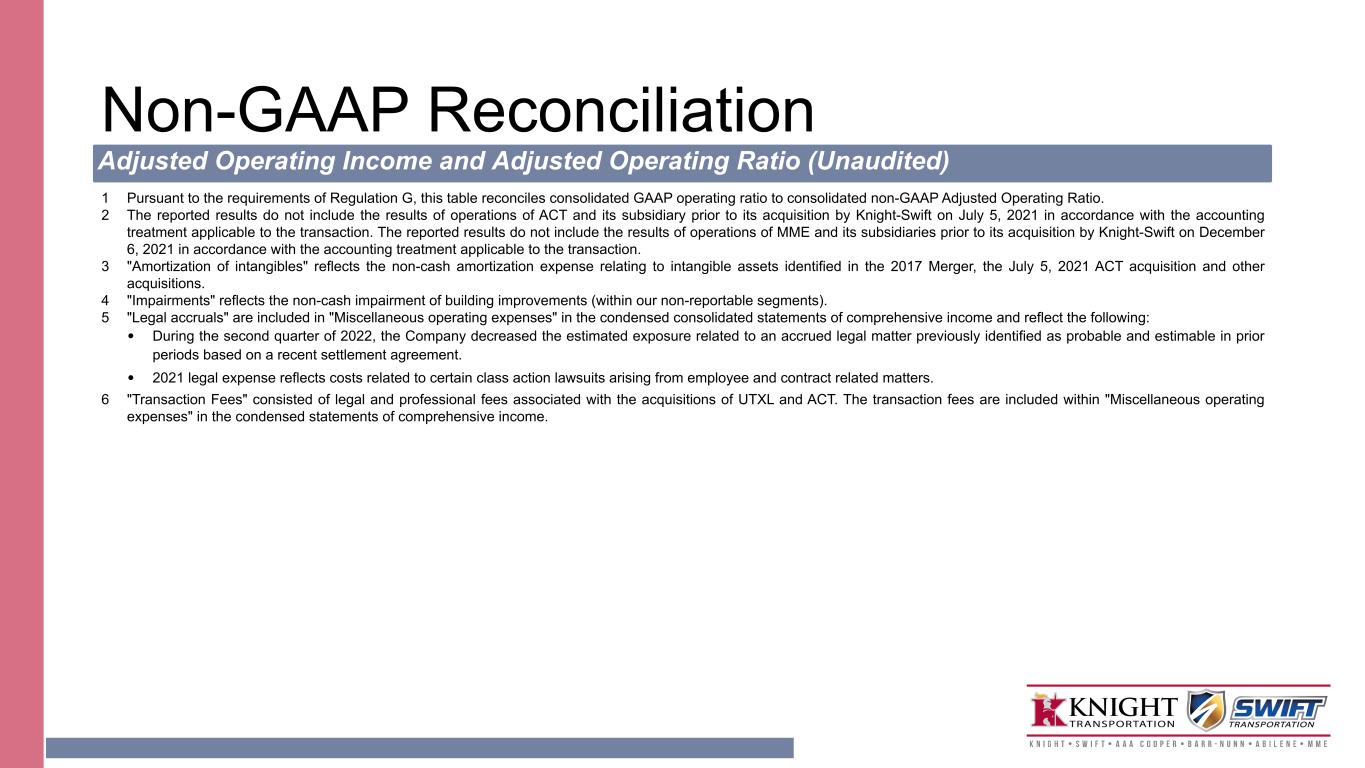
Non-GAAP Reconciliation Adjusted Operating Income and Adjusted Operating Ratio (Unaudited) 1 Pursuant to the requirements of Regulation G, this table reconciles consolidated GAAP operating ratio to consolidated non-GAAP Adjusted Operating Ratio. 2 The reported results do not include the results of operations of ACT and its subsidiary prior to its acquisition by Knight-Swift on July 5, 2021 in accordance with the accounting treatment applicable to the transaction. The reported results do not include the results of operations of MME and its subsidiaries prior to its acquisition by Knight-Swift on December 6, 2021 in accordance with the accounting treatment applicable to the transaction. 3 "Amortization of intangibles" reflects the non-cash amortization expense relating to intangible assets identified in the 2017 Merger, the July 5, 2021 ACT acquisition and other acquisitions. 4 "Impairments" reflects the non-cash impairment of building improvements (within our non-reportable segments). 5 "Legal accruals" are included in "Miscellaneous operating expenses" in the condensed consolidated statements of comprehensive income and reflect the following: • During the second quarter of 2022, the Company decreased the estimated exposure related to an accrued legal matter previously identified as probable and estimable in prior periods based on a recent settlement agreement. • 2021 legal expense reflects costs related to certain class action lawsuits arising from employee and contract related matters. 6 "Transaction Fees" consisted of legal and professional fees associated with the acquisitions of UTXL and ACT. The transaction fees are included within "Miscellaneous operating expenses" in the condensed statements of comprehensive income.

Non-GAAP Reconciliation Adjusted Net Income Attributable to Knight-Swift and Adjusted EPS 1 2 (Unaudited) Quarter-to-Date June 30, Year-to-Date June 30, 2022 2021 2022 2021 (Dollars in thousands, except per share data) GAAP: Net income attributable to Knight-Swift $ 219,492 $ 152,804 $ 427,829 $ 282,594 Adjusted for: Income tax expense attributable to Knight-Swift 72,090 51,783 141,264 97,112 Income before income taxes attributable to Knight-Swift 291,582 204,587 569,093 379,706 Amortization of intangibles 3 16,215 11,984 32,381 23,733 Impairments 4 — — 810 — Legal accruals 5 (2,000) 879 3,055 2,121 Transaction fees 6 — 659 — 659 Adjusted income before income taxes 305,797 218,109 605,339 406,219 Provision for income tax expense at effective rate (75,608) (55,111) (150,287) (103,788) Non-GAAP: Adjusted Net Income Attributable to Knight-Swift $ 230,189 $ 162,998 $ 455,052 $ 302,431 1 Pursuant to the requirements of Regulation G, these tables reconcile consolidated GAAP net income attributable to Knight-Swift to non-GAAP consolidated Adjusted Net Income Attributable to Knight- Swift. 2 Refer to Non-GAAP Reconciliation (Unaudited): Adjusted Operating Income and Adjusted Operating Ratio – footnote 2. 3 Refer to Non-GAAP Reconciliation (Unaudited): Adjusted Operating Income and Adjusted Operating Ratio – footnote 3. 4 Refer to Non-GAAP Reconciliation (Unaudited): Adjusted Operating Income and Adjusted Operating Ratio – footnote 4. 5 Refer to Non-GAAP Reconciliation (Unaudited): Adjusted Operating Income and Adjusted Operating Ratio – footnote 5. 6 Refer to Non-GAAP Reconciliation (Unaudited): Adjusted Operating Income and Adjusted Operating Ratio – footnote 6.
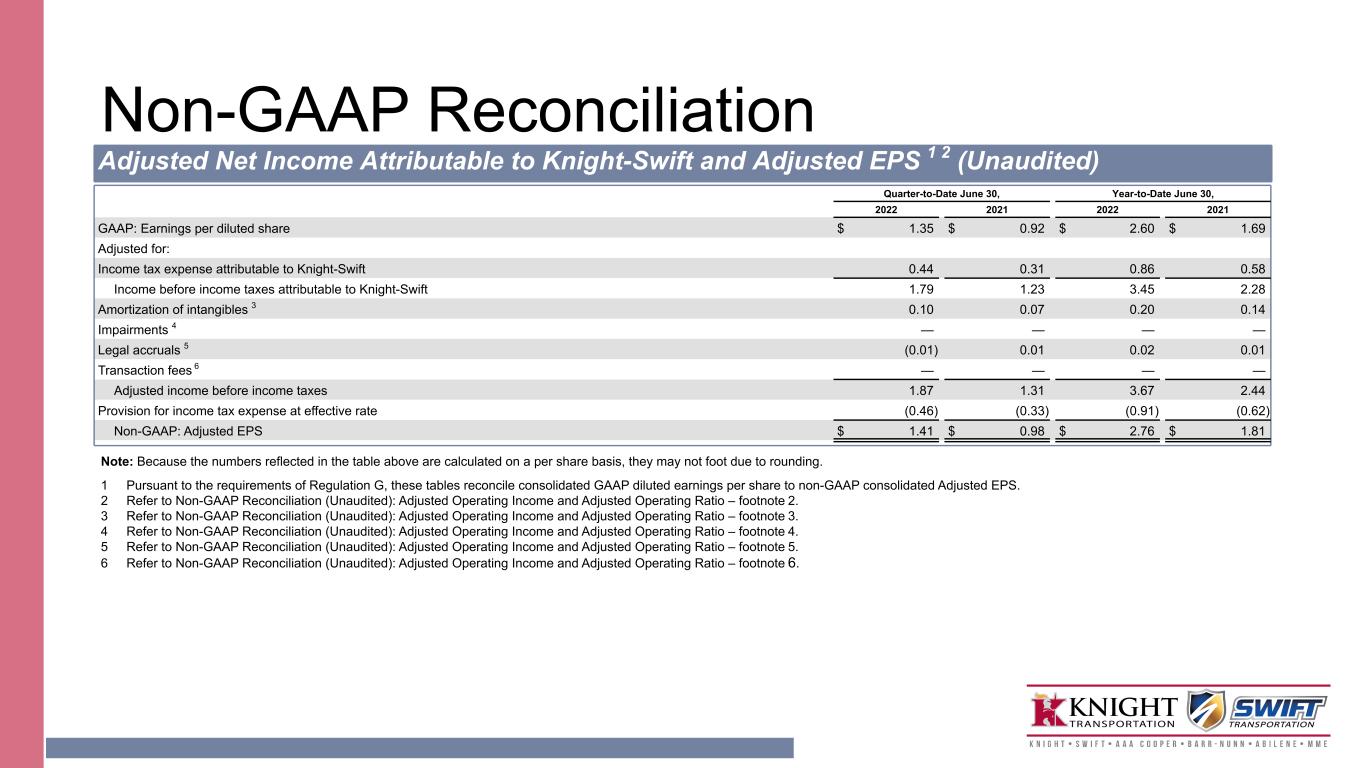
Non-GAAP Reconciliation Adjusted Net Income Attributable to Knight-Swift and Adjusted EPS 1 2 (Unaudited) Quarter-to-Date June 30, Year-to-Date June 30, 2022 2021 2022 2021 GAAP: Earnings per diluted share $ 1.35 $ 0.92 $ 2.60 $ 1.69 Adjusted for: Income tax expense attributable to Knight-Swift 0.44 0.31 0.86 0.58 Income before income taxes attributable to Knight-Swift 1.79 1.23 3.45 2.28 Amortization of intangibles 3 0.10 0.07 0.20 0.14 Impairments 4 — — — — Legal accruals 5 (0.01) 0.01 0.02 0.01 Transaction fees 6 — — — — Adjusted income before income taxes 1.87 1.31 3.67 2.44 Provision for income tax expense at effective rate (0.46) (0.33) (0.91) (0.62) Non-GAAP: Adjusted EPS $ 1.41 $ 0.98 $ 2.76 $ 1.81 Note: Because the numbers reflected in the table above are calculated on a per share basis, they may not foot due to rounding. 1 Pursuant to the requirements of Regulation G, these tables reconcile consolidated GAAP diluted earnings per share to non-GAAP consolidated Adjusted EPS. 2 Refer to Non-GAAP Reconciliation (Unaudited): Adjusted Operating Income and Adjusted Operating Ratio – footnote 2. 3 Refer to Non-GAAP Reconciliation (Unaudited): Adjusted Operating Income and Adjusted Operating Ratio – footnote 3. 4 Refer to Non-GAAP Reconciliation (Unaudited): Adjusted Operating Income and Adjusted Operating Ratio – footnote 4. 5 Refer to Non-GAAP Reconciliation (Unaudited): Adjusted Operating Income and Adjusted Operating Ratio – footnote 5. 6 Refer to Non-GAAP Reconciliation (Unaudited): Adjusted Operating Income and Adjusted Operating Ratio – footnote 6.

Non-GAAP Reconciliation Segment Adjusted Operating Income and Adjusted Operating Ratio 1 (Unaudited) Quarter-to-Date June 30, Year-to-Date June 30, Truckload Segment 2022 2021 2022 2021 GAAP Presentation (Dollars in thousands) Total revenue $ 1,188,809 $ 985,858 $ 2,269,340 $ 1,948,805 Total operating expenses (982,513) (817,401) (1,857,927) (1,621,865) Operating income $ 206,296 $ 168,457 $ 411,413 $ 326,940 Operating ratio 82.6 % 82.9 % 81.9 % 83.2 % Non-GAAP Presentation Total revenue $ 1,188,809 $ 985,858 $ 2,269,340 $ 1,948,805 Fuel surcharge (206,931) (102,829) (345,592) (192,738) Intersegment transactions (399) (469) (735) (693) Revenue, excluding fuel surcharge and intersegment transactions 981,479 882,560 1,923,013 1,755,374 Total operating expenses 982,513 817,401 1,857,927 1,621,865 Adjusted for: Fuel surcharge (206,931) (102,829) (345,592) (192,738) Intersegment transactions (399) (469) (735) (693) Amortization of intangibles 2 (323) (324) (647) (648) Adjusted Operating Expenses 774,860 713,779 1,510,953 1,427,786 Adjusted Operating Income $ 206,619 $ 168,781 $ 412,060 $ 327,588 Adjusted Operating Ratio 78.9 % 80.9 % 78.6 % 81.3 % 1 Pursuant to the requirements of Regulation G, this table reconciles GAAP operating ratio to non-GAAP Adjusted Operating Ratio. 2 "Amortization of intangibles" reflects the non-cash amortization expense relating to intangible assets identified in historical Knight acquisitions.
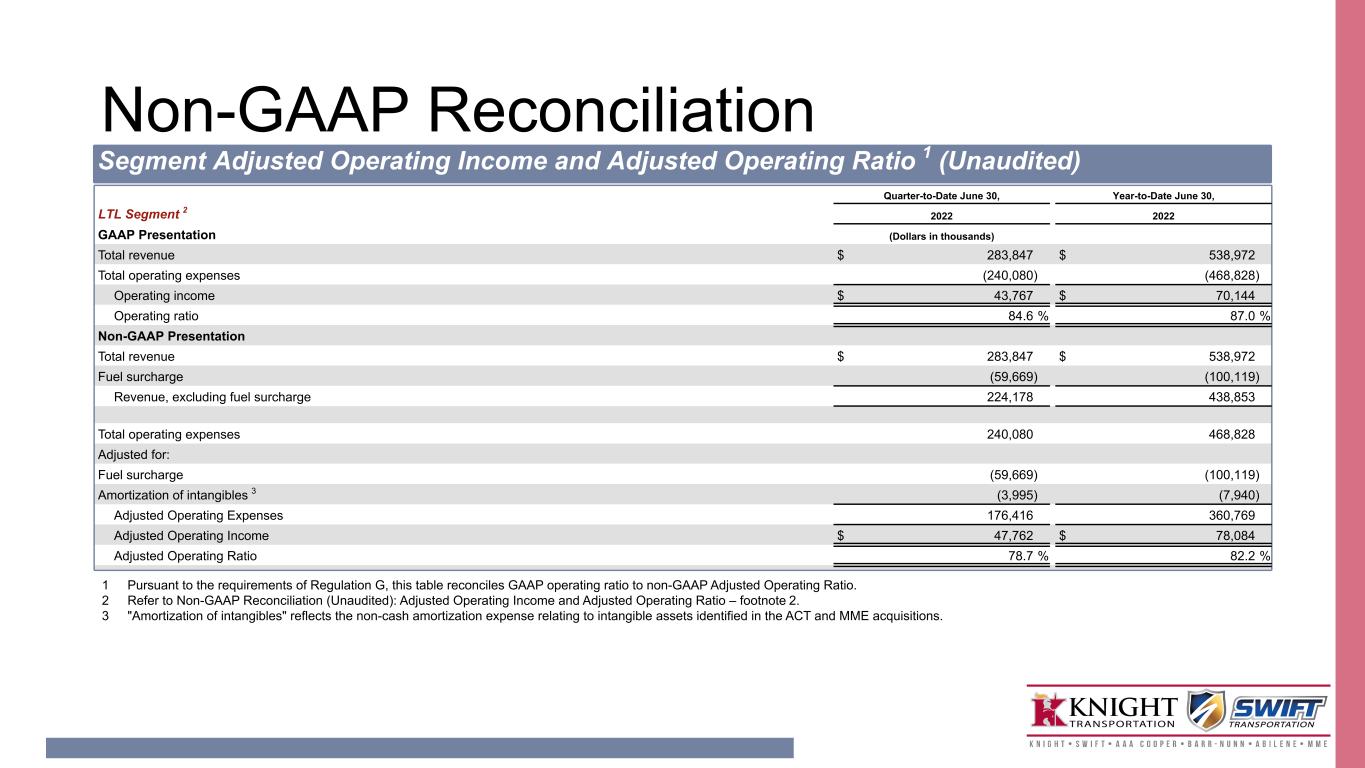
Non-GAAP Reconciliation Segment Adjusted Operating Income and Adjusted Operating Ratio 1 (Unaudited) Quarter-to-Date June 30, Year-to-Date June 30, LTL Segment 2 2022 2022 GAAP Presentation (Dollars in thousands) Total revenue $ 283,847 $ 538,972 Total operating expenses (240,080) (468,828) Operating income $ 43,767 $ 70,144 Operating ratio 84.6 % 87.0 % Non-GAAP Presentation Total revenue $ 283,847 $ 538,972 Fuel surcharge (59,669) (100,119) Revenue, excluding fuel surcharge 224,178 438,853 Total operating expenses 240,080 468,828 Adjusted for: Fuel surcharge (59,669) (100,119) Amortization of intangibles 3 (3,995) (7,940) Adjusted Operating Expenses 176,416 360,769 Adjusted Operating Income $ 47,762 $ 78,084 Adjusted Operating Ratio 78.7 % 82.2 % 1 Pursuant to the requirements of Regulation G, this table reconciles GAAP operating ratio to non-GAAP Adjusted Operating Ratio. 2 Refer to Non-GAAP Reconciliation (Unaudited): Adjusted Operating Income and Adjusted Operating Ratio – footnote 2. 3 "Amortization of intangibles" reflects the non-cash amortization expense relating to intangible assets identified in the ACT and MME acquisitions.

Non-GAAP Reconciliation Quarter-to-Date June 30, Year-to-Date June 30, Logistics Segment 2022 2021 2022 2021 GAAP Presentation (Dollars in thousands) Total revenue $ 248,662 $ 166,737 $ 530,701 $ 285,624 Total operating expenses (204,913) (152,381) (447,351) (263,691) Operating income $ 43,749 $ 14,356 $ 83,350 $ 21,933 Operating ratio 82.4 % 91.4 % 84.3 % 92.3 % Non-GAAP Presentation Total revenue $ 248,662 $ 166,737 $ 530,701 $ 285,624 Intersegment transactions (1,343) (4,570) (3,211) (7,735) Revenue, excluding intersegment transactions 247,319 162,167 527,490 277,889 Total operating expenses 204,913 152,381 447,351 263,691 Adjusted for: Intersegment transactions (1,343) (4,570) (3,211) (7,735) Amortization of intangibles 2 (334) (97) (668) (97) Adjusted Operating Expenses 203,236 147,714 443,472 255,859 Adjusted Operating Income $ 44,083 $ 14,453 $ 84,018 $ 22,030 Adjusted Operating Ratio 82.2 % 91.1 % 84.1 % 92.1 % Segment Adjusted Operating Income and Adjusted Operating Ratio 1 (Unaudited) 1 Pursuant to the requirements of Regulation G, this table reconciles GAAP cash flows from operations to non-GAAP Free Cash Flow. 2 "Amortization of intangibles" reflects the non-cash amortization expense relating to intangible assets identified in the UTXL acquisition.

Non-GAAP Reconciliation Segment Adjusted Operating Income and Adjusted Operating Ratio 1 (Unaudited) Quarter-to-Date June 30, Year-to-Date June 30, Intermodal Segment 2022 2021 2022 2021 GAAP Presentation (Dollars in thousands) Total revenue $ 132,871 $ 115,378 $ 242,093 $ 222,444 Total operating expenses (118,699) (109,566) (212,751) (213,175) Operating income $ 14,172 $ 5,812 $ 29,342 $ 9,269 Operating ratio 89.3 % 95.0 % 87.9 % 95.8 % Non-GAAP Presentation Total revenue $ 132,871 $ 115,378 $ 242,093 $ 222,444 Intersegment transactions (17) (84) (47) (179) Revenue, excluding intersegment transactions 132,854 115,294 242,046 222,265 Total operating expenses 118,699 109,566 212,751 213,175 Adjusted for: Intersegment transactions (17) (84) (47) (179) Adjusted Operating Expenses 118,682 109,482 212,704 212,996 Adjusted Operating Income $ 14,172 $ 5,812 $ 29,342 $ 9,269 Adjusted Operating Ratio 89.3 % 95.0 % 87.9 % 95.8 % 1 Pursuant to the requirements of Regulation G, this table reconciles GAAP cash flows from operations to non-GAAP Free Cash Flow.

Non-GAAP Reconciliation Return on Net Tangible Assets 1 (Unaudited) June 30, 2022 2021 (Dollars in thousands) Total Assets $ 10,714,878 $ 8,682,459 Adjusted for: Intangible assets, net (1,798,668) (1,403,483) Goodwill (3,518,589) (2,971,023) Tangible Assets $ 5,397,621 $ 4,307,953 Total Liabilities $ 4,083,621 $ 2,584,406 Adjusted for: Revolving line of credit, finance lease obligations, and long-term debt (1,720,712) (592,286) Accounts receivable securitization (278,594) (278,372) Deferred income tax liabilities (874,601) (806,398) Non-Interest Bearing Liabilities, excluding deferred income tax liabilities $ 1,209,714 $ 907,350 Net Tangible Assets $ 4,187,907 $ 3,400,603 Average Net Tangible Assets $ 3,794,255 Adjusted Net Income - TTM June 30, 2022 $ 940,802 Return on Net Tangible Assets 24.8 % 1 Pursuant to the requirements of Regulation G, this table reconciles Total Assets and Total Liabilities to Average Net Tangible Assets.
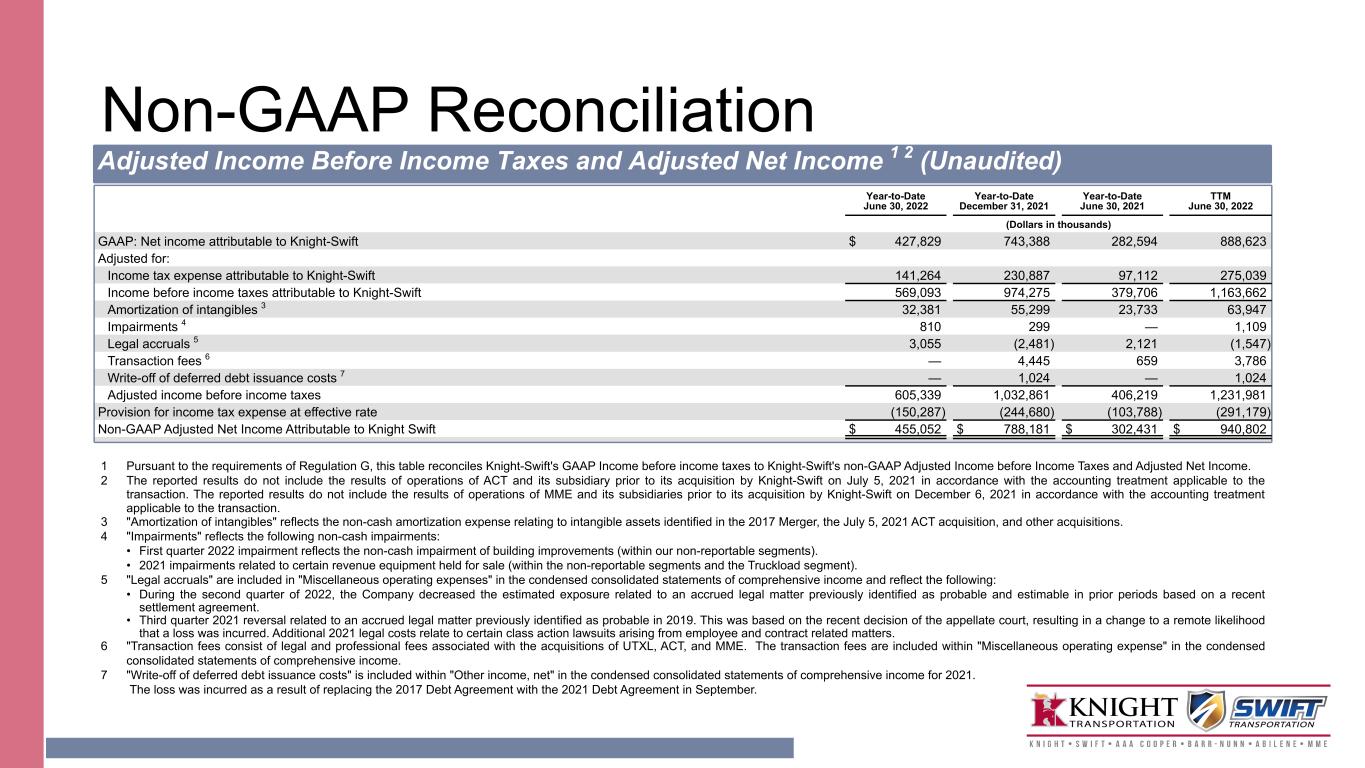
Non-GAAP Reconciliation Adjusted Income Before Income Taxes and Adjusted Net Income 1 2 (Unaudited) Year-to-Date June 30, 2022 Year-to-Date December 31, 2021 Year-to-Date June 30, 2021 TTM June 30, 2022 (Dollars in thousands) GAAP: Net income attributable to Knight-Swift $ 427,829 743,388 282,594 888,623 Adjusted for: Income tax expense attributable to Knight-Swift 141,264 230,887 97,112 275,039 Income before income taxes attributable to Knight-Swift 569,093 974,275 379,706 1,163,662 Amortization of intangibles 3 32,381 55,299 23,733 63,947 Impairments 4 810 299 — 1,109 Legal accruals 5 3,055 (2,481) 2,121 (1,547) Transaction fees 6 — 4,445 659 3,786 Write-off of deferred debt issuance costs 7 — 1,024 — 1,024 Adjusted income before income taxes 605,339 1,032,861 406,219 1,231,981 Provision for income tax expense at effective rate (150,287) (244,680) (103,788) (291,179) Non-GAAP Adjusted Net Income Attributable to Knight Swift $ 455,052 $ 788,181 $ 302,431 $ 940,802 1 Pursuant to the requirements of Regulation G, this table reconciles Knight-Swift's GAAP Income before income taxes to Knight-Swift's non-GAAP Adjusted Income before Income Taxes and Adjusted Net Income. 2 The reported results do not include the results of operations of ACT and its subsidiary prior to its acquisition by Knight-Swift on July 5, 2021 in accordance with the accounting treatment applicable to the transaction. The reported results do not include the results of operations of MME and its subsidiaries prior to its acquisition by Knight-Swift on December 6, 2021 in accordance with the accounting treatment applicable to the transaction. 3 "Amortization of intangibles" reflects the non-cash amortization expense relating to intangible assets identified in the 2017 Merger, the July 5, 2021 ACT acquisition, and other acquisitions. 4 "Impairments" reflects the following non-cash impairments: • First quarter 2022 impairment reflects the non-cash impairment of building improvements (within our non-reportable segments). • 2021 impairments related to certain revenue equipment held for sale (within the non-reportable segments and the Truckload segment). 5 "Legal accruals" are included in "Miscellaneous operating expenses" in the condensed consolidated statements of comprehensive income and reflect the following: • During the second quarter of 2022, the Company decreased the estimated exposure related to an accrued legal matter previously identified as probable and estimable in prior periods based on a recent settlement agreement. • Third quarter 2021 reversal related to an accrued legal matter previously identified as probable in 2019. This was based on the recent decision of the appellate court, resulting in a change to a remote likelihood that a loss was incurred. Additional 2021 legal costs relate to certain class action lawsuits arising from employee and contract related matters. 6 "Transaction fees consist of legal and professional fees associated with the acquisitions of UTXL, ACT, and MME. The transaction fees are included within "Miscellaneous operating expense" in the condensed consolidated statements of comprehensive income. 7 "Write-off of deferred debt issuance costs" is included within "Other income, net" in the condensed consolidated statements of comprehensive income for 2021. The loss was incurred as a result of replacing the 2017 Debt Agreement with the 2021 Debt Agreement in September.
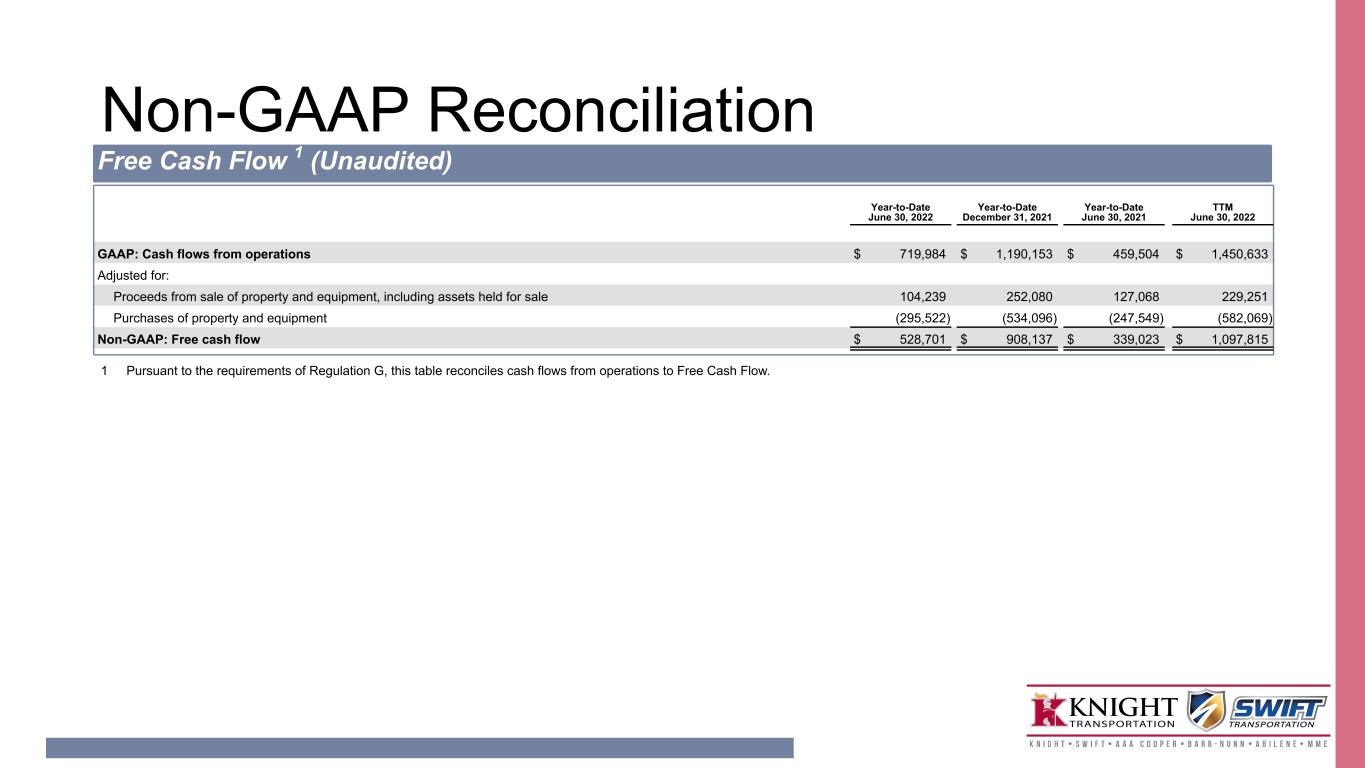
Non-GAAP Reconciliation Free Cash Flow 1 (Unaudited) Year-to-Date June 30, 2022 Year-to-Date December 31, 2021 Year-to-Date June 30, 2021 TTM June 30, 2022 GAAP: Cash flows from operations $ 719,984 $ 1,190,153 $ 459,504 $ 1,450,633 Adjusted for: Proceeds from sale of property and equipment, including assets held for sale 104,239 252,080 127,068 229,251 Purchases of property and equipment (295,522) (534,096) (247,549) (582,069) Non-GAAP: Free cash flow $ 528,701 $ 908,137 $ 339,023 $ 1,097,815 1 Pursuant to the requirements of Regulation G, this table reconciles cash flows from operations to Free Cash Flow.


