First Quarter 2023 Earnings Exhibit 99.2

2 Disclosure This presentation, including documents incorporated herein by reference, will contain forward-looking statements within the meaning of Section 27A of the Securities Act of 1933, as amended and Section 21E of the Securities Exchange Act of 1934, as amended. Such forward-looking statements are made pursuant to the safe harbor provisions of the Private Securities Litigation Reform Act of 1995. Forward-looking statements are subject to risks and uncertainties that could cause actual results to differ materially from those contemplated by the forward-looking statements. Please review our disclosures in filings with the United States Securities and Exchange Commission. Non-GAAP Financial Data This presentation includes the use of adjusted operating income, operating ratio, adjusted operating ratio, adjusted earnings per share, adjusted income before taxes and adjusted operating expenses, which are financial measures that are not in accordance with United States generally accepted accounting principles (“GAAP”). Each such measure is a supplemental non-GAAP financial measure that is used by management and external users of our financial statements, such as industry analysts, investors and lenders. While management believes such measures are useful for investors, they should not be used as a replacement for financial measures that are in accordance with GAAP. In addition, our use of these non-GAAP measures should not be interpreted as indicating that these or similar items could not occur in future periods. In addition, adjusted operating ratio excludes truckload and LTL segment fuel surcharges from revenue and nets these surcharges against fuel expense.

3 Adjustments • $16.2M in Q1 2023 and $16.2M in Q1 2022 of amortization expense from mergers and acquisitions • $0.3M decrease and $5.1M increase in legal accrual related to settlements in Q1 2023 and Q1 2022, respectively • $0.8M in Q1 2022 of impairments • $1.5M in Q1 2023 of transaction fees • $1.5M in Q1 2023 of severance expense 1 See GAAP to non-GAAP reconciliation in the schedules following this presentation KNX Q1 2023 Comparative Results 1,827 1,637 1Q22 1Q23 Total Revenue (10.4%) 1,648 1,450 1Q22 1Q23 Revenue xFSC (12.0%) 298 145 1Q22 1Q23 Operating Income (51.4%) 320 164 1Q22 1Q23 Adj. Operating Inc. 1 (48.9%) 208 104 1Q22 1Q23 Net Income (49.9%) 225 118 1Q22 1Q23 Adj. Net Income 1 (47.3%) $1.25 $0.64 1Q22 1Q23 Earnings Per Share (48.8%) $1.35 $0.73 1Q22 1Q23 Adj. EPS 1 (45.8%) In m ill io ns In m ill io ns In m ill io ns Strong margins as we navigate challenging freight environment Creating Value To Drive Growth Leveraging our scale, technology, and talented people to help our customers solve large, complex supply chain challenges
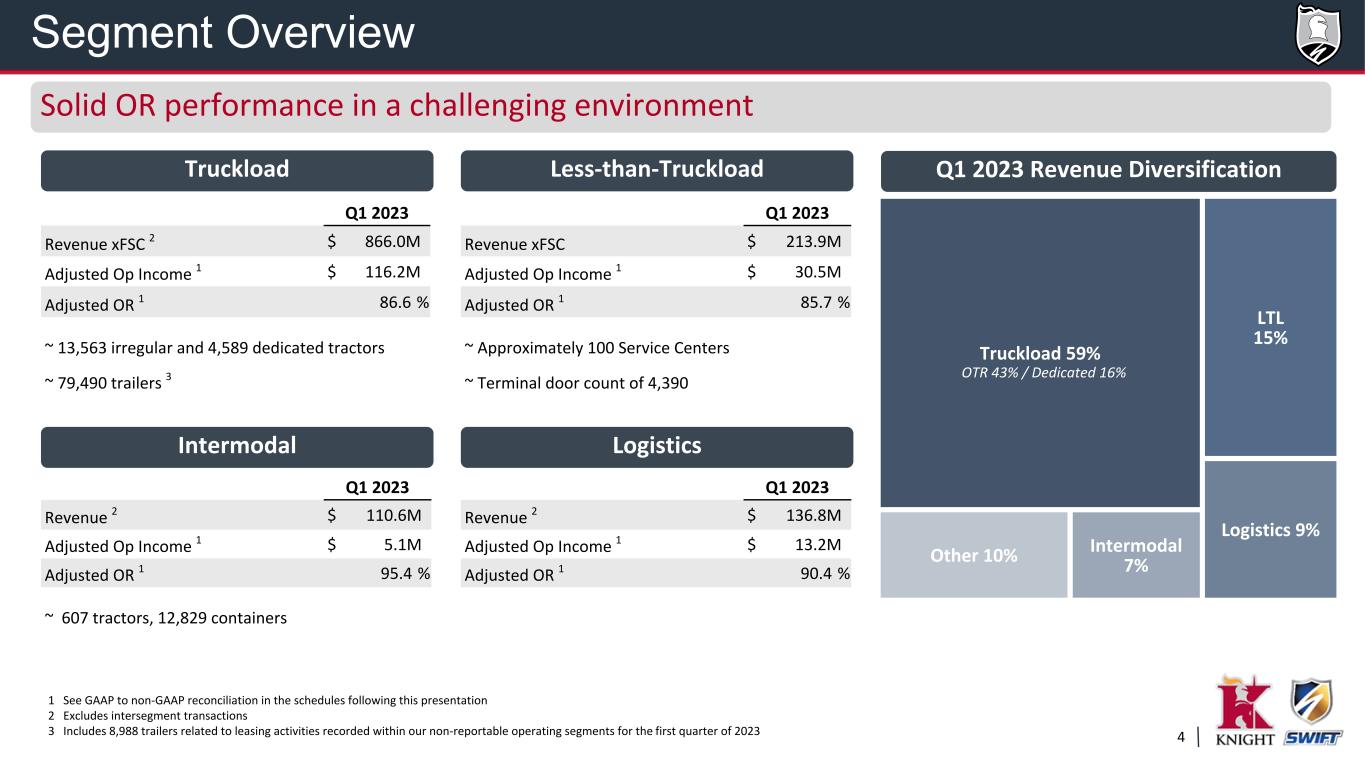
4 Truckload 981.5 57.3 % LTL 224.2 13.1 % Logistics 247.3 14.4 % Intermodal 132.9 7.8 % Other 128.1 7.5 % 1714 1 See GAAP to non-GAAP reconciliation in the schedules following this presentation 2 Excludes intersegment transactions 3 Includes 8,988 trailers related to leasing activities recorded within our non-reportable operating segments for the first quarter of 2023 Q1 2023 Revenue xFSC 2 $ 866.0 M Adjusted Op Income 1 $ 116.2 M Adjusted OR 1 86.6 % ~ 13,563 irregular and 4,589 dedicated tractors ~ 79,490 trailers 3 Q1 2023 Revenue 2 $ 110.6 M Adjusted Op Income 1 $ 5.1 M Adjusted OR 1 95.4 % ~ 607 tractors, 12,829 containers Q1 2023 Revenue 2 $ 136.8 M Adjusted Op Income 1 $ 13.2 M Adjusted OR 1 90.4 % Q1 2023 Revenue xFSC $ 213.9 M Adjusted Op Income 1 $ 30.5 M Adjusted OR 1 85.7 % ~ Approximately 100 Service Centers ~ Terminal door count of 4,390 Truckload 59% LTL 15% Logistics 9% Other 10% Intermodal 7% OTR 43% / Dedicated 16% Segment Overview Solid OR performance in a challenging environment Truckload Less-than-Truckload Intermodal Logistics Q1 2023 Revenue Diversification
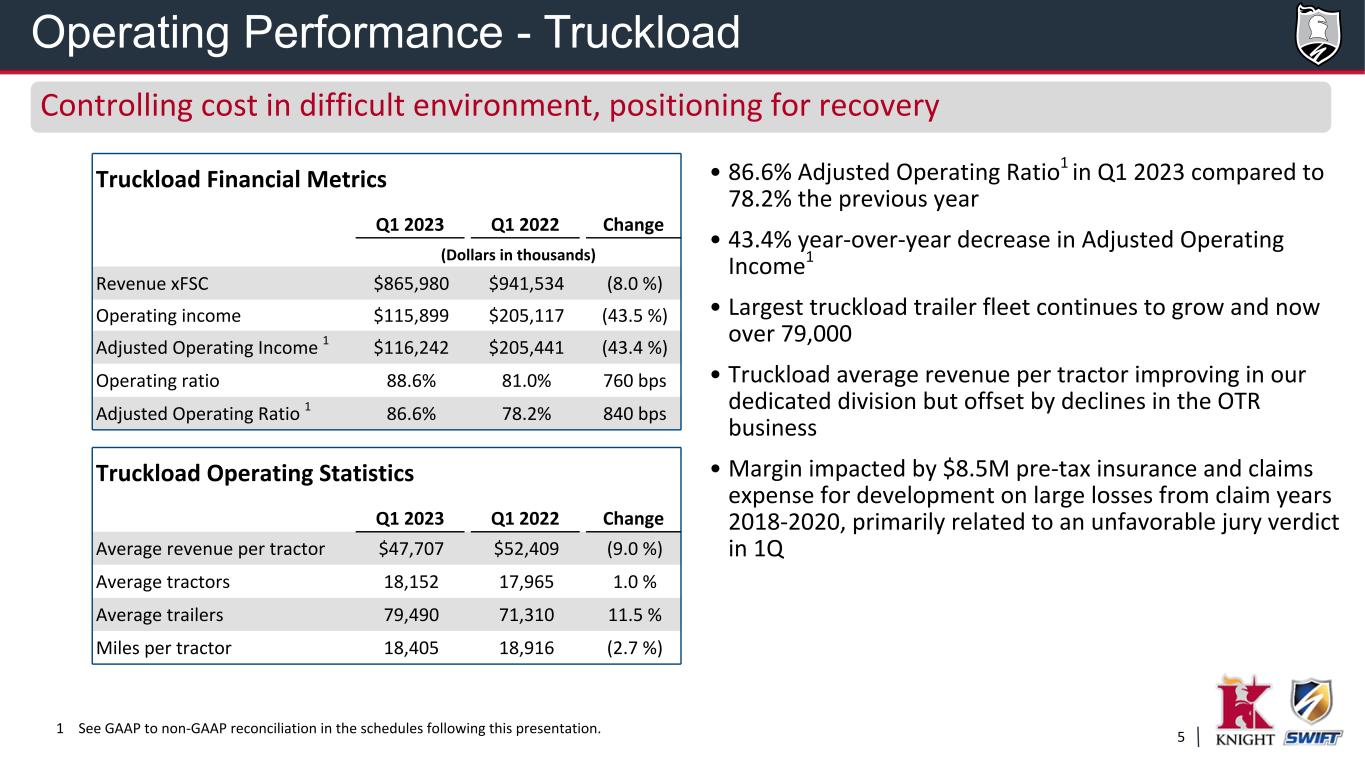
5 • 86.6% Adjusted Operating Ratio1 in Q1 2023 compared to 78.2% the previous year • 43.4% year-over-year decrease in Adjusted Operating Income1 • Largest truckload trailer fleet continues to grow and now over 79,000 • Truckload average revenue per tractor improving in our dedicated division but offset by declines in the OTR business • Margin impacted by $8.5M pre-tax insurance and claims expense for development on large losses from claim years 2018-2020, primarily related to an unfavorable jury verdict in 1Q 1 See GAAP to non-GAAP reconciliation in the schedules following this presentation. Truckload Operating Statistics Q1 2023 Q1 2022 Change Average revenue per tractor $47,707 $52,409 (9.0 %) Average tractors 18,152 17,965 1.0 % Average trailers 79,490 71,310 11.5 % Miles per tractor 18,405 18,916 (2.7 %) Truckload Financial Metrics Q1 2023 Q1 2022 Change (Dollars in thousands) Revenue xFSC $865,980 $941,534 (8.0 %) Operating income $115,899 $205,117 (43.5 %) Adjusted Operating Income 1 $116,242 $205,441 (43.4 %) Operating ratio 88.6% 81.0% 760 bps Adjusted Operating Ratio 1 86.6% 78.2% 840 bps Controlling cost in difficult environment, positioning for recovery Operating Performance - Truckload

6 • 85.7% Adjusted Operating Ratio1 in Q1 2023 • $30.5M of Adjusted Operating Income1 • 5.1% increase in LTL Revenue xFSC per shipment compared to Q1 2022 • 8.7% increase in revenue xFSC per hundredweight compared to Q1 2022 LTL Operating Statistics Q1 2023 Q1 2022 Change LTL shipments per day 17,717 18,783 (5.7 %) LTL weight per shipment 1,061 1,098 (3.4 %) LTL revenue xFSC per hundredweight $14.93 $13.73 8.7 % LTL revenue xFSC per shipment $158.45 $150.70 5.1 % 1 See GAAP to non-GAAP reconciliation in the schedules following this presentation. LTL Financial Metrics Q1 2023 Q1 2022 Change (Dollars in thousands) Revenue xFSC $213,929 $214,675 (0.3 %) Operating income $26,582 $26,377 0.8 % Adjusted Operating Income 1 $30,502 $30,322 0.6 % Operating ratio 89.6% 89.7% (10 bps) Adjusted Operating Ratio 1 85.7% 85.9% (20 bps) Operating Performance - LTL Strong performance as we continue to expand our network to drive growth

7 • 90.4% Adjusted Operating Ratio1 during the quarter, a 470 basis point deterioration from the prior year; 400 basis point deterioration sequentially • 19.8% Gross margin for Q1 representing a 40 basis point decrease from the prior year • 23.2% YoY decrease in load count as spot market remains soft 1 See GAAP to non-GAAP reconciliation in the schedules following this presentation. Operating Statistics Q1 2023 Q1 2022 Change Revenue per load $1,715 $2,697 (36.4 %) Gross margin 19.8% 20.2% (40 bps) Logistics Financial Metrics Q1 2023 Q1 2022 Change (Dollars in thousands) Revenue ex intersegment $136,777 $280,171 (51.2 %) Operating income $12,820 $39,601 (67.6 %) Adjusted Operating Income 1 $13,154 $39,935 (67.1 %) Operating ratio 90.7% 86.0% 470 bps Adjusted Operating Ratio 1 90.4% 85.7% 470 bps Solid margins in a challenging freight environment Operating Performance - Logistics Extensive Trailer Network Powers Supply Chains
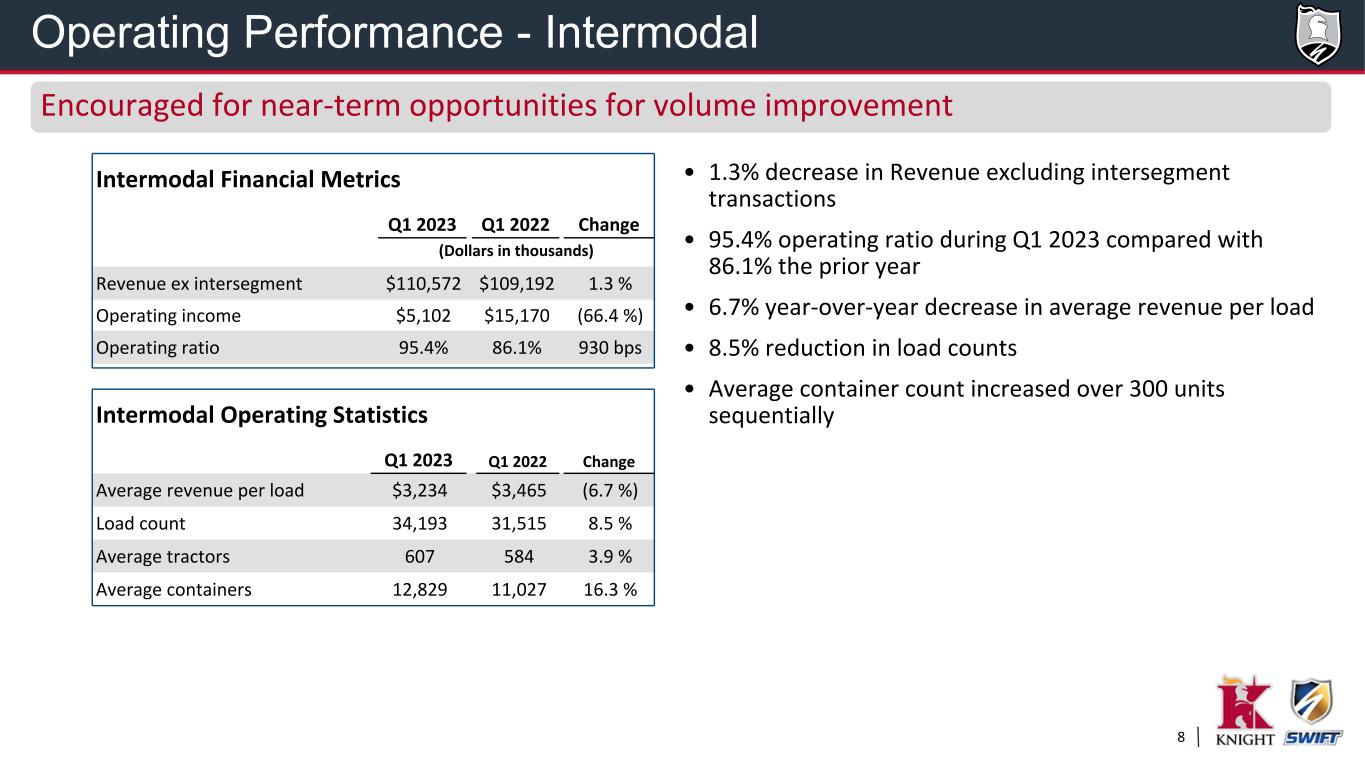
8 • 1.3% decrease in Revenue excluding intersegment transactions • 95.4% operating ratio during Q1 2023 compared with 86.1% the prior year • 6.7% year-over-year decrease in average revenue per load • 8.5% reduction in load counts • Average container count increased over 300 units sequentiallyIntermodal Operating Statistics Q1 2023 Q1 2022 Change Average revenue per load $3,234 $3,465 (6.7 %) Load count 34,193 31,515 8.5 % Average tractors 607 584 3.9 % Average containers 12,829 11,027 16.3 % Intermodal Financial Metrics Q1 2023 Q1 2022 Change (Dollars in thousands) Revenue ex intersegment $110,572 $109,192 1.3 % Operating income $5,102 $15,170 (66.4 %) Operating ratio 95.4% 86.1% 930 bps Operating Performance - Intermodal Encouraged for near-term opportunities for volume improvement

9 Q1 Non-Reportable Performance: • 20.7% increase in revenue to $142.0M • ($15.6M) in operating loss ◦ Third party insurance business posted $22.8M loss due to increased frequency and unfavorable claims development and revenue collectability challenges with small carriers Growth trajectory expected to temporarily slow Strategic Pivot on Third Party Insurance • Temporarily reducing exposure to third party insurance risk in an unusually difficult environment for small operators • Near term headwind to revenue growth for this program, but the prudent move for our business at this point in the cycle Operating Performance - Non-Reportable Non-Reportable Financial Metrics Q1 2023 Q1 2022 Change (Dollars in thousands) Revenue $141,986 $117,639 20.7 % Operating (loss) income $(15,616) $11,821 (232.1 %)

10 U.S. Xpress - Go Forward Plan / Business Evolution (1) Total Transportation of Mississippi LLC Acquisition announced March 22nd, anticipated to close early Q3 Adjusted Operating Ratio in the high 80's will result in a mid-teens return on invested capital

11 • Continued softness in freight demand with non-contract rates trending below contract rates through the first half of 2023 as shippers work through higher inventory levels • Capacity continues to exit at an accelerating rate • Freight volumes begin to improve during 2nd half of the year with a more typical peak season • Spot pricing bottoms out in 2Q and begins recovering in 2nd half of 2023 • Expect trailer pool service to continue to be a differentiator when demand recovers • LTL demand pressured but remains more stable than truckload • LTL improvement in revenue (excluding fuel) per hundredweight year-over-year • Inflationary pressures ease in many cost areas but remain elevated on a year-over-year basis • Equipment and labor availability continues to improve, particularly for large carriers • Demand in the used equipment market weakens as small carriers struggle Market Outlook

12 Other Guidance Assumptions • LTL revenue (xFSC) increases modestly year-over-year with relatively stable margin profile and typical seasonality • Intermodal Operating Ratio in the mid 90's for the full year with volumes up year over year • Non-Reportable - Easing trailer lease demand from lower inventory overhang and muted freight conditions, and continued revenue and margin growth in warehousing • Expect modest increase in interest expense from Q1, assuming Fed hiking cycle is nearly complete • Net cash capex for the full year 2023 expected range of $640M - $690M; truckload tractor count sequentially stable throughout the year • Expected tax rate to be approximately 25% for the full year 2023 Updated expected Adjusted EPS for 2023 from $4.05 - $4.25 to new range of $3.35 - $3.55 2023 Guidance Update1 1. Excludes U.S. Xpress pending close of the acquisition Non - Reportable • Continue growth in revenue / operating income Updated Guidance Commentary •Modest revenue growth / quarterly operating income at roughly half the prior run-rate for the balance of year • Reflecting reduced exposure to third party insurance risk; net impact to guidance from Iron Insurance change, down ~$0.35 per share TL - Revenue Per Mile • Overall revenue per mile decreases mid- single digits for the year • Overall revenue per mile decreases high single digits for the year • Contract rates continue under pressure, toughest YoY comp for overall revenue/mile in Q2, trending to flat YoY in the fourth quarter Logistics • Volume and revenue per load down in Q1 and then improving on a sequential basis for the rest of the year / OR high 80's to low 90's • Volume and revenue per load remains under pressure into Q2 before improving in the back half of the year / OR low 90's for year Cost per Mile • Gain on Sale range $10M to $15M per quarter • Gain on Sale range $15M to $20M per quarter • Improved traction on cost controls and improved gain on sale Prior Guidance • Demand remains muted in Q2 keeping spot rates lower Key Changes

Appendix
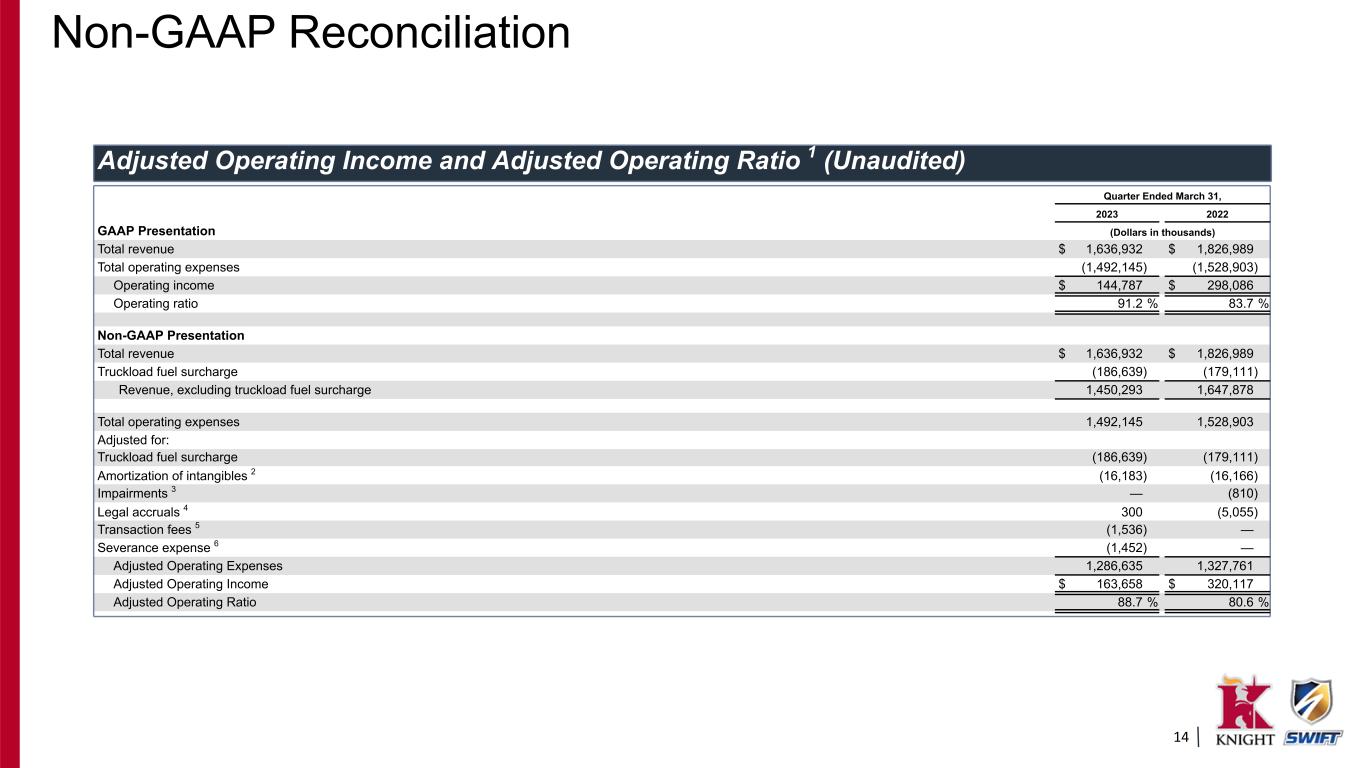
14 Adjusted Operating Income and Adjusted Operating Ratio 1 (Unaudited) Quarter Ended March 31, 2023 2022 GAAP Presentation (Dollars in thousands) Total revenue $ 1,636,932 $ 1,826,989 Total operating expenses (1,492,145) (1,528,903) Operating income $ 144,787 $ 298,086 Operating ratio 91.2 % 83.7 % Non-GAAP Presentation Total revenue $ 1,636,932 $ 1,826,989 Truckload fuel surcharge (186,639) (179,111) Revenue, excluding truckload fuel surcharge 1,450,293 1,647,878 Total operating expenses 1,492,145 1,528,903 Adjusted for: Truckload fuel surcharge (186,639) (179,111) Amortization of intangibles 2 (16,183) (16,166) Impairments 3 — (810) Legal accruals 4 300 (5,055) Transaction fees 5 (1,536) — Severance expense 6 (1,452) — Adjusted Operating Expenses 1,286,635 1,327,761 Adjusted Operating Income $ 163,658 $ 320,117 Adjusted Operating Ratio 88.7 % 80.6 % Non-GAAP Reconciliation
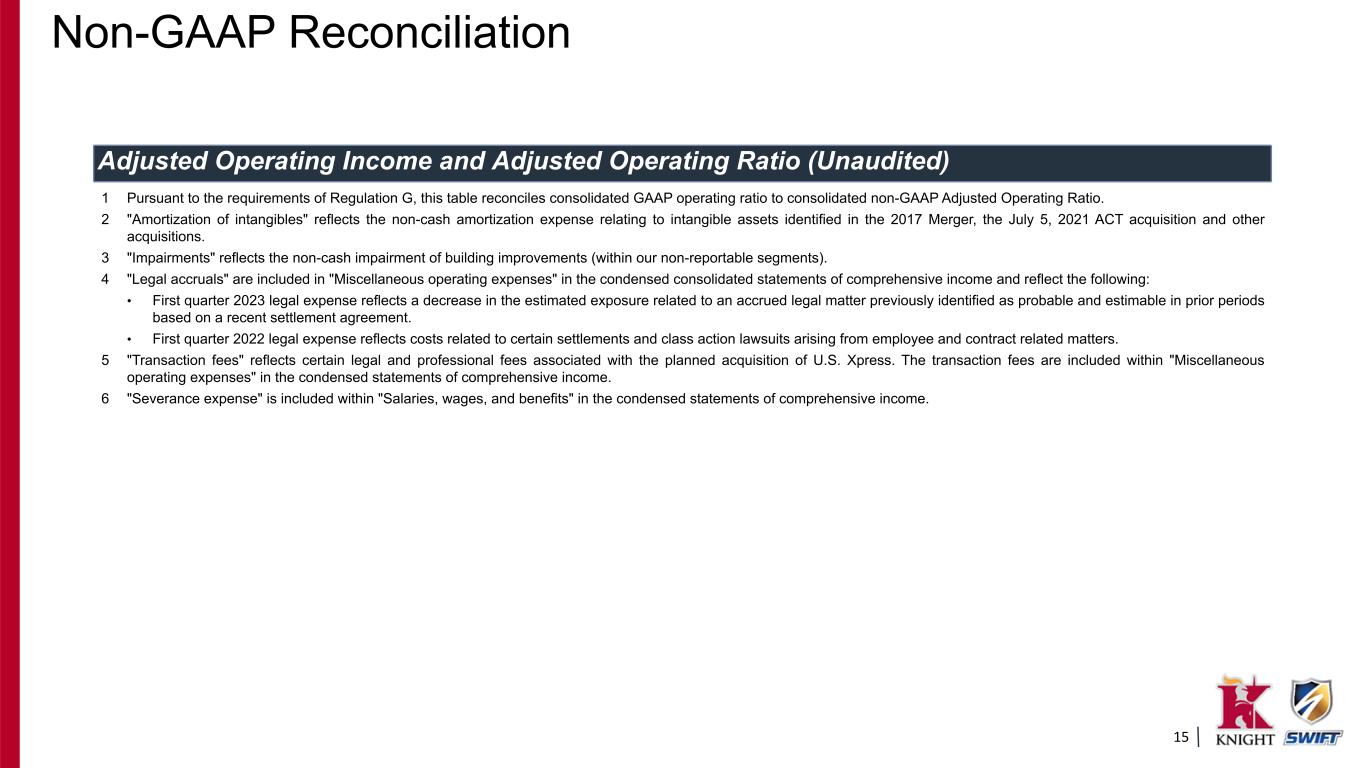
15 Adjusted Operating Income and Adjusted Operating Ratio (Unaudited) 1 Pursuant to the requirements of Regulation G, this table reconciles consolidated GAAP operating ratio to consolidated non-GAAP Adjusted Operating Ratio. 2 "Amortization of intangibles" reflects the non-cash amortization expense relating to intangible assets identified in the 2017 Merger, the July 5, 2021 ACT acquisition and other acquisitions. 3 "Impairments" reflects the non-cash impairment of building improvements (within our non-reportable segments). 4 "Legal accruals" are included in "Miscellaneous operating expenses" in the condensed consolidated statements of comprehensive income and reflect the following: • First quarter 2023 legal expense reflects a decrease in the estimated exposure related to an accrued legal matter previously identified as probable and estimable in prior periods based on a recent settlement agreement. • First quarter 2022 legal expense reflects costs related to certain settlements and class action lawsuits arising from employee and contract related matters. 5 "Transaction fees" reflects certain legal and professional fees associated with the planned acquisition of U.S. Xpress. The transaction fees are included within "Miscellaneous operating expenses" in the condensed statements of comprehensive income. 6 "Severance expense" is included within "Salaries, wages, and benefits" in the condensed statements of comprehensive income. Non-GAAP Reconciliation

16 Adjusted Net Income Attributable to Knight-Swift and Adjusted EPS 1 (Unaudited) Quarter Ended March 31, 2023 2022 (Dollars in thousands, except per share data) GAAP: Net income attributable to Knight-Swift $ 104,284 $ 208,337 Adjusted for: Income tax expense attributable to Knight-Swift 32,735 69,174 Income before income taxes attributable to Knight-Swift 137,019 277,511 Amortization of intangibles 2 16,183 16,166 Impairments 3 — 810 Legal accruals 4 (300) 5,055 Transaction fees 5 1,536 — Severance expense 6 1,452 — Adjusted income before income taxes 155,890 299,542 Provision for income tax expense at effective rate (37,399) (74,679) Non-GAAP: Adjusted Net Income Attributable to Knight-Swift $ 118,491 $ 224,863 1 Pursuant to the requirements of Regulation G, these tables reconcile consolidated GAAP net income attributable to Knight-Swift to non-GAAP consolidated Adjusted Net Income Attributable to Knight- Swift. 2 Refer to Non-GAAP Reconciliation (Unaudited): Adjusted Operating Income and Adjusted Operating Ratio – footnote 2. 3 Refer to Non-GAAP Reconciliation (Unaudited): Adjusted Operating Income and Adjusted Operating Ratio – footnote 3. 4 Refer to Non-GAAP Reconciliation (Unaudited): Adjusted Operating Income and Adjusted Operating Ratio – footnote 4. 5 Refer to Non-GAAP Reconciliation (Unaudited): Adjusted Operating Income and Adjusted Operating Ratio – footnote 5. 6 Refer to Non-GAAP Reconciliation (Unaudited): Adjusted Operating Income and Adjusted Operating Ratio – footnote 6. Non-GAAP Reconciliation

17 Adjusted Net Income Attributable to Knight-Swift and Adjusted EPS 1 (Unaudited) Quarter Ended March 31, 2023 2022 GAAP: Earnings per diluted share $ 0.64 $ 1.25 Adjusted for: Income tax expense attributable to Knight-Swift 0.20 0.42 Income before income taxes attributable to Knight-Swift 0.85 1.67 Amortization of intangibles 2 0.10 0.10 Impairments 3 — — Legal accruals 4 — 0.03 Transaction fees 5 0.01 — Severance expense 6 0.01 — Adjusted income before income taxes 0.96 1.80 Provision for income tax expense at effective rate (0.23) (0.45) Non-GAAP: Adjusted EPS $ 0.73 $ 1.35 Note: Because the numbers reflected in the table above are calculated on a per share basis, they may not foot due to rounding. 1 Pursuant to the requirements of Regulation G, these tables reconcile consolidated GAAP diluted earnings per share to non-GAAP consolidated Adjusted EPS. 2 Refer to Non-GAAP Reconciliation (Unaudited): Adjusted Operating Income and Adjusted Operating Ratio – footnote 2. 3 Refer to Non-GAAP Reconciliation (Unaudited): Adjusted Operating Income and Adjusted Operating Ratio – footnote 3. 4 Refer to Non-GAAP Reconciliation (Unaudited): Adjusted Operating Income and Adjusted Operating Ratio – footnote 4. 5 Refer to Non-GAAP Reconciliation (Unaudited): Adjusted Operating Income and Adjusted Operating Ratio – footnote 5. 6 Refer to Non-GAAP Reconciliation (Unaudited): Adjusted Operating Income and Adjusted Operating Ratio – footnote 6. Non-GAAP Reconciliation

18 Segment Adjusted Operating Income and Adjusted Operating Ratio 1 (Unaudited) Quarter Ended March 31, Truckload Segment 2023 2022 GAAP Presentation (Dollars in thousands) Total revenue $ 1,012,245 $ 1,080,531 Total operating expenses (896,346) (875,414) Operating income $ 115,899 $ 205,117 Operating ratio 88.6 % 81.0 % Non-GAAP Presentation Total revenue $ 1,012,245 $ 1,080,531 Fuel surcharge (145,264) (138,661) Intersegment transactions (1,001) (336) Revenue, excluding fuel surcharge and intersegment transactions 865,980 941,534 Total operating expenses 896,346 875,414 Adjusted for: Fuel surcharge (145,264) (138,661) Intersegment transactions (1,001) (336) Amortization of intangibles 2 (343) (324) Adjusted Operating Expenses 749,738 736,093 Adjusted Operating Income $ 116,242 $ 205,441 Adjusted Operating Ratio 86.6 % 78.2 % 1 Pursuant to the requirements of Regulation G, this table reconciles GAAP operating ratio to non-GAAP Adjusted Operating Ratio. 2 "Amortization of intangibles" reflects the non-cash amortization expense relating to intangible assets identified in historical Knight acquisitions. Non-GAAP Reconciliation
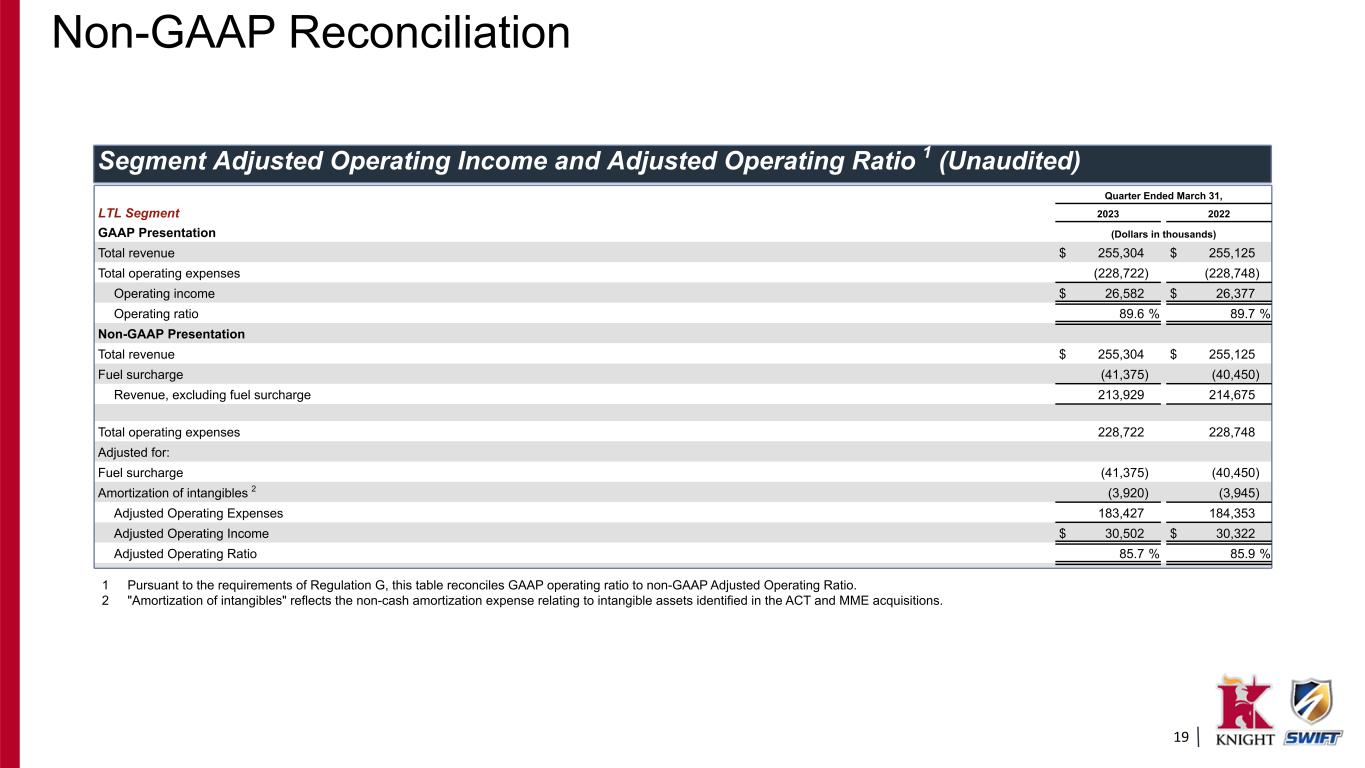
19 Segment Adjusted Operating Income and Adjusted Operating Ratio 1 (Unaudited) Quarter Ended March 31, LTL Segment 2023 2022 GAAP Presentation (Dollars in thousands) Total revenue $ 255,304 $ 255,125 Total operating expenses (228,722) (228,748) Operating income $ 26,582 $ 26,377 Operating ratio 89.6 % 89.7 % Non-GAAP Presentation Total revenue $ 255,304 $ 255,125 Fuel surcharge (41,375) (40,450) Revenue, excluding fuel surcharge 213,929 214,675 Total operating expenses 228,722 228,748 Adjusted for: Fuel surcharge (41,375) (40,450) Amortization of intangibles 2 (3,920) (3,945) Adjusted Operating Expenses 183,427 184,353 Adjusted Operating Income $ 30,502 $ 30,322 Adjusted Operating Ratio 85.7 % 85.9 % 1 Pursuant to the requirements of Regulation G, this table reconciles GAAP operating ratio to non-GAAP Adjusted Operating Ratio. 2 "Amortization of intangibles" reflects the non-cash amortization expense relating to intangible assets identified in the ACT and MME acquisitions. Non-GAAP Reconciliation
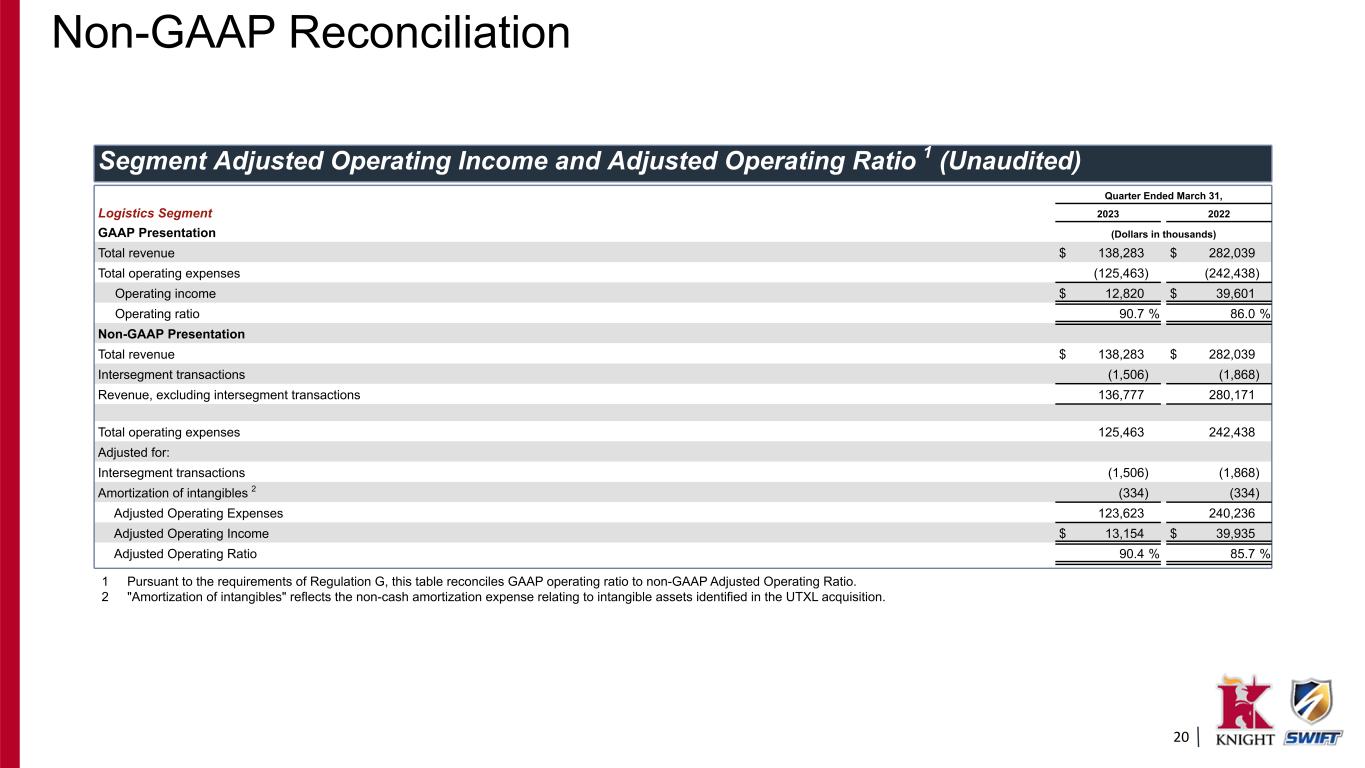
20 Quarter Ended March 31, Logistics Segment 2023 2022 GAAP Presentation (Dollars in thousands) Total revenue $ 138,283 $ 282,039 Total operating expenses (125,463) (242,438) Operating income $ 12,820 $ 39,601 Operating ratio 90.7 % 86.0 % Non-GAAP Presentation Total revenue $ 138,283 $ 282,039 Intersegment transactions (1,506) (1,868) Revenue, excluding intersegment transactions 136,777 280,171 Total operating expenses 125,463 242,438 Adjusted for: Intersegment transactions (1,506) (1,868) Amortization of intangibles 2 (334) (334) Adjusted Operating Expenses 123,623 240,236 Adjusted Operating Income $ 13,154 $ 39,935 Adjusted Operating Ratio 90.4 % 85.7 % Segment Adjusted Operating Income and Adjusted Operating Ratio 1 (Unaudited) 1 Pursuant to the requirements of Regulation G, this table reconciles GAAP operating ratio to non-GAAP Adjusted Operating Ratio. 2 "Amortization of intangibles" reflects the non-cash amortization expense relating to intangible assets identified in the UTXL acquisition. Non-GAAP Reconciliation
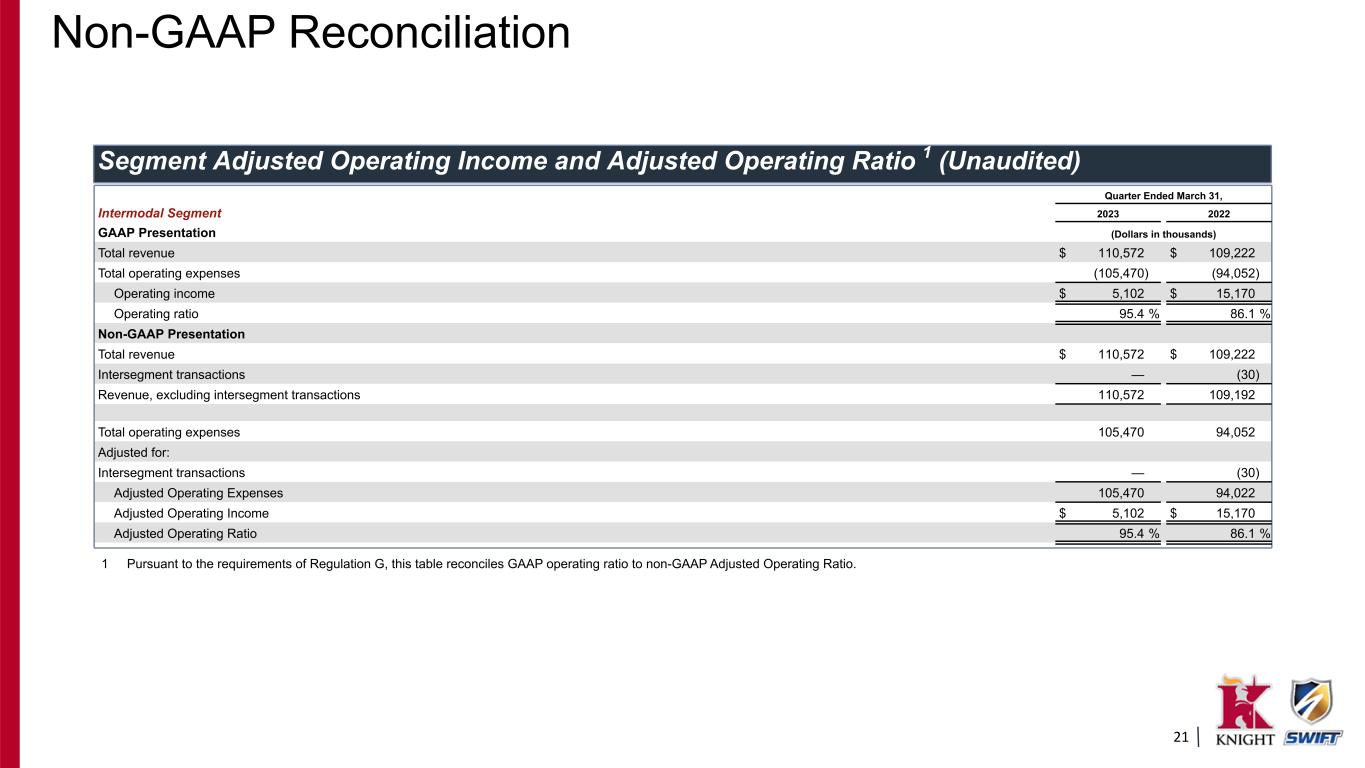
21 Segment Adjusted Operating Income and Adjusted Operating Ratio 1 (Unaudited) Quarter Ended March 31, Intermodal Segment 2023 2022 GAAP Presentation (Dollars in thousands) Total revenue $ 110,572 $ 109,222 Total operating expenses (105,470) (94,052) Operating income $ 5,102 $ 15,170 Operating ratio 95.4 % 86.1 % Non-GAAP Presentation Total revenue $ 110,572 $ 109,222 Intersegment transactions — (30) Revenue, excluding intersegment transactions 110,572 109,192 Total operating expenses 105,470 94,052 Adjusted for: Intersegment transactions — (30) Adjusted Operating Expenses 105,470 94,022 Adjusted Operating Income $ 5,102 $ 15,170 Adjusted Operating Ratio 95.4 % 86.1 % 1 Pursuant to the requirements of Regulation G, this table reconciles GAAP operating ratio to non-GAAP Adjusted Operating Ratio. Non-GAAP Reconciliation


