Exhibit 99.1
| Annual Meeting March 3, 2011 S T A N D A R D |
| Forward-Looking Statements 2 This presentation contains certain forward-looking statements regarding our prospective performance and strategies within the meaning of section 21E of the Securities Exchange Act of 1934, as amended. We intend such forward-looking statements to be covered by the Safe Harbor Provision for forward-looking statements contained in the Private Securities Litigation Reform Act of 1995, and are including this statement for purposes of said Safe Harbor Provision. This report contains forward-looking statements, which can be identified by the use of words such as "estimate," "project," "believe," "intend," "anticipate," "plan," "seek," "expect," "will," "may" and words of similar meaning. These forward-looking statements include, but are not limited to: • statements of our goals, intentions and expectations; • statements regarding our business plans, prospects, growth and operating strategies; • statements regarding the asset quality of our loan and investment portfolios; and • estimates of our risks and future costs and benefits. These forward-looking statements are based on our current beliefs and expectations and are inherently subject to significant business, economic and competitive uncertainties and contingencies, many of which are beyond our control. In addition, these forward-looking statements are subject to assumptions with respect to future business strategies and decisions that are subject to change. We are under no duty to and unless required under the federal securities laws, we do not undertake any obligation to update any forward-looking statements after the date of this report. The following factors, among others, could cause actual results to differ materially from the anticipated results or other expectations expressed in the forward-looking statements: • general economic conditions, either nationally or in our market areas, that are worse than expected; • competition among depository and other financial institutions; • inflation and changes in the interest rate environment that reduce our margins or reduce the fair value of financial instruments; • adverse changes in the securities markets; • changes in laws or government regulations or policies affecting financial institutions, including changes in regulatory fees and capital requirements; • our ability to enter new markets successfully and capitalize on growth opportunities; • our ability to successfully integrate acquired entities, if any; • changes in consumer spending, borrowing and savings habits; • changes in accounting policies and practices, as may be adopted by the bank regulatory agencies, the Financial Accounting Standards Board, the Securities and Exchange Commission and the Public Company Accounting Oversight Board; • changes in our organization, compensation and benefit plans; • changes in our financial condition or results of operations that reduce capital; and • changes in the financial condition or future prospects of issuers of securities that we own. Because of these and other uncertainties, our actual future results may be materially different from the results indicated by these forward- looking statements. |

| Company Overview M A L V E R N S T A N D A R D |

| Overview of Standard Financial Corp. 4 Standard Bank, a Pennsylvania chartered savings bank organized in 1913, is the wholly owned subsidiary of Standard Financial Corp. On October 6, 2010, Standard Financial Corp. completed its mutual-to- stock conversion raising $34.8 million in gross proceeds. Standard Financial Corp. trades on the NASDAQ Capital Market under the symbol STND. Standard Financial Corp. conducts its business from nine banking offices located in the Pennsylvania counties of Allegheny, Westmoreland and Bedford and Allegany County, Maryland. As of December 31, 2010, we had $431.5 million in total assets, $290.3 million in net loans, $312.1 million in deposits and $74.6 million in shareholders' equity. |
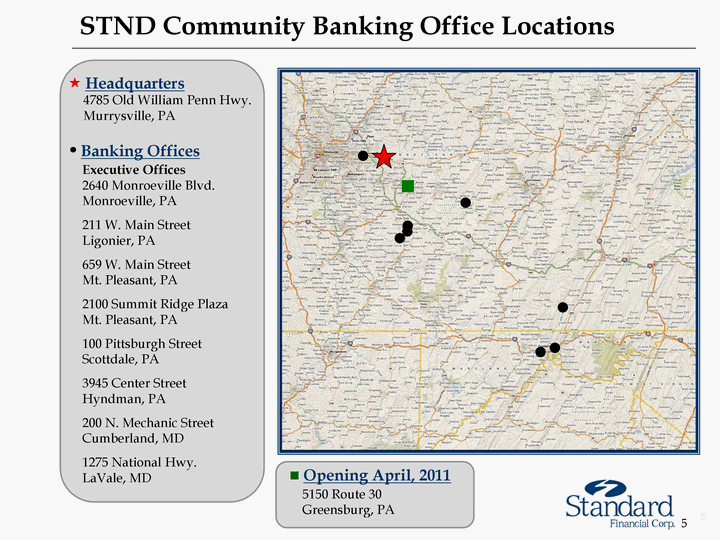
| STND Community Banking Office Locations 4785 Old William Penn Hwy. Murrysville, PA Executive Offices 2640 Monroeville Blvd. Monroeville, PA 211 W. Main Street Ligonier, PA 659 W. Main Street Mt. Pleasant, PA 2100 Summit Ridge Plaza Mt. Pleasant, PA 100 Pittsburgh Street Scottdale, PA 3945 Center Street Hyndman, PA 200 N. Mechanic Street Cumberland, MD 1275 National Hwy. LaVale, MD 5 ? Headquarters ? Opening April, 2011 5150 Route 30 Greensburg, PA ? Banking Offices |

| Market Share in Pennsylvania 6 The population change from 2000-2010 for Westmoreland, Allegheny and Bedford Counties was -2.04%, -4.75% and -0.42%, respectively, compared to - -2.30% for Pennsylvania and 10.59% for the United States. Median household income for 2010 for Westmoreland, Allegheny and Bedford Counties was $48,485, $51,369 and $39,728, respectively, compared to $52,723 for Pennsylvania and $54,442 for the United States. |
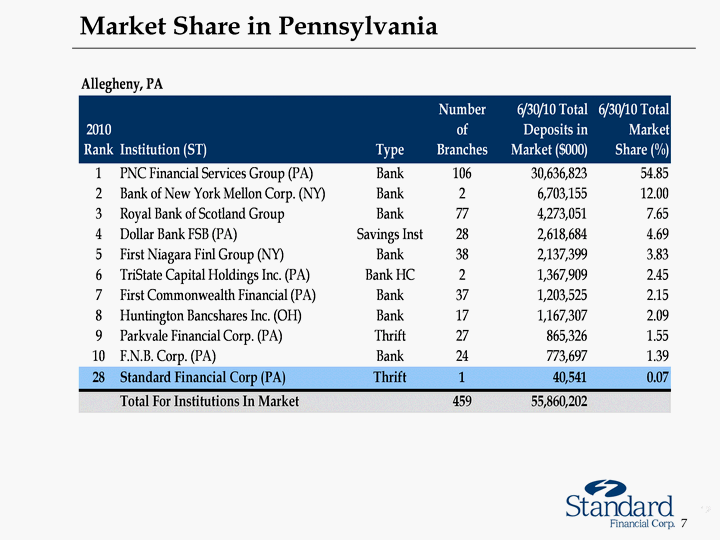
| Market Share in Pennsylvania 7 |
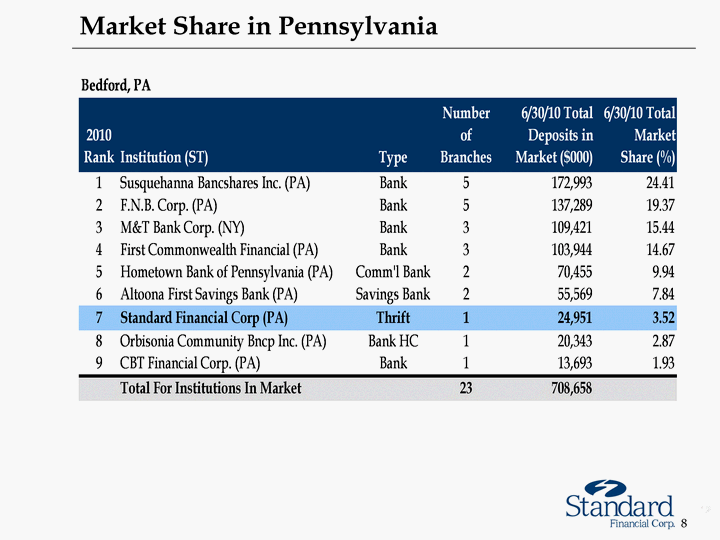
| Market Share in Pennsylvania 8 |

| Market Share in Maryland 9 The population change from 2000-2010 for Allegany County was -2.60% compared to 8.20% for Maryland and 10.59% for the United States. Median household income for 2010 for Allegany County was $37,162 compared to $66,983 for Maryland and $54,442 for the United States. |

| 2011 Business Strategy 10 Our primary objective is to operate as a profitable, community-oriented financial institution serving customers in our market areas. Our business strategy includes the following elements: Remaining a community-oriented financial institution while continuing to increase our customer base with a primary focus on small and medium-size businesses in our market area. Increasing commercial real estate lending while maintaining our conservative loan underwriting standards. Emphasizing lower cost core deposits by attracting new customers and enhancing existing customer relationships. Expanding our community banking office network, primarily by acquiring or establishing new offices. Pursuing future expansion and acquisition opportunities with the capital raised in the conversion, although we have no current arrangements or agreements with respect to any such acquisitions. |

| M A L V E R N Financial Highlights S T A N D A R D |

| Stable Asset Growth 12 Dollars in thousands CAGR = Compound Annual Growth Rate. CAGR 7.2% |
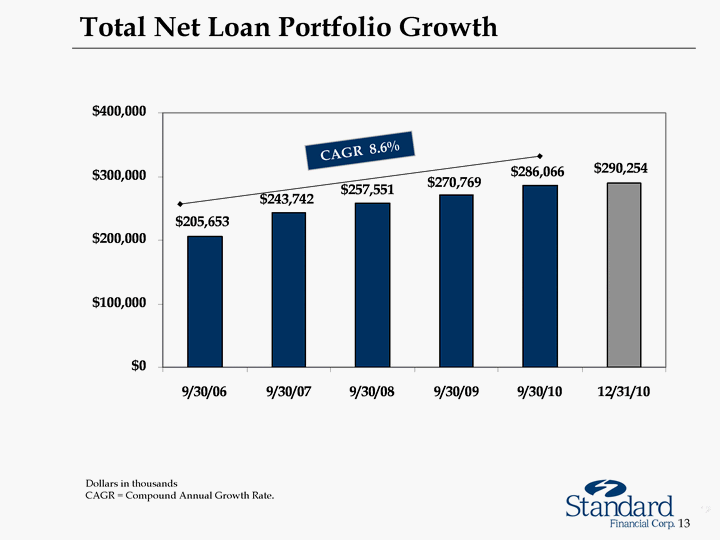
| Total Net Loan Portfolio Growth 13 CAGR 8.6% Dollars in thousands CAGR = Compound Annual Growth Rate. |
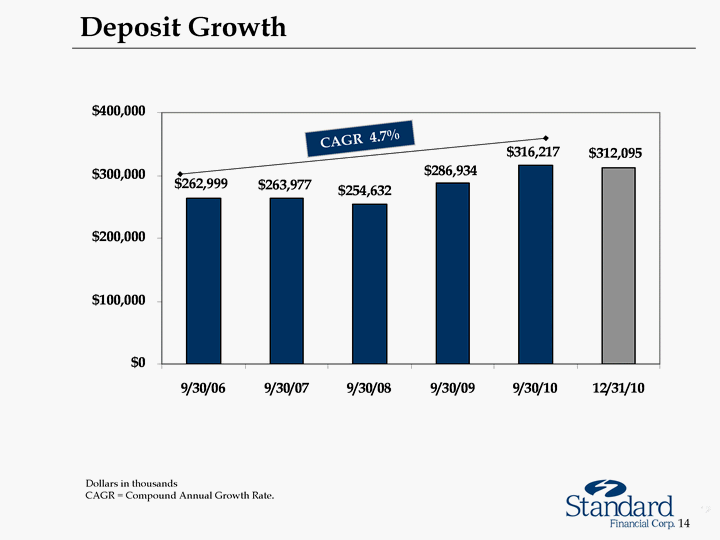
| Deposit Growth 14 CAGR 4.7% Dollars in thousands CAGR = Compound Annual Growth Rate. |
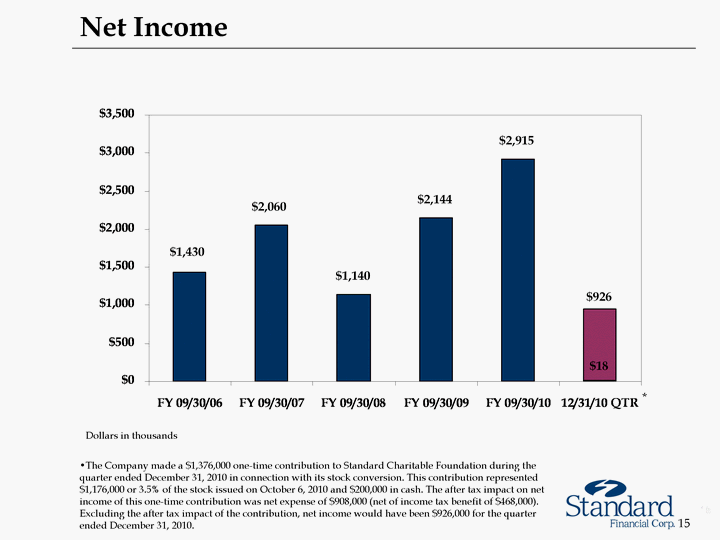
| Net Income 15 Dollars in thousands The Company made a $1,376,000 one-time contribution to Standard Charitable Foundation during the quarter ended December 31, 2010 in connection with its stock conversion. This contribution represented $1,176,000 or 3.5% of the stock issued on October 6, 2010 and $200,000 in cash. The after tax impact on net income of this one-time contribution was net expense of $908,000 (net of income tax benefit of $468,000). Excluding the after tax impact of the contribution, net income would have been $926,000 for the quarter ended December 31, 2010. * |
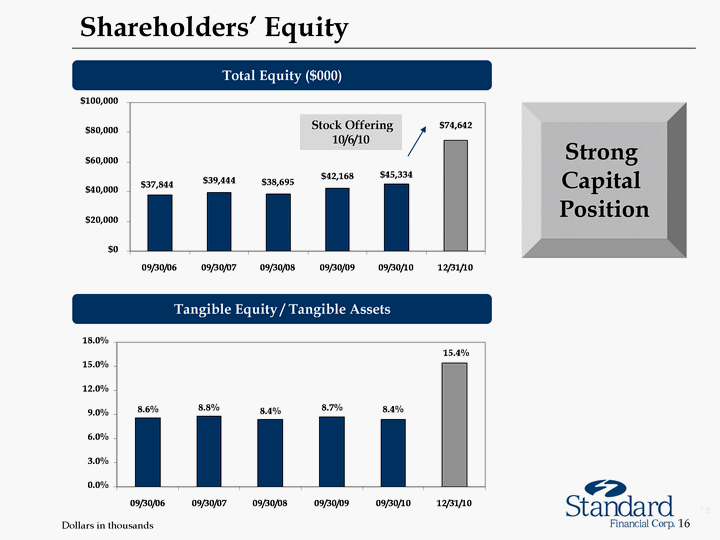
| Shareholders' Equity 16 Stock Offering 10/6/10 Strong Capital Position Total Equity ($000) Tangible Equity / Tangible Assets Dollars in thousands |

| M A L V E R N Market Statistics S T A N D A R D |

| STND Stock Price Performance 18 Since IPO - October 6, 2010 at $10.00 Per Share Data as of February 25, 2011 Source: SNL Financial STND Price on 2/25/11 - $14.67 |
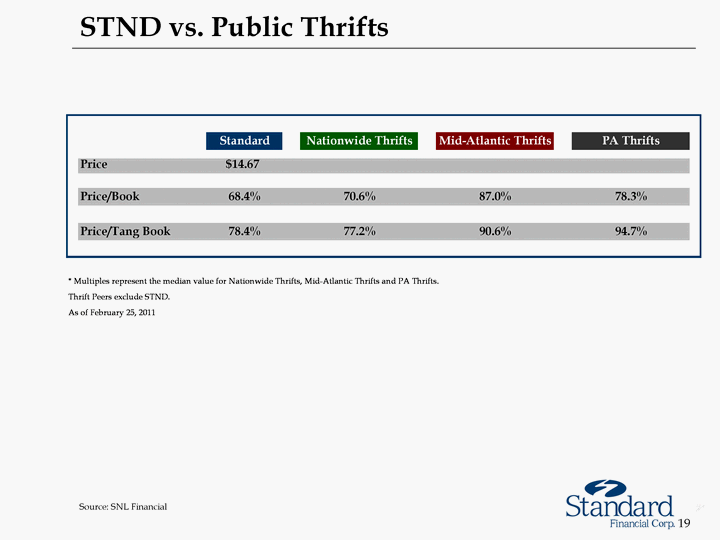
| STND vs. Public Thrifts 19 Source: SNL Financial |

| 2011 Outlook 20 Completed stock conversion in October 2010 raising $34.8 million in gross proceeds. Possible future uses of the capital raised may include: future M&A transactions, paying dividends, and repurchasing our stock (Under banking regulations, we may not repurchase shares of our common stock during the first year following the completion of our stock offering). Emphasize relationship banking with our customers Remain focused on asset quality Prudent loan growth Continue to manage capital Continue to manage the interest rate margin |

| M A L V E R N Questions? S T A N D A R D |