 Annual Meeting February 21, 2012 S T A N D A R D Exhibit 99.1 |
 Forward-Looking Statements 3 2 This presentation contains forward-looking statements, which can be identified by the use of words such as “estimate,” “project,” “believe,” “intend,” “anticipate,” “plan,” “seek,” “expect,” “will,” “may” and words of similar meaning. These forward-looking statements include, but are not limited to: • statements of our goals, intentions and expectations; • statements regarding our business plans, prospects, growth and operating strategies; • statements regarding the asset quality of our loan and investment portfolios; and • estimates of our risks and future costs and benefits. These forward-looking statements are based on our current beliefs and expectations and are inherently subject to significant business, economic and competitive uncertainties and contingencies, many of which are beyond our control. In addition, these forward-looking statements are subject to assumptions with respect to future business strategies and decisions that are subject to change. We are under no duty to and unless required under the federal securities laws, we do not undertake any obligation to update any forward-looking statements after the date of this report. The following factors, among others, could cause actual results to differ materially from the anticipated results or other expectations expressed in the forward-looking statements: • general economic conditions, either nationally or in our market areas, that are worse than expected; • competition among depository and other financial institutions; • inflation and changes in the interest rate environment that reduce our margins or reduce the fair value of financial instruments; • adverse changes in the securities markets; • changes in laws or government regulations or policies affecting financial institutions, including changes in regulatory fees and capital requirements; • our ability to enter new markets successfully and capitalize on growth opportunities; • our ability to successfully integrate acquired entities, if any; • changes in consumer spending, borrowing and savings habits; • changes in accounting policies and practices, as may be adopted by the bank regulatory agencies, the Financial Accounting Standards Board, the Securities and Exchange Commission and the Public Company Accounting Oversight Board; • changes in our organization, compensation and benefit plans; • changes in our financial condition or results of operations that reduce capital available to pay dividends; and • changes in the financial condition or future prospects of issuers of securities that we own. Because of these and other uncertainties, our actual future results may be materially different from the results indicated by these forward- looking statements. |
 Company Overview M A L V E R N S T A N D A R D |
 19 Overview of Standard Financial Corp. 4 Standard Bank, a Pennsylvania chartered savings bank organized in 1913, is the wholly owned subsidiary of Standard Financial Corp. On October 6, 2010, Standard Financial Corp. completed its mutual-to- stock conversion raising $34.8 million in gross proceeds. Standard Financial Corp. trades on the NASDAQ Capital Market under the symbol STND. Standard Financial Corp. conducts its business from ten community banking offices located in the Pennsylvania counties of Allegheny, Westmoreland and Bedford and Allegany County, Maryland. As of December 31, 2011, we had $437.3 million in total assets, $290.7 million in net loans, $324.4 million in deposits and $78.4 million in stockholders’ equity. |
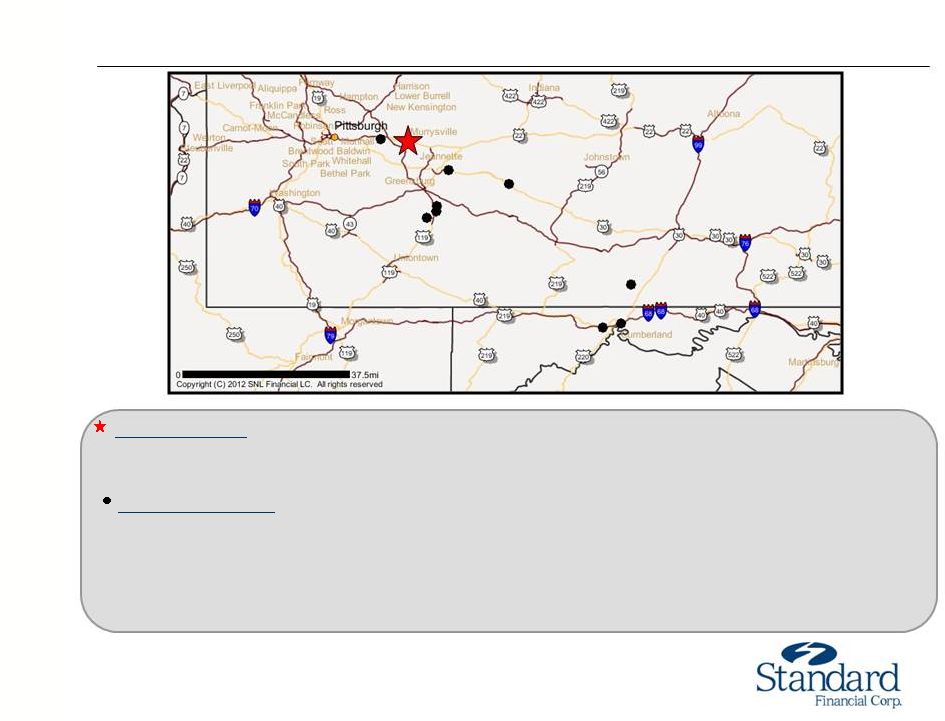 6 Community Banking Office Locations 4785 Old William Penn Hwy. Murrysville, PA Executive Offices 2640 Monroeville Blvd. Monroeville, PA 211 W. Main Street Ligonier, PA 5 Headquarters 3945 Center Street Hyndman, PA 200 N. Mechanic Street Cumberland, MD 1275 National Hwy. LaVale, MD Banking Offices 659 W. Main Street Mt. Pleasant, PA 2100 Summit Ridge Plaza Mt. Pleasant, PA 100 Pittsburgh Street Scottdale, PA 5150 Route 30 Greensburg, PA |
   12 Deposit Market Share 6 The population change from 2000-2010 for Westmoreland and Allegheny Counties was -2.04% and -4.75%, respectively, compared to 2.39% for Pennsylvania and 10.59% for the United States. Median household income for 2010 for Westmoreland and Allegheny Counties was $48,485 and $51,369, respectively, compared to $52,723 for Pennsylvania and $54,442 for the United States. Source: SNL Financial. Westmoreland, PA 2011 Rank Institution (ST) Type Number of Branches 6/30/11 Total Deposits in Market ($000) 6/30/11 Total Market Share (%) 1 PNC Financial Services Group (PA) Bank 22 1,804,063 26.59 2 First Commonwealth Financial (PA) Bank 17 957,807 14.11 3 S&T Bancorp Inc. (PA) Bank 11 766,958 11.30 4 RBS Bank 18 740,482 10.91 5 F.N.B. Corp. (PA) Bank 23 689,534 10.16 6 First Niagara Finl Group (NY) Bank 9 382,344 5.63 7 Commercial National Financial (PA) Bank 10 290,467 4.28 8 Dollar Bank FSB (PA) Savings Inst 4 216,489 3.19 9 Standard Financial Corp (PA) Thrift 6 201,718 2.97 10 Westmoreland FS&LA (PA) Savings Inst 1 132,778 1.96 Total For Institutions In Market 143 6,785,788 Allegheny, PA 2011 Rank Institution (ST) Type Number of Branches 6/30/11 Total Deposits in Market ($000) 6/30/11 Total Market Share (%) 1 PNC Financial Services Group (PA) Bank 104 34,030,720 55.31 2 Bank of New York Mellon Corp. (NY) Bank 2 8,575,399 13.94 3 RBS Bank 78 4,262,827 6.93 4 Dollar Bank FSB (PA) Savings Inst 28 2,772,554 4.51 5 First Niagara Finl Group (NY) Bank 40 2,045,876 3.33 6 F.N.B. Corp. (PA) Bank 50 1,674,370 2.72 7 TriState Capital Holdings Inc. (PA) Bank HC 2 1,560,691 2.54 8 Huntington Bancshares Inc. (OH) Bank 18 1,269,736 2.06 9 First Commonwealth Financial (PA) Bank 34 1,118,452 1.82 10 Northwest Bancshares, Inc. (PA) Thrift 17 680,589 1.11 25 Standard Financial Corp (PA) Thrift 3 43,990 0.07 Total For Institutions In Market 461 61,523,048 |
   12 Deposit Market Share 7 The population change from 2000-2010 for Bedford County, PA was -2.60% and Allegany County, MD was -0.42%, compared to 2.39% for Pennsylvania, 8.20% for Maryland and 10.59% for the United States. Median household income for 2010 for Bedford County, PA was $39,728 and Allegany County, MD was $37,162 compared to $52,723 for Pennsylvania, $66,983 for Maryland and $54,442 for the United States. Allegany, MD 2011 Rank Institution (ST) Type Number of Branches 6/30/11 Total Deposits in Market ($000) 6/30/11 Total Market Share (%) 1 Susquehanna Bancshares Inc. (PA) Bank 5 296,570 43.98 2 M&T Bank Corp. (NY) Bank 6 158,563 23.52 3 First United Corp. (MD) Bank 4 124,309 18.44 4 PNC Financial Services Group (PA) Bank 3 50,338 7.47 5 Standard Financial Corp (PA) Thrift 2 44,515 6.60 Total For Institutions In Market 20 674,295 Source: SNL Financial. Bedford, PA 2011 Rank Institution (ST) Type Number of Branches 6/30/11 Total Deposits in Market ($000) 6/30/11 Total Market Share (%) 1 Susquehanna Bancshares Inc. (PA) Bank 5 170,599 23.72 2 F.N.B. Corp. (PA) Bank 5 136,381 18.96 3 M&T Bank Corp. (NY) Bank 3 103,182 14.35 4 First Commonwealth Financial (PA) Bank 3 97,870 13.61 5 Hometown Bank of Pennsylvania (PA) Comm'l Bank 2 90,743 12.62 6 Altoona First Savings Bank (PA) Savings Bank 2 59,882 8.33 7 Standard Financial Corp (PA) Thrift 1 24,618 3.42 8 Orbisonia Community Bncp Inc. (PA) Bank HC 1 21,820 3.03 9 CBT Financial Corp. (PA) Bank 1 14,033 1.95 10 Somerset Trust Holding Company (PA) Bank 1 0 0.00 Total For Institutions In Market 24 719,128 |
 19 Fiscal 2011 Review 8 Through the stock offering we established the Standard Charitable Foundation by making a one time contribution of $1.4 million. Donations from the foundation will benefit the Bank’s communities for many years. We expect annual contributions to approximate $90,000. Net Income for fiscal 2011 was $2.4 million, or $3.3 million after adjusting for the one time after tax impact of $0.9 million to fund the charitable foundation, which was a 14% increase from fiscal 2010 of $2.9 million. Solid Capital Base with Tangible Equity to Tangible Assets of 16.29% as of 9/30/11. Asset quality continues to remain strong compared to peer groups and industry averages. Despite difficult economic conditions and weak loan demand, we were able to achieve both deposit and loan growth in fiscal 2011. Reduction in borrowings of $9.8 million, or 23.8%, from $41.2 million at fiscal year- end 2010 to $31.4 million at fiscal year-end 2011. On April 6, 2011, a new community banking office was opened in Greensburg, PA. As of 9/30/11 deposits had grown to approximately $2.0 million in a market which includes 29 offices of competing banks. |
 19 2012 Business Strategy 9 Our primary objective is to operate as a profitable, community-oriented financial institution serving customers in our market areas. We have sought to accomplish this objective by adopting a business strategy that is designed to maintain strong capital and high asset quality. Our business strategy includes the following elements: Increasing commercial real estate lending, focusing on small and medium sized businesses, while maintaining our conservative loan underwriting standards. Emphasizing deposit relationships by attracting new customers and enhancing existing customer relationships. Pursuing future expansion and acquisition opportunities with the capital raised in the conversion, although we have no current arrangements or agreements with respect to any such acquisitions. |
 M A L V E R N Financial Highlights S T A N D A R D |
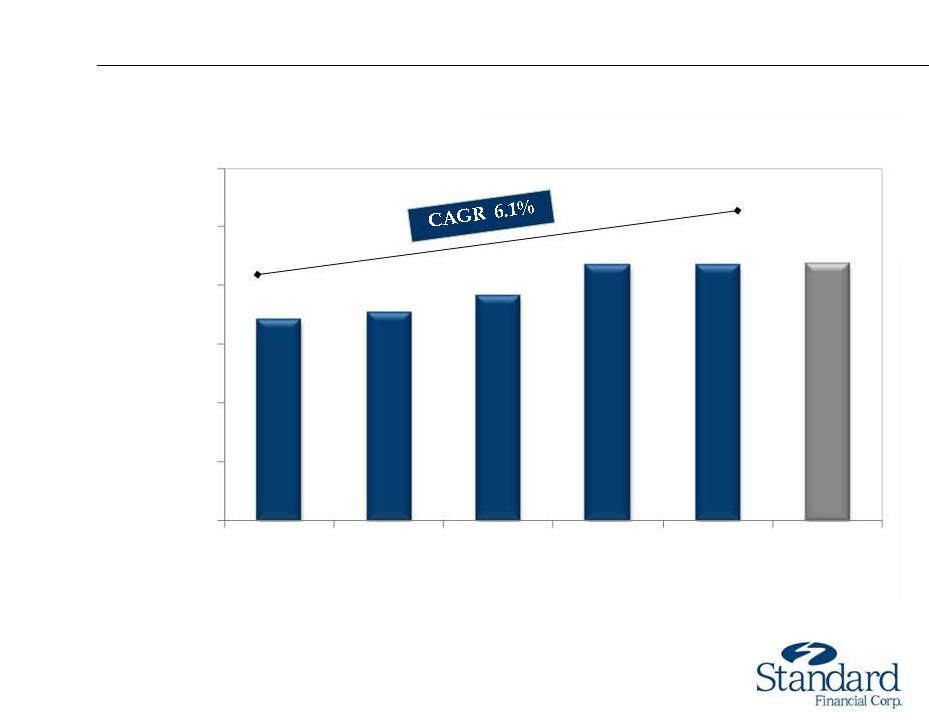 9 Stable Asset Growth 11 Dollars in millions CAGR = Compound Annual Growth Rate. $342.9 $354.0 $382.4 $435.1 $434.6 $437.3 $0.0 $100.0 $200.0 $300.0 $400.0 $500.0 $600.0 9/30/07 9/30/08 9/30/09 9/30/10 09/30/11 12/31/11 |
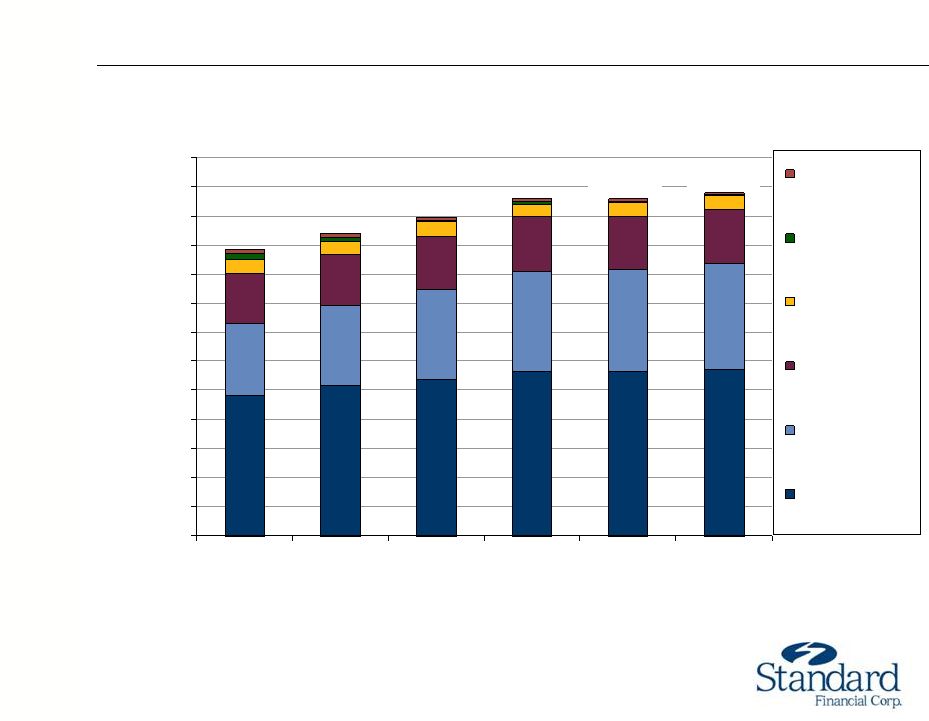 12 Total Loan Portfolio Growth 12 Dollars in millions 48% 50% 49% 49% 49% 49% 25% 26% 28% 30% 30% 31% 17% 17% 17% 16% 16% 16% 5% 5% 5% 3% 4% 4% $0.0 $25.0 $50.0 $75.0 $100.0 $125.0 $150.0 $175.0 $200.0 $225.0 $250.0 $275.0 $300.0 $325.0 9/30/07 9/30/08 9/30/09 9/30/10 09/30/11 12/31/11 Other Construction Commercial Home Equity Commercial RE 1-4 Family Residential $289.6 $246.1 $260.0 $290.1 $273.8 $295.0 |
 12 Credit Quality Trends 13 Peer consists of public banks and thrifts located in the Mid-Atlantic region with Assets between $300M and $600M . Excludes MHCs and Merger Targets. Non-Performing Loans / Total Loans STND at 12/31/11: 1.30% At 2007 2008 2009 2010 2011 12/31/11 NPAs / Total Assets (%) 0.26 0.51 0.61 1.10 1.24 1.17 NCOs / Average Loans (%) 0.02 0.10 0.17 0.10 0.37 0.68 Allowance / NPLs (%) 294.43 150.12 233.01 101.71 97.73 88.95 Allowance / Total Loans (%) 0.97 0.93 1.12 1.38 1.56 1.47 At September 30, 0.63% 0.49% 1.37% 1.62% 0.44% 0.67% 1.62% 1.71% 1.78% 0.00% 0.50% 1.00% 1.50% 2.00% 2.50% 09/30/07 09/30/08 09/30/09 09/30/10 09/30/11 STND Peer Median 0.33% |
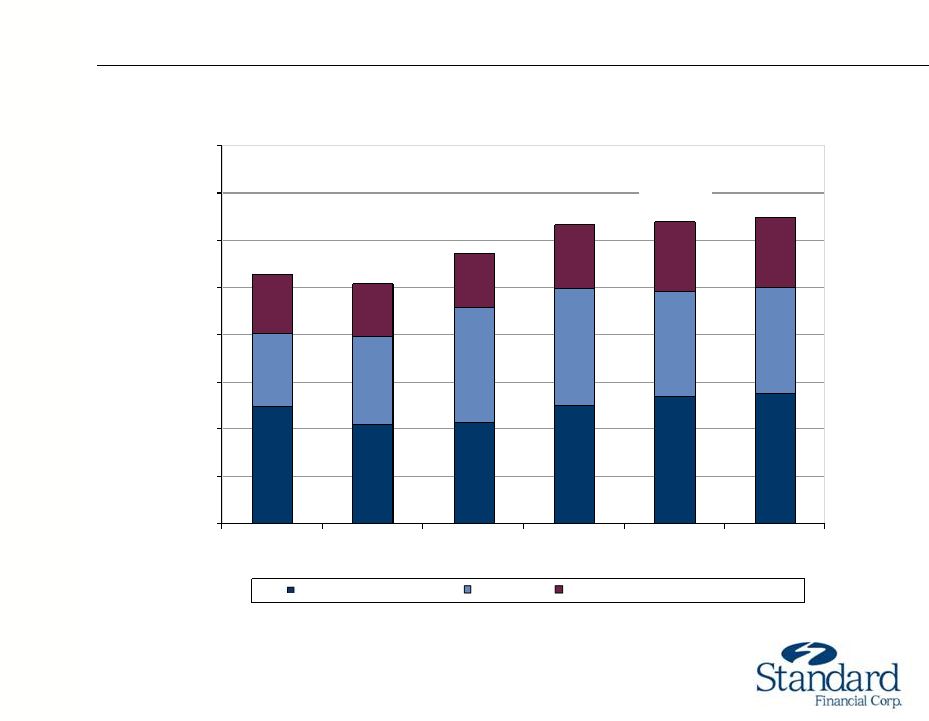 15 Deposit Growth 14 Dollars in millions 47% 41% 38% 40% 42% 43% 29% 36% 42% 39% 35% 35% 24% 22% 20% 21% 23% 23% $0.0 $50.0 $100.0 $150.0 $200.0 $250.0 $300.0 $350.0 $400.0 9/30/07 9/30/08 9/30/09 9/30/10 09/30/11 12/31/11 Certificates of Deposit Savings Demand, NOW and Money Market $320.3 $264.0 $254.6 $316.2 $286.9 $324.4 |
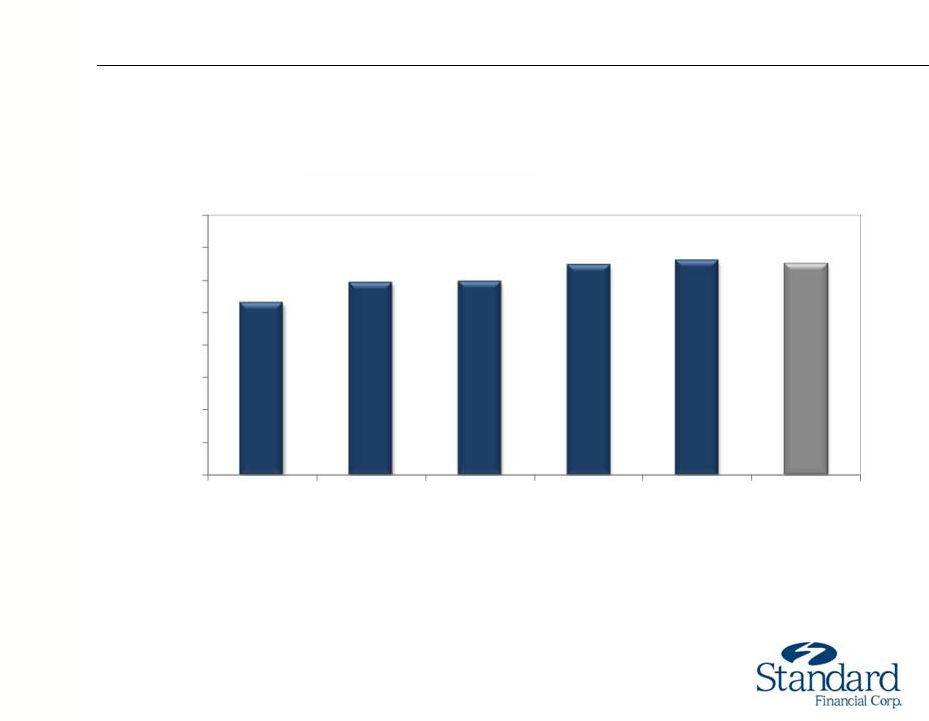 15 Net Interest Margin 15 In this difficult interest rate environment, we have been able to maintain our net interest margin. 2.66% 2.98% 2.99% 3.25% 3.31% 3.26% 0.0% 0.5% 1.0% 1.5% 2.0% 2.5% 3.0% 3.5% 4.0% FY 09/30/07 FY 09/30/08 FY 09/30/09 FY 09/30/10 FY 09/30/11 QTR 12/31/11 |
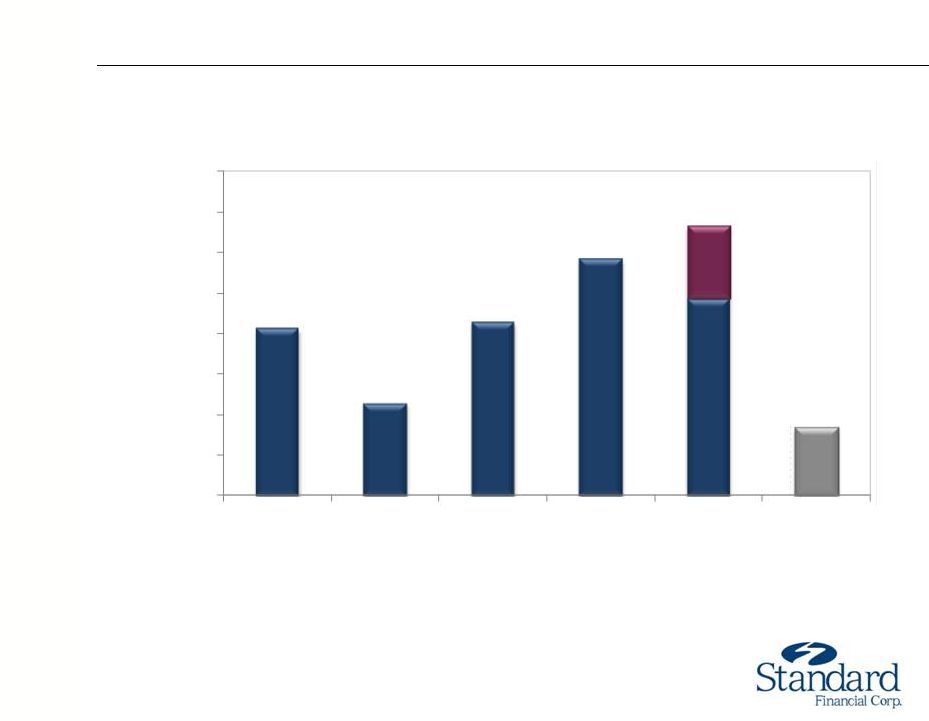 15 Net Income 16 Dollars in thousands *Without net impact of one time contribution of $908,000 to Standard Charitable Foundation. $2,424 $2,060 $1,140 $2,144 $2,915 $831 $3,332* $0 $500 $1,000 $1,500 $2,000 $2,500 $3,000 $3,500 $4,000 FY 09/30/07 FY 09/30/08 FY 09/30/09 FY 09/30/10 FY 09/30/11 QTR 12/31/11 |
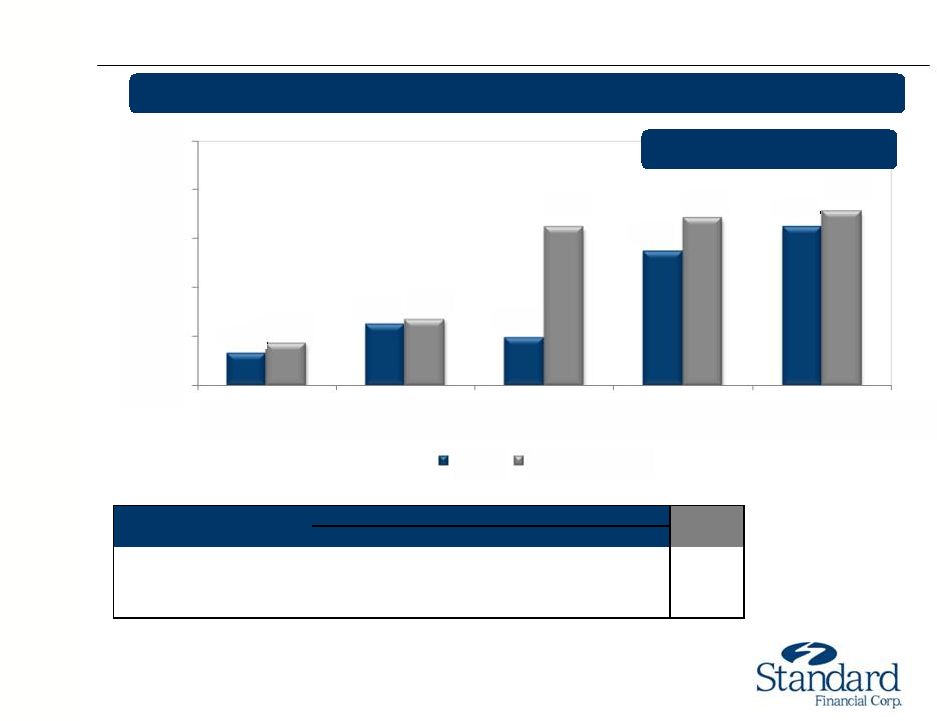
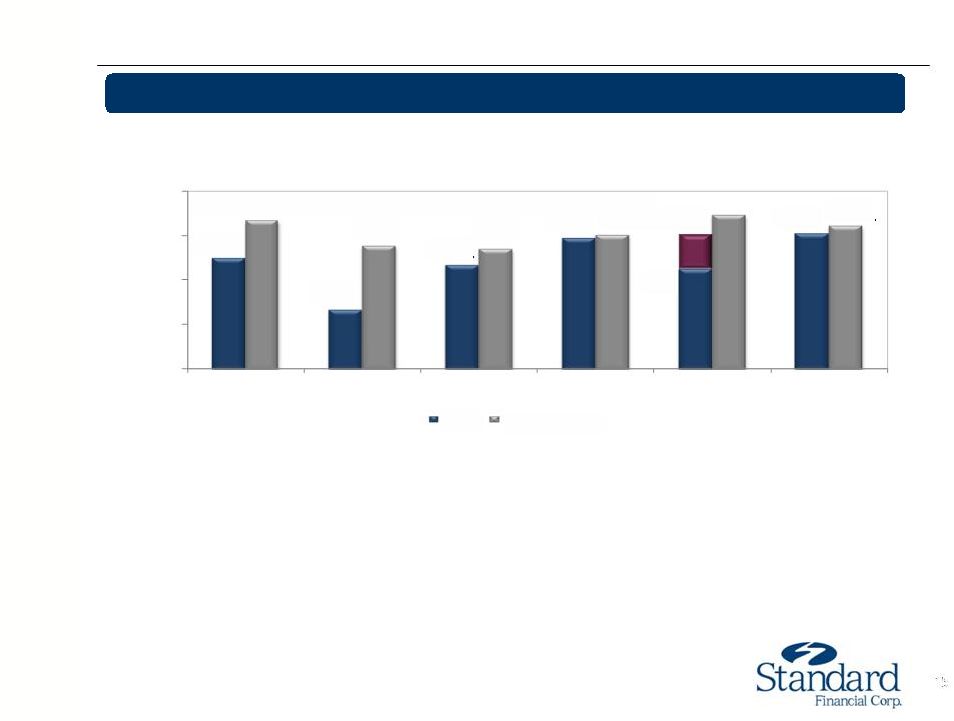 15 Performance Measures 17 Return on Average Assets *Without net impact of one-time contribution to Standard Charitable Foundation. Peer consists of public banks and thrifts located in the Mid-Atlantic region with Assets between $300M and $600M. Excludes MHCs and Merger Targets. 0.56% 0.62% 0.33% 0.58% 0.73% 0.76%* 0.76% 0.83% 0.69% 0.67% 0.75% 0.86% 0.80% 0.0% 0.3% 0.5% 0.8% 1.0% FY 09/30/07 FY 09/30/08 FY 09/30/09 FY 09/30/10 FY 09/30/11 QTR 12/31/11 STND Peer Median |
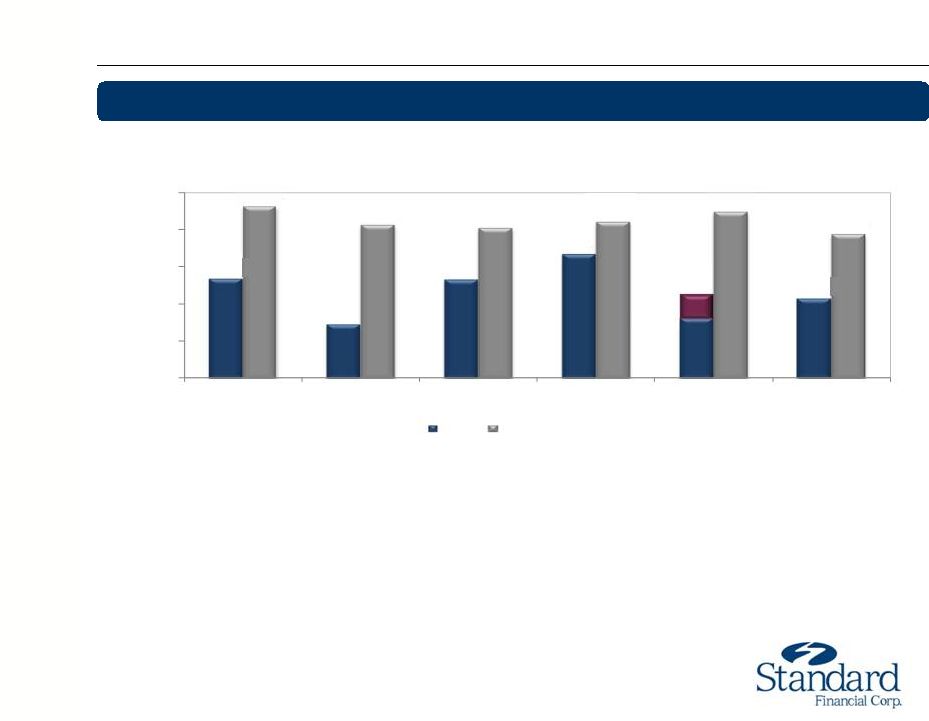 15 Performance Measures 18 Return on Average Equity *Without net impact of one-time contribution to Standard Charitable Foundation. Peer consists of public banks and thrifts located in the Mid-Atlantic region with Assets between $300M and $600M. Excludes MHCs and Merger Targets. 3.18% 5.33% 2.86% 5.27% 6.64% 4.38%* 4.25% 9.23% 8.20% 8.04% 8.39% 8.92% 7.70% 0.0% 2.0% 4.0% 6.0% 8.0% 10.0% FY 09/30/07 FY 09/30/08 FY 09/30/09 FY 09/30/10 FY 09/30/11 QTR 12/31/11 STND Peer Median |
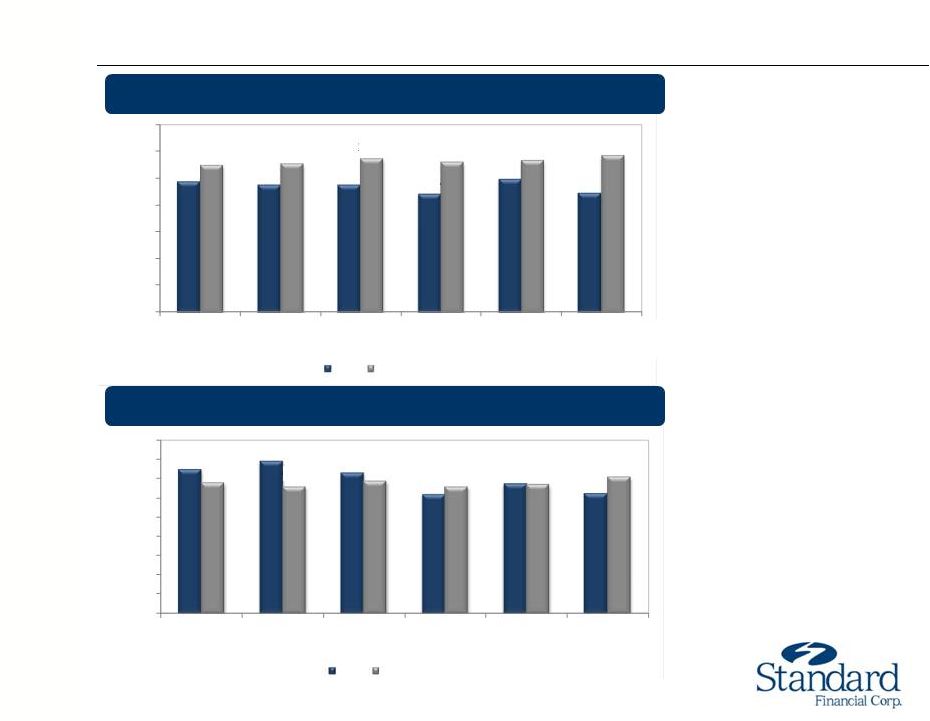 15 Performance Measures – cont. 19 Efficiency Ratio Non Interest Expense / Average Assets Peer consists of public banks and thrifts located in the Mid-Atlantic region with Assets between $300M and $600M. Excludes MHCs and Merger Targets. 2.43% 2.37% 2.36% 2.20% 2.48% 2.21% 2.74% 2.76% 2.86% 2.79% 2.82% 2.91% 0.00% 0.50% 1.00% 1.50% 2.00% 2.50% 3.00% 3.50% FY 09/30/07 FY 09/30/08 FY 09/30/09 FY 09/30/10 FY 09/30/11 QTR 12/31/11 STND Peer Median 75% 79% 73% 62% 68% 62% 68% 66% 69% 66% 67% 71% 0.0% 10.0% 20.0% 30.0% 40.0% 50.0% 60.0% 70.0% 80.0% 90.0% FY 09/30/07 FY 09/30/08 FY 09/30/09 FY 09/30/10 FY 09/30/11 QTR 12/31/11 STND Peer Median |
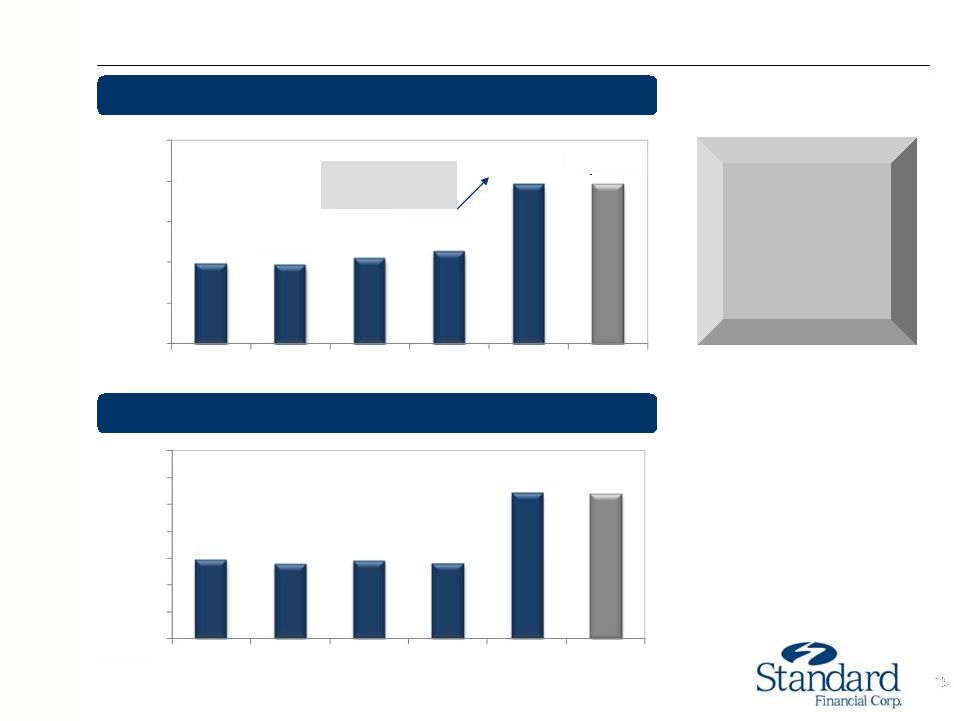 15 Stockholders’ Equity 20 Stock Offering 10/6/10 Strong Capital Position Total Equity ($000) Tangible Equity / Tangible Assets Dollars in millions $39.4 $38.7 $42.2 $45.3 $78.7 $78.4 $0.0 $20.0 $40.0 $60.0 $80.0 $100.0 09/30/07 09/30/08 09/30/09 09/30/10 09/30/11 12/31/11 8.8% 8.4% 8.7% 8.4% 16.3% 16.1% 0.0% 3.0% 6.0% 9.0% 12.0% 15.0% 18.0% 21.0% 09/30/07 09/30/08 09/30/09 09/30/10 09/30/11 12/31/11 |
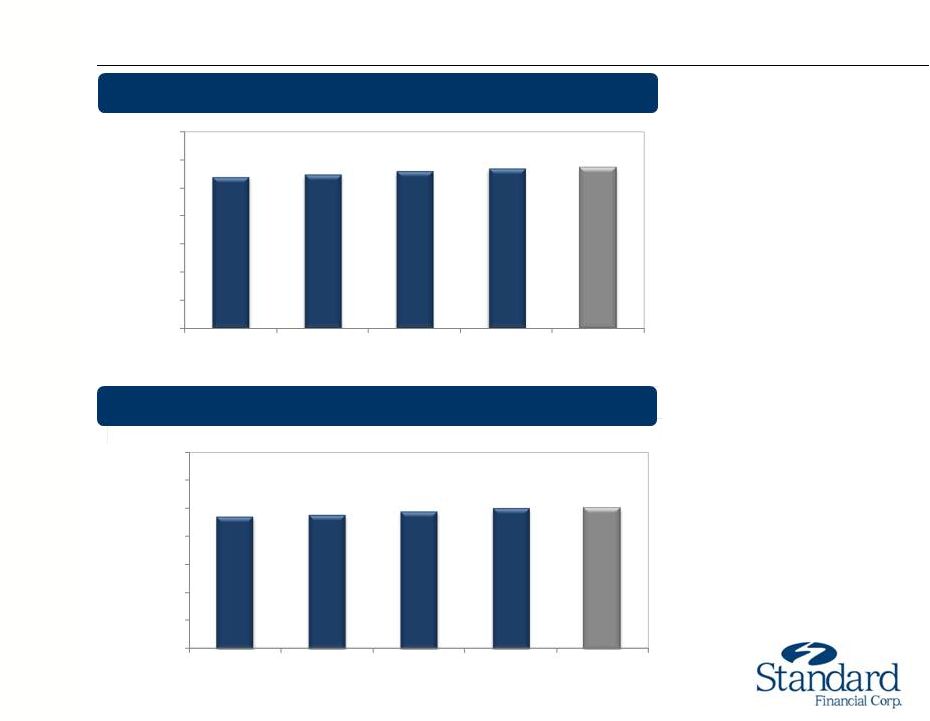 15 Building Shareholder Value 21 • Announced our first quarterly dividend on 10/20/11 of $0.045 per share. • Announced stock repurchase program of 10% in October 2011. As of 12/31/11, 55,000 shares had been repurchased. • Since our IPO (10/6/10) we have increased our book value by 6.7% and our tangible book value by 7.6%. Book Value Tangible Book Value $21.46 $21.74 $22.25 $22.63 $22.89 $0.00 $4.00 $8.00 $12.00 $16.00 $20.00 $24.00 $28.00 12/31/10 03/31/11 06/30/11 09/30/11 12/31/11 $18.71 $18.99 $19.52 $19.91 $20.14 $0.00 $4.00 $8.00 $12.00 $16.00 $20.00 $24.00 $28.00 12/31/10 03/31/11 06/30/11 09/30/11 12/31/11 |
 M A L V E R N Market Statistics S T A N D A R D |
 21 Dividend History 23 Data as of February 1, 2012 Source: SNL Financial Current Div Yield 1.2% Description: Common stock, $0.01 par value Announce Date Ex-Dividend Date Pay Date Amount Frequency 1/19/2012 1/31/2012 2/15/2012 $0.0450 Quarterly 10/20/2011 10/31/2011 11/15/2011 $0.0450 Quarterly Common Equity Dividends |
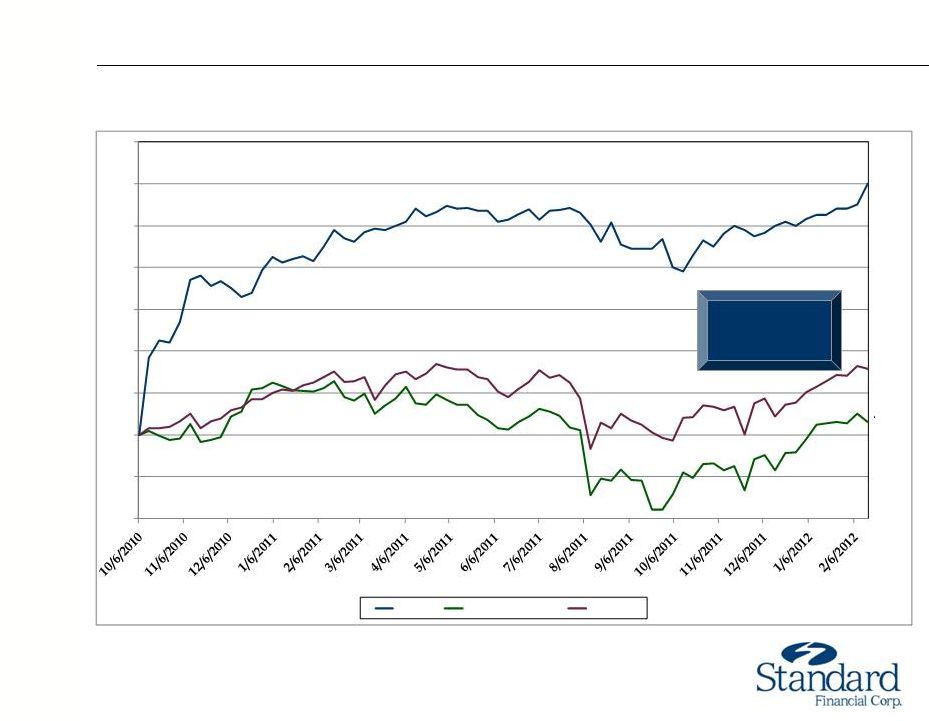 21 STND Stock Price Performance 24 Since IPO – October 6, 2010 at $10.00 Per Share Data as of February 15, 2012 Source: SNL Financial 3.1% 15.8% 60.0% 0.80 0.90 1.00 1.10 1.20 1.30 1.40 1.50 1.60 1.70 STND NASDAQ Bank S&P 500 STND Price on 2/15/12 – $16.00 |
 19 Fiscal 2012 Outlook 25 Emphasize relationship banking with our customers Remain focused on asset quality Prudent loan growth Continue to manage the interest rate margin Manage capital through dividends & repurchases Continue to add value for Standard Shareholders |
 M A L V E R N Questions? |