UNITED STATES
SECURITIES AND EXCHANGE COMMISSION
Washington, DC 20549
FORM N-CSR
CERTIFIED SHAREHOLDER REPORT OF REGISTERED
MANAGEMENT INVESTMENT COMPANY
Investment Company Act file number 811-22465
The Endowment Institutional TEI Fund W, L.P.
(Exact name of registrant as specified in charter)
|
| 4265 SAN FELIPE, 8TH FLOOR, HOUSTON, TX 77027 |
| (Address of principal executive offices) (Zip code) |
With a copy to:
| | |
| John A. Blaisdell | | George J. Zornada |
| The Endowment Institutional TEI Fund W, L.P. | | K & L Gates LLP |
| 4265 San Felipe, 8th Floor | | State Street Financial Center |
| Houston, TX 77027 | | One Lincoln St. |
| (Name and address of agent for service) | | Boston, MA 02111-2950 |
| | (617) 261-3231 |
| | |
Registrant’s telephone number, including area code: 800-725-9456
Date of fiscal year end: 12/31/13
Date of reporting period: 12/31/13
Item 1. Reports to Stockholders.
The Endowment Institutional TEI Fund W, L.P.
THE ENDOWMENT FUND®
Shareholder’s Report
December 31, 2013
TABLE OF CONTENTS

Dear TEF Partners:
It has been an eventful year for The Endowment Fund (the “Fund”)1 and for the core alternative strategies it accesses on behalf of investors. We hope to achieve a few objectives with this letter. First, we will provide an update on the performance of the Fund. Second, we will provide an update on our views of the environment for the Fund and its strategies in 2014 and beyond.
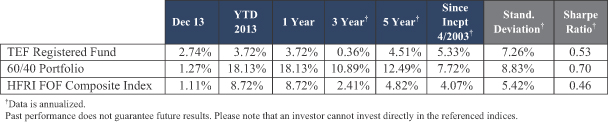
Recall that the goal of The Endowment Fund is to generate a high-quality return stream that targets approximately half the historical volatility of equities (8% target standard deviation) with very low correlation to traditional stocks and bonds. While we believe the reduced volatility and focus on diversification from traditional assets remain critical, both features were undeniably important headwinds in an equity-dominated 2013.
Investment Performance in 2013
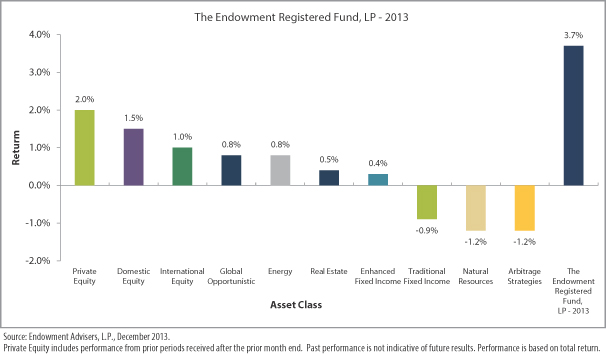
The Endowment Registered Fund returned 3.7% in calendar 2013, including 4.1% in a comparatively strong fourth quarter. While performance was modestly positive, performance in different areas of the Fund varied significantly, consistent with the behavior of markets more broadly.^
Domestic Equity and Private Equity exposures led returns for 2013, contributing 1.5% and 2.1% to the Fund’s performance respectively. (As a reminder, performance contribution is calculated by multiplying the return of the asset class by its allocation within the portfolio.) This contribution to performance comes despite the relatively limited exposure to public equities over this time period, consistent with the approach to provide exposure to investments that diversify, rather than augment, exposures to global equity markets. This is largely the result of tremendous returns for equity market indices, especially the S&P 500, which led major large cap markets with a 32.4% return for 2013.^
Other core market exposures were less successful in 2013, including Traditional Fixed Income and Natural Resources. As mentioned in previous letters, fixed income weakened particularly in May and June of 2013 as a result of initial indications of a pullback in quantitative easing by the Federal Reserve, although those moves did not ultimately transpire until very late in the year. Given the Fund’s emphasis on diversifying away from equities in particular, this position in Traditional Fixed Income was a notable headwind. In addition, however, despite the
1 The Endowment Fund has a variety of feeders, which all feed into a single “master” fund called The Endowment Master Fund, L.P. Each “feeder” fund has different expense ratios, which provide for slightly different returns from one “feeder” fund to the next. Accordingly, unless otherwise specified, the returns outlined herein are those of The Endowment Registered Fund, L.P., which is the largest “feeder” fund in The Endowment Fund complex. Your returns may vary, based on the feeder in which you invest and the timing of your investment. Please consult your capital account statement for the exact returns of your investment.
^ Portfolio composition is subject to change.
1
strong environment for many growth assets, Natural Resources, in particular driven by weakness in commodities prices, was a meaningful negative contributor, reducing Fund returns by 1.0% for the year.^
Hedge fund strategies in the Global Opportunistic category were modest positive contributors, at 0.8%, with strong contributions from more macro- and trading-oriented strategies. In contrast, Arbitrage Strategies, which typically seek market neutral exposure focused on cross-security or cross-capital structure trades, performed poorly, reducing returns by 1.2%. A substantial portion of weakness in Arbitrage Strategies can be attributed to challenges faced by traditional hedging strategies employed by these managers; given their predisposition to hedge market exposure to remain market neutral, many utilize short positions in the S&P 500, one of the most liquid markets, to offset the market exposure from their long positions. Given the dominance of this U.S. Equity index over the year, these hedges were often a meaningful detractor from performance for hedge funds in the Arbitrage Strategies category.^
Economic Overview
More than ever following a year where investing domestically was so profitable for U.S.-based investors, we believe that “global” remains the operative word for 2014. The forces that drive investment returns, namely the behaviors and risk preferences of investors, are human forces, whether one is discussing sovereign debt in emerging Eastern Europe or small cap stocks here in the U.S.
Understanding the narratives which guide investor behaviors is important, but we believe that starting from a foundation of true diversification among the drivers of investment returns remains key. Thus, we believe that shrewd investing starts from a place of humility, introducing views only where we believe we know something of value that should change our positioning. Here is what we know:
| | • | | U.S. Equity Dominance: The U.S. led developed markets in 2013 with a 32.4% return while emerging markets lagged considerably, posting a -2.6% return for the year. |
| | • | | Low Rates Anchored: Low growth rates, low inflation rates and persistent unemployment have kept short term interest rates in core markets anchored at or near zero. |
2
^ Portfolio composition is subject to change.
| | • | | Rising Rates Already Discounted: In the U.S., markets have already priced in a significant expectation of rising rates into forward curves. |
Based on what we know, here is what we think:
| | • | | Emerging over Developed: We favor emerging equity versus developed equity markets as they approach a 40% discount to developed markets based on P/E multiples. Growing consensus against emerging markets serves only to increase our conviction. |
| | • | | U.S. Valuations Not Extreme: Despite the recent outperformance of U.S. equity markets, they do not appear expensive versus other developed equity markets based upon either price to earnings or enterprise value to trailing 12-month EBITDA. |
| | • | | Rally is Old but Supported: Positive sentiment provides a contrarian indicator as we approach the five-year mark of the current bull market; however, it seems unlikely that policy makers would stand idle should the threats of the financial crisis resurface. This may, in our view, place limits on the severity of any market correction this year. |
| | • | | Still Opportunities in Sovereign Debt: The sovereign debt of Latin American issuers and other resourced-based economies like Australia and New Zealand looks attractive as investors are compensated for higher inflation with higher real yields. Furthermore, the secular growth outlooks and structural underpinnings bolster the credit quality of these countries. |
| | • | | Corporate Debt Concerns: We think any meaningful rise in interest rates may be contemporaneous with a counter-cyclical widening of spreads. The low absolute yield levels of corporate debt issues are justifiable based on the low interest rate environment and historically low default rates; however, we believe the combination of spread compression and low interest rates renders them more vulnerable to rising rates than duration measures suggest. |
| | • | | Closer to Home: Energy infrastructure remains a favorite theme as domestic oil production has increased by 30% since 2008 and the breakdown between Brent and West Texas Intermediate crude prices reveals logistical impediments in the current architecture of the global energy supply chain. |
We believe that The Endowment Fund is particularly well-positioned to benefit from three main characteristics going forward. First, we believe that emphasizing results that are driven by skill, diversification and premia like illiquidity are important to generating full cycle results that are not as sensitive to capital market returns, for which we have more limited potential return expectations on a going-forward basis. Second, we believe that maintaining investment in a mature private investments portfolio, which The Endowment Fund allows, may avoid many of the risks and pitfalls of new investments in multi-asset private portfolios. Finally, we believe that providing access to exclusive top-tier hedge funds, unique early stage hedge funds and co-investment opportunities allows the delivery of focused, diversifying exposures to core alternatives that are not as dependent on the rising and falling waves of the market.
We thank you for your continued support. If you have any questions, please do not hesitate to call our service desk at 1-800-725-9456.
Kindest Regards,
Endowment Advisers, L.P.2
2 This letter is provided solely for informational purposes and is exclusively intended for use by existing Fund investors and/or pre-qualified prospective Fund investors with whom the Fund or an authorized intermediary acting on behalf of the Fund has a pre-existing substantive relationship. No other distribution or use of this newsletter has been authorized. Neither this letter nor the information contained therein constitutes an offer to sell or a solicitation of any offer to buy any securities. Any offering or solicitation will be made only to eligible investors and pursuant to the current version of the applicable Private Placement Memorandum and other governing documents, all of which must be read in their entirety.
3
Report of Independent Registered Public Accounting Firm
The Partners and Board of Directors
The Endowment Institutional TEI Fund W, L.P.:
We have audited the accompanying statement of assets, liabilities and partners’ capital of The Endowment Institutional TEI Fund W, L.P. (the “Institutional TEI Fund W”) as of December 31, 2013, and the related statements of operations and cash flows for the year then ended, the statements of changes in partners’ capital for each of the years in the two-year period then ended, and the financial highlights for each of the years in the three-year period then ended. These financial statements and financial highlights are the responsibility of the Institutional TEI Fund W’s management. Our responsibility is to express an opinion on these financial statements and financial highlights based on our audits.
We conducted our audits in accordance with the standards of the Public Company Accounting Oversight Board (United States). Those standards require that we plan and perform the audits to obtain reasonable assurance about whether the financial statements and financial highlights are free of material misstatement. An audit includes examining, on a test basis, evidence supporting the amounts and disclosures in the financial statements. An audit also includes assessing the accounting principles used and significant estimates made by management, as well as evaluating the overall financial statement presentation. We believe that our audits provide a reasonable basis for our opinion.
In our opinion, the financial statements and financial highlights referred to above present fairly, in all material respects, the financial position of The Endowment Institutional TEI Fund W, L.P. as of December 31, 2013, the results of its operations and its cash flows for the year then ended, the changes in its partners’ capital for each of the years in the two-year period then ended, and the financial highlights for each of the years in the three-year period then ended in conformity with U.S. generally accepted accounting principles.
/s/ KPMG LLP
Columbus, Ohio
March 1, 2014
4
THE ENDOWMENT INSTITUTIONAL TEI FUND W, L.P.
(A Limited Partnership)
Statement of Assets, Liabilities and Partners’ Capital
December 31, 2013
| | | | |
Assets | | | | |
Investment in the Offshore Institutional W Fund, at fair value | | $ | 15,454,563 | |
Receivable from the Offshore Institutional W Fund | | | 4,872,640 | |
Prepaids and other assets | | | 4,249 | |
| | | | |
Total assets | | | 20,331,452 | |
| | | | |
Liabilities and Partners’ Capital | | | | |
Withdrawals payable | | | 4,872,640 | |
Payable to Adviser | | | 25,355 | |
Accounts payable and accrued expenses | | | 25,887 | |
| | | | |
Total liabilities | | | 4,923,882 | |
| | | | |
Partners’ capital | | | 15,407,570 | |
| | | | |
Total liabilities and partners’ capital | | $ | 20,331,452 | |
| | | | |
See accompanying notes to financial statements.
5
THE ENDOWMENT INSTITUTIONAL TEI FUND W, L.P.
(A Limited Partnership)
Statement of Operations
Year Ended December 31, 2013
| | | | |
Net investment loss allocated from the Offshore Institutional W Fund: | | | | |
Dividend income | | $ | 80,206 | |
Interest income | | | 12,462 | |
Dividend income from affiliated investments | | | 36,936 | |
Interest income from affiliated investments | | | 1,538 | |
Expenses | | | (346,017 | ) |
| | | | |
Net investment loss allocated from the Offshore Institutional W Fund | | | (214,875 | ) |
| | | | |
Expenses of the Institutional TEI W Fund: | | | | |
Printing fees | | | 15,329 | |
Professional fees | | | 30,689 | |
Regulatory filing fees | | | 19,648 | |
| | | | |
Total expenses of the Institutional TEI W Fund | | | 65,666 | |
| | | | |
Net investment loss of the Institutional TEI W Fund | | | (280,541 | ) |
| | | | |
Net realized and unrealized gain (loss) from investments allocated from the Offshore Institutional W Fund: | | | | |
Net realized gain from investments | | | 897,918 | |
Change in unrealized appreciation/depreciation from investments | | | 166,166 | |
| | | | |
Net realized and unrealized gain from investments allocated from the Offshore Institutional W Fund | | | 1,064,084 | |
| | | | |
Net increase in partners’ capital resulting from operations | | $ | 783,543 | |
| | | | |
See accompanying notes to financial statements.
6
THE ENDOWMENT INSTITUTIONAL TEI FUND W, L.P.
(A Limited Partnership)
Statements of Changes in Partners’ Capital
Years Ended December 31, 2012 and December 31, 2013
| | | | |
Partners’ capital at December 31, 2011 | | $ | 26,364,056 | |
Contributions | | | 5,530,816 | |
Withdrawals | | | (9,767,287 | ) |
Early repurchase fees | | | 30,000 | |
Net increase in partners’ capital resulting from operations: | | | | |
Net investment loss | | | (415,982 | ) |
Net realized gain from investments | | | 2,032,664 | |
Change in unrealized appreciation/depreciation from investments | | | (1,163,684 | ) |
| | | | |
Net increase in partners’ capital resulting from operations | | | 452,998 | |
| | | | |
Partners’ capital at December 31, 2012 | | | 22,610,583 | |
| | | | |
Contributions | | | 239,501 | |
Withdrawals | | | (8,226,057 | ) |
Net increase in partners’ capital resulting from operations: | | | | |
Net investment loss | | | (280,541 | ) |
Net realized gain from investments | | | 897,918 | |
Change in unrealized appreciation/depreciation from investments | | | 166,166 | |
| | | | |
Net increase in partners’ capital resulting from operations | | | 783,543 | |
| | | | |
Partners’ capital at December 31, 2013 | | $ | 15,407,570 | |
| | | | |
See accompanying notes to financial statements.
7
THE ENDOWMENT INSTITUTIONAL TEI FUND W, L.P.
(A Limited Partnership)
Statement of Cash Flows
Year Ended December 31, 2013
| | | | |
Cash flows from operating activities: | | | | |
Net increase in partners’ capital resulting from operations | | $ | 783,543 | |
Adjustments to reconcile net increase in partners’ capital resulting from operations to net cash provided by operating activities: | | | | |
Net realized and unrealized gain from investments allocated from the Offshore Institutional W Fund | | | (1,064,084 | ) |
Net investment loss allocated from the Offshore Institutional W Fund | | | 214,875 | |
Contributions to the Offshore Institutional W Fund | | | (239,501 | ) |
Redemptions from the Offshore Institutional W Fund | | | 8,287,866 | |
Change in operating assets and liabilities: | | | | |
Receivable from the Offshore Institutional W Fund | | | (3,642,750 | ) |
Prepaids and other assets | | | (4,249 | ) |
Accounts payable and accrued expenses | | | 8,106 | |
| | | | |
Net cash provided by operating activities | | | 4,343,806 | |
| | | | |
Cash flows from financing activities: | | | | |
Contributions | | | 239,501 | |
Withdrawals | | | (4,583,307 | ) |
| | | | |
Net cash used in financing activities | | | (4,343,806 | ) |
| | | | |
Net change in cash and cash equivalents | | | — | |
Cash and cash equivalents at beginning of year | | | — | |
| | | | |
Cash and cash equivalents at end of year | | $ | — | |
| | | | |
See accompanying notes to financial statements.
8
THE ENDOWMENT INSTITUTIONAL TEI FUND W, L.P.
(A Limited Partnership)
Notes to Financial Statements
December 31, 2013
(1) ORGANIZATION
The Endowment Institutional TEI Fund W, L.P. (the “Institutional TEI W Fund”), a Delaware limited partnership registered under the Investment Company Act of 1940, as amended (the “1940 Act”), commenced operations on January 1, 2011, as a non-diversified, closed-end management investment company. The Institutional TEI W Fund was created to serve as a feeder fund for The Endowment Institutional TEI Fund W, Ltd. (the “Offshore Institutional W Fund”), which in turn is a feeder fund for The Endowment Master Fund, L.P. (the “Master Fund”). For convenience, reference to the Institutional TEI W Fund may include the Offshore Institutional W Fund and Master Fund, as the context requires.
The Institutional TEI W Fund’s investment objective is to preserve capital and to generate consistent long-term appreciation and returns across a market cycle (which is estimated to be five to seven years). The Institutional TEI W Fund pursues its investment objective by investing substantially all of its assets in the Offshore Institutional W Fund, which in turn invests substantially all of its assets in the Master Fund, which has the same investment objectives as the Offshore Institutional W Fund and the Institutional TEI W Fund. The Master Fund invests its assets in a variety of investment vehicles including but not limited to limited partnerships, limited liability companies, offshore corporations and other foreign investment vehicles (collectively, the “Investment Funds”), registered investment companies (including exchange-traded funds) and direct investments in marketable securities and derivative instruments. The Master Fund’s financial statements, Schedule of Investments and notes to financial statements, included elsewhere in this report, should be read in conjunction with this report. The Offshore Institutional W Fund serves solely as an intermediary for the Institutional TEI W Fund’s investment in the Master Fund. The percentage of the Master Fund’s partnership interests indirectly owned by the Institutional TEI W Fund on December 31, 2013, was 0.75%.
The Endowment Fund GP, L.P., a Delaware limited partnership, serves as the general partner of the Institutional TEI W Fund (the “General Partner”). To the fullest extent permitted by applicable law, the General Partner has irrevocably delegated to a board of directors (the “Board” and each member a “Director”) its rights and powers to monitor and oversee the business affairs of the Institutional TEI W Fund, including the complete and exclusive authority to oversee and establish policies regarding the management, conduct, and operation of the Institutional TEI W Fund’s business. A majority of the members of the Board are independent of the General Partner and its management. To the extent permitted by applicable law, the Board may delegate any of its rights, powers and authority to, among others, the officers of the Institutional TEI W Fund, the Adviser, or any committee of the Board.
The Board is authorized to engage an investment adviser and it has selected Endowment Advisers, L.P. (the “Adviser”), to manage the Institutional TEI W Fund’s portfolio and operations, pursuant to an investment management agreement (the “Investment Management Agreement”). The Adviser is a Delaware limited partnership that is registered as an investment adviser under the Investment Advisers Act of 1940, as amended. Under the Investment Management Agreement, the Adviser is responsible for the establishment of an investment committee, which is responsible for developing, implementing, and supervising the Institutional TEI W Fund’s investment program subject to the ultimate supervision of the Board. In addition to investment advisory services, the Adviser also functions as the servicing agent of the Institutional TEI W Fund (the “Servicing Agent”) and as such provides or procures investor services and administrative assistance for the Institutional TEI W Fund. The Adviser can delegate all or a portion of its duties as Servicing Agent to other parties, who would in turn act as sub-servicing agents.
Under the Institutional TEI W Fund’s organizational documents, the Institutional TEI W Fund’s officers and Directors are indemnified against certain liabilities arising out of the performance of their duties to the
9
THE ENDOWMENT INSTITUTIONAL TEI FUND W, L.P.
(A Limited Partnership)
Notes to Financial Statements, continued
December 31, 2013
Institutional TEI W Fund. In the normal course of business, the Institutional TEI W Fund enters into contracts with service providers, which also provide for indemnifications by the Institutional TEI W Fund. The Institutional TEI W Fund’s maximum exposure under these arrangements is unknown, as this would involve any future potential claims that may be made against the Institutional TEI W Fund. However, based on experience, the General Partner expects that risk of loss to be remote.
(2) SUMMARY OF SIGNIFICANT ACCOUNTING POLICIES AND PRACTICES
(a) BASIS OF ACCOUNTING
The accounting and reporting policies of the Institutional TEI W Fund conform with U.S. generally accepted accounting principles (“U.S. GAAP”). The accompanying financial statements reflect the financial position of the Institutional TEI W Fund and the results of its operations.
(b) CASH EQUIVALENTS
The Institutional TEI W Fund considers all unpledged temporary cash investments with a maturity date at the time of purchase of three months or less to be cash equivalents.
(c) INVESTMENT SECURITIES TRANSACTIONS
The Institutional TEI W Fund records monthly, its pro-rata share of income, expenses, changes in unrealized appreciation and depreciation, and realized gains and losses derived from the Offshore Institutional W Fund.
The Institutional TEI W Fund records investment transactions on a trade-date basis.
Investments that are held by the Institutional TEI W Fund are marked to fair value at the date of the financial statements, and the corresponding change in unrealized appreciation/depreciation is included in the Statement of Operations.
(d) INVESTMENT VALUATION
The valuation of the Institutional TEI W Fund’s investments is determined as of the close of business at the end of each reporting period, generally monthly. The valuation of the Institutional TEI W Fund’s investments is calculated by Citi Fund Services Ohio, Inc., the Institutional TEI W Fund’s independent administrator (the “Administrator”).
The Board has formed a valuation committee (the “Board Valuation Committee”) that is responsible for overseeing the Institutional TEI W Fund’s valuation policies, making recommendations to the Board on valuation-related matters, and overseeing implementation by the Adviser of such valuation policies.
The Board has authorized the Adviser to establish a valuation committee of the Adviser (the “Adviser Valuation Committee”). The function of the Adviser Valuation Committee, subject to the oversight of the Board Valuation Committee and the Board, is generally to review valuation methodologies, valuation determinations, and any information provided to the Adviser Valuation Committee by the Adviser or the Administrator.
10
THE ENDOWMENT INSTITUTIONAL TEI FUND W, L.P.
(A Limited Partnership)
Notes to Financial Statements, continued
December 31, 2013
The Institutional TEI W Fund invests substantially all of its assets in the Offshore Institutional W Fund, which in turn invests substantially all of its assets in the Master Fund. Investments in the Master Fund are recorded at fair value based on the Institutional TEI W Fund’s proportional share of the Master Fund’s partners’ capital, through the Offshore Institutional W Fund. Valuation of the investments held by the Master Fund is discussed in the Master Fund’s notes to financial statements, included elsewhere in this report.
(e) INVESTMENT INCOME
For investments in securities, dividend income is recorded on the ex-dividend date, net of withholding taxes. Interest income is recorded as earned on the accrual basis and includes amortization of premiums or accretion of discounts.
(f) FUND EXPENSES
Unless otherwise voluntarily or contractually assumed by the Adviser or another party, the Institutional TEI W Fund bears all expenses incurred in its business including, directly or indirectly through its investment in the Master Fund (through the Offshore Institutional W Fund), including but not limited to, the following: all costs and expenses related to investment transactions and positions for the Institutional TEI W Fund’s account; legal fees; accounting, auditing and tax preparation fees; recordkeeping and custodial fees; costs of computing the Institutional TEI W Fund’s net asset value; fees for data and software providers; research expenses; costs of insurance; registration expenses; offering costs; expenses of meetings of the partners; directors fees; all costs with respect to communications to partners; offshore withholding taxes; and other types of expenses as may be approved from time to time by the Board.
(g) INCOME TAXES
The Institutional TEI W Fund is organized and operates as a limited partnership and is not subject to income taxes as a separate entity. Such taxes are the responsibility of the individual partners. Accordingly, no provision for income taxes has been made in the Institutional TEI W Fund’s financial statements. Investments in foreign securities may result in foreign taxes being withheld by the issuer of such securities.
For the current open tax year and for all major jurisdictions, management of the Institutional TEI W Fund has evaluated the tax positions taken or expected to be taken in the course of preparing the Institutional TEI W Fund’s tax returns to determine whether the tax positions will “more-likely-than-not” be sustained by the Institutional TEI W Fund upon challenge by the applicable tax authority. Tax positions not deemed to meet the more-likely-than-not threshold and that would result in a tax benefit or expense to the Institutional TEI W Fund would be recorded as a tax benefit or expense in the current period. For the year ended December 31, 2013, the Institutional TEI W Fund did not recognize any amounts for unrecognized tax benefit/expense. A reconciliation of unrecognized tax benefit/expense is not provided herein, as the beginning and ending amounts of unrecognized tax benefit/expense are zero, with no interim additions, reductions or settlements. Tax positions taken in tax years which remain open under the statute of limitations (generally three years for federal income tax purposes) are subject to examination by federal and state tax jurisdictions.
11
THE ENDOWMENT INSTITUTIONAL TEI FUND W, L.P.
(A Limited Partnership)
Notes to Financial Statements, continued
December 31, 2013
(h) USE OF ESTIMATES
The preparation of the financial statements in accordance with U.S. GAAP requires management to make estimates and assumptions relating to the reported amounts of assets and liabilities and the disclosure of contingent assets and liabilities at the date of the financial statements and the reported amounts of income and expenses during the reporting period. Actual results could differ from those estimates and such differences may be significant.
(i) ORGANIZATIONAL EXPENSES
The Institutional TEI W Fund’s organizational expenses (the “Organizational Expenses”) were initially borne by the Adviser or an affiliate thereof and for capital account allocation purposes assumed to be reimbursed, over not more than a 60 month period of time, notwithstanding that such Organizational Expenses were expensed in accordance with U.S. GAAP for Institutional TEI W Fund financial reporting purposes upon commencement of operations.
(3) FAIR VALUE MEASUREMENTS
The Institutional TEI W Fund records its investment in the Offshore Institutional W Fund, which in turn invests substantially all of its assets in the Master Fund, at fair value. Investments of the Master Fund are recorded at fair value as more fully discussed in the Master Fund’s notes to financial statements, included elsewhere in this report.
(4) PARTNERS’ CAPITAL ACCOUNTS
(a) ISSUANCE OF INTERESTS
Upon receipt from an eligible investor of an initial or additional application for interests (the “Interests”), which will generally be accepted as of the first day of each month, the Institutional TEI W Fund will issue new Interests. The Interests have not been registered under the Securities Act of 1933, as amended (the “Securities Act”), or the securities laws of any state. The Institutional TEI W Fund issues Interests only in private placement transactions in accordance with Regulation D or other applicable exemptions under the Securities Act. No public market exists for the Interests, and none is expected to develop. The Institutional TEI W Fund is not required, and does not intend, to hold annual meetings of its partners. The Interests are subject to substantial restrictions on transferability and resale and may not be transferred or resold except as permitted under the Institutional TEI W Fund’s limited partnership agreement. The Institutional TEI W Fund reserves the right to reject any applications for subscription of Interests.
(b) ALLOCATION OF PROFITS AND LOSSES
For each fiscal period, generally monthly, net profits or net losses of the Institutional TEI W Fund, including allocations from the Master Fund (through the Offshore Institutional W Fund), are allocated among and credited to or debited against the capital accounts of all partners as of the last day of each fiscal period in accordance with the partners’ respective capital account ownership percentage for the fiscal period. Net profits or net losses are measured as the net change in the value of the partners’ capital of the Institutional TEI W Fund, including any change in unrealized appreciation or depreciation of investments and income, net of expenses, and realized gains or losses during a fiscal period. Net profits or net losses are allocated after giving effect for any initial or additional applications for Interests, which generally occur at the beginning of the month, or any repurchases of Interests.
12
THE ENDOWMENT INSTITUTIONAL TEI FUND W, L.P.
(A Limited Partnership)
Notes to Financial Statements, continued
December 31, 2013
(c) REPURCHASE OF INTERESTS
A partner will not be eligible to have the Institutional TEI W Fund repurchase all or any portion of an Interest at the partner’s discretion at any time. The Adviser, which also serves as the investment adviser of the Master Fund and Offshore Institutional W Fund, generally recommends to the Board that the Institutional TEI W Fund offer to repurchase such Interests each calendar quarter, pursuant to written tenders by partners.
The Board retains the sole discretion to accept or reject the recommendation of the Adviser and to determine the amount of Interests, if any, that will be purchased in any tender offer that it does approve. Since the Institutional TEI W Fund’s assets are invested in the Master Fund (through the Offshore Institutional W Fund), the ability of the Institutional TEI W Fund to have its Interests in the Master Fund be repurchased would be subject to the Master Fund’s and Offshore Institutional W Fund’s repurchase policies. The Master Fund’s and Offshore Institutional W Fund’s repurchase policies are substantially similar to the Institutional TEI W Fund’s repurchase policy as any tender offer by the Master Fund (through the Offshore Institutional W Fund) is subject to the sole discretion of the Board. In addition, the Institutional TEI W Fund may determine not to conduct a repurchase offer each time the Master Fund and Offshore Institutional W Fund conduct a repurchase offer. In the event Interests are repurchased, there will be a substantial period of time between the date as of which partners must tender their Interests for repurchase and the date they can expect to receive payment for their Interests from the Institutional TEI W Fund.
(5) INVESTMENTS IN PORTFOLIO SECURITIES
As of December 31, 2013, all of the investments made by the Institutional TEI W Fund were in the Master Fund (through the Offshore Institutional W Fund).
(6) FINANCIAL INSTRUMENTS WITH OFF-BALANCE SHEET RISK
In the normal course of business, the Investment Funds in which the Institutional TEI W Fund may invest either directly or through the Offshore Institutional W Fund and Master Fund may trade various derivative securities and other financial instruments, and enter into various investment activities with off-balance sheet risk both as an investor and as a principal. The Institutional TEI W Fund’s risk of loss in these Investment Funds is limited to the Institutional TEI W Fund’s pro rata share of the value of its investment in or commitment to such Investment Funds as held directly or through the Offshore Institutional W Fund and Master Fund. In addition, the Master Fund may invest directly in derivative securities or other financial instruments to gain greater or lesser exposure to a particular asset class.
(7) ADMINISTRATION AGREEMENT
In consideration for administrative, accounting, and recordkeeping services, the Master Fund pays the Administrator a monthly administration fee based on the month-end partners’ capital of the Master Fund. The Administrator also provides the Institutional TEI W Fund, the Offshore Institutional W Fund and the Master Fund with legal, compliance, transfer agency, and other investor related services at an additional cost.
The fees for Institutional TEI W Fund administration are paid out of the Master Fund’s assets, which decreases the net profits or increases the net losses of the partners in the Institutional TEI W Fund.
13
THE ENDOWMENT INSTITUTIONAL TEI FUND W, L.P.
(A Limited Partnership)
Notes to Financial Statements, continued
December 31, 2013
(8) RELATED PARTY TRANSACTIONS
(a) INVESTMENT MANAGEMENT FEE
In consideration of the advisory and other services provided by the Adviser to the Master Fund and the Institutional TEI W Fund, the Master Fund pays the Adviser an investment management fee (the “Investment Management Fee”) equal to 1.00% on an annualized basis of the Master Fund’s partners’ capital calculated based on the Master Fund’s partners’ capital at the end of each month, payable quarterly in arrears. So long as the Institutional TEI W Fund invests all of its investable assets in the Offshore Institutional W Fund, which in turn invests all of its investable assets in the Master Fund, the Institutional TEI W Fund will not pay the Adviser directly any Investment Management Fee; however, should the Institutional TEI W Fund not have all of its investments in the Offshore Institutional W Fund, it may be charged the 1.00% Investment Management Fee directly. The Institutional TEI W Fund’s partners bear an indirect portion of the Investment Management Fee paid by the Master Fund. The Investment Management Fee decreases the net profits or increases the net losses of the Master Fund and indirectly the Institutional TEI W Fund as the fees reduce the capital accounts of the Master Fund’s partners.
(b) PLACEMENT AGENTS
The Institutional TEI W Fund may engage one or more placement agents (each, a “Placement Agent”) to solicit investments in the Institutional TEI W Fund. Salient Capital, L.P., an affiliate of the Adviser, is a broker-dealer who has been engaged by the Institutional TEI W Fund to serve as a Placement Agent. A Placement Agent may engage one or more sub-placement agents. The Adviser or its affiliates may pay a fee out of their own resources to Placement Agents and sub-placement agents.
(9) FINANCIAL HIGHLIGHTS
| | | | | | | | | | | | |
| | | Year ended
December 31,
2013 | | | Year ended
December 31,
2012 | | | Year ended
December 31,
20111 | |
Net investment loss to average partners’ capital2 | | | (1.36)% | | | | (1.51)% | | | | (1.58)% | |
Gross expenses to average partners’ capital2 | | | 2.00% | | | | 2.19% | | | | 2.35% | |
Net expenses to average partners capital2 | | | 2.00% | | | | 2.19% | | | | 2.19%3 | |
Portfolio turnover4 | | | 16.95% | | | | 20.88% | | | | 26.72% | |
Total return5,6,7 | | | 4.07% | | | | 1.93% | | | | (6.23)% | |
Partners’ capital, end of year (000s) | | $ | 15,408 | | | $ | 22,611 | | | $ | 26,364 | |
An investor’s return (and operating ratios) may vary from those reflected based on the timing of capital transactions.
| 1 | The Institutional TEI W Fund commenced operations on January 1, 2011. |
| 2 | Ratios are calculated by dividing the indicated amount by average partners’ capital measured at the end of each month during the year. Ratios include allocations of net investment loss and expenses from the Offshore Institutional W Fund and Master Fund. |
| 3 | Ratio includes expenses reimbursed by the Adviser. Had the Organizational Expenses not been included as an expense at Inception and were instead amortized over 60 months as they are being handled for capital allocation purposes, the ratio of net expenses to average partners’ capital would have been 1.75% for the year ended December 31, 2011. (see Note 2) |
14
THE ENDOWMENT INSTITUTIONAL TEI FUND W, L.P.
(A Limited Partnership)
Notes to Financial Statements, continued
December 31, 2013
| 4 | The Institutional TEI W Fund is invested exclusively in the Offshore Institutional W Fund, which in turn is invested solely in the Master Fund, therefore this ratio reflects the portfolio turnover of the Master Fund, which is for the year indicated. |
| 5 | Calculated as geometrically linked monthly returns for each month in the year. |
| 6 | Calculated including benefit of early repurchase fees in each applicable year. Had these early repurchase fees not been included as income for the purposes of the total return calculation, the total return for 2012 would have been 1.80%. |
| 7 | The reported total return amount for the year ended December 31, 2011, is negatively impacted by the write off of the Institutional TEI W and the Offshore Institutional W Funds’ Organizational Expenses, which occurred at Inception of the Institutional TEI W and Offshore Institutional W Funds’ operations in accordance with U.S. GAAP. Had these costs not been included as an expense at Inception for the purposes of the total return calculation and were instead amortized over 60 months as they are being handled for capital allocation purposes, the total return would have been (3.99)% for the year ended December 31, 2011. |
(10) SUBSEQUENT EVENTS
On February 18, 2014, the Board approved a tender offer (the “Offer”) to be made for up to 100% of the Institutional TEI W Fund’s outstanding Interests with a valuation date of March 31, 2014, with a potential extension of the valuation date to June 30, 2014 depending on certain factors as set forth in the Offer. Unlike the Institutional TEI W Fund’s prior offers to repurchase Interests, with respect to which the Institutional TEI W Fund paid repurchase proceeds in cash, proceeds for Interests tendered and accepted pursuant to the Offer will not be paid in cash. Proceeds for tendered Interests will be paid in-kind with tendering partners receiving 100% of their repurchase proceeds in shares of limited partnership interests (the “Shares”) in PMF Fund, L.P. (the “PMF Fund”), a newly-formed, closed-end, non-diversified, investment company registered under the 1940 Act that invests substantially all of its assets in The Endowment PMF Master Fund, L.P. (the “PMF Master Fund” and together with the PMF Fund, the “PMF Funds”), which also is a newly-formed, closed-end, non-diversified, registered investment company under the 1940 Act.
The Offer commenced on February 20, 2014 and, unless extended, will expire on March 19, 2014. The estimated net asset value will be calculated for the purpose of the Offer as of March 31, 2014 or, if the valuation date is extended, June 30, 2014. The Offer is subject to certain conditions and is being made simultaneously with a cash tender offer by the PMF Fund in which partners tendering Interests pursuant to the Offer, and therefore becoming holders of Shares of the PMF Fund, will have the opportunity to participate (the “PMF Funds Offer”). The PMF Funds Offer is a cash repurchase offer pursuant to which Shares will be repurchased at a discount to their net asset value, assuming all of the conditions of the PMF Funds Offer are satisfied. The Offer is not contingent upon the completion of the PMF Funds Offer. Additional information regarding the Offer and the PMF Funds Offer is available free of charge on the SEC’s website at www.sec.gov.
Management of the Institutional TEI W Fund has evaluated the need for disclosures and/or adjustments resulting from subsequent events through the date the financial statements were issued. Based on this evaluation, no adjustments were required to the financial statements as of December 31, 2013.
15
THE ENDOWMENT INSTITUTIONAL TEI FUND W, L.P.
(A Limited Partnership)
Supplemental Information
December 31, 2013
(Unaudited)
Directors and Officers
The Institutional TEI W Fund’s operations are managed under the direction and oversight of the Board. Each Director serves for an indefinite term or until he or she reaches mandatory retirement, if any, as established by the Board. The Board appoints the officers of the Institutional TEI W Fund who are responsible for the Institutional TEI W Fund’s day-to-day business decisions based on policies set by the Board. The officers serve at the pleasure of the Board.
Compensation for Directors
The Institutional TEI W Fund, The Master Fund, The Endowment Registered Fund, L.P., The Endowment Institutional Fund, L.P. and The Endowment TEI Fund, L.P., together pay each of the Directors who is not an “interested person” of the Adviser, as defined in the 1940 Act (the “Independent Directors”) an annual retainer of $38,000, paid quarterly, an annual Board meeting fee of $15,000, a fee of $1,250 per informal Board meeting, a fee of $1,250 per telephonic Board meeting, an annual fee of $4,000 for membership on each committee, an annual fee of $5,000 for the audit committee chairman and $2,500 for each other committee chair, each of which is paid quarterly, and an annual fee of $7,500, paid quarterly, to the Lead Independent Director. There are currently six Independent Directors. In the interest of retaining Independent Directors of the highest quality, the Board intends to periodically review such compensation and may modify it as the Board deems appropriate.
Interested Directors
| | | | | | | | |
| Name, Address and Age | | Position(s)
Held | | Principal
Occupation(s) During
the Past 5 Years | | Number of
Portfolios
in Fund
Complex
Overseen
by Director | | Other Directorships
Held by Director |
John A. Blaisdell(1) Age: 53 Address: c/o The Endowment Fund 4265 San Felipe, 8th Floor, Houston, TX 77027 | | Director, Co-Principal Executive Officer (Since 2004) | | Member, Investment Committee of the Adviser, since 2002; Managing Director of Salient, since 2002. | | 5 | | Salient Alternative Strategies Funds (investment companies) (two funds) since 2010; Salient MF Trust (investment company) (five funds) since 2012; Salient Midstream & MLP Fund (investment company) since 2012; Salient MLP & Energy Infrastructure Fund (investment company) since 2011. |
16
THE ENDOWMENT INSTITUTIONAL TEI FUND W, L.P.
(A Limited Partnership)
Supplemental Information, continued
December 31, 2013
(Unaudited)
| | | | | | | | |
| Name, Address and Age | | Position(s)
Held | | Principal
Occupation(s) During
the Past 5 Years | | Number of
Portfolios
in Fund
Complex
Overseen
by Director | | Other Directorships
Held by Director |
Andrew Linbeck(1) Age: 49 Address: c/o The Endowment Fund 4265 San Felipe, 8th Floor, Houston, TX 77027 | | Director, Co-Principal Executive Officer (Since 2004) | | Member, Investment Committee of the Adviser, since 2002; Managing Director of Salient, since 2002. | | 5 | | Salient Alternative Strategies Funds (investment companies) (two funds) 2010-2012; Salient Midstream & MLP Fund (investment company) since 2012; Salient MLP & Energy Infrastructure Fund (investment company) since 2011. |
A. Haag Sherman(1) Age: 48 Address: c/o The Endowment Fund 4265 San Felipe, 8th Floor, Houston, TX 77027 | | Director (Since 2004) | | Member, Investment Committee of the Adviser, 2002-2011; Managing Director of Salient, 2002-2011. | | 5 | | Salient Alternative Strategies Funds (investment companies) (two funds) 2010-2012; Salient Midstream & MLP Fund (investment company) since 2012; Salient MLP & Energy Infrastructure Fund (investment company) since 2011; Plains Capital Corporation, since 2009; Blue Dolphin Energy Company, since 2012. |
| (1) | This person’s status as an “interested” director arises from his affiliation with Salient Partners, L.P., which itself is an affiliate of the Master Fund, The Endowment Registered Fund, L.P., The Endowment Institutional Fund, L.P., The Endowment TEI Fund, L.P., The Endowment Institutional TEI Fund W, L.P., and the Adviser. |
17
THE ENDOWMENT INSTITUTIONAL TEI FUND W, L.P.
(A Limited Partnership)
Supplemental Information, continued
December 31, 2013
(Unaudited)
Independent Directors
| | | | | | | | |
| Name, Address and Age | | Position(s)
Held | | Principal
Occupation(s) During
the Past 5 Years | | Number of
Portfolios
in Fund
Complex
Overseen
by Director | | Other Directorships
Held by Director |
Karin B. Bonding, CFA Age: 74 Address: c/o The Endowment Fund 4265 San Felipe, 8th Floor, Houston, TX 77027 | | Director (Since 2010) | | Lecturer, University of Virginia, since 1996; President of Capital Markets Institute, Inc. (fee-only financial planner and investment advisor) since 1996. | | 5 | | Salient Alternative Strategies Funds (investment companies) (two funds) since 2010; Salient MF Trust (investment company) (five funds) since 2012; Salient Midstream & MLP Fund (investment company) since 2012; Salient MLP & Energy Infrastructure Fund (investment company) since 2011; Brandes Investment Trust (investment companies) (four funds) since 2006; Credit Suisse Alternative Capital Funds (investment companies) (six funds) 2005-2010. |
Jonathan P. Carroll Age: 52 Address: c/o The Endowment Fund 4265 San Felipe, 8th Floor, Houston, TX 77027 | | Director (Since 2004) | | President of Lazarus Financial LLC (holding company) since 2006; private investor for the past six years. | | 5 | | Salient Alternative Strategies Funds (investment companies) (two funds) since 2010; Salient MF Trust (investment company) (five funds) since 2012; Salient Midstream & MLP Fund (investment company) since 2012; Salient MLP & Energy Infrastructure Fund (investment company) since 2011. |
18
THE ENDOWMENT INSTITUTIONAL TEI FUND W, L.P.
(A Limited Partnership)
Supplemental Information, continued
December 31, 2013
(Unaudited)
| | | | | | | | |
| Name, Address and Age | | Position(s)
Held | | Principal
Occupation(s) During
the Past 5 Years | | Number of
Portfolios
in Fund
Complex
Overseen
by Director | | Other Directorships
Held by Director |
Dr. Bernard Harris Age: 57 Address: c/o The Endowment Fund 4265 San Felipe, 8th Floor, Houston, TX 77027 | | Director (Since 2009) | | Chief Executive Officer and Managing Partner, Vesalius Ventures, Inc (venture investing), since 2002; President of The Space Agency (marketing), since 1999; President of The Harris Foundation (non-profit), since 1998; clinical scientist, flight surgeon and astronaut for NASA, 1986 to 1996. | | 5 | | Salient Alternative Strategies Funds (investment companies) (two funds) since 2010; Salient MF Trust (investment company) (five funds) since 2012; Salient Midstream & MLP Fund (investment company) since 2012; Salient MLP & Energy Infrastructure Fund (investment company) since 2011; U.S. Physical Therapy, Inc., since 2005; Sterling Bancshares, Inc., since 2007; RMD Networks, Inc., since 2006; Monebo Technologies Inc., since 2009; AG Technologies, since 2009; The Harris Foundation, Inc., since 1998; Houston Technology Center, since 2004; Greater Houston Community Foundation, 2004-2009; Communities in Schools, since 2007; ZOO SCORE “Counselors to America’s Small Business”, since 2009; American Telemedicine Association, since 2007; Houston Angel Network, since 2004; BioHouston, since 2006; The National Math and Science Initiative, and Space Agency, since 2008. |
19
THE ENDOWMENT INSTITUTIONAL TEI FUND W, L.P.
(A Limited Partnership)
Supplemental Information, continued
December 31, 2013
(Unaudited)
| | | | | | | | |
| Name, Address and Age | | Position(s)
Held | | Principal
Occupation(s) During
the Past 5 Years | | Number of
Portfolios
in Fund
Complex
Overseen
by Director | | Other Directorships
Held by Director |
Richard C. Johnson Age: 76 Address: c/o The Endowment Fund 4265 San Felipe, 8th Floor, Houston, TX 77027 | | Director (Since 2004) | | Senior Counsel (retired) for Baker Botts LLP (law firm) since 2002; Managing Partner, Baker Botts, 1998 to 2002; practiced law at Baker Botts, 1966 to 2002 (1972 to 2002 as a partner). | | 5 | | Salient Alternative Strategies Funds (investment companies) (two funds) since 2010; Salient MF Trust (investment company) (five funds) since 2012; Salient Midstream & MLP Fund (investment company) since 2012; Salient MLP & Energy Infrastructure Fund (investment company) since 2011. |
G. Edward Powell Age: 77 Address: c/o The Endowment Fund 4265 San Felipe, 8th Floor, Houston, TX 77027 | | Director (Since 2004) | | Principal of Mills & Stowell (private equity) since 2002. Principal, Innovation Growth Partners (consulting), since 2002; Consultant to emerging and middle market businesses, 1994-2002; Managing Partner, PriceWaterhouse & Co. (Houston Office, 1982 to 1994). | | 5 | | Salient Alternative Strategies Funds (investment companies) (two funds) since 2010; Salient MF Trust (investment company) (five funds) since 2012; Salient Midstream & MLP Fund (investment company) since 2012; Salient MLP & Energy Infrastructure Fund (investment company) since 2011; Therapy Track, LLC, since 2009; Global Water Technologies, Inc.; Datavox Holdings, Inc.; Energy Services International, Inc., since 2004. |
20
THE ENDOWMENT INSTITUTIONAL TEI FUND W, L.P.
(A Limited Partnership)
Supplemental Information, continued
December 31, 2013
(Unaudited)
| | | | | | | | |
| Name, Address and Age | | Position(s)
Held | | Principal
Occupation(s) During
the Past 5 Years | | Number of
Portfolios
in Fund
Complex
Overseen
by Director | | Other Directorships
Held by Director |
Scott E. Schwinger Age: 48 Address: c/o The Endowment Fund 4265 San Felipe, 8th Floor, Houston, TX 77027 | | Director (Since 2004) | | President, The McNair Group (management), since 2006; Senior Vice President and Chief Financial Officer, the Houston Texans (professional football team) (1999). | | 5 | | Salient Alternative Strategies Funds (investment companies) (two funds) since 2010; Salient MF Trust (investment company) (five funds) since 2012; Salient Midstream & MLP Fund (investment company) since 2012; Salient MLP & Energy Infrastructure Fund (investment company) since 2011; The Make-A-Wish Foundation, since 2008; YES Prep Public Schools, since 2001. |
Officers of the Fund Who Are Not Directors
| | | | |
| Name, Address and Age | | Position(s) Held with the Fund | | Principal Occupation(s) During the
Past 5 Years |
Paul Bachtold Age: 40 Address: c/o The Endowment Fund 4265 San Felipe, 8th Floor, Houston, TX 77027 | | Chief Compliance Officer (“CCO”) (Since 2010) | | CCO, Salient, since 2010; Consultant, Chicago Investment Group (compliance consulting), 2009-2010; US Compliance Manager, Barclays Global Investors, 2005-2008. |
John E. Price Age: 46 Address: c/o The Endowment Fund 4265 San Felipe, 8th Floor, Houston, TX 77027 | | Treasurer; Principal Financial Officer (Since 2004) | | Managing Director and Chief Financial Officer, Adviser, since 2003; Partner, Managing Director and Chief Financial Officer of Salient, since 2003. |
21
THE ENDOWMENT INSTITUTIONAL TEI FUND W, L.P.
(A Limited Partnership)
Supplemental Information, continued
December 31, 2013
(Unaudited)
| | | | |
| Name, Address and Age | | Position(s) Held with the Fund | | Principal Occupation(s) During the
Past 5 Years |
Jeremy Radcliffe Age: 39 Address: c/o The Endowment Fund 4265 San Felipe, 8th Floor, Houston, TX 77027 | | Secretary (Since 2013) | | Managing Director of Salient, since 2002. |
Allocation of Investments
The following chart indicates the allocation of investments among the asset classes in the Master Fund as of December 31, 2013.
| | | | | | | | |
Asset Class1 | | Fair Value | | | % | |
Arbitrage Strategies | | $ | 259,380,056 | | | | 12.40 | |
Domestic Equity | | | 27,794,430 | | | | 1.33 | |
Energy | | | 236,553,251 | | | | 11.31 | |
Enhanced Fixed Income | | | 145,106,419 | | | | 6.94 | |
Global Opportunistic | | | 212,121,331 | | | | 10.14 | |
International Equity | | | 43,287,010 | | | | 2.07 | |
Natural Resources | | | 34,182,182 | | | | 1.63 | |
Private Equity | | | 727,754,609 | | | | 34.77 | |
Real Estate | | | 195,817,823 | | | | 9.36 | |
Technology | | | 129,024 | | | | 0.01 | |
Call Options Purchased | | | 20,750,470 | | | | 0.99 | |
Money Market Funds | | | 189,272,108 | | | | 9.05 | |
| | | | | | | | |
Total Investments | | $ | 2,092,148,713 | | | | 100.00 | |
| | | | | | | | |
| 1 | The complete list of investments is included in the Schedule of Investments of the Master Fund, which is included elsewhere in this report. |
Form N-Q Filings
The Institutional TEI W Fund files a complete schedule of portfolio holdings with the Securities and Exchange Commission for the first and third quarters of each fiscal year on Form N-Q. The Institutional TEI W Fund’s Form N-Q is available on the Securities and Exchange Commission website at http://www.sec.gov. The Institutional TEI W Fund’s Form N-Q may be reviewed and copied at the Securities and Exchange Commission Public Reference Room in Washington, DC and information regarding operation of the Public Reference Room may be obtained by calling 1-800-SEC-0330.
22
THE ENDOWMENT INSTITUTIONAL TEI FUND W, L.P.
(A Limited Partnership)
Supplemental Information, continued
December 31, 2013
(Unaudited)
Proxy Voting Policies
A description of the policies and procedures that the Institutional TEI W Fund uses to determine how to vote proxies relating to portfolio securities is available (i) without charge, upon request, by calling 1-800-725-9456; and (ii) on the Securities and Exchange Commission website at http://www.sec.gov.
Information regarding how the Institutional TEI W Fund voted proxies relating to portfolio securities during the most recent 12-month period ended June 30 is available (i) without charge, upon request, by calling 1-800-725-9456; and (ii) on the Securities and Exchange Commission website at http://www.sec.gov.
Additional Information
The Institutional TEI W Fund’s private placement memorandum (the “PPM”) includes additional information about Directors of the Institutional TEI W Fund. The PPM is available, without charge, upon request by calling 1-800-725-9456.
23
THE ENDOWMENT INSTITUTIONAL TEI FUND W, L.P.
(A Limited Partnership)
Privacy Policy (Unaudited)
The Institutional TEI W Fund recognizes the importance of securing personal financial information. It is our policy to safeguard any personal and financial information that may be entrusted to us. The following is a description of the Institutional TEI W Fund’s policy regarding disclosure of nonpublic personal information.
We collect nonpublic personal information as follows:
We collect information about our investors, including, but not limited to, the investor’s name, address, telephone number, e-mail address, social security number and date of birth. We collect that information from subscription agreements, other forms of correspondence that we receive from investors, from personal conversations and from affiliated entities as permitted by law.
We receive information about investor transactions with us, including, but not limited to, account number, account balance, investment amounts, withdrawal amounts and other financial information.
We are permitted by law to disclose nonpublic information we collect, as described above, to the Institutional TEI W Fund’s service providers, including the Institutional TEI W Fund’s investment adviser, sub-advisers, servicing agent, independent administrator, custodian, legal counsel, accountant and auditor. We do not disclose any nonpublic information about our current or former investors to nonaffiliated third parties, except as required or permitted by law. We restrict access to investor nonpublic personal information to those persons who require such information to provide products or services to investors. We maintain physical, electronic and procedural safeguards that comply with federal standards to guard investors’ nonpublic personal information.
If an investor’s investment relationship with the Institutional TEI W Fund involves a financial intermediary, including, but not limited to, a broker-dealer, bank or trust company, the privacy policy of such investor’s financial intermediary would govern how any nonpublic personal information would be shared by them with nonaffiliated third parties.
24
the
ENDOWMENT FUND
The Endowment Master Fund, L.P.
Shareholders’ Report
December 31, 2013
Report of Independent Registered Public Accounting Firm
The Partners and Board of Directors
The Endowment Master Fund, L.P.:
We have audited the accompanying statement of assets, liabilities and partners’ capital of The Endowment Master Fund, L.P. (the “Master Fund”), including the schedule of investments, as of December 31, 2013, and the related statements of operations and cash flows for the year then ended, the statements of changes in partners’ capital for each of the years in the two-year period then ended, and the financial highlights for each of the years in the five-year period then ended. These financial statements and financial highlights are the responsibility of the Master Fund’s management. Our responsibility is to express an opinion on these financial statements and financial highlights based on our audits.
We conducted our audits in accordance with the standards of the Public Company Accounting Oversight Board (United States). Those standards require that we plan and perform the audits to obtain reasonable assurance about whether the financial statements and financial highlights are free of material misstatement. An audit includes examining, on a test basis, evidence supporting the amounts and disclosures in the financial statements. Our procedures included confirmation of securities owned as of December 31, 2013, by correspondence with custodians and investees; or other appropriate auditing procedures. An audit also includes assessing the accounting principles used and significant estimates made by management, as well as evaluating the overall financial statement presentation. We believe that our audits provide a reasonable basis for our opinion.
In our opinion, the financial statements and financial highlights referred to above present fairly, in all material respects, the financial position of The Endowment Master Fund, L.P. as of December 31, 2013, the results of its operations and its cash flows for the year then ended, the changes in its partners’ capital for each of the years in the two-year period then ended and the financial highlights for each of the years in the five-year period then ended in conformity with U.S. generally accepted accounting principles.
/s/ KPMG LLP
Columbus, Ohio
March 1, 2014
26
THE ENDOWMENT MASTER FUND, L.P.
(A Limited Partnership)
Statement of Assets, Liabilities and Partners’ Capital
December 31, 2013
| | | | |
Assets | | | | |
Investments in Investment Funds, at fair value (cost $756,366,463) | | $ | 934,742,972 | |
Investments in affiliated Investment Funds, at fair value (cost $900,292,673) | | | 947,192,231 | |
Investments in securities, at fair value (cost $190,226,451) | | | 189,463,040 | |
Investments in derivative contracts, at fair value (cost $24,991,550) | | | 20,750,470 | |
| | | | |
Total investments | | | 2,092,148,713 | |
Cash and cash equivalents | | | 469,431,361 | |
Deposits with brokers for futures contracts | | | 21,305,867 | |
Deposits with brokers for swap agreements | | | 15,534,304 | |
Net unrealized gain on swap agreements | | | 1,608,926 | |
Premiums paid on credit default swap agreements | | | 2,907,059 | |
Receivable from investments sold | | | 85,380,825 | |
Receivable from affiliated investments sold | | | 35,242,278 | |
Prepaids and other assets | | | 422,840 | |
| | | | |
Total assets | | | 2,723,982,173 | |
| | | | |
Liabilities and Partners’ Capital | | | | |
Withdrawals payable | | | 650,870,677 | |
Investment Management Fees payable | | | 6,631,332 | |
Offshore withholding tax payable | | | 910,683 | |
Administration fees payable | | | 255,784 | |
Payable to Adviser | | | 100,000 | |
Payable to Directors | | | 141,750 | |
Accounts payable and accrued expenses | | | 1,030,521 | |
| | | | |
Total liabilities | | | 659,940,747 | |
| | | | |
Partners’ capital | | | 2,064,041,426 | |
| | | | |
Total liabilities and partners’ capital | | $ | 2,723,982,173 | |
| | | | |
See accompanying notes to financial statements.
27
THE ENDOWMENT MASTER FUND, L.P.
(A Limited Partnership)
Schedule of Investments
December 31, 2013
| | | | | | | | | | |
| | | Shares | | | Fair
Value | | | % of
Partners’
Capital |
Investments in Investment Funds | | | | | | | | | | |
Limited Partnerships, Exempted Limited Partnerships and Limited Liability Companies | | | | | | | | | | |
Cayman Islands | | | | | | | | | | |
Arbitrage Strategies (0.03% of Partners’ Capital) | | | | | | | | | | |
Montrica Global Opportunities Fund, L.P.(1) | | | 25,428 | | | $ | 669,370 | | | |
Natural Resources (1.46% of Partners’ Capital) | | | | | | | | | | |
Sentient Global Resources Fund III, L.P.(2) | | | | | | | 21,944,417 | | | |
Sentient Global Resources Fund IV, L.P. | | | | | | | 8,212,383 | | | |
Private Equity (14.65% of Partners’ Capital) | | | | | | | | | | |
ABRY Advanced Securities Fund, L.P. | | | | | | | 4,831,101 | | | |
CX Partners Fund Limited(1) | | | | | | | 18,264,000 | | | |
Gavea Investment Fund II A, L.P.(1) | | | | | | | 1,916,000 | | | |
Gavea Investment Fund III A, L.P. | | | | | | | 36,011,134 | | | |
Hillcrest Fund, L.P.(3) | | | | | | | 12,205,434 | | | |
India Asset Recovery Fund, L.P. | | | | | | | 228,169 | | | |
J.C. Flowers III, L.P.(2) | | | | | | | 11,034,760 | | | |
LC Fund IV, L.P.(1)(2) | | | | | | | 25,533,642 | | | |
New Horizon Capital III, L.P.(2) | | | | | | | 42,264,844 | | | |
Northstar Equity Partners III Limited | | | | | | | 6,997,547 | | | |
Orchid Asia IV, L.P.(2) | | | | | | | 12,792,082 | | | |
Reservoir Capital Partners (Cayman), L.P. | | | | | | | 13,253,028 | | | |
Tiger Global Private Investment Partners IV, L.P.(2) | | | | | | | 10,388,497 | | | |
Tiger Global Private Investment Partners V, L.P.(2) | | | | | | | 23,850,820 | | | |
Tiger Global Private Investment Partners VI, L.P.(2) | | | | | | | 8,892,810 | | | |
Trustbridge Partners II, L.P. | | | | | | | 22,000,000 | | | |
Trustbridge Partners III, L.P.(1)(2) | | | | | | | 40,243,212 | | | |
Trustbridge Partners IV, L.P.(2) | | | | | | | 11,670,162 | | | |
Real Estate (1.70% of Partners’ Capital) | | | | | | | | | | |
Forum European Realty Income III, L.P. | | | | | | | 16,592,843 | | | |
Phoenix Asia Real Estate Investments II, L.P.(2) | | | | | | | 11,737,256 | | | |
Phoenix Real Estate Fund (T), L.P.(1) | | | | | | | 6,832,239 | | | |
| | | | | | | | | | |
Total Cayman Islands | | | | | | | 368,365,750 | | | |
| | | | | | | | | | |
Guernsey | | | | | | | | | | |
Private Equity (0.46% of Partners’ Capital) | | | | | | | | | | |
Mid Europa Fund III, L.P.(2) | | | | | | | 9,414,145 | | | |
| | | | | | | | | | |
Total Guernsey | | | | | | | 9,414,145 | | | |
| | | | | | | | | | |
Republic of Mauritius | | | | | | | | | | |
Real Estate (0.11% of Partners’ Capital) | | | | | | | | | | |
Orbis Real Estate Fund I(1) | | | | | | | 2,180,645 | | | |
| | | | | | | | | | |
Total Republic of Mauritius | | | | | | | 2,180,645 | | | |
| | | | | | | | | | |
See accompanying notes to financial statements.
28
THE ENDOWMENT MASTER FUND, L.P.
(A Limited Partnership)
Schedule of Investments, continued
December 31, 2013
| | | | | | | | |
| | | Shares | | Fair
Value | | | % of
Partners’
Capital |
Limited Partnerships, Exempted Limited Partnerships and Limited Liability Companies (continued) | | | | | | | | |
United Kingdom | | | | | | | | |
Private Equity (1.17% of Partners’ Capital) | | | | | | | | |
Darwin Private Equity I, L.P.(2) | | | | $ | 6,699,409 | | | |
Sovereign Capital Limited Partnership III(1) | | | | | 17,424,428 | | | |
Real Estate (0.42% of Partners’ Capital) | | | | | | | | |
Benson Elliott Real Estate Partners II, L.P. | | | | | 2,151,595 | | | |
Patron Capital, L.P. II | | | | | 541,983 | | | |
Patron Capital, L.P. III | | | | | 5,912,292 | | | |
| | | | | | | | |
Total United Kingdom | | | | | 32,729,707 | | | |
| | | | | | | | |
United States | | | | | | | | |
Arbitrage Strategies (11.46% of Partners’ Capital) | | | | | | | | |
Blue Mountain Credit Alternatives Fund, L.P.(1) | | | | | 79,092,477 | | | |
Citadel Wellington, LLC | | | | | 67,582,977 | | | |
Eton Park Fund, L.P. | | | | | 6,121,953 | | | |
Kenmont Onshore Fund, L.P.(1) | | | | | 18,684 | | | |
King Street Capital, L.P. | | | | | 968,383 | | | |
Magnetar Capital Fund, L.P.(1) | | | | | 7,591,968 | | | |
Magnetar SPV, LLC (Series L)(1) | | | | | 2,046,734 | | | |
Millennium USA, L.P. | | | | | 29,411,715 | | | |
OZ Asia Domestic Partners, L.P. | | | | | 2,071,062 | | | |
PIPE Equity Partners, LLC(3) | | | | | 12,411,446 | | | |
PIPE Select Fund, LLC(3) | | | | | 27,883,086 | | | |
Stark Investments Limited Partnership(2) | | | | | 116,996 | | | |
Stark Select Asset Fund, LLC | | | | | 1,265,639 | | | |
Domestic Equity (1.34% of Partners’ Capital) | | | | | | | | |
CCM Small Cap Value Qualified Fund, L.P.(3) | | | | | 5,210,242 | | | |
Ithan Creek Partners, L.P. | | | | | 19,989,632 | | | |
Kior Shares Liquidating Capital Account | | | | | 70,587 | | | |
Samlyn Onshore Fund, L.P. | | | | | 2,462,061 | | | |
Energy (11.46% of Partners’ Capital) | | | | | | | | |
ArcLight Energy Partners Fund IV, L.P.(2) | | | | | 4,126,954 | | | |
ArcLight Energy Partners Fund V, L.P.(2) | | | | | 4,950,946 | | | |
CamCap Resources, L.P. | | | | | 222,446 | | | |
EnCap Energy Capital Fund VII-B, L.P.(2) | | | | | 4,406,025 | | | |
EnCap Energy Infrastructure TE Feeder, L.P.(1)(2) | | | | | 5,722,401 | | | |
Intervale Capital Fund, L.P.(1)(2) | | | | | 15,288,846 | | | |
Merit Energy Partners G, L.P.(2) | | | | | 11,644,715 | | | |
NGP Energy Technology Partners II, L.P.(2) | | | | | 5,107,039 | | | |
NGP IX Offshore Fund, L.P.(2) | | | | | 34,901,000 | | | |
See accompanying notes to financial statements.
29
THE ENDOWMENT MASTER FUND, L.P.
(A Limited Partnership)
Schedule of Investments, continued
December 31, 2013
| | | | | | | | | | |
| | | Shares | | | Fair
Value | | | % of
Partners’
Capital |
Limited Partnerships, Exempted Limited Partnerships and Limited Liability Companies (continued) | | | | | | | | | | |
United States (continued) | | | | | | | | | | |
Energy (11.46% of Partners’ Capital) (continued) | | | | | | | | | | |
NGP Midstream & Resources, L.P.(2) | | | | | | $ | 52,557,664 | | | |
Quantum Parallel Partners V, L.P.(3) | | | | | | | 29,590,634 | | | |
Tenaska Power Fund II-A, L.P.(1)(2) | | | | | | | 18,683,665 | | | |
The Energy & Minerals Group Fund II(2) | | | | | | | 10,301,261 | | | |
Velite Energy, L.P.(1) | | | | | | | 39,049,655 | | | |
Enhanced Fixed Income (7.03% of Partners’ Capital) | | | | | | | | | | |
BDCM Partners I, L.P.(1) | | | | | | | 40,530,131 | | | |
Credit Distressed Blue Line Fund, L.P.(3) | | | | | | | 13,190,943 | | | |
Fortelus Special Situations Fund, L.P.(1) | | | | | | | 5,094,797 | | | |
Halcyon European Structured Opportunities Fund, L.P.(3) | | | | | | | 89,380 | | | |
Harbinger Capital Partners Fund I, L.P.(3) | | | | | | | 25,240,685 | | | |
Harbinger Capital Partners Fund II, L.P. | | | | | | | 1,894,261 | | | |
Harbinger Capital Partners Special Situations Fund, L.P. | | | | | | | 1,790,932 | | | |
Harbinger Class L Holdings (U.S.), LLC | | | | | | | 161,786 | | | |
Harbinger Class LS Holdings (U.S.) Trust | | | 3,816 | | | | 391,796 | | | |
Harbinger Class PE Holdings (U.S.) Trust | | | 10 | | | | 1,620,152 | | | |
Prospect Harbor Credit Partners, L.P. | | | | | | | 2,518,673 | | | |
Providence MBS Fund, L.P.(1) | | | | | | | 52,582,883 | | | |
Global Opportunistic (10.28% of Partners’ Capital) | | | | | | | | | | |
Blueshift Energy Fund, L.P.(3) | | | | | | | 33,372,298 | | | |
Falcon Edge Global, L.P. | | | | | | | 16,032,947 | | | |
Hayman Capital Partners, L.P.(1)(2) | | | | | | | 63,811,807 | | | |
Kepos Alpha Fund, L.P.(1) | | | | | | | 78,659,225 | | | |
Passport Global Strategies III, Ltd.(1) | | | 2,244 | | | | 870,073 | | | |
Senator Global Opportunity Fund, L.P. | | | | | | | 5,179,906 | | | |
Valiant Capital Partners, L.P. | | | | | | | 6,550,787 | | | |
Viking Global Equities, L.P. | | | | | | | 7,644,288 | | | |
International Equity (2.07% of Partners’ Capital) | | | | | | | | | | |
Penta Asia Domestic Partners, L.P. | | | | | | | 4,735,958 | | | |
Steel Partners Japan Strategic Fund, L.P. | | | | | | | 1,823,223 | | | |
TAEF Fund, LLC | | | | | | | 3,908,401 | | | |
Tybourne Equity (U.S.) Fund(1)(2) | | | | | | | 32,203,799 | | | |
Natural Resources (0.00% of Partners’ Capital) | | | | | | | | | | |
Tocqueville Gold Partners, L.P. | | | | | | | 24,408 | | | |
Private Equity (18.98% of Partners’ Capital) | | | | | | | | | | |
Accel-KKR Capital Partners III, L.P. | | | | | | | 18,928,279 | | | |
Advent Latin American Private Equity Fund IV-F, L.P. | | | | | | | 4,566,852 | | | |
See accompanying notes to financial statements.
30
THE ENDOWMENT MASTER FUND, L.P.
(A Limited Partnership)
Schedule of Investments, continued
December 31, 2013
| | | | | | | | | | |
| | | Shares | | | Fair
Value | | | % of
Partners’
Capital |
Limited Partnerships, Exempted Limited Partnerships and Limited Liability Companies (continued) | | | | | | | | | | |
United States (continued) | | | | | | | | | | |
Private Equity (18.98% of Partners’ Capital) (continued) | | | | | | | | | | |
Advent Latin American Private Equity Fund V-F, L.P.(1) | | | | | | $ | 8,509,932 | | | |
Audax Mezzanine Fund II, L.P.(2) | | | | | | | 1,404,911 | | | |
Audax Mezzanine Fund III, L.P.(2) | | | | | | | 7,776,625 | | | |
BDCM Opportunity Fund II, L.P.(2) | | | | | | | 11,295,794 | | | |
Black River Commodity Multi-Strategy Fund, LLC | | | | | | | 675,608 | | | |
Capital Royalty Partners, L.P.(2) | | | | | | | 964,957 | | | |
Catterton Growth Partners, L.P. | | | | | | | 18,349,957 | | | |
CEF-Safety Kleen Liquidating Account | | | 4,810 | | | | 142,881 | | | |
Chrysalis Ventures III, L.P. | | | | | | | 2,165,345 | | | |
Crosslink Crossover Fund IV, L.P. | | | | | | | 1,539,384 | | | |
Crosslink Crossover Fund V, L.P. | | | | | | | 6,304,207 | | | |
Crosslink Crossover Fund VI, L.P. | | | | | | | 16,577,771 | | | |
Dace Ventures I, L.P.(1) | | | | | | | 1,509,963 | | | |
Fairhaven Capital Partners, L.P. | | | | | | | 7,607,946 | | | |
Garrison Opportunity Fund II A, LLC | | | | | | | 15,608,617 | | | |
Garrison Opportunity Fund, LLC(1) | | | | | | | 20,554,861 | | | |
HealthCor Partners Fund, L.P.(1) | | | | | | | 8,719,201 | | | |
Highland Credit Strategies Liquidation Vehicle Onshore | | | | | | | 2,222,131 | | | |
Integral Capital Partners VIII, L.P.(1) | | | | | | | 2,872,000 | | | |
L-R Global Partners, L.P | | | | | | | 404,777 | | | |
MatlinPatterson Global Opportunities Partners III, L.P.(2) | | | | | | | 10,805,832 | | | |
Middle East North Africa Opportunities Fund, L.P.(3) | | | 5,089 | | | | 1,315,734 | | | |
Monomoy Capital Partners II, L.P. | | | | | | | 4,252,442 | | | |
Monomoy Capital Partners, L.P. | | | | | | | 2,683,686 | | | |
Monsoon India Inflection Fund 2, L.P. | | | | | | | 230,000 | | | |
Monsoon India Inflection Fund, L.P. | | | | | | | 130,000 | | | |
Pine Brook Capital Partners, L.P.(2) | | | | | | | 23,775,394 | | | |
Pinto America Growth Fund, L.P.(2) | | | | | | | 1,560,110 | | | |
Private Equity Investment Fund IV, L.P.(1)(2) | | | | | | | 5,409,231 | | | |
Private Equity Investment Fund V, L.P.(1)(2) | | | | | | | 39,915,679 | | | |
Saints Capital VI, L.P.(1)(2) | | | | | | | 16,440,779 | | | |
Sanderling Venture Partners VI Co-Investment Fund, L.P. | | | | | | | 1,755,251 | | | |
Sanderling Venture Partners VI, L.P. | | | | | | | 1,268,451 | | | |
Sterling Capital Partners II, L.P.(2) | | | | | | | 1,630,110 | | | |
Sterling Group Partners II, L.P. | | | | | | | 960,582 | | | |
Sterling Group Partners III, L.P. | | | | | | | 8,599,007 | | | |
Strategic Value Global Opportunities Fund I-A, L.P. | | | | | | | 2,046,887 | | | |
Tenaya Capital V, L.P. | | | | | | | 6,732,216 | | | |
See accompanying notes to financial statements.
31
THE ENDOWMENT MASTER FUND, L.P.
(A Limited Partnership)
Schedule of Investments, continued
December 31, 2013
| | | | | | | | | | | | |
| | | Shares | | | Fair
Value | | | % of
Partners’
Capital | |
Limited Partnerships, Exempted Limited Partnerships and Limited Liability Companies (continued) | | | | | | | | | | | | |
United States (continued) | | | | | | | | | | | | |
Private Equity (18.97% of Partners’ Capital) (continued) | | | | | | | | | | | | |
Tenaya Capital VI, L.P. | | | | | | $ | 3,881,287 | | | | | |
The Column Group, L.P. | | | | | | | 8,451,768 | | | | | |
The Founders Fund III, L.P. | | | | | | | 18,490,313 | | | | | |
The Founders Fund IV, L.P. | | | | | | | 9,535,472 | | | | | |
The Raptor Private Holdings, L.P. | | | 1,833 | | | | 936,975 | | | | | |
Trivest Fund IV, L.P.(1)(2) | | | | | | | 19,392,683 | | | | | |
Tuckerbrook SB Global Distressed Fund I, L.P.(1) | | | | | | | 5,293,587 | | | | | |
VCFA Private Equity Partners IV, L.P.(2) | | | | | | | 1,382,838 | | | | | |
VCFA Venture Partners V, L.P. | | | | | | | 5,310,105 | | | | | |
Voyager Capital Fund III, L.P. | | | | | | | 3,815,370 | | | | | |
WestView Capital Partners II, L.P.(1)(2) | | | | | | | 27,135,597 | | | | | |
Real Estate (6.62% of Partners’ Capital) | | | | | | | | | | | | |
Aslan Realty Partners III, L.L.C.(2) | | | | | | | 484,300 | | | | | |
Cypress Realty VI, L.P. | | | | | | | 5,604,852 | | | | | |
Florida Real Estate Value Fund, L.P.(1) | | | | | | | 8,150,000 | | | | | |
GTIS Brazil Real Estate Fund (Brazilian Real), L.P.(1) | | | | | | | 23,900,000 | | | | | |
Lone Star Real Estate Fund II (U.S.), L.P. | | | | | | | 5,831,654 | | | | | |
Monsoon Infrastructure & Realty Co-Invest, L.P.(1) | | | | | | | 14,994,404 | | | | | |
Northwood Real Estate Co-Investors, L.P.(2) | | | | | | | 7,033,803 | | | | | |
Northwood Real Estate Partners, L.P.(2) | | | | | | | 13,357,102 | | | | | |
Parmenter Realty Fund III, L.P.(2) | | | | | | | 6,018,110 | | | | | |
Parmenter Realty Fund IV, L.P.(2) | | | | | | | 8,300,019 | | | | | |
Pearlmark Mezzanine Realty Partners III, LLC(1)(2) | | | | | | | 14,205,600 | | | | | |
Pennybacker II, L.P.(1)(2) | | | | | | | 7,726,279 | | | | | |
SBC Latin America Housing US Fund, L.P.(1) | | | | | | | 7,641,872 | | | | | |
Square Mile Partners III, L.P.(2) | | | | | | | 13,404,731 | | | | | |
| | | | | | | | | | | | |
Total United States | | | | | | | 1,429,284,543 | | | | | |
| | | | | | | | | | | | |
Total Limited Partnerships, Exempted Limited Partnerships and Limited Liability Companies | | | | | | | 1,841,974,790 | | | | 89.24% | |
| | | | | | | | | | | | |
Passive Foreign Investment Companies | | | | | | | | | | | | |
Cayman Companies Limited by Shares, Exempted Companies and Limited Liability Companies | | | | | | | | | | | | |
Arbitrage Strategies (1.08% of Partners’ Capital) | | | | | | | | | | | | |
CRC Credit Fund Ltd. | | | 78,050 | | | | 21,372,049 | | | | | |
Overseas CAP Partners, Inc. | | | 92 | | | | 755,517 | | | | | |
International Equity (0.03% of Partners’ Capital) | | | | | | | | | | | | |
Quorum Fund Limited | | | 10,369 | | | | 615,629 | | | | | |
See accompanying notes to financial statements.
32
THE ENDOWMENT MASTER FUND, L.P.
(A Limited Partnership)
Schedule of Investments, continued
December 31, 2013
| | | | | | | | | | | | |
| | | Shares | | | Fair
Value | | | % of
Partners’
Capital | |
Passive Foreign Investment Companies (continued) | | | | | | | | | | | | |
Cayman Companies Limited by Shares, Exempted Companies | | | | | | | | | | | | |
and Limited Liability Companies (continued) | | | | | | | | | | | | |
Natural Resources (0.19% of Partners’ Capital) | | | | | | | | | | | | |
Ospraie Special Opportunities (Offshore), Ltd. | | | | | | $ | 4,000,974 | | | | | |
| | | | | | | | | | | | |
Total Cayman Companies Limited by Shares, Exempted Companies and Limited Liability Companies | | | | | | | 26,744,169 | | | | | |
| | | | | | | | | | | | |
Total Passive Foreign Investment Companies | | | | | | | 26,744,169 | | | | 1.30% | |
| | | | | | | | | | | | |
Private Corporations | | | | | | | | | | | | |
United States | | | | | | | | | | | | |
Real Estate (0.64% of Partners’ Capital) | | | | | | | | | | | | |
Legacy Partners Realty Fund II, Inc. | | | | | | | 2,064,527 | | | | | |
Legacy Partners Realty Fund III, Inc. | | | | | | | 7,552,271 | | | | | |
Net Lease Private REIT V, Inc.(2) | | | | | | | 137,708 | | | | | |
Net Lease Private REIT VI, Inc.(2) | | | | | | | 770,918 | | | | | |
Net Lease Private REIT VII, Inc.(2) | | | | | | | 1,345,410 | | | | | |
Net Lease Private REIT VII-A, Inc.(2) | | | | | | | 1,345,410 | | | | | |
| | | | | | | | | | | | |
Total Private Corporations | | | | | | | 13,216,244 | | | | 0.64% | |
| | | | | | | | | | | | |
Total Investments in Investment Funds Cost ($1,656,659,136) | | | | | | | 1,881,935,203 | | | | 91.17% | |
| | | | | | | | | | | | |
Investments in Securities | | | | | | | | | | | | |
Common Stocks | | | | | | | | | | | | |
United States | | | | | | | | | | | | |
Domestic Equity (0.00% of Partners’ Capital) | | | | | | | | | | | | |
Kior, Inc. | | | 36,850 | | | | 61,908 | | | | | |
Technology (0.01% of Partners’ Capital) | | | | | | | | | | | | |
Houghton Mifflin Harcourt Co. | | | 7,608 | | | | 129,024 | | | | | |
| | | | | | | | | | | | |
Total Common Stocks | | | | | | | 190,932 | | | | 0.01% | |
| | | | | | | | | | | | |
Registered Investment Company | | | | | | | | | | | | |
United States | | | | | | | | | | | | |
Money Market Funds (9.17% of Partners’ Capital) | | | | | | | | | | | | |
JPMorgan 100% U.S. Treasury Securities Money Market Fund(2) | | | 189,272,108 | | | | 189,272,108 | | | | | |
| | | | | | | | | | | | |
Total Registered Investment Company | | | | | | | 189,272,108 | | | | 9.17% | |
| | | | | | | | | | | | |
Total Investments in Securities (Cost $190,226,451) | | | | | | | 189,463,040 | | | | 9.18% | |
| | | | | | | | | | | | |
See accompanying notes to financial statements.
33
THE ENDOWMENT MASTER FUND, L.P.
(A Limited Partnership)
Schedule of Investments, continued
December 31, 2013
| | | | | | | | | | | | |
| | | Shares | | | Fair
Value | | | % of
Partners’
Capital | |
Derivative Contracts—Assets | | | | | | | | | | | | |
Call Options Purchased | | | | | | | | | | | | |
United States | | | | | | | | | | | | |
CMS 10 Year One Look Cap, 10 Year USD Swap Rate (Strike Rate 5.50%, Expiration 05/01/19) | | | 1,079,000,000 | | | $ | 7,258,678 | | | | | |
CMS 10 Year One Look Cap, 10 Year USD Swap Rate (Strike Rate 6.50%, Expiration 05/01/19) | | | 1,350,000,000 | | | | 5,567,365 | | | | | |
CMS 10 Year One Look Cap, 10 Year USD Swap Rate (Strike Rate 5.62%, Expiration 05/02/19) | | | 714,285,714 | | | | 4,459,742 | | | | | |
CMS 10 Year One Look Cap, 10 Year USD Swap Rate (Strike Rate 6.62%, Expiration 05/02/19) | | | 877,192,983 | | | | 3,464,685 | | | | | |
| | | | | | | | | | | | |
Total Call Options Purchased | | | | | | | 20,750,470 | | | | 1.01% | |
| | | | | | | | | | | | |
Warrants Purchased | | | | | | | | | | | | |
United States | | | | | | | | | | | | |
Global Opportunistic (0.00% of Partners’ Capital) | | | | | | | | | | | | |
Bally Total Fitness Holdings Corp. Warrants Exp. Sep. 2014, Strike Price $20.00 | | | 4 | | | | — | | | | | |
| | | | | | | | | | | | |
Total Warrants Purchased | | | | | | | — | | | | 0.00% | |
| | | | | | | | | | | | |
Total Derivative Contracts—Assets (Cost $24,991,550) | | | | | | | 20,750,470 | | | | 1.01% | |
| | | | | | | | | | | | |
Total Investments (Cost $1,871,877,137) | | | | | | $ | 2,092,148,713 | | | | 101.36% | |
| | | | | | | | | | | | |
The Master Fund’s total outstanding capital commitments to Investment Funds as of December 31, 2013 were $304,586,740. For certain Investment Funds for which the Master Fund has a capital commitment, the Master Fund may be allocated its pro-rata share of expenses prior to having to fund a capital call for such expenses.
All Investment Funds and securities are non-income producing unless noted otherwise.
Refer to Note 5, Investments in Portfolio Securities, for information regarding the liquidity of the Master Fund’s investments.
| (1) | Affiliated investments (See Note 5c) |
| (2) | Income producing investment |
| (3) | Affiliated investments for which ownership exceeds 25% of Partners’ Capital |
See accompanying notes to financial statements.
34
THE ENDOWMENT MASTER FUND, L.P.
(A Limited Partnership)
Schedule of Investments, continued
December 31, 2013
Futures Contracts Purchased:
| | | | | | | | | | | | | | |
Description | | Expiration
Date | | Number of
Contracts | | | Notional
Amount at
Value | | | Unrealized
Appreciation
(Depreciation) | |
10 Year U.S. Treasury Note | | March 2014 | | | 326 | | | $ | 40,113,281 | | | $ | (896,615 | ) |
CAC40 10 Euro | | January 2014 | | | 443 | | | | 26,194,502 | | | | 1,013,886 | |
E-Mini S&P 500 | | March 2014 | | | 2,067 | | | | 190,277,685 | | | | 3,963,453 | |
Euro BUXL 30-Year Bond | | March 2014 | | | 241 | | | | 40,451,772 | | | | (315,883 | ) |
FTSE/MIB Index | | March 2014 | | | 198 | | | | 25,908,922 | | | | 959,365 | |
German Stock Index | | March 2014 | | | 84 | | | | 27,747,813 | | | | 1,158,724 | |
IBEX 35 Index | | January 2014 | | | 194 | | | | 26,337,950 | | | | 1,195,668 | |
Tokyo Price Index | | March 2014 | | | 212 | | | | 26,225,662 | | | | 914,995 | |
| | | | | | | | | | | | | | |
| | | | | | | | $ | 403,257,587 | | | $ | 7,993,593 | |
| | | | | | | | | | | | | | |
Total Return Swap Agreements:
| | | | | | | | | | | | | | | | |
Underlying Instrument | | Counterparty | | | Maturity
Date | | | Notional
Amount at
Value | | | Unrealized
Gain
(Loss) | |
Long Position: | | | | | | | | | | | | | | | | |
KOSPI 200 Index | | | Goldman Sachs | | | | 3/13/2014 | | | $ | 25,427,075 | | | $ | 268,006 | |
Credit Default Swap Agreements—Sell Protection:(a)
| | | | | | | | | | | | | | | | | | | | | | | | | | | | |
Underlying Instrument | | Fixed
Deal
Receive
Rate | | | Maturity
Date | | | Implied
Credit
Spread at
December 31
2013(b) | | | Notional
Amount(c) | | | Value(d) | | | Upfront
Premiums
Paid
(Received) | | | Unrealized
Gain
(Loss) | |
CDX Emerging Markets Index Swap Agreement with Goldman Sachs International; Series 19 | | | 5.00 | % | | | 6/20/18 | | | | 2.88 | % | | $ | 4,542,884 | | | $ | 405,619 | | | $ | 456,560 | | | $ | (50,941 | ) |
CDX Emerging Markets Index Swap Agreement with Goldman Sachs International; Series 20 | | | 5.00 | % | | | 12/20/18 | | | | 2.75 | % | | | 10,580,449 | | | | 1,090,915 | | | | 1,052,755 | | | | 38,160 | |
CDX iTraxx Europe Crossover Index Swap Agreement with Goldman Sachs International; Series 20 | | | 5.00 | % | | | 12/20/18 | | | | 2.87 | % | | | 15,083,787 | | | | 1,439,396 | | | | 660,482 | | | | 778,914 | |
CDX North America High Yield Index Swap Agreement with Goldman Sachs International; Series 21 | | | 5.00 | % | | | 12/20/18 | | | | 3.08 | % | | | 15,123,333 | | | | 1,312,049 | | | | 737,262 | | | | 574,787 | |
| | | | | | | | | | | | | | | | | | | | | | | | | | | | |
| | | | | | | | | | | | | | | | | | $ | 4,247,979 | | | $ | 2,907,059 | | | $ | 1,340,920 | |
| | | | | | | | | | | | | | | | | | | | | | | | | | | | |
See accompanying notes to financial statements.
35
THE ENDOWMENT MASTER FUND, L.P.
(A Limited Partnership)
Schedule of Investments, continued
December 31, 2013
| (a) | When a credit event occurs as defined under the terms of the swap agreement, the Master Fund as a seller of credit protection will either (i) pay to the buyer of protection an amount equal to the par value of the defaulted reference entity and take delivery of the reference entity or (ii) pay a net amount equal to the par value of the defaulted reference entity less its recovery value. |
| (b) | Implied credit spread, represented in absolute terms, utilized in determining the market value of the credit default swap agreement as of period end, serves as an indicator of the current status of the payment/performance risk and represents the likelihood or risk of default for the credit derivative. The implied credit spread of a referenced entity reflects the cost of buying/selling protection and may include upfront payments required to be made to enter into the agreement. Generally, wider credit spreads represent a perceived deterioration of the reference entity’s credit soundness and a greater likelihood or risk of default or other credit event occurring as defined under the terms of the swap agreement. |
| (c) | The notional amount represents the maximum potential payment amount the Master Fund could be required to make as a seller of credit protection if a credit event occurs, as defined under the terms of the swap agreement. |
| (d) | Value includes upfront payments paid (received) and unrealized gain (loss). |
See accompanying notes to financial statements.
36
THE ENDOWMENT MASTER FUND, L.P.
(A Limited Partnership)
Statement of Operations
Year Ended December 31, 2013
| | | | |
Investment income: | | | | |
Dividend income | | $ | 10,727,115 | |
Interest income | | | 1,697,803 | |
Dividend income from affiliated investments | | | 4,951,830 | |
Interest income from affiliated investments | | | 204,821 | |
| | | | |
Total investment income | | | 17,581,569 | |
| | | | |
Expenses: | | | | |
Investment Management Fees | | | 28,677,960 | |
Administration fees | | | 1,645,176 | |
Professional fees | | | 1,203,891 | |
Custodian fees | | | 229,395 | |
Line of credit commitment fees | | | 450,940 | |
Directors fees | | | 480,000 | |
Interest expense | | | 450,210 | |
Offshore withholding tax expense | | | 4,012,275 | |
Other expenses | | | 886,503 | |
| | | | |
Total expenses | | | 38,036,350 | |
| | | | |
Net investment loss | | | (20,454,781 | ) |
| | | | |
Net realized and unrealized gain (loss): | | | | |
Net realized gain from investments and foreign currency translations | | | 199,189,193 | |
Net realized loss from futures contracts | | | (30,196,456 | ) |
Net realized loss from swap contracts | | | (59,469,633 | ) |
Net realized loss from forward foreign currency exchange contracts | | | (8,860,029 | ) |
Net realized gain from redemptions in-kind | | | 170,632 | |
Net realized gain from affiliated investments | | | 19,603,727 | |
Change in unrealized appreciation/depreciation | | | 22,813,375 | |
| | | | |
Net realized and unrealized gain | | | 143,250,809 | |
| | | | |
Net increase in partners’ capital resulting from operations | | $ | 122,796,028 | |
| | | | |
See accompanying notes to financial statements.
37
THE ENDOWMENT MASTER FUND, L.P.
(A Limited Partnership)
Statements of Changes in Partners’ Capital
Years Ended December 31, 2012 and December 31, 2013
| | | | |
Partners’ capital at December 31, 2011 | | $ | 4,301,278,858 | |
Contributions | | | 132,053,507 | |
Withdrawals | | | (1,459,231,885 | ) |
Net increase in partners’ capital resulting from operations: | | | | |
Net investment loss | | | (30,336,972 | ) |
Net realized gain from investments and foreign currency translations | | | 236,860,829 | |
Net realized gain from purchased option contracts | | | 1,896,642 | |
Net realized loss from futures contracts | | | (21,473,556 | ) |
Net realized loss from redemptions in-kind | | | (1,112,455 | ) |
Net realized gain from affiliated investments | | | 56,413,884 | |
Change in unrealized appreciation/depreciation | | | (144,614,669 | ) |
| | | | |
Net increase in partners’ capital resulting from operations | | | 97,633,703 | |
| | | | |
Partners’ capital at December 31, 2012 | | | 3,071,734,183 | |
| | | | |
Contributions | | | 468,913 | |
Withdrawals | | | (1,130,957,698 | ) |
Net increase in partners’ capital resulting from operations: | | | | |
Net investment loss | | | (20,454,781 | ) |
Net realized gain from investments and foreign currency translations | | | 199,189,193 | |
Net realized loss from futures contracts | | | (30,196,456 | ) |
Net realized loss from swap contracts | | | (59,469,633 | ) |
Net realized loss from forward foreign currency exchange contracts | | | (8,860,029 | ) |
Net realized gain from redemptions in-kind | | | 170,632 | |
Net realized gain from affiliated investments | | | 19,603,727 | |
Change in unrealized appreciation/depreciation | | | 22,813,375 | |
| | | | |
Net increase in partners’ capital resulting from operations | | | 122,796,028 | |
| | | | |
Partners’ capital at December 31, 2013 | | $ | 2,064,041,426 | |
| | | | |
See accompanying notes to financial statements.
38
THE ENDOWMENT MASTER FUND, L.P.
(A Limited Partnership)
Statement of Cash Flows
Year Ended December 31, 2013
| | | | |
Cash flows from operating activities: | | | | |
Net increase in partners’ capital resulting from operations | | $ | 122,796,028 | |
Adjustments to reconcile net increase in partners’ capital resulting from operations to net cash provided by operating activities: | | | | |
Purchases of investments | | | (2,040,454,592 | ) |
Proceeds from disposition of investments | | | 3,178,476,789 | |
Premiums paid on credit default swap agreements | | | (2,907,059 | ) |
Net realized gain from investments | | | (199,811,166 | ) |
Net realized gain from redemptions in-kind | | | (170,632 | ) |
Net realized gain from affiliated investments | | | (19,603,727 | ) |
Change in unrealized appreciation/depreciation from investments | | | (38,218 | ) |
Change in unrealized appreciation/depreciation from swap agreements | | | (1,608,926 | ) |
Change in operating assets and liabilities: | | | | |
Deposits with brokers for futures contracts | | | 26,790,490 | |
Deposits with brokers for swap agreements | | | (15,534,304 | ) |
Interest and dividends receivable | | | 30,285 | |
Dividends receivable from affiliated investments | | | 78,786 | |
Receivable from investments sold | | | 69,534,999 | |
Receivable from affiliated investments sold | | | (10,203,711 | ) |
Prepaids and other assets | | | (276,185 | ) |
Investment Management Fees payable | | | (1,401,055 | ) |
Offshore withholding tax payable | | | (2,999,311 | ) |
Administration fees payable | | | (45,989 | ) |
Payable to Adviser | | | 75,048 | |
Payable to Directors | | | 28,375 | |
Accounts payable and accrued expenses | | | (580,931 | ) |
| | | | |
Net cash provided by operating activities | | | 1,102,174,994 | |
| | | | |
Cash flows from financing activities: | | | | |
Contributions | | | 468,913 | |
Withdrawals | | | (692,589,280 | ) |
| | | | |
Net cash used in financing activities | | | (692,120,367 | ) |
| | | | |
Net change in cash and cash equivalents | | | 410,054,627 | |
Cash and cash equivalents at beginning of year | | | 59,376,734 | |
| | | | |
Cash and cash equivalents at end of year | | $ | 469,431,361 | |
| | | | |
Supplemental schedule of cash activity: | | | | |
Cash paid for offshore withholding taxes | | $ | 7,011,586 | |
Cash paid for interest | | | 445,812 | |
Supplemental schedule of noncash activity: | | | | |
Redemptions in-kind (Cost $880,810) | | $ | 1,051,442 | |
See accompanying notes to financial statements.
39
THE ENDOWMENT MASTER FUND, L.P.
(A Limited Partnership)
Notes to Financial Statements
December 31, 2013
(1) ORGANIZATION
The Endowment Master Fund, L.P. (the “Master Fund”) a Delaware limited partnership, commenced operations on April 1, 2003. The Master Fund operated as an unregistered investment vehicle until March 10, 2004, at which time it registered as a non-diversified, closed-end management investment company under the Investment Company Act of 1940, as amended (the “1940 Act”). The Master Fund is the master fund in a master-feeder structure in which there are currently nine feeder funds.
The Master Fund’s investment objective is to preserve capital and to generate consistent long-term appreciation and returns across a market cycle (which is estimated to be five to seven years). The Master Fund is primarily a “fund of funds” which pursues its investment objective by investing its assets in a variety of investment vehicles including, but not limited to, limited partnerships, limited liability companies, offshore corporations and other foreign investment vehicles (collectively, the “Investment Funds”), registered investment companies (including exchange-traded funds) and direct investments in marketable securities and derivative instruments. The Investment Funds are managed by a carefully selected group of investment managers, identified by the Adviser, as hereinafter defined. The various styles and strategies employed by the Investment Funds and supplemented by the Master Fund’s direct investments, serve to achieve a portfolio that is broadly allocated.
The Endowment Fund GP, L.P., a Delaware limited partnership, serves as the general partner of the Master Fund (the “General Partner”). To the fullest extent permitted by applicable law, the General Partner has irrevocably delegated to a board of directors (the “Board” and each member a “Director”) its rights and powers to monitor and oversee the business affairs of the Master Fund, including the complete and exclusive authority to oversee and establish policies regarding the management, conduct, and operation of the Master Fund’s business. A majority of the members of the Board are independent of the General Partner and its management. To the extent permitted by applicable law, the Board may delegate any of its rights, powers and authority to, among others, the officers of the Master Fund, the Adviser, as hereinafter defined, or any committee of the Board.
The Board is authorized to engage an investment adviser, and pursuant to an investment management agreement, (the “Investment Management Agreement”), it has selected Endowment Advisers, L.P. (the “Adviser”), to manage the Master Fund’s portfolio and operations. The Adviser is a Delaware limited partnership that is registered as an investment adviser under the Investment Advisers Act of 1940, as amended. Under the Investment Management Agreement, the Adviser is responsible for the establishment of an investment committee (the “Investment Committee”), which is responsible for developing, implementing, and supervising the Master Fund’s investment program subject to the ultimate supervision of the Board.
Under the Master Fund’s organizational documents, the Master Fund’s Directors and officers are indemnified against certain liabilities arising out of the performance of their duties to the Master Fund. In the normal course of business, the Master Fund enters into contracts with service providers, which also provide for indemnifications by the Master Fund. The Master Fund’s maximum exposure under these arrangements is unknown, as this would involve any future potential claims that may be made against the Master Fund. However, based on experience, the General Partner expects that risk of loss to be remote.
(2) SUMMARY OF SIGNIFICANT ACCOUNTING POLICIES AND PRACTICES
(a) BASIS OF ACCOUNTING
The accounting and reporting policies of the Master Fund conform with U.S. generally accepted accounting principles (“U.S. GAAP”). The accompanying financial statements reflect the financial position of the Master Fund and the results of its operations.
40
THE ENDOWMENT MASTER FUND, L.P.
(A Limited Partnership)
Notes to Financial Statements, continued
December 31, 2013
(b) CASH EQUIVALENTS
The Master Fund considers all unpledged temporary cash investments with a maturity date at the time of purchase of three months or less to be cash equivalents.
(c) INVESTMENT SECURITIES TRANSACTIONS
The Master Fund records investment transactions on a trade-date basis.
Investments that are held by the Master Fund, including those that have been sold short, are marked to fair value at the date of the financial statements, and the corresponding change in unrealized appreciation/depreciation is included in the Statement of Operations.
Dividend income is recorded on the ex-dividend date. Other investment fund distributions are recorded based on the detail provided with the distribution notice, as applicable. Realized gains or losses on the disposition of investments are accounted for based on the first in first out method.
(d) INVESTMENT VALUATION
The valuation of the Master Fund’s investments is determined as of the close of business at the end of each reporting period, generally monthly. The valuation of the Master Fund’s investments is calculated by Citi Fund Services Ohio, Inc., the Master Fund’s independent administrator (the “Administrator”).
The Board has formed a valuation committee (the “Board Valuation Committee”) that is responsible for overseeing the Master Fund’s valuation policies, making recommendations to the Board on valuation-related matters, and overseeing implementation by the Adviser of such valuation policies.
The Board has authorized the Adviser to establish a valuation committee of the Adviser (the “Adviser Valuation Committee”). The function of the Adviser Valuation Committee, subject to the oversight of the Board Valuation Committee and the Board, is generally to review valuation methodologies, valuation determinations, and any information provided to the Adviser Valuation Committee by the Adviser or the Administrator.
The Master Fund is not able to obtain complete underlying investment holding details on each of the Investment Funds in order to determine if the Master Fund’s proportional, aggregated, indirect share of any investments held by the Investment Funds exceeds 5% of net assets of the Master Fund as of December 31, 2013.
Investments currently held by the Master Fund are valued as follows:
| | • | | INVESTMENT FUNDS—Investments in Investment Funds are carried at fair value, using the net asset value (the “NAV”) as a practical expedient, as provided to the Administrator by the investment managers of such Investment Funds or the administrators of such Investment Funds. These Investment Funds value their underlying investments in accordance with policies established by such Investment Funds. Prior to investing in any Investment Fund, the Adviser Valuation Committee, as part of the due diligence process, conducts a review of the valuation methodologies employed by the Investment Fund to determine whether such methods are appropriate for the asset types. All of the Master Fund’s valuations utilize financial information supplied by each Investment Fund and are net of management and estimated performance incentive fees or allocations payable to the Investment Funds’ managers |
41
THE ENDOWMENT MASTER FUND, L.P.
(A Limited Partnership)
Notes to Financial Statements, continued
December 31, 2013
| | pursuant to the Investment Funds’ agreements. Generally, Investment Funds in which the Master Fund invests will use market value when available, and otherwise will use principles of fair value applied in good faith. The Adviser Valuation Committee will consider whether it is appropriate, in light of the relevant circumstances, to value shares at NAV as reported by an Investment Fund for valuation purposes, or whether to adjust such reported value to reflect an adjusted fair value. Because of the inherent uncertainty of valuation, fair value may differ significantly from the value that would have been used had readily available markets for the investments in Investment Funds existed. The Master Fund’s investments in Investment Funds are subject to the terms and conditions of the respective operating agreements and offering memoranda of such Investment Funds. Investment Funds are typically categorized as Level 2 or 3 in the fair value hierarchy based upon liquidity. |
| | • | | SECURITIES LISTED ON A SECURITIES EXCHANGE OR OVER-THE-COUNTER EXCHANGES—In general, the Master Fund values these securities at their last sales price on the exchange or over-the-counter market on the valuation date. If the security is listed on more than one exchange, the Master Fund uses the price from the exchange that it considers to be the principal exchange on which the security is traded. If there have been no sales for that day on the exchange where the security is principally traded, then the price of the security will be valued at the mean between the closing “bid” and “ask” prices on the valuation date. In these situations, valuations are typically categorized as Level 1 in the fair value hierarchy. Securities traded on a foreign securities exchange will generally be valued at their closing prices on the exchange where such securities are primarily traded, and translated into U.S. dollars at the current exchange rate. If an event occurred between the close of the foreign exchange and the valuation date of the Master Fund’s NAV that would materially affect the value of the security and the NAV of the Master Fund, the value of such security and the NAV of the Master Fund will be adjusted to reflect the change in the estimated value of the security. Such fair valued securities are typically categorized as Level 2 in the fair value hierarchy, based upon the inputs used to value the securities. |
| | • | | DERIVATIVES—Exchange traded futures contracts are valued using quoted final settlement prices from the national exchange on which they are principally traded and are typically categorized as Level 1 in the fair value hierarchy. If no such price is reported by such exchange on the valuation date, the Adviser Valuation Committee will determine the fair value in good faith using information that is available at such time. Such fair valued investments are typically categorized as Level 2 or Level 3 in the fair value hierarchy, based upon the inputs used to value the investments. |
Options that are listed on a securities exchange are generally valued at the closing “bid” and “ask” prices for options held long and short, respectively on the valuation date and are typically categorized as Level 1 in the fair value hierarchy. If no such bid or ask price is reported, the positions are valued at the last sales price on the valuation date. If no such sales price is reported by such exchange on the valuation date, the Adviser Valuation Committee in conjunction with the Administrator will determine the fair value of such investments in good faith using information that is available at such time. Such fair valued options are typically categorized as Level 2 or Level 3 in the fair value hierarchy, based upon the inputs used to value the investments.
Non exchange-traded derivatives, such as swap agreements, are valued based on procedures approved by the Board and are typically categorized as Level 2 in the fair value hierarchy. Credit default swaps and total return swaps are generally fair valued using evaluated quotes provided by an independent pricing service. If a quotation is not available from the independent pricing service, the price is obtained from a broker (typically the counterparty to the swap agreement) on the valuation date.
42
THE ENDOWMENT MASTER FUND, L.P.
(A Limited Partnership)
Notes to Financial Statements, continued
December 31, 2013
Forward foreign currency exchange contracts are valued at the current day’s interpolated foreign exchange rate, which is calculated using the current day’s spot rate and the 30 day forward rate, or the 30 to 720 day forward rates converted to U.S. dollars at the exchange rate of such currencies on the valuation date. Such valuations are provided by a pricing service approved by the Board, and are typically categorized as Level 2 in the fair value hierarchy.
| | • | | OTHER—Investments in open-end registered investment companies (“RICs”) that do not trade on an exchange are valued at the end of day NAV per share and are categorized as Level 1 in the fair value hierarchy. Where no value is readily available from a RIC or other security, or where a value supplied by a RIC is deemed not to be indicative of the RICs value, the Adviser Valuation Committee and/or the Board Valuation Committee, in consultation with the Administrator or the Adviser, will determine, in good faith, the fair value of the RIC or other security. Such fair valued investments are typically categorized as Level 1 or Level 2 in the fair value hierarchy, based upon the inputs used to value the investments. |
Fixed-income securities are valued according to prices as furnished by an independent pricing service or broker/dealer quotes and are typically categorized as Level 2 in the fair value hierarchy. Fixed-income securities maturing within a relatively short time frame may be valued at amortized cost, which approximates fair value, and are typically categorized as Level 2 in the fair value hierarchy.
| | • | | SECURITIES NOT ACTIVELY TRADED—The value of securities, derivatives or synthetic securities that are not actively traded on an exchange shall be determined by obtaining quotes from brokers that normally deal in such securities or by an unaffiliated pricing service that may use actual trade data or procedures using market indices, matrices, yield curves, specific trading characteristics of certain groups of securities, pricing models or a combination of these procedures pursuant to the fair valuation procedures approved by the Board. In each of these situations, valuations are typically categorized as Level 2 or Level 3 in the fair value hierarchy, based upon the inputs used to value the investments. |
(e) FOREIGN CURRENCY
The accounting records of the Master Fund are maintained in U.S. dollars. Foreign currency amounts and investments denominated in a foreign currency, if any, are translated into U.S. dollar amounts at current exchange rates on the valuation date. Purchases and sales of investments denominated in foreign currencies are translated into U.S. dollar amounts at the exchange rate on the respective dates of such transactions.
(f) DERIVATIVE INSTRUMENTS
All open derivative positions at period-end are presented in the Master Fund’s Schedules of Investments. In addition to the derivatives held by the Master Fund, the Investment Funds may have directly engaged in derivative transactions during the period. The following is a description of the derivative instruments the Master Fund utilizes as part of its investment strategy, including the primary underlying risk exposures related to each instrument type.
OPTIONS CONTRACTS—The Master Fund invests in options contracts to speculate on the price movements of a financial instrument or for use as an economic hedge against certain positions held in the Master Fund’s portfolio. Options contracts purchased give the Master Fund the right, but not the obligation, to buy or sell the underlying instrument for a specified price upon exercise at any time during the option period. Options contracts written obligate the Master Fund to buy or sell the underlying instrument for a specified price upon
43
THE ENDOWMENT MASTER FUND, L.P.
(A Limited Partnership)
Notes to Financial Statements, continued
December 31, 2013
exercise at any time during the option period. When the Master Fund writes an options contract, an amount equal to the premium received by the Master Fund is recorded as a liability and is subsequently adjusted to the current fair value of the option contract written.
FORWARD FOREIGN CURRENCY EXCHANGE CONTRACTS—The Master Fund enters into forward foreign currency exchange contracts in connection with its investment objective in order to gain more or less exposure to foreign currencies. The forward foreign currency exchange contracts are adjusted by the daily exchange rate of the underlying currency and any gains or losses are recorded for financial statement purposes as unrealized gains or losses until the contract settlement date. The Master Fund could be exposed to risks if the counterparties to the contracts are unable to meet the terms of their contracts and from unanticipated movements in the value of a foreign currency relative to the U.S. dollar. The Master Fund remains subject to credit risk with respect to the amount it expects to receive from counterparties. However, the Master Fund has sought to mitigate these risks by generally requiring the posting of collateral at prearranged exposure levels to cover its exposure to the counterparty.
FUTURES CONTRACTS—The Master Fund invests in futures contracts as part of its strategy to manage exposure to interest rate, equity and market price movements, and commodity prices. A futures contract represents a commitment for the future purchase or sale of an asset at a specified price on a specified date. Upon entering into a futures contract, the Master Fund is required to pledge to the broker an amount of cash and/or other assets equal to a certain percentage of the contract amount (initial margin deposit). Subsequent payments, known as “variation margin,” are made or received by the Master Fund, depending on fluctuations in the value of the underlying asset. The underlying assets are not physically delivered. The Master Fund recognizes a gain or loss equal to the variation margin. Should market conditions move unexpectedly, the Master Fund may not achieve the anticipated benefits of the futures contracts and may realize a loss. The use of futures transactions involves, to varying degrees, elements of market risk (generally equity price risk related to stock index or equity futures contracts, interest rate risk related to bond futures contracts, and commodity price risk related to commodity futures contracts) and exposure to loss. The face or contract amount reflects the extent of the total exposure the Master Fund has in the particular classes of instruments. Among other risks, the use of futures contracts may cause the Master Fund to have imperfect correlation due to differences between movements in the price of the futures contracts and the market value of the underlying securities and the possibility of an illiquid market for a futures contract. With futures contracts, there is minimal counterparty risk to the Master Fund since the futures contracts are exchange-traded and the exchange’s clearinghouse, as the counterparty to all exchange-traded futures, guarantees the futures against default.
SWAP AGREEMENTS—The Master Fund invests in swap agreements, primarily credit default and total return swap agreements, as a part of its hedging strategy to manage credit and market risks.
A credit default swap agreement gives one party (the buyer) the right to recoup the economic value of a decline in the value of debt securities of the reference issuer if a credit event (a downgrade, bankruptcy or default) occurs. This value is obtained by delivering a debt security of the reference issuer to the party in return for a previously agreed upon payment from the other party (frequently, the par value of the debt security) or receipt of a net amount equal to the par value of the defaulted reference entity less its recovery value. The Master Fund is usually a net seller of credit default swap agreements.
The Master Fund as a seller of a credit default swap agreement would have the right to pay the par (or other agreed-upon) value of a referenced debt obligation to the counterparty in the event of a default or other credit
44
THE ENDOWMENT MASTER FUND, L.P.
(A Limited Partnership)
Notes to Financial Statements, continued
December 31, 2013
event by the reference issuer with respect to its debt obligations. In return, the Master Fund would receive from the counterparty a periodic stream of payments over the term of the agreement provided that no event of default or other credit event has occurred. If no default or other credit event occurs, the Master Fund would keep the stream of payments and would have no further obligations to the counterparty. As a seller, the Master Fund is subject to investment exposure on the notional amount of the swap agreement.
A total return swap agreement is a bilateral financial contract agreement where one party (the payer) agrees to pay the other (the receiver) the total return on a specified asset or index in exchange for a fixed or floating rate of return. A total return swap agreement allows the receiver or payer to derive the economic benefit of owning or having short exposure to an asset without owning or shorting the underlying asset directly. The receiver is entitled to the amount, if any, by which the notional amount of the total return swap agreement would have increased in value had it been invested in the particular instruments, plus an amount equal to any dividends or interest that would have been received on those instruments. In return, the payer is entitled to an amount equal to a fixed or floating rate of interest (e.g., a LIBOR based rate) on the notional amount of the swap agreement plus the amount, if any, by which the notional amount would have decreased in value had it been invested in such instruments, less any dividends or interest. The amounts to which each party is entitled are normally netted against each other, at periodic settlement dates, resulting in a single amount that is either due to or from each party.
An interest rate swap involves the exchange of commitments to pay and receive interest based on a notional amount and is subject to interest rate risk exposure. If the other party to an interest rate swap defaults, the Master Fund’s risk of loss consists of the net amount of interest payments that the Master Fund is contractually entitled to receive.
Swap agreements do not involve the physical delivery of assets, thereby limiting the risk of loss to the Master Fund to the net amount of payments it is contractually obligated to make. The use of swap agreements involves, to varying degrees, elements of market risk, equity risk and counterparty risk. The Master Fund remains subject to credit risk with respect to the net amount expected to be received from the other party. The Master Fund considers the creditworthiness of each counterparty to a swap agreement in evaluating potential credit risk, and will not enter into any swap agreement unless the Adviser believes the counterparty to the transaction is creditworthy, or unless the swap agreement is centrally cleared. With uncleared swap agreements, the Master Fund bears the risk of loss of the amount expected to be received under the swap agreement if the counterparty fails to perform. The counterparty risk for cleared swap agreements is generally lower than for uncleared over-the-counter swap agreements as the clearing organization becomes substituted for each counterparty and, in effect, guarantees the parties’ performance under the contract as each party to a trade looks only to a clearing house for performance of financial obligations. However, there can be no assurance that the clearing house, or its members, will satisfy its obligations to the Master Fund. However, the Master Fund seeks to minimize this risk by generally requiring collateral, in the form of cash, to be held in a broker segregated account for swap agreements. The use of swaps is a highly specialized activity that involves investment techniques and risks different from those associated with ordinary securities transactions.
During the year ended December 31, 2013, the Master Fund’s direct investments in derivatives consisted of the purchase and sale of call options contracts, the purchase and sale of futures contracts, the purchase and sale of forward foreign currency exchange contracts and the purchase and sale of total return, interest rate and credit default swap agreements. Investment Funds in which the Master Fund invests may also purchase and sell derivative instruments and other financial instruments.
45
THE ENDOWMENT MASTER FUND, L.P.
(A Limited Partnership)
Notes to Financial Statements, continued
December 31, 2013
The following is a summary of the fair value of derivative instruments held directly by the Master Fund as of December 31, 2013. These derivatives are presented in the Schedule of Investments.
| | | | | | | | | | | | | | | | | | | | |
| | | Assets | | | Liabilities | |
| | | Investments
in Derivative
Contracts at
Fair Value | | | Unrealized
Appreciation on
Futures
Contracts | | | Unrealized
Gain on
Swap
Agreements | | | Unrealized
Depreciation on
Futures
Contracts | | | Unrealized
Loss on
Swap
Agreements | |
Equity Risk Exposure: | | | | | | | | | | | | | | | | | | | | |
Futures Contracts* | | $ | — | | | $ | 9,206,091 | | | $ | — | | | $ | — | | | $ | — | |
Total Return Swap Agreements | | | — | | | | — | | | | 268,006 | | | | — | | | | — | |
| | | | | |
Commodity Risk Exposure: | | | | | | | | | | | | | | | | | | | | |
Futures Contracts* | | | — | | | | — | | | | — | | | | 1,212,498 | | | | — | |
| | | | | |
Interest Rate Risk Exposure: | | | | | | | | | | | | | | | | | | | | |
Call Options Purchased | | | 20,750,470 | | | | — | | | | — | | | | — | | | | — | |
| | | | | |
Credit Risk Exposure: | | | | | | | | | | | | | | | | | | | | |
Credit Default Swap Agreements | | | — | | | | — | | | | 1,391,861 | | | | — | | | | 50,941 | |
| * | Includes cumulative appreciation/depreciation on futures contracts. |
The following is a summary of the effect of derivative instruments on the Statements of Operations for the year ended December 31, 2013:
| | | | | | | | |
| | | Realized
Gain
(Loss) from
Derivatives | | | Change in
Unrealized
Appreciation/
Depreciation
from
Derivatives | |
Equity Risk Exposure: | | | | | | | | |
Futures Contracts | | $ | 78,950,173 | | | $ | 10,276,474 | |
Total Return Swap Agreements | | | (4,415,071 | ) | | | 268,006 | |
| | |
Commodity Risk Exposure: | | | | | | | | |
Futures Contracts | | | (58,144,975 | ) | | | 4,488,134 | |
| | |
Interest Rate Risk Exposure: | | | | | | | | |
Futures Contracts | | | (51,001,654 | ) | | | 6,723,012 | |
Interest Rate Swap Agreements | | | (63,750,306 | ) | | | — | |
Call Options Purchased | | | — | | | | 8,758,398 | |
| | |
Credit Risk Exposure: | | | | | | | | |
Credit Default Swap Agreements | | | 8,695,744 | | | | 1,340,920 | |
| | |
Foreign Exchange Rate Exposure: | | | | | | | | |
Forward Foreign Currency Exchange Contracts | | | (8,860,029 | ) | | | — | |
Effective January 1, 2013 the Master Fund adopted Accounting Standards Update (“ASU”) No. 2011-11 “Disclosures about Offsetting Assets and Liabilities” (“ASU 2011-11”), which was subsequently clarified by ASU No. 2013-01 “Clarifying the Scope of Disclosures about Offsetting Assets and Liabilities”
46
THE ENDOWMENT MASTER FUND, L.P.
(A Limited Partnership)
Notes to Financial Statements, continued
December 31, 2013
(“ASU 2013-01”). ASU 2013-01 requires an entity to disclose information about offsetting and related arrangements to enable users of that entity’s financial statements to understand the effect of the arrangements on its financial position.
As described above, the Master Fund utilized derivative instruments to achieve its investment objective during the year ended December 31, 2013. The Master Fund may enter into International Swaps and Derivatives Association, Inc. Master Agreements (“ISDA Master Agreement”) or similar agreements with its derivative contract counterparties whereby the Master Fund may, under certain circumstances, offset with the counterparty certain derivative financial instruments’ payables and/or receivables with collateral held and/or posted and create one single net payment. Under the ISDA Master Agreements in place at December 31, 2013, the Master Funds is subject to master netting agreements that allow for amounts owed between the Master Fund and its counterparty to be netted. The party that has the larger payable pays the excess of the larger amount over the smaller amount to the other party. The master netting agreements do not apply to amounts owed to or from different counterparties. At December 31, 2013, the Master Fund had one ISDA Master Agreement in place with Goldman Sachs for which master netting agreements (“MNA”) apply only to amounts owed in the same currency and in respect of the same transaction.
The following table provides additional disclosures regarding the derivative assets net of amounts available for offset under a MNA and net of the collateral received as of December 31, 2013:
| | | | | | | | | | | | | | | | | | | | |
| | | Gross Amounts of
Recognized Assets | | | Gross Amounts
Available for Offset | | | Net Amounts
of Assets^ | | | Cash Collateral
Received | | | Net Amount | |
Swap Agreement | | $ | 1,659,867 | | | $ | (50,941 | ) | | $ | 1,608,926 | | | $ | — | | | $ | 1,608,926 | |
| ^ | Amounts for swap agreements are reflected in the Statement of Assets, Liabilities and Partners’ Capital as Net Unrealized Gain on Swap Agreements. |
The following table provides additional disclosures regarding the offsetting of derivative liabilities net of amounts available for offset under a MNA and net of collateral pledged as of December 31, 2013:
| | | | | | | | | | | | | | | | | | | | |
| | | Gross Amounts of
Recognized Liabilities | | | Gross Amounts
Available for Offset | | | Net Amounts
of Liabilities* | | | Cash Collateral
Pledged | | | Net Amount | |
Swap Agreement | | $ | 50,941 | | | $ | (50,941 | ) | | $ | — | | | $ | — | | | $ | — | |
| * | Amounts for swap agreements are reflected in the Statement of Assets, Liabilities and Partners’ Capital as Net Unrealized Loss on Swap Agreements. |
The average monthly fair value of options purchased was $17,422,241 for the year ended December 31, 2013. The following is a summary of the average monthly notional value of futures contracts purchased and sold, swap agreements and forward foreign currency exchange contracts in the Master Fund for the year ended December 31, 2013, as well as the notional amount of futures contracts, swap agreements and forward foreign currency exchange contracts outstanding as of December 31, 2013:
| | | | | | | | |
| | | Average Monthly
Notional Value | | | Notional Value
Outstanding at
December 31, 2013 | |
Futures contracts sold | | $ | 360,433,572 | | | $ | — | |
Futures contracts purchased | | | 1,632,364,266 | | | | 403,257,587 | |
Credit default swap agreements | | | 296,042,477 | | | | 45,330,453 | |
Total return swap agreements | | | 42,768,654 | | | | 25,427,075 | |
Forward foreign currency exchange contracts | | | 122,908,028 | | | | — | |
47
THE ENDOWMENT MASTER FUND, L.P.
(A Limited Partnership)
Notes to Financial Statements, continued
December 31, 2013
(g) CFTC REGULATION
On August 13, 2013, the Commodity Futures Trading Commission (“CFTC”) adopted rules to harmonize conflicting Securities and Exchange Commission (the “SEC”) and CFTC disclosure, reporting and recordkeeping requirements for registered investment companies that do not meet an exemption from the definition of commodity pool. The harmonization rules provide that the CFTC will accept the SEC’s disclosure, reporting, and recordkeeping regime as substituted compliance for substantially all of the otherwise applicable CFTC regulations as long as such investment companies meet the applicable SEC requirements.
Previously, in November 2012, the CFTC issued relief for fund of fund operators, including advisers to registered investment companies, that may otherwise be required to register with the CFTC as commodity pool operators but do not have access to information from the investment funds in which they are invested in order to determine whether such registration is required. This relief delayed the registration date for such operators until the later of June 30, 2013 or six months from the date the CFTC issues revised guidance on the application of certain thresholds with respect to investments in commodities held by funds of funds. In December 2012, the Master Fund filed as required with the CFTC in order to claim this no-action relief, which was effective upon receipt of the filing. Although the CFTC now has adopted harmonization rules applicable to investment companies that are deemed to be commodity pools, the CFTC has not yet issued guidance on how funds of funds are to determine whether they are deemed to be commodity pools. As of December 31, 2013, the Master Fund is not considered a commodity pool and continues to rely on the fund of fund no-action relief.
(h) INVESTMENT INCOME
For investments in securities, dividend income is recorded on the ex-dividend date, net of withholding taxes. Interest income is recorded as earned on the accrual basis and includes amortization of premiums or accretion of discounts.
(i) FUND EXPENSES
Unless otherwise voluntarily or contractually assumed by the Adviser or another party, the Master Fund bears all expenses incurred in its business including, but not limited to, the following: all costs and expenses related to investment transactions and positions for the Master Fund’s account; legal fees; accounting, auditing and tax preparation fees; recordkeeping and custodial fees; costs of computing the Master Fund’s net asset value; fees for data and software providers; research expenses; costs of insurance; registration expenses; offering costs; expenses of meetings of partners; directors fees; all costs with respect to communications to partners; transfer taxes; offshore withholding taxes and taxes withheld on non-U.S. dividends; interest and commitment fees on loans and debit balances; and other types of expenses as may be approved from time to time by the Board. Offering costs are amortized over a twelve-month period or less from the date they are incurred.
(j) INCOME TAXES
The Master Fund is organized and operates as a limited partnership and is not subject to income taxes as a separate entity. Such taxes are the responsibility of the individual partners. Accordingly, no provision for income taxes has been made in the Master Fund’s financial statements. Investments in foreign securities may result in foreign taxes being withheld by the issuer of such securities. For U.S. offshore withholding tax, the Master Fund may serve as withholding agent for its offshore feeder funds.
48
THE ENDOWMENT MASTER FUND, L.P.
(A Limited Partnership)
Notes to Financial Statements, continued
December 31, 2013
For the current open tax year and for all major jurisdictions, management of the Master Fund has evaluated the tax positions taken or expected to be taken in the course of preparing the Master Fund’s tax returns to determine whether the tax positions will “more-likely-than-not” be sustained by the Master Fund upon challenge by the applicable tax authority. Tax positions not deemed to meet the more-likely-than-not threshold and that would result in a tax benefit or expense to the Master Fund would be recorded as a tax benefit or expense in the current period. For the year ended December 31, 2013, the Master Fund did not recognize any amounts for unrecognized tax benefit/expense. A reconciliation of unrecognized tax benefit/expense is not provided herein, as the beginning and ending amounts of unrecognized tax benefit/expense are zero, with no interim additions, reductions or settlements. Tax positions taken in tax years which remain open under the statute of limitations (generally three years for federal income tax purposes) are subject to examination by federal and state tax jurisdictions.
(k) USE OF ESTIMATES
The preparation of the financial statements in accordance with U.S. GAAP requires management to make estimates and assumptions relating to the reported amounts of assets and liabilities and the disclosure of contingent assets and liabilities at the date of the financial statements and the reported amounts of income and expenses during the reporting period. Actual results could differ from those estimates and such differences may be significant.
(3) FAIR VALUE MEASUREMENTS
The Master Fund defines fair value as the price that would be received to sell an asset or paid to transfer a liability in an orderly transaction between market participants at the measurement date under current market conditions.
The inputs used to determine the fair value of the Master Fund’s investments are summarized in the three broad levels listed below:
| | • | | Level 1—unadjusted quoted prices in active markets for identical investments |
| | • | | Level 2—investments with other significant observable inputs or investments that can be fully redeemed at the NAV in the “near term” |
| | • | | Level 3—investments with significant unobservable inputs (which may include the Master Fund’s own assumptions in determining the fair value of investments) or investments that cannot be fully redeemed at the NAV in the “near term”; these are investments that generally have one or more of the following characteristics: gated redemptions, suspended redemptions, or lock-up periods greater than quarterly |
Changes in valuation techniques may result in transfers in or out of an assigned level within the disclosure hierarchy. The inputs or methodology used for valuing investments are not necessarily an indication of the risk associated with investing in those investments.
The Master Fund establishes valuation processes and procedures to ensure that the valuation techniques for investments categorized within Level 3 of the fair value hierarchy are fair, consistent, and appropriate. The Adviser is responsible for developing the Master Fund’s written valuation processes and procedures, conducting periodic reviews of the valuation policies, and evaluating the overall fairness and consistent application of the valuation policies. The Board Valuation Committee has authorized the Adviser to oversee the implementation of the Board approved valuation procedures by the Administrator. The Adviser Valuation Committee is comprised of various Master Fund personnel, which include members from the Master Fund’s portfolio management and
49
THE ENDOWMENT MASTER FUND, L.P.
(A Limited Partnership)
Notes to Financial Statements, continued
December 31, 2013
operations groups. The Adviser Valuation Committee meets monthly or as needed, to determine the valuations of the Master Fund’s Level 3 investments. The valuations are required to be supported by market data, industry accepted third party valuation models, or other methods the Adviser Valuation Committee deems to be appropriate, including the use of internal proprietary valuation models.
The following is a summary categorization as of December 31, 2013, of the Master Fund’s investments based on the level of inputs utilized in determining the value of such investments:
| | | | | | | | | | | | | | | | | | | | | | | | | | | | |
| | | LEVEL 1 | | | LEVEL 2 | | | LEVEL 3 | | | Total | |
| | | Investments | | | Other
Financial
Instruments^ | | | Investments | | | Other
Financial
Instruments^ | | | Investments | | | Investments | | | Other
Financial
Instruments^ | |
Investment Funds | | | | | | | | | | | | | | | | | | | | | | | | | | | | |
Limited Partnerships, Exempted Limited Partnerships and Limited Liability Companies | | | | | | | | | | | | | | | | | | | | | | | | | | | | |
Arbitrage Strategies | | $ | — | | | $ | — | | | $ | 73,704,930 | | | $ | — | | | $ | 163,547,560 | | | $ | 237,252,490 | | | $ | — | |
Domestic Equity | | | — | | | | — | | | | — | | | | — | | | | 27,732,522 | | | | 27,732,522 | | | | — | |
Energy | | | — | | | | — | | | | 39,049,655 | | | | — | | | | 197,503,596 | | | | 236,553,251 | | | | — | |
Enhanced Fixed Income | | | — | | | | — | | | | 52,582,883 | | | | — | | | | 92,523,536 | | | | 145,106,419 | | | | — | |
Global Opportunistic | | | — | | | | — | | | | 64,681,880 | | | | — | | | | 147,439,451 | | | | 212,121,331 | | | | — | |
International Equity | | | — | | | | — | | | | — | | | | — | | | | 42,671,381 | | | | 42,671,381 | | | | — | |
Natural Resources | | | — | | | | — | | | | — | | | | — | | | | 30,181,208 | | | | 30,181,208 | | | | — | |
Private Equity | | | — | | | | — | | | | — | | | | — | | | | 727,754,609 | | | | 727,754,609 | | | | — | |
Real Estate | | | — | | | | — | | | | — | | | | — | | | | 182,601,579 | | | | 182,601,579 | | | | — | |
Passive Foreign Investment Companies | | | | | | | | | | | | | | | | | | | | | | | | | | | | |
Arbitrage Strategies | | | — | | | | — | | | | — | | | | — | | | | 22,127,566 | | | | 22,127,566 | | | | — | |
International Equity | | | — | | | | — | | | | — | | | | — | | | | 615,629 | | | | 615,629 | | | | — | |
Natural Resources | | | — | | | | — | | | | — | | | | — | | | | 4,000,974 | | | | 4,000,974 | | | | — | |
Private Corporations | | | | | | | | | | | | | | | | | | | | | | | | | | | | |
Real Estate | | | — | | | | — | | | | — | | | | — | | | | 13,216,244 | | | | 13,216,244 | | | | — | |
Investment Securities | | | | | | | | | | | | | | | | | | | | | | | | | | | | |
Common Stocks | | | | | | | | | | | | | | | | | | | | | | | | | | | | |
Domestic Equity | | | 61,908 | | | | — | | | | — | | | | — | | | | — | | | | 61,908 | | | | — | |
Technology | | | 129,024 | | | | — | | | | — | | | | — | | | | — | | | | 129,024 | | | | — | |
Registered Investment Companies | | | | | | | | | | | | | | | | | | | | | | | | | | | | |
Money Market Funds | | | 189,272,108 | | | | — | | | | — | | | | — | | | | — | | | | 189,272,108 | | | | — | |
Derivative Instruments | | | | | | | | | | | | | | | | | | | | | | | | | | | | |
Call Options Purchased | | | — | | | | — | | | | 20,750,470 | | | | — | | | | — | | | | 20,750,470 | | | | — | |
Warrants Purchased | | | | | | | | | | | | | | | | | | | | | | | | | | | | |
Global Opportunistic | | | — | | | | — | | | | — | | | | — | | | | — | | | | — | | | | — | |
Futures Contracts | | | — | | | | 7,993,593 | | | | — | | | | — | | | | — | | | | — | | | | 7,993,593 | |
Total Return Swap Agreements | | | — | | | | — | | | | — | | | | 268,006 | | | | — | | | | — | | | | 268,006 | |
Credit Default Swap Agreements | | | — | | | | — | | | | — | | | | 1,340,920 | | | | — | | | | — | | | | 1,340,920 | |
| | | | | | | | | | | | | | | | | | | | | | | | | | | | |
Total | | $ | 189,463,040 | | | $ | 7,993,593 | | | $ | 250,769,818 | | | $ | 1,608,926 | | | $ | 1,651,915,855 | | | $ | 2,092,148,713 | | | $ | 9,602,519 | |
| | | | | | | | | | | | | | | | | | | | | | | | | | | | |
| ^ | Other financial instruments include any derivative instruments not reflected in the Schedule of Investments as Investments in Securities, such as futures contracts and swap agreements. These financial instruments are generally recorded in the financial statements at the unrealized gain or loss on the financial instrument. |
50
THE ENDOWMENT MASTER FUND, L.P.
(A Limited Partnership)
Notes to Financial Statements, continued
December 31, 2013
The categorization of investments amongst Levels 1 through 3 does not reflect the fact that many of the underlying investments held by the Investment Funds included in Level 3, if owned directly by the Master Fund, may be classified as Level 1 or Level 2 investments.
The following table is a summary of quantitative information about significant unobservable valuation inputs approved by the Adviser Valuation Committee for Level 3 fair value measurements for investments held as of December 31, 2013:
| | | | | | | | | | |
| | | Fair Value as of
December 31, 2013 | | | Valuation Technique | | Liquidity of
Investments | | Adjustments
To NAV** |
Investments | | | | | | | | | | |
Limited Partnerships, Exempted Limited Partnerships and Limited Liability Companies | | | | | | | | | | |
Arbitrage Strategies | | $ | 163,547,560 | | | NAV as Practical Expedient* | | Quarterly or Greater | | None |
Domestic Equity | | | 27,732,522 | | | NAV as Practical Expedient* | | Quarterly or Greater | | None |
Energy | | | 197,503,596 | | | NAV as Practical Expedient* | | Non-redeemable | | None |
Enhanced Fixed Income | | | 92,523,536 | | | NAV as Practical Expedient* | | Quarterly or Greater | | None |
Global Opportunistic | | | 147,439,451 | | | NAV as Practical Expedient* | | Monthly or Greater | | None |
International Equity | | | 42,671,381 | | | NAV as Practical Expedient* | | Quarterly or Greater | | None |
Natural Resources | | | 30,181,208 | | | NAV as Practical Expedient* | | Non-redeemable | | None |
Private Equity | | | 727,754,609 | | | NAV as Practical Expedient* | | Non-redeemable | | None |
Real Estate | | | 182,601,579 | | | NAV as Practical Expedient* | | Non-redeemable | | None |
Passive Foreign Investment Companies | | | | | | | | | | |
Arbitrage Strategies | | | 22,127,566 | | | NAV as Practical Expedient* | | Non-redeemable | | None |
International Equity | | | 615,629 | | | NAV as Practical Expedient* | | Non-redeemable | | None |
Natural Resources | | | 4,000,974 | | | NAV as Practical Expedient* | | Non-redeemable | | None |
Private Corporations | | | | | | | | | | |
Real Estate | | | 13,216,244 | | | NAV as Practical Expedient* | | Non-redeemable | | None |
| | | | | | | | | | |
Total Investments | | $ | 1,651,915,855 | | | | | | | |
| | | | | | | | | | |
| * | Unobservable valuation input. |
| ** | Amounts represent adjustments, if any, made to NAV provided by the investment manager or administrator of the Investment Funds. Adjustments to the practical expedient NAV may be made under certain circumstances including, but not limited to, the following: the practical expedient NAV received is not as of the Master Fund’s measurement date; it is probable that the Investment Fund will be sold at a value significantly different than the reported expedient NAV; it is determined by the Board Valuation Committee that the Investment Fund is not being valued at fair value by the Investment Fund manager. |
The Master Fund discloses transfers between levels based on valuations at the end of the reporting period. Transfers that occurred between Levels 2 and 3 during the year ended December 31, 2013, based on levels
51
THE ENDOWMENT MASTER FUND, L.P.
(A Limited Partnership)
Notes to Financial Statements, continued
December 31, 2013
assigned to Investments on December 31, 2012, are included in the table below. The following is a reconciliation of Level 3 investments based on the inputs used to determine fair value:
| | | | | | | | | | | | | | | | | | | | | | | | | | | | | | | | |
| | | Investments | |
| | | Balance as of
December 31,
2012 | | | Redemptions
In-Kind | | | Transfers
In* | | | Gross
Purchases | | | Gross
Sales** | | | Net Realized
Gain (Loss) | | | Change in
Unrealized
Appreciation/
Depreciation | | | Balance as of
December 31,
2013 | |
Investments | | | | | | | | | | | | | | | | | | | | | | | | | | | | | | | | |
Limited Partnerships, Exempted Limited Partnerships and Limited Liability Companies | | | | | | | | | | | | | | | | | | | | | | | | | | | | | | | | |
Arbitrage Strategies | | $ | 125,266,503 | | | $ | — | | | $ | 968,383 | | | $ | 75,046,571 | | | $ | (43,106,335 | ) | | $ | 261,452 | | | $ | 5,110,986 | | | $ | 163,547,560 | |
Domestic Equity | | | 89,660,048 | | | | — | | | | — | | | | 10,175 | | | | (73,162,927 | ) | | | 6,471,196 | | | | 4,754,030 | | | | 27,732,522 | |
Energy | | | 159,143,681 | | | | — | | | | — | | | | 33,014,799 | | | | (30,521,738 | ) | | | 15,117,548 | | | | 20,749,306 | | | | 197,503,596 | |
Enhanced Fixed Income | | | 199,052,762 | | | | — | | | | 7,613,470 | | | | 10,220,979 | | | | (121,010,612 | ) | | | 27,575,689 | | | | (30,928,752 | ) | | | 92,523,536 | |
Global Opportunistic | | | 274,309,743 | | | | — | | | | 7,644,288 | | | | 155,322,404 | | | | (296,992,531 | ) | | | 75,984,386 | | | | (68,828,839 | ) | | | 147,439,451 | |
International Equity | | | 49,713,569 | | | | — | | | | 3,908,401 | | | | — | | | | (16,049,381 | ) | | | (934,554 | ) | | | 6,033,346 | | | | 42,671,381 | |
Natural Resources | | | 29,024,662 | | | | — | | | | — | | | | 3,355,101 | | | | (1,546,445 | ) | | | 626,986 | | | | (1,279,096 | ) | | | 30,181,208 | |
Private Equity | | | 681,514,504 | | | | — | | | | — | | | | 65,581,196 | | | | (134,858,933 | ) | | | 43,401,313 | | | | 72,116,529 | | | | 727,754,609 | |
Real Estate | | | 185,296,050 | | | | — | | | | — | | | | 24,674,248 | | | | (39,797,945 | ) | | | 5,230,242 | | | | 7,198,984 | | | | 182,601,579 | |
Passive Foreign Investment Companies | | | | | | | | | | | | | | | | | | | | | | | | | | | | | | | | |
Arbitrage Strategies | | | 32,253,834 | | | | — | | | | 755,517 | | | | 15,757,811 | | | | (27,834,207 | ) | | | 2,120,146 | | | | (925,535 | ) | | | 22,127,566 | |
International Equity | | | 819,194 | | | | — | | | | — | | | | — | | | | (189,968 | ) | | | 71,124 | | | | (84,721 | ) | | | 615,629 | |
Natural Resources | | | 8,910,279 | | | | — | | | | — | | | | — | | | | (4,728,401 | ) | | | 948,810 | | | | (1,129,714 | ) | | | 4,000,974 | |
Private Equity | | | 3,000,000 | | | | — | | | | — | | | | — | | | | (3,750,000 | ) | | | (6,250,000 | ) | | | 7,000,000 | | | | — | |
Private Corporations | | | | | | | | | | | | | | | | | | | | | | | | | | | | | | | | |
Real Estate | | | 19,111,732 | | | | — | | | | — | | | | 344,743 | | | | (4,446,491 | ) | | | — | | | | (1,793,740 | ) | | | 13,216,244 | |
| | | | | | | | | | | | | | | | | | | | | | | | | | | | | | | | |
Total Investments | | $ | 1,857,076,561 | | | $ | — | | | $ | 20,890,059 | | | $ | 383,328,027 | | | $ | (797,995,914 | ) | | $ | 170,624,338 | | | $ | 17,992,784 | | | $ | 1,651,915,855 | |
| | | | | | | | | | | | | | | | | | | | | | | | | | | | | | | | |
| * | Transfers from Level 2 to Level 3 in the fair value hierarchy generally relate to changes in liquidity provisions of the Investment Funds. |
| ** | Includes Return of Capital and Capital Gain Distributions. |
The net realized gain (loss) and change in unrealized appreciation/depreciation in the table above are reflected in the accompanying Statement of Operations. The change in unrealized appreciation/depreciation from Level 3 investments held at December 31, 2013 is $57,232,649.
The Master Fund is permitted to invest in alternative investments that may not have a readily determinable fair value. For an investment that does not have a readily determinable fair value, the Master Fund uses the NAV reported by the Investment Fund as a practical expedient, without further adjustment, unless it is probable that the investment will be sold at a value significantly different than the reported NAV. If the practical expedient NAV is not as of the reporting entity’s measurement date, then the NAV is adjusted to reflect any significant events that would materially affect the value of the security and the NAV of the Master Fund as of the valuation date.
Certain Investment Funds in which the Master Fund invests have limitations on liquidity which may result in limitations on redemptions including, but not limited to, early redemption fees. Other than Investment Funds that are self-liquidating, such as Private Equity and some Energy, Natural Resources and Real Estate Funds, the Investment Funds in which the Master Fund invests have withdrawal rights ranging from monthly to annually, after a notice period, usually for a period of up to two years from the date of the initial investment or an
52
THE ENDOWMENT MASTER FUND, L.P.
(A Limited Partnership)
Notes to Financial Statements, continued
December 31, 2013
additional investment. A listing of the investments held by the Master Fund and their attributes as of December 31, 2013, that may qualify for this valuation approach is shown in the table below.
| | | | | | | | | | | | | | | | | | |
| Investment Category | | Investment
Strategy | | Fair
Value
(in 000s) | | | Unfunded
Commitments
(in 000s) | | Remaining
Life* | | | Redemption
Frequency* | | Notice
Period
(in Days)* | | Redemption
Restrictions and
Terms* |
| Arbitrage Strategies(a) | | Investments in a variety of securities with the intent of profiting from relative changes in the price of a set of securities, currencies or commodities. | | $ | 259,380 | | | N/A | | | N/A | | | Quarterly | | 30-90 | | 0-2 years; up to 9% early redemption fee |
| Domestic Equity(b) | | Investments in equity securities issued by U.S. companies. | | | 27,733 | | | N/A | | | N/A | | | Quarterly | | 45-120 | | 0-3 years; up to 5% early redemption fee; possible 20% investor level gate |
| Energy (c) | | Investments in securities issued by companies in the energy sector. | | | 236,553 | | | $65,304 | |
| up to
15 years |
| | N/A | | N/A | | 0-15 years |
| Enhanced Fixed Income(d) | | Investments in non-traditional fixed income securities. | | | 145,106 | | | N/A | | | N/A | | | Quarterly | | 30-120 | | 0-3 years; up to 6% early redemption fee; possible 8% investor level gate |
| Global Opportunistic(e) | | Investments in a variety of global markets across all security types. | | | 212,121 | | | N/A | | | N/A | | | Quarterly | | 45-90 | | 0-3 years; up to 6% early redemption fee; possible 25% investor level gate |
| International Equity(f) | | Investments in equity securities issued by foreign companies. | | | 43,287 | | | N/A | | | N/A | | | Quarterly | | 60 | | 0-2 years; up to 2% early redemption fee; possible 25% investor level gate |
53
THE ENDOWMENT MASTER FUND, L.P.
(A Limited Partnership)
Notes to Financial Statements, continued
December 31, 2013
| | | | | | | | | | | | | | | | |
| Investment Category | | Investment
Strategy | | Fair
Value
(in 000s) | | | Unfunded
Commitments
(in 000s) | | Remaining
Life* | | Redemption
Frequency* | | Notice
Period
(in Days)* | | Redemption
Restrictions and
Terms* |
| Natural Resources(g) | | Investments with exposure to non-energy natural resources. | | $ | 34,182 | | | $ 6,423 | | up to
10 years | | N/A | | N/A | | 0-10 years |
| Private Equity(h) | | Investments in nonpublic companies. | | | 727,755 | | | 188,259 | | up to
10 years | | N/A | | N/A | | 0-10 years |
| Real Estate(i) | | Investments in REITs, private partnerships, and various real estate related mortgage securities. | | | 195,818 | | | 44,601 | | up to
10 years | | N/A | | N/A | | 0-10 years |
| | | | $ | 1,881,935 | | | $304,587 | | | | | | | | |
| | | | | | | | | | | | | | | | |
| * | The information summarized in the table above represents the general terms for the specified asset class. Individual Investment Funds may have terms that are more or less restrictive than those terms indicated for the asset class as a whole. In addition, most Investment Funds have the flexibility, as provided for in their constituent documents, to modify and waive such terms. |
| (a) | This category includes Investment Funds that invest using two primary Styles (Event-Driven and Relative Value). Event-Driven strategies typically will include investments in common and preferred equities and various types of debt (often based on the probability that a particular event will occur). These may include distressed or Special Situations investments (securities of companies that are experiencing difficult business situations). Relative Value strategies may include long and short positions in common and preferred equity, convertible securities, and various forms of senior and junior (typically unsecured) debt. Investments under this style may also include index options, options on futures contracts, and other derivatives. |
| (b) | This category includes Investment Funds that invest primarily in publicly-traded equity securities issued by U.S. companies. These securities will typically trade on one of the major U.S. stock exchanges. Investment Funds in this category may include long/short funds, mutual funds and exchange-traded funds. |
| (c) | This category includes Investment Funds that invest primarily in publicly-traded securities issued by companies in the energy sector, private investments in energy-related assets or companies, and futures in energy commodity markets. The Investment Funds include private funds which may hold long/ short equities, commodity trading advisers (“CTAs”) trading contracts on energy related commodities, mutual funds or exchange-traded funds, and private partnerships with private investments in their portfolios. |
| (d) | This category includes Investment Funds that invest primarily in the following sectors: secured leveraged loans, high yield bonds, distressed debt, structured credit, and global debt (typically less efficient areas of the global fixed income markets than traditional fixed income strategies). Generally these sectors may be heavily weighted to certain industries such as telecom and technology with lower credit rating ranges |
54
THE ENDOWMENT MASTER FUND, L.P.
(A Limited Partnership)
Notes to Financial Statements, continued
December 31, 2013
| | (including leveraged buyouts), may include distressed debt strategies and may include restricted securities and securities that may not be registered for which a market may not be readily available. |
| (e) | This category includes Investment Funds that invest in global markets and across all security types including equities, fixed income, derivatives, commodities, currencies, futures, and exchange-traded funds. Investment Funds in this category are typically private funds and may include global long/short equity funds, global macro funds, and CTA’s. |
| (f) | This category includes Investment Funds that invest primarily in publicly-traded equity securities issued by foreign companies or securities issued on U.S. stock exchanges that represent ownership of a foreign corporation. Investment Funds in this category may include long/ short funds, mutual funds, and exchange-traded funds. |
| (g) | This category includes Investment Funds that invest primarily in assets with exposure to non-energy natural resources, including gold and other precious metals, industrial metals, and agricultural commodities. The Investment Funds may include private funds invested in long/ short equities; CTA’s trading contracts on agricultural commodities, mutual funds and exchange-traded funds, and private partnerships with private investments in their portfolios. |
| (h) | This category includes private equity funds that invest primarily in non-publicly traded companies in need of capital. These Investment Funds may vary widely as to sector, size, stage, duration, and liquidity. Certain of these Investment Funds may also focus on the secondary market, buying interests in existing private equity funds, often at a discount. |
| (i) | This category includes Investment Funds that invest in registered investment companies or managers that invest in real estate trusts (commonly known as “REITs”) and private partnerships that make investments in income producing properties, raw land held for development or appreciation, and various types of mortgage loans and common or preferred stock whose operations involve real estate. |
(4) PARTNERS’ CAPITAL ACCOUNTS
(a) ISSUANCE OF INTERESTS
Upon receipt from an eligible investor of an initial or additional application for interests (the “Interests”), which will generally be accepted as of the first day of each month, the Master Fund will issue new Interests. The Interests have not been registered under the Securities Act, or the securities laws of any state. The Master Fund issues Interests only in private placement transactions in accordance with Regulation D or other applicable exemptions under the Securities Act. No public market exists for the Interests, and none is expected to develop. The Master Fund is not required, and does not intend, to hold annual meetings of its partners. The Interests are subject to substantial restrictions on transferability and resale and may not be transferred or resold except as permitted under the Master Fund’s limited partnership agreement. The Master Fund reserves the right to reject any applications for subscription of Interests.
(b) ALLOCATION OF PROFITS AND LOSSES
For each fiscal period, generally monthly, net profits or net losses of the Master Fund are allocated among and credited to or debited against the capital accounts of all partners as of the last day of each fiscal period in accordance with the partners’ respective capital account ownership percentage for the fiscal period. Net profits or net losses are measured as the net change in the value of the partners’ capital of the Master Fund, including any change in unrealized appreciation or depreciation of investments and income, net of expenses, and realized gains or losses during a fiscal period. Net profits or net losses are allocated after giving effect for any initial or additional applications for Interests, which generally occur at the beginning of the month, or any repurchases of Interests.
55
THE ENDOWMENT MASTER FUND, L.P.
(A Limited Partnership)
Notes to Financial Statements, continued
December 31, 2013
(c) REPURCHASE OF INTERESTS
A partner will not be eligible to have the Master Fund repurchase all or any portion of an Interest at the partner’s discretion at any time. The Adviser generally recommends to the Board that the Master Fund offer to repurchase Interests each calendar quarter, pursuant to written tenders by partners.
The Board retains the sole discretion to accept or reject the recommendation of the Adviser and to determine the amount of Interests, if any, that will be purchased in any tender offer that it does approve. In the event Interests are repurchased, there will be a substantial period of time between the date as of which partners must accept the Master Fund’s offer to repurchase their Interests and the date they can expect to receive payment for their Interests from the Master Fund.
(5) INVESTMENTS IN PORTFOLIO SECURITIES
(a) INVESTMENT ACTIVITY
As of December 31, 2013 the Master Fund held investments in Investment Funds, securities and other derivatives. The agreements related to investments in Investment Funds provide for compensation to the Investment Funds’ managers/general partners or advisers in the form of management fees of up to 3.0% annually of monthly average net assets. In addition, many Investment Funds also provide for performance incentive fees/ allocations of up to 30% of an Investment Fund’s net profits, although it is possible that such ranges may be exceeded for certain investment managers. These management fees and incentive fees are in addition to the management fees charged by the Master Fund.
For the year ended December 31, 2013, the aggregate cost of purchases and proceeds from sales of investments (excluding short-term investments) were $361,759,934 and $1,381,779,524, respectively.
The cost of the Master Fund’s underlying investments for Federal income tax purposes is adjusted for items of taxable income allocated to the Master Fund from such investments. The allocated taxable income is generally reported to the Master Fund by its underlying investments on Schedules K-1, Forms 1099 or PFIC statements, or a combination thereof.
The underlying investments generally do not provide the Master Fund with tax reporting information until well after year end, and as a result, the Master Fund is unable to calculate the year end tax cost of its investments until well after year end. The Master Fund’s book cost as of December 31, 2013, was $1,871,877,137, resulting in accumulated net unrealized appreciation of $220,271,576 consisting of $398,119,005 in gross unrealized appreciation and $177,847,429 in gross unrealized depreciation.
During the year ended December 31, 2013, certain investments were received through a transfer in-kind in connection with the redemption of certain investments. The fair value of these investments transferred in-kind, related cost and realized gain (loss) were as follows:
| | | | | | | | | | | | | | |
Investments Redeemed | | Fair Value | | | Cost | | | Realized Gain (Loss) on
Transfers In-Kind | | | Investments Received |
Passport II, L.P. | | $ | 566,761 | | | $ | 484,754 | | | $ | 82,007 | | | Passport Global Strategies III, Ltd. |
Q Funding III, L.P. | | | 378,657 | | | | 297,885 | | | | 80,772 | | | Houghton Mifflin Harcourt Co. |
Q4 Funding, L.P. | | | 106,024 | | | | 98,171 | | | | 7,853 | | | Houghton Mifflin Harcourt Co. |
| | | | | | | | | | | | | | |
| | $ | 1,051,442 | | | $ | 880,810 | | | $ | 170,632 | | | |
| | | | | | | | | | | | | | |
56
THE ENDOWMENT MASTER FUND, L.P.
(A Limited Partnership)
Notes to Financial Statements, continued
December 31, 2013
(b) INVESTMENT FUND LIQUIDITY
Certain Investment Funds in which the Master Fund invests have restrictions on liquidity which may result in limitations or restrictions on redemptions including, but not limited to, lock-ups, notice periods and early redemption fees. The Master Fund’s investments are grouped in three categories of liquidity, as determined by the Adviser. To better manage the Master Fund’s liquidity, the Adviser has also structured the portfolio’s capital into the liquidity categories listed below. The categories and percent of investments in each are as follows at December 31, 2013:
| | | | | | | | |
Liquidity Categories* | | Total Percentage of
Capital Invested
Allowed, per Category | | Percentage of
Investments,
per Category | | | Withdrawal Rights |
Category 1 Assets(a) | | 10.00%-100.00%(b) | | | 49.3 | % | | Securities and derivatives activity or Investment Funds that settle three business days after trade date (“T+3”) and that have at least quarterly withdrawal rights and not more than a one-year lock-up period remaining. |
| | | |
Category 2 Assets(a) | | 0.00%-100.00%(b) | | | 5.3 | % | | Investment Funds that allow for periodic withdrawals at the time of investment but do not meet the qualifications for Category 1 Assets due to frequency of redemptions allowed or extended lock-up periods remaining. |
| | | |
Category 3 Assets(a) | | 0.00%-25.00%(b) | | | 45.4 | %** | | Investment Funds that are self-liquidating (e.g., private equity funds), or that otherwise fail to meet the definition of Category 1 or 2 Assets. Also includes Investment Funds that only make distributions as the underlying portfolio’s assets or investments are liquidated (i.e., the investor in such Investment Funds does not have the right to request withdrawals on any specified periodic basis). |
| | | | | | | | |
| | | | | 100.0 | % | | |
| | | | | | | | |
| * | The expiration or implementation of lock-up periods on Master Fund investments in an Investment Fund could result in such investments moving from one liquidity category to another. |
| ** | If at the end of any calendar quarter the Master Fund is not in compliance with the weighting of Category 3 Assets, the Master Fund will endeavor to bring its portfolio back into compliance with these requirements, taking into consideration the best interests of all investors, and during such time will not commit any additional capital to Category 3 Assets. During such time, the Master Fund may fund existing capital commitments to Investment Funds comprising Category 3 Assets. The Master Fund’s portfolio currently is above the desired weighting in Category 3 Assets. The Master Fund is currently funding existing capital commitments to Investment Funds comprising Category 3 Assets, but is not currently committing additional capital to Category 3 Assets. |
57
THE ENDOWMENT MASTER FUND, L.P.
(A Limited Partnership)
Notes to Financial Statements, continued
December 31, 2013
| (a) | Category 1 Assets are defined as cash, money market funds, and exchange-traded securities including, but not limited to equities, bonds, notes, mutual funds, ETFs, options (including OTC), and derivatives. Investment Funds with investor-level gates, fund-level gates, redemption fees and/or penalties, sidepockets and/or special purpose vehicles housing less liquid investments may be included in this category as long as they have at least quarterly withdrawal rights with a year or less lockup remaining. |
| (b) | The Master Fund may not have less than 10% of its capital invested in cash and securities with T+3 liquidity, which are included in Category 1 Assets, or more than 25% of its capital invested in Category 3 Assets, with all remaining capital invested in Category 1 Assets or Category 2 Assets. |
(c) AFFILIATED INVESTMENT FUNDS
At December 31, 2013, the Master Fund’s investments in certain Investment Funds were deemed to be investments in affiliated issuers under the 1940 Act, primarily because the Master Fund owns 5% or more of the Investment Funds’ total net assets. The activity resulting from investments in these Investment Funds, including interest and dividend income as well as realized gains and losses, is identified in the Statement of Operations as transactions with affiliated investments. A listing of these affiliated Investment Funds (including activity during the year ended December 31, 2013) is shown below:
| | | | | | | | | | | | | | | | | | | | | | | | | | | | | | | | | | | | |
Investment Funds | | Shares
12/31/2012 | | Shares
12/31/2013 | | Fair
Value
12/31/2012 | | | Redemptions
In-Kind | | | Cost of
Purchases | | | Cost of
Sales* | | | Realized
Gain (Loss) on
Investments | | | Change in
Unrealized
Appreciation/
Depreciation | | | Fair
Value
12/31/2013 | | | Interest/
Dividend
Income | |
Advent Latin American Private Equity Fund V-F, L.P. | | | | | | $ | 6,741,293 | | | | — | | | $ | 3,150,000 | | | $ | (1,792,500 | ) | | $ | 748,763 | | | $ | (337,624 | ) | | $ | 8,509,932 | | | $ | — | |
BDCM Partners I, L.P. | | | | | | | 52,228,921 | | | | — | | | | 7,628,476 | | | | (24,203,260 | ) | | | 2,556,954 | | | | 2,319,040 | | | | 40,530,131 | | | | — | |
Blue Mountain Credit Alternatives Fund, L.P. | | | | | | | — | | | | — | | | | 75,000,000 | | | | — | | | | — | | | | 4,092,477 | | | | 79,092,477 | | | | — | |
Blueshift Energy Fund, L.P. | | | | | | | — | | | | — | | | | 30,000,000 | | | | — | | | | — | | | | 3,372,298 | | | | 33,372,298 | | | | — | |
CCM Small Cap Value Qualified Fund, L.P. | | | | | | | 15,016,101 | | | | — | | | | — | | | | (9,411,514 | ) | | | (7,763,121 | ) | | | 7,368,776 | | | | 5,210,242 | | | | — | |
Credit Distressed Blue Line Fund, L.P. | | | | | | | 23,635,066 | | | | — | | | | — | | | | — | | | | — | | | | (10,444,123 | ) | | | 13,190,943 | | | | — | |
CX Partners Fund Limited | | | | | | | 13,201,649 | | | | — | | | | 5,939,105 | | | | (911,260 | ) | | | 128,547 | | | | (94,041 | ) | | | 18,264,000 | | | | 239,891 | |
Dace Ventures I, L.P. | | | | | | | 1,633,643 | | | | — | | | | 234,064 | | | | (108,287 | ) | | | — | | | | (249,457 | ) | | | 1,509,963 | | | | — | |
Encap Energy Infrastructure TE Feeder, L.P. | | | | | | | 5,883,315 | | | | — | | | | 1,665,898 | | | | (1,936,988 | ) | | | 1,802,967 | | | | (1,692,791 | ) | | | 5,722,401 | | | | 124,290 | |
Florida Real Estate Value Fund, L.P. | | | | | | | 8,267,040 | | | | — | | | | — | | | | (3,130,287 | ) | | | 444,319 | | | | 2,568,928 | | | | 8,150,000 | | | | — | |
Fortelus Special Situations Fund, L.P. | | | | | | | 8,370,867 | | | | — | | | | — | | | | (3,370,239 | ) | | | (947,427 | ) | | | 1,041,596 | | | | 5,094,797 | | | | — | |
Garrison Opportunity Fund, LLC | | | | | | | 23,376,632 | | | | — | | | | — | | | | (5,363,809 | ) | | | (17,188 | ) | | | 2,559,226 | | | | 20,554,861 | | | | — | |
Gavea Investment Fund II A, L.P. | | | | | | | 1,569,121 | | | | — | | | | — | | | | (398,551 | ) | | | 398,551 | | | | 346,879 | | | | 1,916,000 | | | | — | |
GTIS Brazil Real Estate Fund (Brazilian Real), L.P. | | | | | | | 23,955,679 | | | | — | | | | — | | | | — | | | | — | | | | (55,679 | ) | | | 23,900,000 | | | | — | |
Halcyon European Structured Opportunities Fund, L.P. | | | | | | | 313,229 | | | | — | | | | — | | | | (116,230 | ) | | | (249,754 | ) | | | 142,135 | | | | 89,380 | | | | — | |
Harbinger Capital Partners Fund I, L.P. | | | | | | | 26,663,600 | | | | — | | | | — | | | | — | | | | — | | | | (1,422,915 | ) | | | 25,240,685 | | | | — | |
Hayman Capital Partners, L.P. | | | | | | | 57,552,275 | | | | — | | | | 23,268 | | | | — | | | | — | | | | 6,236,264 | | | | 63,811,807 | | | | 23,268 | |
HealthCor Partners Fund, L.P. | | | | | | | 8,386,656 | | | | — | | | | 150,392 | | | | (1,528,308 | ) | | | 882,934 | | | | 827,527 | | | | 8,719,201 | | | | — | |
58
THE ENDOWMENT MASTER FUND, L.P.
(A Limited Partnership)
Notes to Financial Statements, continued
December 31, 2013
| | | | | | | | | | | | | | | | | | | | | | | | | | | | | | | | | | | | | | | | |
Investment Funds | | Shares
12/31/2012 | | | Shares
12/31/2013 | | | Fair
Value
12/31/2012 | | | Redemptions
In-Kind | | | Cost of
Purchases | | | Cost of
Sales* | | | Realized
Gain (Loss) on
Investments | | | Change in
Unrealized
Appreciation/
Depreciation | | | Fair
Value
12/31/2013 | | | Interest/
Dividend
Income | |
Hillcrest Fund, L.P. | | | | | | | | | | $ | 11,037,970 | | | | — | | | $ | — | | | $ | (1,718,280 | ) | | $ | 824,825 | | | $ | 2,060,919 | | | $ | 12,205,434 | | | $ | — | |
Integral Capital Partners VIII, L.P. | | | | | | | | | | | 3,142,555 | | | | — | | | | — | | | | (413,810 | ) | | | — | | | | 143,255 | | | | 2,872,000 | | | | — | |
Intervale Capital Fund, L.P. | | | | | | | | | | | 12,192,477 | | | | — | | | | 380,404 | | | | (935,146 | ) | | | 507,930 | | | | 3,143,181 | | | | 15,288,846 | | | | 315,898 | |
Kenmont Onshore Fund, L.P. | | | | | | | | | | | 213,776 | | | | — | | | | — | | | | (182,626 | ) | | | 57,042 | | | | (69,508 | ) | | | 18,684 | | | | — | |
Kepos Alpha Fund, L.P. | | | | | | | | | | | — | | | | — | | | | 125,000,000 | | | | (35,000,000 | ) | | | (3,492,256 | ) | | | (7,848,519 | ) | | | 78,659,225 | | | | — | |
LC Fund IV, L.P. | | | | | | | | | | | 25,438,063 | | | | — | | | | 1,407,287 | | | | (467,090 | ) | | | 326,642 | | | | (1,171,260 | ) | | | 25,533,642 | | | | 298,002 | |
Magnetar Capital Fund, L.P. | | | | | | | | | | | 8,869,901 | | | | — | | | | — | | | | (3,893,552 | ) | | | 1,383,342 | | | | 1,232,277 | | | | 7,591,968 | | | | — | |
Magnetar SPV, LLC (Series L) | | | | | | | | | | | 13,008,600 | | | | — | | | | — | | | | (10,662,046 | ) | | | 683,211 | | | | (983,031 | ) | | | 2,046,734 | | | | — | |
Middle East North Africa Opportunities Fund, L.P. | | | 5,089 | | | | 5,089 | | | | 1,516,120 | | | | — | | | | — | | | | — | | | | — | | | | (200,386 | ) | | | 1,315,734 | | | | — | |
Monsoon Infrastructure & Realty Co-Investors, L.P. | | | | | | | | | | | 16,036,064 | | | | — | | | | 748,752 | | | | — | | | | — | | | | (1,790,412 | ) | | | 14,994,404 | | | | — | |
Montrica Global Opportunities Fund, L.P. | | | 33,558 | | | | 25,428 | | | | 1,709,302 | | | | — | | | | — | | | | (372,669 | ) | | | (440,277 | ) | | | (226,986 | ) | | | 669,370 | | | | — | |
Orbis Real Estate Fund I | | | | | | | | | | | 2,988,770 | | | | — | | | | 69,273 | | | | (294,675 | ) | | | — | | | | (582,723 | ) | | | 2,180,645 | | | | — | |
Passport Global Strategies III, Ltd. | | | 1,211 | | | | 2,244 | | | | 751,847 | | | | 566,761 | | | | — | | | | — | | | | — | | | | (448,535 | ) | | | 870,073 | | | | — | |
Pearlmark Mezzanine Realty Partners III, LLC | | | | | | | | | | | 16,113,000 | | | | — | | | | 1,582,279 | | | | (3,863,635 | ) | | | — | | | | 373,956 | | | | 14,205,600 | | | | 1,563,028 | |
Pennybacker II, L.P. | | | | | | | | | | | 3,726,729 | | | | — | | | | 4,898,179 | | | | (2,018,847 | ) | | | 355,399 | | | | 764,819 | | | | 7,726,279 | | | | 250,495 | |
Phoenix Real Estate Fund (T), L.P. | | | | | | | | | | | 14,003,922 | | | | — | | | | — | | | | (6,481,395 | ) | | | — | | | | (690,288 | ) | | | 6,832,239 | | | | — | |
PIPE Equity Partners, L.L.C. | | | | | | | | | | | 18,231,147 | | | | — | | | | — | | | | (4,225,724 | ) | | | (5,644,165 | ) | | | 4,050,188 | | | | 12,411,446 | | | | — | |
PIPE Select Fund, L.L.C. | | | | | | | | | | | 34,326,724 | | | | — | | | | — | | | | (3,887,722 | ) | | | 255,152 | | | | (2,811,068 | ) | | | 27,883,086 | | | | — | |
Private Equity Investment Fund IV, L.P. | | | | | | | | | | | 5,783,277 | | | | — | | | | 250,322 | | | | (700,727 | ) | | | (275,679 | ) | | | 352,038 | | | | 5,409,231 | | | | 18,595 | |
Private Equity Investment Fund V, L.P.** | | | | | | | | | | | 38,463,168 | | | | — | | | | 2,707,100 | | | | (2,511,959 | ) | | | 1,249,303 | | | | 8,067 | | | | 39,915,679 | | | | 53,342 | |
Providence MBS Fund L.P. | | | | | | | | | | | 110,686,933 | | | | — | | | | — | | | | (60,000,000 | ) | | | 16,568,567 | | | | (14,672,617 | ) | | | 52,582,883 | | | | — | |
Quantum Parallel Partners V, L.P. | | | | | | | | | | | 13,269,063 | | | | — | | | | 11,494,907 | | | | — | | | | — | | | | 4,826,664 | | | | 29,590,634 | | | | — | |
Saints Capital VI, L.P. | | | | | | | | | | | 19,331,961 | | | | — | | | | 312,543 | | | | (3,535,001 | ) | | | 2,638,257 | | | | (2,306,981 | ) | | | 16,440,779 | | | | 3,765 | |
SBC Latin America Housing US Fund, L.P. | | | | | | | | | | | 4,390,948 | | | | — | | | | 2,389,667 | | | | (266,667 | ) | | | — | | | | 1,127,924 | | | | 7,641,872 | | | | — | |
Sovereign Capital Limited Partnership III | | | | | | | | | | | 8,448,021 | | | | — | | | | 3,301,423 | | | | — | | | | — | | | | 5,674,984 | | | | 17,424,428 | | | | — | |
Tenaska Power Fund II-A, L.P. | | | | | | | | | | | 17,855,284 | | | | — | | | | 7,904,292 | | | | (3,315,025 | ) | | | 3,544 | | | | (3,764,430 | ) | | | 18,683,665 | | | | 53,433 | |
Trivest Fund IV, L.P. | | | | | | | | | | | 18,805,260 | | | | — | | | | 4,290,353 | | | | (5,976,852 | ) | | | — | | | | 2,273,922 | | | | 19,392,683 | | | | 1,046,091 | |
Trustbridge Partners III, L.P. | | | | | | | | | | | 30,761,365 | | | | — | | | | 2,484,873 | | | | (10,001,463 | ) | | | 4,857,963 | | | | 12,140,474 | | | | 40,243,212 | | | | 245,981 | |
Tuckerbrook SB Global Distressed Fund I, L.P. | | | | | | | | | | | 5,734,262 | | | | — | | | | — | | | | (1,125,000 | ) | | | — | | | | 684,325 | | | | 5,293,587 | | | | — | |
59
THE ENDOWMENT MASTER FUND, L.P.
(A Limited Partnership)
Notes to Financial Statements, continued
December 31, 2013
| | | | | | | | | | | | | | | | | | | | | | | | | | | | | | | | | | | | |
Investment Funds | | Shares
12/31/2012 | | Shares
12/31/2013 | | Fair
Value
12/31/2012 | | | Redemptions
In-Kind | | | Cost of
Purchases | | | Cost of
Sales* | | | Realized
Gain (Loss) on
Investments | | | Change in
Unrealized
Appreciation/
Depreciation | | | Fair
Value
12/31/2013 | | | Interest/
Dividend
Income | |
Tybourne Equity (U.S.) Fund | | | | | | $ | 41,247,237 | | | | — | | | $ | — | | | $ | (14,689,559 | ) | | $ | 1,759,382 | | | $ | 3,886,739 | | | $ | 32,203,799 | | | $ | — | |
Velite Energy, L.P. | | | | | | | 52,142,437 | | | | — | | | | — | | | | — | | | | — | | | | (13,092,782 | ) | | | 39,049,655 | | | | — | |
Westview Capital Partners II, L.P. | | | | | | | 20,785,579 | | | | — | | | | 3,943,595 | | | | — | | | | — | | | | 2,406,423 | | | | 27,135,597 | | | | 920,572 | |
| | | | | | | | | | | | | | | | | | | | | | | | | | | | | | | | | | | | |
| | | | | | $ | 847,806,849 | | | $ | 566,761 | | | $ | 296,956,452 | | | $ | (228,810,703 | ) | | $ | 19,603,727 | | | $ | 11,069,145 | | | $ | 947,192,231 | | | $ | 5,156,651 | |
| | | | | | | | | | | | | | | | | | | | | | | | | | | | | | | | | | | | |
| * | Sales include return of capital. |
| ** | Voting rights have been waived for this investment. |
(6) FINANCIAL INSTRUMENTS WITH OFF-BALANCE SHEET RISK
In the normal course of business, the Investment Funds in which the Master Fund invests may trade various derivative securities and other financial instruments, and may enter into various investment activities with off-balance sheet risk both as an investor and as a principal. The Master Fund’s risk of loss in these Investment Funds is limited to the value of its investment in such Investment Funds. In addition, by investing directly in derivative instruments, the Master Fund is subject to credit risk with respect to the net amount expected to be received from the other party. The Master Fund may be negatively impacted if the other party defaults or fails to perform its obligations under such agreement.
(7) DUE FROM BROKERS
The Master Fund conducts business with brokers for its investment activities. The clearing and depository operations for the investment activities are performed pursuant to agreements with the brokers. The Master Fund is subject to credit risk to the extent any broker with whom the Master Fund conducts business is unable to deliver cash balances or securities, or clear security transactions on the Master Fund’s behalf. The Master Fund monitors the financial condition of the brokers with which the Master Fund conducts business and believes the likelihood of loss under the aforementioned circumstances is remote.
(8) ADMINISTRATION AGREEMENT
In consideration for administrative, accounting, and recordkeeping services, the Master Fund pays the Administrator a monthly administration fee based on the month-end partners’ capital of the Master Fund. The Master Fund is charged, on an annual basis, 6 basis points on partners’ capital of up to $2 billion, 5 basis points on partners’ capital between the amounts of $2 billion and $5 billion, 2 basis points on partners’ capital between the amounts of $5 billion and $15 billion, and 1.25 basis points for amounts over $15 billion. The administration fee is payable monthly in arrears. The Administrator also provides the Master Fund with legal, compliance, transfer agency, and other investor related services at an additional cost.
The administration fees are paid out of the Master Fund’s assets, which decreases the net profits or increases the net losses of the partners in the Master Fund. As of December 31, 2013, the Master Fund had $2,064,041,426 in partners’ capital. The total administration fee incurred for the year ended December 31, 2013, was $1,645,176.
60
THE ENDOWMENT MASTER FUND, L.P.
(A Limited Partnership)
Notes to Financial Statements, continued
December 31, 2013
(9) RELATED PARTY TRANSACTIONS
(a) INVESTMENT MANAGEMENT FEE
In consideration of the advisory and other services provided by the Adviser to the Master Fund pursuant to the Investment Management Agreement, the Master Fund pays the Adviser an investment management fee (the “Investment Management Fee”), equal to 1.00% on an annualized basis of the Master Fund’s partners’ capital calculated based on the Master Fund’s partners’ capital at the end of each month, payable quarterly in arrears. The Investment Management Fee decreases the net profits or increases the net losses of the Master Fund that are credited to or debited against the capital accounts of its partners. For the year ended December 31, 2013, $28,677,960 was incurred for Investment Management Fees.
(b) PLACEMENT AGENTS
The Master Fund may engage one or more placement agents (each, a “Placement Agent”) to solicit investments in the Master Fund. Salient Capital, L.P., an affiliate of the Adviser, is a broker-dealer who has been engaged by the Master Fund to serve as a Placement Agent. A Placement Agent may engage one or more sub-placement agents. The Adviser or its affiliates may pay a fee out of their own resources to Placement Agents and sub-placement agents. As of December 31, 2013, the two largest non-affiliated sub-placement agents service approximately 80.57% of the feeder funds assets which are invested in the Master Fund. To the extent that substantial numbers of investors have a relationship with a particular sub-placement agent, such sub-placement agent may have the ability to influence investor behavior, which may affect the Master Fund.
(10) CREDIT FACILITY
As a fundamental policy, the Master Fund may borrow up to, but not more than, 25% of the partners’ capital of the Master Fund (at the time such borrowings were made and after taking into account the investment and/or deployment of such proceeds) for the purpose of making investments, funding redemptions and for other working capital and general Master Fund purposes. For purposes of the Master Fund’s investment restrictions and certain investment limitations under the 1940 Act, including for example, the Master Fund’s leverage limitations, the Master Fund will not “look through” Investment Funds in which the Master Fund invests. Investment Funds may also use leverage, whether through borrowings, futures, or other derivative products and are not subject to the Master Fund’s investment restrictions. However, such borrowings by Investment Funds are without recourse to the Master Fund and the Master Fund’s risk of loss is limited to its investment in such Investment Funds, other than for some Investment Funds in which the Master Fund has made a capital commitment, for which the risk of loss is limited to the Master Fund’s total capital commitment. For some Investment Funds in which the Master Fund has made a capital commitment that will be funded over a period of time, such as private equity, private energy and real estate funds, the Master Fund, in certain instances, may commit to fund more than its initial capital commitment. The rights of any lenders to the Master Fund to receive payments of interest or repayments of principal will be senior to those of the partners, and the terms of any borrowings may contain provisions that limit certain activities of the Master Fund.
The Master Fund maintained a line of credit agreement (the “Agreement”) with Deutsche Bank Aktiengesellschaft which provided a $500,000,000 credit facility, with available borrowing capacity subject to collateral allocation ratios as defined in the Agreement. Borrowings under the Agreement were secured by the Master Fund’s investments. The Agreement provided for a commitment fee of 0.65% plus interest accruing on any borrowed amounts at the three-month London Interbank Offered Rate (LIBOR) plus a spread of 1.10% per
61
THE ENDOWMENT MASTER FUND, L.P.
(A Limited Partnership)
Notes to Financial Statements, continued
December 31, 2013
annum, payable quarterly in arrears. At the discretion of the Master Fund, the Agreement with Deutsche Bank was terminated in May 2013. There were no borrowings during the year ended December 31, 2013.
(11) FINANCIAL HIGHLIGHTS
| | | | | | | | | | | | | | | | | | | | |
| | | Year ended
December 31,
2013 | | | Year ended
December 31,
2012 | | | Year ended
December 31,
2011 | | | Year ended
December 31,
2010 | | | Year ended
December 31,
2009 | |
Net investment loss to average partners’ capital1 | | | (0.74)% | | | | (0.81)% | | | | (0.75)% | | | | (0.84)% | | | | (0.95)% | |
Expenses to average partners��� capital1,2 | | | 1.37% | | | | 1.49% | | | | 1.27% | | | | 1.19% | | | | 1.20% | |
Portfolio turnover | | | 16.95% | | | | 20.88% | | | | 26.72% | | | | 26.71% | | | | 27.40% | |
Total return3 | | | 4.67% | | | | 2.50% | | | | (3.18)% | | | | 9.52% | | | | 14.96% | |
Partners’ capital, end of year (000s) | | $ | 2,064,041 | | | $ | 3,071,734 | | | $ | 4,301,279 | | | $ | 5,355,785 | | | $ | 5,212,611 | |
An investor’s return (and operating ratios) may vary from those reflected based on the timing of capital transactions.
| 1 | Ratios are calculated by dividing the indicated amount by average partners’ capital measured at the end of each month during the year. |
| 2 | Expense ratios do not include expenses of acquired funds that are paid indirectly by the Master Fund as a result of its ownership in the underlying funds. Expenses include U.S. offshore withholding tax, which is only allocable to investors investing through the offshore feeder funds. |
| 3 | Calculated as geometrically linked monthly returns for each month in the year. |
(12) SUBSEQUENT EVENTS
On February 18, 2014, the Board approved a tender offer (the “Offer”) to be made for up to 100% of the Master Fund’s outstanding Interests with a valuation date of March 31, 2014, with a potential extension of the valuation date to June 30, 2014 depending on certain factors as set forth in the Offer. Unlike the Master Fund’s prior offers to repurchase Interests, with respect to which the Master Fund paid repurchase proceeds in cash, proceeds for Interests tendered and accepted pursuant to the Offer will not be paid in cash. Proceeds for tendered Interests will be paid in-kind with tendering partners receiving 100% of their repurchase proceeds in shares of limited partnership interests (the “Shares”) in PMF Fund, L.P. (the “PMF Fund”), a newly-formed, closed-end, non-diversified, investment company registered under the 1940 Act that invests substantially all of its assets in The Endowment PMF Master Fund, L.P. (the “PMF Master Fund” and together with the PMF Fund, the “PMF Funds”), which also is a newly-formed, closed-end, non-diversified, registered investment company under the 1940 Act.
The Offer commenced on February 20, 2014 and, unless extended, will expire on March 19, 2014. The estimated net asset value will be calculated for the purpose of the Offer as of March 31, 2014 or, if the valuation date is extended, June 30, 2014. The Offer is subject to certain conditions and is being made simultaneously with a cash tender offer by the PMF Fund in which partners tendering Interests pursuant to the Offer, and therefore becoming holders of Shares of the PMF Fund, will have the opportunity to participate (the “PMF Funds Offer”). The PMF Funds Offer is a cash repurchase offer pursuant to which Shares will be repurchased at a discount to
62
THE ENDOWMENT MASTER FUND, L.P.
(A Limited Partnership)
Notes to Financial Statements, continued
December 31, 2013
their net asset value, assuming all of the conditions of the PMF Funds Offer are satisfied. The Offer is not contingent upon the completion of the PMF Funds Offer. Additional information regarding the Offer and the PMF Funds Offer is available free of charge on the SEC’s website at www.sec.gov.
Subsequent to locking the net asset value of the portfolio on January 23, 2014, certain underlying investment fund managers provided updated valuation information. Due to the impact of such information on the Master Fund’s net asset value, management made the decision to adjust the estimated fair value of such investment funds to reflect such updated information in the accompanying financial statements, which resulted in an increase to the value of the Master Fund’s net asset value in the amount of $42,725,467.
63
THE ENDOWMENT MASTER FUND, L.P.
(A Limited Partnership)
Supplemental Information
December 31, 2013
(Unaudited)
Directors and Officers
The Master Fund’s operations are managed under the direction and oversight of the Board. Each Director serves for an indefinite term or until he or she reaches mandatory retirement, if any, as established by the Board. The Board appoints the officers of the Master Fund who are responsible for the Master Fund’s day-to-day business decisions based on policies set by the Board. The officers serve at the pleasure of the Board.
Compensation for Directors
The Master Fund, The Endowment Registered Fund, L.P., The Endowment Institutional Fund, L.P, The Endowment TEI Fund, L.P. and The Endowment Institutional TEI Fund W, L.P., together pay each of the Directors who is not an “interested person” of the Adviser, as defined in the 1940 Act (the “Independent Directors”) an annual retainer of $38,000, paid quarterly, an annual Board meeting fee of $15,000, a fee of $1,250 per informal Board meeting, a fee of $1,250 per telephonic Board meeting, an annual fee of $4,000 for membership on each committee, an annual fee of $5,000 for the audit committee chairman and $2,500 for each other committee chair, each of which is paid quarterly, and an annual fee of $7,500, paid quarterly, to the Lead Independent Director. There are currently six Independent Directors. In the interest of retaining Independent Directors of the highest quality, the Board intends to periodically review such compensation and may modify it as the Board deems appropriate.
Interested Directors
| | | | | | | | |
| Name, Address and Age | | Position(s)
Held | | Principal
Occupation(s) During
the Past 5 Years | | Number of
Portfolios
in Fund
Complex
Overseen
by Director | | Other
Directorships
Held by
Director |
John A. Blaisdell(1) Age: 53 Address: c/o The Endowment Fund
4265 San Felipe, 8th Floor, Houston, TX 77027 | | Director,
Co-
Principal
Executive
Officer
(Since
2004) | | Member, Investment Committee of the Adviser, since 2002; Managing Director of Salient, since 2002. | | 5 | | Salient Alternative Strategies Funds (investment companies) (two funds) since 2010; Salient MF Trust (investment company) (five funds) since 2012; Salient Midstream & MLP Fund (investment company) since 2012; Salient MLP & Energy Infrastructure Fund (investment company) since 2011. |
64
THE ENDOWMENT MASTER FUND, L.P.
(A Limited Partnership)
Supplemental Information, continued
December 31, 2013
(Unaudited)
| | | | | | | | |
| Name, Address and Age | | Position(s)
Held | | Principal
Occupation(s) During
the Past 5 Years | | Number of
Portfolios
in Fund
Complex
Overseen
by Director | | Other
Directorships
Held by
Director |
Andrew Linbeck(1) Age: 49 Address: c/o The Endowment Fund
4265 San Felipe, 8th Floor, Houston, TX 77027 | | Director,
Co-
Principal
Executive
Officer
(Since
2004) | | Member, Investment Committee of the Adviser, since 2002; Managing Director of Salient, since 2002. | | 5 | | Salient Alternative Strategies Funds (investment companies) (two funds) 2010-2012; Salient Midstream & MLP Fund (investment company) since 2012; Salient MLP & Energy Infrastructure Fund (investment company) since 2011. |
A. Haag Sherman(1) Age: 48 Address: c/o The Endowment Fund
4265 San Felipe, 8th Floor, Houston, TX 77027 | | Director
(Since
2004) | | Member, Investment Committee of the Adviser, 2002-2011; Managing Director of Salient, 2002-2011. | | 5 | | Salient Alternative Strategies Funds (investment companies) (two funds) 2010-2012; Salient Midstream & MLP Fund (investment company) since 2012; Salient MLP & Energy Infrastructure Fund (investment company) since 2011; Plains Capital Corporation, since 2009; Blue Dolphin Energy Company, since 2012. |
| (1) | This person’s status as an “interested” director arises from his affiliation with Salient Partners, L.P., which itself is an affiliate of the Master Fund, The Endowment Registered Fund, L.P., The Endowment Institutional Fund, L.P., The Endowment TEI Fund, L.P., The Endowment Institutional TEI Fund W, L.P., and the Adviser. |
65
THE ENDOWMENT MASTER FUND, L.P.
(A Limited Partnership)
Supplemental Information, continued
December 31, 2013
(Unaudited)
Independent Directors
| | | | | | | | |
| Name, Address and Age | | Position(s)
Held | | Principal
Occupation(s) During
the Past 5 Years | | Number of
Portfolios
in Fund
Complex
Overseen
by Director | | Other Directorships Held by
Director |
Karin B. Bonding, CFA Age: 74 Address: c/o The Endowment Fund
4265 San Felipe, 8th Floor, Houston, TX 77027 | | Director
(Since
2010) | | Lecturer, University of Virginia, since 1996; President of Capital Markets Institute, Inc. (fee-only financial planner and investment advisor) since 1996. | | 5 | | Salient Alternative Strategies
Funds (investment
companies) (two funds)
since 2010; Salient MF Trust
(investment company) (five
funds) since 2012; Salient
Midstream & MLP Fund
(investment company) since
2012; Salient MLP &
Energy Infrastructure Fund
(investment company) since
2011; Brandes Investment
Trust (investment
companies)(four funds) since
2006; Credit Suisse
Alternative Capital Funds
(investment companies) (six
funds) 2005-2010. |
Jonathan P. Carroll Age: 52 Address: c/o The Endowment Fund
4265 San Felipe, 8th Floor, Houston, TX 77027 | | Director
(Since
2004) | | President of Lazarus Financial LLC (holding company) since 2006; private investor for the past six years. | | 5 | | Salient Alternative Strategies
Funds (investment
companies) (two funds)
since 2010; Salient MF Trust
(investment company) (five
funds) since 2012; Salient
Midstream & MLP Fund
(investment company) since
2012; Salient MLP &
Energy Infrastructure Fund
(investment company) since
2011. |
66
THE ENDOWMENT MASTER FUND, L.P.
(A Limited Partnership)
Supplemental Information, continued
December 31, 2013
(Unaudited)
| | | | | | | | |
| Name, Address and Age | | Position(s)
Held | | Principal
Occupation(s) During
the Past 5 Years | | Number of
Portfolios
in Fund
Complex
Overseen
by Director | | Other Directorships Held by
Director |
Dr. Bernard Harris Age: 57 Address: c/o The Endowment Fund
4265 San Felipe, 8th Floor, Houston, TX 77027 | | Director
(Since
2009) | | Chief Executive Officer and Managing Partner, Vesalius Ventures, Inc (venture investing), since 2002; President of The Space Agency (marketing), since 1999; President of The Harris Foundation (non-profit), since 1998; clinical scientist, flight surgeon and astronaut for NASA, 1986 to 1996. | | 5 | | Salient Alternative Strategies
Funds (investment
companies) (two funds)
since 2010; Salient MF Trust
(investment company) (five
funds) since 2012; Salient
Midstream & MLP Fund
(investment company) since
2012; Salient MLP &
Energy Infrastructure Fund
(investment company) since
2011; U.S. Physical
Therapy, Inc., since 2005;
Sterling Bancshares, Inc.,
since 2007; RMD Networks,
Inc., since 2006; Monebo
Technologies Inc., since
2009; AG Technologies,
since 2009; The Harris
Foundation, Inc., since 1998;
Houston Technology Center,
since 2004; Greater Houston
Community Foundation,
2004-2009; Communities in
Schools, since 2007; ZOO
SCORE “Counselors to
America’s Small Business”,
since 2009; American
Telemedicine Association,
since 2007; Houston Angel
Network, since 2004;
BioHouston, since 2006; The
National Math and Science
Initiative, and Space
Agency, since 2008. |
67
THE ENDOWMENT MASTER FUND, L.P.
(A Limited Partnership)
Supplemental Information, continued
December 31, 2013
(Unaudited)
| | | | | | | | |
| Name, Address and Age | | Position(s)
Held | | Principal
Occupation(s) During
the Past 5 Years | | Number of
Portfolios
in Fund
Complex
Overseen
by Director | | Other Directorships Held by
Director |
Richard C. Johnson Age: 76 Address: c/o The Endowment Fund
4265 San Felipe, 8th Floor, Houston, TX 77027 | | Director
(Since
2004) | | Senior Counsel (retired) for Baker Botts LLP (law firm) since 2002; Managing Partner, Baker Botts, 1998 to 2002; practiced law at Baker Botts, 1966 to 2002 (1972 to 2002 as a partner). | | 5 | | Salient Alternative Strategies
Funds (investment
companies) (two funds)
since 2010; Salient MF Trust
(investment company) (five
funds) since 2012; Salient
Midstream & MLP Fund
(investment company) since
2012; Salient MLP &
Energy Infrastructure Fund
(investment company) since
2011. |
G. Edward Powell Age: 77 Address: c/o The Endowment Fund 4265 San Felipe, 8th Floor,
Houston, TX 77027 | | Director
(Since
2004) | | Principal of Mills & Stowell (private equity) since 2002. Principal, Innovation Growth Partners (consulting), since 2002; Consultant to emerging and middle market businesses, 1994-2002; Managing Partner, PriceWaterhouse & Co. (Houston Office, 1982 to 1994). | | 5 | | Salient Alternative Strategies
Funds (investment
companies) (two funds)
since 2010; Salient MF Trust
(investment company) (five
funds) since 2012; Salient
Midstream & MLP Fund
(investment company) since
2012; Salient MLP &
Energy Infrastructure Fund
(investment company) since
2011; Therapy Track, LLC,
since 2009; Global Water
Technologies, Inc.; Datavox
Holdings, Inc.; Energy
Services International, Inc.,
since 2004. |
68
THE ENDOWMENT MASTER FUND, L.P.
(A Limited Partnership)
Supplemental Information, continued
December 31, 2013
(Unaudited)
| | | | | | | | |
| Name, Address and Age | | Position(s)
Held | | Principal
Occupation(s) During
the Past 5 Years | | Number of
Portfolios
in Fund
Complex
Overseen
by Director | | Other Directorships Held by
Director |
Scott E. Schwinger Age: 48 Address: c/o The Endowment Fund 4265 San Felipe, 8th Floor, Houston, TX 77027 | | Director
(Since
2004) | | President, The McNair Group (management), since 2006; Senior Vice President and Chief Financial Officer, the Houston Texans (professional football team) (1999). | | 5 | | Salient Alternative Strategies
Funds (investment
companies) (two funds)
since 2010; Salient MF Trust
(investment company) (five
funds) since 2012; Salient
Midstream & MLP Fund
(investment company) since
2012; Salient MLP &
Energy Infrastructure Fund
(investment company) since
2011; The Make-A-Wish
Foundation, since 2008;
YES Prep Public Schools,
since 2001. |
Officers of the Fund Who Are Not Directors
| | | | |
| Name, Address and Age | | Position(s) Held with the Fund | | Principal Occupation(s) During the
Past 5 Years |
Paul Bachtold Age: 40 Address: c/o The Endowment Fund
4265 San Felipe, 8th Floor,
Houston, TX 77027 | | Chief Compliance Officer (“CCO”) (Since 2010) | | CCO, Salient, since 2010; Consultant, Chicago Investment Group (compliance consulting), 2009-2010; US Compliance Manager, Barclays Global Investors, 2005-2008. |
John E. Price Age: 46 Address: c/o The Endowment Fund
4265 San Felipe, 8th Floor,
Houston, TX 77027 | | Treasurer; Principal Financial Officer (Since 2004) | | Managing Director and Chief Financial Officer, Adviser, since 2003; Partner, Managing Director and Chief Financial Officer of Salient, since 2003. |
Jeremy Radcliffe Age: 39 Address: c/o The Endowment Fund 4265 San Felipe, 8th Floor, Houston, TX 77027 | | Secretary (Since 2013) | | Managing Director of Salient, since 2002. |
69
THE ENDOWMENT MASTER FUND, L.P.
(A Limited Partnership)
Supplemental Information, continued
December 31, 2013
(Unaudited)
Allocation of Investments
The following chart indicates the allocation of investments among the asset classes in the Master Fund as of December 31, 2013.
| | | | | | | | |
Asset Class1 | | Fair Value | | | % | |
Arbitrage Strategies | | $ | 259,380,056 | | | | 12.40 | |
Domestic Equity | | | 27,794,430 | | | | 1.33 | |
Energy | | | 236,553,251 | | | | 11.31 | |
Enhanced Fixed Income | | | 145,106,419 | | | | 6.94 | |
Global Opportunistic | | | 212,121,331 | | | | 10.14 | |
International Equity | | | 43,287,010 | | | | 2.07 | |
Natural Resources | | | 34,182,182 | | | | 1.63 | |
Private Equity | | | 727,754,609 | | | | 34.77 | |
Real Estate | | | 195,817,823 | | | | 9.36 | |
Technology | | | 129,024 | | | | 0.01 | |
Call Options Purchased | | | 20,750,470 | | | | 0.99 | |
Money Market Funds | | | 189,272,108 | | | | 9.05 | |
| | | | | | | | |
Total Investments | | $ | 2,092,148,713 | | | | 100.00 | |
| | | | | | | | |
| 1 | The complete list of investments included in the following asset class categories is included in the Schedule of Investments of the Master Fund. |
Form N-Q Filings
The Master Fund files a complete schedule of portfolio holdings with the Securities and Exchange Commission for the first and third quarters of each fiscal year on Form N-Q. The Master Fund’s Form N-Q is available on the Securities and Exchange Commission website at http://www.sec.gov. The Master Fund’s Form N-Q may be reviewed and copied at the Securities and Exchange Commission Public Reference Room in Washington, DC and information regarding operation of the Public Reference Room may be obtained by calling 1-800-SEC-0330.
Proxy Voting Policies
A description of the policies and procedures that the Master Fund uses to determine how to vote proxies relating to portfolio securities is available (i) without charge, upon request, by calling 1-800-725-9456; and (ii) on the Securities and Exchange Commission website at http://www.sec.gov.
Information regarding how the Master Fund voted proxies relating to portfolio securities during the most recent 12-month period ended June 30 is available (i) without charge, upon request, by calling 1-800-725-9456; and (ii) on the Securities and Exchange Commission website at http://www.sec.gov.
Additional Information
The Master Fund’s private placement memorandum (the “PPM”) includes additional information about Directors of the Master Fund. The PPM is available, without charge, upon request by calling 1-800-725-9456.
70
THE ENDOWMENT MASTER FUND, L.P.
(A Limited Partnership)
Privacy Policy (Unaudited)
The Master Fund recognizes the importance of securing personal financial information. It is our policy to safeguard any personal and financial information that may be entrusted to us. The following is a description of the Master Fund’s policy regarding disclosure of nonpublic personal information.
We collect nonpublic personal information as follows:
We collect information about our investors, including, but not limited to, the investor’s name, address, telephone number, e-mail address, social security number and date of birth. We collect that information from subscription agreements, other forms of correspondence that we receive from investors, from personal conversations and from affiliated entities as permitted by law.
We receive information about investor transactions with us, including, but not limited to, account number, account balance, investment amounts, withdrawal amounts and other financial information.
We are permitted by law to disclose nonpublic information we collect, as described above, to the Master Fund’s service providers, including the Master Fund’s investment adviser, sub-advisers, servicing agent, independent administrator, custodian, legal counsel, accountant and auditor. We do not disclose any nonpublic information about our current or former investors to nonaffiliated third parties, except as required or permitted by law. We restrict access to investor nonpublic personal information to those persons who require such information to provide products or services to investors. We maintain physical, electronic and procedural safeguards that comply with federal standards to guard investors’ nonpublic personal information.
If an investor’s investment relationship with the Master Fund involves a financial intermediary, including, but not limited to, a broker-dealer, bank or trust company, the privacy policy of such investor’s financial intermediary would govern how any nonpublic personal information would be shared by them with nonaffiliated third parties.
71
Independent Directors
Jonathan P. Carroll
Dr. Bernard Harris
Richard C. Johnson
G. Edward Powell
Scott E. Schwinger
Karin B. Bonding
Interested Directors and Officers
A. Haag Sherman, Director
John A. Blaisdell, Director and Co-Principal Executive Officer
Andrew B. Linbeck, Director and Co-Principal Executive Officer
John E. Price, Treasurer and Principal Financial Officer
Jeremy Radcliffe, Secretary
Paul A. Bachtold, Chief Compliance Officer
Investment Adviser
Endowment Advisers, L.P.
Houston, TX
Fund Administrator and Transfer Agent
Citi Fund Services Ohio, Inc.
Columbus, OH
Custodian
J.P. Morgan Chase Bank, N.A.
Greenwich, CT
Independent Registered Public Accounting Firm
KPMG LLP
Columbus, OH
Legal Counsel
K&L Gates LLP
Boston, MA
THE ENDOWMENT FUND®
4265 San Felipe
8th Floor
Houston, Texas 77027
Tel 800-725-9456
Fax 713-993-4698
Item 2. Code of Ethics.
(a) The registrant has adopted a code of ethics that applies to the registrant’s principal executive officer, principal financial officer, principal accounting officer or controller, or persons performing similar functions. This code of ethics is included as Exhibit 12(a)(1).
(b) During the period covered by the report, with respect to the registrant’s code of ethics that applies to its principal executive officer, principal financial officer, principal accounting officer or controller, or persons performing similar functions; there have been no amendments to, nor any waivers granted from, a provision that relates to any element of the code of ethics definition enumerated in paragraph (b) of this Item 2.
Item 3. Audit Committee Financial Expert.
3(a)(1) The registrant’s board of directors has determined that the registrant has at least one audit committee financial expert serving on its audit committee.
3(a)(2) The audit committee financial expert is G. Edward Powell, who is “independent” for purposes of this Item 3 of Form N-CSR.
Item 4. Principal Accountant Fees and Services.
| | | | | | | | |
| | | Current Year | | | Previous Year | |
Audit Fees | | $ | 10,400 | | | $ | 10,250 | |
Audit-Related Fees | | $ | 0 | | | $ | 0 | |
Tax Fees | | $ | 0 | | | $ | 0 | |
All Other Fees | | $ | 0 | | | $ | 0 | |
(e)(1) Disclose the audit committee’s pre-approval policies and procedures described in paragraph (c)(7) of Rule 2-01 of Regulation S-X.
The audit committee may delegate its authority to pre-approve audit and permissible non-audit services to one or more members of the committee. Any decision of such members to pre-approve services shall be presented to the full audit committee at its next regularly scheduled meeting.
(2) Disclose the percentage of services described in each of paragraphs (b) through (d) of this item that were approved by the audit committee pursuant to paragraph (c) (7)(i)(c) of Rule 2-01 of Regulation S-X.
| | |
Current Year | | Previous Year |
0% | | 0% |
(f) Not applicable.
(g) Disclose the aggregate non-audit fees billed by the registrant’s accountant for services rendered to registrant, and rendered to the registrant’s investment adviser (not including any sub-adviser whose role is primarily portfolio management and is subcontracted with or overseen by another investment adviser), and any entity controlling, controlled by, or under common control with the adviser that provides ongoing services to the registrant for each of the last two fiscal years of the registrant.
| | |
Current Year | | Previous Year |
$0 | | $ 0 |
(h) Not applicable.
Item 5. Audit Committee of Listed Registrants.
Not applicable.
Item 6. Investments.
(a) Schedule of Investments as of the close of the reporting period is included in the report to the shareholders filed under item 1 of this form.
(b) Not applicable.
Item 7. Disclosure of Proxy Voting Policies and Procedures for Closed-End Management Investment Companies.
A closed-end management investment company that is filing an annual report on this Form N-CSR must, unless it invests exclusively in non-voting securities, describe the policies and procedures that it uses to determine how to vote proxies relating to portfolio securities, including the procedures that the company uses when a vote presents a conflict between the interests of its shareholders, on the one hand, and those of the company’s investment adviser; principal underwriter; or any affiliated person (as defined in section 2(a)(3) of the Investment Company Act of 1940 (15 U.S.C. 80a-2(a)(3)) and the rules thereunder) of the company, its investment adviser, or its principal underwriter, on the other. Include any policies and procedures of the company’s investment adviser, or any other third party, that the company uses, or that are used on the company’s behalf, to determine how to vote proxies relating to portfolio securities.
These policies are included as Exhibit 12(a)(4).
Item 8. Portfolio Managers of Closed-End Management Investment Companies.
The Adviser’s Investment Committee Members
As of the date of the filing, the Investment Committee is responsible for the day-to-day management of the Fund’s portfolio. The Endowment Master Fund, L.P. (the “Master Fund”), The Endowment Institutional Fund, L.P. (the “Institutional Fund”), The Endowment Registered Fund, L.P. (the “Registered Fund”), The Endowment TEI Fund, L.P. (the “TEI Fund”) and The Endowment Institutional TEI Fund W, L.P. (the “Institutional TEI W Fund”) are registered investment companies (collectively, the “Fund Complex” and each individually the “Fund”). The members of the Investment Committee (each an “Investment Committee Member”) are: Messrs. Lee G. Partridge, Jeremy L. Radcliffe, William K. Enszer, William B. Hunt and William R. Guinn.
Mr. Partridge has served as an Investment Committee Member since January 15, 2013, and has served as Chief Investment Officer of Salient Partners, L.P. (“Salient”), which owns Salient Trust Co., LTA, a trust company chartered under the laws of the State of Texas, since January 15, 2013. Mr. Radcliffe has served as an Investment Committee Member since 2014 and Managing Director of Salient since 2002. Previously, he held the position of Partner of The Redstone Companies, L.P. and certain affiliates thereof (from 1998-2002 (collectively, “Redstone”)). Mr. Enszer has served as an Investment Committee Member since 2014 and Director of Salient since 2010. Previously, he held the position of Vice President of Redstone Asset Management (from 2005-2010). Mr. Hunt has served as an Investment Committee Member since 2014 and as Chief Risk Officer of Salient since 2014. He previously held positions as a Senior Analyst and Portfolio Manager of Iridian Asset Management (from 1996-2011) and Professor at Southern Methodist University (from 1991-2000). Mr. Guinn has served as an Investment Committee Member since 2014 and Director of Salient since 2013. Previously, he held the position of Director of Strategic Partnerships and Opportunistic Investments at the Teacher Retirement System of Texas (2009-2013). Each member of the Investment Committee reviews asset allocation recommendations made by the Adviser’s representatives, manager due diligence and recommendations and, by a majority vote of the Investment Committee, determines asset allocation and manager selection.
The Adviser and certain other entities controlled by the Principals manage investment programs which are similar to that of the Fund, and the Adviser and/or the Principals may in the future serve as an investment adviser or otherwise manage or direct the investment activities of other registered and/or private investment vehicles with investment programs similar to the Funds.
Other Accounts Managed by the Investment Adviser
Certain Investment Committee Members, who are primarily responsible for the day-to-day management of the Fund, also manage other registered investment companies, other pooled investment vehicles and other accounts, as indicated below. The following tables identify, as of December 31, 2013: (i) the number of registered investment companies (including the Fund), other pooled investment vehicles and other accounts managed by the Investment Committee Member and the total assets of such companies, vehicles and accounts; and (ii) the number and total assets of such companies, vehicles and accounts with respect to which the advisory fee is based on performance.
| | | | | | | | | | | | | | | | |
Name | | Number of Other
Accounts | | | Total Assets of Other
Accounts | | | Number of Other
Accounts Subject to
a Performance Fee | | | Total Assets of Other
Accounts Subject to
a Performance Fee | |
Jeremy Radcliffe | | | | | | | | | | | | | | | | |
Registered investment companies (1) | | | 9 | | | $ | 1.51 billion | | | | 0 | | | $ | — | |
Other pooled investment companies (1) | | | 13 | | | $ | 1.29 billion | | | | 2 | | | $ | 331 million | |
Other accounts | | | >1420 | | | $ | 14.31 billion | | | | 3 | | | $ | 9.80 billion | |
Lee Partridge | | | | | | | | | | | | | | | | |
Registered investment companies (1) | | | 9 | | | $ | 1.43 billion | | | | 0 | | | $ | — | |
Other pooled investment companies (1) | | | 11 | | | $ | 1.05 billion | | | | 2 | | | $ | 331 million | |
Other accounts | | | >1420 | | | $ | 14.27 billion | | | | 3 | | | $ | 9.80 billion | |
William K. Enszer | | | | | | | | | | | | | | | | |
Registered investment companies (1) | | | 0 | | | $ | — | | | | 0 | | | $ | — | |
Other pooled investment companies (1) | | | 0 | | | $ | — | | | | 0 | | | $ | — | |
Other accounts | | | 0 | | | $ | — | | | | 0 | | | $ | — | |
William B. Hunt | | | | | | | | | | | | | | | | |
Registered investment companies (1) | | | 0 | | | $ | — | | | | 0 | | | $ | — | |
Other pooled investment companies (1) | | | 0 | | | $ | — | | | | 0 | | | $ | — | |
Other accounts | | | 0 | | | $ | — | | | | 0 | | | $ | — | |
William R. Guinn | | | | | | | | | | | | | | | | |
Registered investment companies (1) | | | 3 | | | $ | 1.18 billion | | | | 0 | | | $ | — | |
Other pooled investment companies (1) | | | 3 | | | $ | 425 million | | | | 2 | | | $ | 331 million | |
Other accounts | | | >1420 | | | $ | 4.57 billion | | | | 2 | | | $ | 70 million | |
| (1) | For registered investment companies and pooled investment vehicles managed, the number of vehicles reported for master-feeder structures includes both the master fund and feeder funds while the corresponding total assets reported reflect the assets of the master fund only. |
Conflicts of Interest of the Adviser
From time to time, potential conflicts of interest may arise between an Investment Committee Member’s management of the investments of the Fund, on the one hand, and the management of other registered investment companies, pooled investment vehicles and other accounts (collectively, “other accounts”), on the other. The other accounts might have similar investment objectives or strategies as the Fund, track the same index the Fund tracks or otherwise hold, purchase, or sell securities that are eligible to be held, purchased or sold by the Fund. The other accounts might also have different investment objectives or strategies than the Fund.
Knowledge and Timing of Fund Trades. A potential conflict of interest may arise as a result of the Investment Committee Member’s day-to-day management of a Fund. Because of their positions with the Fund, the Investment Committee Members know the size, timing and possible market impact of the Fund’s trades. It is theoretically possible that the Investment Committee Members could use this information to the advantage of other accounts they manage and to the possible detriment of the Fund.
Investment Opportunities. A potential conflict of interest may arise as a result of the Investment Committee Member’s management of a number of accounts with varying investment guidelines. Often, an investment opportunity may be suitable for both the Fund and other accounts managed by the Investment Committee Member, but may not be available in sufficient quantities for both the Fund and the other accounts to participate fully. Similarly, there may be limited opportunity to sell an investment held by the Fund and other accounts. The Adviser has adopted policies and procedures reasonably designed to allocate investment opportunities on a fair and equitable basis over time.
Performance Fees. An Investment Committee Member may advise certain accounts with respect to which the advisory fee is based entirely or partially on performance. Performance fee arrangements may create a conflict of interest for the Investment Committee Member in that the Member may have an incentive to allocate the investment opportunities that he or she believes might be the most profitable to such other accounts instead of allocating them to the Fund.
Compensation to Investment Committee Members
Messrs. Partridge, Radcliffe, Enszer, Hunt and Guinn indirectly own equity interests in the Adviser. As it relates to the Fund and other funds within the Fund Complex, Messrs. Partridge, Radcliffe, Enszer, Hunt and Guinn receive all of their compensation based on the size of the Fund and the other funds within the Fund Complex and the management and servicing fees charged thereon. Accordingly, they believe that a significant driver of their compensation is the performance of the Fund and the Fund Complex, which has a significant bearing on the ability to raise additional assets. Messrs. Partridge, Radcliffe, Enszer, Hunt and Guinn also indirectly own equity in the advisers to other funds and are compensated based on the size of the funds’ asset bases and the management and servicing fees charged thereon. In addition, Messrs. Partridge and Radcliffe are partners and principal executive officers of Salient and related affiliates and subsidiaries (collectively, the “Salient Group”), which pays them a base salary (but no bonus) and is obligated to make distributions of profits to them, as well as the other partners, on an annual basis. These individuals are responsible for the investment processes and management of the Salient Group. Messrs. Partridge and Radcliffe believe that to the extent that they are successful in their investment endeavors, the greater the number of assets over time and the more significant their compensation from the Salient Group.
Securities Ownership of Investment Committee Members
The table below shows the dollar range of the interests of each Fund beneficially owned as of December 31, 2013 by each Investment Committee Member.
| | | | | | | | | | |
Investment Committee
Member | | Master Fund | | Registered Fund | | Institutional Fund | | TEI Fund | | Institutional TEI
W Fund |
Jeremy L. Radcliffe | | None | | None | | $500,001 to $750,000 | | None | | None |
Lee G. Partridge | | None | | None | | None | | None | | None |
William K. Enszer | | None | | None | | None | | None | | None |
William B. Hunt | | None | | None | | None | | None | | None |
William R. Guinn | | None | | None | | None | | None | | None |
Item 9. Purchases of Equity Securities by Closed-End Management Investment Company and Affiliated Purchasers.
Not applicable.
Item 10. Submission of Matters to a Vote of Security Holders.
Not applicable.
Item 11. Controls and Procedures.
The registrant’s principal executive officer and principal financial officer have concluded, based on their evaluation of the registrant’s disclosure controls and procedures as conducted within 90 days of the filing date of this report, that these disclosure controls and procedures are adequately designed and are operating effectively to ensure that information required to be disclosed by the registrant on Form N-CSR is (i) accumulated and communicated to the investment company’s management, including its certifying officers, to allow timely decisions regarding required disclosure; and (ii) recorded, processed, summarized and reported within the time periods specified in the Securities and Exchange Commission’s rules and forms.
There were no changes in the registrant’s internal control over financial reporting (as defined in Rule 30a-3(d) under the Act (17 CFR 270.30a-3(d)) that occurred during the fourth fiscal quarter of the period covered by this report that have materially affected or are reasonably likely to materially affect, the registrant’s internal control over financial reporting.
Item 12. Exhibits.
(a)(1) Code of ethics that is subject to Item 2 is attached hereto.
(a)(2) Certifications pursuant to Rule 30a-2(a) are attached hereto.
(a)(3) Not applicable.
(a)(4) Proxy voting policies and procedures pursuant to Item 7 are attached hereto.
(b) Certifications pursuant to Rule 30a-2(b) are furnished herewith.
SIGNATURES
Pursuant to the requirements of the Securities Exchange Act of 1934 and the Investment Company Act of 1940, the registrant has duly caused this report to be signed on its behalf by the undersigned, thereunto duly authorized.
| | | | |
| (Registrant) The Endowment Institutional TEI Fund W, L.P. | | |
| | |
| By (Signature and Title) | | /s/ John A. Blaisdell | | |
| | John A. Blaisdell | | |
| | Co-Principal Executive Officer | | |
| | | | |
| | |
| By (Signature and Title) | | /s/ Andrew B. Linbeck | | |
| | Andrew B. Linbeck | | |
| | Co-Principal Executive Officer | | |
Pursuant to the requirements of the Securities Exchange Act of 1934 and the Investment Company Act of 1940, this report has been signed below by the following persons on behalf of the registrant and in the capacities and on the dates indicated.
| | | | |
| By (Signature and Title) | | /s/ John A. Blaisdell | | |
| | John A. Blaisdell | | |
| | Co-Principal Executive Officer | | |
| | | | |
| | |
| By (Signature and Title) | | /s/ Andrew B. Linbeck | | |
| | Andrew B. Linbeck | | |
| | Co-Principal Executive Officer | | |
| | | | |
| | |
| By (Signature and Title) | | /s/ John E. Price | | |
| | John E. Price | | |
| | Principal Financial Officer | | |