UNITED STATES
SECURITIES AND EXCHANGE COMMISSION
Washington, D.C. 20549
FORM N-CSR
CERTIFIED SHAREHOLDER REPORT OF REGISTERED
MANAGEMENT INVESTMENT COMPANIES
Investment Company Act file number 811-22425
Nuveen Build America Bond Opportunity Fund
(Exact name of registrant as specified in charter)
Nuveen Investments
333 West Wacker Drive
Chicago, IL 60606
(Address of principal executive offices) (Zip code)
Kevin J. McCarthy
Nuveen Investments
333 West Wacker Drive
Chicago, IL 60606
(Name and address of agent for service)
Registrant's telephone number, including area code: (312) 917-7700
Date of fiscal year end: March 31
Date of reporting period: September 30, 2013
Form N-CSR is to be used by management investment companies to file reports with the Commission not later than 10 days after the transmission to stockholders of any report that is required to be transmitted to stockholders under Rule 30e-1 under the Investment Company Act of 1940 (17 CFR 270.30e-1). The Commission may use the information provided on Form N-CSR in its regulatory, disclosure review, inspection, and policymaking roles.
A registrant is required to disclose the information specified by Form N-CSR, and the Commission will make this information public. A registrant is not required to respond to the collection of information contained in Form N-CSR unless the Form displays a currently valid Office of Management and Budget ("OMB") control number. Please direct comments concerning the accuracy of the information collection burden estimate and any suggestions for reducing the burden to Secretary, Securities and Exchange Commission, 450 Fifth Street, NW, Washington, DC 20549-0609. The OMB has reviewed this collection of information under the clearance requirements of 44 U.S.C. ss. 3507.
ITEM 1. REPORTS TO STOCKHOLDERS.
Life is Complex
Nuveen makes things e-simple.
It only takes a minute to sign up for e-Reports. Once enrolled, you’ll receive an e-mail as soon as your Nuveen Investments Fund information is ready—no more waiting for delivery by regular mail. Just click on the link within the e-mail to see the report and save it on your computer if you wish.
Free e-Reports right to your e-mail!
www.investordelivery.com
If you receive your Nuveen Fund dividends and statements from your financial advisor or brokerage account.
or
www.nuveen.com/accountaccess
If you receive your Nuveen Fund dividends and statements directly from Nuveen.
Table of Contents
| Chairman’s Letter to Shareholders | 4 |
| Portfolio Manager’s Comments | 5 |
| Fund Leverage | 8 |
| Share Information | 9 |
| Risk Considerations | 11 |
| Performance Overview and Holding Summaries | 12 |
| Shareholder Meeting Report | 14 |
| Portfolios of Investments | 15 |
| Statement of Assets and Liabilities | 26 |
| Statement of Operations | 27 |
| Statement of Changes in Net Assets | 28 |
| Statement of Cash Flows | 29 |
| Financial Highlights | 30 |
| Notes to Financial Statements | 32 |
| Annual Investment Management Agreement Approval Process | 42 |
| Reinvest Automatically, Easily and Conveniently | 50 |
| Glossary of Terms Used in this Report | 51 |
| Additional Fund Information | 55 |
| Nuveen Investments | 3 |
Chairman’s Letter to Shareholders

Dear Shareholders,
I am pleased to have this opportunity to introduce myself to you as the new independent chairman of the Nuveen Fund Board, effective July 1, 2013. I am honored to have been selected as chairman, with its primary responsibility to serve the interests of the Nuveen Fund shareholders. My predecessor, Robert Bremner, was the first independent director to serve as chairman of the Board and I, and my fellow Board members, plan to continue his legacy of strong independent oversight of your funds.
The global economy has hit major turning points over the last several months to a year. The developed world is gradually recovering from their financial crisis while the emerging markets appear to be struggling with the downshift of China’s growth potential. Japan is entering a new era of growth after decades of economic stagnation and many of the Eurozone nations appear to be exiting their recession. Despite the positive events, there are still potential risks. Middle East tensions, rising oil prices, defaults in Europe and fallout from the financial stress in emerging markets could all reverse the recent progress in the global economy.
On the domestic front, the U.S. economy is experiencing sustainable slow growth. Corporate fundamentals are strong as earnings per share and corporate cash are at the highest level in two decades. Unemployment is trending down and the housing market has experienced a rebound, each assisting the positive economic scenario. However, there are some issues to be watched. Interest rates are expected to increase but significant uncertainty about the timing remains. Partisan politics in Washington D.C. with their troublesome outcome add to the uncertainties that could cause problems for the economy going forward.
In the near term, governments are focused on economic recovery and the growth of their economies, which could lead to an environment of attractive investment opportunities. Over the long term, the uncertainties mentioned earlier could hinder the potential growth. Because of this, Nuveen’s investment management teams work hard to balance return and risk with a range of investment strategies. I encourage you to read the following commentary on the management of your fund.
On behalf of the other members of the Fund Board, we look forward to continuing to earn your trust in the months and years ahead.
Sincerely,

William J. Schneider
Chairman of the Nuveen Fund Board
November 22, 2013
| 4 | Nuveen Investments |
Portfolio Manager’s Comments
Nuveen Build America Bond Fund (NBB)
Nuveen Build America Bond Opportunity Fund (NBD)
These Funds feature management by Nuveen Asset Management, LLC, an affiliate of Nuveen Investments. Portfolio manager Daniel J. Close, CFA, reviews key investment strategies and the six-month performance of the Nuveen Build America Bond Fund (NBB) and the Nuveen Build America Bond Opportunity Fund (NBD). Dan has managed NBB and NBD since their inceptions in April 2010 and November 2010, respectively.
What key strategies were used to manage NBB and NBD during the six-month reporting period ended September 30, 2013?
During this reporting period, uncertainty about the next step for the Federal Reserve’s quantitative easing program and the potential impact on the economy and financial markets led to increased volatility across the fixed income markets. Ongoing political debate over federal spending and headline credit stories involving Detroit and Puerto Rico also contributed to an unsettled environment and prompted an increase in selling by bond investors. Overall, the performance of the Build America Bond (BAB) market was negative for the reporting period, largely reflecting the decrease in the price of longer dated Treasuries.
NBB and NBD are designed to invest primarily in BABs and other taxable municipal bonds. The primary investment objective of these two Funds is to provide current income through investments in taxable municipal securities. Their secondary objective is to seek enhanced portfolio value and total return. The Funds offer strategic portfolio diversification opportunities for traditional municipal bond investors, while providing investment options to investors that have not traditionally purchased municipal bonds, including public and corporate retirement plans, endowments, life insurance companies and sovereign wealth funds. For these investors, the Funds can offer investment grade municipal credit, current income and strong call protection.
With the end of the BAB new issuance program in 2010, our focus during this reporting period continued to be on taking advantage of opportunities to add value and improve the liquidity profiles of both NBB and NBD by purchasing additional benchmark BAB issues in the secondary market. Many of these benchmark BAB purchases were additions to positions already held in the Funds. Benchmark BAB issues, which typically offer more liquidity than their non-benchmark counterparts, are defined as BABs over $250 million in size and therefore eligible for inclusion in the Barclays Build America Bond Index. Their greater liquidity makes them potentially easier to sell at Fund termination. In contrast, non-benchmark BABs generally are smaller issues that may offer the same credit quality as benchmark BABs, but sometimes require more detailed credit reviews before purchase and consequently may be less liquid.
Ratings shown are the highest rating given by one of the following national rating agencies: Standard & Poor’s, Moody’s Investors Service, Inc. or Fitch, Inc. Credit ratings are subject to change. AAA, AA, A, and BBB are investment grade ratings; BB, B, CCC, CC, C and D are below investment grade ratings. Certain bonds backed by U.S. government or agency securities are regarded as having an implied rating equal to the rating of such securities. Holdings designated N/R are not rated by these national rating agencies.
| Nuveen Investments | 5 |
Portfolio Manager’s Comments (continued)
We also found opportunities to purchase a few select BABs at attractive prices following the government sequestration in March 2013. Earlier in 2013, prior to the start of this reporting period, Congress had failed to reach a resolution on spending cuts intended to address the federal budget deficit, which triggered sequestration, or a program of automatic spending cuts, on March 1, 2013. As part of this program, the original 35% subsidy on BABs was cut to approximately 32%. This reduction, in turn, had an impact on the small percentage of BABs that included par call provisions, which gave issuers the right to call these BABs at par in the event of a subsidy cut by the federal government. This allowed these bonds to be purchased at below market prices. Following the sequestration, BABs with par call provisions dropped in price. However, when the market began to price these bonds at very low levels that reflected their risk, we viewed this as an opportunity to purchase a few positions in these BABs in both Funds, adding higher coupons at low prices.
Both Funds also continued to purchase attractive taxable municipal bonds in the primary market. Among our purchases during this reporting period were new taxable issues of dedicated tax bonds and health care credits. Overall, our strategy was to continue to add value by pursuing active management and implementing relative value trades as we found attractive opportunities.
For the most part, cash for purchases in NBB during this reporting period was generated by sales of some of the Fund’s few remaining non-benchmark holdings. In NBD, we sold highly rated credits that, in our opinion, had less performance potential.
Shareholders should note that, because there was no new issuance of BABs or similar U.S. Treasury-subsidized taxable municipal bonds for the 24-month period ended December 31, 2012, the Funds’ contingent term provisions went into effect on January 1, 2013. During the reporting period ended September 30, 2013, NBB and NBD were managed in line with termination dates on or around June 30, 2020, and December 31, 2020, respectively, with the distribution of the Funds’ assets to shareholders planned for those times. We continued our efforts to maximize the Funds’ liquidity and better position NBB and NBD for termination. Even though the Funds are scheduled to terminate, we believe the opportunity still exists to add value for the shareholders of these Funds through active management and strong credit research.
How did these Funds perform during the six-month reporting period ended September 30, 2013?
The tables in each Fund’s Performance Overview and Holding Summaries section of this report provide the Funds’ returns for the six-month, one-year and since-inception periods ended September 30, 2013. Each Fund’s total returns are compared with the performance of a corresponding market index.
For the six months ended September 30, 2013, the cumulative return on common share net asset value (NAV) for NBB exceeded the return for the Barclays Build America Bond Index, while NBD trailed the return for this index. As previously mentioned, the performance of the BAB market as a whole generally was negative for the reporting period. Key management factors that influenced the returns of NBB and NBD included duration and yield curve positioning, the use of derivatives, credit exposure and sector allocation.
As interest rates rose during this reporting period, bonds with shorter maturities generally outperformed those with longer maturities. Overall, credits at the shortest end of the yield curve posted the best returns, while bonds at the longest end produced the weakest results. For the reporting period, duration and yield curve positioning relative to the index was a positive contributor to the performance of NBB, which generally was underweighted in the underperforming longest segment of the curve and marginally overweighted in the shorter segments that performed better. NBD’s performance for the reporting period was negatively impacted by overweightings at the longest end of the curve.
| 6 | Nuveen Investments |
As part of their approach to investing, NBB and NBD use an integrated leverage and hedging strategy in their efforts to enhance current income and total return, while working to maintain a level of interest rate risk similar to that of the Barclays Build America Bond Index. As part of this integrated strategy, both NBB and NBD used inverse floating rate securities and bank borrowings as leverage to potentially magnify performance. At the same time, the Funds used interest rate swaps to reduce their leverage-adjusted durations to a level close to that of the Barclays Build America Bond Index. In addition, the Funds entered into staggered interest rate swaps to partially fix the interest cost of leverage. During this reporting period, as rates rose and bonds with shorter maturities outperformed, the use of inverse floaters detracted from the Funds’ performance. However, because NBB and NBD were also using swaps to short long interest rates at a time when rates were rising and bond prices falling, the use of swaps had a positive impact on the Funds’ total return performance for the period. Leverage is discussed in more detail later in this report.
Credit rating exposure also factored into the Funds’ performance during this reporting period, as higher quality bonds generally outperformed lower quality bonds. In general, NBB and NBD benefited from their exposure to the higher rated categories. Both Funds had strong exposure to bonds rated AA and A, which was helpful during this reporting period.
The Funds’ sector allocations were well diversified, with the heaviest weightings in general obligation and other tax-supported bonds, transportation, water and sewer and utilities. The overall impact of this sector allocation was modestly positive for both Funds.
Given the headline news about credit downgrades on Puerto Rico debt and Detroit’s bankruptcy filing in July 2013, we should note that neither NBB nor NBD holds any Puerto Rico BABs. Both Funds hold BABs rated Aa2 issued for Detroit City School District that are backed by the state of Michigan. In late September 2013, NBB also added a position in high coupon BABs issued by Wayne County, Michigan. Neither the Detroit City School District nor the Wayne County BABs are part of the Detroit bankruptcy filing.
| Nuveen Investments | 7 |
Fund Leverage
IMPACT OF THE FUNDS’ LEVERAGE STRATEGIES ON PERFORMANCE
One important factor impacting the returns of the Funds relative to the comparative index was the Funds’ use of leverage. The Funds use leverage because their manager believes that, over time, leveraging provides opportunities for additional income and total return for shareholders. However, use of leverage also can expose shareholders to additional volatility. For example, as the prices of securities held by a Fund decline, the negative impact of these valuation changes on NAV and total return is magnified by the use of leverage. Conversely, leverage may enhance share returns during periods when the prices of securities held by a Fund generally are rising. Overall, leverage had a negative impact to the performance of the Funds over this reporting period.
As of September 30, 2013, the Funds’ percentages of effective and regulatory leverage are shown in the accompanying table.
| NBB | NBD | ||||||
| Effective Leverage* | 30.42% | 30.71% | |||||
| Regulatory Leverage* | 14.30% | 7.02% |
| * | Effective leverage is a Fund’s effective economic leverage, and includes both regulatory leverage and the leverage effects of certain derivative and other investments in a Fund’s portfolio that increase the Fund’s investment exposure. Currently, the leverage effects of Tender Option Bond (TOB) inverse floater holdings are included in effective leverage values, in addition to any regulatory leverage. Regulatory leverage consists of preferred shares issued or borrowings of a Fund. Both of these are part of a Fund’s capital structure. Regulatory leverage is subject to asset coverage limits set forth in the Investment Company Act of 1940. |
THE FUNDS’ REGULATORY LEVERAGE
As of September 30, 2013, the Funds have outstanding bank borrowings as shown in the accompanying table.
| NBB | NBD | ||||||
| Bank Borrowings | $ | 89,000,000 | $ | 11,500,000 |
Refer to Notes to Financial Statements, Note 8 - Borrowing Arrangements for further details on each Fund’s bank borrowings.
| 8 | Nuveen Investments |
Share Information
DIVIDEND INFORMATION
During the current reporting period ended September 30, 2013, the Funds’ monthly dividends to shareholders were as shown in the accompanying table.
| Per Share Amounts | |||||||
| NBB | NBD | ||||||
| April | $ | 0.1135 | $ | 0.1105 | |||
| May | 0.1135 | 0.1105 | |||||
| June | 0.1135 | 0.1105 | |||||
| July | 0.1135 | 0.1105 | |||||
| August | 0.1135 | 0.1105 | |||||
| September | 0.1160 | 0.1140 | |||||
| Market Yield** | 7.70% | 7.38 | % | ||||
| ** | Market Yield is based on the Fund’s current annualized monthly dividend divided by the Fund’s current market price as of the end of the reporting period. |
The Funds in this report seek to pay stable dividends at rates that reflect each Fund’s past results and projected future performance. During certain periods, each Fund may pay dividends at a rate that may be more or less than the amount of net investment income actually earned by the Fund during the period. If a Fund has cumulatively earned more than it has paid in dividends, it holds the excess in reserve as undistributed net investment income (UNII) as part of the Fund’s NAV. Conversely, if a Fund has cumulatively paid dividends in excess of its earnings, the excess constitutes negative UNII that is likewise reflected in the Fund’s NAV. Each Fund will, over time, pay all of its net investment income as dividends to shareholders. As of September 30, 2013, both Funds had positive UNII balances, based upon our best estimate, for tax purposes. NBB had a negative UNII balance, while NBD had a positive UNII balance for financial reporting purposes.
| Nuveen Investments | 9 |
Share Information (continued)
SHARE REPURCHASES
Since the inception of the Funds’ repurchase programs, the Funds have not repurchased any of their outstanding shares.
OTHER SHARE INFORMATION
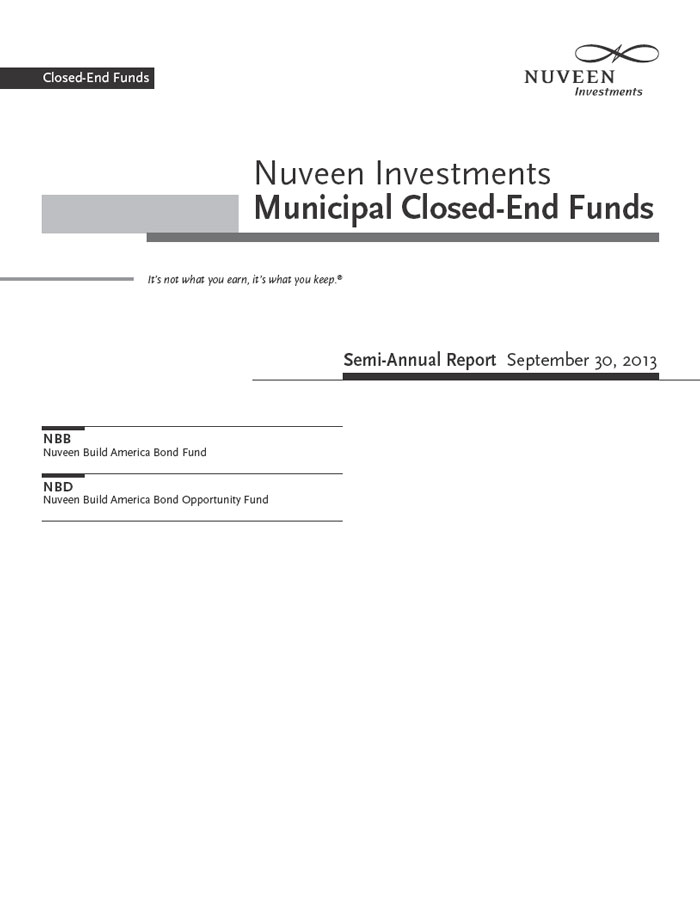
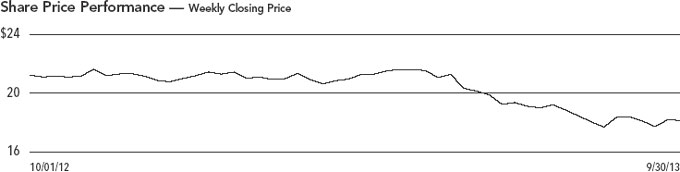
As of September 30, 2013, and during the current reporting period, the Funds’ share prices were trading at a premium/(discount) to their NAV as shown in the accompanying table.
| NBB | NBD | ||||||
| NAV | $ | 20.16 | $ | 21.14 | |||
| Share Price | $ | 18.07 | $ | 18.54 | |||
| Premium/(Discount) to NAV | (10.37 | )% | (12.30 | )% | |||
| 6-Month Average Premium/(Discount) to NAV | (8.39 | )% | (9.75 | )% |
| 10 | Nuveen Investments |
Risk Considerations
Fund shares are not guaranteed or endorsed by any bank or other insured depository institution, and are not federally insured by the Federal Deposit Insurance Corporation. Past performance is no guarantee of future results. Fund shares are subject to a variety of risks, including:
Investment, Price and Market Risk. An investment in shares is subject to investment risk, including the possible loss of the entire principal amount that you invest. Your investment in shares represents an indirect investment in the municipal securities owned by the Fund, which generally trade in the over-the-counter markets. Shares of closed-end investment companies like these Funds frequently trade at a discount to their net asset value (NAV). Your shares at any point in time may be worth less than your original investment, even after taking into account the reinvestment of Fund dividends and distributions.
Build America Bonds Risk. BABs are a new form of municipal financing, and the market is smaller, less diverse, and potentially less liquid than other types of municipal securities. In addition, bonds issued after December 31, 2010, will not qualify as BABs unless the relevant section of the program is extended. Consequently, if the program is not extended, BABs may be less actively traded which may negatively affect the value of BABs held by the Fund.
Leverage Risk. Each Fund’s use of leverage creates the possibility of higher volatility for the Fund’s per share NAV, market price, distributions and returns. There is no assurance that a Fund’s leveraging strategy will be successful.
Tax Risk. The tax treatment of Fund distributions may be affected by new IRS interpretations of the Internal Revenue Code and future changes in tax laws and regulations.
Issuer Credit Risk. This is the risk that a security in a Fund’s portfolio will fail to make dividend or interest payments when due.
Interest Rate Risk. Fixed-income securities such as bonds, preferred, convertible and other debt securities will decline in value if market interest rates rise.
Reinvestment Risk. If market interest rates decline, income earned from a Fund’s portfolio may be reinvested at rates below that of the original bond that generated the income.
Call Risk or Prepayment Risk. Issuers may exercise their option to prepay principal earlier than scheduled, forcing a Fund to reinvest in lower-yielding securities.
Inverse Floater Risk. The Funds invest in inverse floaters. Due to their leveraged nature, these investments can greatly increase a Fund’s exposure to interest rate risk and credit risk. In addition, investments in inverse floaters involve the risk that the Fund could lose more than its original principal investment.
Derivatives Strategy Risk. Derivative securities, such as calls, puts, warrants, swaps and forwards, carry risks different from, and possibly greater than, the risks associated with the underlying investments.
| Nuveen Investments | 11 |
| NBB | |
| Nuveen Build America Bond Fund | |
| Performance Overview and Holding Summaries as of September 30, 2013 |
Average Annual Total Returns as of September 30, 2013
| Cumulative | Average Annual | |||||||||
| Since | ||||||||||
| 6-Month | 1-Year | Inception1 | ||||||||
| NBB at NAV | (7.88)% | (4.14)% | 8.27% | |||||||
| NBB at Share Price | (10.76)% | (9.76)% | 3.79% | |||||||
| Barclays Build America Bond Index | (8.52)% | (5.73)% | 8.47% | |||||||
Past performance is not predictive of future results. Current performance may be higher or lower than the data shown. Returns do not reflect the deduction of taxes that shareholders may have to pay on Fund distributions or upon the sale of Fund shares. Comparative index return information is provided for the Fund’s shares at NAV only. Indexes are not available for direct investment.
Portfolio Composition2,5 | ||||
| (as a % of total investments) | ||||
| Tax Obligation/Limited | 23.2 | % | ||
| Tax Obligation/General | 22.3 | % | ||
| Transportation | 17.6 | % | ||
| Utilities | 17.4 | % | ||
| Water and Sewer | 13.8 | % | ||
| Short-Term Investments | 0.3 | % | ||
| Other | 5.4 | % |
Credit Quality2,3,4 | ||||
| (as a % of total investment exposure) | ||||
| AAA/U.S. Guaranteed | 9.6 | % | ||
| AA | 53.1 | % | ||
| A | 26.2 | % | ||
| BBB | 6.0 | % | ||
| BB or Lower | 0.5 | % | ||
| N/R | 0.9 | % |
States2 | ||||
| (as a % of total long-term investments) | ||||
| California | 19.7 | % | ||
| Illinois | 12.8 | % | ||
| New York | 10.2 | % | ||
| Texas | 8.5 | % | ||
| Ohio | 5.4 | % | ||
| Michigan | 4.7 | % | ||
| Nevada | 4.2 | % | ||
| South Carolina | 4.1 | % | ||
| Georgia | 4.0 | % | ||
| Louisiana | 3.3 | % | ||
| New Jersey | 3.1 | % | ||
| Other | 20.0 | % |
Refer to the Glossary of Terms Used in this Report for further definition of the terms used within this page.
| 1 | Since inception returns are from 4/27/10. |
| 2 | Holdings are subject to change. |
| 3 | Ratings shown are the highest rating given by one of the following national rating agencies: Standard & Poor’s Group, Moody’s Investors Service, Inc. or Fitch, Inc. Credit ratings are subject to change. AAA, AA, A and BBB are investment grade ratings; BB, B, CCC, CC, C and D are below-investment grade ratings. Certain bonds backed by U.S. Government or agency securities are regarded as having an implied rating equal to the rating of such securities. Holdings designated N/R are not rated by these national rating agencies. |
| 4 | Percentages may not add to 100% due to the exclusion of other assets less liabilities from the table. |
| 5 | Excluding investments in derivatives. |
| 12 | Nuveen Investments |
| NBD | |
| Nuveen Build America Bond Opportunity Fund | |
| Performance Overview and Holding Summaries as of September 30, 2013 |
Average Annual Total Returns as of September 30, 2013
| Cumulative | Average Annual | |||||||||
| Since | ||||||||||
| 6-Month | 1-Year | Inception1 | ||||||||
| NBD at NAV | (8.95)% | (4.91)% | 10.06% | |||||||
| NBD at Share Price | (13.36)% | (10.46)% | 3.87% | |||||||
| Barclays Build America Bond Index | (8.52)% | (5.73)% | 10.23% | |||||||
Past performance is not predictive of future results. Current performance may be higher or lower than the data shown. Returns do not reflect the deduction of taxes that shareholders may have to pay on Fund distributions or upon the sale of Fund shares. Comparative index return information is provided for the Fund’s shares at NAV only. Indexes are not available for direct investment.
Portfolio Composition2,5 | ||||
| (as a % of total investments) | ||||
| Tax Obligation/Limited | 31.2 | % | ||
| Transportation | 17.6 | % | ||
| Water and Sewer | 16.4 | % | ||
| Tax Obligation/General | 13.9 | % | ||
| Utilities | 13.2 | % | ||
| Short-Term Investments | 0.2 | % | ||
| Other | 7.5 | % |
Credit Quality2,3.4 | ||||
| (as a % of total investment exposure) | ||||
| AAA/U.S. Guaranteed | 11.7 | % | ||
| AA | 62.8 | % | ||
| A | 15.9 | % | ||
| BBB | 3.0 | % | ||
| BB or Lower | 1.7 | % | ||
| N/R | 0.8 | % |
States2 | ||||
| (as a % of total long-term investments) | ||||
| California | 17.5 | % | ||
| Illinois | 14.6 | % | ||
| New York | 11.7 | % | ||
| South Carolina | 7.9 | % | ||
| New Jersey | 6.5 | % | ||
| Michigan | 4.4 | % | ||
| Colorado | 4.2 | % | ||
| Ohio | 4.0 | % | ||
| Texas | 3.9 | % | ||
| Georgia | 3.5 | % | ||
| Virginia | 2.8 | % | ||
| Other | 19.0 | % |
Refer to the Glossary of Terms Used in this Report for further definition of the terms used within this page.
| 1 | Since inception returns are from 11/23/10. |
| 2 | Holdings are subject to change. |
| 3 | Ratings shown are the highest rating given by one of the following national rating agencies: Standard & Poor’s Group, Moody’s Investors Service, Inc. or Fitch, Inc. Credit ratings are subject to change. AAA, AA, A and BBB are investment grade ratings; BB, B, CCC, CC, C and D are below-investment grade ratings. Certain bonds backed by U.S. Government or agency securities are regarded as having an implied rating equal to the rating of such securities. Holdings designated N/R are not rated by these national rating agencies. |
| 4 | Percentages may not add to 100% due to the exclusion of other assets less liabilities from the table. |
| 5 | Excluding investments in derivatives. |
| Nuveen Investments | 13 |
| NBB | |
| NBD | Shareholder Meeting Report |
| The annual meeting of shareholders was held in the offices of Nuveen Investments on August 7, 2013; at this meeting the shareholders were asked to vote on the election of Board Members. |
| NBB | NBD | |||||||
| Common | Common | |||||||
| shares | shares | |||||||
| Approval of the Board Members was reached as follows: | ||||||||
| William C. Hunter | ||||||||
| For | 24,262,624 | 6,128,139 | ||||||
| Withhold | 357,697 | 85,522 | ||||||
| Total | 24,620,321 | 6,213,661 | ||||||
| Judith M. Stockdale | ||||||||
| For | 24,243,088 | 6,110,765 | ||||||
| Withhold | 377,233 | 102,896 | ||||||
| Total | 24,620,321 | 6,213,661 | ||||||
| Carole E. Stone | ||||||||
| For | 24,244,451 | 6,111,976 | ||||||
| Withhold | 375,870 | 101,685 | ||||||
| Total | 24,620,321 | 6,213,661 | ||||||
| Virginia L. Stringer | ||||||||
| For | 24,247,262 | 6,122,089 | ||||||
| Withhold | 373,059 | 91,572 | ||||||
| Total | 24,620,321 | 6,213,661 | ||||||
| 14 | Nuveen Investments |
| NBB | |
| Nuveen Build America Bond Fund | |
| Portfolio of Investments | |
| September 30, 2013 (Unaudited) |
| Principal | Optional Call | |||||||||
| Amount (000) | Description (1) | Provisions (2) | Ratings (3) | Value | ||||||
| LONG-TERM INVESTMENTS – 121.3% (99.7% of Total Investments) | ||||||||||
| MUNICIPAL BONDS – 121.3% (99.7% of Total Investments) | ||||||||||
| Alabama – 0.3% (0.3% of Total Investments) | ||||||||||
| $ | 2,000 | Baptist Health Care Authority, Alabama, An Affiliate of UAB Health System, Taxable Bond Series 2013A, 5.500%, 11/15/43 | No Opt. Call | A3 | $ | 1,798,680 | ||||
| Arizona – 1.8% (1.5% of Total Investments) | ||||||||||
| 4,070 | Downtown Phoenix Hotel Corporation, Arizona, Revenue Bonds, Subordinate Lien Series 2005C, 5.290%, 7/01/18 – FGIC Insured | No Opt. Call | A | 4,120,753 | ||||||
| 5,000 | Mesa, Arizona, Utility System Revenue Bonds, Series 2010, 6.100%, 7/01/34 | 7/20 at 100.00 | Aa2 | 5,570,250 | ||||||
| 9,070 | Total Arizona | 9,691,003 | ||||||||
| California – 23.9% (19.7% of Total Investments) | ||||||||||
| 1,520 | Alameda Corridor Transportation Authority, California, User Fee Revenue Bonds, Subordinate Lien Series 2004B, 0.000%, 10/01/31 – AMBAC Insured | No Opt. Call | BBB+ | 417,362 | ||||||
| 150 | Bay Area Toll Authority, California, Revenue Bonds, San Francisco Bay Area Toll Bridge, Build America Federally Taxable Bond Series 2009F-2, 6.263%, 4/01/49 | No Opt. Call | AA | 181,559 | ||||||
| 75 | Bay Area Toll Authority, California, Revenue Bonds, San Francisco Bay Area Toll Bridge, Subordinate Lien, Build America Federally Taxable Bond Series 2010S-1, 6.793%, 4/01/30 | No Opt. Call | A+ | 89,034 | ||||||
| 500 | California Infrastructure and Economic Development Bank, Revenue Bonds, University of California San Francisco Neurosciences Building, Build America Taxable Bond Series 2010B, 6.486%, 5/15/49 | No Opt. Call | Aa2 | 530,685 | ||||||
| 3,005 | California State Public Works Board, Lease Revenue Bonds, Various Capital Projects, Build America Taxable Bond Series 2009G-2, 8.361%, 10/01/34 | No Opt. Call | A2 | 3,667,362 | ||||||
| 4,050 | California State Public Works Board, Lease Revenue Bonds, Various Capital Projects, Build America Taxable Bond Series 2010A-2, 8.000%, 3/01/35 | 3/20 at 100.00 | A2 | 4,422,722 | ||||||
| 7,000 | California State University, Systemwide Revenue Bonds, Build America Taxable Bond Series 2010B, 6.484%, 11/01/41 | No Opt. Call | Aa2 | 7,288,260 | ||||||
| 4,565 | California State, General Obligation Bonds, Various Purpose Build America Taxable Bond Series 2010, 7.950%, 3/01/36 | 3/20 at 100.00 | A1 | 5,279,925 | ||||||
| 10,000 | California State, General Obligation Bonds, Various Purpose, Build America Taxable Bond Series 2010, 7.600%, 11/01/40 | No Opt. Call | A1 | 13,119,900 | ||||||
| 15,000 | Los Angeles Community College District, California, General Obligation Bonds, Build America Taxable Bonds, Series 2010, 6.600%, 8/01/42 | No Opt. Call | Aa1 | 18,105,150 | ||||||
| 10,000 | Los Angeles Community College District, Los Angeles County, California, General Obligation Bonds, Series 2010, 6.600%, 8/01/42 (UB) (4) | No Opt. Call | Aa1 | 12,070,100 | ||||||
| Los Angeles County Public Works Financing Authority, California, Lease Revenue Bonds, Multiple Capital Projects I, Build America Taxable Bond Series 2010B: | ||||||||||
| 5,500 | 7.488%, 8/01/33 | No Opt. Call | AA– | 6,517,610 | ||||||
| 17,500 | 7.618%, 8/01/40 | No Opt. Call | AA– | 20,979,172 | ||||||
| 9,385 | Los Angeles Department of Airports, California, Revenue Bonds, Los Angeles International Airport, Build America Taxable Bonds, Series 2009C, 6.582%, 5/15/39 | No Opt. Call | AA– | 11,155,199 | ||||||
| 1,685 | Los Angeles Department of Water and Power, California, Power System Revenue Bonds, Federally Taxable – Direct Payment – Build America Bonds, Series 2010D, 6.574%, 7/01/45 | No Opt. Call | AA– | 2,078,060 | ||||||
| 2,000 | Los Angeles Department of Water and Power, California, Water System Revenue Bonds, Tender Option Bond Trust T0003, 29.702%, 7/01/42 (IF) (4) | No Opt. Call | AA | 4,632,500 | ||||||
| 3,000 | Oakland Redevelopment Agency, California, Subordinated Housing Set Aside Revenue Bonds, Federally Taxable Series 2011A-T, 7.500%, 9/01/19 | No Opt. Call | A | 3,229,440 | ||||||
| 1,365 | San Francisco City and County Public Utilities Commission, California, Water Revenue Bonds, Build America Taxable Bonds, Series 2010B, 6.000%, 11/01/40 | No Opt. Call | AA– | 1,531,448 |
| Nuveen Investments | 15 |
| NBB | Nuveen Build America Bond Fund (continued) |
Portfolio of Investments September 30, 2013 (Unaudited) |
| Principal | Optional Call | |||||||||
| Amount (000) | Description (1) | Provisions (2) | Ratings (3) | Value | ||||||
California (continued) | ||||||||||
| $ | 3,000 | San Francisco City and County Public Utilities Commission, California, Water Revenue Bonds, Build America Taxable Bonds, Series 2010G, 6.950%, 11/01/50 | No Opt. Call | AA– | $ | 3,710,250 | ||||
| 4,000 | San Francisco City and County, California, Certificates of Participation, 525 Golden Gate Avenue, San Francisco Public Utilities Commission Office Project, Tender Option Bond Trust B001, 29.357%, 11/01/30 (IF) | No Opt. Call | AA | 5,186,400 | ||||||
| Stanton Redevelopment Agency, California, Consolidated Project Tax Allocation Bonds, Series 2011A: | ||||||||||
| 275 | 6.500%, 12/01/17 | No Opt. Call | A– | 285,233 | ||||||
| 295 | 6.750%, 12/01/18 | No Opt. Call | A– | 306,461 | ||||||
| 2,505 | University of California, General Revenue Bonds, Limited Project, Build America Taxable Bond Series 2010F, 5.946%, 5/15/45 | No Opt. Call | Aa2 | 2,776,993 | ||||||
| 106,375 | Total California | 127,560,825 | ||||||||
| Colorado – 0.6% (0.5% of Total Investments) | ||||||||||
| 3,100 | Denver School District 1, Colorado, General Obligation Bonds, Build America Taxable Bonds, Series 2009C, 5.664%, 12/01/33 | No Opt. Call | AA+ | 3,308,289 | ||||||
| Connecticut – 1.0% (0.8% of Total Investments) | ||||||||||
| 4,500 | Harbor Point Infrastructure Improvement District, Connecticut, Special Obligation Revenue Bonds, Harbor Point Project, Federally Taxable – Issuer Subsidy – Recovery Zone Economic Development Bond Series 2010B, 12.500%, 4/01/39 | 4/20 at 100.00 | N/R | 5,493,330 | ||||||
| Florida – 1.0% (0.8% of Total Investments) | ||||||||||
| 5,000 | Florida State Board of Education, Public Education Capital Outlay Bonds, Build America Taxable Bonds, Series 2010G, 5.750%, 6/01/35 | 6/19 at 100.00 | AAA | 5,251,950 | ||||||
| Georgia – 4.8% (4.0% of Total Investments) | ||||||||||
| 9,000 | Georgia Municipal Electric Authority, Plant Vogtle Units 3 & 4 Project J Bonds, Taxable Build America Bonds Series 2010A, 6.637%, 4/01/57 | No Opt. Call | A+ | 9,360,720 | ||||||
| 15,000 | Georgia Municipal Electric Authority, Plant Vogtle Units 3 & 4 Project P Bonds, Refunding Taxable Build America Bonds Series 2010A, 7.055%, 4/01/57 | No Opt. Call | A– | 15,105,750 | ||||||
| 2,602 | Liberty County Industrial Authority, Georgia, Revenue Bonds, Series 2011C, 1.000%, 7/01/18 | 1/14 at 100.00 | N/R | 1,241,755 | ||||||
| 26,602 | Total Georgia | 25,708,225 | ||||||||
| Illinois – 15.5% (12.8% of Total Investments) | ||||||||||
| 4,200 | Chicago Transit Authority, Illinois, Sales Tax Receipts Revenue Bonds, Federally Taxable Build America Bonds, Series 2010B, 6.200%, 12/01/40 | No Opt. Call | AA | 4,421,424 | ||||||
| 10,875 | Chicago, Illinois, General Airport Revenue Bonds, O’Hare International Airport, Third Lien, Build America Taxable Bond Series 2010B, 6.845%, 1/01/38 | 1/20 at 100.00 | A2 | 11,612,216 | ||||||
| 12,090 | Chicago, Illinois, Wastewater Transmission Revenue Bonds, Build America Taxable Bond Series 2010B, 6.900%, 1/01/40 | No Opt. Call | AA | 14,193,902 | ||||||
| 13,195 | Chicago, Illinois, Water Revenue Bonds, Taxable Second Lien Series 2010B, 6.742%, 11/01/40 | No Opt. Call | AA | 14,836,590 | ||||||
| 16,375 | Cook County, Illinois, General Obligation Bonds, Build America Taxable Bonds, Series 2010D, 6.229%, 11/15/34 | No Opt. Call | AA | 16,144,768 | ||||||
| 500 | Illinois Finance Authority, Revenue Bonds, Illinois Institute of Technology, Refunding Series 2006A, 6.100%, 4/01/15 | 10/13 at 100.00 | Baa3 | 494,520 | ||||||
| 14,000 | Illinois State, General Obligation Bonds, Taxable Build America Bonds, Series 2010-3, 6.725%, 4/01/35 | No Opt. Call | A– | 14,080,920 | ||||||
| 4,660 | Illinois Toll Highway Authority, Toll Highway Revenue Bonds, Build America Taxable Bonds, Senior Lien Series 2009A, 6.184%, 1/01/34 | No Opt. Call | AA– | 5,347,443 | ||||||
| 1,440 | Illinois Toll Highway Authority, Toll Highway Revenue Bonds, Build America Taxable Bonds, Senior Lien Series 2009B, 5.851%, 12/01/34 | No Opt. Call | AA– | 1,593,518 | ||||||
| 77,335 | Total Illinois | 82,725,301 | ||||||||
| Indiana – 1.0% (0.8% of Total Investments) | ||||||||||
| 5,000 | Indiana University, Consolidated Revenue Bonds, Build America Taxable Bonds, Series 2010B, 5.636%, 6/01/35 | 6/20 at 100.00 | Aaa | 5,469,800 |
| 16 | Nuveen Investments |
| Principal | Optional Call | |||||||||
| Amount (000) | Description (1) | Provisions (2) | Ratings (3) | Value | ||||||
| Kentucky – 1.6% (1.4% of Total Investments) | ||||||||||
| $ | 5,000 | Kentucky Municipal Power Agency, Power Supply System Revenue Bonds, Prairie State Project, Tender Option Bond Trust B002, 28.786%, 9/01/37 – AGC Insured (IF) | 9/20 at 100.00 | AA– | $ | 6,458,500 | ||||
| 1,950 | Louisville and Jefferson County Metropolitan Sewer District, Kentucky, Sewer and Drainage System Revenue Bonds, Build America Taxable Bonds Series 2010A, 6.250%, 5/15/43 | No Opt. Call | AA | 2,332,727 | ||||||
| 6,950 | Total Kentucky | 8,791,227 | ||||||||
| Louisiana – 4.0% (3.3% of Total Investments) | ||||||||||
| 20,350 | East Baton Rouge Sewerage Commission, Louisiana, Revenue Bonds, Build America Taxable Bonds, Series 2010B, 6.087%, 2/01/45 (UB) (4) | 2/20 at 100.00 | AA | 21,228,510 | ||||||
| Massachusetts – 0.7% (0.5% of Total Investments) | ||||||||||
| 2,000 | Massachusetts, Transportation Fund Revenue Bonds, Accelerated Bridge Program, Tender Option Bond Trust T0004, 25.530%, 6/01/40 (IF) (4) | No Opt. Call | AAA | 3,515,600 | ||||||
| Michigan – 5.7% (4.7% of Total Investments) | ||||||||||
| 13,405 | Detroit City School District, Wayne County, Michigan, General Obligation Bonds, Build America Taxable Bond Series 2009B, 7.747%, 5/01/39 | No Opt. Call | Aa2 | 13,838,652 | ||||||
| 3,440 | Michigan Tobacco Settlement Finance Authority, Tobacco Settlement Asset-Backed Revenue Bonds, Taxable Turbo Series 2006A, 7.309%, 6/01/34 | No Opt. Call | B2 | 2,734,800 | ||||||
| 13,955 | Wayne County Building Authority, Michigan, General Obligation Bonds, Jail Facilities, Federally Taxable Recovery Zone Economic Development Series 2010, 10.000%, 12/01/40 | 12/20 at 100.00 | BBB | 13,670,737 | ||||||
| 30,800 | Total Michigan | 30,244,189 | ||||||||
| Missouri – 0.3% (0.2% of Total Investments) | ||||||||||
| 1,290 | Curators of the University of Missouri, System Facilities Revenue Bonds, Build America Taxable Bonds, Series 2009A, 5.960%, 11/01/39 | No Opt. Call | AA+ | 1,463,376 | ||||||
| Nevada – 5.1% (4.2% of Total Investments) | ||||||||||
| 8,810 | Clark County, Nevada, Airport Revenue Bonds, Senior Lien Series 2009B, 6.881%, 7/01/42 | 7/19 at 100.00 | Aa2 | 9,512,333 | ||||||
| 1,800 | Clark County, Nevada, Airport System Revenue, Taxable Direct Payment Build America Bonds, Senior Series 2010C, 6.820%, 7/01/45 | No Opt. Call | Aa2 | 2,219,580 | ||||||
| 8,800 | Las Vegas Valley Water District, Nevada, Limited Tax General Obligation Bonds, Build America Taxable Bonds, Series 2009C, 7.013%, 6/01/39 | No Opt. Call | AA+ | 9,693,992 | ||||||
| 1,315 | Las Vegas, Nevada, Certificates of Participation, City Hall Project, Build America Federally Taxable Bonds, Series 2009B, 7.800%, 9/01/39 | 9/19 at 100.00 | AA– | 1,488,712 | ||||||
| 4,000 | North Las Vegas, Nevada, General Obligation Water and Wastewater Improvement Bonds, Build America Taxable Bonds, Series 2010A, 6.572%, 6/01/40 | No Opt. Call | BBB+ | 3,153,920 | ||||||
| 1,070 | Reno, Nevada, 1999 Special Assessment District 2 Local Improvement Bonds, ReTRAC Project, Taxable Series 2006, 6.890%, 6/01/16 | No Opt. Call | BBB | 1,095,701 | ||||||
| 25,795 | Total Nevada | 27,164,238 | ||||||||
| New Jersey – 3.7% (3.1% of Total Investments) | ||||||||||
| 3,100 | New Jersey Turnpike Authority, Revenue Bonds, Build America Taxable Bonds, Series 2009F, 7.414%, 1/01/40 | No Opt. Call | A+ | 4,045,872 | ||||||
| 12,535 | New Jersey Turnpike Authority, Revenue Bonds, Build America Taxable Bonds, Series 2010A, 7.102%, 1/01/41 | No Opt. Call | A+ | 15,820,298 | ||||||
| 15,635 | Total New Jersey | 19,866,170 | ||||||||
| New York – 12.4% (10.2% of Total Investments) | ||||||||||
| 25,000 | Dormitory Authority of the State of New York, State Personal Income Tax Revenue Bonds, Build America Taxable Bonds, Series 2010D, 5.600%, 3/15/40 (UB) (4) | No Opt. Call | AAA | 27,167,750 | ||||||
| 5,000 | Long Island Power Authority, New York, Electric System Revenue Bonds, Build America Taxable Bond Series 2010B, 5.850%, 5/01/41 | No Opt. Call | A– | 5,008,550 | ||||||
| 1,815 | Metropolitan Transportation Authority, New York, Dedicated Tax Fund Bonds, Build America Taxable Bonds, Series 2010C, 7.336%, 11/15/39 | No Opt. Call | AA | 2,392,297 | ||||||
| 4,980 | Metropolitan Transportation Authority, New York, Transportation Revenue Bonds, Build America Taxable Bonds, Series 2009A-1, 5.871%, 11/15/39 | No Opt. Call | A | 5,309,427 |
| Nuveen Investments | 17 |
| NBB | Nuveen Build America Bond Fund (continued) |
Portfolio of Investments September 30, 2013 (Unaudited) |
| Principal | Optional Call | |||||||||
| Amount (000) | Description (1) | Provisions (2) | Ratings (3) | Value | ||||||
New York (continued) | ||||||||||
| $ | 2,595 | New York City Municipal Water Finance Authority, New York, Water and Sewer System Revenue Bonds, Second Generation Resolution, Build America Taxable Bonds, Series 2010DD, 5.952%, 6/15/42 | No Opt. Call | AA+ | $ | 3,006,437 | ||||
| 2,025 | New York City Municipal Water Finance Authority, New York, Water and Sewer System Revenue Bonds, Second Generation Resolution, Build America Taxable Bonds, Series 2010DD, 5.952%, 6/15/42 (UB) | No Opt. Call | AA+ | 2,346,064 | ||||||
| 1,595 | New York City Municipal Water Finance Authority, New York, Water and Sewer System Revenue Bonds, Second Generation Resolution, Taxable Tender Option Bonds Trust T30001-2, 26.768%, 6/15/44 (IF) | No Opt. Call | AA+ | 2,712,936 | ||||||
| 6,240 | New York City Transitional Finance Authority, New York, Building Aid Revenue Bonds, Build America Taxable Bond Fiscal 2011 Series 2010S-1B, 6.828%, 7/15/40 | No Opt. Call | AA– | 7,681,378 | ||||||
| 10,000 | New York City Transitional Finance Authority, New York, Future Tax Secured Bonds, Build America Taxable Bonds, Series 2010G-1, 5.467%, 5/01/40 (4) | No Opt. Call | AAA | 10,665,400 | ||||||
| 59,250 | Total New York | 66,290,239 | ||||||||
| Ohio – 6.6% (5.4% of Total Investments) | ||||||||||
| American Municipal Power Inc., Ohio, Combined Hydroelectric Projects Revenue Bonds, Federally Taxable Build America Bonds, Series 2010B: | ||||||||||
| 10,060 | 7.834%, 2/15/41 | No Opt. Call | A | 12,665,842 | ||||||
| 5,000 | 8.084%, 2/15/50 | No Opt. Call | A | 6,515,500 | ||||||
| 15,000 | Northeast Ohio Regional Sewer District, Wastewater Improvement Revenue Bonds, Build America Taxable Bonds, Series 2010, 6.038%, 11/15/40 | 11/20 at 100.00 | AA+ | 16,047,750 | ||||||
| 30,060 | Total Ohio | 35,229,092 | ||||||||
| Oregon – 3.1% (2.5% of Total Investments) | ||||||||||
| 4,000 | Oregon Department of Administrative Services, Certificates of Participation, Federally Taxable Build America Bonds, Tender Option Bond Trust TN-011, 26.644%, 5/01/35 (IF) (4) | 5/20 at 100.00 | AA | 5,973,600 | ||||||
| 9,365 | Warm Springs Reservation Confederated Tribes, Oregon, Tribal Economic Development Bonds, Hydroelectric Revenue Bonds, Pelton Round Butte Project, Refunding Series 2009A, 8.250%, 11/01/19 | No Opt. Call | A3 | 10,447,126 | ||||||
| 13,365 | Total Oregon | 16,420,726 | ||||||||
| Pennsylvania – 1.2% (1.0% of Total Investments) | ||||||||||
| 2,550 | Commonwealth Financing Authority, Pennsylvania, State Appropriation Lease Bonds, Build America Taxable Bonds, Series 2009D, 6.218%, 6/01/39 | No Opt. Call | AA– | 2,787,303 | ||||||
| 2,000 | Pennsylvania State, General Obligation Bonds, Build America Taxable Bonds, Third Series 2010B, 5.850%, 7/15/30 | 7/20 at 100.00 | Aa2 | 2,181,380 | ||||||
| 1,400 | Pennsylvania Turnpike Commission, Turnpike Revenue Bonds, Build America Taxable Bonds, Series 2009A, 6.105%, 12/01/39 | No Opt. Call | A+ | 1,570,422 | ||||||
| 5,950 | Total Pennsylvania | 6,539,105 | ||||||||
| South Carolina – 5.0% (4.1% of Total Investments) | ||||||||||
| 15,000 | South Carolina Public Service Authority, Electric System Revenue Bonds, Santee Cooper, Federally Taxable Build America Series 2010C, 6.454%, 1/01/50 | No Opt. Call | AA– | 16,416,000 | ||||||
| 205 | South Carolina Public Service Authority, Electric System Revenue Bonds, Santee Cooper, Federally Taxable Build America Tender Option Bond Trust T30002, 29.451%, 1/01/50 (IF) | No Opt. Call | AA– | 301,760 | ||||||
| 8,985 | South Carolina Public Service Authority, Electric System Revenue Bonds, Santee Cooper, Federally Taxable Build America Series 2010C, 6.454%, 1/01/50 (UB) | No Opt. Call | AA– | 9,833,184 | ||||||
| 24,190 | Total South Carolina | 26,550,944 | ||||||||
| South Dakota – 0.4% (0.3% of Total Investments) | ||||||||||
| 2,000 | South Dakota Educational Enhancement Funding Corporation, Tobacco Settlement Revenue Bonds, Series 2013A, 3.539%, 6/01/22 | No Opt. Call | A | 1,910,580 |
| 18 | Nuveen Investments |
| Principal | Optional Call | |||||||||
| Amount (000) | Description (1) | Provisions (2) | Ratings (3) | Value | ||||||
| Tennessee – 3.6% (2.9% of Total Investments) | ||||||||||
| $ | 1,040 | Metropolitan Government Nashville & Davidson County Convention Center Authority, Tennessee, Tourism Tax Revenue Bonds, Build America Taxable Bonds, Subordinate Lien Series 2010B, 6.731%, 7/01/43 | No Opt. Call | Aa2 | $ | 1,159,600 | ||||
| 15,000 | Metropolitan Government Nashville & Davidson County Convention Center Authority, Tennessee, Tourism Tax Revenue Bonds, Build America Taxable Bonds, Series 2010A-2, 7.431%, 7/01/43 | No Opt. Call | A1 | 17,890,350 | ||||||
| 16,040 | Total Tennessee | 19,049,950 | ||||||||
| Texas – 10.3% (8.4% of Total Investments) | ||||||||||
| 9,940 | Dallas Convention Center Hotel Development Corporation, Texas, Hotel Revenue Bonds, Build America Taxable Bonds, Series 09B, 7.088%, 1/01/42 | No Opt. Call | A+ | 11,680,792 | ||||||
| 10,000 | North Texas Tollway Authority, System Revenue Bonds, Subordinate Lien Taxable Revenue Bonds, Federally Taxable Build America Bonds, Series 2010-B2, 8.910%, 2/01/30 | 2/20 at 100.00 | Baa3 | 11,400,800 | ||||||
| 15,000 | North Texas Tollway Authority, System Revenue Bonds, Taxable Build America Bond Series 2009B, 6.718%, 1/01/49 | No Opt. Call | A2 | 18,196,050 | ||||||
| 5,000 | San Antonio, Texas, General Obligation Bonds, Build America Taxable Bonds, Series 2010B, 6.038%, 8/01/40 | 8/20 at 100.00 | AAA | 5,483,300 | ||||||
| 7,015 | Texas State, General Obligation Bonds, Transportation Commission, Build America Taxable Bonds, Series 2009A, 5.517%, 4/01/39 | No Opt. Call | AAA | 7,969,250 | ||||||
| 46,955 | Total Texas | 54,730,192 | ||||||||
| Utah – 1.0% (0.8% of Total Investments) | ||||||||||
| 4,000 | Central Utah Water Conservancy District, Utah, Revenue Bonds, Federally Taxable Build America Bonds, Series 2010A, 5.700%, 10/01/40 | 4/20 at 100.00 | AA+ | 4,234,520 | ||||||
| 1,000 | Tooele County Municipal Building Authority, Utah, Lease Revenue Bonds, Build America Bond Series 2010A-2, 8.000%, 12/15/32 | 12/20 at 100.00 | A | 1,008,500 | ||||||
| 5,000 | Total Utah | 5,243,020 | ||||||||
| Vermont – 1.1% (0.9% of Total Investments) | ||||||||||
| 5,000 | University of Vermont and State Agricultural College, Revenue Bonds, Build America Bonds Series 2010, 6.428%, 10/01/44 | No Opt. Call | Aa3 | 5,666,350 | ||||||
| Virginia – 3.2% (2.6% of Total Investments) | ||||||||||
| 4,300 | Metropolitan Washington Airports Authority, Virginia, Dulles Toll Road Revenue Bonds, Series 2009D, 7.462%, 10/01/46 – AGC Insured | No Opt. Call | BBB+ | 4,980,647 | ||||||
| 10,000 | Metropolitan Washington Airports Authority, Virginia, Dulles Toll Road Revenue Bonds, Dulles Metrorail Capital Improvement Project, Build America Taxable Bonds, Series 2010D, 8.000%, 10/01/47 | No Opt. Call | BBB | 10,963,000 | ||||||
| 1,660 | Tobacco Settlement Financing Corporation of Virginia, Tobacco Settlement Asset Backed Bonds, Refunding Senior Lien Series 2007A1, 6.706%, 6/01/46 | 12/13 at 100.00 | B2 | 1,155,094 | ||||||
| 15,960 | Total Virginia | 17,098,741 | ||||||||
| Washington – 2.4% (2.0% of Total Investments) | ||||||||||
| 2,000 | Grays Harbor County Public Utility District 1, Washington, Electric System Revenue Bonds, Taxable Build America Bonds – Direct Payment, Series 2010A, 6.707%, 7/01/40 | No Opt. Call | A1 | 2,151,120 | ||||||
| 5,000 | Mason County Public Utility District 3, Washington, Electric Revenue Bonds, Build America Taxable Bonds, Series 2010B, 6.347%, 12/01/40 | 6/20 at 100.00 | Aa3 | 5,092,300 | ||||||
| 4,000 | Seattle, Washington, Municipal Light and Power Revenue Bonds, Federally Taxable Build America Bonds, Tender Option Bond Trust T0001, 24.384%, 2/01/40 (IF) (4) | No Opt. Call | AA | 5,614,400 | ||||||
| 11,000 | Total Washington | 12,857,820 | ||||||||
| $ | 576,572 | Total Long-Term Investments (cost $620,992,872) | 646,867,472 |
| Nuveen Investments | 19 |
| NBB | Nuveen Build America Bond Fund (continued) |
Portfolio of Investments September 30, 2013 (Unaudited) |
| Principal | ||||||||||
| Amount (000) | Description (1) | Coupon | Maturity | Value | ||||||
| SHORT-TERM INVESTMENTS – 0.3% (0.3% of Total Investments) | ||||||||||
| $ | 1,896 | Repurchase Agreement with State Street Bank, dated 9/30/13, repurchase price $1,895,718, collateralized by $1,930,000 U.S. Treasury Notes, 0.625%, due 7/15/16, value $1,934,786 | 0.000% | 10/01/13 | $ | 1,895,718 | ||||
| Total Short-Term Investments (cost $1,895,718) | 1,895,718 | |||||||||
| Total Investments (cost $622,888,590) – 121.6% | 648,763,190 | |||||||||
| Borrowings – (16.7)% (5), (6) | (89,000,000 | ) | ||||||||
| Floating Rate Obligations – (9.9)% | (53,090,000 | ) | ||||||||
| Other Assets Less Liabilities – 5.0% (7) | 26,797,956 | |||||||||
| Net Assets – 100% | $ | 533,471,146 |
Investments in Derivatives as of September 30, 2013
Swaps outstanding:
| Fund | Fixed Rate | Unrealized | |||||||||||||||||||||||
| Notional | Pay/Receive | Floating Rate | Fixed Rate | Payment | Effective | Termination | Appreciation | ||||||||||||||||||
| Counterparty | Amount | Floating Rate | Index | (Annualized | ) | Frequency | Date (8) | Date | (Depreciation) (7) | ||||||||||||||||
| Barclays Bank PLC | $ | 60,500,000 | Receive | 1-Month USD-LIBOR | 1.450 | % | Monthly | 10/01/14 | 10/01/18 | $ | 737,801 | ||||||||||||||
| JPMorgan | 19,200,000 | Receive | 1-Month USD-LIBOR | 1.193 | Monthly | 3/21/11 | 3/21/14 | (95,017 | ) | ||||||||||||||||
| Morgan Stanley | 19,200,000 | Receive | 1-Month USD-LIBOR | 2.064 | Monthly | 3/21/11 | 3/21/16 | (750,567 | ) | ||||||||||||||||
| Morgan Stanley | 60,500,000 | Receive | 1-Month USD-LIBOR | 1.764 | Monthly | 10/01/14 | 12/01/19 | 1,215,987 | |||||||||||||||||
| Morgan Stanley | 135,000,000 | Receive | 3-Month USD-LIBOR | 3.035 | Semi-Annually | 2/21/14 | 2/21/41 | 16,444,653 | |||||||||||||||||
| $ | 294,400,000 | $ | 17,552,857 | ||||||||||||||||||||||
| (1) | All percentages shown in the Portfolio of Investments are based on net assets unless otherwise noted. |
| (2) | Optional Call Provisions: Dates (month and year) and prices of the earliest optional call or redemption. There may be other call provisions at varying prices at later dates. Certain mortgage-backed securities may be subject to periodic principal paydowns. |
| (3) | Ratings: Using the highest of Standard & Poor’s Group (“Standard & Poor’s”), Moody’s Investors Service, Inc. (“Moody’s”) or Fitch, Inc. (“Fitch”) rating. Ratings below BBB by Standard & Poor’s, Baa by Moody’s or BBB by Fitch are considered to be below investment grade. Holdings designated N/R are not rated by any of these national rating agencies. |
| (4) | Investment, or portion of investment, has been pledged to collateralize the net payment obligations for investments in derivatives and/or inverse floating rate transactions. |
| (5) | Borrowings as a percentage of Total Investments is 13.7%. |
| (6) | The Fund segregates 100% of its eligible investments in the Portfolio of Investments as collateral for Borrowings. |
| (7) | Other Assets Less Liabilities includes the Unrealized Appreciation (Depreciation) of derivative instruments as listed within Investments in Derivatives as of the end of the reporting period. |
| (8) | Effective date represents the date on which both the Fund and Counterparty commence interest payment accruals on each swap contract. |
| (IF) | Inverse floating rate investment. |
| (UB) | Underlying bond of an inverse floating rate trust reflected as a financing transaction. See Notes to Financial Statements, Note 3 – Portfolio Securities and Investments in Derivatives, Inverse Floating Rate Securities for more information. |
| USD-LIBOR | United States Dollar-London Inter-Bank Offered Rate. |
See accompanying notes to financial statements.
| 20 | Nuveen Investments |
| NBD | |
| Nuveen Build America Bond Opportunity Fund | |
| Portfolio of Investments | |
| September 30, 2013 (Unaudited) |
| Principal | Optional Call | |||||||||
| Amount (000) | Description (1) | Provisions (2) | Ratings (3) | Value | ||||||
| LONG-TERM INVESTMENTS – 106.4% (99.8% of Total Investments) | ||||||||||
| MUNICIPAL BONDS – 106.4% (99.8% of Total Investments) | ||||||||||
| Alabama – 0.6% (0.6% of Total Investments) | ||||||||||
| $ | 1,000 | Baptist Health Care Authority, Alabama, An Affiliate of UAB Health System, Taxable Bond Series 2013A, 5.500%, 11/15/43 | No Opt. Call | A3 | $ | 899,340 | ||||
| California – 18.7% (17.5% of Total Investments) | ||||||||||
| 1,500 | California State Public Works Board, Lease Revenue Bonds, Various Capital Projects, Build America Taxable Bond Series 2009G-2, 8.361%, 10/01/34 | No Opt. Call | A2 | 1,830,630 | ||||||
| 675 | City and County of San Francisco Redevelopment Financing Authority, California, Taxable Tax Allocation Revenue Bonds, San Francisco Redevelopment Projects, Series 2009F, 8.406%, 8/01/39 | No Opt. Call | A | 754,556 | ||||||
| 2,000 | Los Angeles Community College District, Los Angeles County, California, General Obligation Bonds, Tender Option Bond Trust TN027, 29.857%, 8/01/49 (IF) (4) | No Opt. Call | Aa1 | 4,433,100 | ||||||
| 3,000 | Los Angeles County Public Works Financing Authority, California, Lease Revenue Bonds, Multiple Capital Projects I, Build America Taxable Bond Series 2010B, 7.618%, 8/01/40 | No Opt. Call | AA– | 3,596,430 | ||||||
| 2,650 | Los Angeles Department of Airports, California, Revenue Bonds, Los Angeles International Airport, Build America Taxable Bonds, Series 2009C, 6.582%, 5/15/39 | No Opt. Call | AA– | 3,149,843 | ||||||
| 2,000 | Los Angeles Department of Water and Power, California, Water System Revenue Bonds, Tender Option Bond Trust T0003, 29.702%, 7/01/42 (IF) (4) | No Opt. Call | AA | 4,632,500 | ||||||
| 1,000 | Oakland Redevelopment Agency, California, Subordinated Housing Set Aside Revenue Bonds, Federally Taxable Series 2011A-T, 7.500%, 9/01/19 | No Opt. Call | A | 1,076,480 | ||||||
| 2,175 | San Diego County Regional Transportation Commission, California, Sales Tax Revenue Bonds, Build America Taxable Bonds Series 2010A, 5.911%, 4/01/48 (4) | No Opt. Call | AAA | 2,497,988 | ||||||
| 2,000 | San Francisco City and County, California, Certificates of Participation, 525 Golden Gate Avenue, San Francisco Public Utilities Commission Office Project, Tender Option Bond Trust B001-2, 29.357%, 11/01/41 (IF) | No Opt. Call | AA | 2,593,200 | ||||||
| 315 | Stanton Redevelopment Agency, California, Consolidated Project Tax Allocation Bonds, Series 2011A, 7.000%, 12/01/19 | No Opt. Call | A– | 326,794 | ||||||
| 3,000 | The Regents of the University of California, Medical Center Pooled Revenue Bonds, Build America Taxable Bonds, Series 2010H, 6.548%, 5/15/48 | No Opt. Call | Aa2 | 3,553,500 | ||||||
| 20,315 | Total California | 28,445,021 | ||||||||
| Colorado – 4.5% (4.2% of Total Investments) | ||||||||||
| 4,000 | Colorado State Bridge Enterprise Revenue Bonds, Federally Taxable Build America Series 2010A, 6.078%, 12/01/40 | No Opt. Call | AA | 4,534,280 | ||||||
| 2,000 | Regional Transportation District, Colorado, Sales Tax Revenue Bonds, Fastracks Project, Build America Series 2010B, 5.844%, 11/01/50 | No Opt. Call | AA+ | 2,315,480 | ||||||
| 6,000 | Total Colorado | 6,849,760 | ||||||||
| Connecticut – 0.8% (0.7% of Total Investments) | ||||||||||
| 1,000 | Harbor Point Infrastructure Improvement District, Connecticut, Special Obligation Revenue Bonds, Harbor Point Project, Federally Taxable – Issuer Subsidy – Recovery Zone Economic Development Bond Series 2010B, 12.500%, 4/01/39 | 4/20 at 100.00 | N/R | 1,220,740 | ||||||
| District of Columbia – 0.6% (0.6% of Total Investments) | ||||||||||
| 800 | District of Columbia, Income Tax Secured Revenue Bonds, Build America Taxable Bonds, Series 2009E, 5.591%, 12/01/34 | No Opt. Call | AAA | 903,560 | ||||||
| Georgia – 3.7% (3.4% of Total Investments) | ||||||||||
| 2,000 | Georgia Municipal Electric Authority, Plant Vogtle Units 3 & 4 Project J Bonds, Taxable Build America Bonds Series 2010A, 6.637%, 4/01/57 | No Opt. Call | A+ | 2,080,160 |
| Nuveen Investments | 21 |
| NBD | Nuveen Build America Bond Opportunity Fund (continued) |
Portfolio of Investments September 30, 2013 (Unaudited) |
| Principal | Optional Call | |||||||||
| Amount (000) | Description (1) | Provisions (2) | Ratings (3) | Value | ||||||
Georgia (continued) | ||||||||||
| $ | 3,000 | Georgia Municipal Electric Authority, Plant Vogtle Units 3 & 4 Project P Bonds, Refunding Taxable Build America Bonds Series 2010A, 7.055%, 4/01/57 | No Opt. Call | A– | $ | 3,021,150 | ||||
| 1,058 | Liberty County Industrial Authority, Georgia, Revenue Bonds, Series 2011C, 1.000%, 7/01/18 | 1/14 at 100.00 | N/R | 504,980 | ||||||
| 6,058 | Total Georgia | 5,606,290 | ||||||||
| Illinois – 15.6% (14.6% of Total Investments) | ||||||||||
| 3,575 | Chicago Transit Authority, Illinois, Sales Tax Receipts Revenue Bonds, Federally Taxable Build America Bonds, Series 2010B, 6.200%, 12/01/40 | No Opt. Call | AA | 3,763,474 | ||||||
| 1,010 | Chicago, Illinois, General Airport Revenue Bonds, O’Hare International Airport, Third Lien, Build America Taxable Bond Series 2010B, 6.845%, 1/01/38 | 1/20 at 100.00 | A2 | 1,078,468 | ||||||
| 5,160 | Chicago, Illinois, Wastewater Transmission Revenue Bonds, Build America Taxable Bond Series 2010B, 6.900%, 1/01/40 | No Opt. Call | AA | 6,057,940 | ||||||
| 4,000 | Chicago, Illinois, Water Revenue Bonds, Taxable Second Lien Series 2010B, 6.742%, 11/01/40 | No Opt. Call | AA | 4,497,640 | ||||||
| 1,000 | Cook County, Illinois, General Obligation Bonds, Build America Taxable Bonds, Series 2010D, 6.229%, 11/15/34 | No Opt. Call | AA | 985,940 | ||||||
| 500 | Illinois Finance Authority, Revenue Bonds, Illinois Institute of Technology, Refunding Series 2006A, 6.100%, 4/01/15 | 10/13 at 100.00 | Baa3 | 494,520 | ||||||
| 2,000 | Illinois State, General Obligation Bonds, Build America Taxable Bonds, Series 2010-5, 7.350%, 7/01/35 | No Opt. Call | A– | 2,129,820 | ||||||
| 4,110 | Illinois Toll Highway Authority, Toll Highway Revenue Bonds, Build America Taxable Bonds, Senior Lien Series 2009A, 6.184%, 1/01/34 | No Opt. Call | AA– | 4,716,307 | ||||||
| 21,355 | Total Illinois | 23,724,109 | ||||||||
| Indiana – 2.3% (2.1% of Total Investments) | ||||||||||
| 2,980 | Indianapolis Local Public Improvement Bond Bank, Indiana, Build America Taxable Bonds, Series 2010B-2, 6.116%, 1/15/40 | No Opt. Call | AA+ | 3,468,154 | ||||||
| Kentucky – 2.4% (2.2% of Total Investments) | ||||||||||
| 3,000 | Louisville and Jefferson County Metropolitan Sewer District, Kentucky, Sewer and Drainage System Revenue Bonds, Build America Taxable Bonds Series 2010A, 6.250%, 5/15/43 | No Opt. Call | AA | 3,588,810 | ||||||
| Massachusetts – 2.3% (2.2% of Total Investments) | ||||||||||
| 2,000 | Massachusetts, Transportation Fund Revenue Bonds, Accelerated Bridge Program, Tender Option Bond Trust T0004, 25.530%, 6/01/40 (IF) (4) | No Opt. Call | AAA | 3,515,600 | ||||||
| Michigan – 4.6% (4.3% of Total Investments) | ||||||||||
| 500 | Detroit City School District, Wayne County, Michigan, General Obligation Bonds, Build America Taxable Bond Series 2009B, 7.747%, 5/01/39 | No Opt. Call | Aa2 | 516,175 | ||||||
| 3,000 | Detroit City School District, Wayne County, Michigan, General Obligation Bonds, Build America Taxable Bond Series 2010B, 6.845%, 5/01/40 | 5/20 at 100.00 | Aa2 | 2,928,090 | ||||||
| 2,090 | Michigan Tobacco Settlement Finance Authority, Tobacco Settlement Asset-Backed Revenue Bonds, Taxable Turbo Series 2006A, 7.309%, 6/01/34 | No Opt. Call | B2 | 1,661,550 | ||||||
| 2,000 | Wayne County Building Authority, Michigan, General Obligation Bonds, Jail Facilities, Federally Taxable Recovery Zone Economic Development Series 2010, 10.000%, 12/01/40 | 12/20 at 100.00 | BBB | 1,959,260 | ||||||
| 7,590 | Total Michigan | 7,065,075 | ||||||||
| Mississippi – 1.8% (1.7% of Total Investments) | ||||||||||
| 2,585 | Mississippi State, General Obligation Bonds, Build America Taxable Bond Series 2010F, 5.245%, 11/01/34 | No Opt. Call | AA+ | 2,738,523 | ||||||
| Missouri – 0.2% (0.2% of Total Investments) | ||||||||||
| 250 | Curators of the University of Missouri, System Facilities Revenue Bonds, Build America Taxable Bonds, Series 2009A, 5.960%, 11/01/39 | No Opt. Call | AA+ | 283,600 | ||||||
| Nevada – 2.9% (2.7% of Total Investments) | ||||||||||
| 1,950 | Clark County, Nevada, Airport Revenue Bonds, Senior Lien Series 2009B, 6.881%, 7/01/42 | 7/19 at 100.00 | Aa2 | 2,105,454 | ||||||
| 1,500 | Clark County, Nevada, Airport System Revenue, Taxable Direct Payment Build America Bonds, Senior Series 2010C, 6.820%, 7/01/45 | No Opt. Call | Aa2 | 1,849,650 |
| 22 | Nuveen Investments |
| Principal | Optional Call | |||||||||
| Amount (000) | Description (1) | Provisions (2) | Ratings (3) | Value | ||||||
Nevada (continued) | ||||||||||
| $ | 430 | Las Vegas Valley Water District, Nevada, Limited Tax General Obligation Bonds, Build America Taxable Bonds, Series 2009C, 7.013%, 6/01/39 | No Opt. Call | AA+ | $ | 473,684 | ||||
| 3,880 | Total Nevada | 4,428,788 | ||||||||
| New Jersey – 7.0% (6.5% of Total Investments) | ||||||||||
| 3,055 | New Jersey Transportation Trust Fund Authority, Transportation System Bonds, Build America Bonds Issuer Subsidy Program, Series 2010C, 5.754%, 12/15/28 | No Opt. Call | A+ | 3,330,836 | ||||||
| 4,000 | New Jersey Turnpike Authority, Revenue Bonds, Build America Taxable Bonds, Series 2010A, 7.102%, 1/01/41 | No Opt. Call | A+ | 5,048,360 | ||||||
| 2,070 | Rutgers State University, New Jersey, Revenue Bonds, Build America Taxable Bond Series 2010H, 5.665%, 5/01/40 | No Opt. Call | AA– | 2,234,048 | ||||||
| 9,125 | Total New Jersey | 10,613,244 | ||||||||
| New York – 12.4% (11.7% of Total Investments) | ||||||||||
| 2,000 | Dormitory Authority of the State of New York, State Personal Income Tax Revenue Bonds, Tender Option Bond Trust B004, 25.229%, 3/15/40 (IF) | No Opt. Call | AAA | 2,867,100 | ||||||
| 3,270 | Metropolitan Transportation Authority, New York, Transportation Revenue Bonds, Federally Taxable Issuer Subsidy Build America Bonds, Series 2010A, 6.668%, 11/15/39 | 11/13 at 100.00 | A | 3,879,790 | ||||||
| 1,500 | New York City Municipal Water Finance Authority, New York, Water and Sewer System Revenue Bonds, Second Generation Resolution, Build America Taxable Bonds, Fiscal 2011 Series AA, 5.440%, 6/15/43 | No Opt. Call | AA+ | 1,612,395 | ||||||
| 2,000 | New York City Municipal Water Finance Authority, New York, Water and Sewer System Revenue Bonds, Second Generation Resolution, Taxable Tender Option Bonds Trust T30001-2, 26.768%, 6/15/44 (IF) | No Opt. Call | AA+ | 3,401,800 | ||||||
| 3,500 | New York City Transitional Finance Authority, New York, Building Aid Revenue Bonds, Build America Taxable Bond Fiscal 2011 Series 2010S-1B, 6.828%, 7/15/40 | No Opt. Call | AA– | 4,308,465 | ||||||
| 2,500 | New York City, New York, General Obligation Bonds, Federally Taxable Build America Bonds, Series 2010-F1, 6.646%, 12/01/31 | 12/20 at 100.00 | AA | 2,877,500 | ||||||
| 14,770 | Total New York | 18,947,050 | ||||||||
| North Carolina – 1.1% (1.0% of Total Investments) | ||||||||||
| 1,550 | North Carolina Turnpike Authority, Triangle Expressway System State Annual Appropriation Revenue Bonds, Federally Taxable Issuer Subsidy Build America Bonds, Series 2009B, 6.700%, 1/01/39 | 1/19 at 100.00 | AA | 1,685,532 | ||||||
| Ohio – 4.2% (4.0% of Total Investments) | ||||||||||
| 3,000 | American Municipal Power Inc., Ohio, Meldahl Hydroelectric Projects Revenue Bonds, Federally Taxable Build America Bonds, Series 2010B, 7.499%, 2/15/50 | No Opt. Call | A | 3,632,400 | ||||||
| 2,650 | Northeast Ohio Regional Sewer District, Wastewater Improvement Revenue Bonds, Build America Taxable Bonds, Series 2010, 6.038%, 11/15/40 | 11/20 at 100.00 | AA+ | 2,835,103 | ||||||
| 5,650 | Total Ohio | 6,467,503 | ||||||||
| Pennsylvania – 1.7% (1.6% of Total Investments) | ||||||||||
| 2,500 | Pennsylvania Turnpike Commission, Turnpike Revenue Bonds, Build America Taxable Bonds, Series 2010B, 5.511%, 12/01/45 | No Opt. Call | A+ | 2,630,750 | ||||||
| South Carolina – 8.4% (7.9% of Total Investments) | ||||||||||
| 2,395 | South Carolina Public Service Authority, Electric System Revenue Bonds, Santee Cooper, Federally Taxable Build America Series 2010C, 6.454%, 1/01/50 | No Opt. Call | AA– | 2,621,088 | ||||||
| 205 | South Carolina Public Service Authority, Electric System Revenue Bonds, Santee Cooper, Federally Taxable Build America Tender Option Bond Trust T30002, 29.451%, 1/01/50 (IF) | No Opt. Call | AA– | 301,760 | ||||||
| 8,985 | South Carolina Public Service Authority, Electric System Revenue Bonds, Santee Cooper, Federally Taxable Build America Series 2010C, 6.454%, 1/01/50 (UB) | No Opt. Call | AA– | 9,833,184 | ||||||
| 11,585 | Total South Carolina | 12,756,032 |
| Nuveen Investments | 23 |
| NBD | Nuveen Build America Bond Opportunity Fund (continued) |
Portfolio of Investments September 30, 2013 (Unaudited) |
| Principal | Optional Call | |||||||||
| Amount (000) | Description (1) | Provisions (2) | Ratings (3) | Value | ||||||
| South Dakota – 0.6% (0.6% of Total Investments) | ||||||||||
| $ | 1,000 | South Dakota Educational Enhancement Funding Corporation, Tobacco Settlement Revenue Bonds, Series 2013A, 3.539%, 6/01/22 | No Opt. Call | A | $ | 955,290 | ||||
| Tennessee – 2.2% (2.1% of Total Investments) | ||||||||||
| 3,000 | Metropolitan Government Nashville & Davidson County Convention Center Authority, Tennessee, Tourism Tax Revenue Bonds, Build America Taxable Bonds, Subordinate Lien Series 2010B, 6.731%, 7/01/43 | No Opt. Call | Aa2 | 3,345,000 | ||||||
| Texas – 4.2% (3.9% of Total Investments) | ||||||||||
| 2,000 | Dallas Area Rapid Transit, Texas, Senior Lien Sales Tax Revenue Bonds, Build America Taxable Bonds, Series 2009B, 5.999%, 12/01/44 | No Opt. Call | AA+ | 2,333,140 | ||||||
| 2,000 | Dallas Convention Center Hotel Development Corporation, Texas, Hotel Revenue Bonds, Build America Taxable Bonds, Series 09B, 7.088%, 1/01/42 | No Opt. Call | A+ | 2,350,260 | ||||||
| 1,500 | North Texas Tollway Authority, System Revenue Bonds, Subordinate Lien Taxable Revenue Bonds, Federally Taxable Build America Bonds, Series 2010-B2, 8.910%, 2/01/30 | 2/20 at 100.00 | Baa3 | 1,710,120 | ||||||
| 5,500 | Total Texas | 6,393,520 | ||||||||
| Virginia – 2.9% (2.8% of Total Investments) | ||||||||||
| 2,110 | Metropolitan Washington Airports Authority, Virginia, Dulles Toll Road Revenue Bonds, Series 2009D, 7.462%, 10/01/46 – AGC Insured | No Opt. Call | BBB+ | 2,443,992 | ||||||
| 2,915 | Tobacco Settlement Financing Corporation of Virginia, Tobacco Settlement Asset Backed Bonds, Refunding Senior Lien Series 2007A1, 6.706%, 6/01/46 | 12/13 at 100.00 | B2 | 2,028,374 | ||||||
| 5,025 | Total Virginia | 4,472,366 | ||||||||
| Washington – 0.7% (0.7% of Total Investments) | ||||||||||
| 1,000 | Washington State Convention Center Public Facilities District, Lodging Tax Revenue Bonds, Build America Taxable Bond Series 2010B, 6.790%, 7/01/40 | No Opt. Call | Aa3 | 1,089,620 | ||||||
| $ | 139,518 | Total Long-Term Investments (cost $143,462,465) | 162,093,277 |
| Principal | ||||||||||
| Amount (000) | Description (1) | Coupon | Maturity | Value | ||||||
| SHORT-TERM INVESTMENTS – 0.2% (0.2% of Total Investments) | ||||||||||
| $ | 347 | Repurchase Agreement with State Street Bank, dated 9/30/13, repurchase price $347,437, collateralized by $355,000 U.S. Treasury Notes, 0.625%, due 7/15/16, value $355,880 | 0.000% | 10/01/13 | $ | 347,437 | ||||
| Total Short-Term Investments (cost $347,437) | 347,437 | |||||||||
| Total Investments (cost $143,809,902) – 106.6% | 162,440,714 | |||||||||
| Borrowings – (7.5)% (5), (6) | (11,500,000 | ) | ||||||||
| Floating Rate Obligations – (4.7)% | (7,190,000 | ) | ||||||||
| Other Assets Less Liabilities – 5.6% (7) | 8,569,391 | |||||||||
| Net Assets – 100% | $ | 152,320,105 |
| 24 | Nuveen Investments |
Investments in Derivatives as of September 30, 2013
Swaps outstanding:
| Fund | Floating | Fixed | Fixed Rate | Unrealized | ||||||
| Notional | Pay/Receive | Rate | Rate | Payment | Effective | Termination | Appreciation | |||
| Counterparty | Amount | Floating Rate | Index | (Annualized | ) | Frequency | Date (8) | Date | (Depreciation) (7) | |
| Barclays Bank PLC | $ 11,200,000 | Receive | 1-Month USD-LIBOR | 2.240 | % | Monthly | 12/17/10 | 12/17/15 | $ (458,113 | ) |
| Barclays Bank PLC | 14,750,000 | Receive | 1-Month USD-LIBOR | 1.450 | Monthly | 10/01/14 | 10/01/18 | 179,877 | ||
| Barclays Bank PLC | 20,000,000 | Receive | 3-Month USD-LIBOR | 3.280 | Semi-Annually | 2/19/15 | 2/19/42 | 2,179,841 | ||
| Morgan Stanley | 11,200,000 | Receive | 1-Month USD-LIBOR | 1.295 | Monthly | 12/17/10 | 12/17/13 | (31,421 | ) | |
| Morgan Stanley | 14,750,000 | Receive | 1-Month USD-LIBOR | 1.875 | Monthly | 10/01/14 | 6/01/20 | 350,033 | ||
| Morgan Stanley | 18,000,000 | Receive | 3-Month USD-LIBOR | 3.098 | Semi-Annually | 1/24/14 | 1/24/41 | 1,943,307 | ||
| Morgan Stanley | 15,000,000 | Receive | 3-Month USD-LIBOR | 3.035 | Semi-Annually | 2/21/14 | 2/21/41 | 1,827,184 | ||
| $104,900,000 | $5,990,708 |
| (1) | All percentages shown in the Portfolio of Investments are based on net assets unless otherwise noted. |
| (2) | Optional Call Provisions: Dates (month and year) and prices of the earliest optional call or redemption. There may be other call provisions at varying prices at later dates. Certain mortgage-backed securities may be subject to periodic principal paydowns. |
| (3) | Ratings: Using the highest of Standard & Poor’s Group (“Standard & Poor’s”), Moody’s Investors Service, Inc. (“Moody’s”) or Fitch, Inc. (“Fitch”) rating. Ratings below BBB by Standard & Poor’s, Baa by Moody’s or BBB by Fitch are considered to be below investment grade. Holdings designated N/R are not rated by any of these national rating agencies. |
| (4) | Investment, or portion of investment, has been pledged to collateralize the net payment obligations for investments in derivatives and/or inverse floating rate transactions. |
| (5) | Borrowings as a percentage of Total Investments is 7.1%. |
| (6) | The Fund segregates 100% of its eligible investments in the Portfolio of Investments as collateral for Borrowings. |
| (7) | Other Assets Less Liabilities includes the Unrealized Appreciation (Depreciation) of derivative instruments as listed within Investments in Derivatives as of the end of the reporting period. |
| (8) | Effective date represents the date on which both the Fund and Counterparty commence interest payment accruals on each swap contract. |
| (IF) | Inverse floating rate investment. |
| (UB) | Underlying bond of an inverse floating rate trust reflected as a financing transaction. See Notes to Financial Statements, Note 3 – Portfolio Securities and Investments in Derivatives, Inverse Floating Rate Securities for more information. |
| USD-LIBOR | United States Dollar-London Inter-Bank Offered Rate. |
See accompanying notes to financial statements.
| Nuveen Investments | 25 |
| Statement of | |
| Assets & Liabilities | |
| September 30, 2013 (Unaudited) | |
| Build America | Build America | ||||||
| Bond | Bond Opportunity | ||||||
| (NBB | ) | (NBD | ) | ||||
| Assets | |||||||
| Long-term investments, at value (cost $620,992,872 and $143,462,465, respectively) | $ | 646,867,472 | $ | 162,093,277 | |||
| Short-term investments, at value (cost approximates value) | 1,895,718 | 347,437 | |||||
| Receivable for interest | 12,996,338 | 3,515,794 | |||||
| Unrealized appreciation on swaps, net | 17,647,874 | 5,990,708 | |||||
| Other assets | 52,656 | 10,727 | |||||
| Total assets | 679,460,058 | 171,957,943 | |||||
| Liabilities | |||||||
| Borrowings | 89,000,000 | 11,500,000 | |||||
| Floating rate obligations | 53,090,000 | 7,190,000 | |||||
| Unrealized depreciation on swaps | 95,017 | — | |||||
| Payable for: | |||||||
| Dividends | 2,960,875 | 769,077 | |||||
| Investments purchased | 259,338 | — | |||||
| Accrued expenses: | |||||||
| Interest on borrowings | 67,696 | 8,751 | |||||
| Management fees | 374,608 | 110,637 | |||||
| Trustees fees | 21,216 | 1,066 | |||||
| Other | 120,162 | 58,307 | |||||
| Total liabilities | 145,988,912 | 19,637,838 | |||||
| Net assets | $ | 533,471,146 | $ | 152,320,105 | |||
| Shares outstanding | 26,461,985 | 7,205,250 | |||||
| Net asset value per share outstanding | $ | 20.16 | $ | 21.14 | |||
| Net assets consist of: | |||||||
| Shares, $.01 par value per share | $ | 264,620 | $ | 72,053 | |||
| Paid-in surplus | 504,137,904 | 137,235,389 | |||||
| Undistributed (Over-distribution of) net investment income | (53,462 | ) | 172,778 | ||||
| Accumulated net realized gain (loss) | (14,305,373 | ) | (9,781,635 | ) | |||
| Net unrealized appreciation (depreciation) | 43,427,457 | 24,621,520 | |||||
| Net assets | $ | 533,471,146 | $ | 152,320,105 | |||
| Authorized shares | Unlimited | Unlimited | |||||
See accompanying notes to financial statements.
| 26 | Nuveen Investments |
| Statement of | |
| Operations | |
| Six Months Ended September 30, 2013 (Unaudited) | |
| Build America | Build America | ||||||
| Bond | Bond Opportunity | ||||||
| (NBB | ) | (NBD | ) | ||||
| Investment Income | $ | 21,519,546 | $ | 5,908,824 | |||
| Expenses | |||||||
| Management fees | 2,380,719 | 706,208 | |||||
| Shareholder servicing agent fees and expenses | 82 | 82 | |||||
| Interest expense | 636,722 | 89,478 | |||||
| Custodian fees and expenses | 51,703 | 20,395 | |||||
| Trustees fees and expenses | 8,599 | 2,279 | |||||
| Professional fees | 28,379 | 26,945 | |||||
| Shareholder reporting expenses | 58,947 | 15,646 | |||||
| Stock exchange listing fees | 4,304 | 4,304 | |||||
| Investor relations expenses | 7,395 | 1,849 | |||||
| Other expenses | 11,859 | 4,474 | |||||
| Total expenses | 3,188,709 | 871,660 | |||||
| Net investment income (loss) | 18,330,837 | 5,037,164 | |||||
| Realized and Unrealized Gain (Loss) | |||||||
| Net realized gain (loss) from: | |||||||
| Investments | 1,500,378 | 556,074 | |||||
| Swaps | (277,550 | ) | (174,661 | ) | |||
| Change in net unrealized appreciation (depreciation) of: | |||||||
| Investments | (84,214,641 | ) | (27,549,284 | ) | |||
| Swaps | 18,105,855 | 6,922,595 | |||||
| Net realized and unrealized gain (loss) | (64,885,958 | ) | (20,245,276 | ) | |||
| Net increase (decrease) in net assets from operations | $ | (46,555,121 | ) | $ | (15,208,112 | ) | |
See accompanying notes to financial statements.
| Nuveen Investments | 27 |
| Statement of | |
Changes in Net Assets (Unaudited) |
| Build America | Build America | |||||||||||||||
| Bond (NBB) | Bond Opportunity (NBD) | |||||||||||||||
| Six Months | Year | Six Months | Year | |||||||||||||
| Ended | Ended | Ended | Ended | |||||||||||||
| 9/30/13 | 3/31/13 | 9/30/13 | 3/31/13 | |||||||||||||
| Operations | ||||||||||||||||
| Net investment income (loss) | $ | 18,330,837 | $ | 35,813,258 | $ | 5,037,164 | $ | 9,669,257 | ||||||||
| Net realized gain (loss) from: | ||||||||||||||||
| Investments | 1,500,378 | 5,671,625 | 556,074 | 1,334,232 | ||||||||||||
| Swaps | (277,550 | ) | (537,486 | ) | (174,661 | ) | 232,303 | |||||||||
| Change in net unrealized appreciation (depreciation) of: | ||||||||||||||||
| Investments | (84,214,641 | ) | 31,778,396 | (27,549,284 | ) | 10,699,578 | ||||||||||
| Swaps | 18,105,855 | (5,779,996 | ) | 6,922,595 | (2,902,583 | ) | ||||||||||
| Net increase (decrease) in net assets from operations | (46,555,121 | ) | 66,945,797 | (15,208,112 | ) | 19,032,787 | ||||||||||
| Distributions to Shareholders | ||||||||||||||||
| From net investment income | (18,086,767 | ) | (34,784,279 | ) | (4,802,299 | ) | (9,280,362 | ) | ||||||||
| Decrease in net assets from distributions to shareholders | (18,086,767 | ) | (34,784,279 | ) | (4,802,299 | ) | (9,280,362 | ) | ||||||||
| Net increase (decrease) in net assets | (64,641,888 | ) | 32,161,518 | (20,010,411 | ) | 9,752,425 | ||||||||||
| Net assets at the beginning of period | 598,113,034 | 565,951,516 | 172,330,516 | 162,578,091 | ||||||||||||
| Net assets at the end of period | $ | 533,471,146 | $ | 598,113,034 | $ | 152,320,105 | $ | 172,330,516 | ||||||||
| Undistributed (Over-distribution of) net investment income at the end of period | $ | (53,462 | ) | $ | (297,532 | ) | $ | 172,778 | $ | (62,087 | ) | |||||
See accompanying notes to financial statements.
| 28 | Nuveen Investments |
| Statement of | |
| Cash Flows | |
| Six Months Ended September 30, 2013 (Unaudited) |
| Build America | Build America | ||||||
| Bond | Bond Opportunity | ||||||
| (NBB | ) | (NBD | ) | ||||
| Cash Flows from Operating Activities: | |||||||
| Net Increase (Decrease) in Net Assets from Operations | $ | (46,555,121 | ) | $ | (15,208,112 | ) | |
| Adjustments to reconcile the net increase (decrease) in net assets from operations to net cash provided by (used in) operating activities: | |||||||
| Purchases of investments | (19,179,258 | ) | (4,726,912 | ) | |||
| Proceeds from sales and maturities of investments | 21,614,029 | 4,304,710 | |||||
| Proceeds from (Purchases of) short-term investments, net | (1,548,317 | ) | 400,565 | ||||
| Proceeds from (Payments for) swap contracts, net | (277,550 | ) | (174,661 | ) | |||
| Amortization (Accretion) of premiums and discounts, net | 355,739 | (2,163 | ) | ||||
| (Increase) Decrease in: | |||||||
| Receivable for interest | (125,656 | ) | (30,941 | ) | |||
| Other assets | (13,590 | ) | (3,693 | ) | |||
| Increase (Decrease) in: | |||||||
| Payable for investments purchased | (1,036,631 | ) | — | ||||
| Accrued interest on borrowings | (7,158 | ) | (925 | ) | |||
| Accrued management fees | (41,713 | ) | (12,981 | ) | |||
| Accrued Trustees fees | 2,713 | 3 | |||||
| Accrued other expenses | (69,942 | ) | (24,941 | ) | |||
| Net realized (gain) loss from: | |||||||
| Investments | (1,500,378 | ) | (556,074 | ) | |||
| Swaps | 277,550 | 174,661 | |||||
| Change in net unrealized (appreciation) depreciation of: | |||||||
| Investments | 84,214,641 | 27,549,284 | |||||
| Swaps | (18,105,855 | ) | (6,922,595 | ) | |||
| Net cash provided by (used in) operating activities | 18,003,503 | 4,765,225 | |||||
| Cash Flows from Financing Activities: | |||||||
| Cash distributions paid to shareholders | (18,003,503 | ) | (4,765,225 | ) | |||
| Net cash provided by (used in) financing activities | (18,003,503 | ) | (4,765,225 | ) | |||
| Net Increase (Decrease) in Cash | — | — | |||||
| Cash at the beginning of period | — | — | |||||
| Cash at the End of Period | $ | — | $ | — | |||
Supplemental Disclosure of Cash Flow Information
| Build America | Build America | ||||||
| Bond | Bond Opportunity | ||||||
| (NBB | ) | (NBD | ) | ||||
| Cash paid for interest (excluding borrowing costs) | $ | 585,173 | $ | 75,963 | |||
See accompanying notes to financial statements.
| Nuveen Investments | 29 |
| Financial | |
Highlights (Unaudited) | |
| Selected data for a share outstanding throughout each period: | |
| Investment Operations | Less Distributions | |||||||||||||||||||||||||||||||||||||||
| Net | Net | From | From | |||||||||||||||||||||||||||||||||||||
| Beginning | Investment | Realized/ | Net | Accumulated | Ending | Ending | ||||||||||||||||||||||||||||||||||
| Net Asset | Income | Unrealized | Investment | Net Realized | Offering | Net Asset | Market | |||||||||||||||||||||||||||||||||
| Value | (Loss | )(a) | Gain (Loss | ) | Total | Income | Gains | Total | Costs | Value | Value | |||||||||||||||||||||||||||||
| Build America Bond (NBB) | ||||||||||||||||||||||||||||||||||||||||
| Year Ended 3/31: | ||||||||||||||||||||||||||||||||||||||||
| 2014(h) | $ | 22.60 | $ | .69 | $ | (2.45 | ) | $ | (1.76 | ) | $ | (.68 | ) | $ | — | $ | (.68 | ) | $ | — | $ | 20.16 | $ | 18.07 | ||||||||||||||||
| 2013 | 21.39 | 1.35 | 1.17 | 2.52 | (1.31 | ) | — | (1.31 | ) | — | 22.60 | 20.97 | ||||||||||||||||||||||||||||
| 2012 | 18.86 | 1.36 | 2.57 | 3.93 | (1.40 | ) | — | (1.40 | ) | — | 21.39 | 20.18 | ||||||||||||||||||||||||||||
| 2011(f) | 19.10 | 1.19 | (.22 | ) | .97 | (1.17 | ) | — | (1.17 | ) | (0.04 | ) | 18.86 | 18.06 | ||||||||||||||||||||||||||
| Build America Bond Opportunity (NBD) | ||||||||||||||||||||||||||||||||||||||||
| Year Ended 3/31: | ||||||||||||||||||||||||||||||||||||||||
| 2014(h) | 23.92 | .70 | (2.81 | ) | (2.11 | ) | (.67 | ) | — | (.67 | ) | — | 21.14 | 18.54 | ||||||||||||||||||||||||||
| 2013 | 22.56 | 1.34 | 1.31 | 2.65 | (1.29 | ) | — | (1.29 | ) | — | 23.92 | 22.12 | ||||||||||||||||||||||||||||
| 2012 | 19.43 | 1.45 | 3.17 | 4.62 | (1.49 | ) | — | (1.49 | ) | — | 22.56 | 20.97 | ||||||||||||||||||||||||||||
| 2011(g) | 19.10 | .47 | .28 | .75 | (.38 | ) | — | (.38 | ) | (0.04 | ) | 19.43 | 18.63 | |||||||||||||||||||||||||||
| Borrowings at the End of Period | ||||||||
| Aggregate | ||||||||
| Amount | Asset | |||||||
| Outstanding | Coverage | |||||||
| (000 | ) | Per $1,000 | ||||||
| Build America Bond (NBB) | ||||||||
| Year Ended 3/31: | ||||||||
| 2014(h) | $ | 89,000 | $ | 6,994 | ||||
| 2013 | 89,000 | 7,720 | ||||||
| 2012 | 44,000 | 13,863 | ||||||
| 2011(f) | 44,000 | 12,341 | ||||||
| Build America Bond Opportunity (NBD) | ||||||||
| Year Ended 3/31: | ||||||||
| 2014(h) | 11,500 | 14,245 | ||||||
| 2013 | 11,500 | 15,985 | ||||||
| 2012 | — | — | ||||||
| 2011(g) | — | — | ||||||
| 30 | Nuveen Investments |
| Ratios/Supplemental Data | ||||||||||||||||||||||
| Ratios to Average | ||||||||||||||||||||||
| Total Returns | Net Assets (c) | |||||||||||||||||||||
| Based on | Based on | Ending | Net | Portfolio | ||||||||||||||||||
| Net Asset | Market | Net Assets | Investment | Turnover | ||||||||||||||||||
| Value | (b) | Value | (b) | (000 | ) | Expenses | (d) | Income (Loss | ) | Rate | (e) | |||||||||||
| (7.88 | )% | (10.76 | )% | $ | 533,471 | 1.12 | %* | 6.45 | %* | 3 | % | |||||||||||
| 12.05 | 10.57 | 598,113 | 1.10 | 6.10 | 7 | |||||||||||||||||
| 21.29 | 19.92 | 565,952 | 1.05 | 6.63 | 18 | |||||||||||||||||
| 4.90 | (3.99 | ) | 499,020 | 1.11 | * | 6.70 | * | 100 | ||||||||||||||
| (8.95 | ) | (13.36 | ) | 152,320 | 1.07 | * | 6.17 | * | 2 | |||||||||||||
| 11.97 | 11.88 | 172,331 | 1.07 | 5.74 | 4 | |||||||||||||||||
| 24.34 | 21.00 | 162,578 | .97 | 6.74 | 7 | |||||||||||||||||
| 3.73 | (4.96 | ) | 139,972 | .87 | * | 6.90 | * | 77 | ||||||||||||||
| (a) | Per share Net Investment Income (Loss) is calculated using the average daily shares method. |
| (b) | Total Return Based on Market Value is the combination of changes in the market price per share and the effect of reinvested dividend income and reinvested capital gains distributions, if any, at the average price paid per share at the time of reinvestment. The last dividend declared in the period, which is typically paid on the first business day of the following month, is assumed to be reinvested at the ending market price. The actual reinvestment for the last dividend declared in the period may take place over several days, and in some instances may not be based on the market price, so the actual reinvestment price may be different from the price used in the calculation. Total returns are not annualized. |
| Total Return Based on Net Asset Value is the combination of changes in net asset value, reinvested dividend income at net asset value and reinvested capital gains distributions at net asset value, if any. The last dividend declared in the period, which is typically paid on the first business day of the following month, is assumed to be reinvested at the ending net asset value. The actual reinvest price for the last dividend declared in the period may often be based on the Fund’s market price (and not its net asset value), and therefore may be different from the price used in the calculation. Total returns are not annualized. | |
| (c) | Net Investment Income (Loss) ratios reflect income earned and expenses incurred on assets attributable to borrowings, where applicable. |
| (d) | The expense ratios reflect, among other things, the interest expense deemed to have been paid by the Fund on the floating rate certificates issued by the special purpose trusts for the self-deposited inverse floaters held by the Fund, and/or all interest expense paid and other costs related to borrowings, where applicable, as described in Note 3 – Portfolio Securities and Investments in Derivatives, Inverse Floating Rate Securities and in Note 8 – Borrowing Arrangements, respectively, as follows: |
| Build America Bond (NBB) | ||||
| Year Ended 3/31: | ||||
| 2014(h) | .22 | %* | ||
| 2013 | .22 | |||
| 2012 | .18 | |||
| 2011(f) | .24 | * | ||
| Build America Bond Opportunity (NBD) | ||||
| Year Ended 3/31: | ||||
| 2014(h) | .11 | %* | ||
| 2013 | .10 | |||
| 2012 | .03 | |||
| 2011(g) | .03 | * | ||
| (e) | Portfolio Turnover Rate is calculated based on the lesser of long term purchases or sales (as disclosed in Note 5 – Investment Transactions) divided by the average long-term market value during the period. |
| (f) | For the period April 27, 2010 (commencement of operations) through March 31, 2011. |
| (g) | For the period November 23, 2010 (commencement of operations) through March 31, 2011. |
| (h) | For the six months ended September 30, 2013. |
| * | Annualized. |
See accompanying notes to financial statements.
| Nuveen Investments | 31 |
| Notes to | |
Financial Statements (Unaudited) |
1. General Information and Significant Accounting Policies
General Information
Fund Information
The funds covered in this report and their corresponding New York Stock Exchange (“NYSE”) symbols are as follows (each a “Fund” and collectively, the “Funds”):
| • | Nuveen Build America Bond Fund (NBB) (“Build America Bond (NBB)”) |
| • | Nuveen Build America Bond Opportunity Fund (NBD) (“Build America Bond Opportunity (NBD)”) |
The Funds are registered under the Investment Company Act of 1940, as amended, as diversified closed-end registered investment companies. Build America Bond (NBB) and Build America Bond Opportunity (NBD) were organized as Massachusetts business trusts on December 4, 2009 and June 4, 2010 respectively.
Each Fund’s primary investment objective is to provide current income through investments in taxable municipal securities. Each Fund’s secondary investment objective is to seek enhanced portfolio value and total return. The Funds seek to achieve their investment objectives by investing primarily in a diversified portfolio of taxable municipal securities known as Build America Bonds (“BABs”), which make up approximately 80% of their managed assets (as defined in Note 7 – Management Fees and Other Transactions with Affiliates). BABs are taxable municipal securities that include bonds issued by state and local governments to finance capital projects such as public schools, roads, transportation infrastructure, bridges, ports and public buildings, among others, pursuant to the American Recovery and Reinvestment Act of 2009, which offer municipal issuers a federal subsidy equal to 35% of a bond’s interest payments. Under normal circumstances, the Funds may invest 20% of their managed assets in securities other than BABs, including taxable and tax-exempt municipal securities, U.S. Treasury and other U.S. government agency securities. At least 80% of each Fund’s managed assets will be invested in securities that are investment grade quality at the time of purchase, as rated by at least one independent rating agency or judged to be of comparable quality by Nuveen Asset Management, LLC (the “Sub-Adviser”), a subsidiary of Nuveen Fund Advisors, LLC, (the “Adviser”) a wholly-owned subsidiary of Nuveen Investments, Inc. (“Nuveen”). In addition, each Fund will use an integrated leverage and hedging strategy that the Fund has the potential to enhance income and risk-adjusted total return over time. Each Fund may employ leverage instruments such as bank borrowings, including loans from certain financial institutions, and portfolio investments that have the economic effect of leverage, including investments in inverse floating rate securities. Each Fund’s overall goal is to outperform over time the Barclays Build America Bond Index, an unleveraged index representing the BABs market, while maintaining a comparable overall level of interest rate risk.
The BAB program expired on December 31, 2010, and was not renewed. Build America Bond (NBB) and Build American Bond Opportunity (NBD) each have contingent term provisions stating that if there are no new issuances of BABs or similar U.S. Treasury-subsidized taxable municipal bonds for any twenty-four month period ending on or before December 31, 2014, Build America Bond (NBB) and Build American Bond Opportunity (NBD) will terminate on or around June 30, 2020, and December 31, 2020, respectively.
Investment Adviser
The Adviser is responsible for each Fund’s overall investment strategy and asset allocation decisions. The Adviser has entered into sub-advisory agreements with the Sub-Adviser, under which the Sub-Adviser manages the investment portfolios of the Funds.
Significant Accounting Policies
The following is a summary of significant accounting policies followed by the Funds in the preparation of their financial statements in accordance with U.S. generally accepted accounting principles (“U.S. GAAP”).
Investment Transactions
Investment transactions are recorded on a trade date basis. Realized gains and losses from investment transactions are determined on the specific identification method, which is the same basis used for federal income tax purposes. Investments purchased on a when-issued/delayed delivery basis may have extended settlement periods. Any investments so purchased are subject to market fluctuation during this period. The Funds have instructed the custodian to earmark securities in the Funds’ portfolios with a current value at least equal to the amount of the when-issued/delayed delivery purchase commitments. As of September 30, 2013, there were no such outstanding purchase commitments in either of the Funds.
| 32 | Nuveen Investments |
Investment Income
Investment income, which reflects the amortization of premiums and includes accretion of discounts for financial reporting purposes, is recorded on an accrual basis. Investment income also reflects paydown gains and losses, if any.
Professional Fees
Professional fees presented on the Statement of Operations consist of legal fees incurred in the normal course of operations, audit fees, tax consulting fees and, in some cases, workout expenditures. Workout expenditures are incurred in an attempt to protect or enhance an investment, or to pursue other claims or legal actions on behalf of Fund shareholders. Should a Fund receive a refund of workout expenditures paid in a prior reporting period, such amounts will be recognized as “Legal fee refund” on the Statement of Operations.
Dividends and Distributions to Shareholders
Dividends to shareholders are declared monthly. Net realized capital gains from investment transactions, if any, are distributed to shareholders at least annually. Furthermore, capital gains are distributed only to the extent they exceed available capital loss carryforwards.
Distributions to shareholders are recorded on the ex-dividend date. The amount and timing of distributions are determined in accordance with federal income tax regulations, which may differ from U.S. GAAP.
Indemnifications
Under the Funds’ organizational documents, their officers and trustees are indemnified against certain liabilities arising out of the performance of their duties to the Funds. In addition, in the normal course of business, the Funds enter into contracts that provide general indemnifications to other parties. The Funds’ maximum exposure under these arrangements is unknown as this would involve future claims that may be made against the Funds that have not yet occurred. However, the Funds have not had prior claims or losses pursuant to these contracts and expect the risk of loss to be remote.
Netting Agreements
In the ordinary course of business, the Funds have entered into transactions subject to enforceable master repurchase agreements, International Swaps and Derivative Association, Inc. (“ISDA”) master agreements or other similar arrangements (“netting agreements”). Generally, the right to offset in netting agreements allows each Fund to offset any exposure to a specific counterparty with any collateral received or delivered to that counterparty based on the terms of the agreements. Generally, a Fund manages its cash collateral and securities collateral on a counterparty basis. As of September 30, 2013, the Funds were not invested in any portfolio securities or derivatives, other than repurchase agreements and swap contracts further described in Note 3 – Portfolio Securities, Repurchase Agreements and Investments in Derivatives, Swap Contracts that are subject to netting agreements.
Use of Estimates
The preparation of financial statements in conformity with U.S. GAAP requires management to make estimates and assumptions that affect the reported amounts of assets and liabilities at the date of the financial statements and the reported amounts of increases and decreases in net assets from operations during the reporting period. Actual results may differ from those estimates.
2. Investment Valuation and Fair Value Measurements
Investment Valuation
Prices of municipal bonds and swap contracts are provided by a pricing service approved by the Funds’ Board of Trustees. These securities are generally classified as Level 2 for fair value measurement purposes. The pricing service establishes a security’s fair value using methods that may include consideration of the following: yields or prices of investments of comparable quality, type of issue, coupon, maturity and rating, market quotes or indications of value from security dealers, evaluations of anticipated cash flows or collateral, general market conditions and other information and analysis, including the obligor’s credit characteristics considered relevant. In pricing certain securities, particularly less liquid and lower quality securities, the pricing service may consider information about a security, its issuer or market activity provided by the Adviser. These securities are generally classified as Level 2 or Level 3 depending on the priority of the significant inputs.
Repurchase agreements are valued at contract amount plus accrued interest, which approximates market value. These securities are generally classified as Level 2.
Certain securities may not be able to be priced by the pre-established pricing methods as described above. Such securities may be valued by the Funds’ Board of Trustees or its designee at fair value. These securities generally include, but are not limited to, restricted securities (securities which may not be publicly sold without registration under the Securities Act of 1933, as amended) for which a pricing service is unable to provide a market price; securities whose trading has been formally suspended; debt securities that have gone into default and for which there is no current market
| Nuveen Investments | 33 |
Notes to Financial Statements (Unaudited) (continued)
quotation; a security whose market price is not available from a pre-established pricing source; a security with respect to which an event has occurred that is likely to materially affect the value of the security after the market has closed but before the calculation of a Fund’s net asset value (as may be the case in non-U.S. markets on which the security is primarily traded) or make it difficult or impossible to obtain a reliable market quotation; and a security whose price, as provided by the pricing service, is not deemed to reflect the security’s fair value. As a general principle, the fair value of a security would appear to be the amount that the owner might reasonably expect to receive for it in a current sale. A variety of factors may be considered in determining the fair value of such securities, which may include consideration of the following: yields or prices of investments of comparable quality, type of issue, coupon, maturity and rating, market quotes or indications of value from securities dealers, evaluations of anticipated cash flows or collateral, general market conditions and other information and analysis, including the obligor’s credit characteristics considered relevant. These securities are generally classified as Level 2 or Level 3 depending on the priority of the significant inputs. Regardless of the method employed to value a particular security, all valuations are subject to review by the Funds’ Board of Trustees or its designee.
Fair Value Measurements
Fair value is defined as the price that the Funds would receive upon selling an investment or transferring a liability in an orderly transaction to an independent buyer in the principal or most advantageous market for the investment. A three-tier hierarchy is used to maximize the use of observable market data and minimize the use of unobservable inputs and to establish classification of fair value measurements for disclosure purposes. Observable inputs reflect the assumptions market participants would use in pricing the asset or liability. Observable inputs are based on market data obtained from sources independent of the reporting entity. Unobservable inputs reflect the reporting entity’s own assumptions about the assumptions market participants would use in pricing the asset or liability. Unobservable inputs are based on the best information available in the circumstances. The following is a summary of the three-tiered hierarchy of valuation input levels.
| Level 1 – | Inputs are unadjusted and prices are determined using quoted prices in active markets for identical securities. |
| Level 2 – | Prices are determined using other significant observable inputs (including quoted prices for similar securities, interest rates, prepayment speeds, credit risk, etc.). |
| Level 3 – | Prices are determined using significant unobservable inputs (including management’s assumptions in determining the fair value of investments). |
The inputs or methodologies used for valuing securities are not an indication of the risks associated with investing in those securities. The following is a summary of each Fund’s fair value measurements as of the end of the reporting period:
| Build America Bond (NBB) | Level 1 | Level 2 | Level 3 | Total | ||||||||||||
| Long-Term Investments*: | ||||||||||||||||
| Municipal Bonds | $ | — | $ | 646,867,472 | $ | — | $ | 646,867,472 | ||||||||
| Short-Term Investments: | ||||||||||||||||
| Repurchase Agreements | — | 1,895,718 | — | 1,895,718 | ||||||||||||
| Derivatives: | ||||||||||||||||
| Swaps** | — | 17,552,857 | — | 17,552,857 | ||||||||||||
| Total | $ | — | $ | 666,316,047 | $ | — | $ | 666,316,047 | ||||||||
| Build America Bond Opportunity (NBD) | Level 1 | Level 2 | Level 3 | Total | ||||||||||||
| Long-Term Investments*: | ||||||||||||||||
| Municipal Bonds | $ | — | $ | 162,093,277 | $ | — | $ | 162,093,277 | ||||||||
| Short-Term Investments: | ||||||||||||||||
| Repurchase Agreements | — | 347,437 | — | 347,437 | ||||||||||||
| Derivatives: | ||||||||||||||||
| Swaps** | — | 5,990,708 | — | 5,990,708 | ||||||||||||
| Total | $ | — | $ | 168,431,422 | $ | — | $ | 168,431,422 | ||||||||
| * | Refer to the Fund’s Portfolio of Investments for state classifications. |
| ** | Represents net unrealized appreciation (depreciation) as reported in the Fund’s Portfolio of Investments. |
The Nuveen funds’ Board of Directors/Trustees is responsible for the valuation process and has delegated the oversight of the daily valuation process to the Adviser’s Valuation Committee. The Valuation Committee, pursuant to the valuation policies and procedures adopted by the Board of Directors/Trustees, is responsible for making fair value determinations, evaluating the effectiveness of the funds’ pricing policies and reporting to the Board of Directors/Trustees. The Valuation Committee is aided in its efforts by the Adviser’s dedicated Securities Valuation Team, which is responsible for administering the daily valuation process and applying fair value methodologies as approved by the Valuation Committee. When determining the reliability of independent pricing services for investments owned by the funds, the Valuation Committee, among other things, conducts due diligence reviews of the pricing services and monitors the quality of security prices received through various testing reports conducted by the Securities Valuation Team.
| 34 | Nuveen Investments |
The Valuation Committee will consider pricing methodologies it deems relevant and appropriate when making a fair value determination, based on the facts and circumstances specific to the portfolio instrument. Fair value determinations generally will be derived as follows, using public or private market information:
| (i) | If available, fair value determinations shall be derived by extrapolating from recent transactions or quoted prices for identical or comparable securities. | |
| (ii) | If such information is not available, an analytical valuation methodology may be used based on other available information including, but not limited to: analyst appraisals, research reports, corporate action information, issuer financial statements and shelf registration statements. Such analytical valuation methodologies may include, but are not limited to: multiple of earnings, discount from market value of a similar freely-traded security, discounted cash flow analysis, book value or a multiple thereof, risk premium/yield analysis, yield to maturity and/or fundamental investment analysis. |
The purchase price of a portfolio instrument will be used to fair value the instrument only if no other valuation methodology is available or deemed appropriate, and it is determined that the purchase price fairly reflects the instrument’s current value.
For each portfolio security that has been fair valued pursuant to the policies adopted by the Board of Directors/Trustees, the fair value price is compared against the last available and next available market quotations. The Valuation Committee reviews the results of such testing and fair valuation occurrences are reported to the Board of Directors/Trustees.
3. Portfolio Securities and Investments in Derivatives
Portfolio Securities
Inverse Floating Rate Securities
Each Fund is authorized to invest in inverse floating rate securities. An inverse floating rate security is created by depositing a municipal bond, typically with a fixed interest rate, into a special purpose trust created by a broker-dealer. In turn, this trust (a) issues floating rate certificates, in face amounts equal to some fraction of the deposited bond’s par amount or market value, that typically pay short-term tax-exempt interest rates to third parties, and (b) issues to a long-term investor (such as one of the Funds) an inverse floating rate certificate (sometimes referred to as an “inverse floater”) that represents all remaining or residual interest in the trust. The income received by the inverse floater holder varies inversely with the short-term rate paid to the floating rate certificates’ holders, and in most circumstances the inverse floater holder bears substantially all of the underlying bond’s downside investment risk and also benefits disproportionately from any potential appreciation of the underlying bond’s value. The price of an inverse floating rate security will be more volatile than that of the underlying bond because the interest rate is dependent on not only the fixed coupon rate of the underlying bond but also on the short-term interest paid on the floating rate certificates, and because the inverse floating rate security essentially bears the risk of loss of the greater face value of the underlying bond.
A Fund may purchase an inverse floating rate security in a secondary market transaction without first owning the underlying bond (referred to as an “externally-deposited inverse floater”), or instead by first selling a fixed-rate bond to a broker-dealer for deposit into the special purpose trust and receiving in turn the residual interest in the trust (referred to as a “self-deposited inverse floater”). The inverse floater held by a Fund gives the Fund the right (a) to cause the holders of the floating rate certificates to tender their notes at par, and (b) to have the broker transfer the fixed-rate bond held by the trust to the Fund, thereby collapsing the trust. An investment in an externally-deposited inverse floater is identified in the Portfolio of Investments as “(IF) – Inverse floating rate investment.” An investment in a self-deposited inverse floater is accounted for as a financing transaction. In such instances, a fixed-rate bond deposited into a special purpose trust is identified in the Portfolio of Investments as “(UB) – Underlying bond of an inverse floating rate trust reflected as a financing transaction,” with the Fund accounting for the short-term floating rate certificates issued by the trust, at their liquidation value, as “Floating rate obligations” on the Statement of Assets and Liabilities. In addition, the Fund reflects in “Investment Income” the entire earnings of the underlying bond and the related interest paid to the holders of the short-term floating rate certificates as a component of “Interest expense” on the Statement of Operations.
During the six months ended September 30, 2013, each Fund invested in externally-deposited inverse floaters and/or self-deposited inverse floaters.
Each Fund may also enter into shortfall and forbearance agreements (sometimes referred to as a “recourse trust” or “credit recovery swap”) (such agreements referred to herein as “Recourse Trusts”) with a broker-dealer by which a Fund agrees to reimburse the broker-dealer, in certain circumstances, for the difference between the liquidation value of the fixed-rate bond held by the trust and the liquidation value of the floating rate certificates issued by the trust plus any shortfalls in interest cash flows. Under these agreements, a Fund’s potential exposure to losses related to or on inverse floaters may increase beyond the value of a Fund’s inverse floater investments as a Fund may potentially be liable to fulfill all amounts owed to holders of the floating rate certificates. At period end, any such shortfall is recognized as “Unrealized depreciation on Recourse Trusts” on the Statement of Assets and Liabilities.
| Nuveen Investments | 35 |
Notes to Financial Statements (Unaudited) (continued)
As of September 30, 2013, each Fund’s maximum exposure to the floating rate obligations issued by externally-deposited Recourse Trusts was as follows:
| Build | Build America | ||||||
| America | Bond | ||||||
| Bond | Opportunity | ||||||
| (NBB | ) | (NBD | ) | ||||
| Maximum exposure to Recourse Trusts | $ | 91,190,000 | $ | 40,810,000 |
The average floating rate obligations outstanding and average annual interest rate and fees related to self-deposited inverse floaters during the six months ended September 30, 2013, were as follows:
| Build | Build America | ||||||
| America | Bond | ||||||
| Bond | Opportunity | ||||||
| (NBB | ) | (NBD | ) | ||||
| Average floating rate obligations outstanding | $ | 53,090,000 | $ | 7,190,000 | |||
| Average annual interest rate and fees | 0.59% | 0.57% |
Zero Coupon Securities
Each Fund is authorized to invest in zero coupon securities. A zero coupon security does not pay a regular interest coupon to its holders during the life of the security. Income to the holder of the security comes from accretion of the difference between the original purchase price of the security at issuance and the par value of the security at maturity and is effectively paid at maturity. The market prices of zero coupon securities generally are more volatile than the market prices of securities that pay interest periodically.
Repurchase Agreements
In connection with transactions in repurchase agreements, it is each Fund’s policy that its custodian take possession of the underlying collateral securities, the fair value of which exceeds the principal amount of the repurchase transaction, including accrued interest, at all times. If the counterparty defaults, and the fair value of the collateral declines, realization of the collateral may be delayed or limited.
The following table presents the repurchase agreements for the Funds that are subject to netting agreements as of the end of the reporting period, and the collateral delivered related to those repurchase agreements.
| Short-Term | Collateral | ||||||||||||
| Investments, | Pledged (From | ) | Net | ||||||||||
| Fund | Counterparty | at Value | Counterparty* | Exposure | |||||||||
| Build America Bond (NBB) | State Street Bank | $ | 1,895,718 | $ | (1,895,718 | ) | $ | — | |||||
| Build America Bond Opportunity (NBD) | State Street Bank | $ | 347,437 | $ | (347,437 | ) | $ | — |
| * | As of September 30, 2013, the value of the collateral pledged from the counterparty exceeded the value of the repurchase agreements. Refer to the Fund’s Portfolio of Investments for details on the repurchase agreements. |
Investments in Derivatives
Each Fund is authorized to invest in certain derivative instruments such as futures, options and swap contracts. Each Fund will limit its investments in futures, options on futures and swap contracts to the extent necessary for the Adviser to claim the exclusion from registration by the Commodity Futures Trading Commission as a commodity pool operator with respect to the Fund. The Funds record derivative instruments at fair value with changes in fair value recognized on the Statement of Operations, when applicable. Even though the Funds’ investments in derivatives may represent economic hedges, they are not considered to be hedge transactions for financial reporting purposes.
Swap Contracts
Interest rate swap contracts involve each Fund’s agreement with the counterparty to pay or receive a fixed rate payment in exchange for the counterparty receiving or paying a variable rate payment. Forward interest rate swap transactions involve a Fund’s agreement with a counterparty to pay or receive, in the future, a fixed or variable rate payment in exchange for the counterparty receiving or paying a Fund a variable or fixed rate payment, the accruals for which would begin at a specified date in the future (the “effective date”). Accordingly, the risk of loss with respect to the swap counterparty on such transactions is limited to the net amount of interest payments that each Fund is to receive. The payment obligation is based on the notional amount and the termination date of the swap contract (which is akin to a bond’s maturity). The value of a Fund’s swap contract would increase or decrease based primarily on the extent to which long-term interest rates for bonds having a maturity of the swap contract’s termination date increase or decrease. Swap contracts are valued daily. Upon entering into an interest rate swap (and beginning on the effective date for a forward interest rate swap), each Fund accrues the fixed rate payment expected to be paid or received and the variable rate payment expected to be received or paid on a daily basis, and recognizes the daily change in the market value of the Fund’s contractual rights and obligations under the contracts. The net amount recorded for these transactions for each counterparty is recognized on the Statement of Assets and Liabilities as a component of “Unrealized appreciation or depreciation on swaps (,net)” with the change during the fiscal period recognized on the Statement of Operations as a component of “Change in net unrealized appreciation (depreciation) of swaps.” Income received or paid by each Fund is recognized as a component
| 36 | Nuveen Investments |
of “Net realized gain (loss) from swaps” on the Statement of Operations, in addition to the net realized gains or losses recognized upon the termination of a swap contract, and are equal to the difference between the Fund’s basis in the swap contract and the proceeds from (or cost of) the closing transaction. Payments received or made at the beginning of the measurement period are recognized as a component of “Swap premiums paid and/or received” on the Statement of Assets and Liabilities, when applicable. For tax purposes, periodic payments are treated as ordinary income or expense.
Each Fund may terminate a swap contract prior to the effective date, at which point a realized gain or loss is recognized. When a swap contract is terminated, it ordinarily does not involve the delivery of securities or other underlying assets or principal, but rather is settled in cash on a net basis. Once periodic payments are settled in cash, they are combined with the net realized gain or loss recorded upon the termination of the swap contract.
During the six months ended September 30, 2013, each Fund continued to use swap contracts to reduce the duration of its portfolio as well as to fix its interest cost of leverage.
The average notional amount of swap contracts outstanding during the six months ended September 30, 2013, was as follows:
| Build | Build America | ||||||
| America | Bond | ||||||
| Bond | Opportunity | ||||||
| (NBB | ) | (NBD | ) | ||||
| Average notional amount of swap contracts outstanding* | $ | 294,400,000 | $ | 104,900,000 |
| * | The average notional amount is calculated based on the outstanding notional at the beginning of the fiscal year and at the end of each fiscal quarter within the current fiscal year. |
The following tables present the fair value of all swap contracts held by the Funds as of September 30, 2013, the location of these instruments on the Statement of Assets and Liabilities and the primary underlying risk exposure.
| Location on the Statement of Assets and Liabilities | |||||||||||||
| Asset Derivatives | (Liability) Derivatives | ||||||||||||
| Underlying | Derivative | ||||||||||||
| Risk Exposure | Instrument | Location | Value | Location | Value | ||||||||
| Build America Bond (NBB) | |||||||||||||
| Interest rate | Swaps | Unrealized appreciation on swaps, net | $ | 17,647,874 | Unrealized depreciation on swaps | $ | (95,017 | ) | |||||
| Build America Bond Opportunity (NBD) | |||||||||||||
| Interest rate | Swaps | Unrealized appreciation on swaps, net | $ | 5,990,708 | — | $ | — | ||||||
The following table presents the swap contracts, which are subject to netting agreements, as well as collateral delivered to those swap contracts.
| Gross | Gross | Amounts Netted | Net Unrealized | Collateral | ||||||||||||||||||||||
| Unrealized | Unrealized | on Statement | Appreciation | Pledged to | ||||||||||||||||||||||
| Appreciation | (Depreciation | ) | of Assets | (Depreciation | ) | (from | ) | |||||||||||||||||||
| Fund | Counterparty | on Swaps* | on Swaps* | and Liabilities | on Swaps | Counterparty | Net Exposure | |||||||||||||||||||
| Build America Bond (NBB) | ||||||||||||||||||||||||||
| Barclays Bank PLC | $ | 737,801 | $ | — | $ | — | $ | 737,801 | $ | (737,801 | ) | $ | — | |||||||||||||
| JPMorgan | — | (95,017 | ) | — | (95,017 | ) | — | (95,017 | ) | |||||||||||||||||
| Morgan Stanley | 17,660,640 | (750,567 | ) | (750,567 | ) | 16,910,073 | (16,388,866 | ) | 521,207 | |||||||||||||||||
| Total | $ | 18,398,441 | $ | (845,584 | ) | $ | (750,567 | ) | $ | 17,552,857 | $ | (17,126,667 | ) | $ | 426,190 | |||||||||||
Build America Bond Opportunity (NBD)
| Barclays Bank PLC | $ | 2,359,718 | $ | (458,113 | ) | $ | (458,113 | ) | $ | 1,901,605 | $ | (1,901,605 | ) | $ | — | |||||||||||||
| Morgan Stanley | 4,120,524 | (31,421 | ) | (31,421 | ) | 4,089,103 | (4,089,103 | ) | — | |||||||||||||||||||
| Total | $ | 6,480,242 | $ | (489,534 | ) | $ | (489,534 | ) | $ | 5,990,708 | $ | (5,990,708 | ) | $ | — | |||||||||||||
| * | Represents gross unrealized appreciation (depreciation) for the counterparty as reported in the Fund’s Portfolio of Investments. |
The following table presents the amount of net realized gain (loss) and change in net unrealized appreciation (deprecation) recognized on swap contracts during the six months ended September 30, 2013, and the primary underlying risk exposure.
| Change in Net | ||||||||||
| Unrealized | ||||||||||
| Underlying | Derivative | Net Realized | Appreciation | |||||||
| Fund | Risk Exposure | Instrument | Gain (Loss | ) | (Depreciation | ) | ||||
| Build America Bond (NBB) | Interest rate | Swaps | $ | (277,550 | ) | $ | 18,105,855 | |||
| Build America Bond Opportunity (NBD) | Interest rate | Swaps | (174,661 | ) | 6,922,595 | |||||
| Nuveen Investments | 37 |
Notes to Financial Statements (Unaudited) (continued)
Market and Counterparty Credit Risk
In the normal course of business each Fund may invest in financial instruments and enter into financial transactions where risk of potential loss exists due to changes in the market (market risk) or failure of the other party to the transaction to perform (counterparty credit risk). The potential loss could exceed the value of the financial assets recorded on the financial statements. Financial assets, which potentially expose each Fund to counterparty credit risk, consist principally of cash due from counterparties on forward, option and swap transactions, when applicable. The extent of each Fund’s exposure to counterparty credit risk in respect to these financial assets approximates their carrying value as recorded on the Statement of Assets and Liabilities.
Each Fund helps manage counterparty credit risk by entering into agreements only with counterparties the Adviser believes have the financial resources to honor their obligations and by having the Adviser monitor the financial stability of the counterparties. Additionally, counterparties may be required to pledge collateral daily (based on the daily valuation of the financial asset) on behalf of each Fund with a value approximately equal to the amount of any unrealized gain above a pre-determined threshold. Reciprocally, when each Fund has an unrealized loss, the Funds have instructed the custodian to pledge assets of the Funds as collateral with a value approximately equal to the amount of the unrealized loss above a pre-determined threshold. Collateral pledges are monitored and subsequently adjusted if and when the valuations fluctuate, either up or down, by at least the pre-determined threshold amount.
4. Fund Shares
Since the inception of the Funds’ repurchase programs, the Funds have not repurchased any of their outstanding shares.
Transactions in shares were as follows:
| Build | Build America | ||||||||||||
| America | Bond | ||||||||||||
| Bond | Opportunity | ||||||||||||
| (NBB) | (NBD) | ||||||||||||
| Six Months | Year | Six Months | Year | ||||||||||
| Ended | Ended | Ended | Ended | ||||||||||
| 9/30/13 | 3/31/13 | 9/30/13 | 3/31/13 | ||||||||||
| Shares issued to shareholders due to reinvestment of distributions | — | — | — | — | |||||||||
5. Investment Transactions
Purchases and sales (including maturities but excluding short-term investments and derivative transactions) during the six months ended September 30, 2013, were as follows:
| Build | Build America | ||||||
| America | Bond | ||||||
| Bond | Opportunity | ||||||
| (NBB | ) | (NBD | ) | ||||
| Purchases | $ | 19,179,258 | $ | 4,726,912 | |||
| Sales and maturities | 21,614,029 | 4,304,710 |
6. Income Tax Information
Each Fund is a separate taxpayer for federal income tax purposes. Each Fund intends to distribute substantially all of its net investment income and net capital gains to shareholders and to otherwise comply with the requirements of Subchapter M of the Internal Revenue Code applicable to regulated investment companies. Therefore, no federal income tax provision is required.
For all open tax years and all major taxing jurisdictions, management of the Funds has concluded that there are no significant uncertain tax positions that would require recognition in the financial statements. Open tax years are those that are open for examination by taxing authorities (i.e., generally the last four tax year ends and the interim tax period since then). Furthermore, management of the Funds is also not aware of any tax positions for which it is reasonably possible that the total amounts of unrecognized tax benefits will significantly change in the next twelve months.
The following information is presented on an income tax basis. Differences between amounts for financial statement and federal income tax purposes are primarily due to timing differences in recognizing certain gains and losses on investment transactions and the treatment of investments in inverse floating rate securities reflected as financing transactions, if any. To the extent that differences arise that are permanent in nature, such amounts are reclassified within the capital accounts as detailed below. Temporary differences do not require reclassification. Temporary and permanent differences do not impact the net asset values of the Funds.
| 38 | Nuveen Investments |
As of September 30, 2013, the cost and unrealized appreciation (depreciation) of investments (excluding investments in derivatives), as determined on a federal income tax basis, were as follows:
| Build | Build America | ||||||
| America | Bond | ||||||
| Bond | Opportunity | ||||||
| (NBB | ) | (NBD | ) | ||||
| Cost of investments | $ | 570,480,520 | $ | 136,771,317 | |||
| Gross unrealized: | |||||||
| Appreciation | $ | 42,232,524 | $ | 20,509,835 | |||
| Depreciation | (17,040,799 | ) | (2,031,382 | ) | |||
| Net unrealized appreciation (depreciation) of investments | $ | 25,191,725 | $ | 18,478,453 |
Permanent differences, primarily due to federal taxes paid and notional principal contracts reclassifications, resulted in reclassifications among the Funds’ components of net assets as of March 31, 2013, the Funds’ last tax year end, as follows:
| Build | Build America | ||||||
| America | Bond | ||||||
| Bond | Opportunity | ||||||
| (NBB | ) | (NBD | ) | ||||
| Paid-in surplus | $ | — | $ | — | |||
| Undistributed (Over-distribution of) net investment income | (501,303 | ) | (341,230 | ) | |||
| Accumulated net realized gain (loss) | 501,303 | 341,230 |
The tax components of undistributed net ordinary income and net long-term capital gains as of March 31, 2013, the Funds’ last tax year end, were as follows:
| Build | Build America | ||||||
| America | Bond | ||||||
| Bond | Opportunity | ||||||
| (NBB | ) | (NBD | ) | ||||
Undistributed net ordinary income1 | $ | 3,744,745 | $ | 820,457 | |||
| Undistributed net long-term capital gains | — | — |
| 1 | Net ordinary income consists of net taxable income derived from dividends, interest and net short-term capital gains, if any. Undistributed net ordinary income (on a tax basis) has not been reduced for the dividend declared on March 1, 2013, and paid on April 1, 2013. |
The tax character of distributions paid during the Funds’ last tax year ended March 31, 2013 was designated for purposes of the dividends paid deduction as follows:
| Build | Build America | ||||||
| America | Bond | ||||||
| Bond | Opportunity | ||||||
| (NBB | ) | (NBD | ) | ||||
Distributions from net ordinary income2 | $ | 34,651,969 | $ | 9,251,541 | |||
| Distributions from net long-term capital gains | — | — |
| 2 | Net ordinary income consists of net taxable income derived from dividends, interest, and net short-term capital gains, if any. |
As of March 31, 2013, the Funds’ last tax year end, the Funds had unused capital loss carryforwards available for federal income tax purposes to be applied against future capital gains, if any. If not applied, the carryforwards will expire as shown in the following table. The losses not subject to expiration retain the character reflected and will be utilized first by the Funds, while the losses subject to expiration are considered short-term:
| Build | Build America | ||||||
| America | Bond | ||||||
| Bond | Opportunity | ||||||
| (NBB | ) | (NBD | ) | ||||
| Not subject to expiration: | |||||||
| Short-term losses: | $ | — | $ | 318,228 | |||
| Long-term losses: | 16,275,924 | 9,844,820 | |||||
| Total | $ | 16,275,924 | $ | 10,163,048 |
| Nuveen Investments | 39 |
Notes to Financial Statements (Unaudited) (continued)
7. Management Fees and Other Transactions with Affiliates
Each Fund’s management fee compensates the Adviser for overall investment advisory and administrative services and general office facilities. The Sub-Adviser is compensated for its services to the Funds from the management fees paid to the Adviser.
Each Fund’s management fee consists of two components – a fund-level fee, based only on the amount of assets within the Fund, and a complex-level fee, based on the aggregate amount of all eligible fund assets managed by the Adviser. This pricing structure enables Fund shareholders to benefit from growth in the assets within their respective Fund as well as from growth in the amount of complex-wide assets managed by the Adviser.
The annual fund-level fee for each Fund, payable monthly, is calculated according to the following schedule:
| Average Daily Managed Assets* | Fund-Level Fee Rate | |||
| For the first $125 million | .4500 | % | ||
| For the next $125 million | .4375 | |||
| For the next $250 million | .4250 | |||
| For the next $500 million | .4125 | |||
| For the next $1 billion | .4000 | |||
| For managed assets over $2 billion | .3875 | |||
The annual complex-level fee for each Fund, payable monthly, is calculated according to the following schedule:
| Complex-Level Managed Asset Breakpoint Level* | Effective Rate at Breakpoint Level | |||
| $55 billion | .2000 | % | ||
| $56 billion | .1996 | |||
| $57 billion | .1989 | |||
| $60 billion | .1961 | |||
| $63 billion | .1931 | |||
| $66 billion | .1900 | |||
| $71 billion | .1851 | |||
| $76 billion | .1806 | |||
| $80 billion | .1773 | |||
| $91 billion | .1691 | |||
| $125 billion | .1599 | |||
| $200 billion | .1505 | |||
| $250 billion | .1469 | |||
| $300 billion | .1445 | |||
| * | For the fund-level and complex-level fees, managed assets include closed-end fund assets managed by the Adviser that are attributable to certain types of leverage. For these purposes, leverage includes the funds’ use of preferred stock and borrowings and certain investments in the residual interest certificates (also called inverse floating rate securities) in tender option bond (TOB) trusts, including the portion of assets held by a TOB trust that has been effectively financed by the trust’s issuance of floating rate securities, subject to an agreement by the Adviser as to certain funds to limit the amount of such assets for determining managed assets in certain circumstances. The complex-level fee is calculated based upon the aggregate daily managed assets of all Nuveen Funds that constitute “eligible assets.” Eligible assets do not include assets attributable to investments in other Nuveen Funds or assets in excess of $2 billion added to the Nuveen Fund complex in connection with the Adviser’s assumption of the management of the former First American Funds effective January 1, 2011. As of September 30, 2013, the complex-level fee rate for these Funds was .1686%. |
The Funds pay no compensation directly to those of its trustees who are affiliated with the Adviser or to its officers, all of whom receive remuneration for their services to the Funds from the Adviser or its affiliates. The Board of Trustees has adopted a deferred compensation plan for independent trustees that enables trustees to elect to defer receipt of all or a portion of the annual compensation they are entitled to receive from certain Nuveen-advised funds. Under the plan, deferred amounts are treated as though equal dollar amounts had been invested in shares of select Nuveen-advised funds.
| 40 | Nuveen Investments |
8. Borrowing Arrangements
As part of their investment strategies the Funds have each entered into a committed secured 364-day line of credit (“Borrowings”) with its custodian bank as a means of leverage. Each Fund’s maximum commitment amount under these Borrowings is as follows:
| Build | Build America | ||||||
| America | Bond | ||||||
| Bond | Opportunity | ||||||
| (NBB | ) | (NBD | ) | ||||
| Maximum commitment amount | $ | 100,000,000 | $ | 25,000,000 |
As of September 30, 2013, each Fund’s outstanding balance on its Borrowings was as follows:
| Build | Build America | ||||||
| America | Bond | ||||||
| Bond | Opportunity | ||||||
| (NBB | ) | (NBD | ) | ||||
| Outstanding balance on Borrowings | $ | 89,000,000 | $ | 11,500,000 |
During the six months ended September 30, 2013, the average daily balance outstanding and average annual interest rate on each Fund’s Borrowings were as follows:
| Build | Build America | ||||||
| America | Bond | ||||||
| Bond | Opportunity | ||||||
| (NBB | ) | (NBD | ) | ||||
| Average daily balance outstanding | $ | 89,000,000 | $ | 11,500,000 | |||
| Average annual interest rate | 0.93% | 0.93% |
In order to maintain these Borrowings, the Funds must meet certain collateral, asset coverage and other requirements. Borrowings outstanding are fully secured by securities held in each Fund’s portfolio of investments. Interest expense incurred on each Fund’s Borrowings is calculated at a rate per annum equal to the higher of (i) the overnight Federal Funds rate plus .80% or (ii) the overnight London Inter-bank Offered Rate (LIBOR) plus .80%.
In addition to the interest expense, the Funds each pay a per annum facility fee, based on the maximum commitment amount of the Borrowings through the renewal date.
On May 22, 2013, Build America Bond (NBB) renewed its Borrowings, at which time the termination date was extended through May 21, 2014. The Fund’s per annum facility fee was reduced from .15% to .10%, based on the maximum commitment amount of the Borrowings through the renewal date. The Fund also paid a one-time closing fee of .05% on the maximum commitment amount of the Borrowings, which will be fully expensed through the termination date of May 21, 2014. All other terms of the Borrowings remained unchanged.
On February 19, 2013 and April 19, 2013, Build America Bond Opportunity (NBD) renewed its Borrowings, at which time the termination date was extended through April 19, 2013 and May 22, 2013, respectively. All other terms of the Borrowings remained unchanged. On May 22, 2013, the Fund amended its Borrowings, at which time the Borrowings were changed from unsecured to secured, the termination date was extended through May 21, 2014, and the Fund’s per annum facility fee was reduced from .15% to .10%, based on the maximum commitment amount of the Borrowings through the renewal date. The Fund also paid a one-time closing fee of .05% on the maximum commitment amount of the Borrowings, which will be fully expensed through the termination date of May 21, 2014. All other terms of the Borrowings remained unchanged.
Borrowings outstanding are recognized as “Borrowings” on the Statement of Assets and Liabilities. Interest expense facility fees and one-time closing fees are recognized as components of “Interest expense” on the Statement of Operations.
| Nuveen Investments | 41 |
| Annual Investment Management | |
Agreement Approval Process (Unaudited) | |
The Board of Trustees (each, a “Board” and each Trustee, a “Board Member”) of the Funds, including the Board Members who are not parties to the Funds’ advisory or sub-advisory agreements or “interested persons” of any such parties (the “Independent Board Members”), is responsible for approving the advisory agreements (each, an “Investment Management Agreement”) between each Fund and Nuveen Fund Advisors, LLC (the “Adviser”) and the sub-advisory agreements (each, a “Sub-Advisory Agreement”) between the Adviser and Nuveen Asset Management, LLC (the “Sub-Adviser”) (the Investment Management Agreements and the Sub-Advisory Agreements are referred to collectively as the “Advisory Agreements”) and their periodic continuation. Pursuant to the Investment Company Act of 1940, as amended (the “1940 Act”), the Board is required to consider the continuation of the Advisory Agreements on an annual basis. Accordingly, at an in-person meeting held on May 20-22, 2013 (the “May Meeting”), the Board, including a majority of the Independent Board Members, considered and approved the continuation of the Advisory Agreements for the Funds for an additional one-year period.
In preparation for its considerations at the May Meeting, the Board requested and received extensive materials prepared in connection with the review of the Advisory Agreements. The materials provided a broad range of information regarding the Funds, the Adviser and the Sub-Adviser (the Adviser and the Sub-Adviser are collectively, the “Fund Advisers” and each, a “Fund Adviser”). As described in more detail below, the information provided included, among other things, a review of Fund performance, including Fund investment performance assessments against peer groups and appropriate benchmarks; a comparison of Fund fees and expenses relative to peers; a description and assessment of shareholder service levels for the Funds; a summary of the performance of certain service providers; a review of product initiatives and shareholder communications; and an analysis of the Adviser’s profitability with comparisons to comparable peers in the managed fund business. As part of its annual review, the Board also held a separate meeting on April 17-18, 2013, to review the Funds’ investment performance and consider an analysis provided by the Adviser of the Sub-Adviser which generally evaluated the Sub-Adviser’s investment team, investment mandate, organizational structure and history, investment philosophy and process, performance of the applicable Fund, and significant changes to the foregoing. As a result of its review of the materials and discussions, the Board presented the Adviser with questions and the Adviser responded.
The materials and information prepared in connection with the annual review of the Advisory Agreements supplement the information and analysis provided to the Board during the year. In this regard, throughout the year, the Board, acting directly or through its committees, regularly reviews the performance and various services provided by the Adviser and the Sub-Adviser. The Board meets at least quarterly as well as at other times as the need arises. At its quarterly meetings, the Board reviews reports by the Adviser regarding, among other things, fund performance, fund expenses, premium and discount levels of closed-end funds, the performance of the investment teams, and compliance, regulatory and risk management matters. In addition to regular reports, the Adviser provides special reports to the Board or a committee thereof from time to time to enhance the Board’s understanding of various topics that impact some or all the Nuveen funds (such as accounting and financial statement presentations of the various forms of leverage that may be used by a closed-end fund or an update on the valuation policies and procedures), to update the Board on regulatory developments impacting the investment company industry or to update the Board on the business plans or other matters impacting the Adviser. The Board also meets with key investment personnel managing the fund
| 42 | Nuveen Investments |
portfolios during the year. In October 2011, the Board also created two standing committees (the Open-End Fund Committee and the Closed-End Fund Committee) to assist the full Board in monitoring and gaining a deeper insight into the distinctive business practices of open-end and closed-end funds. These Committees meet prior to each quarterly Board meeting, and the Adviser provides presentations to these Committees permitting them to delve further into specific matters or initiatives impacting the respective product line.
In addition, the Board continues its program of seeking to have the Board Members or a subset thereof visit each sub-adviser to the Nuveen funds at least once over a multiple year rotation, meeting with key investment and business personnel. In this regard, the Independent Board Members visited certain of the Sub-Adviser’s investment teams in Minneapolis in September 2012, and the Sub-Adviser’s municipal team in November 2012. In addition, the ad hoc Securities Lending Committee of the Board met with certain service providers and the Audit Committee of the Board made a site visit to three pricing service providers.
The Board considers the information provided and knowledge gained at these meetings and visits during the year when performing its annual review of the Advisory Agreements. The Independent Board Members also are assisted throughout the process by independent legal counsel. Counsel provided materials describing applicable law and the duties of directors or trustees in reviewing advisory contracts. During the course of the year and during their deliberations regarding the review of advisory contracts, the Independent Board Members met with independent legal counsel in executive sessions without management present. In addition, it is important to recognize that the management arrangements for the Nuveen funds are the result of many years of review and discussion between the Independent Board Members and fund management and that the Board Members’ conclusions may be based, in part, on their consideration of fee arrangements and other factors developed in previous years.
The Board considered all factors it believed relevant with respect to each Fund, including among other factors: (a) the nature, extent and quality of the services provided by the Fund Advisers, (b) the investment performance of the Fund and Fund Advisers, (c) the advisory fees and costs of the services to be provided to the Fund and the profitability of the Fund Advisers, (d) the extent of any economies of scale, (e) any benefits derived by the Fund Advisers from the relationship with the Fund and (f) other factors. Each Board Member may have accorded different weight to the various factors in reaching his or her conclusions with respect to a Fund’s Advisory Agreements. The Independent Board Members did not identify any single factor as all important or controlling. The Independent Board Members’ considerations were instead based on a comprehensive consideration of all the information presented. The principal factors considered by the Board and its conclusions are described below.
A. Nature, Extent and Quality of Services
In considering renewal of the Advisory Agreements, the Independent Board Members considered the nature, extent and quality of the Fund Adviser’s services, including advisory services and the resulting Fund performance and administrative services. The Independent Board Members further considered the overall reputation and capabilities of the Adviser and its affiliates, the commitment of the Adviser to provide high quality service to the Funds, their overall confidence in the capability and integrity of the Adviser and its staff and the Adviser’s responsiveness to questions and concerns raised by them. The Independent Board Members reviewed materials outlining, among other things, the Fund Adviser’s organization and business; the types of services that the Fund Adviser or its affiliates provide to the Funds; the performance record of the applicable Fund (as described in further detail below); and any applicable initiatives Nuveen had taken for the closed-end fund product line.
| Nuveen Investments | 43 |
Annual Investment Management Agreement Approval Process (Unaudited) (continued)
In considering advisory services, the Board recognized that the Adviser provides various oversight, administrative, compliance and other services for the Funds and the Sub-Adviser generally provides the portfolio investment management services to the Funds. In reviewing the portfolio management services provided to each Fund, the Board reviewed the materials provided by the Nuveen Investment Services Oversight Team analyzing, among other things, the Sub-Adviser’s investment team and changes thereto, organization and history, assets under management, the investment team’s philosophy and strategies in managing the Fund, developments affecting the Sub-Adviser or Fund and Fund performance. The Independent Board Members also reviewed portfolio manager compensation arrangements to evaluate each Fund Adviser’s ability to attract and retain high quality investment personnel, preserve stability, and reward performance but not provide an inappropriate incentive to take undue risks. In addition, the Board considered the Adviser’s execution of its oversight responsibilities over the Sub-Adviser. Given the importance of compliance, the Independent Board Members also considered Nuveen’s compliance program, including the report of the chief compliance officer regarding the Funds’ compliance policies and procedures; the resources dedicated to compliance; and the record of compliance with the policies and procedures. Given the Adviser’s emphasis on business risk, the Board also appointed an Independent Board Member as a point person to review and keep the Board apprised of developments in this area during the year.
In addition to advisory services, the Board considered the quality and extent of administrative and other non-investment advisory services the Adviser and its affiliates provide to the Funds, including product management, investment services (such as oversight of investment policies and procedures, risk management, and pricing), fund administration, oversight of service providers, shareholder services and communications, administration of Board relations, regulatory and portfolio compliance, legal support, managing leverage and promoting an orderly secondary market for common shares. The Board further recognized Nuveen’s additional investments in personnel, including in compliance and risk management.
In reviewing the services provided, the Board considered the new services and service enhancements that the Adviser has implemented since the various advisory agreements were last reviewed. In reviewing the activities of 2012, the Board recognized the Adviser’s focus on product rationalization for both closed-end and open-end funds during the year, consolidating certain Nuveen funds through mergers that were designed to improve efficiencies and economies of scale for shareholders, repositioning various Nuveen funds through updates in their investment policies and guidelines with the expectation of bringing greater value to shareholders, and liquidating certain Nuveen funds. The Board recognized the Adviser’s significant investment in technology initiatives to, among other things, create a central repository for fund and other Nuveen product data, develop a group within the Adviser designed to handle and analyze fund performance data, and implement a data system to support the risk oversight group. The Board also recognized the enhancements in the valuation group within the Adviser, including upgrading the team and process and automating certain basic systems, and in the compliance group with the addition of personnel, particularly within the testing group. With the advent of the Open-End Fund Committee and Closed-End Fund Committee, the Board also noted the enhanced support and comprehensive in-depth presentations provided by the Adviser to these committees.
In addition to the foregoing actions, the Board also considered other initiatives related to the Nuveen closed-end funds, including the significant level of oversight and administration necessary to manage leverage that has become increasingly varied and complex and the ongoing redesign of technology systems to manage and track the various forms of leverage; continued capital management services, including developing shelf offering programs for various funds; the implementation of projects designed to enhance data integrity for information published on the web and to increase the use of data received from third parties to gain market intelligence; and the continued communication efforts with shareholders, fund analysts and financial advisers. With respect to the latter, the Independent Board Members noted Nuveen’s continued commitment to supporting the secondary market for the common shares of its
| 44 | Nuveen Investments |
closed-end funds through a comprehensive secondary market communication program and campaigns designed to raise investor and analyst awareness and understanding of closed-end funds. Nuveen’s support services included, among other things: developing materials covering the Nuveen closed-end fund product line and educational materials regarding closed-end funds; designing and executing various marketing campaigns; supporting and promoting the alternative minimum tax (AMT)-free funds; sponsoring and participating in conferences; communicating with closed-end fund analysts and financial advisers throughout the year; providing marketing and product updates for the closed-end funds; and maintaining and enhancing a closed-end fund website.
Based on their review, the Independent Board Members found that, overall, the nature, extent and quality of services provided to the respective Funds under each applicable Advisory Agreement were satisfactory.
B. The Investment Performance of the Funds and Fund Advisers
The Board, including the Independent Board Members, considered the performance history of each Fund over various time periods. The Board reviewed reports, including an analysis of the Funds’ performance and the applicable investment team. In general, in considering a fund’s performance, the Board recognized that a fund’s performance can be reviewed through various measures including the fund’s absolute return, the fund’s return compared to the performance of other peer funds, and the fund’s performance compared to its respective benchmark. Accordingly, the Board reviewed, among other things, each Fund’s historic investment performance as well as information comparing the Fund’s performance information with that of other funds (the “Performance Peer Group”) and with recognized and/or customized benchmarks (i.e., generally benchmarks derived from multiple recognized benchmarks) for the quarter and one-year periods ending December 31, 2012 as well as performance information reflecting the first quarter of 2013. In addition, with respect to closed-end funds (such as the Funds), the Independent Board Members also reviewed historic premium and discount levels, including a summary of actions taken to address or discuss other developments affecting the secondary market discounts of various funds. This information supplemented the fund performance information provided to the Board at each of its quarterly meetings.
In evaluating performance, the Board recognized several factors that may impact the performance data as well as the consideration given to particular performance data. The Board recognized that the performance data reflects a snapshot of time, in this case as of the end of the most recent calendar year or quarter. The Board noted that selecting a different performance period could derive significantly different results. Further, the Board recognized that it is possible that long-term performance can be adversely affected by even one period of significant underperformance so that a single investment decision or theme has the ability to disproportionately affect long-term performance. The Independent Board Members also noted that the investment experience of a particular shareholder in the Nuveen funds will vary depending on when such shareholder invests in the applicable fund, the class held (if multiple classes are offered in a fund) and the performance of the fund (or respective class) during that shareholder’s investment period.
With respect to the comparative performance information, the Board recognized that the usefulness of comparative performance data as a frame of reference to measure a fund’s performance may be limited because the Performance Peer Group, among other things, does not adequately reflect the objectives and strategies of the fund, has a different investable universe, or the composition of the peer set may be limited in size or number as well as other factors. In this regard, the Board noted that the Adviser classified, in relevant part, the Performance Peer Groups of certain funds as having significant differences from the funds but to still be somewhat relevant while the Performance Peer Groups of other funds (including the Funds) were classified as having such significant differences as to be irrelevant. Accordingly, while the Board is cognizant of the relative performance of a fund’s peer set and/or benchmark(s), the Board evaluated
| Nuveen Investments | 45 |
Annual Investment Management Agreement Approval Process (Unaudited) (continued)
fund performance in light of the respective fund’s investment objectives, investment parameters and guidelines and considered that the variations between the objectives and investment parameters or guidelines of the funds with their peers and/or benchmarks result in differences in performance results. In addition, with respect to any Nuveen funds for which the Board has identified performance concerns, the Board monitors such funds closely until performance improves, discusses with the Adviser the reasons for such results, considers those steps necessary or appropriate to address such issues, and reviews the results of any efforts undertaken.
In considering the performance data for the Funds, given that, as noted above, the Performance Peer Group for each Fund was classified as irrelevant, thereby limiting the usefulness of the peer comparison data, the Independent Board Members also considered the Funds’ performance compared to their respective benchmarks. In this regard, they noted with respect to each Fund, that although it underperformed its benchmark for the one-year period ending December 31, 2012, it outperformed its benchmark for the quarter and one-year periods ending March 31, 2013.
Based on their review, the Independent Board Members determined that each Fund’s investment performance had been satisfactory.
| C. | Fees, Expenses and Profitability |
| 1. Fees and Expenses | |
The Board evaluated the management fees and expenses of each Fund reviewing, among other things, such Fund’s gross management fees, net management fees and net expense ratio in absolute terms as well as compared to the fees and expenses of a comparable universe of funds provided by an independent fund data provider (the “Peer Universe”) and any expense limitations. | |
| The Independent Board Members further reviewed the methodology regarding the construction of the applicable Peer Universe. In reviewing the comparisons of fee and expense information, the Independent Board Members took into account that in certain instances various factors such as: the limited size and particular composition of the Peer Universe (including the inclusion of other Nuveen funds in the peer set); expense anomalies; changes in the funds comprising the Peer Universe from year to year; levels of reimbursement or fee waivers; the timing of information used; and the differences in the type and use of leverage may impact the comparative data, thereby limiting somewhat the ability to make a meaningful comparison with peers. | |
| In reviewing the fee schedule for a Fund, the Independent Board Members also considered the fund-level and complex-wide breakpoint schedules (described in further detail below) and any fee waivers and reimbursements provided by Nuveen. In reviewing fees and expenses (excluding leverage costs and leveraged assets, as applicable), the Board considered the expenses and fees to be higher if they were over 10 basis points higher, slightly higher if they were approximately 6 to 10 basis points higher, in line if they were within approximately 5 basis points higher than the peer average and below if they were below the peer average of the Peer Universe. In reviewing the reports, the Board noted that the majority of the Nuveen funds were at, close to or below their peer set average based on the net total expense ratio. | |
| The Independent Board Members noted that the Funds had net management fees and net expense ratios (including fee waivers and expense reimbursements) that were below their respective peer averages. | |
| Based on their review of the fee and expense information provided, the Independent Board Members determined that each Fund’s management fees to a Fund Adviser were reasonable in light of the nature, extent and quality of services provided to the Fund. |
| 46 | Nuveen Investments |
| 2. Comparisons with the Fees of Other Clients | |
| The Board recognized that all Nuveen funds have a sub-adviser (which, in the case of the Funds, is an affiliated sub-adviser), and therefore, the overall fund management fee can be divided into two components, the fee retained by the Adviser and the fee paid to the sub-adviser. In general terms, the fee to the Adviser reflects the administrative services it provides to support the funds, and while some administrative services may occur at the sub-adviser level, the fee generally reflects the portfolio management services provided by the sub-adviser. The Independent Board Members reviewed information regarding the nature of services provided by the Adviser, including through the Sub-Adviser, and the range of fees and average fee the Sub-Adviser assessed for such services to other clients. Such other clients include separately managed accounts (both retail and institutional accounts), foreign investment funds offered by Nuveen and funds that are not offered by Nuveen but are sub-advised by one of Nuveen’s investment management teams. In evaluating the comparisons of fees, the Independent Board Members noted that the fee rates charged to the Funds and other clients vary, among other things, because of the different services involved and the additional regulatory and compliance requirements associated with registered investment companies, such as the Funds. Accordingly, the Independent Board Members considered the differences in the product types, including, but not limited to, the services provided, the structure and operations, product distribution and costs thereof, portfolio investment policies, investor profiles, account sizes and regulatory requirements. The Independent Board Members noted, in particular, that the range of services provided to the Funds (as discussed above) is much more extensive than that provided to separately managed accounts. Many of the additional administrative services provided by the Adviser are not required for institutional clients. The Independent Board Members further noted that the management fee rates of the foreign funds advised by the Adviser may vary due to, among other things, differences in the client base, governing bodies, operational complexities and services covered by the management fee. Given the inherent differences in the various products, particularly the extensive services provided to the Funds, the Independent Board Members believe such facts justify the different levels of fees. | |
| 3. Profitability of Fund Advisers | |
| In conjunction with their review of fees, the Independent Board Members also considered the profitability of Nuveen for its advisory activities and its financial condition. The Independent Board Members reviewed the revenues and expenses of Nuveen’s advisory activities for the last two calendar years, the allocation methodology used in preparing the profitability data and an analysis of the key drivers behind the changes in revenues and expenses that impacted profitability in 2012. The Independent Board Members noted this information supplemented the profitability information requested and received during the year to help keep them apprised of developments affecting profitability (such as changes in fee waivers and expense reimbursement commitments). In this regard, the Independent Board Members noted that they have an Independent Board Member serve as a point person to review and keep them apprised of changes to the profitability analysis and/or methodologies during the year. The Independent Board Members also considered Nuveen’s revenues for advisory activities, expenses, and profit margin compared to that of various unaffiliated management firms with comparable assets under management (based on asset size and asset composition). | |
| In reviewing profitability, the Independent Board Members recognized the Adviser’s continued investment in its business to enhance its services, including capital improvements to investment technology, updated compliance systems, and additional personnel. In addition, in evaluating profitability, the Independent Board Members also recognized the subjective nature of determining profitability which may be affected by numerous factors including the allocation of expenses and that various allocation methodologies may each be reasonable but yield different results. Further, the Independent Board Members recognized the difficulties in making comparisons as the profitability of other advisers generally is not publicly available and the profitability information that is available for |
| Nuveen Investments | 47 |
Annual Investment Management Agreement Approval Process (Unaudited) (continued)
| certain advisers or management firms may not be representative of the industry and may be affected by, among other things, the adviser’s particular business mix, capital costs, types of funds managed and expense allocations. Notwithstanding the foregoing, the Independent Board Members reviewed Nuveen’s methodology and assumptions for allocating expenses across product lines to determine profitability. Based on their review, the Independent Board Members concluded that the Adviser’s level of profitability for its advisory activities was reasonable in light of the services provided. | |
| With respect to sub-advisers affiliated with Nuveen, including the Sub-Adviser, the Independent Board Members reviewed the sub-adviser’s revenues, expenses and profitability margins (pre- and post-tax) for its advisory activities and the methodology used for allocating expenses among the internal sub-advisers. Based on their review, the Independent Board Members were satisfied that the Sub-Adviser’s level of profitability was reasonable in light of the services provided. | |
| In evaluating the reasonableness of the compensation, the Independent Board Members also considered other amounts paid to a Fund Adviser by the Funds as well as indirect benefits (such as soft dollar arrangements), if any, the Fund Adviser and its affiliates receive, or are expected to receive, that are directly attributable to the management of the Funds. See Section E below for additional information on indirect benefits a Fund Adviser may receive as a result of its relationship with the Funds. Based on their review of the overall fee arrangements of each Fund, the Independent Board Members determined that the advisory fees and expenses of the respective Fund were reasonable. |
D. Economies of Scale and Whether Fee Levels Reflect These Economies of Scale
With respect to economies of scale, the Independent Board Members have recognized the potential benefits resulting from the costs of a fund being spread over a larger asset base, although economies of scale are difficult to measure and predict with precision, particularly on a fund-by-fund basis. One method to help ensure the shareholders share in these benefits is to include breakpoints in the advisory fee schedule. Generally, management fees for funds in the Nuveen complex are comprised of a fund-level component and a complex-level component, subject to certain exceptions. Accordingly, the Independent Board Members reviewed and considered the applicable fund-level breakpoints in the advisory fee schedules that reduce advisory fees as asset levels increase. Further, the Independent Board Members noted that although closed-end funds may from time-to-time make additional share offerings, the growth of their assets will occur primarily through the appreciation of such funds’ investment portfolio.
In addition to fund-level advisory fee breakpoints, the Board also considered the Funds’ complex-wide fee arrangement. Pursuant to the complex-wide fee arrangement, the fees of the funds in the Nuveen complex are generally reduced as the assets in the fund complex reach certain levels. The complex-wide fee arrangement seeks to provide the benefits of economies of scale to fund shareholders when total fund complex assets increase, even if assets of a particular fund are unchanged or have decreased. The approach reflects the notion that some of Nuveen’s costs are attributable to services provided to all its funds in the complex and therefore all funds benefit if these costs are spread over a larger asset base. In addition, with the acquisition of the funds previously advised by FAF Advisors, Inc. at the end of 2010, the Board noted that a portion of such funds’ assets at the time of acquisition were deemed eligible to be included in the complex-wide fee calculation in order to deliver fee savings to shareholders in the combined complex and such funds were subject to differing complex-level fee rates.
| 48 | Nuveen Investments |
Based on their review, the Independent Board Members concluded that the breakpoint schedules and complex-wide fee arrangement were acceptable and reflect economies of scale to be shared with shareholders when assets under management increase.
E. Indirect Benefits
In evaluating fees, the Independent Board Members received and considered information regarding potential “fall out” or ancillary benefits the respective Fund Adviser or its affiliates may receive as a result of its relationship with each Fund. In this regard, the Independent Board Members considered any revenues received by affiliates of the Adviser for serving as co-manager in initial public offerings of new closed-end funds as well as revenues received in connection with secondary offerings.
In addition to the above, the Independent Board Members considered whether the Fund Advisers received any benefits from soft dollar arrangements whereby a portion of the commissions paid by a Fund for brokerage may be used to acquire research that may be useful to the Fund Adviser in managing the assets of the Funds and other clients. The Funds’ portfolio transactions are determined by the Sub-Adviser. Accordingly, the Independent Board Members considered that the Sub-Adviser may benefit from its soft dollar arrangements pursuant to which it receives research from brokers that execute the Funds’ portfolio transactions. With respect to fixed income securities, however, the Board recognized that such securities generally trade on a principal basis that does not generate soft dollar credits. Nevertheless, the Sub-Adviser may also engage in soft dollar arrangements on behalf of other clients, and the Funds as well as the Sub-Adviser may benefit from the research or other services received. Similarly, the Board recognized that the research received pursuant to soft dollar arrangements by the Sub-Adviser may also benefit a Fund and shareholders to the extent the research enhances the ability of the Sub-Adviser to manage the Fund. The Independent Board Members noted that the Sub-Adviser’s profitability may be somewhat lower if it did not receive the research services pursuant to the soft dollar arrangements and had to acquire such services directly.
Based on their review, the Independent Board Members concluded that any indirect benefits received by a Fund Adviser as a result of its relationship with the Funds were reasonable and within acceptable parameters.
F. Other Considerations
The Independent Board Members did not identify any single factor discussed previously as all-important or controlling. The Board Members, including the Independent Board Members, unanimously concluded that the terms of each Advisory Agreement are fair and reasonable, that the respective Fund Adviser’s fees are reasonable in light of the services provided to each Fund and that the Advisory Agreements be renewed.
| Nuveen Investments | 49 |
| Reinvest Automatically, | |
| Easily and Conveniently | |
Nuveen makes reinvesting easy. A phone call is all it takes to set up your reinvestment account.
Nuveen Closed-End Funds Automatic Reinvestment Plan
Nuveen Closed-End Fund allows you to conveniently reinvest distributions in additional Fund shares. By choosing to reinvest, you’ll be able to invest money regularly and automatically, and watch your investment grow through the power of compounding. Just like distributions in cash, there may be times when income or capital gains taxes may be payable on distributions that are reinvested. It is important to note that an automatic reinvestment plan does not ensure a profit, nor does it protect you against loss in a declining market.
Easy and convenient
To make recordkeeping easy and convenient, each month you’ll receive a statement showing your total distributions, the date of investment, the shares acquired and the price per share, and the total number of shares you own.
How shares are purchased
The shares you acquire by reinvesting will either be purchased on the open market or newly issued by the Fund. If the shares are trading at or above net asset value at the time of valuation, the Fund will issue new shares at the greater of the net asset value or 95% of the then-current market price. If the shares are trading at less than net asset value, shares for your account will be purchased on the open market. If the Plan Agent begins purchasing Fund shares on the open market while shares are trading below net asset value, but the Fund’s shares subsequently trade at or above their net asset value before the Plan Agent is able to complete its purchases, the Plan Agent may cease open-market purchases and may invest the uninvested portion of the distribution in newly-issued Fund shares at a price equal to the greater of the shares’ net asset value or 95% of the shares’ market value on the last business day immediately prior to the purchase date. Distributions received to purchase shares in the open market will normally be invested shortly after the distribution payment date. No interest will be paid on distributions awaiting reinvestment. Because the market price of the shares may increase before purchases are completed, the average purchase price per share may exceed the market price at the time of valuation, resulting in the acquisition of fewer shares than if the distribution had been paid in shares issued by the Fund. A pro rata portion of any applicable brokerage commissions on open market purchases will be paid by Plan participants. These commissions usually will be lower than those charged on individual transactions.
Flexible
You may change your distribution option or withdraw from the Plan at any time, should your needs or situation change. You can reinvest whether your shares are registered in your name, or in the name of a brokerage firm, bank, or other nominee. Ask your investment advisor if his or her firm will participate on your behalf. Participants whose shares are registered in the name of one firm may not be able to transfer the shares to another firm and continue to participate in the Plan. The Fund reserves the right to amend or terminate the Plan at any time. Although the Fund reserves the right to amend the Plan to include a service charge payable by the participants, there is no direct service charge to participants in the Plan at this time.
Call today to start reinvesting distributions
For more information on the Nuveen Automatic Reinvestment Plan or to enroll in or withdraw from the Plan, speak with your financial advisor or call us at (800) 257-8787.
| 50 | Nuveen Investments |
Glossary of Terms Used in this Report
| ■ | Auction Rate Bond: An auction rate bond is a security whose interest payments are adjusted periodically through an auction process, which process typically also serves as a means for buying and selling the bond. Auctions that fail to attract enough buyers for all the shares offered for sale are deemed to have “failed,” with current holders receiving a formula-based interest rate until the next scheduled auction. |
| ■ | Average Annual Total Return: This is a commonly used method to express an investment’s performance over a particular, usually multi-year time period. It expresses the return that would have been necessary each year to equal the investment’s actual cumulative performance (including change in NAV or market price and reinvested dividends and capital gains distributions, if any) over the time period being considered. |
| ■ | Barclays Build America Bond Index: An unleveraged index that comprises all direct pay Build America Bonds that are SEC-regulated, taxable, dollar-denominated and have at least one year to final maturity, at least $250 million par amount outstanding, and are determined to be investment grade by Barclays. Index returns assume reinvestment of distributions, but do not reflect any applicable sales charges or management fees. |
| ■ | Duration: Duration is a measure of the expected period over which a bond’s principal and interest will be paid, and consequently is a measure of the sensitivity of a bond’s or bond fund’s value to changes when market interest rates change. Generally, the longer a bond’s or fund’s duration, the more the price of the bond or fund will change as interest rates change. |
| ■ | Effective Leverage: Effective leverage is a fund’s effective economic leverage, and includes both regulatory leverage (see leverage) and the leverage effects of certain derivative investments in a Fund’s portfolio. Currently, the leverage effects of Tender Option Bond (TOB) inverse floater holdings are included in effective leverage values, in addition to any regulatory leverage. |
| ■ | Forward Interest Rate Swap: A contractual agreement between two counterparties under which one party agrees to make periodic payments to the other for an agreed period of time based on a fixed rate, while the other party agrees to make periodic payments based on a floating rate of interest based on an underlying index. Alternatively, both series of cashflows to be exchanged could be calculated using floating rates of interest but floating rates that are based upon different underlying indices. |
| ■ | Gross Domestic Product (GDP): The total market value of all final goods and services produced in a country/region in a given year, equal to total consumer, investment and government spending, plus the value of exports, minus the value of imports. |
| ■ | Inverse Floating Rate Securities: Inverse floating rate securities, also known as inverse floaters or tender option bonds (TOBs), are created by depositing a municipal bond, typically with a fixed interest rate, into a special purpose trust created by a broker-dealer. This trust, in turn, (a) issues floating rate certificates typically paying short-term tax-exempt interest rates to third parties in amounts equal to some fraction of the deposited bond’s par amount or market value, and (b) issues an inverse floating rate certificate (sometimes referred to as an “inverse floater”) to an investor (such as a fund) interested in gaining investment exposure to a long-term municipal bond. The income received by the holder of the inverse floater varies inversely with the short-term rate paid to the floating rate certificates’ holders, and in most |
| Nuveen Investments | 51 |
Glossary of Terms Used in this Report (continued) |
| circumstances the holder of the inverse floater bears substantially all of the underlying bond’s downside investment risk. The holder of the inverse floater typically also benefits disproportionately from any potential appreciation of the underlying bond’s value. Hence, an inverse floater essentially represents an investment in the underlying bond on a leveraged basis. | |
| ■ | Leverage: Leverage is created whenever a fund has investment exposure (both reward and/or risk) equivalent to more than 100% of the investment capital. |
| ■ | Net Asset Value (NAV) Per Share: A fund’s Net Assets is equal to its total assets (securities, cash, accrued earnings and receivables) less its total liabilities. NAV per share is equal to the fund’s Net Assets divided by its number of shares outstanding. |
| ■ | Pre-Refunding: Pre-Refunding, also known as advanced refundings or refinancings, is a procedure used by state and local governments to refinance municipal bonds to lower interest expenses. The issuer sells new bonds with a lower yield and uses the proceeds to buy U.S. Treasury securities, the interest from which is used to make payments on the higher-yielding bonds. Because of this collateral, pre-refunding generally raises a bond’s credit rating and thus its value. |
| ■ | Regulatory Leverage: Regulatory Leverage consists of preferred shares issued by or borrowings of a fund. Both of these are part of a fund’s capital structure. Regulatory leverage is subject to asset coverage limits set in the Investment Company Act of 1940. |
| ■ | Total Investment Exposure: Total investment exposure is a fund’s assets managed by the Adviser that are attributable to financial leverage. For these purposes, financial leverage includes a fund’s use of preferred stock and borrowings and investments in the residual interest certificates (also called inverse floating rate securities) in tender option bond (TOB) trusts, including the portion of assets held by a TOB trust that has been effectively financed by the trust’s issuance of floating rate securities. |
| ■ | Zero Coupon Bond: A zero coupon bond does not pay a regular interest coupon to its holders during the life of the bond. Tax-exempt income to the holder of the bond comes from accretion of the difference between the original purchase price of the bond at issuance and the par value of the bond at maturity and is effectively paid at maturity. The market prices of zero coupon bonds generally are more volatile than the market prices of bonds that pay interest periodically. |
| 52 | Nuveen Investments |
Notes
| Nuveen Investments | 53 |
Notes
| 54 | Nuveen Investments |
Additional Fund Information
| Board of Trustees | ||||||||||
| William Adams IV* | Robert P. Bremner | Jack B. Evans | William C. Hunter | David J. Kundert | John K. Nelson | |||||
| William J. Schneider | Thomas S. Schreier, Jr.* | Judith M. Stockdale | Carole E. Stone | Virginia L. Stringer | Terence J. Toth |
* Interested Board Member.
| Fund Manager | Custodian | Legal Counsel | Independent Registered | Transfer Agent and | ||||
Nuveen Fund Advisors, LLC 333 West Wacker Drive Chicago, IL 60606 | State Street Bank & Trust Company Boston, MA 02111 | Chapman and Cutler LLP Chicago, IL 60603 | Public Accounting Firm Ernst & Young LLP Chicago, IL 60606 | Shareholder Services State Street Bank & Trust Company Nuveen Funds P.O. Box 43071 Providence, RI 02940-3071 (800) 257-8787 |
Quarterly Form N-Q Portfolio of Investments Information
Each Fund is required to file its complete schedule of portfolio holdings with the Securities and Exchange Commission (SEC) for the first and third quarters of each fiscal year on Form N-Q. You may obtain this information directly from the SEC. Visit the SEC on-line at http://www.sec.gov or in person at the SEC’s Public Reference Room in Washington, D.C. Call the SEC toll-free at (800) SEC-0330 for room hours and operation.
Nuveen Funds’ Proxy Voting Information
You may obtain (i) information regarding how each fund voted proxies relating to portfolio securities held during the most recent twelve-month period ended June 30, without charge, upon request, by calling Nuveen Investments toll-free at (800) 257-8787 or on Nuveen’s website at www.nuveen.com and (ii) a description of the policies and procedures that each fund used to determine how to vote proxies relating to portfolio securities without charge, upon request, by calling Nuveen Investments toll free at (800) 257-8787. You may also obtain this information directly from the SEC. Visit the SEC on-line at http://www.sec.gov.
CEO Certification Disclosure
Each Fund’s Chief Executive Officer has submitted to the New York Stock Exchange (NYSE) the annual CEO certification as required by Section 303A.12(a) of the NYSE Listed Company Manual. Each Fund has filed with the SEC the certification of its Chief Executive Officer and Chief Financial Officer required by Section 302 of the Sarbanes-Oxley Act.
Share Information
Each Fund intends to repurchase shares of its own common stock at such times and in such amounts as is deemed advisable. During the period covered by this report, the Fund repurchased shares of its common stock as shown in the accompanying table. Any future repurchases will be reported to shareholders in the next annual or semi-annual report.
| NBB | NBD | ||||||
| Shares repurchased | — | — |
| Nuveen Investments | 55 |
| Nuveen Investments: | |
| Serving Investors for Generations | |
Since 1898, financial advisors and their clients have relied on Nuveen Investments to provide dependable investment solutions through continued adherence to proven, long-term investing principles. Today, we offer a range of high quality equity and fixed-income solutions designed to be integral components of a well-diversified core portfolio.
Focused on meeting investor needs.
Nuveen Investments provides high-quality investment services designed to help secure the long-term goals of institutional and individual investors as well as the consultants and financial advisors who serve them. Nuveen Investments markets a wide range of specialized investment solutions which provide investors access to capabilities of its high-quality boutique investment affiliates—Nuveen Asset Management, Symphony Asset Management, NWQ Investment Management Company, Santa Barbara Asset Management, Tradewinds Global Investors, Winslow Capital Management and Gresham Investment Management. In total, Nuveen Investments managed approximately $215 billion as of September 30, 2013.
Find out how we can help you.
To learn more about how the products and services of Nuveen Investments may be able to help you meet your financial goals, talk to your financial advisor, or call us at (800) 257-8787. Please read the information provided carefully before you invest. Investors should consider the investment objective and policies, risk considerations, charges and expenses of any investment carefully. Where applicable, be sure to obtain a prospectus, which contains this and other relevant information. To obtain a prospectus, please contact your securities representative or Nuveen Investments, 333 W. Wacker Dr., Chicago, IL 60606. Please read the prospectus carefully before you invest or send money.
Learn more about Nuveen Funds at: www.nuveen.com/cef
| Distributed by Nuveen Investments, LLC | 333 West Wacker Drive | Chicago, IL 60606 | www.nuveen.com |  |
ESA-C-0913D
ITEM 2. CODE OF ETHICS.
Not applicable to this filing.
ITEM 3. AUDIT COMMITTEE FINANCIAL EXPERT.
Not applicable to this filing.
ITEM 4. PRINCIPAL ACCOUNTANT FEES AND SERVICES.
Not applicable to this filing.
ITEM 5. AUDIT COMMITTEE OF LISTED REGISTRANTS.
Not applicable to this filing.
ITEM 6. SCHEDULE OF INVESTMENTS.
(a) See Portfolio of Investments in Item 1.
(b) Not applicable.
ITEM 7. DISCLOSURE OF PROXY VOTING POLICIES AND PROCEDURES FOR CLOSED-END MANAGEMENT INVESTMENT COMPANIES.
Not applicable to this filing.
ITEM 8. PORTFOLIO MANAGERS OF CLOSED-END MANAGEMENT INVESTMENT COMPANIES.
Not applicable to this filing.
ITEM 9. PURCHASES OF EQUITY SECURITIES BY CLOSED-END MANAGEMENT INVESTMENT COMPANY AND AFFILIATED PURCHASERS.
Not applicable.
ITEM 10. SUBMISSION OF MATTERS TO A VOTE OF SECURITY HOLDERS.
There have been no material changes to the procedures by which shareholders may recommend nominees to the registrant's Board implemented after the registrant last provided disclosure in response to this Item.
ITEM 11. CONTROLS AND PROCEDURES.
| (a) | The registrant's principal executive and principal financial officers, or persons performing similar functions, have concluded that the registrant's disclosure controls and procedures (as defined in Rule 30a-3(c) under the Investment Company Act of 1940, as amended (the "1940 Act") (17 CFR 270.30a-3(c))) are effective, as of a date within 90 days of the filing date of this report that includes the disclosure required by this paragraph, based on their evaluation of the controls and procedures required by Rule 30a-3(b) under the 1940 Act (17 CFR 270.30a-3(b)) and Rules 13a-15(b) or 15d-15(b) under the Securities Exchange Act of 1934, as amended (the "Exchange Act")(17 CFR 240.13a-15(b) or 240.15d-15(b)). |
| (b) | There were no changes in the registrant's internal control over financial reporting (as defined in Rule 30a-3(d) under the 1940 Act (17 CFR 270.30a-3(d)) that occurred during the second fiscal quarter of the period covered by this report that has materially affected, or is reasonably likely to materially affect, the registrant's internal control over financial reporting. |
ITEM 12. EXHIBITS.
File the exhibits listed below as part of this Form.
| (a)(1) | Any code of ethics, or amendment thereto, that is the subject of the disclosure required by Item 2, to the extent that the registrant intends to satisfy the Item 2 requirements through filing of an exhibit: Not applicable to this filing. |
| (a)(2) | A separate certification for each principal executive officer and principal financial officer of the registrant as required by Rule 30a-2(a) under the 1940 Act (17 CFR 270.30a-2(a)) in the exact form set forth below: See Ex-99.CERT attached hereto. |
| (a)(3) | Any written solicitation to purchase securities under Rule 23c-1 under the 1940 Act (17 CFR 270.23c-1) sent or given during the period covered by the report by or on behalf of the registrant to 10 or more persons: Not applicable. |
| (b) | If the report is filed under Section 13(a) or 15(d) of the Exchange Act, provide the certifications required by Rule 30a-2(b) under the 1940 Act (17 CFR 270.30a-2(b)); Rule 13a-14(b) or Rule 15d-14(b) under the Exchange Act (17 CFR 240.13a-14(b) or 240.15d-14(b)), and Section 1350 of Chapter 63 of Title 18 of the United States Code (18 U.S.C. 1350) as an exhibit. A certification furnished pursuant to this paragraph will not be deemed "filed" for purposes of Section 18 of the Exchange Act (15 U.S.C. 78r), or otherwise subject to the liability of that section. Such certification will not be deemed to be incorporated by reference into any filing under the Securities Act of 1933 or the Exchange Act, except to the extent that the registrant specifically incorporates it by reference: See Ex-99.906 CERT attached hereto. |
SIGNATURES
Pursuant to the requirements of the Securities Exchange Act of 1934 and the Investment Company Act of 1940, the registrant has duly caused this report to be signed on its behalf by the undersigned, thereunto duly authorized.
(Registrant) Nuveen Build America Bond Opportunity Fund
By (Signature and Title) /s/ Kevin J. McCarthy
Kevin J. McCarthy
Vice President and Secretary
Date: December 5, 2013
Pursuant to the requirements of the Securities Exchange Act of 1934 and the Investment Company Act of 1940, this report has been signed below by the following persons on behalf of the registrant and in the capacities and on the dates indicated.
By (Signature and Title) /s/ Gifford R. Zimmerman
Gifford R. Zimmerman
Chief Administrative Officer
(principal executive officer)
Date: December 5, 2013
By (Signature and Title) /s/ Stephen D. Foy
Stephen D. Foy
Vice President and Controller
(principal financial officer)
Date: December 5, 2013