Exhibit 99.1
Naugatuck Valley
Financial Corp.
Conversion
Valuation
Appraisal
May 28, 2010
Table of Contents
Naugatuck Valley Financial Corporation
Naugatuck, Connecticut
TABLE OF CONTENTS | I | |
INTRODUCTION | 1 | |
1. OVERVIEW AND FINANCIAL ANALYSIS | 4 | |
GENERAL OVERVIEW | 4 | |
HISTORYAND OVERVIEW | 5 | |
STRATEGIC DIRECTION | 7 | |
BALANCE SHEET TRENDS | 8 | |
LOAN PORTFOLIO | 12 | |
INVESTMENTS | 16 | |
INVESTMENTSAND MORTGAGE-BACKED SECURITIES | 18 | |
ASSET QUALITY | 19 | |
FUNDING COMPOSITION | 23 | |
ASSET/LIABILITY MANAGEMENT | 26 | |
NET WORTHAND CAPITAL | 27 | |
PROFITABILITY TRENDS | 28 | |
LEGAL PROCEEDINGS | 35 | |
SUBSIDIARIES | 35 | |
2. MARKET AREA ANALYSIS | 36 | |
3. COMPARISONS WITH PUBLICLY TRADED THRIFTS | 38 | |
INTRODUCTION | 38 | |
SELECTION CRITERIA | 38 | |
OVERVIEWOFTHE COMPARABLES | 40 | |
4. MARKET VALUE DETERMINATION | 44 | |
MARKET VALUE ADJUSTMENTS | 44 | |
FINANCIAL CONDITION | 45 | |
ASSET QUALITY | 48 | |
BALANCE SHEET GROWTH | 50 | |
EARNINGS QUALITY, PREDICTABILITYAND GROWTH | 51 | |
MARKETAREA | 58 | |
CASH DIVIDENDS | 60 | |
LIQUIDITYOFTHE ISSUE | 61 | |
RECENT REGULATORY MATTERS | 62 | |
5. OTHER FACTORS | 63 | |
MANAGEMENT | 63 | |
SUBSCRIPTION INTEREST | 64 | |
VALUATION ADJUSTMENTS | 66 | |
6. VALUATION | 67 | |
DISCUSSIONOF WEIGHT GIVENTO VALUATION MULTIPLES | 67 | |
FULL OFFERING VALUEIN RELATIONTO COMPARABLES | 69 | |
COMPARISONTOOTHER PENDING SECOND STEP CONVERSIONS | 72 | |
COMPARISONOFTHE EXCHANGE VALUEAND STOCK PRICE | 73 | |
VALUATION CONCLUSION | 74 | |
List of Figures
Naugatuck Valley Financial Corporation
Naugatuck, Connecticut
FIGURE 1 - CURRENT FACILITIES LIST | 4 | |
FIGURE 2 - ASSET AND RETAINED EARNINGS CHART | 9 | |
FIGURE 3 - KEY BALANCE SHEET DATA | 10 | |
FIGURE 4 - KEY RATIOS | 11 | |
FIGURE 5 - NET LOANS RECEIVABLE CHART | 13 | |
FIGURE 6 - LOAN MIX AS OF MARCH 31, 2010 | 14 | |
FIGURE 7 - LOAN MIX AT MARCH 31, 2010 | 15 | |
FIGURE 8 - SECURITIES CHART | 17 | |
FIGURE 9 - INVESTMENT MIX | 18 | |
FIGURE 10 - ASSET QUALITY CHART | 20 | |
FIGURE 11 - NONPERFORMING LOANS | 21 | |
FIGURE 12 - ALLOWANCE FOR POSSIBLE LOAN AND LEASE LOSSES CHART | 22 | |
FIGURE 13 - DEPOSIT AND BORROWING TREND CHART | 24 | |
FIGURE 14 - DEPOSIT MIX | 25 | |
FIGURE 15 - INTEREST RATE RISK | 26 | |
FIGURE 16 - CAPITAL ANALYSIS | 27 | |
FIGURE 17 - NET INCOME CHART | 29 | |
FIGURE 18 - AVERAGE YIELDS AND COSTS | 30 | |
FIGURE 19 - SPREAD AND MARGIN CHART | 33 | |
FIGURE 20 - INCOME STATEMENT TRENDS | 34 | |
FIGURE 21 - DEPOSIT AND DEMOGRAPHIC DATA FOR NEW HAVEN, CT | 37 | |
FIGURE 22 - DEPOSIT AND DEMOGRAPHIC DATA FOR FAIRFIELD, CT | 37 | |
FIGURE 23 - COMPARABLE GROUP | 39 | |
FIGURE 24 - KEY FINANCIAL INDICATORS | 42 | |
FIGURE 25 - KEY BALANCE SHEET DATA | 45 | |
FIGURE 26 - CAPITAL DATA | 46 | |
FIGURE 27 - ASSET QUALITY TABLE | 48 | |
FIGURE 28 - BALANCE SHEET GROWTH DATA | 50 | |
FIGURE 29 - PROFITABILITY DATA | 53 | |
FIGURE 30 - INCOME STATEMENT DATA | 56 | |
FIGURE 31 - MARKET AREA DATA | 58 | |
FIGURE 32 - DIVIDEND DATA | 60 | |
FIGURE 33 - MARKET CAPITALIZATION DATA | 61 | |
FIGURE 34 - SECOND STEP CONVERSIONS (SINCE 1/1/08) PRO FORMA DATA | 64 | |
FIGURE 35 - CONVERSIONS PRICE APPRECIATION | 65 | |
FIGURE 36 - VALUE RANGE | 69 | |
FIGURE 37 - APPRAISED VALUE | 69 | |
FIGURE 38 - CONVERSION OFFERING PRICING MULTIPLES | 70 | |
FIGURE 39 - COMPARABLE CONVERSION PRICING MULTIPLES TO THE BANK’S PRO FORMA MIDPOINT | 70 | |
FIGURE 40 - COMPARABLE CONVERSION PRICING MULTIPLES TO THE BANK’S PRO FORMA SUPER MAXIMUM | 70 | |
FIGURE 41 - COMPARABLE CONVERSION PRICING MULTIPLES TO THE BANK’S PRO FORMA MINIMUM | 71 | |
FIGURE 42 - COMPARISON TO OTHER PENDING SECOND STEP CONVERSIONS | 72 | |
FIGURE 43 - COMPARISON OF THE EXCHANGE VALUE PER MINORITY SHARE AND STOCK PRICE | 73 |
List of Exhibits
Naugatuck Valley Financial Corporation
Naugatuck, Connecticut
Exhibit | ||
| 1. | Profile of FinPro, Inc. and the Author of the Appraisal | |
| 2. | Consolidated Balance Sheets: NVSL and SSE | |
| 3. | Consolidated Statements of Income: NVSL and SSE | |
| 4. | Consolidated Statements of Equity and Comprehensive Income: NVSL and SSE | |
| 5. | Consolidated Statements of Cash Flows: NVSL and SSE | |
| 6. | Income Reconciliation of TFR to Consolidated Statements: NVSL | |
| 7. | Comparable Group Selection Screens | |
| 8. | Selected Financial Data | |
| 9. | Industry Pricing Multiples | |
| 10. | Second Step Conversions 2008 to Year-to-Date | |
| 11. | Consolidated Merger Pro forma Balance Sheet (w/o second step conversion): March 31, 2010 and December 31, 2009 | |
| 12. | Consolidated Merger Pro forma Income Statement (w/o second step conversion): 12 months ending March 31, 2010, 3 months ending March 31, 2010, and 12 months ending December 31, 2009 | |
| 13. | Appraisal Second Step No Foundation Pro Forma March 31, 2010 – 12 Months | |
| 14. | Stub Second Step No Foundation Pro Forma March 31, 2010 – 3 Months | |
| 15. | Offering Circular Second Step No Foundation Pro Forma December 31, 2009 – 12 Months | |
| 16. | Consolidated Merger Pro forma Balance Sheet: March 31, 2010 and December 31, 2009 | |
| 17. | Consolidated Merger Pro forma Income Statement: 12 months ending March 31, 2010, 3 months ending March 31, 2010, and 12 months ending December 31, 2009 | |
| Conversion Valuation Appraisal Report | Page: 1 | |
Introduction
Naugatuck Valley Financial Corporation, a newly formed Maryland corporation, is offering common stock for sale in connection with the conversion of Naugatuck Valley Savings and Loan from the mutual holding company form of organization to the stock form. As part of the conversion, the Bank is offering for sale common stock representing the 59.6% ownership interest of Naugatuck Valley Financial that is currently held by Naugatuck Valley Mutual Holding Company. At the conclusion of the conversion and offering, existing public shareholders of Naugatuck Valley Financial will receive shares of common stock in the new Naugatuck Valley Financial Corporation in exchange for their existing shares of common stock of Naugatuck Valley Financial.
In compiling the pro formas, FinPro relied upon the assumptions provided by the Bank and its agents. The pro forma assumptions are as follows:
| • | 59.6% of the total shares will be sold to the depositors and public, |
| • | the stock will be issued at $10.00 per share, |
| • | the conversion expenses will be $2.2 million at the midpoint, |
| • | there will be an ESOP equal to 6% of the shares issued funded internally, amortized over 15 years straight-line, |
| • | there will be an MRP equal to 3% of the shares issued, amortized over 5 years straight-line, |
| • | there will be a Stock Option Plan equal to 10% of the shares issued, expensed at $2.73 per option over 5 years straight-line, |
| • | the tax rate is assumed at 34.00% and, |
| • | the net proceeds will be invested at the three-year Treasury Note rate of 1.60%, pre-tax. |
Simultaneous with the completion of the offering, Naugatuck Valley Financial will acquire Southern Connecticut Bancorp, Inc. (the “Target”). In connection with the merger, Naugatuck Valley Financial will issue to the Target an aggregate of approximately 977,264 shares of common stock and pay approximately $9.8 million in cash.
| Conversion Valuation Appraisal Report | Page: 2 | |
It is our understanding that the Bank will offer its stock in a subscription and community offering to Eligible Account Holders, to the Employee Plans, and to Supplemental Eligible Account Holders of the Bank. This appraisal has been prepared in accordance with Regulation 563b.7 and the “Guidelines for Appraisal Reports for the Valuation of Savings and Loan Associations Converting from Mutual to Stock Form of Organization” of the Office of Thrift Supervision (“OTS”) which have been adopted in practice by the Federal Deposit Insurance Corporation (“FDIC”), including the most recent revisions as of October 21, 1994, and applicable regulatory interpretations thereof.
In the course of preparing our report, we reviewed the Bank’s and the Target’s audited financials for the year ended December 31, 2009, and the Bank’s and Target’s unaudited financials for the three months ending March 31, 2010. We also reviewed the registration statement on Form S-1 as filed with the Securities and Exchange Commission (“SEC”). We have conducted due diligence analysis of the Bank and held due diligence related discussions with the Bank’s Management and Board, Stifel, Nicolaus & Company, Incorporated, (the Bank’s underwriter), Kilpatrick Stockton LLP (the Bank’s special counsel), and Ostrowski and Company (the Bank’s M&A advisor for this transaction). The valuation parameters set forth in the appraisal were predicated on these discussions but all conclusions related to the valuation were reached and made independent of such discussions.
Where appropriate, we considered information based upon other publicly available sources, which we believe to be reliable; however, we cannot guarantee the accuracy or completeness of such information. We visited the Bank’s primary market area and reviewed the market area’s economic condition. We also reviewed the competitive environment in which the Bank operates and its relative strengths and weaknesses. We compared the Bank’s performance with selected publicly traded thrift institutions. We reviewed conditions in the securities markets in general and in the market for savings institutions in particular. Our analysis included a review of the estimated effects of the Conversion of the Bank on the operations and expected financial performance as they related to the Bank’s estimated pro forma value.
In preparing our valuation, we relied upon and assumed the accuracy and completeness of financial and other information provided to us by the Bank and its independent accountants. We did not independently verify the financial statements and other information provided by the Bank and its independent accountants, nor did we independently value any of the Bank’s assets or liabilities. This estimated valuation considers the Bank only as a going concern and should not be considered as an indication of its liquidation value.
| Conversion Valuation Appraisal Report | Page: 3 | |
Our valuation is not intended, and must not be construed, to be a recommendation of any kind as the advisability of purchasing shares of Common Stock in the stock issuance. Moreover, because such valuation is necessarily based upon estimates and projections of a number of matters, all of which are subject to change from time to time, no assurance can be given that persons who purchase shares of Common Stock in the stock issuance will thereafter be able to sell such shares at prices related to the foregoing valuation of the pro forma market value thereof. FinPro is not a seller of securities within the meaning of any federal or state securities laws. Any report prepared by FinPro shall not be used as an offer or solicitation with respect to the purchase or sale of any securities.
The estimated valuation herein will be updated as appropriate. These updates will consider, among other factors, any developments or changes in the Bank’s financial condition, operating performance, management policies and procedures and current conditions in the securities market for thrift institution common stock. Should any such developments or changes, in our opinion, be material to the estimated pro forma market value of the Bank, appropriate adjustments to the estimated pro forma market value will be made. The reasons for any such adjustments will be explained at that time.
| Conversion Valuation Appraisal Report | Page: 4 | |
| 1. | Overview and Financial Analysis |
GENERAL OVERVIEW
As of March 31, 2010, the Bank had $564.2 million in total assets, $388.1 million in deposits, $480.8 million in net loans and $50.7 million in equity.
As of March 31, 2010, the Target had $135.7 million in total assets, $117.7 million in deposits, $113.2 million in net loans and $15.7 million in equity.
The following table sets forth information with respect to the Bank’s and the Target’s full-service banking offices. The data shown below is the most recently available public data with regard to branch deposits (June 30, 2009).
FIGURE 1 – CURRENT FACILITIES LIST
| City | State | County | Zip Code | Deposits as of June 30, | Growth (%) | |||||||||||||||||
Address | 2009 | 2008 | 2004 | 2008 - 2009 | 2004 - 2009 | |||||||||||||||||
Naugatuck Valley Financial Corporation (MHC) | ||||||||||||||||||||||
| 1. | 1009 New Haven Rd | Naugatuck | CT | New Haven | 06770-4716 | 42,853 | 40,800 | 34,899 | 5.03 | % | 22.79 | % | ||||||||||
| 2. | 333 Church St | Naugatuck | CT | New Haven | 06770-2806 | 134,454 | 133,739 | 118,436 | 0.53 | % | 13.52 | % | ||||||||||
| 3. | 127 S Main St | Beacon Falls | CT | New Haven | 06403-1447 | 25,391 | 25,185 | 16,684 | 0.82 | % | 52.19 | % | ||||||||||
| 4. | 504 Bridgeport Ave Unit 300 | Shelton | CT | Fairfield | 06484-4765 | 35,640 | 34,573 | 22,257 | 3.09 | % | 60.13 | % | ||||||||||
| 5. | 49 Pershing Dr | Derby | CT | New Haven | 06418-1406 | 25,973 | 23,723 | 10,146 | 9.48 | % | 155.99 | % | ||||||||||
| 6. | 249 West St | Seymour | CT | New Haven | 06483-2650 | 40,127 | 36,489 | NA | 9.97 | % | NA | |||||||||||
| 7. | 1699 Highland Ave | Cheshire | CT | New Haven | 06410-1271 | 22,139 | 14,986 | NA | 47.73 | % | NA | |||||||||||
| 8. | 1030 Hamilton Ave | Waterbury | CT | New Haven | 06706-2348 | 23,900 | 16,028 | NA | 49.11 | % | NA | |||||||||||
| 9. | 1570 Southford Rd | Southbury | CT | New Haven | 06488-2412 | 19,340 | 16,251 | NA | 19.01 | % | NA | |||||||||||
| 10. | 450 Heritage Rd Ste 3C | Southbury | CT | New Haven | 06488-3871 | 11,424 | 1,678 | NA | 580.81 | % | NA | |||||||||||
Total - Naugatuck Valley Financial Corporation (MHC) | 381,241 | 343,452 | 202,422 | |||||||||||||||||||
Bank of Southern Connecticut | ||||||||||||||||||||||
| 1. | 215 Church St | New Haven | CT | New Haven | 06510-1803 | 58,056 | 42,913 | 38,961 | 35.29 | % | 49.01 | % | ||||||||||
| 2. | 445 W Main St | Branford | CT | New Haven | 06405-3415 | 18,955 | 17,165 | 5,894 | 10.43 | % | 221.60 | % | ||||||||||
| 3. | 1475 Whalley Ave | New Haven | CT | New Haven | 06515-1155 | 20,611 | 13,544 | 8,092 | 52.18 | % | 154.71 | % | ||||||||||
| 4. | 24 Washington Ave | North Haven | CT | New Haven | 06473-2309 | 20,610 | 16,019 | NA | 28.66 | % | NA | |||||||||||
Total - Bank of Southern Connecticut | 118,232 | 89,641 | 52,947 | |||||||||||||||||||
Total - Combined Entity (14 Branches) | 499,473 | 433,093 | 255,369 | |||||||||||||||||||
Source: SNL Financial
| Conversion Valuation Appraisal Report | Page: 5 | |
HISTORYAND OVERVIEW
NAUGATUCK VALLEY FINANCIAL
Naugatuck Valley Financial was organized on September 30, 2004 under the laws of the United States to be a holding company for Naugatuck Valley Savings and Loan, a stock savings bank also organized under the laws of the United States in connection with Naugatuck Valley Savings and Loan’s conversion from the mutual to the mutual holding company form of organization. On September 30, 2004, Naugatuck Valley Financial completed its initial public offering in which it sold 3,269,881 shares, or 43.0%, of its common stock to the public, including 298,091 shares to the Naugatuck Valley Savings and Loan Employee Stock Ownership Plan. An additional 4,182,407 shares, or 55.0% of Naugatuck Valley Financial’s outstanding stock, were issued to Naugatuck Valley Mutual Holding Company, Naugatuck Valley Financial’s federally chartered mutual holding company. Additionally, Naugatuck Valley Financial contributed 152,087 shares, or 2.0% of its outstanding common stock, to the Naugatuck Valley Savings and Loan Charitable Foundation.
Naugatuck Valley Financial’s business activities consist of the ownership of Naugatuck Valley Savings and Loan’s capital stock and the management of the offering proceeds it retained. Naugatuck Valley Financial does not own or lease any property. Instead, it uses the premises, equipment and other property of Naugatuck Valley Savings and Loan. Accordingly, the information set forth in this prospectus, including the consolidated financial statements and related financial data, relates primarily to Naugatuck Valley Savings and Loan. As a federally chartered savings and loan holding company, Naugatuck Valley Financial is subject to the regulation of the Office of Thrift Supervision.
Naugatuck Valley Savings and Loan operates as a community-oriented financial institution offering traditional financial services to consumers and businesses in its market areas. Naugatuck Valley Savings and Loan attracts deposits from the general public and uses those funds to originate one- to four-family real estate, multi-family and commercial real estate, construction, commercial and consumer loans, which Naugatuck Valley Savings and Loan generally holds for investment. Naugatuck Valley Savings and Loan also maintains an investment portfolio. Naugatuck Valley Savings and Loan is regulated by the Office of Thrift Supervision and its deposits are insured up to applicable legal limits under the Deposit Insurance Fund administered by the Federal Deposit Insurance Corporation. Naugatuck Valley Savings and Loan is also a member of the Federal Home Loan Bank of Boston.
| Conversion Valuation Appraisal Report | Page: 6 | |
SOUTHERN CONNECTICUT BANCORP
Southern Connecticut Bancorp (“the Target”) is a bank holding company headquartered in New Haven, Connecticut that was incorporated on November 8, 2000. Southern Connecticut Bancorp’s strategic objective is to serve as a bank holding company for a community-based commercial bank and a mortgage broker serving primarily New Haven County (the “Greater New Haven Market”). Southern Connecticut Bancorp owns 100% of the capital stock of The Bank of Southern Connecticut, a Connecticut-chartered bank with its headquarters in New Haven, Connecticut, and 100% of the capital stock of SCB Capital Inc., operating under the name “Evergreen Financial Services” (“Evergreen”), which is licensed by the State of Connecticut Department of Banking to operate a mortgage brokerage business and also operates from Southern Connecticut Bancorp’s headquarters in New Haven, Connecticut. Southern Connecticut Bancorp and its subsidiaries focus on meeting the financial services needs of consumers and small to medium-sized businesses, professionals and professional corporations, and their owners and employees in the Greater New Haven Market.
The Bank of Southern Connecticut operates branches at four locations, including downtown New Haven, the Amity/Westville section of New Haven, Branford and North Haven. The Bank of Southern Connecticut’s branches have a consistent, attractive appearance. Each location has an open lobby, comfortable waiting area, offices for the branch manager and a loan officer, and a conference room. The design of the branches complements the business development strategy of The Bank of Southern Connecticut, affording an appropriate space to deliver personalized banking services in professional, confidential surroundings.
The Bank of Southern Connecticut focuses on serving the banking needs of small to medium-sized businesses, professionals and professional corporations, and their owners and employees in the Greater New Haven Market. The Bank of Southern Connecticut’s target commercial customer has between $1.0 and $30.0 million in revenues, 15 to 150 employees, and borrowing needs of up to $3.0 million. The primary focus on this commercial market makes The Bank of Southern Connecticut uniquely qualified to move deftly in responding to the needs of its clients. The Bank of Southern Connecticut has been successful in winning business by offering a combination of competitive pricing for its services, quick decision making processes and a high level of personalized, “high touch” customer service.
| Conversion Valuation Appraisal Report | Page: 7 | |
STRATEGIC DIRECTION
The Bank’s business strategy is to grow and improve profitability by:
| • | Maintaining capital at “well capitalized” levels; |
| • | Maintaining high levels of asset quality; |
| • | Maintaining a well diversified loan portfolio; |
| • | Improving the efficiency ratio; |
| • | Managing interest rate risk; |
| • | Expanding the franchise and footprint through acquisition opportunities and the opening of additional branch offices; |
| • | Developing secondary market capabilities; and |
| • | Maintaining multiple sources of liquidity. |
| Conversion Valuation Appraisal Report | Page: 8 | |
BALANCE SHEET TRENDS
The Bank’s balance sheet increased by $58.5 million between December 31, 2005 and December 31, 2006, by $48.7 million between December 31, 2006 and December 31, 2007, by $72.9 million from December 31, 2007 to December 31, 2008 and by $21.3 million between December 31, 2008 and December 31, 2009. For the three months ended March 31, 2010, the Bank’s balance sheet increased $7.2 million.
Equity was $50.7 million as of March 31, 2010 and the equity to assets ratio was 8.99% at March 31, 2010.
The Target’s balance sheet increased by $35.7 million between December 31, 2005 and December 31, 2006 and by $6.3 million between December 31, 2006 and December 31, 2007. From December 31, 2007 to December 31, 2008 the balance sheet decreased $15.6 million. From December 31, 2008 and December 31, 2009 the Target increased total assets $20.7 million. For the three months ended March 31, 2010, the Bank’s balance sheet increased $99 thousand.
Equity was $15.7 million as of March 31, 2010 and the equity to assets ratio was 11.54% at March 31, 2010.
| Conversion Valuation Appraisal Report | Page: 9 | |
FIGURE 2 - ASSETAND RETAINED EARNINGS CHART

Source: Offering Prospectus
| Conversion Valuation Appraisal Report | Page: 10 | |
The following tables set forth certain information concerning the financial position of the Bank and the Target at the dates indicated.
FIGURE 3 - KEY BALANCE SHEET DATA
Naugatuck Valley Financial
| At March 31, | At December 31, | |||||||||||||||||
Selected Financial Condition (in thousands) | 2010 | 2009 | 2008 | 2007 | 2006 | 2005 | ||||||||||||
Total assets | $ | 564,215 | $ | 556,955 | $ | 535,386 | $ | 462,527 | $ | 413,855 | $ | 355,346 | ||||||
Securities held-to-maturity | 1,373 | 1,451 | — | 1,190 | 2,531 | 5,002 | ||||||||||||
Securities available-for-sale | 40,432 | 37,623 | 63,844 | 65,264 | 67,736 | 58,047 | ||||||||||||
Loans receivable, net | 480,841 | 473,304 | 431,976 | 359,831 | 308,376 | 259,427 | ||||||||||||
Cash and cash equivalents | 9,263 | 12,146 | 8,247 | 8,370 | 7,942 | 8,951 | ||||||||||||
Deposits | 388,077 | 380,931 | 363,026 | 321,398 | 289,198 | 240,846 | ||||||||||||
Borrowed Funds | 120,933 | 118,984 | 119,148 | 85,107 | 68,488 | 57,059 | ||||||||||||
Total capital | 50,710 | 50,308 | 45,589 | 50,457 | 51,084 | 50,964 | ||||||||||||
Southern Connecticut Bancorp
| At March 31, | At December 31, | |||||||||||||||||
Selected Financial Condition (in thousands) | 2010 | 2009 | 2008 | 2007 | 2006 | 2005 | ||||||||||||
Total assets | $ | 135,709 | $ | 135,610 | $ | 114,917 | $ | 130,564 | $ | 124,263 | $ | 88,574 | ||||||
Securities held-to-maturity | — | — | — | — | — | — | ||||||||||||
Securities available-for-sale | 2,735 | 2,220 | 5,130 | 5,266 | 8,055 | 9,973 | ||||||||||||
Loans receivable, net | 113,217 | 109,865 | 89,241 | 85,995 | 75,306 | 55,882 | ||||||||||||
Cash and cash equivalents | 2,860 | 2,542 | 5,267 | 3,891 | 5,821 | 967 | ||||||||||||
Deposits | 117,687 | 117,556 | 93,970 | 107,422 | 101,274 | 65,280 | ||||||||||||
Borrowed Funds | 1,382 | 1,470 | 1,395 | 1,730 | 2,072 | 2,553 | ||||||||||||
Total capital | 15,664 | 15,633 | 18,541 | 20,084 | 20,332 | 20,297 | ||||||||||||
Source: Offering Prospectus
| Conversion Valuation Appraisal Report | Page: 11 | |
FIGURE 4 - KEY RATIOS
Naugatuck Valley Financial
| At March 31, | At December 31, | |||||||||||||||||
| 2010 | 2009 | 2008 | 2007 | 2006 | 2005 | |||||||||||||
Performance Ratios: | ||||||||||||||||||
Return on average assets | 0.22 | % | 0.37 | % | -0.06 | % | 0.33 | % | 0.38 | % | 0.62 | % | ||||||
Return on average equity | 2.45 | % | 4.10 | % | -0.64 | % | 2.77 | % | 2.79 | % | 3.66 | % | ||||||
Interest rate spread (1) | 3.38 | % | 3.00 | % | 2.88 | % | 2.76 | % | 3.07 | % | 3.68 | % | ||||||
Net interest margin (2) | 3.45 | % | 3.09 | % | 3.02 | % | 2.95 | % | 3.26 | % | 3.87 | % | ||||||
Noninterest expense to average assets | 2.75 | % | 2.68 | % | 2.66 | % | 2.86 | % | 3.03 | % | 3.27 | % | ||||||
Efficiency ratio (3) | 75.43 | % | 78.43 | % | 101.28 | % | 87.18 | % | 85.93 | % | 80.61 | % | ||||||
Average int-earning assets to average int-bearing liabilities | 103.54 | % | 103.77 | % | 104.46 | % | 105.65 | % | 107.18 | % | 111.20 | % | ||||||
Average equity to average assets | 9.16 | % | 8.97 | % | 9.71 | % | 11.80 | % | 13.65 | % | 16.87 | % | ||||||
Asset Quality Ratios: | ||||||||||||||||||
Allowance for loan losses as a percent of total loans | 0.99 | % | 0.84 | % | 0.66 | % | 0.60 | % | 0.67 | % | 0.72 | % | ||||||
Allowance for loan losses as a percent of nonperforming loans | ||||||||||||||||||
| 43.00 | % | 66.60 | % | 107.13 | % | 222.99 | % | 103.03 | % | 638.78 | % | |||||||
Net charge-offs to average outstanding loans during the period | 0.00 | % | 0.00 | % | -0.01 | % | 0.02 | % | 0.00 | % | 0.01 | % | ||||||
Nonperforming loans as a percent of total loans | 2.30 | % | 1.26 | % | 0.62 | % | 0.27 | % | 0.65 | % | 0.11 | % | ||||||
Nonperforming assets as a percent of total assets | 2.00 | % | 1.10 | % | 0.50 | % | 0.21 | % | 0.49 | % | 0.10 | % | ||||||
Capital Ratios: | ||||||||||||||||||
Total equity to total assets | 8.99 | % | 9.03 | % | 8.52 | % | 10.91 | % | 12.34 | % | 14.34 | % | ||||||
Tier 1 capital (to adjusted assets) (4) | 7.74 | % | 7.76 | % | 7.58 | % | 8.81 | % | 9.53 | % | 11.42 | % | ||||||
Tier 1 capital (to risk-weighted assets) (4) | 10.08 | % | 10.16 | % | 10.36 | % | 12.22 | % | 13.56 | % | 17.07 | % | ||||||
Total capital (to risk-weighted assets) (4) | 11.19 | % | 11.10 | % | 11.09 | % | 12.88 | % | 14.29 | % | 17.88 | % | ||||||
Other Data: | ||||||||||||||||||
Deposit accounts | 30,883 | 30,712 | 30,721 | 29,489 | 27,385 | 25,592 | ||||||||||||
Offices | 10 | 10 | 10 | 9 | 9 | 6 | ||||||||||||
Southern Connecticut Bancorp
| At March 31, | At December 31, | |||||||||||||||||
| 2010 | 2009 | 2008 | 2007 | 2006 | 2005 | |||||||||||||
Performance Ratios: | ||||||||||||||||||
Return on average assets | 0.05 | % | -2.24 | % | 0.12 | % | -0.45 | % | -0.12 | % | -0.33 | % | ||||||
Return on average equity | 0.46 | % | -17.50 | % | 0.68 | % | -2.80 | % | -0.58 | % | -1.38 | % | ||||||
Interest rate spread (1) | 3.42 | % | 2.68 | % | 3.31 | % | 3.51 | % | 3.81 | % | 4.04 | % | ||||||
Net interest margin (2) | 4.07 | % | 3.45 | % | 4.46 | % | 4.89 | % | 5.27 | % | 5.02 | % | ||||||
Noninterest expense to average assets | 4.42 | % | 4.46 | % | 5.28 | % | 5.28 | % | 5.57 | % | 5.53 | % | ||||||
Efficiency ratio (3) | 101.08 | % | 118.74 | % | 94.40 | % | 100.54 | % | 97.62 | % | 101.33 | % | ||||||
Average int-earning assets to average int-bearing | 143.93 | % | 144.11 | % | 155.03 | % | 148.32 | % | 160.56 | % | 168.28 | % | ||||||
Average equity to average assets | 11.59 | % | 12.79 | % | 17.05 | % | 15.99 | % | 20.46 | % | 23.66 | % | ||||||
Asset Quality Ratios: | ||||||||||||||||||
Allowance for loan losses as a percent of total loans | 2.36 | % | 2.46 | % | 1.31 | % | 1.43 | % | 1.39 | % | 1.37 | % | ||||||
Allowance for loan losses as a percent of nonperforming loans | 45.03 | % | 47.36 | % | 99.44 | % | 100.08 | % | 351.99 | % | 134.37 | % | ||||||
Net charge-offs to average outstanding loans during the | 0.00 | % | 0.42 | % | 0.36 | % | 0.41 | % | 0.05 | % | 0.35 | % | ||||||
Nonperforming loans as a percent of total loans | 5.24 | % | 5.19 | % | 1.40 | % | 1.43 | % | 0.39 | % | 1.02 | % | ||||||
Nonperforming assets as a percent of total assets | 4.49 | % | 4.31 | % | 1.10 | % | 0.96 | % | 0.24 | % | 0.65 | % | ||||||
Capital Ratios: | ||||||||||||||||||
Total equity to total assets | 11.54 | % | 11.56 | % | 16.13 | % | 15.38 | % | 16.36 | % | 22.92 | % | ||||||
Tier 1 capital (to adjusted assets) (4) | 11.53 | % | 11.24 | % | 15.64 | % | 15.08 | % | 17.56 | % | 24.17 | % | ||||||
Tier 1 capital (to risk-weighted assets) (4) | 12.31 | % | 11.99 | % | 17.13 | % | 18.80 | % | 21.80 | % | 29.17 | % | ||||||
Total capital (to risk-weighted assets) (4) | 13.57 | % | 13.25 | % | 18.46 | % | 19.97 | % | 22.96 | % | 30.30 | % | ||||||
Other Data: | ||||||||||||||||||
Deposit accounts | 3,294 | 3,727 | 3,647 | 3,657 | 3,181 | 2,063 | ||||||||||||
Offices | 4 | 4 | 4 | 5 | 5 | 4 | ||||||||||||
Source: Offering Prospectus
| Conversion Valuation Appraisal Report | Page: 12 | |
LOAN PORTFOLIO
The Bank’s loan portfolio has increased by $48.9 million from December 31, 2005 to December 31, 2006, by $51.5 million from December 31, 2006 to December 31, 2007, by $72.1 million from December 31, 2007 to December 31, 2008 and by $41.3 million from December 31, 2008 to December 31, 2009. The Bank increased net loans by $7.5 million from December 31, 2009 to March 31, 2010. As a percent of assets, the loan portfolio has increased from 73.01% to 85.22% between December 31, 2005 and March 31, 2010, respectively.
The Target’s loan portfolio has increased by $19.4 million from December 31, 2005 to December 31, 2006, by $10.7 million from December 31, 2006 to December 31, 2007, by $3.2 million from December 31, 2007 to December 31, 2008 and by $20.6 million from December 31, 2008 to December 31, 2009. The Target increased net loans by $3.4 million from December 31, 2009 to March 31, 2010. As a percent of assets, the loan portfolio has increased from 63.09% to 83.43% between December 31, 2005 and March 31, 2010, respectively.
| Conversion Valuation Appraisal Report | Page: 13 | |
FIGURE 5 - NET LOANS RECEIVABLE CHART

Source: Offering Prospectus
| Conversion Valuation Appraisal Report | Page: 14 | |
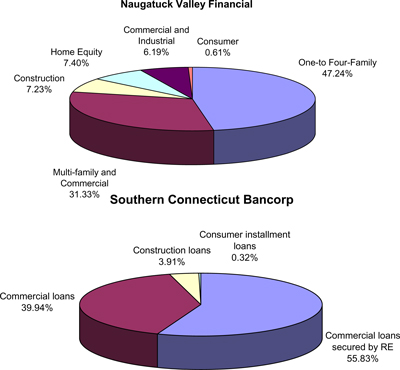
Since December 31, 2005, the Bank’s loan portfolio composition has shifted toward multi-family and commercial real estate and commercial loans and has shifted away from one-to-four-family residential real estate and home equity loans.
FIGURE 6 - LOAN MIXASOF MARCH 31, 2010
Naugatuck Valley Financial
| At March 31, | At December 31, | |||||||||||||||||||||||||||||||||||||||||
($000s) | 2010 | 2009 | 2008 | 2007 | 2006 | 2005 | ||||||||||||||||||||||||||||||||||||
| Amount | Percent | Amount | Percent | Amount | Percent | Amount | Percent | Amount | Percent | Amount | Percent | |||||||||||||||||||||||||||||||
Real estate loans: | ||||||||||||||||||||||||||||||||||||||||||
One-to four-family | $ | 230,913 | 47.24 | % | $ | 229,693 | 47.74 | % | $ | 216,201 | 49.51 | % | $ | 193,787 | 53.24 | % | $ | 179,374 | 57.27 | % | $ | 156,900 | 59.44 | % | ||||||||||||||||||
Multi-family and commercial | 153,159 | 31.33 | % | 134,931 | 28.05 | % | 106,028 | 24.28 | % | 70,051 | 19.25 | % | 45,879 | 14.65 | % | 33,608 | 12.73 | % | ||||||||||||||||||||||||
Construction | 35,318 | 7.23 | % | 46,298 | 9.62 | % | 50,596 | 11.59 | % | 41,041 | 11.27 | % | 30,124 | 9.62 | % | 24,943 | 9.45 | % | ||||||||||||||||||||||||
Total real estate loans | 419,390 | 85.80 | % | 410,922 | 85.41 | % | 372,825 | 85.38 | % | 304,879 | 83.76 | % | 255,377 | 81.54 | % | 215,451 | 81.62 | % | ||||||||||||||||||||||||
Consumer loans: | ||||||||||||||||||||||||||||||||||||||||||
Savings accounts | 2,585 | 0.53 | % | 1,113 | 0.23 | % | 1,093 | 0.25 | % | 1,272 | 0.35 | % | 634 | 0.20 | % | 785 | 0.30 | % | ||||||||||||||||||||||||
Personal | 207 | 0.04 | % | 256 | 0.05 | % | 262 | 0.06 | % | 302 | 0.08 | % | 275 | 0.09 | % | 212 | 0.08 | % | ||||||||||||||||||||||||
Automobile | 203 | 0.04 | % | 230 | 0.05 | % | 271 | 0.06 | % | 327 | 0.09 | % | 186 | 0.06 | % | 160 | 0.06 | % | ||||||||||||||||||||||||
Home equity | 36,161 | 7.40 | % | 37,276 | 7.75 | % | 39,655 | 9.08 | % | 40,517 | 11.13 | % | 43,220 | 13.80 | % | 37,628 | 14.25 | % | ||||||||||||||||||||||||
Total consumer loans | 39,156 | 8.01 | % | 38,875 | 8.08 | % | 41,281 | 9.45 | % | 42,418 | 11.65 | % | 44,315 | 14.15 | % | 38,785 | 14.69 | % | ||||||||||||||||||||||||
Commercial and industrial | 30,278 | 6.19 | % | 31,325 | 6.51 | % | 22,567 | 5.17 | % | 16,690 | 4.59 | % | 13,508 | 4.31 | % | 9,728 | 3.69 | % | ||||||||||||||||||||||||
Total loans | 488,824 | 100 | % | 481,122 | 100 | % | 436,673 | 100 | % | 363,987 | 100 | % | 313,200 | 100 | % | 263,964 | 100 | % | ||||||||||||||||||||||||
Less: | ||||||||||||||||||||||||||||||||||||||||||
Deferred loan origination costs (fees), net | (501 | ) | (486 | ) | (529 | ) | (461 | ) | (410 | ) | (401 | ) | ||||||||||||||||||||||||||||||
Allowance for loan losses | (4,795 | ) | (3,996 | ) | (2,869 | ) | (2,163 | ) | (2,071 | ) | (1,878 | ) | ||||||||||||||||||||||||||||||
Undisbursed construction loans | (2,687 | ) | (3,336 | ) | (1,299 | ) | (1,532 | ) | (2,343 | ) | (2,258 | ) | ||||||||||||||||||||||||||||||
Net loans | $ | 480,841 | $ | 473,304 | $ | 431,976 | $ | 359,831 | $ | 308,376 | $ | 259,427 | ||||||||||||||||||||||||||||||
Southern Connecticut Bancorp
($000s) | At March 31, 2010 | At December 31, 2009 | ||||||||||
| Amount | Percent | Amount | Percent | |||||||||
Commercial loans secured by RE | $ | 64,811 | 55.83 | % | $ | 63,837 | 56.60 | % | ||||
Commercial loans | 46,363 | 39.94 | % | 43,893 | 38.92 | % | ||||||
Construction loans | 4,543 | 3.91 | % | 4,608 | 4.09 | % | ||||||
Consumer installment loans | 367 | 0.32 | % | 449 | 0.40 | % | ||||||
Total Loans | $ | 116,084 | 100.00 | % | $ | 112,786 | 100.00 | % | ||||
Source: Offering Prospectus
| Conversion Valuation Appraisal Report | Page: 15 | |
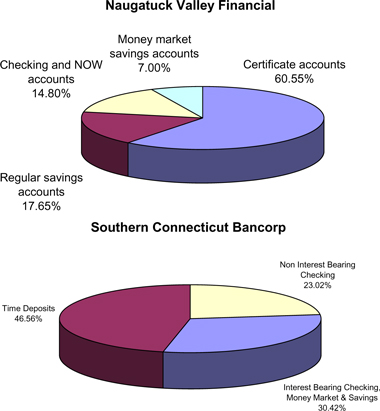
The two large components in the Bank’s loan portfolio are 1-4 family residential loans, which account for 47.24% of the portfolio mix at March 31, 2010, and multi-family and commercial real estate loans, which account for 31.33% of the portfolio mix at March 31, 2010.
The Target’s loan portfolio was heavily weighted in loans secured by commercial real estate as well as a moderate concentration in commercial and industrial loans at March 31, 2010.
FIGURE 7 - LOAN MIXAT MARCH 31, 2010
Source: Offering Prospectus
| Conversion Valuation Appraisal Report | Page: 16 | |
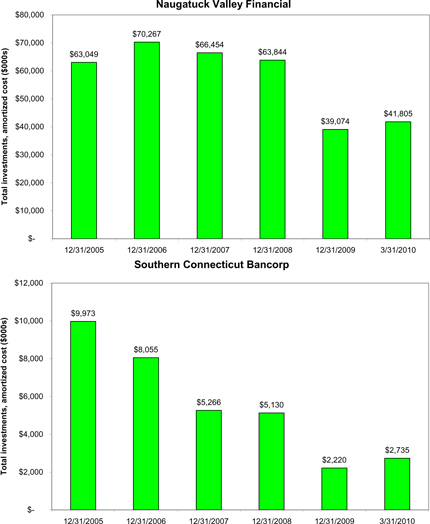
INVESTMENTS
The Bank’s investment portfolio decreased $21.2 million between December 31, 2005 and March 31, 2010. The Target’s investment portfolio decreased $7.2 million between December 31, 2005 and March 31, 2010.
| Conversion Valuation Appraisal Report | Page: 17 | |
FIGURE 8 - SECURITIES CHART
Source: Offering Prospectus
| Conversion Valuation Appraisal Report | Page: 18 | |
INVESTMENTSAND MORTGAGE-BACKED SECURITIES
The following table sets forth the amortized cost and fair values of the Bank’s securities portfolio at the dates indicated. All of the securities were classified as available-for-sale at the dates indicated. The portfolio is predominately agency sponsored MBS.
FIGURE 9 - INVESTMENT MIX
Naugatuck Valley Financial
| At March 31, 2010 | At December 31, | |||||||||||||||||||||||
| 2009 | 2008 | 2007 | ||||||||||||||||||||||
(in thousands) | Amortized Cost | Fair Value | Amortized Cost | Fair Value | Amortized Cost | Fair Value | Amortized Cost | Fair Value | ||||||||||||||||
Available-for-sale Securities | ||||||||||||||||||||||||
U.S. Government and agency obligations | $ | 1,527 | $ | 1,587 | $ | 1,529 | $ | 1,583 | $ | 1,537 | $ | 1,604 | $ | 2,749 | $ | 2,744 | ||||||||
Mortgage-backed securities | 26,176 | 27,216 | 23,561 | 24,500 | 42,297 | 43,030 | 31,352 | 31,261 | ||||||||||||||||
Collateralized mortgage obligations | 3,125 | 3,028 | 3,091 | 3,000 | 3,339 | 3,183 | 3,547 | 3,494 | ||||||||||||||||
Municipal obligations | — | — | — | — | 8,888 | 8,993 | 14,092 | 14,075 | ||||||||||||||||
Money market preferred obligations | 8,200 | 7,868 | 8,200 | 7,880 | 9,273 | 6,744 | 12,700 | 12,700 | ||||||||||||||||
Corporate obligations | 1,000 | 733 | 1,000 | 660 | 1,000 | 290 | 1,000 | 990 | ||||||||||||||||
Held-to-maturity securities: | ||||||||||||||||||||||||
U.S. Government and agency obligations | 1,373 | 1,398 | 1,451 | 1,475 | — | — | 1,000 | 998 | ||||||||||||||||
Interest-bearing balances | — | — | — | — | — | — | 190 | 190 | ||||||||||||||||
Total | $ | 41,401 | $ | 41,830 | $ | 38,832 | $ | 39,098 | $ | 66,334 | $ | 63,844 | $ | 66,630 | $ | 66,452 | ||||||||
Southern Connecticut Bancorp
| At March 31, 2010 | |||
($000s) | Amortized Cost | ||
U.S. Government sponsored agency obligations | $ | 956 | |
U.S. Treasury bills | 1,700 | ||
Mortgage-backed securities | 80 | ||
Total | $ | 2,735 | |
Source: Offering Prospectus
| Conversion Valuation Appraisal Report | Page: 19 | |
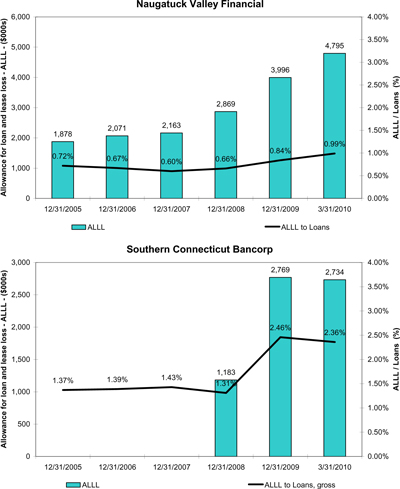
ASSET QUALITY
The Bank’s nonperforming assets increased to $11.3 million at March 31, 2010 from $341 thousand at December 31, 2005. The Bank’s nonperforming asset to total assets ratio increased from 0.10% at December 31, 2005 to 2.00% at March 31, 2009.
The Target’s nonperforming asset to total assets ratio increased from 0.65% at December 31, 2005 to 4.47% at March 31, 2009.
| Conversion Valuation Appraisal Report | Page: 20 | |
FIGURE 10 - ASSET QUALITY CHART
Naugatuck Valley Financial

Source: Offering Prospectus
| Conversion Valuation Appraisal Report | Page: 21 | |
At March 31, 2010, the Bank’s nonperforming loans to total loan ratio was 2.30% and the nonperforming assets to total assets ratio was 2.00%. The largest increases in the portfolio were multi-family and commercial real estate. Nonperforming one-to-four-family real estate loans increased by $422 thousand from December 31, 2009 to March 31, 2010. Nonperforming multi-family and commercial real estate increased by $3.7 million from December 31, 2009 to March 31, 2010. Nonperforming construction loans increased $25 thousand from December 31, 2009 to March 31 2010.
FIGURE 11 - NONPERFORMING LOANS
Naugatuck Valley Financial
| March 31, 2010 | At December 31, | |||||||||||||||||||||||
($000s) | 2009 | 2008 | 2007 | 2006 | 2005 | |||||||||||||||||||
Nonaccrual loans: | ||||||||||||||||||||||||
One- to four-family | $ | 2,248 | $ | 1,826 | $ | 1,100 | $ | 422 | $ | 423 | $ | 165 | ||||||||||||
Construction | 4,331 | 1,250 | 370 | — | 1,036 | — | ||||||||||||||||||
Multi-family and commercial real estate | 2,734 | 2,114 | 1,001 | 356 | 352 | 120 | ||||||||||||||||||
Commercial business | 477 | 452 | 142 | 144 | 142 | 9 | ||||||||||||||||||
Consumer | 170 | 358 | 65 | 48 | 57 | — | ||||||||||||||||||
Total non performing loans | 9,960 | 6,000 | 2,678 | 970 | 2,010 | 294 | ||||||||||||||||||
Troubled debt restructurings | 1,190 | — | — | — | — | — | ||||||||||||||||||
Foreclosed real estate | 120 | 140 | — | — | — | 47 | ||||||||||||||||||
Total nonperforming assets | $ | 11,270 | $ | 6,140 | $ | 2,678 | $ | 970 | $ | 2,010 | $ | 341 | ||||||||||||
Total nonperforming loans to total loans | 2.30 | % | 1.26 | % | 0.62 | % | 0.27 | % | 0.65 | % | 0.11 | % | ||||||||||||
Total nonperforming loans to total assets | 1.98 | % | 1.08 | % | 0.50 | % | 0.21 | % | 0.49 | % | 0.08 | % | ||||||||||||
Total nonperforming assets to total assets | 2.00 | % | 1.10 | % | 0.50 | % | 0.21 | % | 0.49 | % | 0.10 | % | ||||||||||||
Southern Connecticut Bancorp
| March 31, 2010 | At December 31, | ||||||||
($000s) | 2009 | 2008 | |||||||
Non-accrual loans | $ | 5,713 | $ | 5,363 | $ | 882 | |||
Accruing loans contractually past due 90 days or more | |||||||||
Loans past due 90 days or more and still accruing | 211 | 484 | 196 | ||||||
Matured loans pending renewal and still accruing | 146 | — | 189 | ||||||
Total | $ | 358 | $ | 484 | $ | 384 | |||
Source: Offering Prospectus
| Conversion Valuation Appraisal Report | Page: 22 | |
FIGURE 12 - ALLOWANCEFOR POSSIBLE LOANAND LEASE LOSSES CHART
Source: Offering Prospectus
| Conversion Valuation Appraisal Report | Page: 23 | |
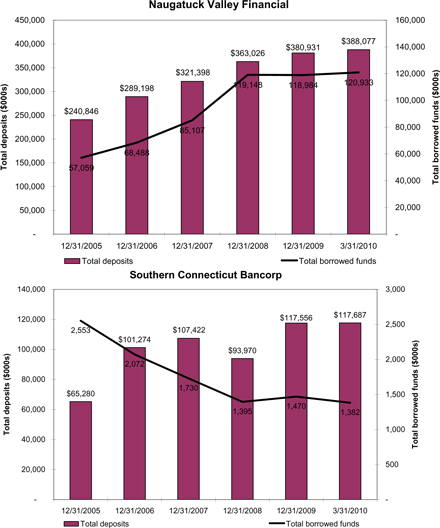
FUNDING COMPOSITION
The Bank experienced deposit growth of $147.2 million between December 31, 2005 and March 31, 2010 as deposits increased from $240.8 million to $388.1 million. Borrowings trended upward between December 31, 2005 and March 31, 2010 as well, due to the Bank implementing leverage strategies. As of March 31, 2009, the Bank had outstanding borrowings of $120.3 million.
The Target’s deposits fluctuated from December 31, 2005 through March 31, 2010, increasing a total of $52.3 over the time period from $65.3 to a total of $117.7. Borrowing levels trended downward, decreasing $1.2 million from $2.6 million to $1.4 million.
| Conversion Valuation Appraisal Report | Page: 24 | |
FIGURE 13 - DEPOSITAND BORROWING TREND CHART
Source: Offering Prospectus
| Conversion Valuation Appraisal Report | Page: 25 | |
The following chart illustrates the Bank’s deposit mix as of March 31, 2010. The two largest components of the deposit mix are certificates of deposit and savings accounts.
FIGURE 14 - DEPOSIT MIX
Source: Offering Prospectus
| Conversion Valuation Appraisal Report | Page: 26 | |
ASSET/LIABILITY MANAGEMENT
The following table, which is based on information that the Bank provided to the Office of Thrift Supervision, presents the change in the net portfolio value of the Bank at March 31, 2010 (the latest date for which the information is available) that would occur in the event of an immediate change in interest rates based on Office of Thrift Supervision assumptions, with no effect given to any steps that the Bank might take to counteract that change. The Bank’s interest rate risk position is considered to be “Minimum Risk” according to TB-13a.
FIGURE 15 - INTEREST RATE RISK
Naugatuck Valley Financial
| Net Portfolio Value | Portfolio Value of Assets | ||||||||||||||
Basis point (“bp”) Change in rates | Amount | Change | % Change | NPV Ratio | Change (bp) | ||||||||||
| ($000s) | |||||||||||||||
300 | $ | 36,150 | (22,289 | ) | -38.14 | % | 6.58 | % | (338 | ) | |||||
200 | 44,660 | (13,779 | ) | -23.58 | % | 7.93 | % | (203 | ) | ||||||
100 | 52,573 | (5,866 | ) | -10.04 | % | 9.13 | % | (83 | ) | ||||||
50 | 55,902 | (2,537 | ) | -4.34 | % | 9.61 | % | (35 | ) | ||||||
0 | 58,439 | — | 0.00 | % | 9.96 | % | — | ||||||||
-50 | 59,677 | 1,238 | 2.12 | % | 10.10 | % | 14 | ||||||||
-100 | 59,827 | 1,388 | 2.38 | % | 10.08 | % | 12 | ||||||||
Source: Offering Prospectus
| Conversion Valuation Appraisal Report | Page: 27 | |
NET WORTHAND CAPITAL
At March 31, 2010 the Bank and the Target had capital in excess of the minimum requirements for all capital ratios.
FIGURE 16 - CAPITALANALYSIS
Naugatuck Valley Financial
| Naugatuck Valley Financial Corporation (MHC) | Naugatuck Valley Savings & Loan (MHC) | ||||||||||
March 31, 2010 | Actual | Capital Adequacy Target Ratio | Actual | Capital Adequacy Target Ratio | |||||||
Total Capital to Risk Weighted Assets | NA | 8.00 | % | 11.19 | % | 8.00 | % | ||||
Tier 1 Capital to Risk Weighted Assets | NA | 4.00 | % | 10.08 | % | 4.00 | % | ||||
Tier 1 (leverage) Capital Ratio to Average Assets | NA | 4.00 | % | 7.74 | % | 4.00 | % | ||||
Southern Connecticut Bancorp
| Southern Connecticut Bancorp | The Bank of Southern Connecticut | |||||||||||
March 31, 2010 | Actual | Capital Adequacy Target Ratio | Actual | Capital Adequacy Target Ratio | ||||||||
Total Capital to Risk Weighted Assets | 13.57 | % | 8.00 | % | 12.73 | % | 8.00 | % | ||||
Tier 1 Capital to Risk Weighted Assets | 12.31 | % | 4.00 | % | 11.47 | % | 4.00 | % | ||||
Tier 1 (leverage) Capital Ratio to Average Assets | 11.53 | % | 4.00 | % | 10.75 | % | 4.00 | % | ||||
Source: Offering Prospectus
| Conversion Valuation Appraisal Report | Page: 28 | |
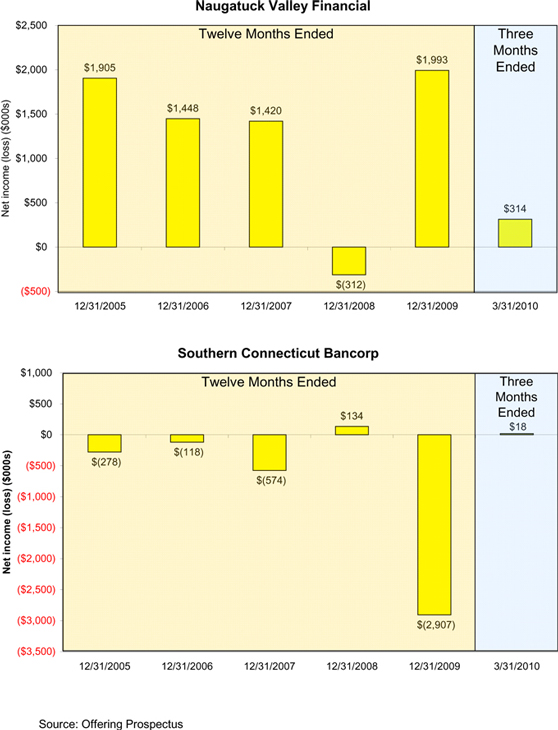
PROFITABILITY TRENDS
Net income trended downward between the twelve months ended December 31, 2005 and the twelve months ended December 31, 2008. For the twelve months ended December 31, 2009, the Bank achieved $2.0 million in net income, which represents an increase over the twelve months ended December 31, 2005. In the first three months of 2010, the Bank achieved $314 thousand in net income.
The Target’s net income has been historically negative and it achieved modest profitability only once from December 31, 2005 to December 2009. In the first three months of 2010, the Target achieved $18 thousand of net income.
| Conversion Valuation Appraisal Report | Page: 29 | |
FIGURE 17 - NET INCOME CHART
| Conversion Valuation Appraisal Report | Page: 30 | |
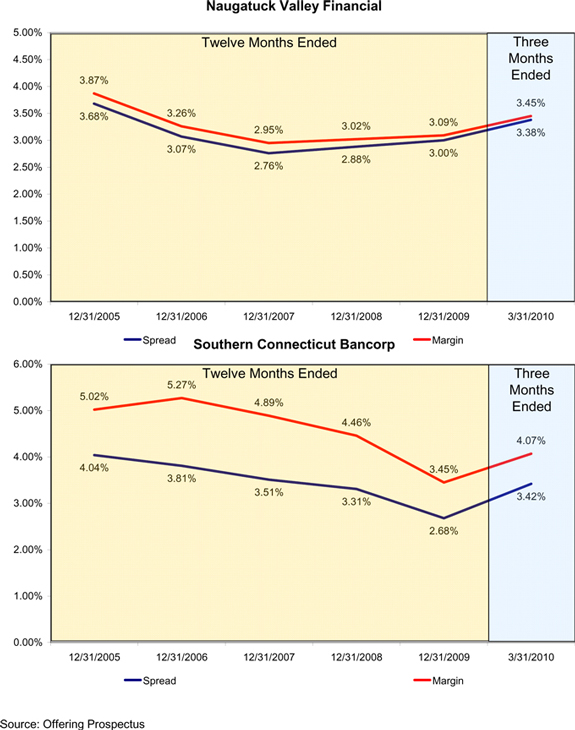
The net interest spread and margin increased between the three months ended March 31, 2009 and the three months ended March 31, 2010. The increase was primarily attributable to the cost of funds decreasing at a faster rate compared to the yield on earning assets.
FIGURE 18 - AVERAGE YIELDSAND COSTS
Naugatuck Valley Financial
| Three Months Ended March 31, | ||||||||||||||||||
| 2010 | 2009 | |||||||||||||||||
| Dollars in thousands | Average Balance | Interest and Dividends | Yield/ Cost | Average Balance | Interest and Dividends | Yield/ Cost | ||||||||||||
Interest-earning assets: | ||||||||||||||||||
Loans | $ | 475,011 | $ | 6,684 | 5.63 | % | $ | 434,724 | $ | 6,378 | 5.87 | % | ||||||
Fed Funds sold | 4,128 | 1 | 0.10 | % | 11,444 | 3 | 0.10 | % | ||||||||||
Investment securities | 39,873 | 458 | 4.59 | % | 59,580 | 707 | 4.75 | % | ||||||||||
Federal Home Loan Bank stock | 6,252 | — | 0.00 | % | 6,252 | — | 0.00 | % | ||||||||||
Total interest-earning assets | 525,264 | 7,143 | 5.44 | % | 512,000 | 7,088 | 5.54 | % | ||||||||||
Noninterest-earning assets | 35,369 | 30,706 | ||||||||||||||||
Total assets | $ | 560,633 | $ | 542,706 | ||||||||||||||
Interest-bearing liabilities: | ||||||||||||||||||
Certificate accounts | $ | 233,657 | $ | 1,658 | 2.84 | % | 240,824 | $ | 2,096 | 3.48 | % | |||||||
Regular savings accounts and escrow | 68,421 | 85 | 0.50 | % | 53,515 | 96 | 0.72 | % | ||||||||||
Checking and NOW accounts | 56,269 | 11 | 0.08 | % | 57,643 | 12 | 0.08 | % | ||||||||||
Money market savings accounts | 25,881 | 57 | 0.88 | % | 25,137 | 96 | 1.53 | % | ||||||||||
Total interest-bearing deposits | 384,228 | 1,811 | 1.89 | % | 377,119 | 2,300 | 2.44 | % | ||||||||||
FHLB advances | 109,895 | 772 | 2.81 | % | 115,332 | 1,105 | 3.83 | % | ||||||||||
Other borrowings | 13,170 | 32 | 0.97 | % | 1,784 | 10 | 2.24 | % | ||||||||||
Total interest-bearing liabilities | 507,293 | 2,615 | 2.06 | % | 494,235 | 3,415 | 2.76 | % | ||||||||||
Noninterest-bearing liabilities | 1,999 | 1,898 | ||||||||||||||||
Total liabilities | 509,292 | 496,133 | ||||||||||||||||
Stockholders’ equity | 51,341 | 46,573 | ||||||||||||||||
Total liabilities and stockholders’ equity | $ | 560,633 | $ | 542,706 | ||||||||||||||
Net interest income | $ | 4,528 | $ | 3,673 | ||||||||||||||
Interest rate spread | 3.38 | % | 2.77 | % | ||||||||||||||
Net interest margin | 3.45 | % | 2.87 | % | ||||||||||||||
Average interest-earning assets to average interest-bearing liabilities | 103.54 | % | 103.59 | % | ||||||||||||||
Source: Offering Prospectus
| Conversion Valuation Appraisal Report | Page: 31 | |
Southern Connecticut Bancorp
| Three Months Ended March 31, | ||||||||||||||||||||
| 2010 | 2009 | |||||||||||||||||||
| Dollars in thousands | Average Balance | Interest and Dividends | Yield/ Cost | Average Balance | Interest and Dividends | Yield/ Cost | ||||||||||||||
Interest-earning assets: | ||||||||||||||||||||
Loans (1)(2) | $ | 115,179 | $ | 1,741 | 6.13 | % | $ | 89,799 | $ | 1,458 | 6.58 | % | ||||||||
Short-term and other investments | 11,659 | 23 | 0.80 | % | 11,433 | 48 | 1.70 | % | ||||||||||||
Investments | 2,718 | 7 | 1.04 | % | 5,151 | 59 | 4.65 | % | ||||||||||||
Federal funds sold | — | — | 0.00 | % | ||||||||||||||||
Total interest-earning assets | 129,556 | 1,771 | 5.54 | % | 106,383 | 1,565 | 5.97 | % | ||||||||||||
Cash and due from banks | 3,811 | 4,149 | ||||||||||||||||||
Premises and equipment, net | 2,460 | 2,727 | ||||||||||||||||||
Allowance for loan losses | (2,774 | ) | (1,232 | ) | ||||||||||||||||
Other | 2,768 | 2,237 | ||||||||||||||||||
Total Non interest-earning assets | 6,265 | 7,881 | ||||||||||||||||||
Total assets | $ | 135,821 | $ | 114,264 | ||||||||||||||||
Interest-bearing liabilities: | ||||||||||||||||||||
Time certificates | $ | 51,586 | $ | 331 | 2.60 | % | $ | 35,690 | $ | 300 | 3.41 | % | ||||||||
Savings deposits | 2,377 | 4 | 0.68 | % | 1,478 | 5 | 1.37 | % | ||||||||||||
Money market/checking deposits | 33,534 | 90 | 1.09 | % | 32,054 | 144 | 1.82 | % | ||||||||||||
Capital lease obligations | 1,175 | 44 | 15.19 | % | 1,180 | 44 | 15.12 | % | ||||||||||||
Repurchase agreements | 1,343 | 2 | 0.60 | % | 450 | 1 | 0.90 | % | ||||||||||||
Total interest bearing liabilities | 90,015 | 471 | 2.12 | % | 70,852 | 494 | 2.83 | % | ||||||||||||
Non-interest bearing deposits | 29,115 | 23,942 | ||||||||||||||||||
Accrued expenses and other liabilities | 945 | 1,016 | ||||||||||||||||||
Total Noninterest-bearing liabilities | 30,060 | 24,958 | ||||||||||||||||||
Total liabilities | 120,075 | 95,810 | ||||||||||||||||||
Stockholders’ equity | 15,746 | 18,454 | ||||||||||||||||||
Total liabilities and stockholders’ equity | $ | 135,821 | $ | 114,264 | ||||||||||||||||
Net interest income | $ | 1,300 | $ | 1,071 | ||||||||||||||||
Interest rate spread | 3.42 | % | 3.14 | % | ||||||||||||||||
Net interest margin | 4.07 | % | 4.08 | % | ||||||||||||||||
Average interest-earning assets to average interest-bearing liabilities | 143.93 | % | 150.15 | % | ||||||||||||||||
Source: Offering Prospectus
| Conversion Valuation Appraisal Report | Page: 32 | |
The Banks’ spread and margin trended downward between December 31, 2005 and December 31, 2007, however from December 31, 2008 through March 31, 2010, the Bank’s spread and margin increased as rates decreased. The Target’s spread and margin decreased from December 31, 2005 to December 31, 2009 but increased in the first quarter of 2010.
| Conversion Valuation Appraisal Report | Page: 33 | |
FIGURE 19 - SPREADAND MARGIN CHART
| Conversion Valuation Appraisal Report | Page: 34 | |
FIGURE 20 - INCOME STATEMENT TRENDS
Naugatuck Valley Financial
| For the Twelve Months Ended March 31, | For the Twelve Months Ended December 31, | |||||||||||||||||||||
Selected Financial Condition ($000s) | 2010 | 2009 | 2009 | 2008 | 2007 | 2006 | 2005 | |||||||||||||||
Interest income | $ | 7,143 | $ | 7,088 | $ | 28,291 | $ | 28,203 | $ | 25,030 | $ | 20,750 | $ | 15,908 | ||||||||
Interest expense | 2,615 | 3,415 | 12,537 | 13,904 | 13,174 | 9,350 | 4,941 | |||||||||||||||
Net interest income | 4,528 | 3,673 | 15,754 | 14,299 | 11,856 | 11,400 | 10,967 | |||||||||||||||
Provision (credit) for loan losses | 809 | 285 | 1,144 | 675 | 151 | 192 | 32 | |||||||||||||||
Net interest income after provision (credit) for loan losses | 3,719 | 3,388 | 14,610 | 13,624 | 11,705 | 11,208 | 10,935 | |||||||||||||||
Noninterest income | 571 | 706 | 2,742 | (1,048 | ) | 2,354 | 1,948 | 1,517 | ||||||||||||||
Noninterest expense | 3,854 | 3,598 | 14,541 | 13,454 | 12,422 | 11,504 | 10,097 | |||||||||||||||
(Loss) income before income tax (benefit) expense | 436 | 496 | 2,811 | (878 | ) | 1,637 | 1,652 | 2,355 | ||||||||||||||
Income tax (benefit) expense | 122 | 127 | 818 | (566 | ) | 217 | 204 | 450 | ||||||||||||||
Net (loss) income (1) | $ | 314 | $ | 369 | $ | 1,993 | $ | (312 | ) | $ | 1,420 | $ | 1,448 | $ | 1,905 | |||||||
Southern Connecticut Bancorp
| For the Twelve Months Ended March 31, | For the Twelve Months Ended December 31, | ||||||||||||||||||||||||||
Selected Financial Condition ($000s) | 2010 | 2009 | 2009 | 2008 | 2007 | 2006 | 2005 | ||||||||||||||||||||
Interest income | $ | 1,771 | $ | 1,565 | $ | 6,426 | $ | 7,000 | $ | 9,143 | $ | 7,080 | $ | 5,179 | |||||||||||||
Interest expense | 471 | 494 | 2,172 | 2,240 | 3,378 | 2,223 | 1,152 | ||||||||||||||||||||
Net interest income | 1,300 | 1,071 | 4,254 | 4,760 | 5,765 | 4,857 | 4,027 | ||||||||||||||||||||
Provision (credit) for loan losses | (34 | ) | 2,146 | 1,992 | 226 | 538 | 253 | 216 | |||||||||||||||||||
Net interest income after provision (credit) for loan losses | 1,334 | (1,075 | ) | 2,262 | 4,534 | 5,227 | 4,604 | 3,811 | |||||||||||||||||||
Noninterest income | 184 | 163 | 629 | 1,667 | 960 | 804 | 630 | ||||||||||||||||||||
Noninterest expense | 1,500 | 1,396 | 5,798 | 6,067 | 6,761 | 5,526 | 4,719 | ||||||||||||||||||||
(Loss) income before income tax (benefit) expense | 18 | (2,308 | ) | (2,907 | ) | 134 | (574 | ) | (118 | ) | (278 | ) | |||||||||||||||
Income tax (benefit) expense | — | — | — | — | — | — | — | ||||||||||||||||||||
Net (loss) income (1) | $ | 18 | $ | (2,308 | ) | $ | (2,907 | ) | 134 | $ | (574 | ) | $ | (118 | ) | $ | (278 | ) | |||||||||
| �� | |||||||||||||||||||||||||||
Source: Offering Prospectus
| Conversion Valuation Appraisal Report | Page: 35 | |
LEGAL PROCEEDINGS
Periodically, there have been various claims and lawsuits against the Bank, such as claims to enforce liens, condemnation proceedings on properties in which the Bank hold security interests, claims involving the making and servicing of real property loans and other issues incident to the Bank’s business. The Bank is not a party to any pending legal proceedings that it believes would have a material adverse effect on its financial condition, results of operations or cash flows.
SUBSIDIARIES
Naugatuck Valley Savings and Loan is the wholly-owned subsidiary of Naugatuck Financial Corporation.
Bank of Southern Connecticut is the wholly-owned subsidiary of Southern Connecticut Bancorp.
| Conversion Valuation Appraisal Report | Page: 36 | |
| 2. | Market Area Analysis |
Connecticut Market Area:
The Bank is headquartered in Naugatuck, Connecticut, which is located in southwestern Connecticut approximately six miles south of Waterbury and 26 miles north of Bridgeport. In addition to its main office, it operates nine branch offices in the greater Naugatuck Valley market which is considered the Bank’s market area. The greater Naugatuck Valley market encompasses the communities in the central and lower Naugatuck Valley regions in New Haven County, where the main office and eight of its branch offices are located, and Fairfield County, where one of its branch offices is located. The economy in the market area is primarily oriented to the service, retail, construction, and manufacturing industries.
The Target serves the Greater New Haven Market, which is comprised of the communities located in and around New Haven County in Southern Central Connecticut. The Greater New Haven Market is located in the center of, and is a critical component of, the commercial activity of the northeast corridor in New England. The market focus resides in the busy transportation and commercial area between New York City to the south, Hartford to the north, Providence to the east, and Boston to the northeast. The diversified economic base of this market region includes pharmaceutical, advanced manufacturing, healthcare, defense, technology, service and energy companies. The region is also one of New England’s most popular tourist destinations, featuring popular shoreline and heritage sites. In addition, Southern Connecticut Bancorp’s headquarters is located in downtown New Haven, in the area of Yale University’s campus.
| Conversion Valuation Appraisal Report | Page: 37 | |
The following tables provide deposit and demographic data for the Bank’s market area.
FIGURE 21 - DEPOSITAND DEMOGRAPHIC DATAFOR NEW HAVEN, CT
| Demographic Summary: New Haven, CT | ||||||||||||
| Base 2000 | Current 2009 | Projected 2014 | % Change 2000 - 2009 | % Change 2009 - 2014 | ||||||||
Total Population (actual) | 824,008 | 848,827 | 857,643 | 3.01 | 1.04 | |||||||
0-14 Age Group (%) | 20.55 | 19.05 | 18.85 | (4.48 | ) | (0.03 | ) | |||||
15-34 Age Group (%) | 26.24 | 25.78 | 26.41 | 1.22 | 3.51 | |||||||
35-54 Age Group (%) | 30.02 | 28.84 | 26.20 | (1.05 | ) | (8.22 | ) | |||||
55-69 Age Group (%) | 12.11 | 15.65 | 17.64 | 33.10 | 13.86 | |||||||
70+ Age Group (%) | 11.08 | 10.68 | 10.91 | (0.73 | ) | 3.20 | ||||||
Median Age (actual) | 37.00 | 39.10 | 39.20 | 5.68 | 0.26 | |||||||
Total Households (actual) | 319,040 | 329,253 | 333,263 | 3.20 | 1.22 | |||||||
< $25K Households (%) | 25.33 | 18.98 | 17.24 | (22.67 | ) | (8.06 | ) | |||||
$25-49K Households (%) | 25.67 | 20.72 | 20.65 | (16.70 | ) | 0.90 | ||||||
$50-99K Households (%) | 33.22 | 38.37 | 40.70 | 19.20 | 7.35 | |||||||
$100K+ Households (%) | 15.78 | 21.93 | 21.41 | 43.40 | (1.19 | ) | ||||||
Average Household Income ($) | 62,220 | 77,965 | 80,512 | 25.31 | 3.27 | |||||||
Median Household Income ($) | 48,834 | 62,319 | 66,012 | 27.61 | 5.93 | |||||||
Per Capita Income ($) | 24,439 | 30,751 | 31,856 | 25.83 | 3.59 | |||||||
| Source: SNL Financial & ESRI | ||||||||||||
FIGURE 22 - DEPOSITAND DEMOGRAPHIC DATAFOR FAIRFIELD, CT
| Demographic Summary: Fairfield, CT | ||||||||||||
| Base 2000 | Current 2009 | Projected 2014 | % Change 2000 - 2009 | % Change 2009 - 2014 | ||||||||
Total Population (actual) | 882,567 | 908,106 | 914,371 | 2.89 | 0.69 | |||||||
0-14 Age Group (%) | 21.92 | 21.49 | 20.73 | 0.88 | (2.92 | ) | ||||||
15-34 Age Group (%) | 24.04 | 23.05 | 24.34 | (1.32 | ) | 6.33 | ||||||
35-54 Age Group (%) | 31.52 | 30.56 | 27.50 | (0.23 | ) | (9.40 | ) | |||||
55-69 Age Group (%) | 12.74 | 15.21 | 17.26 | 22.85 | 14.23 | |||||||
70+ Age Group (%) | 9.78 | 9.68 | 10.17 | 1.84 | 5.82 | |||||||
Median Age (actual) | 37.30 | 39.20 | 39.70 | 5.09 | 1.28 | |||||||
Total Households (actual) | 324,232 | 331,823 | 333,893 | 2.34 | 0.62 | |||||||
< $25K Households (%) | 17.98 | 12.88 | 11.70 | (26.70 | ) | (8.57 | ) | |||||
$25-49K Households (%) | 20.64 | 15.20 | 15.55 | (24.64 | ) | 2.92 | ||||||
$50-99K Households (%) | 30.35 | 28.31 | 26.37 | (4.53 | ) | (6.28 | ) | |||||
$100K+ Households (%) | 31.03 | 43.61 | 46.38 | 43.84 | 7.02 | |||||||
Average Household Income ($) | 103,255 | 128,398 | 136,054 | 24.35 | 5.96 | |||||||
Median Household Income ($) | 64,876 | 87,897 | 92,333 | 35.48 | 5.05 | |||||||
Per Capita Income ($) | 38,350 | 47,227 | 50,031 | 23.15 | 5.94 | |||||||
| Source: SNL Financial & ESRI | ||||||||||||
| Conversion Valuation Appraisal Report | Page: 38 | |
| 3. | Comparisons with Publicly Traded Thrifts |
INTRODUCTION
This section presents an analysis of the Bank’s operations against a selected group (“Comparable Group”) of publicly traded thrifts. The Comparable Group was selected based upon similarity of characteristics to the Bank. The Comparable Group multiples provide the basis for the valuation of the Bank.
Factors that influence the Bank’s value such as balance sheet structure and size, profitability, income and expense trends, capital levels, credit risk, and recent operating results can be measured against the Comparable Group. The Comparable Group’s current market pricing, coupled with the appropriate aggregate adjustment for differences between the Bank and the Comparable Group, will then be utilized as the basis for the pro forma valuation of the Bank’s to-be-issued common stock.
SELECTION CRITERIA
The goal of the selection criteria process is to find those institutions with characteristics that most closely match those of the Bank. In an ideal world, all of the Comparable Group would contain the exact characteristics of the Bank. However, none of the Comparables selected will be exact clones of the Bank.
As of the date of this appraisal, there are a total of 256 thrifts that trade on public exchanges or are private companies. There are 144 traded on the NYSE, NASDAQ or AMEX. FinPro limited the Comparable Group to institutions whose common stock is listed on a major exchange, (defined as the NYSE, NASDAQ or AMEX) since these companies tend to trade regularly. FinPro believes that thrifts that trade over-the-counter, as pink sheets, or private companies are inappropriate for the Comparable Group, due to irregular trading activity and wide bid/ask spreads, which may skew the trading value and make trading multiples less reliable as an indicator of value.
Institutions that were structured as Mutual Holding Companies (MHC’s) were eliminated. 38 institutions were eliminated due to the MHC structure, leaving 106 remaining institutions.
Institutions outside of the New England region were eliminated. 90 institutions were eliminated due to being outside the target region.
| Conversion Valuation Appraisal Report | Page: 39 | |
Of the 16 remaining institutions, 6 institutions were eliminated due to their size. An institution was eliminated if total assets were below $450 million or above $1.6 billion.
The remaining 10 institutions were deemed acceptable Comparables.
Using the criteria established, the Comparable Group was created. It is important to note that none of the Comparables will be identical clones of the Bank, and as such, subjective adjustments will have to be made. A variance to the Comparable median was established for each data field.
FIGURE 23 - COMPARABLE GROUP
Corporate | ||||||||||||
Ticker | Short Name | Exchange | City | State | Number of Offices | IPO Date | ||||||
| Comparable Thrift Data | ||||||||||||
CEBK | Central Bancorp, Inc. | NASDAQ | Somerville | MA | 11 | 10/24/1986 | ||||||
CBNK | Chicopee Bancorp, Inc. | NASDAQ | Chicopee | MA | 8 | 07/20/2006 | ||||||
HBNK | Hampden Bancorp, Inc. | NASDAQ | Springfield | MA | 9 | 01/17/2007 | ||||||
HIFS | Hingham Institution for Savings | NASDAQ | Hingham | MA | 10 | 12/20/1988 | ||||||
LEGC | Legacy Bancorp, Inc. | NASDAQ | Pittsfield | MA | 20 | 10/26/2005 | ||||||
LSBX | LSB Corporation | NASDAQ | North Andover | MA | 8 | 05/02/1986 | ||||||
NHTB | New Hampshire Thrift Bancshares, Inc. | NASDAQ | Newport | NH | 27 | 05/27/1986 | ||||||
NFSB | Newport Bancorp, Inc. | NASDAQ | Newport | RI | 6 | 07/07/2006 | ||||||
UBNK | United Financial Bancorp, Inc. | NASDAQ | West Springfield | MA | 24 | 12/04/2007 | ||||||
WFD | Westfield Financial, Inc. | NASDAQ | Westfield | MA | 11 | 01/04/2007 | ||||||
Average | ||||||||||||
Median | ||||||||||||
Maximum | ||||||||||||
Minimum | ||||||||||||
Pro-forma Results* | 14 | |||||||||||
Pro-forma Variance to the Comparable Median | ||||||||||||
NVSL | Naugatuck Valley Financial Corporation (MHC) | NASDAQ | Naugatuck | CT | 10 | 10/1/2004 | ||||||
SSE | Southern Connecticut Bancorp, Inc. | NYSE Amex | New Haven | CT | 4 | 7/6/2001 | ||||||
NVSL Variance to the Comparable Median | ||||||||||||
SSE Variance to the Comparable Median | ||||||||||||
* Does not include adjustments resulting from the Second Step Transaction
| Conversion Valuation Appraisal Report | Page: 40 | |
OVERVIEWOFTHE COMPARABLES
The members of the Comparable Group were reviewed against the Bank to ensure comparability based upon the following criteria:
| 1. | Asset size |
| 2. | Profitability |
| 3. | Capital Level |
| 4. | Balance Sheet Mix |
| 5. | Operating Strategy |
| 6. | Date of conversion |
1. Asset SizeIdeally, the Comparable Group should have a similar asset size to the Bank. The Comparable Group ranged in size from $456.6 million to $1.5 billion in total assets with a median of $872.6 million. The Bank’s pro forma asset size, prior to the capital raise, was $696.9 million as of March 31, 2010. At the pro forma midpoint of the offering range including the merger, the Bank is expected to have assets of $723.0 million.
2. ProfitabilityThe Comparable Group had a median core ROAA of 0.49% and a median core ROAE of 3.10% for the last twelve months. The pro forma Bank, prior to the capital raise, had a core ROAA of 0.23% and a core ROAE of 2.60% for the twelve months ended March 31, 2010. On a pro forma basis including the conversion, the Bank’s core ROAA and core ROAE are 0.20% and 1.67%, respectively.
3. Capital LevelThe Comparable Group had a median tangible equity to tangible assets ratio of 11.36% with a high of 20.47% and a low of 6.60%. At March 31, 2010, the pro forma Bank, prior to the capital raise, had a tangible equity to tangible assets ratio of 8.01%. At the midpoint of the conversion and including the merger, the Bank would have a pro forma tangible equity to tangible assets ratio of 11.35%.
4. Balance Sheet MixAt March 31, 2010, the pro forma Bank, prior to the capital raise, had a loan to asset ratio of 85.87%. The median loan to asset ratio for the Comparables was 72.48%, ranging from a low of 38.96% to a high of 85.08%. On the liability side, the pro forma Bank’s, prior to the capital raise, deposit to asset ratio was 72.72% at March 31, 2010 while the Comparable median was 67.15%, ranging from 55.12% to 74.88%. The pro forma Bank’s borrowing to asset ratio prior to the capital raise of 17.38% is slightly below the Comparable median of 20.36%.
5. Operating StrategyAn institution’s operating characteristics are important because they determine future performance. Operational strategy also affects expected rates of return and investors’ general perception of the quality, risk and attractiveness of a given company. Specific operating characteristics include profitability, balance sheet growth, asset quality, capitalization and non-financial factors such as management strategies and lines of business.
| Conversion Valuation Appraisal Report | Page: 41 | |
6. Date of ConversionRecent conversions, were excluded since the earnings of a newly converted institution do not reflect the reinvestment of conversion proceeds. Additionally, new issues tend to trade at a discount to the market averages.
The following table represents key financial indicators for the Bank and the Comparable Group.
| Conversion Valuation Appraisal Report | Page: 42 | |
FIGURE 24 - KEY FINANCIAL INDICATORS
| NVSL at or for the Twelve Months Ended 3/31/10 | SSE at or for the Twelve Months Ended 3/31/10 | Pro-forma* at or for the Twelve Months Ended 3/31/10 | Comparable Group Median Last Twelve Months | ||||||
Balance Sheet Data | |||||||||
Gross Loans to Deposits | 125.14 | 98.52 | 118.08 | 105.78 | |||||
Total Net Loans to Assets | 86.07 | 85.44 | 85.87 | 72.48 | |||||
Securities to Assets | 8.52 | 2.06 | 7.31 | 20.55 | |||||
Deposits to Assets | 68.78 | 86.72 | 72.72 | 67.15 | |||||
Borrowed Funds to Assets | 21.43 | 1.02 | 17.38 | 20.36 | |||||
Balance Sheet Growth | |||||||||
Asset Growth Rate | 3.96 | 19.71 | 6.25 | 3.74 | |||||
Loan Growth Rate | 9.59 | 28.91 | 12.82 | 2.86 | |||||
Deposit Growth Rate | 2.20 | 24.57 | 6.86 | 7.52 | |||||
Capital | |||||||||
Equity to Assets | 8.99 | 11.54 | 8.65 | 11.91 | |||||
Tangible Equity to Tangible Assets | 8.98 | 11.54 | 8.01 | 11.36 | |||||
Intangible Assets to Equity | 0.15 | — | 0.70 | — | |||||
Regulatory Core Capital to Assets | 7.74 | 10.75 | 6.61 | 12.51 | |||||
Equity + Reserves to Assets | 9.84 | 13.56 | 9.34 | 12.71 | |||||
Asset Quality | |||||||||
Non-Performing Loans to Loans | 2.30 | 4.93 | 2.21 | 1.48 | |||||
Reserves to Non-Performing Loans | 43.00 | 47.86 | 36.20 | 62.82 | |||||
Non-Performing Assets to Assets | 2.00 | 4.21 | 1.92 | 1.28 | |||||
Non-Performing Assets to Equity | 22.22 | 36.47 | 22.16 | 11.22 | |||||
Reserves to Loans | 0.99 | 2.36 | 0.80 | 1.13 | |||||
Reserves to Non-Performing Assets + 90 Days Del. | 42.55 | 45.03 | 34.94 | 60.13 | |||||
Profitability | |||||||||
Return on Average Assets | 0.35 | (0.43 | ) | 0.01 | 0.39 | ||||
Return on Average Equity | 3.94 | (3.66 | ) | 0.10 | 2.35 | ||||
Core Return on Average Assets | 0.36 | (0.43 | ) | 0.23 | 0.49 | ||||
Core Return on Average Equity | 4.02 | (3.66 | ) | 2.60 | 3.10 | ||||
Income Statement | |||||||||
Yield on Average Earning Assets | 5.52 | 5.04 | 5.41 | 5.10 | |||||
Cost of Average Interest Bearing Liabilities | 2.37 | 1.64 | 2.10 | 2.64 | |||||
Net Interest Spread | 3.15 | 2.65 | 2.95 | 2.52 | |||||
Net Interest Margin | 3.24 | 3.40 | 3.31 | 3.22 | |||||
Noninterest Income to Average Assets | 0.44 | 0.46 | 0.48 | 0.48 | |||||
Noninterest Expense to Average Assets | 2.66 | 4.38 | 3.37 | 2.70 | |||||
Efficiency Ratio | 76.16 | 110.99 | 84.55 | 73.69 | |||||
Overhead Ratio | 72.74 | 112.52 | 97.57 | 69.71 |
| * | Does not include adjustments resulting from the Second Step |
| Conversion Valuation Appraisal Report | Page: 43 | |
| NVSL at or for the Twelve Months Ended 3/31/10 | SSE at or for the Twelve Months Ended 3/31/10 | Pro-forma* at or for the Twelve Months Ended 3/31/10 | Comparable Group Median Last Twelve Months | ||||||
Balance Sheet Data | |||||||||
Gross Loans to Deposits | 125.14 | 98.52 | 118.08 | 105.78 | |||||
Total Net Loans to Assets | 86.07 | 85.44 | 85.87 | 72.48 | |||||
Securities to Assets | 8.52 | 2.06 | 7.31 | 20.55 | |||||
Deposits to Assets | 68.78 | 86.72 | 72.72 | 67.15 | |||||
Borrowed Funds to Assets | 21.43 | 1.02 | 17.38 | 20.36 | |||||
Balance Sheet Growth | |||||||||
Asset Growth Rate | 3.96 | 19.71 | 6.25 | 3.74 | |||||
Loan Growth Rate | 9.59 | 28.91 | 12.82 | 2.86 | |||||
Deposit Growth Rate | 2.20 | 24.57 | 6.86 | 7.52 | |||||
Capital | |||||||||
Equity to Assets | 8.99 | 11.54 | 8.65 | 11.91 | |||||
Tangible Equity to Tangible Assets | 8.98 | 11.54 | 8.01 | 11.36 | |||||
Intangible Assets to Equity | 0.15 | — | 0.70 | — | |||||
Regulatory Core Capital to Assets | 7.74 | 10.75 | 6.61 | 12.51 | |||||
Equity + Reserves to Assets | 9.84 | 13.56 | 9.34 | 12.71 | |||||
Asset Quality | |||||||||
Non-Performing Loans to Loans | 2.30 | 4.93 | 2.21 | 1.48 | |||||
Reserves to Non-Performing Loans | 43.00 | 47.86 | 36.20 | 62.82 | |||||
Non-Performing Assets to Assets | 2.00 | 4.21 | 1.92 | 1.28 | |||||
Non-Performing Assets to Equity | 22.22 | 36.47 | 22.16 | 11.22 | |||||
Reserves to Loans | 0.99 | 2.36 | 0.80 | 1.13 | |||||
Reserves to Non-Performing Assets + 90 Days Del. | 42.55 | 45.03 | 34.94 | 60.13 | |||||
Profitability | |||||||||
Return on Average Assets | 0.35 | (0.43 | ) | 0.01 | 0.39 | ||||
Return on Average Equity | 3.94 | (3.66 | ) | 0.10 | 2.35 | ||||
Core Return on Average Assets | 0.36 | (0.43 | ) | 0.23 | 0.49 | ||||
Core Return on Average Equity | 4.02 | (3.66 | ) | 2.60 | 3.10 | ||||
Income Statement | |||||||||
Yield on Average Earning Assets | 5.52 | 5.04 | 5.41 | 5.10 | |||||
Cost of Average Interest Bearing Liabilities | 2.37 | 1.64 | 2.10 | 2.64 | |||||
Net Interest Spread | 3.15 | 2.65 | 2.95 | 2.52 | |||||
Net Interest Margin | 3.24 | 3.40 | 3.31 | 3.22 | |||||
Noninterest Income to Average Assets | 0.44 | 0.46 | 0.48 | 0.48 | |||||
Noninterest Expense to Average Assets | 2.66 | 4.38 | 3.37 | 2.70 | |||||
Efficiency Ratio | 76.16 | 110.99 | 84.55 | 73.69 | |||||
Overhead Ratio | 72.74 | 112.52 | 97.57 | 69.71 |
| * | Does not include adjustments resulting from the Second Step |
Source: The Bank’s Offering Circular, FinPro calculations and SNL Securities
| Conversion Valuation Appraisal Report | Page: 44 | |
| 4. | Market Value Determination |
MARKET VALUE ADJUSTMENTS
The estimated pro forma market value of the Bank, along with certain adjustments to its value relative to market values for the Comparable Group are delineated in this section. The adjustments are made from potential investors’ viewpoint and are adjustments necessary when comparing the Bank to the Comparable Group. The adjustment factors are subjectively assessed using the appraiser’s knowledge and expertise and an aggregate adjustment is determined. Potential investors include depositors holding subscription rights and unrelated parties who may purchase stock in the community offering and who are assumed to be aware of all relevant and necessary facts as they pertain to the value of the Bank relative to other publicly traded thrift institutions and relative to alternative investment opportunities.
There are numerous criteria on which the market value adjustments are based. The major criteria utilized for purposes of this report include:
Adjustments Relative to the Comparable Group:
| • | Financial Condition |
| • | Asset Quality |
| • | Balance Sheet Growth |
| • | Earnings Quality, Predictability and Growth |
| • | Market Area |
| • | Cash Dividends |
| • | Liquidity of the Issue |
| • | Recent Regulatory Matters |
Adjustments for Other Factors:
| • | Management |
| • | Subscription Interest |
| • | Other than Temporary Impairment Charge |
To ascertain the market value of the Bank, the median trading multiple values for the Comparable Group are utilized as the starting point. The adjustment, up or down, to the Comparable Group median multiple values is made based on the comparison of the Bank to the Comparable Group.
| Conversion Valuation Appraisal Report | Page: 45 | |
FINANCIAL CONDITION
The balance sheet strength of an institution is an important market value determinant, as the investment community considers such factors as cash liquidity, capitalization, asset composition, funding mix, intangible levels and interest rate risk in assessing the attractiveness of investing in the common stock of a thrift. The following figures summarize the key financial elements of the pro forma Bank measured against the Comparable Group.
FIGURE 25 - KEY BALANCE SHEET DATA
| Key Financial Data for the Most Recent Period End | ||||||||||||||||||
Ticker | Short Name | Total Assets ($000) | Loans/ Deposits (%) | Loans/ Assets (%) | Securities/ Assets (%) | Deposits/ Assets (%) | Borrowings/ Assets (%) | |||||||||||
| Comparable Thrift Data | ||||||||||||||||||
CEBK | Central Bancorp, Inc. | 542,444 | 136.07 | 85.08 | 8.20 | 62.53 | 28.54 | |||||||||||
CBNK | Chicopee Bancorp, Inc. | 545,765 | 122.62 | 78.99 | 13.08 | 64.42 | 18.20 | |||||||||||
HBNK | Hampden Bancorp, Inc. | 577,841 | 101.13 | 72.00 | 20.48 | 71.19 | 11.92 | |||||||||||
HIFS | Hingham Institution for Savings | 966,387 | 108.66 | 75.93 | 10.90 | 69.88 | 22.52 | |||||||||||
LEGC | Legacy Bancorp, Inc. | 946,224 | 97.95 | 68.45 | 20.86 | 69.88 | 16.54 | |||||||||||
LSBX | LSB Corporation | 806,567 | 107.96 | 67.50 | 27.06 | 62.53 | 29.26 | |||||||||||
NHTB | New Hampshire Thrift Bancshares, Inc. | 938,665 | 90.95 | 68.10 | 23.18 | 74.88 | 14.33 | |||||||||||
NFSB | Newport Bancorp, Inc. | 456,610 | 136.27 | 77.63 | 12.18 | 56.97 | 31.19 | |||||||||||
UBNK | United Financial Bancorp, Inc. | 1,512,683 | 103.59 | 72.95 | 20.62 | 70.42 | 14.06 | |||||||||||
WFD | Westfield Financial, Inc. | 1,199,757 | 70.68 | 38.96 | 54.58 | 55.12 | 23.72 | |||||||||||
Average | 849,294 | 107.59 | 70.56 | 21.11 | 65.78 | 21.03 | ||||||||||||
Median | 872,616 | 105.78 | 72.48 | 20.55 | 67.15 | 20.36 | ||||||||||||
Maximum | 1,512,683 | 136.27 | 85.08 | 54.58 | 74.88 | 31.19 | ||||||||||||
Minimum | 456,610 | 70.68 | 38.96 | 8.20 | 55.12 | 11.92 | ||||||||||||
Pro-forma Results* | 696,907 | 118.08 | 85.87 | 7.31 | 72.72 | 17.38 | ||||||||||||
| Pro-forma Variance to the Comparable Median | (175,709 | ) | 12.30 | 13.39 | (13.24 | ) | 5.57 | (2.98 | ) | |||||||||
NVSL | Naugatuck Valley Financial Corporation (MHC) | 564,215 | 125.14 | 86.07 | 8.52 | 68.78 | 21.43 | |||||||||||
SSE | Southern Connecticut Bancorp, Inc. | 135,709 | 98.52 | 85.44 | 2.06 | 86.72 | 1.02 | |||||||||||
NVSL Variance to the Comparable Median | (308,401 | ) | 19.36 | 13.59 | (12.03 | ) | 1.63 | 1.07 | ||||||||||
SSE Variance to the Comparable Median | (736,907 | ) | (7.26 | ) | 12.96 | (18.49 | ) | 19.57 | (19.34 | ) | ||||||||
| * | Does not include adjustments resulting from the Second Step Transaction |
Sources: SNL and Offering Circular Data, FinPro Computations
Asset Size - The Bank’s pro forma assets, at $696.9 million, are moderately below the Comparable Group median of $872.6 million. At the pro forma midpoint of the offering range, the Bank is expected to have assets of $723.0 million.
Asset Composition - The Bank’s pro forma loans to assets ratio of 85.87% is above the Comparable Group median of 72.48%. The pro forma Bank has a lower level of securities as a percentage of assets.
| Conversion Valuation Appraisal Report | Page: 46 | |
Funding Mix - The pro forma Bank funds itself through deposits, 72.72% of assets, and borrowings, 17.38% of assets. The Comparable Group has a deposits to assets ratio of 67.15% and a borrowing to asset ratio of 20.36%.
Cash Liquidity - The cash liquidity of the Bank and the Comparable Group appear to be sufficient to meet funding requirements and regulatory guidelines.
Interest Rate Risk - The Bank’s interest rate risk position is illustrated on page 26. The Bank’s interest rate risk position is considered to be “Minimum Risk”. The pro forma increase in capital is expected to reduce the institution’s interest rate risk. No similar data is available for the Comparable Group.
FIGURE 26 - CAPITAL DATA
| Capital for the Most Recent Period End | ||||||||||||||||
Ticker | Short Name | Equity/ Assets (%) | Tangible Tang Equity/ Tang Assets (%) | Intangible Assets/ Equity (%) | Core Capital/ Tangible Assets (%) | Equity + Reserves/ Assets (%) | ||||||||||
| Comparable Thrift Data | ||||||||||||||||
CEBK | Central Bancorp, Inc. | 8.32 | 7.94 | 4.95 | 9.22 | 8.88 | ||||||||||
CBNK | Chicopee Bancorp, Inc. | 17.33 | 17.33 | — | 17.20 | 18.12 | ||||||||||
HBNK | Hampden Bancorp, Inc. | 16.25 | 16.25 | — | 15.80 | 17.29 | ||||||||||
HIFS | Hingham Institution for Savings | 6.94 | 6.94 | — | 7.03 | 7.57 | ||||||||||
LEGC | Legacy Bancorp, Inc. | 12.72 | 11.62 | 9.72 | 7.90 | 13.57 | ||||||||||
LSBX | LSB Corporation | 7.69 | 7.69 | — | NA | 8.59 | ||||||||||
NHTB | New Hampshire Thrift Bancshares, Inc. | 9.50 | 6.60 | 32.73 | NA | 10.61 | ||||||||||
NFSB | Newport Bancorp, Inc. | 11.09 | 11.09 | — | NA | 11.85 | ||||||||||
UBNK | United Financial Bancorp, Inc. | 14.82 | 14.35 | 3.70 | NA | 15.46 | ||||||||||
WFD | Westfield Financial, Inc. | 20.47 | 20.47 | — | 20.65 | 21.10 | ||||||||||
Average | 12.51 | 12.03 | 5.11 | 12.97 | 13.30 | |||||||||||
Median | 11.91 | 11.36 | — | 12.51 | 12.71 | |||||||||||
Maximum | 20.47 | 20.47 | 32.73 | 20.65 | 21.10 | |||||||||||
Minimum | 6.94 | 6.60 | — | 7.03 | 7.57 | |||||||||||
Pro-forma Results* | 8.65 | 8.01 | 0.70 | 6.61 | 9.34 | |||||||||||
Pro-forma Variance to the Comparable Median | (3.26 | ) | (3.35 | ) | 0.70 | (5.90 | ) | (3.37 | ) | |||||||
NVSL | Naugatuck Valley Financial Corporation (MHC) | 8.99 | 8.98 | 0.15 | 7.74 | 9.84 | ||||||||||
SSE | Southern Connecticut Bancorp, Inc. | 11.54 | 11.54 | — | 10.75 | 13.56 | ||||||||||
NVSL Variance to the Comparable Median | (2.92 | ) | (2.38 | ) | 0.15 | (4.77 | ) | (2.87 | ) | |||||||
SSE Variance to the Comparable Median | (0.37 | ) | 0.18 | — | (1.76 | ) | 0.85 | |||||||||
| * | Does not include adjustments resulting from the Second Step Transaction |
Sources: SNL and Offering Circular Data, FinPro Computations
Capitalization - The Comparable Group’s median tangible equity to tangible assets ratio of 11.36% is above the pro forma Bank’s, prior to the capital raise, ratio of 8.01%. The Bank’s pro forma tangible equity to tangible assets ratio is projected to be 11.35% at the midpoint of the valuation range.
| Conversion Valuation Appraisal Report | Page: 47 | |
Positive | Neutral | Negative | ||
| Higher Loan to Assets | Similar Post offering Capital ratio | |||
| Lower Borrowings to Assets | ||||
| Higher Deposits to Assets | ||||
The pro forma Bank’s asset mix is weaker than the Comparable Group’s mix. The pro forma Bank has a higher level of loans and deposits and a lower level of borrowings as a percentage of assets relative to the Comparable Group. The pro forma converted Bank has similar tangible capital levels at the midpoint of the range. Collectively aslight upward adjustment is warranted for financial condition.
| Conversion Valuation Appraisal Report | Page: 48 | |
ASSET QUALITY
The asset quality of an institution is an important determinant of market value. The investment community considers levels of nonperforming loans, Real Estate Owned (“REO”) and levels of Allowance for Loan and Lease Losses (“ALLL”) in assessing the attractiveness of investing in the common stock of an institution.
FIGURE 27 - ASSET QUALITY TABLE
| Asset Quality for the Most Recent Period End | |||||||||||||||||
| NPLs/ | Reserves/ | NPAs/ | NPAs/ | Reserves/ | Reserves/ | ||||||||||||
| Loans | NPLs | Assets | Equity | Loans | NPAs + 90 | ||||||||||||
Ticker | Short Name | (% ) | (% ) | (% ) | (% ) | (% ) | (% ) | ||||||||||
| Comparable Thrift Data | |||||||||||||||||
CEBK | Central Bancorp, Inc. | 1.63 | 40.25 | 1.40 | 16.86 | 0.66 | 39.93 | ||||||||||
CBNK | Chicopee Bancorp, Inc. | 1.11 | 89.52 | 0.90 | 5.17 | 1.00 | 88.05 | ||||||||||
HBNK | Hampden Bancorp, Inc. | 2.46 | 58.88 | 1.93 | 11.86 | 1.45 | 54.05 | ||||||||||
HIFS | Hingham Institution for Savings | 1.41 | 59.42 | 1.34 | 19.39 | 0.83 | 47.15 | ||||||||||
LEGC | Legacy Bancorp, Inc. | 2.73 | 45.77 | 2.06 | 16.19 | 1.25 | 41.59 | ||||||||||
LSBX | LSB Corporation | 2.02 | 66.21 | 1.36 | 17.72 | 1.34 | 66.21 | ||||||||||
NHTB | New Hampshire Thrift Bancshares, Inc. | 1.47 | 110.09 | 1.01 | 10.59 | 1.62 | 110.09 | ||||||||||
NFSB | Newport Bancorp, Inc. | 0.50 | 194.45 | 0.39 | 3.52 | 0.98 | 194.45 | ||||||||||
UBNK | United Financial Bancorp, Inc. | 1.49 | 58.38 | 1.22 | 8.22 | 0.87 | 52.13 | ||||||||||
WFD | Westfield Financial, Inc. | 0.75 | 215.62 | 0.37 | 1.82 | 1.62 | 168.59 | ||||||||||
| Average | 1.56 | 93.86 | 1.20 | 11.13 | 1.16 | 86.22 | |||||||||||
| Median | 1.48 | 62.82 | 1.28 | 11.22 | 1.13 | 60.13 | |||||||||||
| Maximum | 2.73 | 215.62 | 2.06 | 19.39 | 1.62 | 194.45 | |||||||||||
| Minimum | 0.50 | 40.25 | 0.37 | 1.82 | 0.66 | 39.93 | |||||||||||
| Pro-forma Results* | 2.21 | 36.20 | 1.92 | 22.16 | 0.80 | 34.94 | |||||||||||
| Pro-forma Variance to the Comparable Median | 0.73 | (26.62 | ) | 0.64 | 10.94 | (0.33 | ) | (25.19 | ) | ||||||||
NVSL | Naugatuck Valley Financial Corporation (MHC) | 2.30 | 43.00 | 2.00 | 22.22 | 0.99 | 42.55 | ||||||||||
SSE | Southern Connecticut Bancorp, Inc. | 4.93 | 47.86 | 4.21 | 36.47 | 2.36 | 45.03 | ||||||||||
| NVSL Variance to the Comparable Median | 0.82 | (19.82 | ) | 0.72 | 11.00 | (0.14 | ) | (17.58 | ) | ||||||||
| SSE Variance to the Comparable Median | 3.45 | (14.96 | ) | 2.93 | 25.25 | 1.23 | (15.10 | ) | |||||||||
| * | Does not include adjustments resulting from the Second Step Transaction |
Sources: SNL and Offering Circular Data, FinPro Computations
The Bank’s pro forma, prior to capital raise, NPA to asset ratio of 1.92% was above the Comparable Group median NPA to asset ratio of 1.28%. The Bank’s pro forma reserve level, 0.80% to total loans, is below the Comparable median of 1.13% of loans. The Bank’s pro forma level of reserves to NPLs, at 36.20%, is below the Comparable Group median of 62.82%. The Bank’s pro forma level of NPAs and NPLs increased substantially in the quarter ended March 31, 2010.
| Conversion Valuation Appraisal Report | Page: 49 | |
Positive | Neutral | Negative | ||
| Higher NPLs and NPAs | ||||
| Lower ALLL to NPLs | ||||
| Lower ALLL to Loans | ||||
The pro forma Bank has a higher level of NPLs and NPAs and the increase came in the quarter ending March 31, 2010. The Bank has a lower level of reserves as a percentage of loans relative to the Comparable levels due to the FASB 141r adjustment created from the merger. The investment community is carefully scrutinizing asset quality. Taken collectively, astrong downward adjustment is warranted for asset quality.
| Conversion Valuation Appraisal Report | Page: 50 | |
BALANCE SHEET GROWTH
The Bank’s assets, loans and deposits have all increased. Relative to the Comparable Group median, the pro forma Bank’s asset and loan growth is higher, while deposit growth is slightly below the Comparable Group. However, the contribution from SSE has caused the growth rates of the combined company to be high. On a going forward basis, this higher level of growth is not expected to continue.
FIGURE 28 - BALANCE SHEET GROWTH DATA
| Growth | |||||||||||
| Asset Growth | Loan Growth | Deposit Growth | |||||||||
| LTM | LTM | LTM | |||||||||
Ticker | Short Name | (% ) | (% ) | (% ) | |||||||
| Comparable Thrift Data | |||||||||||
CEBK | Central Bancorp, Inc. | (5.80 | ) | 0.18 | (9.57 | ) | |||||
CBNK | Chicopee Bancorp, Inc. | 3.87 | 2.99 | 1.56 | |||||||
HBNK | Hampden Bancorp, Inc. | 0.02 | 7.29 | 7.65 | |||||||
HIFS | Hingham Institution for Savings | 15.05 | 9.06 | 20.22 | |||||||
LEGC | Legacy Bancorp, Inc. | (2.26 | ) | (7.36 | ) | 2.73 | |||||
LSBX | LSB Corporation | 3.61 | 13.44 | 16.29 | |||||||
NHTB | New Hampshire Thrift Bancshares, Inc. | 8.30 | 1.57 | 7.39 | |||||||
NFSB | Newport Bancorp, Inc. | 3.44 | 2.73 | 6.77 | |||||||
UBNK | United Financial Bancorp, Inc. | 21.68 | 28.17 | 33.93 | |||||||
WFD | Westfield Financial, Inc. | 6.58 | (1.16 | ) | 10.07 | ||||||
| Average | 5.45 | 5.69 | 9.70 | ||||||||
| Median | 3.74 | 2.86 | 7.52 | ||||||||
| Maximum | 21.68 | 28.17 | 33.93 | ||||||||
| Minimum | (5.80 | ) | (7.36 | ) | (9.57 | ) | |||||
| Pro-forma Results* | 6.25 | 12.82 | 6.86 | ||||||||
| Pro-forma Variance to the Comparable Median | 2.51 | 9.96 | (0.66 | ) | |||||||
NVSL | Naugatuck Valley Financial Corporation (MHC) | 3.96 | 9.59 | 2.20 | |||||||
SSE | Southern Connecticut Bancorp, Inc. | 19.71 | 28.91 | 24.57 | |||||||
| NVSL Variance to the Comparable Median | 0.22 | 6.73 | (5.32 | ) | |||||||
| SSE Variance to the Comparable Median | 15.97 | 26.05 | 17.05 | ||||||||
| * | Does not include adjustments resulting from the Second Step Transaction |
Sources: SNL and Offering Circular Data, FinPro Computations
Positive | Neutral | Negative | ||
Higher asset and loan growth | Slightly lower deposit growth | |||
Anmoderate upward adjustment is warranted.
| Conversion Valuation Appraisal Report | Page: 51 | |
EARNINGS QUALITY, PREDICTABILITYAND GROWTH
The earnings quality, predictability and growth are critical components in the establishment of market values for thrifts. Thrift earnings are primarily a function of:
| • | net interest income |
| • | loan loss provision |
| • | non-interest income |
| • | non-interest expense |
The quality and predictability of earnings is dependent on both internal and external factors. Some internal factors include the mix of the balance sheet, the interest rate sensitivity of the balance sheet, the asset quality, and the infrastructure in place to deliver the assets and liabilities to the public. External factors include the competitive market for both assets and liabilities, the global interest rate scenario, local economic factors and regulatory issues.
Investors are focusing on earnings sustainability as interest rate volatility has caused a wide variation in income levels. With the intense competition for both assets and deposits, banks cannot easily replace lost spread and margin with balance sheet growth.
Each of these factors can influence the earnings of an institution, and each of these factors is volatile. Investors prefer stability and consistency. As such, solid, consistent earnings are preferred to high but risky earnings. Investors also prefer earnings to be diversified and not entirely dependent on interest income.
| Conversion Valuation Appraisal Report | Page: 52 | |
The Bank’s pro forma, prior to capital raise, core ROAA and core ROAE are below the Comparable Group medians. The Bank’s higher capitalization and benefit plan expenses following the offering are expected to reduce return on equity for the near term. The merger expenses and reduction in ongoing operating expenses should increase return on equity for the near term. On a pro forma basis, inclusive of the second step transaction at the midpoint of the range, the Bank’s core ROAA and core ROAE are 0.20% and 1.67%, respectively (as shown in appraisal). Without the second step transaction, the pro forma core ROAA and core ROAE are 0.23% and 2.60%, respectively.
| Conversion Valuation Appraisal Report | Page: 53 | |
FIGURE 29 - PROFITABILITY DATA
| Conversion Valuation Appraisal Report | Page: 54 | |
| LTM Profitability | ||||||||||||||
Ticker | Short Name | Return on Avg Assets (% ) | Return on Avg Equity (% ) | Core Return on Avg Assets (% ) | Core Return on Avg Equity (% ) | |||||||||
| Comparable Thrift Data | ||||||||||||||
| CEBK | Central Bancorp, Inc. | 0.36 | 4.65 | 0.45 | 5.77 | |||||||||
| CBNK | Chicopee Bancorp, Inc. | (0.33 | ) | (1.86 | ) | (0.14 | ) | (0.80 | ) | |||||
| HBNK | Hampden Bancorp, Inc. | (0.15 | ) | (0.90 | ) | (0.13 | ) | (0.75 | ) | |||||
| HIFS | Hingham Institution for Savings | 0.98 | 13.65 | 1.00 | 14.06 | |||||||||
| LEGC | Legacy Bancorp, Inc. | (0.87 | ) | (6.58 | ) | (0.19 | ) | (1.40 | ) | |||||
| LSBX | LSB Corporation | 0.70 | 8.07 | 0.54 | 6.26 | |||||||||
| NHTB | New Hampshire Thrift Bancshares, Inc. | 0.76 | 8.00 | 0.60 | 6.36 | |||||||||
| NFSB | Newport Bancorp, Inc. | 0.18 | 1.56 | 0.24 | 2.08 | |||||||||
| UBNK | United Financial Bancorp, Inc. | 0.41 | 2.48 | 0.61 | 3.71 | |||||||||
| WFD | Westfield Financial, Inc. | 0.47 | 2.21 | 0.53 | 2.49 | |||||||||
Average | 0.25 | 3.13 | 0.35 | 3.78 | ||||||||||
Median | 0.39 | 2.35 | 0.49 | 3.10 | ||||||||||
Maximum | 0.98 | 13.65 | 1.00 | 14.06 | ||||||||||
Minimum | (0.87 | ) | (6.58 | ) | (0.19 | ) | (1.40 | ) | ||||||
Pro-forma Results* | 0.01 | 0.10 | 0.01 | 0.17 | ||||||||||
Pro-forma Variance to the Comparable Median | (0.38 | ) | (2.25 | ) | (0.48 | ) | (2.93 | ) | ||||||
| NVSL | Naugatuck Valley Financial Corporation (MHC) | 0.35 | 3.94 | 0.36 | 4.02 | |||||||||
| SSE | Southern Connecticut Bancorp, Inc. | (0.43 | ) | (3.66 | ) | (0.43 | ) | (3.66 | ) | |||||
NVSL Variance to the Comparable Median | (0.04 | ) | 1.59 | (0.13 | ) | 0.92 | ||||||||
SSE Variance to the Comparable Median | (0.82 | ) | (6.01 | ) | (0.92 | ) | (6.76 | ) | ||||||
| * | Does not include adjustments resulting from the Second Step Transaction |
| Conversion Valuation Appraisal Report | Page: 55 | |
| LTM Profitability | ||||||||||||||
Ticker | Short Name | Return on Avg Assets (% ) | Return on Avg Equity (% ) | Core Return on Avg Assets (% ) | Core Return on Avg Equity (% ) | |||||||||
| Comparable Thrift Data | ||||||||||||||
| CEBK | Central Bancorp, Inc. | 0.36 | 4.65 | 0.45 | 5.77 | |||||||||
| CBNK | Chicopee Bancorp, Inc. | (0.33 | ) | (1.86 | ) | (0.14 | ) | (0.80 | ) | |||||
| HBNK | Hampden Bancorp, Inc. | (0.15 | ) | (0.90 | ) | (0.13 | ) | (0.75 | ) | |||||
| HIFS | Hingham Institution for Savings | 0.98 | 13.65 | 1.00 | 14.06 | |||||||||
| LEGC | Legacy Bancorp, Inc. | (0.87 | ) | (6.58 | ) | (0.19 | ) | (1.40 | ) | |||||
| LSBX | LSB Corporation | 0.70 | 8.07 | 0.54 | 6.26 | |||||||||
| NHTB | New Hampshire Thrift Bancshares, Inc. | 0.76 | 8.00 | 0.60 | 6.36 | |||||||||
| NFSB | Newport Bancorp, Inc. | 0.18 | 1.56 | 0.24 | 2.08 | |||||||||
| UBNK | United Financial Bancorp, Inc. | 0.41 | 2.48 | 0.61 | 3.71 | |||||||||
| WFD | Westfield Financial, Inc. | 0.47 | 2.21 | 0.53 | 2.49 | |||||||||
Average | 0.25 | 3.13 | 0.35 | 3.78 | ||||||||||
Median | 0.39 | 2.35 | 0.49 | 3.10 | ||||||||||
Maximum | 0.98 | 13.65 | 1.00 | 14.06 | ||||||||||
Minimum | (0.87 | ) | (6.58 | ) | (0.19 | ) | (1.40 | ) | ||||||
Pro-forma Results* | 0.01 | 0.10 | 0.23 | 2.60 | ||||||||||
Pro-forma Variance to the Comparable Median | (0.38 | ) | (2.25 | ) | (0.26 | ) | (0.50 | ) | ||||||
| NVSL | Naugatuck Valley Financial Corporation (MHC) | 0.35 | 3.94 | 0.36 | 4.02 | |||||||||
| SSE | Southern Connecticut Bancorp, Inc. | (0.43 | ) | (3.66 | ) | (0.43 | ) | (3.66 | ) | |||||
NVSL Variance to the Comparable Median | (0.04 | ) | 1.59 | (0.13 | ) | 0.92 | ||||||||
SSE Variance to the Comparable Median | (0.82 | ) | (6.01 | ) | (0.92 | ) | (6.76 | ) | ||||||
| * | Does not include adjustments resulting from the Second Step Transaction |
Sources: SNL and Offering Circular Data, FinPro Computations
| Conversion Valuation Appraisal Report | Page: 56 | |
FIGURE 30 - INCOME STATEMENT DATA
| LTM Income Statement | ||||||||||||||||||||||
Ticker | Short Name | Yield on Ave Earn Assets (%) | Cost of Funds (%) | Net Interest Spread (%) | Net Interest Margin (%) | Noninterest Income/ Avg Assets (%) | Noninterest Expense/ Avg Assets (%) | Efficiency Ratio (%) | Overhead Ratio (%) | |||||||||||||
| Comparable Thrift Data | ||||||||||||||||||||||
| CEBK | Central Bancorp, Inc. | 5.38 | NA | NA | 3.21 | 0.34 | 2.68 | 78.75 | 76.41 | |||||||||||||
| CBNK | Chicopee Bancorp, Inc. | 4.98 | NA | NA | 3.22 | 0.48 | 3.36 | 97.18 | 96.73 | |||||||||||||
| HBNK | Hampden Bancorp, Inc. | 5.00 | NA | NA | 3.12 | 0.47 | 2.98 | 84.06 | 81.57 | |||||||||||||
| HIFS | Hingham Institution for Savings | 5.16 | NA | NA | 3.25 | 0.22 | 1.58 | 44.13 | 40.20 | |||||||||||||
| LEGC | Legacy Bancorp, Inc. | 5.04 | 2.31 | 2.73 | 3.09 | 0.59 | 3.01 | 84.11 | 80.85 | |||||||||||||
| LSBX | LSB Corporation | 5.27 | 2.96 | 2.31 | 2.61 | 0.23 | 1.69 | 61.07 | 57.51 | |||||||||||||
| NHTB | New Hampshire Thrift Bancshares, Inc. | 4.61 | NA | NA | 3.30 | 0.98 | 2.66 | 64.19 | 52.78 | |||||||||||||
| NFSB | Newport Bancorp, Inc. | 5.41 | NA | NA | 3.29 | 0.49 | 2.93 | 82.16 | 79.32 | |||||||||||||
| UBNK | United Financial Bancorp, Inc. | 5.20 | NA | NA | 3.50 | 0.64 | 2.72 | 68.62 | 62.57 | |||||||||||||
| WFD | Westfield Financial, Inc. | 4.66 | NA | NA | 2.94 | 0.32 | 2.08 | 66.81 | 63.00 | |||||||||||||
Average | 5.07 | 2.64 | 2.52 | 3.15 | 0.48 | 2.57 | 73.11 | 69.09 | ||||||||||||||
Median | 5.10 | 2.64 | 2.52 | 3.22 | 0.48 | 2.70 | 73.69 | 69.71 | ||||||||||||||
Maximum | 5.41 | 2.96 | 2.73 | 3.50 | 0.98 | 3.36 | 97.18 | 96.73 | ||||||||||||||
Minimum | 4.61 | 2.31 | 2.31 | 2.61 | 0.22 | 1.58 | 44.13 | 40.20 | ||||||||||||||
Pro-forma Results* | 5.41 | 2.10 | 2.95 | 3.31 | 0.48 | 3.37 | 84.55 | 97.57 | ||||||||||||||
Pro-forma Variance to the Comparable Median | 0.31 | (0.54 | ) | 0.43 | 0.09 | (0.00 | ) | 0.67 | 10.86 | 27.86 | ||||||||||||
| NVSL | Naugatuck Valley Financial Corporation (MHC) | 5.52 | 2.37 | 3.15 | 3.24 | 0.44 | 2.66 | 76.16 | 72.74 | |||||||||||||
| SSE | Southern Connecticut Bancorp, Inc. | 5.04 | 1.64 | 2.65 | 3.40 | 0.46 | 4.38 | 110.99 | 112.52 | |||||||||||||
NVSL Variance to the Comparable Median | 0.42 | (0.27 | ) | 0.63 | 0.02 | (0.04 | ) | (0.04 | ) | 2.47 | 3.03 | |||||||||||
SSE Variance to the Comparable Median | (0.06 | ) | (1.00 | ) | 0.13 | 0.18 | (0.02 | ) | 1.68 | 37.30 | 42.81 | |||||||||||
| * | Does not include adjustments resulting from the Second Step Transaction |
Sources: SNL and Offering Circular Data, FinPro Computations
Note: The cost of funds and the net interest spread medians are less reliable due to the lack of five data points.
The pro forma Bank has a 9 basis point advantage in net margin, but a 67 basis point disadvantage in noninterest expense as a percentage of average assets relative to the Comparable Group.
The pro forma Bank’s efficiency ratio of 84.55% is above the Comparable median of 73.69%.
On a forward looking basis, after the conversion the Bank’s operating expenses are expected to rise as a result of the stock benefit plans and additional costs of being a fully public company. However, the merger expenses and reduction in ongoing operating expenses should help decrease non interest expense. At the same time, the Bank will have additional capital to deploy and leverage.
| Conversion Valuation Appraisal Report | Page: 57 | |
Positive | Neutral | Negative | ||
| Conversion proceeds can be leveraged to generate addition earnings | Non interest income | Lower core ROAA and Lower core ROAE | ||
| Slightly higher margin | Higher noninterest expense | |||
| Higher efficiency ratio | ||||
The Bank’s pro forma profitability is below the Comparables on an ROAA and ROAE basis. The Bank’s earnings composition is mixed compared to the Comparable Group as the Bank has a higher margin, but higher noninterest expense. The Bank’s historical earnings have been trending downward. After the conversion, the Bank will have capital that can be leveraged to enhance future earnings. Taken collectively, amoderate downward adjustment is warranted for this factor.
| Conversion Valuation Appraisal Report | Page: 58 | |
MARKETAREA
The market area that an institution serves has a significant impact on value, as future success is interrelated with the economic, demographic and competitive aspects of the market. The location of an institution will have an impact on the trading value of an institution, as many analysts compare the pricing of institutions relative to a state or regional multiples in investor presentations.
The following figure compares the demographic and competitive data for the counties serviced by the pro forma Bank, to the county data of the Comparable Group members.
FIGURE 31 - MARKET AREA DATA
| Number of | Bank’s Deps | Bank’s | Total | Population | Median | HH Income | ||||||||||||||||||
Institution | County | Branches 6/30/2009 (actual) | in the County 6/30/2009 (actual) | Deposit Mkt Share (% ) | Population 2009 (actual) | Population Per Branch (actual) | Change 2000-2009 (% ) | Change 2009-2014 (% ) | HH Income 2009 ($) | Change 2000-2009 (% ) | Change 2009-2014 (% ) | Unemp. Rate Mar-10 (% ) | ||||||||||||
Central Bancorp, Inc. | Middlesex, MA | 517 | 331,883 | 0.88 | 1,485,082 | 2,872 | 1.34 | 0.61 | 84,469 | 38.90 | 6.08 | 7.40 | ||||||||||||
Central Bancorp, Inc. | Norfolk, MA | 249 | 29,419 | 0.17 | 661,665 | 2,657 | 1.75 | 0.49 | 88,399 | 39.52 | 6.37 | 8.00 | ||||||||||||
Deposit Weighted Market Data | 0.66 | 2,803 | 1.38 | 0.60 | 84,789 | 38.95 | 6.10 | 7.58 | ||||||||||||||||
Chicopee Bancorp, Inc. | Hampden, MA | 159 | 368,839 | 4.75 | 459,791 | 2,892 | 0.78 | -0.39 | 50,540 | 27.24 | 7.01 | 11.40 | ||||||||||||
Chicopee Bancorp, Inc. | Hampshire, MA | 59 | 11,595 | 0.38 | 154,109 | 2,612 | 1.22 | 0.11 | 62,790 | 36.11 | 5.36 | 7.00 | ||||||||||||
Deposit Weighted Market Data | 3.52 | 2,816 | 0.79 | -0.37 | 50,913 | 27.51 | 6.96 | 10.30 | ||||||||||||||||
Hampden Bancorp, Inc. | Hampden, MA | 159 | 382,379 | 4.92 | 459,791 | 2,892 | 0.78 | -0.39 | 50,540 | 27.24 | 7.01 | 11.40 | ||||||||||||
Deposit Weighted Market Data | 4.92 | 2,892 | 0.78 | -0.39 | 50,540 | 27.24 | 7.01 | 11.40 | ||||||||||||||||
Hingham Institution for Savings | Plymouth, MA | 163 | 461,809 | 6.65 | 498,968 | 3,061 | 5.53 | 1.84 | 76,101 | 36.76 | 6.59 | 10.10 | ||||||||||||
Hingham Institution for Savings | Norfolk, MA | 249 | 95,852 | 0.55 | 661,665 | 2,657 | 1.75 | 0.49 | 88,399 | 39.52 | 6.37 | 8.00 | ||||||||||||
Hingham Institution for Savings | Suffolk, MA | 222 | 30,463 | 0.06 | 695,403 | 3,132 | 0.81 | 0.61 | 53,416 | 35.68 | 6.47 | 8.30 | ||||||||||||
Deposit Weighted Market Data | 0.78 | 2,928 | 4.67 | 1.56 | 76,930 | 37.16 | 6.55 | 8.68 | ||||||||||||||||
Legacy Bancorp, Inc. | Berkshire, MA | 63 | 535,708 | 18.12 | 130,714 | 2,075 | -3.14 | -2.36 | 50,638 | 29.77 | 6.56 | 9.60 | ||||||||||||
Legacy Bancorp, Inc. | Hampshire, MA | 59 | 10,865 | 0.35 | 154,109 | 2,612 | 1.22 | 0.11 | 62,790 | 36.11 | 5.36 | 7.00 | ||||||||||||
Legacy Bancorp, Inc. | Greene, NY | 26 | 39,394 | 4.39 | 50,332 | 1,936 | 4.43 | 1.24 | 46,233 | 26.31 | 4.87 | 8.60 | ||||||||||||
Legacy Bancorp, Inc. | Washington, NY | 19 | 19,686 | 3.31 | 63,809 | 3,358 | 4.53 | 1.81 | 47,455 | 25.19 | 4.55 | 8.60 | ||||||||||||
Legacy Bancorp, Inc. | Albany, NY | 131 | 19,179 | 0.12 | 299,607 | 2,287 | 1.71 | -0.02 | 57,331 | 32.83 | 7.23 | 6.50 | ||||||||||||
Legacy Bancorp, Inc. | Schoharie, NY | 12 | 12,429 | 3.29 | 32,034 | 2,670 | 1.43 | 0.31 | 45,764 | 25.21 | 5.59 | 10.20 | ||||||||||||
Deposit Weighted Market Data | 2.66 | 2,357 | 1.70 | 0.18 | 51,702 | 29.24 | 5.69 | 7.65 | ||||||||||||||||
LSB Corporation | Essex, MA | 263 | 411,029 | 2.45 | 744,480 | 2,831 | 2.91 | 0.62 | 69,858 | 34.96 | 6.80 | 9.90 | ||||||||||||
LSB Corporation | Rockingham, NH | 94 | 44,706 | 0.95 | 302,476 | 3,218 | 9.06 | 3.08 | 75,903 | 30.27 | 5.61 | 7.40 | ||||||||||||
Deposit Weighted Market Data | 2.12 | 2,933 | 5.99 | 1.85 | 72,881 | 32.62 | 6.21 | 9.18 | ||||||||||||||||
New Hampshire Thrift Bancshares, Inc. | Sullivan, NH | 18 | 199,177 | 28.35 | 43,000 | 2,389 | 6.28 | 2.13 | 50,087 | 22.38 | 1.37 | 6.90 | ||||||||||||
New Hampshire Thrift Bancshares, Inc. | Merrimack, NH | 51 | 190,754 | 6.38 | 150,472 | 2,950 | 10.46 | 3.60 | 61,638 | 26.61 | 4.12 | 6.80 | ||||||||||||
New Hampshire Thrift Bancshares, Inc. | Grafton, NH | 59 | 113,671 | 6.13 | 87,294 | 1,480 | 6.79 | 2.21 | 53,139 | 26.26 | 2.33 | 6.00 | ||||||||||||
New Hampshire Thrift Bancshares, Inc. | Hillsborough, NH | 104 | 43,216 | 0.45 | 407,525 | 3,919 | 7.01 | 2.27 | 70,703 | 31.93 | 5.31 | 7.40 | ||||||||||||
New Hampshire Thrift Bancshares, Inc. | Rutland, VT | 26 | 107,027 | 12.04 | 63,505 | 2,443 | 0.17 | -0.25 | 49,481 | 34.54 | 6.08 | 7.80 | ||||||||||||
New Hampshire Thrift Bancshares, Inc. | Windsor, VT | 35 | 36,403 | 3.91 | 57,751 | 1,650 | 0.58 | -1.40 | 53,811 | 32.23 | 2.70 | 6.50 | ||||||||||||
Deposit Weighted Market Data | 4.07 | 2,763 | 5.22 | 1.43 | 56,477 | 28.99 | 3.65 | 7.08 | ||||||||||||||||
Newport Bancorp, Inc. | New London, CT | 97 | 48,554 | 1.07 | 269,600 | 2,779 | 4.06 | 0.48 | 65,136 | 28.58 | 5.08 | 8.70 | ||||||||||||
Newport Bancorp, Inc. | Newport, RI | 24 | 152,568 | 11.45 | 83,867 | 3,494 | -1.83 | -2.55 | 66,131 | 31.24 | 5.81 | 13.40 | ||||||||||||
Newport Bancorp, Inc. | Washington, RI | 36 | 65,838 | 2.37 | 130,215 | 3,617 | 5.40 | 1.74 | 70,461 | 32.01 | 6.35 | 11.30 | ||||||||||||
Deposit Weighted Market Data | 3.09 | 3,081 | 2.54 | -0.11 | 67,243 | 30.61 | 5.75 | 10.21 | ||||||||||||||||
United Financial Bancorp, Inc. | Hampden, MA | 159 | 793,938 | 10.23 | 459,791 | 2,892 | 0.78 | -0.39 | 50,540 | 27.24 | 7.01 | 11.40 | ||||||||||||
United Financial Bancorp, Inc. | Worcester, MA | 237 | 188,540 | 1.68 | 794,206 | 3,351 | 5.76 | 1.83 | 62,731 | 31.03 | 5.37 | 10.20 | ||||||||||||
United Financial Bancorp, Inc. | Hampshire, MA | 59 | 56,570 | 1.85 | 154,109 | 2,612 | 1.22 | 0.11 | 62,790 | 36.11 | 5.36 | 7.00 | ||||||||||||
Deposit Weighted Market Data | 4.71 | 3,095 | 1.71 | 0.04 | 53,419 | 28.41 | 6.62 | 10.24 | ||||||||||||||||
Westfield Financial, Inc. | Hampden, MA | 159 | 632,736 | 8.15 | 459,791 | 2,892 | 0.78 | -0.39 | 50,540 | 27.24 | 7.01 | 11.40 | ||||||||||||
Deposit Weighted Market Data | 8.15 | 2,892 | 0.78 | -0.39 | 50,540 | 27.24 | 7.01 | 11.40 | ||||||||||||||||
Comparable Median | 3.30 | 2,892 | 1.70 | 0.11 | 54,948 | 29.11 | 6.38 | 9.70 | ||||||||||||||||
Naugatuck Valley Financial Corporation (MHC) | New Haven, CT | 278 | 463,833 | 2.51 | 848,827 | 3,053 | 3.01 | 1.04 | 62,319 | 27.61 | 5.93 | 10.00 | ||||||||||||
Naugatuck Valley Financial Corporation (MHC) | Fairfield, CT | 419 | 35,640 | 0.13 | 908,106 | 2,167 | 2.89 | 0.69 | 87,897 | 35.48 | 5.05 | 8.40 | ||||||||||||
Deposit Weighted Market Data | 2,521 | 3.00 | 1.01 | 64,710 | 28.35 | 5.84 | 9.20 | |||||||||||||||||
Connecticut | 1,313 | 3,534,235 | 2,692 | 3.78 | 1.14 | 70,949 | 31.59 | 4.99 | 8.50 | |||||||||||||||
National | 99,546 | 309,731,508 | 3,111 | 10.06 | 4.63 | 54,719 | 29.78 | 4.06 | 9.90 | |||||||||||||||
Sources: SNL Securities
| Conversion Valuation Appraisal Report | Page: 59 | |
The Bank’s population per branch in its market area is lower than the Comparable Group median as well as Connecticut and national statistics. Historical population growth was higher for the state and national figures compared to the Bank’s market area’s population growth. However, the comparable median historical population growth was well below that of the market area. Projected population growth for the Bank’s market area is projected to remain above the comparable median but below the state and national levels. The Bank’s market area median household income was above the Comparable Group median and national figures, but below the Connecticut state median. Household income in the Bank’s market area is projected to lag behind household income growth of the Comparable Group median but remain above the state and national figures. The Bank’s market area unemployment percentage was below the comparable median and national average but was slightly above the state. Due to the various strengths and weaknesses of the Bank’s market area,no adjustment was given.
Positive | Neutral | Negative | ||
| Unemployment Rate | Population per branch | |||
| Higher Median HH Income | Lower Projected Median HH Income Growth | |||
| Higher Projected Population Growth | ||||
| Conversion Valuation Appraisal Report | Page: 60 | |
CASH DIVIDENDS
The industry has typically not disclosed dividend policies concurrent with conversion. Recently, a number of financial institutions have cut dividend rates in an effort to conserve capital.
FIGURE 32 - DIVIDEND DATA
| Dividends | ||||||||
Ticker | Short Name | Current Dividend Yield (% ) | LTM Dividend Payout Ratio (% ) | |||||
| Comparable Thrift Data | ||||||||
CEBK | Central Bancorp, Inc. | 1.74 | 21.74 | |||||
CBNK | Chicopee Bancorp, Inc. | — | — | |||||
HBNK | Hampden Bancorp, Inc. | 1.27 | NM | |||||
HIFS | Hingham Institution for Savings | 2.44 | 26.81 | |||||
LEGC | Legacy Bancorp, Inc. | 2.28 | NM | |||||
LSBX | LSB Corporation | 2.95 | 25.74 | |||||
NHTB | New Hampshire Thrift Bancshares, Inc. | 5.04 | 46.43 | |||||
NFSB | Newport Bancorp, Inc. | — | — | |||||
UBNK | United Financial Bancorp, Inc. | 2.06 | 77.78 | |||||
WFD | Westfield Financial, Inc. | 2.35 | 263.16 | |||||
Average | 2.01 | 57.71 | ||||||
Median | 2.17 | 26.28 | ||||||
Maximum | 5.04 | 263.16 | ||||||
Minimum | — | — | ||||||
Pro-forma Results* | NA | NA | ||||||
Pro-forma Variance to the Comparable Median | ||||||||
NVSL | Naugatuck Valley Financial Corporation (MHC) | 1.73 | 41.38 | |||||
SSE | Southern Connecticut Bancorp, Inc. | — | — | |||||
NVSL Variance to the Comparable Median | (0.44 | ) | 15.10 | |||||
SSE Variance to the Comparable Median | (2.17 | ) | (26.28 | ) | ||||
| * | Does not include adjustments resulting from the Second Step Transaction |
Sources: SNL and Offering Circular Data, FinPro Computations
All but two of the Comparable institutions had declared cash dividends. The median dividend payout ratio for the Comparable Group was 26.28%, ranging from a high of 263.16% to a low of 0.00%. The Bank, on a pro forma basis at the mid point of the value range will have a tangible equity to tangible assets ratio of 11.35%. The Bank will have adequate capital to pay cash dividends.
As such,no adjustment is warranted for this factor.
| Conversion Valuation Appraisal Report | Page: 61 | |
LIQUIDITYOFTHE ISSUE
The Comparable Group is by definition composed only of companies that trade in the public markets with all of the Comparables trading on NASDAQ. Typically, the number of shares outstanding and the market capitalization provides an indication of how much liquidity there will be in a given stock. The actual liquidity can be measured by volume traded over a given period of time.
FIGURE 33 - MARKET CAPITALIZATION DATA
| Market Data | ||||||||||||||||||||
Ticker | Short Name | Market Value ($) | Stock Price ($) | Price High ($) | Price Low ($) | Book Value ($) | Tangible Book Value ($) | |||||||||||||
| Comparable Thrift Data | ||||||||||||||||||||
CEBK | Central Bancorp, Inc. | 19.20 | 11.50 | 11.50 | 8.41 | 21.31 | 19.97 | |||||||||||||
CBNK | Chicopee Bancorp, Inc. | 74.60 | 11.70 | 13.15 | 11.63 | 14.83 | 14.83 | |||||||||||||
HBNK | Hampden Bancorp, Inc. | 67.50 | 9.44 | 10.16 | 9.08 | 13.13 | 13.13 | |||||||||||||
HIFS | Hingham Institution for Savings | 80.20 | 37.73 | 38.05 | 31.50 | 31.56 | 31.56 | |||||||||||||
LEGC | Legacy Bancorp, Inc. | 76.30 | 8.76 | 9.84 | 8.56 | 13.80 | 12.40 | |||||||||||||
LSBX | LSB Corporation | 54.90 | 12.19 | 14.50 | 11.61 | 13.77 | 13.77 | |||||||||||||
NHTB | New Hampshire Thrift Bancshares, Inc. | 59.60 | 10.32 | 11.93 | 9.91 | 13.70 | 8.65 | |||||||||||||
NFSB | Newport Bancorp, Inc. | 44.70 | 12.15 | 12.34 | 11.46 | 13.61 | 13.61 | |||||||||||||
UBNK | United Financial Bancorp, Inc. | 226.80 | 13.56 | 15.16 | 12.68 | 13.39 | 12.90 | |||||||||||||
WFD | Westfield Financial, Inc. | 251.70 | 8.51 | 10.37 | 7.92 | 8.30 | 8.30 | |||||||||||||
Average | 95.55 | 13.59 | 14.70 | 12.28 | 15.74 | 14.91 | ||||||||||||||
Median | 71.05 | 11.60 | 12.14 | 10.69 | 13.74 | 13.37 | ||||||||||||||
Maximum | 251.70 | 37.73 | 38.05 | 31.50 | 31.56 | 31.56 | ||||||||||||||
Minimum | 19.20 | 8.51 | 9.84 | 7.92 | 8.30 | 8.30 | ||||||||||||||
Pro-forma Results* | 61.80 | NA | NA | NA | NA | NA | ||||||||||||||
Pro-forma Variance to the Comparable Median | ||||||||||||||||||||
NVSL | Naugatuck Valley Financial Corporation (MHC) | 48.80 | 6.95 | 7.10 | 5.76 | 7.22 | 7.21 | |||||||||||||
SSE | Southern Connecticut Bancorp, Inc. | 17.00 | 6.30 | 6.85 | 5.66 | 5.81 | 5.81 | |||||||||||||
NVSL Variance to the Comparable Median | (22.25 | ) | (4.65 | ) | (5.04 | ) | (4.93 | ) | (6.52 | ) | (6.16 | ) | ||||||||
SSE Variance to the Comparable Median | (54.05 | ) | (5.30 | ) | (5.29 | ) | (5.03 | ) | (7.93 | ) | (7.56 | ) | ||||||||
| * | Does not include adjustments resulting from the Second Step Transaction |
Sources: SNL and Offering Circular Data, FinPro Computations
The market capitalization values of the Comparable Group range from a low of $19.2 million to a high of $251.7 million with a median market capitalization of $71.1 million. The Bank expects to have $61.8 million of market capital at the midpoint on a pro forma basis. It is expected that the Bank will trade on NASDAQ along with all of the Comparables.
A Slight Downward adjustment for this factor appears warranted as the Bank will have a lower market capitalization than the Comparables.
| Conversion Valuation Appraisal Report | Page: 62 | |
RECENT REGULATORY MATTERS
Regulatory matters influence the market for thrift conversions. It is expected that industry regulation will increase as a result of the current crisis and there is a lack of clarity to the resulting regulatory framework. Both the Bank and the Comparable Group are expected to operate in substantially the same regulatory environment.
No adjustment for this factor is warranted as both the Bank and the Comparables will operate in the same ownership structure and will be supervised in the same regulatory environment.
| Conversion Valuation Appraisal Report | Page: 63 | |
| 5. | Other Factors |
MANAGEMENT
The current team has considerable banking experience and has held similar positions in other financial institutions. The Bank’s organizational chart is reasonable for an institution of its size and complexity.
The Board is active and oversees and advises on all key strategic and policy decisions.
As such,no adjustment appears to be warranted for this factor.
| Conversion Valuation Appraisal Report | Page: 64 | |
SUBSCRIPTION INTEREST
There have been four second step conversion since January 1, 2008. The median price to tangible book value of these conversions was 73.1%. Northwest’s price to pro forma tangible book value was above the others and is partially attributable to the size of the institution. Eagle completed its second step in April 2010 at 81.2% of tangible book.
FIGURE 34 - SECOND STEP CONVERSIONS (SINCE 1/1/08) PRO FORMA DATA
| Price to Pro Forma | ||||||||||||||||
Ticker | Name | IPO Date | Gross Proceeds ($) | IPO Price ($) | EPS (%) | Book Value (%) | Tangible Book Value (%) | |||||||||
BCSB | BCSB Bancorp, Inc. | 4/11/2008 | $ | 19,765 | $ | 10.00 | NM | 61.8 | 65.0 | |||||||
NWBI | Northwest Bancshares, Inc. | 12/18/2009 | 688,783 | 10.00 | 24.8 | 89.0 | 103.8 | |||||||||
OSHC | Ocean Shore Holding Co. | 12/21/2009 | 33,490 | 8.00 | 17.3 | 63.0 | 63.0 | |||||||||
EBMT | Eagle Bancorp Montana, Inc. | 4/5/2010 | 24,643 | 10.00 | 12.3 | 81.2 | 81.2 | |||||||||
| Average | 18.1 | 73.8 | 78.3 | |||||||||||||
| Median | 17.3 | 72.1 | 73.1 | |||||||||||||
Source: SNL Securities
| Conversion Valuation Appraisal Report | Page: 65 | |
There was a first day “pop” for 2010 year-to-date, 2009 full year transactions, and 2008 full year transactions. The median price change after 1 day was 8.95%. Of the four second step conversions, three are currently trading above their IPO price.
FIGURE 35 - CONVERSIONS PRICE APPRECIATION
| Percentage Change in Price | ||||||||||||||||||
Ticker | Name | IPO Date | Gross Proceeds ($) | After 1 Day (%) | After 1 Week (%) | After 1 Month (%) | After 3 Months (%) | To Date (%) | ||||||||||
BCSB | BCSB Bancorp, Inc. | 4/11/2008 | $ | 19,765 | 10.40 | 14.90 | 13.50 | 4.00 | (0.10 | ) | ||||||||
NWBI | Northwest Bancshares, Inc. | 12/18/2009 | 688,783 | 13.50 | 13.00 | 14.00 | NA | 16.30 | ||||||||||
OSHC | Ocean Shore Holding Co. | 12/21/2009 | 33,490 | 7.50 | 11.88 | 13.13 | NA | 38.75 | ||||||||||
EBMT | Eagle Bancorp Montana, Inc. | 4/5/2010 | 24,643 | 5.50 | 5.00 | 4.00 | NA | 0.50 | ||||||||||
| Average | 9.23 | 11.20 | 11.16 | 4.00 | 13.86 | |||||||||||||
| Median | 8.95 | 12.44 | 13.32 | 4.00 | 8.40 | |||||||||||||
Source: SNL Securities, data as of 5/28/2010
No adjustment is given for subscription interest. There are 9 MHCs currently in the subscription phase of their second step process. The success or failure of these companies may result in a future adjustment.
| Conversion Valuation Appraisal Report | Page: 66 | |
VALUATION ADJUSTMENTS
Relative to the Comparables the following adjustments need to be made to the Bank’s pro forma market value.
Valuation Factor | Valuation Adjustment | |
| Financial Condition | Slight Upward | |
| Asset Quality | Strong Downward | |
| Balance Sheet Growth | Moderate Upward | |
| Earnings Quality, Predictability and Growth | Moderate Downward | |
| Market Area | No Adjustment | |
| Dividends | No Adjustment | |
| Liquidity of the Issue | Slight Downward | |
| Recent Regulatory Matters | No Adjustment | |
Additionally, the following adjustment should be made to the Bank’s market value.
Valuation Factor | Valuation Adjustment | |
Management | No Adjustment | |
Subscription Interest | No Adjustment | |
| Conversion Valuation Appraisal Report | Page: 67 | |
| 6. | Valuation |
In applying the accepted valuation methodology promulgated by the regulators, i.e., the pro forma market value approach, three key pricing multiples were considered. The four multiples include:
Price to core earnings (“P/E”)
Price to book value (“P/B”) / Price to tangible book value (“P/TB”)
Price to assets (“P/A”)
All of the approaches were calculated on a pro forma basis including the effects of the conversion proceeds. All of the assumptions utilized are presented in Exhibit 13.
DISCUSSIONOF WEIGHT GIVENTO VALUATION MULTIPLES
To ascertain the pro forma estimated market value of the Bank, the market multiples for the Comparable Group were utilized. As a secondary check, all publicly traded thrifts and the recent and historical conversions were assessed. The multiples for the Comparable Group, all publicly traded thrifts are shown in Exhibit 9.
Price to Earnings – According to the Appraisal Guidelines: “When both the converting institution and the comparable companies are recording “normal” earnings. A P/E approach may be the simplest and most direct method of valuation. When earnings are low or negative, however, this approach may not be appropriate and the greater consideration should be given to the P/BV approach.” In this particular case, the Bank’s earnings are skewed by credit costs. As such, this approach was given limited consideration in this appraisal.
In the pro forma figures for the Bank, FinPro incorporated the impact of SFAS 123, which requires the expensing of stock options. In preparing the fully converted pro forma figures for the Comparable Group, FinPro also incorporated the impact of SFAS 123.
| Conversion Valuation Appraisal Report | Page: 68 | |
Price to Book/Price to Tangible Book– According to the Appraisal Guidelines: “The P/BV approach works best when the converting institution and the Comparables have a normal amount of book value. The P/BV approach could seriously understate the value of an institution that has almost no book value but has an outstanding future earnings potential. For converting institutions with high net worth, the appraiser may have difficulty in arriving at a pro forma market value because of pressure placed on the P/E multiple as higher P/BV levels are required to reflect a similar P/BV ratio as the peer group average. The P/BV approach also suffers from the use of historical cost accounting data.”
Since thrift earnings in general have had a high degree of volatility, the P/B is utilized frequently as the benchmark for market value. A better approach is the P/TB approach. In general, investors tend to price financial institutions on a tangible book basis, because it incorporates the P/B approach adjusted for intangibles. Initially following conversion, FinPro believes that thrifts often trade on a price to tangible book basis.
Price to Assets– According to the Appraisal Guidelines: “This approach remedies the problems of a small base that can occur with the P/BV approach, but the approach has many of the other limitations of the latter approach (the P/BV approach).” FinPro places little weight on this valuation approach due to the lack of consideration of asset and funding mixes and the resulting earnings impact.
| Conversion Valuation Appraisal Report | Page: 69 | |
FULL OFFERING VALUEIN RELATIONTO COMPARABLES
Based upon the adjustments defined in the previous section, the Bank is pricing at the midpoint as a standard conversion is estimated to be $61,824,590. Based upon a range below and above the midpoint value, the respective values are $54,016,800 at the minimum and $69,632,380 at the maximum respectively. At the super maximum of the range, the offering value would be $78,611,340. At the minimum as adjusted of the range, the offering value would be $50,064,300.
At the various levels of the estimated value range, the full offering would result in the following offering data:
FIGURE 36 - VALUE RANGE
Conclusion | Total Shares Shares | Price Per Share | Total Value | |||||
Appraised Value - Midpoint | 6,182,459 | $ | 10.00 | $ | 61,824,590 | |||
Range: | ||||||||
- Minimum, Adj. | 5,006,430 | $ | 10.00 | 50,064,300 | ||||
- Minimum | 5,401,680 | 10.00 | 54,016,800 | |||||
- Maximum | 6,963,238 | 10.00 | 69,632,380 | |||||
- Super Maximum | 7,861,134 | 10.00 | 78,611,340 | |||||
Source: FinPro Inc. Pro forma Model
FIGURE 37 - APPRAISED VALUE
| Appraised Value | ||||||||||||||||||||
| Conclusion | Minimum, Adj. | Minimum | Midpoint | Maximum | SuperMaximum * | |||||||||||||||
Total Shares | 5,006,430 | 5,401,680 | 6,182,459 | 6,963,238 | 7,861,134 | |||||||||||||||
Price per Share | $ | 10 | $ | 10 | $ | 10 | $ | 10 | $ | 10 | ||||||||||
Full Conversion Value | $ | 50,064,300 | $ | 54,016,800 | $ | 61,824,590 | $ | 69,632,380 | $ | 78,611,340 | ||||||||||
Exchange Shares | 1,789,416 | 1,789,416 | 2,105,195 | 2,420,974 | 2,784,120 | |||||||||||||||
Exchange Percent | 35.74 | % | 33.13 | % | 34.05 | % | 34.77 | % | 35.42 | % | ||||||||||
Conversion Shares | 2,635,000 | 2,635,000 | 3,100,000 | 3,565,000 | 4,099,750 | |||||||||||||||
Conversion Percent | 52.63 | % | 48.78 | % | 50.14 | % | 51.20 | % | 52.15 | % | ||||||||||
Merger Shares | 582,014 | 977,264 | 977,264 | 977,264 | 977,264 | |||||||||||||||
Merger Percent | 11.63 | % | 18.09 | % | 15.81 | % | 14.03 | % | 12.43 | % | ||||||||||
Gross Proceeds | $ | 22,397,500 | $ | 26,350,000 | $ | 31,000,000 | $ | 35,650,000 | $ | 40,997,500 | ||||||||||
Exchange Value | $ | 17,894,160 | $ | 17,894,160 | $ | 21,051,950 | $ | 24,209,740 | $ | 27,841,200 | ||||||||||
Exchange Ratio | 0.6300 | 0.6300 | 0.7412 | 0.8524 | 0.9802 | |||||||||||||||
Exchange Value per Minority Share | $ | 6.30 | $ | 6.30 | $ | 7.41 | $ | 8.52 | $ | 9.80 | ||||||||||
| * | SuperMaximum is an overallotment option that is 15% above the maximum amount. |
The appraised value of the institution resulted in an exchange value per minority share that ranges from $6.30 per share at the minimum to $9.80 per share at the super maximum, with an exchange value per share of $7.41 at the midpoint.
| Conversion Valuation Appraisal Report | Page: 70 | |
FIGURE 38 - CONVERSION OFFERING PRICING MULTIPLES
| Bank | Comparables | State | National | ||||||||||||||||||||
| Mean | Median | Mean | Median | Mean | Median | ||||||||||||||||||
| Min Adj | 34.48 | ||||||||||||||||||||||
| Min | 35.71 | ||||||||||||||||||||||
Price-Core Earnings Ratio P/E | Mid | 41.67 | 21.94 | 16.70 | 32.15 | 32.15 | 23.99 | 15.60 | |||||||||||||||
| Max | 47.62 | ||||||||||||||||||||||
| Smax | 52.63 | ||||||||||||||||||||||
| Min Adj | 63.78 | % | |||||||||||||||||||||
| Min | 65.66 | % | |||||||||||||||||||||
Price-to-Book Ratio P/B | Mid | 71.58 | % | 84.48 | % | 83.70 | % | 89.45 | % | 89.45 | % | 76.58 | % | 75.30 | % | ||||||||
| Max | 76.98 | % | |||||||||||||||||||||
| Smax | 82.64 | % | |||||||||||||||||||||
| Min Adj | 67.98 | % | |||||||||||||||||||||
| Min | 69.74 | % | |||||||||||||||||||||
Price-to-Tangible Book Ratio P/TB | Mid | 75.87 | % | 90.35 | % | 88.90 | % | 138.90 | % | 138.90 | % | 85.18 | % | 79.55 | % | ||||||||
| Max | 81.37 | % | |||||||||||||||||||||
| Smax | 87.11 | % | |||||||||||||||||||||
| Min Adj | 7.00 | % | |||||||||||||||||||||
| Min | 7.51 | % | |||||||||||||||||||||
Price-to-Assets Ratio P/A | Mid | 8.55 | % | 10.45 | % | 9.10 | % | 19.06 | % | 19.06 | % | 8.31 | % | 6.85 | % | ||||||||
| Max | 9.58 | % | |||||||||||||||||||||
| Smax | 10.74 | % | |||||||||||||||||||||
Source: FinPro Calculations
FIGURE 39 - COMPARABLE CONVERSION PRICING MULTIPLESTOTHE BANK’S PRO FORMA MIDPOINT
| Price Relative to | ||||||||||||||
| Earnings | Core Earnings | Book | Tangible Book | Assets | ||||||||||
The Bank (at midpoint) Full Conversion | NM | 41.67 | 71.58 | % | 75.87 | % | 8.55 | % | ||||||
Comparable Group Median | 12.50 | 16.70 | 83.70 | % | 88.90 | % | 9.10 | % | ||||||
(Discount) Premium | NA | 149.52 | % | -14.48 | % | -14.66 | % | -5.99 | % | |||||
Source: SNL data, FinPro Calculations
As Figure 39 demonstrates, at the midpoint of the estimated valuation range the Bank is priced at a 14.66% discount to the Comparable Group on a tangible book basis.
FIGURE 40 - COMPARABLE CONVERSION PRICING MULTIPLESTOTHE BANK’S PRO FORMA SUPER MAXIMUM
| Price Relative to | ||||||||||||||
| Earnings | Core Earnings | Book | Tangible Book | Assets | ||||||||||
The Bank (at the supermax) Full Conversion | NM | 52.63 | 82.64 | % | 87.11 | % | 10.74 | % | ||||||
Comparable Group Median | 12.50 | 16.70 | 83.70 | % | 88.90 | % | 9.10 | % | ||||||
(Discount) Premium | NA | 215.15 | % | -1.27 | % | -2.01 | % | 18.09 | % | |||||
Source: SNL data, FinPro Calculations
As Figure 40 demonstrates, at the super maximum of the estimated valuation range the Bank is priced at a 2.01% discount to the Comparable Group on a tangible book basis.
| Conversion Valuation Appraisal Report | Page: 71 | |
FIGURE 41 - COMPARABLE CONVERSION PRICING MULTIPLESTOTHE BANK’S PRO FORMA MINIMUM
| Price Relative to | ||||||||||||||
| Earnings | Core Earnings | Book | Tangible Book | Assets | ||||||||||
The Bank (at the minimum) Full Conversion | NM | 35.71 | 65.66 | % | 69.74 | % | 7.51 | % | ||||||
Comparable Group Median | 12.50 | 16.70 | 83.70 | % | 88.90 | % | 9.10 | % | ||||||
(Discount) Premium | NA | 113.83 | % | -21.55 | % | -21.55 | % | -17.43 | % | |||||
Source: SNL data, FinPro Calculations
As Figure 41 demonstrates, at the minimum of the estimated valuation range the Bank is priced at a 21.55% discount to the Comparable Group on a tangible book basis.
| Conversion Valuation Appraisal Report | Page: 72 | |
COMPARISONTOOTHER PENDING SECOND STEP CONVERSIONS
As Figure 42 demonstrates, the Bank’s offering price to tangible book value per share range is in between the high end and low end of the pending second step conversion comparable tangible book basis. The Bank is priced between 69.74% and 87.11% of tangible book value per share.
FIGURE 42 - COMPARISONTOOTHER PENDING SECOND STEP CONVERSIONS
Ticker | Institution | State | Type | Gross Proceeds ($) | Price/ TBVS Range (%) | ||||||
ORIT | Oritani Financial Corp | NJ | Second Step | $ | 515,775 | 82.44 - 98.52 | |||||
FFCO | FedFirst Financial Corp. | PA | Second Step | 29,756 | 57.67 - 76.69 | ||||||
ONFC | Oneida Financial Corp. | NY | Second Step | 41,659 | 89.49 - 112.04 | ||||||
JXSB | Jacksonville Bancorp | IL | Second Step | 15,539 | 58.28 - 77.88 | ||||||
VPFG | ViewPoint Financial Group | TX | Second Step | 264,500 | 86.00 - 108.70 | ||||||
FXCB | Fox Chase Bancorp, Inc. (MHC) | PA | Second Step | 133,556 | 72.62 - 92.85 | ||||||
COBK | Colonial Financial Services | NJ | Second Step | 35,708 | 64.68 - 85.76 | ||||||
CFFN | Capitol Federal Financial Inc. | KS | Second Step | 2,127,500 | 95.42 - 106.16 | ||||||
KFFG | Kaiser Federal Financial | CA | Second Step | 105,800 | 69.83 - 88.81 | ||||||
NVSL | Naugatuck Valley Financial (MHC) | CT | Second Step | $ | 35,650 | 69.74 - 87.11 | |||||
Source: SNL Securities, FinPro calculations
| * | Offering data is presented at the supermax for all deal; Price/Tangible Book Range presents values at the minimum and supermax |
| Conversion Valuation Appraisal Report | Page: 73 | |
COMPARISONOFTHE EXCHANGE VALUEAND STOCK PRICE
FIGURE 43 - COMPARISONOFTHE EXCHANGE VALUE PER MINORITY SHAREAND STOCK PRICE
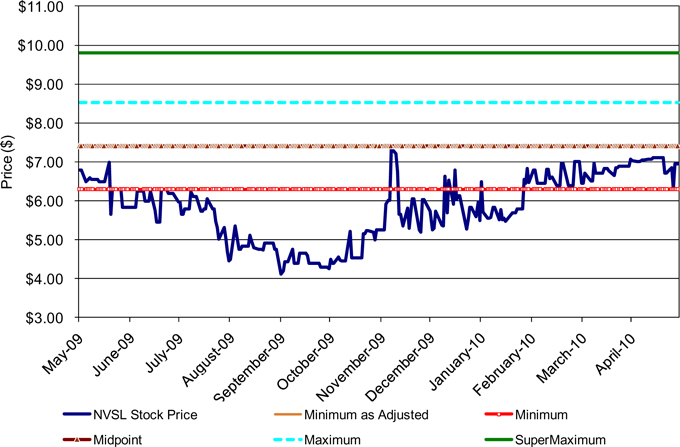
Source: SNL data, FinPro Calculations
As Figure 43 demonstrates, the Bank’s stock price is currently between the minimum and the midpoint of the range.
| Conversion Valuation Appraisal Report | Page: 74 | |
VALUATION CONCLUSION
We believe that the discount on a tangible book basis at the midpoint is appropriate relative to the Comparable Group. The resulting pro forma multiples are inline with other pending offerings.
It is, therefore, FinPro’s opinion that as of May 28, 2010, the estimated pro forma market value of the Bank in a full offering was $61,824,590 at the midpoint of a range with a minimum of $54,016,800 to a maximum of $69,632,380 at 15% below and 15% above the midpoint of the range respectively. Assuming an adjusted maximum value of 15% above the maximum value, the adjusted maximum value or super maximum value in a full offering is $78,611,340. Assuming an adjusted minimum value, the value in a full offering is $50,064,300.
The document represents an initial valuation for the Bank. Due to the duration of time that passes between the time this document is compiled and the time the offering closes, numerous factors could lead FinPro to update or revise the appraised value of the Bank. Some factors that could lead FinPro to adjust the appraised value include: (1) changes in the Bank’s operations and financial condition; (2) changes in the market valuation or financial condition of the Comparable Group; (3) changes in the broader market; and (4) changes in the market for thrift conversions. Should there be material changes to any of these factors, FinPro will prepare an appraisal update to appropriately adjust the value of the Bank. At the time of closing, FinPro will prepare a final appraisal to determine if the valuation range is still appropriate and determine the exact valuation amount appropriate for the Bank.
EXHIBITS
OMITTED
IN ACCORDANCE WITH RULE 202 OF REGULATION S-T, THESE EXHIBITS ARE BEING FILED IN PAPER PURSUANT TO A CONTINUING HARDSHIP EXEMPTION.