 2 nd Step Conversion and Offering June 2011 Issuer Free Writing Prospectus Filed pursuant to Rule 433 Registration No. 333-167482 |
 Legal Matters This presentation is for informational purposes only and does not constitute an offer to sell nor a solicitation of an offer to buy shares of common stock of Naugatuck Valley Financial Corporation. The offer is made only by the prospectus. The conversion involves the formation of a new holding company for Naugatuck Valley Savings and Loan, which is also called Naugatuck Valley Financial Corporation, a Maryland corporation (“New Naugatuck Valley Financial”), the exchange of shares of New Naugatuck Valley Financial for the shares of Naugatuck Valley Financial and the sale by New Naugatuck Valley Financial shares of common stock. Please refer to the prospectus dated May 13, 2011 New Naugatuck Valley Financial has filed a registration statement (including a prospectus) with the Securities and Exchange Commission (SEC) for the offering to which this presentation relates. Before you invest, you should read the prospectus and other documents filed with the registration statement for more complete information about Naugatuck Valley Financial Corporation and the offering. You may obtain these documents for free by visiting EDGAR on the SEC Website at www.sec.gov. The shares of common stock of New Naugatuck Valley Financial are not deposits or savings accounts and are not insured or guaranteed by the Federal Deposit Insurance Corporation or any other government agency. 2 |
 Forward Looking Statements 3 This presentation contains forward-looking statements, which can be identified by the use of words such as “believes,” “expects,” “anticipates,” “estimates” or similar expressions. Forward-looking statements include, but are not limited to: statements of our goals, intentions and expectations; statements regarding our business plans, prospects, growth and operating strategies; statements regarding the quality of our loan and investment portfolios; and estimates of our risks and future costs and benefits. These forward-looking statements are subject to significant risks and uncertainties. Actual results may differ materially from those contemplated by the forward-looking statements due to, among others, the following factors: general economic conditions, either nationally or in our market area, that are worse than expected; changes in the interest rate environment that reduce our interest margins or reduce the fair value of financial instruments; increased competitive pressures among financial services companies; changes in consumer spending, borrowing and savings habits; legislative or regulatory changes that adversely affect our business; adverse changes in the securities markets; and changes in accounting policies and practices, as may be adopted by the bank regulatory agencies or the Financial Accounting Standards Board. Any of the forward-looking statements that we make in this presentation may later prove incorrect because of inaccurate assumptions, the factors illustrated above or other factors that we cannot foresee. Consequently, no forward-looking statement can be guaranteed. Further information on other factors that could affect us are included in the section captioned “Risk Factors” in the prospectus. |
 Offering Summary Issuer: Naugatuck Valley Financial Corporation Listing / Ticker: NASDAQ / “NVSLD” (1) Price Per Share: $8.00 Shares Offered: 4,173,008 Gross Proceeds: $33.4 million Exchange Ratio: 0.9978 Price/ Tangible Book Value: 69.19% Expected Dividend Yield: 1.5% (2) Expected Closing Date/ Expected Trading Date: June 29, 2011 / June 30, 2011 4 (1) New Naugatuck Valley Financial’s common stock will trade on the Nasdaq Global Market under the trading symbol “NVSLD” for a period of 20 trading days after the completion of the offering. Thereafter the trading symbol will be “NVSL.” (2) Annualized and based upon the $8.00 per share offering price. |
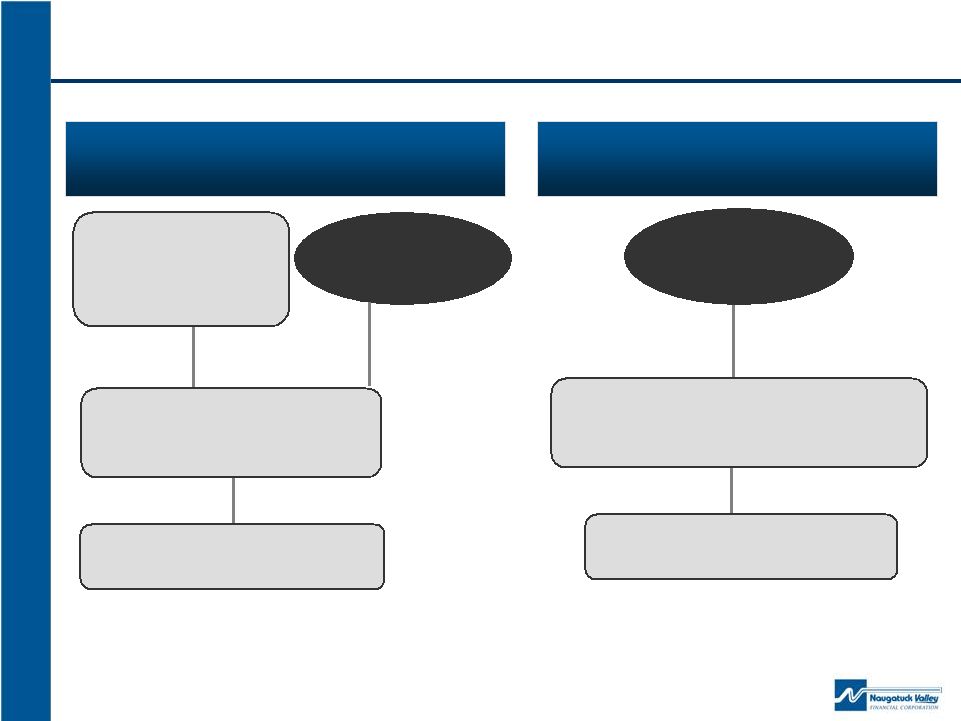 Naugatuck Valley Mutual Holding Company (owns 59.6% of common stock) Overview of Organizational Structure Public Stockholders (1) (own 40.4% of common stock) Naugatuck Valley Savings and Loan Naugatuck Valley Financial Corporation (100% of the common stock) Naugatuck Valley Savings and Loan Public Stockholders (2) (own 100% of common stock) Naugatuck Valley Financial Corporation (100% of the common stock) 5 Structure Following Conversion and Offering Current Structure (1) The Naugatuck Valley Savings and Loan Foundation owns approximately 1.8% of the current outstanding shares of Naugatuck Valley Financial common stock. (2) Upon completion of the offering, the Naugatuck Valley Savings and Loan Foundation will continue to own approximately 1.8% of the outstanding shares of New Naugatuck Valley Financial common stock. No stock or cash contribution will be made to the charitable foundation in connection with the conversion and offering. |
 Rationale for Conversion and Offering – Why Now? To increase Naugatuck’s already “well capitalized” capital position: Increase lending opportunities Continue to support operational growth Enhance existing lines of businesses, products and services Better positioned in view of anticipated future regulatory capital requirements Increase liquidity in Naugatuck's common stock More flexible capital management tools: Facilitate stock repurchases Facilitate continued payment of cash dividends Facilitate and pursue acquisition opportunities: Consolidation opportunities in current and new markets The conversion will remove the uncertainties associated with the mutual holding company structure created by the recently enacted financial reform legislation. 6 |
 Company Overview |
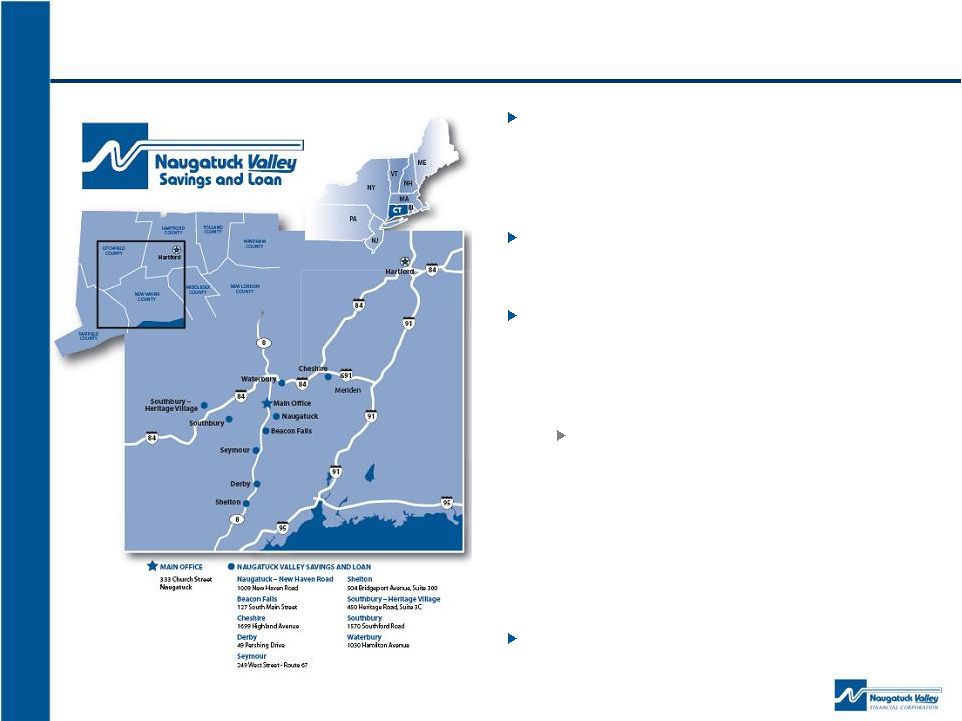 Company Profile and Overview Naugatuck Valley Savings and Loan is a community bank headquartered in Naugatuck, Connecticut, which is located in southwestern Connecticut approximately six miles south of Waterbury, CT and 26 miles north of Bridgeport, CT Completed Mutual Holding Company reorganization and Initial Public Offering of $32.7 million in May of 2004 Operate nine branch offices in the greater Naugatuck Valley market in Connecticut which we consider our market area (encompasses the communities in the central and lower Naugatuck Valley regions in New Haven County) and one branch in Fairfield County Connecticut is one of the most attractive banking markets in the United States with a total population of approximately 3.5 million, the highest per capita income of $36,065 in the United States and a median household income of $70,340 as of June 30, 2010, ranking second in the United States and well above the U.S. median household income of $54,442, according to SNL Financial As of March 31, 2011, Naugatuck had $564.1 million in total assets, $414.1 million in total deposits and shareholders’ equity of $52.4 million Source: Company filings, SNL Financial. 8 |
   Attractive and Stable Market Area Naugatuck's primary market area encompasses the communities in the central and lower Naugatuck Valley regions in New Haven and Fairfield Counties in Connecticut: Total population: 1.8 million Total households: 660,000 with projected 2010-2015 household income growth rates between 17% to 18%, which exceeds the Connecticut average of 15% and the National average of 12% Primary market area exhibits generally favorable demographic characteristics Diverse economy that contains a highly-educated and skilled labor force. The economy in our market area is primarily oriented to the service, retail, construction, and manufacturing industries. Major employers include: Pratt &Whitney, Yale University, Sikorsky and City of New Haven Our market area is also a major education center with colleges and universities which include: Yale University, Quinnipiac University, University of New Haven, Sacred Heart University, Fairfield University and Post University 9 Median Per Unemployment Household Capita County Rate Income Income New Haven 9.9% $62,374 $30,479 Fairfield 8.2% $87,754 $47,705 Connecticut 9.1% $70,340 $36,065 US 9.1% $54,442 $26,739 Source: SNL Financial as of 6/30/2010. U.S. Department of Labor statistics reflect most recently available data through 6/23/2011, seasonally adjusted. |
  Experienced Management Team Naugatuck's management team is comprised of experienced professionals who have significant banking experience and expertise in Naugatuck's primary market area Pro forma for offering, management and board will own approximately 3.9% of shares outstanding 10 Years w/ Years of Name Age Position Naugatuck Experience John C. Roman 57 President and Chief Executive Officer 13 39 Dominic J. Alegi, Jr. 64 Executive Vice President 41 46 Mark S. Graveline 54 Chief Lending Officer 6 29 William C. Nimons 64 Senior Vice President 10 35 Lee R. Schlesinger 50 Chief Financial Officer 28 28 |
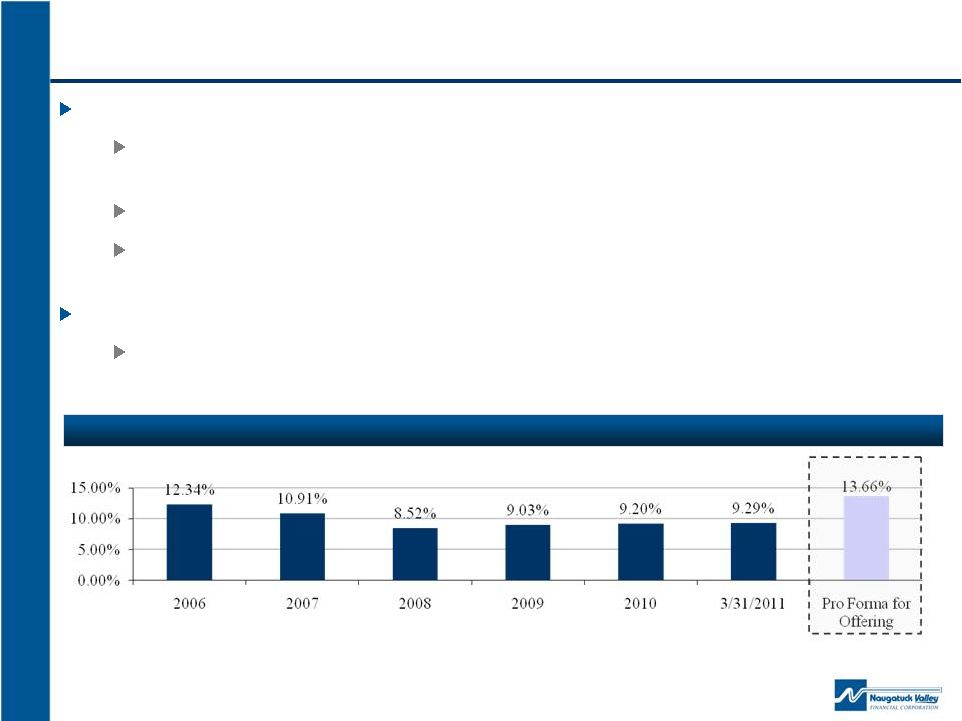 Shareholder Oriented Capital Management Dividend Payments Paid quarterly cash dividends for 26 consecutive quarters starting in January 2005 after IPO in May 2004 Through March 31, 2011, trailing twelve month dividend payout of 54.5% Naugatuck expects to continue its current quarterly cash dividend of $0.03 per share or $0.12 annualized after the conversion and offering (1) Stock repurchase plans Since May 2006 through March 31, 2011, Naugatuck repurchased a total of 585,988 shares at a total cost of $6.1 million and an average cost of $10.47 per share 11 Source: Company filings (1) The rate of such dividends will be in the discretion of the board of directors and will depend upon a number of factors. No assurance can be given that payment of dividends will continue in the future or that they will not be reduced in the future. Total Equity to Total Assets |
 Financial Highlights |
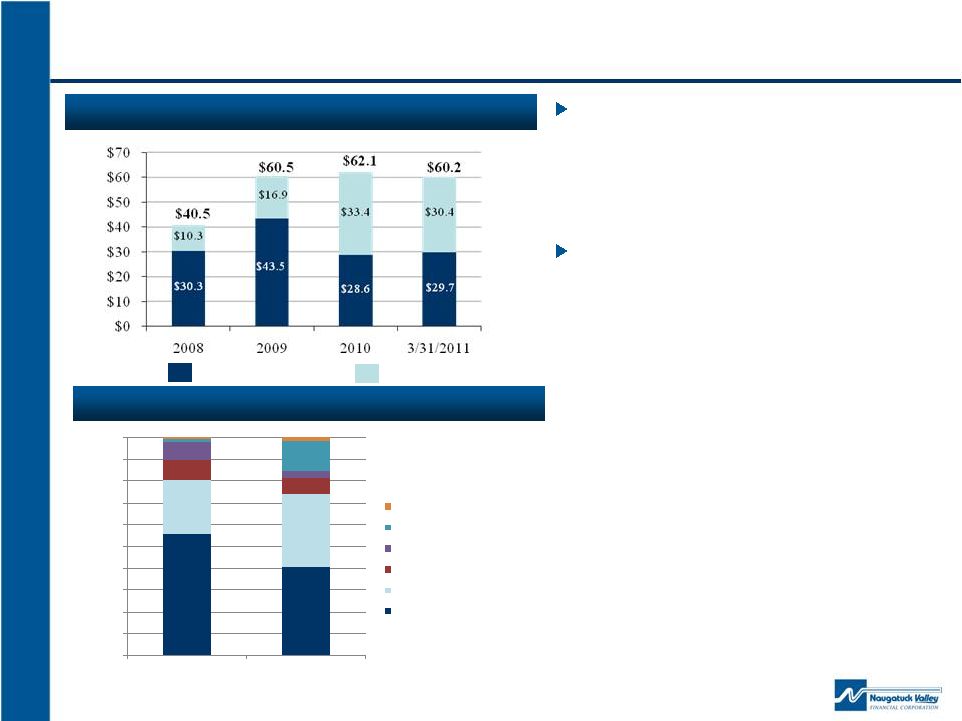
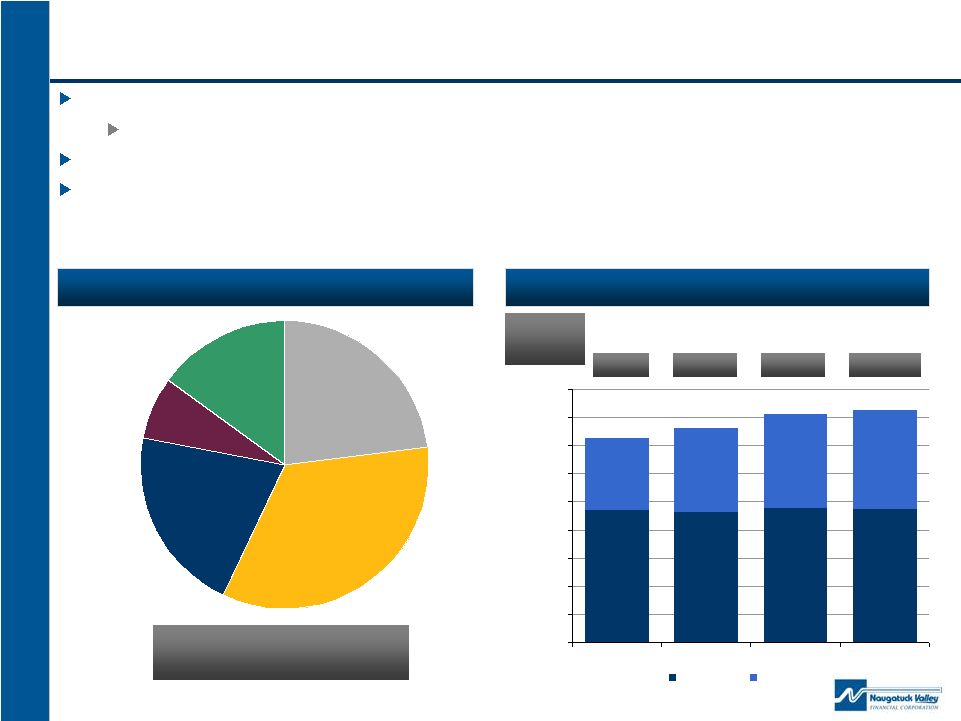
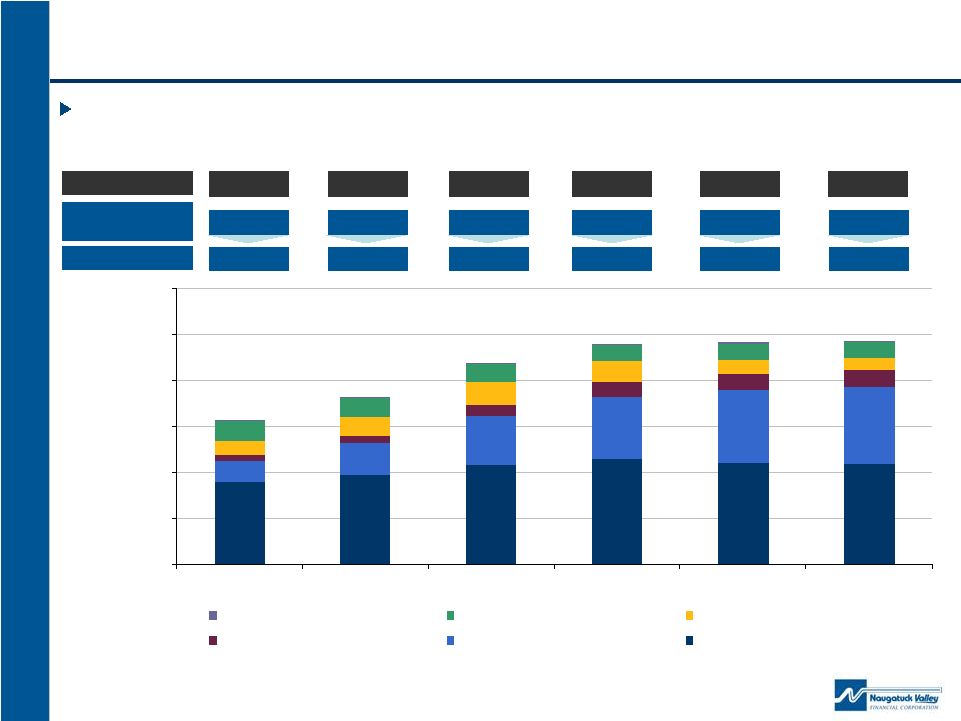 $0 $100 $200 $300 $400 $500 $600 12/31/2006 12/31/2007 12/31/2008 12/31/2009 12/31/2010 3/31/2011 Other Consumer Home equity Construction Commercial business loans Multi-family and CRE 1-4 Family Prudent and Stable Loan Growth Naugatuck has implemented a balanced loan growth strategy over the past few years with a focus on commercial loans Source: Company filings 13 $59.4 $86.7 $128.6 $166.2 $195.0 $204.8 Multi-family & CRE, Commercial Business $313.2 $364.0 $436.7 $481.1 $481.4 $484.9 Gross Loans ($MM) 19.0% 23.8% 29.4% 34.5% 40.5% 42.2% as a % of total loans |
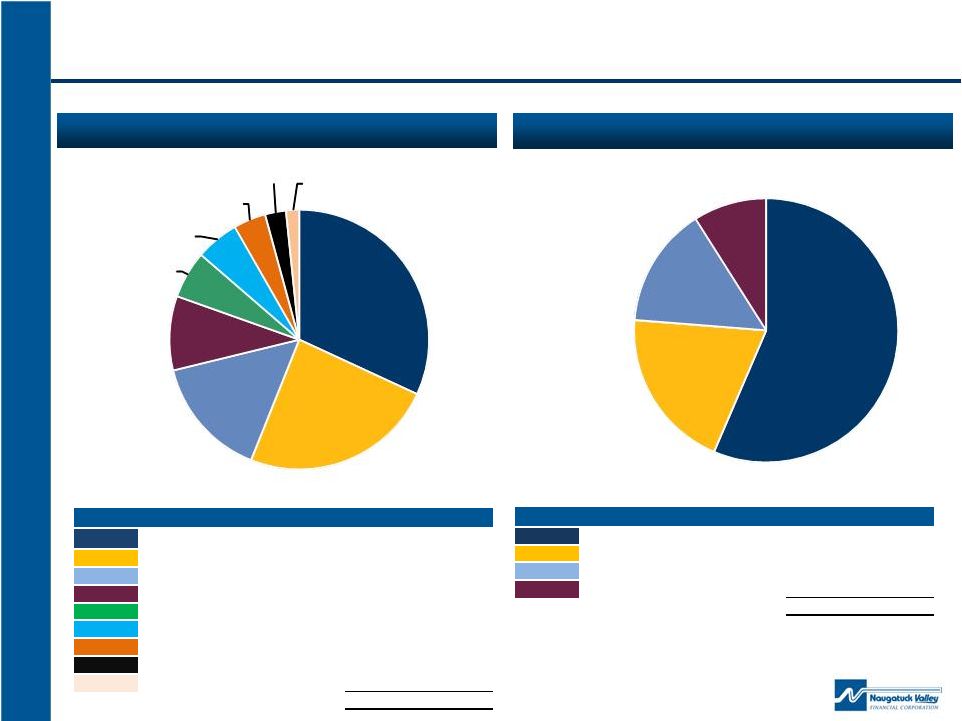 Commercial and Construction Concentrations Commercial Real Estate Concentration Construction Concentration 14 Source: Company filings As of 3/31/2011 $MM % Retail Space $54 32% Industrial/warehouse 40 24% Office 25 15% Other Mortgage 16 9% Multifamily 10 6% Restaurant 9 5% Mixed use (retail/residential) 7 4% Land Development 4 3% Non-profit 3 2% $168 100% $MM % Land and Residential Development $16 56% 1-4 Family Construction (spec) 5 20% Commercial Construction 4 15% Residential Construction (non spec) 2 9% $27 100% Retail Space 32% Industrial/warehouse 24% Office 15% Other Mortgage 9% Multifamily 6% Restaurant 5% Mixed use (retail/residential) 4% Land Development 3% Non -profit 2% Land and Residential Development 56% 1-4 Family Construction (spec) 20% Commercial Construction 15% Residential Construction (non spec) 9% |
 Stabilizing Asset Quality 15 Our credit risk strategy focuses on having well-defined credit policies and uniform underwriting criteria and providing prompt attention to potential problem loans In response to the economic downturn and prevailing market conditions, we are proactively addressing the increase in problem assets by: Implementing and monitoring construction and commercial concentration limits (as a percentage of total risk-based capital) Applying more stringent loan-to-value ratio requirements and debt service coverage ratio requirements Providing more attention and resources on loan workouts and modifications with delinquent borrowers Creating an Asset Quality Committee comprised of executive management and members of the board to review and resolve problem assets in a manner most advantageous to the institution Charge offs have not exceeded 20bps since 2006 (1) (1) Source: Company filings 1) Three months ended March 31, 2011 net charge offs and ncos/ avg. loans annualized for comparative purposes. Year Ended December 31, March 31, (Dollars in thousands) 2006 2007 2008 2009 2010 Delinquent Loans Past Due 31 - 60 days 1,278 $ 1,021 $ 1,654 $ 4,618 $ 6,668 $ 3,131 $ Delinquent Loans Past Due 61 - 90 days 1,371 1,653 735 3,228 491 954 Accruing Loans Past Due 90 days or More - - - - - - Total Non-Accruing Loans 2,010 970 2,678 5,526 11,127 10,524 Troubled debt restructurings (TDRs) - - - 474 6,761 6,616 Total Non-Performing Loans 2,010 970 2,678 6,000 17,888 17,140 REO and Other Repossessed Assets - - - 140 421 528 Total NPAs 2,010 970 2,678 6,140 18,309 17,668 Loan Loss Reserves 2,071 2,163 2,869 3,996 6,393 6,684 NPAs / Assets 0.49% 0.21% 0.50% 1.10% 3.22% 3.13% NPLs / Loans 0.65% 0.27% 0.62% 1.26% 3.73% 3.54% LLR / Gross Loans 0.67% 0.60% 0.66% 2011 0.84% 1.33% 1.38% LLR / NPLs 103.03% 222.99% 107.13% 66.60% 35.74% 39.00% Net Charge-offs (Recoveries) (1) $ 59 $ (31) $ 17 $ 963 $ 588 $ NCOs (Recoveries) / Avg. Loans 0.00% 0.02% (0.01%) 0.00% 0.20% 0.12% |
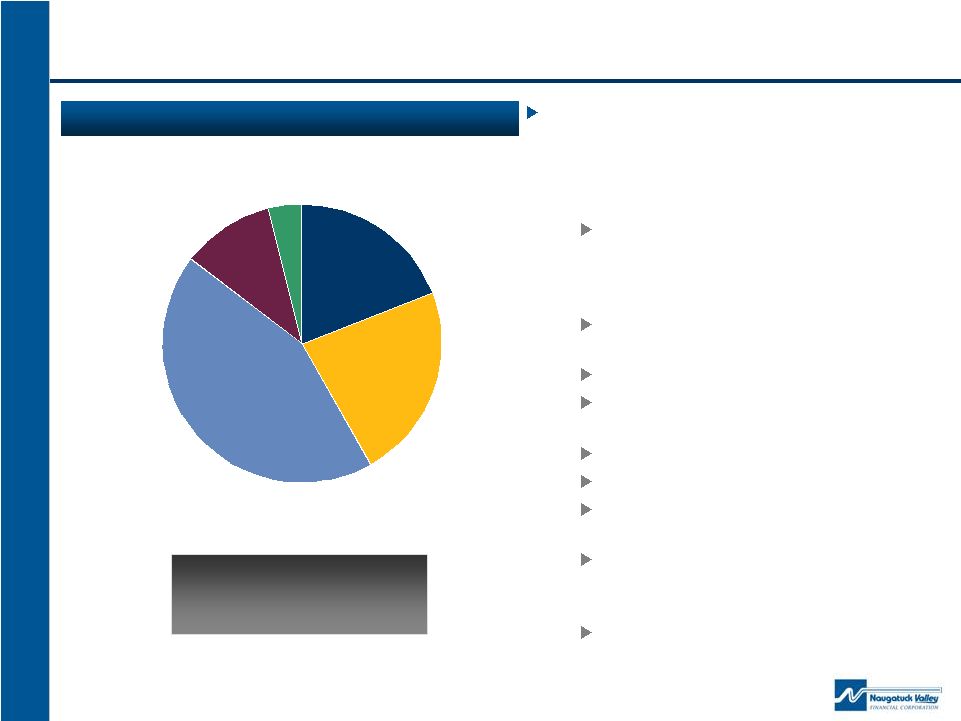
 0% 10% 20% 30% 40% 50% 60% 70% 80% 90% 100% Special Mention Substandard Consumer Loans Residential Other Assets Commercial Business Construction Mutli-family and CRE Classified Assets Classified assets totaled $60.2 million at March 31, 2011, a decrease of 3.0% from December 31, 2010 primarily due to improvement in our commercial and construction portfolios At March 31, 2011, $17.7 million of classified assets were nonperforming assets, compared to $18.3 million at December 31, 2010 Classified Assets Trend ($MM) 16 Special Mention Substandard (1) (1) (1) (1) Source: Company filings 1) Includes doubtful assets of $4,000, $37,000, $111,000 and $95,000 at December 31, 2008, 2009 and 2010, and 3/31/2011 respectively. Composition of Classified Assets as of 3/31/2011 |
 Non-Accrual Loan Composition At March 31, 2011, 65% of our non-accrual loans (excluding troubled debt restructurings) (1) consisted of 14 relationships, with an aggregate outstanding balance of $6.8 million, which mainly consisted of: $2.2 million commercial real estate loan to an auto dealership with an SBA guaranty of 90% on $1.5 million portion of the loans 4 mixed use restaurant and residential property relationships totaling $1.1 million $880,000 land development relationship 3 single family construction relationships totaling $628,294 $464,947 condo conversion relationship $445,112 office building relationship $417,321 industrial and residential development relationship $404,126 medical supply company relationship secured by second mortgage on residential real estate $271,768 auto repair/speed shop and residential property relationship Non-Accrual Loans (1) as of 3/31/2011 17 Total Non-Accrual Loans (1) $10.5MM 1-4 family 19% Construction 23% Multi-family and CRE 45% Commercial business 9% Consumer 4% Source: Company filings 1) Excludes $6.6 million of TDRs of which 89% were performing in accordance with their modified terms. However, under current accounting guidelines, such loans were classified as non-accrual loans. |
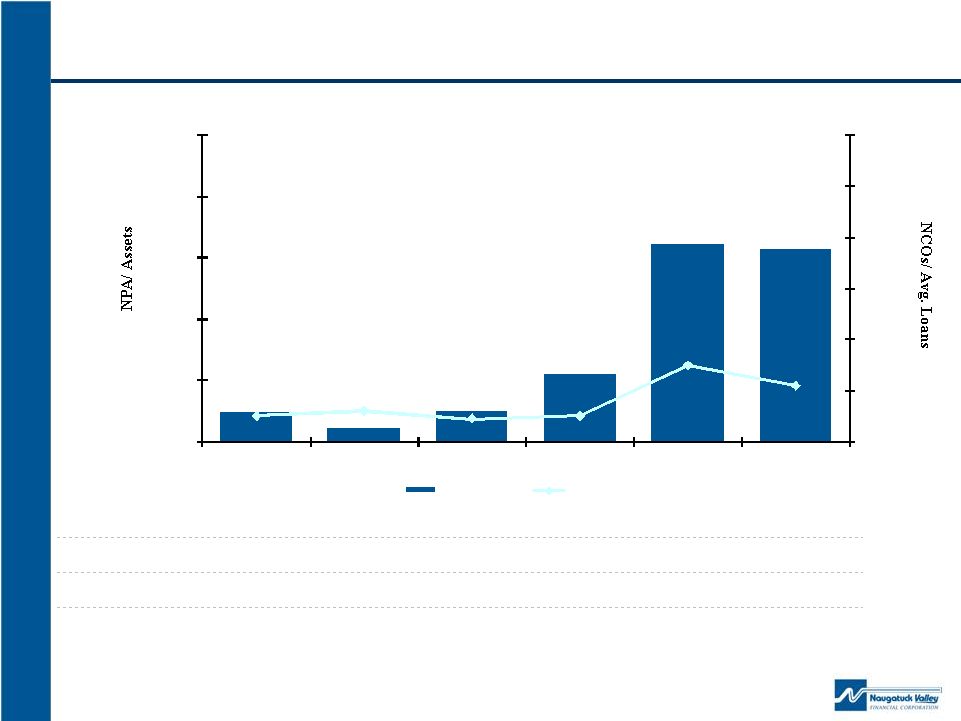 Prudent Underwriting Standards 18 Reserves/ Loans 0.67% 0.60% 0.66% 0.84% 1.33% 1.38% Reserves/ NPLs 103.03% 222.99% 107.13% 66.60% 35.74% 39.00% Provisions/ Avg. Loans 0.07% 0.05% 0.16% 0.26% 0.70% 0.37% Provision for loan losses to net charge offs NM 2.56x NM 67.29x 3.49x 2.98x (2) (2) (2) Source: Company filings 1) Not Meaningful (‘NM’) due recoveries or net charge offs. 2) Three months ended March 31, 2011 ncos/ avg. loans, provisions/ avg. loans, and provisions/ ncos annualized for comparative purposes. (1) (1) 0.49% 0.21% 0.50% 1.10% 3.22% 3.13% 0.00% 0.02% -0.01% 0.00% 0.20% 0.12% -0.10% 0.10% 0.30% 0.50% 0.70% 0.90% 1.10% 0.00% 1.00% 2.00% 3.00% 4.00% 5.00% 2006 2007 2008 2009 2010 3/31/2011 NPAs / Assets NCOs / Avg. Loans |
 Certificates >$100k 23% Certificates <$100k 34% Savings 21% Money Market 7% Transaction 15% Improved Funding Base and Deposit Growth 19 Deposit Composition as of 3/31/2011 Historical Deposit Growth Dollars in thousands 19 2.68% Avg. Cost of Int. Bearing Deposits 2.24% 1.83% 1.70% $235,764 $231,905 $239,406 $237,055 $127,262 $149,026 $166,469 $177,025 $0 $50,000 $100,000 $150,000 $200,000 $250,000 $300,000 $350,000 $400,000 $450,000 12/31/2008 12/31/2009 12/31/2010 3/31/2011 Time Non-Time Total Deposits $414.1MM Naugatuck's core deposit strategy has improved its funding mix and reduced its reliance on borrowings Borrowed funds have decreased 21.6% from December 31, 2008 to March 31, 2011 Total deposits have grown 14.1% since December 31, 2008 $50.0 million (1) of above market, promotional rate certificates of deposit scheduled to mature between May 1, 2011 and August 31, 2011. These certificates were offered in conjunction with the opening of our Heritage Village branch office and we expect a substantial portion to be rolled into new lower rate certificates of deposit or other short term deposits Source: Company filings 1) As of December 31, 2010 |
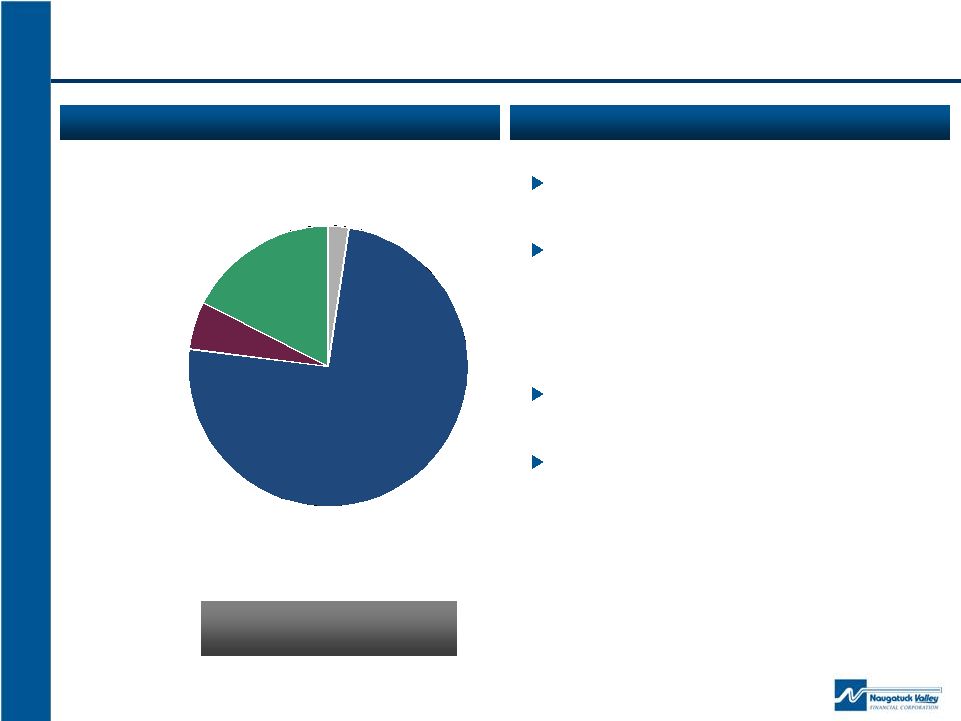 Investment Portfolio Source: Company filings At March 31, 2011, our investment portfolio totaled $45.2 million All of our mortgage-backed securities (75% of total investment portfolio) and substantially all of our collateralized mortgage obligations were issued by either Fannie Mae, Freddie Mac or Ginnie Mae Sold entire municipal bond portfolio in 2009 At March 31, 2011, $30.4 million of securities were available for sale and $14.8 million were held to maturity Investment Portfolio as of March 31, 2011 20 Total Investment Portfolio $45.2MM Securities Portfolio Characteristics U.S. Government & Agency obligations 2% Mortgage-backed securities - GSEs 75% Collateralized mortgage obligations 6% Auction-rate trust preferred securities 17% |
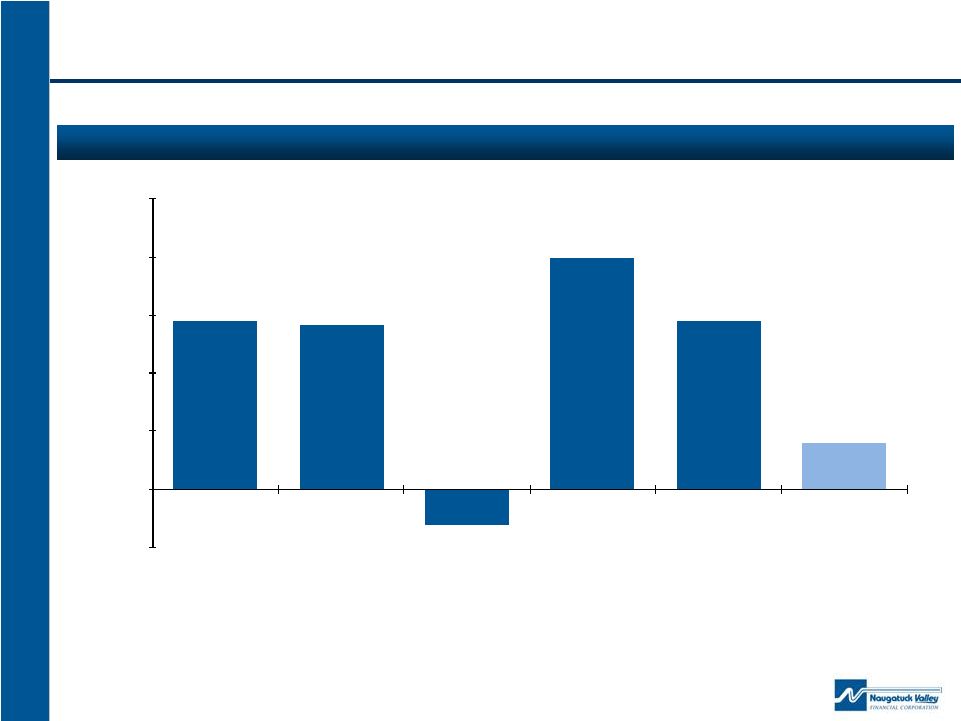 Stable Earnings Dollars in thousands 21 Net Income Source: Company filings 1) Includes impact of $3.4 million in pre-tax OTTI charges related to auction rate pass through certificates with Fannie Mae preferred stock as underlying collateral securities. 2) Includes impact of $782,000 pre-tax expenses related to a terminated bank acquisition in November 2010. (1) (2) $1,448 $1,420 $(312) $1,993 $1,451 $396 ($500) $0 $500 $1,000 $1,500 $2,000 $2,500 2006 2007 2008 2009 2010 Three Months Ended March 31, 2011 |
 Offering Summary |
   Attractive Valuation Naugatuck has an attractive valuation compared to peers On a tangible book value per share basis, Naugatuck valuation is at a 31% discount 23 Pro Forma for Offering Appraisal Peer Group Average Price / Book Value 69.15% 93.67% Price / Tangible Book Value 69.19% 99.70% Price / Earnings 38.3x 24.0x Dividend Yield 1.5% 1.7% Data is based on 12/31/2010 financial information for Naugatuck and most recent quarter end for peers Appraisal peer group comprised of CEBK, CBNK, HBNK, MFLR, NHTB, NFSB, OSHC, THRD, UBNK, WFD Market Information as of 06/23/11 Source: SNL Financial & RP Financial, LC |
 Investment Merits Community-oriented bank with experienced management team Attractive valuation with pro forma pricing at a discount to comparable peers Capital being raised provides Naugatuck additional strategic flexibility to: Capitalize on lending opportunities in the commercial and residential sectors Grow through de novo branching initiatives in attractive markets Expand secondary mortgage market capabilities Prudent underwriting standards as evidenced by historical charge-off levels Franchise is focused in a demographically attractive and wealthy market area Stable profitability throughout the economic downturn (1) : Focus on higher yielding commercial loans while improving core deposit and funding base Improving efficiency ratio through expense control and increases in noninterest income and in net interest income Expect to continue quarterly cash dividends 24 1) Excluding the impact of OTTI charges during the year ended December 31, 2008. |
 2 nd Step Conversion and Offering June 2011 |