UNITED STATES
SECURITIES AND EXCHANGE COMMISSION
Washington, D.C. 20549
FORM N-CSR
CERTIFIED SHAREHOLDER REPORT OF REGISTERED MANAGEMENT INVESTMENT COMPANIES
Investment Company Act file number 811-23477
BNY Mellon ETF Trust
(Exact name of registrant as specified in charter)
240 Greenwich Street
New York, New York 10286
(Address of principal executive offices) (Zip code)
Deirdre Cunnane, Esq.
240 Greenwich Street
New York, New York 10286
(Name and address of agent for service)
Registrant's telephone number, including area code: (212) 922-6400
Date of fiscal year end: June 30
Date of reporting period: June 30, 2024
The following N-CSR relates only to the Registrant's series listed below and does not relate to any series of the Registrant with a different fiscal year end and, therefore, different N-CSR reporting requirements. A separate N-CSR will be filed for any series with a different fiscal year end, as appropriate.
BNY Mellon Ultra Short Income ETF
BNY Mellon Responsible Horizons Corporate Bond ETF
Item 1. Reports to Stockholders.
(a) The following is a copy of the report transmitted to shareholders pursuant to Rule 30e-1 under the Investment Company Act of 1940 (17 CFR 270.30e-1).
BNY Mellon Ultra Short Income ETF
Annual Shareholder Report
Ticker - BKUI (NYSE Arca, Inc.)
This annual shareholder report contains important information about BNY Mellon Ultra Short Income ETF (the “Fund”) for the period of July 1, 2023 to June 30, 2024.You can find additional information about the Fund at im.bnymellon.com/etfliterature. You can also request this information by calling us at 1-833-383-2696 or calling your financial adviser.
What were the Fund's costs for the last year?
(based on a hypothetical $10,000 investment)
| Fund | Costs of a $10,000 investment | Costs paid as a percentage of a $10,000 investment |
|---|
| BNY Mellon Ultra Short Income ETF | $12 | 0.12% |
How did the Fund perform last year?
For the 12 month period ended June 30, 2024, the Fund’s shares returned 5.76% on a net asset value basis and 5.77% on a market price basis.
In comparison, ICE BofA 3-Month U.S. Treasury Bill Index (the “Index”) returned 5.40% for the same period.
What affected the Fund's performance?
U.S. Treasury yields fell in the second half of 2023, then rose by a similar amount in 2024, with bonds maturing in two-to-three years ending the reporting period little changed.
The Fund’s performance relative to the Index benefited from significant exposure to credit assets as credit spreads continued to move tighter over the 12-month period.
The Fund’s exposure to commercial paper during the first half of 2024 provided a yield pick-up versus shorter U.S. government securities.
In the first half of 2024, the Fund’s positions in fixed-rate securities detracted from relative performance as yields rose across the curve on expectations of higher-for-longer interest rates.
Not FDIC-Insured. Not Bank-Guaranteed. May Lose Value.
How did the fund perform since its inception?
The Fund's past performance is not a good predictor of the Fund's future performance.The graph and table do not reflect the deduction of taxes that a shareholder would pay on fund distributions or redemption of fund shares.
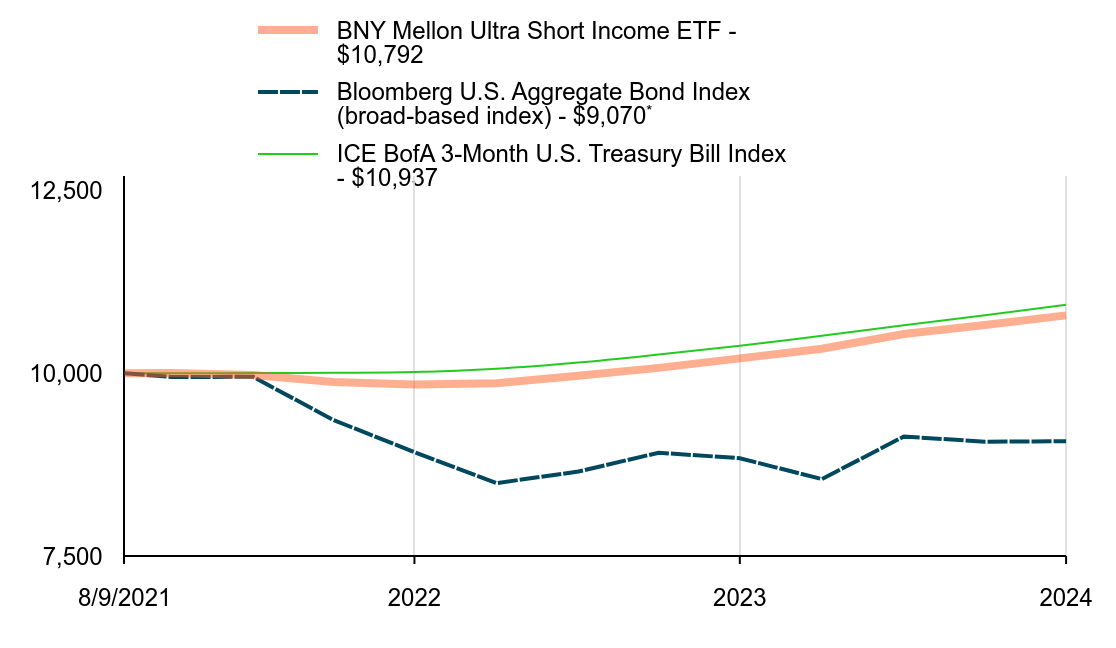
CUMULATIVE PERFORMANCE FROM AUGUST 9, 2021 THROUGH JUNE 30, 2024
INITIAL INVESTMENT OF $10,000
| BNY Mellon Ultra Short Income ETF - $10,792 | Bloomberg U.S. Aggregate Bond Index (broad-based index) - $9,070Footnote Reference* | ICE BofA 3-Month U.S. Treasury Bill Index - $10,937 |
|---|
| 8/9/2021 | 10,000 | 10,000 | 10,000 |
| 9/30/2021 | 10,004 | 9,950 | 10,001 |
| 12/31/2021 | 9,976 | 9,951 | 10,002 |
| 3/31/2022 | 9,880 | 9,361 | 10,006 |
| 6/30/2022 | 9,846 | 8,921 | 10,016 |
| 9/30/2022 | 9,863 | 8,497 | 10,062 |
| 12/31/2022 | 9,966 | 8,656 | 10,147 |
| 3/31/2023 | 10,074 | 8,913 | 10,256 |
| 6/30/2023 | 10,204 | 8,838 | 10,376 |
| 9/30/2023 | 10,336 | 8,552 | 10,512 |
| 12/31/2023 | 10,538 | 9,135 | 10,656 |
| 3/31/2024 | 10,660 | 9,064 | 10,794 |
| 6/30/2024 | 10,792 | 9,070 | 10,937 |
The above graph compares a hypothetical $10,000 investment in the Fund’s shares to a hypothetical investment of $10,000 made in each index on August 9, 2021, the Fund’s inception. The performance shown takes into account applicable fees and expenses of the Fund, including management fees and other expenses. The Fund’s performance also assumes the reinvestment of dividends and capital gains. Unlike the Fund, an index is not subject to fees and other expenses. Investors cannot invest directly in any index.
AVERAGE ANNUAL TOTAL RETURNS (AS OF 6/30/24)
| Fund | 1 YR | Since Inception (August 9, 2021) |
|---|
| BNY Mellon Ultra Short Income ETF - NAV Return | 5.76% | 2.68% |
| BNY Mellon Ultra Short Income ETF - Market Price Return | 5.77% | 2.67% |
Bloomberg U.S. Aggregate Bond Index (broad-based index)Footnote Reference* | 2.63% | |
| ICE BofA 3-Month U.S. Treasury Bill Index | 5.40% | 3.15% |
| Footnote | Description |
Footnote* | In accordance with regulatory changes requiring the Fund’s primary benchmark to represent the overall applicable market, the Fund’s primary prospectus benchmark changed to the indicated benchmark effective as of June 30, 2024. |
The performance data quoted represent past performance, which is no guarantee of future results. For more current performance information, visit im.bnymellon.com/etfliterature.
KEY FUND STATISTICS (AS OF 6/30/24)
| Fund size (Millions) | Number of Holdings | Total Advisory Fee Paid During Period ($) | Annual Portfolio Turnover |
|---|
| $74 | 113 | 63,419 | 42.44% |
Not FDIC-Insured. Not Bank-Guaranteed. May Lose Value.
Portfolio Holdings (as of 6/30/24)
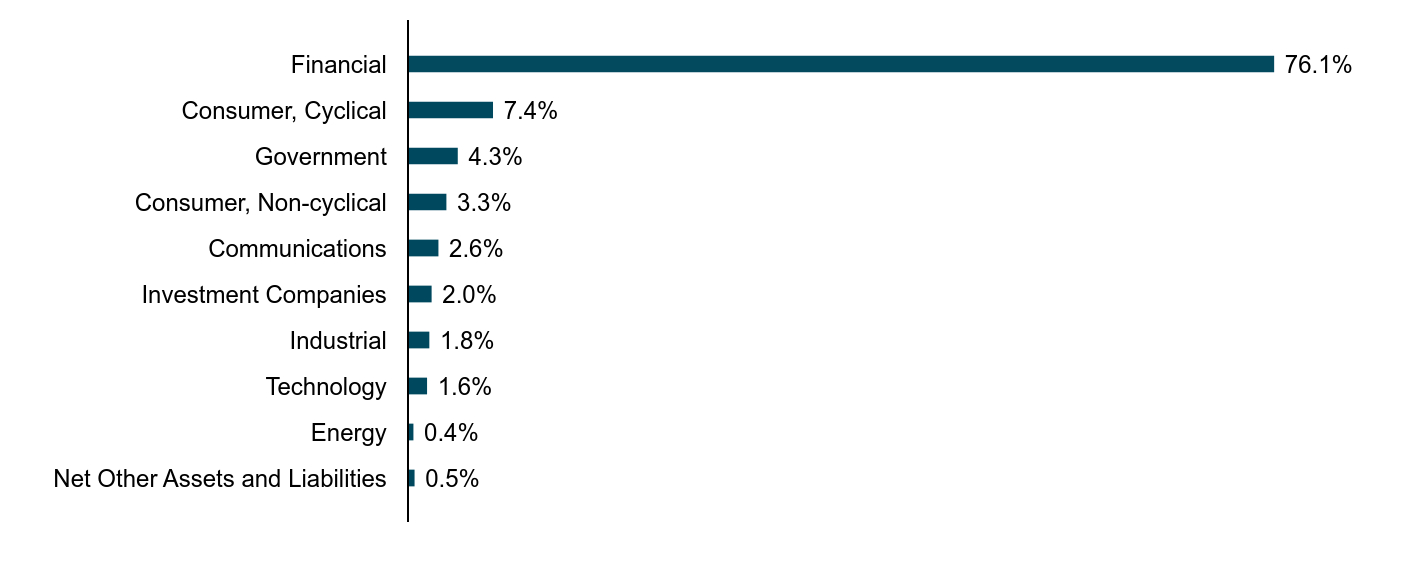
Sector Allocation
(Based on Net Assets)
| Value | Value |
|---|
| Net Other Assets and Liabilities | 0.5% |
| Energy | 0.4% |
| Technology | 1.6% |
| Industrial | 1.8% |
| Investment Companies | 2.0% |
| Communications | 2.6% |
| Consumer, Non-cyclical | 3.3% |
| Government | 4.3% |
| Consumer, Cyclical | 7.4% |
| Financial | 76.1% |
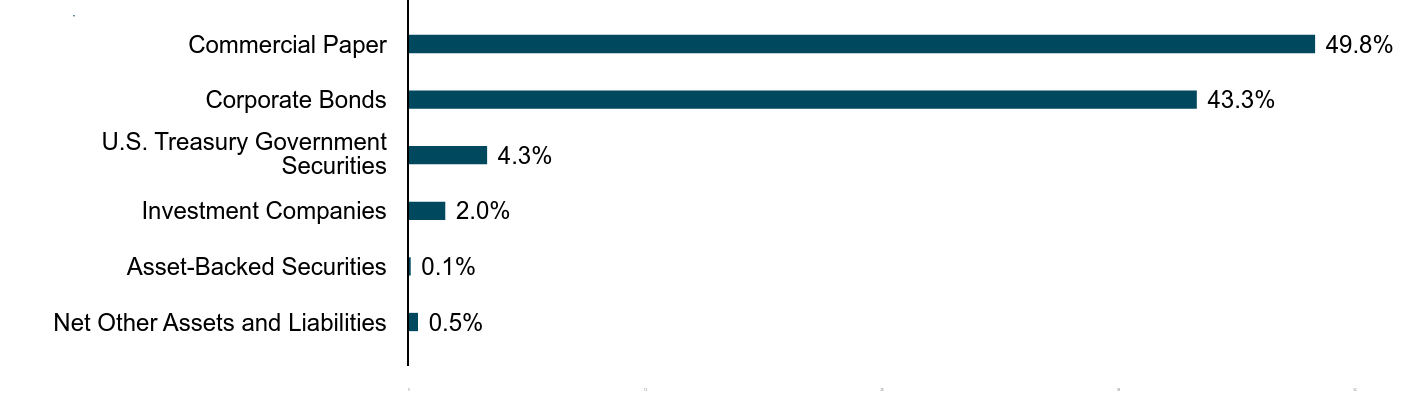
Allocation of Holdings
(Based on Net Assets)
| Value | Value |
|---|
| Net Other Assets and Liabilities | 0.5% |
| Asset-Backed Securities | 0.1% |
| Investment Companies | 2.0% |
| U.S. Treasury Government Securities | 4.3% |
| Corporate Bonds | 43.3% |
| Commercial Paper | 49.8% |
For additional information about the Fund, including its prospectus, financial information, portfolio holdings and proxy voting information, please visit im.bnymellon.com/etfliterature.
Not FDIC-Insured. Not Bank-Guaranteed. May Lose Value.
© 2024 BNY Mellon Securities Corporation,
240 Greenwich Street, 9th Floor, New York, NY 10281
Code-4862AR0624
BNY Mellon Responsible Horizons Corporate Bond ETF
Annual Shareholder Report
Ticker - RHCB (NYSE Arca, Inc.)
This annual shareholder report contains important information about BNY Mellon Responsible Horizons Corporate Bond ETF (the “Fund”) for the period of July 1, 2023 to June 30, 2024.You can find additional information about the Fund at im.bnymellon.com/etfliterature. You can also request this information by calling us at 1-833-383-2696 or calling your financial adviser.
This report describes changes to the Fund that occurred during the reporting period.
What were the Fund's costs for the last year?
(based on a hypothetical $10,000 investment)
| Fund | Costs of a $10,000 investment | Costs paid as a percentage of a $10,000 investment |
|---|
| BNY Mellon Responsible Horizons Corporate Bond ETF | $36 | 0.35% |
How did the Fund perform last year?
For the 12 month period ended June 30, 2024, the Fund’s shares returned 5.12% on a net asset value basis and 5.07% on a market price basis.
In comparison, ICE BofA U.S. Corporate Index (the “Index”) returned 5.04% for the same period.
What affected the Fund's performance?
Economic growth propelled credit markets to gains, narrowing credit spreads as the Federal Reserve (“Fed”) ended its tightening cycle in September 2023.
The Fund was positioned slightly long duration in anticipation of upcoming Fed rate cuts as inflation normalizes. However, this led to a slight drag on performance as the rate cuts were delayed. In addition, our overweight to the 7 year and 30 year was a slight drag on performance as the very short end of the curve outperformed and the curve steepened.
Security selection and a large allocation to credit risk drove the Fund’s performance. As spreads tightened, the Fund’s overweight to lower-rated investment-grade bonds and a small allocation to high-yield bonds proved beneficial and upwards rating trends in securities held, providing performance tailwinds.
Sector allocation effects were mixed as the Fund’s overweight to banks contributed to performance but its underweight to energy detracted.
Not FDIC-Insured. Not Bank-Guaranteed. May Lose Value.
How did the fund perform since its inception?
The Fund's past performance is not a good predictor of the Fund's future performance.The graph and table do not reflect the deduction of taxes that a shareholder would pay on fund distributions or redemption of fund shares.
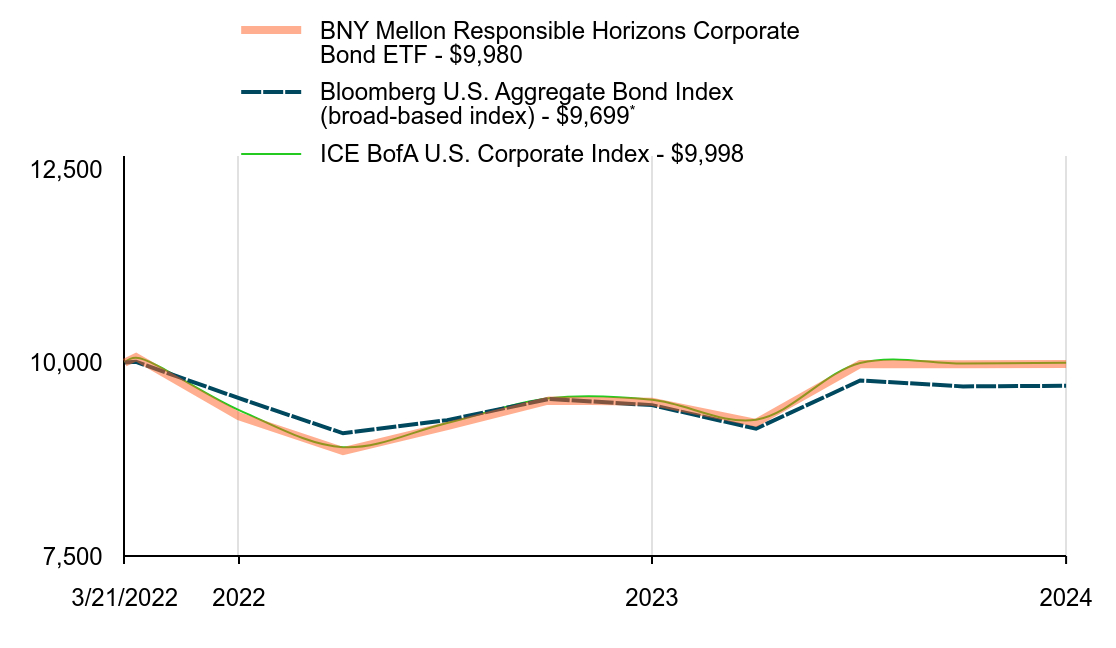
CUMULATIVE PERFORMANCE FROM MARCH 21, 2022 THROUGH JUNE 30, 2024
INITIAL INVESTMENT OF $10,000
| BNY Mellon Responsible Horizons Corporate Bond ETF - $9,980 | Bloomberg U.S. Aggregate Bond Index (broad-based index) - $9,699Footnote Reference* | ICE BofA U.S. Corporate Index - $9,998 |
|---|
| 3/21/2022 | 10,000 | 10,000 | 10,000 |
| 3/31/2022 | 10,071 | 10,009 | 10,061 |
| 6/30/2022 | 9,306 | 9,539 | 9,386 |
| 9/30/2022 | 8,856 | 9,086 | 8,906 |
| 12/31/2022 | 9,180 | 9,256 | 9,220 |
| 3/31/2023 | 9,510 | 9,530 | 9,538 |
| 6/30/2023 | 9,494 | 9,450 | 9,518 |
| 9/30/2023 | 9,221 | 9,145 | 9,262 |
| 12/31/2023 | 9,981 | 9,768 | 9,995 |
| 3/31/2024 | 9,977 | 9,692 | 9,987 |
| 6/30/2024 | 9,980 | 9,699 | 9,998 |
The above graph compares a hypothetical $10,000 investment in the Fund’s shares to a hypothetical investment of $10,000 made in each index on March 21, 2022, the Fund’s inception. The performance shown takes into account applicable fees and expenses of the Fund, including management fees and other expenses. The Fund’s performance also assumes the reinvestment of dividends and capital gains. Unlike the Fund, an index is not subject to fees and other expenses. Investors cannot invest directly in any index.
AVERAGE ANNUAL TOTAL RETURNS (AS OF 6/30/24)
| Fund | 1 YR | Since Inception (March 21, 2022) |
|---|
| BNY Mellon Responsible Horizons Corporate Bond ETF - NAV Return | 5.12% | |
| BNY Mellon Responsible Horizons Corporate Bond ETF - Market Price Return | 5.07% | |
Bloomberg U.S. Aggregate Bond Index (broad-based index)Footnote Reference* | 2.63% | |
| ICE BofA U.S. Corporate Index | 5.04% | |
| Footnote | Description |
Footnote* | In accordance with regulatory changes requiring the Fund’s primary benchmark to represent the overall applicable market, the Fund’s primary prospectus benchmark changed to the indicated benchmark effective as of June 30, 2024. |
The performance data quoted represent past performance, which is no guarantee of future results. For more current performance information, visit im.bnymellon.com/etfliterature.
KEY FUND STATISTICS (AS OF 6/30/24)
| Fund size (Millions) | Number of Holdings | Total Advisory Fee Paid During Period ($) | Annual Portfolio Turnover |
|---|
| $23 | 276 | 78,566 | 56.72% |
Not FDIC-Insured. Not Bank-Guaranteed. May Lose Value.
Portfolio Holdings (as of 6/30/24)
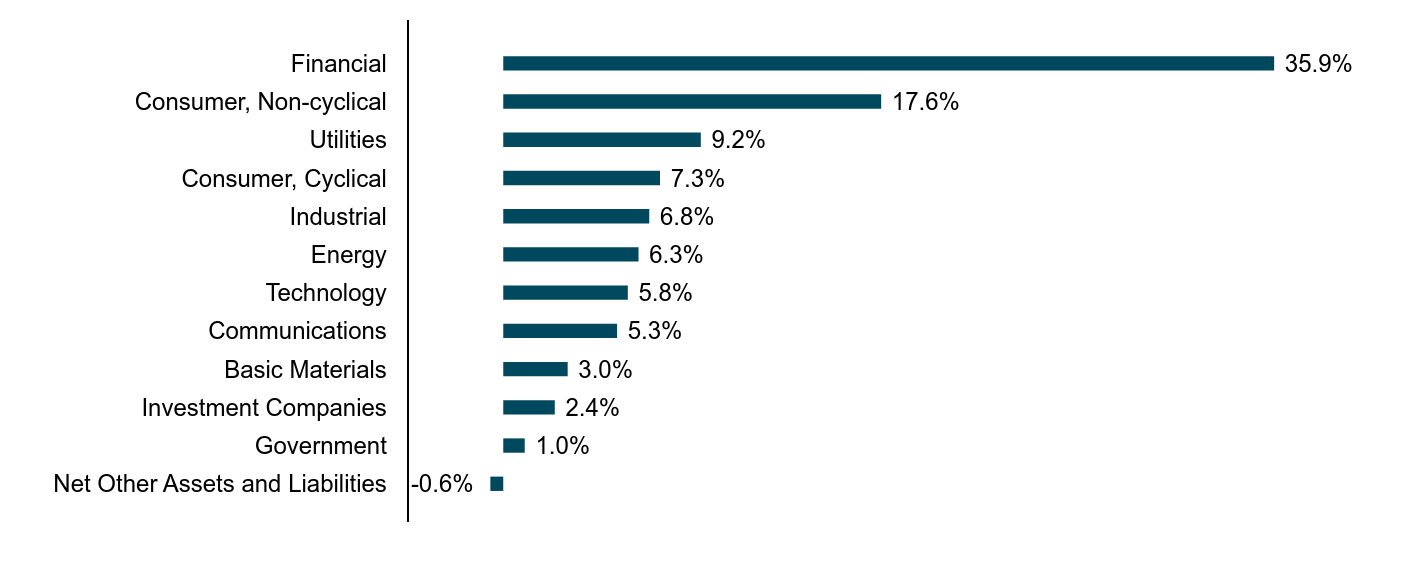
Sector Allocation
(Based on Net Assets)
| Value | Value |
|---|
| Net Other Assets and Liabilities | -0.6% |
| Government | 1.0% |
| Investment Companies | 2.4% |
| Basic Materials | 3.0% |
| Communications | 5.3% |
| Technology | 5.8% |
| Energy | 6.3% |
| Industrial | 6.8% |
| Consumer, Cyclical | 7.3% |
| Utilities | 9.2% |
| Consumer, Non-cyclical | 17.6% |
| Financial | 35.9% |
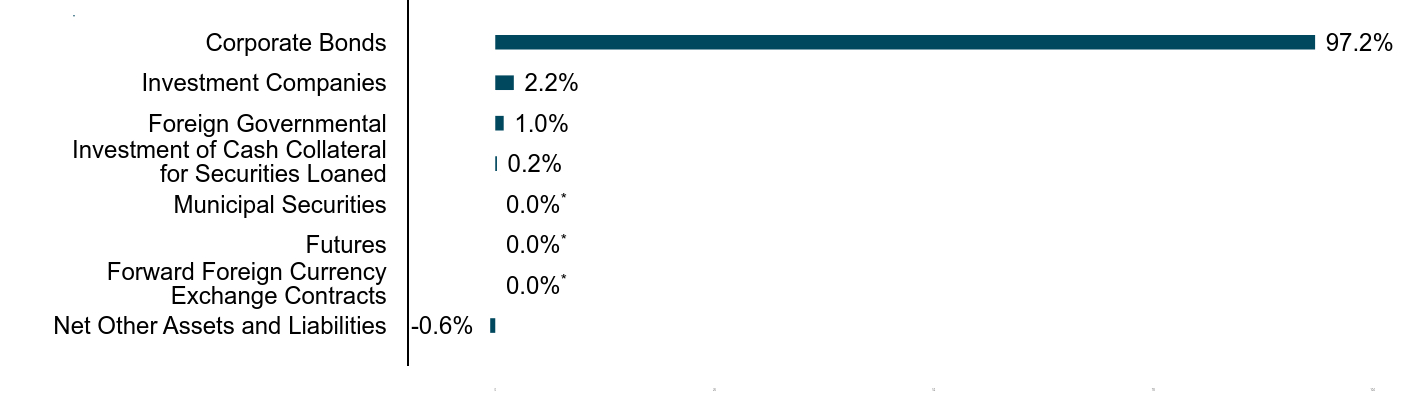
Allocation of Holdings
(Based on Net Assets)
| Value | Value |
|---|
| Net Other Assets and Liabilities | -0.6% |
| Forward Foreign Currency Exchange Contracts | 0.0%Footnote Reference* |
| Futures | 0.0%Footnote Reference* |
| Municipal Securities | 0.0%Footnote Reference* |
| Investment of Cash Collateral for Securities Loaned | 0.2% |
| Foreign Governmental | 1.0% |
| Investment Companies | 2.2% |
| Corporate Bonds | 97.2% |
| Footnote | Description |
Footnote* | Less than 0.1%. |
How has the Fund changed?
This is a summary of certain changes to the Fund since July 1, 2023. For more complete information, you may review the Fund’s next prospectus, which we expect to be available by November 1, 2024 at im.bnymellon.com/etfliterature or upon request at 1-833-383-2696 or by calling your financial adviser.
For additional information about the Fund, including its prospectus, financial information, portfolio holdings and proxy voting information, please visit im.bnymellon.com/etfliterature.
Not FDIC-Insured. Not Bank-Guaranteed. May Lose Value.
© 2024 BNY Mellon Securities Corporation,
240 Greenwich Street, 9th Floor, New York, NY 10281
Code-4863AR0624
Item 1. Reports to Stockholders (cont.).
(b) Not applicable.
Item 2. Code of Ethics.
(a) As of the period ended June 30, 2024 (the “Reporting Period”), the Registrant has adopted a code of ethics that applies to the Registrant’s principal executive officer, principal financial officer, principal accounting officer, controller or persons performing similar functions, regardless of whether these individuals are employed by the Registrant or a third party.
(c) During the Reporting Period, there have been no amendments to a provision of the code of ethics that applies to the Registrant’s principal executive officer, principal financial officer, principal accounting officer or controller, or persons performing similar functions, regardless of whether these individuals are employed by the Registrant or a third party, and that relates to any element of the code of ethics description.
(d) During the Reporting Period, the Registrant has not granted any waivers, including an implicit waiver, from a provision of the code of ethics to the Registrant’s principal executive officer, principal financial officer, principal accounting officer or controller, or persons performing similar functions, regardless of whether these individuals are employed by the Registrant or a third party, that relates to one or more of the items set forth in paragraph (b) of this item’s instructions.
Item 3. Audit Committee Financial Expert.
The Registrant’s Board of Trustees has determined that Mr. Kevin W. Quinn is qualified to serve as an audit committee financial expert serving on the Registrant’s audit committee and that he is “independent,” as defined by Item 3 of Form N-CSR.
Item 4. Principal Accountant Fees and Services.
(a) Audit Fees
The aggregate fees billed for each of the last two fiscal years for professional services rendered by the principal accountant for the audit of the Registrant’s annual financial statements or services that are normally provided by the accountant in connection with statutory and regulatory filings or engagements for those fiscal years were $43,299 in 2023 and $44,165 in 2024.
(b) Audit-Related Fees
The aggregate fees billed for each of the last two fiscal years for assurance and related services rendered to the Registrant by the principal accountant that are reasonably related to the performance of the audit of the Registrant’s financial statements and are not reported under paragraph (a) of this Item were $12,240 in 2023 and $12,484 in 2024. These services consisted of security counts required by Rule 17f-2 under the Investment Company Act of 1940, as amended.
(c) Tax Fees
The aggregate fees billed for each of the last two fiscal years for professional services rendered to the Registrant by the principal accountant for tax compliance, tax advice and tax planning were $7,752 in 2023 and $7,908 in 2024. These services consisted of (i) review or preparation of U.S. federal, state, local and excise tax returns; (ii) U.S. federal, state and local entity tax planning, advice and assistance regarding statutory, regulatory or administrative developments, and (iii) tax advice regarding tax qualification.
(d) All Other Fees
The aggregate fees billed for each of the last two fiscal years for products and services provided by the principal accountant, other than the services reported in paragraphs (a) through (c) of this Item were $0 in 2023 and $0 in 2024.
(e)(1) Pursuant to the Registrant’s Audit Committee Charter that has been adopted by the audit committee, the audit committee shall approve all audit and permissible non-audit services to be provided to the Registrant and all permissible non-audit services to be provided to its investment adviser or any entity controlling, controlled by or under common control with the investment adviser that provides ongoing services to the Registrant if the engagement relates directly to the operations and financial reporting of the Registrant.
(e)(2) The percentage of services described in paragraphs (b) through (d) of this Item that were approved by the audit committee pursuant to paragraph (c)(7)(i)(C) of Rule 2-01 of Regulation S-X, with respect to: Audit-Related Fees was 100%; Tax Fees was 100%; and All Other Fees was 0%.
(f) The percentage of hours expended on the principal accountant’s engagement to audit the Registrant’s financial statements for the most recent fiscal year that were attributed to work performed by persons other than the principal accountant’s full-time, permanent employees was less than fifty percent.
(g) The aggregate non-audit fees billed by the Registrant’s accountant for services rendered to the Registrant, and rendered to the Registrant’s investment adviser (not including any sub-adviser whose role is primarily portfolio management and is subcontracted with or overseen by another investment adviser), and any entity controlling, controlled by, or under common control with the investment adviser that provides ongoing services to the Registrant for each of the last two fiscal years of the Registrant were $269,097 in 2023 and $282,787 in 2024.
(h) The Registrant’s audit committee has considered whether the provision of non-audit services that were rendered to the Registrant’s investment adviser (not including any sub-adviser whose role is primarily portfolio management and is subcontracted with or overseen by another investment adviser), and any entity controlling, controlled by, or under common control with the investment adviser that provides ongoing services to the Registrant that were not pre-approved pursuant to paragraph (c)(7)(ii) of Rule 2-01 of Regulation S-X is compatible with maintaining the principal accountant’s independence.
(i) Not applicable.
(j) Not applicable.
Item 5. Audit Committee of Listed Registrants.
(a) The Registrant has a separately designated audit committee established in accordance with Section 3(a)(58)(A) of the Securities Exchange Act of 1934, as amended, which consists of independent trustees of the Registrant. The audit committee members are J. Charles Cardona, Kristen M. Dickey, F. Jack Liebau, Jr., Jill I. Mavro, Kevin W. Quinn, and Stacy L. Schaus.
(b) Not applicable.
Item 6. Investments.
(a) The Schedule of Investments in securities of unaffiliated issuers as of the close of the Reporting Period is included in the financial statements filed under Item 7 of this Form N-CSR.
(b) Not applicable.
Item 7. Financial Statements and Financial Highlights for Open-End Management Investment Companies.
The following is a copy of the Registrant’s most recent financial statements and financial highlights.
ANNUAL
FINANCIALS
AND
OTHER
INFORMATION
June
30,
2024
BNY
Mellon
Ultra
Short
Income
ETF:
BKUI
Principal
U.S.
Listing
Exchange:
NYSE
Arca,
Inc.
IMPORTANT
NOTICE
–
CHANGES
TO
ANNUAL
AND
SEMI-ANNUAL
REPORTS
The
Securities
and
Exchange
Commission
(the
“SEC”)
has
adopted
rule
and
form
amendments
which
have
resulted
in
changes
to
the
design
and
delivery
of
annual
and
semi-annual
fund
reports
(“Reports”).
Reports
are
now
streamlined
to
highlight
key
information.
Certain
information
previously
included
in
Reports,
including
financial
statements,
no
longer
appear
in
the
Reports
but
will
be
available
online
within
the
Semi-Annual
and
Annual
Financials
and
Other
Information,
delivered
free
of
charge
to
shareholders
upon
request,
and
filed
with
the
SEC.
Please
note
the
Annual
Financials
and
Other
Information
only
contains
Items
7-11
required
in
Form
N-CSR.
All
other
required
items
will
be
filed
with
the
SEC.
Item
7.
Financial
Statements
and
Financial
Highlights
for
Open-End
Management
Investment
Companies
3
Statement
of
Investments
3
Statement
of
Assets
and
Liabilities
7
Statement
of
Operations
8
Statement
of
Changes
in
Net
Assets
9
Financial
Highlights
10
Notes
to
Financial
Statements
11
Report
of
Independent
Registered
Public
Accounting
Firm
16
Important
Tax
Information
17
Board
Members
Information
18
Officers
of
the
Trust
19
Item
8.
Changes
in
and
Disagreements
with
Accountants
for
Open-End
Management
Investment
Companies
21
Item
9.
Proxy
Disclosures
for
Open-End
Management
Investment
Companies
22
Item
10.
Remuneration
Paid
to
Directors,
Officers,
and
Others
of
Open-End
Investment
Companies
23
Item
11.
Statement
Regarding
Basis
for
Approval
of
Investment
Advisory
Contracts
24
Save
time.
Save
paper.
View
your
next
shareholder
report
online
as
soon
as
it’s
available.
Log
into
www.
im.bnymellon.com
and
sign
up
for
eCommunications.
It’s
simple
and
only
takes
a
few
minutes.
The
views
expressed
herein
are
current
to
the
date
of
this
report.
These
views
and
the
composition
of
the
fund’s
portfolio
is
subject
to
change
at
any
time
based
on
market
and
other
conditions.
Not
FDIC-Insured
•
Not
Bank-Guaranteed
•
May
Lose
Value
BNY
Mellon
Ultra
Short
Income
ETF
Statement
of
Investments
June
30,
2024
Item
7.
Financial
Statements
and
Financial
Highlights
for
Open-End
Management
Investment
Companies
Description
Principal
Amount
($)
Value
($)
Asset-Backed
Securities
–
0.1%
Honda
Auto
Receivables
Owner
Trust,
Series
2021-3,
Class
A3,
0.41%,
11/18/2025
86,676
85,396
Total
Asset-Backed
Securities
(cost
$86,675)
85,396
Commercial
Paper
–
49.8%
Atlantic
Asset
Securitization
LLC,
5.41%,
7/10/2024
(a)(b)
1,000,000
998,219
Bank
of
Montreal,
5.48%,
9/04/2024
(a)(b)
1,400,000
1,385,979
Canadian
Imperial
Bank,
5.43%,
4/03/2025
(b)
1,500,000
1,440,051
Chariot
Funding
LLC,
5.51%
(1
Month
SOFR
+
0.17%),
10/02/2024
(a)(c)
750,000
750,014
Commonwealth
Bank
of
Australia,
5.22%,
10/16/2024
(a)(b)
1,600,000
1,574,016
Credit
Industriel
et
Commercial
5.28%,
1/09/2024
(a)(b)
1,000,000
984,518
5.35%,
2/06/2025
(a)(b)
1,300,000
1,256,282
DNB
ASA,
5.56%,
4/11/2025
(a)(b)
2,000,000
1,917,874
Fairway
Finance
Co.
LLC,
5.66%
(1
Month
SOFR
+
0.12%),
11/14/2024
(a)(c)
1,000,000
1,000,038
HSBC
Bank
PLC,
6.01%
(1
Month
SOFR
+
0.67%),
6/05/2025
(a)(c)
1,500,000
1,500,223
ING
(U.S.)
Funding
LLC,
5.40%,
9/05/2024
(b)
500,000
494,840
Liberty
Street
Funding
Corp.,
5.53%,
9/23/2024
(a)(b)
1,000,000
986,967
LMA
SA/LMA-Americas
LLC,
5.61%,
1/28/2025
(a)(b)
1,200,000
1,162,210
Macqurie
Bank
Ltd.,
5.29%,
9/16/2024
(a)(b)
2,000,000
1,975,615
Manhattan
Asset
Funding
Co.
LLC,
5.57%,
12/06/2024
(a)(b)
2,000,000
1,952,258
MetLife,
5.46%
(1
Month
SOFR
+
0.12%),
8/16/2024
(a)(c)
1,500,000
1,500,047
National
Bank,
5.47%,
4/01/2025
(b)
1,500,000
1,439,789
Natixis
SA,
5.45%,
8/05/2024
(b)
2,000,000
1,988,776
Old
Line
Funding
LLC
5.58%,
10/21/2024
(a)(b)
250,000
245,688
5.74%
(1
Month
SOFR
+
0.40%),
1/27/2025
(a)(c)
1,200,000
1,200,060
Societe
Generale
SA,
5.59%,
4/11/2025
(b)
1,000,000
959,031
Standard
Chartered
Bank,
5.26%,
10/01/2024
(b)
1,500,000
1,478,694
Svenska
Handelsbanken
AB,
6.02%,
9/18/2024
(b)
425,000
419,851
Swedbank
AB
5.40%,
7/17/2024
(a)(b)
2,000,000
1,994,431
5.37%,
3/13/2025
(a)(b)
750,000
722,012
Toronto-Dominion
Bank
5.90%
(1
Month
SOFR
+
0.56%),
10/28/2024
(a)(c)
350,000
350,438
5.46%,
4/03/2025
(a)(b)
1,500,000
1,439,859
United
Overseas
Bank
Ltd.,
5.48%
(1
Month
SOFR
+
0.15%),
9/30/2024
(a)(c)
2,000,000
2,000,392
Westpac
Banking
Corp.
5.79%,
11/14/2024
(a)(b)
500,000
489,842
5.41%,
3/31/2025
(a)(b)
1,500,000
1,440,984
Total
Commercial
Paper
(cost
$37,063,915)
37,048,998
Corporate
Bonds
–
43.3%
Auto
Manufacturers
–
5.1%
American
Honda
Finance
Corp.
,
1.30%
,
9/09/2026
300,000
276,551
BMW
US
Capital
LLC
5.74%
(3
Month
SOFRIX
+
0.38%),
8/12/2024
(a)(c)
300,000
300,072
4.90%,
4/02/2027
(a)
600,000
598,064
General
Motors
Financial
Co.,
Inc.
5.40%,
4/06/2026
250,000
249,564
6.71%
(3
Month
SOFRIX
+
1.35%),
5/08/2027
(c)
350,000
352,893
Mercedes-Benz
Finance
North
America
LLC
5.20%,
8/03/2026
(a)
325,000
325,241
3.45%,
1/06/2027
(a)
325,000
312,766
PACCAR
Financial
Corp.
,
3.55%
,
8/11/2025
300,000
294,650
Toyota
Motor
Credit
Corp.
5.67%
(3
Month
SOFR
+
0.32%),
1/13/2025
(c)
300,000
300,081
6.01%
(3
Month
SOFR
+
0.65%),
3/19/2027
(c)
750,000
753,281
3,763,163
Statement
of
Investments
(continued)
Description
Principal
Amount
($)
Value
($)
Corporate
Bonds
–
43.3%
(continued)
Banks
–
22.7%
ANZ
New
Zealand
Int'l
Ltd.
,
5.96%
(
3
Month
SOFR
+
0.60%
)
,
2/18/2025
(a)(c)
300,000
300,466
Bank
of
America
NA
,
5.53%
,
8/18/2026
300,000
302,188
Bank
of
Montreal
6.42%
(3
Month
SOFRIX
+
1.06%),
6/07/2025
(c)
350,000
351,852
5.27%,
12/11/2026
325,000
324,597
Bank
of
Nova
Scotia
(The)
5.81%
(3
Month
SOFR
+
0.46%),
1/10/2025
(c)
300,000
300,271
5.35%,
12/07/2026
750,000
751,144
Canadian
Imperial
Bank
of
Commerce
3.95%,
8/04/2025
275,000
270,403
6.59%
(3
Month
SOFR
+
1.22%),
10/02/2026
(c)
375,000
379,333
Citigroup,
Inc.
6.89%
(3
Month
SOFR
+
1.53%),
3/17/2026
(c)
300,000
302,422
6.13%
(3
Month
SOFR
+
0.77%),
6/09/2027
(c)
700,000
700,422
Commonwealth
Bank
of
Australia
,
6.11%
(
3
Month
SOFR
+
0.75%
)
,
3/13/2026
(a)(c)
350,000
351,821
Goldman
Sachs
Group,
Inc.
(The)
,
6.15%
(
3
Month
SOFR
+
0.79%
)
,
12/09/2026
(c)
725,000
725,940
ING
Groep
NV
,
3.95%
,
3/29/2027
600,000
579,403
JPMorgan
Chase
&
Co.
,
6.68%
(
3
Month
SOFR
+
1.32%
)
,
4/26/2026
(c)
300,000
302,555
JPMorgan
Chase
Bank
NA
,
5.11%
,
12/08/2026
325,000
325,006
KeyBank
NA
,
4.70%
,
1/26/2026
300,000
294,144
Manufacturers
&
Traders
Trust
Co.
,
4.65%
,
1/27/2026
300,000
294,641
Mitsubishi
UFJ
Financial
Group,
Inc.
,
6.75%
(
3
Month
SOFR
+
1.39%
)
,
9/12/2025
(c)
350,000
350,791
Morgan
Stanley
Bank
NA
,
6.52%
(
3
Month
SOFR
+
1.17%
)
,
10/30/2026
(c)
500,000
506,897
National
Australia
Bank
Ltd.
5.73%
(3
Month
SOFR
+
0.38%),
1/12/2025
(a)(c)
300,000
300,199
1.89%,
1/12/2027
(a)
375,000
347,450
National
Bank
of
Canada
,
5.25%
,
1/17/2025
300,000
299,234
Natwest
Markets
PLC
,
6.26%
(
3
Month
SOFR
+
0.90%
)
,
5/17/2027
(a)(c)
500,000
500,469
NatWest
Markets
PLC
5.89%
(3
Month
SOFR
+
0.53%),
8/12/2024
(a)(c)
350,000
350,115
1.60%,
9/29/2026
(a)
225,000
206,688
PNC
Financial
Services
Group,
Inc.
(The)
,
2.60%
,
7/23/2026
325,000
307,785
Royal
Bank
of
Canada
Series
G,
5.80%
(3
Month
SOFRIX
+
0.44%),
1/21/2025
(c)
300,000
299,878
Series
G,
6.31%
(3
Month
SOFRIX
+
0.95%),
1/19/2027
(c)
650,000
655,338
Standard
Chartered
PLC
,
7.11%
(
3
Month
SOFR
+
1.74%
)
,
3/30/2026
(a)(c)
350,000
352,316
State
Street
Corp.
3.55%,
8/18/2025
98,000
96,150
5.27%,
8/03/2026
225,000
225,474
6.20%
(3
Month
SOFRIX
+
0.85%),
8/03/2026
(c)
350,000
351,503
Sumitomo
Mitsui
Financial
Group,
Inc.
,
1.40%
,
9/17/2026
300,000
275,445
Sumitomo
Mitsui
Trust
Bank
Ltd.
5.80%
(3
Month
SOFR
+
0.44%),
9/16/2024
(a)(c)
300,000
300,159
6.48%
(3
Month
SOFR
+
1.12%),
3/09/2026
(a)(c)
300,000
303,106
5.65%,
9/14/2026
(a)
325,000
327,055
Toronto-Dominion
Bank
(The)
5.71%
(3
Month
SOFR
+
0.35%),
9/10/2024
(c)
300,000
300,099
5.53%,
7/17/2026
200,000
200,749
US
Bancorp
1.45%,
5/12/2025
1,600,000
1,545,619
Series
V,
2.38%,
7/22/2026
325,000
306,766
Wells
Fargo
&
Co.
,
3.00%
,
2/19/2025
300,000
295,194
Wells
Fargo
Bank
NA
,
5.55%
,
8/01/2025
750,000
751,220
Westpac
Banking
Corp.
,
5.66%
(
3
Month
SOFR
+
0.30%
)
,
11/18/2024
(c)
300,000
300,106
16,912,413
Description
Principal
Amount
($)
Value
($)
Corporate
Bonds
–
43.3%
(continued)
Computers
–
0.4%
International
Business
Machines
Corp.
,
4.00%
,
7/27/2025
300,000
295,799
295,799
Diversified
Financial
Services
–
2.2%
American
Express
Co.
6.12%
(3
Month
SOFR
+
0.76%),
2/13/2026
(c)
250,000
251,251
2.55%,
3/04/2027
750,000
701,162
Charles
Schwab
Corp.
(The)
5.88%
(3
Month
SOFRIX
+
0.52%),
5/13/2026
(c)
300,000
300,084
5.88%,
8/24/2026
350,000
354,125
1,606,622
Healthcare-Services
–
0.9%
Roche
Holdings,
Inc.
,
6.10%
(
3
Month
SOFR
+
0.74%
)
,
11/13/2026
(a)(c)
650,000
654,914
654,914
Insurance
–
0.4%
Prudential
Financial,
Inc.
,
1.50%
,
3/10/2026
300,000
282,262
282,262
Machinery-Construction
&
Mining
–
1.0%
Caterpillar
Financial
Services
Corp.
,
5.88%
(
3
Month
SOFR
+
0.52%
)
,
5/14/2027
(c)
750,000
752,508
752,508
Machinery-Diversified
–
0.8%
John
Deere
Capital
Corp.
4.80%,
1/09/2026
300,000
298,243
1.70%,
1/11/2027
350,000
322,867
621,110
Media
–
0.9%
Comcast
Corp.
,
2.35%
,
1/15/2027
750,000
702,371
702,371
Oil
&
Gas
–
0.4%
BP
Capital
Markets
America,
Inc.
,
3.41%
,
2/11/2026
300,000
291,668
291,668
Pharmaceuticals
–
2.4%
AbbVie,
Inc.
,
2.95%
,
11/21/2026
350,000
333,703
Cigna
Group
(The)
,
5.69%
,
3/15/2026
650,000
650,035
CVS
Health
Corp.
,
3.00%
,
8/15/2026
300,000
285,933
Pfizer
Investment
Enterprises
Pte
Ltd.
,
4.45%
,
5/19/2026
250,000
246,894
Shire
Acquisitions
Investments
Ireland
DAC
,
3.20%
,
9/23/2026
300,000
287,764
1,804,329
Real
Estate
–
0.9%
Simon
Property
Group
LP
,
1.38%
,
1/15/2027
725,000
661,765
661,765
Retail
–
2.3%
Home
Depot,
Inc.
(The)
,
4.00%
,
9/15/2025
750,000
739,340
Target
Corp.
,
1.95%
,
1/15/2027
700,000
651,639
Walmart,
Inc.
,
3.90%
,
9/09/2025
300,000
295,774
1,686,753
Semiconductors
–
0.4%
Intel
Corp.
,
3.70%
,
7/29/2025
300,000
294,941
294,941
Software
–
0.8%
Oracle
Corp.
,
2.65%
,
7/15/2026
300,000
284,387
Salesforce,
Inc.
,
0.63%
,
7/15/2024
300,000
299,427
583,814
Statement
of
Investments
(continued)
See
Notes
to
Fina
ncial
Statements
Description
Principal
Amount
($)
Value
($)
Corporate
Bonds
–
43.3%
(continued)
Telecommunications
–
1.7%
AT&T,
Inc.
,
4.25%
,
3/01/2027
700,000
683,846
T-Mobile
USA,
Inc.
,
3.75%
,
4/15/2027
600,000
576,817
1,260,663
Total
Corporate
Bonds
(cost
$32,221,420)
32,175,095
U.S.
Treasury
Government
Securities
–
4.3%
U.S.
Treasury
Notes
3.13%,
8/15/2025
1,750,000
1,713,530
4.88%,
11/30/2025
1,500,000
1,498,506
Total
U.S.
Treasury
Government
Securities
(cost
$3,234,915)
3,212,036
Shares
Investment
Companies
–
2.0%
Registered
Investment
Companies
–
2.0%
Dreyfus
Institutional
Preferred
Government
Money
Market
Fund,
Institutional
Shares,
5.27%
(d)(e)
(cost
$1,494,113)
1,494,113
1,494,113
Total
Investments
(cost
$74,101,038)
99.5%
74,015,638
Cash
and
Receivables
(Net)
0.5%
368,065
Net
Assets
100.0%
74,383,703
SOFR—Secured
Overnight
Financing
Rate
SOFRIX—Secured
Overnight
Financing
Rate
Index
(a)
Security
exempt
from
registration
pursuant
to
Rule
144A
under
the
Securities
Act
of
1933.
These
securities
may
be
resold
in
transactions
exempt
from
registration,
normally
to
qualified
institutional
buyers.
At
June
30,
2024,
these
securities
were
valued
at
$34,658,867
or
46.59%
of
net
assets.
(b)
Security
is
a
discount
security.
Income
is
recognized
through
the
accretion
of
discount.
(c)
Variable
rate
security
-
rate
shown
is
the
interest
rate
in
effect
at
period
end.
Security
description
also
includes
the
reference
rate
and
spread
if
published
and
available.
(d)
Investment
in
affiliated
issuer.
The
investment
objective
of
this
investment
company
is
publicly
available
and
can
be
found
within
the
investment
company’s
prospectus.
(e)
The
rate
shown
is
the
1-day
yield
as
of
June
30,
2024.
Holdings
and
transactions
in
these
affiliated
companies
during
the
period
ended
June
30,
2024
are
as
follows:
Description
Value
($)
6/30/23
Purchases
($)
1
Sales
($)
Value
($)
6/30/24
Dividends/
Distributions
($)
Investment
Companies
–
2.0%
Dreyfus
Institutional
Preferred
Government
Money
Market
Fund,
Institutional
Shares
39,339
75,033,420
(73,578,646)
1,494,113
97,699
Total
–
2.0%
39,339
75,033,420
(73,578,646)
1,494,113
97,699
1
Includes
reinvested
dividends/distributions.
STATEMENT
OF
ASSETS
AND
LIABILITIES
June
30,
2024
See
Notes
to
Financial
Statements
Cost
Value
Assets
($):
Investments
in
securities—See
Statement
of
Investments:
–
Unaffiliated
issuers
72,606,925
72,521,525
Affiliated
issuers
1,494,113
1,494,113
Interest
receivable
371,339
Dividends
receivable
4,031
74,391,008
Liabilities
($):
Due
to
BNY
Mellon
ETF
Investment
Adviser,
LLC—Note
3(b)
7,305
7,305
Net
Assets
($)
74,383,703
Composition
of
Net
Assets
($):
Paid-in
capital
74,494,211
Total
distributable
earnings
(loss)
(110,508)
Net
Assets
($)
74,383,703
Shares
outstanding
no
par
value
(unlimited
shares
authorized):
1,500,001
Net
asset
value
per
share
49.59
Market
price
per
share
49.58
STATEMENT
OF
OPERATIONS
Year
Ended
June
30,
2024
See
Notes
to
Financial
Statements
Investment
Income
($):
Income:
Cash
dividends:
Affiliated
issuers
97,699
Interest
2,553,163
Total
Income
2,650,862
Expenses:
Management
fee—Note
3(a)
63,419
Total
Expenses
63,419
Net
Investment
Income
2,587,443
Realized
and
Unrealized
Gain
(Loss)
on
Investments—Note
4
($):
Net
realized
gain
(loss)
on
investments
(16,315)
Net
change
in
unrealized
appreciation
(depreciation)
on
investments
241,251
Net
Realized
and
Unrealized
Gain
(Loss)
on
Investments
224,936
Net
Increase
(Decrease)
in
Net
Assets
Resulting
from
Operations
2,812,379
STATEMENT
OF
CHANGES
IN
NET
ASSETS
See
Notes
to
Financial
Statements
Year
Ended
June
30,
2024
2023
Operations
($):
Net
investment
income
2,587,443
887,148
Net
realized
gain
(loss)
on
investments
(16,315)
(9,700)
Net
change
in
unrealized
appreciation
(depreciation)
on
investments
241,251
117,584
Net
Increase
(Decrease)
in
Net
Assets
Resulting
from
Operations
2,812,379
995,032
Distributions
($):
Distributions
to
shareholders
(2,459,830)
(878,254)
Beneficial
Interest
Transactions
($):
Proceeds
from
shares
sold
47,001,580
4,886,067
Cost
of
shares
redeemed
(2,473,521)
(2,436,261)
Transaction
fees—Note
5
4,948
732
Increase
(Decrease)
in
Net
Assets
from
Beneficial
Interest
Transactions
44,533,007
2,450,538
Total
Increase
(Decrease)
in
Net
Assets
44,885,556
2,567,316
Net
Assets
($):
Beginning
of
Period
29,498,147
26,930,831
End
of
Period
74,383,703
29,498,147
Changes
in
Shares
Outstanding:
Shares
sold
950,000
100,000
Shares
redeemed
(50,000)
(50,000)
Net
Increase
(Decrease)
in
Shares
Outstanding
900,000
50,000
The
following
table
describes
the
performance
for
the
fiscal
periods
indicated.
See
Notes
to
Financial
Statements
Year
Ended
June
30,
For
the
Period
from
August
11,
2021
(a)
to
June
30,
2022
2024
2023
Per
Share
Data
($):
Net
asset
value,
beginning
of
period
49.16
48.97
50.00
Investment
Operations:
Net
investment
income
(b)
2.41
1.56
0.17
Net
realized
and
unrealized
gain
(loss)
on
investments
0.36
0.18
(0.94)
Total
from
Investment
Operations
2.77
1.74
(0.77)
Distributions:
–
–
–
Dividends
from
net
investment
income
(2.34)
(1.55)
(0.27)
Transaction
fees
(b)
0.00
(c)
0.00
(c)
0.01
Net
asset
value,
end
of
period
49.59
49.16
48.97
Market
price,
end
of
period
49.58
49.15
48.96
Net
Asset
Value
Total
Return
(%)
(d)
5.76
3.64
(1.54)
(e)
Market
Price
Total
Return
(%)
(d)
5.77
3.62
(1.55)
(e)
Ratios/Supplemental
Data
(%):
Ratio
of
total
expenses
to
average
net
assets
0.12
0.12
0.12
(f)
Ratio
of
net
investment
income
to
average
net
assets
4.90
3.19
0.39
(f)
Portfolio
Turnover
Rate
(g)
42.44
20.55
43.10
Net
Assets,
end
of
period
($
x
1,000)
74,384
29,498
26,931
(a)
Commencement
of
operations.
(b)
Based
on
average
shares
outstanding.
(c)
Amount
represents
less
than
$0.01
per
share.
(d)
Net
asset
value
total
return
is
calculated
assuming
an
initial
investment
made
at
the
net
asset
value
at
the
beginning
of
the
period,
reinvestment
of
all
dividends
and
distributions
at
net
asset
value
during
the
period,
and
redemption
at
net
asset
value
on
the
last
day
of
the
period.
Net
asset
value
total
return
includes
adjustments
in
accordance
with
accounting
principles
generally
accepted
in
the
United
States
of
America
and
as
such,
the
net
asset
value
for
financial
reporting
purposes
and
the
returns
based
upon
those
net
asset
values
may
differ
from
the
net
asset
value
and
returns
for
shareholder
transactions.
Market
price
total
return
is
calculated
assuming
an
initial
investment
made
at
the
market
price
at
the
beginning
of
the
period,
reinvestment
of
all
dividends
and
distributions
at
market
price
during
the
period,
and
sale
at
the
market
price
on
the
last
day
of
the
period.
Total
investment
returns
calculated
for
a
period
of
less
than
one
year
are
not
annualized.
(e)
The
net
asset
value
total
return
and
the
market
price
total
return
is
calculated
from
fund
inception.
The
inception
date
is
the
first
date
the
fund
was
available
on
NYSE
Arca,
Inc.
(f)
Annualized.
(g)
Portfolio
turnover
rate
is
not
annualized
for
periods
less
than
one
year,
if
applicable,
and
does
not
include
securities
received
or
delivered
from
processing
creations
or
redemptions.
NOTES
TO
FINANCIAL
STATEMENTS
NOTE
1—Organization:
BNY
Mellon
Ultra
Short
Income
ETF (the “fund”) is a
separate
diversified series
of
BNY
Mellon
ETF
Trust
(the
“Trust”),
which is
registered as
a
Massachusetts
business
trust
under
the
Investment
Company
Act
of
1940,
as
amended
(the
“Act”),
as
an
open-ended
management
investment
company.
The
Trust
operates
as
a
series
company
currently
consisting
of
thirteen
series,
including
the
fund.
The
investment
objective
of
the
fund
is
to
seek
high
current
income
consistent
with
the
maintenance
of
liquidity
and
low
volatility
of
principal.
BNY
Mellon
ETF
Investment
Adviser,
LLC
(the
“Adviser”),
a
wholly-owned
subsidiary
of
The
Bank
of
New
York
Mellon
Corporation
(“BNY”),
serves
as
the
fund’s
investment
adviser. Dreyfus,
a
division
of
Mellon
Investments
Corporation (the
“Sub-Adviser”),
an
indirect wholly-owned
subsidiary
of
BNY
and
an
affiliate
of
the
Adviser,
serves
as
the
fund’s
sub-adviser.
The
Bank
of
New
York
Mellon,
a
subsidiary
of
BNY
and
an
affiliate
of
the
Adviser,
serves
as
administrator,
custodian
and
transfer
agent
with
the
Trust.
BNY
Mellon
Securities
Corporation
(the
“Distributor”),
a wholly-owned
subsidiary
of
the
Adviser,
is
the
distributor
of
the
fund’s
shares.
The
shares
of
the
fund
are
referred
to
herein
as
“Shares”
or
“Fund
Shares.”
Fund
Shares
are
listed
and
traded
on
NYSE
Arca,
Inc.
The
market
price
of
each
Share
may
differ
to
some
degree
from
the
fund’s
net
asset
value
(“NAV”).
Unlike
conventional
mutual
funds,
the
fund
issues
and
redeems
Shares
on
a
continuous
basis,
at
NAV,
only
in
a
large
specified
number
of
Shares,
each
called
a
“Creation
Unit”.
Creation
Units
are
issued
and
redeemed
principally
in
exchange
for
the
deposit
or
delivery
of
a
basket
of
securities.
Except
when
aggregated
in
Creation
Units
by
Authorized
Participants,
the
Shares
are
not
individually
redeemable
securities
of
the
fund.
Individual
Fund
Shares
may
only
be
purchased
and
sold
on
the
NYSE
Arca,
Inc.,
other
national
securities
exchanges,
electronic
crossing
networks
and
other
alternative
trading
systems
through
your
broker-dealer
at
market
prices.
Because
Fund
Shares
trade
at
market
prices
rather
than
at
NAV,
Fund
Shares
may
trade
at
a
price
greater
than
NAV
(premium)
or
less
than
NAV
(discount).
When
buying
or
selling
Shares
in
the
secondary
market,
you
may
incur
costs
attributable
to
the
difference
between
the
highest
price
a
buyer
is
willing
to
pay
to
purchase
Shares
of
the
fund
(bid)
and
the
lowest
price
a
seller
is
willing
to
accept
for
Shares
of
the
fund
(ask).
NOTE
2—Significant
Accounting
Policies:
The
Financial
Accounting
Standards
Board
(“FASB”)
Accounting
Standards
Codification
(“ASC”)
is
the
exclusive
reference
of
authoritative
U.S.
generally
accepted
accounting
principles
(“GAAP”)
recognized
by
the
FASB
to
be
applied
by
nongovernmental
entities.
Rules
and
interpretive
releases
of
the
SEC
under
authority
of
federal
laws
are
also
sources
of
authoritative
GAAP
for
SEC
registrants. The
fund
is an
investment
company
and
applies
the
accounting
and
reporting
guidance
of
the
FASB
ASC
Topic
946
Financial
Services-Investment
Companies. The
fund’s
financial
statements
are
prepared
in
accordance
with
GAAP,
which
may
require
the
use
of
management
estimates
and
assumptions.
Actual
results
could
differ
from
those
estimates.
The
Trust
enters
into
contracts
that
contain
a
variety
of
indemnifications.
The
fund’s
maximum
exposure
under
these
arrangements
is
unknown.
The
fund
does
not
anticipate
recognizing
any
loss
related
to
these
arrangements.
(a)
Portfolio
valuation:
The
fair
value
of
a
financial
instrument
is
the
amount
that
would
be
received
to
sell
an
asset
or
paid
to
transfer
a
liability
in
an
orderly
transaction
between
market
participants
at
the
measurement
date
(i.e.,
the
exit
price).
GAAP
establishes
a
fair
value
hierarchy
that
prioritizes
the
inputs
of
valuation
techniques
used
to
measure
fair
value.
This
hierarchy
gives
the
highest
priority
to
unadjusted
quoted
prices
in
active
markets
for
identical
assets
or
liabilities
(Level
1
measurements)
and
the
lowest
priority
to
unobservable
inputs
(Level
3
measurements).
Additionally,
GAAP
provides
guidance
on
determining
whether
the
volume
and
activity
in
a
market
has
decreased
significantly
and
whether
such
a
decrease
in
activity
results
in
transactions
that
are
not
orderly.
GAAP
requires
enhanced
disclosures
around
valuation
inputs
and
techniques
used
during
annual
and
interim
periods.
Various
inputs
are
used
in
determining
the
value
of
the
fund’s
investments
relating
to
fair
value
measurements.
These
inputs
are
summarized
in
the
three
broad
levels
listed
below:
Level
1
—
unadjusted
quoted
prices
in
active
markets
for
identical
investments.
Level
2
—
other
significant
observable
inputs
(including
quoted
prices
for
similar investments,
interest
rates,
prepayment
speeds,
credit
risk,
etc.).
Level
3
—
significant
unobservable
inputs
(including
the
fund’s
own
assumptions
in
determining
the
fair
value
of
investments).
The
inputs
or
methodology
used
for
valuing
securities
are
not
necessarily
an
indication
of
the
risk
associated
with
investing
in
those
securities.
Changes
in
valuation
techniques
may
result
in
transfers
in
or
out
of
an
assigned
level
within
the
disclosure
hierarchy.
Valuation
techniques
used
to
value
the
fund’s
investments
are
as
follows:
Registered
investment
companies
that
are
not
traded
on
an
exchange
are
valued
at
their
net
asset
value
and
are
generally
categorized
within
Level 1
of
the
fair
value
hierarchy.
NOTES
TO
FINANCIAL
STATEMENTS
(continued)
The
Trust’s Board
of
Trustees
(the
“Board”)
has
designated
the
Adviser
as
the
fund’s
valuation
designee
to
make
all
fair
value
determinations
with
respect
to
the
fund’s
portfolio
of
investments,
subject
to
the
Board’s
oversight
and
pursuant
to
Rule
2a-5
under
the
Act.
Investments
in
debt
securities
excluding
short-term
investments
(other
than
U.S.
Treasury
Bills)
are
valued
each
business
day
by
one
or
more
independent
pricing
services
(each,
a
“Service”)
approved
by the Board.
Investments
for
which
quoted
bid
prices
are
readily
available
and
are
representative
of
the
bid
side
of
the
market
in
the
judgment
of
a
Service
are
valued
at
the
mean
between
the
quoted
bid
prices
(as
obtained
by
a
Service
from
dealers
in
such
securities)
and
asked
prices
(as
calculated
by
a
Service
based
upon
its
evaluation
of
the
market
for
such
securities).
Securities
are
valued
as
determined
by
a
Service,
based
on
methods
which
include
consideration
of
the
following:
yields
or
prices
of
securities
of
comparable
quality,
coupon,
maturity
and
type;
indications
as
to
values
from
dealers;
and
general
market
conditions.
Each
Service
and
independent
valuation
firm
is
engaged
under
the
general
oversight
of
the
Board.
Overnight
and
certain
other
short-term
debt
instruments
(excluding
U.S.
Treasury
Bills)
will
be
valued
by
the
amortized
cost
method,
which
approximates
value,
unless
a
Service
provides
a
valuation
for
such
security
or,
in
the
opinion
of
the
Board
or
a
committee
or
other
persons
designated
by
the
Board,
the
amortized
cost
method
would
not
represent
fair
value. These
securities
are
generally
categorized
within
Level
2
of
the
fair
value
hierarchy.
When
market
quotations
or
official
closing
prices
are
not
readily
available,
or
are
determined
not
to
reflect
fair
value
accurately,
they are
valued
at
fair
value
as
determined
in
good
faith
based
on
procedures
approved
by
the
Board.
Fair
value
of
investments
may
be
determined
by
valuation
designee
using
such
information
as
it
deems
appropriate
under
the
circumstances.
Certain
factors
may
be
considered
when
fair
valuing
investments
such
as:
fundamental
analytical
data,
the
nature
and
duration
of
restrictions
on
disposition,
an
evaluation
of
the
forces
that
influence
the
market
in
which
the
securities
are
purchased
and
sold,
and
public
trading
in
similar
securities
of
the
issuer
or
comparable
issuers.
These
securities
are
either
categorized
within
Level
2
or
3
of
the
fair
value
hierarchy
depending
on
the
relevant
inputs
used.
For
securities
where
observable
inputs
are
limited,
assumptions
about
market
activity
and
risk
are
used
and
are
generally
categorized
within
Level
3
of
the
fair
value
hierarchy.
The
table
below
summarizes
the
inputs
used
as
of June
30,
2024
in
valuing
the
fund’s
investments:
Fair
Value
Measurements
(b) Securities
transactions
and
investment
income:
Securities
transactions
are
recorded
on
a
trade
date
basis.
Realized
gains
and
losses
from
securities
transactions
are
recorded
on
the
identified
cost
basis.
Dividend
income
is
recognized
on
the
ex-dividend
date
and
interest
income,
including,
where
applicable,
accretion
of
discount
and
amortization
of
premium
on
investments,
is
recognized
on
the
accrual
basis.
(c)
Affiliated
issuers:
Investments
in
other
investment
companies
advised
by
the
Adviser
or
its
affiliates are
defined
as
“affiliated”
under
the
Act.
(d)
Market
Risk:
The
value
of
the
securities
in
which
the
fund
invests
may
be
affected
by
political,
regulatory,
economic
and
social
developments,
and
developments
that
impact
specific
economic
sectors,
industries
or
segments
of
the
market.
In
addition,
turbulence
in
financial
markets
and
reduced
liquidity
in
equity,
credit
and/or
fixed
income
markets
may
negatively
affect
many
issuers,
which
could
adversely
affect
the
fund.
Global
economies
and
financial
markets
are
becoming
increasingly
interconnected,
and
conditions
and
events
in
one
country,
region
or
financial
market
may
adversely
impact
issuers
in
a
different
country,
region
or
financial
market.
These
risks
may
be
magnified
if
certain
events
or
developments
adversely
interrupt
the
global
supply
chain;
in
these
and
other
circumstances,
such
risks
might
affect
companies
world-wide.
Level
1
-
Unadjusted
Quoted
Prices
Level
2
-
Other
Significant
Observable
Inputs
Level
3
-
Significant
Unobservable
Inputs
Total
Assets
($)
Investments
In
Securities:
†
Asset-Backed
Securities
—
85,396
—
85,396
Commercial
Paper
—
37,048,998
—
37,048,998
Corporate
Bonds
—
32,175,095
—
32,175,095
U.S.
Treasury
Government
Securities
—
3,212,036
—
3,212,036
Investment
Companies
1,494,113
—
—
1,494,113
†
See
Statement
of
Investments
for
additional
detailed
categorizations,
if
any.
Fixed-Income
Market
Risk:
The
market
value
of
a
fixed-income
security
may
decline
due
to
general
market
conditions
that
are
not
specifically
related
to
a
particular
company,
such
as
real
or
perceived
adverse
economic
conditions,
changes
in
the
outlook
for
corporate
earnings,
changes
in
interest
or
currency
rates
or
adverse
investor
sentiment
generally.
The
fixed-income
securities
market
can
be
susceptible
to
increases
in
volatility
and
decreases
in
liquidity.
Liquidity
can
decline
unpredictably
in
response
to
overall
economic
conditions
or
credit
tightening.
Increases
in
volatility
and
decreases
in
liquidity
may
be
caused
by
a
rise
in
interest
rates
(or
the
expectation
of
a
rise
in
interest
rates).
An
unexpected
increase
in
redemption
requests,
including
requests
from
Authorized
Participants
who
may
own
a
significant
percentage
of
the
fund’s
shares,
which
may
be
triggered
by
market
turmoil
or
an
increase
in
interest
rates,
could
cause
the
fund
to
sell
its
holdings
at
a
loss
or
at
undesirable
prices
and
adversely
affect
the
fund’s
share
price
and
increase
the
fund’s
liquidity
risk,
fund
expenses
and/or
taxable
distributions.
Federal
Reserve
policy
in
response
to
market
conditions,
including
with
respect
to
interest
rates,
may
adversely
affect
the
value,
volatility
and
liquidity
of
dividend
and
interest
paying
securities.
Policy
and
legislative
changes
worldwide
are
affecting
many
aspects
of
financial
regulation.
The
impact
of
these
changes
on
the
markets
and
the
practical
implications
for
market
participants
may
not
be
fully
known
for
some
time.
Commercial
Paper
Risk:
Commercial
paper
is
a
short-term
obligation
with
a
maturity
generally
ranging
from one
to
270
days
and
is
issued
by
U.S.
or
foreign
companies
or
other
entities
in
order
to
finance
their
current
operations.
Such
investments
are
unsecured
and
usually
discounted
from
their
value
at
maturity.
The
value
of
commercial
paper
may
be
affected
by
changes
in
the
credit
rating
or
financial
condition
of
the
issuing
entities
and
will
tend
to
fall
when
interest
rates
rise
and
rise
when
interest
rates
fall.
Authorized
Participants,
Market
Makers
and
Liquidity
Providers
Risk:
The
fund
has
a
limited
number
of
financial
institutions
that
may
act
as
Authorized
Participants,
which
are
responsible
for
the
creation
and
redemption
activity
for
the
fund.
In
addition,
there
may
be
a
limited
number
of
market
makers
and/or
liquidity
providers
in
the
marketplace.
To
the
extent
either
of
the
following
events
occur,
fund
shares
may
trade
at
a
material
discount
to
net
asset
value
and
possibly
face
delisting:
(i)
Authorized
Participants
exit
the
business
or
otherwise
become
unable
to
process
creation
and/or
redemption
orders
and
no
other
Authorized
Participants
step
forward
to
perform
these
services,
or
(ii)
market
makers
and/or
liquidity
providers
exit
the
business
or
significantly
reduce
their
business
activities
and
no
other
entities
step
forward
to
perform
their
functions.
(e)
Dividends
and
distributions
to
shareholders:
Dividends
and
distributions
are
recorded
on
the
ex-dividend
date.
Dividends
from
net
investment
income
are
normally
declared
and
paid
on
a
monthly
basis.
Dividends
from
net
realized
capital
gains,
if
any,
are
normally
declared
and
paid
annually,
but
the
fund
may
make
distributions
on
a
more
frequent
basis
to
comply
with
the
distribution
requirements
of
the
Internal
Revenue
Code
of
1986,
as
amended
(the
“Code”).
To
the
extent
that
net
realized
capital
gains
can
be
offset
by
capital
loss
carryovers
of
a
fund,
it
is
the
policy
of
the
fund
not
to
distribute
such
gains.
Income
and
capital
gain
distributions
are
determined
in
accordance
with
income
tax
regulations,
which
may
differ
from
GAAP.
(f)
Federal
income
taxes:
It
is
the
policy
of
the
fund
to
continue to
qualify
as
a
regulated
investment
company,
if
such
qualification
is
in
the
best
interests
of
its
shareholders,
by
complying
with
the
applicable
provisions
of
the
Code,
and
to
make
distributions
of
taxable
income
and
net
realized
capital
gain sufficient
to
relieve
it
from
substantially
all
federal
income
and
excise
taxes.
As
of
and
during
the period
ended June
30,
2024,
the
fund
did
not
have
any
liabilities
for
any
uncertain
tax
positions.
The
fund
recognizes
interest
and
penalties,
if
any,
related
to
uncertain
tax
positions
as
income
tax
expense
in
the
Statement
of
Operations.
During
the period
ended June
30,
2024,
the
fund
did
not
incur
any
interest
or
penalties.
Each
tax
year
in
the
three-year
period
ended June
30,
2024
remains
subject
to
examination
by
the
Internal
Revenue
Service
and
state
taxing
authorities.
At June
30,
2024,
the
components
of
accumulated
earnings
on
a
tax
basis
were
as
follows:
undistributed
ordinary
income
$318,928,
accumulated
capital
losses
$324,269,
and
unrealized depreciation
$105,167.
The
fund is
permitted
to
carry
forward
capital
losses
for
an
unlimited
period.
Furthermore,
capital
loss
carryovers
retain
their
character
as
either
short-term
or
long-term
capital
losses.
The
accumulated
capital
loss
carryover
is
available
for
federal
income
tax
purposes
to
be
applied
against
future
net
realized
capital
gains,
if
any,
realized
subsequent
to
June
30,
2024.
The
fund
has
$119,472
of
short-term
capital
losses
and
$204,797
of
long-term
capital
losses
which
can
be
carried
forward
for
an
unlimited
period.
The
tax
character
of
distributions
paid
to
shareholders
during
the
fiscal
years
ended
June
30,
2024
and
June
30,
2023
were
as
follows:
ordinary
income
$2,459,830
and
$878,254,
respectively.
NOTES
TO
FINANCIAL
STATEMENTS
(continued)
NOTE
3—Management
Fee,
Sub-Advisory
Fee
and
Other
Transactions
with
Affiliates:
(a)
Pursuant
to
a
management
agreement
with
the
Adviser,
the
management
fee
is computed
at
an
annual
rate of
0.12%
of
the
value
of
the
fund’s
average
daily
net
assets
and
is
payable
monthly.
The
fund’s
management
agreement
provides
that
the
Adviser
pays
substantially
all
expenses
of
the
fund,
except
for
the
management
fees,
payments
under
the
fund’s
12b-1
plan
(if
any),
interest
expenses,
taxes,
acquired
fund
fees
and
expenses,
brokerage
commissions,
costs
of
holding
shareholder
meetings,
fees
and
expenses
associated
with
the
fund’s
securities
lending
program,
and
litigation
and
potential
litigation
and
other
extraordinary
expenses
not
incurred
in
the
ordinary
course
of
the
fund’s
business.
The
Adviser
may
from
time
to
time
voluntarily
waive
and/or
reimburse
fees
or
expenses
in
order
to
limit
total
annual
fund
operating
expenses.
Any
such
voluntary
waiver
or
reimbursement
may
be
eliminated
by
the
Adviser
at
any
time.
During
the
period
ended
June
30,
2024,
there
was
no
reduction
in
expenses
pursuant
to
the
undertaking.
Pursuant
to
a
sub-investment
advisory
agreement
between
the
Adviser
and
the
Sub-Adviser,
the
Sub-Adviser
serves
as
the
fund’s
sub-
adviser
responsible
for
the
day-to-day
management
of
the
fund’s
portfolio.
The
Adviser
pays
the
Sub-Adviser
a
monthly
fee
at
an
annual
percentage
of
the
value
of
the
fund’s
average
daily
net
assets.
The
Adviser
has
obtained
an
exemptive
order
from
the
SEC
(the
“Order”),
upon
which
the
fund
may
rely,
to
use
a
manager
of
managers
approach
that
permits
the
Adviser,
subject
to
certain
conditions
and
approval
by
the
Board,
to
enter
into
and
materially
amend
sub-investment
advisory
agreements
with
one
or
more
sub-advisers
who
are
either
unaffiliated
or
affiliated
with
the
Adviser
without
obtaining
shareholder
approval.
The
Order
also
relieves
the
fund
from
disclosing
the
sub-advisory
fee
paid
by
the
Adviser
to
a
Sub-Adviser
in
documents
filed
with
the
SEC
and
provided
to
shareholders.
In
addition,
pursuant
to
the
Order,
it
is
not
necessary
to
disclose
the
sub-advisory
fee
payable
by
the
Adviser
separately
to
a
Sub-Adviser
that
is
a
wholly-owned
subsidiary
(as
defined
in
the
1940
Act)
of
BNY
in
documents
filed
with
the
SEC
and
provided
to
shareholders;
such
fees
are
to
be
aggregated
with
fees
payable
to
the
Adviser.
The
Adviser
has
ultimate
responsibility
(subject
to
oversight
by
the
Board)
to
supervise
any
Sub-Adviser
and
recommend
the
hiring,
termination,
and
replacement
of
any
Sub-Adviser
to
the
Board.
Pursuant
to
a
sub-investment
advisory
agreement
between
the
Adviser
and
the
Sub-Adviser,
the
Adviser
pays
the
Sub-Adviser
a
monthly
fee
at
an
annual
rate
of
0.06%
of
the
value
of
the
fund’s
average
daily
net
assets.
The
Adviser,
and
not
the
fund,
pays
the
Sub-Adviser
fee
rate.
(b)
The
fund
has
an
arrangement
with
The
Bank
of
New
York
Mellon
(the
“Custodian”),
a
subsidiary
of
BNY
and
an
affiliate
of
the
Adviser, whereby
the
fund
will
receive
interest
income
or
be
charged
overdraft
fees
when
cash
balances
are
maintained.
For
financial
reporting
purposes,
the
fund
includes
this
interest
income
and
overdraft
fees,
if
any,
as
interest
income
in
the
Statement
of
Operations.
The
components
of
“Due
to
BNY
Mellon
ETF Investment
Adviser,
LLC”
in
the
Statement
of
Assets
and
Liabilities
consist
of:
management
fee
of $7,305.
(c)
Each
Board
member
serves
as
a
Board
member
of
each
fund
within
the
Trust.
The
Board
members
are
not
compensated
directly
by
the
fund.
The
Board
members
are
paid
by
the
Adviser
from
the
unitary
management
fees
paid
to
the
Adviser
by
the
funds
within
the
Trust,
including
the
fund.
NOTE
4—Securities
Transactions:
The
aggregate
amount
of
purchases
and
sales
(including
paydowns)
of
investment
securities,
excluding
short-term
securities
and
in-kind
transactions,
during
the
period
ended
June
30,
2024, amounted
to $27,821,141
and
$11,531,328,
respectively.
At June
30,
2024,
the
cost
of
investments
for
federal
income
tax
purposes
was
$74,120,805;
accordingly,
accumulated
net
unrealized
depreciation on
investments
for
federal
income
tax
purposes
was
$105,167,
consisting
of
gross
appreciation
of
$57,994
and
gross
depreciation
of
$163,161.
NOTE
5—Shareholder
Transactions:
The
fund
issues
and
redeems
its
shares
on
a
continuous
basis,
at
NAV,
to
certain
institutional
investors
known
as
“Authorized
Participants”
(typically
market
makers
or
other
broker-dealers)
only
in
a
large
specified
number
of
shares
called
a
Creation
Unit.
Except
when
aggregated
in
Creation
Units,
shares
of
the
fund
are
not
redeemable.
The
value
of
the
fund
is
determined
once
each
business
day.
The
Creation
Unit
size
for the
fund
may
change.
Authorized
Participants
will
be
notified
of
such
change.
Creation
Unit
transactions
may
be
made
in-kind,
for
cash,
or
for
a
combination
of
securities
and
cash.
The
principal
consideration
for
creations
and
redemptions
for
the
fund
is
in-kind,
although
this
may
be
revised
at
any
time
without
notice.
The
Trust
issues
and
sells
shares
of
the
fund
only:
in
Creation
Units
on
a
continuous
basis
through
the
Distributor,
without
a
sales
load,
at
their
NAV
per
share
determined
after
receipt
of
an
order,
on
any
Business
Day,
in
proper
form
pursuant
to
the
terms
of
the
Authorized
Participant
Agreement.
Transactions
in
capital
shares
for
the
fund
are
disclosed
in
detail
in
the
Statement
of
Changes
in
Net
Assets.
The
consideration
for
the
purchase
of
Creation
Units
of the
fund
may
consist
of
the
in-kind
deposit
of
a
designated
portfolio
of
securities
and
a
specified
amount
of
cash.
Investors
purchasing
and
redeeming
Creation
Units
may
pay
a
purchase
transaction
fee
and
a
redemption
transaction
fee
directly
to
the
Trust
and/or
custodian
to
offset
transfer
and
other
transaction
costs
associated
with
the
issuance
and
redemption
of
Creation
Units,
including
Creation
Units
for
cash.
The
Adviser
or
its
affiliates
(the
“Selling
Shareholder”)
may
purchase
Creation
Units
through
a
broker-dealer
to
“seed”
(in
whole
or
in
part)
funds
as
they
are
launched
or
may
purchase shares
from
broker-dealers
or
other
investors
that
have
previously
provided
“seed”
for
funds
when
they
were
launched
or
otherwise
in
secondary
market
transactions.
Because
the
Selling
Shareholder
may
be
deemed
an
affiliate
of
such
funds,
the
fund shares
are
being
registered
to
permit
the
resale
of
these
shares
from
time
to
time
after
purchase.
The
fund
will
not
receive
any
of
the
proceeds
from
resale
by
the
Selling
Shareholders
of
these
fund
shares. An
additional
variable
fee
may
be
charged
for
certain
transactions.
Such
variable
charges,
if
any,
are
included
in
“Transaction
fees”
on
the
Statement
of
Changes
in
Net
Assets.
Seed
Capital:
As
of
June
30,
2024,
MBC
Investments
Corporation,
a
wholly-owned
subsidiary
of
BNY,
held
499,001
shares
of
the
fund.
In-kind
Redemptions:
For
financial
reporting
purposes,
in-kind
redemptions
are
treated
as
sales
of
securities
resulting
in
realized
capital
gains
or
losses
to
the
fund.
Because
such
gains
or
losses
are
not
taxable
to
the
fund
and
are
not
distributed
to
existing
fund
shareholders,
the
gains
or
losses
are
reclassified
from
accumulated
net
realized
gain
(loss)
to
paid-in
capital
at
the
end
of
the
fund’s
tax
year.
These
reclassifications
have
no
effect
on
net
assets
or
net
asset
value
per
share.
During
the
year
ended
June
30,
2024,
the
fund
had
no
in-kind
transactions.
REPORT
OF
INDEPENDENT
REGISTERED
PUBLIC
ACCOUNTING
FIRM
To
the
Shareholders
and
the
Board
of
Trustees
of
BNY
Mellon
Ultra
Short
Income
ETF
Opinion
on
the
Financial
Statements
We
have
audited
the
accompanying
statement
of
assets
and
liabilities
of
BNY
Mellon
Ultra
Short
Income
ETF
(the
“Fund”)
(one
of
the
funds
constituting
BNY
Mellon
ETF
Trust
(the
“Trust”)),
including
the
statement
of
investments,
as
of
June
30,
2024,
and
the
related
statement
of
operations
for
the
year
then
ended,
the
statements
of
changes
in
net
assets
for
each
of
the
two
years
in
the
period
then
ended,
the
financial
highlights
for
the
two
years
in
the
period
then
ended
and
the
period
from
August
11,
2021
(commencement
of
operations)
through
June
30,
2022
and
the
related
notes
(collectively
referred
to
as
the
“financial
statements”).
In
our
opinion,
the
financial
statements
present
fairly,
in
all
material
respects,
the
financial
position
of
the
Fund
(one
of
the
funds
constituting
BNY
Mellon
ETF
Trust)
at
June
30,
2024,
the
results
of
its
operations
for
the
year
then
ended,
the
changes
in
its
net
assets
for
each
of
the
two
years
in
the
period
then
ended
and
its
financial
highlights
for
each
of
the
two
years
in
the
period
then
ended
and
the
period
from
August
11,
2021
(commencement
of
operations)
through
June
30,
2022,
in
conformity
with
U.S.
generally
accepted
accounting
principles.
Basis
for
Opinion
These
financial
statements
are
the
responsibility
of
the
Trust’s
management.
Our
responsibility
is
to
express
an
opinion
on
the
Fund’s
financial
statements
based
on
our
audits.
We
are
a
public
accounting
firm
registered
with
the
Public
Company
Accounting
Oversight
Board
(United
States)
(“PCAOB”)
and
are
required
to
be
independent
with
respect
to
the
Trust
in
accordance
with
the
U.S.
federal
securities
laws
and
the
applicable
rules
and
regulations
of
the
Securities
and
Exchange
Commission
and
the
PCAOB.
We
conducted
our
audits
in
accordance
with
the
standards
of
the
PCAOB.
Those
standards
require
that
we
plan
and
perform
the
audit
to
obtain
reasonable
assurance
about
whether
the
financial
statements
are
free
of
material
misstatement,
whether
due
to
error
or
fraud.
The
Trust
is
not
required
to
have,
nor
were
we
engaged
to
perform,
an
audit
of
the
Trust’s
internal
control
over
financial
reporting.
As
part
of
our
audits,
we
are
required
to
obtain
an
understanding
of
internal
control
over
financial
reporting
but
not
for
the
purpose
of
expressing
an
opinion
on
the
effectiveness
of
the
Trust’s
internal
control
over
financial
reporting.
Accordingly,
we
express
no
such
opinion.
Our
audits
included
performing
procedures
to
assess
the
risks
of
material
misstatement
of
the
financial
statements,
whether
due
to
error
or
fraud,
and
performing
procedures
that
respond
to
those
risks.
Such
procedures
included
examining,
on
a
test
basis,
evidence
regarding
the
amounts
and
disclosures
in
the
financial
statements.
Our
procedures
included
confirmation
of
securities
owned
as
of
June
30,
2024,
by
correspondence
with
the
custodian,
brokers
and
others;
when
replies
were
not
received
from
brokers
and
others,
we
performed
other
auditing
procedures.
Our
audits
also
included
evaluating
the
accounting
principles
used
and
significant
estimates
made
by
management,
as
well
as
evaluating
the
overall
presentation
of
the
financial
statements.
We
believe
that
our
audits
provide
a
reasonable
basis
for
our
opinion.
We
have
served
as
the
auditor
of
one
or
more
investment
companies
in
the
BNY
Mellon
Family
of
Funds
since
at
least
1957,
but
we
are
unable
to
determine
the
specific
year.
New
York,
New
York
August
19,
2024
IMPORTANT
TAX
INFORMATION
(Unaudited)
Form
1099-DIV,
Form
1042-S
and
other
year–end
tax
information
provide
shareholders
with
actual
calendar
year
amounts
that
should
be
included
in
their
tax
returns.
Shareholders
should
consult
their
tax
advisers.
The
following
distribution
information
is
being
provided
as
required
by
the
Internal
Revenue
Code
or
to
meet
a
specific
state’s
requirement.
The
fund
designates
the
following
amounts
or,
if
subsequently
determined
to
be
different,
the
maximum
amount
allowable
for
its
fiscal
year
ended June
30,
2024:
For
federal
tax
purposes
the
fund
hereby
reports
81.77%
of
ordinary
income
dividends
paid
during
the
fiscal
year
ended
June
30,
2024 as
qualifying
interest
related
dividends.
BOARD
MEMBERS
INFORMATION
(Unaudited)
INDEPENDENT
BOARD
MEMBERS
J.
Charles
Cardona
(68)
Chairman
of
the
Board
(2020)
Principal
Occupation
During
Past
5
Years:
•
BNY Mellon
Family of Funds,
Interested
Director
(2014
–
2018),
Independent Director
(2019 – Present)
•
BNY
Mellon
Liquidity
Funds,
Director
(2004
–
Present)
and
Chairman
(2019
–
2021)
.
No.
of
Portfolios
for
which
Board
Member
Serves:
35,
including
22
managed
by
an
affiliate
of
the
Adviser
Kristen
M.
Dickey
(64)
Board
Member
(2020)
Principal
Occupation
During
Past
5
Years:
Independent
board
director
of
Marstone,
Inc.,
a
financial
technology
company
(since
2018);
Lead
non-executive
director
for
Aperture
Investors,
LLC,
an
investment
management
firm
(since
2018);
Managing
Director—Global
Head
of
Index
Strategy
at
BlackRock,
Inc.
(until
2017)
No.
of
Portfolios
for
which
Board
Member
Serves:
13
F.
Jack
Liebau,
Jr.
(60)
Board
Member
(2020)
Principal
Occupation
During
Past
5
Years:
Managing
Director
at
Beach
Investment
Counsel,
a
financial
advisory
firm
(since
2020)
Corporate
director
(since
2015)
Other
Public
Company
Board
Memberships
During
Past
5
Years:
Myers
Industries,
an
industrial
company,
Director
(2015
–
Present);
Chairman
of
Board
(2016
–
Present)
STRATTEC
Security
Corp.,
an
automotive
power
and
security
solutions
company,
Director
(2023
–
Present);
Chairman
of
Board
(2024
–
Present)
No.
of
Portfolios
for
which
Board
Member
Serves:
13
Jill
I.
Mavro
(52)
Board
Member
(2020)
Principal
Occupation
During
Past
5
Years:
Managing
director
at
Ecoban,
LLC,
a
financial
technology
consulting
company
(since
2020)
Founder
and
Principal
of
Spoondrift
Advisory,
LLC
(since
2018);
Senior
Managing
Director,
Head
of
Strategic
Relationships
and
Member
of
SPDR
Executive
Committee
at
State
Street
Global
Advisors
(until
2018)
No.
of
Portfolios
for
which
Board
Member
Serves:
13
Kevin
W.
Quinn
(65)
Board
Member
(2020)
Principal
Occupation
During
Past
5
Years:
Partner
at
PricewaterhouseCoopers,
LLC
(until
2019)
No.
of
Portfolios
for
which
Board
Member
Serves:
13
Stacy
L.
Schaus
(64)
Board
Member
(2020)
Principal
Occupation
During
Past
5
Years:
Chief
Executive
Officer
of
the
Schaus
Group
LLC,
a
consulting
firm
(since
2019);
Advisory
board
member
of
A&P
Capital,
a
consulting
firm
(from
2019-2021);
Executive
Vice
President—Defined
Contribution
Practice
Founder
at
PIMCO
Investment
Management
(until
2018).
No.
of
Portfolios
for
which
Board
Member
Serves:
13
OFFICERS
OF
THE
TRUST
(Unaudited)
DAVID
DIPETRILLO,
President
since
February
2020.
Vice
President
and
Director
of
BNYM
Investment
Adviser
since
February
2021;
Head
of
North
America
Distribution,
BNY
Investments
since
February
2023;
and
Head
of
North
America
Product,
BNY
Investments
from
January
2018
to
February
2023.
He
is
an
officer
of
51
investment
companies
(comprised
of
96
portfolios)
managed
by
BNYM
Investment
Adviser
or
an
affiliate
of
BNYM
Investment
Adviser. He
is
46
years
old
and
has
been
an
employee
of
BNY
since
2005.
PETER
M.
SULLIVAN,
Chief
Legal
Officer
since
July
2021,
Vice
President
and
Assistant
Secretary
since
February
2020.
Chief
Legal
Officer
of
BNYM
Investment
Adviser
and
Associate
General
Counsel
of
BNY
since
July
2021;
Senior
Managing
Counsel
of
BNY
from
December
2020
to
July
2021;
and
Managing
Counsel
of
BNY
from
March
2009
to
December
2020.
He
is
an
officer
of
52
investment
companies
(comprised
of
114
portfolios)
managed
by
the
Adviser
or
an
affiliate
of
the
Adviser. He
is
56
years
old
and
has
been
an
employee
of
BNY
since
April
2004.
JAMES
WINDELS,
Treasurer
since
February
2020.
Director
of
BNYM
Investment
Adviser
since
February
2023;
Vice
President
of
BNYM
Investment
Adviser
since
September
2020;
and
Director
–
BNY
Mellon
Fund
Administration.
He
is
an
officer
of
52
investment
companies
(comprised
of
114
portfolios)
managed
by
the
Adviser
or
an
affiliate
of
the
Adviser. He
is
65
years
old
and
has
been
an
employee
of
BNYM
Investment
Adviser
since
April
1985.
SARAH
S.
KELLEHER,
Vice
President
and
Secretary
since
February
2020.
Vice
President
of
BNY
Mellon
ETF
Investment
Adviser,
LLC
since
February
2020;
Senior
Managing
Counsel
of
BNY
since
September
2021;
and
Managing
Counsel
of
BNY
from
December
2017
to
September
2021. She
is
an
officer
of
52
investment
companies
(comprised
of
114
portfolios)
managed
by
the
Adviser
or
an
affiliate
of
the
Adviser. She
is
48
years
old
and
has
been
an
employee
of
BNY
since
March
2013.
DEIRDRE
CUNNANE,
Vice
President
and
Assistant
Secretary
since
February
2020.
Managing
Counsel
of
BNY
since
December
2021;
and
Counsel
of
BNY
from
August
2018
to
December
2021;
She
is
an
officer
of
52
investment
companies
(comprised
of
114
portfolios)
managed
by
the
Adviser
or
an
affiliate
of
the
Adviser.
She
is
34
years
old
and
has
been
an
employee
of
BNY
since
August
2013.
LISA
M.
KING,
Vice
President
and
Assistant
Secretary
since
May
2024.
Counsel
of
BNY
since
June
2023;
and
Regulatory
Administration
Group
Manager
at
BNY
Mellon
Asset
Servicing
from
February
2016
to
June
2023.
She
is
an
officer
of
52
investment
companies
(comprised
of
114
portfolios)
managed
by
BNYM
Investment
Adviser
or
an
affiliate
of
BNYM
Investment
Adviser.
She
is
56
years
old
and
has
been
an
employee
of
BNY
since
February
2016.
JEFF
PRUSNOFSKY,
Vice
President
and
Assistant
Secretary
since
February
2020.
Senior
Managing
Counsel
of
BNY.
He
is
an
officer
of
52
investment
companies
(comprised
of
114
portfolios)
managed
by
the
Adviser
or
an
affiliate
of
the
Adviser.
He
is
59
years
old
and
has
been
an
employee
of
BNYM
Investment
Adviser
since
October
1990.
AMANDA
QUINN,
Vice
President
and
Assistant
Secretary
since
February
2020.
Managing
Counsel
of
BNY
since
March
2024;
Counsel
of
BNY
from
June
2019
to
February
2024;
and
Regulatory
Administration
Manager
at
BNY
Investments
Services from
September
2018
to
May
2019.
She
is
an
officer
of
52
investment
companies
(comprised
of
114
portfolios)
managed
by
the
Adviser
or
an
affiliate
of
the
Adviser.
She
is
39
years
old
and
has
been
an
employee
of
BNY
since
June
2012.
JOANNE
SKERRETT,
Vice
President
and
Assistant
Secretary
since
March
2023.
Managing
Counsel
of
BNY
since
June
2022;
and
Senior
Counsel
with
the
Mutual
Fund
Directors
Forum,
a
leading
funds
industry
organization,
from
2016
to
June
2022. She
is
an
officer
of
52
investment
companies
(comprised
of
114
portfolios)
managed
by
the
Adviser
or
an
affiliate
of
the
Adviser.
She
is
52
years
old
and
has
been
an
employee
of
BNYM
Investment
Adviser
since
June
2022.
DANIEL
GOLDSTEIN,
Vice
President
since
March
2022
Head
of
Product
Development
of
North
America
Distribution,
BNY
Investments
since
January
2018;
Executive
Vice
President
of
North
America
Product,
BNY
Investments
since
April
2023;
and
Senior
Vice
President,
Development
&
Oversight
of
North
America
Product,
BNY
Investments
from
2010
to
March
2023.
He
is
an
officer
of
51
investment
companies
(comprised
of
96
portfolios)
managed
by
the
Adviser
or
an
affiliate
of
the
Adviser.
He
is
55
years
old
and
has
been
an
employee
of
the
Distributor
since
1991.
JOSEPH
MARTELLA,
Vice
President
since
March
2022
Vice
President
of
BNYM
Investment
Adviser
since
December
2022;
Head
of
Product
Management
of
North
America
Distribution,
BNY
Investments
since
January
2018;
Executive
Vice
President
of
North
America
Product,
BNY
Investments
since
April
2023,
and
Senior
Vice
President
of
North
America
Product,
BNY
Investments
from
2010
to
March
2023.
He
is
an
officer
of
51
investment
companies
(comprised
of
96
portfolios)
managed
by
the
Adviser
or
an
affiliate
of
the
Adviser.
He
is
47
years
old
and
has
been
an
employee
of
the
Distributor
since
1999.
ROBERTO
G.
MAZZEO,
Assistant
Treasurer
since
May
2024.
Financial
Reporting
Manager
–
BNY
Mellon
Fund
Administration.
He
is
an
officer
of
52
investment
companies
(comprised
of
114
portfolios)
managed
by
BNYM
Investment
Adviser
or
an
affiliate
of
BNYM
Investment
Adviser. He
is
43
years
old
and
has
been
an
employee
of
BNYM
Investment
Adviser
since
October
2006.
GAVIN
C.
REILLY,
Assistant
Treasurer
since
February
2020.
Tax
Manager-BNY
Mellon
Fund
Administration.
He
is
an
officer
of
52
investment
companies
(comprised
of
114
portfolios)
managed
by
the
Adviser
or
an
affiliate
of
the
Adviser.
He
is
55
years
old
and
has
been
an
employee
of
BNYM
Investment
Adviser
since
April
1991.
ROBERT
SALVIOLO,
Assistant
Treasurer
since
February
2020.
Senior
Accounting
Manager
–
BNY
Mellon
Fund
Administration.
He
is
an
officer
of
52
investment
companies
(comprised
of
114
portfolios)
managed
by
the
Adviser
or
an
affiliate
of
the
Adviser. He
is
57
years
old
and
has
been
an
employee
of
BNYM
Investment
Adviser
since
June
1989.
OFFICERS
OF
THE
TRUST
(Unaudited)
(continued)
ROBERT
SVAGNA,
Assistant
Treasurer
since
February
2020.
Senior
Accounting
Manager
–
BNY
Mellon
Fund
Administration.
He
is
an
officer
of
52
investment
companies
(comprised
of
114
portfolios)
managed
by
the
Adviser
or
an
affiliate
of
the
Adviser. He
is
57
years
old
and
has
been
an
employee
of
BNYM
Investment
Adviser
since
November
1990.
JOHN
SQUILLACE,
Chief
Compliance
Officer
since
May
2024.
Chief
Compliance
Officer
since
May
2024
of
BNY
Mellon
ETF
Investment
Adviser,
LLC
and
BNY
Mellon
ETF
Trust;
Chief
Compliance
Officer
of
BNY
Mellon
Securities
Corporation’s
investment
advisory
business
since
January
2016;
and
Chief
Compliance
Officer
of
BNYMIA
since
July
2012.
He
is
an
officer
of
1
investment
company
(comprised
of
13
portfolios)
managed
by
BNY
Mellon
ETF
Investment
Adviser.
He
is
65
years
old
and
has
been
an
employee
of
BNY
Mellon
since
December
2010.
CARIDAD
M.
CAROSELLA,
Anti-Money
Laundering
Compliance
Officer
since
February
2020.
Anti-Money
Laundering
Compliance
Officer
of
the
BNY
Mellon
Family
of
Funds
and
BNY
Mellon
Funds
Trust.
She
is
an
officer
of
45
investment
companies
(comprised
of
107
portfolios)
managed
by
the
Adviser
or
an
affiliate
of
the
Adviser.
She
is
55
years
old
and
has
been
an
employee
of
the
Distributor
since
1997.
Item
8.
Changes
in
and
Disagreements
with
Accountants
for
Open-End
Management
Investment
Companies
(Unaudited)
Item
9.
Proxy
Disclosures
for
Open-End
Management
Investment
Companies
(Unaudited)
Item
10.
Remuneration
Paid
to
Directors,
Officers,
and
Others
of
Open-End
Investment
Companies
(Unaudited)
Each
member
of
the
Board
serves
as
a
Board
member
of
each
fund
within
the
Registrant.
The
Board
members
are
not
compensated
directly
by
the
Registrant.
The
Board
members
are
paid
by
the
Adviser
from
the
unitary
management
fees
paid
to
the
Adviser
by
the
funds
within
the
Registrant.
Item
11.
Statement
Regarding
Basis
for
Approval
of
Investment
Advisory
Contracts
(Unaudited)
At
a
meeting
held
on
February
23,
2024
(the
“February
Meeting”)
and
a
meeting
held
on
May
7,
2024
(the
“May
Meeting,”
and
together
with
the
February
Meeting,
the
“Meetings”),
the
Board
of
Trustees
of
the
Trust
(the
“Board”),
all
the
members
of
which
are
not
“interested
persons”
of
the
Trust
as
defined
in
the
Investment
Company
Act
of
1940,
as
amended,
evaluated
(i)
proposals
to
continue
the
Management
Agreement
between
the
Trust
and
BNY
Mellon
ETF
Investment
Adviser,
LLC
(the
“Adviser”)
with
respect
to
the
BNY
Mellon
Ultra
Short
Income
ETF
(the
“fund”);
and
(ii)
proposals
to
continue
the
Sub-Investment
Advisory
Agreement
between
the
Adviser
and
Mellon
Investments
Corporation
(the
“Sub-Adviser”),
an
affiliate
of
the
Adviser,
pursuant
to
which
Dreyfus,
a
division
of
the
Sub-Adviser,
provides
day-to-day
management
of
the
fund’s
investments
(each
of
the
Management
Agreement
and
the
Sub-Investment
Advisory
Agreement,
an
“Agreement,”
and
together,
the
“Agreements”).
At
each
Meeting,
the
Trustees
also
met
separately
to
consider
the
Agreements
and
were
advised
by
legal
counsel
throughout
the
process.
In
connection
with
each
Meeting,
to
evaluate
the
Agreements,
the
Board
requested,
and
the
Adviser
and
the
Sub-Adviser
provided,
such
materials
as
the
Board,
with
the
advice
of
counsel,
deemed
reasonably
necessary.
In
addition,
the
Board
considered
information
it
reviewed
at
other
Board
and
Board
committee
meetings.
In
deciding
whether
to
approve
the
Agreements,
the
Board
considered
various
factors,
including
the
(i)
nature,
extent
and
quality
of
services
provided
by
the
Adviser
and
Sub-Adviser
under
each
respective
Agreement,
(ii)
investment
performance
of
the
fund,
(iii)
profits
realized
by
the
Adviser
and
its
affiliates
from
its
relationship
with
the
fund,
(iv)
fees
charged
to
comparable
funds,
(v)
other
benefits
to
the
Adviser,
Sub-Adviser
and/or
their
affiliates,
and
(vi)
extent
to
which
economies
of
scale
would
be
shared
as
the
fund
grows.
The
Board
considered
the
Agreements
for
the
fund
and
the
engagement
of
the
Adviser
and
the
Sub-Adviser
separately.
The
Board
reviewed
reports
prepared
by
Broadridge
Financial
Solutions,
Inc.
(“Broadridge”),
an
independent
provider
of
investment
company
data,
which
included
information
(i)
comparing
the
fund’s
performance
with
the
performance
of
a
group
of
other
actively-
managed
ultrashort
bond
exchange
traded
funds
(“ETFs”)
(the
“Performance
Group”)
and
with
a
broader
group
of
retail
and
institutional
ultrashort
bond
funds
and
ETFs
(the
“Performance
Universe”)
for
the
periods
ended
December
31,
2023;
and
(ii)
comparing
the
fund’s
contractual
management
fees
and
total
expenses
with
a
group
of
other
actively-managed
ultrashort
bond
ETFs
(the
“Expense
Group”)
and,
with
respect
to
total
expenses,
with
a
broader
group
of
actively-managed
ultrashort
bond
ETFs
(the
“Expense
Universe”),
the
information
for
which
was
derived
in
part
from
fund
financial
statements
available
to
Broadridge
as
of
the
date
of
its
analysis.
In
addition,
at
the
May
Meeting,
the
Board
also
reviewed
reports
that
included
information
comparing
the
fund’s
performance
with
the
performance
of
its
Performance
Universe
for
the
periods
ended
March
31,
2024.
Nature,
Extent
and
Quality
of
Services
The
Board
considered
the
nature,
extent
and
quality
of
services
provided
by
the
Adviser
and
the
Sub-Adviser.
In
doing
so,
the
Trustees
relied
on
their
prior
experience
in
overseeing
the
management
of
the
fund
and
the
materials
provided
prior
to
and
at
each
Meeting.
The
Board
reviewed
the
Agreements
and
the
Adviser’s
and
the
Sub-Adviser’s
responsibilities
for
managing
investment
operations
of
the
fund
in
accordance
with
the
fund’s
investment
objective
and
policies,
and
applicable
legal
and
regulatory
requirements.
The
Board
appreciated
the
nature
of
the
fund
as
an
exchange-traded
fund
and
considered
the
background
and
experience
of
the
Adviser’s
and
the
Sub-Adviser’s
senior
management,
including
those
individuals
responsible
for
portfolio
management
and
regulatory
compliance
of
the
funds.
The
Board
also
considered
the
portfolio
management
resources,
structures
and
practices
of
the
Adviser
and
the
Sub-Adviser,
including
those
associated
with
monitoring
and
ensuring
the
fund’s
compliance
with
its
investment
objective
and
policies
and
with
applicable
laws
and
regulations.
The
Board
further
considered
information
about
the
Sub-Adviser’s
best
execution
procedures
as
well
as
the
Adviser’s
and
the
Sub-Adviser’s
overall
investment
management
business.
The
Board
looked
at
the
Adviser’s
general
knowledge
of
the
investment
management
business
and
that
of
its
affiliates,
including
the
Sub-Adviser.
With
respect
to
the
Sub-Adviser,
the
Board
also
considered
the
Adviser’s
favorable
assessment
of
the
nature
and
quality
of
the
services
provided
by
the
Sub-Adviser.
Investment
Performance
The
Board
reviewed
the
results
of
the
fund’s
performance
comparisons
and
considered
that
the
fund’s
total
return
performance
was
above
the
Performance
Group
median
for
the
one-year
period
ended
December
31,
2023,
below
the
Performance
Group
median
for
the
two-year
period
ended
December
31,
2023,
and
below
the
Performance
Universe
median
for
the
one-year
and
two-year
periods
ended
December
31,
2023.
At
the
May
Meeting,
the
Board
also
considered
that
the
fund’s
total
return
performance
was
below
the
Performance
Universe
average
for
the
one-year
period
and
since
inception
(August
9,
2021)
period
ended
March
31,
2024.
With
respect
to
each
period
of
underperformance,
the
Board
noted
the
fund’s
performance
was
not
significantly
below
the
respective
median
or
average.
Representatives
of
the
Adviser
indicated
that
the
usefulness
of
performance
comparisons
may
be
affected
by
a
number
of
factors,
including
different
investment
limitations
and
policies
that
may
be
applicable
to
the
fund
and
comparison
funds
and
the
end
date
selected.
Profits
Realized
by
the
Adviser
The
Board
considered
the
profitability
of
the
advisory
arrangement
with
the
fund
to
the
Adviser
and
its
affiliates.
The
Board
had
the
opportunity
to
discuss
with
representatives
of
the
Adviser
the
process
and
methodology
used
to
calculate
profitability.
Fees
Charged
to
Comparable
Funds
The
Board
evaluated
the
fund’s
unitary
fee
through
review
of
comparative
information
with
respect
to
fees
paid
by
similar
funds
-
i.e.,
other
actively-managed
ultrashort
bond
ETFs.
The
Board
explored
with
management
the
differences
between
the
fund’s
fee
and
fees
paid
by
similar
funds.
The
Board
noted
the
fund’s
contractual
management
fee
was
below
the
Expense
Group
median
and
the
fund’s
total
expenses
were
below
the
Expense
Group
median
and
the
Expense
Universe
median
total
expenses.
The
Board
considered
the
fee
paid
to
the
Sub-Adviser
in
relation
to
the
fee
paid
to
the
Adviser
by
the
fund
and
the
respective
services
provided
by
the
Sub-Adviser
and
the
Adviser.
The
Board
also
took
into
consideration
that
the
Sub-Adviser’s
fee
is
paid
by
the
Adviser
and
not
the
fund.
Other
Benefits
The
Board
also
considered
whether
the
Adviser,
the
Sub-Adviser
or
their
affiliates
benefited
in
other
ways
from
their
relationship
with
the
funds,
noting
that
neither
the
Adviser
nor
the
Sub-Adviser
maintains
soft-dollar
arrangements
in
connection
with
the
fund’s
brokerage
transactions.
The
Board
noted
The
Bank
of
New
York
Mellon
Corporation
may
derive
certain
benefits
from
an
incremental
growth
in
its
businesses
that
may
possibly
result
from
the
availability
of
the
fund
to
clients.
Economies
of
Scale
The
Board
reviewed
information
regarding
economies
of
scale
or
other
efficiencies
that
may
result
as
the
fund’s
assets
grow
in
size.
The
Board
noted
that
the
advisory
fee
rate
for
the
fund
did
not
provide
for
breakpoints
as
assets
of
the
fund
increases.
The
Adviser
asserted
that
one
of
the
benefits
of
the
unitary
fee
was
to
provide
an
unvarying
expense
structure,
which
could
be
lost
or
diluted
with
the
addition
of
breakpoints.
The
Board
noted
that
it
intends
to
continue
to
monitor
fees
as
the
fund
grows
in
size
and
assess
whether
fee
breakpoints
may
be
warranted.
Conclusion
After
weighing
the
foregoing
factors,
none
of
which
was
dispositive
in
itself
and
may
have
been
weighed
differently
by
each
Trustee,
the
Board
approved
the
continuation
of
the
Agreements
for
the
fund
at
each
Meeting.
In
approving
the
continuance
of
the
Agreements,
the
Board
found
that
the
terms
of
the
Agreements
are
fair
and
reasonable
and
that
the
continuance
of
the
Agreements
is
in
the
best
interests
of
the
fund
and
its
shareholders.
©
2024
BNY
Mellon
Securities
Corporation
ANNUAL
FINANCIALS
AND
OTHER
INFORMATION
June
30,
2024
BNY
Mellon
Responsible
Horizons
Corporate
Bond
ETF:
RHCB
Principal
U.S.
Listing
Exchange:
NYSE
Arca,
Inc.
IMPORTANT
NOTICE
–
CHANGES
TO
ANNUAL
AND
SEMI-ANNUAL
REPORTS
The
Securities
and
Exchange
Commission
(the
“SEC”)
has
adopted
rule
and
form
amendments
which
have
resulted
in
changes
to
the
design
and
delivery
of
annual
and
semi-annual
fund
reports
(“Reports”).
Reports
are
now
streamlined
to
highlight
key
information.
Certain
information
previously
included
in
Reports,
including
financial
statements,
no
longer
appear
in
the
Reports
but
will
be
available
online
within
the
Semi-Annual
and
Annual
Financials
and
Other
Information,
delivered
free
of
charge
to
shareholders
upon
request,
and
filed
with
the
SEC.
Please
note
the
Annual
Financials
and
Other
Information
only
contains
Items
7-11
required
in
Form
N-CSR.
All
other
required
items
will
be
filed
with
the
SEC.
Item
7.
Financial
Statements
and
Financial
Highlights
for
Open-End
Management
Investment
Companies
3
Statement
of
Investments
3
Statement
of
Assets
and
Liabilities
12
Statement
of
Operations
13
Statement
of
Changes
in
Net
Assets
14
Financial
Highlights
15
Notes
to
Financial
Statements
16
Report
of
Independent
Registered
Public
Accounting
Firm
24
Important
Tax
Information
25
Board
Members
Information
26
Officers
of
the
Trust
27
Item
8.
Changes
in
and
Disagreements
with
Accountants
for
Open-End
Management
Investment
Companies
29
Item
9.
Proxy
Disclosures
for
Open-End
Management
Investment
Companies
30
Item
10.
Remuneration
Paid
to
Directors,
Officers,
and
Others
of
Open-End
Investment
Companies
31
Item
11.
Statement
Regarding
Basis
for
Approval
of
Investment
Advisory
Contracts
32
Save
time.
Save
paper.
View
your
next
shareholder
report
online
as
soon
as
it’s
available.
Log
into
www.
im.bnymellon.com
and
sign
up
for
eCommunications.
It’s
simple
and
only
takes
a
few
minutes.
The
views
expressed
herein
are
current
to
the
date
of
this
report.
These
views
and
the
composition
of
the
fund’s
portfolio
is
subject
to
change
at
any
time
based
on
market
and
other
conditions.
Not
FDIC-Insured
•
Not
Bank-Guaranteed
•
May
Lose
Value
BNY
Mellon
Responsible
Horizons
Corporate
Bond
ETF
Statement
of
Investments
June
30,
2024
Item
7.
Financial
Statements
and
Financial
Highlights
for
Open-End
Management
Investment
Companies
Description
Principal
Amount
($)
(a)
Value
($)
Corporate
Bonds
–
97.2%
Airlines
–
0.3%
Delta
Air
Lines,
Inc.
/
SkyMiles
IP
Ltd.
,
4.75%
,
10/20/2028
(b)
80,000
77,944
77,944
Auto
Manufacturers
–
3.1%
Ford
Motor
Co.
3.25%,
2/12/2032
75,000
62,021
6.10%,
8/19/2032
110,000
109,918
General
Motors
Co.
,
5.95%
,
4/01/2049
79,000
76,728
General
Motors
Financial
Co.,
Inc.
,
6.10%
,
1/07/2034
142,000
143,600
Mercedes-Benz
Finance
North
America
LLC
,
1.45%
,
3/02/2026
(b)
150,000
141,023
Stellantis
Finance
U.S.,
Inc.
,
2.69%
,
9/15/2031
(b)
200,000
165,403
698,693
Banks
–
23.3%
Bank
of
America
Corp.
3.82%,
1/20/2028
165,000
159,072
5.20%,
4/25/2029
113,000
112,849
3.19%,
7/23/2030
200,000
181,662
2.57%,
10/20/2032
134,000
111,114
5.29%,
4/25/2034
65,000
64,356
Bank
of
Nova
Scotia
(The)
,
4.85%
,
2/01/2030
108,000
106,312
Canadian
Imperial
Bank
of
Commerce
,
5.00%
,
4/28/2028
100,000
99,312
Citigroup,
Inc.
3.11%,
4/08/2026
125,000
122,488
3.98%,
3/20/2030
195,000
184,125
6.17%,
5/25/2034
54,000
54,946
5.45%,
6/11/2035
55,000
54,590
Citizens
Financial
Group,
Inc.
,
5.64%
,
5/21/2037
80,000
74,272
Cooperatieve
Rabobank
UA
,
1.00%
,
9/24/2026
(b)
250,000
236,449
Credit
Agricole
SA
,
6.32%
,
10/03/2029
(b)
250,000
256,864
Goldman
Sachs
Group,
Inc.
(The)
1.09%,
12/09/2026
150,000
140,270
2.64%,
2/24/2028
60,000
55,974
4.41%,
4/23/2039
220,000
194,663
HSBC
Holdings
PLC
,
6.33%
,
3/09/2044
200,000
209,356
Industrial
Bank
of
Korea
,
5.38%
,
10/04/2028
(b)
200,000
203,826
ING
Groep
NV
,
5.55%
,
3/19/2035
200,000
197,548
JPMorgan
Chase
&
Co.
5.01%,
1/23/2030
150,000
148,880
5.77%,
4/22/2035
112,000
114,956
3.88%,
7/24/2038
170,000
145,833
Morgan
Stanley
4.68%,
7/17/2026
130,000
128,754
1.93%,
4/28/2032
250,000
200,955
5.95%,
1/19/2038
38,000
37,800
5.94%,
2/07/2039
80,000
79,160
PNC
Financial
Services
Group,
Inc.
(The)
4.76%,
1/26/2027
115,000
113,635
5.49%,
5/14/2030
125,000
125,724
4.63%,
6/06/2033
95,000
87,990
Royal
Bank
of
Canada
,
7.50%
,
5/02/2084
200,000
206,763
Societe
Generale
SA
,
6.07%
,
1/19/2035
(b)
200,000
198,138
State
Street
Corp.
,
Series
I
,
6.70%
(c)
63,000
63,533
Toronto-Dominion
Bank
(The)
5.26%,
12/11/2026
20,000
19,999
7.25%,
7/31/2084
200,000
200,000
Statement
of
Investments
(continued)
Description
Principal
Amount
($)
(a)
Value
($)
Corporate
Bonds
–
97.2%
(continued)
Banks
–
23.3%
(continued)
Truist
Financial
Corp.
6.05%,
6/08/2027
14,000
14,104
7.16%,
10/30/2029
66,000
70,100
5.87%,
6/08/2034
10,000
10,081
5.71%,
1/24/2035
19,000
18,926
UBS
Group
AG
,
6.30%
,
9/22/2034
(b)
200,000
208,086
US
Bancorp
6.79%,
10/26/2027
102,000
105,048
5.78%,
6/12/2029
86,000
87,325
5.68%,
1/23/2035
46,000
46,194
Westpac
Banking
Corp.
,
2.67%
,
11/15/2035
50,000
41,342
5,293,374
Beverages
–
2.1%
Anheuser-Busch
Cos.
LLC
/
Anheuser-Busch
InBev
Worldwide,
Inc.
,
4.90%
,
2/01/2046
(d)
100,000
92,255
Anheuser-Busch
InBev
Worldwide,
Inc.
4.60%,
4/15/2048
15,000
13,280
5.55%,
1/23/2049
50,000
50,412
Coca-Cola
Co.
(The)
,
3.50%
,
5/14/2044
EUR
100,000
103,427
Diageo
Capital
PLC
,
5.63%
,
10/05/2033
200,000
207,719
467,093
Biotechnology
–
1.5%
Amgen,
Inc.
1.65%,
8/15/2028
75,000
65,634
5.25%,
3/02/2030
33,000
33,252
5.60%,
3/02/2043
33,000
32,544
4.66%,
6/15/2051
100,000
85,528
4.88%,
3/01/2053
22,000
19,388
5.65%,
3/02/2053
31,000
30,552
Gilead
Sciences,
Inc.
,
5.55%
,
10/15/2053
23,000
22,981
Illumina,
Inc.
,
5.75%
,
12/13/2027
61,000
61,584
351,463
Building
Materials
–
1.7%
Builders
FirstSource
,
Inc.
6.38%,
6/15/2032
(b)
18,000
18,045
6.38%,
3/01/2034
(b)
26,000
25,773
Carrier
Global
Corp.
2.72%,
2/15/2030
150,000
132,569
5.90%,
3/15/2034
10,000
10,442
Johnson
Controls
International
PLC
/
Tyco
Fire
&
Security
Finance
SCA
,
4.90%
,
12/01/2032
94,000
91,725
Trane
Technologies
Financing
Ltd.
5.25%,
3/03/2033
100,000
100,783
5.10%,
6/13/2034
14,000
13,958
393,295
Chemicals
–
2.7%
Braskem
Netherlands
Finance
BV
,
4.50%
,
1/31/2030
(b)
200,000
169,254
Dow
Chemical
Co.
(The)
,
6.30%
,
3/15/2033
(d)
33,000
34,841
LYB
International
Finance
III
LLC
,
5.50%
,
3/01/2034
200,000
197,969
Nutrien
Ltd.
4.00%,
12/15/2026
200,000
193,597
4.90%,
3/27/2028
12,000
11,864
607,525
Description
Principal
Amount
($)
(a)
Value
($)
Corporate
Bonds
–
97.2%
(continued)
Commercial
Services
–
2.3%
Ashtead
Capital,
Inc.
,
4.25%
,
11/01/2029
(b)
200,000
187,678
ERAC
USA
Finance
LLC
3.80%,
11/01/2025
(b)
125,000
122,295
4.90%,
5/01/2033
(b)
77,000
74,972
Herc
Holdings,
Inc.
,
6.63%
,
6/15/2029
(b)
45,000
45,664
United
Rentals
North
America,
Inc.
,
5.25%
,
1/15/2030
50,000
48,495
Williams
Scotsman,
Inc.
,
6.63%
,
6/15/2029
(b)
34,000
34,299
513,403
Computers
–
2.1%
Dell
International
LLC
/
EMC
Corp.
3.38%,
12/15/2041
80,000
58,562
3.45%,
12/15/2051
26,000
17,634
IBM
International
Capital
Pte
Ltd.
4.75%,
2/05/2031
200,000
196,032
5.25%,
2/05/2044
200,000
189,732
Kyndryl
Holdings,
Inc.
,
4.10%
,
10/15/2041
27,000
20,476
482,436
Diversified
Financial
Services
–
3.2%
AerCap
Ireland
Capital
DAC
/
AerCap
Global
Aviation
Trust
,
3.85%
,
10/29/2041
150,000
117,415
Air
Lease
Corp.
,
2.10%
,
9/01/2028
135,000
118,613
Ally
Financial,
Inc.
,
8.00%
,
11/01/2031
42,000
46,377
Capital
One
Financial
Corp.
,
2.36%
,
7/29/2032
79,000
61,750
Discover
Financial
Services
,
6.70%
,
11/29/2032
(d)
61,000
63,684
Intercontinental
Exchange,
Inc.
4.60%,
3/15/2033
80,000
76,480
4.95%,
6/15/2052
(d)
24,000
21,811
LSEGA
Financing
PLC
,
1.38%
,
4/06/2026
(b)
200,000
186,633
NASDAQ,
Inc.
,
5.95%
,
8/15/2053
27,000
27,310
720,073
Electric
–
8.3%
Avangrid
,
Inc.
,
3.20%
,
4/15/2025
130,000
127,314
Commonwealth
Edison
Co.
,
5.65%
,
6/01/2054
175,000
174,130
Consolidated
Edison
Co.
of
New
York,
Inc.
Series
05-A,
5.30%,
3/01/2035
135,000
134,101
Series
A,
4.13%,
5/15/2049
100,000
79,152
Constellation
Energy
Generation
LLC
6.50%,
10/01/2053
70,000
74,372
5.75%,
3/15/2054
17,000
16,490
Electricite
de
France
SA
,
9.13%
(b)(c)
200,000
218,020
ENEL
Finance
America
LLC
,
7.10%
,
10/14/2027
(b)
200,000
210,128
ENEL
Finance
International
NV
,
5.00%
,
6/15/2032
(b)
200,000
190,136
Eversource
Energy
Series
R,
1.65%,
8/15/2030
110,000
88,765
5.50%,
1/01/2034
26,000
25,522
Exelon
Corp.
,
4.05%
,
4/15/2030
120,000
112,675
New
England
Power
Co.
,
5.94%
,
11/25/2052
(b)
71,000
71,675
New
York
State
Electric
&
Gas
Corp.
,
5.85%
,
8/15/2033
(b)
95,000
96,595
Public
Service
Electric
&
Gas
Co.
4.65%,
3/15/2033
80,000
77,179
5.13%,
3/15/2053
44,000
41,774
5.45%,
8/01/2053
125,000
123,613
Public
Service
Enterprise
Group,
Inc.
,
6.13%
,
10/15/2033
32,000
33,279
1,894,920
Statement
of
Investments
(continued)
Description
Principal
Amount
($)
(a)
Value
($)
Corporate
Bonds
–
97.2%
(continued)
Entertainment
–
0.6%
WarnerMedia
Holdings,
Inc.
4.05%,
3/15/2029
100,000
92,373
5.39%,
3/15/2062
50,000
39,053
131,426
Environmental
Control
–
0.2%
GFL
Environmental,
Inc.
,
6.75%
,
1/15/2031
(b)
35,000
35,750
35,750
Food
–
2.7%
Bimbo
Bakeries
USA,
Inc.
,
5.38%
,
1/09/2036
(b)
200,000
195,040
General
Mills,
Inc.
,
4.95%
,
3/29/2033
134,000
130,589
J.M.
Smucker
Co.
(The)
5.90%,
11/15/2028
30,000
30,911
4.25%,
3/15/2035
50,000
44,835
6.50%,
11/15/2043
18,000
18,960
6.50%,
11/15/2053
17,000
18,286
Kraft
Heinz
Foods
Co.
5.20%,
7/15/2045
(d)
55,000
50,480
5.50%,
6/01/2050
56,000
53,629
SYSCO
Corp.
,
4.50%
,
4/01/2046
65,000
55,024
US
Foods,
Inc.
,
6.88%
,
9/15/2028
(b)
24,000
24,568
622,322
Forest
Products
&
Paper
–
0.2%
Suzano
Austria
GmbH
,
3.75%
,
1/15/2031
59,000
51,443
51,443
Gas
–
0.9%
Atmos
Energy
Corp.
,
5.50%
,
6/15/2041
55,000
54,802
Boston
Gas
Co.
,
6.12%
,
7/20/2053
(b)
150,000
148,880
203,682
Healthcare-Products
–
1.4%
Alcon
Finance
Corp.
,
5.38%
,
12/06/2032
(b)
200,000
200,501
Thermo
Fisher
Scientific,
Inc.
,
1.50%
,
10/01/2039
EUR
100,000
78,675
Zimmer
Biomet
Holdings,
Inc.
,
5.35%
,
12/01/2028
28,000
28,177
307,353
Healthcare-Services
–
1.6%
HCA,
Inc.
5.25%,
6/15/2026
150,000
149,411
5.45%,
4/01/2031
40,000
39,982
4.63%,
3/15/2052
55,000
44,432
UnitedHealth
Group,
Inc.
3.05%,
5/15/2041
50,000
36,927
5.88%,
2/15/2053
25,000
25,982
4.95%,
5/15/2062
29,000
25,827
6.05%,
2/15/2063
42,000
44,234
366,795
Home
Builders
–
0.1%
KB
Home
,
4.00%
,
6/15/2031
28,000
24,768
24,768
Description
Principal
Amount
($)
(a)
Value
($)
Corporate
Bonds
–
97.2%
(continued)
Insurance
–
4.1%
Allianz
SE
,
6.35%
,
9/06/2053
(b)
200,000
206,350
Allstate
Corp.
(The)
,
3.85%
,
8/10/2049
(d)
50,000
37,782
Corebridge
Financial,
Inc.
,
5.75%
,
1/15/2034
34,000
34,246
Corebridge
Global
Funding
,
5.20%
,
1/12/2029
(b)
115,000
114,513
Liberty
Mutual
Group,
Inc.
,
4.30%
,
2/01/2061
(b)
54,000
33,665
Lincoln
National
Corp.
,
5.85%
,
3/15/2034
52,000
51,964
Marsh
&
McLennan
Cos.,
Inc.
,
5.45%
,
3/15/2053
85,000
82,821
MetLife,
Inc.
6.40%,
12/15/2036
100,000
101,364
5.00%,
7/15/2052
8,000
7,296
Metropolitan
Life
Global
Funding
I
,
1.55%
,
1/07/2031
(b)
150,000
119,628
Prudential
Financial,
Inc.
,
3.70%
,
3/13/2051
85,000
61,705
XL
Group
Ltd.
,
5.25%
,
12/15/2043
75,000
69,435
920,769
Leisure
Time
–
0.1%
Royal
Caribbean
Cruises
Ltd.
,
6.25%
,
3/15/2032
(b)
28,000
28,253
28,253
Lodging
–
0.5%
Marriott
International,
Inc.
5.00%,
10/15/2027
38,000
37,913
Series
HH,
2.85%,
4/15/2031
90,000
77,112
115,025
Machinery-Diversified
–
0.3%
AGCO
Corp.
,
5.80%
,
3/21/2034
78,000
77,738
77,738
Media
–
1.7%
Charter
Communications
Operating
LLC
/
Charter
Communications
Operating
Capital
Corp.
6.48%,
10/23/2045
60,000
54,857
5.25%,
4/01/2053
74,000
58,113
4.40%,
12/01/2061
50,000
32,651
Comcast
Corp.
,
2.94%
,
11/01/2056
150,000
90,559
Fox
Corp.
,
5.58%
,
1/25/2049
56,000
51,462
Paramount
Global
,
6.38%
,
3/30/2062
40,000
35,363
Walt
Disney
Co.
(The)
,
3.50%
,
5/13/2040
68,000
54,286
377,291
Mining
–
0.1%
Newmont
Corp.
/
Newcrest
Finance
Pty
Ltd.
,
5.35%
,
3/15/2034
(b)
32,000
31,963
31,963
Miscellaneous
Manufacturing
–
0.2%
Hillenbrand,
Inc.
,
6.25%
,
2/15/2029
38,000
38,230
38,230
Oil
&
Gas
–
3.9%
AKER
BP
ASA
5.60%,
6/13/2028
(b)
300,000
302,785
3.10%,
7/15/2031
(b)
200,000
170,388
BP
Capital
Markets
America,
Inc.
,
3.00%
,
2/24/2050
65,000
42,336
ENI
SpA
,
5.95%
,
5/15/2054
(b)
200,000
196,571
Parkland
Corp.
,
4.50%
,
10/01/2029
(b)
50,000
45,807
TotalEnergies
Capital
International
SA
,
3.13%
,
5/29/2050
90,000
60,731
TotalEnergies
Capital
SA
3.88%,
10/11/2028
60,000
57,612
5.49%,
4/05/2054
21,000
20,724
896,954
Statement
of
Investments
(continued)
Description
Principal
Amount
($)
(a)
Value
($)
Corporate
Bonds
–
97.2%
(continued)
Oil
&
Gas
Services
–
1.1%
Schlumberger
Holdings
Corp.
4.30%,
5/01/2029
(b)
200,000
193,211
5.00%,
11/15/2029
(b)
49,000
48,649
241,860
Packaging
&
Containers
–
2.0%
Ball
Corp.
,
6.00%
,
6/15/2029
27,000
27,179
Berry
Global,
Inc.
,
5.50%
,
4/15/2028
200,000
199,678
Sealed
Air
Corp.
,
6.50%
,
7/15/2032
(b)
33,000
32,842
Smurfit
Kappa
Treasury
ULC
,
5.44%
,
4/03/2034
(b)
200,000
198,368
458,067
Pharmaceuticals
–
6.0%
AbbVie,
Inc.
4.95%,
3/15/2031
15,000
14,966
4.05%,
11/21/2039
100,000
86,907
AstraZeneca
Finance
LLC
,
2.25%
,
5/28/2031
150,000
126,708
Bristol-Myers
Squibb
Co.
5.10%,
2/22/2031
70,000
70,288
4.25%,
10/26/2049
35,000
28,511
6.25%,
11/15/2053
22,000
23,645
5.55%,
2/22/2054
7,000
6,906
6.40%,
11/15/2063
14,000
15,212
Cigna
Group
(The)
,
5.60%
,
2/15/2054
26,000
24,980
Eli
Lilly
&
Co.
,
4.70%
,
2/27/2033
45,000
44,245
Pfizer
Investment
Enterprises
Pte
Ltd.
5.11%,
5/19/2043
57,000
54,227
5.30%,
5/19/2053
86,000
83,009
5.34%,
5/19/2063
87,000
82,185
Pfizer,
Inc.
,
2.63%
,
4/01/2030
120,000
106,493
Takeda
Pharmaceutical
Co.
Ltd.
5.00%,
11/26/2028
200,000
198,569
5.30%,
7/05/2034
400,000
397,578
1,364,429
Pipelines
–
1.3%
Enbridge,
Inc.
6.20%,
11/15/2030
26,000
27,309
5.50%,
7/15/2077
60,000
56,631
Galaxy
Pipeline
Assets
Bidco
Ltd.
,
2.16%
,
3/31/2034
(b)
162,080
139,156
Williams
Cos.,
Inc.
(The)
,
5.75%
,
6/24/2044
80,000
78,414
301,510
Real
Estate
–
5.3%
Agree
LP
2.90%,
10/01/2030
150,000
129,395
5.63%,
6/15/2034
10,000
9,902
Alexandria
Real
Estate
Equities,
Inc.
,
1.88%
,
2/01/2033
167,000
125,707
American
Homes
4
Rent
LP
5.50%,
2/01/2034
175,000
172,154
4.30%,
4/15/2052
34,000
26,398
Description
Principal
Amount
($)
(a)
Value
($)
Corporate
Bonds
–
97.2%
(continued)
Real
Estate
–
5.3%
(continued)
Boston
Properties
LP
,
2.75%
,
10/01/2026
100,000
93,349
Crown
Castle,
Inc.
,
3.80%
,
2/15/2028
100,000
94,784
Equinix
,
Inc.
,
1.00%
,
9/15/2025
100,000
94,700
Iron
Mountain
Information
Management
Services,
Inc.
,
5.00%
,
7/15/2032
(b)
50,000
45,714
Kite
Realty
Group
LP
,
5.50%
,
3/01/2034
10,000
9,784
Kite
Realty
Group
Trust
,
4.00%
,
3/15/2025
50,000
49,260
Park
Intermediate
Holdings
LLC
/
PK
Domestic
Property
LLC
/
PK
Finance
Co.-Issuer
,
7.00%
,
2/01/2030
(b)
28,000
28,357
Phillips
Edison
Grocery
Center
Operating
Partnership
I
LP
,
5.75%
,
7/15/2034
12,000
11,858
ProLogis
Euro
Finance
LLC
,
1.50%
,
9/10/2049
EUR
100,000
61,349
Regency
Centers
LP
,
5.25%
,
1/15/2034
36,000
35,078
Rexford
Industrial
Realty
LP
,
5.00%
,
6/15/2028
126,000
124,676
Ventas
Realty
LP
,
5.63%
,
7/01/2034
84,000
83,304
1,195,769
Retail
–
2.6%
7-Eleven,
Inc.
,
2.50%
,
2/10/2041
(b)
100,000
65,376
AutoZone,
Inc.
,
4.50%
,
2/01/2028
98,000
95,870
Home
Depot,
Inc.
(The)
5.30%,
6/25/2054
24,000
23,450
3.50%,
9/15/2056
150,000
106,444
Lowe's
Cos.,
Inc.
2.80%,
9/15/2041
100,000
68,686
4.25%,
4/01/2052
6,000
4,719
5.63%,
4/15/2053
47,000
45,543
4.45%,
4/01/2062
37,000
28,791
Macy's
Retail
Holdings
LLC
,
5.88%
,
3/15/2030
(b)
31,000
29,758
McDonald's
Corp.
,
4.88%
,
12/09/2045
54,000
48,582
Starbucks
Corp.
,
5.00%
,
2/15/2034
78,000
76,182
593,401
Semiconductors
–
1.7%
Advanced
Micro
Devices,
Inc.
,
4.39%
,
6/01/2052
46,000
38,939
Intel
Corp.
5.20%,
2/10/2033
37,000
36,960
5.63%,
2/10/2043
30,000
29,733
5.70%,
2/10/2053
53,000
52,134
Micron
Technology,
Inc.
,
2.70%
,
4/15/2032
134,000
111,006
NXP
BV
/
NXP
Funding
LLC
/
NXP
USA,
Inc.
,
3.25%
,
5/11/2041
120,000
87,590
Texas
Instruments,
Inc.
,
5.05%
,
5/18/2063
31,000
28,832
385,194
Software
–
2.0%
Fidelity
National
Information
Services,
Inc.
,
1.15%
,
3/01/2026
130,000
121,165
Fiserv,
Inc.
,
5.45%
,
3/15/2034
115,000
114,331
Microsoft
Corp.
,
2.68%
,
6/01/2060
100,000
61,112
Oracle
Corp.
4.65%,
5/06/2030
49,000
48,033
3.65%,
3/25/2041
100,000
76,578
4.00%,
7/15/2046
50,000
38,168
459,387
Telecommunications
–
3.6%
AT&T,
Inc.
2.55%,
12/01/2033
200,000
159,093
3.50%,
6/01/2041
100,000
76,448
3.55%,
9/15/2055
50,000
33,738
Rogers
Communications,
Inc.
4.50%,
3/15/2042
80,000
67,800
4.55%,
3/15/2052
62,000
50,652
Statement
of
Investments
(continued)
Description
Principal
Amount
($)
(a)
Value
($)
Corporate
Bonds
–
97.2%
(continued)
Telecommunications
–
3.6%
(continued)
T-Mobile
USA,
Inc.
3.50%,
4/15/2031
150,000
134,937
3.30%,
2/15/2051
75,000
50,676
Verizon
Communications,
Inc.
1.50%,
9/18/2030
100,000
81,634
2.85%,
9/03/2041
60,000
42,066
3.88%,
3/01/2052
100,000
75,921
5.50%,
2/23/2054
34,000
33,307
806,272
Transportation
–
1.7%
Canadian
National
Railway
Co.
,
4.40%
,
8/05/2052
23,000
19,795
Canadian
Pacific
Railway
Co.
,
1.75%
,
12/02/2026
50,000
46,143
CSX
Corp.
,
3.95%
,
5/01/2050
90,000
70,946
FedEx
Corp.
,
4.75%
,
11/15/2045
84,000
72,509
Ryder
System,
Inc.
,
5.65%
,
3/01/2028
80,000
81,215
Union
Pacific
Corp.
,
4.95%
,
9/09/2052
58,000
54,262
XPO,
Inc.
6.25%,
6/01/2028
(b)
30,000
30,146
7.13%,
2/01/2032
(b)
5,000
5,130
380,146
Trucking
&
Leasing
–
0.7%
Penske
Truck
Leasing
Co.
LP
/
PTL
Finance
Corp.
,
5.55%
,
5/01/2028
(b)
150,000
151,109
151,109
Total
Corporate
Bonds
(cost
$23,115,823)
22,067,125
Foreign
Governmental
–
1.0%
Chile
Government
International
Bond,
4.85%,
1/22/2029
200,000
197,917
Republic
of
Poland
Government
International
Bond,
5.50%,
3/18/2054
27,000
26,243
Total
Foreign
Governmental
(cost
$226,510)
224,160
Municipal
Securities
–
0.0%
California
Health
Facilities
Financing
Authority,
RB,
Series
2022,
4.35%,
6/01/2041
10,000
8,948
Total
Municipal
Securities
(cost
$10,000)
8,948
Shares
Investment
Companies
–
2.2%
Registered
Investment
Companies
–
2.2%
Dreyfus
Institutional
Preferred
Government
Money
Market
Fund,
Institutional
Shares,
5.27%
(e)(f)
(cost
$502,735)
502,735
502,735
Investment
of
Cash
Collateral
for
Securities
Loaned
–
0.2%
Registered
Investment
Companies
–
0.2%
Dreyfus
Institutional
Preferred
Government
Money
Market
Fund,
Institutional
Shares,
5.27%
(e)(f)
(cost
$36,093)
36,093
36,093
Total
Investments
(cost
$23,891,161)
100.6%
22,839,061
Liabilities,
Less
Cash
and
Receivables
(0.6)%
(141,368)
Net
Assets
100.0%
22,697,693
EUR—Euro
RB—Revenue
Bond
(a)
Amounts
stated
in
U.S.
Dollar
unless
otherwise
noted
above.
(b)
Security
exempt
from
registration
pursuant
to
Rule
144A
under
the
Securities
Act
of
1933.
These
securities
may
be
resold
in
transactions
exempt
from
registration,
normally
to
qualified
institutional
buyers.
At
June
30,
2024,
these
securities
were
valued
at
$5,961,378
or
26.26%
of
net
assets.
(c)
Perpetual
bond
with
no
specified
maturity
date.
(d)
Security,
or
portion
thereof,
on
loan.
At
June
30,
2024,
the
value
of
the
fund’s
securities
on
loan
was
$300,343
and
the
value
of
the
collateral
was
$315,448,
consisting
of
cash
collateral
of
$36,093
and
U.S.
Government
&
Agency
securities
valued
at
$279,355.
In
addition,
the
value
of
collateral
may
include
pending
sales
that
are
also
on
loan.
(e)
Investment
in
affiliated
issuer.
The
investment
objective
of
this
investment
company
is
publicly
available
and
can
be
found
within
the
investment
company’s
prospectus.
(f)
The
rate
shown
is
the
1-day
yield
as
of
June
30,
2024.
See
Notes
to
Financial
Statements
Holdings
and
transactions
in
these
affiliated
companies
during
the
period
ended
June
30,
2024
are
as
follows:
Description
Value
($)
6/30/23
Purchases
($)
1
Sales
($)
Value
($)
6/30/24
Dividends/
Distributions
($)
Investment
Companies
–
2.2%
Dreyfus
Institutional
Preferred
Government
Money
Market
Fund,
Institutional
Shares
100,316
6,562,493
(6,160,074)
502,735
10,754
Investment
of
Cash
Collateral
for
Securities
Loaned
–
0.2%
Dreyfus
Institutional
Preferred
Government
Money
Market
Fund,
Institutional
Shares
299,170
5,078,485
(5,341,562)
36,093
3,732
2
Total
–
2.4%
399,486
11,640,978
(11,501,636)
538,828
14,486
1
Includes
reinvested
dividends/distributions.
2
Represents
securities
lending
income
earned
from
the
reinvestment
of
cash
collateral
from
loaned
securities,
net
of
fees
and
collateral
investment
expenses,
and
other
payments
to
and
from
borrowers
of
securities.
Futures
Description
Number
of
Contracts
Expiration
Notional
Value
($)
Market
Value
($)
Unrealized
Appreciation
(Depreciation)
($)
Futures
Long
U.S.
Treasury
Long
Bonds
11
9/19/2024
1,284,146
1,301,438
17,292
U.S.
Treasury
2
Year
Notes
10
9/30/2024
2,036,579
2,042,188
5,609
U.S.
Treasury
10
Year
Notes
1
9/19/2024
109,024
109,984
960
Futures
Short
U.S.
Treasury
5
Year
Notes
1
9/30/2024
105,884
106,578
(694)
Euro-
Buxl
3
9/6/2024
416,703
*
422,876
(6,173)
U.S.
Treasury
10
Year
Ultra
Notes
19
9/19/2024
2,142,550
2,157,094
(14,544)
Gross
Unrealized
Appreciation
23,861
Gross
Unrealized
Depreciation
(21,411)
*
Notional
amounts
in
foreign
currency
have
been
converted
to
USD
using
relevant
foreign
exchange
rates.
Forward
Foreign
Currency
Exchange
Contracts
Counterparty
/
Purchased
Currency
Purchased
Currency
Amounts
Currency
Sold
Sold
Currency
Amounts
Settlement
Date
Unrealized
Appreciation
(Depreciation)
($)
Goldman
Sachs
&
Co.
United
States
Dollar
21,349
Euro
20,000
7/16/2024
(87)
United
States
Dollar
154,804
Euro
142,000
8/6/2024
2,452
United
States
Dollar
146,368
Euro
134,000
8/20/2024
2,497
United
States
Dollar
106,511
Euro
99,000
9/4/2024
139
Gross
Unrealized
Appreciation
5,088
Gross
Unrealized
Depreciation
(87)
STATEMENT
OF
ASSETS
AND
LIABILITIES
June
30,
2024
See
Notes
to
Financial
Statements
Cost
Value
Assets
($):
Investments
in
securities—See
Statement
of
Investments
(including
securities
on
loan,
valued
at
$300,343)—Note
2(c):
–
Unaffiliated
issuers
23,352,333
22,300,233
Affiliated
issuers
538,828
538,828
Cash
denominated
in
foreign
currency
303
303
Cash
collateral
held
by
broker—Note
4
54,391
Interest
receivable
264,945
Receivable
for
investment
securities
sold
173,709
Unrealized
appreciation
on
forward
foreign
currency
exchange
contracts—Note
4
5,088
Dividends
receivable
1,001
Receivable
for
futures
variation
margin—Note
4
688
Securities
lending
income
receivable
109
23,339,295
Liabilities
($):
Due
to
BNY
Mellon
ETF
Investment
Adviser,
LLC—Note
3(b)
6,526
Liability
for
securities
on
loan—Note
2(c)
36,093
Payable
for
investment
securities
purchased
598,896
Unrealized
depreciation
on
forward
foreign
currency
exchange
contracts—Note
4
87
641,602
Net
Assets
($)
22,697,693
Composition
of
Net
Assets
($):
Paid-in
capital
25,050,050
Total
distributable
earnings
(loss)
(2,352,357)
Net
Assets
($)
22,697,693
Shares
outstanding
no
par
value
(unlimited
shares
authorized):
500,001
Net
asset
value
per
share
45.40
Market
price
per
share
45.48
STATEMENT
OF
OPERATIONS
Year
Ended
June
30,
2024
See
Notes
to
Financial
Statements
Investment
Income
($):
Income:
Cash
dividends:
Affiliated
issuers
10,754
Interest
1,077,285
Income
from
securities
lending—Note
2(c)
3,732
Total
Income
1,091,771
Expenses:
Management
fee—Note
3(a)
78,566
Total
Expenses
78,566
Net
Investment
Income
1,013,205
Realized
and
Unrealized
Gain
(Loss)
on
Investments—Note
4
($):
Net
realized
gain
(loss)
on
investments
and
foreign
currency
transactions
(493,634)
Net
realized
gain
(loss)
on
futures
(8,665)
Net
realized
gain
(loss)
on
forward
foreign
currency
exchange
contracts
9,271
Net
realized
gain
(loss)
(493,028)
Net
change
in
unrealized
appreciation
(depreciation)
on
investments
and
foreign
currency
transactions
598,193
Net
change
in
unrealized
appreciation
(depreciation)
on
futures
(107)
Net
change
in
unrealized
appreciation
(depreciation)
on
forward
foreign
currency
exchange
contracts
5,990
Net
change
in
unrealized
appreciation
(depre
ciation)
604,076
Net
Realized
and
Unrealized
Gain
(Loss)
on
Investments
111,048
Net
Increase
(Decrease)
in
Net
Assets
Resulting
from
Operations
1,124,253
STATEMENT
OF
CHANGES
IN
NET
ASSETS
See
Notes
to
Financial
Statements
Year
Ended
June
30,
2024
2023
Operations
($):
Net
investment
income
1,013,205
909,217
Net
realized
gain
(loss)
on
investments
(493,028)
(572,114)
Net
change
in
unrealized
appreciation
(depreciation)
on
investments
604,076
105,112
Net
Increase
(Decrease)
in
Net
Assets
Resulting
from
Operations
1,124,253
442,215
Distributions
($):
Distributions
to
shareholders
(1,108,452)
(865,717)
Beneficial
Interest
Transactions
($):
Proceeds
from
shares
sold
—
—
Increase
(Decrease)
in
Net
Assets
from
Beneficial
Interest
Transactions
—
—
Total
Increase
(Decrease)
in
Net
Assets
15,801
(423,502)
Net
Assets
($):
Beginning
of
Period
22,681,892
23,105,394
End
of
Period
22,697,693
22,681,892
Changes
in
Shares
Outstanding:
Shares
sold
—
—
Net
Increase
(Decrease)
in
Shares
Outstanding
—
—
The
following
table
describes
the
performance
for
the
fiscal
periods
indicated.
See
Notes
to
Financial
Statements
Year
Ended
June
30,
For
the
Period
from
March
22,
2022
(a)
to
June
30,
2022
2024
2023
Per
Share
Data
($):
Net
asset
value,
beginning
of
period
45.36
46.21
50.00
Investment
Operations:
Net
investment
income
(b)
2.03
1.82
0.45
Net
realized
and
unrealized
gain
(loss)
on
investments
0.23
(0.94)
(4.01)
Total
from
Investment
Operations
2.26
0.88
(3.56)
Distributions:
–
–
–
Dividends
from
net
investment
income
(2.22)
(1.73)
(0.33)
Transaction
fees
(b)
—
—
0.10
Net
asset
value,
end
of
period
45.40
45.36
46.21
Market
price,
end
of
period
45.48
45.47
46.46
Net
Asset
Value
Total
Return
(%)
(c)
5.12
2.01
(6.94)
(d)
Market
Price
Total
Return
(%)
(c)
5.07
1.69
(6.44)
(d)
Ratios/Supplemental
Data
(%):
Ratio
of
total
expenses
to
average
net
assets
0.35
0.35
0.35
(e)
Ratio
of
net
investment
income
to
average
net
assets
4.51
4.01
3.41
(e)
Portfolio
Turnover
Rate
(f)
56.72
53.59
13.06
Net
Assets,
end
of
period
($
x
1,000)
22,698
22,682
23,105
(a)
Commencement
of
operations.
(b)
Based
on
average
shares
outstanding.
(c)
Net
asset
value
total
return
is
calculated
assuming
an
initial
investment
made
at
the
net
asset
value
at
the
beginning
of
the
period,
reinvestment
of
all
dividends
and
distributions
at
net
asset
value
during
the
period,
and
redemption
at
net
asset
value
on
the
last
day
of
the
period.
Net
asset
value
total
return
includes
adjustments
in
accordance
with
accounting
principles
generally
accepted
in
the
United
States
of
America
and
as
such,
the
net
asset
value
for
financial
reporting
purposes
and
the
returns
based
upon
those
net
asset
values
may
differ
from
the
net
asset
value
and
returns
for
shareholder
transactions.
Market
price
total
return
is
calculated
assuming
an
initial
investment
made
at
the
market
price
at
the
beginning
of
the
period,
reinvestment
of
all
dividends
and
distributions
at
market
price
during
the
period,
and
sale
at
the
market
price
on
the
last
day
of
the
period.
Total
investment
returns
calculated
for
a
period
of
less
than
one
year
are
not
annualized.
(d)
The
net
asset
value
total
return
and
the
market
price
total
return
is
calculated
from
fund
inception.
The
inception
date
is
the
first
date
the
fund
was
available
on
NYSE
Arca,
Inc.
(e)
Annualized.
(f)
Portfolio
turnover
rate
is
not
annualized
for
periods
less
than
one
year,
if
applicable,
and
does
not
include
securities
received
or
delivered
from
processing
creations
or
redemptions.
NOTES
TO
FINANCIAL
STATEMENTS
NOTE
1—Organization:
BNY
Mellon
Responsible
Horizons
Corporate
Bond
ETF (the “fund”) is a
separate
diversified series
of
BNY
Mellon
ETF
Trust
(the
“Trust”),
which is
registered as
a
Massachusetts
business
trust
under
the
Investment
Company
Act
of
1940,
as
amended
(the
“Act”),
as
an
open-ended
management
investment
company.
The
Trust
operates
as
a
series
company
currently
consisting
of
thirteen
series,
including
the
fund.
The
investment
objective
of
the
fund
is
to
seek
total
return
consisting
of
capital
appreciation
and
income.
BNY
Mellon
ETF
Investment
Adviser,
LLC
(the
“Adviser”),
a
wholly-owned
subsidiary
of
The
Bank
of
New
York
Mellon
Corporation
(“BNY”),
serves
as
the
fund’s
investment
adviser. Insight
North
America
LLC (the
“Sub-Adviser”
or
“INA”),
an
indirect wholly-owned
subsidiary
of
BNY
and
an
affiliate
of
the
Adviser,
serves
as
the
fund’s
sub-adviser.
The
Bank
of
New
York
Mellon,
a
subsidiary
of
BNY
and
an
affiliate
of
the
Adviser,
serves
as
administrator,
custodian
and
transfer
agent
with
the
Trust.
BNY
Mellon
Securities
Corporation
(the
“Distributor”),
a wholly-owned
subsidiary
of
the
Adviser,
is
the
distributor
of
the
fund’s
shares.
The
shares
of
the
fund
are
referred
to
herein
as
“Shares”
or
“Fund
Shares.”
Fund
Shares
are
listed
and
traded
on
NYSE
Arca,
Inc..
The
market
price
of
each
Share
may
differ
to
some
degree
from
the
fund’s
net
asset
value
(“NAV”).
Unlike
conventional
mutual
funds,
the
fund
issues
and
redeems
Shares
on
a
continuous
basis,
at
NAV,
only
in
a
large
specified
number
of
Shares,
each
called
a
“Creation
Unit”.
Creation
Units
are
issued
and
redeemed
principally
in
exchange
for
the
deposit
or
delivery
of
a
basket
of
securities.
Except
when
aggregated
in
Creation
Units
by
Authorized
Participants,
the
Shares
are
not
individually
redeemable
securities
of
the
fund.
Individual
Fund
Shares
may
only
be
purchased
and
sold
on
the
NYSE
Arca,
Inc..,
other
national
securities
exchanges,
electronic
crossing
networks
and
other
alternative
trading
systems
through
your
broker-dealer
at
market
prices.
Because
Fund
Shares
trade
at
market
prices
rather
than
at
NAV,
Fund
Shares
may
trade
at
a
price
greater
than
NAV
(premium)
or
less
than
NAV
(discount).
When
buying
or
selling
Shares
in
the
secondary
market,
you
may
incur
costs
attributable
to
the
difference
between
the
highest
price
a
buyer
is
willing
to
pay
to
purchase
Shares
of
the
fund
(bid)
and
the
lowest
price
a
seller
is
willing
to
accept
for
Shares
of
the
fund
(ask).
NOTE
2—Significant
Accounting
Policies:
The
Financial
Accounting
Standards
Board
(“FASB”)
Accounting
Standards
Codification
(“ASC”)
is
the
exclusive
reference
of
authoritative
U.S.
generally
accepted
accounting
principles
(“GAAP”)
recognized
by
the
FASB
to
be
applied
by
nongovernmental
entities.
Rules
and
interpretive
releases
of
the
SEC
under
authority
of
federal
laws
are
also
sources
of
authoritative
GAAP
for
SEC
registrants. The
fund
is an
investment
company
and
applies
the
accounting
and
reporting
guidance
of
the
FASB
ASC
Topic
946
Financial
Services-Investment
Companies. The
fund’s
financial
statements
are
prepared
in
accordance
with
GAAP,
which
may
require
the
use
of
management
estimates
and
assumptions.
Actual
results
could
differ
from
those
estimates.
The
Trust
enters
into
contracts
that
contain
a
variety
of
indemnifications.
The
fund’s
maximum
exposure
under
these
arrangements
is
unknown.
The
fund
does
not
anticipate
recognizing
any
loss
related
to
these
arrangements.
(a)
Portfolio
valuation:
The
fair
value
of
a
financial
instrument
is
the
amount
that
would
be
received
to
sell
an
asset
or
paid
to
transfer
a
liability
in
an
orderly
transaction
between
market
participants
at
the
measurement
date
(i.e.,
the
exit
price).
GAAP
establishes
a
fair
value
hierarchy
that
prioritizes
the
inputs
of
valuation
techniques
used
to
measure
fair
value.
This
hierarchy
gives
the
highest
priority
to
unadjusted
quoted
prices
in
active
markets
for
identical
assets
or
liabilities
(Level
1
measurements)
and
the
lowest
priority
to
unobservable
inputs
(Level
3
measurements).
Additionally,
GAAP
provides
guidance
on
determining
whether
the
volume
and
activity
in
a
market
has
decreased
significantly
and
whether
such
a
decrease
in
activity
results
in
transactions
that
are
not
orderly.
GAAP
requires
enhanced
disclosures
around
valuation
inputs
and
techniques
used
during
annual
and
interim
periods.
Various
inputs
are
used
in
determining
the
value
of
the
fund’s
investments
relating
to
fair
value
measurements.
These
inputs
are
summarized
in
the
three
broad
levels
listed
below:
Level
1
—
unadjusted
quoted
prices
in
active
markets
for
identical
investments.
Level
2
—
other
significant
observable
inputs
(including
quoted
prices
for
similar
investments,
interest
rates,
prepayment
speeds,
credit
risk,
etc.).
Level
3
—
significant
unobservable
inputs
(including
the
fund’s
own
assumptions
in
determining
the
fair
value
of
investments).
The
inputs
or
methodology
used
for
valuing
securities
are
not
necessarily
an
indication
of
the
risk
associated
with
investing
in
those
securities.
Changes
in
valuation
techniques
may
result
in
transfers
in
or
out
of
an
assigned
level
within
the
disclosure
hierarchy.
Valuation
techniques
used
to
value
the
fund’s
investments
are
as
follows:
Registered
investment
companies
that
are
not
traded
on
an
exchange
are
valued
at
their
net
asset
value
and
are
generally
categorized
within
Level 1
of
the
fair
value
hierarchy.
The
Trust’s Board
of
Trustees
(the
“Board”)
has
designated
the
Adviser
as
the
fund’s
valuation
designee
to
make
all
fair
value
determinations
with
respect
to
the
fund’s
portfolio
of
investments,
subject
to
the
Board’s
oversight
and
pursuant
to
Rule
2a-5
under
the
Act.
Investments
in
debt
securities
excluding
short-term
investments
(other
than
U.S.
Treasury
Bills),
futures
and
forward
foreign
currency
exchange
contracts
(“forward
contracts”)
are
valued
each
business
day
by
one
or
more
independent
pricing
services
(each,
a
“Service”)
approved
by the Board.
Investments
for
which
quoted
bid
prices
are
readily
available
and
are
representative
of
the
bid
side
of
the
market
in
the
judgment
of
a
Service
are
valued
at
the
mean
between
the
quoted
bid
prices
(as
obtained
by
a
Service
from
dealers
in
such
securities)
and
asked
prices
(as
calculated
by
a
Service
based
upon
its
evaluation
of
the
market
for
such
securities).
Securities
are
valued
as
determined
by
a
Service,
based
on
methods
which
include
consideration
of
the
following:
yields
or
prices
of
securities
of
comparable
quality,
coupon,
maturity
and
type;
indications
as
to
values
from
dealers;
and
general
market
conditions.
Each
Service
and
independent
valuation
firm
is
engaged
under
the
general
oversight
of
the
Board.
Overnight
and
certain
other
short-term
debt
instruments
(excluding
U.S.
Treasury
Bills)
will
be
valued
by
the
amortized
cost
method,
which
approximates
value,
unless
a
Service
provides
a
valuation
for
such
security
or,
in
the
opinion
of
the
Board
or
a
committee
or
other
persons
designated
by
the
Board,
the
amortized
cost
method
would
not
represent
fair
value. These
securities
are
generally
categorized
within
Level
2
of
the
fair
value
hierarchy.
When
market
quotations
or
official
closing
prices
are
not
readily
available,
or
are
determined
not
to
reflect
fair
value
accurately,
they are
valued
at
fair
value
as
determined
in
good
faith
based
on
procedures
approved
by
the
Board.
Fair
value
of
investments
may
be
determined
by
valuation
designee
using
such
information
as
it
deems
appropriate
under
the
circumstances.
Certain
factors
may
be
considered
when
fair
valuing
investments
such
as:
fundamental
analytical
data,
the
nature
and
duration
of
restrictions
on
disposition,
an
evaluation
of
the
forces
that
influence
the
market
in
which
the
securities
are
purchased
and
sold,
and
public
trading
in
similar
securities
of
the
issuer
or
comparable
issuers.
These
securities
are
either
categorized
within
Level
2
or
3
of
the
fair
value
hierarchy
depending
on
the
relevant
inputs
used.
For
securities
where
observable
inputs
are
limited,
assumptions
about
market
activity
and
risk
are
used
and
are
generally
categorized
within
Level
3
of
the
fair
value
hierarchy.
Futures,
which
are
traded
on
an
exchange,
are
valued
at
the
last
sales
price
on
securities
exchange
on
which
such
contracts
are
primarily
traded
or
at
the
last
sales
price
on
the
exchange
on
each
business
day
and
are
generally
categorized
within
Level
1
of
the
fair
value
hierarchy.
Forward
contracts
are
valued
at
the
forward
rate
and
are
generally
categorized
within
Level
2
of
the
fair
value
hierarchy.
The
table
below
summarizes
the
inputs
used
as
of June
30,
2024
in
valuing
the
fund’s
investments:
Fair
Value
Measurements
(b)
Foreign
currency
transactions:
The
fund
does
not
isolate
that
portion
of
the
results
of
operations
resulting
from
changes
in
foreign
exchange
rates
on
investments
from
the
fluctuations
arising
from
changes
in
the
market
prices
of
securities
held.
Such
fluctuations
are
included
with
the
net
realized
and
unrealized
gain
or
loss
on
investments.
Level
1
-
Unadjusted
Quoted
Prices
Level
2
-
Other
Significant
Observable
Inputs
Level
3
-
Significant
Unobservable
Inputs
Total
Assets
($)
Investments
In
Securities:
†
Corporate
Bonds
—
22,067,125
—
22,067,125
Foreign
Governmental
—
224,160
—
224,160
Municipal
Securities
—
8,948
—
8,948
Investment
Companies
502,735
—
—
502,735
Investment
of
Cash
Collateral
for
Securities
Loaned
36,093
—
—
36,093
Other
Financial
Instruments:
Futures
††
23,861
—
—
23,861
Forward
Foreign
Currency
Exchange
Contracts
††
—
5,088
—
5,088
Liabilities
($)
Other
Financial
Instruments:
Futures
††
(21,411)
—
—
(21,411)
Forward
Foreign
Currency
Exchange
Contracts
††
—
(87)
—
(87)
†
See
Statement
of
Investments
for
additional
detailed
categorizations,
if
any.
††
Amount
shown
represents
unrealized
appreciation
(depreciation)
at
period
end,
but
only
variation
margin
on
exchange-traded
and
centrally
cleared
derivatives,
if
any,
are
reported
in
the
Statement
of
Assets
and
liabilities.
NOTES
TO
FINANCIAL
STATEMENTS
(continued)
Net
realized
foreign
exchange
gains
or
losses
arise
from
sales
of
foreign
currencies,
currency
gains
or
losses
realized
on
securities
transactions
between
trade
and
settlement
date,
and
the
difference
between
the
amounts
of
dividends,
interest
and
foreign
withholding
taxes
recorded
on
the
fund’s
books
and
the
U.S.
dollar
equivalent
of
the
amounts
actually
received
or
paid.
Net
unrealized
foreign
exchange
gains
and
losses
arise
from
changes
in
the
value
of
assets
and
liabilities
other
than
investments
resulting
from
changes
in
exchange
rates.
Foreign
currency
gains
and
losses
on
foreign
currency
transactions
are
also
included
with
net
realized
and
unrealized
gain
or
loss
on
investments.
Foreign
Taxes:
The
fund
may
be
subject
to
foreign
taxes
(a
portion
of
which
may
be
reclaimable)
on
income,
stock
dividends,
realized
and
unrealized
capital
gains
on
investments
or
certain
foreign
currency
transactions.
Foreign
taxes
are
recorded
in
accordance
with
the
applicable
foreign
tax
regulations
and
rates
that
exist
in
the
foreign
jurisdictions
in
which
the
fund
invests.
These
foreign
taxes,
if
any,
are
paid
by
the
fund
and
are
reflected
in
the
Statement
of
Operations,
if
applicable.
Foreign
taxes
payable
or
deferred
or
those
subject
to
reclaims as
of
June
30,
2024
,
if
any,
are
disclosed
in
the
fund’s
Statement
of
Assets
and
Liabilities.
(c)
Securities
transactions
and
investment
income:
Securities
transactions
are
recorded
on
a
trade
date
basis.
Realized
gains
and
losses
from
securities
transactions
are
recorded
on
the
identified
cost
basis.
Dividend
income
is
recognized
on
the
ex-dividend
date
and
interest
income,
including,
where
applicable,
accretion
of
discount
and
amortization
of
premium
on
investments,
is
recognized
on
the
accrual
basis.
Pursuant
to
a
securities
lending
agreement
with
BNY,
the
fund
may
lend
securities
to
qualified
institutions.
It
is
the
fund’s
policy
that,
at
origination,
all
loans
are
secured
by
collateral
of
at
least
102%
of
the
value
of
U.S.
securities
loaned
and
105%
of
the
value
of
foreign
securities
loaned.
Collateral
equivalent
to
at
least
100%
of
the
market
value
of
securities
on
loan
is
maintained
at
all
times.
Collateral
is
either
in
the
form
of
cash,
which
can
be
invested
in
certain
money
market
mutual
funds
managed
by
the
Adviser,
or
U.S.
Government
and
Agency
securities.
Any
non-cash
collateral
received
cannot
be
sold
or
re-pledged
by
the
fund,
except
in
the
event
of
borrower
default.
The
securities
on
loan,
if
any,
are
also
disclosed
in
the
fund’s
Statement
of
Investments.
The
fund is
entitled
to
receive
all
dividends,
interest
and
distributions
on
securities
loaned,
in
addition
to
income
earned
as
a
result
of
the
lending
transaction.
Should
a
borrower
fail
to
return
the
securities
in
a
timely
manner,
BNY
is
required
to
replace
the
securities
for
the
benefit
of
the
fund
or
credit
the
fund
with
the
market
value
of
the
unreturned
securities
and
is
subrogated
to
the
fund’s
rights
against
the
borrower
and
the
collateral.
Additionally,
the
contractual
maturity
of
security
lending
transactions
are
on
an
overnight
and
continuous
basis.
During
the
year
ended
June
30,
2024,
BNY
earned
$507 from
the
lending
of
the
fund’s portfolio
securities,
pursuant
to
the
securities
lending
agreement.
For
financial
reporting
purposes,
the
fund
elects
not
to
offset
assets
and
liabilities
subject
to
a
securities
lending
agreement,
if
any,
in
the
Statement
of
Assets
and
Liabilities.
Therefore,
all
qualifying
transactions
are
presented
on
a
gross
basis
in
the
Statement
of
Assets
and
Liabilities.
As
of
June
30,
2024,
the
fund
had
securities
lending
and
the
impact
of
netting
of
assets
and
liabilities
and
the
offsetting
of
collateral
pledged
or
received,
if
any,
based
on
contractual
netting/set-off
provisions
in
the
securities
lending
agreement
are
detailed
in
the
following
table:
(d)
Affiliated
issuers:
Investments
in
other
investment
companies
advised
by
the
Adviser
or
its
affiliates are
defined
as
“affiliated”
under
the
Act.
(e)
Market
Risk:
The
value
of
the
securities
in
which
the
fund
invests
may
be
affected
by
political,
regulatory,
economic
and
social
developments,
and
developments
that
impact
specific
economic
sectors,
industries
or
segments
of
the
market.
In
addition,
turbulence
in
financial
markets
and
reduced
liquidity
in
equity,
credit
and/or
fixed
income
markets
may
negatively
affect
many
issuers,
which
could
adversely
affect
the
fund.
Global
economies
and
financial
markets
are
becoming
increasingly
interconnected,
and
conditions
and
events
in
one
country,
region
or
financial
market
may
adversely
impact
issuers
in
a
different
country,
region
or
financial
market.
These
risks
may
be
magnified
if
certain
events
or
developments
adversely
interrupt
the
global
supply
chain;
in
these
and
other
circumstances,
such
risks
might
affect
companies
world-wide.
Assets
($)
Liabilities
($)
Securities
Lending
300,343
—
Total
gross
amount
of
assets
and
liabilities
in
the
Statement
of
Assets
and
Liabilities
300,343
—
Collateral
(received)/posted
not
offset
in
the
Statement
of
Assets
and
Liabilities
(300,343)
†
—
Net
Amount
—
—
†
The
value
of
the
related
collateral
received
by
the
fund
normally
exceeded
the
value
of
the
securities
loaded
by
the
fund
pursuant
to
the
securities
lending
agreement.
In
addition,
the
value
of
collateral
may
include
pending
sales
that
are
also
on
loan.
See
Statement
of
Investments
for
detailed
information
regarding
the
collateral
received
for
open
securities
lending.
Fixed-Income
Market
Risk:
The
market
value
of
a
fixed-income
security
may
decline
due
to
general
market
conditions
that
are
not
specifically
related
to
a
particular
company,
such
as
real
or
perceived
adverse
economic
conditions,
changes
in
the
outlook
for
corporate
earnings,
changes
in
interest
or
currency
rates
or
adverse
investor
sentiment
generally.
The
fixed-income
securities
market
can
be
susceptible
to
increases
in
volatility
and
decreases
in
liquidity.
Liquidity
can
decline
unpredictably
in
response
to
overall
economic
conditions
or
credit
tightening.
Increases
in
volatility
and
decreases
in
liquidity
may
be
caused
by
a
rise
in
interest
rates
(or
the
expectation
of
a
rise
in
interest
rates).
An
unexpected
increase
in
redemption
requests,
including
requests
from
Authorized
Participants
who
may
own
a
significant
percentage
of
the
fund’s
shares,
which
may
be
triggered
by
market
turmoil
or
an
increase
in
interest
rates,
could
cause
the
fund
to
sell
its
holdings
at
a
loss
or
at
undesirable
prices
and
adversely
affect
the
fund’s
share
price
and
increase
the
fund’s
liquidity
risk,
fund
expenses
and/or
taxable
distributions.
Federal
Reserve
policy
in
response
to
market
conditions,
including
with
respect
to
interest
rates,
may
adversely
affect
the
value,
volatility
and
liquidity
of
dividend
and
interest
paying
securities.
Policy
and
legislative
changes
worldwide
are
affecting
many
aspects
of
financial
regulation.
The
impact
of
these
changes
on
the
markets
and
the
practical
implications
for
market
participants
may
not
be
fully
known
for
some
time.
ESG
Investment
Approach
Risk:
The
fund’s
incorporation
of
ESG
considerations
into
its
investment
approach
may
cause
it
to
make
different
investments
than
funds
that
invest
principally
in
corporate
bonds
but
do
not
incorporate
ESG
considerations
when
selecting
investments.
Under
certain
economic
conditions,
this
could
cause
the
fund
to
underperform
funds
that
do
not
incorporate
ESG
considerations.
For
example,
the
incorporation
of
ESG
considerations
may
result
in
the
fund
forgoing
opportunities
to
buy
certain
securities
when
it
might
otherwise
be
advantageous
to
do
so
or
selling
securities
when
it
might
otherwise
be
disadvantageous
for
the
fund
to
do
so.
The
incorporation
of
ESG
considerations
may
also
affect
the
fund’s
exposure
to
certain
sectors
and/or
types
of
investments,
and
may
adversely
impact
the
fund’s
performance
depending
on
whether
such
sectors
or
investments
are
in
or
out
of
favor
in
the
market.
INA’s
security
selection
process
incorporates
ESG
data
provided
by
third
parties,
which
may
be
limited
for
certain
issuers
and/or
only
take
into
account
one
or
a
few
ESG
related
components.
In
addition,
ESG
data
may
include
quantitative
and/or
qualitative
measures,
and
consideration
of
this
data
may
be
subjective.
Different
methodologies
may
be
used
by
the
various
data
sources
that
provide
ESG
data.
ESG
data
from
third
parties
used
by
INA
as
part
of
its
proprietary
ESG
process
often
lacks
standardization,
consistency
and
transparency,
and
for
certain
issuers
such
data
may
not
be
available
complete
or
accurate.
INA’s
evaluation
of
ESG
factors
relevant
to
a
particular
issuer
may
be
adversely
affected
in
such
instances.
As
a
result,
the
fund’s
investments
may
differ
from,
and
potentially
underperform,
funds
that
incorporate
ESG
data
from
other
sources
or
utilize
other
methodologies.
Foreign
Investment
Risk:
Because
the
fund
invests
in
foreign
securities,
the
fund’s
performance
will
be
influenced
by
political,
social
and
economic
factors
affecting
investments
in
foreign
issuers.
Special
risks
associated
with
investments
in
foreign
issuers
include
exposure
to
currency
fluctuations,
less
liquidity,
less
developed
or
less
efficient
trading
markets,
lack
of
comprehensive
company
information,
political
and
economic
instability
and
differing
auditing
and
legal
standards.
The
imposition
of
sanctions,
confiscations,
trade
restrictions
(including
tariffs)
and
other
government
restrictions
by
the
United
States
and
other
governments,
or
problems
in
share
registration,
settlement
or
custody,
may
result
in
losses
for
the
fund.
Investments
denominated
in
foreign
currencies
are
subject
to
the
risk
that
such
currencies
will
decline
in
value
relative
to
the
U.S.
dollar
and
affect
the
value
of
these
investments
held
by
the
fund.
Some
sovereign
obligors
have
been
among
the
world’s
largest
debtors
to
commercial
banks,
other
governments,
international
financial
organizations
and
other
financial
institutions.
These
obligors,
in
the
past,
may
have
experienced
substantial
difficulties
in
servicing
their
external
debt
obligations,
which
led
to
defaults
on
certain
obligations
and
the
restructuring
of
certain
indebtedness.
To
the
extent
securities
held
by
the
fund
trade
in
a
market
that
is
closed
when
the
exchange
on
which
the
fund’s
shares
trade
is
open,
there
may
be
deviations
between
the
current
price
of
a
security
and
the
last
quoted
price
for
the
security
in
the
closed
foreign
market.
These
deviations
could
result
in
the
fund
experiencing
premiums
or
discounts
greater
than
those
of
ETFs
that
invest
in
domestic
securities.
High
Yield
Securities Risk:
High
yield
(“junk”)
securities
involve
greater
credit
risk,
including
the
risk
of
default,
than
investment
grade
securities,
and
are
considered
predominantly
speculative
with
respect
to
the
issuer’s
ability
to
make
principal
and
interest
payments.
The
prices
of
high
yield
securities
can
fall
in
response
to
unfavorable
news
about
the
issuer
or
its
industry,
or
the
economy
in
general,
to
a
greater
extent than
those
of
higher
rated
securities.
Authorized
Participants,
Market
Makers
and
Liquidity
Providers
Risk:
The
fund
has
a
limited
number
of
financial
institutions
that
may
act
as
Authorized
Participants,
which
are
responsible
for
the
creation
and
redemption
activity
for
the
fund.
In
addition,
there
may
be
a
limited
number
of
market
makers
and/or
liquidity
providers
in
the
marketplace.
To
the
extent
either
of
the
following
events
occur,
fund
shares
may
trade
at
a
material
discount
to
net
asset
value
and
possibly
face
delisting:
(i)
Authorized
Participants
exit
the
business
or
otherwise
become
unable
to
process
creation
and/or
redemption
orders
and
no
other
Authorized
Participants
step
forward
to
perform
these
services,
or
(ii)
market
makers
and/or
liquidity
providers
exit
the
business
or
significantly
reduce
their
business
activities
and
no
other
entities
step
forward
to
perform
their
functions.
(f)
Dividends
and
distributions
to
shareholders:
Dividends
and
distributions
are
recorded
on
the
ex-dividend
date.
Dividends
from
net
investment
income
are
normally
declared
and
paid
on
a
monthly
basis. Dividends
from
net
realized
capital
gains,
if
any,
are
normally
declared
and
paid
annually,
but
the
fund
may
make
distributions
on
a
more
frequent
basis
to
comply
with
the
distribution
requirements
NOTES
TO
FINANCIAL
STATEMENTS
(continued)
of
the
Internal
Revenue
Code
of
1986,
as
amended
(the
“Code”).
To
the
extent
that
net
realized
capital
gains
can
be
offset
by
capital
loss
carryovers
of
a
fund,
it
is
the
policy
of
the
fund
not
to
distribute
such
gains.
Income
and
capital
gain
distributions
are
determined
in
accordance
with
income
tax
regulations,
which
may
differ
from
GAAP.
(g)
Federal
income
taxes:
It
is
the
policy
of
the
fund
to
continue to
qualify
as
a
regulated
investment
company,
if
such
qualification
is
in
the
best
interests
of
its
shareholders,
by
complying
with
the
applicable
provisions
of
the
Code,
and
to
make
distributions
of
taxable
income
and
net
realized
capital
gain sufficient
to
relieve
it
from
substantially
all
federal
income
and
excise
taxes.
For
federal
income
tax
purposes,
the
fund
is
treated
as
a
separate
entity.
As
of
and
during
the period
ended June
30,
2024,
the
fund
did
not
have
any
liabilities
for
any
uncertain
tax
positions.
The
fund
recognizes
interest
and
penalties,
if
any,
related
to
uncertain
tax
positions
as
income
tax
expense
in
the
Statement
of
Operations.
During
the period
ended June
30,
2024,
the
fund
did
not
incur
any
interest
or
penalties.
Each
tax
year
in
the
three-year
period
ended June
30,
2024
remains
subject
to
examination
by
the
Internal
Revenue
Service
and
state
taxing
authorities.
At June
30,
2024,
the
components
of
accumulated
earnings
on
a
tax
basis
were
as
follows:
undistributed
ordinary
income
$94,755,
accumulated
capital
losses
$1,364,165,
and
unrealized depreciation
$1,082,947.
The
fund is
permitted
to
carry
forward
capital
losses
for
an
unlimited
period.
Furthermore,
capital
loss
carryovers
retain
their
character
as
either
short-term
or
long-term
capital
losses.
The
accumulated
capital
loss
carryover
is
available
for
federal
income
tax
purposes
to
be
applied
against
future
net
realized
capital
gains,
if
any,
realized
subsequent
to
June
30,
2024.
The
fund
has
$811,604
of
short-term
capital
losses
and
$552,561
of
long-term
capital
losses
which
can
be
carried
forward
for
an
unlimited
period.
The
tax
character
of
distributions
paid
to
shareholders
during
the
fiscal
years
ended
June
30,
2024
and
June
30,
2023
were
as
follows:
ordinary
income
$1,108,452
and
$865,717,
respectively.
NOTE
3—Management
Fee,
Sub-Advisory
Fee
and
Other
Transactions
with
Affiliates:
(a)
Pursuant
to
a
management
agreement
with
the
Adviser,
the
management
fee
is computed
at
an
annual
rate of
0.35%
of
the
value
of
the
fund’s
average
daily
net
assets
and
is
payable
monthly.
The
fund’s
management
agreement
provides
that
the
Adviser
pays
substantially
all
expenses
of
the
fund,
except
for
the
management
fees,
payments
under
the
fund’s
12b-1
plan
(if
any),
interest
expenses,
taxes,
acquired
fund
fees
and
expenses,
brokerage
commissions,
costs
of
holding
shareholder
meetings,
fees
and
expenses
associated
with
the
fund’s
securities
lending
program,
and
litigation
and
potential
litigation
and
other
extraordinary
expenses
not
incurred
in
the
ordinary
course
of
the
fund’s
business.
The
Adviser
may
from
time
to
time
voluntarily
waive
and/or
reimburse
fees
or
expenses
in
order
to
limit
total
annual
fund
operating
expenses.
Any
such
voluntary
waiver
or
reimbursement
may
be
eliminated
by
the
Adviser
at
any
time.
During
the
period
ended
June
30,
2024,
there
was
no
reduction
in
expenses
pursuant
to
the
undertaking.
Pursuant
to
a
sub-investment
advisory
agreement
between
the
Adviser
and
the
Sub-Adviser,
the
Sub-Adviser
serves
as
the
fund’s
sub-
adviser
responsible
for
the
day-to-day
management
of
the
fund’s
portfolio.
The
Adviser
pays
the
Sub-Adviser
a
monthly
fee
at
an
annual
percentage
of
the
value
of
the
fund’s
average
daily
net
assets.
The
Adviser
has
obtained
an
exemptive
order
from
the
SEC
(the
“Order”),
upon
which
the
fund
may
rely,
to
use
a
manager
of
managers
approach
that
permits
the
Adviser,
subject
to
certain
conditions
and
approval
by
the
Board,
to
enter
into
and
materially
amend
sub-investment
advisory
agreements
with
one
or
more
sub-advisers
who
are
either
unaffiliated
or
affiliated
with
the
Adviser
without
obtaining
shareholder
approval.
The
Order
also
relieves
the
fund
from
disclosing
the
sub-advisory
fee
paid
by
the
Adviser
to
a
Sub-Adviser
in
documents
filed
with
the
SEC
and
provided
to
shareholders.
In
addition,
pursuant
to
the
Order,
it
is
not
necessary
to
disclose
the
sub-advisory
fee
payable
by
the
Adviser
separately
to
a
Sub-Adviser
that
is
a
wholly-owned
subsidiary
(as
defined
in
the
1940
Act)
of
BNY
in
documents
filed
with
the
SEC
and
provided
to
shareholders;
such
fees
are
to
be
aggregated
with
fees
payable
to
the
Adviser.
The
Adviser
has
ultimate
responsibility
(subject
to
oversight
by
the
Board)
to
supervise
any
Sub-Adviser
and
recommend
the
hiring,
termination,
and
replacement
of
any
Sub-Adviser
to
the
Board.
Pursuant
to
a
sub-investment
advisory
agreement
between
the
Adviser
and
the
Sub-Adviser,
the
Adviser
pays
the
Sub-Adviser
a
monthly
fee
at
an
annual
rate
of
0.175%
of
the
value
of
the
fund’s
average
daily
net
assets.
The
Adviser,
and
not
the
fund,
pays
the
Sub-Adviser
fee
rate.
(b)
The
fund
has
an
arrangement
with
The
Bank
of
New
York
Mellon
(the
“Custodian”),
a
subsidiary
of
BNY
and
an
affiliate
of
the
Adviser, whereby
the
fund
will
receive
interest
income
or
be
charged
overdraft
fees
when
cash
balances
are
maintained.
For
financial
reporting
purposes,
the
fund
includes
this
interest
income
and
overdraft
fees,
if
any,
as
interest
income
in
the
Statement
of
Operations.
The
components
of
“Due
to
BNY
Mellon
ETF Investment
Adviser,
LLC”
in
the
Statement
of
Assets
and
Liabilities
consist
of:
management
fee
of $6,526.
(c)
Each
Board
member
serves
as
a
Board
member
of
each
fund
within
the
Trust.
The
Board
members
are
not
compensated
directly
by
the
fund.
The
Board
members
are
paid
by
the
Adviser
from
the
unitary
management
fees
paid
to
the
Adviser
by
the
funds
within
the
Trust,
including
the
fund.
NOTE
4—Securities
Transactions:
The
aggregate
amount
of
purchases
and
sales
(including
paydowns)
of
investment
securities,
excluding
short-term
securities,
futures,
forward
contracts
and
in-kind
transactions,
during
the
period
ended
June
30,
2024, amounted
to $12,528,580
and
$12,710,006,
respectively.
Derivatives:
A
derivative
is
a
financial
instrument
whose
performance
is
derived
from
the
performance
of
another
asset.
The
fund
enters
into
International
Swaps
and
Derivatives
Association,
Inc.
Master
Agreements
or
similar
agreements
(collectively,
“Master
Agreements”)
with
its
over-the-counter
(“OTC”)
derivative
contract
counterparties
in
order
to,
among
other
things,
reduce
its
credit
risk
to
counterparties.
Master
Agreements
include
provisions
for
general
obligations,
representations,
collateral
and
events
of
default
or
termination.
Under
a
Master
Agreement,
the
fund
may
offset
with
the
counterparty
certain
derivative
financial
instruments’
payables
and/or
receivables
with
collateral
held
and/or
posted
and
create
one
single
net
payment
in
the
event
of
default
or
termination.
Rule
18f-4
under
the
Act
regulates
the
use
of
derivative
transactions
for
certain
funds
registered
under
the
Act.
The
fund’s
derivative
transactions
are
subject
to
a
value-at-
risk
leverage
limit
and
certain
reporting
and
other
requirements
pursuant
to
a
derivatives
risk
management
program
adopted
by
the
fund.
Each
type
of
derivative
instrument
that
was
held
by
the
fund
during
the year
ended
June
30,
2024
is
discussed
below.
Futures:
In
the
normal
course
of
pursuing
its
investment
objective,
exposed
to
market
risk,
including
interest
risk,
as
a
result
of
changes
in
value
of
underlying
financial
instruments.
The
fund
invests
in
futures
in
order
to
manage
the
exposure
to
or
protect
against
changes
in
the
market.
A
futures
contract
represents
a
commitment
for
the
future
purchase
or
a
sale
of
an
asset
at
a
specified
date.
Upon
entering
into
such
contracts,
these
investments
require
initial
margin
deposits
with
a
counterparty,
which
consist
of
cash
or
cash
equivalents.
The
amount
of
these
deposits
is
determined
by
the
exchange
or
Board
of
Trade
on
which
the
contract
is
traded
and
is
subject
to
change.
Accordingly,
variation
margin
payments
are
received
or
made
to
reflect
daily
unrealized
gains
or
losses
which
are
recorded
in
the
Statements
of
Operations.
When
the
contracts
are
closed,
the
fund
recognizes
a
realized
gain
or
loss
which
is
reflected
in
the
Statements
of
Operations.
There
is
minimal
counterparty
credit
risk
to
the
fund
with
futures
since
they
are
exchange
traded,
and
the
exchange
guarantees
the
futures
against
default.
Futures
open
at June
30,
2024,
are
set
forth
in
the
Statement
of
Investments.
Forward
Foreign
Currency
Exchange
Contracts:
T
he
fund
enters
into
forward
contracts
in
order
to
hedge
its
exposure
to
changes
in
foreign
currency
exchange
rates
on
its
foreign
portfolio
holdings,
to
settle
foreign
currency
transactions
or
as
a
part
of
its
investment
strategy.
When
executing
forward
contracts,
the
fund
is
obligated
to
buy
or
sell
a
foreign
currency
at
a
specified
rate
on
a
certain
date
in
the
future.
With
respect
to
sales
of
forward
contracts,
the
fund
incurs
a
loss
if
the
value
of
the
contract
increases
between
the
date
the
forward
contract
is
opened
and
the
date
the
forward
contract
is
closed.
The
fund
realizes
a
gain
if
the
value
of
the
contract
decreases
between
those
dates.
With
respect
to
purchases
of
forward
contracts,
the
fund
incurs
a
loss
if
the
value
of
the
contract
decreases
between
the
date
the
forward
contract
is
opened
and
the
date
the
forward
contract
is
closed.
The
fund
realizes
a
gain
if
the
value
of
the
contract
increases
between
those
dates.
Any
realized
or
unrealized
gains
or
losses
which
occurred
during
the
period
are
reflected
in
the
Statement
of
Operations.
The
fund
is
exposed
to
foreign
currency
risk
as
a
result
of
changes
in
value
of
underlying
financial
instruments.
The
fund
is
also
exposed
to
credit
risk
associated
with
counterparty
nonperformance
on
these
forward
contracts,
which
is
generally
limited
to
the
unrealized
gain
on
each
open
contract.
This
risk
may
be
mitigated
by
Master
Agreements,
if
any,
between
the
fund
and
the
counterparty
and
the
posting
of
collateral,
if
any,
by
the
counterparty
to
the
fund
to
cover
the
fund’s
exposure
to
the
counterparty.
Forward
contracts
open
at June
30,
2024
are
set
forth
in
the
Statement
of
Investments.
The
following
tables
show
the
fund’s
exposure
to
different
types
of
market
risk
as
it
relates
to
the
Statement
of
Assets
and
Liabilities
and
the
Statement
of
Operations,
respectively.
Fair
value
of
derivative
instruments
as
of June
30,
2024
is
shown
below:
NOTES
TO
FINANCIAL
STATEMENTS
(continued)
Statement
of
Assets
and
Liabilities
location:
The
effect
of
derivative
instruments
in
the
Statements of
Operations
during
the year
ended
June
30,
2024 is
shown
below:
Statement
of
Operations
location:
The
provisions
of
ASC
Topic
210
“Disclosures
about
Offsetting
Assets
and
Liabilities”
require
disclosure
on
the
offsetting
of
financial
assets
and
liabilities.
These
disclosures
are
required
for
certain
investments,
including
derivative
financial
instruments
subject
to
Master
Agreements
which
are
eligible
for
offsetting
in
the
Statement
of
Assets
and
Liabilities
and
require
the
fund
to
disclose
both
gross
and
net
information
with
respect
to
such
investments.
For
financial
reporting
purposes,
the
fund
does
not
offset
derivative
assets
and
derivative
liabilities
that
are
subject
to
Master
Agreements
in
the
Statement
of
Assets
and
Liabilities.
At June
30,
2024,
derivative
assets
and
liabilities
(by
type)
on
a
gross
basis
are
as
follows:
The
following
tables
present
derivative
assets
and
liabilities
net
of
amounts
available
for
offsetting
under
Master
Agreements
and
net
of
related
collateral
received
or
pledged,
if
any,
as
of June
30,
2024:
Derivative
Assets
($)
Derivative
Liabilities
($)
Interest
rate
risk
23,861
(a)
Interest
rate
risk
(21,411)
(a)
Foreign
exchange
risk
5,088
(b)
Foreign
exchange
risk
(87)
(b)
Gross
fair
value
of
derivative
contracts
28,949
(21,498)
(a)
Includes
cumulative
appreciation
(depreciation)
on
futures
as
reported
in
the
Statement
of
Investments,
but
only
the
unpaid
variation
margin
is
reported
in
the
Statement
of
Assets
and
Liabilities.
(b)
Unrealized
appreciation
(depreciation)
on
forward
foreign
currency
exchange
contracts.
Amount
of
realized
gain
(loss)
on
derivatives
recognized
in
income
($)
Underlying
Risk
Futures
(a)
Forward
Contracts
(b)
Total
Interest
rate
(8,665)
—
(8,665)
Foreign
exchange
—
9,271
9,271
Total
(8,665)
9,271
606
Net
change
in
unrealized
appreciation
(depreciation)
on
derivatives
recognized
in
income
($)
Underlying
Risk
Futures
(c)
Forward
Contracts
(d)
Total
Interest
rate
(107)
—
(107)
Foreign
exchange
—
5,990
5,990
Total
(107)
5,990
5,883
(a)
Net
realized
gain
(loss)
on
futures.
(b)
Net
realized
gain
(loss)
on
forward
foreign
currency
exchange
contracts.
(c)
Net
change
in
unrealized
appreciation
(depreciation)
on
futures.
(d)
Net
change
in
unrealized
appreciation
(depreciation)
on
forward
foreign
currency
exchange
contracts.
Derivative
Financial
Instruments:
Assets
($)
Liabilities
($)
Futures
23,861
(21,411)
Forward
contracts
5,088
(87)
Total
gross
amount
of
derivative
assets
and
liabilities
in
the
Statement
of
Assets
and
Liabilities
28,949
(21,498)
Derivatives
not
subject
to Master
Agreements
23,861
(21,411)
Total
gross
amount
of
derivative
assets
and
liabilities
subject
to
Master
Agreements
5,088
(87)
Counterparty
Gross
Amount
of
Assets
($)
†
Financial
Instruments
and
Derivatives
Available
for
Offset
($)
Collateral
Received
($)
Net
Amount
of
Assets
($)
Goldman
Sachs
&
Co.
5,088
(87)
–
5,001
Counterparty
Gross
Amount
of
Liabilities($)
†
Financial
Instruments
and
Derivatives
Available
for
Offset
($)
Collateral
Pledged
($)
Net
Amount
of
Liabilities
($)
Goldman
Sachs
&
Co.
(87)
87
–
–
†
Absent
a
default
event
or
early
termination,
OTC
derivative
assets
and
liabilities
are
presented
at
gross
amounts
and
are
not
offset
in
the
Statement
of
Assets
and
Liabilities.
The following
table summarizes
the
monthly
average market
value of
derivatives
outstanding
during
the year
ended
June
30,
2024:
At June
30,
2024,
the
cost
of
investments
for
federal
income
tax
purposes
was
$23,922,008;
accordingly,
accumulated
net
unrealized
depreciation on
investments
for
federal
income
tax
purposes
was
$1,082,947,
consisting
of
gross
appreciation
of
$171,333
and
gross
depreciation
of
$1,254,280.
NOTE
5—Shareholder
Transactions:
The
fund
issues
and
redeems
its
shares
on
a
continuous
basis,
at
NAV,
to
certain
institutional
investors
known
as
“Authorized
Participants”
(typically
market
makers
or
other
broker-dealers)
only
in
a
large
specified
number
of
shares
called
a
Creation
Unit.
Except
when
aggregated
in
Creation
Units,
shares
of
the
fund
are
not
redeemable.
The
value
of
the
fund
is
determined
once
each
business
day.
The
Creation
Unit
size
for the
fund
may
change.
Authorized
Participants
will
be
notified
of
such
change.
Creation
Unit
transactions
may
be
made
in-kind,
for
cash,
or
for
a
combination
of
securities
and
cash.
The
principal
consideration
for
creations
and
redemptions
for
the
fund
is
in-kind,
although
this
may
be
revised
at
any
time
without
notice.
The
Trust
issues
and
sells
shares
of
the
fund
only:
in
Creation
Units
on
a
continuous
basis
through
the
Distributor,
without
a
sales
load,
at
their
NAV
per
share
determined
after
receipt
of
an
order,
on
any
Business
Day,
in
proper
form
pursuant
to
the
terms
of
the
Authorized
Participant
Agreement.
Transactions
in
capital
shares
for
the
fund
are
disclosed
in
detail
in
the
Statement
of
Changes
in
Net
Assets.
The
consideration
for
the
purchase
of
Creation
Units
of the
fund
may
consist
of
the
in-kind
deposit
of
a
designated
portfolio
of
securities
and
a
specified
amount
of
cash.
Investors
purchasing
and
redeeming
Creation
Units
may
pay
a
purchase
transaction
fee
and
a
redemption
transaction
fee
directly
to
the
Trust
and/or
custodian
to
offset
transfer
and
other
transaction
costs
associated
with
the
issuance
and
redemption
of
Creation
Units,
including
Creation
Units
for
cash.
The
Adviser
or
its
affiliates
(the
“Selling
Shareholder”)
may
purchase
Creation
Units
through
a
broker-dealer
to
“seed”
(in
whole
or
in
part)
funds
as
they
are
launched
or
may
purchase shares
from
broker-dealers
or
other
investors
that
have
previously
provided
“seed”
for
funds
when
they
were
launched
or
otherwise
in
secondary
market
transactions.
Because
the
Selling
Shareholder
may
be
deemed
an
affiliate
of
such
funds,
the
fund shares
are
being
registered
to
permit
the
resale
of
these
shares
from
time
to
time
after
purchase.
The
fund
will
not
receive
any
of
the
proceeds
from
resale
by
the
Selling
Shareholders
of
these
fund
shares. An
additional
variable
fee
may
be
charged
for
certain
transactions.
Such
variable
charges,
if
any,
are
included
in
“Transaction
fees”
on
the
Statement
of
Changes
in
Net
Assets.
Seed
Capital:
As
of
June
30,
2024,
MBC
Investments
Corporation,
a
wholly-owned
subsidiary
of
BNY,
held
490,001
shares
of
the
fund.
In-kind
Redemptions:
For
financial
reporting
purposes,
in-kind
redemptions
are
treated
as
sales
of
securities
resulting
in
realized
capital
gains
or
losses
to
the
fund.
Because
such
gains
or
losses
are
not
taxable
to
the
fund
and
are
not
distributed
to
existing
fund
shareholders,
the
gains
or
losses
are
reclassified
from
accumulated
net
realized
gain
(loss)
to
paid-in
capital
at
the
end
of
the
fund’s
tax
year.
These
reclassifications
have
no
effect
on
net
assets
or
net
asset
value
per
share.
During
the
year
ended
June
30,
2024,
the
fund
had
no
in-kind
transactions.
Average
Market
Value
($)
Futures:
Interest
Rate
Futures
Long
2,723,698
Interest
Rate
Futures
Short
2,397,077
Forward
Contracts:
Forward
Contracts
Purchased
in
USD
377,775
Forward
Contracts
Sold
in
USD
375,743
REPORT
OF
INDEPENDENT
REGISTERED
PUBLIC
ACCOUNTING
FIRM
To
the
Shareholders
and
the
Board
of
Trustees
of
BNY
Mellon
Responsible
Horizons
Corporate
Bond
ETF
Opinion
on
the
Financial
Statements
We
have
audited
the
accompanying
statement
of
assets
and
liabilities
of
BNY
Mellon
Responsible
Horizons
Corporate
Bond
ETF
(the
“Fund”)
(one
of
the
funds
constituting
BNY
Mellon
ETF
Trust
(the
“Trust”)),
including
the
statement
of
investments,
as
of
June
30,
2024,
and
the
related
statement
of
operations
for
the
year
then
ended,
the
statements
of
changes
in
net
assets
for
each
of
the
two
years
in
the
period
then
ended,
the
financial
highlights
for
the
two
years
in
the
period
then
ended
and
the
period
from
March
22,
2022
(commencement
of
operations)
through
June
30,
2022
and
the
related
notes
(collectively
referred
to
as
the
“financial
statements”).
In
our
opinion,
the
financial
statements
present
fairly,
in
all
material
respects,
the
financial
position
of
the
Fund
(one
of
the
funds
constituting
BNY
Mellon
ETF
Trust)
at
June
30,
2024,
the
results
of
its
operations
for
the
year
then
ended,
the
changes
in
its
net
assets
for
each
of
two
years
in
the
period
then
ended
and
its
financial
highlights
for
each
of
the
two
years
in
the
period
then
ended
and
the
period
from
March
22,
2022
(commencement
of
operations)
through
June
30,
2022,
in
conformity
with
U.S.
generally
accepted
accounting
principles.
Basis
for
Opinion
These
financial
statements
are
the
responsibility
of
the
Trust’s
management.
Our
responsibility
is
to
express
an
opinion
on
the
Fund’s
financial
statements
based
on
our
audits.
We
are
a
public
accounting
firm
registered
with
the
Public
Company
Accounting
Oversight
Board
(United
States)
(“PCAOB”)
and
are
required
to
be
independent
with
respect
to
the
Trust
in
accordance
with
the
U.S.
federal
securities
laws
and
the
applicable
rules
and
regulations
of
the
Securities
and
Exchange
Commission
and
the
PCAOB.
We
conducted
our
audits
in
accordance
with
the
standards
of
the
PCAOB.
Those
standards
require
that
we
plan
and
perform
the
audit
to
obtain
reasonable
assurance
about
whether
the
financial
statements
are
free
of
material
misstatement,
whether
due
to
error
or
fraud.
The
Trust
is
not
required
to
have,
nor
were
we
engaged
to
perform,
an
audit
of
the
Trust’s
internal
control
over
financial
reporting.
As
part
of
our
audits,
we
are
required
to
obtain
an
understanding
of
internal
control
over
financial
reporting
but
not
for
the
purpose
of
expressing
an
opinion
on
the
effectiveness
of
the
Trust’s
internal
control
over
financial
reporting.
Accordingly,
we
express
no
such
opinion.
Our
audits
included
performing
procedures
to
assess
the
risks
of
material
misstatement
of
the
financial
statements,
whether
due
to
error
or
fraud,
and
performing
procedures
that
respond
to
those
risks.
Such
procedures
included
examining,
on
a
test
basis,
evidence
regarding
the
amounts
and
disclosures
in
the
financial
statements.
Our
procedures
included
confirmation
of
securities
owned
as
of
June
30,
2024,
by
correspondence
with
the
custodian,
brokers
and
others;
when
replies
were
not
received
from
brokers
and
others,
we
performed
other
auditing
procedures.
Our
audits
also
included
evaluating
the
accounting
principles
used
and
significant
estimates
made
by
management,
as
well
as
evaluating
the
overall
presentation
of
the
financial
statements.
We
believe
that
our
audits
provide
a
reasonable
basis
for
our
opinion.
We
have
served
as
the
auditor
of
one
or
more
investment
companies
in
the
BNY
Mellon
Family
of
Funds
since
at
least
1957,
but
we
are
unable
to
determine
the
specific
year.
New
York,
New
York
August
19,
2024
IMPORTANT
TAX
INFORMATION
(Unaudited)
Form
1099-DIV,
Form
1042-S
and
other
year–end
tax
information
provide
shareholders
with
actual
calendar
year
amounts
that
should
be
included
in
their
tax
returns.
Shareholders
should
consult
their
tax
advisers.
The
following
distribution
information
is
being
provided
as
required
by
the
Internal
Revenue
Code
or
to
meet
a
specific
state’s
requirement.
The
fund
designates
the
following
amounts
or,
if
subsequently
determined
to
be
different,
the
maximum
amount
allowable
for
its
fiscal
year
ended June
30,
2024:
For
federal
tax
purposes
the
fund
hereby
reports
63.41%
of
ordinary
income
dividends
paid
during
the
fiscal
year
ended
June
30,
2024 as
qualifying
interest
related
dividends.
BOARD
MEMBERS
INFORMATION
(Unaudited)
INDEPENDENT
BOARD
MEMBERS
J.
Charles
Cardona
(68)
Chairman
of
the
Board
(2020)
Principal
Occupation
During
Past
5
Years:
•
BNY Mellon
Family of Funds,
Interested
Director
(2014
–
2018),
Independent Director
(2019 – Present)
•
BNY
Mellon
Liquidity
Funds,
Director
(2004
–
Present)
and
Chairman
(2019
–
2021)
.
No.
of
Portfolios
for
which
Board
Member
Serves:
35,
including
22
managed
by
an
affiliate
of
the
Adviser
Kristen
M.
Dickey
(64)
Board
Member
(2020)
Principal
Occupation
During
Past
5
Years:
Independent
board
director
of
Marstone,
Inc.,
a
financial
technology
company
(since
2018);
Lead
non-executive
director
for
Aperture
Investors,
LLC,
an
investment
management
firm
(since
2018);
Managing
Director—Global
Head
of
Index
Strategy
at
BlackRock,
Inc.
(until
2017)
No.
of
Portfolios
for
which
Board
Member
Serves:
13
F.
Jack
Liebau,
Jr.
(60)
Board
Member
(2020)
Principal
Occupation
During
Past
5
Years:
Managing
Director
at
Beach
Investment
Counsel,
a
financial
advisory
firm
(since
2020)
Corporate
director
(since
2015)
Other
Public
Company
Board
Memberships
During
Past
5
Years:
Myers
Industries,
an
industrial
company,
Director
(2015
–
Present);
Chairman
of
Board
(2016
–
Present)
STRATTEC
Security
Corp.,
an
automotive
power
and
security
solutions
company,
Director
(2023
–
Present);
Chairman
of
Board
(2024
–
Present)
No.
of
Portfolios
for
which
Board
Member
Serves:
13
Jill
I.
Mavro
(52)
Board
Member
(2020)
Principal
Occupation
During
Past
5
Years:
Managing
director
at
Ecoban,
LLC,
a
financial
technology
consulting
company
(since
2020)
Founder
and
Principal
of
Spoondrift
Advisory,
LLC
(since
2018);
Senior
Managing
Director,
Head
of
Strategic
Relationships
and
Member
of
SPDR
Executive
Committee
at
State
Street
Global
Advisors
(until
2018)
No.
of
Portfolios
for
which
Board
Member
Serves:
13
Kevin
W.
Quinn
(65)
Board
Member
(2020)
Principal
Occupation
During
Past
5
Years:
Partner
at
PricewaterhouseCoopers,
LLC
(until
2019)
No.
of
Portfolios
for
which
Board
Member
Serves:
13
Stacy
L.
Schaus
(64)
Board
Member
(2020)
Principal
Occupation
During
Past
5
Years:
Chief
Executive
Officer
of
the
Schaus
Group
LLC,
a
consulting
firm
(since
2019);
Advisory
board
member
of
A&P
Capital,
a
consulting
firm
(from
2019-2021);
Executive
Vice
President—Defined
Contribution
Practice
Founder
at
PIMCO
Investment
Management
(until
2018).
No.
of
Portfolios
for
which
Board
Member
Serves:
13
OFFICERS
OF
THE
TRUST
(Unaudited)
DAVID
DIPETRILLO,
President
since
February
2020.
Vice
President
and
Director
of
BNYM
Investment
Adviser
since
February
2021;
Head
of
North
America
Distribution,
BNY
Investments
since
February
2023;
and
Head
of
North
America
Product,
BNY
Investments
from
January
2018
to
February
2023.
He
is
an
officer
of
51
investment
companies
(comprised
of
96
portfolios)
managed
by
BNYM
Investment
Adviser
or
an
affiliate
of
BNYM
Investment
Adviser. He
is
46
years
old
and
has
been
an
employee
of
BNY
since
2005.
PETER
M.
SULLIVAN,
Chief
Legal
Officer
since
July
2021,
Vice
President
and
Assistant
Secretary
since
February
2020.
Chief
Legal
Officer
of
BNYM
Investment
Adviser
and
Associate
General
Counsel
of
BNY
since
July
2021;
Senior
Managing
Counsel
of
BNY
from
December
2020
to
July
2021;
and
Managing
Counsel
of
BNY
from
March
2009
to
December
2020.
He
is
an
officer
of
52
investment
companies
(comprised
of
114
portfolios)
managed
by
the
Adviser
or
an
affiliate
of
the
Adviser. He
is
56
years
old
and
has
been
an
employee
of
BNY
since
April
2004.
JAMES
WINDELS,
Treasurer
since
February
2020.
Director
of
BNYM
Investment
Adviser
since
February
2023;
Vice
President
of
BNYM
Investment
Adviser
since
September
2020;
and
Director
–
BNY
Mellon
Fund
Administration.
He
is
an
officer
of
52
investment
companies
(comprised
of
114
portfolios)
managed
by
the
Adviser
or
an
affiliate
of
the
Adviser. He
is
65
years
old
and
has
been
an
employee
of
BNYM
Investment
Adviser
since
April
1985.
SARAH
S.
KELLEHER,
Vice
President
and
Secretary
since
February
2020.
Vice
President
of
BNY
Mellon
ETF
Investment
Adviser,
LLC
since
February
2020;
Senior
Managing
Counsel
of
BNY
since
September
2021;
and
Managing
Counsel
of
BNY
from
December
2017
to
September
2021. She
is
an
officer
of
52
investment
companies
(comprised
of
114
portfolios)
managed
by
the
Adviser
or
an
affiliate
of
the
Adviser. She
is
48
years
old
and
has
been
an
employee
of
BNY
since
March
2013.
DEIRDRE
CUNNANE,
Vice
President
and
Assistant
Secretary
since
February
2020.
Managing
Counsel
of
BNY
since
December
2021;
and
Counsel
of
BNY
from
August
2018
to
December
2021;
She
is
an
officer
of
52
investment
companies
(comprised
of
114
portfolios)
managed
by
the
Adviser
or
an
affiliate
of
the
Adviser.
She
is
34
years
old
and
has
been
an
employee
of
BNY
since
August
2013.
LISA
M.
KING,
Vice
President
and
Assistant
Secretary
since
May
2024.
Counsel
of
BNY
since
June
2023;
and
Regulatory
Administration
Group
Manager
at
BNY
Mellon
Asset
Servicing
from
February
2016
to
June
2023.
She
is
an
officer
of
52
investment
companies
(comprised
of
114
portfolios)
managed
by
BNYM
Investment
Adviser
or
an
affiliate
of
BNYM
Investment
Adviser.
She
is
56
years
old
and
has
been
an
employee
of
BNY
since
February
2016.
JEFF
PRUSNOFSKY,
Vice
President
and
Assistant
Secretary
since
February
2020.
Senior
Managing
Counsel
of
BNY.
He
is
an
officer
of
52
investment
companies
(comprised
of
114
portfolios)
managed
by
the
Adviser
or
an
affiliate
of
the
Adviser.
He
is
59
years
old
and
has
been
an
employee
of
BNYM
Investment
Adviser
since
October
1990.
AMANDA
QUINN,
Vice
President
and
Assistant
Secretary
since
February
2020.
Managing
Counsel
of
BNY
since
March
2024;
Counsel
of
BNY
from
June
2019
to
February
2024;
and
Regulatory
Administration
Manager
at
BNY
Investments
Services from
September
2018
to
May
2019.
She
is
an
officer
of
52
investment
companies
(comprised
of
114
portfolios)
managed
by
the
Adviser
or
an
affiliate
of
the
Adviser.
She
is
39
years
old
and
has
been
an
employee
of
BNY
since
June
2012.
JOANNE
SKERRETT,
Vice
President
and
Assistant
Secretary
since
March
2023.
Managing
Counsel
of
BNY
since
June
2022;
and
Senior
Counsel
with
the
Mutual
Fund
Directors
Forum,
a
leading
funds
industry
organization,
from
2016
to
June
2022. She
is
an
officer
of
52
investment
companies
(comprised
of
114
portfolios)
managed
by
the
Adviser
or
an
affiliate
of
the
Adviser.
She
is
52
years
old
and
has
been
an
employee
of
BNYM
Investment
Adviser
since
June
2022.
DANIEL
GOLDSTEIN,
Vice
President
since
March
2022
Head
of
Product
Development
of
North
America
Distribution,
BNY
Investments
since
January
2018;
Executive
Vice
President
of
North
America
Product,
BNY
Investments
since
April
2023;
and
Senior
Vice
President,
Development
&
Oversight
of
North
America
Product,
BNY
Investments
from
2010
to
March
2023.
He
is
an
officer
of
51
investment
companies
(comprised
of
96
portfolios)
managed
by
the
Adviser
or
an
affiliate
of
the
Adviser.
He
is
55
years
old
and
has
been
an
employee
of
the
Distributor
since
1991.
JOSEPH
MARTELLA,
Vice
President
since
March
2022
Vice
President
of
BNYM
Investment
Adviser
since
December
2022;
Head
of
Product
Management
of
North
America
Distribution,
BNY
Investments
since
January
2018;
Executive
Vice
President
of
North
America
Product,
BNY
Investments
since
April
2023,
and
Senior
Vice
President
of
North
America
Product,
BNY
Investments
from
2010
to
March
2023.
He
is
an
officer
of
51
investment
companies
(comprised
of
96
portfolios)
managed
by
the
Adviser
or
an
affiliate
of
the
Adviser.
He
is
47
years
old
and
has
been
an
employee
of
the
Distributor
since
1999.
ROBERTO
G.
MAZZEO,
Assistant
Treasurer
since
May
2024.
Financial
Reporting
Manager
–
BNY
Mellon
Fund
Administration.
He
is
an
officer
of
52
investment
companies
(comprised
of
114
portfolios)
managed
by
BNYM
Investment
Adviser
or
an
affiliate
of
BNYM
Investment
Adviser. He
is
43
years
old
and
has
been
an
employee
of
BNYM
Investment
Adviser
since
October
2006.
GAVIN
C.
REILLY,
Assistant
Treasurer
since
February
2020.
Tax
Manager-BNY
Mellon
Fund
Administration.
He
is
an
officer
of
52
investment
companies
(comprised
of
114
portfolios)
managed
by
the
Adviser
or
an
affiliate
of
the
Adviser.
He
is
55
years
old
and
has
been
an
employee
of
BNYM
Investment
Adviser
since
April
1991.
ROBERT
SALVIOLO,
Assistant
Treasurer
since
February
2020.
Senior
Accounting
Manager
–
BNY
Mellon
Fund
Administration.
He
is
an
officer
of
52
investment
companies
(comprised
of
114
portfolios)
managed
by
the
Adviser
or
an
affiliate
of
the
Adviser. He
is
57
years
old
and
has
been
an
employee
of
BNYM
Investment
Adviser
since
June
1989.
OFFICERS
OF
THE
TRUST
(Unaudited)
(continued)
ROBERT
SVAGNA,
Assistant
Treasurer
since
February
2020.
Senior
Accounting
Manager
–
BNY
Mellon
Fund
Administration.
He
is
an
officer
of
52
investment
companies
(comprised
of
114
portfolios)
managed
by
the
Adviser
or
an
affiliate
of
the
Adviser. He
is
57
years
old
and
has
been
an
employee
of
BNYM
Investment
Adviser
since
November
1990.
JOHN
SQUILLACE,
Chief
Compliance
Officer
since
May
2024.
Chief
Compliance
Officer
since
May
2024
of
BNY
Mellon
ETF
Investment
Adviser,
LLC
and
BNY
Mellon
ETF
Trust;
Chief
Compliance
Officer
of
BNY
Mellon
Securities
Corporation’s
investment
advisory
business
since
January
2016;
and
Chief
Compliance
Officer
of
BNYMIA
since
July
2012.
He
is
an
officer
of
1
investment
company
(comprised
of
13
portfolios)
managed
by
BNY
Mellon
ETF
Investment
Adviser.
He
is
65
years
old
and
has
been
an
employee
of
BNY
Mellon
since
December
2010.
CARIDAD
M.
CAROSELLA,
Anti-Money
Laundering
Compliance
Officer
since
February
2020.
Anti-Money
Laundering
Compliance
Officer
of
the
BNY
Mellon
Family
of
Funds
and
BNY
Mellon
Funds
Trust.
She
is
an
officer
of
45
investment
companies
(comprised
of
107
portfolios)
managed
by
the
Adviser
or
an
affiliate
of
the
Adviser.
She
is
55
years
old
and
has
been
an
employee
of
the
Distributor
since
1997.
Item
8.
Changes
in
and
Disagreements
with
Accountants
for
Open-End
Management
Investment
Companies
(Unaudited)
Item
9.
Proxy
Disclosures
for
Open-End
Management
Investment
Companies
(Unaudited)
Item
10.
Remuneration
Paid
to
Directors,
Officers,
and
Others
of
Open-End
Investment
Companies
(Unaudited)
Each
member
of
the
Board
serves
as
a
Board
member
of
each
fund
within
the
Registrant.
The
Board
members
are
not
compensated
directly
by
the
Registrant.
The
Board
members
are
paid
by
the
Adviser
from
the
unitary
management
fees
paid
to
the
Adviser
by
the
funds
within
the
Registrant.
Item
11.
Statement
Regarding
Basis
for
Approval
of
Investment
Advisory
Contracts
(Unaudited)
At
a
meeting
held
on
February
23,
2024
(the
“February
Meeting”)
and
a
meeting
held
on
May
7,
2024
(the
“May
Meeting,”
and
together
with
the
February
Meeting,
the
“Meetings”),
the
Board
of
Trustees
of
the
Trust
(the
“Board”),
all
the
members
of
which
are
not
“interested
persons”
of
the
Trust
as
defined
in
the
Investment
Company
Act
of
1940,
as
amended,
evaluated
(i)
proposals
to
continue
the
Management
Agreement
between
the
Trust
and
BNY
Mellon
ETF
Investment
Adviser,
LLC
(the
“Adviser”)
with
respect
to
the
BNY
Mellon
Responsible
Horizons
Corporate
Bond
ETF
(the
“fund”);
and
(ii)
proposals
to
continue
the
Sub-Investment
Advisory
Agreement
between
the
Adviser
and
Insight
North
America
LLC
(the
“Sub-Adviser”),
an
affiliate
of
the
Adviser,
on
behalf
of
the
fund
(each
of
the
Management
Agreement
and
the
Sub-Investment
Advisory
Agreement,
an
“Agreement,”
and
together,
the
“Agreements”).
At
each
Meeting,
the
Trustees
also
met
separately
to
consider
the
Agreements
and
were
advised
by
legal
counsel
throughout
the
process.
In
connection
with
each
Meeting,
to
evaluate
the
Agreements,
the
Board
requested,
and
the
Adviser
and
the
Sub-Adviser
provided,
such
materials
as
the
Board,
with
the
advice
of
counsel,
deemed
reasonably
necessary.
In
addition,
the
Board
considered
information
it
reviewed
at
other
Board
and
Board
committee
meetings.
In
deciding
whether
to
approve
the
Agreements,
the
Board
considered
various
factors,
including
the
(i)
nature,
extent
and
quality
of
services
provided
by
the
Adviser
and
Sub-Adviser
under
each
respective
Agreement,
(ii)
investment
performance
of
the
fund,
(iii)
profits
realized
by
the
Adviser
and
its
affiliates
from
its
relationship
with
the
fund,
(iv)
fees
charged
to
comparable
funds,
(v)
other
benefits
to
the
Adviser,
Sub-Adviser
and/or
their
affiliates,
and
(vi)
extent
to
which
economies
of
scale
would
be
shared
as
the
fund
grows.
The
Board
considered
the
Agreements
for
the
fund
and
the
engagement
of
the
Adviser
and
the
Sub-Adviser
separately.
The
Board
reviewed
reports
prepared
by
Broadridge
Financial
Solutions,
Inc.
(“Broadridge”),
an
independent
provider
of
investment
company
data,
which
included
information
(i)
comparing
the
fund’s
performance
with
the
performance
of
a
group
of
other
actively-
managed
corporate
bond
exchange
traded
funds
(“ETFs”)
(the
“Performance
Group”)
and
with
a
broader
group
of
retail
and
institutional
corporate
bond
funds
and
ETFs
(the
“Performance
Universe”)
for
the
one-year
period
ended
December
31,
2023;
and
(ii)
comparing
the
fund’s
contractual
management
fees
and
total
expenses
with
a
group
of
other
actively-managed
corporate
bond
ETFs
(the
“Expense
Group”)
and,
with
respect
to
total
expenses,
with
a
broader
group
of
actively-managed
corporate
bond
ETFs
(the
“Expense
Universe”),
the
information
for
which
was
derived
in
part
from
fund
financial
statements
available
to
Broadridge
as
of
the
date
of
its
analysis.
In
addition,
at
the
May
Meeting,
the
Board
also
reviewed
reports
that
included
information
comparing
the
fund’s
performance
with
the
performance
of
its
benchmark
and
Performance
Universe
for
the
periods
ended
March
31,
2024.
Nature,
Extent
and
Quality
of
Services
The
Board
considered
the
nature,
extent
and
quality
of
services
provided
by
the
Adviser
and
the
Sub-Adviser.
In
doing
so,
the
Trustees
relied
on
their
prior
experience
in
overseeing
the
management
of
the
fund
and
the
materials
provided
prior
to
and
at
each
Meeting.
The
Board
reviewed
the
Agreements
and
the
Adviser’s
and
the
Sub-Adviser’s
responsibilities
for
managing
investment
operations
of
the
fund
in
accordance
with
the
fund’s
investment
objective
and
policies,
and
applicable
legal
and
regulatory
requirements.
The
Board
appreciated
the
nature
of
the
fund
as
an
exchange-traded
fund
and
considered
the
background
and
experience
of
the
Adviser’s
and
the
Sub-Adviser’s
senior
management,
including
those
individuals
responsible
for
portfolio
management
and
regulatory
compliance
of
the
funds.
The
Board
also
considered
the
portfolio
management
resources,
structures
and
practices
of
the
Adviser
and
the
Sub-Adviser,
including
those
associated
with
monitoring
and
ensuring
the
fund’s
compliance
with
its
investment
objective
and
policies
and
with
applicable
laws
and
regulations.
The
Board
further
considered
information
about
the
Sub-Adviser’s
best
execution
procedures
as
well
as
the
Adviser’s
and
the
Sub-Adviser’s
overall
investment
management
business.
The
Board
looked
at
the
Adviser’s
general
knowledge
of
the
investment
management
business
and
that
of
its
affiliates,
including
the
Sub-Adviser.
With
respect
to
the
Sub-Adviser,
the
Board
also
considered
the
Adviser’s
favorable
assessment
of
the
nature
and
quality
of
the
services
provided
by
the
Sub-Adviser.
Investment
Performance
The
Board
reviewed
the
results
of
the
fund’s
performance
comparisons
and
considered
that
the
fund’s
total
return
performance
was
above
the
Performance
Group
and
Performance
Universe
medians
for
the
one-year
period
ended
December
31,
2023.
At
the
May
Meeting,
the
Board
also
considered
that
the
fund’s
total
return
performance
was
above
the
benchmark
and
the
Performance
Universe
average
for
the
one-year
period
and
since
inception
(March
21,
2022)
period
ended
March
31,
2024.
Representatives
of
the
Adviser
indicated
that
the
usefulness
of
performance
comparisons
may
be
affected
by
a
number
of
factors,
including
different
investment
limitations
and
policies
that
may
be
applicable
to
the
fund
and
comparison
funds
and
the
end
date
selected.
Profits
Realized
by
the
Adviser
The
Board
considered
the
profitability
of
the
advisory
arrangement
with
the
fund
to
the
Adviser
and
its
affiliates.
The
Board
had
the
opportunity
to
discuss
with
representatives
of
the
Adviser
the
process
and
methodology
used
to
calculate
profitability.
Fees
Charged
to
Comparable
Funds
The
Board
evaluated
the
fund’s
unitary
fee
through
review
of
comparative
information
with
respect
to
fees
paid
by
similar
funds
-
i.e.,
other
actively-managed
corporate
bond
ETFs.
The
Board
explored
with
management
the
differences
between
the
fund’s
fee
and
fees
paid
by
similar
funds.
The
Board
noted
the
fund’s
contractual
management
fee
was
the
same
as
the
Expense
Group
median
and
the
fund’s
total
expenses
were
the
same
as
the
Expense
Group
median
and
the
Expense
Universe
median
total
expenses.
The
Board
considered
the
fee
paid
to
the
Sub-Adviser
in
relation
to
the
fee
paid
to
the
Adviser
by
the
fund
and
the
respective
services
provided
by
the
Sub-Adviser
and
the
Adviser.
The
Board
also
took
into
consideration
that
the
Sub-Adviser’s
fee
is
paid
by
the
Adviser
and
not
the
fund.
Other
Benefits
The
Board
also
considered
whether
the
Adviser,
the
Sub-Adviser
or
their
affiliates
benefited
in
other
ways
from
their
relationship
with
the
funds,
noting
that
neither
the
Adviser
nor
the
Sub-Adviser
maintains
soft-dollar
arrangements
in
connection
with
the
fund’s
brokerage
transactions.
The
Board
noted
The
Bank
of
New
York
Mellon
Corporation
may
derive
certain
benefits
from
an
incremental
growth
in
its
businesses
that
may
possibly
result
from
the
availability
of
the
fund
to
clients.
Economies
of
Scale
The
Board
reviewed
information
regarding
economies
of
scale
or
other
efficiencies
that
may
result
as
the
fund’s
assets
grow
in
size.
The
Board
noted
that
the
advisory
fee
rate
for
the
fund
did
not
provide
for
breakpoints
as
assets
of
the
fund
increases.
The
Adviser
asserted
that
one
of
the
benefits
of
the
unitary
fee
was
to
provide
an
unvarying
expense
structure,
which
could
be
lost
or
diluted
with
the
addition
of
breakpoints.
The
Board
noted
that
it
intends
to
continue
to
monitor
fees
as
the
fund
grows
in
size
and
assess
whether
fee
breakpoints
may
be
warranted.
Conclusion
After
weighing
the
foregoing
factors,
none
of
which
was
dispositive
in
itself
and
may
have
been
weighed
differently
by
each
Trustee,
the
Board
approved
the
continuation
of
the
Agreements
for
the
fund
at
each
Meeting.
In
approving
the
continuance
of
the
Agreements,
the
Board
found
that
the
terms
of
the
Agreements
are
fair
and
reasonable
and
that
the
continuance
of
the
Agreements
is
in
the
best
interests
of
the
fund
and
its
shareholders.
©
2024
BNY
Mellon
Securities
Corporation
Item 12. Disclosure of Proxy Voting Policies and Procedures for Closed-End Management Investment Companies.
Not applicable.
Item 13. Portfolio Managers of Closed-End Management Investment Companies.
Not applicable.
Item 14. Purchases of Equity Securities by Closed-End Management Investment Company and Affiliated Purchasers.
Not applicable.
Item 15. Submission of Matters to a Vote of Security Holders.
There have been no material changes to the procedures by which the shareholders may recommend nominees to the Registrant’s Board, where those changes were implemented after the Registrant last provided disclosure in response to the requirements of Item 407(c)(2)(iv) of Regulation S-K (17 CFR 229.407) (as required by Item 22(b)(15) of Schedule 14A (17 CFR 240.14a-101)), or this Item.
Item 16. Controls and Procedures.
(a) The Registrant’s principal executive and principal financial officers, or persons performing similar functions, have concluded that the Registrant’s disclosure controls and procedures (as defined in Rule 30a-3(c) under the Investment Company Act of 1940, as amended (the “1940 Act”) (17 CFR 270.30a-3(c))) are effective, as of a date within 90 days of the filing date of the report that includes the disclosure required by this paragraph, based on their evaluation of these controls and procedures required by Rule 30a-3(b) under the 1940 Act (17 CFR 270.30a-3(b)) and Rules 13a-15(b) or 15d-15(b) under the Securities Exchange Act of 1934, as amended (17 CFR 240.13a-15(b) or 240.15d-15(b)).
(b) There were no changes in the Registrant’s internal control over financial reporting (as defined in Rule 30a-3(d) under the 1940 Act (17 CFR 270.30a-3(d))) that occurred during the period covered by this report that has materially affected, or is reasonably likely to materially affect, the Registrant’s internal control over financial reporting.
Item 17. Disclosure of Securities Lending Activities for Closed-End Management Investment Companies.
Not applicable.
Item 18. Recovery of Erroneously Awarded Compensation.
Not Applicable.
Item 19. Exhibits.
(a)(2)(1) Not applicable.
(a)(2)(2) Not applicable.
SIGNATURES
Pursuant to the requirements of the Securities Exchange Act of 1934 and the Investment Company Act of 1940, the registrant has duly caused this report to be signed on its behalf by the undersigned, thereunto duly authorized.
(Registrant) BNY Mellon ETF Trust
By (Signature and Title) * /s/ David J. DiPetrillo
David J. DiPetrillo, President
(Principal Executive Officer)
Date 08/26/2024
Pursuant to the requirements of the Securities Exchange Act of 1934 and the Investment Company Act of 1940, this report has been signed below by the following persons on behalf of the registrant and in the capacities and on the dates indicated.
By (Signature and Title) * /s/ David J. DiPetrillo
David J. DiPetrillo, President
(Principal Executive Officer)
Date 08/26/2024
By (Signature and Title) * /s/ James Windels
James Windels, Treasurer
(Principal Financial and Accounting Officer)
Date 08/26/2024
* Print the name and title of each signing officer under his or her signature.