SECURITIES AND EXCHANGE COMMISSION
Washington, D.C. 20549
(Exact name of registrant as specified in charter)
(Address of principal executive offices) (Zip code)
BNY Mellon Ultra Short Income ETF
Annual Shareholder Report
June 30, 2024
Ticker - BKUI (NYSE Arca, Inc.)
This annual shareholder report contains important information about BNY Mellon Ultra Short Income ETF (the “Fund”) for the period of July 1, 2023 to June 30, 2024.You can find additional information about the Fund at im.bnymellon.com/etfliterature. You can also request this information by calling us at 1-833-383-2696 or calling your financial adviser.
What were the Fund's costs for the last year?
(based on a hypothetical $10,000 investment)
| Fund | Costs of a $10,000 investment | Costs paid as a percentage of a $10,000 investment |
|---|---|---|
| BNY Mellon Ultra Short Income ETF | $12 | 0.12% |
How did the Fund perform last year?
For the 12 month period ended June 30, 2024, the Fund’s shares returned 5.76% on a net asset value basis and 5.77% on a market price basis.
In comparison, ICE BofA 3-Month U.S. Treasury Bill Index (the “Index”) returned 5.40% for the same period.
What affected the Fund's performance?
U.S. Treasury yields fell in the second half of 2023, then rose by a similar amount in 2024, with bonds maturing in two-to-three years ending the reporting period little changed.
The Fund’s performance relative to the Index benefited from significant exposure to credit assets as credit spreads continued to move tighter over the 12-month period.
The Fund’s exposure to commercial paper during the first half of 2024 provided a yield pick-up versus shorter U.S. government securities.
In the first half of 2024, the Fund’s positions in fixed-rate securities detracted from relative performance as yields rose across the curve on expectations of higher-for-longer interest rates.
Not FDIC-Insured. Not Bank-Guaranteed. May Lose Value.

How did the fund perform since its inception?
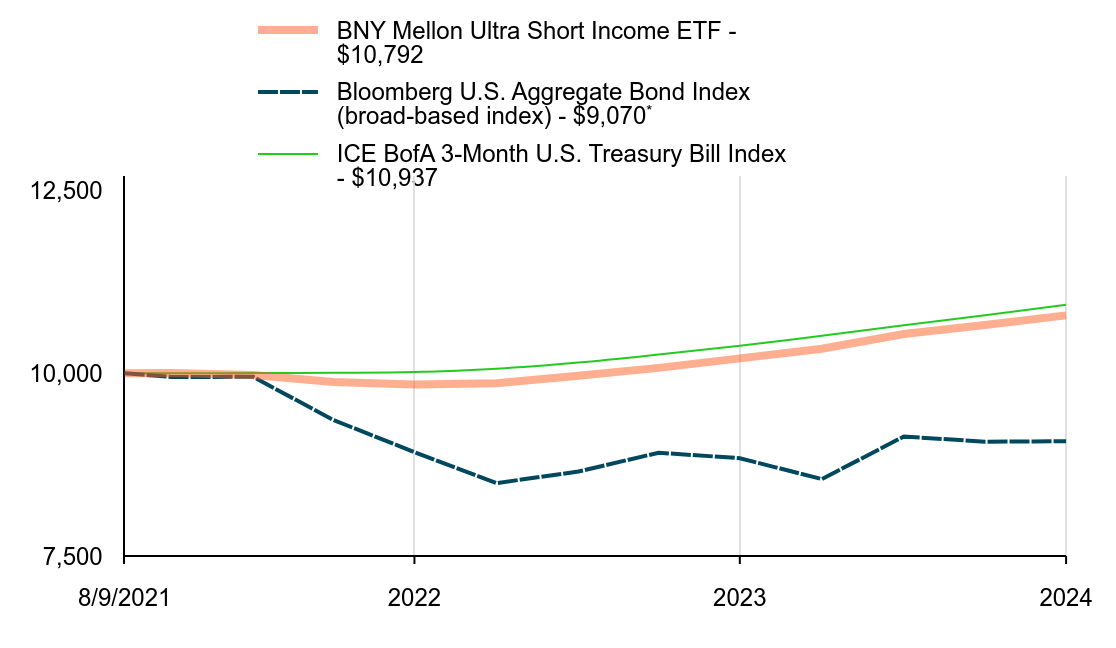
The Fund's past performance is not a good predictor of the Fund's future performance.The graph and table do not reflect the deduction of taxes that a shareholder would pay on fund distributions or redemption of fund shares.
CUMULATIVE PERFORMANCE FROM AUGUST 9, 2021 THROUGH JUNE 30, 2024
INITIAL INVESTMENT OF $10,000

| BNY Mellon Ultra Short Income ETF - $10,792 | Bloomberg U.S. Aggregate Bond Index (broad-based index) - $9,070Footnote Reference* | ICE BofA 3-Month U.S. Treasury Bill Index - $10,937 | |
|---|---|---|---|
| 8/9/2021 | 10,000 | 10,000 | 10,000 |
| 9/30/2021 | 10,004 | 9,950 | 10,001 |
| 12/31/2021 | 9,976 | 9,951 | 10,002 |
| 3/31/2022 | 9,880 | 9,361 | 10,006 |
| 6/30/2022 | 9,846 | 8,921 | 10,016 |
| 9/30/2022 | 9,863 | 8,497 | 10,062 |
| 12/31/2022 | 9,966 | 8,656 | 10,147 |
| 3/31/2023 | 10,074 | 8,913 | 10,256 |
| 6/30/2023 | 10,204 | 8,838 | 10,376 |
| 9/30/2023 | 10,336 | 8,552 | 10,512 |
| 12/31/2023 | 10,538 | 9,135 | 10,656 |
| 3/31/2024 | 10,660 | 9,064 | 10,794 |
| 6/30/2024 | 10,792 | 9,070 | 10,937 |
Years Ended 6/30
The above graph compares a hypothetical $10,000 investment in the Fund’s shares to a hypothetical investment of $10,000 made in each index on August 9, 2021, the Fund’s inception. The performance shown takes into account applicable fees and expenses of the Fund, including management fees and other expenses. The Fund’s performance also assumes the reinvestment of dividends and capital gains. Unlike the Fund, an index is not subject to fees and other expenses. Investors cannot invest directly in any index.
AVERAGE ANNUAL TOTAL RETURNS (AS OF 6/30/24)
| Fund | 1 YR | Since Inception (August 9, 2021) |
|---|---|---|
| BNY Mellon Ultra Short Income ETF - NAV Return | 5.76% | 2.68% |
| BNY Mellon Ultra Short Income ETF - Market Price Return | 5.77% | 2.67% |
Bloomberg U.S. Aggregate Bond Index (broad-based index)Footnote Reference* | 2.63% | - 3.32% |
| ICE BofA 3-Month U.S. Treasury Bill Index | 5.40% | 3.15% |
| Footnote | Description |
Footnote* | In accordance with regulatory changes requiring the Fund’s primary benchmark to represent the overall applicable market, the Fund’s primary prospectus benchmark changed to the indicated benchmark effective as of June 30, 2024. |
The performance data quoted represent past performance, which is no guarantee of future results. For more current performance information, visit im.bnymellon.com/etfliterature.
KEY FUND STATISTICS (AS OF 6/30/24)
| Fund size (Millions) | Number of Holdings | Total Advisory Fee Paid During Period ($) | Annual Portfolio Turnover |
|---|---|---|---|
| $74 | 113 | 63,419 | 42.44% |
Not FDIC-Insured. Not Bank-Guaranteed. May Lose Value.

Portfolio Holdings (as of 6/30/24)
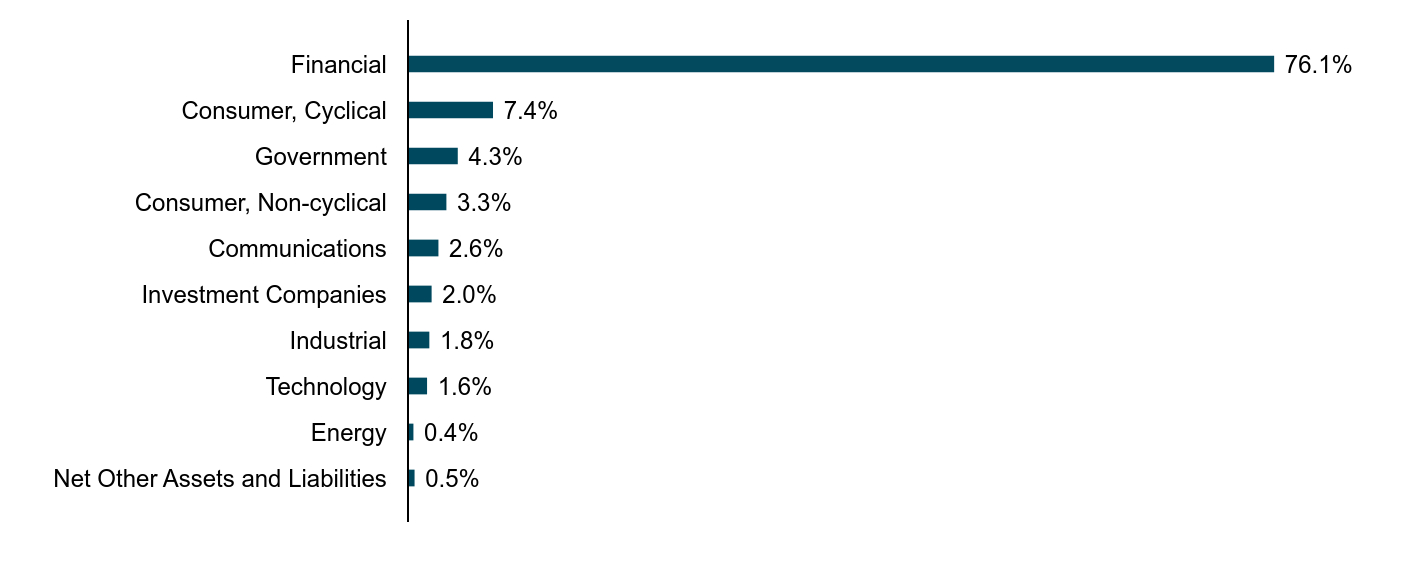
Sector Allocation
(Based on Net Assets)

| Value | Value |
|---|---|
| Net Other Assets and Liabilities | 0.5% |
| Energy | 0.4% |
| Technology | 1.6% |
| Industrial | 1.8% |
| Investment Companies | 2.0% |
| Communications | 2.6% |
| Consumer, Non-cyclical | 3.3% |
| Government | 4.3% |
| Consumer, Cyclical | 7.4% |
| Financial | 76.1% |
Allocation of Holdings
(Based on Net Assets)

| Value | Value |
|---|---|
| Net Other Assets and Liabilities | 0.5% |
| Asset-Backed Securities | 0.1% |
| Investment Companies | 2.0% |
| U.S. Treasury Government Securities | 4.3% |
| Corporate Bonds | 43.3% |
| Commercial Paper | 49.8% |
For additional information about the Fund, including its prospectus, financial information, portfolio holdings and proxy voting information, please visit im.bnymellon.com/etfliterature.
Not FDIC-Insured. Not Bank-Guaranteed. May Lose Value.

© 2024 BNY Mellon Securities Corporation,
240 Greenwich Street, 9th Floor, New York, NY 10281
Code-4862AR0624

BNY Mellon Responsible Horizons Corporate Bond ETF
Annual Shareholder Report
June 30, 2024
Ticker - RHCB (NYSE Arca, Inc.)
This annual shareholder report contains important information about BNY Mellon Responsible Horizons Corporate Bond ETF (the “Fund”) for the period of July 1, 2023 to June 30, 2024.You can find additional information about the Fund at im.bnymellon.com/etfliterature. You can also request this information by calling us at 1-833-383-2696 or calling your financial adviser.
This report describes changes to the Fund that occurred during the reporting period.
What were the Fund's costs for the last year?
(based on a hypothetical $10,000 investment)
| Fund | Costs of a $10,000 investment | Costs paid as a percentage of a $10,000 investment |
|---|---|---|
| BNY Mellon Responsible Horizons Corporate Bond ETF | $36 | 0.35% |
How did the Fund perform last year?
For the 12 month period ended June 30, 2024, the Fund’s shares returned 5.12% on a net asset value basis and 5.07% on a market price basis.
In comparison, ICE BofA U.S. Corporate Index (the “Index”) returned 5.04% for the same period.
What affected the Fund's performance?
Economic growth propelled credit markets to gains, narrowing credit spreads as the Federal Reserve (“Fed”) ended its tightening cycle in September 2023.
The Fund was positioned slightly long duration in anticipation of upcoming Fed rate cuts as inflation normalizes. However, this led to a slight drag on performance as the rate cuts were delayed. In addition, our overweight to the 7 year and 30 year was a slight drag on performance as the very short end of the curve outperformed and the curve steepened.
Security selection and a large allocation to credit risk drove the Fund’s performance. As spreads tightened, the Fund’s overweight to lower-rated investment-grade bonds and a small allocation to high-yield bonds proved beneficial and upwards rating trends in securities held, providing performance tailwinds.
Sector allocation effects were mixed as the Fund’s overweight to banks contributed to performance but its underweight to energy detracted.
Not FDIC-Insured. Not Bank-Guaranteed. May Lose Value.

How did the fund perform since its inception?
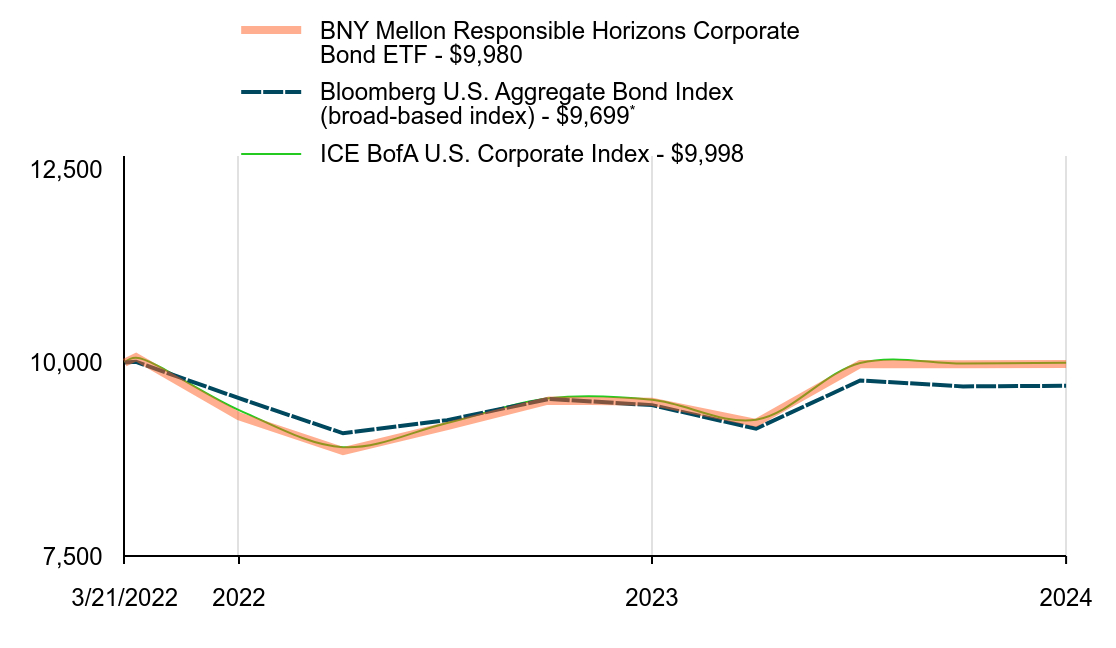
The Fund's past performance is not a good predictor of the Fund's future performance.The graph and table do not reflect the deduction of taxes that a shareholder would pay on fund distributions or redemption of fund shares.
CUMULATIVE PERFORMANCE FROM MARCH 21, 2022 THROUGH JUNE 30, 2024
INITIAL INVESTMENT OF $10,000

| BNY Mellon Responsible Horizons Corporate Bond ETF - $9,980 | Bloomberg U.S. Aggregate Bond Index (broad-based index) - $9,699Footnote Reference* | ICE BofA U.S. Corporate Index - $9,998 | |
|---|---|---|---|
| 3/21/2022 | 10,000 | 10,000 | 10,000 |
| 3/31/2022 | 10,071 | 10,009 | 10,061 |
| 6/30/2022 | 9,306 | 9,539 | 9,386 |
| 9/30/2022 | 8,856 | 9,086 | 8,906 |
| 12/31/2022 | 9,180 | 9,256 | 9,220 |
| 3/31/2023 | 9,510 | 9,530 | 9,538 |
| 6/30/2023 | 9,494 | 9,450 | 9,518 |
| 9/30/2023 | 9,221 | 9,145 | 9,262 |
| 12/31/2023 | 9,981 | 9,768 | 9,995 |
| 3/31/2024 | 9,977 | 9,692 | 9,987 |
| 6/30/2024 | 9,980 | 9,699 | 9,998 |
Years Ended 6/30
The above graph compares a hypothetical $10,000 investment in the Fund’s shares to a hypothetical investment of $10,000 made in each index on March 21, 2022, the Fund’s inception. The performance shown takes into account applicable fees and expenses of the Fund, including management fees and other expenses. The Fund’s performance also assumes the reinvestment of dividends and capital gains. Unlike the Fund, an index is not subject to fees and other expenses. Investors cannot invest directly in any index.
AVERAGE ANNUAL TOTAL RETURNS (AS OF 6/30/24)
| Fund | 1 YR | Since Inception (March 21, 2022) |
|---|---|---|
| BNY Mellon Responsible Horizons Corporate Bond ETF - NAV Return | 5.12% | - 0.09% |
| BNY Mellon Responsible Horizons Corporate Bond ETF - Market Price Return | 5.07% | - 0.02% |
Bloomberg U.S. Aggregate Bond Index (broad-based index)Footnote Reference* | 2.63% | - 1.33% |
| ICE BofA U.S. Corporate Index | 5.04% | - 0.01% |
| Footnote | Description |
Footnote* | In accordance with regulatory changes requiring the Fund’s primary benchmark to represent the overall applicable market, the Fund’s primary prospectus benchmark changed to the indicated benchmark effective as of June 30, 2024. |
The performance data quoted represent past performance, which is no guarantee of future results. For more current performance information, visit im.bnymellon.com/etfliterature.
KEY FUND STATISTICS (AS OF 6/30/24)
| Fund size (Millions) | Number of Holdings | Total Advisory Fee Paid During Period ($) | Annual Portfolio Turnover |
|---|---|---|---|
| $23 | 276 | 78,566 | 56.72% |
Not FDIC-Insured. Not Bank-Guaranteed. May Lose Value.

Portfolio Holdings (as of 6/30/24)
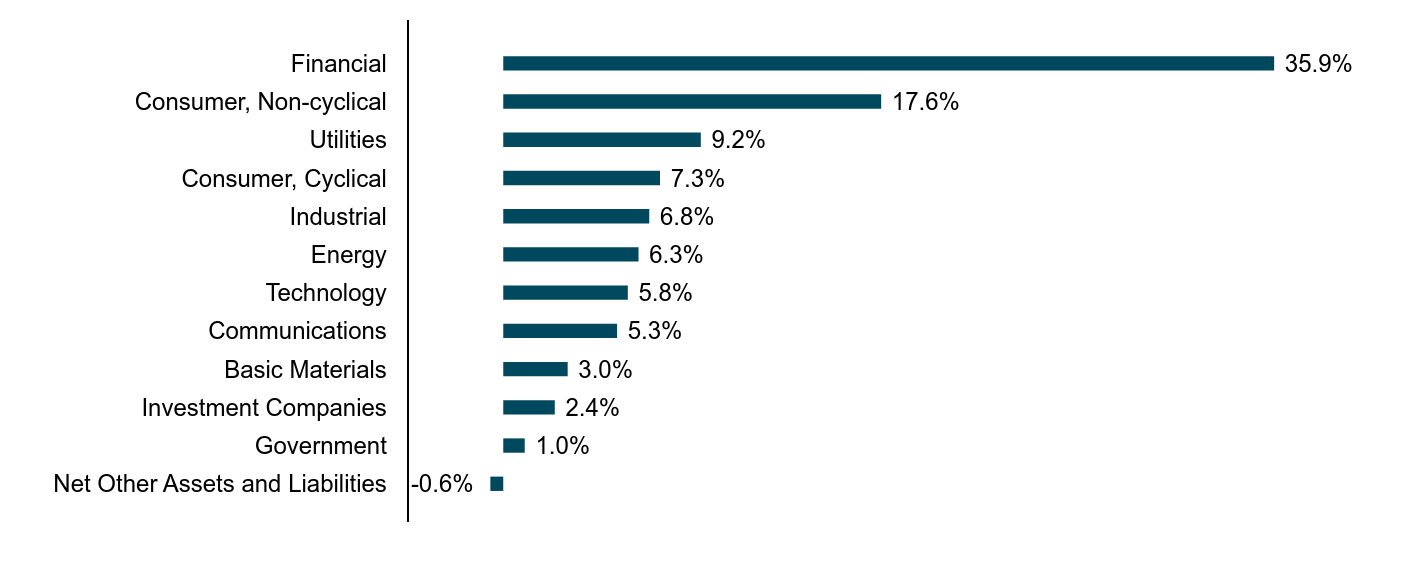
Sector Allocation
(Based on Net Assets)

| Value | Value |
|---|---|
| Net Other Assets and Liabilities | -0.6% |
| Government | 1.0% |
| Investment Companies | 2.4% |
| Basic Materials | 3.0% |
| Communications | 5.3% |
| Technology | 5.8% |
| Energy | 6.3% |
| Industrial | 6.8% |
| Consumer, Cyclical | 7.3% |
| Utilities | 9.2% |
| Consumer, Non-cyclical | 17.6% |
| Financial | 35.9% |
Allocation of Holdings
(Based on Net Assets)

| Value | Value |
|---|---|
| Net Other Assets and Liabilities | -0.6% |
| Forward Foreign Currency Exchange Contracts | 0.0%Footnote Reference* |
| Futures | 0.0%Footnote Reference* |
| Municipal Securities | 0.0%Footnote Reference* |
| Investment of Cash Collateral for Securities Loaned | 0.2% |
| Foreign Governmental | 1.0% |
| Investment Companies | 2.2% |
| Corporate Bonds | 97.2% |
| Footnote | Description |
Footnote* | Less than 0.1%. |
How has the Fund changed?
The Fund revised its investment strategy and related risks to more fully describe the sub-adviser’s investment processes. More information on the changes can be found in the Fund’s current prospectus dated November 1, 2023.
This is a summary of certain changes to the Fund since July 1, 2023. For more complete information, you may review the Fund’s next prospectus, which we expect to be available by November 1, 2024 at im.bnymellon.com/etfliterature or upon request at 1-833-383-2696 or by calling your financial adviser.
For additional information about the Fund, including its prospectus, financial information, portfolio holdings and proxy voting information, please visit im.bnymellon.com/etfliterature.
Not FDIC-Insured. Not Bank-Guaranteed. May Lose Value.

© 2024 BNY Mellon Securities Corporation,
240 Greenwich Street, 9th Floor, New York, NY 10281
Code-4863AR0624

David J. DiPetrillo, President
David J. DiPetrillo, President
James Windels, Treasurer