UNITED STATES
SECURITIES AND EXCHANGE COMMISSION
Washington, D.C. 20549
FORM N-CSR
CERTIFIED SHAREHOLDER REPORT OF REGISTERED MANAGEMENT INVESTMENT COMPANIES
Investment Company Act file number 811-23477
BNY Mellon ETF Trust
(Exact name of registrant as specified in charter)
240 Greenwich Street
New York, New York 10286
(Address of principal executive offices) (Zip code)
Deirdre Cunnane, Esq.
240 Greenwich Street
New York, New York 10286
(Name and address of agent for service)
Registrant's telephone number, including area code: (212) 922-6400
Date of fiscal year end: June 30
Date of reporting period: December 31, 2024
The following N-CSR relates only to the Registrant's series listed below and does not relate to any series of the Registrant with a different fiscal year end and, therefore, different N-CSR reporting requirements. A separate N-CSR will be filed for any series with a different fiscal year end, as appropriate.
BNY Mellon Ultra Short Income ETF
Item 1. Reports to Stockholders.
(a) The following is a copy of the report transmitted to shareholders pursuant to Rule 30e-1 under the Investment Company Act of 1940 (17 CFR 270.30e-1).
BNY Mellon Ultra Short Income ETF
Semi-Annual Shareholder Report
Ticker - BKUI (NYSE Arca, Inc.)
This semi-annual shareholder report contains important information about BNY Mellon Ultra Short Income ETF (the “Fund”) for the period of July 1, 2024 to December 31, 2024. You can find additional information about the Fund at bny.com/investments/etfliterature. You can also request this information by calling us at 1-833-383-2696 or calling your financial adviser.
What were the Fund's costs for the last six months?
(based on a hypothetical $10,000 investment)
| Fund | Costs of a $10,000 investment | Costs paid as a percentage of a $10,000 investment |
|---|
| BNY Mellon Ultra Short Income ETF | $6 | 0.12%Footnote Reference* |
|---|
| Footnote | Description |
Footnote* | Annualized |
KEY FUND STATISTICS (AS OF 12/31/24)
| Fund size (Millions) | Number of Holdings | Portfolio Turnover |
|---|
| $196 | 117 | 9.06% |
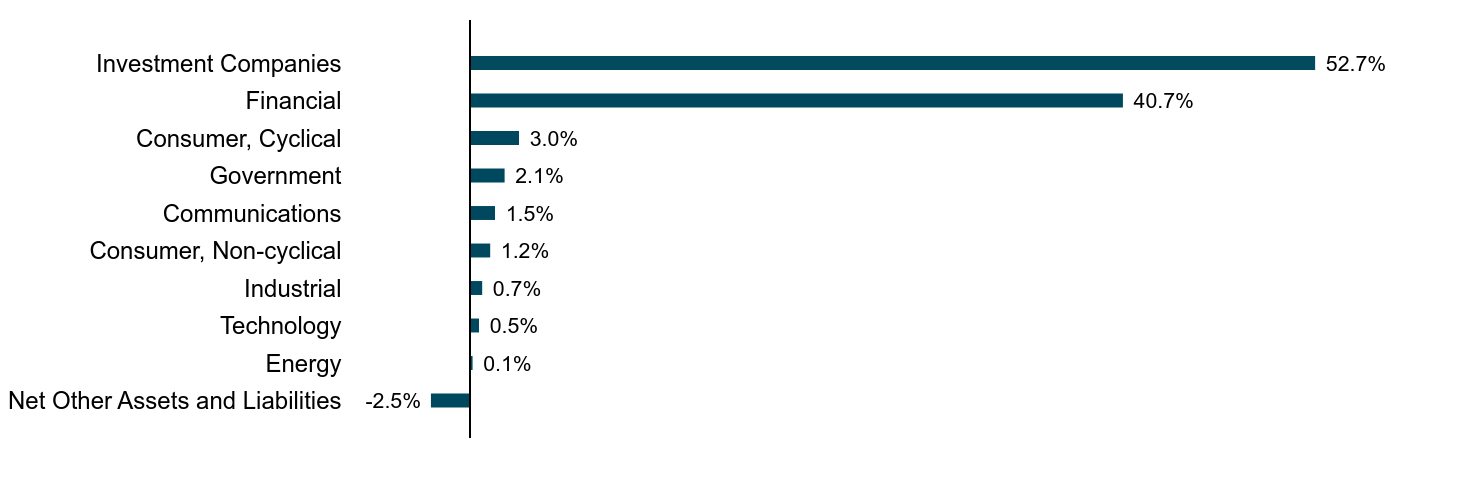
Portfolio Holdings (as of 12/31/24)
Sector Allocation
(Based on Net Assets)
| Value | Value |
|---|
| Net Other Assets and Liabilities | -2.5% |
| Energy | 0.1% |
| Technology | 0.5% |
| Industrial | 0.7% |
| Consumer, Non-cyclical | 1.2% |
| Communications | 1.5% |
| Government | 2.1% |
| Consumer, Cyclical | 3.0% |
| Financial | 40.7% |
| Investment Companies | 52.7% |
Not FDIC-Insured. Not Bank-Guaranteed. May Lose Value.
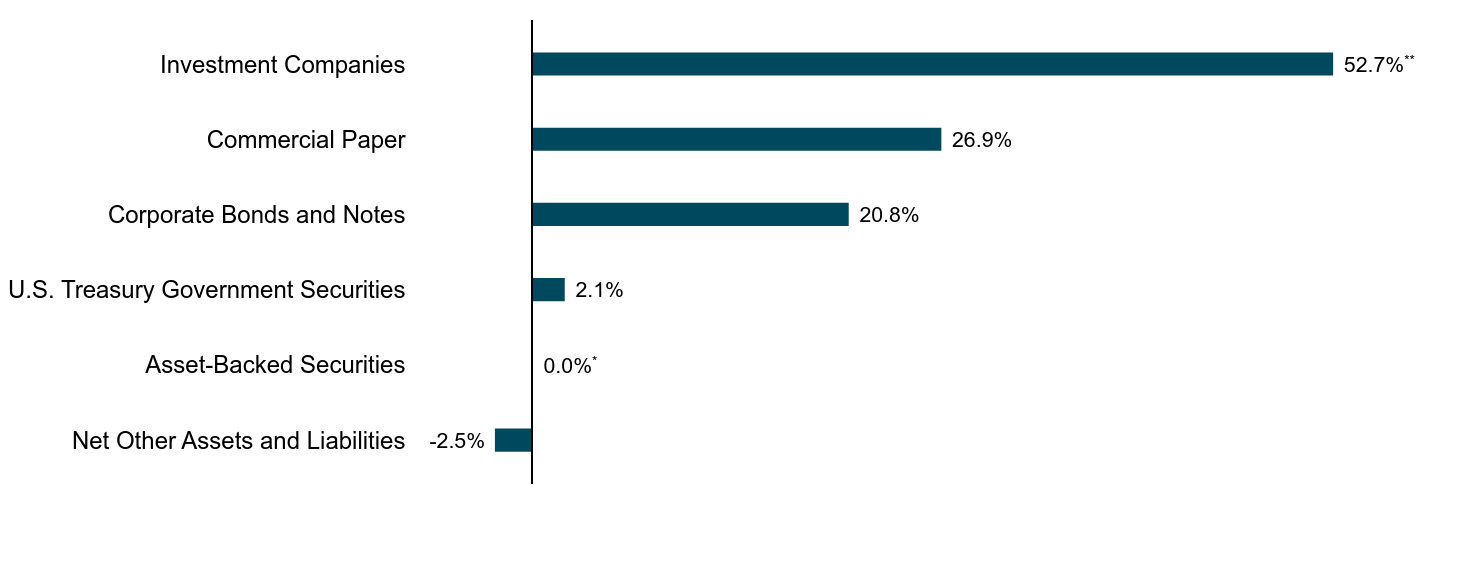
Allocation of Holdings
(Based on Net Assets)
| Value | Value |
|---|
| Net Other Assets and Liabilities | -2.5% |
| Asset-Backed Securities | 0.0%Footnote Reference* |
| U.S. Treasury Government Securities | 2.1% |
| Corporate Bonds and Notes | 20.8% |
| Commercial Paper | 26.9% |
| Investment Companies | 52.7%Footnote Reference** |
| Footnote | Description |
Footnote* | Amount represents less than 0.1%. |
Footnote** | A large creation unit order for shares of the Fund was placed on December 30, 2024 and temporarily invested by the Fund into the Dreyfus Institutional Preferred Government Money Market Fund, temporarily causing the Fund’s investments in investment companies on and around December 31, 2024 to be higher than usual. |
For additional information about the Fund, including its prospectus, financial information, portfolio holdings and proxy voting information, please visit bny.com/investments/etfliterature.
© 2025 BNY Mellon Securities Corporation,
240 Greenwich Street, 9th Floor, New York, NY 10286
Code-4862SA1224
Item 1. Reports to Stockholders (cont.).
(b) Not applicable.
Item 2. Code of Ethics.
Not applicable.
Item 3. Audit Committee Financial Expert.
Not applicable.
Item 4. Principal Accountant Fees and Services.
Not applicable.
Item 5. Audit Committee of Listed Registrants.
Not applicable.
Item 6. Investments.
(a) The Schedule of Investments in securities of unaffiliated issuers as of the close of the Reporting Period is included in the financial statements filed under Item 7 of this Form N-CSR.
(b) Not applicable.
Item 7. Financial Statements and Financial Highlights for Open-End Management Investment Companies.
The following is a copy of the Registrant’s most recent financial statements and financial highlights.
SEMI-ANNUAL
FINANCIALS
AND
OTHER
INFORMATION
December
31,
2024
BNY
Mellon
Ultra
Short
Income
ETF:
BKUI
Principal
U.S.
Listing
Exchange:
NYSE
Arca,
Inc.
Please
note
the
Semi-Annual
Financials
and
Other
Information
only
contains
Items
7-11
required
in
Form
N-CSR.
All
other
required
items
will
be
filed
with
the
SEC.
Item
7.
Financial
Statements
and
Financial
Highlights
for
Open-End
Management
Investment
Companies
3
Statement
of
Investments
3
Statement
of
Assets
and
Liabilities
7
Statement
of
Operations
8
Statement
of
Changes
in
Net
Assets
9
Financial
Highlights
10
Notes
to
Financial
Statements
11
Item
8.
Changes
in
and
Disagreements
with
Accountants
for
Open-End
Management
Investment
Companies
16
Item
9.
Proxy
Disclosures
for
Open-End
Management
Investment
Companies
17
Item
10.
Remuneration
Paid
to
Directors,
Officers,
and
Others
of
Open-End
Investment
Companies
18
Item
11.
Statement
Regarding
Basis
for
Approval
of
Investment
Advisory
Contracts
19
Save
time.
Save
paper.
View
your
next
shareholder
report
online
as
soon
as
it’s
available.
Log
into
www.bny.com/investments
and
sign
up
for
eCommunications.
It’s
simple
and
only
takes
a
few
minutes.
The
views
expressed
herein
are
current
to
the
date
of
this
report.
These
views
and
the
composition
of
the
fund’s
portfolio
is
subject
to
change
at
any
time
based
on
market
and
other
conditions.
Not
FDIC-Insured
•
Not
Bank-Guaranteed
•
May
Lose
Value
BNY
Mellon
Ultra
Short
Income
ETF
Statement
of
Investments
December
31,
2024
(Unaudited)
Item
7.
Financial
Statements
and
Financial
Highlights
for
Open-End
Management
Investment
Companies
Description
Principal
Amount
($)
Value
($)
Asset-Backed
Securities
–
0.0%
Honda
Auto
Receivables
Owner
Trust
,
Series
2021-3,
Class
A3,
0.41%,
11/18/2025
(a)
10,041
10,020
Total
Asset-Backed
Securities
(cost
$10,041)
10,020
Commercial
Paper
–
26.9%
Atlantic
Asset
Securitization
LLC
5.04%,
2/19/2025
(a)(b)
1,000,000
993,738
4.52%,
5/06/2025
(a)(b)
1,000,000
984,351
Banco
Santander
S.A.
,
4.55%,
3/21/2025
(a)(b)
2,500,000
2,475,100
Canadian
Imperial
Bank
5.28%,
4/03/2025
(a)(b)
1,500,000
1,483,200
4.64%
(1
Month
SOFR
+
0.34%),
9/08/2025
(b)(c)
750,000
750,479
Chariot
Funding
LLC
,
4.70%
(1
Month
SOFR
+
0.30%),
5/09/2025
(b)(c)
2,600,000
2,600,147
Cooperatieve
Rabobank
UA
,
4.61%
(1
Month
SOFR
+
0.21%),
8/04/2025
(c)
2,500,000
2,500,015
Credit
Industriel
et
Commercial
5.29%,
2/06/2025
(a)
1,300,000
1,294,163
4.65%
(1
Month
SOFR
+
0.25%),
7/07/2025
(b)(c)
2,500,000
2,500,744
DNB
ASA
,
5.40%,
4/11/2025
(a)(b)
2,000,000
1,975,712
HSBC
Bank
PLC
,
4.76%
(1
Month
SOFR
+
0.36%),
6/05/2025
(b)(c)
1,500,000
1,501,137
LMA
SA/LMA-Americas
LLC
,
5.56%,
1/28/2025
(a)(b)
1,200,000
1,195,840
Manhattan
Asset
Funding
Co.
LLC
,
4.45%,
3/25/2025
(a)(b)
5,000,000
4,947,465
National
Australia
Bank
Ltd.
,
4.60%
(1
Month
SOFR
+
0.20%),
5/05/2025
(b)(c)
2,000,000
2,000,233
National
Bank
of
Canada
,
5.33%,
4/01/2025
(a)(b)
1,500,000
1,483,033
Natixis
SA
,
4.42%,
7/18/2025
(a)
2,750,000
2,683,334
Old
Line
Funding
LLC
,
4.70%
(1
Month
SOFR
+
0.30%),
6/23/2025
(b)(c)
1,200,000
1,200,095
Oversea-Chinese
Banking
Corp.
Ltd.
,
4.60%
(1
Month
SOFR
+
0.20%),
5/20/2025
(b)(c)
2,500,000
2,499,793
Sheffield
Receivables
Co.
LLC
,
4.66%,
3/05/2025
(a)(b)
2,300,000
2,281,655
Societe
Generale
SA
,
5.52%,
4/11/2025
(a)(b)
1,000,000
987,626
Starbird
Funding
Corp.
,
4.45%,
4/01/2025
(a)(b)
3,000,000
2,965,992
Svenska
Handelsbanken AB
,
4.34%,
7/21/2025
(a)(b)
2,750,000
2,682,966
Swedbank
AB
,
5.26%,
3/13/2025
(a)(b)
750,000
743,340
Thunder
Bay
Funding
LLC
,
4.56%
(1
Month
SOFR
+
0.12%),
6/06/2025
(b)(c)
5,000,000
4,905,063
Toronto-Dominion
Bank
(The)
,
5.32%,
4/03/2025
(a)(b)
1,500,000
1,482,745
Westpac
Banking
Corp.
,
5.27%,
3/31/2025
(a)(b)
1,500,000
1,483,223
Total
Commercial
Paper
(cost
$52,574,956)
52,601,189
Corporate
Bonds
and
Notes
–
20.8%
Auto
Manufacturers
–
1.8%
American
Honda
Finance
Corp.
,
1.30%
,
9/09/2026
300,000
283,791
BMW
US
Capital
LLC
,
4.90%
,
4/02/2027
(b)
600,000
601,842
General
Motors
Financial
Co.,
Inc.
5.40%,
4/06/2026
250,000
251,544
5.91%
(3
Month
SOFRIX
+
1.35%),
5/08/2027
(c)
350,000
353,234
Mercedes-Benz
Finance
North
America
LLC
5.20%,
8/03/2026
(b)
325,000
327,562
3.45%,
1/06/2027
(b)
325,000
317,061
PACCAR
Financial
Corp.
,
3.55%
,
8/11/2025
300,000
298,303
Toyota
Motor
Credit
Corp.
4.98%
(3
Month
SOFR
+
0.32%),
1/13/2025
(c)
300,000
300,016
5.15%
(3
Month
SOFR
+
0.65%),
3/19/2027
(c)
750,000
752,655
3,486,008
Statement
of
Investments
(continued)
Description
Principal
Amount
($)
Value
($)
Corporate
Bonds
and
Notes
–
20.8%
(continued)
Banks
–
12.6%
ANZ
New
Zealand
Int'l
Ltd.
,
5.14%
(
3
Month
SOFR
+
0.60%
)
,
2/18/2025
(b)(c)
300,000
300,142
Australia
&
New
Zealand
Banking
Group
Ltd.
,
5.16%
(
3
Month
SOFR
+
0.65%
)
,
9/30/2027
(b)(c)
1,000,000
1,002,464
Bank
of
America
NA
,
5.53%
,
8/18/2026
300,000
304,157
Bank
of
Montreal
5.58%
(3
Month
SOFRIX
+
1.06%),
6/07/2025
(c)
350,000
351,131
5.27%,
12/11/2026
325,000
328,885
Bank
of
Nova
Scotia
(The)
5.12%
(3
Month
SOFR
+
0.46%),
1/10/2025
(c)
300,000
300,015
5.35%,
12/07/2026
750,000
759,867
Barclays
PLC
,
6.39%
(
3
Month
SOFR
+
1.88%
)
,
9/13/2027
(c)
750,000
761,313
Canadian
Imperial
Bank
of
Commerce
3.95%,
8/04/2025
275,000
273,988
5.73%
(3
Month
SOFR
+
1.22%),
10/02/2026
(c)
375,000
378,569
Citigroup,
Inc.
6.03%
(3
Month
SOFR
+
1.53%),
3/17/2026
(c)
300,000
300,793
5.29%
(3
Month
SOFR
+
0.77%),
6/09/2027
(c)
700,000
701,610
Commonwealth
Bank
of
Australia
,
5.26%
(
3
Month
SOFR
+
0.75%
)
,
3/13/2026
(b)(c)
350,000
351,500
Goldman
Sachs
Group,
Inc.
(The)
,
5.31%
(
3
Month
SOFR
+
0.79%
)
,
12/09/2026
(c)
725,000
726,790
ING
Groep
NV
,
3.95%
,
3/29/2027
600,000
589,774
JPMorgan
Chase
&
Co.
,
5.93%
(
3
Month
SOFR
+
1.32%
)
,
4/26/2026
(c)
300,000
301,136
JPMorgan
Chase
Bank
NA
,
5.11%
,
12/08/2026
325,000
328,508
KeyBank
NA
4.70%,
1/26/2026
300,000
299,599
5.85%,
11/15/2027
750,000
768,787
Lloyds
Banking
Group
PLC
,
6.29%
(
3
Month
SOFRIX
+
1.58%
)
,
1/05/2028
(c)
850,000
862,341
Macquarie
Bank
Ltd.
,
5.43%
(
3
Month
SOFRIX
+
0.92%
)
,
7/02/2027
(b)(c)
750,000
754,953
Manufacturers
&
Traders
Trust
Co.
,
4.65%
,
1/27/2026
300,000
299,323
Morgan
Stanley
Bank
NA
,
5.76%
(
3
Month
SOFR
+
1.17%
)
,
10/30/2026
(c)
500,000
505,880
National
Australia
Bank
Ltd.
5.04%
(3
Month
SOFR
+
0.38%),
1/12/2025
(b)(c)
300,000
300,019
1.89%,
1/12/2027
(b)
375,000
355,736
National
Bank
of
Canada
5.25%,
1/17/2025
300,000
300,072
5.54%
(3
Month
SOFRIX
+
1.03%),
7/02/2027
(c)
750,000
752,887
NatWest
Markets
PLC
1.60%,
9/29/2026
(b)
225,000
213,607
5.44%
(3
Month
SOFR
+
0.90%),
5/17/2027
(b)(c)
500,000
501,886
PNC
Financial
Services
Group,
Inc.
(The)
,
2.60%
,
7/23/2026
325,000
315,028
Royal
Bank
of
Canada
Series
G,
5.07%
(3
Month
SOFRIX
+
0.44%),
1/21/2025
(c)
300,000
300,035
Series
G,
5.58%
(3
Month
SOFRIX
+
0.95%),
1/19/2027
(c)
650,000
655,305
Standard
Chartered
PLC
6.25%
(3
Month
SOFR
+
1.74%),
3/30/2026
(b)(c)
350,000
350,940
6.62%
(3
Month
SOFR
+
1.93%),
7/06/2027
(b)(c)
400,000
406,829
State
Street
Corp.
3.55%,
8/18/2025
98,000
97,434
5.27%,
8/03/2026
225,000
227,370
5.42%
(3
Month
SOFRIX
+
0.85%),
8/03/2026
(c)
600,000
604,493
Sumitomo
Mitsui
Financial
Group,
Inc.
,
1.40%
,
9/17/2026
300,000
283,884
Sumitomo
Mitsui
Trust
Bank
Ltd.
5.64%
(3
Month
SOFR
+
1.12%),
3/09/2026
(b)(c)
300,000
302,263
5.65%,
9/14/2026
(b)
325,000
329,956
Toronto-Dominion
Bank
(The)
5.53%,
7/17/2026
200,000
202,456
Series
G,
5.42%
(3
Month
SOFR
+
0.73%),
4/05/2027
(c)
850,000
851,594
Description
Principal
Amount
($)
Value
($)
Corporate
Bonds
and
Notes
–
20.8%
(continued)
Banks
–
12.6%
(continued)
Truist
Financial
Corp.
,
1.13%
,
8/03/2027
750,000
683,327
US
Bancorp
1.45%,
5/12/2025
1,600,000
1,581,946
Series
V,
2.38%,
7/22/2026
325,000
314,376
US
Bank
NA
,
5.32%
(
3
Month
SOFR
+
0.69%
)
,
10/22/2027
(c)
600,000
599,991
Wells
Fargo
&
Co.
,
3.00%
,
2/19/2025
300,000
299,183
Wells
Fargo
Bank
NA
5.55%,
8/01/2025
750,000
753,484
5.58%
(3
Month
SOFR
+
1.07%),
12/11/2026
(c)
900,000
910,220
Westpac
Banking
Corp.
,
5.05%
(
3
Month
SOFR
+
0.52%
)
,
6/03/2026
(c)
700,000
700,883
24,746,729
Computers
–
0.2%
International
Business
Machines
Corp.
,
4.00%
,
7/27/2025
300,000
298,848
298,848
Diversified
Financial
Services
–
0.8%
American
Express
Co.
5.31%
(3
Month
SOFR
+
0.76%),
2/13/2026
(c)
250,000
250,875
2.55%,
3/04/2027
750,000
718,114
Charles
Schwab
Corp.
(The)
5.07%
(3
Month
SOFRIX
+
0.52%),
5/13/2026
(c)
300,000
299,928
5.88%,
8/24/2026
350,000
356,197
1,625,114
Healthcare-Services
–
0.7%
Cigna
Group
(The)
,
5.69%
,
3/15/2026
650,000
650,210
Roche
Holdings,
Inc.
,
5.28%
(
3
Month
SOFR
+
0.74%
)
,
11/13/2026
(b)(c)
650,000
655,355
1,305,565
Insurance
–
0.1%
Prudential
Financial,
Inc.
,
1.50%
,
3/10/2026
300,000
289,567
289,567
Internet
–
0.4%
Amazon.com,
Inc.
,
3.15%
,
8/22/2027
750,000
724,377
724,377
Machinery-Construction
&
Mining
–
0.4%
Caterpillar
Financial
Services
Corp.
,
5.06%
(
3
Month
SOFR
+
0.52%
)
,
5/14/2027
(c)
750,000
750,781
750,781
Machinery-Diversified
–
0.3%
John
Deere
Capital
Corp.
4.80%,
1/09/2026
300,000
300,991
1.70%,
1/11/2027
350,000
331,053
632,044
Media
–
0.4%
Comcast
Corp.
,
2.35%
,
1/15/2027
750,000
717,130
717,130
Oil
&
Gas
–
0.1%
BP
Capital
Markets
America,
Inc.
,
3.41%
,
2/11/2026
300,000
296,458
296,458
Pharmaceuticals
–
0.5%
AbbVie,
Inc.
,
2.95%
,
11/21/2026
350,000
340,165
CVS
Health
Corp.
,
3.00%
,
8/15/2026
300,000
290,853
Pfizer
Investment
Enterprises
Pte
Ltd.
,
4.45%
,
5/19/2026
250,000
249,768
Shire
Acquisitions
Investments
Ireland
DAC
,
3.20%
,
9/23/2026
7,000
6,845
887,631
Statement
of
Investments
(continued)
See
Notes
to
Financial
Statements
Description
Principal
Amount
($)
Value
($)
Corporate
Bonds
and
Notes
–
20.8%
(continued)
Real
Estate
–
0.3%
Simon
Property
Group
LP
,
1.38%
,
1/15/2027
725,000
680,021
680,021
Retail
–
1.2%
Home
Depot,
Inc.
(The)
,
4.00%
,
9/15/2025
750,000
747,706
Starbucks
Corp.
,
2.00%
,
3/12/2027
750,000
708,798
Target
Corp.
,
1.95%
,
1/15/2027
700,000
666,074
Walmart,
Inc.
,
3.90%
,
9/09/2025
300,000
299,025
2,421,603
Semiconductors
–
0.2%
Intel
Corp.
,
3.70%
,
7/29/2025
300,000
298,070
298,070
Software
–
0.1%
Oracle
Corp.
,
2.65%
,
7/15/2026
300,000
291,054
291,054
Telecommunications
–
0.7%
AT&T,
Inc.
,
4.25%
,
3/01/2027
700,000
693,744
T-Mobile
USA,
Inc.
,
3.75%
,
4/15/2027
600,000
586,347
1,280,091
Total
Corporate
Bonds
and
Notes
(cost
$40,611,909)
40,731,091
U.S.
Treasury
Government
Securities
–
2.1%
U.S.
Treasury
Notes
3.13%,
8/15/2025
600,000
595,873
4.88%,
11/30/2025
1,500,000
1,508,270
4.13%,
11/15/2027
2,000,000
1,991,487
Total
U.S.
Treasury
Government
Securities
(cost
$4,095,627)
4,095,630
Shares
Investment
Companies
–
52.7%
Registered
Investment
Companies
–
52.7%
Dreyfus
Institutional
Preferred
Government
Money
Market
Fund,
Institutional
Shares,
4.42%
(d)(e)
(cost
$103,146,676)
103,146,676
103,146,676
Total
Investments
(cost
$200,439,209)
102.5%
200,584,606
Liabilities,
Less
Cash
and
Receivables
(2.5)%
(4,819,331)
Net
Assets
100.0%
195,765,275
SOFR—Secured
Overnight
Financing
Rate
SOFRIX—Secured
Overnight
Financing
Rate
Index
(a)
Security
is
a
discount
security.
Income
is
recognized
through
the
accretion
of
discount.
(b)
Security
exempt
from
registration
pursuant
to
Rule
144A
under
the
Securities
Act
of
1933.
These
securities
may
be
resold
in
transactions
exempt
from
registration,
normally
to
qualified
institutional
buyers.
At
December
31,
2024,
these
securities
were
valued
at
$53,195,792
or
27.17%
of
net
assets.
(c)
Variable
rate
security
-
rate
shown
is
the
interest
rate
in
effect
at
period
end.
Security
description
also
includes
the
reference
rate
and
spread
if
published
and
available.
(d)
Investment
in
affiliated
issuer.
The
investment
objective
of
this
investment
company
is
publicly
available
and
can
be
found
within
the
investment
company’s
prospectus.
(e)
The
rate
shown
is
the
1-day
yield
as
of
December
31,
2024.
Holdings
and
transactions
in
these
affiliated
companies
during
the
period
ended
December
31,
2024
are
as
follows:
Description
Value
($)
6/30/24
Purchases
($)
1
Sales
($)
Value
($)
12/31/24
Dividends/
Distributions
($)
Investment
Companies
–
52.7%
Dreyfus
Institutional
Preferred
Government
Money
Market
Fund,
Institutional
Shares
1,494,113
143,200,444
(41,547,881)
103,146,676
92,806
Total
–
52.7%
1,494,113
143,200,444
(41,547,881)
103,146,676
92,806
1
Includes
reinvested
dividends/distributions.
STATEMENT
OF
ASSETS
AND
LIABILITIES
December
31,
2024
(Unaudited)
See
Notes
to
Financial
Statements
Cost
Value
Assets
($):
Investments
in
securities—See
Statement
of
Investments:
–
Unaffiliated
issuers
97,292,533
97,437,930
Affiliated
issuers
103,146,676
103,146,676
Interest
receivable
475,181
Dividends
receivable
13,674
201,073,461
Liabilities
($):
Due
to
BNY
Mellon
ETF
Investment
Adviser,
LLC—Note
3(b)
9,193
Cash
overdraft
due
to
Custodian
393,930
Payable
for
investment
securities
purchased
4,905,063
5,308,186
Net
Assets
($)
195,765,275
Composition
of
Net
Assets
($):
Paid-in
capital
195,957,238
Total
distributable
earnings
(loss)
(191,963)
Net
Assets
($)
195,765,275
Shares
outstanding
no
par
value
(unlimited
shares
authorized):
3,950,001
Net
asset
value
per
share
49.56
Market
price
per
share
49.58
STATEMENT
OF
OPERATIONS
Six
Months
Ended
December
31,
2024
(Unaudited)
See
Notes
to
Financial
Statements
Investment
Income
($):
Income:
Cash
dividends:
Affiliated
issuers
92,806
Interest
2,033,145
Total
Income
2,125,951
Expenses:
Management
fee—Note
3(a)
49,132
Total
Expenses
49,132
Net
Investment
Income
2,076,819
Realized
and
Unrealized
Gain
(Loss)
on
Investments—Note
4
($):
Net
realized
gain
(loss)
on
investments
4,364
Net
change
in
unrealized
appreciation
(depreciation)
on
investments
230,797
Net
Realized
and
Unrealized
Gain
(Loss)
on
Investments
235,161
Net
Increase
(Decrease)
in
Net
Assets
Resulting
from
Operations
2,311,980
STATEMENT
OF
CHANGES
IN
NET
ASSETS
See
Notes
to
Financial
Statements
Six
Months
Ended
December
31,
2024
(Unaudited)
Year
Ended
June
30,
2024
Operations
($):
Net
investment
income
2,076,819
2,587,443
Net
realized
gain
(loss)
on
investments
4,364
(16,315)
Net
change
in
unrealized
appreciation
(depreciation)
on
investments
230,797
241,251
Net
Increase
(Decrease)
in
Net
Assets
Resulting
from
Operations
2,311,980
2,812,379
Distributions
($):
Distributions
to
shareholders
(2,393,435)
(2,459,830)
Beneficial
Interest
Transactions
($):
Proceeds
from
shares
sold
128,906,022
47,001,580
Cost
of
shares
redeemed
(7,456,631)
(2,473,521)
Transaction
fees—Note
5
13,636
4,948
Increase
(Decrease)
in
Net
Assets
from
Beneficial
Interest
Transactions
121,463,027
44,533,007
Total
Increase
(Decrease)
in
Net
Assets
121,381,572
44,885,556
Net
Assets
($):
Beginning
of
Period
74,383,703
29,498,147
End
of
Period
195,765,275
74,383,703
Changes
in
Shares
Outstanding:
Shares
sold
2,600,000
950,000
Shares
redeemed
(150,000)
(50,000)
Net
Increase
(Decrease)
in
Shares
Outstanding
2,450,000
900,000
The
following
table
describes
the
performance
for
the
fiscal
periods
indicated.
See
Notes
to
Financial
Statements
Six
Months
Ended
December
31,
2024
(Unaudited)
Year
Ended
June
30,
For
the
Period
from
August
11,
2021
(a)
to
June
30,
2022
2024
2023
Per
Share
Data
($):
Net
asset
value,
beginning
of
period
49.59
49.16
48.97
50.00
Investment
Operations:
Net
investment
income
(b)
1.26
2.41
1.56
0.17
Net
realized
and
unrealized
gain
(loss)
on
investments
0.19
0.36
0.18
(0.94)
Total
from
Investment
Operations
1.45
2.77
1.74
(0.77)
Distributions:
–
–
–
–
Dividends
from
net
investment
income
(1.49)
(2.34)
(1.55)
(0.27)
Transaction
fees
(b)
0.01
0.00
(c)
0.00
(c)
0.01
Net
asset
value,
end
of
period
49.56
49.59
49.16
48.97
Market
price,
end
of
period
49.58
49.58
49.15
48.96
Net
Asset
Value
Total
Return
(%)
(d)
2.99
5.76
3.64
(1.54)
(e)
Market
Price
Total
Return
(%)
(d)
3.04
5.77
3.62
(1.55)
(e)
Ratios/Supplemental
Data
(%):
Ratio
of
total
expenses
to
average
net
assets
0.12
(f)
0.12
0.12
0.12
(f)
Ratio
of
net
investment
income
to
average
net
assets
5.07
(f)
4.88
3.19
0.39
(f)
Portfolio
Turnover
Rate
(g)
9.06
42.44
20.55
43.10
Net
Assets,
end
of
period
($
x
1,000)
195,765
74,384
29,498
26,931
(a)
Commencement
of
operations.
(b)
Based
on
average
shares
outstanding.
(c)
Amount
represents
less
than
$0.01
per
share.
(d)
Net
asset
value
total
return
is
calculated
assuming
an
initial
investment
made
at
the
net
asset
value
at
the
beginning
of
the
period,
reinvestment
of
all
dividends
and
distributions
at
net
asset
value
during
the
period,
and
redemption
at
net
asset
value
on
the
last
day
of
the
period.
Net
asset
value
total
return
includes
adjustments
in
accordance
with
accounting
principles
generally
accepted
in
the
United
States
of
America
and
as
such,
the
net
asset
value
for
financial
reporting
purposes
and
the
returns
based
upon
those
net
asset
values
may
differ
from
the
net
asset
value
and
returns
for
shareholder
transactions.
Market
price
total
return
is
calculated
assuming
an
initial
investment
made
at
the
market
price
at
the
beginning
of
the
period,
reinvestment
of
all
dividends
and
distributions
at
market
price
during
the
period,
and
sale
at
the
market
price
on
the
last
day
of
the
period.
Total
investment
returns
calculated
for
a
period
of
less
than
one
year
are
not
annualized.
(e)
The
net
asset
value
total
return
and
the
market
price
total
return
is
calculated
from
fund
inception.
The
inception
date
is
the
first
date
the
fund
was
available
on
NYSE
Arca,
Inc.
(f)
Annualized.
(g)
Portfolio
turnover
rate
is
not
annualized
for
periods
less
than
one
year,
if
applicable,
and
does
not
include
securities
received
or
delivered
from
processing
creations
or
redemptions.
NOTES
TO
FINANCIAL
STATEMENTS
(Unaudited)
NOTE
1—Organization:
BNY
Mellon
Ultra
Short
Income
ETF (the “fund”) is a
separate
diversified series
of
BNY
Mellon
ETF
Trust
(the
“Trust”),
which is
registered as
a
Massachusetts
business
trust
under
the
Investment
Company
Act
of
1940,
as
amended
(the
“Act”),
as
an
open-ended
management
investment
company.
The
Trust
operates
as
a
series
company
currently
consisting
of
twelve
series,
including
the
fund.
The
investment
objective
of
the
fund
is
to
seek
high
current
income
consistent
with
the
maintenance
of
liquidity
and
low
volatility
of
principal.
BNY
Mellon
ETF
Investment
Adviser,
LLC
(the
“Adviser”),
a
wholly-owned
subsidiary
of
The
Bank
of
New
York
Mellon
Corporation
(“BNY”),
serves
as
the
fund’s
investment
adviser. Dreyfus,
a
division
of
Mellon
Investments
Corporation (the
“Sub-Adviser”),
an
indirect wholly-owned
subsidiary
of
BNY
and
an
affiliate
of
the
Adviser,
serves
as
the
fund’s
sub-adviser.
The
Bank
of
New
York
Mellon,
a
subsidiary
of
BNY
and
an
affiliate
of
the
Adviser,
serves
as
administrator,
custodian
and
transfer
agent
with
the
Trust.
BNY
Mellon
Securities
Corporation
(the
“Distributor”),
a wholly-owned
subsidiary
of
the
Adviser,
is
the
distributor
of
the
fund’s
shares.
The
shares
of
the
fund
are
referred
to
herein
as
“Shares”
or
“Fund
Shares.”
Fund
Shares
are
listed
and
traded
on
NYSE
Arca,
Inc..
The
market
price
of
each
Share
may
differ
to
some
degree
from
the
fund’s
net
asset
value
(“NAV”).
Unlike
conventional
mutual
funds,
the
fund
issues
and
redeems
Shares
on
a
continuous
basis,
at
NAV,
only
in
a
large
specified
number
of
Shares,
each
called
a
“Creation
Unit”.
Creation
Units
are
issued
and
redeemed
principally
in
exchange
for
the
deposit
or
delivery
of
a
basket
of
securities.
Except
when
aggregated
in
Creation
Units
by
Authorized
Participants,
the
Shares
are
not
individually
redeemable
securities
of
the
fund.
Individual
Fund
Shares
may
only
be
purchased
and
sold
on
the
NYSE
Arca,
Inc.,
other
national
securities
exchanges,
electronic
crossing
networks
and
other
alternative
trading
systems
through
your
broker-dealer
at
market
prices.
Because
Fund
Shares
trade
at
market
prices
rather
than
at
NAV,
Fund
Shares
may
trade
at
a
price
greater
than
NAV
(premium)
or
less
than
NAV
(discount).
When
buying
or
selling
Shares
in
the
secondary
market,
you
may
incur
costs
attributable
to
the
difference
between
the
highest
price
a
buyer
is
willing
to
pay
to
purchase
Shares
of
the
fund
(bid)
and
the
lowest
price
a
seller
is
willing
to
accept
for
Shares
of
the
fund
(ask).
NOTE
2—Significant
Accounting
Policies:
The
Financial
Accounting
Standards
Board
(“FASB”)
Accounting
Standards
Codification
(“ASC”)
is
the
exclusive
reference
of
authoritative
U.S.
generally
accepted
accounting
principles
(“GAAP”)
recognized
by
the
FASB
to
be
applied
by
nongovernmental
entities.
Rules
and
interpretive
releases
of
the
SEC
under
authority
of
federal
laws
are
also
sources
of
authoritative
GAAP
for
SEC
registrants. The
fund
is an
investment
company
and
applies
the
accounting
and
reporting
guidance
of
the
FASB
ASC
Topic
946
Financial
Services-Investment
Companies. The
fund’s
financial
statements
are
prepared
in
accordance
with
GAAP,
which
may
require
the
use
of
management
estimates
and
assumptions.
Actual
results
could
differ
from
those
estimates.
The
Trust
enters
into
contracts
that
contain
a
variety
of
indemnifications.
The
fund’s
maximum
exposure
under
these
arrangements
is
unknown.
The
fund
does
not
anticipate
recognizing
any
loss
related
to
these
arrangements.
(a)
Portfolio
valuation:
The
fair
value
of
a
financial
instrument
is
the
amount
that
would
be
received
to
sell
an
asset
or
paid
to
transfer
a
liability
in
an
orderly
transaction
between
market
participants
at
the
measurement
date
(i.e.,
the
exit
price).
GAAP
establishes
a
fair
value
hierarchy
that
prioritizes
the
inputs
of
valuation
techniques
used
to
measure
fair
value.
This
hierarchy
gives
the
highest
priority
to
unadjusted
quoted
prices
in
active
markets
for
identical
assets
or
liabilities
(Level
1
measurements)
and
the
lowest
priority
to
unobservable
inputs
(Level
3
measurements).
Additionally,
GAAP
provides
guidance
on
determining
whether
the
volume
and
activity
in
a
market
has
decreased
significantly
and
whether
such
a
decrease
in
activity
results
in
transactions
that
are
not
orderly.
GAAP
requires
enhanced
disclosures
around
valuation
inputs
and
techniques
used
during
annual
and
interim
periods.
Various
inputs
are
used
in
determining
the
value
of
the
fund’s
investments
relating
to
fair
value
measurements.
These
inputs
are
summarized
in
the
three
broad
levels
listed
below:
Level
1
—
unadjusted
quoted
prices
in
active
markets
for
identical
investments.
Level
2
—
other
significant
observable
inputs
(including
quoted
prices
for
similar investments,
interest
rates,
prepayment
speeds,
credit
risk,
etc.).
Level
3
—
significant
unobservable
inputs
(including
the
fund’s
own
assumptions
in
determining
the
fair
value
of
investments).
The
inputs
or
methodology
used
for
valuing
securities
are
not
necessarily
an
indication
of
the
risk
associated
with
investing
in
those
securities.
Changes
in
valuation
techniques
may
result
in
transfers
in
or
out
of
an
assigned
level
within
the
disclosure
hierarchy.
Valuation
techniques
used
to
value
the
fund’s
investments
are
as
follows:
Registered
investment
companies
that
are
not
traded
on
an
exchange
are
valued
at
their
net
asset
value
and
are
generally
categorized
within
Level 1
of
the
fair
value
hierarchy.
NOTES
TO
FINANCIAL
STATEMENTS
(Unaudited)
(continued)
The
Trust’s Board
of
Trustees
(the
“Board”)
has
designated
the
Adviser
as
the
fund’s
valuation
designee
to
make
all
fair
value
determinations
with
respect
to
the
fund’s
portfolio
of
investments,
subject
to
the
Board’s
oversight
and
pursuant
to
Rule
2a-5
under
the
Act.
Investments
in
debt
securities
excluding
short-term
investments
(other
than
U.S.
Treasury
Bills)
are
valued
each
business
day
by
one
or
more
independent
pricing
services
(each,
a
“Service”)
approved
by the Board.
Investments
for
which
quoted
bid
prices
are
readily
available
and
are
representative
of
the
bid
side
of
the
market
in
the
judgment
of
a
Service
are
valued
at
the
mean
between
the
quoted
bid
prices
(as
obtained
by
a
Service
from
dealers
in
such
securities)
and
asked
prices
(as
calculated
by
a
Service
based
upon
its
evaluation
of
the
market
for
such
securities).
Securities
are
valued
as
determined
by
a
Service,
based
on
methods
which
include
consideration
of
the
following:
yields
or
prices
of
securities
of
comparable
quality,
coupon,
maturity
and
type;
indications
as
to
values
from
dealers;
and
general
market
conditions.
Each
Service
and
independent
valuation
firm
is
engaged
under
the
general
oversight
of
the
Board.
Overnight
and
certain
other
short-term
debt
instruments
(excluding
U.S.
Treasury
Bills)
will
be
valued
by
the
amortized
cost
method,
which
approximates
value,
unless
a
Service
provides
a
valuation
for
such
security
or,
in
the
opinion
of
the
Board
or
a
committee
or
other
persons
designated
by
the
Board,
the
amortized
cost
method
would
not
represent
fair
value. These
securities
are
generally
categorized
within
Level
2
of
the
fair
value
hierarchy.
When
market
quotations
or
official
closing
prices
are
not
readily
available,
or
are
determined
not
to
reflect
fair
value
accurately,
they are
valued
at
fair
value
as
determined
in
good
faith
based
on
procedures
approved
by
the
Board.
Fair
value
of
investments
may
be
determined
by
valuation
designee
using
such
information
as
it
deems
appropriate
under
the
circumstances.
Certain
factors
may
be
considered
when
fair
valuing
investments
such
as:
fundamental
analytical
data,
the
nature
and
duration
of
restrictions
on
disposition,
an
evaluation
of
the
forces
that
influence
the
market
in
which
the
securities
are
purchased
and
sold,
and
public
trading
in
similar
securities
of
the
issuer
or
comparable
issuers.
These
securities
are
either
categorized
within
Level
2
or
3
of
the
fair
value
hierarchy
depending
on
the
relevant
inputs
used.
For
securities
where
observable
inputs
are
limited,
assumptions
about
market
activity
and
risk
are
used
and
are
generally
categorized
within
Level
3
of
the
fair
value
hierarchy.
The
table
below
summarizes
the
inputs
used
as
of December
31,
2024
in
valuing
the
fund’s
investments:
Fair
Value
Measurements
(b) Securities
transactions
and
investment
income:
Securities
transactions
are
recorded
on
a
trade
date
basis.
Realized
gains
and
losses
from
securities
transactions
are
recorded
on
the
identified
cost
basis.
Dividend
income
is
recognized
on
the
ex-dividend
date
and
interest
income,
including,
where
applicable,
accretion
of
discount
and
amortization
of
premium
on
investments,
is
recognized
on
the
accrual
basis.
(c)
Affiliated
issuers:
Investments
in
other
investment
companies
advised
by
the
Adviser
or
its
affiliates are
defined
as
“affiliated”
under
the
Act.
(d)
Market
Risk:
The
value
of
the
securities
in
which
the
fund
invests
may
be
affected
by
political,
regulatory,
economic
and
social
developments,
and
developments
that
impact
specific
economic
sectors,
industries
or
segments
of
the
market.
In
addition,
turbulence
in
financial
markets
and
reduced
liquidity
in
equity,
credit
and/or
fixed
income
markets
may
negatively
affect
many
issuers,
which
could
adversely
affect
the
fund.
Global
economies
and
financial
markets
are
becoming
increasingly
interconnected,
and
conditions
and
events
in
one
country,
region
or
financial
market
may
adversely
impact
issuers
in
a
different
country,
region
or
financial
market.
These
risks
may
be
magnified
if
certain
events
or
developments
adversely
interrupt
the
global
supply
chain;
in
these
and
other
circumstances,
such
risks
might
affect
companies
world-wide.
Level
1
-
Unadjusted
Quoted
Prices
Level
2
-
Other
Significant
Observable
Inputs
Level
3
-
Significant
Unobservable
Inputs
Total
Assets
($)
Investments
In
Securities:
†
Asset-Backed
Securities
—
10,020
—
10,020
Commercial
Paper
—
52,601,189
—
52,601,189
Corporate
Bonds
—
40,731,091
—
40,731,091
U.S.
Treasury
Government
Securities
—
4,095,630
—
4,095,630
Investment
Companies
103,146,676
—
—
103,146,676
†
See
Statement
of
Investments
for
additional
detailed
categorizations,
if
any.
Fixed-Income
Market
Risk:
The
market
value
of
a
fixed-income
security
may
decline
due
to
general
market
conditions
that
are
not
specifically
related
to
a
particular
company,
such
as
real
or
perceived
adverse
economic
conditions,
changes
in
the
outlook
for
corporate
earnings,
changes
in
interest
or
currency
rates
or
adverse
investor
sentiment
generally.
The
fixed-income
securities
market
can
be
susceptible
to
increases
in
volatility
and
decreases
in
liquidity.
Liquidity
can
decline
unpredictably
in
response
to
overall
economic
conditions
or
credit
tightening.
Increases
in
volatility
and
decreases
in
liquidity
may
be
caused
by
a
rise
in
interest
rates
(or
the
expectation
of
a
rise
in
interest
rates).
An
unexpected
increase
in
redemption
requests,
including
requests
from
Authorized
Participants
who
may
own
a
significant
percentage
of
the
fund’s
shares,
which
may
be
triggered
by
market
turmoil
or
an
increase
in
interest
rates,
could
cause
the
fund
to
sell
its
holdings
at
a
loss
or
at
undesirable
prices
and
adversely
affect
the
fund’s
share
price
and
increase
the
fund’s
liquidity
risk,
fund
expenses
and/or
taxable
distributions.
Federal
Reserve
policy
in
response
to
market
conditions,
including
with
respect
to
interest
rates,
may
adversely
affect
the
value,
volatility
and
liquidity
of
dividend
and
interest
paying
securities.
Policy
and
legislative
changes
worldwide
are
affecting
many
aspects
of
financial
regulation.
The
impact
of
these
changes
on
the
markets
and
the
practical
implications
for
market
participants
may
not
be
fully
known
for
some
time.
Commercial
Paper
Risk:
Commercial
paper
is
a
short-term
obligation
with
a
maturity
generally
ranging
from one
to
270
days
and
is
issued
by
U.S.
or
foreign
companies
or
other
entities
in
order
to
finance
their
current
operations.
Such
investments
are
unsecured
and
usually
discounted
from
their
value
at
maturity.
The
value
of
commercial
paper
may
be
affected
by
changes
in
the
credit
rating
or
financial
condition
of
the
issuing
entities
and
will
tend
to
fall
when
interest
rates
rise
and
rise
when
interest
rates
fall.
Authorized
Participants,
Market
Makers
and
Liquidity
Providers
Risk:
The
fund
has
a
limited
number
of
financial
institutions
that
may
act
as
Authorized
Participants,
which
are
responsible
for
the
creation
and
redemption
activity
for
the
fund.
In
addition,
there
may
be
a
limited
number
of
market
makers
and/or
liquidity
providers
in
the
marketplace.
To
the
extent
either
of
the
following
events
occur,
fund
shares
may
trade
at
a
material
discount
to
net
asset
value
and
possibly
face
delisting:
(
i
)
Authorized
Participants
exit
the
business
or
otherwise
become
unable
to
process
creation
and/or
redemption
orders
and
no
other
Authorized
Participants
step
forward
to
perform
these
services,
or
(ii)
market
makers
and/or
liquidity
providers
exit
the
business
or
significantly
reduce
their
business
activities
and
no
other
entities
step
forward
to
perform
their
functions.
(e)
Dividends
and
distributions
to
shareholders:
Dividends
and
distributions
are
recorded
on
the
ex-dividend
date.
Dividends
from
net
investment
income
are
normally
declared
and
paid
on
a
monthly
basis.
Dividends
from
net
realized
capital
gains,
if
any,
are
normally
declared
and
paid
annually,
but
the
fund
may
make
distributions
on
a
more
frequent
basis
to
comply
with
the
distribution
requirements
of
the
Internal
Revenue
Code
of
1986,
as
amended
(the
“Code”).
To
the
extent
that
net
realized
capital
gains
can
be
offset
by
capital
loss
carryovers
of
a
fund,
it
is
the
policy
of
the
fund
not
to
distribute
such
gains.
Income
and
capital
gain
distributions
are
determined
in
accordance
with
income
tax
regulations,
which
may
differ
from
GAAP.
(f)
Federal
income
taxes:
It
is
the
policy
of
the
fund
to
continue to
qualify
as
a
regulated
investment
company,
if
such
qualification
is
in
the
best
interests
of
its
shareholders,
by
complying
with
the
applicable
provisions
of
the
Code,
and
to
make
distributions
of
taxable
income
and
net
realized
capital
gain sufficient
to
relieve
it
from
substantially
all
federal
income
and
excise
taxes.
As
of
and
during
the period
ended December
31,
2024,
the
fund
did
not
have
any
liabilities
for
any
uncertain
tax
positions.
The
fund
recognizes
interest
and
penalties,
if
any,
related
to
uncertain
tax
positions
as
income
tax
expense
in
the
Statement
of
Operations.
During
the period
ended December
31,
2024,
the
fund
did
not
incur
any
interest
or
penalties.
Each
tax
year
in
the
three-year
period
ended June
30,
2024
remains
subject
to
examination
by
the
Internal
Revenue
Service
and
state
taxing
authorities.
The
fund
is
permitted
to
carry
forward
capital
losses
for
an
unlimited
period.
Furthermore,
capital
loss
carryovers
retain
their
character
as
either
short-term
or
long-term
capital
losses.
The
fund
has
an
unused
capital
loss
carryover
of
$324,269
available
for
federal
income
tax
purposes
to
be
applied
against
future
net
realized
capital
gains,
if
any,
realized
subsequent
to
June
30,
2024.
The
fund
had
$119,472
of
short-term
capital
losses
and
$204,797
of
long-term
capital
losses
which
can
be
carried
forward
for
an
unlimited
period.
The
tax
character
of
distributions
paid
to
shareholders
during
the
fiscal
year
ended
June
30,
2024
were
as
follows:
ordinary
income
$2,459,830.
The
tax
character
of
current
year
distributions
will
be
determined
at
the
end
of
the
current
fiscal
year.
NOTE
3—Management
Fee,
Sub-Advisory
Fee
and
Other
Transactions
with
Affiliates:
(a)
Pursuant
to
a
management
agreement
with
the
Adviser,
the
management
fee
is computed
at
an
annual
rate of
0.12%
of
the
value
of
the
fund’s
average
daily
net
assets
and
is
payable
monthly.
The
fund’s
management
agreement
provides
that
the
Adviser
pays
substantially
all
expenses
of
the
fund,
except
for
the
management
fees,
payments
under
the
fund’s
12b-1
plan
(if
any),
interest
expenses,
taxes,
acquired
NOTES
TO
FINANCIAL
STATEMENTS
(Unaudited)
(continued)
fund
fees
and
expenses,
brokerage
commissions,
costs
of
holding
shareholder
meetings,
fees
and
expenses
associated
with
the
fund’s
securities
lending
program,
and
litigation
and
potential
litigation
and
other
extraordinary
expenses
not
incurred
in
the
ordinary
course
of
the
fund’s
business.
The
Adviser
may
from
time
to
time
voluntarily
waive
and/or
reimburse
fees
or
expenses
in
order
to
limit
total
annual
fund
operating
expenses.
Any
such
voluntary
waiver
or
reimbursement
may
be
eliminated
by
the
Adviser
at
any
time.
During
the
period
ended
December
31,
2024,
there
was
no
reduction
in
expenses
pursuant
to
the
undertaking.
Pursuant
to
a
sub-investment
advisory
agreement
between
the
Adviser
and
the
Sub-Adviser,
the
Sub-Adviser
serves
as
the
fund’s
sub-
adviser
responsible
for
the
day-to-day
management
of
the
fund’s
portfolio.
The
Adviser
pays
the
Sub-Adviser
a
monthly
fee
at
an
annual
percentage
of
the
value
of
the
fund’s
average
daily
net
assets.
The
Adviser
has
obtained
an
exemptive
order
from
the
SEC
(the
“Order”),
upon
which
the
fund
may
rely,
to
use
a
manager
of
managers
approach
that
permits
the
Adviser,
subject
to
certain
conditions
and
approval
by
the
Board,
to
enter
into
and
materially
amend
sub-investment
advisory
agreements
with
one
or
more
sub-advisers
who
are
either
unaffiliated
or
affiliated
with
the
Adviser
without
obtaining
shareholder
approval.
The
Order
also
relieves
the
fund
from
disclosing
the
sub-advisory
fee
paid
by
the
Adviser
to
a
Sub-Adviser
in
documents
filed
with
the
SEC
and
provided
to
shareholders.
In
addition,
pursuant
to
the
Order,
it
is
not
necessary
to
disclose
the
sub-advisory
fee
payable
by
the
Adviser
separately
to
a
Sub-Adviser
that
is
a
wholly-owned
subsidiary
(as
defined
in
the
1940
Act)
of
BNY
in
documents
filed
with
the
SEC
and
provided
to
shareholders;
such
fees
are
to
be
aggregated
with
fees
payable
to
the
Adviser.
The
Adviser
has
ultimate
responsibility
(subject
to
oversight
by
the
Board)
to
supervise
any
Sub-Adviser
and
recommend
the
hiring,
termination,
and
replacement
of
any
Sub-Adviser
to
the
Board.
Pursuant
to
a
sub-investment
advisory
agreement
between
the
Adviser
and
the
Sub-Adviser,
the
Adviser
pays
the
Sub-Adviser
a
monthly
fee
at
an
annual
rate
of
0.06%
of
the
value
of
the
fund’s
average
daily
net
assets.
The
Adviser,
and
not
the
fund,
pays
the
Sub-Adviser
fee
rate.
(b)
The
fund
has
an
arrangement
with
The
Bank
of
New
York
Mellon
(the
“Custodian”),
a
subsidiary
of
BNY
and
an
affiliate
of
the
Adviser, whereby
the
fund
will
receive
interest
income
or
be
charged
overdraft
fees
when
cash
balances
are
maintained.
For
financial
reporting
purposes,
the
fund
includes
this
interest
income
and
overdraft
fees,
if
any,
as
interest
income
in
the
Statement
of
Operations.
The
components
of
“Due
to
BNY
Mellon
ETF Investment
Adviser,
LLC”
in
the
Statement
of
Assets
and
Liabilities
consist
of:
Management
fee
of $9,193.
(c)
Each
Board
member
serves
as
a
Board
member
of
each
fund
within
the
Trust.
The
Board
members
are
not
compensated
directly
by
the
fund.
The
Board
members
are
paid
by
the
Adviser
from
the
unitary
management
fees
paid
to
the
Adviser
by
the
funds
within
the
Trust,
including
the
fund.
NOTE
4—Securities
Transactions:
The
aggregate
amount
of
purchases
and
sales
(including
paydowns)
of
investment
securities,
excluding
short-term
securities
and
in-kind
transactions,
if
any,
during
the
period
ended
December
31,
2024, amounted
to $12,733,218
and
$3,702,377,
respectively.
At December
31,
2024,
accumulated
net
unrealized
appreciation on
investments
was
$145,397,
consisting
of
gross
appreciation
of
$178,031
and
gross
depreciation
of
$32,634.
At
December
31,
2024,
the
cost
of
investments
for
federal
income
tax
purposes
was
substantially
the
same
as
the
cost
for
financial
reporting
purposes
(see
the
Statement
of
Investments).
NOTE
5—Shareholder
Transactions:
The
fund
issues
and
redeems
its
shares
on
a
continuous
basis,
at
NAV,
to
certain
institutional
investors
known
as
“Authorized
Participants”
(typically
market
makers
or
other
broker-dealers)
only
in
a
large
specified
number
of
shares
called
a
Creation
Unit.
Except
when
aggregated
in
Creation
Units,
shares
of
the
fund
are
not
redeemable.
The
value
of
the
fund
is
determined
once
each
business
day.
The
Creation
Unit
size
for the
fund
may
change.
Authorized
Participants
will
be
notified
of
such
change.
Creation
Unit
transactions
may
be
made
in-kind,
for
cash,
or
for
a
combination
of
securities
and
cash.
The
principal
consideration
for
creations
and
redemptions
for
the
fund
is
in-kind,
although
this
may
be
revised
at
any
time
without
notice.
The
Trust
issues
and
sells
shares
of
the
fund
only:
in
Creation
Units
on
a
continuous
basis
through
the
Distributor,
without
a
sales
load,
at
their
NAV
per
share
determined
after
receipt
of
an
order,
on
any
Business
Day,
in
proper
form
pursuant
to
the
terms
of
the
Authorized
Participant
Agreement.
Transactions
in
capital
shares
for
the
fund
are
disclosed
in
detail
in
the
Statement
of
Changes
in
Net
Assets.
The
consideration
for
the
purchase
of
Creation
Units
of the
fund
may
consist
of
the
in-kind
deposit
of
a
designated
portfolio
of
securities
and
a
specified
amount
of
cash.
Investors
purchasing
and
redeeming
Creation
Units
may
pay
a
purchase
transaction
fee
and
a
redemption
transaction
fee
directly
to
the
Trust
and/or
custodian
to
offset
transfer
and
other
transaction
costs
associated
with
the
issuance
and
redemption
of
Creation
Units,
including
Creation
Units
for
cash.
The
Adviser
or
its
affiliates
(the
“Selling
Shareholder”)
may
purchase
Creation
Units
through
a
broker-dealer
to
“seed”
(in
whole
or
in
part)
funds
as
they
are
launched
or
may
purchase shares
from
broker-dealers
or
other
investors
that
have
previously
provided
“seed”
for
funds
when
they
were
launched
or
otherwise
in
secondary
market
transactions.
Because
the
Selling
Shareholder
may
be
deemed
an
affiliate
of
such
funds,
the
fund shares
are
being
registered
to
permit
the
resale
of
these
shares
from
time
to
time
after
purchase.
The
fund
will
not
receive
any
of
the
proceeds
from
resale
by
the
Selling
Shareholders
of
these
fund
shares. An
additional
variable
fee
may
be
charged
for
certain
transactions.
Such
variable
charges,
if
any,
are
included
in
“Transaction
fees”
on
the
Statement
of
Changes
in
Net
Assets.
Seed
Capital:
As
of
December
31,
2024,
MBC
Investments
Corporation,
a
wholly-owned
subsidiary
of
BNY,
held
499,001
shares
of
the
fund.
In-kind
Redemptions:
For
financial
reporting
purposes,
in-kind
redemptions
are
treated
as
sales
of
securities
resulting
in
realized
capital
gains
or
losses
to
the
fund.
Because
such
gains
or
losses
are
not
taxable
to
the
fund
and
are
not
distributed
to
existing
fund
shareholders,
the
gains
or
losses
are
reclassified
from
accumulated
net
realized
gain
(loss)
to
paid-in
capital
at
the
end
of
the
fund’s
tax
year.
These
reclassifications
have
no
effect
on
net
assets
or
net
asset
value
per
share.
During
the
period
ended
December
31,
2024
,
the
fund
had
no
in-kind
transactions
.
Item
8.
Changes
in
and
Disagreements
with
Accountants
for
Open-End
Management
Investment
Companies
(Unaudited)
Item
9.
Proxy
Disclosures
for
Open-End
Management
Investment
Companies
(Unaudited)
Item
10.
Remuneration
Paid
to
Directors,
Officers,
and
Others
of
Open-End
Investment
Companies
(Unaudited)
Each
Board
member
serves
as
a
Board
member
of
each
fund
within
the
Trust
and
BNY
Mellon
ETF
Trust
II.
The
Board
members
are
not
compensated
directly
by
the
fund.
The
Board
members
are
paid
by
the
Adviser
from
the
unitary
management
fees
paid
to
the
Adviser
by
the
funds
within
the
Trust
and
BNY
Mellon
ETF
Trust
II,
including
the
fund.
Item
11.
Statement
Regarding
Basis
for
Approval
of
Investment
Advisory
Contracts
(Unaudited)
©
2025
BNY
Mellon
Securities
Corporation
Item 12. Disclosure of Proxy Voting Policies and Procedures for Closed-End Management Investment Companies.
Not applicable.
Item 13. Portfolio Managers of Closed-End Management Investment Companies.
Not applicable.
Item 14. Purchases of Equity Securities by Closed-End Management Investment Company and Affiliated Purchasers.
Not applicable.
Item 15. Submission of Matters to a Vote of Security Holders.
There have been no material changes to the procedures by which the shareholders may recommend nominees to the Registrant’s Board of Trustees, where those changes were implemented after the Registrant last provided disclosure in response to the requirements of Item 407(c)(2)(iv) of Regulation S-K (17 CFR 229.407) (as required by Item 22(b)(15) of Schedule 14A (17 CFR 240.14a-101)), or this Item.
Item 16. Controls and Procedures.
(a) The Registrant’s principal executive and principal financial officers, or persons performing similar functions, have concluded that the Registrant’s disclosure controls and procedures (as defined in Rule 30a-3(c) under the Investment Company Act of 1940, as amended (the “1940 Act”) (17 CFR 270.30a-3(c))) are effective, as of a date within 90 days of the filing date of the report that includes the disclosure required by this paragraph, based on their evaluation of these controls and procedures required by Rule 30a-3(b) under the 1940 Act (17 CFR 270.30a-3(b)) and Rules 13a-15(b) or 15d-15(b) under the Securities Exchange Act of 1934, as amended (17 CFR 240.13a-15(b) or 240.15d-15(b)).
(b) There were no changes in the Registrant’s internal control over financial reporting (as defined in Rule 30a-3(d) under the 1940 Act (17 CFR 270.30a-3(d))) that occurred during the period covered by this report that has materially affected, or is reasonably likely to materially affect, the Registrant’s internal control over financial reporting.
Item 17. Disclosure of Securities Lending Activities for Closed-End Management Investment Companies.
Not applicable.
Item 18. Recovery of Erroneously Awarded Compensation.
Not Applicable.
Item 19. Exhibits.
(a)(1) Not applicable.
(a)(2) Not applicable.
(a)(4) Not applicable.
(a)(5) Not applicable.
SIGNATURES
Pursuant to the requirements of the Securities Exchange Act of 1934 and the Investment Company Act of 1940, the registrant has duly caused this report to be signed on its behalf by the undersigned, thereunto duly authorized.
(Registrant) BNY Mellon ETF Trust
By (Signature and Title) * /s/ David J. DiPetrillo
David J. DiPetrillo, President
(Principal Executive Officer)
Date 2/26/2025
Pursuant to the requirements of the Securities Exchange Act of 1934 and the Investment Company Act of 1940, this report has been signed below by the following persons on behalf of the registrant and in the capacities and on the dates indicated.
By (Signature and Title) * /s/ David J. DiPetrillo
David J. DiPetrillo, President
(Principal Executive Officer)
Date 2/26/2025
By (Signature and Title) * /s/ James Windels
James Windels, Treasurer
(Principal Financial and Accounting Officer)
Date 2/26/2025
* Print the name and title of each signing officer under his or her signature.