![]() M/A-COM Technology Solutions (MTSI) November 2013 Exhibit 99.1 |
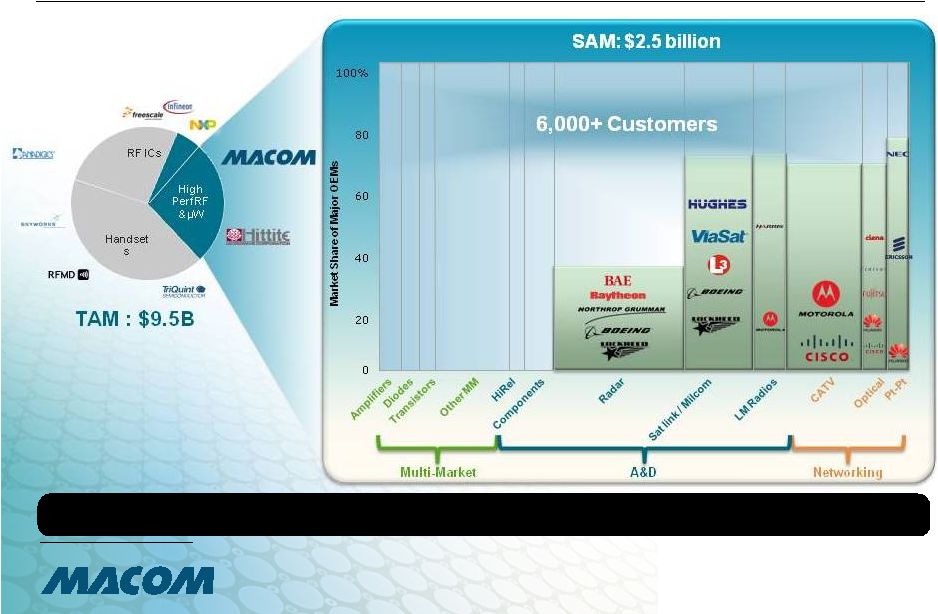
![]() 2 Forward-Looking Statement Safe Harbor and Use of Non-GAAP Financial Measures This presentation contains forward-looking statements based on management’s beliefs and assumptions and on information currently available to our management. Forward-looking statements include, among others, statements concerning the Mindspeed transaction, including those regarding the potential date of closing of the acquisition, and any potential benefits and synergies, strategic plans, divestitures, restructuring, cost savings, accretion, and financial and business expectations associated with the acquisition, as well as any other statements regarding our plans, beliefs or expectations regarding the transaction or its future business or financial results. Forward-looking statements include all statements that are not historical facts and generally may be identified by terms such as "anticipates," "believes," "could," "estimates," "expects," "intends," "may," "plans," "potential,” "predicts," "projects," "seeks," "should," "will," "would" or similar expressions and the negatives of those terms. Our forward-looking statements are subject to assumptions, risks and uncertainties, and are not guarantees of future results. Actual results may differ materially from the outcomes stated or implied by our forward-looking statements based on any assumptions and risk factors we may mention today or otherwise, including the factors set forth in the press release we issued November 5, 2013 related to the Mindspeed acquisition, our Quarterly Report on Form 10-Q filed with the SEC on August 5, 2013, and other information we file with the SEC, which are publicly-available on the SEC's EDGAR database located at www.sec.gov. We undertake no obligation to update these statements at a later date. All projections in this presentation are made as of November 5, 2013 only and are not being reaffirmed hereby. MACOM undertakes no obligation to update them at any future date. We make references in this presentation to certain financial information calculated on a basis other than in accordance with accounting principles generally accepted in the United States (GAAP). These non-GAAP measures are provided as additional insight into on-going financial performance and to enhance the user’s overall understanding of the potential impact of the Mindspeed acquisition. These non- GAAP measures are provided in addition to, and not as a substitute for, or superior to, measures of financial performance prepared in accordance with GAAP. See reconciliation of MACOM results to the nearest GAAP measure in the appendix. We are unable to provide a quantitative reconciliation for certain non-GAAP measures presented herein to the most directly comparable GAAP measure because we cannot reliably forecast acquisition, integration and other costs related to the Mindspeed acquisition, which are difficult to predict and estimate. We do not provide a reconciliation for Mindspeed’s historical non-GAAP information presented. Our fiscal year end is the Friday closest to September 30th. Fiscal year 2014 will be a 53-week year and the first quarter of fiscal year 2014 will have 14 weeks. |
![]() 3 Tender Offer Information This communication is for informational purposes only and is not an offer to purchase any shares of Mindspeed or a solicitation of an offer to sell securities. MACOM and Micro Merger Sub, Inc. have filed a tender offer statement on Schedule TO, including an offer to purchase, a letter of transmittal and related documents, with the United States Securities and Exchange Commission (the “SEC”) and Mindspeed has filed a solicitation/recommendation statement on Schedule 14D-9 with the SEC. The tender offer statement (including an offer to purchase, a related letter of transmittal and other offer documents) and the solicitation/recommendation statement contains important information that should be read carefully before any decision is made with respect to the tender offer. Such materials are available to Mindspeed stockholders at no expense to them by written request to Georgeson Inc., 480 Washington Blvd., 26th Floor, Jersey City, NJ 07310 or by calling (866) 295-3782 (toll-free). In addition, such materials (and all other offer documents filed with the SEC) are available at no charge on the SEC’s website at www.sec.gov. |
![]() 4 MACOM is a leading supplier of high performance RF, µW, and mmW products Company Snapshot Strong catalog business with 2,700+ products Advanced RF design capabilities solving difficult and complex challenges Established customer base of 6,000+ customers $319mm of FY13 revenue Advanced RF Design Diverse Customer Base Financial Scale and Stability Strong Product Portfolio Broad end- Markets / Applications Global Presence RF, µ W and mmW franchise built on 60+ years of innovation |
![]() 5 Leader in high performance RF, µW and mmW analog semiconductors Broad catalog business of long lifecycle products serving large and diverse end markets Focused R&D investments in high-growth, high-margin applications Growth and richer product mix driving gross and operating margin expansion Scalable “fab-lite” manufacturing model with differentiated domestic manufacturing Strong balance sheet, cash flow and return on capital Announced definitive agreement to acquire Mindspeed Technologies, Inc. (NASDAQ: MSPD), with an anticipated closing in December, 2013 Company Highlights |
![]() 6 Leader in High Performance RF, µW and mmW Source: MACOM estimates based on internal and external (WSTS, ABI Research, Strategy Analytics, Engalco, Ovum, Infonetics, EJL, NSR, Yole) sources Broad catalog portfolio and breadth of channel |
![]() 7 Broad Catalog of Specialized Products Integrated Circuits Power Pallets & Transistors Passive Components Diodes, Switch Limiters, Switches Active Components Multi-Chip Modules 1 MHz Radio Frequency 6 GHz Microwave 20 GHz 110 GHz Millimeter Wave Industrial Broad- band Wireless Data, Toll Tags GPS, Avionic, Radar Cellular DVB, Satellite Radio WiMAX, WLAN, Access Points Test Equipment Microwave Radio Links DBS, Industrial Imaging Satellite Payload Communications Industrial VSAT Millimeter Wave Radio Links UAV Datalink SATCOM Terminal Communication Tracking and Jamming Adaptive Cruise Control Scientific Imaging and Measurement Radar Communications Broadcast • Sticky, value-added technologies • Advanced RF, µW and mmW engineering competencies • Long product lifecycles Diverse Array of Products and Form Factors Serving a Broad Frequency Spectrum |
![]() 8 Blended Organic Growth Model Targets 2-3x Market CAGR Source: MACOM estimates based on internal and external (WSTS, ABI Research, Strategy Analytics, Engalco, Ovum, Infonetics, EJL, NSR, Yole, Moody’s, Dell ‘Oro) sources |
![]() 9 Investment Focused on High Growth, High Margin (1) Products R&D focused on high growth opportunities with disruptive technologies M&A delivering high growth opportunities based on SiGe and GaN technologies New products targeting GM ranging from low 60% to mid 80% – many exceed 70% New products target 70+% gross margins Focused on Selected High-Growth Opportunities Deep Commitment to Technology Leadership Source: MACOM estimates based on internal and external (ABI Research, Strategy Analytics, Engalco, NSR, Dell’Oro) sources (1) Gross margin is on non-GAAP basis. |
![]() ![]() ![]() 10 Large and Diverse End Markets Note: Percentage of revenue for FY Q4’13. Servicing transition from GaAs to GaN technologies Demand for improved situational awareness on the modern battlefield A&D – 28% Multi-market – 21% Advanced driver assistance for navigation, fuel efficiency and reduced emissions Automotive – 25% Driven by cloud computing, streaming video and mobile Internet devices Networks – 26% |
![]() ![]() ![]() ![]() ![]() ![]() ![]() ![]() 11 Mindspeed Acquisition: Strategic Rationale Aligns with core growth strategy in networking and 100G optical markets Aligns with core growth strategy in networking and 100G optical markets Consistent with MACOM’s high performance analog business model – high margins, long lifecycles and sticky customer relationships Consistent with MACOM’s high performance analog business model – high margins, long lifecycles and sticky customer relationships Complements MACOM’s strong US presence by adding a broad customer footprint and sales channel in Asia Pacific Complements MACOM’s strong US presence by adding a broad customer footprint and sales channel in Asia Pacific Expands addressable market with high-growth, high- margin SiGe products and technology Expands addressable market with high-growth, high- margin SiGe products and technology 1 2 3 4 Expected to be immediately accretive to gross margin and EPS with strong operational synergies Expected to be immediately accretive to gross margin and EPS with strong operational synergies 5 + |
![]() ![]() ![]() 12 Proposed Mindspeed Acquisition Will Add Enterprise Demand for low latency and high bandwidth for eCommerce and the Internet of Things Enterprise |
![]() 13 Enterprise – 100G Optical PRODUCTS & TECHNOLOGY KEY CUSTOMERS APPLICATIONS 100G IN THE NETWORK Source: MACOM estimates based on internal and external (Infonetics, Dell’Oro) sources |
![]() 14 100G Optical – 10 Year Cycle of Innovation Products Device Technology Applications Optomai and Mindspeed acquisitions deliver 30-year heritage of innovation |
![]() 15 Mindspeed’s SiGe Will Expand MACOM Technology Base |
![]() 16 0 2,000 3,000 $3,600M 2012 GaAs GaN LDMOS SOI SiGe SiGe Mindspeed 2017 GaAs GaN LDMOS SOI SiGe SiGe Mindspeed The SiGe Opportunity Space Served Available Market by Technology Mindspeed will deliver technology leadership Will expand SAM in core RF and µw markets SiGe expands SAM in two directions Source: MACOM estimates based on internal & external (ABI Research, Strategy Analytics) sources SiGe RF IC ~850 transistors (octal) GaAs MMIC ~60 transistors Crosspoint switches 2x2 to 288x288 3.2 Gbps to 12.8+ Gbps |
![]() 17 GaN as a Market Dislocator Gallium Nitride is a wide bandgap semiconductor whose critical electric field is 10x that of GaAs and 20x that of Silicon enabling unprecedented power and bandwidth capability |
![]() ![]() ![]() 18 The GaN Dislocation 0 2,000 2,500 $3,500M 2012 GaAs GaN LDMOS SiGe SOI 2017 GaAs GaN LDMOS SiGe SOI High Performance RF / µW Market by Technology Copy Exact 0.5µ 0.25µ 0.15µ 90W power transistor in 3x6mm plastic package MACOM drives GaN innovation Industry's First Dual Source Supply Chain GaN growing almost 5x faster than the market Source: MACOM estimates based on internal & external (ABI Research, Strategy Analytics) sources |
![]() 19 Aerospace & Defense – AESA Radar MMICs MPAR Module and Board Transistors Diodes Components X-band AESA RADAR PRODUCTS & TECHNOLOGY KEY CUSTOMERS APPLICATIONS Source: MACOM estimates based on internal and external (Engalco) sources |
![]() 20 AESA Radar – 20 Year Cycle of Innovation Products Device Technology Applications 60-year heritage of radar innovation |
![]() 21 Aerospace & Defense – mmW Satellite Link PRODUCTS & TECHNOLOGY KEY CUSTOMERS APPLICATIONS mmW SATCOM GROWTH Single Chip T/R Module GaN Transistor MELF Diodes Filters Source: MACOM estimates based on internal and external (Engalco,NSR) sources |
![]() 22 mmW Satellite Link – 10 Year Cycle of Innovation Products Device Technology Applications 40-year heritage of satellite link innovation |
![]() 23 Scalable, Fab-lite Manufacturing Strategy |
![]() 24 Mindspeed Will Strengthen our Global Position Note: Geographic revenue based on the quarter ended June 28, 2013 for MACOM and Mindspeed. Mindspeed revenue excludes non-recurring revenue related to sales of intellectual property. |
![]() 25 Experienced and Proven Management Team |
![]() FINANCIAL OVERVIEW |
![]() 27 High-performance analog semiconductor business model • Proprietary products • Long lifecycles • Established customer relationships Strong and cash generative broad catalog business Focused R&D investment in new high-growth, high margin (70+%) products Strong balance sheet, cash flow and return on capital Key Financial Highlights (1) Gross margin is on non-GAAP basis (1) |
![]() 28 1. Revenue for FY13 for MACOM and Mindspeed. Mindspeed revenue excludes wireless business and non-recurring revenue related to sales of intellectual property. 2. Post closing model is based on MACOM’s projections and assumes restructuring and achievement of targeted synergies. 3. Amounts shown under MACOM and Mindspeed are each companies’ reported FY 13 results. Non-GAAP margins. 4. Non-GAAP EPS (fully diluted). Projected Financial Model Post Mindspeed Acquisition (1) ($ in millions / % of revenue) LTM Revenue (3) $319 $132 N/A Gross Margin (3) 45% ~63% 50% – 52% Operating Margin (3) 19% ~18% 23% – 25% Post Closing Model (2) EPS accretion expected to be between $0.15-$0.20 per share in FY 2014 and $0.25-$0.30 per share in FY 2015 (4) |
![]() 29 ($ in millions) MACOM Fiscal 2013 Results & Q1 2014 Guidance 1. Non-GAAP. 2. Q2 actual includes $0.02 EPS related to CY12 tax credits. 3. Guidance is as of November 5, 2013 and not reaffirmed hereby Incremental revenue model targets 60% gross margin(1) contribution REVENUE GROSS MARGIN (1) OPERATING MARGIN (1) EPS (1) |
![]() 30 Margin Expansion Through Growth, Mix Shift and Acquisition(1) 70%+ GM < 70% GM Incremental revenue model targets 60% blended gross margin contribution (1) Non-GAAP. Mindspeed information excludes wireless and communications processors businesses and non recurring sales of intellectual property. |
![]() 31 MACOM Growth vs. Industry and Peers FY2012 - FY2013 High Performance RF and uW Semiconductor Industry High Performance Analog Handset Suppliers Source: Public filings and consensus estimates for FY13 |
![]() 32 Strong Balance Sheet, Cash Flow and Return on Capital $110 million in cash, zero debt and untapped $300 million credit line as of September 27, 2013 Cash Balance (1) Free Cash Flow (2) (% of Rev.) Return on Capital Employed (2) ($ in millions) 1. Balances shown are as of the end of the periods presented, 2. Free Cash Flow and Return on Capital Employed are non-GAAP measures and are defined in the Appendix. |
![]() 33 Capitalization MACOM (1) Mindspeed (1) Post Close Model (2) Cash and cash equivalents $110.4 $35.0 $30.0 Outstanding debt - 57.6 214.1 Net outstanding debt NA $22.6 $184.1 Leverage ratio (2) 2.1x Net leverage ratio (2) 1.8x Model with $214 Million in borrowings against $300 Million Revolver 1) MACOM and Mindspeed amounts as of September 27, 2013. 2) Leverage ratios are non-GAAP measures and defined in the Appendix ($ in millions) |
![]() 34 Summary Continued revenue growth through market share gains and strength of catalog business Accelerating growth through targeted acquisitions and investments in high growth, defensible markets Margin expansion through acquisition, high margin new products and richer product mix Increasing profitability supported by strong balance sheet |
![]() APPENDIX |
![]() 36 Unless otherwise disclosed, non-GAAP financial information excludes amortization of intangibles, share-based and other non-cash compensation expense, restructuring charges, certain litigation costs, changes in the carrying values of liabilities measured at fair value, contingent consideration, other non-cash expenses, earn-out costs, exited leased facility costs and certain income tax and other items. Management does not believe that the excluded items are reflective of underlying performance. The exclusion of these and other similar items from the non-GAAP presentation should not be interpreted as implying that these items are non-recurring, infrequent or unusual. “Free Cash Flow” (FCF), a non-GAAP financial measure, is cash flow from operations reduced by purchases of property and equipment. We use free cash flow, and ratios based on it, to conduct and evaluate our business because, although it is similar to cash flow from operations, we believe it typically will present a more conservative measure of cash flows from operations since purchases of property and equipment, are a necessary component of ongoing operations. Free cash flow has limitations due to the fact that it does not represent the residual cash flow available for discretionary expenditures. For example, free cash flow does not incorporate the portion of payments representing principal reductions of debt, obligations related to capital leases and leases accounted for as financing arrangements, or cash payments for business acquisitions. Therefore, we believe it is important to view free cash flow as a complement to our entire consolidated statements of cash flows. “Return on Capital Employed” (ROCE), also a non-GAAP financial measure, is non-GAAP operating income after tax divided by the sum of i) total assets (excluding cash and cash equivalents) minus ii) current liabilities. We use the ROCE financial performance ratio in order to assess our income generation from the point of view of our shareholders and creditors, who provide us with capital in the forms of equity and debt. We believe that the presentation of ROCE and the various supplemental financial measures involved in its calculation provides useful information to investors because ROCE can be used to determine whether capital invested in the Company yields competitive returns. As with free cash flow, return on capital employed is used in addition to and in conjunction with results presented in accordance with GAAP and should not be relied upon to the exclusion of GAAP financial measures. Debt “Leverage Ratio”, also a non-GAAP financial measure, is presented as outstanding debt divided by adjusted earnings before interest, taxes, depreciation and amortization, all on a non-GAAP basis (EBITDA). When outstanding debt is reduced by available cash and cash equivalents in the calculation, this is referred to as “Net Leverage Ratio”. Non-GAAP Financial Measures |
![]() 37 ($ in thousands) 2010 2011 2012 Fiscal Years December 28, 2012 March 29, 2013 Three Months Ended Note: MTSI’s fiscal year end is the Friday closest to September 30 . Reconciliation of GAAP to Non-GAAP Results th |
![]() 38 Reconciliation of GAAP to Non-GAAP Results Continued Free-Cash Flow (FCF) ($ in thousands) Q3 FY12 Q4 FY12 Q1 FY13 Q2 FY13 Q3 FY13 Q4 FY13 Revenue $77,125 $74,563 $75,014 $77,824 $82,225 $83,655 Net cash from operating activities - GAAP 8,121 9,075 9,042 12,995 13,447 1,317 Contingent consideration payment - - 5,328 - - - Litigation settlement - - - - - 7,250 Purchases of property and equipment (3,846) (2,168) (1,580) (3,117) (1,969) (5,103) Free Cash Flow - non-GAAP $4,275 $6,907 $12,790 $9,878 $11,478 $3,464 FCF as % of Revenue using GAAP measures 5.5% 9.3% 9.9% 12.7% 14.0% -4.5% FCF as % of Revenue using non-GAAP measures 5.5% 9.3% 17.1% 12.7% 14.0% 4.1% |