Table of Contents
Cayman Islands | 7371 | Not Applicable | ||
| (State or Other Jurisdiction of Incorporation or Organization) | (Primary Standard Industrial Classification Code Number) | (I.R.S. Employer Identification Number) |
Leiming Chen, Esq. Simpson Thacher & Bartlett LLP 35th Floor, ICBC Tower 3 Garden Road Central, Hong Kong +852-2514-7600 | Alan Seem, Esq. Shearman & Sterling LLP 12th Floor, East Tower, Twin Towers B-12 Jianguomenwai Dajie Beijing 100022 People’s Republic of China +86-10-5922-8000 |
| Proposed | ||||||||||||
| Maximum | Proposed Maximum | |||||||||||
| Title of Each Class of | Offering Price | Aggregate Offering | Amount of | |||||||||
| Securities to be Registered (1) | Amount to be Registered (2)(3) | per Common Share (3) | Price (3) | Registration Fee | ||||||||
| Common shares, par value $0.0001 per share | 161,690,000 | $0.6842 | $110,628,298 | $7,888 | ||||||||
| (1) | American depositary shares, or ADSs, evidenced by American depositary receipts issuable upon deposit of the common shares registered hereby will be registered under a separate registration statement onForm F-6. Each ADS represents 19 common shares. |
| (2) | Includes (a) common shares represented by ADSs that may be purchased by the underwriters pursuant to their over-allotment option and (b) all common shares represented by ADSs initially offered and sold outside the United States that may be resold from time to time in the United States either as part of the distribution or within 40 days after the later of the effective date of this registration statement and the date the securities are first bona fide offered to the public. |
| (3) | Estimated solely for the purpose of computing the amount of the registration fee pursuant to Rule 457(a) under the Securities Act of 1933, as amended. |
Table of Contents
| The information in this preliminary prospectus is not complete and may be changed. Neither we nor the selling shareholders may sell these securities until the registration statement filed with the Securities and Exchange Commission is declared effective. This preliminary prospectus is not an offer to sell these securities and it is not soliciting any offer to buy these securities in any jurisdiction where the offer or sale is not permitted. |

| Per ADS | Total | |||
| Public offering price | $ | $ | ||
| Underwriting discounts and commissions | $ | $ | ||
| Proceeds, before expenses, to HiSoft International | $ | $ | ||
| Proceeds, before expenses, to selling shareholders | $ | $ |
| Deutsche Bank Securities |
| UBS Investment Bank |
| Citi |
| Cowen and Company | Thomas Weisel Partners LLC |
Table of Contents

Table of Contents
1
Table of Contents
2
Table of Contents
| • | highly developed infrastructure; | |
| • | government support in the form of preferential land availability, incentives for creating entry-level employment and lower taxes; | |
| • | lower labor costs than the U.S., Europe, Japan and other developed countries; | |
| • | geographic and cultural proximity to Japan and Korea; and | |
| • | the desire of corporations to diversify their use of offshore IT outsourcing services to multiple delivery locations and providers. |
3
Table of Contents
| • | dual-shore delivery model; | |
| • | excellence in service quality and security; | |
| • | strong human capital management with a focus on middle management development; | |
| • | highly reputable client base and strong expertise in BFSI; and | |
| • | ability to target key global markets. |
| • | increase business from existing clients; | |
| • | increase business from Chinese domestic clients; | |
| • | expand the scope and depth of our service offerings; | |
| • | capture new clients; | |
| • | continue to pursue strategic acquisitions; and | |
| • | expand delivery capabilities in tier two Chinese cities. |
| • | recessionary conditions in our key client geographies which would likely lead to a reduction in the IT and research and development outsourcing budgets of clients from those geographies; | |
| • | concentration in a limited set of industries and dependence on a limited number of clients; | |
| • | successful execution of our China domestic growth strategy and management of our growth generally; | |
| • | recruitment, training and retention of skilled professionals and middle management; | |
| • | intense competition from other outsourcing companies globally and in China; and | |
| • | successful integration and growth of our past and future acquired businesses and assets. |
4
Table of Contents
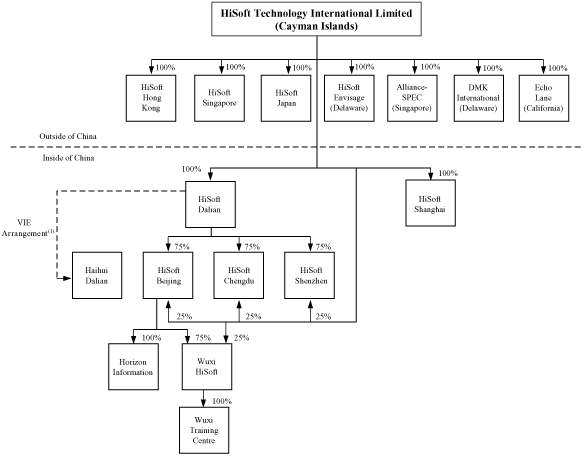
| (1) | Includes a series of contractual arrangements among HiSoft Technology (Dalian) Co., Ltd., or HiSoft Dalian, Haihui Dalian and certain shareholders of Haihui Dalian, including a strategic cooperation agreement, a voting rights agreement and an equity acquisition option agreement. See “Related Party Transactions—Agreements among HiSoft Dalian, Haihui Dalian, and the Shareholders of Haihui Dalian.” |
5
Table of Contents
6
Table of Contents
| ADSs Offered by Us | 6,400,000 ADSs | |
| ADSs Offered by the Selling Shareholders | 1,000,000 ADSs | |
| Price per ADS | We estimate that the initial public offering price will be between $11.00 and $13.00 per ADS. | |
| ADSs Outstanding Immediately After This Offering | 7,400,000 ADSs (or 8,510,000 ADSs if the underwriters exercise in full the over-allotment option). | |
| Common Shares Outstanding Immediately After This Offering | 528,472,536 common shares after giving effect to the conversion of our convertible redeemable preferred shares and including 5,968,299 nonvested common shares awarded under our share incentive plan, but excluding common shares issuable upon the exercise of outstanding options with respect to our common shares under our share incentive plan. | |
| Over-Allotment Option | The selling shareholders have granted to the underwriters an option, exercisable for 30 days from the date of this prospectus, to purchase up to an aggregate of 1,110,000 additional ADSs at the initial public offering price, less underwriting discounts and commissions, solely for the purpose of covering over-allotments. | |
| The ADSs | Each ADS represents 19 common shares. The ADSs will be evidenced by ADRs. | |
| The depositary will be the holder of the common shares underlying the ADSs and you will have the rights of an ADR holder as provided in the deposit agreement among us, the depositary and holders and beneficial owners of ADSs from time to time. | ||
| You may surrender your ADSs to the depositary to withdraw the common shares underlying your ADSs. The depositary will charge you a fee for such an exchange. | ||
| We may amend or terminate the deposit agreement for any reason without your consent. Any amendment that imposes or increases fees or charges or which materially prejudices any substantial |
7
Table of Contents
| existing right you have as an ADS holder will not become effective as to outstanding ADSs until 30 days after notice of the amendment is given to ADS holders. If an amendment becomes effective, you will be bound by the deposit agreement as amended if you continue to hold your ADSs. | ||
| To better understand the terms of the ADSs, you should carefully read the section in this prospectus entitled “Description of American Depositary Shares.” We also encourage you to read the deposit agreement, which is an exhibit to the registration statement that includes this prospectus. | ||
| Use of Proceeds | We estimate that we will receive net proceeds of approximately $66.4 million from this offering, assuming an initial public offering price of $12.00 per ADS, the mid-point of the estimated range of the initial public offering price, after deducting estimated underwriter discounts, commissions and estimated offering expenses payable by us. We anticipate using the net proceeds of this offering for general corporate purposes, including incremental costs associated with being a public company, and for potential acquisitions of, or investments in, other businesses or technologies that we believe will complement our current operations and expansion strategies. | |
| We will not receive any of the proceeds from the sale of the ADSs by the selling shareholders. | ||
| Risk Factors | See “Risk Factors” and other information included in this prospectus for a discussion of the risks relating to investing in our ADSs. You should carefully consider these risks before deciding to invest in our ADSs. | |
| Listing | We have applied to list our ADSs on the Nasdaq Global Market. Our common shares will not be listed on any exchange or quoted for trading on any over-the-counter trading system. | |
| Nasdaq Global Market Trading Symbol | HSFT | |
| Depositary | Deutsche Bank Trust Company Americas |
8
Table of Contents
| Lock-up | We, our officers and directors, and the holders of substantially all of our common shares have agreed with the underwriters not to sell, transfer or dispose of any ADSs, common shares or similar securities for a period of 180 days after the date of this prospectus. See “Underwriting.” |
9
Table of Contents
| Year Ended December 31, | Three Months Ended March 31, | |||||||||||||||||||||||||||
| 2005 | 2006 | 2007 | 2008 | 2009 | 2009 | 2010 | ||||||||||||||||||||||
| (dollars in thousands, except share data, per share data and per ADS data) | ||||||||||||||||||||||||||||
Consolidated Statements of Operations Data | ||||||||||||||||||||||||||||
| Net revenues | $ | 17,483 | $ | 33,669 | $ | 63,051 | $ | 100,720 | $ | 91,456 | $ | 21,537 | $ | 30,537 | ||||||||||||||
| Cost of revenues (1)(2) | 11,696 | 25,334 | 47,435 | 70,295 | 58,759 | 13,792 | 19,418 | |||||||||||||||||||||
| Gross profit | 5,787 | 8,335 | 15,616 | 30,425 | 32,697 | 7,745 | 11,119 | |||||||||||||||||||||
| Operating expenses: | ||||||||||||||||||||||||||||
| General and administrative (2) | 4,538 | 12,454 | 12,617 | 19,010 | 18,981 | 5,651 | 5,859 | |||||||||||||||||||||
| Selling and marketing (1)(2) | 1,591 | 4,176 | 5,599 | 8,345 | 5,968 | 1,103 | 1,991 | |||||||||||||||||||||
| Offering expenses | — | — | — | 3,782 | — | — | — | |||||||||||||||||||||
| Impairment of intangible assets | — | 2,480 | — | 5,760 | — | — | — | |||||||||||||||||||||
| Impairment of goodwill | — | — | — | 4,784 | — | — | — | |||||||||||||||||||||
| Total operating expenses | 6,129 | 19,110 | 18,216 | 41,681 | 24,949 | 6,754 | 7,850 | |||||||||||||||||||||
| (Loss) income from operations | (342 | ) | (10,775 | ) | (2,600 | ) | (11,256 | ) | 7,748 | 991 | 3,269 | |||||||||||||||||
| Other (expenses) income (3) | (430 | ) | (592 | ) | 2,488 | 411 | 676 | 348 | 126 | |||||||||||||||||||
| Income tax (expense) benefit | (293 | ) | 760 | (770 | ) | 703 | (1,061 | ) | (168 | ) | (428 | ) | ||||||||||||||||
| Net (loss) income on discontinued operation | 10 | 31 | (38 | ) | (569 | ) | — | — | — | |||||||||||||||||||
| Net (loss) income | (1,055 | ) | (10,576 | ) | (920 | ) | (10,711 | ) | 7,363 | 1,171 | 2,967 | |||||||||||||||||
| Noncontrolling interest | (63 | ) | 654 | — | — | — | — | — | ||||||||||||||||||||
| Net (loss) income attributable to HiSoft Technology International Limited | $ | (1,118 | ) | $ | (9,922 | ) | $ | (920 | ) | $ | (10,711 | ) | $ | 7,363 | $ | 1,171 | $ | 2,967 | ||||||||||
| Deemed dividend on series A-1, B and C convertible redeemable preferred shares | $ | — | $ | (1,120 | ) | $ | (5,762 | ) | $ | — | $ | — | $ | — | $ | — | ||||||||||||
| Net (loss) income attributable to holders of common shares of HiSoft Technology International Limited | $ | (1,118 | ) | $ | (11,042 | ) | $ | (6,682 | ) | $ | (10,711 | ) | $ | 7,363 | $ | 1,171 | $ | 2,967 | ||||||||||
10
Table of Contents
| Year Ended December 31, | Three Months Ended March 31, | |||||||||||||||||||||||||||
| 2005 | 2006 | 2007 | 2008 | 2009 | 2009 | 2010 | ||||||||||||||||||||||
| (dollars in thousands, except share data, per share data and per ADS data) | ||||||||||||||||||||||||||||
| Net (loss) income per common share: | ||||||||||||||||||||||||||||
| Basic | $ | (0.02 | ) | $ | (0.13 | ) | $ | (0.07 | ) | $ | (0.13 | ) | $ | 0.02 | $ | — | $ | 0.01 | ||||||||||
| Diluted | $ | (0.02 | ) | $ | (0.13 | ) | $ | (0.07 | ) | $ | (0.13 | ) | $ | 0.02 | $ | — | $ | 0.01 | ||||||||||
| Net (loss) income per ADS attributable to holders of ADSs of HiSoft Technology International Limited: | ||||||||||||||||||||||||||||
| Basic | $ | (0.38 | ) | $ | (2.47 | ) | $ | (1.35 | ) | $ | (2.47 | ) | $ | 0.37 | $ | 0.06 | $ | 0.14 | ||||||||||
| Diluted | $ | (0.38 | ) | $ | (2.47 | ) | $ | (1.35 | ) | $ | (2.47 | ) | $ | 0.36 | $ | 0.06 | $ | 0.13 | ||||||||||
| Weighted average common shares used in calculating net (loss) income per common share: | ||||||||||||||||||||||||||||
| Basic | 66,058,582 | 82,176,358 | 94,237,854 | 82,279,610 | 86,148,324 | 85,189,211 | 89,933,268 | |||||||||||||||||||||
| Diluted | 66,058,582 | 82,176,358 | 94,237,854 | 82,279,610 | 388,372,705 | 363,343,798 | 424,477,209 | |||||||||||||||||||||
| Weighted average ADSs used in calculating net (loss) income per ADS: | ||||||||||||||||||||||||||||
| Basic | 3,476,767 | 4,325,071 | 4,959,887 | 4,330,506 | 4,534,122 | 4,483,643 | 4,733,330 | |||||||||||||||||||||
| Diluted | 3,476,767 | 4,325,071 | 4,959,887 | 4,330,506 | 20,440,699 | 19,123,358 | 22,340,906 | |||||||||||||||||||||
| (1) | Includes acquisition-related amortization of intangible assets totaling $1.9 million, $1.6 million and $0.1 million in 2007, 2008 and 2009, respectively, and nil and $0.2 million in the three months ended March 31, 2009 and 2010, respectively, allocated as follows: |
| Three Months | ||||||||||||||||||||
| Year Ended December 31, | Ended March 31, | |||||||||||||||||||
| 2007 | 2008 | 2009 | 2009 | 2010 | ||||||||||||||||
| (dollars in thousands) | ||||||||||||||||||||
| Cost of revenues | $ | 152 | $ | 50 | $ | 16 | $ | — | $ | 47 | ||||||||||
| Operating expenses: | ||||||||||||||||||||
| Selling and marketing | 1,716 | 1,565 | 60 | — | 116 | |||||||||||||||
| (2) | Includes share-based compensation charges totaling $1.5 million, $1.8 million and $1.1 million in 2007, 2008 and 2009, respectively, and $0.2 million and $0.6 million in the three months ended March 31, 2009 and 2010, respectively, allocated as follows: |
| Year Ended December 31, | Three Months Ended March 31, | |||||||||||||||||||
| 2007 | 2008 | 2009 | 2009 | 2010 | ||||||||||||||||
| (dollars in thousands) | ||||||||||||||||||||
| Cost of revenues | $ | 268 | $ | 362 | $ | 321 | $ | 83 | $ | 233 | ||||||||||
| Operating expenses: | ||||||||||||||||||||
| General and administrative | 1,214 | 1,405 | 720 | 124 | 339 | |||||||||||||||
| Selling and marketing | 8 | 35 | 56 | 10 | 17 | |||||||||||||||
| (3) | Includes change in fair value of warrants of $2.4 million in the year ended 2007 resulting from our issuance in 2004 of warrants allowing the holders to acquire 2,000,000 shares of our series A convertible redeemable preferred shares and 36,000,000series A-1 convertible redeemable preferred shares. The warrants were exercised in full in 2007 and no future charge will apply. |
11
Table of Contents
| Year Ended December 31, | Three Months Ended March 31, | |||||||||||||||||||
| 2007 | 2008 | 2009 | 2009 | 2010 | ||||||||||||||||
Other Consolidated Financial Data | ||||||||||||||||||||
| Gross margin (1) | 24.8 | % | 30.2 | % | 35.8 | % | 36.0 | % | 36.4 | % | ||||||||||
| Operating margin (2) | (4.1 | )% | (11.2 | )% | 8.5 | % | 4.7 | % | 10.7 | % | ||||||||||
| Net margin (3) | (1.5 | )% | (10.6 | )% | 8.1 | % | 5.5 | % | 9.7 | % | ||||||||||
| (1) | Gross margin represents gross profit as a percentage of net revenues. | |
| (2) | Operating margin represents income (loss) from operations as a percentage of net revenues. | |
| (3) | Net margin represents net income (loss) before noncontrolling interest as a percentage of net revenues. |
| As of December 31, | As of March 31, 2010 | |||||||||||||||||||
| 2007 | 2008 | 2009 | Actual | Pro Forma (1) | ||||||||||||||||
| (dollars in thousands) | ||||||||||||||||||||
Consolidated Balance Sheet Data | ||||||||||||||||||||
| Cash and cash equivalents | $ | 39,229 | $ | 46,881 | $ | 54,842 | $ | 52,863 | $ | 52,863 | ||||||||||
| Total assets | 96,668 | 86,100 | 104,242 | 108,989 | 108,989 | |||||||||||||||
| Total liabilities | 22,246 | 16,699 | 26,151 | 26,678 | 26,678 | |||||||||||||||
| Series A convertible redeemable preferred shares | 12,581 | 12,581 | 12,581 | 12,581 | — | |||||||||||||||
Series A-1 convertible redeemable preferred shares | 9,900 | 9,900 | 9,900 | 9,900 | — | |||||||||||||||
| Series B convertible redeemable preferred shares | 30,800 | 30,800 | 30,800 | 30,800 | — | |||||||||||||||
| Series C convertible redeemable preferred shares | 35,750 | 35,750 | 35,750 | 35,750 | — | |||||||||||||||
| Total (deficit) equity | $ | (14,609 | ) | $ | (19,630 | ) | $ | (10,940 | ) | $ | (6,720 | ) | $ | 82,311 | ||||||
| (1) | The pro forma balance sheet data as of March 31, 2010 assumes the conversion of our outstanding series A,A-1, B and C convertible redeemable preferred shares into common shares as of March 31, 2010. |
12
Table of Contents
13
Table of Contents
| • | maintaining high quality control and process execution standards; | |
| • | maintaining high resource utilization rates on a consistent basis; | |
| • | maintaining productivity levels and implementing necessary process improvements; | |
| • | controlling costs; and | |
| • | maintaining close client contact and high levels of client satisfaction, while at the same time preserving continuity in personnel engaged in a particular project while also rotating personnel to ensure that periodic wage adjustments do not adversely impact our margins on a particular project. |
14
Table of Contents
15
Table of Contents
| • | recruiting, training and retaining a sufficient number of skilled technical, sales and management personnel; | |
| • | creating and capitalizing upon economies of scale; | |
| • | managing a larger number of clients in a greater number of industry sectors; | |
| • | managing our days of sales outstanding; | |
| • | maintaining effective oversight over personnel and offices; | |
| • | coordinating work among onshore and offshore sites and project teams and maintaining high resource utilization rates; | |
| • | integrating new management personnel and expanded operations while preserving our culture, values and entrepreneurial environment; and | |
| • | developing and improving our internal systems and infrastructure, particularly our financial, operational and communications systems. |
| • | global offshore outsourced technology services companies such as Cognizant Technology Solutions, HCL Technologies, Infosys Technologies, Patni Computer Systems, Tata Consultancy Services and Wipro Technologies; | |
| • | China-based technology outsourcing service providers such as Beyondsoft, Chinasoft, Dalian Hi-think Computer (DHC), iSoftStone, Neusoft, SinoCom and VanceInfo; | |
| • | certain divisions of large multinational technology firms; and | |
| • | in-house IT departments of our clients and potential clients. |
16
Table of Contents
17
Table of Contents
18
Table of Contents
| • | client financial difficulties; | |
| • | a change in strategic priorities resulting in elimination of the impetus for the project or a reduced level of technology spending; | |
| • | a change in outsourcing strategy resulting in moving more work to the client’s in-house technology departments or to our competitors; | |
| • | the replacement by our clients of existing software with other software packages supported by licensors; and | |
| • | mergers and acquisitions or significant corporate restructurings. |
19
Table of Contents
20
Table of Contents
21
Table of Contents
22
Table of Contents
23
Table of Contents
| • | acquisitions of assets, technologies or businesses; | |
| • | the development and expansion of our technology service offerings; | |
| • | the expansion of our operations and geographic presence; and | |
| • | our marketing and business development costs. |
24
Table of Contents
| • | investors’ perception of, and demand for, securities of outsourced technology services companies; | |
| • | conditions in the U.S. and other capital markets in which we may seek to raise funds; | |
| • | our future results of operations and financial condition; | |
| • | PRC government regulation of foreign investment in China; | |
| • | economic, political and other conditions in China; and | |
| • | PRC government policies relating to the borrowing and remittance outside China of foreign currency. |
25
Table of Contents
| • | variations in the duration, size, timing and scope of our engagements, particularly with our major clients; | |
| • | impact of new or terminated client engagements; | |
| • | timing and impact of acquisitions, including how quickly and effectively we are able to integrate the acquired business, its service offerings and employees, and retain acquired clients; | |
| • | changes in our pricing policies or those of our clients or competitors; | |
| • | start-up expenses for new engagements; | |
| • | progress on fixed-price engagements, and the accuracy of estimates of resources and time frames required to complete pending assignments; | |
| • | the proportion of services that we perform onshore versus offshore; | |
| • | the proportion of fixed-price contracts versustime-and-materials contracts; | |
| • | unanticipated employee turnover and attrition; | |
| • | the size and timing of expansion of our facilities; | |
| • | unanticipated cancellations, non-renewal of our contracts by our clients, contract terminations or deferrals of projects; | |
| • | changes in our employee utilization rates; | |
| • | changes in relevant exchange rates; and | |
| • | our ability to implement productivity and process improvements, and maintain appropriate staffing to ensure cost-effectiveness on individual engagements. |
26
Table of Contents
| • | significant currency fluctuations among the Renminbi, Japanese yen, U.S. dollar and other currencies in which we transact business; | |
| • | legal uncertainty owing to the overlap of different legal regimes, problems in asserting contractual or other rights across international borders, and the burden and expense of complying with the laws and regulations of various jurisdictions; | |
| • | potentially adverse tax consequences, such as scrutiny of transfer pricing arrangements by authorities in the countries in which we operate; | |
| • | current and future tariffs and other trade barriers, including restrictions on technology and data transfers; | |
| • | obtaining visas and other travel documents, especially for our employees who are PRC citizens; | |
| • | unexpected changes in regulatory requirements; and | |
| • | terrorist attacks and other acts of violence, regional conflicts or war, including any escalation of recent events involving South Korea and North Korea. |
27
Table of Contents
28
Table of Contents
29
Table of Contents
30
Table of Contents
31
Table of Contents
32
Table of Contents
33
Table of Contents
34
Table of Contents
35
Table of Contents
36
Table of Contents
37
Table of Contents
38
Table of Contents
39
Table of Contents
40
Table of Contents
| • | to recognize or enforce judgments of United States courts obtained against us or our directors or officers predicated upon the civil liability provisions of the securities laws of the United States or any state in the United States; or | |
| • | to entertain original actions brought against us or our directors or officers predicated upon the securities laws of the United States or any state in the United States. |
41
Table of Contents
| • | we have failed to timely provide the depositary with our notice of meeting and related voting materials; |
42
Table of Contents
| • | we have instructed the depositary that we do not wish a discretionary proxy to be given; | |
| • | we have informed the depositary that there is substantial opposition as to a matter to be voted on at the meeting; | |
| • | a matter to be voted on at the meeting would have a material adverse impact on shareholders; or | |
| • | voting at the meeting is made on a show of hands. |
43
Table of Contents
| • | our goals and strategies; | |
| • | our prospects, business development, growth of our operations, financial condition and results of operations; | |
| • | our ability to introduce successful new services and attract new clients; | |
| • | the expected demand for IT and research and development outsourced technology services in our principal target markets of the U.S., Japan and China; | |
| • | our expectations regarding maintaining and strengthening relationships with our key clients; | |
| • | our ability to attract and retain skilled and experienced professionals; | |
| • | our ability to pursue, integrate and manage our strategic acquisitions; | |
| • | trends in our service offerings mix; | |
| • | changes in the IT industry in China, including changes in the policies and regulations of the PRC government governing the IT industry; | |
| • | our planned use of proceeds; and | |
| • | fluctuations in general economic and business conditions in China. |
44
Table of Contents
45
Table of Contents
46
Table of Contents
| • | an actual basis; | |
| • | a pro forma basis to give effect to the automatic conversion of all of our outstanding series A,series A-1, series B and series C convertible redeemable preferred shares into common shares upon closing of this offering; and | |
| • | a pro forma as adjusted basis to give effect to (i) the automatic conversion of all of our series A,series A-1, series B and series C convertible redeemable preferred shares into common shares upon closing of this offering, and (ii) the issuance and sale of the common shares in the form of ADSs offered hereby at an assumed initial public offering price of $12.00 per ADS, the mid-point of the estimated public offering price range shown on the front cover of this prospectus, after deducting underwriting discounts, commissions and estimated offering expenses payable by us and assuming no exercise of the underwriters’ over-allotment option. |
| As of March 31, 2010 | ||||||||||||
| Pro Forma as | ||||||||||||
| Actual | Pro Forma | Adjusted (1) | ||||||||||
| (dollars in thousands, except for share and per share data) | ||||||||||||
| Convertible redeemable preferred shares, $0.0001 par value, including: | ||||||||||||
| Series A convertible redeemable preferred shares; 57,000,000 shares authorized; 57,000,000 shares issued and outstanding | $ | 12,581 | $ | — | $ | — | ||||||
Series A-1 convertible redeemable preferred shares; 36,000,000 shares authorized; 36,000,000 shares issued and outstanding | 9,900 | — | — | |||||||||
| Series B convertible redeemable preferred shares; 112,000,000 shares authorized; 112,000,000 shares issued and outstanding | 30,800 | — | — | |||||||||
| Series C convertible redeemable preferred shares; 60,000,000 shares authorized; 59,090,910 shares issued and outstanding | 35,750 | — | — | |||||||||
| HiSoft Technology International Limited shareholders’ (deficit) equity: | ||||||||||||
| Common shares, $0.0001 par value; 607,000,000 shares authorized; 91,895,573 shares issued and outstanding | 9 | 40 | 52 | |||||||||
| Additional paid-in capital | 8,410 | 97,410 | 163,760 | |||||||||
| Statutory reserve | 2,447 | 2,447 | 2,447 | |||||||||
| Accumulated deficit | (23,749 | ) | (23,749 | ) | (23,749 | ) | ||||||
| Accumulated other comprehensive income | 6,163 | 6,163 | 6,163 | |||||||||
| Total HiSoft Technology International Limited shareholders’ (deficit) equity | (6,720 | ) | 82,311 | 148,673 | ||||||||
| Total capitalization | $ | 82,311 | $ | 82,311 | $ | 148,673 | ||||||
| (1) | Assumes that the underwriters do not exercise their over-allotment option to purchase additional ADSs. |
47
Table of Contents
| Assumed initial public offering price per common share | $ | 0.63 | ||
| Net tangible book value per common share as of March 31, 2010 (1) | $ | 0.17 | ||
| Increase in net tangible book value per common share attributable to price paid by new investors | $ | 0.09 | ||
| Pro forma net tangible book value per common share after the offering | $ | 0.26 | ||
| Dilution in net tangible book value per common share to new investors in the offering | $ | 0.37 | ||
| Dilution in net tangible book value per ADS to new investors in the offering | $ | 7.10 |
| (1) | After giving effect to the automatic conversion of all outstanding convertible redeemable preferred shares to common shares upon the closing of this offering and excluding 5,968,299 nonvested common shares awarded under our share incentive plan. |
48
Table of Contents
| Common Shares | Total | Average Price per | ||||||||||||||||||||||
| Purchased | Consideration | Common Share | Average Price per | |||||||||||||||||||||
| Number | Percent | Amount | Percent | Equivalent | ADS Equivalent | |||||||||||||||||||
| Existing shareholders | 400,574,809 | 77% | $ | 92,776,701 | 55% | $ | 0.24 | $ | 4.40 | |||||||||||||||
| New investors | 121,600,000 | 23% | 76,800,000 | 45% | 0.63 | 12.00 | ||||||||||||||||||
| Total | 522,174,809 | 100% | $ | 169,576,701 | 100% | $ | 0.33 | $ | 6.17 | |||||||||||||||
49
Table of Contents
| Noon Buying Rate | ||||||||||||||||
Period (1) | Period End | Average (2) | Low | High | ||||||||||||
| (RMB per $1.00) | ||||||||||||||||
| 2005 | 8.0702 | 8.1826 | 8.2765 | 8.0702 | ||||||||||||
| 2006 | 7.8041 | 7.9579 | 8.0702 | 7.8041 | ||||||||||||
| 2007 | 7.2946 | 7.5806 | 7.8127 | 7.2946 | ||||||||||||
| 2008 | 6.8225 | 6.9193 | 7.2946 | 6.7800 | ||||||||||||
| 2009 | 6.8259 | 6.8307 | 6.8470 | 6.8176 | ||||||||||||
| 2010 (through June 11) | 6.8320 | 6.8271 | 6.8330 | 6.8229 | ||||||||||||
| Most recent six months: | ||||||||||||||||
| December 2009 | 6.8259 | 6.8275 | 6.8299 | 6.8244 | ||||||||||||
| January 2010 | 6.8268 | 6.8269 | 6.8295 | 6.8258 | ||||||||||||
| February 2010 | 6.8258 | 6.8285 | 6.8330 | 6.8258 | ||||||||||||
| March 2010 | 6.8258 | 6.8262 | 6.8270 | 6.8254 | ||||||||||||
| April 2010 | 6.8247 | 6.8256 | 6.8275 | 6.8229 | ||||||||||||
| May 2010 | 6.8305 | 6.8275 | 6.8310 | 6.8245 | ||||||||||||
| June 2010 (through June 11) | 6.8320 | 6.8294 | 6.8322 | 6.8268 | ||||||||||||
| (1) | For all dates through December 31, 2008, exchange rates between Renminbi and U.S. dollars are presented at the noon buying rate in the City of New York for cable transfers in Renminbi per U.S. dollars as certified for customs purposes by the Federal Reserve Bank of New York. For January 1, 2009 and all later dates and periods, the exchange rate refers to the noon buying rate as set forth in the H.10 statistical release of the U.S. Federal Reserve Board. | |
| (2) | Annual averages are calculated using the average of the rates on the last business day of each month during the relevant year. Monthly averages are calculated using the average of the daily rates during the relevant month. |
50
Table of Contents
51
Table of Contents
52
Table of Contents
| (1) | Includes a series of contractual arrangements among HiSoft Technology (Dalian) Co., Ltd., or HiSoft Dalian, Haihui Dalian and certain shareholders of Haihui Dalian, including a strategic cooperation agreement, a voting rights agreement and an equity acquisition option agreement. See “Related Party Transactions—Agreements among HiSoft Dalian, Haihui Dalian, and the Shareholders of Haihui Dalian.” |
| • | Granite Global Ventures and its affiliated entities, which together beneficially own 22.6% of our outstanding shares; | |
| • | International Finance Corporation, which beneficially owns 11.9% of our outstanding shares; |
53
Table of Contents
| • | JAFCO Asia Technology Fund, which beneficially owns 8.2% of our outstanding shares; | |
| • | Draper Fisher Jurvetson and its affiliated entities, which together beneficially own 8.2% of our outstanding shares; | |
| • | Tian Hai International Limited, which beneficially owns 7.8% of our outstanding shares; | |
| • | Intel Capital (Cayman) Corporation, which beneficially owns 7.8% of our outstanding shares; | |
| • | GE Capital Equity Investments Ltd., which beneficially owns 7.2% of our outstanding shares; and | |
| • | Kaiki Inc., which beneficially owns 5.5% of our outstanding shares. |
| • | In December 2005, we acquired 51% of the business of Beijing Tianhai Hongye International Software Co. Ltd., or Tianhai International, a Beijing-based software outsourcing provider, and in December 2006, we acquired the remaining 49%. To effect the Tianhai International business acquisition, HiSoft Holdings BVI, a BVI holding company, and its wholly owned PRC subsidiary, HiSoft Beijing, were formed to hold and operate the underlying business. We acquired our interest in the business by acquiring shares of the offshore holding company, HiSoft Holdings BVI. | |
| • | In December 2005, we acquired 55% of the business of Teksen Systems, a Hong Kong and Guangzhou-based IT services provider, and in January 2007 we acquired the remaining 45% of the business. To effect the Teksen Systems business acquisition, HiSoft Systems BVI, a BVI holding company, and its wholly owned subsidiaries, HiSoft Systems Hong Kong Limited, or HiSoft Hong Kong, and HiSoft Shenzhen were formed to hold and operate the underlying business. | |
| • | In December 2006, we established HiSoft Envisage Inc., or HiSoft Envisage, in Delaware to acquire Envisage Solutions, aU.S.-based provider of packaged software services. This acquisition was completed in December 2006. |
54
Table of Contents
| • | In April 2007, we established HiSoft Chengdu and, in June 2007, we established HiSoft Technology (Singapore) Pte. Ltd., which was subsequently dissolved in June 2009. | |
| • | In November 2007, we completed our acquisition of Shanghai Shinko Computer Technology Co., Ltd., an outsourcing technology center for a new key client, Kobe Steel Ltd., and renamed it as HiSoft Technology (Shanghai) Co., Ltd., or HiSoft Shanghai. | |
| • | In December 2007, we acquired T-est Pte Ltd, or T-est, a Singapore-based research and development services provider, which we renamed HiSoft Singapore Pte. Ltd., or HiSoft Singapore. | |
| • | In December 2007, we acquired 100% of Daemoyrod, an Oracle application software implementation and support specialist with operations in the United States and Mexico, by merging it into HiSoft Wave, Inc., our wholly owned subsidiary, or HiSoft Wave. | |
| • | In January 2009, we established Wuxi HiSoft Services Limited, or Wuxi HiSoft, and, in December 2009, we established Wuxi Training Centre through Wuxi HiSoft. | |
| • | In August 2009, we acquired a business process support team from AIA Information Technology (Guangzhou) Co. Ltd. | |
| • | In October 2009, we acquired the testing business of MG Digital Pte Ltd., a Singapore-based research and development services provider. | |
| • | In December 2009, we acquired 100% of AllianceSPEC, a professional IT transaction system testing company based in Singapore. | |
| • | In February 2010, we acquired 100% of Beijing Horizon Information & Technology Co., Ltd., or Horizon Information, a professional IT testing company based in China. | |
| • | In April 2010, we acquired 100% of Echo Lane, Inc., or Echo Lane, a professional consulting services firm in the U.S. with expertise in cloud computing. The consideration for this acquisition consisted of (i) cash consideration of US$1.2 million that was paid on closing and (ii) cash consideration of US$1.9 million, to be paid when the financial statements of Echo Lane for fiscal year 2011 have been audited by independent auditors. The consideration in (ii) will be subject to adjustment based on certain financial conditions of Echo Lane. | |
| • | We have entered into an agreement to acquire 100% of Insurance Systems Laboratory CO., LTD, or ISL, a Japanese consulting firm with expertise in planning, development, maintenance and management of information technology systems for insurance companies. The acquisition is expected to close on July 1, 2010 for a consideration of ¥200 million ($2.1 million) which may be adjusted downwards if certain financial conditions are not met by ISL. | |
| • | We are currently in discussions to acquire 100% of a China-based IT services firm specialized in providing SAP consulting and implementation services. Subject to further due diligence, the execution of a definitive agreement and satisfaction of customary closing conditions, we expect the acquisition to be completed in the third quarter of 2010. |
| • | AllianceSPEC, our wholly owned subsidiary incorporated in Singapore that primarily provides application testing services to BFSI clients; |
55
Table of Contents
| • | DMK International, our wholly owned subsidiary incorporated in Delaware that primarily provides IT outsourcing services, including application development and maintenance services; | |
| • | Echo Lane, our wholly owned subsidiary incorporated in California that primarily provides consulting services for cloud computing solutions and related applications; | |
| • | HiSoft Envisage, our wholly owned subsidiary incorporated in Delaware that primarily provides consulting services, including enterprise resource planning, customer relationship management and business intelligence consulting, and serves as our front office for the U.S. market; | |
| • | HiSoft Hong Kong, our wholly owned subsidiary incorporated in Hong Kong that primarily provides IT outsourcing services, including application development and maintenance services, to BFSI clients; | |
| • | HiSoft Japan, our wholly owned subsidiary incorporated in Japan that primarily provides IT outsourcing services, including application development and maintenance services, to clients in the BFSI and technology industries and serves as our front office for the Japan market; | |
| • | HiSoft Singapore, our wholly owned subsidiary incorporated in Singapore that primarily provides IT outsourcing services, including hardware and software testing services, to clients in the technology industry and serves as our front office for the Singapore market; |
| • | HiSoft Beijing, our wholly owned subsidiary incorporated in the PRC that primarily provides IT outsourcing services, including testing and localization services; | |
| • | HiSoft Chengdu, our wholly owned subsidiary incorporated in the PRC that primarily provides IT outsourcing services, including application development and maintenance services; | |
| • | Haihui Dalian, our variable interest entity that had no material operations as of the date of this prospectus; | |
| • | HiSoft Dalian, our wholly owned subsidiary incorporated in the PRC that primarily provides IT outsourcing services, including application development and maintenance services; | |
| • | HiSoft Shanghai, our wholly owned subsidiary incorporated in the PRC that primarily provides IT outsourcing services, including application development and maintenance services; | |
| • | HiSoft Shenzhen, our wholly owned subsidiary incorporated in the PRC that primarily provides IT outsourcing services, including application development and maintenance services, for clients in the BFSI industry; | |
| • | Horizon Information, our wholly owned subsidiary incorporated in the PRC that primarily provides application testing services, including application development and maintenance services, for clients in the telecom industry; |
56
Table of Contents
| • | Wuxi HiSoft, our wholly owned subsidiary incorporated in the PRC that primarily provides IT outsourcing services, including application development and maintenance, testing and localization testing services; and | |
| • | Wuxi Training Centre, our wholly owned subsidiary incorporated in the PRC that had no material operations as of the date of this prospectus but is expected to provide IT training programs for university graduates as part of our resource planning strategy. |
57
Table of Contents
| Year Ended December 31, | Three Months Ended March 31, | |||||||||||||||||||||||||||
| 2005 | 2006 | 2007 | 2008 | 2009 | 2009 | 2010 | ||||||||||||||||||||||
| (dollars in thousands, except share, per share and per ADS data) | ||||||||||||||||||||||||||||
Selected Consolidated Statements of Operations Data | ||||||||||||||||||||||||||||
| Net revenues | $ | 17,483 | $ | 33,669 | $ | 63,051 | $ | 100,720 | $ | 91,456 | $ | 21,537 | $ | 30,537 | ||||||||||||||
| Cost of revenues (1)(2) | 11,696 | 25,334 | 47,435 | 70,295 | 58,759 | 13,792 | 19,418 | |||||||||||||||||||||
| Gross profit | 5,787 | 8,335 | 15,616 | 30,425 | 32,697 | 7,745 | 11,119 | |||||||||||||||||||||
| Operating expenses: | ||||||||||||||||||||||||||||
| General and administrative (2) | 4,538 | 12,454 | 12,617 | 19,010 | 18,981 | 5,651 | 5,859 | |||||||||||||||||||||
| Selling and marketing (1)(2) | 1,591 | 4,176 | 5,599 | 8,345 | 5,968 | 1,103 | 1,991 | |||||||||||||||||||||
| Offering expenses | — | — | — | 3,782 | — | — | — | |||||||||||||||||||||
| Impairment of intangible assets | — | 2,480 | — | 5,760 | — | — | — | |||||||||||||||||||||
| Impairment of goodwill | — | — | — | 4,784 | — | — | — | |||||||||||||||||||||
| Total operating expenses | 6,129 | 19,110 | 18,216 | 41,681 | 24,949 | 6,754 | 7,850 | |||||||||||||||||||||
| (Loss) income from operations | (342 | ) | (10,775 | ) | (2,600 | ) | (11,256 | ) | 7,748 | 991 | 3,269 | |||||||||||||||||
| Other (expenses) income (3) | (430 | ) | (592 | ) | 2,488 | 411 | 676 | 348 | 126 | |||||||||||||||||||
| Income tax (expense) benefit | (293 | ) | 760 | (770 | ) | 703 | (1,061 | ) | (168 | ) | (428 | ) | ||||||||||||||||
| Net (loss) income on discontinued operation | 10 | 31 | (38 | ) | (569 | ) | — | — | — | |||||||||||||||||||
| Net (loss) income | (1,055 | ) | (10,576 | ) | (920 | ) | (10,711 | ) | 7,363 | 1,171 | 2,967 | |||||||||||||||||
| Noncontrolling interest | (63 | ) | 654 | — | — | — | — | — | ||||||||||||||||||||
| Net (loss) income attributable to HiSoft Technology International Limited | $ | (1,118 | ) | $ | (9,922 | ) | $ | (920 | ) | $ | (10,711 | ) | $ | 7,363 | $ | 1,171 | $ | 2,967 | ||||||||||
58
Table of Contents
| Year Ended December 31, | Three Months Ended March 31, | |||||||||||||||||||||||||||
| 2005 | 2006 | 2007 | 2008 | 2009 | 2009 | 2010 | ||||||||||||||||||||||
| (dollars in thousands, except share, per share and per ADS data) | ||||||||||||||||||||||||||||
Deemed dividend on Series A,A-1, B and C convertible redeemable preferred shares | — | (1,120 | ) | (5,762 | ) | — | — | — | — | |||||||||||||||||||
| Net (loss) income attributable to holders of common shares | $ | (1,118 | ) | $ | (11,042 | ) | (6,682 | ) | $ | (10,711 | ) | $ | 7,363 | $ | 1,171 | $ | 2,967 | |||||||||||
| Net (loss) income per common share: | ||||||||||||||||||||||||||||
| Basic | $ | (0.02 | ) | $ | (0.13 | ) | $ | (0.07 | ) | $ | (0.13 | ) | $ | 0.02 | $ | — | $ | 0.01 | ||||||||||
| Diluted | $ | (0.02 | ) | $ | (0.13 | ) | $ | (0.07 | ) | $ | (0.13 | ) | $ | 0.02 | $ | — | $ | 0.01 | ||||||||||
| Net (loss) income per ADS: | ||||||||||||||||||||||||||||
| Basic | $ | (0.38 | ) | $ | (2.47 | ) | $ | (1.35 | ) | $ | (2.47 | ) | $ | 0.37 | $ | 0.06 | $ | 0.14 | ||||||||||
| Diluted | $ | (0.38 | ) | $ | (2.47 | ) | $ | (1.35 | ) | $ | (2.47 | ) | $ | 0.36 | $ | 0.06 | $ | 0.13 | ||||||||||
| Weighted average common shares used in calculating (loss) income per common share: | ||||||||||||||||||||||||||||
| Basic | 66,058,582 | 82,176,358 | 94,237,854 | 82,279,610 | 86,148,324 | 85,189,211 | 89,933,268 | |||||||||||||||||||||
| Diluted | 66,058,582 | 82,176,358 | 94,237,854 | 82,279,610 | 388,372,705 | 363,343,798 | 424,477,209 | |||||||||||||||||||||
| Weighted average ADSs used in calculating net (loss) income per ADS: | ||||||||||||||||||||||||||||
| Basic | 3,476,767 | 4,325,071 | 4,959,887 | 4,330,506 | 4,534,122 | 4,483,643 | 4,733,330 | |||||||||||||||||||||
| Diluted | 3,476,767 | 4,325,071 | 4,959,887 | 4,330,506 | 20,440,699 | 19,123,358 | 22,340,906 | |||||||||||||||||||||
| (1) | Includes acquisition-related amortization of intangible assets totaling $1.9 million, $1.6 million and $0.1 million in 2007, 2008 and 2009, respectively, and nil and $0.2 million in the three months ended March 31, 2009 and 2010, respectively, allocated as follows: |
| Three Months | ||||||||||||||||||||
| Year Ended December 31, | Ended March 31, | |||||||||||||||||||
| 2007 | 2008 | 2009 | 2009 | 2010 | ||||||||||||||||
| (dollars in thousands) | ||||||||||||||||||||
| Cost of revenues | $ | 152 | $ | 50 | $ | 16 | $ | — | $ | 47 | ||||||||||
| Operating expenses: | ||||||||||||||||||||
| Selling and marketing | 1,716 | 1,565 | 60 | — | 116 | |||||||||||||||
| (2) | Includes share-based compensation charges totaling $1.5 million, $1.8 million and $1.1 million in 2007, 2008 and 2009, respectively, and $0.2 million and $0.6 million in the three months ended March 31, 2009 and 2010, respectively, allocated as follows: |
| Year Ended December 31, | Three Months Ended March 31, | |||||||||||||||||||
| 2007 | 2008 | 2009 | 2009 | 2010 | ||||||||||||||||
| (dollars in thousands) | ||||||||||||||||||||
| Cost of revenues | $ | 268 | $ | 362 | $ | 321 | $ | 83 | $ | 233 | ||||||||||
| Operating expenses: | ||||||||||||||||||||
| General and administrative | 1,214 | 1,405 | 720 | 124 | 339 | |||||||||||||||
| Selling and marketing | 8 | 35 | 56 | 10 | 17 | |||||||||||||||
| (3) | Includes change in fair value of warrants of $2.4 million in the year ended 2007 resulting from our issuance in 2004 of warrants allowing the holders to acquire 2,000,000 shares of our series A convertible redeemable preferred shares and 36,000,000 shares of ourseries A-1 convertible redeemable preferred shares. The warrants were exercised in full in 2007 and no future charge will apply. |
59
Table of Contents
| Year Ended December 31, | Three Months Ended March 31, | |||||||||||||||||||||||||||
| 2005 | 2006 | 2007 | 2008 | 2009 | 2009 | 2010 | ||||||||||||||||||||||
Other Consolidated Financial Data | ||||||||||||||||||||||||||||
| Gross margin (1) | 33.1 | % | 24.8 | % | 24.8 | % | 30.2 | % | 35.8 | % | 36.0 | % | 36.4 | % | ||||||||||||||
| Operating margin (2) | (2.0 | )% | (32.0 | )% | (4.1 | )% | (11.2 | )% | 8.5 | % | 4.7 | % | 10.7 | % | ||||||||||||||
| Net margin (3) | (6.0 | )% | (31.4 | )% | (1.5 | )% | (10.6 | )% | 8.1 | % | 5.5 | % | 9.7 | % | ||||||||||||||
| (1) | Gross margin represents gross profit as a percentage of net revenues. | |
| (2) | Operating margin represents income (loss) from operations as a percentage of net revenues. | |
| (3) | Net margin represents net income (loss) before noncontrolling interest as a percentage of net revenues. |
| As of December 31, | As of March 31, 2010 | |||||||||||||||||||||||||||
| 2005 | 2006 | 2007 | 2008 | 2009 | Actual | Pro Forma (1) | ||||||||||||||||||||||
| (dollars in thousands) | ||||||||||||||||||||||||||||
Consolidated Balance Sheet Data | ||||||||||||||||||||||||||||
| Cash and cash equivalents | $ | 7,731 | $ | 10,889 | $ | 39,229 | $ | 46,881 | $ | 54,842 | $ | 52,863 | $ | 52,863 | ||||||||||||||
| Total assets | 27,679 | 40,774 | 96,668 | 86,100 | 104,242 | 108,989 | 108,989 | |||||||||||||||||||||
| Total liabilities | 10,073 | 20,217 | 22,246 | 16,699 | 26,151 | 26,678 | 26,678 | |||||||||||||||||||||
| Noncontrolling interest | 1,956 | 181 | — | — | — | — | — | |||||||||||||||||||||
| Series A convertible redeemable preferred shares | 12,100 | 12,100 | 12,581 | 12,581 | 12,581 | 12,581 | — | |||||||||||||||||||||
Series A-1 convertible redeemable preferred shares | — | — | 9,900 | 9,900 | 9,900 | 9,900 | — | |||||||||||||||||||||
| Series B convertible redeemable preferred shares | — | 12,320 | 30,800 | 30,800 | 30,800 | 30,800 | — | |||||||||||||||||||||
| Series C convertible redeemable preferred shares | — | — | 35,750 | 35,750 | 35,750 | 35,750 | — | |||||||||||||||||||||
| Total equity (deficit) | $ | 3,550 | $ | (4,044 | ) | $ | (14,609 | ) | $ | (19,630 | ) | $ | (10,940 | ) | $ | (6,720 | ) | $ | 82,311 | |||||||||
| (1) | The pro forma balance sheet data as of March 31, 2010 assumes the conversion of our outstanding series A,A-1, B and C convertible redeemable preferred shares into common shares as of March 31, 2010. |
60
Table of Contents
CONDITION AND RESULTS OF OPERATIONS
In 2009, IDC ranked us as the second largest China-based provider of offshore, outsourced software development services by revenues. In addition to our strong market presence in the U.S. and Japan, we are leveraging our global capabilities to rapidly grow our business in China, which is benefiting from increased demand for China-based outsourced IT services from multinational and domestic corporations in China.
61
Table of Contents
| • | Market demand. Our net revenues are significantly affected by changes in demand for outsourced technology services by multinational corporations and software companies, especially demand for China-based outsourced technology service providers. For example, a decline in a client’s technology budget may have an adverse effect on the amount and types of services they seek from us. As a result of the recent global economic crisis and a slowdown in business activities, we experienced a decrease in demand for outsourced technology services in general that has led to a decrease in our net revenues from 2008 to 2009. However, in the second half of 2009 and continuing into the first quarter of 2010, we experienced increased work order demand due in part to the recovery in the global economy. | |
| • | Economic growth rates in our key client industries and locations. Our net revenues are significantly affected by economic growth rates in the industries and countries in which our main clients operate, including the technology and the BFSI industries in Japan, the United States and other parts of the world where our clients are based. | |
| • | Competition. Competition from China-based and non-China-based outsourced technology service providers may affect our ability to gain new clients and maintain and increase business from existing clients and, as a result, can have an adverse effect on our results of operations and financial condition. | |
| • | Wage rates. Our cost of revenues and operating expenses, and therefore gross margins and operating margins, may be affected by changes in wage rates in countries where we operate, particularly in China where most of our employees are based. As a result of the rapid economic growth in China and the increased competition for skilled employees in China, we have experienced a general increase in wages in China, both in more developed cities such as Beijing, Dalian, Shanghai and Shenzhen and, to a lesser extent, in other cities such as Wuxi and Chengdu. We believe wages in China will continue to increase in the future while wage inflation in other countries in which we operate will remain relatively stable. | |
| • | Government policies. Our results of operations may be affected by government policies and regulations, such as the Chinese government’s policies on preferential tax treatment as well as any policies or regulations affecting demand for offshore outsourced technology services in our key client locations. | |
| • | Relevant exchange rates. Changes in exchange rates, especially relative changes in exchange rates against the Renminbi, in which most of our costs are denominated, and the Japanese yen and U.S. dollar, in which a large percentage of our revenues is denominated, may have a significant effect on our gross margins and operating margins. |
| • | Our ability to obtain new clients and repeat business from existing clients. Revenues from individual clients typically grow over time as we seek to increase the number and scope of services provided to each client and as clients increase the complexity and scope of the work outsourced to us. Therefore, our ability to obtain new clients, as well |
62
Table of Contents
| as our ability to maintain and increase business from our existing clients, will have a significant effect on our results of operations and financial condition. |
| • | Our ability to expand our portfolio of service offerings. Our ability to grow revenue from new and existing clients is impacted by the breadth of our service offerings. Services we recently began to offer, including following recent acquisitions, include business process outsourcing services, consulting service in cloud computing solutions and testing. | |
| • | Impact of business acquisitions. We have entered into several business acquisitions in recent years and plan to pursue selective business acquisitions in the future as a means of growing our business. Our ability to identify, acquire, effectively manage and integrate new businesses into our existing operations can have a significant effect on our results of operations. | |
| • | Billing rates. Our billing rates are a key factor impacting our revenues and gross margins. Billing rates vary by service offering and location of service delivery, and aggregate billings per engagement are driven by a number of factors, including the mix of onshore versus offshore delivered services and the mix of experience levels of personnel on a particular project. | |
| • | Proportion of services performed onshore versus offshore. Services performed at a client site or onshore typically generate higher revenues but lower gross margins than services performed at our offshore delivery centers in China due to a higher cost base for onshore services. As a result, our gross margin fluctuates based on the relative proportion of work performed inside and outside China. The proportion of work performed at client sites, onshore in the client’s home country or offshore in China varies depending on client needs and the maturity or stage of engagement with a client. The proportion of work performed at our service delivery centers in China is typically greater for research and development services than for IT services. IT services generally have a higher proportion of onshore-delivered work early in an engagement, with the proportion of offshore-delivered work increasing over the term of the engagement. | |
| • | Employee utilization. We make hiring decisions and manage employee utilization based on our assessment of our project pipeline and staffing requirements. Employee utilization is typically higher for longer-term engagements due to increasing predictability of client needs over the course of the engagement. Our ability to effectively manage employee utilization will have an effect on our gross margin and our results of operations. |
| Year Ended December 31, | Three Months Ended March 31, | |||||||||||||||||||||||||||||||||||||||
| 2007 | 2008 | 2009 | 2009 | 2010 | ||||||||||||||||||||||||||||||||||||
| % of | % of | % of | % of | % of | ||||||||||||||||||||||||||||||||||||
| Net | Total Net | Net | Total Net | Net | Total Net | Net | Total Net | Net | Total Net | |||||||||||||||||||||||||||||||
| Revenues | Revenues | Revenues | Revenues | Revenues | Revenues | Revenues | Revenues | Revenues | Revenues | |||||||||||||||||||||||||||||||
| (dollars in thousands, except for percentages) | ||||||||||||||||||||||||||||||||||||||||
| IT services | $ | 40,682 | 64.5% | $ | 62,009 | 61.6% | $ | 47,139 | 51.5% | $ | 12,477 | 57.9% | $ | 15,605 | 51.1% | |||||||||||||||||||||||||
| Research and development services | 22,369 | 35.5% | 38,711 | 38.4% | 44,317 | 48.5% | 9,060 | 42.1% | 14,932 | 48.9% | ||||||||||||||||||||||||||||||
| Total net revenues | $ | 63,051 | 100.0% | $ | 100,720 | 100.0% | $ | 91,456 | 100.0% | $ | 21,537 | 100.0% | $ | 30,537 | 100.0% | |||||||||||||||||||||||||
63
Table of Contents
| Year Ended December 31, | Three Months Ended March 31, | |||||||||||||||||||||||||||||||||||||||
| 2007 | 2008 | 2009 | 2009 | 2010 | ||||||||||||||||||||||||||||||||||||
| % of | % of | % of | % of | % of | ||||||||||||||||||||||||||||||||||||
| Net | Total Net | Net | Total Net | Net | Total Net | Net | Total Net | Net | Total Net | |||||||||||||||||||||||||||||||
| Revenues | Revenues | Revenues | Revenues | Revenues | Revenues | Revenues | Revenues | Revenues | Revenues | |||||||||||||||||||||||||||||||
| (dollars in thousands, except for percentages) | ||||||||||||||||||||||||||||||||||||||||
| U.S. | $ | 37,066 | 58.8% | $ | 58,738 | 58.3% | $ | 54,541 | 59.6% | $ | 12,790 | 59.4% | $ | 16,895 | 55.3% | |||||||||||||||||||||||||
| Japan | 15,741 | 25.0% | 23,156 | 23.0% | 23,160 | 25.3% | 5,597 | 26.0% | 7,146 | 23.4% | ||||||||||||||||||||||||||||||
| Europe | 7,571 | 12.0% | 15,759 | 15.6% | 9,280 | 10.1% | 2,204 | 10.2% | 3,241 | 10.6% | ||||||||||||||||||||||||||||||
| China (including Hong Kong) | 2,283 | 3.6% | 2,269 | 2.3% | 2,865 | 3.1% | 532 | 2.5% | 1,959 | 6.4% | ||||||||||||||||||||||||||||||
| Others | 390 | 0.6% | 798 | 0.8% | 1,610 | 1.9% | 414 | 1.9% | 1,296 | 4.3% | ||||||||||||||||||||||||||||||
| Total net revenues | $ | 63,051 | 100.0% | $ | 100,720 | 100.0% | $ | 91,456 | 100.0% | $ | 21,537 | 100.0% | $ | 30,537 | 100.0% | |||||||||||||||||||||||||
64
Table of Contents
| Year Ended December 31, | Three Months Ended March 31, | |||||||||||||||||||||||||||||||||||||||
| 2007 | 2008 | 2009 | 2009 | 2010 | ||||||||||||||||||||||||||||||||||||
| % of | % of | % of | % of | % of | ||||||||||||||||||||||||||||||||||||
| Net | Total Net | Net | Total Net | Net | Total Net | Net | Total Net | Net | Total Net | |||||||||||||||||||||||||||||||
| Revenues | Revenues | Revenues | Revenues | Revenues | Revenues | Revenues | Revenues | Revenues | Revenues | |||||||||||||||||||||||||||||||
| (dollars in thousands, except for percentages) | ||||||||||||||||||||||||||||||||||||||||
| U.S. | $ | 17,268 | 27.4% | $ | 16,714 | 16.6% | $ | 22,960 | 25.1% | $ | 5,347 | 24.8% | $ | 6,371 | 20.9% | |||||||||||||||||||||||||
| Japan | 20,715 | 32.9% | 26,052 | 25.9% | 24,694 | 27.0% | 6,105 | 28.3% | 8,384 | 27.5% | ||||||||||||||||||||||||||||||
| Europe | 1,190 | 1.9% | 1,040 | 1.0% | 2,410 | 2.6% | 395 | 1.8% | 724 | 2.4% | ||||||||||||||||||||||||||||||
| China (including Hong Kong) | 23,250 | 36.9% | 48,914 | 48.6% | 32,999 | 36.1% | 8,028 | 37.3% | 10,180 | 33.3% | ||||||||||||||||||||||||||||||
| Singapore | 628 | 0.9% | 8,000 | 7.9% | 8,393 | 9.2% | 1,662 | 7.8% | 4,878 | 15.9% | ||||||||||||||||||||||||||||||
| Total net revenues | $ | 63,051 | 100.0% | $ | 100,720 | 100.0% | $ | 91,456 | 100.0% | $ | 21,537 | 100.0% | $ | 30,537 | 100.0% | |||||||||||||||||||||||||
| Year Ended December 31, | Three Months Ended March 31, | |||||||||||||||||||||||||||||||||||||||
| 2007 | 2008 | 2009 | 2009 | 2010 | ||||||||||||||||||||||||||||||||||||
| % of | % of | % of | % of | % of | ||||||||||||||||||||||||||||||||||||
| Net | Total Net | Net | Total Net | Net | Total Net | Net | Total Net | Net | Total Net | |||||||||||||||||||||||||||||||
| Revenues | Revenues | Revenues | Revenues | Revenues | Revenues | Revenues | Revenues | Revenues | Revenues | |||||||||||||||||||||||||||||||
| (dollars in thousands, except for percentages) | ||||||||||||||||||||||||||||||||||||||||
| Technology | $ | 31,820 | 50.5% | $ | 54,646 | 54.3% | $ | 56,222 | 61.5% | $ | 12,695 | 58.9% | $ | 18,590 | 60.9% | |||||||||||||||||||||||||
| BFSI | 17,528 | 27.8% | 29,210 | 29.0% | 21,697 | 23.7% | 5,307 | 24.6% | 7,516 | 24.6% | ||||||||||||||||||||||||||||||
| Others (1) | 13,703 | 21.7% | 16,864 | 16.7% | 13,537 | 14.8% | 3,535 | 16.5% | 4,431 | 14.5% | ||||||||||||||||||||||||||||||
| Total net revenues | $ | 63,051 | 100.0% | $ | 100,720 | 100.0% | $ | 91,456 | 100.0% | $ | 21,537 | 100.0% | $ | 30,537 | 100.0% | |||||||||||||||||||||||||
| (1) | Includes manufacturing, telecommunications and life sciences. |
65
Table of Contents
| Year Ended December 31, | Three Months Ended March 31, | |||||||||||||||||||||||||||||||||||||||
| 2007 | 2008 | 2009 | 2009 | 2010 | ||||||||||||||||||||||||||||||||||||
| % of | % of | % of | % of | % of | ||||||||||||||||||||||||||||||||||||
| Total Net | Total Net | Total Net | Total Net | Total Net | ||||||||||||||||||||||||||||||||||||
| Total | Revenues | Total | Revenues | Total | Revenues | Total | Revenues | Total | Revenues | |||||||||||||||||||||||||||||||
| (dollars in thousands, except for percentages) | ||||||||||||||||||||||||||||||||||||||||
| Total net revenues | $ | 63,051 | 100.0% | $ | 100,720 | 100.0% | $ | 91,456 | 100.0% | $ | 21,537 | 100.0% | $ | 30,537 | 100.0% | |||||||||||||||||||||||||
| Cost of revenues | 47,435 | 75.2% | 70,295 | 69.8% | 58,759 | 64.2% | 13,792 | 64.0% | 19,418 | 63.6% | ||||||||||||||||||||||||||||||
| Gross profit and gross margin | 15,616 | 24.8% | 30,425 | 30.2% | 32,697 | 35.8% | 7,745 | 36.0% | 11,119 | 36.4% | ||||||||||||||||||||||||||||||
66
Table of Contents
| Year Ended December 31, | Three Months Ended March 31, | |||||||||||||||||||||||||||||||||||||||
| 2007 | 2008 | 2009 | 2009 | 2010 | ||||||||||||||||||||||||||||||||||||
| % of | % of | % of | % of | % of | ||||||||||||||||||||||||||||||||||||
| Total Net | Total Net | Total Net | Total Net | Total Net | ||||||||||||||||||||||||||||||||||||
| Total | Revenues | Total | Revenues | Total | Revenues | Total | Revenues | Total | Revenues | |||||||||||||||||||||||||||||||
| (dollars in thousands, except for percentages) | ||||||||||||||||||||||||||||||||||||||||
| General and administrative expenses | $ | 12,617 | 20.0% | $ | 19,010 | 18.9% | $ | 18,981 | 20.8% | $ | 5,651 | 26.2% | $ | 5,859 | 19.2% | |||||||||||||||||||||||||
| Selling and marketing expenses | 5,599 | 8.9% | 8,345 | 8.3% | 5,968 | 6.5% | 1,103 | 5.1% | 1,991 | 6.5% | ||||||||||||||||||||||||||||||
67
Table of Contents
| • | Shanghai Shinko Computer Technology Co., Ltd., an outsourcing technology center for a new key client, Kobe Steel Ltd.; | |
| • | T-est, a Singapore-based research and development services provider; | |
| • | Daemoyrod, an Oracle application software implementation and support specialist with operations in the United States and Mexico; |
68
Table of Contents
| • | a business process support team from AIA Information Technology (Guangzhou) Co., Ltd.; | |
| • | the testing business of MG Digital Pte Ltd., a Singapore-based research and development services provider; | |
| • | AllianceSPEC, a professional IT transaction system testing company based in Singapore; | |
| • | Horizon Information, a professional IT testing company based in China; and | |
| • | Echo Lane, a professional consulting services firm in the U.S. with expertise in cloud computing. |
69
Table of Contents
| Year Ended December 31, | ||||||||||||
| 2007 | 2008 | 2009 | ||||||||||
| (dollars in thousands) | ||||||||||||
| Current | ||||||||||||
| - PRC and Hong Kong income tax expense | $ | 262 | $ | 464 | $ | 1,692 | ||||||
| - Japan income tax expense | 27 | 128 | 50 | |||||||||
| - U.S. income tax expense | 878 | — | — | |||||||||
| - Singapore income tax expense | 8 | 8 | 107 | |||||||||
| Deferred | ||||||||||||
| - PRC and Hong Kong income tax expense (benefit) | 121 | (287 | ) | (100 | ) | |||||||
| - Japan income tax expense (benefit) | 29 | 15 | (222 | ) | ||||||||
| - U.S. income tax benefit | (576 | ) | (872 | ) | (420 | ) | ||||||
| - Singapore income tax expense (benefit) | 21 | (159 | ) | (46 | ) | |||||||
| Income tax expense (benefit) | $ | 770 | $ | (703 | ) | $ | 1,061 | |||||
70
Table of Contents
71
Table of Contents
| Year Ended December 31, | Three Months Ended March 31, | |||||||||||||||||||||||||||||||||||||||
| 2007 | 2008 | 2009 | 2009 | 2010 | ||||||||||||||||||||||||||||||||||||
| (dollars in thousands, except for percentages) | ||||||||||||||||||||||||||||||||||||||||
Summary Consolidated Statements of Operating Data | ||||||||||||||||||||||||||||||||||||||||
| Net revenues | $ | 63,051 | 100.0% | $ | 100,720 | 100.0% | $ | 91,456 | 100.0% | $ | 21,537 | 100.0% | $ | 30,537 | 100.0% | |||||||||||||||||||||||||
| Cost of revenues (1)(2) | 47,435 | 75.2% | 70,295 | 69.8% | 58,759 | 64.2% | 13,792 | 64.0% | 19,418 | 63.6% | ||||||||||||||||||||||||||||||
| Gross profit | 15,616 | 24.8% | 30,425 | 30.2% | 32,697 | 35.8% | 7,745 | 36.0% | 11,119 | 36.4% | ||||||||||||||||||||||||||||||
| Operating expenses: | ||||||||||||||||||||||||||||||||||||||||
| General and administrative (2) | 12,617 | 20.0% | 19,010 | 18.9% | 18,981 | 20.8% | 5,651 | 26.2% | 5,859 | 19.2% | ||||||||||||||||||||||||||||||
| Selling and marketing (1)(2) | 5,599 | 8.9% | 8,345 | 8.3% | 5,968 | 6.5% | 1,103 | 5.1% | 1,991 | 6.5% | ||||||||||||||||||||||||||||||
| Offering expenses | — | — | 3,782 | 3.8% | — | — | — | — | — | — | ||||||||||||||||||||||||||||||
| Impairment of intangible assets | — | — | 5,760 | 5.7% | — | — | — | — | — | — | ||||||||||||||||||||||||||||||
| Impairment of goodwill | — | — | 4,784 | 4.7% | — | — | — | — | — | — | ||||||||||||||||||||||||||||||
| Total operating expenses | 18,216 | 28.9% | 41,681 | 41.4% | 24,949 | 27.3% | 6,754 | 31.3% | 7,850 | 25.7% | ||||||||||||||||||||||||||||||
| (Loss)/income from operations | (2,600) | (4.1)% | (11,256) | (11.2)% | 7,748 | 8.5% | 991 | 4.7% | 3,269 | 10.7% | ||||||||||||||||||||||||||||||
| Other income (expenses): | ||||||||||||||||||||||||||||||||||||||||
| Interest expense | (493) | (0.8)% | (58) | (0.1)% | (57) | (0.1)% | (7) | (0.0)% | (6) | (0.0)% | ||||||||||||||||||||||||||||||
| Interest income | 493 | 0.8% | 722 | 0.7% | 567 | 0.6% | 181 | 0.8% | 115 | 0.4% | ||||||||||||||||||||||||||||||
| Change in fair value of warrant | 2,387 | 3.8% | — | — | — | — | — | — | — | — | ||||||||||||||||||||||||||||||
| Change in fair value of foreign-currency forward contract | 101 | 0.1% | (253) | (0.2)% | 166 | 0.2% | 174 | 0.8% | 17 | 0.0% | ||||||||||||||||||||||||||||||
| Total other income | 2,488 | 3.9% | 411 | 0.4% | 676 | 0.7% | 348 | 1.6% | 126 | 0.4% | ||||||||||||||||||||||||||||||
| Net (loss)/income from continuing operations before income tax (expense) benefit | (112) | (0.2)% | (10,845) | (10.8)% | 8,424 | 9.2% | 1,339 | 6.3% | 3,395 | 11.1% | ||||||||||||||||||||||||||||||
| Income tax (expense) benefit | (770) | (1.2)% | 703 | 0.7% | (1,061) | (1.2)% | (168) | (0.8)% | (428) | (1.4)% | ||||||||||||||||||||||||||||||
| Net (loss)/income from continuing operations | (882) | (1.4)% | (10,142) | (10.1)% | 7,363 | 8.1% | 1,171 | 5.5% | 2,967 | 9.7% | ||||||||||||||||||||||||||||||
| Net loss on discontinued operation | (38) | (0.1)% | (569) | (0.6)% | — | — | — | — | — | — | ||||||||||||||||||||||||||||||
| Net (loss)/income | $ | (920) | (1.5)% | $ | (10,711) | (10.6)% | $ | 7,363 | 8.1% | $ | 1,171 | 5.5% | $ | 2,967 | 9.7% | |||||||||||||||||||||||||
| (1) | Includes acquisition-related amortization of intangible assets totaling $1.9 million, $1.6 million and $0.1 million in 2007, 2008 and 2009, respectively, and nil and $0.2 million in the three months ended March 31, 2009 and 2010, respectively, allocated as follows: |
| Three Months | ||||||||||||||||||||
| Year Ended December 31, | Ended March 31, | |||||||||||||||||||
| 2007 | 2008 | 2009 | 2009 | 2010 | ||||||||||||||||
| (dollars in thousands) | ||||||||||||||||||||
| Cost of revenues | $ | 152 | $ | 50 | $ | 16 | $ | — | $ | 47 | ||||||||||
| Operating expenses: | ||||||||||||||||||||
| Selling and marketing | 1,716 | 1,565 | 60 | — | 116 | |||||||||||||||
72
Table of Contents
| (2) | Includes share-based compensation charges totaling $1.5 million, $1.8 million and $1.1 million in 2007, 2008 and 2009, respectively, and $0.2 million and $0.6 million in the three months ended March 31, 2009 and 2010, respectively, allocated as follows: |
| Year Ended December 31, | Three Months Ended March 31, | |||||||||||||||||||
| 2007 | 2008 | 2009 | 2009 | 2010 | ||||||||||||||||
| (dollars in thousands) | ||||||||||||||||||||
| Cost of revenues | $ | 268 | $ | 362 | $ | 321 | $ | 83 | $ | 233 | ||||||||||
| Operating expenses: | ||||||||||||||||||||
| General and administrative | 1,214 | 1,405 | 720 | 124 | 339 | |||||||||||||||
| Selling and marketing | 8 | 35 | 56 | 10 | 17 | |||||||||||||||
73
Table of Contents
74
Table of Contents
75
Table of Contents
76
Table of Contents
77
Table of Contents
| Three Months Ended | ||||||||||||||||||||||||||||||||
| March 31, 2008 | June 30, 2008 | September 30, 2008 | December 31, 2008 | |||||||||||||||||||||||||||||
| % of Net | % of Net | % of Net | % of Net | |||||||||||||||||||||||||||||
| Amount | Revenues | Amount | Revenues | Amount | Revenues | Amount | Revenues | |||||||||||||||||||||||||
| (In thousands of U.S. dollars) | ||||||||||||||||||||||||||||||||
| Net revenues: | ||||||||||||||||||||||||||||||||
| IT services | $ | 16,985 | 67.4 | % | $ | 15,083 | 62.4 | % | $ | 14,837 | 57.2 | % | $ | 15,104 | 59.5 | % | ||||||||||||||||
| Research and development services | 8,233 | 32.6 | % | 9,104 | 37.6 | % | 11,090 | 42.8 | % | 10,284 | 40.5 | % | ||||||||||||||||||||
| Total net revenues | 25,218 | 100.0 | % | 24,187 | 100.0 | % | 25,927 | 100.0 | % | 25,388 | 100.0 | % | ||||||||||||||||||||
| Cost of revenues | 18,861 | 74.8 | % | 16,232 | 67.1 | % | 18,212 | 70.2 | % | 16,990 | 66.9 | % | ||||||||||||||||||||
| Gross profit | 6,357 | 25.2 | % | 7,955 | 32.9 | % | 7,715 | 29.8 | % | 8,398 | 33.1 | % | ||||||||||||||||||||
| Operating expenses: | ||||||||||||||||||||||||||||||||
| General and administrative | 3,953 | 15.7 | % | 4,172 | 17.2 | % | 6,850 | 26.4 | % | 4,035 | 15.9 | % | ||||||||||||||||||||
| Selling and marketing | 2,213 | 8.8 | % | 2,419 | 10.0 | % | 2,154 | 8.3 | % | 1,559 | 6.1 | % | ||||||||||||||||||||
| Offering expenses | — | — | — | — | 3,782 | 14.6 | % | — | — | |||||||||||||||||||||||
| Impairment of intangible assets | — | — | — | — | 5,760 | 22.2 | % | — | — | |||||||||||||||||||||||
| Impairment of goodwill | — | — | — | — | 4,784 | 18.5 | % | — | — | |||||||||||||||||||||||
| Total operating expenses | 6,166 | 24.5 | % | 6,591 | 27.2 | % | 23,330 | 90.0 | % | 5,594 | 22.0 | % | ||||||||||||||||||||
| Income (loss) from operations | 191 | 0.7 | % | 1,364 | 5.7 | % | (15,615 | ) | (60.2 | )% | 2,804 | 11.1 | % | |||||||||||||||||||
| Other (expenses) income | (129 | ) | (0.5 | )% | 334 | 1.4 | % | 159 | 0.6 | % | 47 | 0.2 | % | |||||||||||||||||||
| Income (loss) before income tax benefit (expenses) from continuing operations | 62 | 0.2 | % | 1,698 | 7.1 | % | (15,456 | ) | (59.6 | )% | 2,851 | 11.3 | % | |||||||||||||||||||
| Income tax (expense) benefit | 3 | 0.0 | % | 77 | 0.3 | % | 494 | 1.9 | % | 129 | 0.5 | % | ||||||||||||||||||||
| Loss from discontinued operation | (455 | ) | (1.8 | )% | (114 | ) | (0.5 | )% | — | — | — | — | ||||||||||||||||||||
| Net (loss) income | $ | (390 | ) | (1.6 | %) | $ | 1,661 | 6.9 | % | $ | (14,962 | ) | (57.7 | %) | $ | 2,980 | 11.8 | % | ||||||||||||||
78
Table of Contents
| Three Months Ended | ||||||||||||||||||||||||||||||||||||||||
| March 31, 2009 | June 30, 2009 | September 30, 2009 | December 31, 2009 | March 31, 2010 | ||||||||||||||||||||||||||||||||||||
| % of Net | % of Net | % of Net | % of Net | % of Net | ||||||||||||||||||||||||||||||||||||
| Amount | Revenues | Amount | Revenues | Amount | Revenues | Amount | Revenues | Amount | Revenues | |||||||||||||||||||||||||||||||
| (In thousands of U.S. dollars) | ||||||||||||||||||||||||||||||||||||||||
| Net revenues: | ||||||||||||||||||||||||||||||||||||||||
| IT services | $ | 12,477 | 57.9 | % | $ | 10,786 | 51.0 | % | $ | 11,497 | 50.5 | % | $ | 12,379 | 47.6 | % | $ | 15,605 | 51.1 | % | ||||||||||||||||||||
| Research and development services | 9,060 | 42.1 | % | 10,382 | 49.0 | % | 11,254 | 49.5 | % | 13,621 | 52.4 | % | 14,932 | 48.9 | % | |||||||||||||||||||||||||
| Total net revenues | 21,537 | 100.0 | % | 21,168 | 100.0 | % | 22,751 | 100.0 | % | 26,000 | 100.0 | % | 30,537 | 100.0 | % | |||||||||||||||||||||||||
| Cost of revenues | 13,792 | 64.0 | % | 13,583 | 64.2 | % | 14,749 | 64.8 | % | 16,635 | 64.0 | % | 19,418 | 63.6 | % | |||||||||||||||||||||||||
| Gross profit | 7,745 | 36.0 | % | 7,585 | 35.8 | % | 8,002 | 35.2 | % | 9,365 | 36.0 | % | 11,119 | 36.4 | % | |||||||||||||||||||||||||
| Operating expenses: | ||||||||||||||||||||||||||||||||||||||||
| General and administrative | 5,651 | 26.2 | % | 4,215 | 19.9 | % | 4,218 | 18.5 | % | 4,897 | 18.8 | % | 5,859 | 19.2 | % | |||||||||||||||||||||||||
| Selling and marketing | 1,103 | 5.1 | % | 1,476 | 7.0 | % | 1,601 | 7.0 | % | 1,788 | 6.9 | % | 1,991 | 6.5 | % | |||||||||||||||||||||||||
| Total operating expenses | 6,754 | 31.3 | % | 5,691 | 26.9 | % | 5,819 | 25.5 | % | 6,685 | 25.7 | % | 7,850 | 25.7 | % | |||||||||||||||||||||||||
| Income from operations | 991 | 4.7 | % | 1,894 | 8.9 | % | 2,183 | 9.7 | % | 2,680 | 10.3 | % | 3,269 | 10.7 | % | |||||||||||||||||||||||||
| Other income | 348 | 1.6 | % | 47 | 0.2 | % | 160 | 0.7 | % | 121 | 0.5 | % | 126 | 0.4 | % | |||||||||||||||||||||||||
| Income before income tax benefit (expenses) | 1,339 | 6.3 | % | 1,941 | 9.1 | % | 2,343 | 10.4 | % | 2,801 | 10.8 | % | 3,395 | 11.1 | % | |||||||||||||||||||||||||
| Income tax (expenses) benefit | (168 | ) | (0.8 | )% | (244 | ) | (1.2 | )% | (295 | ) | (1.3 | )% | (354 | ) | (1.4 | )% | (428 | ) | 1.4 | % | ||||||||||||||||||||
| Net income | $ | 1,171 | 5.5 | % | $ | 1,697 | 7.9 | % | $ | 2,048 | 9.1 | % | $ | 2,447 | 9.4 | % | 2,967 | 9.7 | % | |||||||||||||||||||||
79
Table of Contents
80
Table of Contents
81
Table of Contents
| • | The total revenue growth was projected at a CAGR of 18.3% for 2010 to 2013, which is within the range of comparable companies at the time of valuation. | |
| • | In the projection period, the cost of revenues as a percentage of net revenues would be stabilized at 61.5%. | |
| • | Operating expenses, including selling and marketing expenses and general and administrative expenses as a percentage of net revenues were expected to decrease in the projection period. | |
| • | The fixed asset and capital expenditures as a percentage of net revenues in the projection period were within the range of comparable companies. | |
| • | The working capital requirement to net revenues ratio was assumed to be 6.6% in 2014. | |
| • | A perpetual growth rate after 2014 was assumed at 3% per year. | |
| • | The weighted average cost of capital, or WACC, used in the calculation was 20%. |
82
Table of Contents
| • | There will be no major changes in the existing political, legal, fiscal and economic conditions in countries in which the reporting unit will carry on its business or to which it exports or from which it imports or sources supplies. | |
| • | There will be no major changes in the current taxation law in countries in which the reporting unit operates, that the rates of tax payable remain unchanged and that all applicable laws and regulations will be complied with. |
| (i) | determining the fair value of our shares at the date of acquisition when we have acquired another entity and the consideration given includes our common shares; and | |
| (ii) | determining the fair value of our common shares at the date of the grant of a share-based compensation award to our employees as one of the inputs into determining the grant date fair value of the award. |
83
Table of Contents
Date | Fair Value | Purpose of Valuation | ||||
| May 31, 2007 | $ | 0.13 | Envisage Solutions earn-out payment | |||
| December 1, 2007 | $ | 0.27 | Acquisition of T-est | |||
| December 31, 2007 | $ | 0.28 | Acquisition of HiSoft Wave | |||
| April 1, 2008 | $ | 0.24 | Employee share option grant | |||
| July 1, 2008 | $ | 0.28 | Employee share option grant | |||
| October 1, 2008 | $ | 0.28 | Employee share option grant | |||
| January 1, 2009 | $ | 0.25 | Employee share option and nonvested share grants | |||
| April 1, 2009 | $ | 0.27 | Employee share option and nonvested share grants | |||
| July 1, 2009 | $ | 0.28 | Employee share option grant | |||
| August 1, 2009 | $ | 0.29 | Employee nonvested share grant | |||
| December 1, 2009 | $ | 0.31 | Acquisition of AllianceSPEC | |||
| January 1, 2010 | $ | 0.39 | Employee share option and nonvested share grants | |||
| February 1, 2010 | $ | 0.47 | Employee nonvested share grant | |||
| April 1, 2010 | $ | 0.62 | Employee share option grant | |||
| May 1, 2010, June 1, 2010 and June 8, 2010* | $ | 0.63 | Employee share option and nonvested share grants | |||
| * | We determined the fair value of our common shares as of May 1, 2010, June 1, 2010 and June 8, 2010 using the mid-point of the estimated price range of our initial public offering. |
| • | The relative importance of the DCF and market multiple approaches. In determining the fair values of our common shares between January 2005 and October 2008, we assigned 70% weight to the DCF approach and 30% weight to market multiples. Under the market multiple approach, public companies similar to ours have to be identified for comparison. There was no single public company similar to us in all aspects and the trading multiples of the selected companies varied. Therefore, in deriving appropriate multiples to be used for valuation under the market approach, we had to make certain subjective adjustments to the financial metrics of the selected companies. This rendered the results obtained by the market multiple approach, less conclusive than the DCF approach. Due to the global financial crisis, which worsened in the fourth quarter of 2008, the market capitalizations of public traded comparable companies fluctuated significantly in 2009 while our operations and long-term cash flow forecast had not |
84
Table of Contents
| changed by the same degree over the same period. In view of the above, we considered the DCF approach to be more reliable than the market multiple approach in determining our fair value. We assigned 100% weighting to the DCF approach and market multiple approach as a cross-check to derive the fair value of our common shares in 2009 and 2010. |
| • | WACC. WACCs of between 15.5% and 23.5% were used. The WACC used decreased from 23.5% in January 2007 to 15.5% in April 2010. The WACCs were determined based on a consideration of factors including the risk-free rate, comparative industry risk, equity risk premium, company size and company-specific factors. This decrease in WACCs was due to the combination of (i) the continuous growth of our business and company size and (ii) additional financing obtained through the issuance of preferred shares. The decrease in WACC used for the valuation resulted in an increase in the determined fair value of the common shares. | |
| • | Comparable companies. In deriving the WACC, which is used as the discount rate under the DCF approach, and market multiples, certain publicly traded companies in the software outsourcing industry were selected for reference as our guideline companies. | |
| • | Capital market valuation multiples. American Appraisal obtained and assessed updated capital markets data of the selected comparable companies and used multiples of enterprise value to revenue, or EV/Revenue, and enterprise value to EBITDA, or EV/EBITDA, for its valuations. | |
| • | Discount for lack of marketability, or DLOM. American Appraisal quantified DLOM using the Black-Scholes option-pricing model. Under this option pricing method, the cost of the put option, which can hedge the price change before the privately held shares can be sold, was considered as a basis to determine the DLOM. This option pricing method is one of the methods commonly used in estimating DLOM as it can take into consideration factors like timing of liquidity events, such as an initial public offering, and estimated volatility of our shares. The farther the valuation date is from an expected liquidity event, the higher the put option value and thus the higher the implied DLOM. DLOMs of between 14.0% (as at January 1, 2007) and 7.0% (as at April 1, 2010) were used in our valuations. The lower DLOM that is used for the valuation, the higher is the determined fair value of the common shares. |
85
Table of Contents
| • | We experienced continual improvement in our operating and financial results during this period. The quarter to quarter growth rate of our net revenues in the third quarter and fourth quarter of 2007 were 30.3% and 21.8%, respectively. We also recorded operating income for first time in our history in the third quarter of 2007. | |
| • | In November and December 2007, we completed three acquisitions, including: (i) Shanghai Shinko Computer Technology Co., Ltd., an outsourcing technology center for an existing client, Kobe Steel Ltd.;(ii) T-est, a Singapore-based research and development services provider, which we renamed HiSoft Singapore; and (iii) Daemoyrod, an Oracle application software implementation and support specialist with operations in the United States and Mexico by merging it into HiSoft Wave, our wholly owned subsidiary. These acquisitions expanded our service offerings and our business to different geographical locations. We believed that the acquisitions would not only increase our forecasted free cash flow, but also reduce market concentration risks of our business. In view of the above, the discount rate was lowered from 22.0% as of May 2007 to 18.5% as of December 2007. |
| • | For the first quarter of 2008, we experienced a decline in operating profit margin. Our operating profit margin decreased from 3.6% in the fourth quarter of 2007 to 0.8% in the first quarter of 2008. |
86
Table of Contents
| • | There was improvement in our operations and financial results during this period. Our operating income margin increased from 0.8% in first quarter of 2008 to 5.6% in the second quarter of 2008. |
| • | As the global financial crisis worsened and business activities slowed down in developed countries in the fourth quarter of 2008, we anticipated that there would be a decrease in demand for outsourced technology services in 2009. In view of the above, we lowered the forecasted revenue and profit margin when preparing the financial projections as of January 1, 2009. | |
| • | As a result of the increase in systematic risk, the discount rate used for the valuation also increased from 18.0% as of July 1, 2008 to 19.0% January 1, 2009. |
| • | We completed the acquisition of a business process support team from AIA Information Technology (Guangzhou) Co. Ltd. in August 2009 and the testing business of MG Digital Pte Ltd., a Singapore-based research and development services provider, in October 2009. We expected that these acquisitions would strengthen our IT services team and contribute to our revenue growth rate. |
| • | Our total net revenues experienced an increase in the last quarter of 2009 as demand for our technology outsourcing services began to increase in connection with the recovery in global economic conditions. | |
| • | We completed the acquisition of 100% of AllianceSPEC, a professional IT transaction system testing company based in Singapore. We anticipated that the acquisition would strengthen our service capability and market position in Singapore. |
| • | In the three months ended March 31, 2010, we achieved net revenue growth of over 17% compared to the previous quarter and over 41% net revenue growth compared to first quarter of 2009. Our gross margin and net income also showed improvement. Based on these factors, as well as current market and operating conditions, we determined that our operations had recovered from the impact of recent global financial crisis and that recent levels of business activity would be sustainable in the foreseeable future. | |
| • | In February 2010, we completed the acquisition of 100% of Horizon Information, a professional IT testing company based in China, and in April 2010, we completed the |
87
Table of Contents
| acquisition of 100% of Echo Lane, a professional consulting services firm in the U.S. with expertise in cloud computing. We anticipate that these acquisitions will increase our scale, geographic presence and service offerings, expand our capabilities, and be a significant source of revenue growth. In view of the above, as of April 2010, we adjusted upward our estimated net income and cash flow for future periods. |
| • | During this period, we recommenced the preparation of our initial public offering and in February 2010 submitted for review by the staff of the SEC draft registration statements and correspondence relating to the offering. The estimated proximity of our initial public offering increased the liquidity of our common shares and hence we lowered the DLOM from 10% as of December 1, 2009 to 7% as of April 1, 2010. | |
| • | The discount rate used for valuation of our common shares decreased from 19% as of December 2009 to 15.5% as of April 2010 due to the combined effect of (i) the continued growth of our business and company size as well as the diversification of market concentration risks through the acquisitions of Horizon Information and Echo Lane; (ii) the proximity of this offering; and (iii) the continued improvement in overall market conditions and capital market sentiments towards comparable companies in the China IT outsourcing industry. We believed that these factors lowered the perceived risk of and market participant’s required rate of return for investing in our common shares, decreased our cost of capital, and hence, the discounted rate applied for valuing our common shares. |
| • | We experienced stronger than expected demand from our customers and potential customers during the period from April 1, 2010 to the present as evidenced by (i) the entry into new contracts with existing customers of our recent acquisitions, (ii) the increase in the number of new customers, and (iii) the increase in backlog of work orders, each of which exceeded prior estimates. | |
| • | The proximity of the impending launch of this offering, which will provide us with additional capital, enhances our ability to access capital markets to grow our business and raise our profile. |
88
Table of Contents
| Options | Options | Options | Options | |||||||||||||
| Granted 2007 | Granted 2008 | Granted 2009 | Granted 2010 | |||||||||||||
| Risk-free interest rate range | 4.30% - 5.35% | 3.90% - 4.55% | 3.04% - 3.89% | 2.82% - 4.26% | ||||||||||||
| Expected dividend yield | 0% | 0% | 0% | 0% | ||||||||||||
| Expected life | 6.1 years | 5.7 - 6.1 years | 6.0 - 6.9 years | 5.5 - 9.6 years | ||||||||||||
| Expected volatility | 47.4% - 57.2% | 43.0% - 44.0% | 48.0% - 49.0% | 47.0% - 55.0% | ||||||||||||
| Exercise price | $ | 0.25 - 0.50 | $ | 0.50 | $ | 0.30 - 0.50 | $ | 0.30 - 0.40 | ||||||||
| Fair value of the underlying common shares | $ | 0.09 - 0.28 | $ | 0.24 - 0.28 | $ | 0.25 - $0.31 | $ | 0.39 - 0.63 | ||||||||
89
Table of Contents
| Options/ | Exercise/Purchase | Fair Value of | Intrinsic | |||||||||||||
| Nonvested Shares | Price | Common Shares | Value | |||||||||||||
Grant Date | Granted | ($ / Share) | ($ / Share) | Per Option | ||||||||||||
Options: | ||||||||||||||||
| January 1, 2009 | 90,000 | 0.50 | 0.25 | 0.00 | ||||||||||||
| April 1, 2009 | 384,500 | 0.30 | 0.27 | 0.00 | ||||||||||||
| July 1, 2009 | 1,025,000 | 0.30 | 0.28 | 0.00 | ||||||||||||
| August 1, 2009 | 2,000,000 | 0.30 | 0.29 | 0.00 | ||||||||||||
| September 1, 2009 | 500,000 | 0.30 | 0.29 | 0.00 | ||||||||||||
| October 1, 2009 | 190,000 | 0.30 | 0.29 | 0.00 | ||||||||||||
| December 1, 2009 | 1,945,000 | 0.30 | 0.31 | 0.01 | ||||||||||||
| January 1, 2010 | 3,620,000 | 0.30 | 0.39 | 0.01 | ||||||||||||
| April 1, 2010 | 10,960,000 | 0.40 | 0.62 | 0.22 | ||||||||||||
| May 1, 2010 | 200,000 | 0.40 | 0.63 | 0.23 | ||||||||||||
| June 1, 2010 | 650,000 | 0.80 | 0.63 | 0.00 | ||||||||||||
Nonvested Shares: | ||||||||||||||||
| January 1, 2009 | 500,000 | 0.0001 | 0.25 | |||||||||||||
| April 1, 2009 | 530,000 | 0.0001 | 0.27 | |||||||||||||
| August 1, 2009 | 3,000,000 | 0.0001 | 0.29 | |||||||||||||
| October 1, 2009 | 10,000 | 0.0001 | 0.29 | |||||||||||||
| January 1, 2010 | 3,000,000 | 0.0001 | 0.39 | |||||||||||||
| February 1, 2010 | 2,000,000 | 0.0001 | 0.47 | |||||||||||||
| May 1, 2010 | 379,500 | 0.0001 | 0.63 | |||||||||||||
| June 8, 2010 | 10,725 | 0.0001 | 0.63 | |||||||||||||
90
Table of Contents
| Three Months | ||||||||||||||||||||
| Year Ended December 31, | Ended March 31, | |||||||||||||||||||
| 2007 | 2008 | 2009 | 2009 | 2010 | ||||||||||||||||
| (dollars in thousands) | ||||||||||||||||||||
| Net cash (used in) provided by operating activities | $ | (4,148 | ) | $ | 10,283 | $ | 13,048 | $ | 4,007 | $ | 1,470 | |||||||||
| Net cash used in investing activities | (14,438 | ) | (4,084 | ) | (4,526 | ) | (510 | ) | (3,367 | ) | ||||||||||
| Net cash provided (used in) by financing activities | 45,622 | (767 | ) | 63 | (23 | ) | (87 | ) | ||||||||||||
| Effect of foreign exchange rate changes on cash | 1,304 | 2,220 | (624 | ) | (731 | ) | 5 | |||||||||||||
| Net increase/(decrease) in cash and cash equivalents | 28,340 | 7,652 | 7,961 | 2,743 | (1,979 | ) | ||||||||||||||
| Cash at beginning of period | 10,889 | 39,229 | 46,881 | 46,881 | 54,842 | |||||||||||||||
| Cash at end of period | 39,229 | 46,881 | 54,842 | 49,624 | 52,863 | |||||||||||||||
91
Table of Contents
92
Table of Contents
| Payment Due by Period | ||||||||||||||||||||||||
| Total | Within 1 Year | 1-3 Years | 3-5 Years | More than 5 Years | Others | |||||||||||||||||||
| (dollars in thousands) | ||||||||||||||||||||||||
| Capital lease obligations | $ | 368 | $ | 181 | $ | 187 | $ | — | $ | — | $ | — | ||||||||||||
| Operating lease obligations | 18,530 | 4,336 | 5,743 | 4,228 | 4,223 | — | ||||||||||||||||||
| Other (1) | 969 | — | — | — | — | 969 | ||||||||||||||||||
| Total | $ | 19,867 | $ | 4,517 | $ | 5,930 | $ | 4,228 | $ | 4,223 | $ | 969 | ||||||||||||
| (1) | Liabilities for unrecognized tax benefits for which reasonable estimates about the timing of the payment cannot be made. |
93
Table of Contents
94
Table of Contents
95
Table of Contents
96
Table of Contents
97
Table of Contents
98
Table of Contents
99
Table of Contents
100
Table of Contents
101
Table of Contents

102
Table of Contents
| • | highly developed infrastructure; | |
| • | government support in the form of preferential land availability, incentives for creating entry-level employment and lower taxes; | |
| • | lower labor costs than the U.S., Europe, Japan and other developed countries; | |
| • | geographic and cultural proximity to Japan and Korea; and | |
| • | the desire of corporations to diversify their use of offshore IT outsourcing services to multiple delivery locations and providers. |
103
Table of Contents
104
Table of Contents
| • | legacy mainframe application maintenance; | |
| • | database management including data cleansing, data migration and various other data warehouse-related tasks; | |
| • | technical support and enhancements; and | |
| • | helpdesk and functional support. |
| • | customer relationship management solutions such as those from Oracle Siebel and Salesforce.com; | |
| • | business intelligence and analytics solutions such as those from Business Objects, Cognos, Informatica and SAS; | |
| • | enterprise resource planning solutions such as those from Oracle’s platform and, to a lesser extent, SAP; and | |
| • | enterprise applications integration and web services solutions such as those from SeeBeyond, TIBCO and WebMethods. |
105
Table of Contents
106
Table of Contents
107
Table of Contents
| • | American International Group, Inc. (namely, AIG Star Life Insurance Co., Ltd., AIG Edison Life Insurance Company and a life insurance subsidiary); | |
| • | Citrix (namely, Citrix Systems Inc.); | |
| • | DirecTV Operations, LLC; | |
| • | General Electric (namely, General Electric International, Inc.); | |
| • | Microsoft Corporation; | |
| • | Nomura Research Institute, Ltd.; |
108
Table of Contents
| • | Olympus Corporation (namely, Olympus Medical Systems Corp.); | |
| • | UBS (namely, UBS AG Hong Kong Branch); | |
| • | a U.S.-based multinational computer, technology and IT consulting company (specifically, a subsidiary based in China); and | |
| • | a U.S.-based multinational IT company (specifically, its subsidiaries based in China, Europe, Singapore and the U.S.). |
| % of Net Revenues for | Three Months Ended | |||||||||||
Client Location | 2008 | 2009 | March 31, 2010 | |||||||||
| United States | 58.3 | % | 59.6 | % | 55.3 | % | ||||||
| Japan | 23.0 | % | 25.3 | % | 23.4 | % | ||||||
| Europe | 15.6 | % | 10.1 | % | 10.6 | % | ||||||
| China (including Hong Kong) | 2.3 | % | 3.1 | % | 6.4 | % | ||||||
| Others | 0.8 | % | 1.9 | % | 4.3 | % | ||||||
| % of Net Revenues for | Three Months Ended | |||||||||||
Client Industry | 2008 | 2009 | March 31, 2010 | |||||||||
| Technology | 54.3 | % | 61.5 | % | 60.9 | % | ||||||
| BFSI | 29.0 | % | 23.7 | % | 24.6 | % | ||||||
| Others(1) | 16.7 | % | 14.8 | % | 14.5 | % | ||||||
| (1) | Includes manufacturing, telecommunications and life sciences. |
| 2008 | 2009 | |||||||
³ $1 million, < $5 million | 15 | 16 | ||||||
³ $5 million, < $10 million | 3 | 4 | ||||||
³ $10 million | 2 | 1 | ||||||
109
Table of Contents
110
Table of Contents
| • | global offshore outsourced technology services companies such as Cognizant Technology Solutions, HCL Technologies, Infosys Technologies, Patni Computer Systems, Tata Consultancy Services and Wipro Technologies; | |
| • | China-based technology outsourcing service providers such as Beyondsoft, Chinasoft, Dalian Hi-think Computer (DHC), iSoftStone, Neusoft, SinoCom and VanceInfo; | |
| • | certain divisions of large multinational technology firms; and | |
| • | in-house IT departments of our clients and potential clients. |
111
Table of Contents
112
Table of Contents
Location | Space | Usage of Property | ||||
| (in square meters) | ||||||
| China: | ||||||
| Dalian | 12,996 | Headquarters and Delivery Center | ||||
| Beijing | 5,901 | General Administration/Delivery Center | ||||
| Chengdu | 265 | Delivery Center | ||||
| Guangzhou | 520 | Delivery Center | ||||
| Shanghai | 1,673 | Delivery Center | ||||
| Shenzhen | 2,859 | Delivery Center | ||||
| Wuxi | 22,000 | Delivery Center | ||||
| Nanjing | 100 | Sales and Service Office | ||||
| Total | 46,314 | |||||
| Hong Kong | 134 | Onshore Office | ||||
| Japan: | ||||||
| Tokyo | 289 | Onshore Office | ||||
| United States: | ||||||
| Atlanta | 14 | Onshore Office | ||||
| Irvine | 14 | Onshore Office | ||||
| San Francisco | 325 | Onshore Office | ||||
| San Jose | 102 | Onshore Office | ||||
| Total | 455 | |||||
| Singapore | 7,120 | Delivery Center | ||||
| Singapore | 207 | Onshore Office | ||||
113
Table of Contents
114
Table of Contents
| • | Certification Standards and Administrative Measures of Software Enterprises (Tentative) (2000); | |
| • | Certain Policies for Encouraging Development of the Software Industry and Integrated Circuits Industry (2000); | |
| • | Software Products Administrative Measures (2009); | |
| • | Circular Concerning Relevant Questions Regarding Software Exports (2001); | |
| • | Circular on Printing and Distributing the Measures on Management and Statistics of Software Export (2001); | |
| • | Administrative Measures on Verification of Key Software Enterprises within the State Plan (2005); and | |
| • | Certain Provisions on Protection of Information of Service Outsourcing Business Undertaken by Domestic Enterprises (2010). |
115
Table of Contents
116
Table of Contents
117
Table of Contents
118
Table of Contents
Name | Age | Position/Title | ||||
| Cheng Yaw Sun | 53 | Executive chairman and director | ||||
| Tiak Koon Loh | 52 | Director and chief executive officer | ||||
| Jenny Lee | 38 | Director | ||||
| Terry McCarthy | 66 | Independent director | ||||
| Venkatachalam Krishnakumar | 60 | Independent director | ||||
| Christine Lu-Wong | 41 | Executive vice president and chief financial officer | ||||
| Yong Ji Sun | 46 | Executive vice president of strategic relationships and special projects | ||||
| Jin Song Li | 41 | Executive vice president of Japan business unit | ||||
| Kevin Bai | 39 | Senior vice president of China business unit | ||||
| Jun Su | 39 | Senior vice president of U.S. business unit | ||||
119
Table of Contents
120
Table of Contents
| • | convening shareholders’ annual general meetings and reporting its work to shareholders at such meetings; | |
| • | issuing authorized but unissued shares; | |
| • | declaring dividends and distributions; | |
| • | exercising the borrowing powers of our company and mortgaging the property of our company; | |
| • | approving the transfer of shares of our company, including the registering of such shares; and | |
| • | exercising any other powers conferred by the shareholders’ meetings or under our amended and restated memorandum and articles of association. |
121
Table of Contents
| • | selecting the independent auditor; | |
| • | pre-approving auditing and non-auditing services permitted to be performed by the independent auditor; | |
| • | annually reviewing the independent auditor’s report describing the auditing firm’s internal quality control procedures, any material issues raised by the most recent internal quality control review, or peer review, of the independent auditors and all relationships between the independent auditor and our company; | |
| • | setting clear hiring policies for employees and former employees of the independent auditors; | |
| • | reviewing with the independent auditor any audit problems or difficulties and management’s response; | |
| • | reviewing and approving all related party transactions on an ongoing basis; | |
| • | reviewing and discussing the annual audited financial statements with management and the independent auditor; | |
| • | reviewing and discussing with management and the independent auditors major issues regarding accounting principles and financial statement presentations; | |
| • | reviewing reports prepared by management or the independent auditors relating to significant financial reporting issues and judgments; | |
| • | discussing earnings press releases with management, as well as financial information and earnings guidance provided to analysts and rating agencies; | |
| • | reviewing with management and the independent auditors the effect of regulatory and accounting initiatives, as well as off-balance sheet structures, on our financial statements; | |
| • | discussing policies with respect to risk assessment and risk management with management, internal auditors and the independent auditor; |
122
Table of Contents
| • | timely reviewing reports from the independent auditor regarding all critical accounting policies and practices to be used by our company, all alternative treatments of financial information within U.S. GAAP that have been discussed with management and all other material written communications between the independent auditor and management; | |
| • | establishing procedures for the receipt, retention and treatment of complaints received from our employees regarding accounting, internal accounting controls or auditing matters and the confidential, anonymous submission by our employees of concerns regarding questionable accounting or auditing matters; | |
| • | annually reviewing and reassessing the adequacy of our audit committee charter; | |
| • | such other matters that are specifically delegated to our audit committee by our board of directors from time to time; | |
| • | meeting separately, periodically, with management, internal auditors and the independent auditor; and | |
| • | reporting regularly to the full board of directors. |
| • | reviewing, evaluating and, if necessary, revising our overall compensation policies; | |
| • | reviewing and evaluating the performance of our directors and senior officers and determining the compensation of our senior officers; | |
| • | reviewing and approving our senior officers’ employment agreements with us; | |
| • | setting performance targets for our senior officers with respect to our incentive-compensation plan and equity-based compensation plans; | |
| • | administering our equity-based compensation plans in accordance with the terms thereof; and | |
| • | such other matters that are specifically delegated to the compensation committee by our board of directors from time to time. |
123
Table of Contents
124
Table of Contents
| Vesting at the End of | ||||||||
| Vesting on the First | Each Quarter after the | |||||||
| Anniversary of the | First Anniversary of | |||||||
Total Vesting Period | Award Date | the Award Date | ||||||
| 4 years | 25.0 | % | 6.25 | % | ||||
| 3 years | 34.0 | % | 8.25 | % | ||||
| 2 years | 50.0 | % | 12.50 | % | ||||
125
Table of Contents
| Exercise/ | ||||||||
| Purchase | ||||||||
Name | Number of Common Shares | Price | Grant Date | Expiration Date | ||||
| ($/Common | ||||||||
| Share) | ||||||||
| Cheng Yaw Sun | 200,000 | 0.50 | November 13, 2007 | November 12, 2017 | ||||
| Cheng Yaw Sun | 600,000 | 0.50 | March 1, 2008 | February 28, 2018 | ||||
| Cheng Yaw Sun | 2,000,000 | 0.30 | August 1, 2009 | July 31, 2019 | ||||
| Cheng Yaw Sun | 3,000,000 (nonvested common shares) | 0.0001 | January 11, 2010 | N/A | ||||
| Cheng Yaw Sun | 2,500,000 (1) | 0.40 | April 1, 2010 | March 31, 2020 | ||||
| Tiak Koon Loh | 8,550,000 | 0.25 | June 1, 2006 | May 31, 2016 | ||||
| Tiak Koon Loh | 6,700,000 (nonvested common shares) | 0.0001 | June 1, 2006 | N/A | ||||
| Tiak Koon Loh | 1,190,750 (nonvested common shares) | 0.0001 | October 1, 2007 | N/A | ||||
| Tiak Koon Loh | 1,000,000 (1) | 0.40 | April 1, 2010 | March 31, 2020 | ||||
| Terry McCarthy | 200,000 | 0.50 | November 13, 2007 | November 12, 2017 | ||||
| Venkatachalam Krishnakumar | 200,000 | 0.40 | May 1, 2010 | April 30, 2020 | ||||
| Christine Lu-Wong | 1,500,000 | 0.30 | January 1, 2010 | December 31, 2019 | ||||
| Christine Lu-Wong | 150,000 (1) | 0.40 | April 1, 2010 | March 31, 2020 | ||||
| Christine Lu-Wong | 500,000 | 0.80 | June 1, 2010 | May 31, 2020 | ||||
| Yong Ji Sun | 307,353 (nonvested common shares) | 0.0001 | October 1, 2007 | N/A | ||||
| Yong Ji Sun | 125,000 (nonvested common shares) | 0.0001 | January 1, 2009 | N/A | ||||
| Yong Ji Sun | 500,000 | 0.30 | December 1, 2009 | November 30, 2019 | ||||
| Yong Ji Sun | 150,000 (1) | 0.40 | April 1, 2010 | March 31, 2020 | ||||
| Jin Song Li | 150,000 | 0.10 | January 1, 2005 | December 31, 2014 | ||||
| Jin Song Li | 1,250,000 | 0.25 | July 1, 2006 | June 30, 2016 | ||||
| Jin Song Li | 300,000 | 0.25 | January 1, 2006 | December 31, 2015 | ||||
| Jin Song Li | 400,000 | 0.50 | November 13, 2007 | November 12, 2017 | ||||
| Jin Song Li | 188,941 (nonvested common shares) | 0.0001 | October 1, 2007 | N/A | ||||
| Jin Song Li | 125,000 (nonvested common shares) | 0.0001 | January 1, 2009 | N/A | ||||
| Jin Song Li | 200,000 (1) | 0.40 | April 1, 2010 | March 31, 2020 | ||||
| Kevin Bai | 600,000 | 0.50 | December 18, 2007 | December 17, 2017 |
126
Table of Contents
| Exercise/ | ||||||||
| Purchase | ||||||||
Name | Number of Common Shares | Price | Grant Date | Expiration Date | ||||
| ($/Common | ||||||||
| Share) | ||||||||
| Kevin Bai | 50,000 (nonvested common shares) | 0.0001 | April 1, 2009 | N/A | ||||
| Kevin Bai | 300,000 (1) | 0.40 | April 1, 2010 | March 31, 2020 | ||||
| Jun Su | 1,250,000 | 0.30 | January 1, 2010 | December 31, 2019 | ||||
| Jun Su | 300,000 (1) | 0.40 | April 1, 2010 | March 31, 2020 |
| (1) | The April 1, 2010 option grant is subject to our company attaining a value of $400 million by August 31, 2010. For more information, see “— Share Options and Other Share Awards Granted to Directors, Executive Officers and Employees.” |
127
Table of Contents
| • | each person known to us to own beneficially more than 5.0% of our common shares; | |
| • | each of our directors and executive officers; and | |
| • | each other selling shareholder participating in this offering. |
| Shares to be | ||||||||||||||||||||||||
| Shares Beneficially | Sold by Selling | Shares Beneficially | ||||||||||||||||||||||
| Owned Prior | Shareholders | Owned After | ||||||||||||||||||||||
| to This Offering | in This Offering | This Offering | ||||||||||||||||||||||
| Number | Percent | Number | Percent | Number | Percent | |||||||||||||||||||
Directors and Executive Officers: | ||||||||||||||||||||||||
| Yong Ji Sun (1) | 34,569,768 | 8.5% | – | – | 34,569,768 | 6.5 | % | |||||||||||||||||
| Tiak Koon Loh (2) | 18,484,868 | 4.5% | – | – | 18,484,868 | 3.5 | % | |||||||||||||||||
| Cheng Yaw Sun | * | * | – | – | * | * | ||||||||||||||||||
| Jenny Lee | – | – | – | – | – | – | ||||||||||||||||||
| Terry McCarthy | * | * | – | – | * | * | ||||||||||||||||||
| Venkatachalam Krishnakumar | * | * | – | – | * | * | ||||||||||||||||||
| Christine Lu-Wong | – | – | – | – | – | – | ||||||||||||||||||
| Jin Song Li | * | * | – | – | * | * | ||||||||||||||||||
| Kevin Bai | * | * | – | – | * | * | ||||||||||||||||||
| Jun Su | – | – | – | – | – | – | ||||||||||||||||||
| Directors and Executive Officers as a Group | 58,894,723 | 14.4% | – | – | 58,894,723 | 11.1 | % | |||||||||||||||||
Principal and Selling Shareholders: | ||||||||||||||||||||||||
| Granite Global Ventures (3) | 92,054,882 | 22.6% | – | – | 92,054,882 | 17.4 | % | |||||||||||||||||
| International Finance Corporation (4) | 48,307,117 | 11.9% | 5,693,065 | 1.4 | % | 42,614,052 | 8.1 | % | ||||||||||||||||
128
Table of Contents
| Shares to be | ||||||||||||||||||||||||
| Shares Beneficially | Sold by Selling | Shares Beneficially | ||||||||||||||||||||||
| Owned Prior | Shareholders | Owned After | ||||||||||||||||||||||
| to This Offering | in This Offering | This Offering | ||||||||||||||||||||||
| Number | Percent | Number | Percent | Number | Percent | |||||||||||||||||||
| JAFCO Asia Technology Fund II (5) | 33,523,000 | 8.2% | 3,950,746 | 1.0 | % | 29,572,254 | 5.6 | % | ||||||||||||||||
| Draper Fisher Jurvetson ePlanet Ventures (6) | 33,345,881 | 8.2% | – | – | 33,345,881 | 6.3 | % | |||||||||||||||||
| Tian Hai International Limited (7) | 31,908,327 | 7.8% | – | – | 31,908,327 | 6.0 | % | |||||||||||||||||
| Intel Capital (Cayman) Corporation (8) | 31,566,000 | 7.8% | 3,720,105 | 0.9 | % | 27,845,895 | 5.3 | % | ||||||||||||||||
| GE Capital Equity Investments Ltd. (9) | 29,411,764 | 7.2% | 3,466,227 | 0.9 | % | 25,945,537 | 4.9 | % | ||||||||||||||||
| Kaiki Inc. (10) | 22,500,625 | 5.5% | – | – | 22,500,625 | 4.3 | % | |||||||||||||||||
| Sumitomo Corporation Equity Asia Limited (11) | 14,411,765 | 3.5% | 1,698,448 | 0.4 | % | 12,713,317 | 2.4 | % | ||||||||||||||||
| Mitsubishi UFJ (12) | 4,000,000 | 1.0% | 471,409 | 0.1 | % | 3,528,591 | 0.7 | % | ||||||||||||||||
| * | Beneficially owns less than 1% of our common shares. | |
| (1) | Includes 369,853 nonvested common shares subject to a repurchase right by the company, 31,908,327 common shares held by Tian Hai International Limited and 2,320,588 common shares issuable upon conversion of our convertible redeemable preferred shares held by Kornhill Consulting Ltd. Tian Hai International Limited is a British Virgin Islands company whose beneficial owner is Yong Ji Sun, our senior vice president. Kornhill Consulting Ltd. is a British Virgin Islands company owned by Yong Ji Sun and Tiak Koon Loh, our directors, and other employees and former employees. | |
| (2) | Includes 7,890,750 nonvested common shares subject to a repurchase right by the company, 8,550,000 common shares issuable upon exercise of options held by Tiak Koon Loh, and 2,044,118 common shares issuable upon conversion of our convertible redeemable preferred shares held by Kornhill Consulting Ltd., a British Virgin Islands company owned by Yong Ji Sun and Tiak Koon Loh, our directors and other employees and former employees. | |
| (3) | Includes 818,193 common shares issuable upon conversion of our convertible redeemable preferred shares held by Granite Global Ventures L.P., 42,464,206 common shares issuable upon conversion of our convertible redeemable preferred shares held by Granite Global Ventures II L.P., 47,883,748 common shares issuable upon conversion of our convertible redeemable preferred shares held by Granite Global Ventures (Q.P.) L.P., and 888,735 common shares issuable upon conversion of our convertible redeemable preferred shares held by GGV II Entrepreneurs Fund L.P. Granite Global Ventures L.P., Granite Global Ventures II L.P., Granite Global Ventures (Q.P.) L.P., and GGV II Entrepreneurs Fund L.P. are all Delaware limited partnerships and are affiliated entities. Granite Global Ventures L.L.C., which has four managing directors: Scott Bonham, Joel Kellman, Hany Nada and Thomas Ng, is the general partner of Granite Global Ventures (Q.P.) L.P. and Granite Global Ventures L.P. The managing directors of Granite Global Ventures L.L.C. share voting and investment power with respect to the shares held by Granite Global Ventures (Q.P.) L.P. and Granite Global Ventures L.P. Piper Jaffray & Co., a limited partner of Granite Global Ventures II L.P., and a member of Granite Global Ventures L.L.C. is a U.S. registered broker-dealer. Granite Global Ventures II L.L.C., which has seven managing directors: Scott Bonham, Joel Kellman, Hany Nada, Thomas Ng, Jixun Foo, Jenny Lee and Glenn Solomon, is the general partner of Granite Global Ventures II L.P. and of GGV II Entrepreneurs Fund L.P. The managing directors of Granite Global Ventures II L.L.C. share voting and investment power with respect to the shares held by Granite Global Ventures II L.P. and GGV II Entrepreneurs Fund L.P. The registered address of each of Granite Global Ventures L.P., Granite Global Ventures II L.P., Granite Global Ventures (Q.P.) L.P. and GGV II Entrepreneurs Fund L.P. is 2494 Sand Hill Road, Suite 100, Menlo Park, CA 94025. | |
| (4) | Includes 48,307,117 common shares issuable upon conversion of our convertible redeemable preferred shares held by International Finance Corporation, an international organization established by Articles of Agreement among its member countries. The registered address of International Finance Corporation is 2121 Pennsylvania Avenue, N.W., Washington, DC 20433. In addition, International Finance Corporation has granted the underwriters an option to purchase up to 3,968,340 common shares or 1.0% of our common |
129
Table of Contents
| shares, to cover over-allotments. If the underwriters exercise in full the over-allotment option granted by the selling shareholders, International Finance Corporation will beneficially own 38,645,712 common shares or 7.3% of our common shares after the offering. | ||
| (5) | Includes 33,523,000 common shares issuable upon conversion of our convertible redeemable preferred shares held by JAFCO Asia Technology Fund II, a Cayman Islands exempted company. JAFCO Asia Technology Fund II is wholly owned by JAFCO Asia Technology Fund II L.P., a limited partnership established in the Cayman Islands. JAFCO Asia Technology Holdings II Limited, a Cayman Islands company and a wholly owned subsidiary of JAFCO Investment (Asia Pacific) Ltd., is the sole general partner of JAFCO Asia Technology Fund II L.P. and controls the voting and investment power over the shares owned by JAFCO Asia Technology Fund II. JAFCO Investment (Asia Pacific) Ltd. is wholly owned by JAFCO Co., Ltd., a public company listed on the Tokyo Stock Exchange. The address for JAFCO Asia Technology Fund II isc/o JAFCO Investment (Asia Pacific) Limited, 6 Battery Road, #42-01, Singapore 049909. In addition, JAFCO Asia Technology Fund II has granted the underwriters an option to purchase up to 5,384,106 common shares or 1.3% of our common shares, to cover over-allotments. If the underwriters exercise in full the over-allotment option granted by the selling shareholders, JAFCO Asia Technology Fund II will beneficially own 24,188,148 common shares or 4.6% of our common shares after the offering. | |
| (6) | Includes 32,112,085 common shares issuable upon conversion of our convertible redeemable preferred shares held by Draper Fisher Jurvetson ePlanet Ventures L.P., a Cayman Islands limited partnership, 666,917 common shares issuable upon conversion of our convertible redeemable preferred shares held by Draper Fisher Jurvetson ePlanet Partners Fund, LLC, a California limited liability company, and 566,879 common shares issuable upon conversion of our convertible redeemable preferred shares held by Draper Fisher Jurvetson ePlanet Ventures GmbH & Co. KG, a German limited partnership. Draper Fisher Jurvetson ePlanet Ventures L.P., Draper Fisher Jurvetson ePlanet Partners Fund, LLC and Draper Fisher Jurvetson ePlanet Ventures GmbH & Co. KG are affiliated entities. Mr. Timothy C. Draper, Mr. John H. N. Fisher, Mr. Stephen T. Jurvetson and Mr. Asad Jamal, as managing directors of Draper Fisher Jurvetson ePlanet Partners, Ltd. (a Cayman Islands company and the sole general partner of Draper Fisher Jurvetson ePlanet Ventures L.P.,) control the voting and investment power over the shares owned by Draper Fisher Jurvetson ePlanet Ventures L.P. Messrs. Draper, Fisher, Jurvetson and Jamal disclaim beneficial ownership of the shares held directly by Draper Fisher Jurvetson ePlanet Ventures L.P., and Draper Fisher Jurvetson ePlanet Partners, Ltd., except to the extent of their respective pecuniary interests therein. Mr. Timothy C. Draper, Mr. John H. N. Fisher and Mr. Stephen T. Jurvetson as managing members of Draper Fisher Jurvetson ePlanet Partners Fund, LLC control the voting power over the shares owned by Draper Fisher Jurvetson ePlanet Partners Fund, LLC. Messrs. Draper, Fisher and Jurvetson disclaim beneficial ownership of the shares held directly by Draper Fisher Jurvetson ePlanet Partners Fund, LLC, except to the extent of their respective pecuniary interests therein. Mr. Timothy C. Draper, Mr. John H. N. Fisher, Mr. Stephen T. Jurvetson and Mr. Asad Jamal, as managing directors of Draper Fisher Jurvetson ePlanet Verwaltungs GmbH (a German company and the sole general partner of Draper Fisher Jurvetson ePlanet Ventures GmbH & Co. KG) control the voting and investment power over the shares owned by Draper Fisher Jurvetson ePlanet Ventures GmbH & Co. KG. Messrs. Draper, Fisher, Jurvetson and Jamal disclaim beneficial ownership of the shares held directly by Draper Fisher Jurvetson ePlanet Ventures GmbH & Co. KG, and Draper Fisher Jurvetson ePlanet Verwaltungs GmbH, except to the extent of their respective pecuniary interests therein. The registered address for Draper Fisher Jurvetson ePlanet Ventures L.P. is c/o Walkers, PO Box 265 GT, Walkers House, Mary Street, George Town, Grand Cayman, Cayman Islands. The registered address for Draper Fisher Jurvetson ePlanet Partners Fund, LLC is 2882 Sand Hill Road, Suite 150, Menlo Park, California, 94025, U.S.A. The registered address for Draper Fisher Jurvetson ePlanet GmbH & Co. KG is c/o Regus, Landsberger Strasse 155, 80687 München, Germany. | |
| (7) | Includes 31,908,327 common shares held by Tian Hai International Limited, a British Virgin Islands company whose beneficial owner is Yong Ji Sun, our executive vice president. The address of Tian Hai International Limited is Block 103, #06-108, Spottiswoode Park, 080103 Singapore. | |
| (8) | Includes 31,566,000 common shares issuable upon conversion of our convertible redeemable preferred shares held by Intel Capital (Cayman) Corporation, an exempted company incorporated in the Cayman Islands wholly owned by Intel Corporation. The shares of Intel Corporation are listed on Nasdaq. The registered office of Intel Capital (Cayman) Corporation is Caledonian House, 69 Dr. Roy’s Dr., PO Box 1043, George Town, Grand Cayman, Cayman Islands. In addition, Intel Capital (Cayman) Corporation has granted the underwriters an option to purchase up to 5,069,789 common shares or 1.2% of our common shares, to cover over-allotments. If the underwriters exercise in full the over-allotment option granted by the selling shareholders, Intel Capital (Cayman) Corporation will beneficially own 22,776,106 common shares or 4.3% of our common shares after the offering. | |
| (9) | Includes 29,411,764 common shares issuable upon conversion of our convertible redeemable preferred shares held by GE Capital Equity Investments Ltd., a Cayman Islands company. GE Capital Equity Investments Ltd. is indirectly wholly owned by General Electric Company. The shares of General Electric Company are listed on the New York Stock Exchange. The registered address for GE Capital Equity Investments Ltd. is Cricket Square, |
130
Table of Contents
| Hutchison Drive, PO Box 2681, Grand Cayman, KYI-1111, Cayman Islands. In addition, GE Capital Equity Investments Ltd. has granted the underwriters an option to purchase up to 4,723,799 common shares or 1.2% of our common shares, to cover over-allotments. If the underwriters exercise in full the over-allotment option granted by the selling shareholders, GE Capital Equity Investments Ltd. will beneficially own 21,221,738 common shares or 4.0% of our common shares after the offering. | ||
| (10) | Includes 22,500,625 common shares held by Kaiki Inc., a British Virgin Islands company owned by certain individuals who are our current or former employees. The registered address for Kaiki Inc. is Romasco Place, Wickhams Cay I, P.O. Box 3140, Road Town, Tortola, British Virgin Islands. | |
| (11) | Includes 14,411,765 common shares issuable upon conversion of our convertible redeemable preferred shares held by Sumitomo Corporation Equity Asia Limited, a company incorporated in Hong Kong. Sumitomo Corporation Equity Asia Limited is a wholly owned subsidiary of Sumitomo Corporation. The shares of Sumitomo Corporation are listed on the Tokyo Stock Exchange. The registered address for Sumitomo Corporation Equity Asia Limited is Suite 602, One International Finance Centre, No. 1 Harbour View Street, Central, Hong Kong. In addition to the shares to be sold, Sumitomo Corporation Equity Asia Limited has granted underwriters an option to purchase up to 1,301,538 common shares or 0.3% of our common shares, to cover over-allotments. If the underwriters exercise in full the over-allotment option granted by the selling shareholders, Sumitomo Corporation Equity Asia Limited will beneficially own 11,411,779 common shares or 2.2% of our common shares after the offering. | |
| (12) | Includes 4,000,000 common shares issuable upon conversion of our convertible redeemable preferred shares held by Butterfield Bank (Cayman) Limited as trustee of the Greater China Trust, a Cayman Island trust managed by Mitsubishi UFJ Securities (HK) Capital, Limited and whose sole beneficiary is MUS Principal Investments Co., Ltd. Both Mitsubishi UFJ Securities (HK) Capital, Limited and MUS Principal Investments Co., Ltd. are indirectly wholly owned subsidiaries of Mitsubishi UFJ Financial Group, Inc. The shares of Mitsubishi UFJ Financial Group, Inc. are listed on the Tokyo Stock Exchange and the New York Stock Exchange. The registered address for Mitsubishi UFJ Securities (HK) Capital, Limited is 11/F AIA Central, 1 Connaught Road, Central, Hong Kong and the registered address for MUS Principal Investments Co., Ltd. is Mitsubishi Building, 2-5-2, Marunouchi, Chiyoda-ku, Tokyo 100-0005. In addition, Mitsubishi UFJ has granted the underwriters an option to purchase up to 642,428 common shares or 0.2% of our common shares, to cover over-allotments. If the underwriters exercise in full the over-allotment option granted by the selling shareholders, Mitsubishi UFJ will beneficially own 2,886,163 common shares or 0.5% of our common shares after the offering. |
Name of Shareholder | Shares Owned | Percentage | ||||||
| Hualu Corporation (BVI) Ltd. | 42,249,375 common shares | 65.25 | % | |||||
| Kaiki, Inc. | 22,500,625 common shares | 34.75 | % | |||||
131
Table of Contents
132
Table of Contents
133
Table of Contents
134
Table of Contents
135
Table of Contents
| • | copies of any quarterly, interim, annual, extraordinary or other reports, if any, filed by us promptly after we file any such documents with the SEC or any other relevant securities exchange, regulatory authority or government agency and when such documents are also generally available to our other shareholders; and | |
| • | copies of any annual reports to shareholders or other materials delivered to all other shareholders. |
| • | the total offering proceeds to our company are no less than $50 million; and | |
| • | the market capitalization as a result of such public offering is no less than $350 million. |
136
Table of Contents
137
Table of Contents
| • | Mr. Li worked as an advisor to us through 2008 for which he received $0.4 million and options for the purchase of 1,000,000 of our common shares under our share incentive plan; | |
| • | Dalian Borui Information Technology Co., Ltd., or Dalian Borui, a company wholly owned by Mr. Li, provided consulting service to Haihui Dalian until December 31, 2008; | |
| • | Mr. Li and all other then current shareholders of Haihui Dalian transferred all of their equity interest in Haihui Dalian to our nominees; | |
| • | Dalian Borui had intended to purchase 40% equity interest in JBDK Company Limited from Haihui Dalian for cash consideration of $1.00 but the parties later cancelled the transaction; the investment had been fully written off as of December 31, 2005 as Haihui Dalian’s share of JBDK Company Limited’s losses had exceeded the investment cost, and JBDK Company Limited was liquidated; | |
| • | A third party designated by Mr. Li purchased all the ownership interest in the Training Center, a wholly owned subsidiary of Haihui Dalian, from Haihui Dalian for cash consideration of RMB0.8 million ($0.1 million); | |
| • | Dalian Borui purchased certain properties from Haihui Dalian, including a building, land use rights and a car, for cash consideration of RMB10.9 million ($1.6 million); | |
| • | Haihui Dalian has licensed its trademark “Haihui” (in Chinese character) to the Training Center for five years; | |
| • | HiSoft Dalian extended a loan of RMB16.6 million ($2.4 million) to Mr. Li free of interest for purchasing of a building, land use rights, a car and the Training Center, the establishment of Dalian Borui and the operation of the Training Center after the transfer described above, which loan is repayable on the earlier of (i) six months after the closing of this offering, provided that Kaiki Inc. can freely transfer the shares it holds in our company, or (ii) three years after the date of the loan agreement; |
138
Table of Contents
| • | HiSoft Dalian extended a loan of RMB0.1 million ($12,200) to Mr. Li free of interest for the establishment and operation of Dalian Borui, which has been repaid in full; and | |
| • | Mr. Li pledged 3,072,085 of our common shares held by him through Kaiki Inc. to HiSoft Dalian to secure the RMB16.6 million loan described above. |
139
Table of Contents
140
Table of Contents
| • | the instrument of transfer is lodged with us, accompanied by the certificate for the common shares to which it relates and such other evidence as our board of directors may reasonably require to show the right of the transferor to make the transfer; | |
| • | the instrument of transfer is in respect of only one class of common shares; | |
| • | the instrument of transfer is properly stamped, if required; | |
| • | the common shares transferred are fully paid and free of any lien in favor of us; | |
| • | any fee related to the transfer has been paid to us; and | |
| • | the transfer is not to more than four joint holders. |
141
Table of Contents
142
Table of Contents
| • | increase the share capital by such sum, to be divided into shares of such classes and amount, as the resolution shall prescribe; | |
| • | consolidate and divide all or any of our share capital into shares of a larger amount than our existing shares; | |
| • | sub-divide our existing shares, or any of them into shares of a smaller amount; or | |
| • | cancel any shares which, at the date of the passing of the resolution, have not been taken or agreed to be taken by any person and diminish the amount of our share capital by the amount of the shares so cancelled. |
| • | an exempted company does not have to file an annual return of its shareholders with the Registrar of Companies; | |
| • | an exempted company’s register of members is not open to inspection; | |
| • | an exempted company does not have to hold an annual general meeting; | |
| • | an exempted company may issue no par value, negotiable or bearer shares; | |
| • | an exempted company may obtain an undertaking against the imposition of any future taxation (such undertakings are usually given for 20 years in the first instance); | |
| • | an exempted company may register by way of continuation in another jurisdiction and be deregistered in the Cayman Islands; | |
| • | an exempted company may register as a limited duration company; and | |
| • | an exempted company may register as a segregated portfolio company. |
143
Table of Contents
| • | the statutory provisions as to the required majority vote have been met; | |
| • | the shareholders have been fairly represented at the meeting in question and the statutory majority are acting bona fide without coercion of the minority to promote interests adverse to those of the class; | |
| • | the arrangement is such that may be reasonably approved by an intelligent and honest man of that class acting in respect of his interest; and |
144
Table of Contents
| • | the arrangement is not one that would more properly be sanctioned under some other provision of the Companies Law. |
| • | a company acts or proposes to act illegally orultra vires; | |
| • | the act complained of, although notultra vires,could only be effected duly if authorized by more than a simple majority vote that has not been obtained; and | |
| • | those who control the company are perpetrating a “fraud on the minority.” |
145
Table of Contents
146
Table of Contents
147
Table of Contents
148
Table of Contents
| • | ifForm F-3 becomes unavailable for such offering by the holders; | |
| • | if the holders, together with the holders of any other securities of our company entitled to inclusion in such registration, propose to sell registrable securities and such other securities, if any, at an aggregate price to the public of less than $1.0 million; | |
| • | if we have, within the six-month period preceding the date of such request, already effected a registration under the Securities Act other than a registration from which the registrable securities of holders have been excluded, with respect to all or any portion of the registrable securities the holders requested be included in such registration, pursuant to the provisions relating to underwriting in a piggyback registration; or | |
| • | in any particular jurisdiction in which we would be required to quality to do business or to execute a general consent to service of process in effecting such registration, qualification or compliance. |
149
Table of Contents
150
Table of Contents
| • | Cash. The depositary will convert any cash dividend or other cash distribution we pay on the common shares or any net proceeds from the sale of any common shares, rights, securities or other entitlements into U.S. dollars if it can do so on a reasonable basis, and can transfer the U.S. dollars to the United States. If that is not possible or lawful or if |
151
Table of Contents
| any government approval is needed and cannot be obtained, the deposit agreement allows the depositary to distribute the foreign currency only to those ADS holders to whom it is possible to do so. It will hold the foreign currency it cannot convert for the account of the ADS holders who have not been paid. It will not invest the foreign currency and it will not be liable for any interest. |
| • | Before making a distribution, any taxes or other governmental charges, together with fees and expenses of the depositary, that must be paid, will be deducted. See “Taxation.” It will distribute only whole U.S. dollars and cents and will round fractional cents to the nearest whole cent.If the exchange rates fluctuate during a time when the depositary cannot convert the foreign currency, you may lose some or all of the value of the distribution. | |
| • | Shares. The depositary may, upon our timely instruction, distribute additional ADSs representing any common shares we distribute as a dividend or free distribution to the extent reasonably practicable and permissible under law. The depositary will only distribute whole ADSs. It will try to sell common shares which would require it to deliver a fractional ADS and distribute the net proceeds in the same way as it does with cash. If the depositary does not distribute additional ADSs, the outstanding ADSs will also represent the new common shares. The depositary may sell a portion of the distributed common shares sufficient to pay its fees and expenses in connection with that distribution. | |
| • | Elective Distributions in Cash or Shares. If we offer holders of our common shares the option to receive dividends in either cash or shares, the depositary, after consultation with us and having received timely notice of such elective distribution by us, has discretion to determine to what extent such elective distribution will be made available to you as a holder of the ADSs. We must first instruct the depositary to make such elective distribution available to you and furnish it with satisfactory evidence that it is legal to do so. The depositary could decide it is not legal or reasonably practical to make such elective distribution available to you, or it could decide that it is only legal or reasonably practical to make such elective distribution available to some but not all holders of the ADSs. In such case, the depositary shall, on the basis of the same determination as is made in respect of the common shares for which no election is made, distribute either cash in the same way as it does in a cash distribution, or additional ADSs representing common shares in the same way as it does in a share distribution. The depositary is not obligated to make available to you a method to receive the elective dividend in shares rather than in ADSs. There can be no assurance that you will be given the opportunity to receive elective distributions on the same terms and conditions as the holders of common shares. | |
| • | Rights to Purchase Additional Shares. If we offer holders of our common shares any rights to subscribe for additional shares or any other rights, the depositary may after consultation with us and having received timely notice of such distribution by us, make these rights available to you. We must first instruct the depositary to make such rights available to you and furnish the depositary with satisfactory evidence that it is legal to do so. If the depositary decides it is not legal and practical to make the rights available but that it is practical to sell the rights, the depositary will use reasonable efforts to sell the rights and distribute the net proceeds in the same way as it does with cash. The depositary will allow rights that are not distributed or sold to lapse. In that case, you will receive no value for them. |
152
Table of Contents
| • | Other Distributions. Subject to receipt of timely notice from us with the request to make any such distribution available to you, and provided the depositary has determined such distribution is lawful and reasonably practicable and feasible and in accordance with the terms of the deposit agreement, the depositary will send to you anything else we distribute on deposited securities by any means it thinks is legal, fair and practical. If it cannot make the distribution in that way, the depositary has a choice: it may decide to sell what we distributed and distribute the net proceeds in the same way as it does with cash; or, it may decide to hold what we distributed, in which case ADSs will also represent the newly distributed property. However, the depositary is not required to distribute any securities (other than ADSs) to you unless it receives satisfactory evidence from us that it is legal to make that distribution. The depositary may sell a portion of the distributed securities or property sufficient to pay its fees and expenses in connection with that distribution. |
153
Table of Contents
154
Table of Contents
| Persons Depositing or | ||
Withdrawing Shares Must Pay: | For: | |
| $0.05 (or less) per ADS | Issuance of ADSs, including issuances resulting from a distribution of shares or rights or other property | |
| Cancellation of ADSs for the purpose of withdrawal, including if the deposit agreement terminates | ||
| $0.05 (or less) per ADS | Any distribution of cash proceeds to you | |
| A fee equivalent to the fee that would be payable if securities distributed to you had been common shares and the common shares had been deposited for issuance of ADSs | Distribution of securities distributed to holders of deposited securities which are distributed by the depositary to ADS holders | |
| $0.05 (or less) per ADS per calendar year | Depositary services | |
| Registration or transfer fees | Transfer and registration of common shares on our share register to or from the name of the depositary or its agent when you deposit or withdraw common shares | |
| Expenses of the depositary | Cable, telex and facsimile transmissions (when expressly provided in the deposit agreement) | |
| Converting foreign currency to U.S. dollars | ||
| Taxes and other governmental charges the depositary or the custodian has to pay on any ADS or share underlying an ADS, including any applicable interest and penalties thereon and any share transfer or other taxes or governmental charges, for example, stock transfer taxes, stamp duty or withholding taxes | As necessary | |
| Any charges incurred by the depositary or its agents for servicing the deposited securities | As necessary |
155
Table of Contents
If we: | Then: | |
| Change the nominal or par value of our common shares | The cash, shares or other securities received by the depositary will become deposited securities. | |
| Reclassify, split up or consolidate any of the deposited securities | Each ADS will automatically represent its equal share of the new deposited securities. | |
| Distribute securities on the common shares that are not distributed to you or Recapitalize, reorganize, merge, liquidate, sell all or substantially all of our assets, or take any similar action | The depositary may distribute some or all of the cash, shares or other securities it received. It may also deliver new ADSs or ask you to surrender your outstanding ADRs in exchange for new ADRs identifying the new deposited securities. |
156
Table of Contents
| • | are only obligated to take the actions specifically set forth in the deposit agreement without gross negligence or willful misconduct; | |
| • | are not liable if either of us is prevented or delayed by law or circumstances beyond our control from performing our obligations under the deposit agreement, including, without limitation, requirements of any present or future law, regulation, governmental or regulatory authority or share exchange of any applicable jurisdiction, any present or future provisions of our memorandum and articles of association, on account of possible civil or criminal penalties or restraint, any provisions of or governing the deposited securities or any act of God, war or other circumstances beyond our control as set forth in the deposit agreement; | |
| • | are not liable if either of us exercises, or fails to exercise, discretion permitted under the deposit agreement; | |
| • | are not liable for the inability of any holder of ADSs to benefit from any distribution on deposited securities that is not made available to holders of ADSs under the terms of the deposit agreement, or for any indirect, special, consequential or punitive damages for any breach of the terms of the deposit agreement; |
157
Table of Contents
| • | have no obligation to become involved in a lawsuit or other proceeding related to the ADSs or the deposit agreement on your behalf or on behalf of any other party; | |
| • | may rely upon any documents we believe in good faith to be genuine and to have been signed or presented by the proper party; | |
| • | disclaim any liability for any action/inaction in reliance on the advice or information of legal counsel, accountants, any person presenting common shares for deposit, holders and beneficial owners (or authorized representatives) of ADSs, or any person believed in good faith to be competent to give such advice or information; | |
| • | disclaim any liability for inability of any holder to benefit from any distribution, offering, right or other benefit made available to holders of deposited securities but not made available to holders of ADSs; and | |
| • | disclaim any liability for any indirect, special, punitive or consequential damages. |
| • | payment of stock transfer or other taxes or other governmental charges and transfer or registration fees charged by third parties for the transfer of any common shares or other deposited securities and payment of the applicable fees, expenses and charges of the depositary; | |
| • | satisfactory proof of the identity and genuineness of any signature or other information it deems necessary; and | |
| • | compliance with regulations it may establish, from time to time, consistent with the deposit agreement, including presentation of transfer documents. |
| • | when temporary delays arise because: (1) the depositary has closed its transfer books or we have closed our transfer books; (2) the transfer of common shares is blocked to permit voting at a shareholders’ meeting; or (3) we are paying a dividend on our common shares; |
158
Table of Contents
| • | when you owe money to pay fees, taxes and similar charges; or | |
| • | when it is necessary to prohibit withdrawals in order to comply with any laws or governmental regulations that apply to ADSs or to the withdrawal of common shares or other deposited securities. |
159
Table of Contents
| • | 1% of the number of our common shares then outstanding, in the form of ADSs or otherwise, which will equal approximately 5,284,725 common shares immediately after this offering; and | |
| • | the average weekly trading volume of our ADSs on the Nasdaq Global Market during the four calendar weeks preceding the date on which notice of the sale is filed with the SEC. |
160
Table of Contents
161
Table of Contents
162
Table of Contents
| • | an individual citizen or resident of the United States; | |
| • | a corporation (or other entity treated as a corporation for United States federal income tax purposes) created or organized in or under the laws of the United States, any state thereof or the District of Columbia; | |
| • | an estate the income of which is subject to United States federal income taxation regardless of its source; or | |
| • | a trust if it (1) is subject to the primary supervision of a court within the United States and one or more United States persons have the authority to control all substantial decisions of the trust or (2) has a valid election in effect under applicable United States Treasury regulations to be treated as a United States person. |
| • | a dealer in securities or currencies; | |
| • | a financial institution; | |
| • | a regulated investment company; | |
| • | a real estate investment trust; | |
| • | an insurance company; | |
| • | a tax-exempt organization; | |
| • | a person holding our common shares or ADSs as part of a hedging, integrated or conversion transaction, a constructive sale or straddle; | |
| • | a trader in securities that has elected the mark-to-market method of accounting for your securities; | |
| • | a person liable for alternative minimum tax; | |
| • | a person who owns or is deemed to own 10% or more of our voting stock; |
163
Table of Contents
| • | a partnership or other pass-through entity for United States federal income tax purposes; or | |
| • | a person whose “functional currency” is not the United States dollar. |
164
Table of Contents
165
Table of Contents
| • | at least 75% of our gross income is passive income, or | |
| • | at least 50% of the value (determined on a quarterly basis) of our assets is attributable to assets that produce or are held for the production of passive income. |
| • | the excess distribution or gain will be allocated ratably over your holding period for the ADSs or common shares, | |
| • | the amount allocated to the current taxable year, and any taxable year prior to the first taxable year in which we were a PFIC, will be treated as ordinary income, and | |
| • | the amount allocated to each other year will be subject to tax at the highest tax rate in effect for that year and the interest charge generally applicable to underpayments of tax will be imposed on the resulting tax attributable to each such year. |
166
Table of Contents
167
Table of Contents
168
Table of Contents
| Number | ||||
Underwriters | of ADSs | |||
| Deutsche Bank Securities Inc. | ||||
| UBS AG | ||||
| Citigroup Global Markets Inc. | ||||
| Cowen and Company, LLC | ||||
| Thomas Weisel Partners LLC | ||||
| Total | 7,400,000 | |||
169
Table of Contents
| Total Fees | ||||||||||||
| Without Exercise of | With Full Exercise of | |||||||||||
| Over-Allotment | Over-Allotment | |||||||||||
| Fee per ADS | Option | Option | ||||||||||
| Discounts and commissions paid by us | $ | $ | $ | |||||||||
| Discounts and commissions paid by the selling shareholders | ||||||||||||
170
Table of Contents
| • | prevailing market conditions; | |
| • | our results of operations in recent periods; |
171
Table of Contents
| • | the present stage of our development; | |
| • | the market capitalizations and stages of development of other companies that we and the representatives of the underwriters believe to be comparable to our business; and | |
| • | estimates of our business potential. |
172
Table of Contents
173
Table of Contents
174
Table of Contents
| SEC registration fee | $ | 8,245 | ||
| Nasdaq Global Market listing fee | 125,000 | |||
| Financial Industry Regulatory Authority filing fee | 11,563 | |||
| Printing and engraving expenses | 300,000 | |||
| Legal fees and expenses | 1,600,000 | |||
| Accounting fees and expenses | 1,050,000 | |||
| Miscellaneous | 815,000 | |||
| Total | $ | 3,909,808 | ||
175
Table of Contents
176
Table of Contents
177
Table of Contents
| Page | ||||
| F-2 | ||||
| F-3 | ||||
| F-5 | ||||
| F-7 | ||||
| F-8 | ||||
| F-10 | ||||
| F-56 | ||||
| F-61 | ||||
| F-63 | ||||
| F-65 | ||||
| F-66 | ||||
| F-68 | ||||
F-1
Table of Contents
F-2
Table of Contents
| December 31, | ||||||||
| 2008 | 2009 | |||||||
ASSETS | ||||||||
| Current assets: | ||||||||
| Cash and cash equivalents | $ | 46,881 | $ | 54,842 | ||||
| Accounts receivable, net of allowance for doubtful accounts of $339 and $220 as of December 31, 2008, and 2009, respectively | 21,123 | 24,473 | ||||||
| Amounts due from related parties | 799 | — | ||||||
| Prepaid expenses and other current assets | 1,594 | 2,149 | ||||||
| Deferred tax assets—current | 115 | 66 | ||||||
| Restricted cash | 330 | 335 | ||||||
| Total current assets | 70,842 | 81,865 | ||||||
| Property, plant and equipment, net | 6,703 | 7,203 | ||||||
| Intangible assets, net | — | 1,934 | ||||||
| Deferred tax assets—non-current | 64 | 423 | ||||||
| Loan receivable | 2,087 | 2,243 | ||||||
| Other assets | 458 | 382 | ||||||
| Goodwill | 5,946 | 10,192 | ||||||
| Total assets | $ | 86,100 | $ | 104,242 | ||||
LIABILITIES, CONVERTIBLE REDEEMABLE PREFERRED SHARES AND (DEFICIT)/EQUITY | ||||||||
| Current liabilities: | ||||||||
| Accounts payable | $ | 482 | $ | 1,211 | ||||
| Amounts due to related parties | 1,035 | — | ||||||
| Accrued expenses and other payables | 11,720 | 20,536 | ||||||
| Government grant | 555 | 316 | ||||||
| Current portion of long-term bank borrowings | 46 | 20 | ||||||
| Income taxes payable | 768 | 1,712 | ||||||
| Other taxes payable | 952 | 955 | ||||||
| Total current liabilities | 15,558 | 24,750 | ||||||
| Deferred tax liabilities—non-current | 40 | 256 | ||||||
| Unrecognized tax benefits—non-current | 969 | 969 | ||||||
| Capital lease obligation—long-term portion | 111 | 176 | ||||||
| Long-term bank borrowings, excluding current portion | 19 | — | ||||||
| Other long-term liability | 2 | — | ||||||
| Total liabilities | 16,699 | 26,151 | ||||||
F-3
Table of Contents
| December 31, | ||||||||
| 2008 | 2009 | |||||||
| Commitments | ||||||||
| Series A convertible redeemable preferred shares ($0.0001 par value; 57,000,000 shares authorized; 57,000,000 and 57,000,000 shares issued and outstanding as of December 31, 2008 and 2009, respectively, liquidation value $11,400) | 12,581 | 12,581 | ||||||
Series A-1 convertible redeemable preferred shares ($0.0001 par value; 36,000,000 shares authorized; 36,000,000 and 36,000,000 shares issued and outstanding as of December 31, 2008 and 2009, respectively, liquidation value $9,000) | 9,900 | 9,900 | ||||||
| Series B convertible redeemable preferred shares ($0.0001 par value; 112,000,000 shares authorized; 112,000,000 and 112,000,000 shares issued and outstanding as of December 31, 2008 and 2009, respectively, liquidation value $42,000) | 30,800 | 30,800 | ||||||
| Series C convertible redeemable preferred shares ($0.0001 par value; 60,000,000 shares authorized; 59,090,910 shares issued and 59,090,910 outstanding as of December 31, 2008 and 2009, respectively, liquidation value $32,500) | 35,750 | 35,750 | ||||||
| (Deficit)/Equity: | ||||||||
| HiSoft Technology International Limited shareholders’ (deficit)/equity: | ||||||||
| Common shares ($0.0001 par value; 607,000,000 shares authorized; 85,189,211 and 87,672,120 shares issued and outstanding as of December 31, 2008 and 2009, respectively) | 9 | 9 | ||||||
| Subscription receivable | (1 | ) | (1 | ) | ||||
| Additional paid-in capital | 5,566 | 6,711 | ||||||
| Shares to be issued in connection with business acquisitions | — | 471 | ||||||
| Statutory reserve | 1,764 | 2,447 | ||||||
| Accumulated deficit | (33,396 | ) | (26,716 | ) | ||||
| Accumulated other comprehensive income | 6,428 | 6,139 | ||||||
| Total HiSoft Technology International Limited shareholders’ (deficit)/equity | (19,630 | ) | (10,940 | ) | ||||
| Total liabilities, convertible redeemable preferred shares and (deficit)/equity | $ | 86,100 | $ | 104,242 | ||||
F-4
Table of Contents
| Years Ended December 31, | ||||||||||||
| 2007 | 2008 | 2009 | ||||||||||
| Revenues | $ | 64,335 | $ | 102,372 | $ | 93,337 | ||||||
| Business tax | (1,284 | ) | (1,652 | ) | (1,881 | ) | ||||||
| Net revenues | 63,051 | 100,720 | 91,456 | |||||||||
| Cost of revenues (including share-based compensation of $268, $362 and $321 for the years ended December 31, 2007, 2008 and 2009, respectively) | 47,435 | 70,295 | 58,759 | |||||||||
| Gross profit | 15,616 | 30,425 | 32,697 | |||||||||
| Operating expenses | ||||||||||||
| General and administrative (including share-based compensation of $1,214, $1,405 and $720 for the years ended December 31, 2007, 2008 and 2009) | 12,617 | 19,010 | 18,981 | |||||||||
| Selling and marketing (including share-based compensation of $8, $35 and $56 for the years ended December 31, 2007, 2008 and 2009, respectively) | 5,599 | 8,345 | 5,968 | |||||||||
| Offering expenses | — | 3,782 | — | |||||||||
| Impairment of intangible assets | — | 5,760 | — | |||||||||
| Impairment of goodwill | — | 4,784 | — | |||||||||
| Total operating expenses | 18,216 | 41,681 | 24,949 | |||||||||
| (Loss)/income from operations | (2,600 | ) | (11,256 | ) | 7,748 | |||||||
| Other income (expenses) | ||||||||||||
| Interest expense | (493 | ) | (58 | ) | (57 | ) | ||||||
| Interest income | 493 | 722 | 567 | |||||||||
| Change in fair value of warrants | 2,387 | — | — | |||||||||
| Change in fair value of foreign-currency forward contract | 101 | (253 | ) | 166 | ||||||||
| Total other income | 2,488 | 411 | 676 | |||||||||
| Net (loss)/income from continuing operations before | ||||||||||||
| income tax (expenses) benefit | (112 | ) | (10,845 | ) | 8,424 | |||||||
| Income tax (expenses) benefit | (770 | ) | 703 | (1,061 | ) | |||||||
| Net (loss)/income from continuing operations | (882 | ) | (10,142 | ) | 7,363 | |||||||
| Discontinued operation: | ||||||||||||
| Loss on discontinued operation, net of tax | (38 | ) | — | — | ||||||||
| Loss on disposal of discontinued operation | — | (569 | ) | — | ||||||||
| Net loss on discontinued operation | (38 | ) | (569 | ) | — | |||||||
| Net (loss)/income | (920 | ) | (10,711 | ) | 7,363 | |||||||
| Net (loss)/income attributable to HiSoft Technology International Limited | (920 | ) | (10,711 | ) | 7,363 | |||||||
Deemed dividend onSeries A-1 convertible redeemable preferred shares | (385 | ) | — | — | ||||||||
| Deemed dividend on Series B convertible redeemable preferred shares | (1,865 | ) | — | — | ||||||||
| Deemed dividend on Series C convertible redeemable preferred shares | (3,512 | ) | — | — | ||||||||
| Net (loss)/income attributable to holders of common shares of HiSoft Technology International Limited | $ | (6,682 | ) | $ | (10,711 | ) | $ | 7,363 | ||||
F-5
Table of Contents
| Years Ended December 31, | ||||||||||||
| 2007 | 2008 | 2009 | ||||||||||
| Net (loss)/income per common share | ||||||||||||
| Basic | $ | (0.07 | ) | $ | (0.13 | ) | $ | 0.02 | ||||
| Diluted | (0.07 | ) | (0.13 | ) | 0.02 | |||||||
| Net income per Series A preferred share—Basic | — | — | 0.02 | |||||||||
Net income perSeries A-1 preferred share—Basic | — | — | 0.02 | |||||||||
| Net income per Series B preferred share—Basic | — | — | 0.02 | |||||||||
| Net income per Series C preferred share—Basic | $ | — | $ | — | $ | 0.02 | ||||||
| Weighted average shares used in calculating net (loss)/income per common share | ||||||||||||
| Basic | 94,237,854 | 82,279,610 | 86,148,324 | |||||||||
| Diluted | 94,237,854 | 82,279,610 | 388,372,705 | |||||||||
| Weighted average shares used in calculating net income per Series A preferred share | 61,959,000 | |||||||||||
Weighted average shares used in calculating net income perSeries A-1 preferred share | 39,132,000 | |||||||||||
| Weighted average shares used in calculating net income per Series B preferred share | 112,000,000 | |||||||||||
| Weighted average shares used in calculating net income per Series C preferred share | 80,046,793 | |||||||||||
| Pro forma net income per share (unaudited) (Note 2) | ||||||||||||
| Basic | $ | 0.02 | ||||||||||
| Diluted | $ | 0.02 | ||||||||||
| Weighted average shares used in calculating pro forma net income per common share (unaudited) (Note 2) | ||||||||||||
| Basic | 378,488,721 | |||||||||||
| Diluted | 388,732,754 | |||||||||||
F-6
Table of Contents
| Shares to be | ||||||||||||||||||||||||||||||||||||||||
| Issued | Accumulated | |||||||||||||||||||||||||||||||||||||||
| Additional | in Connection | Other | Total | Total | ||||||||||||||||||||||||||||||||||||
| Common Shares | Subscription | Paid-in | with Business | Statutory | Accumulated | Comprehensive | Shareholders’ | Comprehensive | ||||||||||||||||||||||||||||||||
| Shares | Amount | Receivable | Capital | Acquisitions | Reserves | Deficit | Income | Deficit | Income (Loss) | |||||||||||||||||||||||||||||||
| Balance at January 1, 2007 | 83,507,500 | $ | 9 | $ | (4 | ) | $ | 4,782 | $ | 1,742 | $ | — | $ | (11,040 | ) | $ | 467 | $ | (4,044 | ) | $ | (9,637 | ) | |||||||||||||||||
| Cumulative effect of unrecognized tax benefit on adoption of new accounting pronouncement | — | — | — | — | — | — | (969 | ) | — | (969 | ) | |||||||||||||||||||||||||||||
| Issuance of common shares | 29,628,442 | 2 | — | 3,476 | (1,742 | ) | — | — | — | 1,736 | ||||||||||||||||||||||||||||||
Deemed dividend onSeries A-1 convertible redeemable preferred shares | — | — | — | (385 | ) | — | — | — | — | (385 | ) | |||||||||||||||||||||||||||||
| Deemed dividend on Series B convertible redeemable preferred shares | — | — | — | (1,865 | ) | — | — | — | — | (1,865 | ) | |||||||||||||||||||||||||||||
| Deemed dividend on Series C convertible redeemable preferred shares | — | — | — | (3,512 | ) | — | — | — | — | (3,512 | ) | |||||||||||||||||||||||||||||
| Share to be issued in connection with business acquisitions | — | — | — | — | 2,240 | — | — | — | 2,240 | |||||||||||||||||||||||||||||||
| Share-based compensation | 3,350,000 | 1 | (1 | ) | 1,490 | — | — | — | — | 1,490 | ||||||||||||||||||||||||||||||
| Provision for statutory reserve | — | — | — | — | — | 569 | (569 | ) | — | — | ||||||||||||||||||||||||||||||
| Repurchase and retirement of common shares | (42,249,375 | ) | (5 | ) | 4 | (2,589 | ) | — | — | (7,992 | ) | — | (10,582 | ) | ||||||||||||||||||||||||||
| Net loss | — | — | — | — | — | — | (920 | ) | — | (920 | ) | $ | (920 | ) | ||||||||||||||||||||||||||
| Foreign currency translation adjustments | — | — | — | — | — | — | — | 2,202 | 2,202 | 2,202 | ||||||||||||||||||||||||||||||
| Balance at December 31, 2007 | 74,236,567 | 7 | (1 | ) | 1,397 | 2,240 | 569 | (21,490 | ) | 2,669 | (14,609 | ) | $ | 1,282 | ||||||||||||||||||||||||||
| Issuance of common shares | 7,972,091 | 1 | — | 2,239 | (2,240 | ) | — | — | — | — | ||||||||||||||||||||||||||||||
| Share option exercise | 530,625 | — | — | 129 | — | — | — | — | 129 | |||||||||||||||||||||||||||||||
| Share-based compensation | — | — | — | 1,802 | — | — | — | — | 1,802 | |||||||||||||||||||||||||||||||
| Vesting of nonvested shares award | 2,449,928 | 1 | — | (1 | ) | — | — | — | — | — | ||||||||||||||||||||||||||||||
| Provision for statutory reserve | — | — | — | — | — | 1,195 | (1,195 | ) | — | — | ||||||||||||||||||||||||||||||
| Net loss | — | — | — | — | — | — | (10,711 | ) | — | (10,711 | ) | $ | (10,711 | ) | ||||||||||||||||||||||||||
| Foreign currency translation adjustments | — | — | — | — | — | — | — | 3,759 | 3,759 | 3,759 | ||||||||||||||||||||||||||||||
| Balance at December 31, 2008 | 85,189,211 | 9 | (1 | ) | 5,566 | — | 1,764 | (33,396 | ) | 6,428 | (19,630 | ) | $ | (6,952 | ) | |||||||||||||||||||||||||
| Shares to be issued in connection with business acquisition | — | — | — | — | 471 | — | — | — | 471 | |||||||||||||||||||||||||||||||
| Share option exercise | 178,061 | — | — | 48 | — | — | — | — | 48 | |||||||||||||||||||||||||||||||
| Share-based compensation | — | — | — | 1,097 | — | — | — | — | 1,097 | |||||||||||||||||||||||||||||||
| Vesting of nonvested shares award | 2,304,848 | — | — | — | — | — | — | — | — | |||||||||||||||||||||||||||||||
| Provision for statutory reserve | — | — | — | — | — | 683 | (683 | ) | — | — | ||||||||||||||||||||||||||||||
| Net income | — | — | — | — | — | — | 7,363 | — | 7,363 | $ | 7,363 | |||||||||||||||||||||||||||||
| Foreign currency translation adjustments | — | — | — | — | — | — | — | (289 | ) | (289 | ) | (289 | ) | |||||||||||||||||||||||||||
| Balance at December 31, 2009 | 87,672,120 | $ | 9 | $ | (1 | ) | $ | 6,711 | $ | 471 | $ | 2,447 | $ | (26,716 | ) | $ | 6,139 | $ | (10,940 | ) | $ | 7,074 | ||||||||||||||||||
F-7
Table of Contents
| Years Ended December 31, | ||||||||||||
| 2007 | 2008 | 2009 | ||||||||||
| Cash flows from operating activities: | ||||||||||||
| Net (loss)/income | $ | (920 | ) | $ | (10,711 | ) | $ | 7,363 | ||||
| Adjustments to reconcile net (loss)/income to net cash (used in) provided by operating activities: | ||||||||||||
| Provision for doubtful accounts | 212 | 578 | — | |||||||||
| Loss on disposals of property, plant and equipment | 34 | 1,067 | 1,422 | |||||||||
| Depreciation | 2,984 | 3,598 | 2,466 | |||||||||
| Change in fair value of warrants | (2,387 | ) | — | — | ||||||||
| Change in fair value of foreign-currency forward contract | (101 | ) | 253 | (166 | ) | |||||||
| Amortization of intangible assets | 1,868 | 1,615 | 76 | |||||||||
| Impairment of intangible assets | — | 5,760 | — | |||||||||
| Impairment of goodwill | — | 4,784 | — | |||||||||
| Write-off of initial public offering expenses | — | 3,782 | — | |||||||||
| Loss on discontinued operations | — | 569 | — | |||||||||
| Interest income | — | (135 | ) | (119 | ) | |||||||
| Share-based compensation expenses | 1,490 | 1,802 | 1,097 | |||||||||
| Changes in operating assets and liabilities: | ||||||||||||
| Accounts receivable | (12,024 | ) | 300 | (2,197 | ) | |||||||
| Accounts due from related parties | 723 | 109 | — | |||||||||
| Prepaid expenses and other current assets | (1,059 | ) | 1,463 | (258 | ) | |||||||
| Income tax receivables | (80 | ) | — | (438 | ) | |||||||
| Other assets | (194 | ) | (95 | ) | 31 | |||||||
| Accounts payable | 478 | (734 | ) | 728 | ||||||||
| Amounts due to related parties | (7,208 | ) | (599 | ) | (243 | ) | ||||||
| Accrued expenses and other payables | 10,535 | (1,041 | ) | 2,809 | ||||||||
| Deferred revenue | 945 | (1,136 | ) | (3 | ) | |||||||
| Government grant liabilities | 401 | (89 | ) | (239 | ) | |||||||
| Income taxes payable | 947 | — | 1,087 | |||||||||
| Other taxes payable | 187 | 67 | (59 | ) | ||||||||
| Deferred income taxes | (979 | ) | (867 | ) | (307 | ) | ||||||
| Other long term liabilities | — | (57 | ) | (2 | ) | |||||||
| Net cash (used in) provided by operating activities | (4,148 | ) | 10,283 | 13,048 | ||||||||
| Cash flows from investing activities: | ||||||||||||
| Purchases of property, plant and equipment | (7,799 | ) | (1,973 | ) | (3,897 | ) | ||||||
| Disposal of discontinued operation | — | (963 | ) | — | ||||||||
| Restricted cash | (246 | ) | 87 | — | ||||||||
| Payment for business acquisitions (net of cash acquired of $1,980, $nil, $844 in 2007, 2008 and 2009 respectively) | (6,393 | ) | (1,443 | ) | (629 | ) | ||||||
| Redemption of a short-term investment upon maturity | — | 208 | — | |||||||||
| Net cash used in investing activities | (14,438 | ) | (4,084 | ) | (4,526 | ) | ||||||
F-8
Table of Contents
(in U.S. dollars in thousands, except share and per share data, or otherwise noted)
| Years Ended December 31, | ||||||||||||
| 2007 | 2008 | 2009 | ||||||||||
| Cash flows from financing activities: | ||||||||||||
| Repayment of long-term borrowings | (4 | ) | (46 | ) | — | |||||||
| Prepayment of initial public offering expenses | (2,191 | ) | (804 | ) | (40 | ) | ||||||
| Cash received from share subscription receivable | 4 | — | — | |||||||||
| Repayment on repurchase of common share | (10,582 | ) | — | — | ||||||||
| Proceeds from issuance of common share under employee option plan | — | 129 | 168 | |||||||||
| Proceeds from issuance of Series A convertible redeemable preferred shares | 100 | — | — | |||||||||
Proceeds from issuance ofSeries A-1 convertible redeemable preferred share | 9,000 | — | — | |||||||||
| Proceeds from issuance of Series B convertible redeemable preferred shares | 16,800 | — | — | |||||||||
| Proceeds from issuance of Series C convertible redeemable preferred shares | 32,500 | — | — | |||||||||
| Payment on capital lease obligations | (5 | ) | (46 | ) | (65 | ) | ||||||
| Net cash provided by (used in) financing activities | 45,622 | (767 | ) | 63 | ||||||||
| Effect of exchange rate changes | 1,304 | 2,220 | (624 | ) | ||||||||
| Net increase in cash and cash equivalents | 28,340 | 7,652 | 7,961 | |||||||||
| Cash and cash equivalents at beginning of year | 10,889 | 39,229 | 46,881 | |||||||||
| Cash and cash equivalents at end of year | $ | 39,229 | $ | 46,881 | $ | 54,842 | ||||||
| Supplemental cash flow information: | ||||||||||||
| Interest paid | $ | — | $ | 15 | $ | 15 | ||||||
| Income taxes paid | $ | 733 | $ | 400 | $ | 1,128 | ||||||
| Supplemental information of non cash investing and financing activities: | ||||||||||||
| Issuance of common shares for acquisitions | $ | 3,478 | $ | 2,240 | $ | — | ||||||
| Payable for business acquisition | $ | — | $ | — | $ | 5,319 | ||||||
F-9
Table of Contents
NOTES TO THE CONSOLIDATED FINANCIAL STATEMENTS
FOR THE YEARS ENDED DECEMBER 31, 2007, 2008 AND 2009
(In thousands of U.S. dollars, except share and per share data, or otherwise noted)
| 1. | ORGANIZATION AND PRINCIPAL ACTIVITIES |
| December 31, | ||||||||
| 2008 | 2009 | |||||||
| Total assets | $ | 4,117 | $ | 3,710 | ||||
| Total liabilities | (4,829 | ) | (3,589 | ) | ||||
| For the Years Ended December 31, | ||||||||||||
| 2007 | 2008 | 2009 | ||||||||||
| Net revenues | $ | 648 | $ | 37 | $ | 2 | ||||||
| Net (loss) income | (341 | ) | 309 | 833 | ||||||||
F-10
Table of Contents
NOTES TO THE CONSOLIDATED FINANCIAL STATEMENTS—(Continued)
FOR THE YEARS ENDED DECEMBER 31, 2007, 2008 AND 2009
(In thousands of U.S. dollars, except share and per share data, or otherwise noted)
| • | In December 2005, the Group acquired 51% of the business of Beijing Tianhai Hongye International Software Co. Ltd., a Beijing-based software outsourcing provider, or Tianhai Hongye, and in December 2006, we acquired the remaining 49%. | |
| • | In December 2005, the Group acquired 55% of the business of Teksen Systems Limited, a Hong Kong and Guangzhou-based IT services provider, or Teksen Systems, and in January 2007 we acquired the remaining 45% of the business. | |
| • | In December 2006, the Group established HiSoft Envisage Inc., or Envisage, in Delaware to acquire Envisage Solutions, aU.S.-based provider of packaged software services. This acquisition was completed in December 2006. | |
| • | At the end of November 2007, the Group completed our acquisition of Shanghai Shinko Computer Technology Co., Ltd., an outsourcing technology center for a client, Kobe Steel Ltd., and renamed it as Haiyuan Technology (Shanghai) Co., Ltd., or HiSoft Shanghai. | |
| • | In December 2007, the Group acquired T-est Pte Ltd, or T-est, a Singapore-based research and development services provider, which we renamed HiSoft Singapore Pte Ltd. | |
| • | In December 2007, the Group acquired 100% of Daemoyrod Corp., an Oracle application software implementation and support specialist with operations in the United States by merging it into HiSoft Wave, Inc., our wholly owned subsidiary, or Wave. | |
| • | In August 2009, the Group acquired a business process support team from AIA Information Technology (Guangzhou) Co. Ltd., a team specialized in providing business support services for the insurance industry. | |
| • | In October 2009, the Group acquired the testing business of MG Digital Pte Ltd., a Singapore-based research and development services provider. | |
| • | In December 2009, the Group acquired 100% of AllianceSPEC Pte Ltd, a professional IT transaction system testing company based in Singapore. |
F-11
Table of Contents
NOTES TO THE CONSOLIDATED FINANCIAL STATEMENTS—(Continued)
FOR THE YEARS ENDED DECEMBER 31, 2007, 2008 AND 2009
(In thousands of U.S. dollars, except share and per share data, or otherwise noted)
| Later of Date of | ||||||||
| Incorporation | Place of | Percentage of | ||||||
Subsidiaries | /Acquisition | Incorporation | Legal Ownership | |||||
| hiSoft Japan Co. Limited. (“HiSoft Japan”) | August 1, 2002 | Japan | 100 | % | ||||
| DMK International Inc. (“DMK”) | September 4, 2003 | USA | 100 | % | ||||
| HiSoft Dalian | July 27, 2004 | PRC | 100 | % | ||||
| HiSoft Systems Holdings Ltd. | September 26, 2005 | British Virgin Islands | 100 | % | ||||
| HiSoft Holdings Ltd. | September 28, 2005 | British Virgin Islands | 100 | % | ||||
| HiSoft Services (Beijing) Limited (“HiSoft Beijing”) | November 10, 2005 | PRC | 100 | % | ||||
| HiSoft Systems (Shenzhen) Limited. (“HiSoft Shenzhen”) | November 9, 2005 | PRC | 100 | % | ||||
| HiSoft Systems (Hong Kong) Limited.(“HiSoft Hong Kong”) | October 12, 2005 | Hong Kong | 100 | % | ||||
| Envisage | December 31, 2006 | USA | 100 | % | ||||
| HiSoft Technology (Chengdu) Co. Ltd Limited(“HiSoft Chendu”) | April 4, 2007 | PRC | 100 | % | ||||
| HiSoft Shanghai | December 1, 2007 | PRC | 100 | % | ||||
| HiSoft Singapore Pte Ltd. (“T-est”) | December 1, 2007 | Singapore | 100 | % | ||||
| Wave | December 31, 2007 | USA | 100 | % | ||||
| Wuxi HiSoft Services Ltd. | January 8, 2009 | PRC | 100 | % | ||||
| AllianceSPEC Pte Ltd. | December 1, 2009 | Singapore | 100 | % | ||||
| Wuxi Training Centre | December 25, 2009 | PRC | 100 | % | ||||
Variable interest entity | ||||||||
| HaiHui Dalian | November 11, 1996 | PRC | Nil | |||||
| 2. | SUMMARY OF SIGNIFICANT ACCOUNTING POLICIES |
F-12
Table of Contents
NOTES TO THE CONSOLIDATED FINANCIAL STATEMENTS—(Continued)
FOR THE YEARS ENDED DECEMBER 31, 2007, 2008 AND 2009
(In thousands of U.S. dollars, except share and per share data, or otherwise noted)
| Years Ended December 31, | ||||||||||||||||
| 2008 | % | 2009 | % | |||||||||||||
| Client A | 13,590 | 13 | 7,621 | 8 | ||||||||||||
| Client B | 10,404 | 10 | 12,525 | 14 | ||||||||||||
| Client C | 9,529 | 9 | 8,793 | 10 | ||||||||||||
F-13
Table of Contents
NOTES TO THE CONSOLIDATED FINANCIAL STATEMENTS—(Continued)
FOR THE YEARS ENDED DECEMBER 31, 2007, 2008 AND 2009
(In thousands of U.S. dollars, except share and per share data, or otherwise noted)
| Years Ended December 31, | ||||||||||||||||
| 2008 | % | 2009 | % | |||||||||||||
| Client C | 1,820 | 9 | 3,162 | 13 | ||||||||||||
| Client D | 2,018 | 10 | 1,359 | 5 | ||||||||||||
| Furniture, fixtures and electronic equipment | 3 - 5 years | |||
| Transportation equipment | 5 years | |||
| Leasehold improvements | Shorter of useful life of the asset or the lease term |
| Customer base | 3 - 5 years | |||
| Contract backlog | 1 year | |||
| Non-Compete agreement | 4 years |
F-14
Table of Contents
NOTES TO THE CONSOLIDATED FINANCIAL STATEMENTS—(Continued)
FOR THE YEARS ENDED DECEMBER 31, 2007, 2008 AND 2009
(In thousands of U.S. dollars, except share and per share data, or otherwise noted)
| Years Ended December 31, | ||||||||||||
| 2007 | 2008 | 2009 | ||||||||||
| Time-and-material | $ | 52,854 | $ | 85,160 | $ | 78,986 | ||||||
| Fixed-price | 10,197 | 15,560 | 12,470 | |||||||||
| Total | $ | 63,051 | $ | 100,720 | $ | 91,456 | ||||||
F-15
Table of Contents
NOTES TO THE CONSOLIDATED FINANCIAL STATEMENTS—(Continued)
FOR THE YEARS ENDED DECEMBER 31, 2007, 2008 AND 2009
(In thousands of U.S. dollars, except share and per share data, or otherwise noted)
F-16
Table of Contents
NOTES TO THE CONSOLIDATED FINANCIAL STATEMENTS—(Continued)
FOR THE YEARS ENDED DECEMBER 31, 2007, 2008 AND 2009
(In thousands of U.S. dollars, except share and per share data, or otherwise noted)
F-17
Table of Contents
NOTES TO THE CONSOLIDATED FINANCIAL STATEMENTS—(Continued)
FOR THE YEARS ENDED DECEMBER 31, 2007, 2008 AND 2009
(In thousands of U.S. dollars, except share and per share data, or otherwise noted)
F-18
Table of Contents
NOTES TO THE CONSOLIDATED FINANCIAL STATEMENTS—(Continued)
FOR THE YEARS ENDED DECEMBER 31, 2007, 2008 AND 2009
(In thousands of U.S. dollars, except share and per share data, or otherwise noted)
F-19
Table of Contents
NOTES TO THE CONSOLIDATED FINANCIAL STATEMENTS—(Continued)
FOR THE YEARS ENDED DECEMBER 31, 2007, 2008 AND 2009
(In thousands of U.S. dollars, except share and per share data, or otherwise noted)
F-20
Table of Contents
NOTES TO THE CONSOLIDATED FINANCIAL STATEMENTS—(Continued)
FOR THE YEARS ENDED DECEMBER 31, 2007, 2008 AND 2009
(In thousands of U.S. dollars, except share and per share data, or otherwise noted)
| 3. | ACQUISITIONS |
| (a) | T-est Pte Ltd |
| • | Cash of $2,698 (including $70 transaction cost), and | |
| • | Share consideration of $931 (3,445,344 common shares of the Company valued at $0.27 per share at the acquisition date). |
| Estimated | ||||||||
| Useful Life | ||||||||
| Net tangible assets: | ||||||||
| Cash | $ | 1,794 | ||||||
| Current assets | 2,345 | |||||||
| Current liabilities | (2,632 | ) | ||||||
| Non-current assets | 545 | |||||||
| Other long-term liabilities | (82 | ) | ||||||
| Total | 1,970 | |||||||
| Intangible assets acquired: | ||||||||
| Contract backlog | 40 | 1 year | ||||||
| Customer base | 840 | 5 years | ||||||
| Non-compete agreement | 15 | 4 years | ||||||
| Goodwill | 925 | |||||||
| Deferred tax liability | (161 | ) | ||||||
| Total | 1,659 | |||||||
| Total consideration | $ | 3,629 | ||||||
F-21
Table of Contents
NOTES TO THE CONSOLIDATED FINANCIAL STATEMENTS—(Continued)
FOR THE YEARS ENDED DECEMBER 31, 2007, 2008 AND 2009
(In thousands of U.S. dollars, except share and per share data, or otherwise noted)
| Year Ended | ||||
| December 31, | ||||
| 2007 | ||||
| (Unaudited) | ||||
| Total revenue | $ | 70,470 | ||
| Net income from continuing operations | 534 | |||
| Net loss on discontinued operation | (38 | ) | ||
| Net income from continuing operations per share | ||||
| - Basic | $ | 0.01 | ||
| - Diluted | $ | — | ||
| Net loss on discontinued operation per share | ||||
| - Basic | $ | — | ||
| - Diluted | $ | — | ||
| Net income per share | ||||
| - Basic | $ | 0.01 | ||
| - Diluted | $ | — | ||
| (b) | Daemoyrod Corporation (“Wave”) |
| • | Cash of $1,532 (including $88 transaction cost); | |
| • | Share consideration of $1,117 (3,976,364 common shares of the Company valued at $0.281 per share, at the acquisition date) |
F-22
Table of Contents
NOTES TO THE CONSOLIDATED FINANCIAL STATEMENTS—(Continued)
FOR THE YEARS ENDED DECEMBER 31, 2007, 2008 AND 2009
(In thousands of U.S. dollars, except share and per share data, or otherwise noted)
| Estimated | ||||||||
| Useful Life | ||||||||
| Net tangible assets: | ||||||||
| Current assets | $ | 1,555 | ||||||
| Current liabilities | (1,034 | ) | ||||||
| Non-current assets | 47 | |||||||
| Total | 568 | |||||||
| Intangible assets acquired: | ||||||||
| Contract backlog | 26 | 1 years | ||||||
| Customer base | 822 | 3 years | ||||||
| Goodwill | 1,538 | |||||||
| Deferred tax liability | (305 | ) | ||||||
| Total | 2,081 | |||||||
| Total consideration | $ | 2,649 | ||||||
| Year Ended | ||||
| December 31, | ||||
| 2007 | ||||
| (Unaudited) | ||||
| Total revenue | $ | 68,844 | ||
| Net loss from continuing operations | (6,984 | ) | ||
| Net loss on discontinued operation | (38 | ) | ||
| Net loss from continuing operations per share | ||||
| - Basic | $ | (0.07 | ) | |
| - Diluted | $ | (0.07 | ) | |
| Net loss on discontinued operation per share | ||||
| - Basic | $ | — | ||
| - Diluted | $ | — | ||
| Net loss per share | ||||
| - Basic | $ | (0.07 | ) | |
| - Diluted | $ | (0.07 | ) | |
F-23
Table of Contents
NOTES TO THE CONSOLIDATED FINANCIAL STATEMENTS—(Continued)
FOR THE YEARS ENDED DECEMBER 31, 2007, 2008 AND 2009
(In thousands of U.S. dollars, except share and per share data, or otherwise noted)
| (c) | AllianceSPEC Pte Ltd |
| • | Deferred cash consideration of $2,700, which was subsequently paid in 2010; | |
| • | Share consideration of $471 (1,500,000 Company’s common shares valued at $0.314 per share, at the acquisition date); and | |
| • | Contingent consideration valued at $2,580: the Group agreed to pay the shareholders of AllianceSPEC Pte Ltd up to $5,023 based on the actual 2011 performance achieved by AllianceSPEC Pte Ltd. |
| Estimated | ||||||||
| Useful Life | ||||||||
| Net tangible assets: | ||||||||
| Current assets | $ | 4,594 | ||||||
| Current liabilities | (3,588 | ) | ||||||
| Non-current assets | 123 | |||||||
| Total | 1,129 | |||||||
| Intangible assets acquired: | ||||||||
| Contract backlog | 248 | 1 year | ||||||
| Customer base | 1,110 | 5 years | ||||||
| Goodwill | 3,502 | |||||||
| Deferred tax liability | (238 | ) | ||||||
| Total | 4,622 | |||||||
| Total consideration | $ | 5,751 | ||||||
F-24
Table of Contents
NOTES TO THE CONSOLIDATED FINANCIAL STATEMENTS—(Continued)
FOR THE YEARS ENDED DECEMBER 31, 2007, 2008 AND 2009
(In thousands of U.S. dollars, except share and per share data, or otherwise noted)
| Years Ended December 31, | ||||||||
| 2008 | 2009 | |||||||
| (Unaudited) | (Unaudited) | |||||||
| Total revenue | $ | 105,907 | $ | 97,678 | ||||
| Net loss from continuing operations | (9,783 | ) | 8,779 | |||||
| Net loss on discontinuing operation | (569 | ) | ||||||
| Net loss from continuing operations per share | ||||||||
| - Basis | $ | (0.03 | ) | $ | 0.02 | |||
| - Diluted | $ | (0.03 | ) | $ | 0.02 | |||
| Net loss on discontinued operation per share | ||||||||
| - Basis | $ | — | $ | — | ||||
| - Diluted | $ | — | $ | — | ||||
| Net loss per share | ||||||||
| - Basis | $ | (0.03 | ) | $ | 0.02 | |||
| - Diluted | $ | (0.03 | ) | $ | 0.02 | |||
| • | AIA Information Technology(Guangzhou) Co. (acquired in August 2009 for cash consideration of $270) | |
| • | The testing business of MG Digital PTE Ltd (acquired in October 2009 for cash consideration of $1,235) |
| 4. | ACCOUNTS RECEIVABLE |
| December 31, | ||||||||
| 2008 | 2009 | |||||||
| Billed receivable | $ | 14,497 | $ | 17,438 | ||||
| Unbilled receivable | 6,965 | 7,255 | ||||||
| 21,462 | 24,693 | |||||||
| Less: Allowance for doubtful accounts | (339 | ) | (220 | ) | ||||
| $ | 21,123 | $ | 24,473 | |||||
F-25
Table of Contents
NOTES TO THE CONSOLIDATED FINANCIAL STATEMENTS—(Continued)
FOR THE YEARS ENDED DECEMBER 31, 2007, 2008 AND 2009
(In thousands of U.S. dollars, except share and per share data, or otherwise noted)
| December 31, | ||||||||||||
| 2007 | 2008 | 2009 | ||||||||||
| Beginning balance | $ | 1,027 | $ | 1,132 | $ | 339 | ||||||
| Provision for doubtful accounts charged to general and administrative expenses | 212 | 578 | — | |||||||||
| Written-off | (167 | ) | (1,406 | ) | (119 | ) | ||||||
| Foreign currency translation adjustments | 60 | 35 | — | |||||||||
| Balances at the end of the year | $ | 1,132 | $ | 339 | $ | 220 | ||||||
| 5. | PREPAID EXPENSES AND OTHER CURRENT ASSETS |
| December 31, | ||||||||
| 2008 | 2009 | |||||||
| Deposits | $ | 404 | $ | 624 | ||||
| Advances to employees | 283 | 288 | ||||||
| Advances to suppliers | 42 | 156 | ||||||
| Prepaid initial public offering (“IPO”) expenses | — | 40 | ||||||
| Prepaid rent and other prepaid expenses | 385 | 862 | ||||||
| Other current assets | 480 | 179 | ||||||
| Total | $ | 1,594 | $ | 2,149 | ||||
| 6. | PROPERTY, PLANT AND EQUIPMENT, NET |
| December 31, | ||||||||
| 2008 | 2009 | |||||||
| Furniture, fixtures and electronic equipment | $ | 8,842 | $ | 8,549 | ||||
| Transportation equipment | 388 | 362 | ||||||
| Leasehold improvements | 3,060 | 3,198 | ||||||
| 12,290 | 12,109 | |||||||
| Less: Accumulated depreciation and amortization | 5,587 | 4,906 | ||||||
| $ | 6,703 | $ | 7,203 | |||||
F-26
Table of Contents
NOTES TO THE CONSOLIDATED FINANCIAL STATEMENTS—(Continued)
FOR THE YEARS ENDED DECEMBER 31, 2007, 2008 AND 2009
(In thousands of U.S. dollars, except share and per share data, or otherwise noted)
| 7. | GOODWILL |
| December 31, | ||||||||
Goodwill | 2008 | 2009 | ||||||
| Balance, beginning of the year | $ | 10,316 | $ | 5,946 | ||||
| Goodwill acquired in acquisition of business | — | 4,320 | ||||||
| Impairment of goodwill | (4,784 | ) | — | |||||
| Foreign exchange difference due to translation | 414 | (74 | ) | |||||
| Balance, end of the year | $ | 5,946 | $ | 10,192 | ||||
| Gross amount of goodwill | 10,730 | 14,976 | ||||||
| Accumulated goodwill impairment loss | (4,784 | ) | (4,784 | ) | ||||
| 8. | INTANGIBLE ASSETS |
| Contract | Customer | Non-Compete | ||||||||||||||
| Backlog | Base | Agreement | Total | |||||||||||||
| Balance as of January 1, 2008 | $ | 63 | $ | 6,480 | $ | 310 | $ | 6,853 | ||||||||
| Amortization | (50 | ) | (1,451 | ) | (114 | ) | (1,615 | ) | ||||||||
| Impairment of intangible assets | (13 | ) | (5,551 | ) | (196 | ) | (5,760 | ) | ||||||||
| Foreign exchange difference due to translation | — | 522 | — | 522 | ||||||||||||
| Net intangible assets as of December 31, 2008 | $ | — | $ | — | $ | — | $ | — | ||||||||
| Acquisition | $ | 248 | $ | 1,780 | $ | — | $ | 2,028 | ||||||||
| Amortization | (16 | ) | (60 | ) | — | (76 | ) | |||||||||
| Foreign exchange difference due to translation | (3 | ) | (15 | ) | — | (18 | ) | |||||||||
| Net intangible assets as of December 31, 2009 | $ | 229 | $ | 1,705 | $ | — | $ | 1,934 | ||||||||
F-27
Table of Contents
NOTES TO THE CONSOLIDATED FINANCIAL STATEMENTS—(Continued)
FOR THE YEARS ENDED DECEMBER 31, 2007, 2008 AND 2009
(In thousands of U.S. dollars, except share and per share data, or otherwise noted)
| 9. | ACCRUED EXPENSES AND OTHER PAYABLES |
| December 31, | ||||||||
| 2008 | 2009 | |||||||
| Employee payroll and welfare payables | $ | 5,765 | $ | 6,590 | ||||
| Advance from customers | 333 | 3,073 | ||||||
| Deferred acquisition consideration | — | 2,700 | ||||||
| Contingent acquisition consideration | — | 2,619 | ||||||
| Accrued rental expenses | 2,065 | 2,581 | ||||||
| Subcontract fee | 952 | 669 | ||||||
| Accrued professional fee | 796 | 541 | ||||||
| Other payable | 1,809 | 1,763 | ||||||
| Total | $ | 11,720 | $ | 20,536 | ||||
| 10. | LONG-TERM BANK BORROWINGS |
| December 31, | ||||||||
| 2008 | 2009 | |||||||
| Secured loan from the Development Bank of Singapore Limited | $ | 65 | $ | 20 | ||||
| Less: current portion | (46 | ) | (20 | ) | ||||
| $ | 19 | $ | — | |||||
| May 2010 | $ | 20 | ||
| $ | 20 | |||
| 11. | OFFERING EXPENSES |
F-28
Table of Contents
NOTES TO THE CONSOLIDATED FINANCIAL STATEMENTS—(Continued)
FOR THE YEARS ENDED DECEMBER 31, 2007, 2008 AND 2009
(In thousands of U.S. dollars, except share and per share data, or otherwise noted)
| 12. | FAIR VALUE |
| • | Level 1—inputs are based upon unadjusted quoted prices for identical instruments traded in active markets. | |
| • | Level 2—inputs are based upon quoted prices for similar instruments in active markets, quoted prices for identical or similar instruments in markets that are not active, and model-based valuation techniques for which all significant assumptions are observable in the market or can be corroborated by observable market data for substantially the full term of the assets or liabilities. | |
| • | Level 3—inputs are generally unobservable and typically reflect management’s estimates of assumptions that market participants would use in pricing the asset or liability. The fair values are therefore determined using model-based techniques that include option pricing models, discounted cash flow models, and similar techniques. |
| (a) | Assets and liabilities measured at fair value on a recurring basis |
| Years Ended December 31 | ||||||||
| 2008 | 2009 | |||||||
| Settlement currency | ||||||||
| Notional amount (Japanese Yen) | ¥ | 120,000,000 | ¥ | 40,000,000 | ||||
| U.S. dollar equivalent | $ | 1,322 | $ | 444 | ||||
F-29
Table of Contents
NOTES TO THE CONSOLIDATED FINANCIAL STATEMENTS—(Continued)
FOR THE YEARS ENDED DECEMBER 31, 2007, 2008 AND 2009
(In thousands of U.S. dollars, except share and per share data, or otherwise noted)
| (b) | Assets and liabilities measured at fair value on a nonrecurring basis |
| • | Acquisition of AIA Information Technology(Guangzhou) Co. Ltd on August 14, 2009 | |
| • | Acquisition of MG Digital PTE Ltd on October 1, 2009 | |
| • | Acquisition of AllianceSPEC Pte Ltd on December 1, 2009 |
| Fair Value Measurements | ||||||||||||||||
| Net Carrying | ||||||||||||||||
| Value as of | ||||||||||||||||
| December 31, | ||||||||||||||||
| 2009 | Level 1 | Level 2 | Level 3 | |||||||||||||
| Contract backlog | $ | 248 | $ | — | $ | — | $ | 248 | ||||||||
| Customer base | $ | 1,780 | $ | — | $ | — | $ | 1,780 | ||||||||
| 13. | INCOME TAXES |
| December 31, | ||||||||||||
| 2007 | 2008 | 2009 | ||||||||||
| Current | ||||||||||||
| - PRC Hong Kong income tax expense | $ | 262 | $ | 464 | $ | 1,692 | ||||||
| - Japan income tax expense | 27 | 128 | 50 | |||||||||
| - U.S. income tax expenses | 878 | — | — | |||||||||
| - Singapore income tax expenses | 8 | 8 | 107 | |||||||||
| Deferred | ||||||||||||
| - PRC Hong Kong income tax expense | 121 | (287 | ) | (100 | ) | |||||||
| - Japan income tax expense | 29 | 15 | (222 | ) | ||||||||
| - U.S. income tax expenses | (576 | ) | (872 | ) | (420 | ) | ||||||
| - Singapore income tax expenses | 21 | (159 | ) | (46 | ) | |||||||
| Income tax expense (benefit) | $ | 770 | $ | (703 | ) | $ | 1,061 | |||||
F-30
Table of Contents
NOTES TO THE CONSOLIDATED FINANCIAL STATEMENTS—(Continued)
FOR THE YEARS ENDED DECEMBER 31, 2007, 2008 AND 2009
(In thousands of U.S. dollars, except share and per share data, or otherwise noted)
F-31
Table of Contents
NOTES TO THE CONSOLIDATED FINANCIAL STATEMENTS—(Continued)
FOR THE YEARS ENDED DECEMBER 31, 2007, 2008 AND 2009
(In thousands of U.S. dollars, except share and per share data, or otherwise noted)
Subsidiaries | 0% | 7.5% | 12.5% | 15% | 18% | 20% | 22% | 24% | ||||||||||||||||||||||||
| HiSoft Dalian (1) | — | 2007 | 2008-2009 | 2010-2012 | — | — | — | — | ||||||||||||||||||||||||
| HiSoft Shenzhen | — | — | — | 2007 | 2008 | 2009 | 2010 | 2011 | ||||||||||||||||||||||||
| HiSoft Chengdu (1) | — | — | — | 2008-2012 | — | — | — | — | ||||||||||||||||||||||||
| HiSoft Beijing (1) | 2007-2008 | 2009-2010 | — | 2011-2012 | — | — | — | — | ||||||||||||||||||||||||
| HiSoft Shanghai | — | — | — | — | 2007 | — | — | — | ||||||||||||||||||||||||
| (1) | The new HNTE status obtained by HiSoft Dalian, HiSoft Chengdu and HiSoft Beijing in 2008 under the New EIT Law is valid for three years and qualifying entities can then apply to renew for an additional three years provided their business operations continue to qualify for the new HNTE status. The Group believes it is highly likely that its qualifying entities will continue to obtain the renewal in the future. Accordingly, in calculating deferred tax assets and liabilities, the Group assumed its qualifying entities will continue to renew the new HNTE status at the conclusion of the initial three-year period. If the Group’s qualifying entities failed to obtain such renewals, then the income tax expenses would increase by $1,421 in 2009, which would be a decrease to the net income. |
F-32
Table of Contents
NOTES TO THE CONSOLIDATED FINANCIAL STATEMENTS—(Continued)
FOR THE YEARS ENDED DECEMBER 31, 2007, 2008 AND 2009
(In thousands of U.S. dollars, except share and per share data, or otherwise noted)
| Years Ended December 31, | ||||||||||||
| 2007 | 2008 | 2009 | ||||||||||
| Deferred tax assets—current: | ||||||||||||
| Provision for doubtful accounts | $ | 326 | $ | 450 | $ | 421 | ||||||
| Accrued expenses | 145 | 77 | 54 | |||||||||
| Less: Valuation allowance | (284 | ) | (412 | ) | (409 | ) | ||||||
| Net deferred tax assets—current | 187 | 115 | 66 | |||||||||
| Deferred tax assets—non-current: | ||||||||||||
| Net operating losses | 1,355 | 996 | 1,830 | |||||||||
| Depreciation | 109 | 61 | 53 | |||||||||
| Total deferred tax assets—non-current | 1,464 | 1,057 | 1,883 | |||||||||
| Less: Valuation allowance | (1,270 | ) | (993 | ) | (1,460 | ) | ||||||
| Net deferred tax assets—non-current | 194 | 64 | 423 | |||||||||
| Deferred tax liabilities—non-current: | ||||||||||||
| Intangible assets | (1,068 | ) | — | (225 | ) | |||||||
| Depreciation | (40 | ) | (40 | ) | (31 | ) | ||||||
| Deferred tax liabilities—non-current | $ | (1,108 | ) | $ | (40 | ) | $ | (256 | ) | |||
F-33
Table of Contents
NOTES TO THE CONSOLIDATED FINANCIAL STATEMENTS—(Continued)
FOR THE YEARS ENDED DECEMBER 31, 2007, 2008 AND 2009
(In thousands of U.S. dollars, except share and per share data, or otherwise noted)
| Years Ended December 31, | ||||||||||||
| 2007 | 2008 | 2009 | ||||||||||
| Tax expense (benefit) at statutory tax rate in the PRC (33%, 25% and 25% for 2007, 2008 and 2009 respectively) | $ | (37 | ) | $ | (2,711 | ) | $ | 2,107 | ||||
| Non-deductible loss on disposal of fixed assets | 10 | 231 | 310 | |||||||||
| Non-deductible expenses of Beijing branch of HiSoft Dalian including expenses incurred on behalf of other entities within the Group | 757 | 657 | — | |||||||||
| Other nondeductible expenses pursuant to the PRC tax law | 413 | 524 | 69 | |||||||||
| Impairment of goodwill | — | 1,196 | — | |||||||||
| Different tax jurisdictions | (215 | ) | 1,022 | (155 | ) | |||||||
| Preferential tax rates and tax exemption in the PRC | (1,207 | ) | (1,753 | ) | (1,421 | ) | ||||||
| Adjustment of deferred tax balance due to enacted tax rate change effective as of January 1, 2008 | 320 | — | — | |||||||||
| Increase (decrease) in valuation allowance | 769 | (148 | ) | 462 | ||||||||
| Other | (40 | ) | 279 | (311 | ) | |||||||
| Effective income tax expense (benefit) | $ | 770 | $ | (703 | ) | $ | 1,061 | |||||
F-34
Table of Contents
NOTES TO THE CONSOLIDATED FINANCIAL STATEMENTS—(Continued)
FOR THE YEARS ENDED DECEMBER 31, 2007, 2008 AND 2009
(In thousands of U.S. dollars, except share and per share data, or otherwise noted)
| Years Ended December 31, | ||||||||||||
| 2007 | 2008 | 2009 | ||||||||||
| Provision for income taxes | $ | 1,977 | $ | 1,050 | $ | 2,482 | ||||||
| Net income per share—basic common share | (0.02 | ) | (0.14 | ) | 0.07 | |||||||
| Net income per Series A convertible preferred share | — | — | 0.10 | |||||||||
Net income perSeries A-1 convertible preferred share | — | — | 0.15 | |||||||||
| Net income per Series B convertible preferred share | — | — | 0.05 | |||||||||
| Net income per Series C convertible preferred share | — | — | 0.07 | |||||||||
| Net income per share—diluted common share | $ | (0.02 | ) | $ | (0.14 | ) | $ | 0.02 | ||||
| Weighted average shares used in calculating net income per common share | 94,237,854 | 82,279,610 | 86,148,324 | |||||||||
| Series A convertible preferred share | 61,959,000 | |||||||||||
Series A-1 convertible preferred share | 39,132,000 | |||||||||||
| Series B convertible preferred share | 112,000,000 | |||||||||||
| Series C convertible preferred share | 80,046,793 | |||||||||||
| Diluted—common shares | 94,237,854 | 82,279,610 | 388,372,705 | |||||||||
| Year Ended December 31, | ||||||||||||
| 2007 | 2008 | 2009 | ||||||||||
Income (loss) from continuing operations | ||||||||||||
before income tax expense (benefit) | ||||||||||||
| Domestic (Cayman Islands) | $ | 114 | $ | (5,497 | ) | $ | (1,202 | ) | ||||
| Foreign (Others) | (226 | ) | (5,348 | ) | 9,626 | |||||||
| Total | $ | (112 | ) | $ | (10,845 | ) | $ | 8,424 | ||||
F-35
Table of Contents
NOTES TO THE CONSOLIDATED FINANCIAL STATEMENTS—(Continued)
FOR THE YEARS ENDED DECEMBER 31, 2007, 2008 AND 2009
(In thousands of U.S. dollars, except share and per share data, or otherwise noted)
| 14. | CONVERTIBLE REDEEMABLE PREFERRED SHARES |
F-36
Table of Contents
NOTES TO THE CONSOLIDATED FINANCIAL STATEMENTS—(Continued)
FOR THE YEARS ENDED DECEMBER 31, 2007, 2008 AND 2009
(In thousands of U.S. dollars, except share and per share data, or otherwise noted)
F-37
Table of Contents
NOTES TO THE CONSOLIDATED FINANCIAL STATEMENTS—(Continued)
FOR THE YEARS ENDED DECEMBER 31, 2007, 2008 AND 2009
(In thousands of U.S. dollars, except share and per share data, or otherwise noted)
F-38
Table of Contents
NOTES TO THE CONSOLIDATED FINANCIAL STATEMENTS—(Continued)
FOR THE YEARS ENDED DECEMBER 31, 2007, 2008 AND 2009
(In thousands of U.S. dollars, except share and per share data, or otherwise noted)
| 15. | WARRANTS |
| 16. | SHARES TO BE ISSUED |
| Subsequent | Unissued | |||||||||||
| Date of | Shares | |||||||||||
| Date | Issuance | Balance | ||||||||||
| Shares to be issued | ||||||||||||
| The initial payment for the acquisition of 49% equity interest in Beijing Tianhia Hongye International Software Limited (“Tianhai”)* | 12/31/2006 | 6/7/2007 | $ | 1,279 | ||||||||
| Acquisition of 100% equity interest in Envisage Solutions Inc. (“Envisage”) | 12/31/2006 | 1/18/2007 | 463 | |||||||||
| Total shares to be issued as of December 31, 2006 | 1,742 | |||||||||||
| Acquisition of 100% equity interest in Wave | 12/31/2007 | 1/14/2008 | 1,117 | |||||||||
| The second payment for the acquisition of 49% equity interest in Tianhai | 12/31/2006 | 2/22/2008 | 1,123 | |||||||||
| Total shares to be issued as of December 31, 2007 | 2,240 | |||||||||||
| Acquisition of AllianceSPEC Pte Ltd. | 12/1/ 2009 | 2/26/2010 | 471 | |||||||||
| Total shares to be issued as of December 31, 2009 | $ | 471 | ||||||||||
| * | Tianhai was a subsidiary of the Group from December 31, 2005 when the Group acquired 51% of Tianhai. |
F-39
Table of Contents
NOTES TO THE CONSOLIDATED FINANCIAL STATEMENTS—(Continued)
FOR THE YEARS ENDED DECEMBER 31, 2007, 2008 AND 2009
(In thousands of U.S. dollars, except share and per share data, or otherwise noted)
| 17. | COMMON SHARES |
| 18. | SHARE-BASED COMPENSATION PLAN |
F-40
Table of Contents
NOTES TO THE CONSOLIDATED FINANCIAL STATEMENTS—(Continued)
FOR THE YEARS ENDED DECEMBER 31, 2007, 2008 AND 2009
(In thousands of U.S. dollars, except share and per share data, or otherwise noted)
| Weighted | ||||||||||||||||
| Weighted | Average | |||||||||||||||
| Number of | Weighted | Average | Intrinsic Value | |||||||||||||
| Share | Average | Grant-Date | Per Option at | |||||||||||||
| Options | Exercise Price | Fair Value | the Grant Dates | |||||||||||||
| Share options outstanding as at January 1, 2007 | 38,471,500 | $ | 0.23 | |||||||||||||
| Granted | 17,657,909 | 0.43 | $ | 0.07 | $ | — | ||||||||||
| Exercised | — | — | ||||||||||||||
| Cancelled | (2,452,449 | ) | 0.27 | |||||||||||||
| Share options outstanding as at December 31, 2007 | 53,676,960 | 0.30 | ||||||||||||||
| Granted | 5,748,000 | 0.50 | $ | 0.08 | $ | — | ||||||||||
| Exercised | (530,625 | ) | 0.24 | |||||||||||||
| Cancelled | (7,002,270 | ) | 0.39 | |||||||||||||
| Share options outstanding as at December 31, 2008 | 51,892,065 | 0.31 | ||||||||||||||
| Granted | 6,134,500 | 0.30 | $ | 0.14 | $ | — | ||||||||||
| Exercised | (178,061 | ) | 0.27 | |||||||||||||
| Cancelled | (3,718,312 | ) | 0.40 | |||||||||||||
| Share options outstanding as at December 31, 2009 | 54,130,192 | $ | 0.30 | |||||||||||||
F-41
Table of Contents
NOTES TO THE CONSOLIDATED FINANCIAL STATEMENTS—(Continued)
FOR THE YEARS ENDED DECEMBER 31, 2007, 2008 AND 2009
(In thousands of U.S. dollars, except share and per share data, or otherwise noted)
| Options Outstanding | Options Exercisable | |||||||||||||||||||||||||||
| Weighted | ||||||||||||||||||||||||||||
| Average | ||||||||||||||||||||||||||||
| Remaining | Weighted | Weighted | ||||||||||||||||||||||||||
| Contractual | Average | Aggregate | Average | Aggregate | ||||||||||||||||||||||||
| Number | Life in | Exercise | Intrinsic | Number | Exercise | Intrinsic | ||||||||||||||||||||||
| Outstanding | Years | Price | Value | Exercisable | Price | Value | ||||||||||||||||||||||
| Exercise price | ||||||||||||||||||||||||||||
| $0.10 | 4,273,250 | 5.08 | $ | 0.10 | $ | 914 | 4,273,250 | $ | 0.10 | $ | 914 | |||||||||||||||||
| $0.25 | 31,884,693 | 6.01 | $ | 0.25 | 2,041 | 29,462,943 | $ | 0.25 | 1,886 | |||||||||||||||||||
| $0.30 | 6,011,000 | 9.67 | $ | 0.30 | 84 | — | $ | 0.30 | — | |||||||||||||||||||
| $0.50 | 11,961,249 | 7.97 | $ | 0.50 | $ | — | 7,069,246 | $ | 0.50 | $ | — | |||||||||||||||||
| 54,130,192 | $ | 0.30 | $ | 3,039 | 40,805,439 | $ | 0.28 | $ | 2,800 | |||||||||||||||||||
| Years Ended December 31, | ||||||||||||
| 2007 | 2008 | 2009 | ||||||||||
| Total fair value of shares vested | $ | 818 | $ | 944 | $ | 651 | ||||||
| Weighted- | ||||||||||||
| Weighted- | Average | |||||||||||
| Average | Exercise- | |||||||||||
| Grant-Date | Price | |||||||||||
Nonvested Share Options | Share Options | Fair Value | per Share | |||||||||
| Nonvested at January 1, 2007 | 35,132,208 | $ | 0.05 | $ | 0.24 | |||||||
| Granted | 17,657,909 | 0.07 | 0.43 | |||||||||
| Vested | (13,924,835 | ) | 0.06 | 0.24 | ||||||||
| Forfeited | (2,452,449 | ) | 0.04 | 0.28 | ||||||||
| Nonvested at December 31, 2007 | 36,412,833 | 0.06 | 0.33 | |||||||||
| Granted | 5,748,000 | 0.08 | 0.50 | |||||||||
| Vested | (14,842,036 | ) | 0.06 | 0.29 | ||||||||
| Forfeited | (7,002,270 | ) | 0.07 | 0.39 | ||||||||
| Nonvested at December 31, 2008 | 20,316,527 | 0.07 | 0.39 | |||||||||
| Granted | 6,134,500 | 0.14 | 0.30 | |||||||||
| Vested | (9,407,963 | ) | 0.07 | 0.36 | ||||||||
| Forfeited | (3,718,312 | ) | 0.07 | 0.40 | ||||||||
| Nonvested at December 31, 2009 | 13,324,752 | $ | 0.10 | $ | 0.36 | |||||||
F-42
Table of Contents
NOTES TO THE CONSOLIDATED FINANCIAL STATEMENTS—(Continued)
FOR THE YEARS ENDED DECEMBER 31, 2007, 2008 AND 2009
(In thousands of U.S. dollars, except share and per share data, or otherwise noted)
| 2007 | 2008 | 2009 | ||||||||||
| Risk free interest | 4.30%-5.35% | 3.90%-4.55% | 3.04%-3.89% | |||||||||
| Expected dividend yield | — | — | — | |||||||||
| Expected life | 6.1 years | 5.7-6.1 years | 6.0-6.9 years | |||||||||
| Expected volatility | 47.4%-57.2% | 43.0%-44.0% | 48.0%-49.0% | |||||||||
| Exercise price | $ | 0.25-0.50 | $ | 0.50 | $ | 0.30-0.50 | ||||||
| Fair value of the underlying common shares | $ | 0.09-0.28 | $ | 0.24-0.28 | $ | 0.25-0.31 | ||||||
| (1) | Volatility |
| (2) | Risk-free interest rate |
| (3) | Expected term |
| (4) | Dividend yield |
| (5) | Exercise price |
F-43
Table of Contents
NOTES TO THE CONSOLIDATED FINANCIAL STATEMENTS—(Continued)
FOR THE YEARS ENDED DECEMBER 31, 2007, 2008 AND 2009
(In thousands of U.S. dollars, except share and per share data, or otherwise noted)
| (6) | Fair value of underlying common shares |
| �� | ||||||||||||
| Number of | Fair Value | Intrinsic | ||||||||||
| Shares | of Shares | Value | ||||||||||
| Nonvested share unvested at January 1, 2007 | 3,350,000 | $ | 0.137 | $ | 459 | |||||||
| Granted | 5,723,038 | 0.270 | 1,545 | |||||||||
| Vested | (3,350,000 | ) | 0.137 | (459 | ) | |||||||
| Forfeited | (202,000 | ) | 0.270 | (55 | ) | |||||||
| Nonvested share unvested on January 1, 2008 | 5,521,038 | $ | 0.270 | $ | 1,490 | |||||||
| Granted | — | — | — | |||||||||
| Vested | (2,449,928 | ) | 0.270 | (661 | ) | |||||||
| Forfeited | — | — | — | |||||||||
| Nonvested share unvested on December 31, 2008 | 3,071,110 | $ | 0.270 | $ | 829 | |||||||
| Granted | 4,040,000 | 0.279 | 1,129 | |||||||||
| Vested | (2,304,848 | ) | 0.270 | (622 | ) | |||||||
| Forfeited | (300,000 | ) | 0.257 | (77 | ) | |||||||
| Nonvested share unvested on December 31, 2009 | 4,506,262 | $ | 0.279 | $ | 1,259 | |||||||
F-44
Table of Contents
NOTES TO THE CONSOLIDATED FINANCIAL STATEMENTS—(Continued)
FOR THE YEARS ENDED DECEMBER 31, 2007, 2008 AND 2009
(In thousands of U.S. dollars, except share and per share data, or otherwise noted)
| 19. | RELATED PARTY BALANCES AND TRANSACTIONS |
| December 31, | ||||||||
| 2008 | 2009 | |||||||
| Tianhai | $ | 799 | $ | — | ||||
| Total | $ | 799 | $ | — | ||||
| December 31, | ||||||||
| 2008 | 2009 | |||||||
| Tianhai | $ | 1,035 | $ | — | ||||
| Years Ended December 31, | ||||||||||||
| 2007 | 2008 | 2009 | ||||||||||
| Sales to JBDK Company Limited | $ | 1,421 | $ | — | $ | — | ||||||
| Years Ended December 31, | ||||||||||||
| 2007 | 2008 | 2009 | ||||||||||
| Tianhai | $ | 455 | $ | — | $ | — | ||||||
F-45
Table of Contents
NOTES TO THE CONSOLIDATED FINANCIAL STATEMENTS—(Continued)
FOR THE YEARS ENDED DECEMBER 31, 2007, 2008 AND 2009
(In thousands of U.S. dollars, except share and per share data, or otherwise noted)
| 20. | CHINA CONTRIBUTION PLAN AND PROFIT APPROPRIATION |
| 21. | NET (LOSS)/INCOME PER SHARE |
| For the Year Ended December 31, | ||||||||||||
| 2007 | 2008 | 2009 | ||||||||||
| Net (loss) income attributable to HiSoft Technology International Limited shareholders | ||||||||||||
| Net (loss) income on continuing operations | $ | (882 | ) | $ | (10,142 | ) | $ | 7,363 | ||||
| Net (loss) income on discontinued operations, net of tax | (38 | ) | (569 | ) | — | |||||||
| Net income attributable to HiSoft Technology International Limited shareholders | (920 | ) | (10,711 | ) | 7,363 | |||||||
Deemed dividends on Series A,Series A-1, Series B, and Series C Convertible redeemable preferred shares | (5,762 | ) | — | — | ||||||||
F-46
Table of Contents
NOTES TO THE CONSOLIDATED FINANCIAL STATEMENTS—(Continued)
FOR THE YEARS ENDED DECEMBER 31, 2007, 2008 AND 2009
(In thousands of U.S. dollars, except share and per share data, or otherwise noted)
| For the Year Ended December 31, | ||||||||||||
| 2007 | 2008 | 2009 | ||||||||||
| Net (loss) income attributable to HiSoft Technology International Limited shareholders allocated for computing net income per common share—basic (i): | ||||||||||||
| Net (loss) income from continuing operations | (882 | ) | (10,142 | ) | 1,673 | |||||||
| Net (loss) income on discontinued operations, net of tax | (38 | ) | (569 | ) | — | |||||||
| Net (loss) income attributable to HiSoft Technology International Limited shareholders allocated for computing net income per common share—basic(i): | (6,682 | ) | (10,711 | ) | 1,673 | |||||||
| Net income attributable to HiSoft Technology International Limited shareholders allocated for computing net income per Series A preferred share—basic (i): | ||||||||||||
| Income from continuing operations | — | — | 1,203 | |||||||||
| Loss on discontinued operations, net of tax | — | — | — | |||||||||
| Net income attributable to HiSoft Technology International Limited shareholders allocated for computing net income per Series A preferred share—basic (i) | — | — | 1,203 | |||||||||
Net income attributable to HiSoft Technology International Limited shareholders allocated for computing net income perSeries A-1 preferred share—basic (i): | ||||||||||||
| Income from continuing operations | — | — | 760 | |||||||||
| Loss on discontinued operations, net of tax | — | — | — | |||||||||
Net income attributable to HiSoft Technology International Limited shareholders allocated for computing net income perSeries A-1 preferred share—basic (i) | — | — | 760 | |||||||||
| Net income attributable to HiSoft Technology International Limited shareholders allocated for computing net income per Series B preferred share—basic (i): | ||||||||||||
| Income from continuing operations | — | — | 2,174 | |||||||||
| Loss on discontinued operations, net of tax | — | — | — | |||||||||
| Net income attributable to HiSoft Technology International Limited shareholders allocated for computing net income per Series B preferred share—basic (i) | — | — | 2,174 | |||||||||
F-47
Table of Contents
NOTES TO THE CONSOLIDATED FINANCIAL STATEMENTS—(Continued)
FOR THE YEARS ENDED DECEMBER 31, 2007, 2008 AND 2009
(In thousands of U.S. dollars, except share and per share data, or otherwise noted)
| For the Year Ended December 31, | ||||||||||||
| 2007 | 2008 | 2009 | ||||||||||
| Net income attributable to HiSoft Technology International Limited shareholders allocated for computing net income per Series C preferred share—basic (i): | ||||||||||||
| Income from continuing operations | — | — | 1,553 | |||||||||
| Loss on discontinued operations, net of tax | — | — | — | |||||||||
| Net income attributable to HiSoft Technology International Limited shareholders allocated for computing net income per Series C preferred share—basic (i) | — | — | 1,553 | |||||||||
| Net income attributable to HiSoft Technology International Limited shareholders allocated for computing net income per common share—diluted | ||||||||||||
| (Loss) Income from continuing operations | (6,644 | ) | (10,142 | ) | 7,363 | |||||||
| (Loss) on discontinued operations, net of tax | (38 | ) | (569 | ) | — | |||||||
| Net income attributable to HiSoft Technology International Limited shareholders allocated for computing net income per common share—diluted | $ | (6,682 | ) | $ | (10,711 | ) | $ | 7,363 | ||||
| Weighted average common shares outstanding used in computing net income per common share—basic(ii) | 94,237,854 | 82,279,610 | 86,148,324 | |||||||||
| Weighted average common shares outstanding used in computing net income per common share—diluted (iii) | 94,237,854 | 82,279,610 | 388,372,705 | |||||||||
| Weighted average shares outstanding used in computing net income per Series A preferred share—basic (iii) | 61,959,000 | |||||||||||
Weighted average shares outstanding used in computing net income perSeries A-1 preferred share—basic (iii) | 39,132,000 | |||||||||||
| Weighted average shares outstanding used in computing net income per Series B preferred share—basic (iii) | 112,000,000 | |||||||||||
| Weighted average shares outstanding used in computing net income per Series C preferred share—basic (iii) | 80,046,793 | |||||||||||
| Net income per common share—basic: | ||||||||||||
| Income from continuing operations | $ | (0.07 | ) | $ | (0.12 | ) | $ | 0.02 | ||||
| Loss on discontinued operations | — | (0.01 | ) | — | ||||||||
| Net income per common share—basic: | (0.07 | ) | (0.13 | ) | 0.02 | |||||||
F-48
Table of Contents
NOTES TO THE CONSOLIDATED FINANCIAL STATEMENTS—(Continued)
FOR THE YEARS ENDED DECEMBER 31, 2007, 2008 AND 2009
(In thousands of U.S. dollars, except share and per share data, or otherwise noted)
| For the Year Ended December 31, | ||||||||||||
| 2007 | 2008 | 2009 | ||||||||||
| Net income per common share—diluted: | ||||||||||||
| Income from continuing operations | (0.07 | ) | (0.12 | ) | 0.02 | |||||||
| Loss on discontinued operations | — | (0.01 | ) | — | ||||||||
| Net income per common share—diluted | (0.07 | ) | (0.13 | ) | 0.02 | |||||||
| Net income per Series A preferred share—basic: | ||||||||||||
| Income from continuing operations | — | — | 0.02 | |||||||||
| Loss on discontinued operations | — | — | — | |||||||||
| Net income per Series A preferred share—basic | — | — | 0.02 | |||||||||
Net income perSeries A-1 preferred share—basic: | ||||||||||||
| Income from continuing operations | — | — | 0.02 | |||||||||
| Loss on discontinued operations | — | — | — | |||||||||
Net income perSeries A-1 preferred share—basic | — | — | 0.02 | |||||||||
| Net income per Series B preferred share—basic: | ||||||||||||
| Income from continuing operations | — | — | 0.02 | |||||||||
| Loss on discontinued operations | — | — | — | |||||||||
| Net income per Series B preferred share—basic | — | — | 0.02 | |||||||||
| Net income per Series C preferred share—basic: | ||||||||||||
| Income from continuing operations | — | — | 0.02 | |||||||||
| Loss on discontinued operations | — | — | — | |||||||||
| Net income per Series C preferred share—basic | $ | — | $ | — | $ | 0.02 | ||||||
| (i) | The net income attributable to holders of common shares as of December 31, 2009 was allocated between common shares and preferred shares on pro rata basis based on the dividend participant right. Each Series A,Series A-1, Series B, and Series C convertible redeemable preferred shares has participating right on the undistributed net income, and the allocation was based on an as-if-converted basis. The undistributed net loss as of December 31, 2007 and 2008 was allocated to common shares only as preferred shares are not contractually obligated to share the loss. | |
| (ii) | As of December 31, 2009, the Company had 1,500,000 common shares related to 2009 acquisition of AllianceSPEC Pte Ltd., which were yet to be issued, and have been included in the calculation of weighted average common shares used in calculating basic net income per share from the date of acquisition. | |
| As of December 31, 2007, the Company had 7,972,091 common shares related to 2007 acquisition of Beijing Tianhai Hongye International Software Limited and Daemoyrod Corp., which were yet to be issued (subsequently issued in 2008), and have been included in the calculation of weighted average common shares used in calculating basic net income per share from the date of acquisition. | ||
| (iii) | The calculation of the weighted average number of common shares for the purpose of diluted net income per share has included the effect of certain securities. For year 2009, such securities included an incremental 61,959,000, 39,132,000, 112,000,000, and 80,046,793 common shares resulting from the assumed conversion of the Series A,Series A-1, Series B, and Series C convertible redeemable preferred shares, respectively. |
F-49
Table of Contents
NOTES TO THE CONSOLIDATED FINANCIAL STATEMENTS—(Continued)
FOR THE YEARS ENDED DECEMBER 31, 2007, 2008 AND 2009
(In thousands of U.S. dollars, except share and per share data, or otherwise noted)
| As of December 31, 2007 and 2008, the Group had 57,000,000 and 57,000,000, respectively, shares of Series A convertible redeemable preferred shares, 36,000,000 and 36,000,000, respectively, shares ofSeries A-1 convertible redeemable preferred shares, 112,000,000 and 112,000,000, respectively, shares of Series B convertible redeemable preferred shares, and 59,090,910 and 59,090,910, respectively, shares of Series C convertible redeemable preferred shares outstanding that could potentially dilute basic earnings per share in the future, but were excluded from the computation of diluted loss per share for the year ended December 31, 2007 and 2008 as their effects would have been anti-dilutive. | ||
| The Group had 40,805,440 vested common share options as of December 31, 2009 and have been included in the calculation of weighted average common shares used in calculating diluted net income per share. | ||
| As of December 31, 2007 and 2008, the Group had 17,264,127 and 31,575,538 vested common share options, respectively, outstanding, which could have potentially diluted basic earnings per share in the future, but were excluded in the computation of diluted loss per share in those periods, as their effects would have been anti-dilutive. | ||
| The Group had 13,324,752 nonvested common share options as of December 31, 2009 and such shares have been included in the calculation of weighted average common shares used in calculating diluted net income per share using the treasury stock method. | ||
| As of December 31, 2008 and 2009, the Group had 2,449,928 and 2,304,848 nonvested shares, respectively included in the calculation of weighted average common shares for calculating diluted net income per share using the treasury stock method. | ||
| As of December 31, 2007 and 2008, the Group had 36,412,833 and 20,316,527 nonvested common share options, respectively, outstanding, which could have potentially diluted basic earnings per share in the future by application of the treasury stock method, but were excluded in the computation of diluted loss per share in those periods, as their effects would have been anti-dilutive. |
| 22. | LEASES AND COMMITMENTS |
| As of December 31, | ||||||||
| 2008 | 2009 | |||||||
| Electronic equipment | $ | 238 | $ | 632 | ||||
| Transportation equipment | 71 | 72 | ||||||
| 309 | 704 | |||||||
| Less: Accumulated amortization | (131 | ) | (185 | ) | ||||
| Less: Write off | — | (97 | ) | |||||
| Less: Disposal | — | (35 | ) | |||||
| $ | 178 | $ | 387 | |||||
F-50
Table of Contents
NOTES TO THE CONSOLIDATED FINANCIAL STATEMENTS—(Continued)
FOR THE YEARS ENDED DECEMBER 31, 2007, 2008 AND 2009
(In thousands of U.S. dollars, except share and per share data, or otherwise noted)
Years Ended December 31, | Total | Operating | Capital | |||||||||
| 2010 | $ | 4,517 | $ | 4,336 | $ | 181 | ||||||
| 2011 | 3,268 | 3,087 | 181 | |||||||||
| 2012 | 2,662 | 2,656 | 6 | |||||||||
| 2013 | 2,129 | 2,129 | — | |||||||||
| 2014 | 2,099 | 2,099 | — | |||||||||
| Thereafter | 4,223 | 4,223 | — | |||||||||
| Total minimum lease payments | $ | 18,898 | $ | 18,530 | $ | 368 | ||||||
| Less, Executory costs | — | |||||||||||
| Net minimum capital lease payments | 368 | |||||||||||
| Less, Estimated amount representing interest | (30 | ) | ||||||||||
| Present value of net minimum capital lease payments | 338 | |||||||||||
| Less: Current portion | (162 | ) | ||||||||||
| Long-term obligations under capital lease at December 31, 2009 | $ | 176 | ||||||||||
| 23. | DISCONTINUED OPERATIONS |
F-51
Table of Contents
NOTES TO THE CONSOLIDATED FINANCIAL STATEMENTS—(Continued)
FOR THE YEARS ENDED DECEMBER 31, 2007, 2008 AND 2009
(In thousands of U.S. dollars, except share and per share data, or otherwise noted)
| Building, net | $ | 980 | ||
| Land use right, net | 228 | |||
| Leasehold improvement, net | 181 | |||
| Transportation equipment, net | 21 | |||
| Assets of Training Center | ||||
| Cash and cash equivalents | 113 | |||
| Prepaid expenses and other current assets | 116 | |||
| Property, plant and equipment, net | 86 | |||
| Liabilities of Training Center | ||||
| Accounts payable | (107 | ) | ||
| Accrued expenses and other payables | (88 | ) | ||
| Income taxes payable | (9 | ) | ||
| Net assets sold | $ | 1,521 | ||
| Fair value of loan note | $ | 1,802 | ||
| Cash | (673 | ) | ||
| Transaction cost | (177 | ) | ||
| Net assets | (1,521 | ) | ||
| $ | (569 | ) | ||
| Years Ended December 31, | ||||||||
| 2007 | 2008 | |||||||
| Revenue of discontinued component | $ | 291 | $ | — | ||||
| Pre-tax loss on discontinued operations | (32 | ) | — | |||||
| Income tax expense | (6 | ) | — | |||||
| Loss on disposal of discontinued operations | — | (569 | ) | |||||
| Net (Loss) | $ | (38 | ) | $ | (569 | ) | ||
F-52
Table of Contents
NOTES TO THE CONSOLIDATED FINANCIAL STATEMENTS—(Continued)
FOR THE YEARS ENDED DECEMBER 31, 2007, 2008 AND 2009
(In thousands of U.S. dollars, except share and per share data, or otherwise noted)
| 24. | SEGMENT INFORMATION AND REVENUE ANALYSIS |
| Years Ended December 31, | ||||||||||||||||||||||||
| 2007 | 2008 | 2009 | ||||||||||||||||||||||
| Net | Long-lived | Net | Long-lived | Net | Long-lived | |||||||||||||||||||
| Revenues (1) | Assets (2) | Revenues (1) | Assets (2) | Revenues (1) | Assets (2) | |||||||||||||||||||
| PRC and Hong Kong | $ | 23,250 | $ | 18,214 | $ | 48,914 | $ | 14,399 | $ | 32,999 | $ | 20,226 | ||||||||||||
| Japan | 20,715 | 509 | 26,052 | 418 | 24,694 | 612 | ||||||||||||||||||
| United States | 17,268 | 5,455 | 16,714 | 40 | 22,960 | 82 | ||||||||||||||||||
| Europe | 1,190 | — | 1,040 | — | 2,410 | — | ||||||||||||||||||
| Singapore | 628 | 2,370 | 8,000 | 401 | 8,393 | 1,457 | ||||||||||||||||||
| Total | $ | 63,051 | $ | 26,548 | $ | 100,720 | $ | 15,258 | $ | 91,456 | $ | 22,377 | ||||||||||||
| (1) | Net revenues are presented by operating location of the Group’s customer entities. | |
| (2) | Long-lived assets are presented by the operating location of the subsidiaries of the Company. |
| For the Years Ended December 31, | ||||||||||||
| 2007 | 2008 | 2009 | ||||||||||
| ITS | $ | 40,682 | $ | 62,009 | $ | 47,139 | ||||||
| RDS | 22,369 | 38,711 | 44,317 | |||||||||
| Total | $ | 63,051 | $ | 100,720 | $ | 91,456 | ||||||
| 25. | SUBSEQUENT EVENTS |
F-53
Table of Contents
NOTES TO THE CONSOLIDATED FINANCIAL STATEMENTS—(Continued)
FOR THE YEARS ENDED DECEMBER 31, 2007, 2008 AND 2009
(In thousands of U.S. dollars, except share and per share data, or otherwise noted)
| • | The first tranche of cash consideration of $1,155, paid upon closing, and is subject to a downward adjustment in the event that Echo Lane, Inc.’s net current asset balance as of January 31, 2010 is less than $500. | |
| • | The second tranche of cash consideration of $1,931, subject to an adjustment based on Echo Lane, Inc.’s actual gross profit in fiscal year 2011, will be paid when the fiscal year 2011 audited financials for Echo Lane, Inc. are completed by independent auditors engaged by the Group and no later than April 14, 2012. |
F-54
Table of Contents
NOTES TO THE CONSOLIDATED FINANCIAL STATEMENTS—(Continued)
FOR THE YEARS ENDED DECEMBER 31, 2007, 2008 AND 2009
(In thousands of U.S. dollars, except share and per share data, or otherwise noted)
F-55
Table of Contents
Additional Information-Financial Statement Schedule I
Condensed Financial Information of Parent Company
Statements of Shareholders’ Equity and Comprehensive Income (loss)
(In thousands of U.S. dollars, except share and per share data, or otherwise noted)
| December 31, | ||||||||
| 2008 | 2009 | |||||||
ASSETS | ||||||||
| Current Assets: | ||||||||
| Cash and cash equivalents | $ | 14,164 | $ | 11,605 | ||||
| Other current assets | 38 | 85 | ||||||
| Total current assets | 14,202 | 11,690 | ||||||
| Property, plant and equipment, net | 15 | — | ||||||
| Investment in subsidiaries and VIE | 56,025 | 72,067 | ||||||
| Total Assets | $ | 70,242 | $ | 83,757 | ||||
| LIABILITIES, MEZZANINE EQUITY AND STOCKHOLDERS’ EQUITY | ||||||||
| Current Liabilities: | ||||||||
| Accrued expenses and other current liabilities | $ | 841 | $ | 5,666 | ||||
| Total current liabilities | 841 | 5,666 | ||||||
| Total liabilities | 841 | 5,666 | ||||||
| Series A convertible redeemable preferred shares ($0.0001 par value; 57,000,000 shares authorized; 57,000,000 and 57,000,000 shares issued and outstanding as of December 31, 2008 and 2009, respectively) | 12,581 | 12,581 | ||||||
Series A-1 convertible redeemable preferred shares ($0.0001 par value; 36,000,000 shares authorized; 36,000,000 and 36,000,000 shares issued and outstanding as of December 31, 2008 and 2009, respectively) | 9,900 | 9,900 | ||||||
| Series B convertible redeemable preferred shares ($0.0001 par value; 112,000,000 shares authorized; 112,000,000 and 112,000,000 shares issued and outstanding as of December 31, 2008 and 2009, respectively) | 30,800 | 30,800 | ||||||
| Series C convertible redeemable preferred shares ($0.0001 par value; 60,000,000 shares authorized; 59,090,910 and 59,090,910 shares issued and outstanding as of December 31, 2008 and 2009, respectively) | 35,750 | 35,750 | ||||||
| Shareholders’ Equity: | ||||||||
| Common shares ($0.0001 par value; 607,000,000 shares authorized; 85,189,211 and 87,672,120 shares issued and outstanding as of December 31, 2008 and 2009, respectively) | 9 | 9 | ||||||
| Subscription receivable | (1 | ) | (1 | ) | ||||
| Additional paid-in capital | 5,566 | 6,711 | ||||||
| Shares to be issued in connection with business acquisition | — | 471 | ||||||
| Accumulated deficit | (31,632 | ) | (24,269 | ) | ||||
| Accumulated other comprehensive income | 6,428 | 6,139 | ||||||
| Total Shareholders’ equity | (19,630 | ) | (10,940 | ) | ||||
| Total Liabilities, Convertible Redeemable Preferred Shares and Shareholders’ Equity | $ | 70,242 | $ | 83,757 | ||||
F-56
Table of Contents
Additional Information-Financial Statement Schedule I
Condensed Financial Information of Parent Company
Statements of Operations
(In thousands of U.S. dollars, except share data and per share data,
or otherwise noted)
| Years Ended December 31, | ||||||||||||
| 2007 | 2008 | 2009 | ||||||||||
| Operating expenses | ||||||||||||
| General and administrative | $ | (2,168 | ) | $ | (5,694 | ) | $ | (1,169 | ) | |||
| Sales and marketing | (8 | ) | (124 | ) | (31 | ) | ||||||
| Total operating expenses | (2,176 | ) | (5,818 | ) | (1,200 | ) | ||||||
| Interest expense | (492 | ) | — | (39 | ) | |||||||
| Interest income | 395 | 321 | 37 | |||||||||
| Change in fair value of warrants | 2,387 | — | — | |||||||||
| Net income (Loss) before earnings from subsidiaries and VIE | 114 | (5,497 | ) | (1,202 | ) | |||||||
| (Loss) Income from subsidiaries and VIE | (1,034 | ) | (430 | ) | 8,565 | |||||||
| Impairment of investments in subsidiaries and VIE | — | (4,784 | ) | — | ||||||||
| Net (loss) Income | $ | (920 | ) | $ | (10,711 | ) | $ | 7,363 | ||||
F-57
Table of Contents
Additional Information-Financial Statement Schedule I
Condensed Financial Information of Parent Company
Statements of Shareholders Equity (Deficit) and Comprehensive Income (Loss)
(In thousands of U.S. dollars, except share data and per share data, or otherwise noted)
| Shares to | ||||||||||||||||||||||||||||||||||||
| be Issued | Accumulated | Total | ||||||||||||||||||||||||||||||||||
| Additional | in Connection | Other | Shareholders’ | Total | ||||||||||||||||||||||||||||||||
| Common Stock | Subscription | Paid-In | with Business | Accumulated | Comprehensive | Equity | Comprehensive | |||||||||||||||||||||||||||||
| Shares | Amount | Receivable | Capital | Acquisitions | Deficit | Income | (Deficit) | Income (Loss) | ||||||||||||||||||||||||||||
| Balance at January 1, 2007 | 83,507,500 | $ | 9 | $ | (4 | ) | $ | 4,782 | $ | 1,742 | $ | (11,040 | ) | $ | 467 | $ | (4,044 | ) | $ | (9,637 | ) | |||||||||||||||
| Cumulative effect of unrecognized tax benefit on adoption of new accounting pronouncement | — | — | — | — | — | (969 | ) | — | (969 | ) | ||||||||||||||||||||||||||
| Issuance of common shares | 29,628,442 | 2 | — | 3,476 | (1,742 | ) | — | — | 1,736 | |||||||||||||||||||||||||||
Deemed dividend onSeries A-1 convertible redeemable preferred shares | — | — | — | (385 | ) | — | — | — | (385 | ) | ||||||||||||||||||||||||||
| Deemed dividend on Series B convertible redeemable preferred shares | — | — | — | (1,865 | ) | — | — | — | (1,865 | ) | ||||||||||||||||||||||||||
| Deemed dividend on Series C convertible redeemable preferred shares | — | — | — | (3,512 | ) | — | — | — | (3,512 | ) | ||||||||||||||||||||||||||
| Shares to be issued in connection with business acquisitions | — | — | — | — | 2,240 | — | — | 2,240 | ||||||||||||||||||||||||||||
| Share based compensation | 3,350,000 | 1 | (1 | ) | 1,490 | — | — | — | 1,490 | |||||||||||||||||||||||||||
| Repurchase and retirement of common shares | (42,249,375 | ) | (5 | ) | 4 | (2,589 | ) | — | (7,992 | ) | — | (10,582 | ) | |||||||||||||||||||||||
| Net loss | — | — | — | — | — | (920 | ) | — | (920 | ) | $ | (920 | ) | |||||||||||||||||||||||
| Foreign currency translation adjustments | — | — | — | — | — | — | 2,202 | 2,202 | 2,202 | |||||||||||||||||||||||||||
| Balance at December 31, 2007 | 74,236,567 | 7 | (1 | ) | 1,397 | 2,240 | (20,921 | ) | 2,669 | (14,609 | ) | $ | 1,282 | |||||||||||||||||||||||
| Issuance of common shares | 7,972,091 | 1 | — | 2,239 | (2,240 | ) | — | — | — | |||||||||||||||||||||||||||
| Share based compensation | — | — | — | 1,802 | — | — | — | 1,802 | ||||||||||||||||||||||||||||
| Vesting of nonvest shares award | 2,449,928 | 1 | — | (1 | ) | — | — | — | — | |||||||||||||||||||||||||||
| Stock option exercise | 530,625 | — | — | 129 | — | — | — | 129 | ||||||||||||||||||||||||||||
| Net loss | — | — | — | — | — | (10,711 | ) | — | (10,711 | ) | $ | (10,711 | ) | |||||||||||||||||||||||
| Foreign currency translation adjustments | — | — | — | — | — | — | 3,759 | 3,759 | 3,759 | |||||||||||||||||||||||||||
| Balance at December 31, 2008 | 85,189,211 | 9 | (1 | ) | 5,566 | — | (31,632 | ) | 6,428 | (19,630 | ) | $ | (6,952 | ) | ||||||||||||||||||||||
| Shares to be issued in connection with business acquisitions | — | — | — | — | 471 | — | — | 471 | ||||||||||||||||||||||||||||
| Share based compensation | — | — | — | 1,097 | — | — | — | 1,097 | ||||||||||||||||||||||||||||
| Vesting of nonvest shares award | 2,304,848 | — | — | — | — | — | — | — | ||||||||||||||||||||||||||||
| Stock option exercise | 178,061 | — | — | 48 | — | — | — | 48 | ||||||||||||||||||||||||||||
| Net loss | — | — | — | — | — | 7,363 | — | 7,363 | $ | 7,363 | ||||||||||||||||||||||||||
| Foreign currency translation adjustments | — | — | — | — | — | — | (289 | ) | (289 | ) | (289 | ) | ||||||||||||||||||||||||
| Balance at December 31, 2009 | 87,672,120 | $ | 9 | $ | (1 | ) | $ | 6,711 | $ | 471 | $ | (24,269 | ) | $ | 6,139 | $ | (10,940 | ) | $ | 7,074 | ||||||||||||||||
F-58
Table of Contents
Parent Company Cash Flows
(In thousands of U.S. dollars, except share data and per share data,
or otherwise noted)
| For the Years Ended December 31, | ||||||||||||
| 2007 | 2008 | 2009 | ||||||||||
| Cash flow from operating activities: | ||||||||||||
| Net (loss)/Income | $ | (920 | ) | $ | (10,711 | ) | $ | 7,363 | ||||
| Adjustments to reconcile net (loss)/income to net cash (used in) provided by operating activities: | ||||||||||||
| (Earnings) loss from subsidiaries and VIE | (6,886 | ) | 430 | (8,565 | ) | |||||||
| Impairment of investments in subsidiaries and VIE | — | 4,784 | — | |||||||||
| Change in fair value of warrants | (2,387 | ) | — | — | ||||||||
| Loss on disposal of property, plant and equipment | — | — | 10 | |||||||||
| Depreciation expenses | 5 | 5 | 5 | |||||||||
| IPO expenses | — | 3,782 | — | |||||||||
| Deferred income taxes | (969 | ) | — | — | ||||||||
| Share based compensation expenses | 1,490 | 1,802 | 1,097 | |||||||||
| Changes in operating assets and liabilities: | ||||||||||||
| Intercompany receivables | — | 1,770 | 4,089 | |||||||||
| Decrease in other current assets | (12,631 | ) | (787 | ) | (6 | ) | ||||||
| Amount due to related party | (936 | ) | — | — | ||||||||
| Increase (decrease) in other current liabilities | 7,182 | (508 | ) | (575 | ) | |||||||
| Net cash (used in) provided by operating activities | (16,052 | ) | 567 | 3,418 | ||||||||
| Cash flow from investing activities: | ||||||||||||
| Injection of capital in subsidiaries | (5,000 | ) | (3,280 | ) | (6,105 | ) | ||||||
| Payment for business acquisitions | (6,393 | ) | (1,443 | ) | — | |||||||
| Net cash used in investing activities | (11,393 | ) | (4,723 | ) | (6,105 | ) | ||||||
| Cash flow from financing activities: | ||||||||||||
| Cash received from share subscription receivable | 4 | |||||||||||
| Repayment of initial public offering expenses | (2,191 | ) | (804 | ) | (40 | ) | ||||||
| Repayment on repurchase of common share | (10,582 | ) | — | — | ||||||||
| Proceeds from issuance of common share under employee option plan | — | 129 | 168 | |||||||||
| Proceeds from issuance of Series A convertible redeemable preferred shares | 100 | — | — | |||||||||
Proceeds from issuance ofSeries A-1 convertible redeemable preferred share | 9,000 | — | — | |||||||||
| Proceeds from issuance of Series B convertible redeemable preferred shares | 16,800 | — | — | |||||||||
| Proceeds from issuance of Series C convertible redeemable preferred shares | 32,500 | — | — | |||||||||
| Net cash provided by (used in) financing activities | 45,631 | (675 | ) | 128 | ||||||||
| (Decrease) increase in cash and cash equivalents | 18,186 | (4,831 | ) | (2,559 | ) | |||||||
| Cash and cash equivalents, beginning of year | 809 | 18,995 | 14,164 | |||||||||
| Cash and cash equivalents, end of year | $ | 18,995 | $ | 14,164 | $ | 11,605 | ||||||
F-59
Table of Contents
| 1. | BASIS OF PREPARATION |
F-60
Table of Contents
| Pro Forma | ||||||||||||
| December 31, | March 31, | March 31, | ||||||||||
| 2009 | 2010 | 2010 | ||||||||||
| (Note 1) | ||||||||||||
ASSETS | ||||||||||||
| Current assets: | ||||||||||||
| Cash and cash equivalents | $ | 54,842 | $ | 52,863 | $ | 52,863 | ||||||
| Accounts receivable, net of allowance for doubtful accounts of $220 and $354 as of December 31, 2009, and March 31, 2010, respectively | 24,473 | 28,562 | 28,562 | |||||||||
| Prepaid expenses and other current assets | 2,149 | 2,477 | 2,477 | |||||||||
| Deferred tax assets—current | 66 | 55 | 55 | |||||||||
| Restricted cash | 335 | 355 | 355 | |||||||||
| Total current assets | 81,865 | 84,312 | 84,312 | |||||||||
| Property, plant and equipment, net | 7,203 | 7,007 | 7,007 | |||||||||
| Intangible assets, net | 1,934 | 2,639 | 2,639 | |||||||||
| Deferred tax assets—non-current | 423 | 661 | 661 | |||||||||
| Loan receivable | 2,243 | 2,285 | 2,285 | |||||||||
| Other assets | 382 | 797 | 797 | |||||||||
| Goodwill | 10,192 | 11,288 | 11,288 | |||||||||
| TOTAL ASSETS | $ | 104,242 | $ | 108,989 | $ | 108,989 | ||||||
LIABILITIES, CONVERTIBLE REDEEMABLE PREFERRED SHARES AND (DEFICIT)/EQUITY | ||||||||||||
| Current liabilities: | ||||||||||||
| Accounts payable | $ | 1,211 | $ | 798 | $ | 798 | ||||||
| Accrued expenses and other payables | 20,536 | 20,748 | 20,748 | |||||||||
| Government grant | 316 | 371 | 371 | |||||||||
| Current portion of long-term bank borrowings | 20 | 8 | 8 | |||||||||
| Income taxes payable | 1,712 | 2,087 | 2,087 | |||||||||
| Other taxes payable | 955 | 1,167 | 1,167 | |||||||||
| Total current liabilities | 24,750 | 25,179 | 25,179 | |||||||||
| Deferred tax liability—non-current | 256 | 364 | 364 | |||||||||
| Unrecognized tax benefits—non-current | 969 | 969 | 969 | |||||||||
| Capital lease obligation—long-term portion | 176 | 166 | 166 | |||||||||
| TOTAL LIABILITIES | 26,151 | 26,678 | 26,678 | |||||||||
F-61
Table of Contents
| Pro Forma | ||||||||||||
| December 31, | March 31, | March 31, | ||||||||||
| 2009 | 2010 | 2010 | ||||||||||
| (Note 1) | ||||||||||||
| Commitments | ||||||||||||
| Series A convertible redeemable preferred shares ($0.0001 par value; 57,000,000 shares authorized; 57,000,000 and 57,000,000 shares issued and outstanding as of December 31, 2009 and March 31, 2010, respectively, liquidation value $11,400) | 12,581 | 12,581 | — | |||||||||
Series A-1 convertible redeemable preferred shares ($0.0001 par value; 36,000,000 shares authorized; 36,000,000 and 36,000,000 shares issued and outstanding as of December 31, 2009 and March 31, 2010, respectively, liquidation value $9,000) | 9,900 | 9,900 | — | |||||||||
| Series B convertible redeemable preferred shares ($0.0001 par value; 112,000,000 shares authorized; 112,000,000 and 112,000,000 shares issued and outstanding as of December 31, 2009 and March 31, 2010, respectively, liquidation value $42,000) | 30,800 | 30,800 | — | |||||||||
| Series C convertible redeemable preferred shares ($0.0001 par value; 60,000,000 shares authorized; 59,090,910 shares issued and 59,090,910 outstanding as of December 31, 2009 and March 31, 2010, respectively, liquidation value $32,500) | 35,750 | 35,750 | — | |||||||||
| (Deficit)/Equity: | ||||||||||||
| HiSoft Technology International Limited shareholder’s equity: | ||||||||||||
| Common shares ($0.0001 par value; 607,000,000 shares authorized; 87,672,120 and 91,895,573 shares issued and outstanding as of December 31, 2009 and March 31, 2010, respectively) | 9 | 9 | 40 | |||||||||
| Subscription receivable | (1 | ) | — | — | ||||||||
| Additional paid-in capital | 6,711 | 8,410 | 97,410 | |||||||||
| Shares to be issued in connection with business acquisition | 471 | — | — | |||||||||
| Statutory reserve | 2,447 | 2,447 | 2,447 | |||||||||
| Accumulated deficit | (26,716 | ) | (23,749 | ) | (23,749 | ) | ||||||
| Accumulated other comprehensive income | 6,139 | 6,163 | 6,163 | |||||||||
| Total HiSoft Technology International Limited shareholder’s (deficit)/equity | (10,940 | ) | (6,720 | ) | 82,311 | |||||||
| TOTAL LIABILITIES, CONVERTIBLE REDEEMABLE PREFERRED SHARES AND (DEFICIT)/EQUITY | $ | 104,242 | $ | 108,989 | $ | 108,989 | ||||||
F-62
Table of Contents
UNAUDITED CONDENSED CONSOLIDATED STATEMENTS
OF OPERATIONS
(in U.S. dollars in thousands, except share and per share data, or otherwise noted)
| Three-Month Periods Ended March 31, | ||||||||
| 2009 | 2010 | |||||||
| Revenues | $ | 21,977 | $ | 31,155 | ||||
| Business tax | (440 | ) | (618 | ) | ||||
| Net revenues | 21,537 | 30,537 | ||||||
| Cost of revenues (including share-based compensation of $83 and $233 for the three-month periods ended March 31, 2009 and 2010, respectively) | 13,792 | 19,418 | ||||||
| Gross profit | 7,745 | 11,119 | ||||||
| Operating expenses | ||||||||
| General and administrative (including share-based compensation of $124 and $339 for the three-month periods ended March 31, 2009 and 2010, respectively) | 5,651 | 5,859 | ||||||
| Selling and marketing (including share-based compensation of $10 and $17 for the three-month periods ended March 31, 2009 and 2010, respectively) | 1,103 | 1,991 | ||||||
| Total operating expenses | 6,754 | 7,850 | ||||||
| Income from operations | 991 | 3,269 | ||||||
| Other income (expenses) | ||||||||
| Interest expense | (7 | ) | (6 | ) | ||||
| Interest income | 181 | 115 | ||||||
| Change in fair value of foreign-currency forward contract | 174 | 17 | ||||||
| Total other income | 348 | 126 | ||||||
| Net income before income tax expenses | 1,339 | 3,395 | ||||||
| Income tax expenses | (168 | ) | (428 | ) | ||||
| Net income | 1,171 | 2,967 | ||||||
| Net income attributable to HiSoft Technology International Limited | 1,171 | 2,967 | ||||||
| Income attributable to holders of common shares of HiSoft Technology International Limited | $ | 1,171 | $ | 2,967 | ||||
| Net income per share attributable to HiSoft Technology International Limited shareholders: Basic | $ | — | $ | 0.01 | ||||
| Diluted | — | 0.01 | ||||||
| Net income per Series A preferred share—Basic | — | 0.01 | ||||||
Net income perSeries A-1 preferred share—Basic | — | 0.01 | ||||||
| Net income per Series B preferred share—Basic | — | 0.01 | ||||||
| Net income per Series C preferred share—Basic | $ | — | $ | 0.01 | ||||
| Weighted average shares used in calculating net income per common share | ||||||||
| Basic | 85,189,211 | 89,933,268 | ||||||
| Diluted | 363,343,798 | 424,477,209 | ||||||
F-63
Table of Contents
UNAUDITED CONDENSED CONSOLIDATED STATEMENTS
OF OPERATIONS—continued
(in U.S. dollars in thousands, except share and per share data, or otherwise noted)
| Three-Month Periods Ended March 31, | ||||||||
| 2009 | 2010 | |||||||
| Weighted average shares used in calculating net income per Series A preferred share | 61,959,000 | |||||||
Weighted average shares used in calculating net income perSeries A-1 preferred share | 39,132,000 | |||||||
| Weighted average shares used in calculating net income per Series B preferred share | 112,000,000 | |||||||
| Weighted average shares used in calculating net income per Series C preferred share | 95,588,237 | |||||||
| Pro forma net income per share attributable to HiSoft Technology International Limited shareholders (Note 1) | ||||||||
| Basic | $ | 0.01 | ||||||
| Diluted | $ | 0.01 | ||||||
| Weighted average shares used in calculating pro forma net income per share (Note 1) | ||||||||
| Basic | 398,612,505 | |||||||
| Diluted | 424,477,209 | |||||||
F-64
Table of Contents
| Shares to be | ||||||||||||||||||||||||||||||||||||||||
| Issued | Accumulated | |||||||||||||||||||||||||||||||||||||||
| Additional | in Connection | Other | Total | Total | ||||||||||||||||||||||||||||||||||||
| Common Shares | Subscription | Paid-In | With Business | Statutory | Accumulated | Comprehensive | Shareholders’ | Comprehensive | ||||||||||||||||||||||||||||||||
| Shares | Amount | Receivable | Capital | Acquisition | Reserves | Deficit | Income | Deficit | Income | |||||||||||||||||||||||||||||||
| Balance at January 1, 2010 | 87,672,120 | $ | 9 | $ | (1 | ) | $ | 6,711 | $ | 471 | $ | 2,447 | $ | (26,716 | ) | $ | 6,139 | $ | (10,940 | ) | $ | 7,074 | ||||||||||||||||||
| Issuance of common shares | 3,500,000 | — | — | 1,071 | (471 | ) | 600 | |||||||||||||||||||||||||||||||||
| Cash received from share subscription receivable | — | — | 1 | — | — | — | — | — | 1 | |||||||||||||||||||||||||||||||
| Share option exercise | 126,572 | — | — | 39 | — | — | — | — | 39 | |||||||||||||||||||||||||||||||
| Share-based compensation | — | — | — | 589 | — | — | — | — | 589 | |||||||||||||||||||||||||||||||
| Vesting of nonvested shares award | 596,881 | — | — | — | — | — | — | — | — | |||||||||||||||||||||||||||||||
| Net income | — | — | — | — | — | — | 2,967 | — | 2,967 | $ | 2,967 | |||||||||||||||||||||||||||||
| Foreign currency translation adjustments | — | — | — | — | — | — | — | 24 | 24 | 24 | ||||||||||||||||||||||||||||||
| Balance at March 31, 2010 | 91,895,573 | $ | 9 | $ | — | $ | 8,410 | $ | — | $ | 2,447 | $ | (23,749 | ) | $ | 6,163 | $ | (6,720 | ) | $ | 2,991 | |||||||||||||||||||
| Comprehensive income for the three-month period ended March 31, 2009 | ||||||||||||||||||||||||||||||||||||||||
| Net income | $ | 1,171 | $ | 1,171 | ||||||||||||||||||||||||||||||||||||
| Foreign currency translation adjustments | (819 | ) | (819 | ) | ||||||||||||||||||||||||||||||||||||
| Total comprehensive income for the three-month period ended March 31, 2009 | $ | 352 | $ | 352 | ||||||||||||||||||||||||||||||||||||
F-65
Table of Contents
| Three-Month Periods Ended March 31, | ||||||||
| 2009 | 2010 | |||||||
| Cash flows from operating activities: | ||||||||
| Net income | $ | 1,171 | $ | 2,967 | ||||
| Adjustments to reconcile net income to net cash provided by operating activities: | ||||||||
| Provision for doubtful accounts | (53 | ) | 100 | |||||
| Loss on disposals of property, plant and equipment | 1,099 | 340 | ||||||
| Depreciation | 697 | 753 | ||||||
| Change in fair value of foreign-currency forward contract | (174 | ) | (17 | ) | ||||
| Amortization of intangible assets | — | 163 | ||||||
| Interest income | (38 | ) | (38 | ) | ||||
| Share-based compensation expenses | 217 | 589 | ||||||
| Changes in operating assets and liabilities: | ||||||||
| Accounts receivable | 2,765 | (3,532 | ) | |||||
| Prepaid expenses and other current assets | (517 | ) | 287 | |||||
| Income tax receivables | (366 | ) | — | |||||
| Other assets | 72 | (427 | ) | |||||
| Accounts payable | (58 | ) | (415 | ) | ||||
| Accrued expenses and other payables | (919 | ) | 215 | |||||
| Deferred revenue | 2 | 84 | ||||||
| Government grant | 4 | 55 | ||||||
| Income taxes payable | 179 | 434 | ||||||
| Other taxes payable | (271 | ) | 212 | |||||
| Deferred income taxes | 199 | (300 | ) | |||||
| Other long term liabilities | (2 | ) | — | |||||
| Net cash provided by operating activities | 4,007 | 1,470 | ||||||
| Cash flows from investing activities: | ||||||||
| Purchases of property, plant and equipment | (510 | ) | (918 | ) | ||||
| Restricted cash | — | (19 | ) | |||||
| Payment for business acquisition (net of cash acquired of $nil and $270 in the three-month periods ended March 31, 2009 and 2010, respectively) | — | (2,430 | ) | |||||
| Net cash used in investing activities | (510 | ) | (3,367 | ) | ||||
| Cash flows from financing activities: | ||||||||
| Prepayment for initial public offering expenses | — | (590 | ) | |||||
| Cash received from share subscription receivable | — | 1 | ||||||
| Proceeds from issuance of common share under employee option plan | 16 | 511 | ||||||
| Payment on capital lease obligations | (39 | ) | (9 | ) | ||||
| Net cash used in financing activities | (23 | ) | (87 | ) | ||||
| Effect of exchange rate changes | (731 | ) | 5 | |||||
F-66
Table of Contents
| Three-Month Periods Ended March 31, | ||||||||
| 2009 | 2010 | |||||||
| Net increase/(decrease) in cash and cash equivalents | 2,743 | (1,979 | ) | |||||
| Cash and cash equivalents at beginning of period | 46,881 | 54,842 | ||||||
| Cash and cash equivalents at end of period | $ | 49,624 | $ | 52,863 | ||||
| Supplemental cash flow information: | ||||||||
| Interest paid | $ | 7 | $ | 3 | ||||
| Income taxes paid | $ | 238 | $ | 41 | ||||
| Supplemental information of non cash investing and financial activities: | ||||||||
| Issuance of common shares for acquisition | $ | — | $ | 471 | ||||
| Payable for business acquisitions | $ | — | $ | 4,152 | ||||
F-67
Table of Contents
| 1. | BASIS OF PREPARATION |
F-68
Table of Contents
F-69
Table of Contents
| 2. | ACQUISITION |
| • | Cash consideration of $545; | |
| • | Contingent consideration valued at $844: the Group agreed to pay the shareholders of Horizon up to $700 and $700 based on the actual 2010 and 2011 audited gross profit, respectively, achieved by Horizon. |
| Estimated | ||||||||
| Useful Life | ||||||||
| Net tangible assets: | ||||||||
| Current assets | $ | 920 | ||||||
| Current liabilities | (1,338 | ) | ||||||
| Total | $ | (418 | ) | |||||
| Intangible assets acquired: | ||||||||
| Customer base | 860 | 5.9 years | ||||||
| Goodwill | 1,076 | |||||||
| Deferred tax liability | (129 | ) | ||||||
| Total | $ | 1,807 | ||||||
| Total consideration | $ | 1,389 | ||||||
F-70
Table of Contents
| For the Three-Month | ||||||||
| Periods Ended March 31, | ||||||||
| 2009 | 2010 | |||||||
| (Unaudited) | (Unaudited) | |||||||
| Net revenues | $ | 22,226 | $ | 30,537 | ||||
| Net income | 939 | 2,526 | ||||||
| Net income per share | ||||||||
| - Basis | $ | 0.01 | $ | 0.03 | ||||
| - Diluted | $ | — | $ | — | ||||
| 3. | ACCOUNTS RECEIVABLE |
| As of | As of | |||||||
| December 31, | March 31, | |||||||
| 2009 | 2010 | |||||||
| Billed receivable | $ | 17,438 | $ | 19,430 | ||||
| Unbilled receivable | 7,255 | 9,486 | ||||||
| 24,693 | 28,916 | |||||||
| Less: Allowance for doubtful accounts | (220 | ) | (354 | ) | ||||
| $ | 24,473 | $ | 28,562 | |||||
| As of | As of | |||||||
| March 31, | March 31, | |||||||
| 2009 | 2010 | |||||||
| Balance at beginning of the period | $ | 339 | $ | 220 | ||||
| (Release)/provision for doubtful accounts charged to general and administrative expenses | (53 | ) | 100 | |||||
| Written-off | (77 | ) | (121 | ) | ||||
| Increase from business acquisition | — | 155 | ||||||
| Balance at end of the period | $ | 209 | $ | 354 | ||||
F-71
Table of Contents
| 4. | PREPAID EXPENSES AND OTHER CURRENT ASSETS |
| As of | As of | |||||||
| December 31, | March 31, | |||||||
| 2009 | 2010 | |||||||
| Deposits | $ | 624 | $ | 554 | ||||
| Advances to employees | 288 | 464 | ||||||
| Advances to suppliers | 156 | 137 | ||||||
| Prepaid initial public offering expenses | 40 | 630 | ||||||
| Prepaid rent and other prepaid expenses | 862 | 515 | ||||||
| Other current assets | 179 | 177 | ||||||
| Total | $ | 2,149 | $ | 2,477 | ||||
| 5. | PROPERTY, PLANT AND EQUIPMENT, NET |
| As of | As of | |||||||
| December 31, | March 31, | |||||||
| 2009 | 2010 | |||||||
| Furniture, fixtures and electronic equipment | $ | 8,549 | $ | 8,512 | ||||
| Transportation equipment | 362 | 88 | ||||||
| Leasehold improvements | 3,198 | 3,298 | ||||||
| 12,109 | 11,898 | |||||||
| Less: Accumulated depreciation and amortization | (4,906 | ) | (4,891 | ) | ||||
| $ | 7,203 | $ | 7,007 | |||||
| 6. | GOODWILL |
| As of | As of | |||||||
| December 31, | March 31 | |||||||
Goodwill | 2009 | 2010 | ||||||
| Balance, beginning of the year and period | $ | 5,946 | $ | 10,192 | ||||
| Goodwill acquired in acquisition of business | 4,320 | 1,076 | ||||||
| Foreign exchange difference due to translation | (74 | ) | 20 | |||||
| Balance, end of the year and period | $ | 10,192 | $ | 11,288 | ||||
| Gross amount of goodwill | 14,976 | 16,072 | ||||||
| Accumulated goodwill impairment loss | (4,784 | ) | (4,784 | ) | ||||
F-72
Table of Contents
| 7. | INTANGIBLE ASSETS |
| Contract | Customer | |||||||||||
| Backlog | Base | Total | ||||||||||
| Balance as of January 1, 2010 | $ | 229 | $ | 1,705 | $ | 1,934 | ||||||
| Acquisition | — | 860 | 860 | |||||||||
| Amortization | (47 | ) | (116 | ) | (163 | ) | ||||||
| Foreign exchange difference due to translation | 1 | 7 | 8 | |||||||||
| Net intangible assets as of March 31, 2010 | $ | 183 | $ | 2,456 | $ | 2,639 | ||||||
| 8. | ACCRUED EXPENSES AND OTHER PAYABLES |
| As of | As of | |||||||
| December 31, | March 31, | |||||||
| 2009 | 2010 | |||||||
| Employee payroll and welfare payables | $ | 6,590 | $ | 7,016 | ||||
| Advance from customers | 3,073 | 2,297 | ||||||
| Deferred acquisition consideration | 2,700 | 545 | ||||||
| Contingent consideration | 2,619 | 3,607 | ||||||
| Accrued rental expenses | 2,581 | 2,800 | ||||||
| Subcontract fee | 669 | 1,652 | ||||||
| Accrued professional fee | 541 | 424 | ||||||
| Other payable | 1,763 | 2,407 | ||||||
| Total | $ | 20,536 | $ | 20,748 | ||||
F-73
Table of Contents
| 9. | LONG-TERM BANK BORROWINGS |
| As of | As of | |||||||
| December 31, | March 31, | |||||||
| 2009 | 2010 | |||||||
| Secured loan from the Development Bank of Singapore Limited | $ | 20 | $ | 8 | ||||
| Less: current portion | (20 | ) | (8 | ) | ||||
| $ | — | $ | — | |||||
| May 2010 | $ | 8 | ||
| $ | 8 | |||
| 10. | FAIR VALUE |
| • | Level 1—inputs are based upon unadjusted quoted prices for identical instruments traded in active markets. | |
| • | Level 2—inputs are based upon quoted prices for similar instruments in active markets, quoted prices for identical or similar instruments in markets that are not active, and model-based valuation techniques for which all significant assumptions are observable in the market or can be corroborated by observable market data for substantially the full term of the assets or liabilities. | |
| • | Level 3—inputs are generally unobservable and typically reflect management’s estimates of assumptions that market participants would use in pricing the asset or liability. The fair values are therefore determined using model-based techniques that include option pricing models, discounted cash flow models, and similar techniques. |
| (a) | Assets and liabilities measured at fair value on a recurring basis |
F-74
Table of Contents
| As of | As of | |||||||
| December 31, | March 31, | |||||||
| 2009 | 2010 | |||||||
| Settlement currency | ||||||||
| Notional amount (Japanese Yen) | ¥ | 40,000,000 | ¥ | 80,000,000 | ||||
| U.S. dollar equivalent | $ | 444 | $ | 856 | ||||
| (b) | Assets and liabilities measured at fair value on a nonrecurring basis |
| • | Acquisition of Horizon on February 1, 2010 |
| Fair Value Measurements | ||||||||||||||||
| Net Carrying | ||||||||||||||||
| Value as of | ||||||||||||||||
| March 31, | ||||||||||||||||
| 2010 | Level 1 | Level 2 | Level 3 | |||||||||||||
| Contract backlog | $ | 248 | $ | — | $ | — | $ | 248 | ||||||||
| Customer base | $ | 2,640 | $ | — | $ | — | $ | 2,640 | ||||||||
F-75
Table of Contents
| 11. | INCOME TAXES |
F-76
Table of Contents
Subsidiaries | 0% | 7.5% | 12.5% | 15% | 18% | 20% | 22% | 24% | ||||||||||||||||||||||||
| HiSoft Dalian (1) | — | 2007 | 2008-2009 | 2010-2012 | — | — | — | — | ||||||||||||||||||||||||
| HiSoft Shenzhen | — | — | — | 2007 | 2008 | 2009 | 2010 | 2011 | ||||||||||||||||||||||||
| HiSoft Chengdu (1) | — | — | — | 2008-2012 | — | — | — | — | ||||||||||||||||||||||||
| HiSoft Beijing | 2007-2008 | 2009-2010 | — | 2011-2012 | — | — | — | — | ||||||||||||||||||||||||
| HiSoft Shanghai | — | — | — | — | 2007 | — | — | — | ||||||||||||||||||||||||
| Horizon (1) | — | — | — | 2008-2010 | — | — | — | — | ||||||||||||||||||||||||
| (1) | The new HNTE status obtained by HiSoft Dalian, HiSoft Chengdu, HiSoft Beijing and Horizon in 2008 under the New EIT Law is valid for three years and qualifying entities can then apply to renew for an additional three years provided their business operations continue to qualify for the new HNTE status. The Group believes it is highly likely that its qualifying entities will continue to obtain the renewal in the future. Accordingly, in calculating deferred tax assets and liabilities, the Group assumed its qualifying entities will continue to renew the new HNTE status at the conclusion of the initial three-year period. If the Group’s qualifying entities failed to obtain such renewals, then the income tax expenses would increase by $267 in the three-month period ended March 31, 2010, which would be a decrease to the net income |
F-77
Table of Contents
| As of | As of | |||||||
| December 31, | March 31, | |||||||
| 2009 | 2010 | |||||||
| Deferred tax assets—current: | ||||||||
| Provision for doubtful accounts | $ | 421 | $ | 429 | ||||
| Accrued expenses | 54 | 36 | ||||||
| Less: Valuation allowance | (409 | ) | (410 | ) | ||||
| Net deferred tax assets—current | $ | 66 | $ | 55 | ||||
| Deferred tax assets—non-current: | ||||||||
| Net operating losses | $ | 1,830 | $ | 2,117 | ||||
| Depreciation | 53 | 54 | ||||||
| Total deferred taxes assets—non-current | 1,883 | 2,171 | ||||||
| Less: Valuation allowance | (1,460 | ) | (1,510 | ) | ||||
| Net deferred tax assets—non-current | 423 | 661 | ||||||
| Deferred tax liabilities—non-current: | ||||||||
| Intangible assets | (225 | ) | (333 | ) | ||||
| Depreciation | (31 | ) | (31 | ) | ||||
| Deferred tax liabilities—non-current | $ | (256 | ) | $ | (364 | ) | ||
F-78
Table of Contents
| 12. | CONVERTIBLE REDEEMABLE PREFERRED SHARES |
F-79
Table of Contents
F-80
Table of Contents
F-81
Table of Contents
| 13. | COMMON SHARES |
| 14. | SHARE-BASED COMPENSATION PLAN |
F-82
Table of Contents
| Weighted | ||||||||||||||||
| Weighted | Average | |||||||||||||||
| Number of | Weighted | Average | Intrinsic Value | |||||||||||||
| Share | Average | Grant-Date | per Option at | |||||||||||||
| Options | Exercise Price | Fair Value | the Grant Dates | |||||||||||||
| Share options outstanding as at January 1, 2010 | 54,130,192 | $ | 0.30 | |||||||||||||
| Granted | 3,620,000 | $ | 0.30 | $ | 0.22 | — | ||||||||||
| Exercised | (126,572 | ) | $ | 0.31 | ||||||||||||
| Cancelled | (259,751 | ) | $ | 0.47 | ||||||||||||
| Share options outstanding as at March 31, 2010 | 57,363,869 | $ | 0.30 | |||||||||||||
F-83
Table of Contents
| Options Outstanding | ||||||||||||||||||||||||||||
| Weighted | ||||||||||||||||||||||||||||
| Average | Options Exercisable | |||||||||||||||||||||||||||
| Remaining | Weighted | Weighted | ||||||||||||||||||||||||||
| Contractual | Average | Aggregate | Average | Aggregate | ||||||||||||||||||||||||
| Number | Life | Exercise | Intrinsic | Number | Exercise | Intrinsic | ||||||||||||||||||||||
Exercise Price | Outstanding | in Years | Price | Value | Exercisable | Price | Value | |||||||||||||||||||||
| $0.10 | 4,273,250 | 4.83 | $ | 0.10 | $ | 914 | 4,273,250 | $ | 0.10 | $ | 914 | |||||||||||||||||
| $0.25 | 31,765,246 | 5.76 | $ | 0.25 | 2,033 | 30,066,060 | $ | 0.25 | 1,924 | |||||||||||||||||||
| $0.30 | 9,619,250 | 9.55 | $ | 0.30 | 135 | 88,375 | $ | 0.30 | 2 | |||||||||||||||||||
| $0.50 | 11,706,123 | 7.73 | $ | 0.50 | $ | — | 7,694,372 | $ | 0.50 | $ | — | |||||||||||||||||
| 57,363,869 | $ | 0.30 | $ | 3,082 | 42,122,057 | $ | 0.28 | $ | 2,840 | |||||||||||||||||||
| Three-Month | ||||
| Period Ended | ||||
| March 31, 2010 | ||||
| Total fair value of share options vested | $ | 100 | ||
| Weighted- | ||||||||||||
| Weighted- | Average | |||||||||||
| Average | Exercise- | |||||||||||
| Grant-Date | Price | |||||||||||
Nonvested Share Options | Share Options | Fair Value | per Share | |||||||||
| Nonvested at January 1, 2010 | 13,324,752 | $ | 0.10 | $ | 0.36 | |||||||
| Granted | 3,620,000 | 0.22 | 0.30 | |||||||||
| Vested | (1,443,189 | ) | 0.07 | 0.37 | ||||||||
| Forfeited | (259,751 | ) | 0.09 | 0.47 | ||||||||
| Nonvested at March 31, 2010 | 15,241,812 | $ | 0.13 | $ | 0.26 | |||||||
F-84
Table of Contents
| Three-Month | ||||
| Period Ended | ||||
| March 31, 2010 | ||||
| Risk free interest | 2.82%-3.04% | |||
| Expected dividend yield | — | |||
| Expected life | 5.5-6.0 years | |||
| Expected volatility | 47%-48% | |||
| Exercise price | $ | 0.30 | ||
| Fair value of the underlying common shares | $ | 0.39-0.62 | ||
| (1) | Volatility |
| (2) | Risk free interest rate |
| (3) | Expected term |
F-85
Table of Contents
| Number | Fair Value | Intrinsic | ||||||||||
| of Shares | of Shares | Value | ||||||||||
| Nonvested share unvested at January 1, 2010 | 4,506,262 | $ | 0.279 | $ | 1,259 | |||||||
| Granted | 5,000,000 | 0.425 | 2,126 | |||||||||
| Vested | (596,881 | ) | 0.270 | (161 | ) | |||||||
| Forfeited | (3,000,000 | ) | 0.285 | (855 | ) | |||||||
| Nonvested share unvested on March 31, 2010 | 5,909,381 | $ | 0.401 | $ | 2,369 | |||||||
| 15. | CHINA CONTRIBUTION PLAN AND PROFIT APPROPRIATION |
F-86
Table of Contents
| 16. | NET INCOME PER SHARE |
| For the Three-Month Periods Ended March 31, | ||||||||
| 2009 | 2010 | |||||||
| Net income attributable to HiSoft Technology International Limited shareholders | 1,171 | 2,967 | ||||||
| Net income attributable to HiSoft Technology International Limited shareholders allocated for computing net income per common share—basic (i): | 279 | 671 | ||||||
| Net income attributable to HiSoft Technology International Limited shareholders allocated for computing net income per Series A preferred share—basic (i) | 203 | 461 | ||||||
Net income attributable to HiSoft Technology International Limited shareholders allocated for computing net income perSeries A-1 preferred share—basic (i) | 128 | 291 | ||||||
| Net income attributable to HiSoft Technology International Limited shareholders allocated for computing net income per Series B preferred share—basic (i) | 367 | 834 | ||||||
| Net income attributable to HiSoft Technology International Limited shareholders allocated for computing net income per Series C preferred share—basic (i) | 194 | 710 | ||||||
| Net income attributable to HiSoft Technology International Limited shareholders allocated for computing net income per common share—diluted | 1,171 | 2,967 | ||||||
| Weighted average common shares outstanding used in computing net income per common share—basic | 85,189,211 | 89,933,268 | ||||||
| Weighted average common shares outstanding used in computing net income per common share—diluted (ii) | 363,343,798 | 424,477,209 | ||||||
| Weighted average shares outstanding used in computing net income per Series A preferred share—basic (ii) | 61,959,000 | 61,959,000 | ||||||
F-87
Table of Contents
| For the Three-Month Periods Ended March 31, | ||||||||
| 2009 | 2010 | |||||||
Weighted average shares outstanding used in computing net income perSeries A-1 preferred share—basic (ii) | 39,132,000 | 39,132,000 | ||||||
| Weighted average shares outstanding used in computing net income per Series B preferred share—basic (ii) | 112,000,000 | 112,000,000 | ||||||
| Weighted average shares outstanding used in computing net income per Series C preferred share—basic (ii) | 59,090,910 | 95,588,237 | ||||||
| Net income per common share attributable to HiSoft Technology International Limited shareholders—basic: | — | 0.01 | ||||||
| Net income per common share attributable to HiSoft Technology International Limited shareholders—diluted: | — | 0.01 | ||||||
| Net income per Series A preferred share—basic | — | 0.01 | ||||||
Net income perSeries A-1 preferred share—basic | — | 0.01 | ||||||
| Net income per Series B preferred share—basic | — | 0.01 | ||||||
| Net income per Series C preferred share—basic | $ | — | $ | 0.01 | ||||
| (i) | The net income attributable to holders of common shares as of March 31, 2009 and 2010 was allocated between common shares and preferred shares on pro rata basis based on the dividend participant right. Each Series A,Series A-1, Series B, and Series C convertible redeemable preferred shares has the participating right on the undistributed net income, and the allocation was based on an as-if-converted basis. | |
| (ii) | The calculation of the weighted average number of common shares for the purpose of diluted net income per share has included the effect of certain securities. For the three-month period ended March 31, 2010, such securities included an incremental 61,959,000, 39,132,000, 112,000,000, and 95,588,237 common shares resulting from the assumed conversion of the Series A,Series A-1, Series B, and Series C convertible redeemable preferred shares, respectively. | |
| The Group had 42,122,057 vested common share options as of March 31, 2010 and have been included in the calculation of weighted average common shares used in calculating diluted net income per share. | ||
| The Company had 15,241,812 nonvested common share options as of March 31, 2010 and such shares have been included in the calculation of weighted average common shares used in calculating diluted net income per share using the treasury stock method. |
| 17. | LEASES AND COMMITMENTS |
F-88
Table of Contents
| As of | ||||
| March 31, | ||||
| 2010 | ||||
| Electronic equipment | $ | 408 | ||
| 408 | ||||
| Less: Accumulated amortization | (55 | ) | ||
| $ | 353 | |||
| Total | Operating | Capital | ||||||||||
| Nine-month period ending December 31, 2010 | $ | 2,876 | $ | 2,706 | $ | 170 | ||||||
| 2011 | 2,562 | 2,381 | 181 | |||||||||
| 2012 | 1,832 | 1,825 | 7 | |||||||||
| 2013 | 1,294 | 1,294 | — | |||||||||
| 2014 | 1,264 | 1,264 | — | |||||||||
| Thereafter | 3,907 | 3,907 | — | |||||||||
| Total minimum lease payments | $ | 13,735 | $ | 13,377 | $ | 358 | ||||||
| Less, Executory costs | $ | — | ||||||||||
| Net minimum capital lease payments | 358 | |||||||||||
| Less, Estimated amount representing interest | (26 | ) | ||||||||||
| Present value of net minimum capital lease payments | 332 | |||||||||||
| Less: Current portion | (166 | ) | ||||||||||
| Long-term obligations under capital lease at March 31, 2010 | $ | 166 | ||||||||||
| 18. | SEGMENT INFORMATION AND REVENUE ANALYSIS |
F-89
Table of Contents
| Three-Month Periods Ended March 31, | ||||||||||||||||
| 2009 | 2010 | |||||||||||||||
| Net | Long-lived | Net | Long-lived | |||||||||||||
| Revenues (1) | Assets (2) | Revenues (1) | Assets (2) | |||||||||||||
| PRC and Hong Kong | $ | 8,028 | $ | 13,129 | $ | 10,180 | $ | 21,631 | ||||||||
| Japan | 6,105 | 325 | 8,384 | 593 | ||||||||||||
| United States | 5,347 | 14 | 6,371 | 59 | ||||||||||||
| Europe | 395 | — | 724 | — | ||||||||||||
| Singapore | 1,662 | 323 | 4,878 | 1,743 | ||||||||||||
| Total | $ | 21,537 | $ | 13,791 | $ | 30,537 | $ | 24,026 | ||||||||
| (1) | Net revenues are presented by operating location of the Group’s customer entities. | |
| (2) | Long-lived assets are presented by the operating location of the subsidiaries of the Company. |
| For the Three-Month Periods Ended March 31, | ||||||||
| 2009 | 2010 | |||||||
| ITS | $ | 12,477 | $ | 15,605 | ||||
| RDS | 9,060 | 14,932 | ||||||
| Total | $ | 21,537 | $ | 30,537 | ||||
| 19. | SUBSEQUENT EVENTS |
F-90
Table of Contents
F-91
Table of Contents
F-92
| 1 | ||||||||
| 13 | ||||||||
| 44 | ||||||||
| 45 | ||||||||
| 46 | ||||||||
| 47 | ||||||||
| 48 | ||||||||
| 50 | ||||||||
| 51 | ||||||||
| 53 | ||||||||
| 58 | ||||||||
| 61 | ||||||||
| 97 | ||||||||
| 115 | ||||||||
| 119 | ||||||||
| 128 | ||||||||
| 135 | ||||||||
| 140 | ||||||||
| 151 | ||||||||
| 160 | ||||||||
| 162 | ||||||||
| 169 | ||||||||
| 175 | ||||||||
| 176 | ||||||||
| 176 | ||||||||
| 177 | ||||||||
| F-1 | ||||||||
| Exhibit 1.1 | ||||||||
| Exhibit 3.1 | ||||||||
| Exhibit 3.2 | ||||||||
| Exhibit 4.1 | ||||||||
| Exhibit 4.6 | ||||||||
| Exhibit 4.7 | ||||||||
| Exhibit 4.8 | ||||||||
| Exhibit 5.1 | ||||||||
| Exhibit 8.1 | ||||||||
| Exhibit 8.2 | ||||||||
| Exhibit 8.3 | ||||||||
| Exhibit 10.1 | ||||||||
| Exhibit 10.2 | ||||||||
| Exhibit 10.3 | ||||||||
| Exhibit 10.4 | ||||||||
| Exhibit 10.5 | ||||||||
| Exhibit 10.6 | ||||||||
| Exhibit 10.7 | ||||||||
| Exhibit 10.8 | ||||||||
| Exhibit 10.9 | ||||||||
| Exhibit 10.10 | ||||||||
| Exhibit 10.11 | ||||||||
| Exhibit 10.12 | ||||||||
| Exhbit 10.13 | ||||||||
| Exhibit 10.14 | ||||||||
| Exhibit 10.15 | ||||||||
| Exhibit 10.16 | ||||||||
| Exhibit 10.17 | ||||||||
| Exhibit 10.18 | ||||||||
| Exhibit 10.19 | ||||||||
| Exhibit 10.20 | ||||||||
| Exhibit 21.1 | ||||||||
| Exhibit 23.1 | ||||||||
| Exhibit 23.4 | ||||||||
HiSoft Technology International Limited
Table of Contents
| Item 6. | Indemnification of Directors and Officers |
| Item 7. | Recent Sales of Unregistered Securities |
| • | In connection with the acquisition of Envisage Solutions, Inc., or Envisage Solutions, we issued another 6,199,994 common shares to HSI Holdings, LLC., or HSI Holdings, in June 2007 as an earnout payment of the acquisition under the December 2006 agreement. This issuance was exempt from registration under the Securities Act pursuant to Section 4(2) of the Securities Act and the recipient was sophisticated with access to information about our company provided in the course of negotiating the acquisition. | |
| • | In July 2007, we entered into a share purchase agreement with GE Capital Equity Investments Ltd., Granite Global Ventures L.P., Granite Global Ventures (Q.P.) L.P., Granite Global Ventures II L.P., GGV II Entrepreneurs Fund L.P., International Finance Corporation, Draper Fisher Jurvetson ePlanet Ventures L.P., Draper Fisher Jurvetson ePlanet Partners Fund, LLC, Draper Fisher Jurvetson ePlanet Ventures GmbH & Co. KG, Sumitomo Corporation Equity Asia Limited, Kornhill Consulting Ltd. and Laoniu Investment Limited Co. Pursuant to this agreement, we issued an aggregate of 59,090,910 series C |
II-1
Table of Contents
| convertible redeemable preferred shares. These issuances were exempt from registration under the Securities Act pursuant to Section 4(2) of the Securities Act and each of the recipients was an accredited investor. |
| • | Under the July 2004 share purchase agreement, we issued a warrant to JAFCO Asia Technology Fund II, or JAFCO, granting JAFCO the right to purchase 2,000,000 series A convertible redeemable preferred shares at a price of $0.05 per preferred share. In August 2007, JAFCO exercised this warrant in its entirety. This issuance was exempt from registration under the Securities Act pursuant to Section 4(2) of the Securities Act and the recipient was an accredited investor. | |
| • | Under the July 2004 share purchase agreement, we issued warrants to JAFCO, Granite Global Ventures L.P., Granite Global Ventures (Q.P.) L.P., International Finance Corporation and Intel Capital Corporation granting them the right to purchase, in the aggregate, 36,000,000series A-1 convertible redeemable preferred shares at a price of $0.25 per preferred share. In August 2007, JAFCO, Granite Global Ventures L.P., Granite Global Ventures (Q.P.) L.P., International Finance Corporation and Intel Capital Corporation exercised these warrants in their entirety. These issuances were exempt from registration under the Securities Act pursuant to Section 4(2) of the Securities Act and each of the recipients was an accredited investor. | |
| • | In October 2007, we issued, in the aggregate, 5,723,038 nonvested shares to certain of our directors, officers and employees at a purchase price of $0.0001 per share. These issuances were exempt from registration under the Securities Act in reliance on Regulation S under the Securities Act and/or Section 4(2) of the Securities Act. For those issued under Section 4(2) of the Securities Act, the acquirers were sophisticated with access to information about our company. | |
| • | In connection with our acquisition ofT-est Pte Ltd, orT-est, we issued 3,445,344 common shares to Toko Investment Pte Ltd, a company controlled by the prior shareholders ofT-est, in December 2007. This issuance was exempt from registration under the Securities Act in reliance on Regulation S under the Securities Act. | |
| • | In connection with our acquisition of Daemoyrod Corp., or Daemoyrod, we issued, in the aggregate, 3,976,364 common shares to the three shareholders of Daemoyrod, Bamboo 35, L.P., Byrd 46, L.P. and Casa De Lago, L.P. in January 2008. This issuance was exempt from registration under the Securities Act pursuant to Section 4(2) of the Securities Act and the recipient was sophisticated with access to information about our company provided in the course of negotiating the acquisition. | |
| • | In February 2008, we issued 3,995,727 common shares to Tian Hai BVI as part of the earn-out consideration pursuant to the share sale agreement entered into by and among Tian Hai BVI, our company and other parties. This issuance was exempt from registration under the Securities Act in reliance on Regulation S under the Securities Act. | |
| • | In connection with our acquisition of AllianceSPEC, we issued 1,500,000 common shares to Liu Chu Tzer on February 26, 2010. This issuance was exempt from registration under the Securities Act in reliance on Regulation S under the Securities Act. | |
| • | In February 2010, we issued 800,000 common shares to our chairman, Cheng Yaw Sun, and 1,200,000 common shares to certain relatives of our chairman, at a price of $0.30 per share under the terms of the employment contract that we entered into with him at the time of his appointment as our executive chairman. This issuance was exempt from registration under the Securities Act in reliance on Regulation S under the Securities Act. | |
| • | In January, February, March, April, May, July, August, September, November and December of 2007, January, February, March, April, July and October of 2008, January, |
II-2
Table of Contents
| April, July, August, September, October and December of 2009, and January, April, May and June of 2010, we granted options to certain of our directors, officers and employees for the purchase of our common shares under our HiSoft Technology International Limited Share Incentive Plan adopted January 2005. These issuances were exempt from registration under the Securities Act in reliance on Rule 701 under the Securities Act. |
| • | In January, April, August and October of 2009, January, February, May and June of 2010, we issued, in the aggregate, 9,430,225 nonvested shares to certain of our directors, officers and employees at a purchase price of $0.0001 per share. These issuances were exempt from registration under the Securities Act in reliance on Regulation S under the Securities Act and/or Section 4(2) of the Securities Act. For those issued under Section 4(2) of the Securities Act, the acquirers were sophisticated with access to information about our company. |
| Item 8. | Exhibits and Financial Statement Schedules |
| Item 9. | Undertakings |
II-3
Table of Contents
II-4
Table of Contents
| By: | /s/ Tiak Koon Loh |
| Title: | Chief Executive Officer |
Signature | Capacity | |||
/s/ Cheng Yaw Sun | Executive Chairman and Director | |||
/s/ Tiak Koon Loh | Director and Chief Executive Officer | |||
/s/ Jenny Lee | Director | |||
/s/ Terry McCarthy | Director | |||
II-5
Table of Contents
Signature | Capacity | |||
/s/ Venkatachalam Krishnakumar | Director | |||
/s/ Christine Lu-Wong | Chief Financial Officer and Executive Vice President (principal financial and accounting officer) | |||
II-6
Table of Contents
| By: | /s/ Donald J. Puglisi |
| Title: | Managing Director |
II-7
Table of Contents
| Exhibit | ||||||
No. | Description of Exhibit | |||||
| 1 | .1 | — | Form of Underwriting Agreement | |||
| 3 | .1 | — | Fifth Amended and Restated Memorandum and Articles of Association of the Registrant | |||
| 3 | .2 | — | Form of Sixth Amended and Restated Memorandum and Articles of Association of the Registrant | |||
| 4 | .1 | — | Form of Common Share Certificate | |||
| 4 | .2 | — | Fifth Amended and Restated Memorandum and Articles of Association of the Registrant (Filed as Exhibit 3.1 hereto) | |||
| 4 | .3 | — | Form of Sixth Amended and Restated Memorandum and Articles of Association of the Registrant (Filed as Exhibit 3.2 hereto) | |||
| 4 | .4(1) | — | Form of Deposit Agreement between the Registrant and Deutsche Bank Trust Company Americas, as depositary | |||
| 4 | .5(1) | — | Form of American Depositary Receipt evidencing American Depositary Shares (included in Exhibit 4.4) | |||
| 4 | .6 | — | Second Amended and Restated Investor’s Rights Agreement, dated August 17, 2007, among the Registrant and its shareholders party thereto | |||
| 4 | .7 | — | Second Amended and Restated Right of First Refusal and Co-Sale Agreement, dated August 17, 2007, among the Registrant and its shareholders party thereto | |||
| 4 | .8 | — | Third Amended and Restated Investor’s Rights Agreement, dated March 15, 2010, among the Registrant and its shareholders party thereto | |||
| 5 | .1 | — | Opinion of Conyers Dill & Pearman regarding the issue of common shares being registered | |||
| 8 | .1 | — | Opinion of Simpson Thacher & Bartlett LLP regarding certain U.S. federal tax matters | |||
| 8 | .2 | — | Opinion of Conyers Dill & Pearman regarding certain Cayman Islands tax matters | |||
| 8 | .3 | — | Opinion of Fangda Partners regarding certain PRC tax matters | |||
| 10 | .1 | — | HiSoft Technology International Limited Amended and Restated Share Incentive Plan | |||
| 10 | .2 | — | Form of Option Agreement | |||
| 10 | .3 | — | Form of Indemnification Agreement between the Registrant and its directors and executive officers | |||
| 10 | .4 | — | Form of Employment Agreement between the Registrant and its executive officers | |||
| 10 | .5 | — | Third Amended Strategic Cooperation Agreement, dated January 23, 2008, among HiSoft Technology (Dalian) Co., Ltd., Dalian Haihui Sci-Tech Co., Ltd., and the current equity interest holders of Dalian Haihui Sci-Tech Co., Ltd. | |||
| 10 | .6 | — | Third Amended Equity Acquisition Option Agreement, dated January 23, 2008, among HiSoft Technology (Dalian) Co., Ltd., Dalian Haihui Sci-Tech Co., Ltd., and the current equity interest holders of Dalian Haihui Sci-Tech Co., Ltd. | |||
| 10 | .7 | — | Third Amended and Restated Voting Rights Agreement, dated January 23, 2008, among HiSoft Technology (Dalian) Co., Ltd., Dalian Haihui Sci-Tech Co., Ltd., and the current equity interest holders of Dalian Haihui Sci-Tech Co., Ltd. | |||
| 10 | .8 | — | Binding Memorandum of Understanding, dated September 30, 2007, among the Registrant, Yuanming Li, Dalian Haihui Sci-Tech Co., Ltd. and HiSoft Technology (Dalian) Co., Ltd. | |||
| 10 | .9 | — | Advisor Engagement Agreement, dated January 23, 2008, between Yuanming Li and the Registrant | |||
II-8
Table of Contents
| Exhibit | ||||||
No. | Description of Exhibit | |||||
| 10 | .10 | — | Share Transfer Agreement, dated January 23, 2008, among Yuanming Li, all other former shareholders of Dalian Haihui Sci-Tech Co., Ltd., and the current shareholders of Dalian Haihui Sci-Tech Co., Ltd. | |||
| 10 | .11 | — | Stock Transfer Agreement, dated January 23, 2008, among Yuanming Li, Dalian Borui Information Technology Co., Ltd., Dalian Haihui Sci-Tech Co., Ltd., HiSoft Technology (Dalian) Co., Ltd. and the Registrant | |||
| 10 | .12 | — | Agreement concerning Change of the Promoter of Dalian Haihui Software Training Center, dated January 23, 2008, among Yuanming Li, Dalian Borui Information Technology Co., Ltd. and Dalian Haihui Sci-Tech Co., Ltd. and the Registrant | |||
| 10 | .13 | — | Land Use Rights Transfer Agreement, dated January 23, 2008, between Dalian Borui Information Technology Co., Ltd. and Dalian Haihui Sci-Tech Co., Ltd. | |||
| 10 | .14 | — | Building Purchase Agreement, dated January 23, 2008, between Dalian Borui Information Technology Co., Ltd. and Dalian Haihui Sci-Tech Co., Ltd. | |||
| 10 | .15 | — | Vehicle Purchase Agreement, dated January 23, 2008, between Dalian Borui Information Technology Co., Ltd. and Dalian Haihui Sci-Tech Co., Ltd. | |||
| 10 | .16 | — | Trademark License Agreement, dated January 23, 2008, between Dalian HaihuiSci-Tech Co., Ltd. and Dalian Haihui Software Training Center | |||
| 10 | .17 | — | Two Loan Agreements, dated January 23, 2008, between Yuanming Li and HiSoft Technology (Dalian) Co., Ltd. | |||
| 10 | .18 | — | Deed of Share Charge, dated January 23, 2008, among Yuanming Li, Kaiki Inc. and HiSoft Technology (Dalian) Co., Ltd. | |||
| 10 | .19 | — | Supplementary Agreement, dated March 28, 2008, among Yuanming Li, Dalian HaihuiSci-Tech Co., Ltd., HiSoft Technology (Dalian) Co., Ltd. and the Registrant | |||
| 10 | .20 | — | Dalian Property Lease Contract, dated April 30, 2010, between Finance Bureau of Dalian High-Tech Industrial Zone and HiSoft Technology (Dalian) Co., Ltd. | |||
| 21 | .1 | — | Subsidiaries of Registrant | |||
| 23 | .1 | — | Consent of Deloitte Touche Tohmatsu CPA Ltd. | |||
| 23 | .2 | — | Consent of Conyers Dill & Pearman (included in Exhibit 5.1 and Exhibit 8.2) | |||
| 23 | .3 | — | Consent of Fangda Partners (included in Exhibit 8.3) | |||
| 23 | .4 | — | Consent of American Appraisal China Limited | |||
| 23 | .5 | — | Consent of Simpson Thacher & Bartlett LLP (included in Exhibit 8.1) | |||
| 24 | .1 | — | Powers of Attorney (included on the signature page in Part II of this Registration Statement) | |||
| (1) | Incorporated by reference to the Registration Statement onForm F-6 to be filed with the Securities and Exchange Commission with respect to American depositary shares representing our common shares. |
II-9