Exhibit (c)-(3)
| October 17, 2013 D I S C U S S I O N M A T E R I A L S Presentation to Pactera’s Special Committee S T R I C T L Y P R I V A T E A N D C O N F I D E N T I A L |
| D I S C U S S I O N M A T E R I A L S English_General This presentation was prepared exclusively for the benefit and internal use of the J.P. Morgan client to whom it is directly addressed and delivered (including such client’s subsidiaries, the “Company”) in order to assist the Company in evaluating, on a preliminary basis, the feasibility of a possible transaction or transactions and does not carry any right of publication or disclosure, in whole or in part, to any other party. This presentation is for discussion purposes only and is incomplete without reference to, and should be viewed solely in conjunction with, the oral briefing provided by J.P. Morgan. Neither this presentation nor any of its contents may be disclosed or used for any other purpose without the prior written consent of J.P. Morgan. The information in this presentation is based upon any management forecasts supplied to us and reflects prevailing conditions and our views as of this date, all of which are accordingly subject to change. J.P. Morgan’s opinions and estimates constitute J.P. Morgan’s judgment and should be regarded as indicative, preliminary and for illustrative purposes only. In preparing this presentation, we have relied upon and assumed, without independent verification, the accuracy and completeness of all information available from public sources or which was provided to us by or on behalf of the Company or which was otherwise reviewed by us. In addition, our analyses are not and do not purport to be appraisals of the assets, stock, or business of the Company or any other entity. In relying on financial analyses and forecasts provided to J.P. Morgan or derived therefrom, J.P. Morgan has assumed that they have been reasonably prepared based on assumptions reflecting the best currently available estimates and judgments by management as to the expected future results of operations and financial condition of the Company to which such analyses or forecasts related. J.P. Morgan expresses no view as to such analyses or forecasts, the assumptions on which they were based or the likelihood that any forecasts, projections or estimates will be achieved. J.P. Morgan makes no representations as to the actual value which may be received in connection with a transaction nor the legal, tax or accounting effects of consummating a transaction. Unless expressly contemplated hereby, the information in this presentation does not take into account the effects of a possible transaction or transactions involving an actual or potential change of control, which may have significant valuation and other effects. Notwithstanding anything herein to the contrary, the Company and each of its employees, representatives or other agents may disclose to any and all persons, without limitation of any kind, the U.S. federal and state income tax treatment and the U.S. federal and state income tax structure of the transactions contemplated hereby and all materials of any kind (including opinions or other tax analyses) that are provided to the Company relating to such tax treatment and tax structure insofar as such treatment and/or structure relates to a U.S. federal or state income tax strategy provided to the Company by J.P. Morgan. J.P. Morgan’s policies prohibit employees from offering, directly or indirectly, a favorable research rating or specific price target, or offering to change a rating or price target, to a subject company as consideration or inducement for the receipt of business or for compensation. J.P. Morgan also prohibits its research analysts from being compensated for involvement in investment banking transactions except to the extent that such participation is intended to benefit investors. IRS Circular 230 Disclosure: JPMorgan Chase & Co. and its affiliates do not provide tax advice. Accordingly, any discussion of U.S. tax matters included herein (including any attachments) is not intended or written to be used, and cannot be used, in connection with the promotion, marketing or recommendation by anyone not affiliated with JPMorgan Chase & Co. of any of the matters addressed herein or for the purpose of avoiding U.S. tax-related penalties. J.P. Morgan is a marketing name for investment banking businesses of JPMorgan Chase & Co. and its subsidiaries worldwide. Securities, syndicated loan arranging, financial advisory and other investment banking activities are performed by a combination J.P. Morgan Securities LLC, J.P. Morgan Limited, J.P. Morgan Securities plc and the appropriately licensed subsidiaries of JPMorgan Chase & Co. in Asia-Pacific, and lending, derivatives and other commercial banking activities are performed by JPMorgan Chase Bank, N.A. J.P. Morgan deal team members may be employees of any of the foregoing entities. This presentation does not constitute a commitment by any J.P. Morgan entity to underwrite, subscribe for or place any securities or to extend or arrange credit or to provide any other services. |
| D I S C U S S I O N M A T E R I A L S 1 Situation overview 1 Valuation analysis 4 |
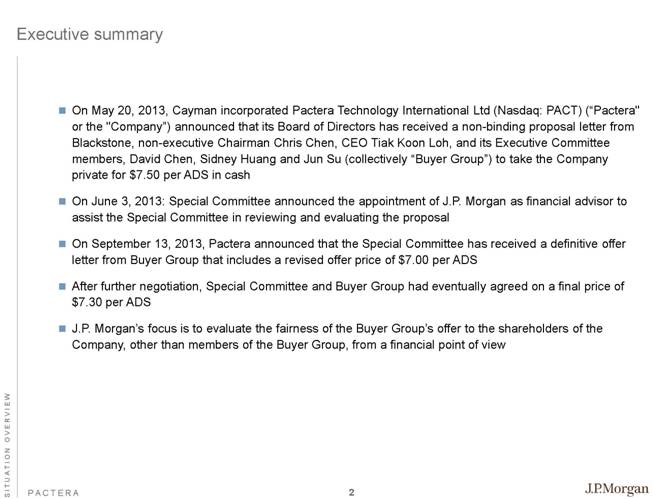
| S I T U A T I O N O V E R V I E W Executive summary On May 20, 2013, Cayman incorporated Pactera Technology International Ltd (Nasdaq: PACT) (“Pactera" or the "Company”) announced that its Board of Directors has received a non-binding proposal letter from Blackstone, non-executive Chairman Chris Chen, CEO Tiak Koon Loh, and its Executive Committee members, David Chen, Sidney Huang and Jun Su (collectively “Buyer Group”) to take the Company private for $7.50 per ADS in cash On June 3, 2013: Special Committee announced the appointment of J.P. Morgan as financial advisor to assist the Special Committee in reviewing and evaluating the proposal On September 13, 2013, Pactera announced that the Special Committee has received a definitive offer letter from Buyer Group that includes a revised offer price of $7.00 per ADS After further negotiation, Special Committee and Buyer Group had eventually agreed on a final price of $7.30 per ADS J.P. Morgan’s focus is to evaluate the fairness of the Buyer Group’s offer to the shareholders of the Company, other than members of the Buyer Group, from a financial point of view 2 |
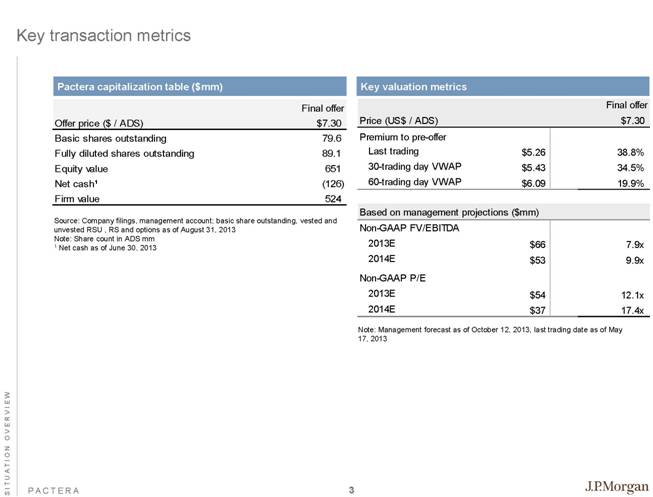
| S I T U A T I O N O V E R V I E W Key transaction metrics Source: Company filings, management account; basic share outstanding, vested and unvested RSU , RS and options as of August 31, 2013 Note: Share count in ADS mm 1 Net cash as of June 30, 2013 Key valuation metrics Pactera capitalization table ($mm) Note: Management forecast as of October 12, 2013, last trading date as of May 17, 2013 3 Final offer Offer price ($ / ADS) $7.30 Basic shares outstanding 79.6 Fully diluted shares outstanding 89.1 Equity value 651 Net cash1 (126) Firm value 524 Final offer Price (US$ / ADS) $7.30 Premium to pre-offer Last trading $5.26 38.8% 30-trading day VWAP $5.43 34.5% 60-trading day VWAP $6.09 19.9% Based on management projections ($mm) Non-GAAP FV/EBITDA 2013E $66 7.9x 2014E $53 9.9x Non-GAAP P/E 2013E $54 12.1x 2014E $37 17.4x |
| D I S C U S S I O N M A T E R I A L S 4 Valuation analysis 4 Situation overview 1 |
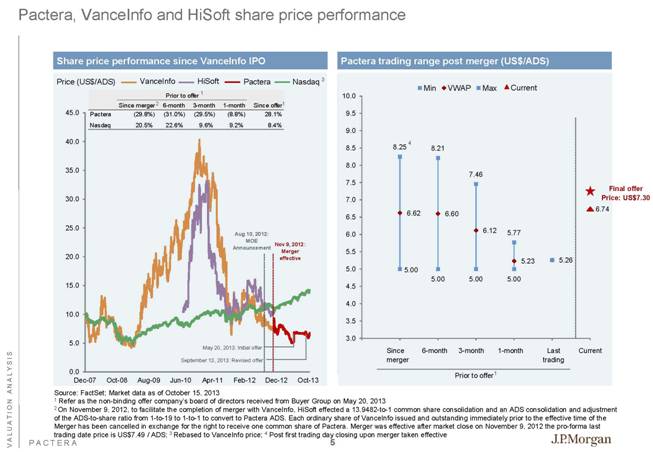
| V A L U A T I O N A N A L Y S I S Pactera, VanceInfo and HiSoft share price performance Share price performance since VanceInfo IPO Pactera trading range post merger (US$/ADS) Current VanceInfo HiSoft Since merger 6-month 3-month 1-month Price (US$/ADS) Source: FactSet; Market data as of October 15, 2013 1 Refer as the non-binding offer company’s board of directors received from Buyer Group on May 20, 2013 2 On November 9, 2012, to facilitate the completion of merger with VanceInfo, HiSoft effected a 13.9482-to-1 common share consolidation and an ADS consolidation and adjustment of the ADS-to-share ratio from 1-to-19 to 1-to-1 to convert to Pactera ADS. Each ordinary share of VanceInfo issued and outstanding immediately prior to the effective time of the Merger has been cancelled in exchange for the right to receive one common share of Pactera. Merger was effective after market close on November 9, 2012 the pro-forma last trading date price is US$7.49 / ADS; 3 Rebased to VanceInfo price; 4 Post first trading day closing upon merger taken effective Pactera Nov 9, 2012: Merger effective Last trading Current Aug 10, 2012: MOE Announcement Nasdaq 3 Prior to offer 2 1 1 4 Final offer Price: US$7.30 May 20, 2013: Initial offer September 13, 2013: Revised offer 1 5 Prior to offer Since merger 6-month 3-month 1-month Since offer Pactera (29.8%) (31.0%) (29.5%) (8.8%) 28.1% Nasdaq 20.5% 22.6% 9.6% 9.2% 8.4% |
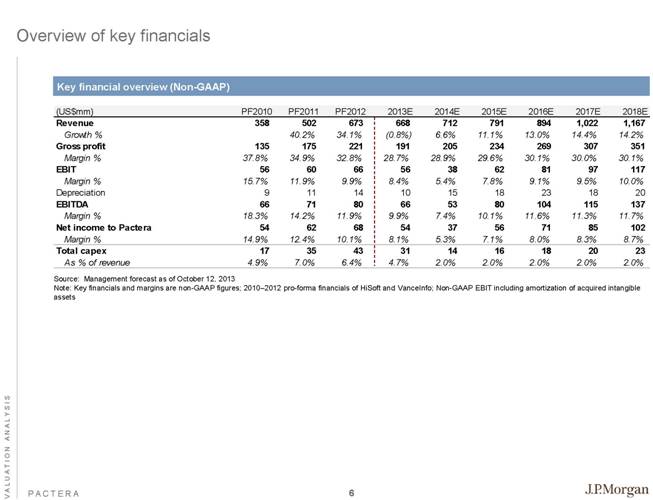
| V A L U A T I O N A N A L Y S I S Overview of key financials Key financial overview (Non-GAAP) Source: Management forecast as of October 12, 2013 Note: Key financials and margins are non-GAAP figures; 2010–2012 pro-forma financials of HiSoft and VanceInfo; Non-GAAP EBIT including amortization of acquired intangible assets 6 (US$mm) PF2010 PF2011 PF2012 2013E 2014E 2015E 2016E 2017E 2018E Revenue 358 502 673 668 712 791 894 1,022 1,167 Growth % 40.2% 34.1% (0.8%) 6.6% 11.1% 13.0% 14.4% 14.2% Gross profit 135 175 221 191 205 234 269 307 351 Margin % 37.8% 34.9% 32.8% 28.7% 28.9% 29.6% 30.1% 30.0% 30.1% EBIT 56 60 66 56 38 62 81 97 117 Margin % 15.7% 11.9% 9.9% 8.4% 5.4% 7.8% 9.1% 9.5% 10.0% Depreciation 9 11 14 10 15 18 23 18 20 EBITDA 66 71 80 66 53 80 104 115 137 Margin % 18.3% 14.2% 11.9% 9.9% 7.4% 10.1% 11.6% 11.3% 11.7% Net income to Pactera 54 62 68 54 37 56 71 85 102 Margin % 14.9% 12.4% 10.1% 8.1% 5.3% 7.1% 8.0% 8.3% 8.7% Total capex 17 35 43 31 14 16 18 20 23 As % of revenue 4.9% 7.0% 6.4% 4.7% 2.0% 2.0% 2.0% 2.0% 2.0% |
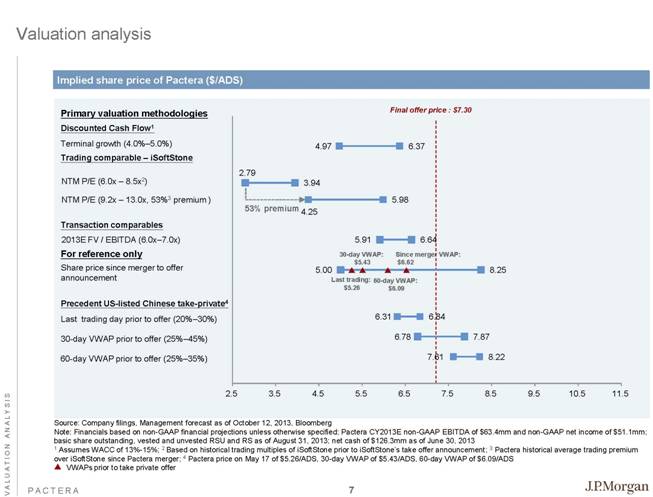
| V A L U A T I O N A N A L Y S I S Valuation analysis Implied share price of Pactera ($/ADS) For reference only Discounted Cash Flow1 Share price since merger to offer announcement Primary valuation methodologies Last trading day prior to offer (20%–30%) Precedent US-listed Chinese take-private4 Terminal growth (4.0%–5.0%) 30-day VWAP prior to offer (25%–45%) Source: Company filings, Management forecast as of October 12, 2013, Bloomberg Note: Financials based on non-GAAP financial projections unless otherwise specified; Pactera CY2013E non-GAAP EBITDA of $63.4mm and non-GAAP net income of $51.1mm; basic share outstanding, vested and unvested RSU and RS as of August 31, 2013; net cash of $126.3mm as of June 30, 2013 1 Assumes WACC of 13%-15%; 2 Based on historical trading multiples of iSoftStone prior to iSoftStone’s take offer announcement; 3 Pactera historical average trading premium over iSoftStone since Pactera merger; 4 Pactera price on May 17 of $5.26/ADS, 30-day VWAP of $5.43/ADS, 60-day VWAP of $6.09/ADS VWAPs prior to take private offer Transaction comparables 2013E FV / EBITDA (6.0x–7.0x) Trading comparable – iSoftStone NTM P/E (6.0x – 8.5x2) NTM P/E (9.2x – 13.0x, 53%3 premium ) Final offer price : $7.30 53% premium 60-day VWAP prior to offer (25%–35%) 60-day VWAP: $6.09 Since merger VWAP: $6.62 30-day VWAP: $5.43 Last trading: $5.26 7 |
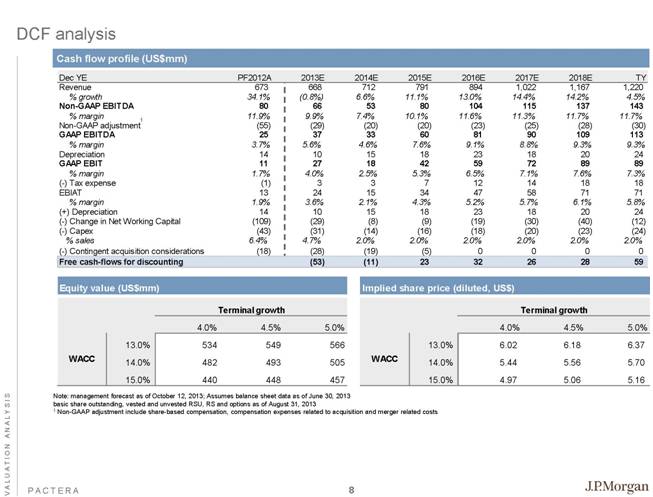
| V A L U A T I O N A N A L Y S I S Cash flow profile (US$mm) DCF analysis 1 Note: management forecast as of October 12, 2013; Assumes balance sheet data as of June 30, 2013 basic share outstanding, vested and unvested RSU, RS and options as of August 31, 2013 1 Non-GAAP adjustment include share-based compensation, compensation expenses related to acquisition and merger related costs 8 Dec YE PF2012A 2013E 2014E 2015E 2016E 2017E 2018E TY Revenue 673 668 712 791 894 1,022 1,167 1,220 % growth 34.1% (0.8%) 6.6% 11.1% 13.0% 14.4% 14.2% 4.5% Non-GAAP EBITDA 80 66 53 80 104 115 137 143 % margin 11.9% 9.9% 7.4% 10.1% 11.6% 11.3% 11.7% 11.7% Non-GAAP adjustment (55) (29) (20) (20) (23) (25) (28) (30) GAAP EBITDA 25 37 33 60 81 90 109 113 % margin 3.7% 5.6% 4.6% 7.6% 9.1% 8.8% 9.3% 9.3% Depreciation 14 10 15 18 23 18 20 24 GAAP EBIT 11 27 18 42 59 72 89 89 % margin 1.7% 4.0% 2.5% 5.3% 6.5% 7.1% 7.6% 7.3% (-) Tax expense (1) 3 3 7 12 14 18 18 EBIAT 13 24 15 34 47 58 71 71 % margin 1.9% 3.6% 2.1% 4.3% 5.2% 5.7% 6.1% 5.8% (+) Depreciation 14 10 15 18 23 18 20 24 (-) Change in Net Working Capital (109) (29) (8) (9) (19) (30) (40) (12) (-) Capex (43) (31) (14) (16) (18) (20) (23) (24) % sales 6.4% 4.7% 2.0% 2.0% 2.0% 2.0% 2.0% 2.0% (-) Contingent acquisition considerations (18) (28) (19) (5) 0 0 0 0 Free cash-flows for discounting (53) (11) 23 32 26 28 59 Equity value (US$mm) Implied share price (diluted, US$) Terminal growth Terminal growth 4.0% 4.5% 5.0% 4.0% 4.5% 5.0% 13.0% 534 549 566 13.0% 6.02 6.18 6.37 14.0% 482 493 505 14.0% 5.44 5.56 5.70 15.0% 440 448 457 15.0% 4.97 5.06 5.16 WACC WACC |
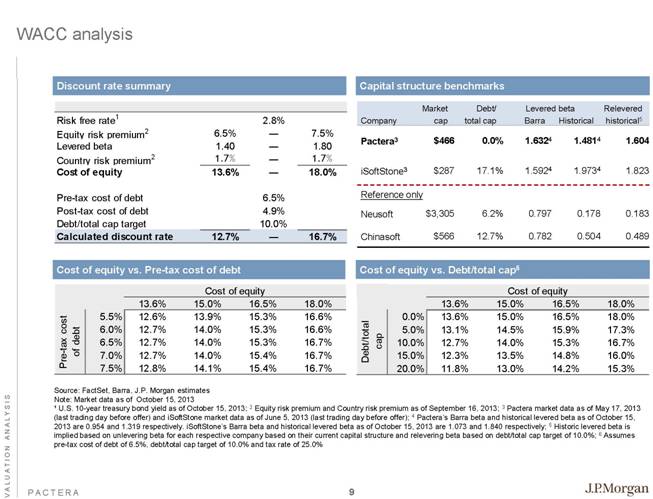
| V A L U A T I O N A N A L Y S I S WACC analysis Discount rate summary Capital structure benchmarks Cost of equity vs. Debt/total cap6 Cost of equity vs. Pre-tax cost of debt Source: FactSet, Barra, J.P. Morgan estimates Note: Market data as of October 15, 2013 ¹ U.S. 10-year treasury bond yield as of October 15, 2013; 2 Equity risk premium and Country risk premium as of September 16, 2013; 3 Pactera market data as of May 17, 2013 (last trading day before offer) and iSoftStone market data as of June 5, 2013 (last trading day before offer); 4 Pactera’s Barra beta and historical levered beta as of October 15, 2013 are 0.954 and 1.319 respectively. iSoftStone’s Barra beta and historical levered beta as of October 15, 2013 are 1.073 and 1.840 respectively; 5 Historic levered beta is implied based on unlevering beta for each respective company based on their current capital structure and relevering beta based on debt/total cap target of 10.0%; 6 Assumes pre-tax cost of debt of 6.5%, debt/total cap target of 10.0% and tax rate of 25.0% Market Debt/ Levered beta Relevered Company cap total cap Barra Historical historical5 Pactera3 $466 0.0% 1.6324 1.4814 1.604 iSoftStone3 $287 17.1% 1.5924 1.9734 1.823 Reference only Neusoft $3,305 6.2% 0.797 0.178 0.183 Chinasoft $566 12.7% 0.782 0.504 0.489 9 Risk free rate 1 2.8% Equity risk premium 2 6.5% — 7.5% Levered beta 1.40 — 1.80 Country risk premium 2 1.7% — 1.7% Cost of equity 13.6% — 18.0% Pre-tax cost of debt 6.5% Post-tax cost of debt 4.9% Debt/total cap target 10.0% Calculated discount rate 12.7% — 16.7% Cost of equity Cost of equity 13.6% 15.0% 16.5% 18.0% 5.5% 12.6% 13.9% 15.3% 16.6% 6.0% 12.7% 14.0% 15.3% 16.6% 6.5% 12.7% 14.0% 15.3% 16.7% 7.0% 12.7% 14.0% 15.4% 16.7% 7.5% 12.8% 14.1% 15.4% 16.7% Pre-tax cost of debt Cost of equity 13.6% 15.0% 16.5% 18.0% 0.0% 13.6% 15.0% 16.5% 18.0% 5.0% 13.1% 14.5% 15.9% 17.3% 10.0% 12.7% 14.0% 15.3% 16.7% 15.0% 12.3% 13.5% 14.8% 16.0% 20.0% 11.8% 13.0% 14.2% 15.3% Debt/total cap |
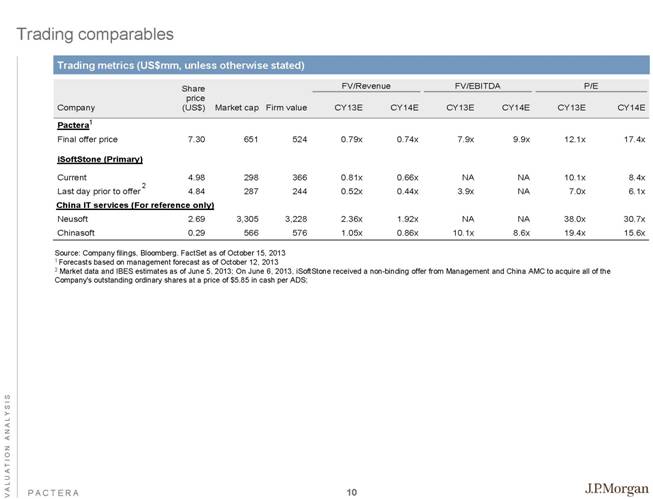
| V A L U A T I O N A N A L Y S I S Trading comparables Trading metrics (US$mm, unless otherwise stated) Source: Company filings, Bloomberg, FactSet as of October 15, 2013 1 Forecasts based on management forecast as of October 12, 2013 2 Market data and IBES estimates as of June 5, 2013; On June 6, 2013, iSoftStone received a non-binding offer from Management and China AMC to acquire all of the Company’s outstanding ordinary shares at a price of $5.85 in cash per ADS; 1 2 10 Company Share price (US$) Market cap Firm value FV/Revenue FV/EBITDA P/E CY13E CY14E CY13E CY14E CY13E CY14E Pactera Final offer price 7.30 651 524 0.79x 0.74x 7.9x 9.9x 12.1x 17.4x iSoftStone (Primary) Current 4.98 298 366 0.81x 0.66x NA NA 10.1x 8.4x Last day prior to offer 4.84 287 244 0.52x 0.44x 3.9x NA 7.0x 6.1x China IT services ( For reference only ) Neusoft 2.69 3,305 3,228 2.36x 1.92x NA NA 38.0x 30.7x Chinasoft 0.29 566 576 1.05x 0.86x 10.1x 8.6x 19.4x 15.6x |
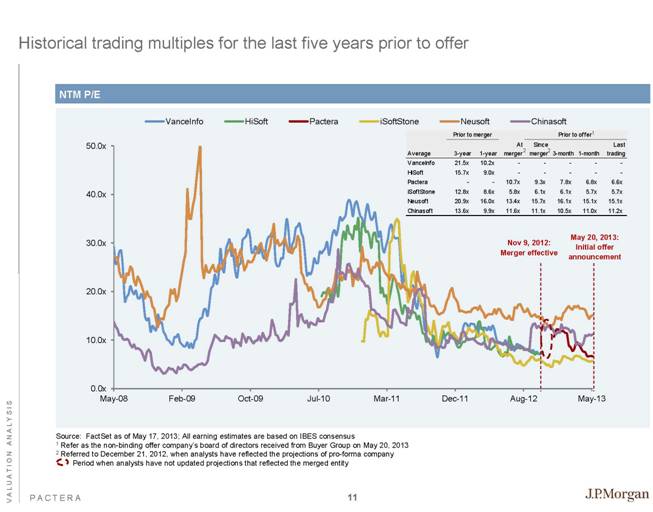
| V A L U A T I O N A N A L Y S I S Historical trading multiples for the last five years prior to offer Source: FactSet as of May 17, 2013; All earning estimates are based on IBES consensus 1 Refer as the non-binding offer company’s board of directors received from Buyer Group on May 20, 2013 2 Referred to December 21, 2012, when analysts have reflected the projections of pro-forma company Period when analysts have not updated projections that reflected the merged entity NTM P/E Nov 9, 2012: Merger effective 2 2 1 May 20, 2013: Initial offer announcement 11 Prior to merger Prior to offer Average 3-year 1-year At merger Since merger 3-month 1-month Last trading VanceInfo 21.5x 10.2x - - - - - HiSoft 15.7x 9.0x - - - - - Pactera - - 10.7x 9.3x 7.8x 6.8x 6.6x iSoftStone 12.8x 8.6x 5.8x 6.1x 6.1x 5.7x 5.7x Neusoft 20.9x 16.0x 13.4x 15.7x 16.1x 15.1x 15.1x Chinasoft 13.6x 9.9x 11.6x 11.1x 10.5x 11.0x 11.2x |
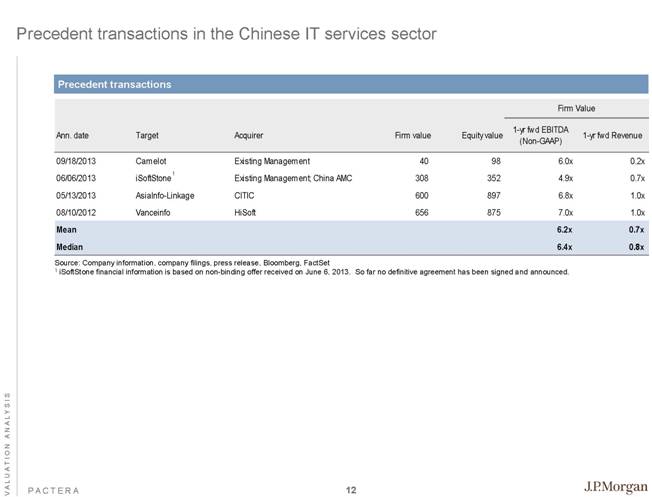
| V A L U A T I O N A N A L Y S I S Precedent transactions in the Chinese IT services sector Precedent transactions Source: Company information, company filings, press release, Bloomberg, FactSet 1 iSoftStone financial information is based on non-binding offer received on June 6, 2013. So far no definitive agreement has been signed and announced. 1 12 Firm Value Ann. date Target Acquirer Firm value Equity value 1-yr fwd EBITDA (Non-GAAP) 1-yr fwd Revenue 09/18/2013 Camelot Existing Management 40 98 6.0x 0.2x 06/06/2013 iSoftStone Existing Management; China AMC 308 352 4.9x 0.7x 05/13/2013 AsiaInfo-Linkage CITIC 600 897 6.8x 1.0x 08/10/2012 Vanceinfo HiSoft 656 875 7.0x 1.0x Mean 6.2x 0.7x Median 6.4x 0.8x |
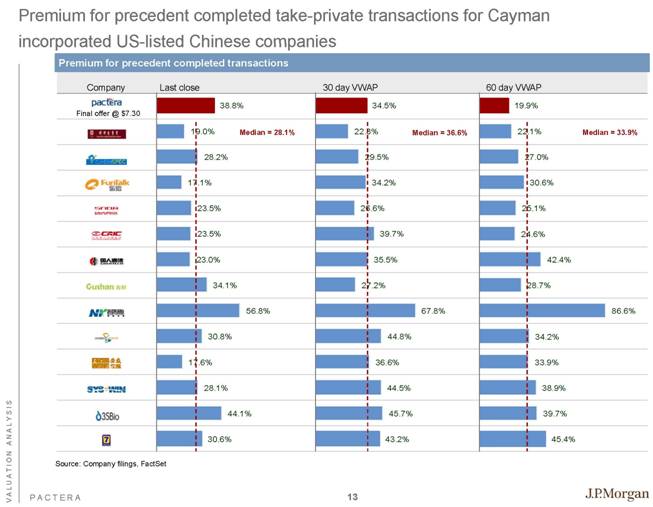
| V A L U A T I O N A N A L Y S I S Premium for precedent completed take-private transactions for Cayman incorporated US-listed Chinese companies Premium for precedent completed transactions Source: Company filings, FactSet Median = 28.1% Median = 33.9% Median = 36.6% Final offer @ $7.30 13 Company Last close 30 day VWAP 60 day VWAP 19.9% 22.1% 27.0% 30.6% 25.1% 24.6% 42.4% 28.7% 86.6% 34.2% 33.9% 38.9% 39.7% 45.4% 38.8% 19.0% 28.2% 17.1% 23.5% 23.5% 23.0% 34.1% 56.8% 30.8% 17.6% 28.1% 44.1% 30.6% 34.5% 22.3% 29.5% 34.2% 26.6% 39.7% 35.5% 27.2% 67.8% 44.8% 36.6% 44.5% 45.7% 43.2% |