 Credit Suisse Small & Mid Cap Conference Carl Lukach, EVP and Chief Financial Officer September 17, 2015 Exhibit 99.1 |
Forward-Looking Statements This presentation includes “forward-looking information,” relating to Univar. Forward-looking statements are subject to known and unknown risks and uncertainties, many of which may be beyond our control. We caution you that the forward-looking information presented in this presentation is not a guarantee of future events, and that actual events may differ materially from those made in or suggested by the forward-looking information contained in this presentation. In addition, forward-looking statements generally can be identified by the use of forward-looking terminology such as “may,” “plan,” “seek,” “comfortable with,” “will,” “expect,” “intend,” “estimate,” “anticipate,” “believe” or “continue” or the negative thereof or variations thereon or similar terminology. Any forward-looking information presented herein is made only as of the date of this presentation, and we do not undertake any obligation to update or revise any forward-looking information to reflect changes in assumptions, the occurrence of unanticipated events, or otherwise. Univar evaluates operating performance using adjusted EBITDA. Adjusted EBITDA is defined as consolidated net income (loss), plus the sum of: (1) interest expense, net of interest income; (2) income tax expense (benefit); (3) depreciation; (4) amortization; (5) other operating expenses, net, which primarily consists of pension mark to market adjustments, acquisition and integration related expenses, stock-based compensation expense, redundancy and restructuring costs, advisory fees paid to stockholders, and other unusual or non-recurring expenses; (6) impairment charges; (7) loss on extinguishment of debt; and (8) other expense, net, which consists of gains and losses on foreign currency transactions and undesignated derivative instruments, ineffective portions of cash flow hedges, debt refinancing costs, and other non-operating activity. Regulation G: Non GAAP Measures The information presented herein regarding certain unaudited non GAAP measures does not conform to generally accepted accounting principles in the United States (U.S. GAAP) and should not be construed as an alternative to the reported results determined in accordance with U.S. GAAP. Univar has included this non-GAAP information to assist in understanding the operating performance of the company and its operating segments. The non-GAAP information provided may not be consistent with the methodologies used by other companies. All non-GAAP information related to previous Univar filings with the SEC has been reconciled with reported U.S. GAAP results. 2 |
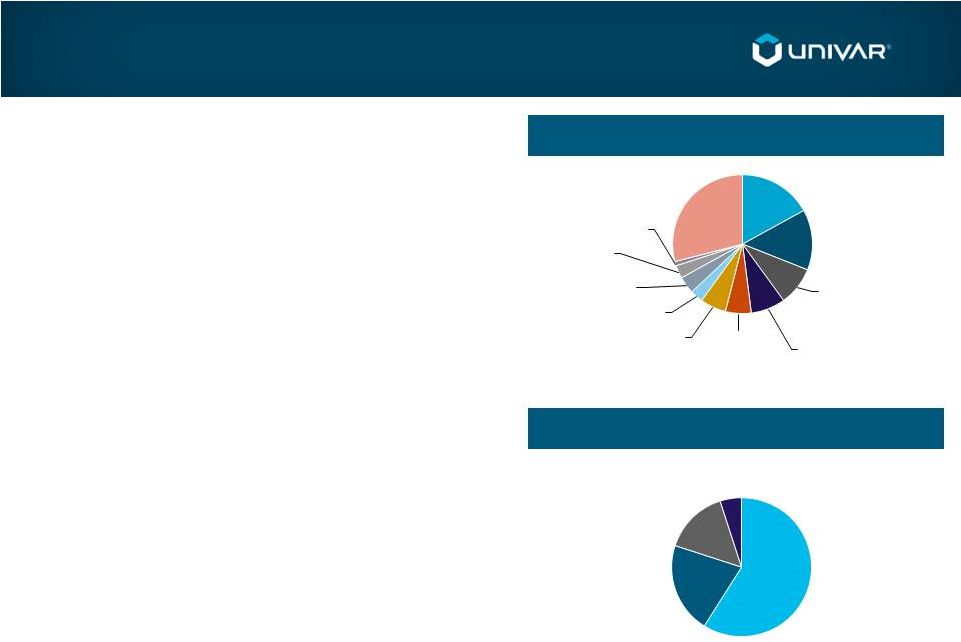 3 World Leader in Chemical Distribution 2014 Revenue By End Market 2014 Revenue By Operating Segment Global provider of basic and specialty chemicals; innovative value-added services • Net Sales $9.8 billion – Last 12 months (LTM) 6/30/15 • Adjusted EBITDA $634.0 million - LTM 6/30/15 #1 in North America and #2 in Europe (a) Strategically positioned for growth and margin expansion (a) Univar and Brenntag are the largest North American chemical distributors per “Specialty Chemical Distribution Market Update” (Boston Consulting Group; April 2014); market share measured based upon revenue per Univar S-1 (USA + Canada) and Brenntag 2014 annual report. Water treatment comprises 5% of total revenue Oil, Gas & Mining 17% Coatings & Adhesives 14% Agricultural Sciences 9% Chemical Manufacturing 8% Food Ingredients 6% Cleaning & Sanitization 6% Personal Care 3% Pharmaceuticals 4% Utilities 3% Rubber & Plastics 1% Other 29% USA 59% EMEA 21% Canada 15% RoW 5% |
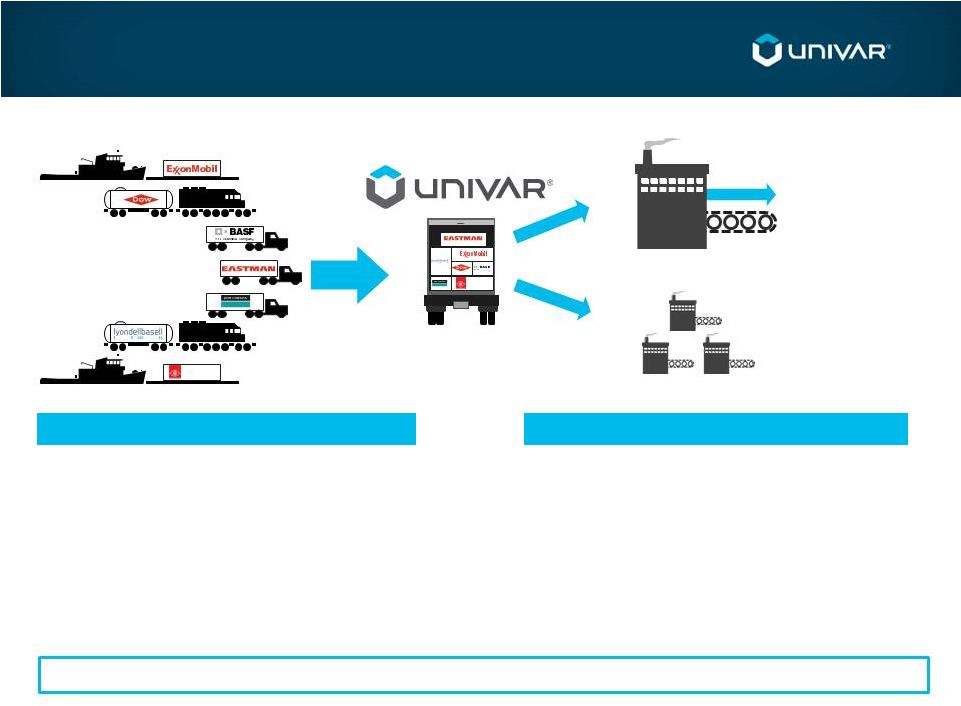 4 Compelling Value Proposition for Producers and Customers Univar provides valued outsourcing services to producers and customers large and small Benefits to Chemical Producers Benefits to Customers › Market demand insights › Quality sales execution – Industry / product knowledge › Improved market access › Reduced complexity › Rigorous safety culture › Regulatory expertise › Simplified sourcing process via “one-stop shop” › Value-added services › Lower total cost of ownership › Centralized account management › Optimized production and formulation › Producer and market insights › “Just-in-time” delivery Local and regional players Multinational leaders 8,000+ producers ~110,000 customers |
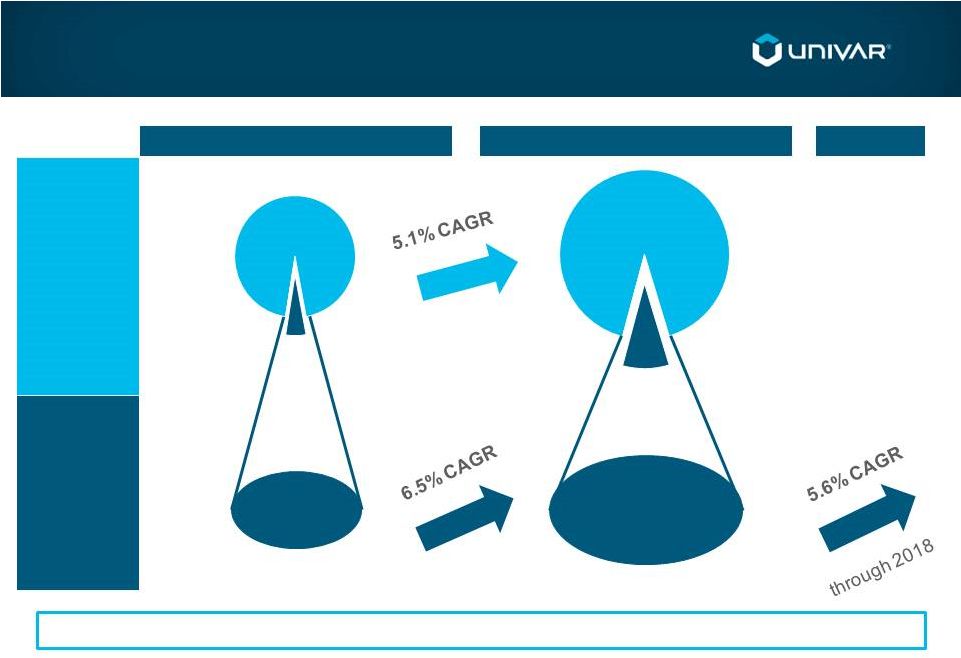 5 2013 $223 Billion (and Growing) Market Opportunity Third-party chemical distribution market growth outpacing broader chemical demand 2008 Addressable Chemical Distribution Market (a) Third Party Chemical Distribution (a) Excludes non-distribution products such as ethylene and propylene. Source: “Specialty Chemical Distribution Market Update” (Boston Consulting Group; April 2014). $163 billion $223 billion 2018 $1.8 trillion $2.3 trillion |
 6 Business Diversity Provides Resilience and Stability Geography >150+ countries Global sourcing and distribution network End-markets Widespread No end market represents more than 20% of sales Customers ~110,000 Highly diverse customer base Suppliers 8,000+ Fragmented global supplier base Products and Services Comprehensive suite >30,000 products USA EMEA Canada RoW – Specialty products – Basic chemicals – Value-added services – Tailored packaging and blends Representative customers: Top 10 represent ~13% of sales Representative suppliers: Top 10 represent ~32% of chemical expenditures Well positioned for growth |
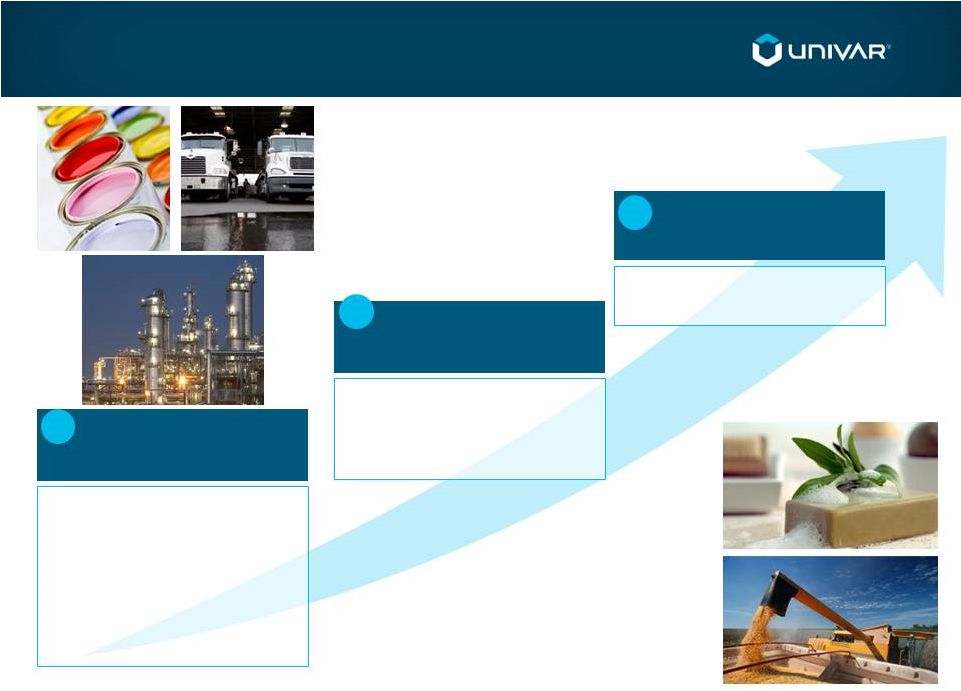
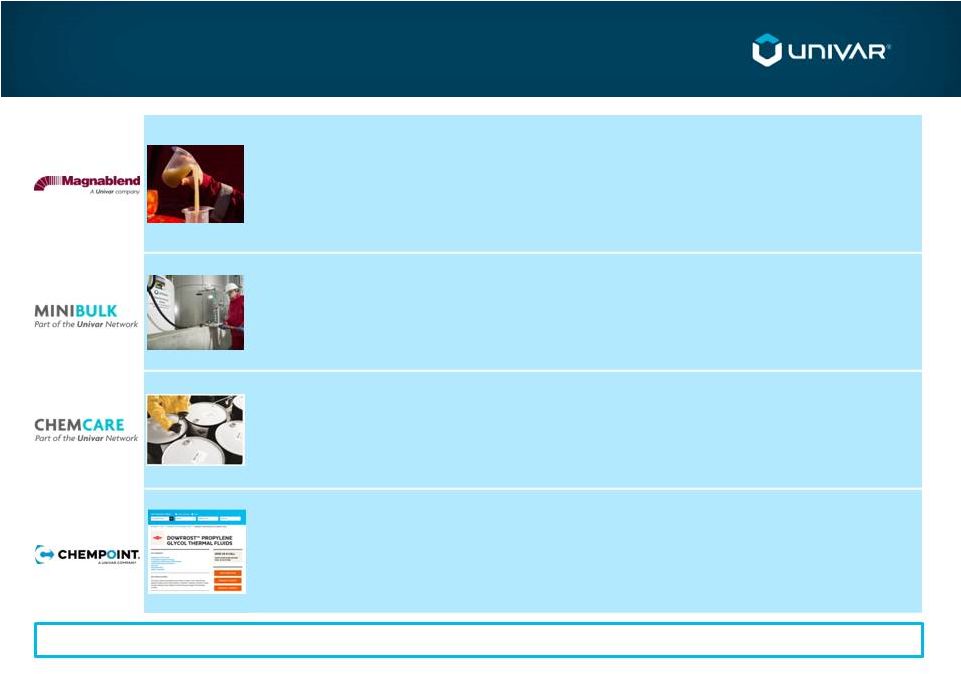 7 Key Differentiation through Innovative & Broad Value-added Services › Formulation and specialty blending expertise in oil and gas and agriculture › Customized to meet formulation and performance demands › Complete on-site storage solution of less-than-truckload deliveries › › End-to-end waste reuse, recycling, and disposal solutions › On-site project management services maximize customer value › Value-added services offer faster growth and higher gross margin potential Unique distribution platform provides technology-enabled marketing and sales Minimizes handling and exposure to hazardous materials |
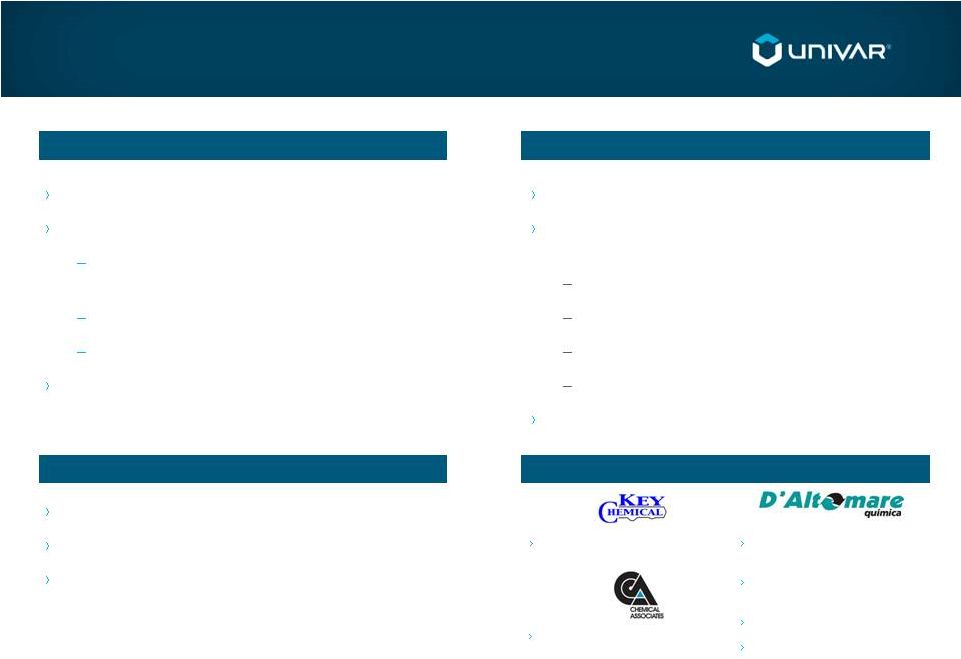 8 M&A Update Attractive robust M&A pipeline Seeking acquisitions to accelerate value creation Successful distributors Attractive risk-adjusted price Univar retains synergy upside Defined and resourced integration Priority focus on maintaining #1 position in North America M&A Approach Acquisition Criteria Recent M&A Overview “Bite-size” and “tuck-in” approach Market synergies Product offering; technical expertise; value-added services Expanding geographic penetration Emerging market access Cost synergies Financial Objectives Brazilian distributor of specialty chemicals Expands presence in key specialty markets Solid service capabilities Over-achieved business case in first quarter owned Year 1: EBITDA / free cash flow accretive Year 2: Achieve cost and market synergies Year 3: Achieve cash return in excess of cost of capital on acquisition price Leading supplier of fluoride in the U.S. Specializes in blending, mixing, and packaging of custom- formulated oleochemicals |
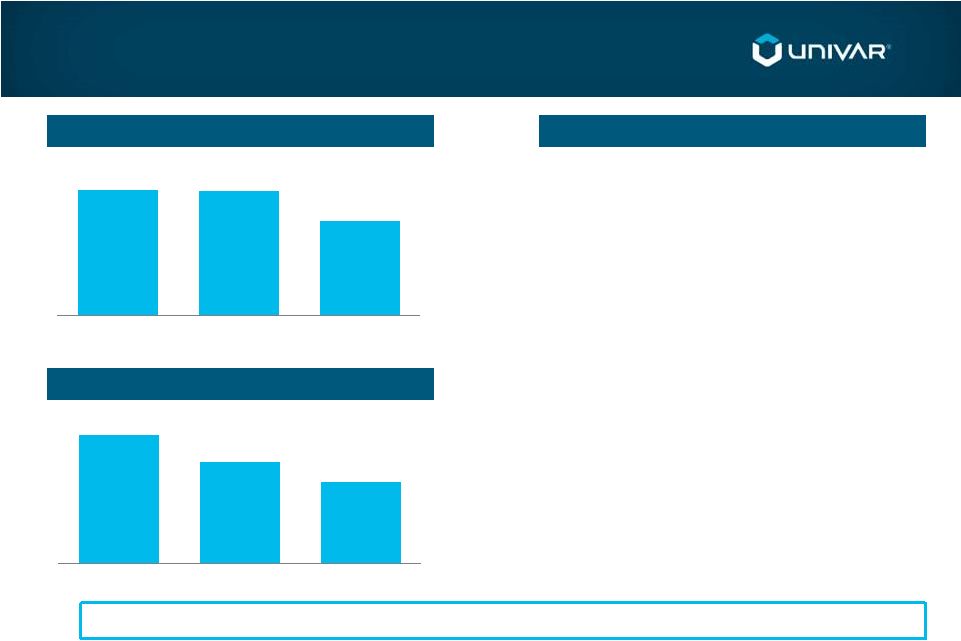 9 Capex as % of Sales Net Working Capital (a) as % of Sales Strong Cash Generation and Focus on Return on Capital Working capital and capital expenditure productivity gains for enhanced cash generation capacity 1.7% 1.4% 1.1% 2012 2013 2014 Commentary › Asset-light Business Model › Working Capital Optimization › Margin Expansion and Earnings Growth Benefiting Capital Returns › 2014 return on net assets (b) : ~23% 11.8% 11.8% 11.5% 2012 2013 2014 (a) NWC defined as annual average accounts receivable + annual average inventory – annual average accounts payable, based off of beginning and ending year amounts. See Appendix for reconciliation. (b) Defined as adjusted EBITA / (average PP&E + average net working capital). Average values utilize opening and closing balances for the year. Source: Company information |
 10 Strategic Priorities Capitalize on Organic Growth Opportunities in Attractive Markets 1 › Innovative Valued-Added Services › Highly Focused Sales Force › Full Solution Customer Value Proposition › Producer-Supported Solutions Model Continue to Execute on Operational Excellence Initiatives 2 › Commercial Excellence Initiatives › Ongoing Productivity Improvements “Tuck-in” Acquisitions to Complement Organic Growth 3 › Steady Flow of Opportunities › New Markets / New Products |
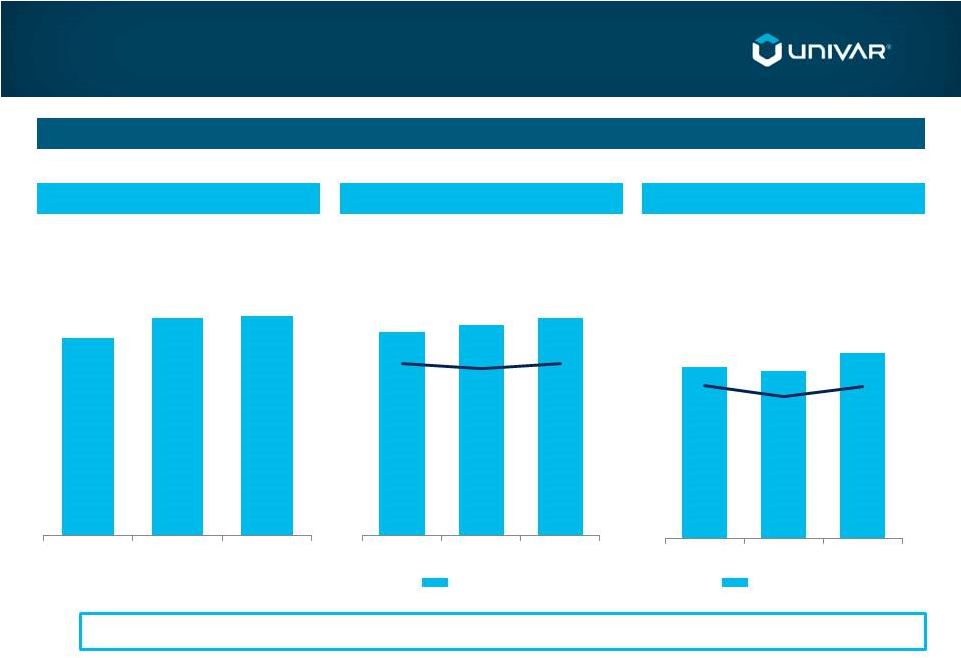 11 Proven Track Record Cost productivity, commercial initiatives, value-added services and acquisitions driving results (a) See Appendix for reconciliation. Source: Company information Adj. EBITDA (a) Revenue Gross Profit Financial Performance ($ in Millions) $10,325 $10,374 2012 2013 2014 $9,747 2012 2013 2014 Gross Profit $1,823 $1,876 $1,931 18.7% 18.2% 18.6% $607 $598 $642 6.2% 5.8% 6.2% 2012 2013 2014 Adj. EBITDA |
 12 Consolidated Highlights – Q2 2015 Successfully Offsetting Headwinds • Large FX translation impact • Oil & Gas volume decline • Mix enrichment from industrial chemicals and services • Gross Margin up • Conversion ratio up 1 • Adjusted EBITDA margin up Key Metrics: $ in millions 2Q15 2Q14 Y/Y % Net Sales $2,510.1 $2,861.4 (12.3%) Currency Neutral -- -- (5.4%) Gross Profit $467.2 $500.5 (6.7%) Currency Neutral -- -- 0.4% Gross Margin 18.6% 17.5% +110 bps Adjusted EBITDA $168.6 $176.4 (4.4%) Currency Neutral -- -- 1.4% Adjusted EBITDA Margin 1 6.7% 6.2% +55 bps 1 Defined as Adjusted EBITDA divided by Gross Profit |
 13 Stronger Financial Profile Stronger Financial Condition IPO + Private Placement + Refinancing IPO & Private Placement: Raised $760 million Debt Reduction: Paid off all $650 million 10.5% debt Debt Refinancing: Extended debt maturities 5 years to 2022-23 Reduced interest expense ~$100 million (40%) Net debt/EBITDA: Reduced from 5.6 times to 4.5 times Credit rating: Raised by Moody’s |
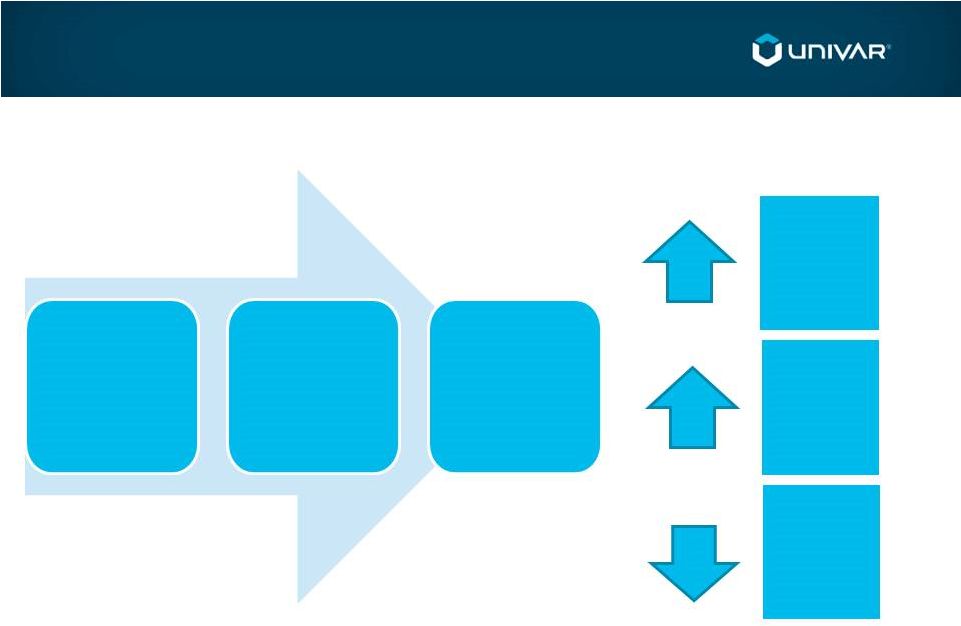 14 Value Drivers Mix Enrichment Productivity Acquisitions Rising Margins Rising Return On Capital Lower Leverage |
 Appendix |
 16 Adjusted EBITDA Reconciliation In addition to our net income (loss) determined in accordance with GAAP, we evaluate operating performance using Adjusted EBITDA, which we define as our consolidated net income (loss), plus the sum of interest expense, net of interest income, income tax expense (benefit), depreciation, amortization, other operating expenses, net (which primarily consists of pension mark to market adjustments, acquisition and integration related expenses, employee stock-based compensation expense, redundancy and restructuring costs, advisory fees paid to stockholders, and other unusual or non-recurring expenses), impairment charges, loss on extinguishment of debt and other income (expense), net (which consists of gains and losses on foreign currency transactions and undesignated derivative instruments, ineffective portion of cash flow hedges, debt refinancing costs and other nonoperating activity). We define Adjusted EBITDA margin as Adjusted EBITDA as a percentage of net sales. We believe that Adjusted EBITDA is an important indicator of operating performance because we report Adjusted EBITDA to our lenders as required under the covenants of our credit agreements. Adjusted EBITDA excludes the effects of income taxes, as well as the effects of financing and investing activities by eliminating the effects of interest, depreciation and amortization expenses. We consider gains (losses) on the acquisition, disposal and impairment of assets as resulting from investing decisions rather than ongoing operations; and other significant items, while periodically affecting our results, may vary significantly from period to period and have a disproportionate effect in a given period, which affects comparability of our results. We also present Adjusted EBITDA as a supplemental performance measure because we believe that this measure provides investors and securities analysts with important supplemental information with which to evaluate our performance and to enable them to assess our performance on the same basis as management. Adjusted EBITDA should not be considered as an alternative to net income (loss) or other performance measures presented in accordance with GAAP, or as an alternative to cash flow from operations as a measure of our liquidity. Adjusted EBITDA does not represent net income (loss) or cash flow from operations as those terms are defined by GAAP and does not necessarily indicate whether cash flows will be sufficient to fund cash needs. Adjusted EBITDA as used herein should not be confused with “Compensation Adjusted EBITDA” used for calculating incentive compensation under our benefit plans as described in the “Executive Compensation” section, found in the Registration Statement filed with the SEC. We caution readers that amounts presented in accordance with our definition of Adjusted EBITDA may not be comparable to similar measures disclosed by other companies, because of differing methods used by other companies in calculating Adjusted EBITDA. For a complete discussion of the method of calculating Adjusted EBITDA and its usefulness, refer to “Management’s Discussion and Analysis of Financial Condition and Results of Operations—Key Business Metrics—Adjusted EBITDA,” included in the Registration Statement filed with the SEC. The following is a quantitative reconciliation of Adjusted EBITDA to the most directly comparable GAAP financial performance measure, which is net income (loss): Fiscal Year Ended December 31, 2014 December 31, 2013 December 31, 2012 Net income (loss) ($20.1) ($82.3) ($197.4) Income tax expense (benefit) (15.8) (9.8) 75.6 Interest expense, net 250.6 294.5 268.1 Loss on extinguishment of debt 1.2 2.5 0.5 Amortization 96.0 100.0 93.3 Depreciation 133.5 128.1 111.7 EBITDA $445.4 $433.0 $351.8 Impairment charges 0.3 135.6 75.8 Other operating expenses, net 197.1 12.0 177.7 Other (income) expense, net (1.1) 17.6 1.9 Adjusted EBITDA $641.7 $598.2 $607.2 Adjusted EBITDA Description |
 17 Adjusted EBITDA Reconciliation 3 months ended 6/30 6 months ended 6/30 LTM $ in Millions 2015 2014 2015 2014 6/30/2015 Adjusted EBITDA $168.6 $176.4 $314.3 $322.0 $634.0 Other Operating Expenses, net 39.0 25.6 47.1 47.3 196.9 Depreciation 37.7 30.6 69.7 61.2 142.0 Amortization 22.4 24.1 44.3 47.8 92.5 Impairment Charges -- -- -- -- 0.3 Interest Expense, net 63.1 64.8 126.3 128.7 248.2 Loss on Extinguishment of Debt 7.3 -- 7.3 1.2 7.3 Other Expense, net 12.1 2.0 5.3 3.9 0.3 Income tax expense (benefit) (0.6) 9.8 7.0 15.2 (24.0) Net Income (Loss) $(12.4) $19.5 $7.3 $16.7 $(29.5) |
 18 NWC Reconciliation STRICTLY PRIVATE & CONFIDENTIAL 2011 2012 2013 2014 Sales $9,747 $10,325 $10,374 Accounts Receivable $1,165 $1,243 $1,277 $1,278 Inventory $762 $929 $894 $943 Accounts Payable $911 $892 $1,021 $992 Net Working Capital $1,016 $1,280 $1,150 $1,228 Average Net Working Capital (a) $1,148 $1,215 $1,189 Average Net Working Capital as % of Sales 11.8% 11.8% 11.5% (a) NWC defined as annual average accounts receivable + annual average inventory – annual average accounts payable, based off of beginning and ending year amounts. Source: Company information |
 19 |