UNITED STATES
SECURITIES AND EXCHANGE COMMISSION
Washington, D.C. 20549
FORM 10-Q
| x | QUARTERLY REPORT PURSUANT TO SECTION 13 OR 15 (d) OF THE SECURITIES EXCHANGE ACT OF 1934 |
For the quarterly period ended September 30, 2014
OR
| ¨ | TRANSITION REPORT PURSUANT TO SECTION 13 OR 15 (d) OF THE SECURITIES EXCHANGE ACT OF 1934 |
Commission file number: 814-00827
CORPORATE CAPITAL TRUST, INC.
(Exact name of registrant as specified in its charter)
| | |
| Maryland | | 27-2857503 |
(State or other jurisdiction of incorporation or organization) | | (I.R.S. Employer Identification No.) |
| | |
CNL Center at City Commons 450 South Orange Avenue Orlando, Florida | | 32801 |
| (Address of principal executive offices) | | (Zip Code) |
Registrant’s telephone number, including area code (866) 745-3797
Indicate by check mark whether the registrant (1) has filed all reports required to be filed by Section 13 or 15(d) of the Securities Exchange Act of 1934 during the preceding 12 months (or for such shorter period that the registrant was required to file such reports), and (2) has been subject to such filing requirements for the past 90 days. Yes x No ¨
Indicate by check mark whether the registrant has submitted electronically and posted on its corporate Web site, if any, every Interactive Data File required to be submitted and posted pursuant to Rule 405 of Regulation S-T (§232.405 of this chapter) during the preceding 12 months (or for such shorter period that the registrant was required to submit and post such files). Yes ¨ No ¨
Indicate by check mark whether the registrant is a large accelerated filer, an accelerated filer, a non-accelerated filer, or a smaller reporting company. See definition of “large accelerated filer,” “accelerated filer” and “smaller reporting company” in Rule 12b-2 of the Exchange Act.
| | | | | | |
| Large accelerated filer | | ¨ | | Accelerated filer | | ¨ |
| | | |
| Non-accelerated filer | | x Do not check if smaller reporting company | | Smaller reporting company | | ¨ |
Indicate by check mark whether the registrant is a shell company (as defined in Rule 12b-2 of the Exchange Act). Yes ¨ No x
The number of shares of common stock of the registrant outstanding as of November 7, 2014 was 205,400,407.
CORPORATE CAPITAL TRUST, INC.
INDEX
Corporate Capital Trust, Inc. and Subsidiaries
Condensed Consolidated Statements of Assets and Liabilities (unaudited)
(in thousands, except share and per share amounts)
| | | | | | | | |
| | | September 30, 2014 | | | December 31, 2013 | |
Assets | | | | | | | | |
Investments at fair value: | | | | | | | | |
Non-controlled, non-affiliated investments (amortized cost of $2,239,482 and $2,013,530, respectively) - including $303,034 and $244,981, respectively, of investments pledged to creditors (Note 11) | | $ | 2,256,228 | | | $ | 2,050,791 | |
Non-controlled, affiliated investments (amortized cost of $154,331 and $21,474, respectively) | | | 153,637 | | | | 21,481 | |
Controlled, affiliated investments (amortized cost of $2,500 and $2,500, respectively) | | | 2,500 | | | | 2,500 | |
| | | | | | | | |
Total investments, at fair value (amortized cost of $2,396,313 and $2,037,504, respectively) | | | 2,412,365 | | | | 2,074,772 | |
Cash | | | 80,534 | | | | 85,987 | |
Cash denominated in foreign currency (cost of $- and $218, respectively) | | | — | | | | 218 | |
Collateral on deposit with custodian | | | 63,400 | | | | 37,501 | |
Interest and dividends receivable | | | 39,509 | | | | 25,613 | |
Receivable for investments sold | | | 8,504 | | | | 46,469 | |
Principal receivable | | | 728 | | | | 795 | |
Unrealized appreciation on derivative instruments | | | 28,100 | | | | 1,861 | |
Receivable from advisors | | | 680 | | | | — | |
Deferred offering expense | | | 3,004 | | | | 3,394 | |
Prepaid and deferred expenses | | | 9,668 | | | | 4,576 | |
| | | | | | | | |
Total assets | | $ | 2,646,492 | | | $ | 2,281,186 | |
| | | | | | | | |
Liabilities | | | | | | | | |
Term loan payable, net of discount | | $ | 396,132 | | | $ | — | |
Revolving credit facilities | | | 185,450 | | | | 707,389 | |
Payable for investments purchased | | | 51,482 | | | | 101,014 | |
Accrued performance-based incentive fees | | | 18,968 | | | | 16,412 | |
Shareholders’ distributions payable | | | 14,943 | | | | 14,923 | |
Accrued investment advisory fees | | | 4,317 | | | | 3,825 | |
Unrealized depreciation on derivative instruments | | | 1,281 | | | | 3,181 | |
Accrued directors’ fees | | | 49 | | | | 74 | |
Accrued reimbursement of expense support | | | — | | | | 1,136 | |
Other accrued expenses and liabilities | | | 3,629 | | | | 2,798 | |
| | | | | | | | |
Total liabilities | | | 676,251 | | | | 850,752 | |
| | | | | | | | |
Commitments and contingencies ($265,059 and $17,500, respectively, Note 12) | | | | | | | | |
Net Assets | | | | | | | | |
Common stock, $0.001 par value per share, 1,000,000,000 shares authorized, 195,861,823 and 143,024,102 shares issued and outstanding at September 30, 2014 and December 31, 2013, respectively | | | 196 | | | | 143 | |
Paid-in capital in excess of par value | | | 1,939,158 | | | | 1,401,767 | |
Distribution in excess of net investment income | | | (11,909 | ) | | | (5,896 | ) |
Accumulated net unrealized appreciation on investments, derivative instruments and foreign currency translation | | | 42,796 | | | | 34,420 | |
| | | | | | | | |
Net assets | | $ | 1,970,241 | | | $ | 1,430,434 | |
| | | | | | | | |
Net asset value per share | | $ | 10.06 | | | $ | 10.00 | |
| | | | | | | | |
See notes to condensed consolidated financial statements.
2
Corporate Capital Trust, Inc. and Subsidiaries
Condensed Consolidated Statements of Operations (unaudited)
(in thousands, except share and per share amounts)
| | | | | | | | | | | | | | | | |
| | | Three Months Ended
September 30, | | | Nine Months Ended
September 30, | |
| | | 2014 | | | 2013 | | | 2014 | | | 2013 | |
Investment income | | | | | | | | | | | | | | | | |
Interest income: | | | | | | | | | | | | | | | | |
Non-controlled, non-affiliated investments | | $ | 50,757 | | | $ | 29,104 | | | $ | 144,093 | | | $ | 63,845 | |
Non-controlled, affiliated investments | | | 4,781 | | | | — | | | | 8,787 | | | | — | |
| | | | | | | | | | | | | | | | |
Total interest income | | | 55,538 | | | | 29,104 | | | | 152,880 | | | | 63,845 | |
| | | | | | | | | | | | | | | | |
Fee income | | | 1,010 | | | | 6,433 | | | | 2,372 | | | | 7,379 | |
| | | | | | | | | | | | | | | | |
Dividend and other income: | | | | | | | | | | | | | | | | |
Non-controlled, non-affiliated investments | | | 4,734 | | | | 1 | | | | 4,744 | | | | 198 | |
Non-controlled, affiliated investments | | | 2,066 | | | | — | | | | 2,643 | | | | — | |
| | | | | | | | | | | | | | | | |
Total dividend and other income | | | 6,800 | | | | 1 | | | | 7,387 | | | | 198 | |
| | | | | | | | | | | | | | | | |
Total investment income | | | 63,348 | | | | 35,538 | �� | | | 162,639 | | | | 71,422 | |
| | | | | | | | | | | | | | | | |
Operating expenses | | | | | | | | | | | | | | | | |
Investment advisory fees | | | 12,561 | | | | 8,098 | | | | 34,506 | | | | 19,449 | |
Interest expense | | | 7,295 | | | | 2,213 | | | | 17,506 | | | | 5,068 | |
Performance-based incentive fees | | | 3,722 | | | | 5,891 | | | | 15,325 | | | | 6,028 | |
Offering expense | | | 1,677 | | | | 1,845 | | | | 5,351 | | | | 4,492 | |
Administrative services | | | 745 | | | | 561 | | | | 2,137 | | | | 1,461 | |
Professional services | | | 520 | | | | 311 | | | | 1,570 | | | | 979 | |
Custodian and accounting fees | | | 226 | | | | 143 | | | | 604 | | | | 358 | |
Director fees and expenses | | | 126 | | | | 97 | | | | 417 | | | | 247 | |
Other | | | 886 | | | | 654 | | | | 2,389 | | | | 1,509 | |
| | | | | | | | | | | | | | | | |
Total operating expenses | | | 27,758 | | | | 19,813 | | | | 79,805 | | | | 39,591 | |
Reimbursement of expense support | | | — | | | | — | | | | — | | | | 1,136 | |
| | | | | | | | | | | | | | | | |
Net expenses | | | 27,758 | | | | 19,813 | | | | 79,805 | | | | 40,727 | |
| | | | | | | | | | | | | | | | |
Net investment income | | | 35,590 | | | | 15,725 | | | | 82,834 | | | | 30,695 | |
| | | | | | | | | | | | | | | | |
Realized and unrealized gains (losses): | | | | | | | | | | | | | | | | |
Net realized gains (losses) on: | | | | | | | | | | | | | | | | |
Non-controlled, non-affiliated investments | | | 1,407 | | | | 1,314 | | | | 15,738 | | | | 5,905 | |
Derivative instruments | | | (548 | ) | | | 6,998 | | | | (1,326 | ) | | | 9,648 | |
Foreign currency transactions | | | (593 | ) | | | 1,050 | | | | (2,939 | ) | | | 653 | |
| | | | | | | | | | | | | | | | |
Net realized gains | | | 266 | | | | 9,362 | | | | 11,473 | | | | 16,206 | |
| | | | | | | | | | | | | | | | |
Net change in unrealized appreciation (depreciation) on: | | | | | | | | | | | | | | | | |
Non-controlled, non-affiliated investments | | | (35,877 | ) | | | 19,052 | | | | (20,515 | ) | | | 18,081 | |
Non-controlled, affiliated investments | | | (9,486 | ) | | | — | | | | (701 | ) | | | — | |
Derivative instruments | | | 31,440 | | | | (9,463 | ) | | | 28,139 | | | | (3,457 | ) |
Foreign currency translation | | | (98 | ) | | | 98 | | | | 1,453 | | | | 86 | |
| | | | | | | | | | | | | | | | |
Net change in unrealized appreciation (depreciation) | | | (14,021 | ) | | | 9,687 | | | | 8,376 | | | | 14,710 | |
| | | | | | | | | | | | | | | | |
Net realized and unrealized gains (losses) | | | (13,755 | ) | | | 19,049 | | | | 19,849 | | | | 30,916 | |
| | | | | | | | | | | | | | | | |
Net increase in net assets resulting from operations | | $ | 21,835 | | | $ | 34,774 | | | $ | 102,683 | | | $ | 61,611 | |
| | | | | | | | | | | | | | | | |
Net Investment Income Per Share | | $ | 0.19 | | | $ | 0.14 | | | $ | 0.49 | | | $ | 0.33 | |
| | | | | | | | | | | | | | | | |
Diluted and Basic Earnings Per Share | | $ | 0.12 | | | $ | 0.30 | | | $ | 0.61 | | | $ | 0.66 | |
| | | | | | | | | | | | | | | | |
Weighted Average Shares Outstanding | | | 186,785,383 | | | | 115,304,666 | | | | 167,389,712 | | | | 93,148,769 | |
| | | | | | | | | | | | | | | | |
Distributions Declared Per Share | | $ | 0.22 | | | $ | 0.20 | | | $ | 0.60 | | | $ | 0.59 | |
| | | | | | | | | | | | | | | | |
See notes to condensed consolidated financial statements.
3
Corporate Capital Trust, Inc. and Subsidiaries
Condensed Consolidated Statements of Changes in Net Assets (unaudited)
(in thousands, except share amounts)
| | | | | | | | |
| | | Nine Months Ended September 30, | |
| | | 2014 | | | 2013 | |
Operations | | | | | | | | |
Net investment income | | $ | 82,834 | | | $ | 30,695 | |
Net realized gain on investments, derivative instruments and foreign currency transactions | | | 11,473 | | | | 16,206 | |
Net change in unrealized appreciation on investments, derivative instruments and foreign currency translation | | | 8,376 | | | | 14,710 | |
| | | | | | | | |
Net increase in net assets resulting from operations | | | 102,683 | | | | 61,611 | |
| | | | | | | | |
Distributions to shareholders from | | | | | | | | |
Net investment income | | | (82,834 | ) | | | (30,695 | ) |
Realized gains | | | (11,473 | ) | | | (16,206 | ) |
Distributions in excess of net investment income (Note 8) | | | (6,013 | ) | | | (6,903 | ) |
| | | | | | | | |
Net decrease in net assets resulting from shareholders distributions | | | (100,320 | ) | | | (53,804 | ) |
| | | | | | | | |
Capital share transactions | | | | | | | | |
Issuance of shares of common stock | | | 498,652 | | | | 613,980 | |
Reinvestment of shareholder distributions | | | 51,383 | | | | 27,215 | |
Repurchase of shares of common stock | | | (12,591 | ) | | | (2,642 | ) |
| | | | | | | | |
Net increase in net assets resulting from capital share transactions | | | 537,444 | | | | 638,553 | |
| | | | | | | | |
Total increase in net assets | | | 539,807 | | | | 646,360 | |
Net assets at beginning of period | | | 1,430,434 | | | | 611,484 | |
| | | | | | | | |
Net assets at end of period | | $ | 1,970,241 | | | $ | 1,257,844 | |
| | | | | | | | |
Capital share activity | | | | | | | | |
Shares issued from subscriptions | | | 49,031,534 | | | | 61,616,518 | |
Shares issued from reinvestment of distributions | | | 5,052,427 | | | | 2,728,786 | |
Shares repurchased | | | (1,246,240 | ) | | | (269,641 | ) |
| | | | | | | | |
Net increase in shares outstanding | | | 52,837,721 | | | | 64,075,663 | |
| | | | | | | | |
Distributions in excess of net investment income at end of period | | $ | (11,909 | ) | | $ | (10,278 | ) |
| | | | | | | | |
See notes to condensed consolidated financial statements.
4
Corporate Capital Trust, Inc. and Subsidiaries
Condensed Consolidated Statements of Cash Flows (unaudited)
(in thousands)
| | | | | | | | |
| | | Nine Months Ended September 30, | |
| | | 2014 | | | 2013 | |
Operating Activities: | | | | | | | | |
Net increase in net assets resulting from operations | | $ | 102,683 | | | $ | 61,611 | |
Adjustments to reconcile net increase in net assets resulting from operations to net cash used in operating activities: | | | | |
Purchases of investments | | | (1,260,847 | ) | | | (1,443,232 | ) |
Decrease in payable for investments purchased | | | (49,555 | ) | | | (46,307 | ) |
Paid-in-kind interest | | | (20,146 | ) | | | (995 | ) |
Proceeds from sales of investments | | | 442,624 | | | | 422,376 | |
Proceeds from principal payments | | | 351,163 | | | | 78,029 | |
Net realized gain on investments | | | (15,738 | ) | | | (5,905 | ) |
Net change in unrealized (appreciation) depreciation on investments | | | 21,216 | | | | (18,081 | ) |
Net change in unrealized (appreciation) depreciation on derivative instruments | | | (28,139 | ) | | | 3,457 | |
Net change in unrealized (appreciation) depreciation on foreign currency translation | | | (1,453 | ) | | | (86 | ) |
Amortization of premium/discount, net | | | (4,541 | ) | | | (586 | ) |
Amortization of deferred financing costs | | | 2,073 | | | | 665 | |
Accretion of discount on term loan payable | | | 132 | | | | — | |
Decrease in short-term investments, net | | | 148,676 | | | | 4,499 | |
Decrease (increase) in cash collateral for total return swap | | | (25,899 | ) | | | 32,953 | |
Increase in interest and dividends receivable | | | (14,012 | ) | | | (15,144 | ) |
Decrease in receivable for investments sold | | | 37,949 | | | | 23,294 | |
Decrease (increase) in principal receivable | | | 67 | | | | (2,291 | ) |
Increase in receivable from advisors | | | (680 | ) | | | — | |
Decrease (increase) in other assets | | | 251 | | | | (2,061 | ) |
Increase in accrued investment advisory fees | | | 492 | | | | 1,422 | |
Increase in accrued performance-based incentive fees | | | 2,556 | | | | 6,028 | |
Increase (decrease) in other accrued expenses and liabilities | | | (330 | ) | | | 656 | |
| | | | | | | | |
Net cash used in operating activities | | | (311,458 | ) | | | (899,698 | ) |
| | | | | | | | |
Financing Activities: | | | | | | | | |
Proceeds from issuance of shares of common stock | | | 498,652 | | | | 613,980 | |
Payment on repurchase of shares of common stock | | | (12,591 | ) | | | (2,642 | ) |
Distributions paid | | | (48,917 | ) | | | (26,589 | ) |
Borrowings under term loan | | | 398,000 | | | | — | |
Repayments under term loan | | | (2,000 | ) | | | — | |
Borrowings under revolving credit facilities | | | 347,000 | | | | 496,806 | |
Repayments of revolving credit facilities | | | (867,331 | ) | | | (150,000 | ) |
Deferred financing costs paid | | | (7,026 | ) | | | (5,002 | ) |
| | | | | | | | |
Net cash provided by financing activities | | | 305,787 | | | | 926,553 | |
| | | | | | | | |
Effect of exchange rate changes on cash | | | — | | | | 46 | |
| | | | | | | | |
Net increase (decrease) in cash | | | (5,671 | ) | | | 26,901 | |
Cash and cash denominated in foreign currency, beginning of period | | | 86,205 | | | | 306 | |
| | | | | | | | |
Cash and cash denominated in foreign currency, end of period | | $ | 80,534 | | | $ | 27,207 | |
| | | | | | | | |
Supplemental disclosure of cash flow information and non-cash financing activities: | | | | |
Cash paid for interest | | $ | 14,767 | | | $ | 4,172 | |
Distributions reinvested | | $ | 51,383 | | | $ | 27,215 | |
Deferred financing costs accrued in other expenses and liabilities | | $ | — | | | $ | 256 | |
See notes to condensed consolidated financial statements.
5
Corporate Capital Trust, Inc. and Subsidiaries
Condensed Consolidated Schedule of Investments (unaudited)
As of September 30, 2014
(in thousands, except share amounts)
| | | | | | | | | | | | | | | | | | | | | | | | | | | | |
| Company (a)(b) | | Footnotes | |
Industry | | Interest
Rate | | | Base Rate
Floor | | | Maturity
Date | | | No. Shares/
Principal
Amount (c) | | |
Cost (d) | | |
Fair Value | |
Senior Secured Loans—First Lien—44.7% | | | | | |
ABILITY Network, Inc. | | (e)(f)(g) | | Health Care Equipment & Services | | | L + 500 | | | | 1.00 | % | | | 5/14/2021 | | | $ | 20,215 | | | $ | 20,002 | | | $ | 20,266 | |
Algeco/Scotsman (LU) | | (e)(h)(i)(j) | | Consumer Durables & Apparel | | | 15.75% PIK | | | | | | | | 5/1/2018 | | | | 28,560 | | | | 28,674 | | | | 29,131 | |
AltEn, LLC | | (k)(l) | | Energy | | | L + 900 | | | | 1.00 | % | | | 9/12/2018 | | | | 29,610 | | | | 26,684 | | | | 26,655 | |
Aspen Dental Management, Inc. | | (e)(g) | | Health Care Equipment & Services | | | L + 550 | | | | 1.50 | % | | | 10/6/2016 | | | | 6,007 | | | | 5,970 | | | | 6,002 | |
Bluestem Brands, Inc. | | (e)(l) | | Consumer Durables & Apparel | | | L + 650 | | | | 1.00 | % | | | 12/6/2018 | | | | 37,601 | | | | 36,259 | | | | 37,719 | |
BRG Sports, Inc. | | (e)(l) | | Consumer Durables & Apparel | | | L + 550 | | | | 1.00 | % | | | 4/15/2021 | | | | 4,544 | | | | 4,457 | | | | 4,578 | |
Caesars Entertainment Operating Co., Inc. | | (e)(f)(g)(i) | | Consumer Services | | | L + 675 | | | | | | | | 3/1/2017 | | | | 10,800 | | | | 10,111 | | | | 9,876 | |
California Pizza Kitchen, Inc. | | (e)(f)(g) | | Food & Staples Retailing | | | L + 425 | | | | 1.00 | % | | | 3/29/2018 | | | | 18,649 | | | | 17,812 | | | | 17,920 | |
Charlotte Russe, Inc. | | (e)(g) | | Retailing | | | L + 550 | | | | 1.25 | % | | | 5/22/2019 | | | | 18,314 | | | | 18,139 | | | | 18,177 | |
| | | (e)(g) | | | | | L + 550 | | | | 1.25 | % | | | 5/22/2019 | | | | 4,727 | | | | 4,699 | | | | 4,656 | |
Distribution International, Inc. | | (g) | | Retailing | | | L + 650 | | | | 1.00 | % | | | 7/16/2019 | | | | 48,022 | | | | 47,619 | | | | 48,142 | |
Emerald Performance Materials, LLC | | (e)(l) | | Materials | | | L + 350 | | | | 1.00 | % | | | 7/30/2021 | | | | 655 | | | | 652 | | | | 651 | |
Football Association of Ireland (IE) | | (h)(i)(k)(EUR) | | Consumer Durables & Apparel | | | 6.40 | % | | | | | | | 12/20/2020 | | | € | 44,615 | | | | 59,718 | | | | 56,383 | |
Greenway Medical Technologies | | (e)(g) | | Health Care Equipment & Services | | | L + 500 | | | | 1.00 | % | | | 11/4/2020 | | | $ | 1,768 | | | | 1,759 | | | | 1,765 | |
Greystone & Co., Inc. | | (g)(k) | | Diversified Financials | | | L + 800 | | | | 1.00 | % | | | 3/26/2021 | | | | 34,003 | | | | 33,440 | | | | 34,099 | |
Gymboree Corp. | | (e)(g) | | Retailing | | | L + 350 | | | | 1.50 | % | | | 2/23/2018 | | | | 14,197 | | | | 12,619 | | | | 9,477 | |
iPayment, Inc. | | (e)(g) | | Software & Services | | | L + 525 | | | | 1.50 | % | | | 5/8/2017 | | | | 36,163 | | | | 35,879 | | | | 35,873 | |
J. Jill | | (g)(k) | | Retailing | | | L + 850 | | | | 1.50 | % | | | 4/29/2017 | | | | 6,418 | | | | 6,418 | | | | 6,418 | |
Jacuzzi Brands, Inc. | | (g)(k) | | Capital Goods | | | L + 650 | | | | 1.25 | % | | | 7/3/2019 | | | | 20,786 | | | | 20,437 | | | | 20,655 | |
Jacuzzi Brands, Inc. (LU) | | (g)(h)(k) | | Capital Goods | | | L + 650 | | | | 1.25 | % | | | 7/3/2019 | | | | 20,118 | | | | 19,781 | | | | 19,992 | |
KeyPoint Government Solutions, Inc. | | (k)(g) | | Capital Goods | | | L + 600 | | | | 1.25 | % | | | 11/13/2017 | | | | 30,071 | | | | 29,642 | | | | 30,071 | |
Keystone Australia Holdings, Pty. Ltd. (AU) | | (h)(i)(j)(k)(AUD) | | Consumer Services | |
| 7.00%, 8.00%
PIK |
| | | | | | | 8/7/2019 | | | A$ | 37,292 | | | | 32,581 | | | | 31,859 | |
Kurt Geiger Ltd. (UK) | | (h)(i)(j)(k)(GBP) | | Consumer Durables & Apparel | |
| 10.00%, 1.00%
PIK |
| | | | | | | 4/8/2019 | | | £ | 46,625 | | | | 76,629 | | | | 76,282 | |
Marshall Retail Group, LLC | | (k)(g) | | Retailing | | | L + 600 | | | | 1.00 | % | | | 8/25/2020 | | | $ | 16,804 | | | | 16,639 | | | | 16,646 | |
MCS AMS Sub-Holdings, LLC(g) | | | | Commercial & Professional Services | | | L + 600 | | | | 1.00 | % | | | 10/15/2019 | | | | 46,511 | | | | 45,334 | | | | 44,651 | |
MSX International, Inc. | | (g) | | Software & Services | | | L + 500 | | | | 1.00 | % | | | 8/18/2020 | | | | 10,017 | | | | 9,450 | | | | 9,979 | |
New Enterprise Stone & Lime Co., Inc. | | (g)(k) | | Capital Goods | | | L + 700 | | | | 1.00 | % | | | 2/12/2019 | | | | 56,298 | | | | 56,298 | | | | 56,442 | |
Nine West Holdings, Inc. | | (e)(g) | | Consumer Durables & Apparel | | | L + 375 | | | | 1.00 | % | | | 10/8/2019 | | | | 3,554 | | | | 3,585 | | | | 3,443 | |
OpenLink Financial, Inc. | | (g) | | Software & Services | | | L + 500 | | | | 1.25 | % | | | 10/30/2017 | | | | 46 | | | | 46 | | | | 46 | |
Pacific Union Financial, LLC | | (i)(k)(g) | | Diversified Financials | | | L + 800 | | | | 1.00 | % | | | 5/31/2019 | | | | 41,147 | | | | 40,556 | | | | 41,272 | |
RedPrairie Corp. | | (e)(g) | | Software & Services | | | L + 500 | | | | 1.00 | % | | | 12/21/2018 | | | | 3,995 | | | | 3,995 | | | | 3,899 | |
See notes to condensed consolidated financial statements.
6
Corporate Capital Trust, Inc. and Subsidiaries
Condensed Consolidated Schedule of Investments (unaudited) (continued)
As of September 30, 2014
(in thousands, except share amounts)
| | | | | | | | | | | | | | | | | | | | | | | | | | | | | | | | | | | | |
Company (a)(b) | | Footnotes | |
Industry | | Interest
Rate | | | Base Rate
Floor | | | Maturity
Date | | | No.
Shares/
Principal
Amount (c) | | | | | |
Cost (d) | | | | | |
Fair Value | |
Sportsman’s Warehouse, Inc. | | (g)(k) | | Retailing | | | L + 600 | | | | 1.25 | % | | | 8/20/2019 | | | $ | 27,335 | | | $ | | | | | 27,102 | | | $ | | | | | 27,380 | |
| | | (g)(k) | | | | | L + 1075 | | | | 1.25 | % | | | 8/20/2019 | | | | 16,079 | | | | | | | | 15,775 | | | | | | | | 16,122 | |
Surgery Center Holdings, Inc. | | (e)(f)(g) | | Health Care Equipment & Services | | | L + 425 | | | | 1.00 | % | | | 7/24/2020 | | | | 14,834 | | | | | | | | 14,760 | | | | | | | | 14,816 | |
Travelport, LLC (LU) | | (e)(h)(m) | | Software & Services | | | L + 500 | | | | 1.00 | % | | | 9/2/2021 | | | | 19,751 | | | | | | | | 19,506 | | | | | | | | 19,765 | |
Tweddle Group, Inc. | | (g)(k) | | Automobiles & Components | | | L + 675 | | | | 1.00 | % | | | 4/7/2020 | | | | 45,822 | | | | | | | | 44,733 | | | | | | | | 45,868 | |
Willbros United States Holding, Inc. | | (e)(i)(l) | | Energy | | | L + 975 | | | | 1.25 | % | | | 8/7/2019 | | | | 29,684 | | | | | | | | 29,142 | | | | | | | | 30,031 | |
Wilton Brands, LLC | | (e)(g) | | Materials | | | L + 625 | | | | 1.25 | % | | | 8/30/2018 | | | | 5,214 | | | | | | | | 5,135 | | | | | | | | 4,941 | |
Total Senior Secured Loans - First Lien | | | | | | | | | | | | | | | | | | | | | | $ | | | | | 882,037 | | | $ | | | | | 881,948 | |
| | | | | | | | | | | | | | | | | | | | | | | | | | | | | | | | | | | | |
Senior Secured Loans - Second Lien—37.8% | | | | | | | | | | | | | | | | | | | | | | | | | | | | | | | | | | | | |
ABILITY Network, Inc. | | (g) | | Health Care Equipment & Services | | | L + 825 | | | | 1.00 | % | | | 5/16/2022 | | | $ | 8,230 | | | $ | | | | | 8,151 | | | $ | | | | | 8,271 | |
American Casino & Entertainment Properties, LLC | | (g) | | Consumer Services | | | L + 1000 | | | | 1.25 | % | | | 1/3/2020 | | | | 1,832 | | | | | | | | 1,891 | | | | | | | | 1,915 | |
Angelica Corp. | | (g)(k) | | Health Care Equipment & Services | | | L + 875 | | | | 1.25 | % | | | 7/15/2019 | | | | 50,869 | | | | | | | | 50,869 | | | | | | | | 49,826 | |
Applied Systems, Inc. | | (e)(f)(g) | | Software & Services | | | L + 650 | | | | 1.00 | % | | | 1/24/2022 | | | | 24,905 | | | | | | | | 25,348 | | | | | | | | 24,936 | |
Arysta Lifescience SPC, LLC | | (e)(g)(i) | | Food, Beverage & Tobacco | | | L + 700 | | | | 1.25 | % | | | 11/30/2020 | | | | 16,305 | | | | | | | | 16,163 | | | | | | | | 16,448 | |
AssuredPartners, Inc. | | (g) | | Insurance | | | L + 675 | | | | 1.00 | % | | | 4/2/2022 | | | | 7,115 | | | | | | | | 7,110 | | | | | | | | 7,043 | |
Brake Bros Ltd. (UK) | | (h)(i)(j)(n)(GBP) | | Food & Staples Retailing | |
| L + 325, 3.00%
PIK |
| | | | | | | 3/12/2017 | | | £ | 8,823 | | | | | | | | 12,634 | | | | | | | | 13,883 | |
BRG Sports, Inc. | | (l) | | Consumer Durables & Apparel | | | L + 925 | | | | 1.00 | % | | | 4/15/2022 | | | $ | 23,855 | | | | | | | | 23,657 | | | | | | | | 23,974 | |
Catalina Marketing Corp. | | (l) | | Media | | | L + 675 | | | | 1.00 | % | | | 4/11/2022 | | | | 6,020 | | | | | | | | 5,977 | | | | | | | | 5,794 | |
CHG Companies, Inc. | | (e)(g) | | Health Care Equipment & Services | | | L + 775 | | | | 1.25 | % | | | 11/19/2020 | | | | 10,485 | | | | | | | | 10,372 | | | | | | | | 10,682 | |
CRC Health Group, Inc. | | (g) | | Health Care Equipment & Services | | | L + 800 | | | | 1.00 | % | | | 9/28/2021 | | | | 42,358 | | | | | | | | 42,128 | | | | | | | | 42,763 | |
CTI Foods Holding Co., LLC | | (g) | | Food, Beverage & Tobacco | | | L + 725 | | | | 1.00 | % | | | 6/28/2021 | | | | 23,219 | | | | | | | | 22,909 | | | | | | | | 23,408 | |
Emerald Performance Materials, LLC | | (l) | | Materials | | | L + 675 | | | | 1.00 | % | | | 8/1/2022 | | | | 2,041 | | | | | | | | 2,030 | | | | | | | | 2,033 | |
Excelitas Technologies Corp. | | (g)(j)(k) | | Technology Hardware & Equipment | |
| L + 975, 1.50%
PIK |
| | | 1.00 | % | | | 4/29/2021 | | | | 108,581 | | | | | | | | 108,581 | | | | | | | | 109,374 | |
Greenway Medical Technologies | | (g) | | Health Care Equipment & Services | | | L + 825 | | | | 1.00 | % | | | 11/4/2021 | | | | 26,396 | | | | | | | | 26,025 | | | | | | | | 26,264 | |
Gruppo Argenta S.p.A. (LU) | | (h)(i)(j)(k)(EUR) | | Retailing | | | 12.00% PIK | | | | | | | | 1/31/2019 | | | € | 22,754 | | | | | | | | 25,071 | | | | | | | | 25,211 | |
Gypsum Management & Supply, Inc. | | (g) | | Capital Goods | | | L + 675 | | | | 1.00 | % | | | 4/1/2022 | | | $ | 13,207 | | | | | | | | 13,082 | | | | | | | | 13,207 | |
Integra Telecom Holdings, Inc. | | (g) | | Telecommunication Services | | | L + 850 | | | | 1.25 | % | | | 2/21/2020 | | | | 3,000 | | | | | | | | 3,061 | | | | | | | | 3,015 | |
iParadigms Holdings, LLC | | (f)(g) | | Software & Services | | | L + 725 | | | | 1.00 | % | | | 7/29/2022 | | | | 20,727 | | | | | | | | 20,561 | | | | | | | | 20,624 | |
Learfield Communications, Inc. | | (g) | | Media | | | L + 775 | | | | 1.00 | % | | | 10/8/2021 | | | | 12,767 | | | | | | | | 12,878 | | | | | | | | 12,751 | |
Lightower Fiber, LLC | | (e)(g) | | Telecommunication Services | | | L + 675 | | | | 1.25 | % | | | 4/12/2021 | | | | 5,282 | | | | | | | | 5,318 | | | | | | | | 5,278 | |
Maxim Crane, LP | | (e)(g) | | Capital Goods | | | L + 925 | | | | 1.00 | % | | | 11/26/2018 | | | | 5,168 | | | | | | | | 5,300 | | | | | | | | 5,286 | |
Misys Ltd. (UK) | | (e)(h)(i) | | Software & Services | | | 12.00 | % | | | | | | | 6/12/2019 | | | | 3,000 | | | | | | | | 3,315 | | | | | | | | 3,405 | |
NewWave Communications, Inc. | | (g) | | Media | | | L + 800 | | | | 1.00 | % | | | 10/30/2020 | | | | 13,712 | | | | | | | | 13,671 | | | | | | | | 13,781 | |
P2 Energy Solutions, Inc. | | (o) | | Software & Services | | | L + 800 | | | | 1.00 | % | | | 4/30/2021 | | | | 9,283 | | | | | | | | 9,197 | | | | | | | | 9,376 | |
See notes to condensed consolidated financial statements.
7
Corporate Capital Trust, Inc. and Subsidiaries
Condensed Consolidated Schedule of Investments (unaudited) (continued)
As of September 30, 2014
(in thousands, except share amounts)
| | | | | | | | | | | | | | | | | | | | | | | | | | | | | | | | | | | | |
Company (a)(b) | | Footnotes | |
Industry | | Interest
Rate | | | Base Rate
Floor | | | Maturity
Date | | | No. Shares/
Principal
Amount (c) | | | | | |
Cost (d) | | | | | |
Fair Value | |
Polyconcept Finance BV (NL) | | (h)(i)(k)(l) | | Consumer Durables & Apparel | | | L + 875 | | | | 1.25 | % | | | 6/28/2020 | | | $ | 46,727 | | | $ | | | | | 46,727 | | | $ | | | | | 46,502 | |
Progressive Solutions | | (l) | | Health Care Equipment & Services | | | L + 850 | | | | 1.00 | % | | | 10/22/2021 | | | | 21,145 | | | | | | | | 20,987 | | | | | | | | 21,145 | |
RedPrairie Corp. | | (e)(f)(g) | | Software & Services | | | L + 1000 | | | | 1.25 | % | | | 12/21/2019 | | | | 28,404 | | | | | | | | 28,033 | | | | | | | | 27,141 | |
Sabine Oil & Gas, LLC | | (e)(g) | | Energy | | | L + 750 | | | | 1.25 | % | | | 12/31/2018 | | | | 14,527 | | | | | | | | 14,416 | | | | | | | | 14,554 | |
SafeNet, Inc. | | (k)(l) | | Software & Services | | | L + 750 | | | | 1.00 | % | | | 3/5/2021 | | | | 20,829 | | | | | | | | 20,536 | | | | | | | | 21,038 | |
Safety Technology Holdings, Inc. | | (g)(k) | | Technology Hardware & Equipment | | | L + 825 | | | | 1.00 | % | | | 6/2/2020 | | | | 30,402 | | | | | | | | 29,715 | | | | | | | | 30,682 | |
SI Organization, Inc. | | (g) | | Capital Goods | | | L + 800 | | | | 1.00 | % | | | 5/23/2020 | | | | 56,000 | | | | | | | | 55,465 | | | | | | | | 56,980 | |
Talbots, Inc. | | (g) | | Retailing | | | L + 725 | | | | 1.00 | % | | | 3/19/2021 | | | | 15,074 | | | | | | | | 14,973 | | | | | | | | 14,961 | |
The TelX Group, Inc. | | (g) | | Telecommunication Services | | | L + 650 | | | | 1.00 | % | | | 4/9/2021 | | | | 11,696 | | | | | | | | 11,681 | | | | | | | | 11,672 | |
Websense, Inc. | | (g) | | Technology Hardware & Equipment | | | L + 725 | | | | 1.00 | % | | | 12/24/2020 | | | | 22,131 | | �� | | | | | | 22,034 | | | | | | | | 22,131 | |
Total Senior Secured Loans—Second Lien | | | | | | | | | | | | | | | | | | | | | | $ | | | | | 739,866 | | | $ | | | | | 745,354 | |
| | | | | | | | | | | | | | | | | | | | | | | | | | | | | | | | | | | | |
Senior Secured Bonds—8.4% | | | | | | | | | | | | | | | | | | | | | | | | | | | | | | | | | | | | |
Artesyn Technologies, Inc. | | (p)(q) | | Technology Hardware & Equipment | | | 9.75% | | | | | | | | 10/15/2020 | | | $ | 12,976 | | | $ | | | | | 12,886 | | | $ | | | | | 12,879 | |
Essar Steel Algoma, Inc. (CA) | | (h)(i)(p)(q) | | Materials | | | 9.38% | | | | | | | | 3/15/2015 | | | | 339 | | | | | | | | 340 | | | | | | | | 338 | |
Guitar Center, Inc. | | (p)(q) | | Retailing | | | 6.50% | | | | | | | | 4/15/2019 | | | | 26,191 | | | | | | | | 25,810 | | | | | | | | 23,637 | |
Hot Topic, Inc. | | (p)(q) | | Consumer Durables & Apparel | | | 9.25% | | | | | | | | 6/15/2021 | | | | 2,396 | | | | | | | | 2,374 | | | | | | | | 2,564 | |
Jeld-Wen, Inc.(p)(q) | | | | Capital Goods | | | 12.25% | | | | | | | | 10/15/2017 | | | | 9,922 | | | | | | | | 10,666 | | | | | | | | 10,530 | |
Louisiana Public Facilities Authority, 2013 C Bonds | | (k)(p) | | Energy | | | 11.50% | | | | | | | | 1/1/2020 | | | | 50,580 | | | | | | | | 49,235 | | | | | | | | 51,086 | |
Louisiana Public Facilities Authority, 2014 B Bonds | | (k)(p) | | Energy | | | 11.50% | | | | | | | | 1/1/2020 | | | | 10,650 | | | | | | | | 10,650 | | | | | | | | 10,692 | |
New Enterprise Stone & Lime Co., Inc. | | (j)(q) | | Capital Goods | |
| 6.00%, 7.00%
PIK |
| | | | | | | 3/15/2018 | | | | 10,841 | | | | | | | | 10,921 | | | | | | | | 11,816 | |
OAG Holdings, LLC | | (j)(k) | | Energy | |
| 8.00%, 2.00%
PIK |
| | | | | | | 12/20/2020 | | | | 20,313 | | | | | | | | 17,665 | | | | | | | | 18,989 | |
Ryerson, Inc. | | (e) | | Materials | | | 9.00% | | | | | | | | 10/15/2017 | | | | 5,814 | | | | | | | | 5,814 | | | | | | | | 6,134 | |
SquareTwo Financial Corp. | | (q) | | Banks | | | 11.63% | | | | | | | | 4/1/2017 | | | | 16,359 | | | | | | | | 16,142 | | | | | | | | 16,318 | |
Total Senior Secured Bonds | | | | | | | | | | | | | | | | | | | | | | $ | | | | | 162,503 | | | $ | | | | | 164,983 | |
| | | | | | | | | | | | | | | | | | | | | | | | | | | | | | | | | | | | |
Total Senior Debt | | | | | | | | | | | | | | | | | | | | | | $ | | | | | 1,784,406 | | | $ | | | | | 1,792,285 | |
| | | | | | | | | | | | | | | | | | | | | | | | | | | | | | | | | | | | |
Subordinated Debt—24.2% | | | | | | | | | | | | | | | | | | | | | | | | | | | | | | | | | | | | |
Cemex Materials, LLC | | (p)(q) | | Materials | | | 7.70% | | | | | | | | 7/21/2025 | | | $ | 25,312 | | | $ | | | | | 25,259 | | | $ | | | | | 28,425 | |
Cequel Communications Holdings, LLC | | (p)(q) | | Media | | | 5.13% | | | | | | | | 12/15/2021 | | | | 7,205 | | | | | | | | 7,008 | | | | | | | | 6,899 | |
Ceridian Corp. | | (p)(q) | | Commercial & Professional Services | | | 8.13% | | | | | | | | 11/15/2017 | | | | 19,725 | | | | | | | | 19,727 | | | | | | | | 19,750 | |
| | | (q) | | | | | 11.00% | | | | | | | | 3/15/2021 | | | | 16,201 | | | | | | | | 17,473 | | | | | | | | 18,388 | |
CHS/Community Health Systems, Inc. | | (i)(p)(q) | | Health Care Equipment & Services | | | 6.88% | | | | | | | | 2/1/2022 | | | | 114 | | | | | | | | 114 | | | | | | | | 119 | |
Datatel, Inc. | | (e)(j)(p) | | Software & Services | | | 9.63% | | | | | | | | 12/1/2018 | | | | 9,287 | | | | | | | | 9,210 | | | | | | | | 9,380 | |
Eagle Midco, Inc. | | (j)(p)(q) | | Software & Services | | | 9.00% | | | | | | | | 6/15/2018 | | | | 31,796 | | | | | | | | 32,653 | | | | | | | | 32,472 | |
Education Management Corp. | | (i)(j)(k)(p)(q) | | Consumer Services | |
| 16.00%
PIK |
| | | | | | | 7/1/2018 | | | | 1,403 | | | | | | | | 1,411 | | | | | | | | 662 | |
See notes to condensed consolidated financial statements.
8
Corporate Capital Trust, Inc. and Subsidiaries
Condensed Consolidated Schedule of Investments (unaudited) (continued)
As of September 30, 2014
(in thousands, except share amounts)
| | | | | | | | | | | | | | | | | | | | | | | | | | | | | | | | | | |
Company (a)(b) | | Footnotes | |
Industry | | Interest
Rate | | | Base Rate
Floor | | Maturity
Date | | | No. Shares/
Principal
Amount (c) | | | | | |
Cost (d) | | | | | |
Fair Value | |
Essar Steel Algoma, Inc. (CA) | | (h)(i)(p)(q)(r) | | Materials | | | 9.88% | | | | | | 6/15/2015 | | | $ | 6,973 | | | $ | | | | | 5,481 | | | $ | | | | | 5,822 | |
GCI, Inc. | | (q) | | Telecommunication Services | | | 8.63% | | | | | | 11/15/2019 | | | | 47,812 | | | | | | | | 50,481 | | | | | | | | 49,246 | |
| | | (q) | | | | | 6.75% | | | | | | 6/1/2021 | | | | 158 | | | | | | | | 151 | | | | | | | | 157 | |
Global Closure Systems (FR) | | (h)(i)(j)(k)(EUR) | | Materials | | | 13.00% PIK | | | | | | 11/15/2019 | | | € | 18,987 | | | | | | | | 25,031 | | | | | | | | 23,647 | |
Griffins Foods, Ltd. (NZ) | | (h)(i)(j)(k)(NZD) | | Food, Beverage & Tobacco | | | 13.75% PIK | | | | | | 1/31/2019 | | | N$ | 52,406 | | | | | | | | 41,206 | | | | | | | | 42,138 | |
Gruppo Argenta S.p.A. (LU) | | (h)(i)(j)(k)(EUR) | | Retailing | | | 15.00% PIK | | | | | | 11/11/2018 | | | € | 668 | | | | | | | | 919 | | | | | | | | 691 | |
Gymboree Corp. | | (q) | | Retailing | | | 9.13% | | | | | | 12/1/2018 | | | $ | 3,335 | | | | | | | | 3,216 | | | | | | | | 934 | |
Hilding Anders (SE) | | (h)(i)(j)(k)(t)(EUR) | | Consumer Durables & Apparel | | | 13.00% PIK | | | | | | 6/30/2021 | | | € | 86,803 | | | | | | | | 103,612 | | | | | | | | 99,511 | |
| | (h)(i)(j)(k)(t)(EUR) | | | | | 12.00% PIK | | | | | | 12/31/2023 | | | | 15,739 | | | | | | | | 1,001 | | | | | | | | 1,640 | |
| | | (h)(i)(j)(k)(t)(EUR) | | | | | 18.00% PIK | | | | | | 12/31/2024 | | | | 7,046 | | | | | | | | 6,846 | | | | | | | | 7,727 | |
Hot Topic, Inc. | | (j)(p)(q) | | Consumer Durables & Apparel | | | 12.00% | | | | | | 5/15/2019 | | | $ | 8,113 | | | | | | | | 7,967 | | | | | | | | 8,377 | |
iPayment, Inc. | | (q) | | Software & Services | | | 10.25% | | | | | | 5/15/2018 | | | | 12,066 | | | | | | | | 9,900 | | | | | | | | 10,648 | |
JC Penney Corp., Inc. | | (i)(q) | | Retailing | | | 5.65% | | | | | | 6/1/2020 | | | | 8,549 | | | | | | | | 6,389 | | | | | | | | 7,181 | |
Pharmaceutical Product Development, Inc. | | (j)(p)(q) | | Pharmaceuticals, Biotechnology & Life Sciences | | | 9.38% | | | | | | 10/15/2017 | | | | 5,151 | | | | | | | | 5,244 | | | | | | | | 5,202 | |
Stuart Weitzman, Inc. | | (j)(k)(l) | | Consumer Durables & Apparel | | | 11.50% | | | | | | 8/29/2019 | | | | 56,918 | | | | | | | | 55,518 | | | | | | | | 57,163 | |
Summit Materials, LLC | | (q) | | Materials | | | 10.50% | | | | | | 1/31/2020 | | | | 9,711 | | | | | | | | 10,506 | | | | | | | | 10,731 | |
| | | (p)(q) | | | | | 10.50% | | | | | | 1/31/2020 | | | | 5,748 | | | | | | | | 6,317 | | | | | | | | 6,352 | |
The TelX Group, Inc. | | (j)(k) | | Telecommunication Services | | | 13.50% PIK | | | | | | 7/9/2021 | | | | 3,239 | | | | | | | | 3,472 | | | | | | | | 3,311 | |
Towergate Finance PLC (UK) | | (h)(i)(p)(q)(GBP) | | Insurance | | | 10.50% | | | | | | 2/15/2019 | | | £ | 14,608 | | | | | | | | 23,263 | | | | | | | | 20,366 | |
Total Subordinated Debt | | | | | | | | | | | | | | | | | | | | $ | | | | | 479,375 | | | $ | | | | | 476,939 | |
| | | | | | | | | | | | | | | | | | | | | | | | | | | | | | | | | | |
Structured Products—1.7% | | | | | | | | | | | | | | | | | | | | | | | | | | | | | | | | | | |
KKR BPT Holdings Aggregator, LLC | | (i)(k)(s)* | | Diversified Financials | | | | | | | | | | | | | N/A | | | $ | | | | | 2,500 | | | $ | | | | | 2,500 | |
Trade Finance Funding I, Ltd. 2013-1A Class B (KY) | | (h)(i)(k)(p) | | Diversified Financials | | | 10.75% | | | | | | 11/13/2018 | | | $ | 28,221 | | | | | | | | 28,221 | | | | | | | | 28,362 | |
VSK Holdings, Ltd. (KY) | | (h)(i)(k)(t)(EUR) | | Diversified Financials | | | | | | | | | | | | | 620,377 | | | | | | | | — | | | | | | | | 3,080 | |
Total Structured Products | | | | | | | | | | | | | | | | | | | | $ | | | | | 30,721 | | | $ | | | | | 33,942 | |
| | | | | | | | | | | | | | | | | | | | | | | | | | | | | | | | | | |
Equity / Other—5.5% | | | | | | | | | | | | | | | | | | | | | | | | | | | | | | | | | | |
Ally Financial, Inc., Preferred Stock | | (i)(p)(q) | | Banks | | | 7.00% | | | | | | | | | | 230 | | | $ | | | | | 229 | | | $ | | | | | 230 | |
AltEn, LLC, Membership Interests | | (k)(t)* | | Energy | | | | | | | | | | | | | 611 | | | | | | | | 2,955 | | | | | | | | 2,955 | |
Cengage Learning Holdings II, LP, Common Stock | | (e) | | Media | | | | | | | | | | | | | 227,802 | | | | | | | | 7,529 | | | | | | | | 7,176 | |
Excelitas Technologies Corp., Class A Membership Interest | | (k)* | | Technology Hardware & Equipment | | | | | | | | | | | | | N/A | | | | | | | | 5,636 | | | | | | | | 6,025 | |
Genesys Telecommunications Laboratories, Inc., Common Stock | | (k)* | | Software & Services | | | | | | | | | | | | | 5,775 | | | | | | | | 449 | | | | | | | | 761 | |
Global Closure Systems (FR), Limited Partnership Interest | | (h)(i)(k)*(EUR) | | Materials | | | | | | | | | | | | | N/A | | | | | | | | 823 | | | | | | | | 1,473 | |
Gruppo Argenta S.p.A. (LU), Warrants | | (h)(i)(k)*(EUR) | | Retailing | | | | | | | | | | | | | 225,289 | | | | | | | | 5,342 | | | | | | | | 4,501 | |
See notes to condensed consolidated financial statements.
9
Corporate Capital Trust, Inc. and Subsidiaries
Condensed Consolidated Schedule of Investments (unaudited) (continued)
As of September 30, 2014
(in thousands, except share amounts)
| | | | | | | | | | | | | | | | | | | | | | | | | | | | | | | | | | |
Company (a)(b) | | Footnotes | |
Industry | | Interest
Rate | | | Base Rate
Floor | | Maturity
Date | | | No. Shares/
Principal
Amount (c) | | | | | |
Cost (d) | | | | | |
Fair Value | |
Hilding Anders (SE), Class A Common Stock | | (h)(i)(k)(t)*(SEK) | | Consumer Durables & Apparel | | | | | | | | | | | | | 1,394,288 | | | $ | | | | | 132 | | | $ | | | | | 312 | |
Hilding Anders (SE), Class B Common Stock | | (h)(i)(k)(t)*(SEK) | | | | | | | | | | | | | | | 260,253 | | | | | | | | 25 | | | | | | | | 58 | |
Hilding Anders (SE), Equity Options | | (h)(i)(k)(t)*(SEK) | | | | | | | | | | | 12/31/2020 | | | | 236,160,807 | | | | | | | | 14,988 | | | | | | | | 13,582 | |
Hyperion Homes, Inc., Common Stock | | (k)(t)* | | Real Estate | | | | | | | | | | | | | 12,840 | | | | | | | | 12,752 | | | | | | | | 12,752 | |
Hyperion Homes, Inc., Warrant Delivery Rights | | (k)(t)* | | | | | | | | | | | | | | | 2,193 | | | | | | | | 36 | | | | | | | | 36 | |
Hyperion Homes, Inc., Warrants | | (k)(t)* | | | | | | | | | | | | | | | 482 | | | | | | | | 53 | | | | | | | | 53 | |
Jones Apparel Group Holdings, Inc., Common Stock | | (k) | | Consumer Durables & Apparel | | | | | | | | | | | | | 5,451 | | | | | | | | 872 | | | | | | | | 2,766 | |
Keystone Australia Holdings, Pty. Ltd., Warrants | | (h)(i)(k)*(AUD) | | Consumer Services | | | | | | | | | | | | | 1,588,469 | | | | | | | | 1,019 | | | | | | | | 1,081 | |
Kurt Geiger, Ltd. (UK), Common Stock | | (k)* | | Consumer Durables & Apparel | | | | | | | | | | | | | 5,451 | | | | | | | | 1,090 | | | | | | | | 6,502 | |
Nine West Holdings, Inc., Common Stock | | (k)* | | Consumer Durables & Apparel | | | | | | | | | | | | | 5,451 | | | | | | | | 6,541 | | | | | | | | 5,671 | |
OAG Holdings, LLC, Overriding Royalty Interest | | (k) | | Energy | | | | | | | | | | | | | N/A | | | | | | | | 2,354 | | | | | | | | 1,688 | |
Orchard Marine, Ltd., (VG), Class B Common Stock | | (h)(i)(k)(t)* | | Transportation | | | | | | | | | | | | | 1,964 | | | | | | | | 3,069 | | | | | | | | 3,069 | |
Orchard Marine, Ltd., (VG), Series A Preferred Stock | | (h)(i)(k)(t) | | | | | 9.00 | % | | | | | | | | | 9,820 | | | | | | | | 8,862 | | | | | | | | 8,862 | |
Star Mountain SMB Multi-Manager Credit Platform, LP, Limited Partnership Interest(i)(k) | | | | Diversified Financials | | | | | | | | | | | | | N/A | | | | | | | | 22,803 | | | | | | | | 19,910 | |
Stuart Weitzman, Inc., Common Stock | | (k) | | Consumer Durables & Apparel | | | | | | | | | | | | | 5,451 | | | $ | | | | | 3,025 | | | $ | | | | | 8,509 | |
Total Equity / Other | | | | | | | | | | | | | | | | | | | | $ | | | | | 100,584 | | | $ | | | | | 107,972 | |
| | | | | | | | | | | | | | | | | | | | | | | | | | | | | | | | | | |
Total Investments, excluding Short Term Investments—122.3% | | | | | | | | | | | | | | | | $ | | | | | 2,395,086 | | | $ | | | | | 2,411,138 | |
| | | | | | | | | | | | | | | | | | | | | | | | | | | | | | | | | | |
Short Term Investments—0.1% | | | | | | | | | | | | | | | | | | | | | | | | | | | | | | | | | | |
Goldman Sachs Financial Square Funds - Prime Obligations Fund, FST Preferred Shares(e)(u) | | | | | | | 0.01 | % | | | | | | | | | 1,142,000 | | | $ | | | | | 1,142 | | | $ | | | | | 1,142 | |
State Street Institutional Liquid Reserves Fund, Institutional Class | | (u) | | | | | 0.06 | % | | | | | | | | | 84,848 | | | | | | | | 85 | | | | | | | | 85 | |
Total Short Term Investments | | | | | | | | | | | | | | | | | | | | $ | | | | | 1,227 | | | $ | | | | | 1,227 | |
| | | | | | | | | | | | | | | | | | | | | | | | | | | | | | | | | | |
TOTAL INVESTMENTS — 122.4%(v) | | | | | | | | | | | | | | | | | | | | $ | | | | | 2,396,313 | | | $ | | | | | 2,412,365 | |
| | | | | | | | | | | | | | | | | | | | | | | | | | | | | | | | | | |
LIABILITIES IN EXCESS OF OTHER ASSETS—(22.4%) | | | | | | | | | | | | | | | | | | | | | | | | | | | | | | | | | (442,124 | ) |
| | | | | | | | | | | | | | | | | | | | | | | | | | | | | | | | | | |
NET ASSETS—100.0% | | | | | | | | | | | | | | | | | | | | | | | | | | | | $ | | | | | 1,970,241 | |
| | | | | | | | | | | | | | | | | | | | | | | | | | | | | | | | | | |
Collateral on Deposit with Custodian—3.2% | | | | | | | | | | | | | | | | | | | | | | | | | | | | | | | | | | |
Bank of Nova Scotia - Certificate of Deposit | | | | | | | 0.13 | % | | | | | 12/31/2014 | | | | 63,400 | | | $ | | | | | 63,400 | | | | | | | | 63,400 | |
Total Collateral on Deposit with Custodian | | | | | | | | | | | | | | | | | | $ | | | | | 63,400 | | | $ | | | | | 63,400 | |
| | | | | | | | | | | | | | | | | | | | | | | | | | | | | | | | | | |
Derivative Instruments (Note 4)—1.4% | | | | | | | | | | | | | | | | | | | | | | | | | | | | | | | | | | |
Foreign currency forward contracts | | (i) | | | | | N/A | | | | | | 10/2014-4/2017 | | | | | | | $ | | | | | — | | | $ | | | | | 27,838 | |
See notes to condensed consolidated financial statements.
10
Corporate Capital Trust, Inc. and Subsidiaries
Condensed Consolidated Schedule of Investments (unaudited) (continued)
As of September 30, 2014
(in thousands, except share amounts)
| | | | | | | | | | | | | | | | | | | | | | | | | | |
Company (a)(b) | | Footnotes | | |
Industry | | Interest
Rate | | | Base Rate
Floor | | Maturity
Date | | | No. Shares/
Principal
Amount (c) | |
Cost (d) | | |
Fair Value | |
Total return swaps | | | (i | )(k) | | | | | N/A | | | | | | 1/15/2016 | | | | | | — | | | | (1,019) | |
Total Derivative Instruments | | | | | | | | | | | | | | | | | | | | $ | — | | | $ | 26,819 | |
| | | | | | | | | | | | | | | | | | | | | | | | | | |
| * | Non-income producing security. |
| (a) | Security may be an obligation of one or more entities affiliated with the named company. |
| (b) | Non-Controlled/Non-Affiliate investments as defined by the Investment Company Act of 1940, as amended (“1940 Act”), unless otherwise indicated. Non-controlled/Non-Affiliate Investments are investments that are neither Controlled Investments nor Affiliate Investments. |
| (c) | Denominated in U.S. Dollars unless otherwise noted. |
| (d) | Represents amortized cost for debt securities and cost for common stocks translated to U.S. dollars. |
| (e) | Security or portion thereof is held within CCT Funding, LLC and is pledged as collateral supporting the amounts outstanding under the revolving credit facility with Deutsche Bank. |
| (f) | Position or portion thereof unsettled as of September 30, 2014. |
| (g) | The interest rate on these investments is subject to a base rate of 3-Month LIBOR, which at September 30, 2014 was 0.24%. The current base rate for each investment may be different from the reference rate on September 30, 2014. |
| (h) | A portfolio company domiciled in a foreign country. The jurisdiction of the security issuer may be a different country than the domicile of the portfolio company. |
| (i) | The investment is not a qualifying asset as defined in Section 55(a) under the 1940 Act. A business development company may not acquire any asset other than qualifying assets, unless, at the time the acquisition is made, qualifying assets represent at least 70% of the company’s total assets. The Company calculates its compliance with the qualifying assets test on a “look through” basis by disregarding the value of the Company’s total return swaps and treating each loan underlying the total return swaps as either a qualifying asset or non-qualifying asset based on whether the obligor is an eligible portfolio company. On this basis, 72.7% of the Company’s total assets represented qualifying assets as of September 30, 2014. |
| (j) | The interest rate on these investments contains a PIK provision, whereby the issuer has either the option or the obligation to make interest payments with the issuance of additional securities. The interest rate in the schedule represents the current interest rate in effect for these investments. The following table provides additional details on these PIK investments, including the maximum PIK interest rate allowed under the existing credit agreements. |
See notes to condensed consolidated financial statements.
11
Corporate Capital Trust, Inc. and Subsidiaries
Condensed Consolidated Schedule of Investments (unaudited) (continued)
As of September 30, 2014
(in thousands, except share amounts)
| | | | | | | | | | | | | | | | | | | | | | | | | | | | | | | | | | |
| | | | | | | | Nine Months Ended September 30, 2014 | | | | | | | | | | |
PIK Security Name | | Local
Currency | | Local Par
as of
December 31,
2013 | | | Local Par
Additions | | | Local Par
Capitalized
PIK | | | Local Par
Reductions | | | Local Par
as of
September 30,
2014 | | | Total
Current
Interest
Rate | | | Currant
PIK Rate | | | Maximum
Current
PIK Rate | |
Algeco/Scotsman - 15.75% PIK | | USD | | $ | 26,464 | | | $ | — | | | $ | 2,096 | | | $ | — | | | $ | 28,560 | | | | 15.75 | % | | | 15.75 | % | | | 15.75 | % |
Brake Bros Ltd. - L + 325, 3.00% PIK | | GBP | | | 8,650 | | | | — | | | | 173 | | | | — | | | | 8,823 | | | | L + 625 | | | | 3.00 | % | | | 3.00 | % |
Datatel, Inc. - 9.63% | | USD | | | 9,287 | | | | — | | | | — | | | | — | | | | 9,287 | | | | 9.63 | % | | | 0.00 | % | | | 10.38 | % |
Eagle Midco, Inc. - 9.00% | | USD | | | 39,815 | | | | 31,796 | | | | — | | | | (39,815 | ) | | | 31,796 | | | | 9.00 | % | | | 0.00 | % | | | 9.75 | % |
Education Management, LLC - 15.00%, 1.00% PIK | | USD | | | 1,299 | | | | | | | | — | | | | (1,299 | ) | | | — | | | | N/A | | | | N/A | | | | N/A | |
Education Management, LLC - 16.00% PIK | | USD | | | — | | | | 1,299 | | | | 104 | | | | — | | | | 1,403 | | | | 16.00 | % | | | 16.00 | % | | | 16.00 | % |
Excelitas Technologies Corp. - L + 975, 1.50% PIK | | USD | | | 107,355 | | | | — | | | | 1,226 | | | | — | | | | 108,581 | | | | L + 1125 | | | | 1.50 | % | | | 1.50 | % |
Global Closure Systems - 13.00% PIK | | EUR | | | 17,828 | | | | — | | | | 1,159 | | | | — | | | | 18,987 | | | | 13.00 | % | | | 13.00 | % | | | 13.00 | % |
Griffins Foods, Ltd. - 13.75% PIK | | NZD | | | 47,417 | | | | — | | | | 4,989 | | | | — | | | | 52,406 | | | | 13.75 | % | | | 13.75 | % | | | 13.75 | % |
Gruppo Argenta S.p.A. - 15.00% PIK | | EUR | | | — | | | | 635 | | | | 33 | | | | — | | | | 668 | | | | 15.00 | % | | | 15.00 | % | | | 15.00 | % |
Gruppo Argenta S.p.A. - 12.00% PIK | | EUR | | | — | | | | 21,459 | | | | 1,295 | | | | — | | | | 22,754 | | | | 12.00 | % | | | 12.00 | % | | | 12.00 | % |
Hilding Anders - 18.00% PIK | | EUR | | | — | | | | 7,046 | | | | — | | | | — | | | | 7,046 | | | | 18.00 | % | | | 18.00 | % | | | 18.00 | % |
Hilding Anders - 13.00% PIK | | EUR | | | 81,478 | | | | — | | | | 5,325 | | | | — | | | | 86,803 | | | | 13.00 | % | | | 13.00 | % | | | 13.00 | % |
Hilding Anders - 12.00% PIK | | EUR | | | — | | | | 15,739 | | | | — | | | | — | | | | 15,739 | | | | 12.00 | % | | | 12.00 | % | | | 12.00 | % |
Hot Topic, Inc. - 12.00% | | USD | | | 8,113 | | | | — | | | | — | | | | — | | | | 8,113 | | | | 12.00 | % | | | 0.00 | % | | | 12.75 | % |
Keystone Australia Holdings, Pty. Ltd. - 7.00%, 8.00% PIK | | AUD | | | — | | | | 36,858 | | | | 434 | | | | — | | | | 37,292 | | | | 15.00 | % | | | 8.00 | % | | | 8.00 | % |
Kurt Geiger Ltd. - 10.00%, 1.00% PIK | | GBP | | | — | | | | 46,625 | | | | — | | | | — | | | | 46,625 | | | | 11.00 | % | | | 1.00 | % | | | 1.00 | % |
New Enterprise Stone & Lime Co., Inc. - 6.00%, 7.00% PIK | | USD | | | 10,071 | | | | — | | | | 770 | | | | — | | | | 10,841 | | | | 13.00 | % | | | 7.00 | % | | | 11.00 | % |
OAG Holdings, LLC - 8.00%, 2.00% PIK | | USD | | | 20,008 | | | | — | | | | 305 | | | | — | | | | 20,313 | | | | 10.00 | % | | | 2.00 | % | | | 2.00 | % |
Pharmaceutical Product Development, Inc. - 9.38% | | USD | | | — | | | | 5,151 | | | | — | | | | — | | | | 5,151 | | | | 9.38 | % | | | 0.00 | % | | | 10.13 | % |
Stuart Weitzman, Inc. - 11.50% | | USD | | | — | | | | 56,918 | | | | — | | | | — | | | | 56,918 | | | | 11.50 | % | | | 0.00 | % | | | 12.50 | % |
The TelX Group, Inc. - 13.50% PIK | | USD | | | — | | | | 3,142 | | | | 97 | | | | — | | | | 3,239 | | | | 13.50 | % | | | 13.50 | % | | | 13.50 | % |
| (k) | Investments classified as Level 3 whereby fair value was determined by the Company’s Board of Directors (see Note 2). |
| (l) | The interest rate on these investments is subject to a base rate of 1-Month LIBOR, which at September 30, 2014 was 0.16%. The current base rate for each investment may be different from the reference rate on September 30, 2014. |
| (m) | The interest rate on these investments is subject to a base rate of 2 month Libor, which at September 30, 2014 was 0.20%. The current base rate for each investment may be different from the reference rate on September 30, 2014. |
| (n) | The interest rate on these investments is subject to a base rate of GBP Libor, which at September 30, 2014 was 0.48%. The current base rate for each investment may be different from the reference rate on September 30, 2014. |
| (o) | The interest rate on these investments is subject to a base rate of 6-Month LIBOR, which at September 30, 2014 was 0.33%. The current base rate for each investment may be different from the reference rate on September 30, 2014. |
See notes to condensed consolidated financial statements.
12
Corporate Capital Trust, Inc. and Subsidiaries
Condensed Consolidated Schedule of Investments (unaudited) (continued)
As of September 30, 2014
(in thousands, except share amounts)
| (p) | This security was acquired in a transaction that was exempt from the registration requirements of the Securities Act of 1933, as amended (the “Securities Act”), pursuant to Rule 144A thereunder. This security may be resold only in transactions that are exempt from the registration requirements of the Securities Act, normally to qualified institutional buyers. |
| (q) | Security or portion thereof is held within Paris Funding, LLC and is pledged as collateral supporting the amounts outstanding under the committed facility agreement with BNP Paribas Prime Brokerage, Inc. and eligible to be hypothecated as allowed under Rule 15c2-1(a)(1) of the Securities Exchange Act of 1934 (“Exchange Act”) subject to the limits of the Rehypothecation Agreement. |
| (r) | Investment was on non-accrual status as of September 30, 2014. |
| (s) | Controlled investment as defined by the 1940 Act, whereby the Company owns more than 25% of the portfolio company’s outstanding voting securities or maintains the ability to nominate greater than 50% of the board representation. The aggregate fair value of controlled investments at September 30, 2014 represented 0.1% of the Company’s net assets. Fair value as of December 31, 2013 and September 30, 2014 along with transactions during the nine months ended September 30, 2014 in these controlled investments were as follows (amounts in thousands): |
| | | | | | | | | | | | | | | | | | | | | | | | | | | | | | | | | | | | |
| | | | | | Nine Months Ended September 30, 2014 | | | | | | Nine Months Ended September 30, 2014 | |
Controlled Investments | | Fair Value at
December 31,
2013 | | | Gross
Additions
(Cost)* | | | Gross
Reductions
(Cost)** | | | Net
Unrealized
Gain (Loss) | | | Fair Value at
September 30,
2014 | | | Net Realized
Gain (Loss) | | | Interest
Income | | | Fee
Income | | | Dividend
Income | |
KKR BPT Holdings Aggregator, LLC | | | | | | | | | | | | | | | | | | | | | | | | | | | | | | | | | | | | |
Structured Product | | $ | 2,500 | | | $ | — | | | $ | — | | | $ | — | | | $ | 2,500 | | | $ | — | | | $ | — | | | $ | — | | | $ | — | |
| | | | | | | | | | | | | | | | | | | | | | | | | | | | | | | | | | | | |
Totals | | $ | 2,500 | | | $ | — | | | $ | — | | | $ | — | | | $ | 2,500 | | | $ | — | | | $ | — | | | $ | — | | | $ | — | |
| | | | | | | | | | | | | | | | | | | | | | | | | | | | | | | | | | | | |
| | * | Gross additions include increases in the cost basis of investments resulting from new portfolio investments, PIK interest, the amortization of unearned income, the exchange of one or more existing securities for one or more new securities and the movement of an existing portfolio company into this category from a different category. |
| | ** | Gross reductions include decreases in the cost basis of investments resulting from principal collections related to investment repayments or sales, the exchange of one or more existing securities for one or more new securities and the movement of an existing portfolio company out of this category into a different category. |
See notes to condensed consolidated financial statements.
13
Corporate Capital Trust, Inc. and Subsidiaries
Condensed Consolidated Schedule of Investments (unaudited) (continued)
As of September 30, 2014
(in thousands, except share amounts)
| (t) | Affiliated investment as defined by the 1940 Act, whereby the Company owns between 5% and 25% of the portfolio company’s outstanding voting securities and the investments are not classified as Controlled investments. The aggregate fair value of non-controlled, affiliated investments at September 30, 2014 represented 7.8% of the Company’s net assets. Fair value as of December 31, 2013 and September 30, 2014 along with transactions during the nine months ended September 30, 2014 in these Affiliated investments are as follows (amounts in thousands): |
| | | | | | | | | | | | | | | | | | | | | | | | | | | | | | | | | | | | |
| | | | | | Nine Months Ended September 30, 2014 | | | | | | Nine Months Ended September 30, 2014 | |
Non-controlled, Affiliated Investments | | Fair Value at
December 31,
2013 | | | Gross
Additions
(Cost)* | | | Gross
Reductions
(Cost)** | | | Net
Unrealized
Gain (Loss) | | | Fair Value at
September 30,
2014 | | | Net Realized
Gain (Loss) | | | Interest
Income | | | Fee
Income | | | Dividend
Income | |
AltEn, LLC | | | | | | | | | | | | | | | | | | | | | | | | | | | | |
Common Stock | | $ | - | | | $ | 2,955 | | | $ | - | | | $ | - | | | $ | 2,955 | | | $ | - | | | $ | - | | | $ | - | | | $ | - | |
Hilding Anders | | | | | | | | | | | | | | | | | | | | | | | | | | | | |
Subordinated Debt | | | - | | | | 111,459 | | | | - | | | | (2,581 | ) | | | 108,878 | | | | - | | | | 8,787 | | | | - | | | | - | |
Class A Common Stock | | | - | | | | 132 | | | | - | | | | 180 | | | | 312 | | | | - | | | | - | | | | - | | | | - | |
Class B Common Stock | | | - | | | | 25 | | | | - | | | | 33 | | | | 58 | | | | - | | | | - | | | | - | | | | - | |
Equity Options | | | - | | | | 14,988 | | | | - | | | | (1,406 | ) | | | 13,582 | | | | - | | | | - | | | | - | | | | - | |
Hyperion Homes, Inc. | | | | | | | | | | | | | | | | | | | | | | | | | | | | |
Common Stock | | | - | | | | 12,752 | | | | - | | | | - | | | | 12,752 | | | | - | | | | - | | | | - | | | | - | |
Warrants | | | - | | | | 53 | | | | - | | | | - | | | | 53 | | | | - | | | | - | | | | - | | | | - | |
Warrants Delivery Rights | | | - | | | | 36 | | | | - | | | | - | | | | 36 | | | | - | | | | - | | | | - | | | | - | |
Orchard Marine, Ltd. | | | | | | | | | | | | | | | | | | | | | | | | | | | | |
Class B Common Stock | | | - | | | | 3,069 | | | | - | | | | - | | | | 3,069 | | | | - | | | | - | | | | - | | | | - | |
Series A Preferred Stock | | | - | | | | 8,862 | | | | - | | | | - | | | | 8,862 | | | | - | | | | - | | | | - | | | | - | |
VSK Holdings, Ltd. | | | | | | | | | | | | | | | | | | | | | | | | | | | - | | | | - | |
Structured Product | | | 21,481 | | | | - | | | | (21,474 | ) | | | 3,073 | | | | 3,080 | | | | - | | | | - | | | | - | | | | 2,643 | |
| | | | | | | | | | | | | | | | | | | | | | | | | | | | | | | | | | | | |
Totals | | $ | 21,481 | | | $ | 154,331 | | | $ | (21,474 | ) | | $ | (701 | ) | | $ | 153,637 | | | $ | - | | | $ | 8,787 | | | $ | - | | | $ | 2,643 | |
| | | | | | | | | | | | | | | | | | | | | | | | | | | | | | | | | | | | |
| | * | Gross additions include increases in the cost basis of investments resulting from new portfolio investments, PIK interest, the amortization of unearned income, the exchange of one or more existing securities for one or more new securities and the movement of an existing portfolio company into this category from a different category. |
| | ** | Gross reductions include decreases in the cost basis of investments resulting from principal collections related to investment repayments or sales, the exchange of one or more existing securities for one or more new securities and the movement of an existing portfolio company out of this category into a different category. |
| (u) | 7-day effective yield as of September 30, 2014. |
| (v) | As of September 30, 2014, the aggregate gross unrealized appreciation for all securities in which there was an excess of value over tax cost was $50,904; the aggregate gross unrealized depreciation for all securities in which there was an excess of tax cost over value was $34,852; the net unrealized appreciation was $16,052; the aggregate cost of securities for Federal income tax purposes was $2,396,313. |
See notes to condensed consolidated financial statements.
14
Corporate Capital Trust, Inc. and Subsidiaries
Condensed Consolidated Schedule of Investments (unaudited) (continued)
As of September 30, 2014
(in thousands, except share amounts)
Abbreviations:
AUD - Australian Dollar; local currency investment amount is denominated in Australian Dollar. A$1 / US $0.873 as of September 30, 2014.
EUR - Euro; local currency investment amount is denominated in Euros. €1 / US $1.269 as of September 30, 2014.
GBP - British Pound Sterling; local currency investment amount is denominated in Pound Sterling. £1 / US $1.624 as of September 30, 2014.
NZD - New Zealand Dollar; local currency investment amount is denominated in New Zealand Dollars. N$1 / US $0.778 as of September 30, 2014.
SEK - Swedish Krona; local currency investment amount is denominated in Swedish Kronor. SEK1 / US $0.138 as of September 30, 2014.
CA - Canada
FR - France
IE - Ireland
KY - Cayman Islands
LU - Luxembourg
NL - The Netherlands
NZ - New Zealand
SE - Sweden
UK - United Kingdom
VG - British Virgin Islands
L = LIBOR - London Interbank Offered Rate, typically 3-Month
PIK - Payment-in-kind; the issuance of additional securities by the borrower to settle interest payment obligations.
See notes to condensed consolidated financial statements.
15
Corporate Capital Trust, Inc. and Subsidiaries
Consolidated Schedule of Investments
As of December 31, 2013
(in thousands, except share amounts)
| | | | | | | | | | | | | | | | | | | | | | | | | | |
Company (a)(b) | | Footnotes | | Industry | | Interest
Rate | | | EURIBOR /LIBOR
Floor | | Maturity
Date | | | No. Shares/
Principal
Amount (c) | | | Cost (d) | | | Fair Value | |
| |
Senior Secured Loans - First Lien—44.7% | | | | | | | | | | | | | | | | | | | | | | |
| |
Algeco/Scotsman (LU) | | (e)(f) | | Consumer Durables & Apparel | | | 15.75% PIK | | | | | | 5/1/2018 | | | | $ 26,464 | | | | $ 26,243 | | | | $ 27,787 | |
| |
Aspen Dental Management, Inc. | | (g) | | Health Care Equipment & Services | | | L + 550 | | | 1.50% | | | 10/6/2016 | | | | 6,053 | | | | 6,005 | | | | 6,008 | |
| |
Avaya, Inc. | | (g) | | Technology Hardware & Equipment | | | L + 675 | | | 1.25% | | | 3/31/2018 | | | | 33,909 | | | | 33,105 | | | | 34,468 | |
| |
Bluestem Brands, Inc. | | (g)(h) | | Consumer Durables & Apparel | | | L + 650 | | | 1.00% | | | 12/6/2018 | | | | 57,731 | | | | 55,422 | | | | 57,154 | |
| |
Catalina Marketing Corp. | | (g) | | Media | | | L + 425 | | | 1.00% | | | 10/12/2020 | | | | 5,215 | | | | 5,273 | | | | 5,295 | |
| |
Cemex S.A.B. de C.V. (MX) | | (e)(f) | | Materials | | | L + 450 | | | | | | 2/14/2017 | | | | 3,441 | | | | 3,222 | | | | 3,411 | |
| |
Cengage Learning Acquisitions, Inc. | | (g)(i) | | Media | | | L + 550 | | | | | | 7/5/2017 | | | | 2,701 | | | | 2,036 | | | | 2,119 | |
| |
Continental Building Products, LLC | | (g) | | Materials | | | L + 375 | | | 1.00% | | | 8/28/2020 | | | | 9,203 | | | | 9,159 | | | | 9,221 | |
| |
Data Device Corp. | | (g) | | Capital Goods | | | L + 650 | | | 1.50% | | | 7/11/2018 | | | | 10,873 | | | | 10,683 | | | | 10,900 | |
| |
Distribution International, Inc. | | | | Retailing | | | L + 650 | | | 1.00% | | | 7/16/2019 | | | | 48,387 | | | | 47,932 | | | | 48,174 | |
| |
Easton-Bell Sports, Inc. | | (j) | | Consumer Durables & Apparel | | | 11.50% | | | | | | 12/31/2015 | | | | 24,247 | | | | 24,259 | | | | 24,247 | |
| |
Flagstone Foods Holding Corp. | | (j) | | Food & Staples Retailing | | | L + 575 | | | 1.25% | | | 4/15/2018 | | | | 20,103 | | | | 19,916 | | | | 20,017 | |
| |
Football Association of Ireland (IE) | | (e)(f)(j)(EUR) | | Consumer Durables & Apparel | | | 6.20% | | | | | | 12/20/2020 | | | | € 44,390 | | | | 59,588 | | | | 59,843 | |
| |
Greenway Medical Technologies | | | | Health Care Equipment & Services | | | L + 500 | | | 1.00% | | | 11/4/2020 | | | | $ 20,413 | | | | 20,182 | | | | 20,413 | |
| |
Guitar Center, Inc. | | (g) | | Retailing | | | L + 600 | | | | | | 4/9/2017 | | | | 19,523 | | | | 19,111 | | | | 19,096 | |
| |
Internet Brands, Inc. | | | | Media | | | L + 500 | | | 1.25% | | | 3/18/2019 | | | | 31,792 | | | | 30,254 | | | | 31,991 | |
| |
iPayment, Inc. | | (g) | | Software & Services | | | L + 525 | | | 1.50% | | | 5/8/2017 | | | | 3,186 | | | | 3,134 | | | | 3,107 | |
| |
IPC Systems, Inc. | | (g) | | Technology Hardware & Equipment | | | L + 650 | | | 1.25% | | | 7/31/2017 | | | | 1,487 | | | | 1,455 | | | | 1,492 | |
| | (g) | | | | | L + 650 | | | 1.25% | | | 7/31/2017 | | | | 6,372 | | | | 6,270 | | | | 6,352 | |
| |
J. Jill | | (j) | | Retailing | | | L + 850 | | | 1.50% | | | 4/29/2017 | | | | 7,954 | | | | 7,954 | | | | 7,954 | |
| |
Jacuzzi Brands, Inc. (LU) | | (f)(j) | | Capital Goods | | | L + 650 | | | 1.25% | | | 7/3/2019 | | | | 41,938 | | | | 41,151 | | | | 41,854 | |
| |
KeyPoint Government Solutions, Inc. | | (j) | | Capital Goods | | | L + 600 | | | 1.25% | | | 11/13/2017 | | | | 31,383 | | | | 30,871 | | | | 31,383 | |
| |
MCS AMS Sub-Holdings, LLC | | | | Commercial & Professional Services | | | L + 600 | | | 1.00% | | | 10/15/2019 | | | | 50,455 | | | | 48,973 | | | | 48,879 | |
| |
North American Breweries Holdings, LLC | | | | Food, Beverage & Tobacco | | | L + 625 | | | 1.25% | | | 12/11/2018 | | | | 4,920 | | | | 4,836 | | | | 4,821 | |
| |
OpenLink Financial, Inc. | | | | Software & Services | | | L + 625 | | | 1.50% | | | 10/30/2017 | | | | 46 | | | | 46 | | | | 46 | |
| |
Sportsman’s Warehouse, Inc. | | (j) | | Retailing | | | L + 1075 | | | 1.25% | | | 8/20/2019 | | | | 23,654 | | | | 23,159 | | | | 23,760 | |
| | (j) | | | | | L + 600 | | | 1.25% | | | 8/20/2019 | | | | 40,211 | | | | 39,830 | | | | 40,593 | |
| |
Travelport, LLC | | (g) | | Software & Services | | | L + 500 | | | 1.25% | | | 6/26/2019 | | | | 5,416 | | | | 5,338 | | | | 5,565 | |
| |
Willbros United States Holding, Inc. | | (e) | | Energy | | | L + 975 | | | 1.25% | | | 8/5/2019 | | | | 33,614 | | | | 32,477 | | | | 34,118 | |
| |
Wilton Brands, LLC | | (g) | | Materials | | | L + 625 | | | 1.25% | | | 8/30/2018 | | | | 8,720 | | | | 8,573 | | | | 8,335 | |
| |
Total Senior Secured Loans - First Lien | | | | | | | | | | | | | | | | | | | | $ | 626,457 | | | $ | 638,403 | |
| | | | | | | | | | | | | | | | | | | | | | | | | | |
See notes to consolidated financial statements.
16
Corporate Capital Trust, Inc. and Subsidiaries
Consolidated Schedule of Investments (continued)
As of December 31, 2013
(in thousands, except share amounts)
| | | | | | | | | | | | | | | | | | | | | | | | | | |
Company (a)(b) | | Footnotes | | Industry | | Interest Rate | | | EURIBOR /LIBOR
Floor | | Maturity
Date | | | No. Shares/
Principal
Amount (c) | | | Cost (d) | | | Fair Value | |
| |
Senior Secured Loans - Second Lien—46.9% | | | | | | | | | | | | | | | | | | | | | | |
| |
American Casino & Entertainment Properties, LLC | | | | Consumer Services | | | L + 1000 | | | 1.25% | | | 1/3/2020 | | | | $ 1,832 | | | | $ 1,897 | | | | $ 1,915 | |
| |
Angelica Corp. | | (j) | | Health Care Equipment & Services | | | L + 875 | | | 1.25% | | | 7/15/2019 | | | | 50,869 | | | | 50,869 | | | | 50,512 | |
| |
Applied Systems, Inc. | | (g) | | Software & Services | | | L + 725 | | | 1.00% | | | 6/8/2017 | | | | 5,895 | | | | 5,969 | | | | 5,932 | |
| |
Arysta Lifescience SPC, LLC | | (e)(g) | | Food, Beverage & Tobacco | | | L + 700 | | | 1.25% | | | 11/30/2020 | | | | 16,305 | | | | 16,150 | | | | 16,606 | |
| |
Brake Bros Ltd. (UK) | | (e)(f)(GBP) | | Food & Staples Retailing | |
| L + 325, 3.00%
PIK |
| | | | | 3/12/2017 | | | | £ 8,650 | | | | 12,049 | | | | 13,661 | |
| |
CHG Companies, Inc. | | (g) | | Health Care Equipment & Services | | | L + 775 | | | 1.25% | | | 11/19/2020 | | | | $ 10,485 | | | | 10,363 | | | | 10,669 | |
| |
Continental Building Products, LLC | | (g)(h) | | Materials | | | L + 775 | | | 1.00% | | | 2/26/2021 | | | | 19,378 | | | | 19,509 | | | | 19,475 | |
| |
CSM Bakery Products | | (e) | | Food, Beverage & Tobacco | | | L + 750 | | | 1.00% | | | 7/3/2021 | | | | 15,175 | | | | 15,322 | | | | 15,336 | |
| |
CTI Foods Holding Co., LLC | | | | Food, Beverage & Tobacco | | | L + 725 | | | 1.00% | | | 6/28/2021 | | | | 23,219 | | | | 22,884 | | | | 23,451 | |
| |
Data Device Corp. | | | | Capital Goods | | | L + 1000 | | | 1.50% | | | 7/11/2019 | | | | 8,000 | | | | 7,864 | | | | 7,680 | |
| |
Excelitas Technologies Corp. | | (j) | | Technology Hardware & Equipment | |
| L + 975, 1.50%
PIK |
| | 1.00% | | | 4/29/2021 | | | | 107,355 | | | | 107,355 | | | | 107,033 | |
| |
EZE Castle Software, Inc. | | (g) | | Software & Services | | | L + 725 | | | 1.25% | | | 4/5/2021 | | | | 12,962 | | | | 12,922 | | | | 13,210 | |
| |
GENEX Services, Inc. | | (g) | | Health Care Equipment & Services | | | L + 825 | | | 1.00% | | | 1/26/2019 | | | | 21,029 | | | | 20,828 | | | | 21,266 | |
| |
Greenway Medical Technologies | | | | Health Care Equipment & Services | | | L + 825 | | | 1.00% | | | 11/4/2021 | | | | 26,396 | | | | 25,998 | | | | 26,660 | |
| |
Hudson’s Bay Co. (CA) | | (e)(f) | | Retailing | | | L + 725 | | | 1.00% | | | 11/4/2021 | | | | 2,933 | | | | 2,904 | | | | 3,039 | |
| |
Learfield Communications, Inc. | | | | Media | | | L + 775 | | | 1.00% | | | 10/8/2021 | | | | 4,743 | | | | 4,696 | | | | 4,861 | |
| |
Lightower Fiber, LLC | | (g) | | Telecommunication Services | | | L + 675 | | | 1.25% | | | 4/12/2021 | | | | 3,381 | | | | 3,349 | | | | 3,420 | |
| |
Misys Ltd. (UK) | | (e)(f)(g) | | Software & Services | | | 12.00% | | | | | | 6/12/2019 | | | | 3,000 | | | | 3,367 | | | | 3,463 | |
| |
Monarch (LU) | | (e)(f)(g) | | Materials | | | L + 700 | | | 1.25% | | | 4/3/2020 | | | | 5,416 | | | | 5,392 | | | | 5,576 | |
| |
NewWave Communications, Inc. | | | | Media | | | L + 800 | | | 1.00% | | | 10/30/2020 | | | | 8,339 | | | | 8,264 | | | | 8,506 | |
| |
P2 Energy Solutions, Inc. | | | | Software & Services | | | L + 800 | | | 1.00% | | | 4/30/2021 | | | | 9,283 | | | | 9,191 | | | | 9,469 | |
| |
Packaging Coordinators, Inc. | | (j) | | Materials | | | L + 825 | | | 1.25% | | | 10/31/2020 | | | | 11,827 | | | | 11,716 | | | | 11,886 | |
| |
Polyconcept Finance BV (NL) | | (e)(f)(j) | | Consumer Durables & Apparel | | | L + 875 | | | 1.25% | | | 6/28/2020 | | | | 46,727 | | | | 46,727 | | | | 45,886 | |
| |
Progressive Solutions | | (h) | | Health Care Equipment & Services | | | L + 850 | | | 1.00% | | | 10/22/2021 | | | | 19,903 | | | | 19,704 | | | | 20,002 | |
| |
RedPrairie Corp. | | (g) | | Software & Services | | | L + 1000 | | | 1.25% | | | 12/21/2019 | | | | 18,150 | | | | 18,169 | | | | 18,691 | |
| |
Sabine Oil & Gas, LLC | | (e)(g) | | Energy | | | L + 750 | | | 1.25% | | | 12/31/2018 | | | | 14,527 | | | | 14,400 | | | | 14,708 | |
| |
Safety Technology Holdings, Inc. | | (j) | | Technology Hardware & Equipment | | | L + 825 | | | 1.25% | | | 6/2/2020 | | | | 30,402 | | | | 29,651 | | | | 29,642 | |
| |
Sedgwick Claims Management Services Holdings, Inc. | | | | Insurance | | | L + 700 | | | 1.00% | | | 12/15/2018 | | | | 25,735 | | | | 25,615 | | | | 26,217 | |
| |
See notes to consolidated financial statements.
17
Corporate Capital Trust, Inc. and Subsidiaries
Consolidated Schedule of Investments (continued)
As of December 31, 2013
(in thousands, except share amounts)
| | | | | | | | | | | | | | | | | | | | | | | | | | |
| Company (a)(b) | | Footnotes | | Industry | | Interest Rate | | | EURIBOR /LIBOR
Floor | | Maturity
Date | | | No. Shares/
Principal
Amount (c) | | | Cost (d) | | | Fair Value | |
| |
Sheridan Holdings, Inc. | | (h) | | Health Care Equipment & Services | | | L + 725 | | | 1.00% | | | 12/13/2021 | | | | $ 13,899 | | | | $ 13,830 | | | | $ 14,030 | |
| |
StoneRiver Holdings, Inc. | | | | Insurance | | | L + 725 | | | 1.25% | | | 5/30/2020 | | | | 15,860 | | | | 15,782 | | | | 16,029 | |
| |
Talbots, Inc. | | (j) | | Retailing | | | L + 800 | | | 1.25% | | | 8/30/2018 | | | | 50,000 | | | | 50,000 | | | | 50,450 | |
| |
Travelport, LLC | | (g) | | Software & Services | | | L + 800 | | | 1.50% | | | 1/31/2016 | | | | 18,868 | | | | 18,533 | | | | 19,582 | |
| |
Websense, Inc. | | | | Technology Hardware & Equipment | | | L + 725 | | | 1.00% | | | 12/24/2020 | | | | 32,018 | | | | 31,866 | | | | 32,098 | |
| |
Total Senior Secured Loans - Second Lien | | | | | | | | | | | | | | | | $ | 663,135 | | | $ | 670,961 | |
| | | | | | | | | | | | | | | | | | | | | | | | | | |
Senior Secured Bonds—11.5% | | | | | | | | | | | | | | | | | | | | | | |
| |
Allen Systems Group, Inc. | | (k)(l) | | Software & Services | | | 10.50% | | | | | | 11/15/2016 | | | | 106 | | | | 73 | | | | 57 | |
| |
American Rock Salt Co., LLC | | (k)(l) | | Materials | | | 8.25% | | | | | | 5/1/2018 | | | | 9,690 | | | | 9,051 | | | | 9,763 | |
| |
Artesyn Technologies, Inc. | | (e)(k) | | Technology Hardware & Equipment | | | 9.75% | | | | | | 10/15/2020 | | | | 3,567 | | | | 3,567 | | | | 3,745 | |
| |
Avaya, Inc. | | (g)(k) | | Technology Hardware & Equipment | | | 7.00% | | | | | | 4/1/2019 | | | | 3,722 | | | | 3,436 | | | | 3,648 | |
| | (k) | | | | | 9.00% | | | | | | 4/1/2019 | | | | 7,048 | | | | 7,035 | | | | 7,365 | |
| |
Cengage Learning Acquisitions, Inc. | | (i)(k)(l) | | Media | | | 11.50% | | | | | | 4/15/2020 | | | | 12,154 | | | | 12,398 | | | | 9,738 | |
| |
Hot Topic, Inc. | | (k)(l) | | Consumer Durables & Apparel | | | 9.25% | | | | | | 6/15/2021 | | | | 27,300 | | | | 27,464 | | | | 28,597 | |
| |
Louisiana Public Facilities Authority | | (j) | | Energy | | | 11.50% | | | | | | 1/1/2020 | | | | 50,580 | | | | 49,070 | | | | 49,063 | |
| |
New Enterprise Stone & Lime Co., Inc. | | (l) | | Capital Goods | |
| 5.00%, 8.00%
PIK |
| | | | | 3/15/2018 | | | | 10,071 | | | | 10,162 | | | | 11,381 | |
| |
OAG Holdings, LLC | | (e)(j) | | Energy | |
| 8.00%, 2.00%
PIK |
| | | | | 12/20/2020 | | | | 20,008 | | | | 17,163 | | | | 17,153 | |
| |
Pinnacle Agriculture Holdings, LLC | | (k)(l) | | Materials | | | 9.00% | | | | | | 11/15/2020 | | | | 2,193 | | | | 2,193 | | | | 2,327 | |
| |
Ryerson, Inc. | | (g) | | Materials | | | 9.00% | | | | | | 10/15/2017 | | | | 5,814 | | | | 5,814 | | | | 6,163 | |
| |
SquareTwo Financial Corp. | | (l) | | Banks | | | 11.63% | | | | | | 4/1/2017 | | | | 6,309 | | | �� | 6,566 | | | | 6,522 | |
| |
Wise Metals Group, LLC | | (k)(l) | | Materials | | | 8.75% | | | | | | 12/15/2018 | | | | 2,148 | | | | 2,148 | | | | 2,261 | |
| |
Xella Holdco Finance SA (LU) | | (e)(f)(k)(l)(EUR) | | Materials | |
| 9.13% or
9.88% PIK |
| | | | | 9/15/2018 | | | | € 5,097 | | | | 6,860 | | | | 7,345 | |
| |
Total Senior Secured Bonds | | | | | | | | | | | | | | | | $ | 163,000 | | | $ | 165,128 | |
| | | | | | | | | | | | | | | | | | | | | | | | | | |
Total Senior Debt—103.1% | | | | | | | | | | | | | | | | $ | 1,452,592 | | | $ | 1,474,492 | |
| | | | | | | | | | | | | | | | | | | | | | | | | | |
Subordinated Debt—25.9% | | | | | | | | | | | | | | | | | | | | | | |
| |
Algeco/Scotsman (LU) | | (e)(f)(k)(l) | | Consumer Durables & Apparel | | | 10.75% | | | | | | 10/15/2019 | | | | $ 179 | | | $ | 181 | | | $ | 189 | |
| |
CDW Corp. | | (e) | | Technology Hardware & Equipment | | | 12.54% | | | | | | 10/12/2017 | | | | 1,879 | | | | 1,986 | | | | 1,964 | |
| |
Cemex Materials, LLC | | (k)(l) | | Materials | | | 7.70% | | | | | | 7/21/2025 | | | | 23,312 | | | | 22,941 | | | | 24,128 | |
| |
Cequel Communications Holdings, LLC | | (k)(l) | | Media | | | 5.13% | | | | | | 12/15/2021 | | | | 5,000 | | | | 4,834 | | | | 4,688 | |
| |
See notes to consolidated financial statements.
18
Corporate Capital Trust, Inc. and Subsidiaries
Consolidated Schedule of Investments (continued)
As of December 31, 2013
(in thousands, except share amounts)
| | | | | | | | | | | | | | | | | | | | | | | | | | |
| Company (a)(b) | | Footnotes | | Industry | | Interest Rate | | | EURIBOR /LIBOR
Floor | | Maturity
Date | | | No. Shares/
Principal
Amount (c) | | | Cost (d) | | | Fair Value | |
| |
Ceridian Corp. | | (l) | | Commercial & Professional Services | | | 11.00% | | | | | | 3/15/2021 | | | | $ 16,201 | | | | $ 17,574 | | | | $ 18,672 | |
| |
Commscope, Inc. | | (k)(l) | | Technology Hardware & Equipment | |
| 6.63% or
7.38% PIK |
| | | | | 6/1/2020 | | | | 5,000 | | | | 4,976 | | | | 5,200 | |
| |
CompuCom Systems, Inc. | | (k)(l) | | Software & Services | | | 7.00% | | | | | | 5/1/2021 | | | | 9,847 | | | | 9,566 | | | | 9,773 | |
| |
ConvaTec Healthcare E SA (LU) | | (e)(f)(k)(l) | | Health Care Equipment & Services | |
| 8.25% or
9.00% PIK |
| | | | | 1/15/2019 | | | | 2,545 | | | | 2,521 | | | | 2,605 | |
| |
CRC Health Group, Inc. | | (l) | | Health Care Equipment & Services | | | 10.75% | | | | | | 2/1/2016 | | | | 6,021 | | | | 6,047 | | | | 6,036 | |
| |
Datatel, Inc. | | (g)(k) | | Software & Services | |
| 9.63% or 9.63%
PIK |
| | | | | 12/1/2018 | | | | 9,287 | | | | 9,195 | | | | 9,566 | |
| |
Education Management, LLC | | (e) | | Consumer Services | | | 15.00% | | | | | | 7/1/2018 | | | | 1,299 | | | | 1,307 | | | | 1,409 | |
| |
Epicor Software Corp. | | (k)(l) | | Software & Services | |
| 9.00% or
9.75% PIK |
| | | | | 6/15/2018 | | | | 39,815 | | | | 39,090 | | | | 41,507 | |
| |
GCI, Inc. | | (l) | | Telecommunication Services | | | 8.63% | | | | | | 11/15/2019 | | | | 8,575 | | | | 9,041 | | | | 9,111 | |
| | (l) | | | | | 6.75% | | | | | | 6/1/2021 | | | | 14,381 | | | | 13,737 | | | | 13,770 | |
| |
Genesys Telecommunications Laboratories, Inc. | | (j)(EUR) | | Software & Services | | | 12.50% | | | | | | 1/31/2020 | | | | € 2,044 | | | | 2,637 | | | | 2,924 | |
| |
Global Closure Systems (FR) | | (e)(f)(j)(EUR) | | Materials | |
| 12.00% or
13.00% PIK |
| | | | | 11/15/2019 | | | | 17,828 | | | | 23,443 | | | | 25,140 | |
| |
Griffins Foods, Ltd. (NZ) | | (e)(f)(j)(NZD) | | Food, Beverage & Tobacco | | | 13.75% PIK | | | | | | 1/31/2019 | | | | N$ 47,417 | | | | 36,916 | | | | 39,035 | |
| |
Gymboree Corp. | | (l) | | Retailing | | | 9.13% | | | | | | 12/1/2018 | | | | $ 3,335 | | | | 3,199 | | | | 3,072 | |
| |
Hilding Anders (SE) | | (e)(f)(j)(EUR) | | Consumer Durables & Apparel | |
| 12.00% or
13.00% PIK |
| | | | | 6/30/2021 | | | | € 81,478 | | | | 95,634 | | | | 98,974 | |
| |
Hot Topic, Inc. | | (k)(l) | | Consumer Durables & Apparel | |
| 12.00% or
12.75% PIK |
| | | | | 5/15/2019 | | | | $ 8,113 | | | | 7,951 | | | | 8,032 | |
| |
iPayment, Inc. | | | | Software & Services | | | 10.25% | | | | | | 5/15/2018 | | | | 4,634 | | | | 4,289 | | | | 3,800 | |
| |
JC Penney Corp., Inc. | | (e) | | Retailing | | | 5.65% | | | | | | 6/1/2020 | | | | 11,139 | | | | 8,338 | | | | 8,744 | |
| |
Summit Materials, LLC | | (l) | | Materials | | | 10.50% | | | | | | 1/31/2020 | | | | 462 | | | | 518 | | | | 508 | |
| |
The TelX Group, Inc. | | (j)(k) | | Telecommunication Services | |
| 12.00% or
10.00%, 2.00%
PIK |
| | | | | 9/26/2019 | | | | 5,517 | | | | 5,952 | | | | 5,848 | |
| |
Towergate Finance PLC (UK) | | (e)(f)(k)(l)(GBP) | | Insurance | | | 10.50% | | | | | | 2/15/2019 | | | | £ 14,608 | | | | 23,366 | | | | 25,436 | |
| |
Total Subordinated Debt | | | | | | | | | | | | | | | | | $ 355,239 | | | | $ 370,131 | |
| | | | | | | | | | | | | | | | | | | | | | | | | | |
Structured Products—3.9% | | | | | | | | | | | | | | | | | | | | | | |
| |
KKR BPT Holdings Aggregator, LLC | | (e)(j)(q)* | | Diversified Financials | | | | | | | | | | | | | $ 2,500 | | | | 2,500 | | | | 2,500 | |
| |
Start CLO Ltd. 2010-6A Class A (KY) | | (e)(f)(j)(k)(m) | | Diversified Financials | | | L + 1600 | | | | | | 4/1/2014 | | | | 3,310 | | | | 3,325 | | | | 3,359 | |
| |
Trade Finance Funding I, Ltd. 2013-1A Class B | | (e)(j)(k) | | Diversified Financials | | | 10.75% | | | | | | 11/13/2018 | | | | 28,221 | | | | 28,221 | | | | 28,235 | |
| |
VSK Holdings, Ltd. (KY) | | (e)(f)(j)(p)* | | Diversified Financials | | | | | | | | | | | | | 620 | | | | 21,474 | | | | 21,481 | |
| |
Total Structured Products | | | | | | | | | | | | | | | | | | | | | $ 55,520 | | | | $ 55,575 | |
| | | | | | | | | | | | | | | | | | | | | | | | | | |
See notes to consolidated financial statements.
19
Corporate Capital Trust, Inc. and Subsidiaries
Consolidated Schedule of Investments (continued)
As of December 31, 2013
(in thousands, except share amounts)
| | | | | | | | | | | | | | | | | | | | | | | | | | |
| Company (a)(b) | | Footnotes | | Industry | | Interest Rate | | | EURIBOR /LIBOR
Floor | | Maturity
Date | | | No. Shares/
Principal
Amount (c) | | | Cost (d) | | | Fair Value | |
| |
Equity / Other—1.7% | | | | | | | | | | | | | | | | | | | | | | |
| |
Excelitas Technologies Corp., Common Stock | | (j)* | | Technology Hardware & Equipment | | | | | | | | | | | | | 5,636,153 | | | $ | 5,636 | | | $ | 5,566 | |
| |
Genesys Telecommunications Laboratories, Inc., Common Stock | | (j)* | | Software & Services | | | | | | | | | | | | | 448,908 | | | | 449 | | | | 672 | |
| |
Global Closure Systems (FR), Common Stock | | (e)(f)(j)* | | Materials | | | | | | | | | | | | | 597,989 | | | | 823 | | | | 823 | |
| |
Hilding Anders (SE), Equity Options | | (e)(f)(j)* | | Consumer Durables & Apparel | | | | | | | | | 12/31/2020 | | | | 236,160,807 | | | | 14,988 | | | | 15,256 | |
| |
OAG Holdings, LLC, Overriding Royalty Interest | | (e)(j)* | | Energy | | | | | | | | | | | | | 2,353,940 | | | | 2,354 | | | | 2,354 | |
| |
Total Equity / Other | | | | | | | | | | | | | | | | | | $ | 24,250 | | | $ | 24,671 | |
| | | | | | | | | | | | | | | | | | | | | | | | | | |
Total Investments, excluding Short Term Investments – 134.6% | | | | | | | | | | | | | | | | $ | 1,887,601 | | | $ | 1,924,869 | |
| | | | | | | | | | | | | | | | | | | | | | | | | | |
| | | | | | |
Short Term Investments—10.5% | | | | | | | | | | | | | | | | | | | | | | |
| |
Goldman Sachs Financial Square Funds - Prime Obligations Fund, FST Preferred Shares | | (g)(n) | | | | | 0.01% | | | | | | | | | | 149,800,957 | | | $ | 149,801 | | | $ | 149,801 | |
State Street Institutional Liquid Reserves Fund, Institutional Class | | (n) | | | | | 0.06% | | | | | | | | | | 102,061 | | | | 102 | | | | 102 | |
| |
Total Short Term Investments | | | | | | | | | | | | | | | | $ | 149,903 | | | $ | 149,903 | |
| | | | | | | | | | | | | | | | | | | | | | | | | | |
TOTAL INVESTMENTS — 145.1%(o) | | | | | | | | | | | | | | | | | | | | $ | 2,037,504 | | | | 2,074,772 | |
| | | | | | | | | | | | | | | | | | | | | | | | | | |
LIABILITIES IN EXCESS OF OTHER ASSETS—(45.1%) | | | | | | | | | | | | | | | | | | | | | | | | | (644,338 | ) |
| | | | | | | | | | | | | | | | | | | | | | | | | | |
NET ASSETS—100.0% | | | | | | | | | | | | | | | | | | | | | | | | $ | 1,430,434 | |
| | | | | | | | | | | | | | | | | | | | | | | | | | |
Collateral on Deposit with Custodian—2.6% | | | | | | | | | | | | | | | | | | | | | | |
| |
Bank of Nova Scotia - Certificate of Deposit | | | | | | | 0.16% | | | | | | 3/31/2014 | | | | $ 37,501 | | | $ | 37,501 | | | $ | 37,501 | |
| |
Total Collateral on Deposit with Custodian | | | | | | | | | | | | | | | | $ | 37,501 | | | $ | 37,501 | |
| | | | | | | | | | | | | | | | | | | | | | | | | | |
| | | | | | |
Derivative Instruments—(0.1%) | | | | | | | | | | | | | | | | | | | | | | |
| |
Foreign currency forward contracts | | (e) | | | | | N/A | | | | |
| 1/2014 -
1/2015 |
| | | | | | $ | — | | | $ | (3,181 | ) |
Total return swaps | | (e)(j) | | | | | N/A | | | | | | 1/15/2016 | | | | | | | | — | | | | 1,861 | |
| |
Total Derivative Instruments | | | | | | | | | | | | | | | | $ | — | | | $ | (1,320 | ) |
| | | | | | | | | | | | | | | | | | | | | | | | | | |
| * | Non-income producing security. |
| (a) | Security may be an obligation of one or more entities affiliated with the named company. |
See notes to consolidated financial statements.
20
Corporate Capital Trust, Inc. and Subsidiaries
Consolidated Schedule of Investments (continued)
As of December 31, 2013
(in thousands, except share amounts)
| (b) | Non-Controlled/Non-Affiliate investments as defined by the Investment Company Act of 1940, as amended (“1940 Act”), unless otherwise indicated. Non-Controlled/Non-Affiliate Investments are investments that are neither Control Investments nor Affiliate Investments. |
| (c) | Denominated in U.S. Dollars unless otherwise noted. |
| (d) | Represents amortized cost for debt securities and cost for common stocks translated to U.S. dollars. |
| (e) | The investment is not a qualifying asset as defined in Section 55(a) under the Investment Company Act of 1940, as amended, or the 1940 Act. A business development company may not acquire any asset other than qualifying assets, unless, at the time the acquisition is made, qualifying assets represent at least 70% of the company’s total assets. The Company calculates its compliance with the qualifying assets test on a “look through” basis by disregarding the value of the Company’s total return swaps and treating each loan underlying the total return swaps as either a qualifying asset or non-qualifying asset based on whether the obligor is an eligible portfolio company. On this basis, 75.8% of the Company’s total assets represented qualifying assets as of December 31, 2013. |
| (f) | A portfolio company domiciled in a foreign country. The jurisdiction of the security issuer may be in a different country than the domicile of the portfolio company. |
| (g) | Security or portion thereof is held within CCT Funding, LLC and is pledged as collateral supporting the amounts outstanding under the revolving credit facility with Deutsche Bank. |
| (h) | Position or portion thereof unsettled as of December 31, 2013. |
| (i) | Investment was on non-accrual status as of December 31, 2013. |
| (j) | Investments classified as Level 3 whereby fair value was determined by the Company’s Board of Directors (see Note 2). |
| (k) | This security was acquired in a transaction that was exempt from the registration requirements of the Securities Act of 1933, as amended (the “Securities Act”), pursuant to Rule 144A thereunder. This security may be resold only in transactions that are exempt from the registration requirements of the Securities Act, normally to qualified institutional buyers. |
| (l) | Security or portion thereof is held within Paris Funding, LLC and is pledged as collateral supporting the amounts outstanding under the committed facility agreement with BNP Paribas Prime Brokerage, Inc. and eligible to be hypothecated as allowed under Rule 15c2-1(a)(1) of the Exchange Act subject to the limits of the Rehypothecation Agreement. |
| (m) | A portfolio company investment structured as a credit-linked floating rate note. |
| (n) | 7-day effective yield as of December 31, 2013. |
| (o) | As of December 31, 2013, the aggregate gross unrealized appreciation for all securities in which there was an excess of value over tax cost was $43,062; the aggregate gross unrealized depreciation for all securities in which there was an excess of tax cost over value was $5,918; the net unrealized appreciation was $37,144; the aggregate cost of securities for Federal income tax purposes was $2,037,628. |
| (p) | Affiliated investment as defined by the 1940 Act, whereby the Company owns between 5% and 25% of the portfolio company’s outstanding voting securities and the investments are not classified as Controlled investments. The aggregate fair value of non-controlled, affiliated investments at December 31, 2013 represents 1.5% of the Company’s net assets. Fair value as of December 31, 2012 and 2013 along with transactions during the year ended December 31, 2013 in these Affiliated investments are as follows (amounts in thousands): |
| | | | | | | | | | | | | | | | | | | | | | | | | | | | | | | | | | | | |
| | | Fair Value at
December 31,
2012 | | | Year Ended December 31, 2013 | | | Fair Value at
December 31,
2013 | | | Year Ended December 31, 2013 | |
| | | | Gross
Additions
(Cost)* | | | Gross
Reductions
(Cost)** | | | Net Unrealized
Gain (Loss) | | | |
Non-controlled, Affiliated Investments | | | | | | | Net Realized
Gain (Loss) | | | Interest Income | | | Fee Income | | | Dividend Income | |
VSK Holdings, Ltd. Structured Product | | $ | — | | | $ | 21,474 | | | $ | — | | | $ | 7 | | | $ | 21,481 | | | $ | — | | | $ | — | | | $
| —
|
| | $ | — | |
| | | | | | | | | | | | | | | | | | | | | | | | | | | | | | | | | | | | |
Totals | | $ | — | | | $ | 21,474 | | | $ | — | | | $ | 7 | | | $ | 21,481 | | | $ | — | | | $ | — | | | $ | — | | | $ | — | |
| | | | | | | | | | | | | | | | | | | | | | | | | | | | | | | | | | | | |
| | * | Gross additions include increases in the cost basis of investments resulting from new portfolio investments, PIK interest, the amortization of unearned income, the exchange of one or more existing securities for one or more new securities and the movement of an existing portfolio company into this category from a different category. |
| | ** | Gross reductions include decreases in the cost basis of investments resulting from principal collections related to investment repayments or sales, the exchange of one or more existing securities for one or more new securities and the movement of an existing portfolio company out of this category into a different category. |
| (q) | Controlled investment as defined by the 1940 Act, whereby the Company owns more than 25% of the portfolio company’s outstanding voting securities or maintains the ability to nominate greater than 50% of the board representation. The aggregate fair value of controlled at December 31, 2013 represents 0.2% of the Company’s net assets. Fair value as of December 31, 2012 and 2013 along with transactions during the year ended December 31, 2013 in these Controlled investments are as follows (amounts in thousands): |
| | | | | | | | | | | | | | | | | | | | | | | | | | | | | | | | | | | | |
| | | Fair Value at
December 31,
2012 | | | Year Ended December 31, 2013 | | | Fair Value at
December 31, 2013 | | | Year Ended December 31, 2013 | |
| | | | Gross
Additions
(Cost)* | | | Gross
Reductions
(Cost)** | | | Net Unrealized
Gain (Loss) | | | |
Controlled Investments | | | | | | | Net Realized
Gain (Loss) | | | Interest Income | | | Fee Income | | | Dividend Income | |
KKR BPT Holdings Aggregator, LLC Structured Product | | $ | — | | | $ | 2,500 | | | $ | — | | | $ | — | | | $ | 2,500 | | | $ | — | | | $ | — | | | $ | — | | | $ | — | |
| | | | | | | | | | | | | | | | | | | | | | | | | | | | | | | | | | | | |
Totals | | $ | — | | | $ | 2,500 | | | $ | — | | | $ | — | | | $ | 2,500 | | | $ | — | | | $ | — | | | $ | — | | | $ | — | |
| | | | | | | | | | | | | | | | | | | | | | | | | | | | | | | | | | | | |
| | * | Gross additions include increases in the cost basis of investments resulting from new portfolio investments, PIK interest, the amortization of unearned income, the exchange of one or more existing securities for one or more new securities and the movement of an existing portfolio company into this category from a different category. |
| | ** | Gross reductions include decreases in the cost basis of investments resulting from principal collections related to investment repayments or sales, the exchange of one or more existing securities for one or more new securities and the movement of an existing portfolio company out of this category into a different category. |
Abbreviations:
EUR - Euro; loan principal amount is denominated in Euros currency. €1 / US $1.377 as of December 31, 2013.
GBP - British Pound Sterling; loan principal amount is denominated in Pound Sterling. £1 / US $1.649 as of December 31, 2013.
NZD - New Zealand Dollar; loan principal amount is denominated in New Zealand Dollars. N$1 / US $0.816 as of December 31, 2013.
CA - Canada
FR - France
IE - Ireland
KY - Cayman Islands
LU - Luxembourg
MX - Mexico
NL - The Netherlands
NZ - New Zealand
SE - Sweden
SG - Singapore
UK - United Kingdom
L = LIBOR - London Interbank Offered Rate, typically 3-Month
PIK - Payment-in-kind; the issuance of additional securities by the borrowers to settle interest payment obligations.
See notes to consolidated financial statements.
21
CORPORATE CAPITAL TRUST, INC. AND SUBSIDIARIES
Notes to Condensed Consolidated Financial Statements (unaudited)
1. Principal Business and Organization
Corporate Capital Trust, Inc. (the “Company”) was incorporated under the general corporation laws of the State of Maryland on June 9, 2010. The Company is a non-diversified closed-end management investment company and it is regulated as a business development company (“BDC”) under the Investment Company Act of 1940 (the “40 Act”). The Company’s investment objective is to provide its shareholders with current income and, to a lesser extent, long-term capital appreciation, by investing primarily in the debt of privately owned U.S. companies with a focus on originated transactions sourced through the networks of its advisors. The Company commenced business operations on June 17, 2011 and it commenced investment operations on July 1, 2011. The Company has elected to be treated as a regulated investment company (“RIC”) under the Internal Revenue Code of 1986, as amended (the “Code”) and operates in a manner so as to qualify for the tax treatment applicable to RICs.
The Company is externally managed by CNL Fund Advisors Company (“CNL”) and KKR Credit Advisors (US) LLC, formerly known as KKR Asset Management LLC (“KKR”), (collectively, the “Advisors”), which are responsible for sourcing potential investments, analyzing and conducting due diligence on prospective investment opportunities, structuring investments and ongoing monitoring of the Company’s investment portfolio. Both Advisors are registered as investment advisers with the Securities and Exchange Commission (“SEC”). CNL also provides the administrative services necessary for the Company to operate.
The Company sold approximately 141 million shares of common stock through its initial continuous public offering (the “Initial Offering”). The Company is currently offering and selling shares of its common stock pursuant to a registration statement on Form N-2 (Registration No. 333-189544) (the “Follow-On Registration Statement”) covering its follow-on continuous public offering of up to 209 million shares of common stock for an approximate maximum offering amount of $2.3 billion (the “Follow-On Offering”). Initial Offering and Follow-On Offering are collectively referred to as the “Offerings.”
As of September 30, 2014, the Company had three wholly owned financing subsidiaries. CCT Funding LLC (“CCT Funding”) and Paris Funding LLC (“Paris Funding”) were established on July 15, 2011 and August 13, 2013, respectively, both of which are special purpose financing subsidiaries organized for the purpose of arranging secured, revolving credit facilities with banks and borrowing money to invest in portfolio companies. Halifax Funding LLC (“Halifax Funding”) was established on October 11, 2012 as a special purpose financing subsidiary for the purpose of entering into total return swaps (“TRS”). The Company has also formed FCF LLC and CCT Holdings LLC, taxable subsidiaries (the “Taxable Subsidiaries”), which are taxed as corporations for federal income tax purposes. The purpose of the Taxable Subsidiaries is to hold equity securities of portfolio companies organized as pass-through entities for U.S. tax purposes.
2. Significant Accounting Policies
Basis of Presentation and Principles of Consolidation - The accompanying financial statements of the Company are prepared in accordance with the instructions to Form 10-Q and accounting principles generally accepted in the United States of America (“GAAP”). The unaudited condensed consolidated financial statements reflect all normal recurring adjustments, which are, in the opinion of management, necessary for the fair presentation of the Company’s results for the interim periods presented. The results of operations for interim periods are not indicative of results to be expected for the full year.
Amounts as of December 31, 2013 included in the unaudited condensed consolidated financial statements have been derived from the audited consolidated financial statements as of that date. Certain financial information that is normally included in annual financial statements, including certain financial statement footnotes, prepared in accordance with GAAP, is not required for interim reporting purposes and has been condensed or omitted herein. These financial statements should be read in conjunction with the Company’s financial statements and notes related thereto included in the Company’s Annual Report on Form 10-K for the year ended December 31, 2013, which was filed with the SEC on March 20, 2014. The condensed consolidated financial statements include the accounts of the Company and its wholly owned subsidiaries.
Use of Estimates- The preparation of condensed consolidated financial statements in conformity with GAAP requires management to make estimates and assumptions that affect (i) the reported amounts of assets and liabilities at the date of the condensed consolidated financial statements, (ii) the reported amounts of income and expenses during the reported period and (iii) disclosure of contingent assets and liabilities at the date of the condensed consolidated financial statements. Actual results could differ from those estimates.
Cash and Cash Equivalents - Cash and cash equivalents consist of demand deposits, foreign currency, and highly liquid investments with original maturities of three months or less.
22
Valuation of Investments - The Company measures the value of its investments in accordance with Accounting Standards Codification Topic 820, Fair Value Measurements and Disclosure (“ASC Topic 820”), issued by the Financial Accounting Standards Board (“FASB”). Fair value is the price that would be received to sell an asset or paid to transfer a liability in an orderly transaction between market participants at the measurement date. Market participants are defined as buyers and sellers in the principal or most advantageous market (which may be a hypothetical market) that are independent, knowledgeable, and willing and able to transact. In accordance with ASC Topic 820, the Company considers its principal market to be the market that has the greatest volume and level of activity.
ASC Topic 820 defines hierarchical levels directly related to the amount of subjectivity associated with the inputs used to determine fair values of assets and liabilities. The hierarchical levels and types of inputs used to measure fair value for each level are described as follows:
Level 1 – Quoted prices are available in active markets for identical investments as of the reporting date. Publicly listed equities and debt securities, publicly listed derivatives, money market/short term investment funds and foreign currency are generally included in Level 1. The Company does not adjust the quoted price for these investments.
Level 2 – Valuation inputs are other than quoted prices in active markets, which are either directly or indirectly observable as of the reporting date, and fair value is determined through the use of models or other valuation methodologies. In certain cases, debt and equity securities are valued on the basis of prices from orderly transactions for similar investments in active markets between market participants and provided by reputable dealers or independent pricing services. In determining the value of a particular investment, independent pricing services may use certain information with respect to transactions in such investments, quotations from dealers, pricing matrices, market transactions in comparable investments, and various relationships between investments. Investments generally included in this category are corporate bonds and loans, convertible debt indexed to publicly listed securities, foreign currency forward contracts and certain over-the-counter derivatives.
Level 3 – Valuation inputs are unobservable for the investment and include situations where there is little, if any, market activity for the investment. The inputs into the determination of fair value require significant judgment or estimation. Investments generally included in this category are total return swap agreements, illiquid corporate bonds and loans, common and preferred stock investments, and equity options that lack observable market pricing.
In certain cases, the inputs used to measure fair value may fall within different levels of the fair value hierarchy. In such cases, an investment’s level within the fair value hierarchy is based on the lowest level of input that is significant to the fair value measurement. Depending on the relative liquidity in the markets for certain investments, the Company may transfer assets to Level 3 if it determines that observable quoted prices, obtained directly or indirectly, are not available or reliable. The Company’s assessment of the significance of a particular input to the fair value measurement requires judgment, and the consideration of factors specific to the investment.
Investments for which market quotations are readily available are valued using market quotations, which are generally obtained from independent pricing services, broker-dealers or market makers. With respect to the Company’s portfolio investments for which market quotations are not readily available, the Company’s board of directors is responsible for determining in good faith the fair value of the Company’s portfolio investments in accordance with the valuation policy and procedures approved by the board of directors, based on, among other things, the input of the Company’s Advisors and management, its audit committee, and independent third-party valuation firms.
The Company and the board of directors conduct its fair value determination process on a quarterly basis and any other time when a decision regarding the fair value of the portfolio investments is required. A determination of fair value involves subjective judgments and estimates. Due to the inherent uncertainty of determining the fair value of portfolio investments that do not have a readily available market value, the fair value of the investments may differ significantly from the values that would have been determined had a readily available market value existed for such investments, and the differences could be material. Further, such investments are generally less liquid than publicly traded securities. If the Company was required to liquidate a portfolio investment that does not have a readily available market value in a forced or liquidation sale, the Company could realize significantly less than the value recorded by the Company.
23
The Company and its Advisors undertake a multi-step valuation process each quarter for determining the fair value of the Company’s investments whose market prices are not readily available, as described below:
| • | | The quarterly valuation process begins with each portfolio company or investment being initially valued by KKR (internal valuation) and/or the Company’s independent third party valuation firm (external valuation), which provides a valuation range. |
| • | | Valuation recommendations are formulated and documented by KKR and reviewed by KKR’s valuation committee. The KKR valuation committee then provides its valuation recommendation for each portfolio investment, along with supporting documentation, to CNL and the Company. |
| • | | After the Company’s management has substantially completed its review, it then forwards the valuation recommendations and supporting documentation for audit committee review. |
| • | | The Company’s board of directors then discusses the investment valuation recommendations with the Advisors and management and, based on those discussions and the related review process conducted by our audit committee, determines the fair value of these investments in good faith. |
The valuation techniques used by the Company for the assets and liabilities that are classified as Level 3 in the fair value hierarchy are described below.
Senior Debt and Subordinated Debt: Senior debt and subordinated debt investments are valued at initial transaction price and are subsequently valued using (i) market data for similar instruments (e.g., recent transactions or indicative broker quotes), (ii) comparisons to benchmark derivative indices or (iii) valuation models. Valuation models are based on yield analysis and discounted cash flow techniques, where the key inputs are based on relative value analyses and the assignment of risk-adjusted discounted rates, based on the analysis of similar instruments from similar issuers. In addition, an illiquidity discount is applied where appropriate.
Equity/Other Investments: Equity/other investments are valued at initial transaction price and are subsequently valued using valuation models in the absence of readily observable market prices. Valuation models are generally based on (i) market and income (discounted cash flow) approaches, in which various internal and external factors are considered, and (ii) earnings before interest, taxes, depreciation and amortization (“EBITDA”) valuation multiples analysis. Factors include key financial inputs and recent public and private transactions for comparable investments. Key inputs used for the discounted cash flow approach include the weighted average cost of capital and assumed inputs used to calculate terminal values, such as EBITDA exit multiples. The fair value for a particular investment will generally be within the value range conclusions derived by the two approaches. Upon completion of the valuations conducted, an illiquidity discount is applied where appropriate.
Total Return Swaps: The Company values its TRS in accordance with the TRS agreements between its wholly owned subsidiary and the TRS counterparty, which collectively established the TRS. Pursuant to the TRS agreements, the value of the TRS is based on (i) the increase or decrease in the value of the TRS assets relative to the notional amounts, (ii) collected and accrued interest income and fee income, (iii) TRS financing costs on the TRS settled notional amount, and (iv) certain other expenses incurred under the TRS. The TRS assets are valued pursuant to the valuation algorithm specified in the TRS agreements, including reliance on indicative bid prices provided by independent third-party pricing services. Bid prices reflect the highest price that market participants may be willing to pay. On a quarterly basis, the Company’s management reviews, tests and compares (i) the indicative bid prices assigned to each TRS asset by the TRS counterparty with (ii) pricing inputs that are independently sourced by the Company’s management and/or its Advisors from third-party pricing services. Additionally, the Company’s management reviews the calculations of (i) collected and accrued interest, (ii) TRS financing costs, and (iii) realized gains and losses as included components of the TRS fair value. For additional disclosures on the Company’s TRS, including quantitative disclosures of the current period fair value components, refer to Note 4.
The Company utilizes several valuation techniques that use unobservable pricing inputs and assumptions in determining the fair value of its Level 3 investments. The valuation techniques, as well as the key unobservable inputs that have a significant impact on the Company’s Level 3 valuations, are described in Note 5. The unobservable pricing inputs and assumptions may differ by asset and in the application of the Company’s valuation methodologies. The reported fair value estimates could vary materially if the Company had chosen to incorporate different unobservable pricing inputs and other assumptions.
24
Security Transactions, Realized/Unrealized Gains or Losses, and Income Recognition - Investment transactions purchased on a secondary basis are recorded on the trade date. Loan originations are recorded on the funding date. The Company measures realized gains or losses from the repayment or sale of investments using the specific identification method. Realized gains or losses are measured by the difference between the net proceeds from the repayment or sale and the amortized cost basis of the investment without regard to unrealized gains or losses previously recognized, and include investments charged off during the period, net of recoveries. Unrealized gains or losses primarily reflect the change in investment values, including the reversal of previously recorded unrealized gains or losses when gains or losses are realized. The amortized cost basis of investments includes (i) the original cost and (ii) adjustments for the accretion/amortization of market discounts and premiums, original issue discount and loan origination fees. The Company reports changes in fair value of investments as a component of net change in unrealized appreciation (depreciation) on investments in the condensed consolidated statements of operations.
Interest income is recorded on an accrual basis and includes amortization of premiums to par value and accretion of discounts to par value. Discounts and premiums to par value on securities purchased are accreted/amortized into interest income over the life of the respective security using the effective interest method.
In its role as the Company’s investment sub-adviser, KKR or its affiliates may provide financial advisory services to portfolio companies and in return may receive fees for capital structuring services. KKR is obligated to remit to the Company any earned capital structuring fees based on the pro-rata portion of the Company’s investment in co-investment transactions and originated investments. These fees are generally non-recurring and are recognized as earned fee income by the Company upon the earlier of the investment commitment execution date or closing date. Loan origination, closing, commitment and other fees received by the Company directly or indirectly from borrowers in connection with the closing of investments are accreted over the contractual life of the debt investment as interest income based on the effective interest method. Upon prepayment of a debt investment, any prepayment penalties and unamortized loan fees and discounts are recorded as interest income.
Certain of the Company’s investments in debt securities contain a contractual payment-in-kind (“PIK”) interest provision. The PIK provisions generally feature the obligation or the option at each interest payment date of making interest payments in (i) cash, (ii) additional securities or (iii) a combination of cash and additional securities. PIK interest, computed at the contractual rate specified in the investment’s credit agreement, is accrued as interest income and recorded as interest receivable up to the interest payment date. On the interest payment dates, the Company will capitalize the accrued interest receivable attributable to PIK as additional principal due from the borrower. When additional PIK securities are received on the interest payment date, they typically have the same terms, including maturity dates and interest rates as the original securities issued. PIK interest generally becomes due at maturity of the investment or upon the investment being called by the issuer.
If the portfolio company valuation indicates the value of the PIK investment is not sufficient to cover the contractual PIK interest, the Company will not accrue additional PIK interest income and will record an allowance for any accrued PIK interest receivable as a reduction of interest income in the period the Company determines it is not collectible. PIK interest income is included in taxable income and could require the Company to make additional distributions to the Company’s shareholders to maintain the Company’s status as a RIC.
Dividend income on preferred equity securities is recorded as dividend income on an accrual basis to the extent that such amounts are payable by the portfolio company and are expected to be collected. Dividend income on common equity securities is recorded on the record date for private portfolio companies or on the ex-dividend date for publicly traded portfolio companies. Each distribution received from limited liability company (“LLC”) and limited partnership (“LP”) investments is evaluated to determine if the distribution should be recorded as dividend income or a return of capital. Generally, the Company will not record distributions from equity investments in LLCs and LPs as dividend income unless there are sufficient accumulated tax-basis earnings and profits in the LLC or LP prior to the distribution. Distributions that are classified as a return of capital are recorded as a reduction in the cost basis of the investment.
Debt securities are placed on non-accrual status when principal or interest payments are at least 90 days past due or when there is reasonable doubt that principal or interest will be collected. Generally, accrued interest is reversed against interest income when a debt security is placed on non-accrual status. Interest payments received on debt securities on non-accrual status may be recognized as interest income or applied to principal based on management’s judgment. Debt securities on non-accrual status are restored to accrual status when past due principal and interest are paid and, in management’s judgment, such investments are likely to remain current on interest payment obligations. The Company may make exceptions to this treatment if the debt security has sufficient collateral value and is in the process of collection. The contractual interest associated with a debt security that has been placed on non-accrual status might increase taxable income, which could create an additional distribution requirement to the Company’s shareholders to maintain the Company’s status as a RIC.
25
Derivative Instruments -The Company’s derivative instruments include foreign currency forward contracts and the TRS. The Company recognizes all derivative instruments as assets or liabilities at fair value in its condensed consolidated financial statements. Derivative contracts entered into by the Company are not designated as hedging instruments, and as a result, the Company presents changes in fair value through net change in unrealized appreciation (depreciation) on derivative instruments in the condensed consolidated statements of operations. TRS unrealized appreciation (depreciation) is composed of the net accrued interest income and accrued TRS financing charges owed and the overall change in fair value of the TRS assets. Realized gains and losses that occur upon the cash settlement of the derivative instruments are included in net realized gain (loss) on derivative instruments in the condensed consolidated statements of operations. TRS realized gains and losses are composed of realized gains or losses on the TRS assets and the net interest and fees received or paid on the quarterly TRS settlement date.
Deferred Financing Costs - Financing costs, including upfront fees, commitment fees and legal fees related to the Company’s credit facilities, term loan and the TRS are deferred and amortized over the life of the related financing instrument using either the effective interest method or straight-line method. Unamortized deferred financing costs are included in prepaid and deferred expenses in the condensed consolidated statements of assets and liabilities. The amortization of deferred financing costs is included in interest expense in the condensed consolidated statements of operations.
Paid In Capital - The Company records the proceeds from the sale of its common stock on a net basis to (i) capital stock and (ii) paid in capital in excess of par value, excluding all commissions and marketing support fees.
Foreign Currency Translation, Transactions and Gains/Losses - Foreign currency amounts are translated into U.S. dollars on the following basis: (i) at the exchange rate on the last business day of the reporting period for the fair value of investment securities, other assets and liabilities; and (ii) at the prevailing exchange rate on the respective recording dates for the purchase and sale of investment securities, income, expenses, gains and losses.
Net assets and fair values are presented based on the applicable foreign exchange rates described above and the Company does not isolate that portion of the results of operations resulting from changes in foreign exchange rates on investments from the fluctuations arising from changes in fair values of investments held; therefore, fluctuations related to foreign exchange rate conversions are included with the net realized gain (loss) and unrealized appreciation (depreciation) on investments.
Net realized foreign exchange gains or losses arise from activity in foreign currency forward contracts, sales of foreign currency, currency gains or losses realized between the trade and settlement dates on securities transactions, and the difference between the amounts of dividends, interest, and foreign withholding taxes recorded by the Company and the U.S. dollar equivalent of the amounts actually received or paid by the Company. Unrealized appreciation (depreciation) from currency translation for foreign currency forward contracts is included in net change in unrealized appreciation (depreciation) in derivative instruments in the condensed consolidated statements of operations and is included with unrealized appreciation (depreciation) on derivative instruments in the condensed consolidated statements of assets and liabilities. Unrealized appreciation (depreciation) from foreign currency translation for other receivables or payables is presented as net change in unrealized appreciation (depreciation) in foreign currency translation in the condensed consolidated statements of operations.
Management Fees - The Company accrues for the base management fee (recorded as investment advisory fees) and performance-based incentive fees, including (i) a subordinated incentive fee on income and (ii) an incentive fee on capital gains. The Company records the liability for the incentive fee on capital gains based on a hypothetical liquidation of its investment portfolio at the end of each reporting period. Therefore, the accrual for incentive fee on capital gains includes the recognition of incentive fee on both net realized gains and net unrealized appreciation, if any, although any such incentive fee associated with net unrealized appreciation is neither earned nor payable to the Advisors until net unrealized appreciation is realized as net realized gains. Additionally, the determination of whether the accrued incentive fee on capital gains is earned and payable to the Advisors can only be made at the end of the calendar year. The two components of performance-based incentive fees are combined and expensed in the condensed consolidated statements of operations and accrued in the condensed consolidated statements of assets and liabilities as accrued performance-based incentive fees.
Offering Expenses - Continuous offering expenses, including reimbursement payments to the Advisors, but excluding commission and marketing support fees, are accumulated monthly and capitalized in the condensed consolidated statements of assets and liabilities as deferred offering expenses and then subsequently expensed over a 12-month period.
Earnings per Share - Earnings per share is calculated based upon the weighted average number of shares of common stock outstanding during the reporting period.
26
Distributions – Weekly distributions are generally declared by the Company’s board of directors each calendar quarter and recognized as a liability on the applicable record date. Distributions are paid monthly. The Company has adopted a distribution reinvestment plan that provides for reinvestment of distributions on behalf of shareholders. Shareholders who have elected to participate in the distribution reinvestment plan will have their cash distribution automatically reinvested in additional shares of common stock at a price per share equivalent to the public offering price, net of commissions and marketing support fees.
Federal Income Taxes - The Company has elected to be treated for federal income tax purposes, and intends to maintain its qualification, as a RIC under Subchapter M of the Code. Generally, a RIC is not subject to federal income taxes on distributed income and gains if it distributes at least 90% of its “Investment Company Taxable Income,” as defined in the Code. The Company intends to distribute sufficient dividends to maintain its RIC status each year and it does not anticipate paying a material level of federal income taxes.
The Company is generally subject to nondeductible federal excise taxes if it does not distribute to its shareholders an amount at least equal to the sum of (i) 98% of its net ordinary income for the calendar year, (ii) 98.2% of its capital gains in excess of capital losses for the one-year period generally ending on October 31 of the calendar year and (iii) any ordinary income and net capital gains for preceding years that were not distributed during such years and on which the Company paid no federal income tax. The Company may, at its discretion, pay a 4% non-deductible federal excise tax on under-distribution of capital gains and taxable income.
The Taxable Subsidiaries hold certain of the Company’s portfolio investments. The Taxable Subsidiaries are consolidated for GAAP reporting purposes, and the portfolio investments held by such entities are included in the condensed consolidated financial statements. The Taxable Subsidiaries may generate income tax expense, or benefit, and related tax assets and liabilities. As a result, any such income tax expense, or benefit and the related tax assets and liabilities are recorded in the Company’s condensed consolidated financial statements. Deferred tax assets and liabilities are recorded for temporary differences between the tax basis of assets and liabilities and their reported amounts in the financial statements, using statutory tax rates in effect for the year in which the temporary differences are expected to reverse. Valuation allowances are established when necessary to reduce deferred tax assets to the amount expected to be realized.
The Company recognizes in its condensed consolidated financial statements the effect of a tax position when it is deemed more likely than not, based on the technical merits, that the position will be sustained upon examination. Tax benefits of positions not deemed to meet the more-likely-than-not threshold are recorded as a tax expense in the current year. The Company did not have any uncertain tax positions that met the recognition or measurement criteria of ASC 740-10-25, Income Taxes – Overall –Recognition, nor did it have any unrecognized tax benefits as of the periods presented herein. Although the Company and the Taxable Subsidiaries file federal and state tax returns, their major tax jurisdiction is federal.
Permanent book and tax basis differences are reclassified among the Company’s capital accounts, as appropriate. Additionally, the tax character of distributions is determined in accordance with the Code which differs from GAAP.
Reclassifications -Certain prior period amounts in the condensed consolidated financial statements have been reclassified to conform to the current period presentation.
3. Investments
The Company is engaged in a strategy to invest primarily in the debt of privately owned U.S. companies. The primary investment concentrations include (i) senior debt securities and (ii) subordinated debt securities. The Company’s investments may, in some cases, be accompanied by warrants, options or other forms of equity participation. The Company may separately purchase common or preferred equity interests or limited partnership interests. The Company may also invest in structured products such as collateralized loan obligations. The fair value of the Company’s investments will generally fluctuate with, among other things, changes in prevailing interest rates, the general supply of, and demand for, debt capital among private and public companies, general domestic and global economic conditions, the condition of certain financial markets, developments or trends in any particular industry and changes in the financial condition and credit quality of each security’s issuer.
27
Investment purchases, sales and principal payments/paydowns are summarized below for the three and nine months ended September 30, 2014 and 2013. The purchase and sale amounts exclude short-term investments (i.e. money market fund investments) and derivative instruments (amounts in thousands).
| | | | | | | | | | | | | | | | |
| | | Three Months Ended September 30, | | | Nine Months Ended September 30, | |
| | | 2014 | | | 2013 | | | 2014 | | | 2013 | |
Investment purchases, at cost | | $ | 449,447 | | | $ | 658,024 | | | $ | 1,260,847 | | | $ | 1,443,232 | |
Investment sales, proceeds | | | 48,067 | | | | 133,874 | | | | 442,624 | | | | 422,376 | |
Principal payments/paydown proceeds | | | 101,692 | | | | 18,333 | | | | 351,163 | | | | 78,029 | |
As of September 30, 2014, debt investments on non-accrual status represented 0.2% of total investments on both an amortized cost basis and fair value basis. As of December 31, 2013, debt investments on non-accrual status represented 0.7% and 0.6% of total investments on an amortized cost basis and fair value basis, respectively.
As of September 30, 2014 and December 31, 2013, the Company’s investment portfolio consisted of the following (amounts in thousands):
| | | | | | | | | | | | | | | | |
| | | As of September 30, 2014 | |
| Asset Category | | Amortized
Cost | | | Fair Value | | | Percentage of
Investment
Portfolio | | | Percentage of
Net Assets | |
Senior debt | | $ | 1,784,406 | | | $ | 1,792,285 | | | | 74.3% | | | | 90.9% | |
Subordinated debt | | | 479,375 | | | | 476,939 | | | | 19.8 | | | | 24.2 | |
Structured products | | | 30,721 | | | | 33,942 | | | | 1.4 | | | | 1.7 | |
Equity/Other | | | 100,584 | | | | 107,972 | | | | 4.5 | | | | 5.5 | |
| | | | | | | | | | | | | | | | |
Subtotal | | | 2,395,086 | | | | 2,411,138 | | | | 100.0% | | | | 122.3 | |
| | | | | | | | | | | | | | | | |
Short term investments | | | 1,227 | | | | 1,227 | | | | | | | | 0.1 | |
| | | | | | | | | | | | | | | | |
Total investments | | $ | 2,396,313 | | | $ | 2,412,365 | | | | | | | | 122.4% | |
| | | | | | | | | | | | | | | | |
| |
| | | As of December 31, 2013 | |
| Asset Category | | Cost | | | Fair Value | | | Percentage of
Investment
Portfolio | | | Percentage of
Net Assets | |
Senior debt | | $ | 1,452,592 | | | $ | 1,474,492 | | | | 76.6% | | | | 103.1% | |
Subordinated debt | | | 355,239 | (1) | | | 370,131 | | | | 19.2 | | | | 25.9 | |
Structured products | | | 55,520 | | | | 55,575 | | | | 2.9 | | | | 3.9 | |
Equity/Other | | | 24,250 | | | | 24,671 | | | | 1.3 | | | | 1.7 | |
| | | | | | | | | | | | | | | | |
Subtotal | | | 1,887,601 | | | | 1,924,869 | | | | 100.0% | | | | 134.6 | |
| | | | | | | | | | | | | | | | |
Short term investments | | | 149,903 | | | | 149,903 | | | | | | | | 10.5 | |
| | | | | | | | | | | | | | | | |
Total investments | | $ | 2,037,504 | | | $ | 2,074,772 | | | | | | | | 145.1% | |
| | | | | | | | | | | | | | | | |
| (1) | This number has been corrected for a typographical error in the Company’s Form 10-K for the year ended December 31, 2013, as filed with the SEC on March 20, 2014, wherein it had been incorrectly reported as $305,239. |
28
The industry composition, geographic dispersion, and local currencies of the Company’s investment portfolio at fair value, excluding short-term investments and derivative instruments, as of September 30, 2014 and December 31, 2013 was as follows:
| | | | | | | | |
Industry Composition | | September 30, 2014 | | | December 31, 2013 | |
Consumer Durables & Apparel | | | 20.4% | | | | 19.0% | |
Software & Services | | | 9.5 | | | | 7.7 | |
Capital Goods | | | 9.3 | | | | 5.4 | |
Retailing | | | 9.3 | | | | 10.6 | |
Health Care Equipment & Services | | | 8.4 | | | | 9.3 | |
Technology Hardware & Equipment | | | 7.5 | | | | 12.4 | |
Energy | | | 6.5 | | | | 6.1 | |
Diversified Financials | | | 5.4 | | | | 2.9 | |
Materials | | | 3.8 | | | | 7.1 | |
Commercial & Professional Services | | | 3.4 | | | | 3.5 | |
Food, Beverage & Tobacco | | | 3.4 | | | | 5.2 | |
Telecommunication Services | | | 3.0 | | | | 1.7 | |
Media | | | 1.9 | | | | 3.5 | |
Automobiles & Components | | | 1.9 | | | | - | |
Consumer Services | | | 1.9 | | | | 0.2 | |
Food & Staples Retailing | | | 1.3 | | | | 1.7 | |
Insurance | | | 1.1 | | | | 3.5 | |
Remaining Industries | | | 2.0 | | | | 0.2 | |
| | | | | | | | |
Total | | | 100.0% | | | | 100.0% | |
| | | | | | | | |
Geographic Dispersion(1) | | | | | | | | |
United States | | | 75.3% | | | | 76.9% | |
Sweden | | | 5.1 | | | | 5.9 | |
United Kingdom | | | 5.0 | | | | 2.2 | |
Luxembourg | | | 4.1 | | | | 4.4 | |
Ireland | | | 2.3 | | | | 3.1 | |
Netherlands | | | 1.9 | | | | 2.4 | |
New Zealand | | | 1.7 | | | | 2.0 | |
Australia | | | 1.4 | | | | - | |
Cayman Islands | | | 1.3 | | | | 1.3 | |
France | | | 1.0 | | | | 1.3 | |
Remaining Countries | | | 0.9 | | | | 0.5 | |
| | | | | | | | |
Total | | | 100.0% | | | | 100.0% | |
| | | | | | | | |
Local Currency | | | | | | | | |
U.S. Dollar | | | 82.4% | | | | 84.0% | |
Euro | | | 9.3 | | | | 11.2 | |
British Pound Sterling | | | 4.6 | | | | 2.0 | |
New Zealand Dollar | | | 1.7 | | | | 2.0 | |
Australian Dollar | | | 1.4 | | | | - | |
Swedish Krona | | | 0.6 | | | | 0.8 | |
| | | | | | | | |
Total | | | 100.0% | | | | 100.0% | |
| | | | | | | | |
| (1) | The geographic dispersion is determined by the portfolio company’s country of domicile or the jurisdiction of the security’s issuer. |
29
The following is a summary of the fair value and location of the Company’s derivative instruments in the condensed consolidated statements of assets and liabilities (amounts in thousands):
| | | | | | | | | | |
| | | | | Fair Value | |
Derivative Instrument | | Statement Location | | September 30, 2014 | | | December 31, 2013 | |
Foreign currency forward contracts | | Unrealized appreciation on derivative instruments | | $ | 28,100 | | | $ | - | |
Foreign currency forward contracts | | Unrealized depreciation on derivative instruments | | | (262) | | | | (3,181) | |
TRS | | Unrealized appreciation (depreciation) on derivative instruments | | | (1,019) | | | | 1,861 | |
| | | | | | | | | | |
Total | | $ | 26,819 | | | $ | (1,320) | |
| | | | | | | | | | |
Realized and unrealized gains and losses on derivative instruments recorded by the Company for the three and nine months ended September 30, 2014 and 2013 are in the following location in the condensed consolidated statements of operations (amounts in thousands):
| | | | | | | | | | | | | | | | | | |
| | | | | Realized Gains (Losses) | |
| | | | | Three Months Ended
September 30, | | | Nine Months Ended
September 30, | |
Derivative Instrument | | Statement Location | | 2014 | | | 2013 | | | 2014 | | | 2013 | |
Foreign currency forward contracts | | Net realized loss on derivative instruments | | $ | (1,486) | | | $ | (316) | | | $ | (4,658) | | | $ | (191) | |
TRS | | Net realized gain on derivative instruments | | | 938 | | | | 7,314 | | | | 3,332 | | | | 9,839 | |
| | | | | | | | | | | | | | | | | | |
Total | | | | $ | (548) | | | $ | 6,998 | | | $ | (1,326) | | | $ | 9,648 | |
| | | | | | | | | | | | | | | | | | |
| | |
| | | | | Unrealized Gains (Losses) | |
| | | | | Three Months Ended
September 30, | | | Nine Months Ended
September 30, | |
Derivative Instrument | | Statement Location | | 2014 | | | 2013 | | | 2014 | | | 2013 | |
Foreign currency forward contracts | | Net change in unrealized appreciation (depreciation) on derivative instruments | | $ | 32,950 | | | $ | (4,343) | | | $ | 31,019 | | | $ | (2,946) | |
TRS | | Net change in unrealized depreciation on derivative instruments | | | (1,510) | | | | (5,120) | | | | (2,880) | | | | (511) | |
| | | | | | | | | | | | | | | | | | |
Total | | | | $ | 31,440 | | | $ | (9,463) | | | $ | 28,139 | | | $ | (3,457) | |
| | | | | | | | | | | | | | | | | | |
Foreign Currency Forward Contracts:
The Company may enter into foreign currency forward contracts from time to time to facilitate settlement of purchases and sales of investments denominated in foreign currencies and to economically hedge the impact that an adverse change in foreign exchange rates would have on the value of the Company’s investments denominated in foreign currencies. A foreign currency forward contract is a commitment to purchase or sell a foreign currency at a future date at a negotiated forward rate. These contracts are marked-to-market by recognizing the difference between the contract forward exchange rate and the forward market exchange rate on the last day of the current period as unrealized appreciation or depreciation. Realized gains or losses are recognized when forward contracts are settled. Risks arise as a result of the potential inability of the counterparties to meet the terms of their contracts; the Company attempts to limit counterparty risk by only dealing with well-known counterparties. The foreign currency forward contracts open at the end of the period are indicative of the volume of activity during the period.
30
As of September 30, 2014 and December 31, 2013, the details of the Company’s open foreign currency forward contracts were as follows (amounts in thousands):
| | | | | | | | | | | | | | | | | | | | |
| September 30, 2014 | |
Foreign Currency | | Settlement Date | | Counterparty | | Amount and
Transaction | | | US$ Value at
Settlement Date | | | US$ Value at
September 30, 2014 | | | Unrealized
Appreciation
(Depreciation) | |
AUD | | Oct. 9, 2015 | | State Street Bank and Trust | | A$ | 36,489 Sold | | | $ | 33,032 | | | $ | 31,140 | | | $ | 1,892 | |
EUR | | Oct. 9, 2014 | | State Street Bank and Trust | | € | 3,575 Sold | | | | 4,865 | | | | 4,516 | | | | 349 | |
EUR | | Jan. 8, 2015 | | State Street Bank and Trust | | € | 17,000 Sold | | | | 22,919 | | | | 21,487 | | | | 1,432 | |
EUR | | Jan. 8, 2015 | | State Street Bank and Trust | | € | 43,500 Sold | | | | 59,608 | | | | 54,982 | | | | 4,626 | |
EUR | | Jan. 8, 2015 | | State Street Bank and Trust | | € | 16,903 Sold | | | | 22,845 | | | | 21,365 | | | | 1,480 | |
EUR | | Jan. 8, 2015 | | State Street Bank and Trust | | € | 1,153 Sold | | | | 1,559 | | | | 1,458 | | | | 101 | |
EUR | | Jan. 8, 2015 | | State Street Bank and Trust | | € | 16,000 Sold | | | | 22,235 | | | | 20,223 | | | | 2,012 | |
EUR | | Jan. 8, 2015 | | State Street Bank and Trust | | € | 11,100 Sold | | | | 15,114 | | | | 14,030 | | | | 1,084 | |
EUR | | Jan. 8, 2015 | | State Street Bank and Trust | | € | 11,100 Sold | | | | 15,112 | | | | 14,030 | | | | 1,082 | |
EUR | | Jan. 8, 2015 | | State Street Bank and Trust | | € | 3,650 Bought | | | | 4,875 | | | | 4,613 | | | | (262) | |
EUR | | Jan. 8, 2015 | | State Street Bank and Trust | | € | 4,053 Sold | | | | 5,237 | | | | 5,123 | | | | 114 | |
EUR | | Jan. 11, 2016 | | J.P. Morgan Chase Bank | | € | 5,400 Sold | | | | 7,413 | | | | 6,876 | | | | 537 | |
EUR | | Jan. 11, 2016 | | J.P. Morgan Chase Bank | | € | 61,000 Sold | | | | 83,436 | | | | 77,669 | | | | 5,767 | |
GBP | | Oct. 9, 2014 | | State Street Bank and Trust | | £ | 23,598 Sold | | | | 40,390 | | | | 38,254 | | | | 2,136 | |
GBP | | Apr. 7, 2017 | | J.P. Morgan Chase Bank | | £ | 45,700 Sold | | | | 74,738 | | | | 73,736 | | | | 1,002 | |
NZD | | Oct. 9, 2014 | | State Street Bank and Trust | | N$ | 46,650 Sold | | | | 40,520 | | | | 36,392 | | | | 4,128 | |
NZD | | Oct. 9, 2014 | | State Street Bank and Trust | | N$ | 4,000 Sold | | | | 3,478 | | | | 3,120 | | | | 358 | |
| | | | | | | | | | | | | | | | | | | | |
Total | | | | | | | | | | $ | 457,376 | | | $ | 429,014 | | | $ | 27,838 | |
| | | | | | | | | | | | | | | | | | | | |
| | | | | | | | | | | | | | | | | | | | |
| December 31, 2013 | |
Foreign Currency | | Settlement Date | | Counterparty | | Amount and
Transaction | | | US$ Value at
Settlement Date | | | US$ Value at
December 31, 2013 | | | Unrealized
Appreciation
(Depreciation) | |
EUR | | Jan. 3, 2014 | | State Street Bank and Trust | | € | 2,100 Sold | | | $ | 2,745 | | | $ | 2,889 | | | $ | (144) | |
EUR | | Jan. 10, 2014 | | State Street Bank and Trust | | € | 8,100 Sold | | | | 10,747 | | | | 11,143 | | | | (396) | |
EUR | | Jan. 8, 2015 | | State Street Bank and Trust | | € | 17,000 Sold | | | | 22,919 | | | | 23,402 | | | | (483) | |
EUR | | Jan. 8, 2015 | | State Street Bank and Trust | | € | 43,500 Sold | | | | 59,608 | | | | 59,882 | | | | (274) | |
EUR | | Jan. 8, 2015 | | State Street Bank and Trust | | € | 2,100 Sold | | | | 2,899 | | | | 2,891 | | | | 8 | |
GBP | | Jan. 10, 2014 | | State Street Bank and Trust | | £ | 15,100 Sold | | | | 23,701 | | | | 25,004 | | | | (1,303) | |
GBP | | Jan. 10, 2014 | | State Street Bank and Trust | | £ | 8,498 Sold | | | | 13,484 | | | | 14,071 | | | | (587) | |
NZD | | Jul. 23, 2014 | | State Street Bank and Trust | | N$ | 4,000 Sold | | | | 3,235 | | | | 3,237 | | | | (2) | |
| | | | | | | | | | | | | | | | | | | | |
Total | | | | | | | | | | $ | 139,338 | | | $ | 142,519 | | | $ | (3,181) | |
| | | | | | | | | | | | | | | | | | | | |
Unrealized gains or losses from investments denominated in foreign currencies that these open foreign currency forward contracts are designed to offset are included in unrealized appreciation (depreciation) on investments in the condensed consolidated statement of operations.
Equity Options:
The Company holds equity options in certain portfolio companies to enhance investment returns in connection with its primary lending activities. In purchasing options, the Company bears the risk of an unfavorable change in the value of the underlying equity interest. The equity options are recorded as investments at fair value in the condensed consolidated statements of assets and liabilities. The aggregate fair value of options as of September 30, 2014 and December 31, 2013 represented 0.7% and 1.1% of the Company’s net assets, respectively.
Total Return Swaps:
On November 15, 2012, Halifax Funding entered into the TRS with the Bank of Nova Scotia (“BNS” or “Counterparty”). The TRS arrangement with BNS consists of a set of TRS agreements. Pursuant to the TRS agreements, Halifax Funding may select a portfolio of single-name corporate loans and/or bonds (each, a “TRS asset” and together, the “TRS assets”) with a maximum aggregate notional amount of $500 million. Under the terms of the TRS agreements, each TRS asset included in the TRS portfolio constitutes a separate total return swap transaction, although all calculations, payments and transfers required to be made under the TRS agreements are calculated and treated on an aggregate basis, based upon all such transactions.
31
Halifax Funding receives quarterly from BNS (i) all collected interest and fees generated by the TRS assets and (ii) realized gains from the sale or principal payments/paydowns of TRS assets, if any. Halifax Funding pays to BNS (i) a financing charge on the TRS settled notional amount at a rate equal to the three-month LIBOR+0.80% per annum if the initial investment amount (i.e. posted collateral) equals or exceeds 50% of the TRS trade basis notional amount, or three-month LIBOR+1.00% if the initial investment amount is less than 50% of the TRS trade basis notional amount and (ii) realized losses, if any. In addition, upon the termination of the TRS arrangement, Halifax Funding will either receive from BNS any net realized gain, or pay to BNS any net realized loss, on the liquidation of TRS assets.
Halifax Funding posts collateral in the form of certificates of deposit held by a custodian. Generally, the required collateral amount is at least 40% of the notional amount of each TRS asset at the time that such TRS asset is confirmed for acquisition by the counterparty. Halifax Funding may be required to post additional collateral in the event the value of the TRS assets decreases below a specified amount. Halifax Funding is required to post additional collateral to ensure that the collateral’s market value, as solely determined by BNS, is at least equal to 25% of the value of the TRS portfolio.
The obligations of Halifax Funding under the TRS agreements are non-recourse to the Company and the Company’s exposure to the TRS is limited to its equity in Halifax Funding, which is generally equal to the collateral posted by Halifax Funding. The Company has no contractual obligation to post any collateral or to pay any financing charges to BNS. The Company may, but is not obligated to, increase its equity investment in Halifax Funding for the purpose of funding additional collateral or payment obligations for which Halifax Funding may become obligated during the term of the TRS agreements. If the Company does not make any such additional equity investment in Halifax Funding and Halifax Funding fails to meet its obligations under the TRS agreements, then BNS will have the right to terminate the TRS agreements and use the collateral posted by Halifax Funding with the custodian to offset any amount owed to BNS. Halifax Funding may terminate the TRS agreements at any time upon providing at least 30 days’ notice prior to the proposed settlement date of the TRS assets related to such termination. In the absence of an early termination, the TRS will terminate on January 15, 2016. In the event of an early termination of the TRS, Halifax Funding may be required to pay a make-whole fee based on a minimum spread amount to be earned by BNS over the life of the TRS agreements. Halifax Funding would have been required to pay an early termination fee of $5.24 million if the TRS had been terminated as of September 30, 2014.
As of September 30, 2014 and December 31, 2013, Halifax Funding had selected 33 and 20 underlying debt positions, respectively, and had posted $63.4 million and $37.5 million in collateral, respectively, which are recorded as collateral on deposit with custodian in the condensed consolidated statements of assets and liabilities. The following table reconciles the TRS settled notional amount, upon which the financing charge to BNS is based, to the total, or trade basis, notional amount as of September 30, 2014 and December 31, 2013 (amounts in thousands).
| | | | | | | | |
| | | September 30, 2014 | | | December 31, 2013 | |
Settled notional amount | | $ | 108,948 | | | $ | 54,829 | |
Unsettled additions | | | 3,745 | | | | 23,759 | |
Unsettled deletions | | | (2,590 | ) | | | (18,677 | ) |
| | | | | | | | |
Total notional amount | | $ | 110,103 | | | $ | 59,911 | |
| | | | | | | | |
The following table summarizes the fair value components of the TRS portfolio as of September 30, 2014 and December 31, 2013 (amounts in thousands):
| | | | | | | | |
| | | September 30, 2014 | | | December 31, 2013 | |
Interest and fee income | | $ | 1,688 | | | $ | 1,806 | |
Financing charge | | | (184 | ) | | | (103 | ) |
Net realized loss | | | (42 | ) | | | (27 | ) |
Net unrealized appreciation/depreciation of TRS assets | | | (2,481 | ) | | | 185 | |
| | | | | | | | |
TRS Total fair value | | $ | (1,019 | ) | | $ | 1,861 | |
| | | | | | | | |
32
The following table summarizes the components of TRS realized gains (amounts in thousands).
| | | | | | | | | | | | | | | | |
| | | Three Months Ended
September 30, | | | Nine Months Ended
September 30, | |
| | | 2014 | | | 2013 | | | 2014 | | | 2013 | |
Interest and fee income | | $ | 994 | | | $ | 5,305 | | | $ | 3,426 | | | $ | 9,080 | |
Financing charge | | | (127) | | | | (696) | | | | (372) | | | | (1,630) | |
Net realized gains | | | 71 | | | | 2,705 | | | | 278 | | | | 2,389 | |
| | | | | | | | | | | | | | | | |
TRS Total realized gains | | $ | 938 | | | $ | 7,314 | | | $ | 3,332 | | | $ | 9,839 | |
| | | | | | | | | | | | | | | | |
The following is a summary of the TRS assets (trade basis) as of September 30, 2014 (amounts in thousands):
| | | | | | | | | | | | | | | | | | | | |
| Company (a) | | Industry | | Interest
Rate | | LIBOR
Floor | | Maturity
Date | | Notional
Amount | | | Fair Value | | | Unrealized
Appreciation
(Depreciation) | |
Senior Secured Loans - First Lien | | | | | | | | | | | | | | | | | | | | |
Applied Systems, Inc. | | Software & Services | | L + 325 | | 1.00% | | 1/25/2021 | | $ | 3,451 | | | $ | 3,388 | | | $ | (63 | ) |
Catalina Marketing Corp. | | Media | | L + 350 | | 1.00% | | 4/9/2021 | | | 4,012 | | | | 3,880 | | | | (132 | ) |
Ceridian Corp. | | Commercial &
Professional Services | | L + 350 | | 1.00% | | 9/14/2020 | | | 2,055 | | | | 2,018 | | | | (37 | ) |
Ceridian Corp. | | Commercial &
Professional Services | | L + 400 | | | | 5/9/2017 | | | 1,970 | | | | 1,952 | | | | (18 | ) |
CHG Companies, Inc. | | Health Care
Equipment &
Services | | L + 325 | | 1.00% | | 11/19/2019 | | | 2,990 | | | | 2,947 | | | | (43 | ) |
CTI Foods Holding Co., LLC | | Food, Beverage &
Tobacco | | L + 350 | | 1.00% | | 6/28/2020 | | | 3,998 | | | | 3,958 | | | | (40 | ) |
Gymboree Corp. | | Retailing | | L + 350 | | 1.50% | | 2/23/2018 | | | 2,834 | | | | 2,078 | | | | (756 | ) |
iPayment, Inc. | | Software & Services | | L + 525 | | 1.50% | | 5/8/2017 | | | 7,885 | | | | 7,847 | | | | (38 | ) |
OneStopPlus Group | | Consumer Durables &
Apparel | | L + 350 | | 1.00% | | 3/18/2021 | | | 353 | | | | 342 | | | | (11 | ) |
OpenLink Financial, Inc. | | Software & Services | | L + 500 | | 1.25% | | 10/30/2017 | | | 824 | | | | 818 | | | | (6 | ) |
The TelX Group, Inc. | | Telecommunication
Services | | L + 350 | | 1.00% | | 4/9/2020 | | | 4,002 | | | | 3,916 | | | | (86 | ) |
Travelport, LLC | | Software & Services | | L + 500 | | 1.00% | | 9/2/2021 | | | 3,950 | | | | 3,991 | | | | 41 | |
Wilton Brands, LLC | | Materials | | L + 625 | | 1.25% | | 8/30/2018 | | | 3,139 | | | | 3,082 | | | | (57 | ) |
Learfield Communications, Inc. | | Media | | L + 350 | | 1.00% | | 10/9/2020 | | | 3,983 | | | | 3,874 | | | | (109 | ) |
Gypsum Management & Supply, Inc. | | Capital Goods | | L + 375 | | 1.00% | | 4/1/2021 | | | 3,980 | | | | 3,908 | | | | (72 | ) |
AssuredPartners, Inc. | | Insurance | | L + 350 | | 1.00% | | 4/2/2021 | | | 4,000 | | | | 3,918 | | | | (82 | ) |
California Pizza Kitchen, Inc. | | Food & Staples
Retailing | | L + 425 | | 1.00% | | 3/29/2018 | | | 3,835 | | | | 3,814 | | | | (21 | ) |
BJ’s Wholesale Club, Inc. | | Food & Staples
Retailing | | L + 350 | | 1.00% | | 9/26/2019 | | | 3,985 | | | | 3,905 | | | | (80 | ) |
CityCenter Holdings, LLC | | Real Estate | | L + 325 | | 1.00% | | 10/16/2020 | | | 3,739 | | | | 3,656 | | | | (83 | ) |
Harbor Freight Tools USA, Inc. | | Capital Goods | | L + 375 | | 1.00% | | 7/26/2019 | | | 3,236 | | | | 3,187 | | | | (49 | ) |
Emerald Expositions Holding, Inc. | | Media | | L + 375 | | 1.00% | | 6/17/2020 | | | 3,803 | | | | 3,727 | | | | (76 | ) |
First American Payment Systems, L.P. | | Software & Services | | L + 450 | | 1.25% | | 10/12/2018 | | | 2,404 | | | | 2,375 | | | | (29 | ) |
Hyland Software, Inc. | | Software & Services | | L + 375 | | 1.00% | | 2/19/2021 | | | 1,984 | | | | 1,953 | | | | (31 | ) |
Neiman Marcus Group, LLC | | Retailing | | L + 325 | | 1.00% | | 10/25/2020 | | | 3,990 | | | | 3,916 | | | | (74 | ) |
Hillman Group, Inc. | | Capital Goods | | L + 350 | | 1.00% | | 6/30/2021 | | | 4,016 | | | | 3,970 | | | | (46 | ) |
Caesars Entertainment Operating Co., Inc. (b)(c) | | Consumer Services | | L + 675 | | | | 3/1/2017 | | | 3,745 | | | | 3,643 | | | | (102 | ) |
Triple Point Technology, Inc. | | Software & Services | | L + 425 | | 1.00% | | 7/10/2020 | | | 4,198 | | | | 4,129 | | | | (69 | ) |
| | | | | | | | | | | | | | | | | | | | |
| Total Senior Secured Loans - First Lien | | | | | | | | | | | 92,361 | | | | 90,192 | | | | (2,169 | ) |
| | | | | | | | | | | | | | | | | | | | |
| Senior Secured Loans - Second Lien | | | | | | | | | | | | | | | | | | | | |
| Misys Ltd. (b) | | Software & Services | | 12.00% | | | | 6/12/2019 | | | 2,898 | | | | 3,131 | | | | 233 | |
| NEP Group, Inc. | | Media | | L + 825 | | 1.25% | | 7/22/2020 | | | 1,323 | | | | 1,340 | | | | 17 | |
| RedPrairie Corp. | | Software & Services | | L + 1000 | | 1.25% | | 12/21/2019 | | | 5,550 | | | | 5,113 | | | | (437 | ) |
| | | | | | | | | | | | | | | | | | | | |
| Total Senior Secured Loans - Second Lien | | | | | | | | | | | 9,771 | | | | 9,584 | | | | (187 | ) |
| | | | | | | | | | | | | | | | | | | | |
| Senior Secured Bonds | | | | | | | | | | | | | | | | | | | | |
| Artesyn Technologies, Inc. | | Technology Hardware
& Equipment | | 9.75% | | | | 10/15/2020 | | | 3,640 | | | | 3,474 | | | | (166 | ) |
| Hot Topic, Inc. | | Consumer Durables &
Apparel | | 9.25% | | | | 6/15/2021 | | | 3,675 | | | | 3,728 | | | | 53 | |
| | | | | | | | | | | | | | | | | | | | |
| Total Senior Secured Bonds | | | | | | | | | | | 7,315 | | | | 7,202 | | | | (113 | ) |
| | | | | | | | | | | | | | | | | | | | |
| Subordinated Debt | | | | | | | | | | | | | | | | | | | | |
| Summit Materials, LLC | | Materials | | 10.50% | | | | 1/31/2020 | | | 656 | | | | 644 | | | | (12 | ) |
| | | | | | | | | | | | | | | | | | | | |
| Total Subordinated Debt | | | | | | | | | | | 656 | | | | 644 | | | | (12 | ) |
| | | | | | | | | | | | | | | | | | | | |
| TOTAL | | | | | | | | | | $ | 110,103 | | | $ | 107,622 | | | $ | (2,481 | ) |
| | | | | | | | | | | | | | | | | | | | |
(a) Security may be an obligation of one or more entities affiliated with the named company.
(b) The investment is not a qualifying asset as defined in Section 55(a) under the 1940 Act.
(c) TRS asset position or portion thereof unsettled as of September 30, 2014.
33
The following is a summary of the TRS assets (trade basis) as of December 31, 2013 (amounts in thousands):
| | | | | | | | | | | | | | | | | | | | | | | | |
| Company (a) | | Industry | | Interest Rate | | | LIBOR Floor | | | Maturity Date | | Notional Amount | | | Fair Value | | | Unrealized
Appreciation (Depreciation) | |
Senior Secured Loans - First Lien | | | | | | | | | | | | | | | | | | | | | | | | |
Avaya, Inc. | | Technology Hardware & Equipment | | | L + 675 | | | | 1.25 | % | | 3/31/2018 | | $ | 2,573 | | | $ | 2,627 | | | $ | 54 | |
Caraustar Industries, Inc. (c) | | Materials | | | L + 625 | | | | 1.25 | % | | 5/1/2019 | | | 3,648 | | | | 3,626 | | | | (22 | ) |
Catalina Marketing Corp. (c) | | Media | | | L + 425 | | | | 1.00 | % | | 10/12/2020 | | | 3,526 | | | | 3,532 | | | | 6 | |
Continental Building Products, LLC | | Materials | | | L + 375 | | | | 1.00 | % | | 8/28/2020 | | | 1,985 | | | | 1,994 | | | | 9 | |
Data Device Corp. (c) | | Capital Goods | | | L + 650 | | | | 1.50 | % | | 7/11/2018 | | | 2,680 | | | | 2,669 | | | | (11 | ) |
Greenway Medical Technologies | | Health Care Equipment & Services | | | L + 500 | | | | 1.00 | % | | 11/4/2020 | | | 2,475 | | | | 2,462 | | | | (13 | ) |
Internet Brands, Inc. (c) | | Media | | | L + 500 | | | | 1.25 | % | | 3/18/2019 | | | 2,465 | | | | 2,440 | | | | (25 | ) |
IPC Systems, Inc. | | Technology Hardware & Equipment | | | L + 650 | | | | 1.25 | % | | 7/31/2017 | | | 2,971 | | | | 3,015 | | | | 44 | |
OneStopPlus Group (c) | | Consumer Durables & Apparel | | | L + 450 | | | | 1.00 | % | | 2/5/2020 | | | 7,294 | | | | 7,285 | | | | (9 | ) |
Travelport, LLC (c) | | Software & Services | | | L + 500 | | | | 1.25 | % | | 6/26/2019 | | | 2,304 | | | | 2,326 | | | | 22 | |
Wilton Brands, LLC (c) | | Materials | | | L + 625 | | | | 1.25 | % | | 8/30/2018 | | | 3,316 | | | | 3,263 | | | | (53 | ) |
| | | | | | | | | | | | | | | | | | | | | | | | |
Total Senior Secured Loans - First Lien | | | | | | | | | | | | | | | 35,237 | | | | 35,239 | | | | 2 | |
| | | | | | | | | | | | | | | | | | | | | | | | |
Senior Secured Loans - Second Lien | | | | | | | | | | | | | | | | | | | | | | | | |
Misys Ltd. (b) | | Software & Services | | | 12.00 | % | | | | | | 6/12/2019 | | | 2,898 | | | | 3,232 | | | | 334 | |
NEP Group, Inc. | | Media | | | L + 825 | | | | 1.25 | % | | 7/22/2020 | | | 1,315 | | | | 1,360 | | | | 45 | |
RedPrairie Corp. | | Software & Services | | | L + 1000 | | | | 1.25 | % | | 12/21/2019 | | | 1,830 | | | | 1,743 | | | | (87 | ) |
| | | | | | | | | | | | | | | | | | | | | | | | |
Total Senior Secured Loans - Second Lien | | | | | | | | | | | | | | | 6,043 | | | | 6,335 | | | | 292 | |
| | | | | | | | | | | | | | | | | | | | | | | | |
Senior Secured Bonds | | | | | | | | | | | | | | | | | | | | | | | | |
Artesyn Technologies, Inc. (b) | | Technology Hardware & Equipment | | | 9.75 | % | | | | | | 10/15/2020 | | | 3,640 | | | | 3,640 | | | | - | |
Hot Topic, Inc. | | Consumer Durables & Apparel | | | 9.25 | % | | | | | | 6/15/2021 | | | 3,675 | | | | 3,658 | | | | (17 | ) |
Pinnacle Agriculture Holdings, LLC | | Materials | | | 9.00 | % | | | | | | 11/15/2020 | | | 3,745 | | | | 3,710 | | | | (35 | ) |
| | | | | | | | | | | | | | | | | | | | | | | | |
Total Senior Secured Bonds | | | | | | | | | | | | | | | 11,060 | | | | 11,008 | | | | (52 | ) |
| | | | | | | | | | | | | | | | | | | | | | | | |
Total Senior Debt | | | | | | | | | | | | | | | 52,340 | | | | 52,582 | | | | 242 | |
| | | | | | | | | | | | | | | | | | | | | | | | |
Subordinated Debt | | | | | | | | | | | | | | | | | | | | | | | | |
Cequel Communications Holdings, LLC | | Media | | | 5.13 | % | | | | | | 12/15/2021 | | | 3,007 | | | | 2,812 | | | | (195 | ) |
Commscope, Inc. | | Technology Hardware & Equipment | |
| 6.63
7.38 | % or
% PIK | | | | | | 6/1/2020 | | | 3,908 | | | | 4,064 | | | | 156 | |
Summit Materials, LLC | | Materials | | | 10.50 | % | | | | | | 1/31/2020 | | | 656 | | | | 638 | | | | (18 | ) |
| | | | | | | | | | | | | | | | | | | | | | | | |
Total Subordinated Debt | | | | | | | | | | | | | | | 7,571 | | | | 7,514 | | | | (57 | ) |
| | | | | | | | | | | | | | | | | | | | | | | | |
TOTAL | | | | | | | | | | | | | | $ | 59,911 | | | $ | 60,096 | | | $ | 185 | |
| | | | | | | | | | | | | | | | | | | | | | | | |
(a) Security may be an obligation of one or more entities affiliated with the named company.
(b) The investment is not a qualifying asset as defined in Section 55(a) under the 1940 Act.
(c) TRS asset position or portion thereof unsettled as of December 31, 2013.
34
| 5. | Fair Value of Financial Instruments |
The Company’s investments were categorized in the fair value hierarchy as follows as of September 30, 2014 and December 31, 2013 (amounts in thousands):
| | | | | | | | | | | | | | | | |
| | | September 30, 2014 | |
Description | | Level 1 | | | Level 2 | | | Level 3 | | | Total | |
Senior debt | | $ | - | | | $ | 922,741 | | | $ | 869,544 | | | $ | 1,792,285 | |
Subordinated debt | | | - | | | | 240,449 | | | | 236,490 | | | | 476,939 | |
Structured products | | | - | | | | - | | | | 33,942 | | | | 33,942 | |
Equity/Other | | | - | | | | 7,406 | | | | 100,566 | | | | 107,972 | |
| | | | | | | | | | | | | | | | |
Subtotal | | | - | | | | 1,170,596 | | | | 1,240,542 | | | | 2,411,138 | |
Short term investments | | | 1,227 | | | | - | | | | - | | | | 1,227 | |
| | | | | | | | | | | | | | | | |
Total investments | | $ | 1,227 | | | $ | 1,170,596 | | | $ | 1,240,542 | | | $ | 2,412,365 | |
| | | | | | | | | | | | | | | | |
| | | | |
Derivative Instruments | | Level 1 | | | Level 2 | | | Level 3 | | | Total | |
Assets | | | | | | | | | | | | | | | | |
Foreign currency forward contracts | | $ | - | | | $ | 28,100 | | | $ | - | | | $ | 28,100 | |
Liabilities | | | | | | | | | | | | | | | | |
Total return swaps | | | - | | | | - | | | | (1,019) | | | | (1,019) | |
Foreign currency forward contracts | | | - | | | | (262) | | | | - | | | | (262) | |
| | | | | | | | | | | | | | | | |
Total | | $ | - | | | $ | 27,838 | | | $ | (1,019) | | | $ | 26,819 | |
| | | | | | | | | | | | | | | | |
| |
| | | December 31, 2013 | |
| | | | |
Description | | Level 1 | | | Level 2 | | | Level 3 | | | Total | |
Senior debt | | $ | - | | | $ | 863,216 | | | $ | 611,276 | | | $ | 1,474,492 | |
Subordinated debt | | | - | | | | 198,210 | | | | 171,921 | | | | 370,131 | |
Structured products | | | - | | | | - | | | | 55,575 | | | | 55,575 | |
Equity/Other | | | - | | | | - | | | | 24,671 | | | | 24,671 | |
| | | | | | | | | | | | | | | | |
Subtotal | | | - | | | | 1,061,426 | | | | 863,443 | | | | 1,924,869 | |
Short term investments | | | 149,903 | | | | - | | | | - | | | | 149,903 | |
| | | | | | | | | | | | | | | | |
Total investments | | $ | 149,903 | | | $ | 1,061,426 | | | $ | 863,443 | | | $ | 2,074,772 | |
| | | | | | | | | | | | | | | | |
| | | | |
Derivative Instruments | | Level 1 | | | Level 2 | | | Level 3 | | | Total | |
Assets | | | | | | | | | | | | | | | | |
Total return swaps | | $ | - | | | $ | - | | | $ | 1,861 | | | $ | 1,861 | |
Liabilities | | | | | | | | | | | | | | | | |
Foreign currency forward contracts | | | - | | | | (3,181) | | | | - | | | | (3,181) | |
| | | | | | | | | | | | | | | | |
Total | | $ | - | | | $ | (3,181) | | | $ | 1,861 | | | $ | (1,320) | |
| | | | | | | | | | | | | | | | |
There were no transfers between Level 1 and Level 2 during the nine months ended September 30, 2014 and the year ended December 31, 2013.
The carrying value of cash and foreign currency is classified as Level 1 with respect to the fair value hierarchy. The carrying values of the Company’s collateral on deposit with custodian, term loan and revolving credit facilities approximate their fair value and are classified as Level 2 with regards to the fair value hierarchy.
At September 30, 2014, the Company held 56 distinct investment positions that were classified as Level 3, representing an aggregate fair value of $1.24 billion and 51.4% of the total investment portfolio. At December 31, 2013, the Company held 30 distinct investment positions that were classified as Level 3, representing an aggregate fair value of $863.44 million and 41.6% of the total investment portfolio. The ranges of unobservable inputs used in the fair value measurement of the Company’s Level 3 investments as of September 30, 2014 and December 31, 2013 were as follows (amounts in thousands):
35
| | | | | | | | | | | | |
As of September 30, 2014 |
| Asset Group | | Fair Value (1)(2) | | | Valuation Techniques(3) | | Unobservable Inputs | | Range (Weighted Average) (4) | | Impact to Valuation
from an Increase in
Input(5) |
Senior Debt | | | $869,544 | | | Discounted Cash Flow | | Discount Rate | | 6.90% - 16.80% (11.20%) | | Decrease |
| | | | | | | | Market Yield | | 5.68% - 16.26% (8.35%) | | Decrease |
| | | | | | | | Yield Premium | | 0.00% - 6.50% (2.01%) | | Decrease |
| | | | | | | | Weighted Average Cost of Capital | | 7.00% - 17.45% (11.04%) | | Decrease |
| | | | | | | | EBITDA Multiple | | 4.25x - 18.50x (8.57x) | | Increase |
| | | | | | | | Tangible Book Value Multiple | | 1.65x (1.65x) | | Increase |
| | | | | | | | | Interest Rate Volatility | | 25.00% (25.00%) | | Decrease |
Subordinated Debt | | | 226,461 | | | Discounted Cash Flow | | Discount Rate | | 12.05% - 19.50% (14.05%) | | Decrease |
| | | | | | | | Market Yield | | 7.93% - 16.74% (9.47%) | | Decrease |
| | | | | | | | Yield Premium | | 3.80% (3.80%) | | Decrease |
| | | | | | | | Weighted Average Cost of Capital | | 10.30% - 19.50% (14.04%) | | Decrease |
| | | | | | | | EBITDA Multiple | | 6.50x - 12.80x (9.50x) | | Increase |
| | | | | | | | Interest Rate Volatility | | 25.00% (25.00%) | | Decrease |
| | | 9,367 | | | Option Pricing Model | | EBITDA Multiple | | 10.60x (10.60x) | | Increase |
| | | | | | | | Implied Volatility | | 45.00% (45.00%) | | Increase |
| | | | | | | | Risk Free Rate | | 0.99% (0.99%) | | Increase |
| | | | | | | | Term | | 3.25 years (3.25 years) | | Increase |
| | | | 662 | | | Market Comparables | | EBITDA Multiple | | 3.80x (3.80x) | | Increase |
Structured Products | | | 33,942 | | | Discounted Cash Flow | | Discount Rate | | 10.80% - 14.50% (11.16%) | | Decrease |
Equity/Other | | | 49,325 | | | Market Comparables | | EBITDA Multiple | | 6.50x - 10.50x (8.12x) | | Increase |
| | | | | | | | Revenue Multiple | | 0.18x (0.18x) | | Increase |
| | | 4,960 | | | Option Pricing Model | | EBITDA Multiple | | 10.60x - 12.80x (12.63x) | | Increase |
| | | | | | | | Implied Volatility | | 21.86% - 45.00% (31.04%) | | Increase |
| | | | | | | | Risk Free Rate | | 0.99% - 2.60% (1.35%) | | Increase |
| | | | | | | | Term | | 3.25 years - 10.00 years (4.01 years) | | Increase |
| | | | | | | | Yield | | 0.00% - 5.00% (0.05%) | | Decrease |
| | | | | | | | Additional Discounts | | 20.00% - 88.10% (47.55%) | | Decrease |
| | | 44,593 | | | Net Asset Value | | Underlying Assets/Liabilities | | N/A | | Increase |
| | | | 1,688 | | | Discounted Cash Flow | | Discount Rate | | 12.20% - 13.10% (12.98%) | | Decrease |
Total | | | $1,240,542 | | | | | | | | | |
| | | | | | | | | | | | |
36
| | | | | | | | | | | | |
As of December 31, 2013 |
| Asset Group | | Fair Value (1)(2) | | | Valuation Techniques(3) | | Unobservable Inputs | | Range (Weighted Average) (4) | | Impact to Valuation
from an Increase in
Input(5) |
Senior Debt | | | $611,276 | | | Discounted Cash Flow | | Discount Rate | | 7.36% - 14.37% (11.12%) | | Decrease |
| | | | | | | | Market Yield | | 5.92% - 10.60% (8.58%) | | Decrease |
| | | | | | | | Yield Premium | | 0.00% - 4.00% (2.31%) | | Decrease |
| | | | | | | | Weighted Average Cost of Capital | | 6.60% - 14.20% (10.61%) | | Decrease |
| | | | | | | | | EBITDA Multiple | | 5.00x - 9.50x (8.08x) | | Increase |
Subordinated Debt | | | 171,921 | | | Discounted Cash Flow | | Discount Rate | | 11.26% - 15.51% (14.77%) | | Decrease |
| | | | | | | | Market Yield | | 6.30% - 11.92% (11.12%) | | Decrease |
| | | | | | | | Yield Premium | | 4.00% (4.00%) | | Decrease |
| | | | | | | | Weighted Average Cost of Capital | | 7.70% - 15.20% (14.36%) | | Decrease |
| | | | | | | | | EBITDA Multiple | | 7.50x - 12.00x (9.25x) | | Increase |
Structured Products | | | 3,359 | | | Broker Quote | | Bid Price | | 101.50 (101.50) | | Increase |
| | | | 52,216 | | | Discounted Cash Flow | | Discount Rate | | 11.34% (11.34%) | | Decrease |
Equity/Other – Common Stock | | | 7,061 | | | Market Comparables | | EBITDA Multiple | | 8.90x - 10.00x (9.02x) | | Increase |
Equity/Other – Equity Options | | | 15,256 | | | Discounted Cash Flow | | EBITDA Multiple | | 9.75x (9.75x) | | Increase |
| | | | | | | | | Discount Rate | | 12.00% (12.00%) | | Decrease |
Equity/Other – Overriding Royalty Interest | | | 2,354 | | | Discounted Cash Flow | | Discount Rate | | 13.71% (13.71%) | | Decrease |
Total | | | $863,443 | | | | | | | | | |
| | | | | | | | | | | | |
| (1) | The TRS was valued in accordance with the TRS agreements as discussed in Note 2. See Note 4 for quantitative disclosures of the current period determinations of the fair value of the TRS. |
| (2) | Certain investments may be valued at cost for a period of time after an acquisition as the best indicator of fair value. |
| (3) | For the assets and investments that have more than one valuation technique, the Company may rely on the stated techniques individually or in the aggregate based on a weight ascribed to each valuation technique, ranging from 0 – 100%. Indicative broker quotes obtained for valuation purposes are reviewed by the Company relative to other valuation techniques. |
| (4) | Weighted average amounts are based on the estimated fair values. |
| (5) | This column represents the directional change in the fair value of the Level 3 investments that would result from an increase to the corresponding unobservable input. A decrease to the input would have the opposite effect. Significant changes in these inputs in isolation could result in significantly higher or lower fair value measurements. |
The above tables represent the significant unobservable inputs as they relate to the Company’s determination of fair values for the majority of its investments categorized within Level 3 as of September 30, 2014 and December 31, 2013. In addition to the techniques and inputs noted in the table above, according to the Company’s valuation policy, it may also use other valuation techniques and methodologies when determining the fair value estimates for the Company’s investments. Any significant increases or decreases in the unobservable inputs would result in significant increases or decreases in the fair value of the Company’s investments.
Investments that do not have a readily available market value are valued utilizing a market approach, an income approach (i.e. discounted cash flow approach), or both approaches, as appropriate. The market comparables approach uses prices, including third-party indicative broker quotes, and other relevant information generated by market transactions involving identical or comparable assets or liabilities (including a business). The income approach uses valuation techniques to convert future amounts (for example, cash flows or earnings) that are discounted based on a required or expected discount rate to derive a single present value amount. The measurement is based on the value indicated by current market expectations about those future amounts. In following these approaches, the types of factors that the Company may take into account to determine the fair value of its investments include, as relevant: available current market data, including an assessment of the credit quality of the security’s issuer, relevant and applicable market trading and transaction comparables, applicable market yields and multiples, illiquidity discounts, security covenants, call protection provisions, information rights, the nature and realizable value of any collateral, the portfolio company’s ability to make payments, its earnings and cash flows, the markets in which the portfolio company does business, comparisons of financial ratios of peer companies that are public, data derived from mergers and acquisitions activities for comparable companies, and enterprise values, among other factors.
37
The following tables provide reconciliations for the three and nine months ended September 30, 2014 of investments for which Level 3 inputs were used in determining fair value (amounts in thousands):
| | | | | | | | | | | | | | | | | | | | | | | | |
| | | Three Months Ended September 30, 2014 | |
| | | Senior | | | Subordinated | | | Structured | | | Equity/ | | | Total Return | | | | |
| | | Debt | | | Debt | | | Products | | | Other | | | Swaps | | | Total | |
Fair Value Balance as of July 1, 2014 | | $ | 801,501 | | | $ | 190,221 | | | $ | 36,053 | | | $ | 61,047 | | | $ | 491 | | | $ | 1,089,313 | |
Additions(1) | | | 111,235 | | | | 58,655 | | | | - | | | | 42,455 | | | | - | | | | 212,345 | |
Net realized gains (2) | | | 311 | | | | - | | | | - | | | | - | | | | 938 | | | | 1,249 | |
Net change in unrealized appreciation (depreciation)(3) | | | (9,838 | ) | | | (12,408 | ) | | | (2,111 | ) | | | 1,641 | | | | (1,510 | ) | | | (24,226 | ) |
Sales or repayments(4) | | | (34,315 | ) | | | (336 | ) | | | - | | | | (4,577 | ) | | | (938 | ) | | | (40,166 | ) |
Net discount accretion | | | 650 | | | | 358 | | | | - | | | | - | | | | - | | | | 1,008 | |
Transfers into Level 3 | | | - | | | | - | | | | - | | | | - | | | | - | | | | - | |
| | | | | | | | | | | | | | | | | | | | | | | | |
Fair Value Balance as of September 30, 2014 | | $ | 869,544 | | | $ | 236,490 | | | $ | 33,942 | | | $ | 100,566 | | | $ | (1,019 | ) | | $ | 1,239,523 | |
| | | | | | | | | | | | | | | | | | | | | | | | |
Change in net unrealized appreciation (depreciation) in investments still held as of September 30, 2014(3) | | $ | (9,089 | ) | | $ | (9,182 | ) | | $ | (2,111 | ) | | $ | 1,641 | | | $ | (1,510 | ) | | $ | (20,251 | ) |
| |
| | | Nine Months Ended September 30, 2014 | |
| | | Senior | | | Subordinated | | | Structured | | | Equity/ | | | Total Return | | | | |
| | | Debt | | | Debt | | | Products | | | Other | | | Swaps | | | Total | |
Fair Value Balance as of January 1, 2014 | | $ | 611,276 | | | $ | 171,921 | | | $ | 55,575 | | | $ | 24,671 | | | $ | 1,861 | | | $ | 865,304 | |
Additions(1) | | | 409,176 | | | | 82,085 | | | | - | | | | 80,706 | | | | - | | | | 571,967 | |
Net realized gains (losses)(2) | | | 605 | | | | 466 | | | | (199 | ) | | | - | | | | 3,332 | | | | 4,204 | |
Net change in unrealized appreciation (depreciation)(3) | | | 2,066 | | | | (9,864 | ) | | | 3,165 | | | | 7,319 | | | | (2,880 | ) | | | (194 | ) |
Sales or repayments(4) | | | (155,201 | ) | | | (9,041 | ) | | | (24,597 | ) | | | (4,601 | ) | | | (3,332 | ) | | | (196,772 | ) |
Net discount accretion (premium amortization) | | | 1,622 | | | | 923 | | | | (2 | ) | | | - | | | | - | | | | 2,543 | |
Transfers out of Level 3 | | | - | | | | - | | | | - | | | | (7,529 | ) | | | - | | | | (7,529 | ) |
Transfers into Level 3 | | | - | | | | - | | | | - | | | | - | | | | - | | | | - | |
| | | | | | | | | | | | | | | | | | | | | | | | |
Fair Value Balance as of September 30, 2014 | | $ | 869,544 | | | $ | 236,490 | | | $ | 33,942 | | | $ | 100,566 | | | $ | (1,019 | ) | | $ | 1,239,523 | |
| | | | | | | | | | | | | | | | | | | | | | | | |
Change in net unrealized appreciation (depreciation) in investments still held as of September 30, 2014(3) | | $ | 3,251 | | | $ | (6,453 | ) | | $ | 3,199 | | | $ | 7,319 | | | $ | (2,880 | ) | | $ | 4,436 | |
| (1) | Includes increases in the cost basis of investments resulting from new and add-on portfolio investments or the capitalization of PIK interest. |
| (2) | Included in net realized gain (loss) in the condensed consolidated statements of operations. |
| (3) | Included in net change in unrealized appreciation/depreciation in the condensed consolidated statements of operations. |
| (4) | Includes principal payments/paydowns on debt investments, collection of PIK interest, TRS settlement payments, proceeds from sales of investments and distributions received on equity investments classified as return of capital. |
38
The following tables provide reconciliations for the three and nine months ended September 30, 2013 of investments for which Level 3 inputs were used in determining fair value (amounts in thousands):
| | | | | | | | | | | | | | | | | | | | |
| | | Three Months Ended September 30, 2013 | |
| | | Senior | | | Subordinated | | | Equity/ | | | Total Return | | | | |
| | | Debt | | | Debt | | | Other | | | Swaps | | | Total | |
Fair Value Balance as of July 1, 2013 | | $ | 165,663 | | | $ | 11,814 | | | $ | 624 | | | $ | 5,958 | | | $ | 184,059 | |
Additions(1) | | | 237,706 | | | | 122,127 | | | | 20,013 | | | | - | | | | 379,846 | |
Net realized gains (2) | | | 58 | | | | - | | | | - | | | | 7,314 | | | | 7,372 | |
Net change in unrealized appreciation (depreciation)(3) | | | 4,171 | | | | 1,712 | | | | 40 | | | | (5,120 | ) | | | 803 | |
Sales or repayments(4) | | | (1,629 | ) | | | - | | | | - | | | | (7,314 | ) | | | (8,943 | ) |
Net discount accretion | | | 62 | | | | 30 | | | | - | | | | - | | | | 92 | |
Transfers out of Level 3 | | | (7,840 | ) | | | - | | | | - | | | | - | | | | (7,840 | ) |
| | | | | | | | | | | | | | | | | | | | |
Fair Value Balance as of September 30, 2013 | | $ | 398,191 | | | $ | 135,683 | | | $ | 20,677 | | | $ | 838 | | | $ | 555,389 | |
| | | | | | | | | | | | | | | | | | | | |
Change in net unrealized appreciation (depreciation) in investments still held as of September 30, 2013(3) | | $ | 4,164 | | | $ | 1,712 | | | $ | 40 | | | $ | (5,119 | ) | | $ | 771 | |
| |
| | | Nine Months Ended September 30, 2013 | |
| | | Senior | | | Subordinated | | | Equity/ | | | Total Return | | | | |
| | | Debt | | | Debt | | | Other | | | Swaps | | | Total | |
Fair Value Balance as of January 1, 2013 | | $ | 86,591 | | | $ | 6,208 | | | $ | 453 | | | $ | 1,349 | | | $ | 94,601 | |
Additions(1) | | | 340,525 | | | | 128,065 | | | | 20,013 | | | | - | | | | 488,603 | |
Net realized gains (2) | | | 118 | | | | - | | | | - | | | | 9,839 | | | | 9,957 | |
Net change in unrealized appreciation (depreciation)(3) | | | 3,551 | | | | 1,381 | | | | 211 | | | | (511 | ) | | | 4,632 | |
Sales or repayments(4) | | | (8,030 | ) | | | - | | | | - | | | | (9,839 | ) | | | (17,869 | ) |
Net discount accretion | | | 711 | | | | 29 | | | | - | | | | - | | | | 740 | |
Transfers out of Level 3 | | | (25,275 | ) | | | - | | | | - | | | | - | | | | (25,275 | ) |
| | | | | | | | | | | | | | | | | | | | |
Fair Value Balance as of September 30, 2013 | | $ | 398,191 | | | $ | 135,683 | | | $ | 20,677 | | | $ | 838 | | | $ | 555,389 | |
| | | | | | | | | | | | | | | | | | | | |
Change in net unrealized appreciation (depreciation) in investments still held as of September 30, 2013(3) | | $ | 4,112 | | | $ | 1,381 | | | $ | 211 | | | $ | (511 | ) | | $ | 5,193 | |
| (1) | Includes increases in the cost basis of investments resulting from new and add-on portfolio investments and the capitalization of PIK interest. |
| (2) | Included in net realized gain (loss) in the condensed consolidated statements of operations. |
| (3) | Included in net change in unrealized appreciation/depreciation in the condensed consolidated statements of operations. |
| (4) | Includes principal repayments on debt investments, collection of PIK interest, TRS settlement payments and sales of debt investments. |
No securities were transferred into the Level 3 hierarchy and one was transferred out of the Level 3 hierarchy during the nine months ended September 30, 2014. Seven securities were transferred out of the Level 3 hierarchy during the nine months ended September 30, 2013. These investments were transferred at fair value as of the beginning of the quarter in which they were transferred. The classification transfers between Level 3 and Level 2 were based on the observed changes in liquidity based on information supplied by a third party pricing source, whereby such liquidity information is routinely reviewed no less frequently than monthly. All realized and unrealized gains and losses are included in earnings and are reported as separate line items within the Company’s condensed consolidated statements of operations.
39
| 6. | Agreements and Related Party Transactions |
CNL, certain CNL affiliates, and KKR receive compensation for advisory services and/or reimbursement of expenses in connection with (i) the performance and supervision of administrative services (ii) investment advisory activities, and (iii) the offering of the Company’s common stock.
CNL Securities Corp., an affiliate of CNL, serves as the managing dealer of the Company’s Offerings and in connection therewith receives selling commissions of up to 7% of gross offering proceeds and a marketing support fee of up to 3% of gross offering proceeds. All or any portion of these fees may be reallowed to participating brokers as determined by CNL Securities Corp. The Company will pay a maximum sales load of 10% of gross offering proceeds for all combined selling commissions and marketing support fees.
The Company is a party to an investment advisory agreement with CNL, as amended (the “Investment Advisory Agreement”) for the overall management of the Company’s investment activities. The Company and CNL have entered into a sub-advisory agreement with KKR (the “Sub-Advisory Agreement”), under which KKR is responsible for the day-to-day management of the Company’s investment portfolio. CNL compensates KKR for advisory services that it provides to the Company with 50% of the base management fees and performance-based incentive fees that CNL receives under the Investment Advisory Agreement. CNL earns a base management fee equal to an annual rate of 2% of the Company’s average gross assets as of the end of the two most recently completed months and it is computed and paid monthly. The computation of gross assets includes TRS unrealized depreciation or appreciation and collateral posted with custodian in connection with TRS, and excludes deferred offering expense. CNL also earns a performance-based incentive fee that is comprised of the following two parts:
(i) a subordinated incentive fee on pre-incentive fee net investment income, that is paid quarterly if earned, and it is computed as the sum of (A) 100% of quarterly pre-incentive fee net investment income in excess of 1.75% of average adjusted capital up to a limit of 0.4375% of average adjusted capital, and (B) 20% of pre-incentive fee net investment income in excess of 2.1875% of average adjusted capital and
(ii) an incentive fee on capital gains that is paid annually if earned, and it is equal to 20% of (A) all realized gains on a cumulative basis from inception, net of (1) all realized losses on a cumulative basis, (2) unrealized depreciation at year end and (3) disregarding any net realized gains associated with the TRS interest spread (which represents the difference between (a) the interest and fees received on total return swaps, and (b) the financing fees paid to the TRS counterparty), and subtracting (B) the aggregate amount of any previously paid incentive fee on capital gains.
The terms of the Investment Advisory Agreement entitle CNL (and indirectly KKR) to receive up to 5% of gross proceeds in connection with the Offerings as reimbursement for organization and offering expenses incurred by the Advisors on behalf of the Company. Through the completion of the Initial Offering, the Advisors were reimbursed $0.90 million for organization expenses and $10.84 million for offering expenses. At the conclusion of the Initial Offering, the final reimbursement rate for organization and offering expenses was 0.8% of gross offering proceeds. During the nine months ended September 30, 2014, the offering expense reimbursement rate for the Follow-On Offering was 0.9% of gross offering proceeds.
Under the terms of the Investment Advisory Agreement, the Advisors are entitled to reimbursement of certain expenses incurred on behalf of the Company in connection with its investment operations and investment transactions.
The Company is a party to an administrative services agreement with CNL (the “Administrative Services Agreement”) whereby CNL performs, and oversees the performance of, various administrative services on behalf of the Company. Administrative services may include transfer agency oversight and supervisory services, shareholder communication services, general ledger accounting services, calculating the Company’s net asset value, maintaining required corporate and financial records, financial reporting for the Company and its subsidiaries, internal audit services, reporting to the Company’s board of directors and lenders, preparing and filing income tax returns, preparing and filing SEC reports, preparing, printing and disseminating shareholder reports, overseeing the payment of the Company’s expenses and shareholder distributions, administering the quarterly share repurchase programs, compliance services, and management and oversight of service providers in their performance of administrative and professional services rendered for the Company. CNL may also enter into agreements with its affiliates for the performance of select administrative services. The Company reimburses CNL for the professional services and expenses it incurs in performing its administrative obligations on behalf of the Company. CNL also receives reimbursement payments from the Company for professional services provided by certain officers of the Company.
40
On June 7, 2011, the Company entered into an Expense Support and Conditional Reimbursement Agreement, as amended (the “Expense Support Agreement”), with CNL and KKR pursuant to which CNL and KKR jointly and severally agreed to pay to the Company certain operating expenses (an “Expense Support Payment”) during the period between June 17, 2011 through June 30, 2012. During the term of the Expense Support Agreement, the Company received Expense Support Payments from its Advisors in the cumulative amount of $2.97 million. The Company made reimbursement payments of $1.14 million and $1.83 million to its Advisors during the nine months ended September 30, 2014 and 2013, respectively. All reimbursement payments to the Advisors were accrued as of December 31, 2013 and as of September 30, 2014, all Expense Support Payments received from the Advisors have been repaid by the Company.
Related party fees, expenses and reimbursement of expenses incurred by the Company in the three and nine months ended September 30, 2014 and 2013 are summarized below (amounts in thousands):
| | | | | | | | | | | | | | | | | | |
| | | | | Three Months Ended
September 30, | | | Nine Months Ended
September 30, | |
Related Party | | Source Agreement & Description | | 2014 | | | 2013 | | | 2014 | | | 2013 | |
CNL Securities Corp. | | Managing Dealer Agreement: Selling commissions and marketing support fees | | $ | 19,495 | | | $ | 23,054 | | | $ | 51,195 | | | $ | 62,832 | |
| | | | | |
CNL and KKR | | Investment Advisory Agreement: Base management fees (investment advisory fees) | | | 12,561 | | | | 8,098 | | | | 34,506 | | | | 19,449 | |
| | | | | |
CNL and KKR | | Investment Advisory Agreement: Subordinated incentive fee on income(1) | | | 6,763 | | | | 1,707 | | | | 11,926 | | | | 1,707 | |
| | | | | |
CNL and KKR | | Investment Advisory Agreement: Incentive fee on capital gains(2) | | | - | | | | - | | | | - | | | | - | |
| | | | | |
CNL and KKR | | Investment Advisory Agreement: Organization and offering expenses reimbursement(3) | | | 1,585 | | | | 2,464 | | | | 4,961 | | | | 6,456 | |
| | | | | |
KKR | | Investment Sub-Advisory Agreement: Investment expenses reimbursement | | | 226 | | | | - | | | | 683 | | | | - | |
| | | | | |
CNL | | Administrative Services Agreement: Administrative and compliance services(4) | | | 511 | | | | 414 | | | | 1,574 | | | | 1,104 | |
| (1) | Subordinated incentive fees on income are included in performance-based incentive fees in the condensed consolidated statements of operations. During the nine months ended September 30, 2014, $10.44 million of subordinated incentive fees on income were paid to the Advisors, of which $5.28 million was recorded as a payable to the Advisors as of December 31, 2013. As of September 30, 2014, a subordinated incentive fee on income of $6.76 million was payable to the Advisors. The Company did not pay any subordinated incentive fees on income during the nine months ended September 30, 2013. |
| (2) | Incentive fees on capital gains are included in performance-based incentive fees in the condensed consolidated statements of operations. The following table provides additional details for the incentive fee on capital gains for the nine months ended September 30, 2014 and 2013 (amounts in thousands): |
| | | | | | | | |
Incentive Fee on Capital Gains for the Nine Months Ended September 30, | | 2014 | | | 2013 | |
Accrued incentive fee on capital gains as of January 1, | | $ | 11,128 | | | $ | 2,087 | |
Incentive fee on capital gains expense during the nine months ended September 30, | | | 3,399 | | | | 4,321 | |
Less: Incentive fee on capital gains paid to the Advisors during the nine months ended September 30, | | | (2,323 | ) | | | - | |
| | | | | | | | |
Accrued incentive fee on gains as of September 30, | | | 12,204 | | | | 6,408 | |
Less: Incentive fee on capital gains unearned by the Advisors as of September 30, | | | (12,204 | ) | | | (6,408 | ) |
| | | | | | | | |
Incentive fee on capital gains earned by and payable to the Advisors as of September 30, | | $ | - | | | $ | - | |
| | | | | | | | |
| (3) | The following table provides additional details for the organization and offering expenses reimbursement (amounts in thousands): |
| | | | | | | | |
Organization and Offering Expenses Reimbursement for the Nine Months Ended September 30, | | 2014 | | | 2013 | |
Offering expenses reimbursement payable as of January 1, | | $ | 240 | | | $ | 437 | |
Additional offering expenses deferred during the nine months ended September 30, | | | 4,961 | | | | 6,456 | |
Offering expenses reimbursements payable as of September 30, | | | (342 | ) | | | (717 | ) |
| | | | | | | | |
Offering expenses reimbursements paid to the Advisors during the nine months ended September 30, | | $ | 4,859 | | | $ | 6,176 | |
| | | | | | | | |
Outstanding unreimbursed offering expenses as of September 30, | | $ | - | | | $ | 582 | |
| | | | | | | | |
41
| (4) | Includes $0.16 million and $0.11 million for reimbursement payments to CNL for services provided to the Company for its Chief Compliance Officer and Chief Financial Officer for the three months ended September 30, 2014 and 2013, respectively, and $0.49 million and $0.33 million for reimbursement payments to CNL for services provided to the Company for its Chief Compliance Officer and Chief Financial Officer for the nine months ended September 30, 2014 and 2013, respectively. |
KKR is obligated to remit to the Company any earned capital structuring fees based on the Company’s pro-rata portion of the co-investment transaction or originated investment in which the Company participates. KKR remitted capital structuring fees to the Company of $0.23 million and $1.21 million during the three and nine months ended September 30, 2014, respectively, and $6.43 million and $7.37 million during the three and nine months ended September 30, 2013, respectively. As of September 30, 2014, KKR owed an additional $0.68 million of capital structuring fees to the Company, which is recorded as receivable from advisors in the condensed consolidated statements of assets and liabilities.
Indemnification - The Investment Advisory Agreement and the Sub-Advisory Agreement provide certain indemnification to the Advisors, their directors, officers, persons associated with the Advisors, and their affiliates. The managing dealer agreement provides certain indemnification to the managing dealer and each participating broker and their respective officers, directors, partners, employees, associated persons, agents and control persons. In addition, the Company’s Articles of Incorporation provide certain indemnifications to its officers, directors, agents and certain other persons. As of September 30, 2014, management believes that the risk of incurring any losses for such indemnification is remote.
7. Earnings Per Share
The following information sets forth the computation of basic and diluted net increase in net assets from operations per share (earnings per share) (amounts in thousands, except share and per share amounts).
| | | | | | | | | | | | | | | | |
Basic and Diluted Net Increase (Decrease) in Net Assets Per Share | |
| | | Three Months Ended
September 30, | | | Nine Months Ended
September 30, | |
| | | 2014 | | | 2013 | | | 2014 | | | 2013 | |
Net increase in net assets resulting from operations | | $ | 21,835 | | | $ | 34,774 | | | $ | 102,683 | | | $ | 61,611 | |
Weighted average shares outstanding | | | 186,785,383 | | | | 115,304,666 | | | | 167,389,712 | | | | 93,148,769 | |
Diluted and Basic Earnings Per Share(1) | | $ | 0.12 | | | $ | 0.30 | | | $ | 0.61 | | | $ | 0.66 | |
| (1) | Diluted and basic net increase in net assets from operations per share were equivalent in each period because there were no common stock equivalents outstanding in each period. |
8. Distributions
The Company’s board of directors declared distributions for 39 record dates in each of the nine months ended September 30, 2014 and 2013. Declared distributions are paid monthly. The total of declared distributions and the sources of declared distributions for the nine months ended September 30, 2014 and 2013 are presented in the tables below (amounts in thousands, except per share amounts).
| | | | | | | | | | | | |
Nine Months Ended September 30, 2014 | | Per Share | | | Amount | | | Allocation | |
For the three months ended March 31, 2014 (12 record dates) | | $ | 0.180 | | | $ | 26,763 | | | | | |
For the three months ended June 30, 2014 (13 record dates) | | | 0.201 | | | | 33,170 | | | | | |
For the three months ended September 30, 2014 (14 record dates) | | | 0.217 | | | | 40,387 | | | | | |
| | | | | | | | | | | | |
Total Declared Distributions for the nine months ended September 30, 2014 | | $ | 0.598 | | | $ | 100,320 | | | | 100.0 | % |
From Net Investment Income | | $ | 0.494 | | | $ | 82,834 | | | | 82.6 | |
From Realized Gains | | | 0.068 | | | | 11,473 | | | | 11.4 | |
Distributions in Excess of Net Investment Income | | | 0.036 | | | | 6,013 | | | | 6.0 | |
| | | |
Nine Months Ended September 30, 2013 | | Per Share | | | Amount | | | Allocation | |
For the three months ended March 31, 2013 (13 record dates) | | $ | 0.195 | | | $ | 13,735 | | | | | |
For the three months ended June 30, 2013 (13 record dates) | | | 0.195 | | | | 17,807 | | | | | |
For the three months ended September 30, 2013 (13 record dates) | | | 0.195 | | | | 22,262 | | | | | |
| | | | | | | | | | | | |
Total Declared Distributions for the nine months ended September 30, 2013 | | $ | 0.585 | | | $ | 53,804 | | | | 100.0 | % |
From Net Investment Income | | $ | 0.334 | | | $ | 30,695 | | | | 57.1 | |
From Realized Gains | | | 0.176 | | | | 16,206 | | | | 30.1 | |
Distributions in Excess of Net Investment Income | | | 0.075 | | | | 6,903 | | | | 12.8 | |
42
Sources of distributions, other than net investment income and realized gains, include (i) the ordinary income component of prior year tax basis undistributed earnings and (ii) required adjustments to GAAP net investment income in the current period to determine taxable income available for distributions. The following table summarizes the primary sources of differences between (i) GAAP net investment income and (ii) taxable income available for distributions; these tax-related adjustments represent additional distribution coverage for the distributions in excess of net investment income for the nine months ended September 30, 2014 and 2013 (amounts in thousands).
| | | | | | | | | | |
Nine Months Ended September 30, | | | | 2014 | | | 2013 | |
Ordinary income component of tax basis undistributed earnings | | | | $ | 3,531 | | | $ | 819 | |
Estimated unearned performance-based incentive fee | | | | | 3,399 | | | | 3,543 | |
Offering expenses | | | | | 5,351 | | | | 4,492 | |
Net change in unrealized depreciation on total return swaps | | | | | (2,880) | | | | (511) | |
Net change in unrealized appreciation (depreciation) on foreign currency forward contracts | | | | | 31,019 | | | | (2,946) | |
| | | | | | | | | | |
Total(1) | | | | $ | 40,420 | | | $ | 5,397 | |
| | | | | | | | | | |
| (1) | The above table does not present all adjustments to calculate taxable income available for distributions. A final determination of taxable income, taxable income available for distributions and the tax classification of the full calendar year paid distributions is made annually at the end of the year. |
For the nine months ended September 30, 2014, the tax-related sources of distributions of $40.42 million were substantially greater than the distributions in excess of net investment income of $6.01 million. As a result, the Company estimates that none of the distributions declared during the nine months ended September 30, 2014 would be classified as a tax basis return of capital. The Company may, at its discretion, pay a 4% non-deductible federal excise tax on under-distribution of capital gains and taxable income. Although the tax-related sources of distributions of $5.40 million for the nine months ended September 30, 2013 were less than the distributions in excess of net investment income of $6.90 million for the same period, none of the distributions for the full 2013 calendar year were classified as a tax basis return of capital.
On September 26, 2014, the Company’s board of directors declared distributions of $0.015483 per share for eight record dates beginning on October 7, 2014 through and including November 25, 2014.
The following table summarizes the total shares issued and proceeds received in connection with the Company’s Offerings for the nine months ended September 30, 2014 and 2013 (amounts in thousands, except share and per share amounts).
| | | | | | | | | | | | | | | | |
| | | Nine Months Ended September 30, | |
| | | 2014 | | | 2013 | |
| | | Shares | | | Amount | | | Shares | | | Amount | |
Gross Proceeds from Offerings | | | 49,031,534 | | | | $ 549,847 | | | | 61,616,518 | | | | $ 676,812 | |
Commissions and Marketing Support Fees | | | - | | | | (51,195 | ) | | | - | | | | (62,832 | ) |
| | | | | | | | | | | | | | | | |
Net Proceeds to Company | | | 49,031,534 | | | | 498,652 | | | | 61,616,518 | | | | 613,980 | |
Reinvestment of Distributions | | | 5,052,427 | | | | 51,383 | | | | 2,728,786 | | | | 27,215 | |
| | | | | | | | | | | | | | | | |
Net Proceeds from Offerings | | | 54,083,961 | | | | $ 550,035 | | | | 64,345,304 | | | | $ 641,195 | |
| | | | | | | | | | | | | | | | |
Average Net Proceeds Per Share | | | $10.17 | | | | $9.96 | |
As of September 30, 2014, the Company has sold 197,787,586 shares of common stock through the Offerings, including reinvestment of distributions, for total gross proceeds of $2.16 billion.
The Company conducts quarterly tender offers pursuant to its share repurchase program. The Company currently limits the number of shares to be repurchased during any calendar year to the number of shares it can repurchase with the proceeds it receives from the issuance of shares of its common stock under its distribution reinvestment plan. At the discretion of the Company’s board of directors, the Company may also use cash on hand, cash available from borrowings and cash from the sale of investments as of the end of the applicable period to repurchase shares. The Company limits repurchases in each quarter to 2.5% of the weighted average number of shares of common stock outstanding in the prior four calendar quarters. The Company’s board of directors may amend, suspend or terminate the share repurchase program upon 30 days’ notice.
43
The following table is a summary of the share repurchases completed during the nine months ended September 30, 2014 (amounts in thousands, except share and per share amounts):
| | | | | | | | | | | | | | | | | | | | |
Repurchase Date | | Total Number of
Shares Offered
to Repurchase | | | Total Number of
Shares Repurchased | | | Total
Consideration | | | No. of Shares
Repurchased /Total Offer | | | Price Paid
per Share | |
March 3, 2014 | | | 2,612,555 | | | | 323,324 | | | $ | 3,233 | | | | 12% | | | $ | 10.00 | |
June 2, 2014 | | | 3,091,175 | | | | 307,909 | | | | 3,116 | | | | 10% | | | | 10.12 | |
August 29, 2014 | | | 3,550,268 | | | | 615,007 | | | | 6,242 | | | | 17% | | | | 10.15 | |
| | | | | | | | | | | | | | | | | | | | |
Total | | | 9,253,998 | | | | 1,246,240 | | | $ | 12,591 | | | | 13% | | | | | |
| | | | | | | | | | | | | | | | | | | | |
The following per share data and financial ratios have been derived from information provided in the unaudited condensed consolidated financial statements. The following is a schedule of financial highlights for one share of common stock during the nine months ended September 30, 2014 and 2013.
| | | | | | | | |
| | | Nine Months Ended September 30, | |
| | | 2014 | | | 2013 | |
OPERATING PERFORMANCE PER SHARE | | | | | | | | |
Net Asset Value, Beginning of Period | | $ | 10.00 | | | $ | 9.75 | |
Net Investment Income, Before Expense Support/Reimbursement(1) | | | 0.49 | | | | 0.34 | |
Expense Support/Reimbursement(1) | | | — | | | | (0.01) | |
| | | | | | | | |
Net Investment Income(1) | | | 0.49 | | | | 0.33 | |
Net Realized and Unrealized Gains (Losses)(1)(2) | | | 0.15 | | | | 0.38 | |
| | | | | | | | |
Net Increase Resulting from Investment Operations | | | 0.64 | | | | 0.71 | |
| | | | | | | | |
| | |
Distributions from Net Investment Income(3) | | | (0.49) | | | | (0.33) | |
Distributions from Realized Gains(3) | | | (0.07) | | | | (0.18) | |
Distributions in Excess of Net Investment Income(3)(4) | | | (0.04) | | | | (0.08) | |
| | | | | | | | |
Net Decrease Resulting from Distributions to Common Shareholders | | | (0.60) | | | | (0.59) | |
| | | | | | | | |
Issuance of Common Stock Above Net Asset Value(5) | | | 0.02 | | | | 0.05 | |
Repurchases of Common Stock(6) | | | — | | | | — | |
| | | | | | | | |
Net Increase Resulting from Capital Share Transactions | | | 0.02 | | | | 0.05 | |
| | | | | | | | |
Net Asset Value, End of Period | | $ | 10.06 | | | $ | 9.92 | |
| | | | | | | | |
| | |
INVESTMENT RETURNS | | | | | | | | |
Total Investment Return-Net Price(7) | | | 4.9% | | | | 6.7% | |
Total Investment Return-Net Asset Value(8) | | | 6.7% | | | | 7.9% | |
| | |
RATIOS/SUPPLEMENTAL DATA (all amounts in thousands, except ratios) | | | | | | | | |
Net Assets, End of Period | | $ | 1,970,241 | | | $ | 1,257,844 | |
Average Net Assets(9) | | $ | 1,689,396 | | | $ | 919,575 | |
Average Borrowings(9) | | $ | 524,996 | | | $ | 251,700 | |
Shares Outstanding, End of Period | | | 195,862 | | | | 126,804 | |
Weighted Average Shares Outstanding | | | 167,390 | | | | 93,149 | |
| | |
Ratios to Average Net Assets:(9) | | | | | | | | |
Total Operating Expenses Before Expense Support/Reimbursement | | | 4.72% | | | | 4.31% | |
Total Operating Expenses After Expense Support/Reimbursement | | | 4.72% | | | | 4.43% | |
Net Investment Income | | | 4.90% | | | | 3.34% | |
Total Investment Income | | | 9.63% | | | | 7.77% | |
Portfolio Turnover Rate | | | 22% | | | | 39% | |
Asset Coverage Ratio(10) | | | 4.14 | | | | 3.47 | |
| (1) | The per share data was derived by using the weighted average shares outstanding during the period. |
| (2) | The amount shown at this caption is the balancing figure derived from the other figures in the schedule. The amount shown at this caption for a share outstanding throughout the period may not agree with the change in the aggregate gains and losses in portfolio securities for the period because of the timing of sales of the Company’s shares in relation to fluctuating market values for the portfolio. |
44
| (3) | The per share data for distributions is the actual amount of distributions paid or payable per share of common stock outstanding during the entire period; distributions per share are rounded to the nearest $0.01. |
| (4) | See Note 8 for further information on the sources of distributions from other than net investment income and realized gains. |
| (5) | The continuous issuance of common stock may cause an incremental increase in net asset value per share due to the sale of shares at the then prevailing public offering price and the receipt of net proceeds per share by the Company in excess of net asset value per share on each subscription closing date. The per share data was derived by computing (i) the sum of (A) the number of shares issued in connection with subscriptions and/or distribution reinvestment on each share transaction date times (B) the differences between the net proceeds per share and the net asset value per share on each share transaction date, divided by (ii) the total shares outstanding at the end of the period. |
| (6) | The per share impact of the Company’s repurchase of common stock is a reduction to net asset value of less than $0.01 per share during the applicable period. |
| (7) | Total investment return-net price is a measure of total return for shareholders who purchased the Company’s common stock at the beginning of the period, including distributions declared during the period. Total investment return-net price is based on (i) the purchase of one share at the public offering price, net of sales load, on the first day of the period, (ii) the sale at the net asset value per share on the last day of the period, of (A) one share plus (B) any fractional shares issued in connection with the reinvestment of monthly distributions, and (iii) distributions payable relating to one share, if any, on the last day of the period. The total investment return-net price calculation assumes that (i) monthly cash distributions are reinvested in accordance with the Company’s distribution reinvestment plan and (ii) the fractional shares issued pursuant to the distribution reinvestment plan are issued at the then current public offering price, net of sales load, on each monthly distribution payment date. Since there is no public market for the Company’s shares, the terminal sales price per share is assumed to be equal to the net asset value per share on the last day of the period presented. The Company’s performance changes over time and currently may be different than that shown above. Past performance is no guarantee of future results. Investment performance is presented without regard to sales load that may be incurred by shareholders in the purchase of the Company’s shares of common stock. |
| (8) | Total investment return-net asset value is a measure of the change in total value for shareholders who held the Company’s common stock at the beginning and end of the period, including distributions declared during the period. Total investment return-net asset value is based on (i) net asset value per share on the first day of the period, (ii) the net asset value per share on the last day of the period, of (A) one share plus (B) any fractional shares issued in connection with the reinvestment of monthly distributions, and (iii) distributions payable relating to one share, if any, on the last day of the period. The total investment return-net asset value calculation assumes that (i) monthly cash distributions are reinvested in accordance with the Company’s distribution reinvestment plan and (ii) the fractional shares issued pursuant to the distribution reinvestment plan are issued at the then current public offering price, net of sales load, on each monthly distribution payment date. Since there is no public market for the Company’s shares, terminal market value per share is assumed to be equal to net asset value per share on the last day of the period presented. The Company’s performance changes over time and currently may be different than that shown above. Past performance is no guarantee of future results. Investment performance is presented without regard to sales load that may be incurred by shareholders in the purchase of the Company’s shares of common stock. |
| (9) | The computation of average net assets and average borrowings during the period is based on the daily value of net assets and borrowing balances, respectively. Ratios are not annualized. |
| (10) | Asset coverage ratio is equal to (i) the sum of (A) net assets at the end of the period and (B) debt outstanding at the end of the period, divided by (ii) total debt outstanding at the end of the period. For purposes of the asset coverage ratio test applicable to the Company as a business development company, the Company regards the TRS total notional amount at the end of the period, less the total amount of cash collateral posted by Halifax Funding under the TRS, as a senior security. These data are presented in Note 4 of the condensed consolidated financial statements. |
45
The Company’s outstanding borrowings as of September 30, 2014 and December 31, 2013 were as follows (dollar amounts in thousands):
| | | | | | | | | | | | | | | | | | | | |
| | | As of September 30, 2014 | | As of December 31, 2013 |
| | | Total Aggregate
Principal
Amount Committed | | | Outstanding
Borrowings | | | Remaining
Years Until
Maturity | | Total Aggregate
Principal
Amount Committed | | | Outstanding
Borrowings | | | Remaining
Years Until
Maturity |
Deutsche Bank Credit Facility(1) | | $ | 340,000 | | | $ | 5,000 | | | 0.3 | | $ | 265,000 | | | $ | 264,440 | | | 0.9 |
BNP Credit Facility(1) | | | 200,000 | | | | 180,450 | | | 1.0 | | | 200,000 | | | | 123,000 | | | 1.0 |
Senior Secured Revolving Credit Facility(1) | | | 490,000(2) | | | | - | | | 2.9 | | | 320,000(2) | | | | 319,949(3) | | | 3.7 |
| | | | | | | | | | | | | | | | | | | | |
Total credit facilities | | | 1,030,000 | | | | 185,450 | | | | | | 785,000 | | | | 707,389 | | | |
2014 Senior Secured Term Loan | | | 398,000 | | | | 396,132(4) | | | 4.6 | | | - | | | | - | | | |
| | | | | | | | | | | | | | | | | | | | |
Total borrowings | | $ | 1,428,000 | | | $ | 581,582 | | | | | $ | 785,000 | | | $ | 707,389 | | | |
| | | | | | | | | | | | | | | | | | | | |
| (1) | Subject to borrowing base and leverage restrictions. |
| (2) | Provides a feature that allows the Company, under certain circumstances, to increase the size of the Senior Secured Revolving Credit Facility to a maximum of $900 million and $600 million as of September 30, 2014 and December 31, 2013, respectively. |
| (3) | Includes $108.68 million denominated in Euros and $33.72 million denominated in New Zealand Dollars. |
| (4) | Comprised of outstanding principal of $398 million, net of unaccreted original issue discount of $1.87 million. |
The weighted average stated interest rate and weighted average remaining years to maturity of the Company’s outstanding borrowings as of September 30, 2014 were 3.28% and 3.5 years, respectively, and as of December 31, 2013 were 2.45% and 2.2 years, respectively.
Deutsche Bank Credit Facility
On January 28, 2014, CCT Funding, Deutsche Bank AG, New York Branch, (“Deutsche Bank”), and the other lenders party thereto entered into an amendment (the “Fourth Amendment”) to the multi-lender, revolving credit facility (“the Deutsche Bank Credit Facility”) that CCT Funding originally entered into with Deutsche Bank on August 22, 2011. The Fourth Amendment provided for, among other things, an increase in the maximum borrowings under the Tranche B1 Loans from $65 million to $140 million. The Fourth Amendment also extended the maturity date of the Tranche B1 Loans to January 28, 2015. As amended, the Tranche B1 Loans bear interest at three-month LIBOR plus 1.80%.
Interest on the Deutsche Bank Credit Facility is incurred in a range of LIBOR plus 1.80% to 2.33%. CCT Funding also pays an annual commitment fee on any unused commitment amounts of 0.50% to 0.75%. The components of interest expense, average interest rates (i.e., base interest rate in effect plus the spread) and average outstanding balances for the Deutsche Bank Credit Facility for the three and nine months ended September 30, 2014 and 2013 were as follows (amounts in thousands):
| | | | | | | | | | | | | | | | |
| | | Three Months Ended September 30, | | | Nine Months Ended September 30, | |
| | | 2014 | | | 2013 | | | 2014 | | | 2013 | |
Direct interest expense | | $ | 22 | | | $ | 1,115 | | | $ | 2,233 | | | $ | 3,385 | |
Unused commitment fees | | | 516 | | | | 142 | | | | 905 | | | | 298 | |
Amortization of deferred financing costs | | | 213 | | | | 113 | | | | 576 | | | | 442 | |
| | | | | | | | | | | | | | | | |
Total interest expense | | $ | 751 | | | $ | 1,370 | | | $ | 3,714 | | | $ | 4,125 | |
| | | | | | | | | | | | | | | | |
Weighted average interest rate | | | 2.1% | | | | 2.2% | | | | 2.3% | | | | 2.2% | |
Average borrowings | | $ | 4,402 | | | $ | 198,897 | | | $ | 128,727 | | | $ | 206,492 | |
46
BNP Credit Facility
In 2013, the Company entered into a committed facility arrangement (the “BNP Credit Facility) with BNP Paribas Prime Brokerage, Inc. (“BNP”) under which the Company may borrow up to $200 million. The Company subsequently assigned the agreements under the BNP Credit Facility to Paris Funding. Paris Funding has the right to prepay loans under the BNP Credit Facility in whole or in part at any time. BNP can recall the loans under the BNP Credit Facility with 364 days’ notice.
Paris Funding pledges certain of its assets as collateral to secure borrowings under the BNP Credit Facility. As of September 30, 2014, Paris Funding had investments with a fair value of $303.03 million pledged as collateral under the BNP Credit Facility. Interest is charged at the rate of one month LIBOR plus 1.10% and is payable monthly. Paris Funding also pays an annual commitment fee on any unused commitment amounts of 0.55% or 0.75%, depending on utilization levels. The components of interest expense, average interest rates (i.e., base interest rate in effect plus the spread) and average outstanding balances for the BNP Credit Facility for the three and nine months ended September 30, 2014 and 2013 were as follows (amounts in thousands):
| | | | | | | | | | | | | | | | |
| | | Three Months Ended September 30, | | | Nine Months Ended September 30, | |
| | | 2014 | | | 2013 | | | 2014 | | | 2013 | |
Direct interest expense | | $ | 307 | | | $ | 347 | | | $ | 847 | | | $ | 394 | |
Unused commitment fees | | | 200 | | | | 133 | | | | 631 | | | | 151 | |
Amortization of deferred financing costs | | | — | | | | 115 | | | | 208 | | | | 136 | |
| | | | | | | | | | | | | | | | |
Total interest expense | | $ | 507 | | | $ | 595 | | | $ | 1686 | | | $ | 681 | |
| | | | | | | | | | | | | | | | |
Weighted average interest rate | | | 1.3% | | | | 1.3% | | | | 1.3% | | | | 1.3% | |
Average borrowings | | $ | 95,993 | | | $ | 105,707 | | | $ | 88,990 (1) | | | $ | 99,324 (1) | |
| (1) | Average borrowings are calculated since the inception of the facility, or June 12, 2013. |
Under the terms of the BNP Credit Facility, BNP has the ability to borrow a portion of the pledged collateral (“Rehypothecated Securities”), subject to certain limits. Paris Funding may receive a fee from BNP in connection with Rehypothecated Securities meeting certain criteria. Paris Funding may designate any security within the pledged collateral as ineligible to be a Rehypothecated Security, provided there are eligible securities within the segregated custody account in an amount equal to the outstanding borrowings owed by Paris Funding to BNP. Paris Funding may recall any Rehypothecated Security at any time and BNP must, to the extent commercially reasonable, return such security or equivalent security within a commercially reasonable period. In the event BNP does not return the security, Paris Funding will have the right to, among other things, apply and set off an amount equal to 100% of the then-current fair market value of such Rehypothecated Securities against any outstanding borrowings owed to BNP under the BNP Credit Facility. Rehypothecated Securities are marked-to-market daily and if the value of all Rehypothecated Securities exceeds 100% of the outstanding borrowings owed by Paris Funding under the BNP Credit Facility, BNP may either reduce the amount of Rehypothecated Securities to eliminate such excess or deposit into the segregated custody account an amount of cash equal to such excess. Paris Funding will continue to receive interest and the scheduled repayment of principal balances on Rehypothecated Securities.
Senior Secured Revolving Credit Facility
In September 2013, the Company entered into a revolving credit facility (the “Senior Secured Revolving Credit Facility”) with certain lenders and JPMorgan Chase Bank, N.A., acting as administrative agent. The Senior Secured Revolving Credit Facility consists of loans to be made in U.S. dollars and other foreign currencies in an aggregate amount of $490 million as of September 30, 2014, with an “accordion” feature that allows the Company, under certain circumstances, to increase the size of the facility to a maximum of $900 million. Availability under the Senior Secured Revolving Credit Facility will terminate on September 4, 2016 and the outstanding loans under the Senior Secured Revolving Credit Facility will mature on September 4, 2017. The Senior Secured Revolving Credit Facility is secured by substantially all of the Company’s portfolio investments and its cash and securities accounts, excluding those held by CCT Funding, Paris Funding and Halifax Funding, and provides for a guarantee by certain other subsidiaries of the Company.
47
The stated borrowing rate under the Senior Secured Revolving Credit Facility is generally based on LIBOR plus an applicable spread of 2.50% or, with respect to borrowings in foreign currencies, on a base interest rate applicable to such currency borrowing plus an applicable spread of 2.50%. The Company also pays an annual commitment fee on any unused commitment amounts between 0.375% and 1.00%, depending on utilization levels. The components of interest expense, average interest rates (i.e., base interest rate in effect plus the spread) and average outstanding balances for the Senior Secured Revolving Credit Facility for the three and nine months ended September 30, 2014 and 2013 were as follows (amounts in thousands):
| | | | | | | | | | | | | | | | |
| | | Three Months Ended September 30, | | | Nine Months Ended September 30, | |
| | | 2014 | | | 2013 | | | 2014 | | | 2013 | |
Direct interest expense | | $ | — | | | $ | 95 | | | $ | 2,670 | | | $ | 95 | |
Unused commitment fees | | | 1,254 | | | | 82 | | | | 2,069 | | | | 82 | |
Amortization of deferred financing costs | | | 330 | | | | 65 | | | | 890 | | | | 65 | |
| | | | | | | | | | | | | | | | |
Total interest expense | | $ | 1,584 | | | $ | 242 | | | $ | 5,629 | | | $ | 242 | |
| | | | | | | | | | | | | | | | |
Weighted average interest rate | | | — % | | | | 2.7% | | | | 3.2% | | | | 2.7% | |
Average borrowings | | $ | — | | | $ | 48,772 (1) | | | | $112,236 | | | $ | 48,772 (1) | |
| (1) | Average borrowings are calculated since the inception of the facility, or September 4, 2013. |
2014 Senior Secured Term Loan
On May 20, 2014, the Company entered into a new senior secured term loan credit facility (the “2014 Senior Secured Term Loan”) with certain lenders and JPMorgan Chase Bank, N.A., as administrative agent. The 2014 Senior Secured Term Loan initially provided the Company with $398 million in gross proceeds. The 2014 Senior Secured Term Loan matures in May 2019, and generally bears interest at LIBOR plus 3.25% (with a LIBOR floor of 0.75%). The 2014 Senior Secured Term Loan includes an accordion feature permitting the Company to expand the facility if certain conditions are satisfied; provided, however, that the aggregate amount of the 2014 Senior Secured Term Loan is limited to the amount as determined from time to time which would not cause the covered debt amount (i.e., the Company’s aggregate debt under both the 2014 Senior Secured Term Loan and the Senior Secured Revolving Credit Facility, other permitted debt and certain other unsecured debt) to exceed the borrowing/collateral base.
Maturities of the 2014 Senior Secured Term Loan for the remainder of 2014 and each of the next four years and thereafter as of September 30, 2014 were as follows (amounts in thousands):
| | | | |
2014 | | $ | 1,000 | |
2015 | | | 4,000 | |
2016 | | | 4,000 | |
2017 | | | 4,000 | |
2018 | | | 4,000 | |
Thereafter | | | 381,000 | |
| | | | |
| | $ | 398,000 | |
| | | | |
The components of interest expense, average interest rates (i.e., base interest rate in effect plus the spread) and average outstanding balances for the 2014 Senior Secured Term Loan for the three and nine months ended September 30, 2014 were as follows (amounts in thousands):
| | | | | | | | |
| | | Three Months Ended | | | Nine Months Ended | |
| | | September 30, 2014 | | | September 30, 2014 | |
Direct interest expense | | $ | 4,078 | | | $ | 5,945 | |
Unused commitment fees | | | 94 | | | | 132 | |
Amortization of deferred financing costs | | | 273 | | | | 378 | |
| | | | | | | | |
Total interest expense | | $ | 4,445 | | | $ | 6,455 | |
| | | | | | | | |
Weighted average interest rate | | | 4.2% | | | | 4.2% | |
Average borrowings | | $ | 398,989 | | | $ | 399,298(1) | |
| (1) | Average borrowings for the 2014 Senior Secured Term Loan for nine months ended September 30, 2014 are calculated since the inception of the facility, or May 20, 2014. |
48
In connection with each of the credit facilities and 2014 Senior Secured Term Loan, the Company has made customary representations and warranties and is required to comply with various covenants, reporting requirements and other customary requirements for similar facilities. As of both September 30, 2014 and December 31, 2013, the Company believes it was in compliance with the covenant requirements for all of its credit facilities and term loan.
| 12. | Commitments and Contingencies |
Unfunded commitments to provide funds to portfolio companies are not recorded in the Company’s condensed consolidated statements of assets and liabilities. The Company’s unfunded commitments may be significant from time to time. Since these commitments may expire without being drawn upon, the total commitment amount does not necessarily represent future cash requirements. The Company intends to use cash flow from scheduled and early principal repayments and proceeds from borrowings and common stock offerings to fund these commitments. As of September 30, 2014, the Company’s unfunded commitments consisted of the following (amounts in thousands):
| | | | | | | | |
Unfunded Commitments | | No. Investments | | | Amount | |
Term loans | | | 2 | | | $ | 69,935 | |
Delayed draw loans | | | 2 | | | | 20,692 | |
Equity investments | | | 4 | | | | 174,432 | |
| | | | | | | | |
Total unfunded commitments | | | 8 | | | $ | 265,059 | |
| | | | | | | | |
In the normal course of business, the Company may enter into guarantees on behalf of portfolio companies. Under these arrangements, the Company would be required to make payments to third parties if the portfolio companies were to default on their related payment obligations. The Company has no such guarantees outstanding at September 30, 2014 and December 31, 2013.
During the nine months ended September 30, 2014, the Company recorded federal and state deferred income tax benefits related to its Taxable Subsidiaries resulting in a net deferred tax asset of approximately $1.30 million, which was primarily comprised of net operating losses and unrealized depreciation in the investments. The Company recorded a valuation allowance against the full amount of the deferred tax asset because as of September 30, 2014, it believed that it was more likely than not that the deferred tax asset would not be realized in future periods. For the nine months ended September 30, 2014, the Taxable Subsidiaries had an effective tax rate of zero.
On October 14, 2014, the Company filed a tender offer statement with the SEC on Schedule TO. The Company is offering to repurchase up to 4,000,694 shares of its common stock at a cash price of $10.06 per share, with an expiration of 5:00 p.m., Central Time, November 26, 2014.
On October 29, 2014, the Company filed a shelf registration statement with the SEC on Form N-2. The shelf registration statement has not yet been declared effective by the SEC. The shelf registration statement provides for the Company to offer, from time to time, up to $500 million of its securities, on terms to be determined at the time of each such offering.
On November 6, 2014, Halifax Funding entered into an amendment (the “First Amendment”) to its BNP Credit Facility. Among other things, the First Amendment allows BNP to terminate the BNP Credit Facility with 29 days’ notice if BNP’s long-term credit rating has declined to a level three or more notches below its highest rating by S&P, Moody’s or Fitch. The First Amendment also revises the annual commitment fee on any unused commitment amounts to 0.40% or 0.50%, depending on utilization levels.
49
| Item 2. | Management’s Discussion and Analysis of Financial Condition and Results of Operations |
The following discussion is based on the unaudited condensed consolidated financial statements as of September 30, 2014 and December 31, 2013, and for the three and nine months ended September 30, 2014 and 2013. Amounts as of December 31, 2013 included in the unaudited condensed consolidated financial statements have been derived from the audited consolidated financial statements as of that date. This information should be read in conjunction with the accompanying unaudited condensed consolidated financial statements and the notes thereto, as well as, the audited consolidated financial statements, notes and management’s discussion and analysis of financial condition and results of operations included in our Annual Report on Form 10-K for the year ended December 31, 2013. Capitalized terms used in this Item 2 have the same meaning as in the accompanying condensed consolidated financial statements in Item 1 unless otherwise defined herein.
Statement Regarding Forward-Looking Information
The following information contains statements that constitute forward-looking statements within the meaning of Section 27A of the Securities Act of 1933, as amended, and Section 21E of the Securities Exchange Act of 1934 (the “Exchange Act”). These statements generally are characterized by the use of terms such as “may,” “should,” “plan,” “anticipate,” “estimate,” “intend,” “predict,” “believe” and “expect” or the negative of these terms or other comparable terminology. Although we believe that the expectations reflected in such forward-looking statements are based upon reasonable assumptions, our actual results could differ materially from those set forth in the forward-looking statements. Some factors that might cause such a difference include the following: the current global economic downturn, increased direct competition, changes in government regulations or accounting rules, changes in local, national and global capital market conditions, our ability to obtain or maintain credit lines or credit facilities on satisfactory terms, changes in interest rates, availability of proceeds from our offering of shares, our ability to identify suitable investments, our ability to close on identified investments, inaccuracies of our accounting estimates, our ability to locate suitable borrowers for our loans and the ability of such borrowers to make payments under their respective loans. Given these uncertainties, we caution you not to place undue reliance on such statements, which apply only as of the date hereof. We undertake no obligation to update or revise forward-looking statements to reflect changed assumptions, the occurrence of unanticipated events or changes to future operating results over time unless otherwise required by law. The forward-looking statements should be read in light of the risk factors identified in the “Risk Factors” section of our Annual Report on Form 10-K filing for the year ended December 31, 2013 and Item 1A in Part II of this Quarterly Report.
Overview
We are a non-diversified closed-end management investment company that has elected to be treated as a business development company under the 1940 Act. Formed as a Maryland corporation on June 9, 2010, we are externally managed by CNL Fund Advisors Company (“CNL”) and KKR Credit Advisors (US) LLC, formerly known as KKR Asset Management LLC (“KKR”), collectively, the “Advisors,” which are responsible for sourcing potential investments, conducting due diligence on prospective investments, analyzing investment opportunities, structuring investments, determining the securities and other assets that we will purchase, retain or sell, and monitoring our portfolio on an ongoing basis. Both Advisors are registered as investment advisers with the Securities and Exchange Commission (the “SEC”). CNL also provides the administrative services necessary for us to operate.
Investment Objective, Investment Program and Primary Investment Types
Our investment objective is to provide our shareholders with current income and, to a lesser extent, long-term capital appreciation. We pursue our investment objective by investing primarily in the debt of privately owned U.S. companies (also referred to as “portfolio companies”) with a focus on originated transactions sourced through the networks of our Advisors. We define originated transactions as any negotiated investment where we, through our Advisors’ direct efforts, provide funds directly to a portfolio company. We also have the ability, as granted through an SEC Exemptive Order, to co-invest in privately negotiated transactions alongside other investment funds managed by or affiliated with KKR (the “Co-Investment Transactions”). We anticipate that a substantial portion of our investment portfolio will consist of senior and subordinated debt, which we believe offer potential opportunities for superior risk-adjusted returns and income generation. Our debt investments may take the form of corporate loans or bonds, may be secured or unsecured and may, in some cases, be accompanied by warrants, options or other forms of equity participation. We may separately purchase common or preferred equity interests in transactions. We may also invest in structured products, such as collateralized loan obligations, and loan participations and assignments.
As of September 30, 2014, our investment program consisted of two main components. First, since the inception of our investment activities, we have been engaged in the direct purchase of debt securities, primarily issued by portfolio companies, through both secondary market and direct lending transactions. We refer to this investment program component as our “Investment Portfolio” in this report. Second, beginning in November 2012, we supplemented our economic exposure to portfolio companies by entering into total return swap arrangements (the “TRS”) with a commercial bank counterparty and directing the creation of a portfolio of debt investments that serve as reference assets under the TRS. We refer to this investment program component as our portfolio of TRS assets or our “TRS Portfolio” in this report. In the case of our TRS Portfolio, we receive all (i) realized income and fees and (ii) realized capital gains generated by the TRS assets. In return, we must pay quarterly to the TRS counterparty a payment consisting of (i) realized capital losses generated by the TRS assets and (ii) financing costs that are based on (a) a floating financing rate and (b) the settled notional amount of TRS assets.
50
References in this report to the term “settled notional amount” in association with the TRS mean the aggregate cost of the TRS assets underlying the TRS that are settled and owned by the counterparty. In addition, this aggregate cost serves as the basis for our payments of financing charges to the counterparty under the TRS. References to the term “total notional amount” mean the settled notional amount plus the effect of the purchase and sale cost of all TRS assets where trade settlement is pending. We will receive additional economic benefit if the value of the underlying TRS asset appreciates relative to the total notional amount through the final settlement date following termination of the agreement. Conversely, we will be required to pay the counterparty the amount, if any, by which the value of the underlying TRS asset declines relative to the total notional amount through such final settlement date. We do not own, or have physical custody of, the TRS assets and the TRS assets are not direct investments by us. Our subsidiary is required to post collateral with a custodian of at least 40% of the notional amount of each TRS asset and may be required to post additional collateral in the event the value of the TRS assets decreases below a specified amount.
Our investment strategy is focused on creating and growing an Investment Portfolio that generates superior risk-adjusted returns by carefully selecting investments through rigorous due diligence and actively managing and monitoring our Investment Portfolio. When evaluating an investment and the related portfolio company, we use the resources of our Advisors to develop an investment thesis and a proprietary view of a potential portfolio company’s intrinsic value. We believe our flexible approach to investing allows us to take advantage of opportunities that offer the most favorable risk/reward characteristics.
We primarily focus on the following investment types:
| | • | | Senior Debt. We invest in senior debt, in which we generally take a security interest in the available assets of the portfolio company, including equity interests in any of its subsidiaries. These investments generally take the form of senior secured first lien loans, senior secured second lien loans or senior secured bonds. In some circumstances, our lien could be subordinated to claims of other creditors. |
| | • | | Subordinated Debt. Our subordinated debt investments are generally subordinated to senior debt and are generally unsecured. These investments are generally structured with interest-only payments throughout the life of the security, with the principal due at maturity. |
| | • | | Structured Products.We also invest in structured products, which may include collateralized debt obligations (“CDOs”), collateralized bond obligations (“CBOs”), collateralized loan obligations (“CLOs”), structured notes and credit-linked notes. The issuers of such investment products may be structured as trusts or other types of pooled investment vehicles. Such products may also involve the deposit with or purchase by an entity of the underlying investments and the issuance by that entity of one or more classes of securities backed by, or representing interests in, the underlying investments or referencing an indicator related to such investments. |
| | • | | Equity Investments. We also make selected equity investments. In addition, when we invest in senior and subordinated debt, we may acquire warrants or options to purchase equity securities or benefit from other types of equity participation. Our goal is ultimately to dispose of these equity interests and realize gains upon our disposition of such interests. |
The level of our investment activity can and does vary substantially from period to period depending on many factors, including: the demand for debt from creditworthy privately owned U.S. companies, the level of merger, acquisition and refinancing activity involving private companies, the availability of credit to finance transactions, the general economic environment, the competitive investment environment for the types of investments we currently seek and intend to seek in the future, the amount of equity capital we raise from offering common stock in our company and the amount of capital we may borrow under our revolving credit facilities.
As a business development company, we are required to comply with certain regulatory requirements. For instance, we may not acquire any assets other than “qualifying assets” as specified in the 1940 Act unless, at the time the acquisition is made, at least 70% of our total assets are qualifying assets as determined at the end of the prior quarter (with certain limited exceptions). Qualifying assets include investments in “eligible portfolio companies.” Under the relevant SEC rules, the term “eligible portfolio company” includes all private companies, companies whose securities are not listed on a national securities exchange and certain public companies that have listed their securities on a national securities exchange and have a market capitalization of less than $250 million. These rules also permit us to include as qualifying assets certain follow-on investments in companies that were eligible portfolio companies at the time of our initial investment but no longer meet the definition of eligible portfolio company at the time of the follow-on investment.
51
Revenues
We generate revenues primarily in the form of interest on the debt securities of portfolio companies that we acquire and hold for investment purposes. Our investments in debt securities generally have an expected maturity of three to ten years, although we have no lower or upper constraint on maturity, and typically earn interest at fixed or floating rates. Interest on our debt securities is generally payable to us quarterly or semi-annually. Some of our investments in debt securities contain PIK interest provisions. The outstanding principal amount of our debt securities and any accrued but unpaid interest will generally become due at the maturity date. In addition, we may generate revenue in the form of dividends from equity investments, prepayment fees, commitment fees, origination fees and fees for providing significant managerial assistance. While the TRS assets also generate interest income and fees, such amounts, net of the financing amounts, are recognized as realized gains pursuant to GAAP when payable to us quarterly.
Operating Expenses
Our primary operating expenses include a base management fee and, depending on our operating results, performance-based incentive fees, reimbursable expenses under the investment advisory agreement, interest expense and financing fees, fund administrative expenses, custodian and accounting fees, other third-party professional services and expenses and amortization of deferred offering expenses. The base management fee and performance-based incentive fees compensate the Advisors for their services in identifying, evaluating, negotiating, closing and monitoring our investments.
Financial and Operating Highlights
The following table presents financial and operating highlights as of September 30, 2014 and December 31, 2013, and the nine months ended September 30, 2014 and 2013:
| | | | | | | | |
| | | (In thousands, except ratios and per share data) | |
| | | September 30, | | | December 31, | |
As of | | 2014 | | | 2013 | |
Total assets | | $ | 2,646,492 | | | $ | 2,281,186 | |
Adjusted total assets (Total assets, net of payable for investments purchased) | | $ | 2,595,010 | | | $ | 2,180,172 | |
Investments in portfolio companies | | $ | 2,411,138 | | | $ | 1,924,869 | |
Borrowings - credit facilities and term loan | | $ | 581,582 | | | $ | 707,389 | |
Deemed borrowings (TRS implied leverage classified as senior securities) | | $ | 46,702 | | | $ | 22,410 | |
Net assets | | $ | 1,970,241 | | | $ | 1,430,434 | |
Net asset value per share | | $ | 10.06 | | | $ | 10.00 | |
Leverage ratio (Borrowings + Deemed borrowings)/Adjusted total assets) | | | 24 | % | | | 33 | % |
| | |
Activity for the Nine Months Ended | | September 30,
2014 | | | September 30,
2013 | |
Average net assets | | $ | 1,689,396 | | | $ | 919,575 | |
Average borrowings under credit facilities and term loan | | $ | 524,996 | | | $ | 251,700 | |
Cost of investments purchased | | $ | 1,260,847 | | | $ | 1,443,232 | |
Sales, principal payments and other exits | | $ | 793,787 | | | $ | 500,405 | |
Net investment income | | $ | 82,834 | | | $ | 30,695 | |
Net realized gains on investments, derivative instruments and foreign currency transactions | | $ | 11,473 | | | $ | 16,206 | |
Net change in unrealized appreciation on investments, derivative instruments and foreign currency translation | | $ | 8,376 | | | $ | 14,710 | |
Net increase in net assets resulting from operations | | $ | 102,683 | | | $ | 61,611 | |
Total distributions declared | | $ | 100,320 | | | $ | 53,804 | |
Net investment income before unearned incentive fees per share | | $ | 0.52 | | | $ | 0.39 | |
Net investment income per share | | $ | 0.49 | | | $ | 0.33 | |
Earnings per share | | $ | 0.61 | | | $ | 0.66 | |
Distributions declared per share outstanding for the entire period | | $ | 0.60 | | | $ | 0.59 | |
| | |
Summary of Common Stock Offerings for the Nine Months Ended | | September 30,
2014 | | | September 30,
2013 | |
Gross proceeds | | $ | 549,847 | | | $ | 676,812 | |
Net proceeds to Company, excluding reinvestment of distributions | | $ | 498,652 | | | $ | 613,980 | |
Average net proceeds per share | | $ | 10.17 | | | $ | 9.96 | |
Shares issued in connection with offerings, excluding reinvestment of distributions | | | 49,032 | | | | 61,617 | |
52
Business Environment
Over the last 12-months, we observed high trading volumes in high-yield bonds resulting in yields decreasing to near historical lows. Capital inflows into bank loan mutual funds were also robust over an extended period of 95 straight weeks; a streak that ended in April 2014. More recently, both high yield bond funds and bank loan mutual funds have experienced outflows resulting in some volatility for corporate debt securities in traded secondary markets. Our basic investment premise emphasizing directly originated and other private credit investments remains unchanged. We believe that privately originated transactions to both U.S. and foreign middle market companies will outperform low-yielding government bonds and high grade credit over the long-term. Meanwhile, we continue to scan for attractive opportunities in secondary credit markets resulting from specific situations and volatility in market technicals.
Moreover, we believe that we are in the middle stages of the cyclical part of the economic recovery. We do not see the credit cycle turning in the next 12 months. The health of middle market American companies remains good and we believe there is further room for companies in this space to increase cash flow. In addition, we believe regulations that burden bank-lending practices will continue to broaden the investment opportunities for non-bank investors and investment entities. We maintain a degree of caution as we progress through 2014 recognizing that credit defaults remain abnormally low and likely not sustainable. We believe continued focus on the fundamentals, including rigorous due diligence, robust credit underwriting and direct structuring of investments best positions the portfolio to protect principal and generate attractive risk-adjusted returns.
Portfolio and Investment Activity
Portfolio Investment Activity for the Nine Months ended September 30, 2014 and 2013
The following table summarizes our investment activity as of and for the nine months ended September 30, 2014 and 2013, excluding our short term investments:
| | | | | | | | | | | | | | | | |
| | | Investment Activity Summary as of and for the Nine Months Ended September 30, ($ in millions) | |
| | | 2014 | | | 2013 | |
| | | Investment Portfolio | | | TRS Portfolio | | | Investment Portfolio | | | TRS Portfolio | |
Total Fair Value | | $ | 2,411.14 | | | $ | 107.62 | | | $ | 1,666.06 | | | $ | 57.92 | |
Incremental Purchases | | $ | 1,260.85 | | | $ | 76.39 | | | $ | 1,443.23 | | | $ | 299.84 | |
Investment Sales | | $ | (442.62 | ) | | $ | (31.92 | ) | | $ | (422.38 | ) | | $ | (361.51 | ) |
Principal Payments | | $ | (351.16 | ) | | $ | (11.90 | ) | | $ | (78.03 | ) | | $ | (41.88 | ) |
No. Portfolio Companies | | | 100 | | | | 32 | | | | 111 | | | | 22 | |
Portfolio Company Additions | | | 33 | | | | 22 | | | | 72 | | | | 45 | |
Portfolio Company Exits | | | (27 | ) | | | (10 | ) | | | (87 | ) | | | (70 | ) |
No. Debt Investments | | | 111 | | | | 33 | | | | 133 | | | | 24 | |
Debt Investment Additions | | | 56 | | | | 26 | | | | 128 | | | | 69 | |
Debt Investment Exits | | | (48 | ) | | | (13 | ) | | | (157 | ) | | | (99 | ) |
No. Structured Product Investments | | | 3 | | | | — | | | | 1 | | | | — | |
No. Equity/Other Investments | | | 22 | | | | — | | | | 2 | | | | — | |
While the Investment Portfolio and the TRS Portfolio are accounted for and presented as two distinct portfolios, the two portfolios had 12 and 18 debt investment positions and 21 and 16 portfolio companies in common as of September 30, 2014 and 2013, respectively. The changes in the fair value of our Investment Portfolio and our TRS Portfolio are directly related to (i) the changes in their cost basis and notional amounts, respectively and (ii) the changes in fair value for assets held at the beginning and end of the period. First with regards to the Investment Portfolio, its cost basis increased by 27% and 137% during the nine months ended September 30, 2014 and 2013, respectively. The fair value of our Investment Portfolio, excluding our short term investments, increased by 25% and 139% during the nine months ended September 30, 2014 and 2013, respectively. Second with regards to the TRS Portfolio, the TRS Portfolio total notional amount increased by 84% during the nine months ended September 30, 2014 and decreased by 64% during the nine months ended September 30, 2013. The fair value of our TRS Portfolio increased by 79% during the nine months ended September 30, 2014 and decreased by 65% during the nine months ended September 30, 2013.
53
As discussed above under “— Overview,” since receiving our SEC Exemptive Order in May 2013, we have increased our focus on originated investments, including Co-Investment Transactions, as a main element of our investment strategy. Co-Investment Transactions give us the opportunity to participate in those investments alongside KKR’s institutional clients and proprietary funds. Our total origination activity, at cost, plus unfunded commitments relating to such investments totaled approximately $666 million for the nine months ended September 30, 2014, representing 39% of approximately $1.7 billion in total originations by KKR in Co-Investment Transactions for the period.
The following summarizes our investment activity associated with our investment focus on originated debt investments during the nine months ended September 30, 2014 and 2013 and the status of originated investments held in the Investment Portfolio as of September 30, 2014 and December 31, 2013:
| | | | | | | | |
| | | September 30, | | | September 30, | |
Originated Investment Activity for the Nine Months Ended ($ in millions) | | 2014 | | | 2013 | |
Number of originated investments, by issuer | | | 16 | | | | 7 | |
Total amount of originated investments, at cost | | $ | 497.74 | | | $ | 379.96 | |
Originated investments as a percentage of total investment activity | | | 37.6 | % | | | 26.3 | % |
Fee income recognized in connection with originated investments | | $ | 1.89 | | | $ | 7.37 | |
| | |
Originated Investments Summary as of($ in millions) | | September 30,
2014 | | | December 31,
2013 | |
Total originated investments, at fair value | | $ | 1,141.22 | | | $ | 713.02 | |
Total originated investments as a percentage of total Investment Portfolio, at fair value | | | 47.3 | % | | | 37.0 | % |
Estimated forward-looking annual yield of originated debt investments(1) | | | 11.4 | % | | | 11.6 | % |
| (1) | The estimated forward-looking annual yield on debt investments is based on amortized cost as of the end of the applicable period. The estimated forward-looking annual yield for our debt investments is represented by a fraction, (i) the numerator of which is the sum of (a) the annual interest rate of each debt investment multiplied by its par amount as of the end of the applicable reporting period, plus (b) the annual amortization of the purchase or original issue discount or premium of each debt investment, if any; and (ii) the denominator of which is the total amortized cost of all debt investments included in the calculated group as of the end of the applicable reporting period. |
The following information presents additional segmentation analysis of our Investment Portfolio and TRS Portfolio. Our investment program is not managed with any specific asset category target goals.
The following tables summarize the investment type segmentation of our Investment Portfolio and our TRS Portfolio based on fair value as of September 30, 2014 and December 31, 2013, excluding our short term investments:
| | | | | | | | | | | | | | | | |
| | | Fair Value Summary as of September 30, 2014 ($ in thousands) | |
Asset Category | | Investment Portfolio
at Fair Value | | | Percentage of
Investment Portfolio | | | TRS Portfolio at
Fair Value | | | Percentage of
TRS Portfolio | |
Senior debt | | | | | | | | | | | | | | | | |
Senior secured loans - first lien | | $ | 881,948 | | | | 36.6 | % | | $ | 90,192 | | | | 83.8 | % |
Senior secured loans - second lien | | | 745,354 | | | | 30.9 | | | | 9,584 | | | | 8.9 | |
Senior secured bonds | | | 164,983 | | | | 6.8 | | | | 7,202 | | | | 6.7 | |
| | | | | | | | | | | | | | | | |
Total senior debt | | | 1,792,285 | | | | 74.3 | | | | 106,978 | | | | 99.4 | |
Subordinated debt | | | 476,939 | | | | 19.8 | | | | 644 | | | | 0.6 | |
Structured products | | | 33,942 | | | | 1.4 | | | | — | | | | — | |
Equity/Other | | | 107,972 | | | | 4.5 | | | | — | | | | — | |
| | | | | | | | | | | | | | | | |
Total | | $ | 2,411,138 | | | | 100.0 | % | | $ | 107,622 | | | | 100.0 | % |
| | | | | | | | | | | | | | | | |
| | | | | | | | | | | | | | | | |
| | | Fair Value Summary as of December 31, 2013 ($ in thousands) | |
Asset Category | | Investment Portfolio
at Fair Value | | | Percentage of
Investment Portfolio | | | TRS Portfolio at
Fair Value | | | Percentage of
TRS Portfolio | |
Senior debt | | | | | | | | | | | | | | | | |
Senior secured loans - first lien | | $ | 638,403 | | | | 33.2 | % | | $ | 35,239 | | | | 58.6 | % |
Senior secured loans - second lien | | | 670,961 | | | | 34.8 | | | | 6,335 | | | | 10.6 | |
Senior secured bonds | | | 165,128 | | | | 8.6 | | | | 11,008 | | | | 18.3 | |
| | | | | | | | | | | | | | | | |
Total senior debt | | | 1,474,492 | | | | 76.6 | | | | 52,582 | | | | 87.5 | |
Subordinated debt | | | 370,131 | | | | 19.2 | | | | 7,514 | | | | 12.5 | |
Structured products | | | 55,575 | | | | 2.9 | | | | — | | | | — | |
Equity/Other | | | 24,671 | | | | 1.3 | | | | — | | | | — | |
| | | | | | | | | | | | | | | | |
Total | | $ | 1,924,869 | | | | 100.0 | % | | $ | 60,096 | | | | 100.0 | % |
| | | | | | | | | | | | | | | | |
54
The following tables summarize the investment type segmentation of our Investment Portfolio based on amortized cost and the TRS Portfolio based on total notional amounts as of September 30, 2014 and December 31, 2013. The primary investment type concentrations include (i) senior debt and (ii) subordinated debt securities.
| | | | | | | | | | | | | | | | |
| | | Investment Portfolio Amortized Cost and TRS Notional Amount Summary as of September 30, 2014
($ in thousands) | |
Asset Category | | Investment Portfolio
at Amortized Cost | | | Percentage of
Investment Portfolio | | | TRS Portfolio at
Notional Amount | | | Percentage of
TRS Portfolio | |
Senior debt | | | | | | | | | | | | | | | | |
Senior secured loans - first lien | | $ | 882,037 | | | | 36.8 | % | | $ | 92,361 | | | | 83.9 | % |
Senior secured loans - second lien | | | 739,866 | | | | 30.9 | | | | 9,771 | | | | 8.9 | |
Senior secured bonds | | | 162,503 | | | | 6.8 | | | | 7,315 | | | | 6.6 | |
| | | | | | | | | | | | | | | | |
Total senior debt | | | 1,784,406 | | | | 74.5 | | | | 109,447 | | | | 99.4 | |
Subordinated debt | | | 479,375 | | | | 20.0 | | | | 656 | | | | 0.6 | |
Structured products | | | 30,721 | | | | 1.3 | | | | — | | | | — | |
Equity/Other | | | 100,584 | | | | 4.2 | | | | — | | | | — | |
| | | | | | | | | | | | | | | | |
Total | | $ | 2,395,086 | | | | 100.0 | % | | $ | 110,103 | | | | 100.0 | % |
| | | | | | | | | | | | | | | | |
| |
| | | Investment Portfolio Amortized Cost and TRS Notional Amount Summary as of December 31, 2013
($ in thousands) | |
Asset Category | | Investment Portfolio
at Amortized Cost | | | Percentage of
Investment Portfolio | | | TRS Portfolio at
Notional Amount | | | Percentage of
TRS Portfolio | |
Senior debt | | | | | | | | | | | | | | | | |
Senior secured loans - first lien | | $ | 626,457 | | | | 33.2 | % | | $ | 35,237 | | | | 58.8 | % |
Senior secured loans - second lien | | | 663,135 | | | | 35.1 | | | | 6,043 | | | | 10.1 | |
Senior secured bonds | | | 163,000 | | | | 8.7 | | | | 11,060 | | | | 18.5 | |
| | | | | | | | | | | | | | | | |
Total senior debt | | | 1,452,592 | | | | 77.0 | | | | 52,340 | | | | 87.4 | |
Subordinated debt | | | 355,239 | | | | 18.8 | | | | 7,571 | | | | 12.6 | |
Structured products | | | 55,520 | | | | 2.9 | | | | — | | | | — | |
Equity/Other | | | 24,250 | | | | 1.3 | | | | — | | | | — | |
| | | | | | | | | | | | | | | | |
Total | | $ | 1,887,601 | | | | 100.0 | % | | $ | 59,911 | | | | 100.0 | % |
| | | | | | | | | | | | | | | | |
The following table presents a summary of interest rate and maturity statistics for the debt investments, based on par value, in our Investment Portfolio and the TRS Portfolio as of September 30, 2014 and December 31, 2013:
| | | | | | | | | | | | | | | | |
| | | Investment Portfolio as of | | | TRS Portfolio as of | |
Floating interest rate debt investments: | | September 30,
2014 | | | December 31,
2013 | | | September 30,
2014 | | | December 31,
2013 | |
Percent of debt portfolio | | | 60.5 | % | | | 63.4 | % | | | 90.6 | % | | | 64.8 | % |
Percent of floating rate debt investments with interest rate floors | | | 98.2 | % | | | 96.4 | % | | | 94.0 | % | | | 100.0 | % |
Weighted average interest rate floor | | | 1.1 | % | | | 1.1 | % | | | 1.1 | % | | | 1.2 | % |
Weighted average coupon spread to base rate | | | 753 bps | | | | 747 bps | | | | 444 bps | | | | 568 bps | |
Weighted average years to maturity | | | 5.5 | | | | 5.8 | | | | 5.2 | | | | 5.5 | |
| | | | |
Fixed interest rate debt investments: | | | | | | | | | | | | |
Percent of debt portfolio | | | 39.5 | % | | | 36.6 | % | | | 9.4 | % | | | 35.2 | % |
Weighted average coupon rate | | | 11.0 | % | | | 10.6 | % | | | 10.2 | % | | | 8.6 | % |
Weighted average years to maturity | | | 5.3 | | | | 6.1 | | | | 5.9 | | | | 6.8 | |
All of our floating interest rate debt investments have base rate reset frequencies of less than twelve months with the majority resetting at least quarterly. The three-month LIBOR, the most prevalent index employed among our floating interest rate debt investments, ranged between 0.223% and 0.243% during the nine months ended September 30, 2014 and the terminal value was 0.235% on September 30, 2014. Base rate resets for floating interest rate investments will only result in interest income increases when the reset base interest rate exceeds the associated interest rate floor.
Our estimated forward-looking annual yield on debt investments was 10.4% as of September 30, 2014, compared to 10.0% as of December 31, 2013.
55
The following table shows the credit ratings of the investments in our Investment Portfolio and TRS Portfolio, based upon the rating scale of Standard & Poor’s Ratings Services, as of September 30, 2014 and December 31, 2013:
| | | | | | | | | | | | | | | | | | | | | | | | | | | | | | | | |
| | | Investment Portfolio as of($ in millions) | | | TRS Portfolio as of($ in millions) | |
| | | September 30, 2014 | | | December 31, 2013 | | | September 30, 2014 | | | December 31, 2013 | |
Standard & Poor’s rating | | Fair Value | | | Percentage
of
Portfolio | | | Fair Value | | | Percentage
of
Portfolio | | | Fair Value | | | Percentage
of
Portfolio | | | Fair Value | | | Percentage
of
Portfolio | |
BB- | | $ | 27.38 | | | | 1.1 | % | | $ | — | | | | — | % | | $ | 7.38 | | | | 6.8 | % | | $ | — | | | | — | % |
B+ | | | 127.74 | | | | 5.3 | | | | 117.53 | | | | 6.1 | | | | 16.70 | | | | 15.5 | | | | 12.06 | | | | 20.1 | |
B | | | 184.38 | | | | 7.7 | | | | 329.46 | | | | 17.1 | | | | 29.46 | | | | 27.4 | | | | 28.26 | | | | 47.0 | |
B- | | | 302.05 | | | | 12.5 | | | | 195.51 | | | | 10.2 | | | | 32.27 | | | | 30.0 | | | | 9.73 | | | | 16.2 | |
CCC+ | | | 560.08 | | | | 23.2 | | | | 561.63 | | | | 29.2 | | | | 13.06 | | | | 12.1 | | | | 10.05 | | | | 16.7 | |
CCC | | | 147.81 | | | | 6.1 | | | | 48.10 | | | | 2.5 | | | | 5.11 | | | | 4.8 | | | | — | | | | — | |
CCC- | | | 17.99 | | | | 0.7 | | | | 8.80 | | | | 0.5 | | | | 3.64 | | | | 3.4 | | | | — | | | | — | |
CC | | | 10.65 | | | | 0.5 | | | | — | | | | — | | | | — | | | | — | | | | — | | | | — | |
C | | | 0.66 | | | | 0.0 | | | | — | | | | — | | | | — | | | | — | | | | — | | | | — | |
D | | | 5.82 | | | | 0.2 | | | | — | | | | — | | | | — | | | | — | | | | — | | | | — | |
Not rated | | | 1,026.58 | | | | 42.7 | | | | 663.84 | | | | 34.4 | | | | — | | | | — | | | | — | | | | — | |
| | | | | | | | | | | | | | | | | | | | | | | | | | | | | | | | |
Total | | $ | 2,411.14 | | | | 100.0 | % | | $ | 1,924.87 | | | | 100.0 | % | | $ | 107.62 | | | | 100.0 | % | | $ | 60.10 | | | | 100.0 | % |
| | | | | | | | | | | | | | | | | | | | | | | | | | | | | | | | |
The table below presents a summary of our debt investment positions held in our Investment Portfolio that feature PIK interest provisions for some or all of the portfolio companies’ interest payment obligations.
| | | | | | | | |
| | | ($ in millions) | |
PIK Summary as of | | September 30,
2014 | | | December 31,
2013 | |
Total number of all investments with PIK feature | | | 21 | | | | 15 | |
Par value of all investments with PIK feature | | $ | 639.63 | | | $ | 431.14 | |
Number of originated investments with PIK feature and active PIK election | | | 9 | | | | 5 | |
Par value of originated investments with PIK feature and active PIK election | | $ | 441.24 | | | $ | 303.04 | |
Total number of all investments that have active PIK election | | | 16 | | | | 10 | |
Par value of all investments that have active PIK election | | $ | 528.37 | | | $ | 368.65 | |
Percent of debt investment portfolio with active PIK election, at par value | | | 22.6 | % | | | 16.1 | % |
| | |
PIK Interest Income Activity for the Nine Months Ended September 30, | | 2014 | | | 2013 | |
Capitalized PIK interest income | | $ | 20.15 | | | $ | 1.00 | |
Capitalized PIK interest income as a percentage of interest income | | | 13.2 | % | | | 1.6 | % |
Capitalized PIK interest income as a percentage of total investment income | | | 12.4 | % | | | 1.4 | % |
56
As of September 30, 2014, our Investment Portfolio consisted of 101 portfolio companies, diversified across 21 industry classifications, as compared to our Investment Portfolio as of December 31, 2013 that consisted of 94 portfolio companies, diversified across 17 distinct industry classifications. As of September 30, 2014, the TRS Portfolio consisted of 32 portfolio companies, diversified across 15 distinct industry classifications, as compared to our TRS Portfolio as of December 31, 2013 that consisted of 20 portfolio companies, diversified across seven distinct industry classifications. The following table presents a summary of our Investment Portfolio and TRS Portfolio arranged by industry classifications of the portfolio companies as of September 30, 2014 and December 31, 2013:
| | | | | | | | | | | | | | | | | | | | | | | | | | | | | | | | |
| | | Investment Portfolio as of($ in millions) | | | TRS Portfolio as of($ in millions) | |
| | | September 30, 2014 | | | December 31, 2013 | | | September 30, 2014 | | | December 31, 2013 | |
Industry Classification | | Fair
Value | | | Percentage
of Portfolio | | | Fair
Value | | | Percentage
of Portfolio | | | Fair
Value | | | Percentage
of Portfolio | | | Fair
Value | | | Percentage
of Portfolio | |
Consumer Durables & Apparel | | $ | 492.39 | | | | 20.4 | % | | $ | 365.97 | | | | 19.0 | % | | $ | 4.07 | | | | 3.8 | % | | $ | 10.94 | | | | 18.2 | % |
Software & Services | | | 229.34 | | | | 9.5 | | | | 147.36 | | | | 7.7 | | | | 32.75 | | | | 30.4 | | | | 7.30 | | | | 12.2 | |
Capital Goods | | | 224.98 | | | | 9.3 | | | | 103.20 | | | | 5.4 | | | | 11.07 | | | | 10.3 | | | | 2.67 | | | | 4.4 | |
Retailing | | | 224.13 | | | | 9.3 | | | | 204.88 | | | | 10.6 | | | | 5.99 | | | | 5.6 | | | | — | | | | — | |
Health Care Equipment & Services | | | 201.92 | | | | 8.4 | | | | 178.20 | | | | 9.3 | | | | 2.95 | | | | 2.7 | | | | 2.46 | | | | 4.1 | |
Technology Hardware & Equipment | | | 181.09 | | | | 7.5 | | | | 238.57 | | | | 12.4 | | | | 3.47 | | | | 3.2 | | | | 13.35 | | | | 22.2 | |
Energy | | | 156.65 | | | | 6.5 | | | | 117.40 | | | | 6.1 | | | | — | | | | — | | | | — | | | | — | |
Diversified Financials | | | 129.22 | | | | 5.4 | | | | 55.58 | | | | 2.9 | | | | — | | | | — | | | | — | | | | — | |
Materials | | | 90.55 | | | | 3.8 | | | | 136.36 | | | | 7.1 | | | | 3.73 | | | | 3.5 | | | | 13.23 | | | | 22.0 | |
Commercial & Professional Services | | | 82.79 | | | | 3.4 | | | | 67.55 | | | | 3.5 | | | | 3.97 | | | | 3.7 | | | | — | | | | — | |
Food, Beverage & Tobacco | | | 81.99 | | | | 3.4 | | | | 99.25 | | | | 5.2 | | | | 3.96 | | | | 3.7 | | | | — | | | | — | |
Telecommunications Services | | | 72.68 | | | | 3.0 | | | | 32.15 | | | | 1.7 | | | | 3.92 | | | | 3.6 | | | | — | | | | — | |
Media | | | 46.40 | | | | 1.9 | | | | 67.20 | | | | 3.5 | | | | 12.82 | | | | 11.9 | | | | 10.15 | | | | 16.9 | |
Automobiles & Components | | | 45.87 | | | | 1.9 | | | | — | | | | — | | | | — | | | | — | | | | — | | | | — | |
Consumer Services | | | 45.39 | | | | 1.9 | | | | 3.32 | | | | 0.2 | | | | 3.64 | | | | 3.4 | | | | — | | | | — | |
Food & Staples Retailing | | | 31.80 | | | | 1.3 | | | | 33.68 | | | | 1.7 | | | | 7.72 | | | | 7.2 | | | | — | | | | — | |
Insurance | | | 27.41 | | | | 1.1 | | | | 67.68 | | | | 3.5 | | | | 3.92 | | | | 3.6 | | | | — | | | | — | |
Remaining Industries | | | 46.54 | | | | 2.0 | | | | 6.52 | | | | 0.2 | | | | 3.64 | | | | 3.4 | | | | — | | | | — | |
| | | | | | | | | | | | | | | | | | | | | | | | | | | | | | | | |
Total | | $ | 2,411.14 | | | | 100.0 | % | | $ | 1,924.87 | | | | 100.0 | % | | $ | 107.62 | | | | 100.0 | % | | $ | 60.10 | | | | 100.0 | % |
| | | | | | | | | | | | | | | | | | | | | | | | | | | | | | | | |
Capital Resources and Liquidity
Sources and Uses of Capital
Our capital resources and liquidity are derived primarily from (i) equity capital proceeds of our Offerings, (ii) borrowings from our credit facilities and term loan, (iii) cash flows from operations, including investment sales and repayments, and (iv) reinvested distributions. Our primary uses of funds include (i) investments in portfolio companies, (ii) distributions to our shareholders, (iii) advisory fees, (iv) interest expense and other financing fees, (v) periodic reductions in the outstanding principal amounts on our credit facilities and term loan, and (vi) operating expenses. We have used, and expect to continue to use, proceeds from the turnover of our Investment Portfolio, equity capital proceeds from our Offerings, and additional borrowings under our credit facilities to finance our investment activities primarily focused on directly originated investments in portfolio companies.
During the nine months ended September 30, 2014, we generated operating cash flows primarily from proceeds received from the sale of investments ($442.62 million), loan repayments ($351.16 million), interest income received on our Investment Portfolio ($118.72 million), and a reduction in the outstanding balances of short term investments ($148.68 million). Primary uses of operating cash flows were the purchase of investments ($1.26 billion) and the increase in collateral for our TRS ($25.90 million). Overall, net cash used in operating activities during the nine months ended September 30, 2014 was $311.46 million.
Net cash provided by financing activities during the nine months ended September 30, 2014 was $305.79 million. Our primary source of cash from financing activities was the equity capital proceeds from the issuance of common stock ($498.65 million). Our primary uses of cash from financing activities were the net repayments of outstanding borrowings under our credit facilities and term loan ($124.33 million) and payment of cash distributions to our shareholders ($48.92 million). These amounts include $398 million we received in May 2014 from the issuance of a five-year senior term loan, the proceeds of which were primarily used to pay down in full the outstanding balances of both the Deutsche Bank Credit Facility (maturity January/February 2015) and the Senior Secured Revolving Credit Facility (maturity September 2017).
57
Liquidity
As of September 30, 2014, we had the following sources of immediate liquidity available to us:
| | | | |
| | | ($ in thousands) | |
Cash and Cash Equivalents | | $ | 80,534 | |
Short Term Investments | | | 1,227 | |
Credit Facilities-Effective Borrowing Capacity(1) | | | 577,156 | |
| | | | |
Total | | $ | 658,917 | |
| | | | |
| (1) | Effective borrowing capacity represents additional amounts that we could borrow from our credit facilities based on collateral in place as of September 30, 2014. |
In addition to the sources of liquidity listed above, we continue to raise capital through our Follow-On Offering. As of September 30, 2014, we had approximately 154.16 million additional shares of common stock available for sale through the Follow-On Offering. The proceeds from the sale of these remaining shares will provide us with additional liquidity.
On October 29, 2014, we filed a shelf registration statement with the SEC on Form N-2. The shelf registration statement has not yet been declared effective by the SEC. The shelf registration statement provides for us to offer, from time to time, up to $500 million of our securities, on terms to be determined at the time of each such offering.
Borrowings-Credit Facilities and Term Loan
Our outstanding borrowings as of September 30, 2014 and December 31, 2013 were as follows:
| | | | | | | | | | | | | | | | | | | | | | | | |
| | | As of September 30, 2014($ in thousands) | | | As of December 31, 2013 ($ in thousands) | |
| | | Total
Aggregate
Principal
Amount
Committed | | | Principal
Amount
Outstanding | | | Remaining
Years
Until
Maturity | | | Total
Aggregate
Principal
Amount
Committed | | | Principal
Amount
Outstanding | | | Remaining
Years
Until
Maturity | |
Deutsche Bank Credit Facility(1) | | $ | 340,000 | | | $ | 5,000 | | | | 0.3 | | | $ | 265,000 | | | $ | 264,440 | | | | 0.9 | |
BNP Credit Facility(1) | | | 200,000 | | | | 180,450 | | | | 1.0 | | | | 200,000 | | | | 123,000 | | | | 1.0 | |
Senior Secured Revolving Credit Facility(1) (2) | | | 490,000 | | | | — | | | | 2.9 | | | | 320,000 | | | | 319,949 | (3) | | | 3.7 | |
| | | | | | | | | | | | | | | | | | | | | | | | |
Total credit facilities | | | 1,030,000 | | | | 185,450 | | | | | | | | 785,000 | | | | 707,389 | | | | | |
2014 Senior Secured Term Loan | | | 398,000 | | | | 398,000 | | | | 4.6 | | | | — | | | | — | | | | — | |
| | | | | | | | | | | | | | | | | | | | | | | | |
Total | | $ | 1,428,000 | | | $ | 583,450 | | | | | | | $ | 785,000 | | | $ | 707,389 | | | | | |
| | | | | | | | | | | | | | | | | | | | | | | | |
| (1) | Subject to borrowing base and leverage restrictions. |
| (2) | Credit facility includes a provision that allows us, under certain circumstances, to increase the size of the Senior Secured Revolving Credit Facility to a maximum of $900 million and $600 million as of September 30, 2014 and December 31, 2013, respectively. |
| (3) | Includes $108.68 million denominated in Euros and $33.72 million denominated in New Zealand Dollars. |
For the nine months ended September 30, 2014 and 2013, our total annualized all-in cost of financing, including fees and expenses, was 4.48% and 2.69%, respectively. As of September 30, 2014, the ratio of total borrowings-to-adjusted total assets was 22% as compared to 32% as of December 31, 2013. Adjusted total assets is equal to (i) total assets less (ii) the payable for investments purchased. We expect to continue to draw on the revolving credit facilities to finance our acquisition of investment positions in portfolio companies. We may further increase our aggregate borrowing capacity in the future beyond the current combined commitment amount of $1.43 billion that is available to us from our revolving credit facilities and term loan, and we may add additional credit arrangements.
Below is a description of each of our existing credit facilities and our term loan. In addition, see Note 11 – “Borrowings” in our condensed consolidated financial statements for additional disclosures regarding our borrowings.
Deutsche Bank Credit Facility
Our wholly owned, special purpose financing subsidiary, CCT Funding LLC (“CCT Funding”), is a party to a 2011 revolving credit facility agreement (as amended, the “Deutsche Bank Credit Facility”), under which CCT Funding may borrow up to $340 million. The interest rate ranges between LIBOR plus 1.80% for borrowings up to $240 million and LIBOR plus 2.33% for the second loan tranche of $100 million. CCT Funding also pays an annualized commitment fee on any unused commitment amounts of 0.50% to 0.75%. For the nine months ended September 30, 2014 and 2013, our annualized all-in cost of financing, including fees and expenses, was 3.88% and 2.68%, respectively. CCT Funding’s obligations to the lenders under the Deutsche Bank Credit Facility are secured by a first priority security interest in substantially all of the assets of CCT Funding. The obligations of CCT Funding under the revolving credit facility are non-recourse to us. The loan tranche commitments in the total amount of $340 million are scheduled to mature in January and February of 2015.
58
BNP Credit Facility
Our wholly owned, special purpose financing subsidiary, Paris Funding LLC (“Paris Funding”), is a party to a 2013 revolving credit facility arrangement (as amended, the “BNP Credit Facility”), under which Paris Funding may borrow up to $200 million. Interest is charged at the annual rate of one month LIBOR plus 1.10% and is payable monthly. Paris Funding also pays an annualized commitment fee on any unused commitment amounts of 0.55% to 0.75%, depending on utilization levels. For the nine months ended September 30, 2014, our annualized all-in cost of financing, including fees and expenses, was 2.54% and for the period from June 12, 2013 through September 30, 2013 our annualized all-in cost of financing was 2.27%. The BNP Credit Facility is secured by certain specific assets that have been pledged as collateral. The required security pledge amount is determined in accordance with the margin requirements of the BNP Credit Facility.
Senior Secured Revolving Credit Facility
We are a party to a 2013 senior secured revolving credit facility (as amended, the “Senior Secured Revolving Credit Facility”) consisting of loans to be made in U.S. dollars and specific foreign currencies in an aggregate commitment amount of $490 million. This credit facility includes an “accordion” feature that allows us, under certain circumstances, to increase the size of the facility to a maximum of $900 million. The applicable interest rate is based on LIBOR plus an applicable spread of 2.50%, or on an “alternate base rate” (which is the highest of a (i) prime rate, (ii) the federal funds rate plus 0.50%, or (iii) one-month LIBOR plus 1.00%), plus an applicable spread of 1.50%, or, with respect to borrowings in currencies other than U.S. Dollars, Euros or British Pound Sterling, on a base interest rate applicable to such currency borrowing, plus an applicable spread of 2.50%. We also pay an annual commitment fee on any unused commitment amounts of between 0.375% and 1.00%, which varies depending on total utilization. For the nine months ended September 30, 2014, our annualized all-in cost of financing, including fees and expenses, was 6.76% and for the period from September 4, 2013 through September 30, 2013 our annualized all-in cost of financing was 6.93%. The Senior Secured Revolving Credit Facility is secured by substantially all of our portfolio investments, cash and securities accounts, excluding those held by our wholly owned financing subsidiaries.
2014 Senior Secured Term Loan
On May 20, 2014, we entered into a senior secured term loan agreement (the “2014 Senior Secured Term Loan”) which provided us with gross borrowing proceeds of $398 million. The 2014 Senior Secured Term Loan includes an accordion feature permitting us to expand the term loan if certain conditions are satisfied; provided, however, that the maximum amount of the facility is capped to the limited amount which would not cause the covered debt amount (i.e., our aggregate debt under both the 2014 Senior Secured Term Loan and our Senior Secured Revolving Credit Facility, other permitted debt and certain other unsecured debt) to exceed the fair value of the borrowing/collateral base. The 2014 Senior Secured Term Loan generally bears interest at LIBOR plus 3.25% (with a LIBOR floor of 0.75%) and matures in May 2019. The nominal interest rate in effect has been 4.00% since the issuance date through September 30, 2014. For the period from May 20, 2014 through September 30, 2014, the 2014 Senior Secured Term Loan annualized all-in cost of financing, including fees and expenses, was 4.50%.
Total Return Swaps
In 2012, Halifax Funding LLC (“Halifax Funding”), our wholly owned, special purpose financing subsidiary, entered into a TRS arrangement with The Bank of Nova Scotia (“BNS”). Our TRS arrangement with BNS consists of a set of agreements between Halifax Funding, BNS and State Street Bank and Trust Company (the “Custodian”) that are collectively referred to herein as the “TRS Agreements.” Under the terms of the TRS Agreements, each asset in the TRS Portfolio constitutes a separate TRS transaction, although all calculations, payments and transfers required to be made under the TRS Agreements are calculated and treated on an aggregate basis, based upon all such transactions.
Pursuant to the terms of the TRS Agreements, Halifax Funding may select single-name corporate loans and bonds and create a TRS Portfolio with a maximum aggregate total notional amount of $500 million. Halifax Funding receives quarterly from BNS all collected interest and fees from the TRS Portfolio. Halifax Funding pays BNS interest at a rate equal to the three-month LIBOR plus 0.80% per annum if the initial investment amount (i.e., posted collateral) equals or exceeds 50% of the settled notional amount, or three-month LIBOR plus 1.00% if the initial investment amount is less than 50% of the TRS settled notional amount. In addition, upon the sale or repayment of any TRS asset, Halifax Funding will either receive from BNS the realized gain in the value of such asset relative to its notional amount, or pay to BNS any realized loss in the value of the asset relative to its notional amount.
The obligations of Halifax Funding under the TRS Agreements are non-recourse to us and our exposure under the TRS Agreements is limited to the amount of collateral that is posted by Halifax Funding pursuant to the terms of the TRS Agreements. As of September 30, 2014, the posted collateral of $63.40 million equaled 58% of the total notional amount, as compared to $37.50 million, or 63% of the total notional amount as of December 31, 2013. The minimum required collateral amount (40% of the total notional amount, plus additional required collateral due to concentration limits in the TRS Portfolio) was $50.01 million as of September 30, 2014.
Halifax Funding may terminate the TRS Agreements at any time upon providing at least 30 days’ notice prior to the proposed settlement date of the TRS assets related to such termination. In the absence of early termination, the TRS Agreements will terminate on January 15, 2016. In the event of early termination of the TRS Agreements, Halifax Funding may be required to pay an early termination fee.
59
See Note 4 – “Derivative Instruments” in our condensed consolidated financial statements included in this report for additional disclosures on the TRS.
Commitments and Contingencies
See Note 12 – “Commitments and Contingencies” in our condensed consolidated financial statements for information on our commitments and contingencies as of September 30, 2014.
Distributions to Shareholders
We pay monthly distributions to our shareholders in the form of cash. Shareholders may elect to reinvest their distributions as additional shares of our common stock under our distribution reinvestment plan. Dividends are taxable to our shareholders even if they are reinvested in additional shares of our common stock. The following table reflects the cash distributions per share and the total amount of distributions that we declared on our common stock during the three and nine months ended September 30, 2014 and 2013:
| | | | | | | | | | | | | | | | | | | | | | | | |
| | | Three Months Ended | | | Nine Months Ended | |
| | | Per Share | | | Amount
($ in millions) | | | No. Weekly
Distributions | | | Per Share | | | Amount
($ in millions) | | | No. Weekly
Distributions | |
September 30, 2014 | | $ | 0.216762 | | | $ | 40.39 | | | | 14 | | | $ | 0.598089 | | | $ | 100.32 | | | | 39 | |
September 30, 2013 | | $ | 0.195052 | | | $ | 22.26 | | | | 13 | | | $ | 0.585156 | | | $ | 53.80 | | | | 39 | |
Approximately 51% of the distributions we declared in each of the nine months ended September 30, 2014 and 2013 were reinvested in shares of our common stock by participants in our distribution reinvestment plan and the reinvested distributions represent an additional source of capital to us.
We estimate we had sufficient taxable income to support 100% of our declared distributions for the nine months ended September 30, 2014. We do not expect to use equity capital or borrowed funds to pay distributions to shareholders nor do we expect any portion of our distributions paid in 2014 to be treated as a return of capital for tax purposes. We routinely disclose the sources of funds used to pay distributions to our shareholders in periodic reports that accompany (i) quarterly account statements and (ii) monthly distribution checks that are prepared and sent directly by our transfer agent to our shareholders. See Note 8 – “Distributions” to the condensed consolidated financial statements for a discussion of the sources of funds used to pay distributions on a GAAP basis for the periods presented.
Results of Operations
As of September 30, 2014, the fair value of our investments totaled $2.41 billion for our Investment Portfolio and $107.62 million for our TRS Portfolio. The majority of our investments at September 30, 2014 consisted of debt investments. See the section entitled “Portfolio and Investment Activity” above for a discussion of the general terms and characteristics of our investments, and for information regarding investment activities during the nine months ended September 30, 2014 and 2013. The growth of our Investment Portfolio since September 30, 2013 was the primary contributing factor to the significant increases in investment income, operating expenses, investment advisory fees, net investment income and net assets between the comparative periods, as discussed below.
60
The following is a summary of our operating results for the three and nine months ended September 30, 2014 and 2013:
| | | | | | | | | | | | | | | | |
| | | Three Months Ended
September 30, | | | Nine Months Ended
September 30, | |
($ in thousands) | | 2014 | | | 2013 | | | 2014 | | | 2013 | |
Total investment income | | $ | 63,348 | | | $ | 35,538 | | | $ | 162,639 | | | $ | 71,422 | |
Net expenses | | | 27,758 | | | | 19,813 | | | | 79,805 | | | | 40,727 | |
| | | | | | | | | | | | | | | | |
Net investment income | | | 35,590 | | | | 15,725 | | | | 82,834 | | | | 30,695 | |
Net realized gains (losses) | | | 266 | | | | 9,362 | | | | 11,473 | | | | 16,206 | |
Net change in unrealized appreciation (depreciation) | | | (14,021 | ) | | | 9,687 | | | | 8,376 | | | | 14,710 | |
| | | | | | | | | | | | | | | | |
Net increase in net assets resulting from operations | | $ | 21,835 | | | $ | 34,774 | | | $ | 102,683 | | | $ | 61,611 | |
| | | | | | | | | | | | | | | | |
Investment income
Investment income consisted of the following for the three and nine months September 30, 2014 and 2013:
| | | | | | | | | | | | | | | | |
| | | Three Months Ended
September 30, | | | Nine Months Ended
September 30, | |
($ in thousands) | | 2014 | | | 2013 | | | 2014 | | | 2013 | |
Interest income | | $ | 55,538 | | | $ | 29,105 | | | $ | 152,880 | | | $ | 63,846 | |
Fee income | | | 1,010 | | | | 6,433 | | | | 2,372 | | | | 7,379 | |
Dividend and other income | | | 6,800 | | | | — | | | | 7,387 | | | | 197 | |
| | | | | | | | | | | | | | | | |
Total investment income | | $ | 63,348 | | | $ | 35,538 | | | $ | 162,639 | | | $ | 71,422 | |
| | | | | | | | | | | | | | | | |
The increase in interest income was due primarily to the growth of our Investment Portfolio, which increased by 45% since September 30, 2013. We expect our Investment Portfolio will continue to grow and, accordingly, we expect further moderate increases in investment income in future periods. As of September 30, 2014, our estimated forward-looking debt portfolio yield was 10.4% based on amortized cost, as defined above in “Portfolio and Investment Activity.” The decrease in fee income was due to a decrease in capital structuring fees earned as related to our co- investment originated transaction activities. We expect to earn additional structuring service fees on co-investment originated transactions in the future as a result of our persistent focus on direct lending activities. The increase in dividend and other income was due primarily to an increase in the number of income-producing equity investments in our Investment Portfolio. The largest sources of dividend income earned during the three months ending September 30, 2014 were non-recurring dividends totaling $6.20 million received from our equity investments in two portfolio companies.
Interest income earned on TRS assets is not included in investment income in the condensed consolidated statements of operations, but rather is recorded as part of (i) realized gains or losses on derivative instruments in connection with quarterly TRS settlement payments and (ii) unrealized appreciation on derivatives for amounts not yet received from the counter-party as of period end.
Operating expenses
Our operating expenses for the three and nine months ended September 30, 2014 and 2013 were as follows:
| | | | | | | | | | | | | | | | |
| | | Three Months Ended
September 30, | | | Nine Months Ended
September 30, | |
($ in thousands) | | 2014 | | | 2013 | | | 2014 | | | 2013 | |
Investment advisory fees | | $ | 12,561 | | | $ | 8,098 | | | $ | 34,506 | | | $ | 19,449 | |
Interest expense | | | 7,295 | | | | 2,213 | | | | 17,506 | | | | 5,068 | |
Performance-based incentive fees | | | 3,722 | | | | 5,891 | | | | 15,325 | | | | 6,028 | |
Offering expense | | | 1,677 | | | | 1,845 | | | | 5,351 | | | | 4,492 | |
Administrative services | | | 745 | | | | 561 | | | | 2,137 | | | | 1,461 | |
Professional services | | | 520 | | | | 311 | | | | 1,570 | | | | 979 | |
Custodian and accounting fees | | | 226 | | | | 143 | | | | 604 | | | | 358 | |
Director fees and expenses | | | 126 | | | | 97 | | | | 417 | | | | 247 | |
Other | | | 886 | | | | 654 | | | | 2,389 | | | | 1,509 | |
| | | | | | | | | | | | | | | | |
Total operating expenses | | | 27,758 | | | | 19,813 | | | | 79,805 | | | | 39,591 | |
Reimbursement of expense support | | | — | | | | — | | | | — | | | | 1,136 | |
| | | | | | | | | | | | | | | | |
Net expenses | | $ | 27,758 | | | $ | 19,813 | | | $ | 79,805 | | | $ | 40,727 | |
| | | | | | | | | | | | | | | | |
61
Investment advisory fees and performance-based incentive fees –Our investment advisory fees are calculated at an annual rate of 2% of our average gross assets; therefore, the increase in these fees for the three and nine months ended September 30, 2014, as compared to the same periods in 2013, was directly attributable to the net increase in our gross assets.
Our Advisors are also eligible to receive incentive fees based on performance. Our performance-based incentive fees, which are comprised of two parts, consisted of the following for the three and nine months ended September 30, 2014 and 2013:
| | | | | | | | | | | | | | | | |
| | | Three Months Ended
September 30, | | | Nine Months Ended
September 30, | |
($ in thousands) | | 2014 | | | 2013 | | | 2014 | | | 2013 | |
Subordinated Incentive fee on income | | $ | 6,763 | | | $ | 1,707 | | | $ | 11,926 | | | $ | 1,707 | |
Incentive fee on capital gains | | | (3,041 | ) | | | 4,184 | | | | 3,399 | | | | 4,321 | |
| | | | | | | | | | | | | | | | |
Total performance-based incentive fees | | $ | 3,722 | | | $ | 5,891 | | | $ | 15,325 | | | $ | 6,028 | |
| | | | | | | | | | | | | | | | |
Subordinated incentive fee on income is payable to our Advisors each calendar quarter if our pre-incentive fee net investment fee income exceeds 1.75% quarterly preference return to our stockholders (the ratio of pre-incentive fee net investment income divided by average adjusted capital). The following table illustrates the calculation of the subordinated incentive fees on income for the three months ended March 31, 2014 and the three months ended September 30, 2014. The Advisors did not earn any subordinated incentive fees on income for the three months ended June 30, 2014.
| | | | | | | | | | | | | | | | |
| | | Three Months Ended
March 31, 2014 | | | Three Months Ended
September 30, 2014 | |
($ in thousands) | | Amount | | | Percent of
Average
Adjusted
Capital | | | Amount | | | Percent of
Average
Adjusted
Capital | |
Average adjusted capital | | $ | 1,467,664 | | | | | | | $ | 1,844,871 | | | | | |
| | | | |
Net investment income | | $ | 20,711 | | | | | | | $ | 35,590 | | | | | |
Add back: Performance-based incentive fees | | | 9,786 | | | | | | | | 3,722 | | | | | |
| | | | | | | | | | | | | | | | |
Pre-incentive fees net investment income | | | 30,497 | | | | 2.08 | % | | | 39,312 | | | | 2.13 | % |
Less: Preference return to shareholders(1) | | $ | (25,334 | ) | | | (1.73 | ) | | $ | (32,549 | ) | | | (1.76 | ) |
| | | | | | | | | | | | | | | | |
Subordinated incentive fees on income | | | 5,163 | | | | 0.35 | % | | | 6,763 | | | | 0.37 | % |
| | | | | | | | | | | | | | | | |
| (1) | The preference return rate for each quarter is based on the actual number of days in each applicable quarter. |
The annual incentive fees on capital gains recorded for GAAP purposes is equal to 20% of our realized and unrealized capital gains on a cumulative basis since inception, net of (i) all realized capital losses and unrealized depreciation on a cumulative basis from inception and (ii) the aggregate amount of any previously paid incentive fees on capital gains. The change in incentive fees on capital gains for the three and nine months ended September 30, 2014 and 2013, was directly attributable to the change in net realized and unrealized gains for the respective periods. As discussed in Note 6. “Agreements and Related Party Transactions” in our condensed consolidated financial statements, the calculation of performance-based incentive fees disregards any net realized and unrealized gains associated with the TRS interest spread. A portion of incentive fees on capital gains is accrued with respect to net unrealized appreciation in our Investment Portfolio and derivative instruments; however, such amounts are not payable by us unless and until the net unrealized appreciation is actually realized.
The actual amount of incentive fees on capital gains that are due and payable to the Advisors is determined at the end of the calendar year. The following table illustrates the amount of the recorded incentive fee on capital gains that would potentially be payable to the Advisors if (i) the cumulative net realized gains were to remain unchanged and (ii) the unrealized depreciation in the investment portfolio was to remain unchanged through the end of the current year. However, the relativity between cumulative net realized gains and unrealized depreciation has the potential to change materially based on (i) subsequent investment disposition activity and (ii) changes in fair market values of investments contributing to unrealized depreciation.
| | | | |
As of September 30, 2014 | | Amount
($ in millions) | |
Cumulative net realized gains since inception (a) | | $ | 31,342 | |
Less: Unrealized depreciation in Investment Portfolio, TRS Portfolio and other derivatives (b) | | | (37,896 | ) |
| | | | |
Excess cumulative net realized gains eligible for earned incentive fees | | $ | (6,554 | ) |
| | | | |
Earned performance-based incentive fee on net realized gains at 20%(1) | | $ | — | |
Prior years paid incentive fees on capital gains | | | 2,323 | |
| | | | |
Potential earned performance-based incentive fee on net realized gains | | $ | — | |
| | | | |
| (1) | The actual incentive fee on capital gains earned and payable to the Advisors, as determined at the end of the year, is 20% of the excess of (a) over (b), less any prior years payments of incentive fees on capital gains. |
62
See “—Contractual Obligations —Investment Advisory Agreements,” below for further details about the performance-based incentive fees.
Interest expense - The components of interest expense for the three and nine months ended September 30, 2014 and 2013 were as follows:
| | | | | | | | | | | | | | | | |
| | | Three Months Ended
September 30, | | | Nine Months Ended
September 30, | |
($ in thousands) | | 2014 | | | 2013 | | | 2014 | | | 2013 | |
Direct interest expense | | $ | 4,408 | | | $ | 1,555 | | | $ | 11,696 | | | $ | 3,872 | |
Unused commitment fees | | | 1,970 | | | | 357 | | | | 3,605 | | | | 531 | |
Amortization of deferred financing costs | | | 823 | | | | 301 | | | | 2,073 | | | | 665 | |
Accretion of discount on term loan | | | 94 | | | | — | | | | 132 | | | | — | |
| | | | | | | | | | | | | | | | |
Total interest expense | | $ | 7,295 | | | $ | 2,213 | | | $ | 17,506 | | | $ | 5,068 | |
| | | | | | | | | | | | | | | | |
The increase in interest expense during the nine months ended September 30, 2014 was primarily attributable to (i) the increase in our weighted average debt outstanding to $525.00 million, as compared to $251.70 million for the same period in 2013, and (ii) an increase in our all-in cost of financing, including fees and expenses, to 4.48%, as compared to 2.69% for the same period in 2013. For the three months ended September 30, 2014, our weighted average debt outstanding increased to $497.47 million, as compared to $318.92 million for the same period in 2013, and our annualized all-in cost of financing, including fees and expenses, increased to 5.94%, as compared to 2.77% for the same period in 2013. The increase in our all-in cost of financing is due primarily to a higher direct interest rate on our 2014 Senior Secured Term Loan (initially five-year term) as compared to our other credit facilities and the upfront fees incurred on both our Senior Secured Revolving Credit Facility and 2014 Senior Secured Term Loan. Incentive fees and interest expense, among other things, may also increase or decrease our overall operating expenses and expense ratios relative to comparative periods depending on portfolio performance, an increase or reduction in borrowed funds and borrowing commitments, and changes in benchmark interest rates, such as LIBOR, among other factors.
All other operating expenses -In general, our other operating expenses increased for the three and nine months ended September 30, 2014, as compared to the same periods in 2013, due to increased administrative and professional services associated with our owning a larger portfolio of investments.
As our asset base and number of shareholders have grown, our general and administrative expenses have increased, but at a slower rate compared to the growth rate in the asset base. We expect certain variable operating expenses to continue to increase due to the anticipated growth in the size of our asset base and the number of open shareholder accounts. During the three and nine months ended September 30, 2014, the ratio of annualized core operating expenses (excluding investment advisory fees, interest expense and offering expenses, and including net expense support) to average net assets was 0.53% and 0.56%, respectively, as compared to 0.62% and 0.83% for the three and nine months ended September 30, 2013, respectively.
Expense Support Reimbursement Payments - During the nine months ended September 30, 2013, we accrued $1.14 million as a probable Reimbursement Payment obligation to the Advisors. Accordingly, the sum of our prior period Reimbursement Payments and accrual of Reimbursement Payments equaled 100% of cumulative Expense Support Payments as of September 30, 2013. The final reimbursement payment to the Advisors was made during the three months ended March 31, 2014. (See “—Contractual Obligations,—Expense Support Agreement,” below for further details about the Expense Support Agreement. Also see Note 6—“Agreements and Related Party Transactions” included within our condensed consolidated financial statements for additional disclosures regarding the Expense Support Payments and Reimbursement Payments.)
Net realized gain and losses - Net realized gains and losses for the three and nine months ended September 30, 2014 and 2013 were as follows:
| | | | | | | | | | | | | | | | |
| | | Three Months Ended
September 30, | | | Nine Months Ended
September 30, | |
($ in thousands) | | 2014 | | | 2013 | | | 2014 | | | 2013 | |
Net realized gains on investments | | $ | 1,407 | | | $ | 1,314 | | | $ | 15,738 | | | $ | 5,905 | |
Net realized gains (losses) on derivative instruments | | | (548 | ) | | | 6,998 | | | | (1,326 | ) | | | 9,648 | |
Net realized gains (losses) on foreign currency transactions | | | (593 | ) | | | 1,050 | | | | (2,939 | ) | | | 653 | |
| | | | | | | | | | | | | | | | |
Net realized gains (losses) | | $ | 266 | | | $ | 9,362 | | | $ | 11,473 | | | $ | 16,206 | |
| | | | | | | | | | | | | | | | |
As the result of our investment sales and principal payments for the periods presented, as described above in “Portfolio and Investment Activity,” we realized net gains on investments for each of the periods presented. The increase in the amount of net realized gains on investments for the nine months ended September 30, 2014 was the result of increased sales and paydowns as compared to the nine months ended September 30, 2013.
63
Our net realized losses on derivative instruments for the nine months ended September 30, 2014 was comprised of a realized gain on the TRS of $3.33 million and realized losses on foreign currency forward contracts of $4.66 million, including $0.94 million and $1.49 million, respectively, for the three months ended September 30, 2014. This compares to a net realized gain on derivative instruments for the three months ended September 30, 2013 comprised of a $7.31 million realized gain on the TRS and a $0.31 million in net realized losses on foreign currency forward contracts.
The net realized losses on foreign currency transactions for the nine months ended September 30, 2014 primarily consisted of $2.50 million of losses realized upon repayments of foreign currency borrowings that occurred during the first six months of 2014 when the Senior Secured Revolving Credit Facility was entirely repaid with proceeds from the 2014 Senior Secured Term Loan, combined with other gains and losses realized upon the settlement of receivables and payables denominated in foreign currencies.
Net change in unrealized appreciation or depreciation
For the three and nine months ended September 30, 2014 and 2013, net unrealized appreciation and depreciation consisted of the following:
| | | | | | | | | | | | | | | | |
| | | Three Months Ended
September 30, | | | Nine Months Ended
September 30, | |
($ in thousands) | | 2014 | | | 2013 | | | 2014 | | | 2013 | |
Net change in unrealized appreciation (depreciation) on: | | | | | | | | | | | | | | | | |
Investments | | $ | (45,363 | ) | | $ | 19,052 | | | $ | (21,216 | ) | | $ | 18,081 | |
Derivative instruments | | | 31,440 | | | | (9,463 | ) | | | 28,139 | | | | (3,457 | ) |
Foreign currency translation | | | (98 | ) | | | 98 | | | | 1,453 | | | | 86 | |
| | | | | | | | | | | | | | | | |
Net change in unrealized appreciation (depreciation) | | $ | (14,021 | ) | | $ | 9,687 | | | $ | 8,376 | | | $ | 14,710 | |
| | | | | | | | | | | | | | | | |
A majority of the unrealized depreciation on investments recorded during the three months ended September 30, 2014 was the result of a $31.50 million decline in the fair value of our investments held as of September 30, 2014 that are denominated in foreign currencies. This $31.50 million decline includes both (i) changes in the fair value of the investments and (ii) fluctuations related to foreign exchange rate conversions. We have entered into several foreign currency forward contracts to economically hedge the impact that changes in foreign exchange rates have on the value of our investments denominated in foreign currencies. The fair value of the foreign currency forward contracts increased by $32.95 million during the three months ended September 30, 2014, as recorded in the table below.
The net change in unrealized appreciation (depreciation) on derivative instruments consisted of the following:
| | | | | | | | | | | | | | | | |
| | | Three Months Ended
September 30, | | | Nine Months Ended
September 30, | |
($ in thousands) | | 2014 | | | 2013 | | | 2014 | | | 2013 | |
Net unrealized appreciation (depreciation) on TRS Portfolio: | | | | | | | | | | | | | | | | |
Unsettled amounts at end of period: | | | | | | | | | | | | | | | | |
Spread interest income | | $ | 1,504 | | | $ | 1,668 | | | $ | 1,504 | | | $ | 1,668 | |
Realized gain (loss) on TRS assets | | | (42 | ) | | | (249 | ) | | | (42 | ) | | | (249 | ) |
Receipt of prior period unsettled amounts | | | (1,030 | ) | | | (8,112 | ) | | | (1,676 | ) | | | (593 | ) |
Unrealized appreciation (depreciation) on TRS assets | | | (1,942 | ) | | | 1,573 | | | | (2,666 | ) | | | (1,337 | ) |
| | | | | | | | | | | | | | | | |
| | | (1,510 | ) | | | (5,120 | ) | | | (2,880 | ) | | | (511 | ) |
Net unrealized appreciation (depreciation) on foreign currency forward contracts | | | 32,950 | | | | (4,343 | ) | | | 31,019 | | | | (2,946 | ) |
| | | | | | | | | | | | | | | | |
Net change in unrealized appreciation (depreciation) on derivative instruments | | $ | 31,440 | | | $ | (9,463 | ) | | $ | 28,139 | | | $ | (3,457 | ) |
| | | | | | | | | | | | | | | | |
The increase in unrealized appreciation on foreign currency forward contracts is due to both an increase in the notional amount of outstanding contracts from $86.05 million as of September 30, 2013 to $457.38 million as of September 30, 2014, as well as an overall increase in the fair value of forward contracts as a result of the strengthening of the U.S. Dollar against other major currencies during the three months ended September 30, 2014.
The net change in unrealized depreciation on foreign currency translation for the nine months ended September 30, 2014 consisted of the reversal of $1.61 million of net unrealized depreciation upon repayment of the portion of the Senior Secured Revolving Credit Facility that was denominated in foreign currencies and $0.16 million of net unrealized depreciation relating to the foreign currency translation of other trade receivables and payables.
We are not aware of any material trends or uncertainties, favorable or unfavorable, that may be reasonably anticipated to have a material impact on either capital resources or the revenues or income to be derived from our investments, other than those described above, risk factors, if any, identified in Part II, Item 1A of this report, and the “Management’s Discussion and Analysis of Financial Condition and Results of Operations” and “Risk Factors” sections of our Annual Report on Form 10-K for the year ended December 31, 2013.
64
Adjusted net investment income
Our net investment income totaled $35.59 million ($0.19 per share) and $82.83 million ($0.49 per share) for the three and nine months ended September 30, 2014, respectively, as compared to $15.73 million ($0.14 per share) and $30.70 million ($0.33 per share) for the three and nine months ended September 30, 2013, respectively. As described above in “- Investment advisory fees and performance-based incentive fees,” we accrue estimated performance-based incentive fees with respect to any net realized and unrealized appreciation in our Investment Portfolio and derivative instruments. The performance-based incentive fees are treated as an operating expense and therefore are a deduction in calculating our net investment income on a GAAP basis. However, our net realized and unrealized appreciation on our Investment Portfolio and derivative instruments that partly determine these fees are not included in net investment income. Therefore, in order to evaluate our net investment income without regard to realized and unrealized appreciation in our Investment Portfolio, including the impact of related accrued performance-based fees, we have developed a supplemental, non-GAAP measure, which we refer to as “adjusted net investment income,” which presents net investment income before the effects of unearned performance-based incentive fees.
We believe that adjusted net investment income is useful to assess the sustainability of our distributions and operating performance. Adjusted net investment income is not necessarily indicative of cash flows available to fund cash needs and should not be considered as an alternative to net investment income as an indication of our performance, as an alternative to cash flows from operations as an indication of our liquidity, or indicative of funds available to fund our cash needs including our ability to make future distributions to our shareholders. Adjusted net investment income should not be construed as an historic performance measure or as more relevant or accurate than the current GAAP methodology in calculating net investment income and its applicability in evaluating our operating performance.
The following table presents a reconciliation of our net investment income to adjusted net investment income for the three and nine months ended September 30, 2014 and 2013; the increase in adjusted net investment income was primarily the result in the growth of our Investment Portfolio and earnings thereon.
| | | | | | | | | | | | | | | | |
| | | Three Months Ended
September 30, | | | Nine Months Ended
September 30, | |
($ in thousands, except per share amounts) | | 2014 | | | 2013 | | | 2014 | | | 2013 | |
Net investment income (GAAP) | | $ | 35,590 | | | $ | 15,725 | | | $ | 82,834 | | | $ | 30,695 | |
Add: Estimated unearned performance-based incentive fees | | | (2,381 | ) | | | 3,406 | | | | 3,399 | | | | 3,543 | |
| | | | | | | | | | | | | | | | |
Adjusted net investment income (non-GAAP) | | $ | 33,209 | | | $ | 19,131 | | | $ | 86,233 | | | $ | 34,238 | |
| | | | | | | | | | | | | | | | |
Net investment income per share (GAAP) | | $ | 0.19 | | | $ | 0.14 | | | $ | 0.49 | | | $ | 0.33 | |
| | | | | | | | | | | | | | | | |
Adjusted net investment income per share (non-GAAP) | | $ | 0.18 | | | $ | 0.17 | | | $ | 0.52 | | | $ | 0.38 | |
| | | | | | | | | | | | | | | | |
In addition, the relative utilization of the TRS can also cause variability in net investment income, because earnings on assets within the TRS Portfolio are not included in the calculation of net investment income in accordance with GAAP. The TRS Portfolio accrued interest income and financing charges are included in the fair value of the TRS and are not recorded as realized gain or loss on derivative instruments until quarterly TRS settlement payments are finalized. If the TRS assets had instead been included in our Investment Portfolio as owned assets, the interest income and financing charges would have been included in net investment income.
The following table shows the TRS interest income and financing charges for the three and nine months ended September 30, 2014 and 2013.
| | | | | | | | | | | | | | | | |
| | | Three Months Ended
September 30, | | | Nine Months Ended
September 30, | |
($ in thousands, except per share amounts) | | 2014 | | | 2013 | | | 2014 | | | 2013 | |
Interest and fee income included in TRS fair value | | $ | 1,688 | | | $ | 1,834 | | | $ | 1,688 | | | $ | 1,834 | |
Financing charges included in TRS fair value | | | (184 | ) | | | (165 | ) | | | (184 | ) | | | (165 | ) |
| | | | | | | | | | | | | | | | |
Subtotal | | | 1,504 | | | | 1,669 | | | | 1,504 | | | | 1,669 | |
Interest and fee income included in TRS net realized gains | | | 1,093 | | | | 5,305 | | | | 3,524 | | | | 9,079 | |
Financing charges included in TRS net realized gains | | | (184 | ) | | | (696 | ) | | | (429 | ) | | | (1,629 | ) |
Less: amounts included in prior period fair value | | | (922 | ) | | | (5,266 | ) | | | (1,703 | ) | | | (938 | ) |
| | | | | | | | | | | | | | | | |
TRS net interest spread | | $ | 1,491 | | | $ | 1,012 | | | $ | 2,896 | | | $ | 8,181 | |
| | | | | | | | | | | | | | | | |
TRS Net interest spread per share | | $ | 0.01 | | | $ | 0.01 | | | $ | 0.02 | | | $ | 0.10 | |
| | | | | | | | | | | | | | | | |
65
Net Assets, Net Asset Value per Share, Annual Investment Return and Total Return Since Inception
Net assets increased $539.81 million and $646.36 million during the nine months ended September 30, 2014 and 2013, respectively. The most significant increase in net assets during the nine months ended September 30, 2014 and 2013 was attributable to capital transactions including (i) the issuance of shares of common stock and (ii) reinvestment of distributions in the combined amount of $550.04 million and $641.20 million, respectively. Our operations resulted in net assets increasing $102.68 million and $61.61 million during the nine months ended September 30, 2014 and 2013, respectively. Our overall increase in net assets was partially offset by distributions to shareholders in the amount of $100.32 million and $53.80 million and the repurchase of shares of common stock in the amount of $12.59 million and $2.64 million during the nine months ended September 30, 2014 and 2013, respectively.
Our net asset value per share was $10.06 and $9.92 on September 30, 2014 and 2013, respectively. After considering (i) the overall changes in net asset value per share, (ii) distributions paid of approximately $0.60 and $0.59 per share during the nine months ended September 30, 2014 and 2013, respectively, and (iii) the assumed reinvestment of those distributions at 90% of the prevailing offering price per share, the total investment return was 6.7% and 7.9% (not annualized) for shareholders who held our shares over the entire nine-month period ending September 30, 2014 and 2013, respectively.
Initial shareholders who subscribed to the Initial Offering in June 2011 with an initial investment of $10,000 and an initial purchase price equal to $9.00 per share (public offering price net of sales load) have seen the value of their investment grow by 44.7% (see first chart below), or an annualized return of 11.9% (see second chart below). Initial shareholders who subscribed to the Initial Offering in June 2011 with an initial investment of $10,000 and an initial purchase price equal to $10.00 per share (the initial public offering price) have registered a total investment return of 30.2% (see first chart below), or an annualized return of 8.4% (see second chart below). The S&P/LSTA Leveraged Loan Index, a primary measure of senior debt covering the U.S. leveraged loan market, which currently consists of approximately 1,100 credit facilities throughout numerous industries, and the Merrill Lynch US High Yield Master II Index, a primary measure of subordinated debt consisting of approximately 2,000 high yield corporate bonds, registered cumulative total returns of approximately 16.8% and 28.5%, respectively, in the period from June 17, 2011 to September 30, 2014.
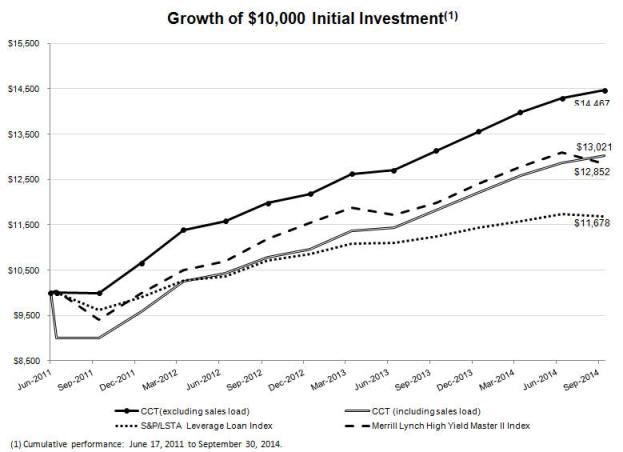
66
The calculations for the Growth of $10,000 Initial Investment in the shares of our common stock are based upon (i) an initial investment of $10,000 in our common stock at the beginning of the period at a share price of $10.00 per share (including sales load) and $9.00 per share (excluding sales load), (ii) assumed reinvestment of monthly distributions in accordance with our distribution reinvestment plan, (iii) the sale of the entire investment position at the net asset value per share on the last day of the period; and (iv) distributions payable, if any, on the last day of the period.
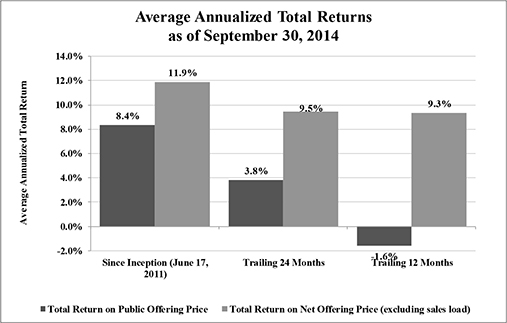
| | | | | | | | | | | | | | | | |
| | Public Offering Price/Share | | | | $10.00 | | | | $10.95 | | | | $11.10 | | |
| | Net Offering Price/Share | | | | $ 9.00 | | | | $9.855 | | | | $9.990 | | |
| | Distributions/Share | | | | $ 2.55 | | | | $ 1.61 | | | | $ 0.84 | | |
| | Terminal Value/Share (NAV) | | | | $10.06 | | | | $10.06 | | | | $10.06 | | |
In the chart above, we also present the average annual returns for the trailing 24 months and trailing 12 months, in each case assuming (i) the purchase of shares of common stock at the public offering price and net offering price (90% of public offering price) at the beginning of the period, (ii) reinvestment of distributions in the common stock, (iii) a terminal value at September 30, 2014 equal to net asset value of $10.06 per share and (iv) distributions payable to shareholders as of September 30, 2014.
Our shares are illiquid investments for which there is not a secondary market, and we do not expect a secondary market in our shares to develop in the future. You should not expect to be able to resell your shares regardless of how we perform. If you are able to sell your shares, you will likely receive less than your purchase price. Our net asset value and annualized returns — which are based in part upon determinations of fair value of Level 3 investments by our board of directors, not active market quotations — are inherently uncertain. Past performance is not a guarantee of future results.
Critical Accounting Policies and Estimates
Our discussion and analysis of our financial condition and results of operations are based upon our condensed consolidated financial statements which have been prepared in accordance with GAAP. The preparation of our condensed consolidated financial statements requires management to make estimates and assumptions that affect the reported amounts of assets, liabilities, revenues and expenses. Note 2 – “Significant Accounting Policies” to our condensed consolidated financial statements describes the significant accounting policies and methods used in the preparation of our consolidated financial statements. We consider the accounting policies listed below to be critical because they involve management judgments and assumptions, require estimates about matters that are inherently uncertain and are important for understanding and evaluating our reported financial results. These judgments affect (i) the reported amounts of assets and liabilities, (ii) our disclosure of contingent assets and liabilities as of the dates of the financial statements and (iii) the reported amounts of revenue and expenses during the reporting periods. With different estimates or assumptions, materially different amounts could be reported in our financial statements. Changes in the economic environment, financial markets and any other parameters used in determining such estimates could cause actual results to differ materially from the amounts reported based on these policies.
67
Valuation of Investments and Unrealized Gain (Loss) – Our investments consist primarily of investments in senior and subordinated debt of private U.S. companies and are presented in our consolidated financial statements at fair value. See Note 3—“Investments,” in the accompanying consolidated financial statements for more information on our investments. As described more fully in Note 2 – “Significant Accounting Policies” and Note 5 – “Fair Value of Financial Instruments” in our consolidated financial statements, a valuation hierarchy based on the level of independent, objective evidence available regarding value is used to measure the fair value of our investments. Investments for which market quotations are readily available are valued using market quotations, which are generally obtained from independent pricing services, broker-dealers or market makers. With respect to our portfolio investments for which market quotations are not readily available, our board of directors is responsible for determining in good faith the fair value of our portfolio investments in accordance with, and the consistent application of, the valuation policy and procedures approved by the board of directors, based on, among other things, the input of our Advisors, audit committee and independent third-party valuation firms.
We utilize several valuation techniques that use unobservable inputs and assumptions in determining the fair value of our Level 3 investments. For senior debt, subordinated debt and structured products categorized as Level 3 investments, we initially value the investment at its initial transaction price and subsequently valued using (i) market data for similar instruments (e.g., recent transactions or indicative broker quotes), (ii) comparisons to benchmark derivative indices and/or (iii) valuation models. Valuation models are based on yield analysis and discounted cash flow techniques, where the key inputs are based on relative value analyses and the assignment of risk-adjusted discounted rates derived from the analysis of similar credit investments from similar issuers. In addition, an illiquidity discount is applied where appropriate. The valuation techniques used by us for other types of assets and liabilities that are classified as Level 3 investments are described in Note 2 to our consolidated financial statements. The unobservable inputs and assumptions may differ by asset and in the application of our valuation methodologies. The reported fair value estimates could vary materially if we had chosen to incorporate different unobservable inputs and other assumptions.
We and our board of directors conduct our fair value determination process on a quarterly basis and any other time when a decision regarding the fair value of our portfolio investments is required. A determination of fair value involves subjective judgments and estimates. Due to the inherent uncertainty of determining the fair value of portfolio investments that do not have a readily available market value, the fair value of the our portfolio investments may differ significantly from the values that would have been determined had a readily available market value existed for such investments, and the differences could be material. Further, such investments are generally less liquid than publicly traded securities. If we were required to liquidate a portfolio investment that does not have a readily available market value in a forced or liquidation sale, we could realize significantly less than the fair value recorded by us.
The table below presents information on the significant presence of investments classified as Level 3 as of September 30, 2014 and December 31, 2013:
| | | | | | | | |
($ in thousands) | | September 30, 2014 | | | December 31, 2013 | |
Fair value of investments classified as Level 3 | | $ | 1,240,542 | | | $ | 863,443 | |
Total fair value of investments | | $ | 2,412,365 | | | $ | 2,074,772 | |
% of fair value classified as Level 3 | | | 51.4 | % | | | 41.6 | % |
Number of positions classified as Level 3 | | | 56 | | | | 30 | |
Total number of positions | | | 138 | | | | 114 | |
% of positions classified as Level 3 | | | 40.6 | % | | | 26.3 | % |
Fair value of individual positions classified as Level 3: | | | | | | | | |
Largest Level 3 position | | $ | 109,374 | | | $ | 107,033 | |
Smallest Level 3 position | | $ | 36 | | | $ | 672 | |
Average fair value | | $ | 22,153 | | | $ | 28,781 | |
The ranges of unobservable inputs used in the fair value measurement of the Company’s Level 3 investments as of September 30, 2014 and December 31, 2013 are described in Note 5 “Fair Value of Financial Instruments” in our consolidated financial statements, as well as, the directional impact to the valuation from an increase in various unobservable inputs.
In addition to impacting the estimated fair value recorded for our investments in our statement of assets and liabilities, had we used different key unobservable inputs to determine the estimated fair value of our investments, amounts recorded in our statement of operations, including the net change in unrealized appreciation and depreciation on investments, investment advisory fees and performance-based incentive fees would also be impacted since such amounts are directly impacted by the estimated fair value of our assets. For instance, a 5% overstatement of the fair value of our Level 3 investments as of September 30, 2014, assuming all other estimates remain unchanged, would otherwise result in a $59.07 million overstatement of net change in unrealized appreciation on investments, a $0.10 million overstatement of our investment advisory fees payable to our Advisors, an $11.81 million overstatement in accrued performance-based incentive fees (incentive fees on capital gains), a $47.16 million overstatement of our net increase in net assets resulting from operations, a $0.28 overstatement in our earnings per share and a $0.24 overstatement of our net asset value per share.
68
Off-Balance Sheet Arrangements
We had no off-balance sheet arrangements as of September 30, 2014.
Contractual Obligations
Investment Advisory Agreements – We have entered into the Investment Advisory Agreement with CNL for the overall management of our investment activities. We and CNL have also entered into the Sub-Advisory Agreement with KKR, under which KKR is responsible for the day-to-day management of our Investment Portfolio. CNL compensates KKR for advisory services that it provides to us with 50% of the base management fees and performance-based incentive fees that CNL receives under the Investment Advisory Agreement. Pursuant to the Investment Advisory Agreement, CNL earns a base management fee equal to an annual rate of 2% of our average gross assets (including unrealized appreciation or depreciation on the TRS and collateral posted with the custodian in connection with the TRS, but excluding deferred offering expenses), and an incentive fee based on our performance. The incentive fee is comprised of the following two parts:
| | (i) | a subordinated incentive fee on pre-incentive fee net investment income, paid quarterly, if earned, computed as the sum of (a) 100% of quarterly pre-incentive fee net investment income in excess of 1.75% of average adjusted capital up to a limit of 0.4375% of average adjusted capital, and (b) 20% of pre-incentive fee net investment income in excess of 2.1875% of average adjusted capital, and |
| | (ii) | an incentive fee on capital gains paid annually, if earned, equal to 20% of (A) all realized gains on a cumulative basis from inception, net of (1) all realized losses on a cumulative basis, (2) unrealized depreciation at year-end and (3) disregarding any net realized gains associated with the TRS interest spread, (which represents the difference between (a) the interest and fees received on total return swaps, and (b) the financing fees paid to the total return swaps counterparty), and subtracting (B) the aggregate amount of any previously paid incentive fee on capital gains. |
The terms of the Investment Advisory Agreement entitle CNL (and indirectly KKR) to receive up to 5% of gross proceeds in connection with the Offerings as reimbursement for organization and offering expenses incurred by the Advisors on our behalf. The final reimbursement rate was 0.8% of gross offering proceeds from the Initial Offering.
The reimbursement rate was 0.9% of gross offering proceeds during the nine months ended September 30, 2014. As of September 30, 2014, the Advisors have been reimbursed in the amounts of $5.22 million for offering expenses from the Follow-On Offering, including any payable balances for reimbursement of offering expenses. As of September 30, 2014, the Advisors were fully reimbursed for all offering expenses in connection with the Follow-On Offering that they incurred on our behalf. The Advisors are expected to continue to incur offering expenses on our behalf throughout the remainder of the Follow-On Offering period and we expect to continue reimbursement of the Advisors for offering expenses they incur on our behalf through the termination date of the Follow-On Offering. We expect the reimbursement rate to remain at or below 1.0% of gross offering proceeds for the remainder of the Follow-On Offering.
As of September 30, 2014, we had accrued incentive fees on capital gains of $12.2 million based on the performance of our portfolio, including amounts based on unrealized gains. See Note 6—“Agreements and Related Party Transactions” in our condensed consolidated financial statements for expanded discussion of the Investment Advisory Agreements.
Unfunded Commitments- Unfunded commitments to provide funds to portfolio companies are not recorded on our consolidated statements of assets and liabilities. Our unfunded commitments may be significant from time to time. Because these commitments may expire without being drawn upon, the total commitment amount does not necessarily represent future cash requirements. We intend to use cash flow from scheduled and early principal repayments and proceeds from borrowings and securities offerings to fund these commitments. As of September 30, 2014, our unfunded investment commitments totaled $265.06 million. We believe we maintain sufficient liquidity in the form of cash on hand and borrowing capacity under our revolving credit facilities to fund such unfunded loan commitments should the need arise.
Borrowings –As discussed above under “Financial Condition, Liquidity and Capital Resources – Credit Facilities,” we, either directly or through our wholly owned subsidiaries, have borrowing agreements with several lenders in connection with our revolving credit facilities and the 2014 Senior Secured Term Loan. As of September 30, 2014, the credit facilities and 2014 Senior Secured Term Loan provided for borrowings in an aggregate amount up to $1.43 billion on a committed basis and $583.45 million outstanding borrowings balance. (See “— Capital Resources and Liquidity — Credit Facilities” above and Note 11—“Borrowings” in our condensed consolidated financial statements for expanded discussion of the revolving credit facilities and the senior secured term loan.)
69
A summary of our significant contractual payment obligations for the repayment of outstanding borrowings and interest expense and other fees related to the credit facilities and term loan at September 30, 2014 is as follows (amounts in millions):
| | | | | | | | | | | | | | | | | | | | |
| | | Total | | | < 1 year | | | 1-3 years | | | 3-5 years | | | After 5 years | |
BNP Credit Facility | | $ | 180.45 | | | $ | 180.45 | | | $ | — | | | $ | — | | | $ | — | |
Deutsche Bank Credit Facility | | | 5.00 | | | | 5.00 | | | | — | | | | — | | | | — | |
2014 Senior Secured Term Loan | | | 398.00 | | | | 4.00 | | | | 8.00 | | | | 386.00 | | | | — | |
Interest and Credit Facilities Fees Payable(1) | | | 92.40 | | | | 25.67 | | | | 41.31 | | | | 25.42 | | | | — | |
| | | | | | | | | | | | | | | | | | | | |
TOTAL | | $ | 675.85 | | | $ | 215.12 | | | $ | 49.31 | | | $ | 411.42 | | | $ | — | |
| | | | | | | | | | | | | | | | | | | | |
| (1) | Estimated interest payments have been calculated based on interest rates of our credit facilities and term loan payables as of September 30, 2014. |
Related Party Transactions
We have entered into agreements with our Advisors and certain of their affiliates, whereby, we agree to pay certain fees to, or reimburse certain expenses of, our Advisors and their affiliates for investment and advisory services, selling commissions and marketing support fees in connection with our Offerings, and reimbursement of offering and administrative and operating costs. In addition, we reimburse CNL for personnel expenses associated with our Chief Financial Officer and Chief Compliance Officer. See Note 6, “Agreements and Related Party Transactions” in the accompanying condensed consolidated financial statements and “Item 13. Certain Relationships and Related Transactions, and Director Independence” in our Form 10-K for the year ended December 31, 2013 for a discussion of the various related party transactions, agreements and fees.
Impact of Recent Accounting Pronouncements
See Item 1. “Financial Statements” for a summary of the impact of any recent accounting pronouncements, if any.
| Item 3. | Quantitative and Qualitative Disclosures About Market Risk |
Interest Rate Risk
We are subject to financial market risks, in particular changes in interest rates. Future changes in interest rates will likely have effects on the interest income we earn on our portfolio investments, the fair value of our fixed income investments, the interest rates and interest expense associated with the money we borrow and the fair value of loan balances. (See Part II, Item 1A)
Subject to the requirements of the 1940 Act, we may hedge against interest rate fluctuations by using standard hedging instruments such as futures, options and forward contracts. Although hedging activities may insulate us against adverse changes in interest rates, they may also limit our ability to participate in the benefits of lower interest rates. During the nine months ended September 30, 2014 and 2013, we did not engage in interest rate hedging activities.
As of September 30, 2014, approximately 60.5% of our portfolio of debt investments (excluding TRS assets), or approximately $1.42 billion measured at par value, featured floating or variable interest rates. The variable interest rate debt investments usually provide for interest payments based on three-month LIBOR (the base rate) and typically have durations of three months after which the base rates are reset to then prevailing three-month LIBOR. At September 30, 2014, approximately 98.2% of our portfolio of variable interest rate debt investments, or approximately $1.39 billion measured at par value, featured minimum base rates, or base rate floors, and the weighted average base rate floor for such investments was 1.1%. Variable interest rate investments that feature a base rate floor generally reset to the then prevailing three-month LIBOR only if the reset base rate exceeds the base rate floor on the applicable interest rate reset date, in which cases, we may benefit through an increase in interest income from such interest rate adjustments. At September 30, 2014, we held an aggregate investment position of $25.10 million at par value in variable interest rate debt investments that featured variable interest rates without any minimum base rates, or approximately 1.8% of our portfolio of variable interest rate debt investments. In the case of these “no base rate floor” variable interest debt investments held in our portfolio, we may benefit from increases in the base rates that may subsequently result in an increase in interest income from such interest rate adjustments.
Because we borrow money to make investments, our net investment income is partially dependent upon the difference between the interest rate at which we invest borrowed funds and the interest rate at which we borrow funds. In periods of rising interest rates, if we have borrowed capital with floating interest rates, our interest expense will increase, which will increase our financing costs and may reduce our net investment income, especially to the extent we continue to acquire and hold fixed-rate debt investments. As a result, there can be no assurance that a significant change in market interest rates will not have a material adverse effect on our net investment income.
70
Pursuant to the terms of our credit facilities and 2014 Senior Secured Term Loan, as discussed above (see “— Financial Condition, Liquidity and Capital Resources —Credit Facilities”), all of our borrowing as of September 30, 2014 provide for floating base rates based on short-term LIBOR. Therefore, if we were to completely draw down (i) the unused commitment amounts in our Deutsche Bank credit facility, (ii) the maximum commitment amount in our BNP credit facility and (iii) the maximum commitment in our Senior Secured Revolving Credit Facility under an interest election of LIBOR plus 2.50%, we expect that our weighted average direct interest rate would decrease by approximately 4 bps, as compared to our current weighted average direct interest cost for borrowed funds. We expect that any further expansion of our current revolving credit facilities, or any future credit facilities that we or any subsidiary may enter into, will also be based on a floating base rate. As a result, we are subject to continuous risks relating to changes in market interest rates.
Under the terms of the TRS Agreements between Halifax Funding and BNS, Halifax Funding pays interest to BNS at a floating rate based on three-month LIBOR in exchange for the right to receive the economic benefits of a portfolio of TRS assets having a maximum aggregate notional amount of $500 million.
Assuming the consolidated schedule of investments as of September 30, 2014 was to remain constant with regards to the Investment Portfolio and no actions were taken to alter the existing interest rate sensitivity or Investment Portfolio allocations, the upper section of the table below presents an estimated and hypothetical increase in interest income for a 12-month period due to an immediate and persistent increase in the base rates associated with our debt investments featuring variable interest rates.
The middle section of the table below also presents sensitivity analysis for a 12-month period due to a persistent increase in the base interest rates that apply to our floating rate credit facilities and term loan and the associated increase in interest expense, as well as, the net effect of change in interest rates on the TRS unrealized appreciation (depreciation). For persistent LIBOR increases of less than 150 basis points, the increase in interest expense eclipses the hypothetical increase in interest income associated with our floating rate debt investments; for a persistent LIBOR increase of 150 basis points or greater, the hypothetical increase in interest income associated with our floating rate debt investments begins to provide a positive contribution to net interest income, in both cases assuming that the consolidated schedule of investments as of September 30, 2014 was to remain constant with regards to the Investment Portfolio and no actions were taken to alter the existing interest rate sensitivity or Investment Portfolio allocations.
| | | | | | | | | | | | | | | | | | | | | | | | |
| | | | | | ($ amounts in millions, except per share data) | |
| | | Par
Amount | | | Weighted
Avg. Floor | | | Increases in LIBOR | |
| | | | +50 bps | | | +100 bps | | | +150 bps | | | +200 bps | |
No base rate floor | | $ | 25.10 | | | | | | | $ | 0.102 | | | $ | 0.204 | | | $ | 0.306 | | | $ | 0.408 | |
Base rate floor | | $ | 1,391.25 | | | | 1.1 | % | | | — | | | | 2.020 | | | | 7.923 | | | | 14.022 | |
| | | | | | | | | | | | | | | | | | | | | | | | |
Increase in Floating Rate Interest Income | | | | | | | | | | $ | 0.102 | | | $ | 2.224 | | | $ | 8.229 | | | $ | 14.430 | |
| | | | | | | | | | | | | | | | | | | | | | | | |
| | | | | | |
| | | | | | Base Rate Spread | | | | | | | | | | | | | |
BNP Credit Facility | | $ | 180.45 | | | | 110 bps | | | $ | (0.902 | ) | | $ | (1.805 | ) | | $ | (2.707 | ) | | $ | (3.609 | ) |
Deutsche Bank Credit Facility | | | 5.00 | | | | 180 bps | | | | (0.025 | ) | | | (0.050 | ) | | | (0.075 | ) | | | (0.100 | ) |
2014 Senior Secured Term Loan | | $ | 398.00 | | | | 325 bps | | | | — | | | | (1.930 | ) | | | (3.920 | ) | | | (5.911 | ) |
| | | | | | | | | | | | | | | | | | | | | | | | |
Increase to Floating Rate Interest Expense | | | | | | | | | | | (0.927 | ) | | | (3.785 | ) | | | (6.702 | ) | | | (9.620 | ) |
| | | | | | | | | | | | | | | | | | | | | | | | |
Change in Floating Rate Net Interest Income, before TRS | | | | | | | | | | | (0.825 | ) | | | (1.561 | ) | | | 1.527 | | | | 4.810 | |
Net change in TRS unrealized appreciation (depreciation)(1) | | | | | | | | | | | (0.525 | ) | | | (0.905 | ) | | | (1.043 | ) | | | (1.154 | ) |
| | | | | | | | | | | | | | | | | | | | | | | | |
Overall Change in Floating Rate Net Interest Income, including TRS | | | | | | | | | | $ | (1.350 | ) | | $ | (2.466 | ) | | $ | 0.484 | | | $ | 3.656 | |
| | | | | | | | | | | | | | | | | | | | | | | | |
Change in Floating Rate Net Interest Income Per Share Outstanding as of September 30, 2014 | | | | | | | | | | $ | (0.01 | ) | | $ | (0.01 | ) | | $ | 0.00 | | | $ | 0.02 | |
| (1) | Pursuant to the TRS Agreements, Halifax Funding receives from BNS all collected interest and fees derived from the TRS assets and pays to BNS interest at a rate equal to three-month LIBOR plus 80 bps per annum on the settled notional amount of TRS assets. As of September 30, 2014, 90.6% of the TRS assets, or approximately $100.09 million measured at par value, featured floating or variable interest rates. At September 30, 2014, 94.1% of the TRS assets with variable interest rates featured minimum base rate floors, or approximately $94.13 million measured at par value, and the weighted average base rate floor for such TRS assets was 1.1%. As of September 30, 2014, the total notional amount of the portfolio of TRS assets was $110.10 million, and the settled notional amount was $108.95 million. For the purpose of presenting the net interest sensitivity analysis above, we have assumed that all TRS assets are settled as of September 30, 2014 and that the TRS notional amount would equal $110.10 million upon which the financing payments to BNS are based. |
The interest rate sensitivity analysis presented above does not consider the potential impact of the changes in fair value of our debt investments and the net asset value of our common stock in the event of sudden increases in interest rates associated with high yield corporate bonds. Approximately 39.5% of our debt Investment Portfolio was invested in fixed interest rate, high yield corporate debt investments as of September 30, 2014. Rising market interest rates will most likely lead to fair value declines for high yield corporate bonds and a decline in the net asset value of our common stock, while declining market interest rates will most likely lead to an increase in bond values.
71
As of September 30, 2014, approximately 40.0% of our fixed interest rate debt investments, or approximately $357.20 million measured at fair value, had prices that are generally available from third party pricing services. We consider these debt investments to be one of the more liquid subsets of our Investment Portfolio since these types of assets are generally broadly syndicated and owned by a wide group of institutional investors, business development companies, mutual funds and other investment funds. Additionally, this group of assets is susceptible to revaluation, or changes in bid-ask values, in response to sudden changes in expected rates of return associated with these investments. We have other fixed interest rate investments in the less liquid subset of our Investment Portfolio that are not included in this analysis.
We have computed a duration of approximately 3.9 for this liquid/fixed subset of our total portfolio. This implies that a sudden increase in the market’s expected rate of return of 100 basis points for this subset of our Investment Portfolio may result in a reduction in fair value of approximately 3.9%, all other financial and market factors assuming to remain unchanged. A 3.9% decrease in the valuation of this Investment Portfolio subset equates to a decrease of $13.89 million, or a 0.7% decline in net assets relative to $10.06 net asset value per share as of September 30, 2014.
Foreign Currency Risk
From time to time, we may make investments that are denominated in a foreign currency that are subject to the effects of exchange rate movements between the foreign currency of each such investment and the U.S. dollar, which may affect future fair values and cash flows, as well as, amounts translated into U.S. dollars for inclusion in our consolidated financial statements.
The table below presents the effect that a 10% immediate, unfavorable change in the foreign currency exchange rates (i.e. further strengthening U.S. Dollar) would have on the fair value of investments in our Investment Portfolio denominated in foreign currencies as of September 30, 2014, by foreign currency, all other valuation assumptions remaining constant. Our TRS Portfolio did not contain any investments denominated in foreign currencies as of September 30, 2014. In addition, the table below presents the par value of our investments denominated in foreign currencies and the notional amount of foreign currency forward contracts in local currency in place as of September 30, 2014 to hedge against foreign currency risks.
| | | | | | | | | | | | | | | | | | | | | | | | |
| | | | | Investments Denominated in Foreign Currencies | | | Hedges | |
| | | | | As of September 30, 2014 | | | Reduction in Fair
Value as of
September 30,
2014 if 10%
Adverse Change
in Exchange Rate | | | As of September 30, 2014 | |
(In thousands) | | | | Par Value/
Cost in Local
Currency (1) | | | Par Value/
Cost in US$ (1) | | | Fair Value | | | | Foreign Currency
Forward Contracts
Notional Amount
in Local Currency | |
Euros | | € | | | 201,171 | | | $ | 254,496 | | | $ | 223,864 | | | $ | (22,386 | ) | | € | | | 187,134 | |
British Pound Sterling | | £ | | | 70,056 | | | | 113,571 | | | | 110,531 | | | | (11,053 | ) | | £ | | | 69,298 | |
New Zealand Dollars | | N$ | | | 52,406 | | | | 40,911 | | | | 42,138 | | | | (4,214 | ) | | N$ | | | 50,650 | |
Australian Dollars | | A$ | | | 38,390 | | | | 33,670 | | | | 32,940 | | | | (3,294 | ) | | A$ | | | 36,489 | |
Swedish Kronor | | SEK | | | 97,249 | | | | 15,145 | | | | 13,952 | | | | (1,395 | ) | | SEK | | | — | |
| | | | | | | | | | | | | | | | | | | | | | | | |
Total | | | | | 459,272 | | | $ | 457,793 | | | $ | 423,425 | | | $ | (42,342 | ) | | | | | | |
| | | | | | | | | | | | | | | | | | | | | | | | |
| (1) | Amount represents the par value of debt investments and cost of equity investments denominated in foreign currencies. |
As illustrated in the table above, we use derivative instruments from time to time, including foreign currency forward contracts, to manage the impact of fluctuations in foreign currency exchange rates. In addition, we have the ability to borrow in foreign currencies under our Senior Secured Revolving Credit Facility, which provides a natural hedge with regard to changes in exchange rates between the foreign currencies and U.S. dollar and reduces our exposure to foreign exchange rate differences. We are typically a net receiver of these foreign currencies as related for our international investment positions, and, as a result, our investments denominated in foreign currencies, to the extent not hedged, benefit from a weaker U.S. dollar and are adversely affected by a stronger U.S. dollar.
As of September 30, 2014, the net contractual notional balance of our foreign currency forward contracts totaled $457.38 million, all of which related to hedging of our foreign currency denominated debt investments. As of September 30, 2014, we did not have any amounts outstanding denominated in foreign currencies on our Senior Secured Revolving Credit Facility.
During the nine months ended September 30, 2014, our foreign currency transactions and foreign currency translation adjustment recorded in our condensed consolidated statements of operations resulted in a net realized and unrealized losses of $1.49 million. Our foreign currency forward contracts, employed for hedging purposes, generated net realized and unrealized gains of $26.36 million during the nine months ended September 30, 2014. We do not isolate that portion of the results of operations resulting from changes in foreign exchange rates on investments from the fluctuations arising from changes in fair values of investments held; therefore, the fluctuations related to foreign exchange rate conversion are included with the net realized gain (loss) and unrealized appreciation (depreciation) on investments.
72
| Item 4. | Controls and Procedures |
Evaluation of Disclosure Controls and Procedures
Pursuant to Rule 13a-15(b) under the Exchange Act, under the supervision and with the participation of our management, including our principal executive officer and principal financial officer, we conducted an evaluation of the effectiveness of our disclosure controls and procedures (as defined under Rule 13a-15(e) under the Exchange Act) as of the end of the period covered by this report. Based upon that evaluation, our management, including our principal executive officer and principal financial officer, concluded that our disclosure controls and procedures are effective as of the end of the period covered by this report.
Changes in Internal Control over Financial Reporting
During the most recent fiscal quarter, there was no change in our internal controls over financial reporting (as defined under Rule 13a-15(f) under the Exchange Act) that has materially affected, or is reasonably likely to materially affect, our internal controls over financial reporting.
PART II. OTHER INFORMATION
| Item 1. | Legal Proceedings - None |
| Item 1A. | Risk Factors – There have been no material changes to the risk factors previously disclosed in response to Item 1A. to Part I. of our Annual Report on Form 10-K for the fiscal year ended December 31, 2013, except for the following: |
We are subject to financial market risks, including changes in interest rates. Because we borrow money to finance a portion of our Investment Portfolio, our net investment income depends, in part, upon the difference between the rate at which we borrow funds and the rate at which we invest those funds. As a result, we can offer no assurance that a significant change in market interest rates will not have a material adverse effect on our net investment income. In periods of rising interest rates when we have debt outstanding, our cost of funds will increase, which could reduce our net investment income.
Moderate increases in interest rates may reduce our net investment income, depending on the types of credit facilities we employ to borrow funds for investment purposes. Several of our credit facilities that enable us to borrow capital from lenders feature floating interest rate provisions and no base interest rate floors. Meanwhile, a substantial portion of our debt investment portfolio features variable interest rates coupled with base interest rate floors (e.g. a base interest rate of three-month LIBOR plus a margin of 450 basis points, with a base interest rate floor of 75 basis points results in an overall daily coupon rate of 5.25%/360 as long as three-month LIBOR is below 0.75%). As a result, the first leg of interest rate increases from prevailing interest rate levels will likely result in nearly immediate increases in the cost of our borrowings while a substantial portion of our variable interest rate debt investment portfolio will not experience any increase in interest income unless and until the LIBOR reference rates that predominantly apply to our debt investment portfolio increase materially above 1.0%.
In addition, interest rates have recently been at or near historic lows. In the event of a significant rising interest rate environment, our portfolio companies with adjustable-rate loans could see their interest payments increase and there may be a significant increase in the number of our portfolio companies who are unable or unwilling to pay interest and repay their loans. Our investment portfolio of adjustable-rate loans may also decline in value in response to rising interest rates if the adjustable interest rates do not rise as much, or as quickly, as market interest rates in general. Similarly, during periods of rising interest rates, our investments with fixed interest rates will likely decline in value.
The Board of Governors of the Federal Reserve System has indicated that it intends to taper its “quantitative easing” program, which potentially could lead to a general rise in interest rates and/or market volatility. In periods of market volatility, the market values of (i) fixed income securities; and (ii) portfolio companies with adjustable-rate loans, may be more sensitive to changes in interest rates.
We may use interest rate risk management techniques in an effort to limit our exposure to interest rate fluctuations. These techniques may include various interest rate hedging activities to the extent such activities are not prohibited by the 1940 Act. These activities may limit our ability to participate in the benefits of lower interest rates with respect to the hedged portfolio. Adverse developments resulting from changes in interest rates or hedging transactions could have a material adverse effect on our business, financial condition and results of operations.
73
| Item 2. | Unregistered Sales of Equity Securities and Use of Proceeds – |
| | (c) | The information required by this Item 2(c) is set forth in Note 9 – “Share Transactions” to the unaudited condensed consolidated financial statements included in Item 1 of Part 1 of this Quarterly Report on Form 10-Q and is incorporated by reference herein. |
| Item 3. | Defaults Upon Senior Securities -None |
| Item 4. | Mine Safety Disclosures –Not applicable |
| Item 5. | Other Information -None |
The exhibits required by this item are set forth in the Exhibit Index attached hereto and are filed or incorporated as part of this report.
74
SIGNATURES
Pursuant to the requirements of Section 13 or 15(d) of the Securities Exchange Act of 1934, the registrant has duly caused this report to be signed on its behalf by the undersigned, thereunto duly authorized, on the 13th day of November 2014.
| | |
| CORPORATE CAPITAL TRUST, INC. |
| |
| By: | | /s/ Thomas K. Sittema |
| | THOMAS K. SITTEMA |
| | Chief Executive Officer |
| | (Principal Executive Officer) |
| |
| By: | | /s/ Paul S. Saint-Pierre |
| | PAUL S. SAINT-PIERRE |
| | Chief Financial Officer |
| | (Principal Financial Officer) |
75
EXHIBIT INDEX
The following exhibits are filed or incorporated as part of this report.
| | |
| 3.1 | | Second Amended and Restated Articles of Incorporation of the Registrant.(Incorporated by reference to Exhibit 3.1 to the Company’s Current Report on Form 8-K filed on May 8, 2012.) |
| |
| 3.2 | | Second Amended and Restated Bylaws of the Registrant.(Incorporated by reference to Exhibit 3.1 to the Company’s Current Report on Form 8-K filed on September 8, 2014.) |
| |
| 10.1 | | Form of Managing Dealer Agreement by and between the Registrant and CNL Securities Corp.(Incorporated by reference to Exhibit 2(h)(1) filed with Pre-Effective Amendment No. 1 to the Company’s registration statement on Form N-2 (File No. 333-189544) filed on October 16, 2013.) |
| |
| 10.2 | | Form of Participating Broker Agreement.(Incorporated by reference to Exhibit 2(h)(2) filed with Pre-Effective Amendment No. 1 to the Company’s registration statement on Form N-2 (File No. 333-189544) filed on October 16, 2013.) |
| |
| 10.3 | | Form of Distribution Reinvestment Plan.(Incorporated by reference to Exhibit 2(e) filed with Pre-Effective Amendment No. 2 to the Company’s registration statement on Form N-2 (File No. 333-167730) filed on February 18, 2011.) |
| |
| 10.4 | | Form of Intellectual Property License Agreement by and between the Registrant and CNL Intellectual Properties, Inc.(Incorporated by reference to Exhibit 2(k)(3) filed with Pre-Effective Amendment No. 2 to the Company’s registration statement on Form N-2 (File No. 333-167730) filed on February 18, 2011.) |
| |
| 10.5 | | Administrative Services Agreement by and between the Registrant and CNL Fund Advisors Company.(Incorporated by reference to Exhibit 2(k)(2) filed with Pre-Effective Amendment No. 3 to the Company’s registration statement on Form N-2 (File No. 333-167730) filed on March 29, 2011.) |
| |
| 10.6 | | Custodian Agreement.(Incorporated by reference to Exhibit 2(j) filed with Pre-Effective Amendment No. 3 to the Company’s registration statement on Form N-2 (File No. 333-167730) filed on March 29, 2011.) |
| |
| 10.7 | | Investment Advisory Agreement by and between the Registrant and CNL Fund Advisors Company.(Incorporated by reference to Exhibit 2(g)(1) filed with Pre-Effective Amendment No. 3 to the Company’s registration statement on Form N-2 (File No. 333-167730) filed on March 29, 2011.) |
| |
| 10.8 | | Sub-Advisory Agreement by and among the Registrant, CNL Fund Advisors Company and KKR Asset Management LLC.(Incorporated by reference to Exhibit 2(g)(2) filed with Pre-Effective Amendment No. 3 to the Company’s registration statement on Form N-2 (File No. 333-167730) filed on March 29, 2011.) |
| |
| 10.9 | | Amended and Restated Escrow Agreement by and among the Registrant, UMB Bank N.A., and CNL Securities Corp. (Incorporated by reference to Exhibit 10.10 to the Company’s Quarterly Report on Form 10-Q filed on August 12, 2011.) |
| |
| 10.10 | | Limited Liability Company Agreement of CCT Funding LLC. (Incorporated by reference to Exhibit 10.13 to the Company’s Quarterly Report on Form 10-Q filed on November 10, 2011.) |
| |
| 10.11 | | Credit Agreement between CCT Funding LLC and Deutsche Bank AG, New York Branch.(Incorporated by reference to Exhibit 10.14 to the Company’s Quarterly Report on Form 10-Q filed on November 10, 2011.) (Confidential portions of this exhibit have been omitted pursuant to a request for confidential treatment and filed separately with the SEC.) |
| |
| 10.12 | | Custodial Agreement among the Registrant, CCT Funding LLC, Deutsche Bank AG, New York Branch and Deutsche Bank Trust Company Americas.(Incorporated by reference to Exhibit 10.15 to the Company’s Quarterly Report on Form 10-Q filed on November 10, 2011.) (Confidential portions of this exhibit have been omitted pursuant to a request for confidential treatment and filed separately with the SEC.) |
| |
| 10.13 | | Asset Contribution Agreement between the Registrant and CCT Funding LLC. (Incorporated by reference to Exhibit 10.16 to the Company’s Quarterly Report on Form 10-Q filed on November 10, 2011.) |
| |
| 10.14 | | Security Agreement between CCT Funding LLC and Deutsche Bank AG, New York Branch.(Incorporated by reference to Exhibit 10.17 to the Company’s Quarterly Report on Form 10-Q filed on November 10, 2011.) |
76
| | |
| |
| 10.15 | | Investment Management Agreement between the Registrant and CCT Funding LLC.(Incorporated by reference to Exhibit 10.18 to the Company’s Quarterly Report on Form 10-Q filed on November 10, 2011.) |
| |
| 10.16 | | First Amendment to Credit Agreement between CCT Funding LLC and Deutsche Bank AG, New York Branch.(Incorporated by reference to Exhibit 10.17 to the Company’s Annual Report on Form 10-K filed on March 16, 2012.) (Confidential portions of this exhibit have been omitted pursuant to a request for confidential treatment and filed separately with the SEC.) |
| |
| 10.17 | | Amended and Restated Expense Support and Conditional Reimbursement Agreement by and among the Registrant, CNL Fund Advisors Company and KKR Asset Management LLC.(Incorporated by reference to Exhibit 10.18 to the Company’s Annual Report on Form 10-K filed on March 16, 2012.) |
| |
| 10.18 | | Amendment No. 1 to Investment Advisory Agreement by and between the Registrant and CNL Fund Advisors Company.(Incorporated by reference to Exhibit 10.19 to the Company’s Annual Report on Form 10-K filed on March 16, 2012.) |
| |
| 10.19 | | Second Amendment to Credit Agreement between CCT Funding LLC and Deutsche Bank AG, New York Branch.(Incorporated by reference to Exhibit 10.1 to the Company’s Current Report on Form 8-K filed on August 24, 2012.) (Confidential portions of this exhibit have been omitted pursuant to a request for confidential treatment and filed separately with the SEC.) |
| |
| 10.20 | | ISDA 2002 Master Agreement, together with the Schedule thereto and Credit Support Annex to such Schedule, each dated as of November 15, 2012, by and between Halifax Funding LLC and The Bank of Nova Scotia.(Incorporated by reference to Exhibit 10.1 to the Company’s Current Report on Form 8-K filed on November 21, 2012.) |
| |
| 10.21 | | Confirmation Letter Agreement, dated as of November 15, 2012, by and between Halifax Funding LLC and The Bank of Nova Scotia.(Incorporated by reference to Exhibit 10.2 to the Company’s Current Report on Form 8-K filed on November 21, 2012.) |
| |
| 10.22 | | Amendment to Amended and Restated Expense Support and Conditional Reimbursement Agreement by and among the Registrant, CNL Fund Advisors Company and KKR Asset Management LLC.(Incorporated by reference to Exhibit 10.1 to the Company’s Current Report on Form 8-K filed on January 7, 2013.) |
| |
| 10.23 | | Third Amendment to Credit Agreement between CCT Funding LLC, the lenders referred to therein and Deutsche Bank AG, New York Branch.(Incorporated by reference to Exhibit 10.1 to the Company’s Current Report on Form 8-K filed on February 14, 2013.) (Confidential portions of this exhibit have been omitted pursuant to a request for confidential treatment and filed separately with the SEC.) |
| |
| 10.24 | | U.S. PB Agreement, dated as of June 4, 2013, by and between the Registrant and BNP Paribas Prime Brokerage, Inc.(Incorporated by reference to Exhibit 10.2 to the Company’s Current Report on Form 8-K filed on June 18, 2013.) |
| |
| 10.25 | | Special Custody and Pledge Agreement, dated as of June 4, 2013, by and between the Registrant, BNP Paribas Prime Brokerage, Inc. and State Street Bank and Trust Company.(Incorporated by reference to Exhibit 10.3 to the Company’s Current Report on Form 8-K filed on June 18, 2013.) |
| |
| 10.26 | | Control Agreement, dated as of July 22, 2013, by and among Halifax Funding LLC, The Bank of Nova Scotia, and State Street Bank and Trust Company (Incorporated by reference to Exhibit 10.1 to the Company’s Current Report on Form 8-K filed on July 26, 2013.) |
| |
| 10.27 | | Amending Agreement, dated as of July 22, 2013, by and among the Registrant, Halifax Funding LLC, The Bank of Nova Scotia, and The Bank of Nova Scotia Trust Company of New York (Incorporated by reference to Exhibit 10.2 to the Company’s Current Report on Form 8-K filed on July 26, 2013.) |
| |
| 10.28 | | Amended and Restated Committed Facility Agreement, dated as of August 29, 2013, by and between Paris Funding LLC and BNP Paribas Prime Brokerage, Inc. (Incorporated by reference to Exhibit 10.1 to the Company’s Current Report on Form 8-K filed on September 5, 2013.) |
77
| | |
| |
| 10.29 | | Senior Secured Revolving Credit Agreement, dated as of September 4, 2013, among the Registrant, as borrower, the lenders from time to time party thereto, JPMorgan Chase Bank, N.A., as administrative agent, and ING Capital LLC as syndication agent(Incorporated by reference to Exhibit 10.1 to the Company’s Current Report on Form 8-K filed on September 10, 2013.) |
| |
| 10.30 | | Guarantee and Security Agreement, dated as of September 4, 2013, and entered into among the Registrant, as borrower, and JPMorgan Chase Bank, N.A., as administrative agent and as collateral agent, and the other parties thereto (Incorporated by reference to Exhibit 10.1 to the Company’s Current Report on Form 8-K filed on September 10, 2013.) |
| |
| 10.31 | | Control Agreement, dated as of September 4, 2013, among the Registrant, as borrower, JPMorgan Chase Bank, N.A., as collateral agent, and State Street Bank and Trust Company, as custodian (Incorporated by reference to Exhibit 10.1 to the Company’s Current Report on Form 8-K filed on September 10, 2013.) |
| |
| 10.32 | | Amending Agreement, dated as of November 12, 2013, by and between Halifax Funding LLC and The Bank of Nova Scotia.(Incorporated by reference to Exhibit 10.32 to the Company’s Quarterly Report on Form 10-Q filed on November 14, 2013.) |
| |
| 10.33 | | Fourth Amendment to Credit Agreement between CCT Funding LLC, the lenders referred to therein and Deutsche Bank AG, New York Branch.(Incorporated by reference to Exhibit 10.26 to the Company’s Current Report on Form 8-K filed on January 31, 2014.) (Confidential portions of this exhibit have been omitted pursuant to a request for confidential treatment and filed separately with the SEC.) |
| |
| 10.34 | | Selected Dealer Agreement among the Registrant, CNL Securities Corp., CNL Fund Advisors Company, CNL Financial Group, LLC, KKR Asset Management LLC and Ameriprise Financial Services, Inc.(Incorporated by reference to Exhibit 10.34 to the Company’s Annual Report on Form 10-K filed on March 20, 2014.) (Confidential portions of this exhibit have been omitted pursuant to a request for confidential treatment and filed separately with the SEC.) |
| |
| 10.35 | | Commitment Increase Agreement between the Registrant and JPMorgan Chase Bank, N.A., as administrative agent for the lenders party to the Credit Agreement. (Incorporated by reference to Exhibit 10.1 to the Company’s Current Report on Form 8-K filed on April 10, 2014.) |
| |
| 10.36 | | Omnibus Amendment to the Senior Secured Term Loan Agreement, dated as of May 19, 2014, among the Registrant, as borrower, the subsidiary guarantor party thereto the lenders party thereto and JPMorgan Chase Bank, N.A., as administrative agent and collateral agent. (Incorporated by reference to Exhibit 10.1 to the Company’s Current Report on Form 8-K filed on May 22, 2014.) |
| |
| 10.37 | | Senior Secured Term Loan Agreement, dated as of May 20, 2014, among the Registrant, as borrower, the lenders from time to time party thereto, JPMorgan Chase Bank, N.A., as administrative agent and collateral agent, J.P. Morgan Securities LLC, Mizuho Bank, Ltd., HSBC Securities (USA) Inc., Merrill Lynch, Pierce, Fenner & Smith Incorporated and Barclays Bank PLC as co-syndication agents, joint bookrunners and joint lead arrangers and Greensledge Capital Markets LLC as co-syndication agent. (Incorporated by reference to Exhibit 10.2 to the Company’s Current Report on Form 8-K filed on May 22, 2014.) |
| |
| 10.38 | | First Amendment Agreement dated as of November 6, 2014 to the Amended and Restated Committed Facility Agreement dated August 29, 2013 between BNP Paribas Prime Brokerage, Inc. and Paris Funding LLC(Filed herewith.) |
| |
| 31.1 | | Certification of Chief Executive Officer of Corporate Capital Trust, Inc., Pursuant to Rule 13a-14(a), as Adopted Pursuant to Section 302 of the Sarbanes-Oxley Act of 2002.(Filed herewith.) |
| |
| 31.2 | | Certification of Chief Financial Officer of Corporate Capital Trust, Inc., Pursuant to Rule 13a-14(a), as Adopted Pursuant to Section 302 of the Sarbanes-Oxley Act of 2002.(Filed herewith.) |
| |
| 32.1 | | Certification of Chief Executive Officer and Chief Financial Officer of Corporate Capital Trust, Inc., Pursuant to 18 U.S.C. Section 1350, as Adopted Pursuant to Section 906 of the Sarbanes-Oxley Act of 2002.(Filed herewith.) |
78