UNITED STATES
SECURITIES AND EXCHANGE COMMISSION
Washington, D.C. 20549
FORM 10-Q
x | QUARTERLY REPORT PURSUANT TO SECTION 13 OR 15 (d) OF THE SECURITIES EXCHANGE ACT OF 1934 |
For the quarterly period ended September 30, 2012
OR
o | TRANSITION REPORT PURSUANT TO SECTION 13 OR 15 (d) OF THE SECURITIES EXCHANGE ACT OF 1934 |
Commission file number: 814-00827
Corporate Capital Trust, Inc.
(Exact name of registrant as specified in its charter)
| | |
| Maryland | 27-2857503 |
| (State or other jurisdiction of incorporation or organization) | (I.R.S. Employer Identification No.) |
| | |
| CNL Center at City Commons | |
| 450 South Orange Avenue | |
| Orlando, Florida | 32801 |
| (Address of principal executive offices) | (Zip Code) |
Registrant’s telephone number, including area code (866) 745-3797
Indicate by check mark whether the registrant (1) has filed all reports required to be filed by Section 13 or 15(d) of the Securities Exchange Act of 1934 during the preceding 12 months (or for such shorter period that the registrant was required to file such reports), and (2) has been subject to such filing requirements for the past 90 days. Yes x No o
Indicate by check mark whether the registrant has submitted electronically and posted on its corporate Web site, if any, every Interactive Data File required to be submitted and posted pursuant to Rule 405 of Regulation S-T (§232.405 of this chapter) during the preceding 12 months (or for such shorter period that the registrant was required to submit and post such files). Yes o No o
Indicate by check mark whether the registrant is a large accelerated filer, an accelerated filer, a non-accelerated filer, or a smaller reporting company. See definition of “large accelerated filer,” “accelerated filer” and “smaller reporting company” in Rule 12b-2 of the Exchange Act.
| | | | |
Large accelerated filer o | | Accelerated filer | o |
| | | | |
Non-accelerated filer x | (Do not check if a smaller reporting company) | Smaller reporting company | o |
Indicate by check mark whether the registrant is a shell company (as defined in Rule 12b-2 of the Exchange Act). Yes o No x
The number of shares of common stock of the registrant outstanding as of November 8, 2012 was 53,703,348.
CORPORATE CAPITAL TRUST, INC.
INDEX
| | | | | |
| | | | PAGE |
| PART I. FINANCIAL INFORMATION | | | |
| | | | | |
| | | | |
| | | | | |
| | | | 2 | |
| | | | | |
| | | | 3 | |
| | | | | |
| | | | 4 | |
| | | | | |
| | | | 5 | |
| | | | | |
| | | | 6 | |
| | | | | |
| | | | 24 | |
| | | | | |
| | | 38 | |
| | | | | |
| | | 50 | |
| | | | | |
| | | 52 | |
| | | | | |
| | | |
| | | | | |
| | | 52 | |
| | | | | |
| | | 52 | |
| | | | | |
| | | 52 | |
| | | | | |
| | | 52 | |
| | | | | |
| | | 52 | |
| | | | | |
| | | 52 | |
| | | | | |
| | | 52 | |
| | | | | |
| | 53 | |
| | | | | |
| | 54 | |
Corporate Capital Trust, Inc. and Subsidiary
| | | | | | | |
| | | September 30, 2012 | | | December 31, 2011 | |
| Assets | | | | | | |
| Investments at fair value (amortized cost of $602,757,860 and $113,825,998) | | $ | 611,305,845 | | | $ | 114,304,509 | |
| Cash | | | 13,267 | | | | — | |
| Dividends and interest receivable | | | 12,190,728 | | | | 1,055,807 | |
| Receivable for investments sold | | | 21,134,376 | | | | — | |
| Principal receivable | | | 491,009 | | | | 59,399 | |
| Receivable from advisors | | | — | | | | 564,756 | |
| Deferred financing costs | | | 156,327 | | | | 203,275 | |
| Deferred offering expense | | | 1,543,461 | | | | — | |
| Prepaid expenses | | | 88,033 | | | | 35,533 | |
| Total assets | | $ | 646,923,046 | | | $ | 116,223,279 | |
| Liabilities | | | | | | | | |
| Revolving credit facility | | $ | 160,920,000 | | | $ | 25,340,000 | |
| Payable for investments purchased | | | 30,813,133 | | | | 24,714,313 | |
| Unrealized depreciation on foreign currency forward contracts | | | 211,385 | | | | — | |
| Accrued performance-based incentive fees | | | 2,026,285 | | | | 282,570 | |
| Accrued investment advisory fees | | | 1,022,300 | | | | 160,679 | |
| Accrued reimbursement of expense support | | | 825,417 | | | | — | |
| Shareholders’ distributions payable | | | — | | | | 398,637 | |
| Accrued administrative services | | | 168,869 | | | | 56,390 | |
| Accrued directors’ fees | | | 14,406 | | | | 5,400 | |
| Other accrued expenses and liabilities | | | 924,747 | | | | 102,561 | |
| Total liabilities | | | 196,926,542 | | | | 51,060,550 | |
| Net Assets | | | | | | | | |
| Common stock, $0.001 par value per share, 1,000,000,000 shares authorized, 46,014,393 and 7,073,166 shares issued and outstanding | | | 46,014 | | | | 7,073 | |
| Paid-in capital in excess of par value | | | 443,855,165 | | | | 64,626,198 | |
| Undistributed (distributions in excess of) net investment income | | | (2,245,082 | ) | | | 5,956 | |
| Accumulated net unrealized appreciation on investments and foreign currency translation | | | 8,340,407 | | | | 523,502 | |
| Net assets | | $ | 449,996,504 | | | $ | 65,162,729 | |
| Net asset value per share | | $ | 9.78 | | | $ | 9.21 | |
See notes to condensed consolidated financial statements.
Corporate Capital Trust, Inc. and Subsidiary
| | | | | | | | | | | | | |
| | | For the three months ended | | | For the nine months ended | |
| | | September 30, 2012 | | | September 30, 2011 | | | September 30, 2012 | | | September 30, 2011 | |
| Investment income | | | | | | | | | | | | |
| Interest income | | $ | 11,223,248 | | | $ | 74,650 | | | $ | 20,182,506 | | | $ | 74,650 | |
| Fee income | | | 255,758 | | | | — | | | | 919,839 | | | | — | |
| Dividend income | | | 262 | | | | — | | | | 4,150 | | | | — | |
| Total investment income | | | 11,479,268 | | | | 74,650 | | | | 21,106,495 | | | | 74,650 | |
| Operating expenses | | | | | | | | | | | | | | | | |
| Investment advisory fees | | | 2,703,871 | | | | 40,371 | | | | 5,219,690 | | | | 41,344 | |
| Performance-based incentive fees | | | 1,387,595 | | | | — | | | | 1,920,562 | | | | — | |
| Organization expenses | | | — | | | | — | | | | 896,218 | | | | — | |
| Interest expense | | | 921,135 | | | | 11,826 | | | | 1,754,899 | | | | 11,826 | |
| Professional services | | | 199,081 | | | | 54,653 | | | | 754,431 | | | | 59,630 | |
| Administrative services | | | 351,135 | | | | 81,711 | | | | 785,136 | | | | 95,002 | |
| Director fees and expenses | | | 36,192 | | | | 47,890 | | | | 135,416 | | | | 55,178 | |
| Offering expense | | | 403,644 | | | | — | | | | 487,466 | | | | — | |
| Custodian and accounting fees | | | 58,507 | | | | 34,783 | | | | 127,261 | | | | 40,076 | |
| Other | | | 322,199 | | | | 80,824 | | | | 640,645 | | | | 89,282 | |
| Total operating expenses | | | 6,383,359 | | | | 352,058 | | | | 12,721,724 | | | | 392,338 | |
| Reimbursement of expense support | | | 798,254 | | | | — | | | | 828,347 | | | | — | |
| Expense support | | | — | | | | (352,058 | ) | | | (1,590,221 | ) | | | (392,338 | ) |
| Net expenses | | | 7,181,613 | | | | — | | | | 11,959,850 | | | | — | |
| Net investment income | | | 4,297,655 | | | | 74,650 | | | | 9,146,645 | | | | 74,650 | |
| Realized and unrealized gain (loss): | | | | | | | | | | | | | | | | |
| Net realized gain (loss) on investments | | | 478,015 | | | | (285 | ) | | | 1,749,910 | | | | (285 | ) |
| Net realized gain (loss) on foreign currency transactions | | | (29,132 | ) | | | — | | | | 13,754 | | | | — | |
| Net change in unrealized appreciation (depreciation) on investments | | | 6,545,953 | | | | (283,453 | ) | | | 8,069,474 | | | | (283,453 | ) |
| Net change in unrealized depreciation on foreign currency translation | | | (116,904 | ) | | | — | | | | (252,569 | ) | | | — | |
| Net realized and unrealized gain (loss) | | | 6,877,932 | | | | (283,738 | ) | | | 9,580,569 | | | | (283,738 | ) |
| Net increase (decrease) in net assets resulting from operations | | $ | 11,175,587 | | | $ | (209,088 | ) | | $ | 18,727,214 | | | $ | (209,088 | ) |
| Net Investment Income Per Share | | $ | 0.11 | | | $ | 0.10 | | | $ | 0.39 | | | $ | 0.27 | |
| Diluted and Basic Earnings (Loss) Per Share | | $ | 0.30 | | | $ | (0.28 | ) | | $ | 0.79 | | | $ | (0.76 | ) |
| Weighted Average Shares Outstanding | | | 37,881,506 | | | | 736,093 | | | | 23,696,227 | | | | 275,541 | |
| Dividends Declared Per Share | | $ | 0.19 | | | $ | 0.19 | | | $ | 0.57 | | | $ | 0.19 | |
See notes to condensed consolidated financial statements.
Corporate Capital Trust, Inc. and Subsidiary
| | | For the nine months ended | |
| | | September 30, 2012 | | | September 30, 2011 | |
| Operations | | | | | | |
| Net investment income | | $ | 9,146,645 | | | $ | 74,650 | |
| Net realized gain (loss) on investments and foreign currency transactions | | | 1,763,664 | | | | (285 | ) |
| Net change in unrealized appreciation (depreciation) on investments and foreign currency translation | | | 7,816,905 | | | | (283,453 | ) |
| Net increase (decrease) in net assets resulting from operations | | | 18,727,214 | | | | (209,088 | ) |
| Distributions to shareholders from | | | | | | | | |
| Net investment income | | | (9,152,601 | ) | | | (74,650 | ) |
| Realized gains | | | (1,763,664 | ) | | | — | |
| Other sources | | | (2,245,082 | ) | | | (53,291 | ) |
| Net decrease in net assets resulting from shareholders distributions | | | (13,161,347 | ) | | | (127,941 | ) |
| Capital share transactions | | | | | | | | |
| Issuance of shares of common stock | | | 372,910,130 | | | | 15,463,347 | |
| Reinvestment of shareholder distributions | | | 6,815,498 | | | | 73,931 | |
| Repurchase of shares of common stock | | | (457,720 | ) | | | — | |
| Net increase in net assets resulting from capital share transactions | | | 379,267,908 | | | | 15,537,278 | |
| Total increase in net assets | | | 384,833,775 | | | | 15,200,249 | |
| Net assets at beginning of period | | | 65,162,729 | | | | 200,000 | |
| Net assets at end of period | | $ | 449,996,504 | | | $ | 15,400,249 | |
| Capital share activity | | | | | | | | |
| Shares issued from subscriptions | | | 38,290,080 | | | | 1,718,149 | |
| Shares issued from reinvestment of distributions | | | 698,628 | | | | 8,215 | |
| Shares repurchased | | | (47,481 | ) | | | — | |
| Net increase in shares outstanding | | | 38,941,227 | | | | 1,726,364 | |
| Distributions in excess of net investment income at end of period | | $ | (2,245,082 | ) | | $ | (53,291 | ) |
See notes to condensed consolidated financial statements.
| Corporate Capital Trust, Inc. and Subsidiary |
|
| | | | | | | |
| | | For the nine months ended | |
| | | September 30, 2012 | | | September 30, 2011 | |
| | | | | | | |
| Operating Activities: | | | | | | |
| Net increase (decrease) in net assets resulting from operations | | $ | 18,727,214 | | | $ | (209,088 | ) |
| Adjustments to reconcile net increase in net assets resulting from operations to net cash used in operating activities: | | | | | | | | |
| Purchases of investments | | | (598,361,856 | ) | | | (15,267,304 | ) |
| Increase in payable for investments purchased | | | 6,053,829 | | | | 5,045,476 | |
| Proceeds from sales of investments | | | 100,188,011 | | | | 33,270 | |
| Net realized (gain) loss on investments | | | (1,749,910 | ) | | | 285 | |
| Net change in unrealized (appreciation) depreciation on investments | | | (8,069,474 | ) | | | 283,453 | |
| Net change in unrealized depreciation on foreign currency translation | | | 252,569 | | | | — | |
| Increase in short-term investments, net | | | (5,226,245 | ) | | | (5,140,857 | ) |
| Proceeds from principal payments | | | 16,323,261 | | | | 10,923 | |
| Amortization of premium/discount - net | | | (105,123 | ) | | | 11,030 | |
| Amortization of deferred financing cost | | | 107,699 | | | | — | |
| Increase in dividend and interest receivable | | | (11,131,114 | ) | | | (180,168 | ) |
| Increase in receivable for investments sold | | | (21,134,376 | ) | | | — | |
| Increase in principal receivable | | | (431,610 | ) | | | (4,681 | ) |
| Decrease (increase) in receivable from advisors | | | 564,756 | | | | (111,169 | ) |
| Increase in other assets | | | (1,595,961 | ) | | | (70,035 | ) |
| Increase in accrued investment advisory fees | | | 1,687,038 | | | | — | |
| Increase in accrued performance-based incentive fees | | | 1,743,715 | | | | — | |
| Increase in other liabilities | | | 943,671 | | | | 171,649 | |
| Net cash used in operating activities | | | (501,213,906 | ) | | | (15,427,216 | ) |
| | | | | | | | | |
| Financing Activities: | | | | | | | | |
| Proceeds from issuance of shares of common stock | | | 372,910,130 | | | | 15,463,347 | |
| Payment on redemption of shares of common stock | | | (457,720 | ) | | | — | |
| Distributions paid | | | (6,744,486 | ) | | | (54,010 | ) |
| Borrowings under credit facility | | | 135,580,000 | | | | — | |
| Deferred financing costs | | | (60,751 | ) | | | (182,121 | ) |
| Net cash provided by financing activities | | | 501,227,173 | | | | 15,227,216 | |
| Net increase (decrease) in cash | | | 13,267 | | | | (200,000 | ) |
| Cash, beginning of period | | | — | | | | 200,000 | |
| Cash, end of period | | $ | 13,267 | | | $ | — | |
| | | | | | | | | |
| Supplemental disclosure of cash flow information and non-cash financing activities: | | | | | | | | |
| Cash paid during period for: | | | | | | | | |
| Interest | | $ | 1,193,510 | | | $ | — | |
| Dividend distributions reinvested | | $ | 6,815,498 | | | $ | 73,931 | |
See notes to condensed consolidated financial statements.
Corporate Capital Trust, Inc. and Subsidiary
Condensed Consolidated Schedule of Investments (unaudited) As of September 30, 2012
| Company (a) | | Industry | | Investments | | Interest Rate | | LIBOR Floor | | Maturity Date | | No. Shares/
Principal
Amount (b) | | | Cost (c) | | | Fair Value | | % of Net Assets | |
Non-Control/Non-Affiliate Investments(d)—132.9% | | | | | | | | | | | | |
| ACCO Brands Corp. | | Commercial & Professional Services | | Subordinated Debt(e)(f)(g) | | 6.75% | | | | 4/30/2020 | | $ | 1,603,000 | | $ | 1,631,945 | | $ | 1,671,127 | | 0.4% | |
| Allen Systems Group, Inc. | | Software & Services | | Senior Debt(g)(h) | | L + 575 | | 1.75% | | 11/21/2015 | | | 7,659,654 | | | 7,226,555 | | | 7,420,289 | | 1.7% | |
| | | | | Senior Debt(e)(g) | | 10.50% | | | | 11/15/2016 | | | 106,000 | | | 64,637 | | | 73,670 | | 0.0% | |
| | | | 7,291,192 | | | 7,493,959 | | 1.7% | |
| Alliant Holdings I, Inc. | | Insurance | | Senior Debt(g) | | L + 300 | | | | 8/21/2014 | | | 84,076 | | | 78,374 | | | 83,740 | | 0.0% | |
| | | | | Subordinated Debt(e)(g)(i) | | 11.00% | | | | 5/1/2015 | | | 12,199,000 | | | 12,696,733 | | | 12,564,970 | | 2.8% | |
| | | | 12,775,107 | | | 12,648,710 | | 2.8% | |
| Allison Transmission, Inc. | | Automobiles & Components | | Senior Debt(f)(g) | | L + 350 | | | | 8/7/2017 | | | 7,507 | | | 7,182 | | | 7,533 | | 0.0% | |
| American Gaming Systems, LLC | | Consumer Services | | Senior Debt(h) | | L + 1000 | | 1.50% | | 8/24/2016 | | | 11,974,375 | | | 11,501,066 | | | 11,974,375 | | 2.7% | |
| | | | | Senior Debt(h)(i)(n) | | L + 1000 | | 1.50% | | 8/24/2016 | | | 780,938 | | | (30,488) | | | — | | —% | |
| | | | | Senior Debt(h)(i)(n) | | L + 1000 | | 1.50% | | 8/24/2016 | | | 780,938 | | | (30,488) | | | — | | —% | |
| | | | 11,440,090 | | | 11,974,375 | | 2.7% | |
| American Rock Salt Company, LLC | | Materials | | Senior Debt(g)(i) | | L + 425 | | 1.25% | | 4/25/2017 | | | 8,507,124 | | | 8,157,699 | | | 8,415,672 | | 1.9% | |
| Amkor Technologies, Inc. | | Semiconductors & Semiconductor Equipment | | Subordinated Debt(f)(g) | | 7.38% | | | | 5/1/2018 | | | 213,000 | | | 210,730 | | | 221,520 | | 0.1% | |
| Aramark Corp. | | Commercial & Professional Services | | Subordinated Debt(g) | | 8.50% | | | | 2/1/2015 | | | 2,863,000 | | | 2,931,445 | | | 2,931,025 | | 0.7% | |
| Ardagh Packaging Holdings Ltd. (IE)(j) | | Capital Goods | | Senior Debt(e)(f)(g) | | 7.38% | | | | 10/15/2017 | | | 100,000 | | | 100,437 | | | 107,250 | | 0.0% | |
| Aspect Software, Inc. | | Technology Hardware & | | Senior Debt(g)(i) | | L + 450 | | 1.75% | | 5/7/2016 | | | 178,628 | | | 176,631 | | | 176,507 | | 0.0% | |
| | | Equipment | | Senior Debt(g) | | 10.63% | | | | 5/15/2017 | | | 9,009,000 | | | 9,507,124 | | | 9,256,747 | | 2.1% | |
| | | | 9,683,755 | | | 9,433,254 | | 2.1% | |
| Aspen Dental Management, Inc. | | Health Care Equipment & Services | | Senior Debt(g) | | L + 550 | | 1.50% | | 10/6/2016 | | | 5,327,871 | | | 5,253,504 | | | 5,322,890 | | 1.2% | |
| Asset Acceptance Capital Corp. | | Diversified Financials | | Senior Debt(f)(g)(h) | | L + 725 | | 1.50% | | 11/14/2017 | | | 931,083 | | | 908,014 | | | 942,721 | | 0.2% | |
| Asurion, LLC | | Software & Services | | Senior Debt(g) | | L + 400 | | 1.50% | | 5/24/2018 | | | 3,285,425 | | | 3,239,833 | | | 3,311,101 | | 0.7% | |
| | | | | Senior Debt(g) | | L + 750 | | 1.50% | | 5/24/2019 | | | 396,303 | | | 396,303 | | | 411,093 | | 0.1% | |
| | | | 3,636,136 | | | 3,722,194 | | 0.8% | |
See notes to condensed consolidated financial statements.
Corporate Capital Trust, Inc. and Subsidiary
Condensed Consolidated Schedule of Investments (unaudited) (continued)
As of September 30, 2012
| Company (a) | | Industry | | Investments | | Interest Rate | | LIBOR Floor | | Maturity Date | | No. Shares/
Principal
Amount (b) | | | Cost (c) | | | Fair Value | | % of Net Assets | |
| Atlantic Broadband Finance, LLC | | Media | | Senior Debt(g) | | L + 400 | | 1.25% | | 4/4/2019 | | $ | 359,344 | | $ | 360,206 | | $ | 360,947 | | 0.1% | |
| Avaya, Inc. | | Technology Hardware & Equipment | | Senior Debt(e)(g) | | 7.00% | | | | 4/1/2019 | | | 9,555,000 | | | 9,026,562 | | | 8,886,150 | | 2.0% | |
| Avis Budget Car Rental, LLC | | Transportation | | Senior Debt(f)(g) | | L + 500 | | 1.25% | | 9/22/2018 | | | 156,025 | | | 153,259 | | | 157,429 | | 0.0% | |
| AWAS Finance Luxembourg S.Ã r.l. (LU)(j) | | Transportation | | Senior Debt(f)(g) | | L + 450 | | 1.25% | | 7/16/2018 | | | 459,768 | | | 455,248 | | | 464,964 | | 0.1% | |
| Belden, Inc. | | Capital Goods | | Subordinated Debt(e)(f)(g) | | 5.50% | | | | 9/1/2022 | | | 4,734,000 | | | 4,743,204 | | | 4,840,515 | | 1.1% | |
| Bill Barrett Corp. | | Energy | | Subordinated Debt(f)(g) | | 7.63% | | | | 10/1/2019 | | | 251,000 | | | 256,899 | | | 266,060 | | 0.1% | |
| Block Communications, Inc. | | Media | | Subordinated Debt(e)(g) | | 7.25% | | | | 2/1/2020 | | | 108,000 | | | 111,115 | | | 114,750 | | 0.0% | |
| BNY ConvergEX Group, LLC | | Diversified Financials | | Senior Debt(f)(g) | | L + 375 | | 1.50% | | 12/19/2016 | | | 109,865 | | | 108,643 | | | 106,203 | | 0.0% | |
| | | | | Senior Debt(f)(g) | | L + 375 | | 1.50% | | 12/19/2016 | | | 250,758 | | | 247,969 | | | 242,400 | | 0.1% | |
| | | | | Senior Debt(f)(g)(h) | | L + 700 | | 1.75% | | 12/17/2017 | | | 1,386,716 | | | 1,380,320 | | | 1,289,646 | | 0.3% | |
| | | | | Senior Debt(f)(g)(h) | | L + 700 | | 1.75% | | 12/17/2017 | | | 581,872 | | | 579,188 | | | 541,141 | | 0.1% | |
| | | | 2,316,120 | | | 2,179,390 | | 0.5% | |
| Boise Paper Holdings, LLC | | Materials | | Subordinated Debt(f)(g) | | 9.00% | | | | 11/1/2017 | | | 146,000 | | | 153,882 | | | 160,600 | | 0.0% | |
| Bright Horizons Family Solutions, Inc. | | Consumer Services | | Senior Debt(g)(h) | | L + 425 | | 1.00% | | 5/23/2017 | | | 1,006,520 | | | 1,001,763 | | | 1,011,553 | | 0.2% | |
| Building Materials Corporation Of America | | Capital Goods | | Subordinated Debt(e)(g) | | 6.75% | | | | 5/1/2021 | | | 1,802,000 | | | 1,939,639 | | | 1,973,190 | | 0.4% | |
| Cablevision Systems Corp. | | Media | | Subordinated Debt(f)(g) | | 7.75% | | | | 4/15/2018 | | | 1,238,000 | | | 1,258,377 | | | 1,371,085 | | 0.3% | |
| Caesars Entertainment Operating Co., Inc. | | Consumer Services | | Senior Debt(f)(g) | | L + 300 | | | | 1/28/2015 | | | 12,699 | | | 11,860 | | | 12,343 | | 0.0% | |
| | | | Senior Debt(f)(g) | | 11.25% | | | | 6/1/2017 | | | 1,023,000 | | | 1,076,807 | | | 1,099,725 | | 0.2% | |
| | | | 1,088,667 | | | 1,112,068 | | 0.2% | |
| California Pizza Kitchen, Inc. | | Food & Staples Retailing | | Senior Debt(g) | | L + 550 | | 1.25% | | 7/7/2017 | | | 4,316,622 | | | 4,273,046 | | | 4,318,414 | | 1.0% | |
| Calpine Corp. | | Utilities | | Senior Debt(f)(g)(i) | | L + 325 | | 1.25% | | 10/9//2019 | | | 363,956 | | | 362,136 | | | 366,118 | | 0.1% | |
| Camp International Holding Co. | | Software & Services | | Senior Debt(g) | | L + 525 | | 1.25% | | 5/31/2019 | | | 2,162,287 | | | 2,167,584 | | | 2,185,532 | | 0.5% | |
See notes to condensed consolidated financial statements.
Corporate Capital Trust, Inc. and Subsidiary
Condensed Consolidated Schedule of Investments (unaudited) (continued)
As of September 30, 2012
| Company (a) | | Industry | | Investments | | Interest Rate | | LIBOR Floor | | Maturity Date | | No. Shares/
Principal Amount (b) | | | Cost (c) | | | Fair Value | | % of Net Assets | |
| Catalina Marketing Corp. | | Media | | Senior Debt(g) | | L + 550 | | | | 9/29/2017 | | $ | 8,431,567 | | $ | 8,352,833 | | $ | 8,505,764 | | 1.9% | |
| | | | | Subordinated Debt(e)(g) | | 10.50% | | | | 10/1/2015 | | | 19,902,000 | | | 19,855,667 | | | 20,001,510 | | 4.4% | |
| | | | 28,208,500 | | | 28,507,274 | | 6.3% | |
| CDW Corp. | | Technology Hardware & Equipment | | Subordinated Debt(g) | | 12.54% | | | | 10/12/2017 | | | 8,698,000 | | | 9,351,817 | | | 9,285,115 | | 2.1% | |
| Cemex Materials, LLC | | Materials | | Subordinated Debt(f)(EUR) | | 4.75% | | | | 3/5/2014 | | € | 419,000 | | $ | 472,523 | | $ | 522,283 | | 0.1% | |
| | | | | Subordinated Debt(e)(g) | | 7.70% | | | | 7/21/2025 | | $ | 8,300,000 | | | 7,448,232 | | | 7,843,500 | | 1.7% | |
| | | | 7,920,755 | | | 8,365,783 | | 1.8% | |
| Cengage Learning Acquisitions, Inc. | | Media | | Senior Debt(e)(g) | | 11.50% | | | | 4/15/2020 | | | 14,622,000 | | | 15,011,768 | | | 15,645,540 | | 3.5% | |
| Cequel Communications, LLC | | Media | | Subordinated Debt(e)(g) | | 8.63% | | | | 11/15/2017 | | | 524,000 | | | 564,442 | | | 559,370 | | 0.1% | |
| Ceridian Corp. | | Software & Services | | Senior Debt(g) | | L + 575 | | | | 5/9/2017 | | | 1,766,730 | | | 1,740,783 | | | 1,779,247 | | 0.4% | |
| | | | | Senior Debt(e)(g) | | 8.88% | | | | 7/15/2019 | | | 2,123,000 | | | 2,123,000 | | | 2,292,840 | | 0.5% | |
| | | | 3,863,783 | | | 4,072,087 | | 0.9% | |
| Charter Communications Operating Holdings, LLC | | Media | | Subordinated Debt(f)(g) | | 7.25% | | | | 10/30/2017 | | | 573,000 | | | 582,057 | | | 624,570 | | 0.1% | |
| Chesapeake Energy Corp. | | Energy | | Subordinated Debt(f)(g) | | L + 700 | | 1.50% | | 12/2/2017 | | | 2,331,000 | | | 2,264,319 | | | 2,341,070 | | 0.5% | |
| ClubCorp Club Operations, Inc. | | Consumer Services | | Senior Debt(g) | | L + 450 | | 1.50% | | 11/30/2016 | | | 136,053 | | | 129,525 | | | 137,074 | | 0.0% | |
| Commscope, Inc. | | Technology Hardware & Equipment | | Subordinated Debt(e)(g) | | 8.25% | | | | 1/15/2019 | | | 632,000 | | | 666,734 | | | 682,560 | | 0.2% | |
| Continental Airlines, Inc. | | Transportation | | Senior Debt(f)(g) | | 7.34% | | | | 4/19/2014 | | | 357,706 | | | 361,483 | | | 372,014 | | 0.1% | |
| | | | | Senior Debt(f)(g) | | 8.31% | | | | 4/2/2018 | | | 680,669 | | | 676,541 | | | 728,316 | | 0.2% | |
| | | | 1,038,024 | | | 1,100,330 | | 0.3% | |
| CRC Health Corp. | | Health Care Equipment & Services | | Senior Debt(g) | | L + 450 | | | | 11/16/2015 | | | 1,199,199 | | | 1,140,995 | | | 1,167,720 | | 0.3% | |
| | | | | Subordinated Debt(g) | | 10.75% | | | | 2/1/2016 | | | 1,114,000 | | | 1,072,323 | | | 1,036,020 | | 0.2% | |
| | | | 2,213,318 | | | 2,203,740 | | 0.5% | |
| Cricket Communications, Inc. | | Telecommunication Services | | Senior Debt(f)(g) | | 7.75% | | | | 5/15/2016 | | | 1,563,000 | | | 1,575,300 | | | 1,648,965 | | 0.4% | |
See notes to condensed consolidated financial statements.
Corporate Capital Trust, Inc. and Subsidiary
Condensed Consolidated Schedule of Investments (unaudited) (continued)
As of September 30, 2012
| Company (a) | | Industry | | Investments | | Interest Rate | | LIBOR Floor | | Maturity Date | | No. Shares/
Principal Amount (b) | | | Cost (c) | | | Fair Value | | % of Net Assets | |
| Data Device Corp. | | Capital Goods | | Senior Debt(g) | | L + 600 | | 1.50% | | 7/11/2018 | | $ | 7,915,517 | | $ | 7,761,818 | | $ | 7,889,119 | | 1.8% | |
| | | | | Senior Debt(g)(h) | | L + 1000 | | 1.50% | | 7/11/2019 | | | 8,000,000 | | | 7,843,494 | | | 7,880,000 | | 1.8% | |
| | | | 15,605,312 | | | 15,769,119 | | 3.6% | |
| DineEquity, Inc. | | Consumer Services | | Senior Debt(f)(g) | | L + 300 | | 1.25% | | 10/19/2017 | | | 55,868 | | | 53,851 | | | 56,314 | | 0.0% | |
| DJO Finance, LLC | | Health Care Equipment & Services | | Senior Debt(g) | | L + 500 | | 1.25% | | 9/15/2017 | | | 1,979,586 | | | 1,981,959 | | | 1,991,464 | | 0.4% | |
| | | | | Senior Debt(e)(g)(i) | | 8.75% | | | | 3/15/2018 | | | 8,188,000 | | | 8,657,585 | | | 8,709,985 | | 1.9% | |
| | | | 10,639,544 | | | 10,701,449 | | 2.3% | |
| DuPont Fabros Technology, LP | | Real Estate | | Subordinated Debt(f)(g) | | 8.50% | | | | 12/15/2017 | | | 100,000 | | | 105,916 | | | 110,250 | | 0.0% | |
| E*Trade Financial Corp. | | Diversified Financials | | Subordinated Debt(f)(g) | | 6.75% | | | | 6/1/2016 | | | 11,000 | | | 11,072 | | | 11,578 | | 0.0% | |
| | | | | Subordinated Debt(f)(g) | | 7.88% | | | | 12/1/2015 | | | 1,269,000 | | | 1,265,196 | | | 1,292,794 | | 0.3% | |
| | | | | Subordinated Debt(f)(g) | | 12.50% | | | | 11/30/2017 | | | 10,826,000 | | | 12,379,056 | | | 12,301,042 | | 2.7% | |
| | | | 13,655,324 | | | 13,605,414 | | 3.0% | |
| Easton-Bell Sports, Inc. | | Consumer Durables & Apparel | | Senior Debt(g) | | 9.75% | | | | 12/1/2016 | | | 1,190,000 | | | 1,264,628 | | | 1,286,688 | | 0.3% | |
| Education Management, LLC | | Consumer Services | | Senior Debt(f)(g) | | L + 700 | | 1.25% | | 3/30/2018 | | | 7,097,662 | | | 6,897,675 | | | 6,347,971 | | 1.4% | |
| | | | | Subordinated Debt(f)(g) | | 8.75% | | | | 6/1/2014 | | | 5,818,000 | | | 5,632,601 | | | 4,581,675 | | 1.0% | |
| | | | 12,530,276 | | | 10,929,646 | | 2.4% | |
| Emergency Medical Services Corp. | | Health Care Equipment & Services | | Senior Debt(g) | | L + 375 | | 1.50% | | 5/25/2018 | | | 3,232,204 | | | 3,232,500 | | | 3,258,465 | | 0.7% | |
| Express, LLC / Express Finance Corp. | | Retailing | | Subordinated Debt(f)(g) | | 8.75% | | | | 3/1/2018 | | | 43,000 | | | 45,928 | | | 47,085 | | 0.0% | |
| Fidelity National Information Services, Inc. | | Software & Services | | Subordinated Debt(f)(g) | | 7.63% | | | | 7/15/2017 | | | 26,000 | | | 27,175 | | | 28,470 | | 0.0% | |
| | | | Subordinated Debt(f)(g) | | 7.88% | | | | 7/15/2020 | | | 114,000 | | | 122,555 | | | 127,395 | | 0.0% | |
| | | | 149,730 | | | 155,865 | | 0.0% | |
| First American Payment Systems, L.P. | | Software & Services | | Senior Debt(g)(h) | | L + 500 | | 1.75% | | 11/1/2016 | | | 1,330,901 | | | 1,318,643 | | | 1,334,229 | | 0.3% | |
| FleetPride Corp. | | Capital Goods | | Senior Debt(g) | | L + 550 | | 1.25% | | 12/6/2017 | | | 831,395 | | | 829,438 | | | 845,945 | | 0.2% | |
| Fly Leasing Ltd. | | Transportation | | Senior Debt(f)(g) | | L + 550 | | 1.25% | | 8/9/2018 | | | 3,289,954 | | | 3,160,509 | | | 3,291,320 | | 0.7% | |
See notes to condensed consolidated financial statements.
Corporate Capital Trust, Inc. and Subsidiary
Condensed Consolidated Schedule of Investments (unaudited) (continued)
As of September 30, 2012
| Company (a) | | Industry | | Investments | | Interest Rate | | LIBOR Floor | | Maturity Date | | No. Shares/
Principal Amount (b) | | | Cost (c) | | | Fair Value | | % of Net Assets | |
| Freedom Group | | Consumer Durables & Apparel | | Senior Debt(g) | | L + 425 | | 1.25% | | 4/19/2019 | | $ | 994,277 | | $ | 989,384 | | $ | 1,003,911 | | 0.2% | |
| | | | | Senior Debt(e)(g) | | 7.88% | | | | 5/1/2020 | | | 909,000 | | | 961,457 | | | 986,265 | | 0.2% | |
| | | | 1,950,841 | | | 1,990,176 | | 0.4% | |
| FTI Consulting, Inc. | | Diversified Financials | | Subordinated Debt(f)(g) | | 6.75% | | | | 10/1/2020 | | | 87,000 | | | 86,840 | | | 92,873 | | 0.0% | |
| GCI, Inc. | | Telecommunication Services | | Subordinated Debt(g) | | 6.75% | | | | 6/1/2021 | | | 6,677,000 | | | 6,753,641 | | | 6,677,000 | | 1.5% | |
| | | | | Subordinated Debt(g) | | 8.63% | | | | 11/15/2019 | | | 8,575,000 | | | 9,117,777 | | | 9,261,000 | | 2.1% | |
| | | | 15,871,418 | | | 15,938,000 | | 3.6% | |
| Generac Power System, Inc. | | Capital Goods | | Senior Debt(f)(g)(h) | | L + 500 | | 1.25% | | 5/30/2018 | | | 6,546 | | | — | | | 6,654 | | 0.0% | |
| Genesys Telecommunications Laboratories, Inc. | | Software & Services | | Common Stock(h)* | | | | | | | | | 448,908 | | | 448,908 | | | 561,134 | | 0.1% | |
| | | | Subordinated Debt(h)(EUR) | | 12.50% | | | | 1/31/2020 | | € | 2,044,000 | | $ | 2,629,630 | | $ | 2,679,174 | | 0.6% | |
| | | | 3,078,538 | | | 3,240,308 | | 0.7% | |
| Good Sam Enterprises, LLC | | Media | | Senior Debt(g) | | 11.50% | | | | 12/1/2016 | | $ | 10,105,000 | | | 10,372,634 | | | 10,711,300 | | 2.4% | |
| Goodman Global, Inc. | | Capital Goods | | Senior Debt(g) | | L + 700 | | 2.00% | | 10/30/2017 | | | 1,246,673 | | | 1,253,636 | | | 1,270,048 | | 0.3% | |
| Great Lakes Dredge & Dock Corp. | | Capital Goods | | Subordinated Debt(f)(g) | | 7.38% | | | | 2/1/2019 | | | 711,000 | | | 726,183 | | | 750,105 | | 0.2% | |
| Guitar Center, Inc. | | Retailing | | Senior Debt(g) | | L + 525 | | | | 4/9/2017 | | | 12,238,739 | | | 11,440,768 | | | 11,773,666 | | 2.7% | |
| Harbor Freight Tools USA, Inc. | | Capital Goods | | Senior Debt(g) | | L + 425 | | 1.25% | | 11/14/2017 | | | 5,008,978 | | | 4,968,077 | | | 5,042,363 | | 1.1% | |
| Hilcorp Energy I LP | | Energy | | Subordinated Debt(e)(f)(g) | | 7.63% | | | | 4/15/2021 | | | 390,000 | | | 422,102 | | | 429,000 | | 0.1% | |
| | | | | Subordinated Debt(e)(f)(g) | | 8.00% | | | | 2/15/2020 | | | 1,659,000 | | | 1,775,677 | | | 1,845,637 | | 0.4% | |
| | | | 2,197,779 | | | 2,274,637 | | 0.5% | |
| HUB International, Ltd. | | Insurance | | Senior Debt(g) | | L + 450 | | | | 6/13/2017 | | | 5,103,622 | | | 5,062,374 | | | 5,116,382 | | 1.1% | |
| | | | | Senior Debt(g) | | L + 475 | | 2.00% | | 12/13/2017 | | | 329,842 | | | 329,842 | | | 334,394 | | 0.1% | |
| | | | | Subordinated Debt(e)(g) | | 8.13% | | | | 10/15/2018 | | | 14,258,000 | | | 14,258,000 | | | 14,436,225 | | 3.2% | |
| | | | 19,650,216 | | | 19,887,001 | | 4.4% | |
| Hubbard Radio, LLC | | Media | | Senior Debt(g) | | L + 375 | | 1.50% | | 4/28/2017 | | | 534,146 | | | 530,687 | | | 540,155 | | 0.1% | |
| | | | | Senior Debt(g) | | L + 725 | | 1.50% | | 4/30/2018 | | | 14,669,501 | | | 14,804,422 | | | 14,889,544 | | 3.3% | |
| | | | 15,335,109 | | | 15,429,699 | | 3.4% | |
See notes to condensed consolidated financial statements.
Corporate Capital Trust, Inc. and Subsidiary
Condensed Consolidated Schedule of Investments (unaudited) (continued)
As of September 30, 2012
| Company (a) | | Industry | | Investments | | Interest Rate | | LIBOR Floor | | Maturity Date | | No. Shares/
Principal Amount (b) | | | Cost (c) | | | Fair Value | | % of Net Assets | |
| Immucor, Inc. | | Health Care Equipment & Services | | Senior Debt(g)(i) | | L + 450 | | 1.25% | | 8/19/2018 | | $ | 2,425,258 | | $ | 2,431,556 | | $ | 2,439,810 | | 0.5% | |
| Ineos US Finance, LLC (UK)(j) | | Materials | | Senior Debt(e)(f)(g) | | 9.00% | | | | 5/15/2015 | | | 70,000 | | | 73,352 | | | 74,025 | | 0.0% | |
| Infor (US), Inc. | | Software & Services | | Senior Debt(g)(i) | | L + 400 | | 1.25% | | 4/5/2018 | | | 2,154,844 | | | 2,144,070 | | | 2,166,178 | | 0.5% | |
| | | | | Subordinated Debt(e)(g) | | 11.50% | | | | 7/15/2018 | | | 4,549,000 | | | 4,981,799 | | | 5,185,860 | | 1.2% | |
| | | | 7,125,869 | | | 7,352,038 | | 1.7% | |
| Intelsat Jackson Holdings SA(LU)(j) | | Media | | Subordinated Debt(f)(g) | | 7.25% | | | | 4/1/2019 | | | 6,173,000 | | | 6,144,112 | | | 6,666,840 | | 1.5% | |
| Interactive Data Corp. | | Diversified Financials | | Senior Debt(g) | | L + 325 | | 1.25% | | 2/11/2018 | | | 17,629 | | | 17,300 | | | 17,763 | | 0.0% | |
| iPayment, Inc. | | Software & Services | | Senior Debt(g) | | L + 425 | | 1.50% | | 5/8/2017 | | | 1,910,441 | | | 1,890,978 | | | 1,898,500 | | 0.4% | |
| | | | | Subordinated Debt(g) | | 10.25% | | | | 5/15/2018 | | | 4,013,000 | | | 3,792,961 | | | 3,501,342 | | 0.8% | |
| | | | 5,683,939 | | | 5,399,842 | | 1.2% | |
| IPC Systems, Inc. | | Technology Hardware & Equipment | | Senior Debt(g) | | L + 525 | | | | 7/31/2017 | | | 4,032,030 | | | 3,969,307 | | | 3,966,510 | | 0.9% | |
| J. Crew Group, Inc. | | Retailing | | Subordinated Debt(g) | | 8.13% | | | | 3/1/2019 | | | 1,471,000 | | | 1,398,880 | | | 1,540,873 | | 0.3% | |
| Jo-Ann Stores, Inc. | | Retailing | | Senior Debt(g) | | L + 350 | | 1.25% | | 3/16/2018 | | | 22,824 | | | 22,628 | | | 22,921 | | 0.0% | |
| Kerling PLC (UK)(j) | | Materials | | Senior Debt(e)(f)(EUR) | | 10.63% | | | | 2/1/2017 | | € | 5,353,000 | | $ | 6,580,102 | | $ | 6,517,730 | | 1.5% | |
| Kinetic Concepts, Inc. | | Health Care Equipment & Services | | Senior Debt(g) | | L + 525 | | 1.25% | | 11/4/2016 | | $ | 1,310,171 | | | 1,304,967 | | | 1,321,216 | | 0.3% | |
| | | | | Senior Debt(g) | | L + 575 | | 1.25% | | 5/4/2018 | | | 1,956,931 | | | 1,967,764 | | | 1,988,124 | | 0.4% | |
| | | | | Senior Debt(e)(g) | | 10.50% | | | | 11/1/2018 | | | 6,847,000 | | | 6,972,738 | | | 7,240,702 | | 1.6% | |
| | | | 10,245,469 | | | 10,550,042 | | 2.3% | |
| Liz Claiborne, Inc. | | Consumer Durables & Apparel | | Senior Debt(e)(f)(g) | | 10.50% | | | | 4/15/2019 | | | 1,735,000 | | | 1,851,847 | | | 1,958,381 | | 0.4% | |
| Local TV Finance, LLC | | Media | | Senior Debt(g) | | L + 400 | | | | 5/7/2015 | | | 370,225 | | | 357,519 | | | 372,539 | | 0.1% | |
| Lord & Taylor Holdings, LLC | | Consumer Durables & Apparel | | Senior Debt(g) | | L + 450 | | 1.25% | | 1/11/2019 | | | 33,362 | | | 33,604 | | | 33,675 | | 0.0% | |
| McJunkin Red Man Corp. | | Energy | | Senior Debt(g) | | 9.50% | | | | 12/15/2016 | | | 11,393,000 | | | 12,013,357 | | | 12,290,199 | | 2.7% | |
| MedAssets, Inc. | | Health Care Equipment & Services | | Senior Debt(f)(g) | | L + 375 | | 1.50% | | 11/16/2016 | | | 684,425 | | | 686,045 | | | 689,901 | | 0.2% | |
| | | | | Subordinated Debt(f)(g) | | 8.00% | | | | 11/15/2018 | | | 489,000 | | | 490,266 | | | 533,010 | | 0.1% | |
| | | | 1,176,311 | | | 1,222,911 | | 0.3% | |
| MetroPCS Wireless, Inc. | | Telecommunication Services | | Subordinated Debt(f)(g) | | 7.88% | | | | 9/1/2018 | | | 1,762,000 | | | 1,837,250 | | | 1,902,960 | | 0.4% | |
See notes to condensed consolidated financial statements.
Corporate Capital Trust, Inc. and Subsidiary
Condensed Consolidated Schedule of Investments (unaudited) (continued)
As of September 30, 2012
| Company (a) | | Industry | | Investments | | Interest Rate | | LIBOR Floor | | Maturity Date | | No. Shares/
Principal Amount (b) | | | Cost (c) | | | Fair Value | | % of Net Assets | |
| Michaels Stores, Inc. | | Retailing | | Senior Debt(g) | | L + 450 | | | | 7/31/2016 | | $ | 681,714 | | $ | 669,158 | | $ | 689,015 | | 0.2% | |
| Misys PLC (UK) | | Software & Services | | Senior Debt(f)(g) | | L + 600 | | 1.25% | | 12/12/2018 | | | 1,419,814 | | | 1,386,963 | | | 1,431,527 | | 0.3% | |
| | | | | Senior Debt(f)(g) | | 12.00% | | | | 6/12/2019 | | | 5,819,283 | | | 5,715,556 | | | 6,052,054 | | 1.3% | |
| | | | 7,102,519 | | | 7,483,581 | | 1.6% | |
| Momentive Performance Materials USA, Inc. | | Materials | | Senior Debt(g) | | L + 350 | | | | 5/5/2015 | | | 536,881 | | | 517,866 | | | 521,220 | | 0.1% | |
| | | | Senior Debt(g) | | 12.50% | | | | 6/15/2014 | | | 8,370,000 | | | 8,716,831 | | | 8,621,100 | | 1.9% | |
| | | | 9,234,697 | | | 9,142,320 | | 2.0% | |
| Mueller Water Products, Inc. | | Capital Goods | | Subordinated Debt(f)(g) | | 7.38% | | | | 6/1/2017 | | | 1,034,000 | | | 888,363 | | | 1,059,850 | | 0.2% | |
| Nara Cable Funding (IE)(j) | | Media | | Senior Debt(e)(f)(g) | | 8.88% | | | | 12/1/2018 | | | 981,000 | | | 826,169 | | | 895,163 | | 0.2% | |
| National Vision, Inc. | | Retailing | | Senior Debt(g)(h) | | L + 575 | | 1.25% | | 8/2/2018 | | | 3,053,928 | | | 3,008,910 | | | 3,092,102 | | 0.7% | |
| NBTY, Inc. | | Household & Personal Products | | Senior Debt(g) | | L + 325 | | 1.00% | | 10/1/2017 | | | 26,355 | | | 26,069 | | | 26,496 | | 0.0% | |
| New Enterprise Stone & Lime Co., Inc. | | Capital Goods | | Senior Debt(e)(g) | | 4.00% CASH, 9.00% PIK | | | | 3/15/2018 | | | 6,272,090 | | | 6,272,090 | | | 6,428,892 | | 1.4% | |
| Newport Television, LLC | | Media | | Senior Debt(g) | | L + 675 | | 3.00% | | 9/14/2016 | | | 11,698,674 | | | 11,796,181 | | | 11,808,232 | | 2.7% | |
| Nexstar Broadcasting, Inc. | | Media | | Senior Debt(f)(g) | | 8.88% | | | | 4/15/2017 | | | 170,000 | | | 176,954 | | | 184,875 | | 0.0% | |
| NPC International, Inc. | | Consumer Services | | Senior Debt(g) | | L + 400 | | 1.25% | | 12/28/2018 | | | 1,635,757 | | | 1,636,473 | | | 1,656,204 | | 0.4% | |
| NuSil Technology, LLC | | Materials | | Senior Debt(g) | | L + 400 | | 1.25% | | 4/7/2017 | | | 510,252 | | | 513,752 | | | 511,208 | | 0.1% | |
| Nuveen Investments, Inc. | | Diversified Financials | | Senior Debt(f)(g) | | L + 550 | | | | 5/13/2017 | | | 25,629 | | | 24,132 | | | 25,533 | | 0.0% | |
| | | | | Senior Debt(f)(g) | | L + 600 | | 1.25% | | 5/13/2017 | | | 282,184 | | | 277,170 | | | 284,918 | | 0.1% | |
| | | | | Senior Debt(f)(g) | | L + 700 | | 1.25% | | 2/28/2019 | | | 641,271 | | | 635,295 | | | 648,088 | | 0.1% | |
| | | | | Subordinated Debt(f)(g) | | 5.50% | | | | 9/15/2015 | | | 889,000 | | | 829,184 | | | 844,550 | | 0.2% | |
| | | | 1,765,781 | | | 1,803,089 | | 0.4% | |
| Ocwen Financial Corp. | | Banks | | Senior Debt(f)(g)(h) | | L + 550 | | 1.50% | | 9/1/2016 | | | 260,405 | | | 257,413 | | | 261,869 | | 0.1% | |
| Office Depot, Inc. | | Retailing | | Senior Debt(e)(f)(g) | | 9.75% | | | | 3/15/2019 | | | 5,743,000 | | | 5,647,504 | | | 5,728,642 | | 1.3% | |
| Penn National Gaming, Inc. | | Consumer Services | | Subordinated Debt(f)(g) | | 8.75% | | | | 8/15/2019 | | | 401,000 | | | 430,147 | | | 449,120 | | 0.1% | |
See notes to condensed consolidated financial statements.
Corporate Capital Trust, Inc. and Subsidiary
Condensed Consolidated Schedule of Investments (unaudited) (continued)
As of September 30, 2012
| Company (a) | | Industry | | Investments | | Interest Rate | | LIBOR Floor | | Maturity Date | | No. Shares/
Principal
Amount (b) | | | Cost (c) | | | Fair Value | | % of Net Assets | |
| Petco Animal Supplies, Inc. | | Retailing | | Senior Debt(g) | | L + 325 | | 1.25% | | 11/24/2017 | | $ | 118,888 | | $ | 113,614 | | $ | 119,604 | | 0.0% | |
| Pharmaceutical Product Development, Inc. | | Pharmaceuticals, Biotechnology & Life Sciences | | Senior Debt(g) | | L + 500 | | 1.25% | | 12/5/2018 | | | 802,597 | | | 793,070 | | | 811,426 | | 0.2% | |
| Pinnacle Foods Finance, LLC | | Food & Staples Retailing | | Senior Debt(g) | | L + 350 | | | | 10/2/2016 | | | 543,582 | | | 529,881 | | | 545,284 | | 0.1% | |
| Plains Exploration & Production Co. | | Energy | | Subordinated Debt(f)(g) | | 6.13% | | | | 6/15/2019 | | | 8,000 | | | 7,806 | | | 8,060 | | 0.0% | |
| Prestige Brands, Inc. | | Pharmaceuticals, Biotechnology & Life Sciences | | Senior Debt(f)(g) | | L + 400 | | 1.25% | | 1/31/2019 | | | 95,264 | | | 93,937 | | | 96,500 | | 0.0% | |
| | | Subordinated Debt(f)(g) | | 8.13% | | | | 2/1/2020 | | | 602,000 | | | 642,759 | | | 671,230 | | 0.2% | |
| | | | 736,696 | | | 767,730 | | 0.2% | |
| Realogy Corp. | | Real Estate | | Senior Debt(g) | | L + 425 | | | | 10/10/2016 | | | 4,148,262 | | | 3,925,053 | | | 4,106,780 | | 1.0% | |
| Redprairie Corp. | | Software & Services | | Senior Debt(g)(i) | | L + 500 | | 1.00% | | 8/6/2018 | | | 4,938,697 | | | 4,943,108 | | | 4,969,564 | | 1.1% | |
| Reynolds Group Holdings, Inc. | | Capital Goods | | Senior Debt(e)(g)(i) | | 5.75% | | | | 10/15/2020 | | | 533,000 | | | 533,000 | | | 533,000 | | 0.1% | |
| Rocket Software, Inc. | | Software & Services | | Senior Debt(g) | | L + 550 | | 1.50% | | 2/8/2018 | | | 1,926,177 | | | 1,944,621 | | | 1,939,420 | | 0.4% | |
| Roofing Supply Group, LLC | | Retailing | | Senior Debt(g) | | L + 525 | | 1.25% | | 5/31/2019 | | | 89,513 | | | 89,731 | | | 90,661 | | 0.0% | |
| Roundy's Supermarkets, Inc. | | Food & Staples Retailing | | Senior Debt(f)(g) | | L + 450 | | 1.25% | | 2/13/2019 | | | 4,476,616 | | | 4,449,581 | | | 4,397,470 | | 1.0% | |
| Ryerson, Inc. | | Materials | | Senior Debt(g) | | L + 737.5 | | | | 11/1/2014 | | | 4,094,000 | | | 4,024,571 | | | 4,094,000 | | 0.9% | |
| | | | | Senior Debt(e)(g)(i) | | 9.00% | | | | 10/15/2017 | | | 6,731,000 | | | 6,731,000 | | | 6,882,447 | | 1.5% | |
| | | | | Senior Debt(g) | | 12.00% | | | | 11/1/2015 | | | 9,037,000 | | | 9,226,490 | | | 9,330,702 | | 2.1% | |
| | | | 19,982,061 | | | 20,307,149 | | 4.5% | |
| Sabre, Inc. | | Transportation | | Senior Debt(i)(g) | | L + 600 | | 1.25% | | 12/29/2017 | | | 1,841,035 | | | 1,823,237 | | | 1,858,295 | | 0.4% | |
| | | | | Senior Debt(e)(g) | | 8.50% | | | | 5/15/2019 | | | 7,957,000 | | | 8,142,016 | | | 8,175,817 | | 1.8% | |
| | | | 9,965,253 | | | 10,034,112 | | 2.2% | |
| Savers, Inc. | | Retailing | | Senior Debt(g) | | L + 500 | | 1.25% | | 7/9/2019 | | | 204,682 | | | 202,685 | | | 206,825 | | 0.0% | |
| Schaeffler AG (DE)(j) | | Automobiles & Components | | Senior Debt(f)(g)(i) | | L + 475 | | 1.25% | | 1/27/2017 | | | 3,086,176 | | | 3,095,375 | | | 3,126,697 | | 0.7% | |
| | | | | Senior Debt(e)(f)(g) | | 8.50% | | | | 2/15/2019 | | | 5,000 | | | 5,388 | | | 5,600 | | 0.0% | |
| | | | 3,100,763 | | | 3,132,297 | | 0.7% | |
See notes to condensed consolidated financial statements.
Corporate Capital Trust, Inc. and Subsidiary
Condensed Consolidated Schedule of Investments (unaudited) (continued)
As of September 30, 2012
| Company (a) | | Industry | | Investments | | Interest Rate | | LIBOR Floor | | Maturity Date | | No. Shares/
Principal Amount (b) | | | Cost (c) | | | Fair Value | | % of Net Assets | |
| Scitor Corp. | | Capital Goods | | Senior Debt(g) | | L + 350 | | 1.50% | | 2/15/2017 | | $ | 21,849 | | $ | 21,805 | | $ | 21,665 | | 0.0% | |
| Sedgwick Claims Management Services Holdings, Inc. | | Insurance | | Senior Debt(g)(h) | | L + 350 | | 1.50% | | 12/31/2016 | | | 112,693 | | | 107,728 | | | 113,186 | | 0.0% | |
| | | | Senior Debt(g)(h) | | L + 750 | | 1.50% | | 5/30/2017 | | | 1,338,888 | | | 1,317,238 | | | 1,332,193 | | 0.3% | |
| | | | 1,424,966 | | | 1,445,379 | | 0.3% | |
| Sidera Networks, Inc. | | Media | | Senior Debt(g) | | L + 450 | | 1.50% | | 8/26/2016 | | | 2,638,236 | | | 2,492,333 | | | 2,625,045 | | 0.6% | |
| Sinclair Television Group, Inc. | | Media | | Subordinated Debt(g) | | 8.38% | | | | 10/15/2018 | | | 27,000 | | | 28,248 | | | 29,768 | | 0.0% | |
| Skilled Healthcare Group, Inc. | | Health Care Equipment & Services | | Senior Debt(f)(g) | | L + 525 | | 1.50% | | 4/9/2016 | | | 14,851 | | | 14,494 | | | 14,869 | | 0.0% | |
| SNL Financial, LLC | | Commercial & Professional Services | | Senior Debt(g)(h) | | L + 700 | | 1.50% | | 8/17/2018 | | | 2,251,491 | | | 2,268,731 | | | 2,251,491 | | 0.5% | |
| Sophia, LP | | Software & Services | | Senior Debt(g) | | L + 500 | | 1.25% | | 7/19/2018 | | | 398,505 | | | 393,024 | | | 403,885 | | 0.1% | |
| Springleaf Financial Funding Co. | | Diversified Financials | | Senior Debt(f)(g) | | L + 425 | | 1.25% | | 5/10/2017 | | | 2,551,580 | | | 2,305,103 | | | 2,503,100 | | 0.6% | |
| SSI Investments II, Ltd. | | Software & Services | | Subordinated Debt(g) | | 11.13% | | | | 6/1/2018 | | | 1,369,000 | | | 1,446,646 | | | 1,546,970 | | 0.3% | |
| Standard Chartered Bank (SG)(j) | | Banks | | Subordinated Debt(e)(f)(h)(k) | | L + 1600 | | | | 4/1/2014 | | | 3,310,000 | | | 3,337,068 | | | 3,424,526 | | 0.8% | |
| Styron Holding B.V. (LU)(j) | | Materials | | Senior Debt(f)(g) | | L + 450 | | 1.50% | | 8/2/2017 | | | 2,593,576 | | | 2,433,920 | | | 2,493,075 | | 0.6% | |
| Supervalu, Inc. | | Food & Staples Retailing | | Subordinated Debt(f)(g)(i) | | 7.25% | | | | 5/1/2013 | | | 3,503,000 | | | 3,473,761 | | | 3,555,545 | | 0.8% | |
| | | | | Subordinated Debt(f)(g) | | 7.50% | | | | 11/15/2014 | | | 6,710,000 | | | 6,490,392 | | | 6,441,600 | | 1.4% | |
| | | | 9,964,153 | | | 9,997,145 | | 2.2% | |
| The Gymboree Corp. | | Retailing | | Senior Debt(g)(i) | | L + 350 | | 1.50% | | 2/23/2018 | | | 11,438,727 | | | 10,938,843 | | | 11,181,355 | | 2.5% | |
| | | | | Subordinated Debt(g)(i) | | 9.13% | | | | 12/1/2018 | | | 11,080,000 | | | 10,461,867 | | | 10,539,850 | | 2.3% | |
| | | | 21,400,710 | | | 21,721,205 | | 4.8% | |
| The Neiman Marcus Group, Inc. | | Retailing | | Senior Debt(g) | | L + 350 | | 1.25% | | 5/16/2018 | | | 188,713 | | | 182,353 | | | 190,064 | | 0.0% | |
| | | | | Subordinated Debt(g) | | 10.38% | | | | 10/15/2015 | | | 1,967,000 | | | 2,028,080 | | | 2,006,340 | | 0.4% | |
| | | | 2,210,433 | | | 2,196,404 | | 0.4% | |
| The SI Organization, Inc. | | Capital Goods | | Senior Debt(g) | | L + 325 | | 1.25% | | 11/22/2016 | | | 186,483 | | | 176,126 | | | 186,017 | | 0.0% | |
| The TelX Group, Inc. | | Telecommunication Services | | Senior Debt(g) | | L + 650 | | 1.25% | | 9/25/2017 | | | 653,119 | | | 658,446 | | | 658,018 | | 0.2% | |
See notes to condensed consolidated financial statements.
Corporate Capital Trust, Inc. and Subsidiary
Condensed Consolidated Schedule of Investments (unaudited) (continued)
As of September 30, 2012
| Company (a) | | Industry | | Investments | | Interest Rate | | LIBOR Floor | | Maturity Date | | No. Shares/
Principal Amount (b) | | | Cost (c) | | | Fair Value | | % of Net Assets | |
| TowerCo Finance, LLC | | Real Estate | | Senior Debt | | L + 350 | | 1.00% | | 2/2/2017 | | $ | 30,104 | | $ | 29,572 | | $ | 30,179 | | 0.0% | |
| Towergate Finance PLC (UK)(j) | | Insurance | | Subordinated Debt(e)(f)(GBP) | | 10.50% | | | | 2/15/2019 | | £ | 125,000 | | $ | 172,654 | | $ | 188,730 | | 0.0% | |
| TransUnion, LLC | | Diversified Financials | | Subordinated Debt(g) | | 11.38% | | | | 6/15/2018 | | $ | 1,403,000 | | | 1,545,663 | | | 1,652,032 | | 0.4% | |
| Triple Point Technology, Inc. | | Software & Services | | Senior Debt(g)(h) | | L + 650 | | 1.50% | | 10/27/2017 | | | 2,316,326 | | | 2,330,178 | | | 2,322,117 | | 0.5% | |
| Univar, Inc. | | Materials | | Senior Debt(g) | | L + 350 | | 1.50% | | 6/30/2017 | | | 955,611 | | | 930,049 | | | 952,759 | | 0.2% | |
| Verisure Holding AB (SE)(j) | | Commercial & Professional Services | | Senior Debt(e)(f)(EUR) | | 8.75% | | | | 9/1/2018 | | € | 397,000 | | $ | 483,354 | | $ | 528,021 | | 0.1% | |
| Vision Solutions, Inc. | | Commercial & Professional Services | | Senior Debt(g)(h) | | L + 450 | | 1.50% | | 7/23/2016 | | $ | 1,387,500 | | | 1,374,181 | | | 1,390,969 | | 0.3% | |
| VWR Funding, Inc. | | Pharmaceuticals, Biotechnology & Life Sciences | | Senior Debt(g) | | L + 425 | | | | 4/3/2017 | | | 146,455 | | | 139,821 | | | 147,370 | | 0.0% | |
| | Subordinated Debt(e)(g) | | 7.25% | | | | 9/15/2017 | | | 5,349,000 | | | 5,349,000 | | | 5,429,235 | | 1.2% | |
| | | | | Subordinated Debt(g) | | 10.25% CASH or 11.25% PIK | | | | 7/15/2015 | | | 7,271,000 | | | 7,479,078 | | | 7,434,597 | | 1.7% | |
| | | | 12,967,899 | | | 13,011,202 | | 2.9% | |
| Warner Chilcott Co., LLC(IE)(j) | | Pharmaceuticals, Biotechnology & Life Sciences | | Subordinated Debt(f)(g) | | 7.75% | | | | 9/15/2018 | | | 1,225,000 | | | 1,219,432 | | | 1,307,688 | | 0.3% | |
| Wastequip, LLC | | Materials | | Senior Debt(g)(h) | | L + 675 | | 1.50% | | 6/15/2018 | | | 11,256,202 | | | 10,982,580 | | | 11,425,045 | | 2.5% | |
| West Corp. | | Software & Services | | Senior Debt | | L + 425 | | 1.25% | | 7/15/2016 | | | 4,961 | | | 4,830 | | | 5,014 | | 0.0% | |
| | | | | Subordinated Debt(g) | | 7.88% | | | | 1/15/2019 | | | 1,575,000 | | | 1,559,711 | | | 1,622,250 | | 0.4% | |
| | | | | Subordinated Debt(g) | | 8.63% | | | | 10/1/2018 | | | 5,840,000 | | | 6,037,124 | | | 6,132,000 | | 1.4% | |
| | | | 7,601,665 | | | 7,759,264 | | 1.8% | |
| Wilton Brands, LLC | | Materials | | Senior Debt(g) | | L + 625 | | 1.25% | | 8/30/2018 | | | 12,985,947 | | | 12,728,235 | | | 13,132,039 | | 2.9% | |
| Zayo Group, LLC | | Telecommunication Services | | Senior Debt(g) | | 8.13% | | | | 1/1/2020 | | | 2,260,000 | | | 2,404,409 | | | 2,469,050 | | 0.6% | |
| | | | | Subordinated Debt(g) | | 10.13% | | | | 7/1/2020 | | | 5,000,000 | | | 5,330,358 | | | 5,525,000 | | 1.2% | |
| | | | 7,734,767 | | | 7,994,050 | | 1.8% | |
| Total Non-Control/Non-Affiliate Investments | | | 589,816,863 | | | 598,364,848 | | 132.9% | |
See notes to condensed consolidated financial statements.
Corporate Capital Trust, Inc. and Subsidiary
Condensed Consolidated Schedule of Investments (unaudited) (continued)
As of September 30, 2012
| Company (a) | | Industry | | Investments | | Interest Rate | | LIBOR Floor | | Maturity Date | | No. Shares/ Principal Amount (b) | | | Cost (c) | | | Fair Value | | % of Net Assets | |
| Short Term Investments—2.9% | | | | | | | | | | | |
| Goldman Sachs Financial Square Funds - Prime Obligations Fund | | | | Short Term Investments(g) | | 0.12% (l) | | | | | $ | 11,806,680 | | $ | 11,806,680 | | $ | 11,806,680 | | 2.6% | |
| State Street Institutional Liquid Reserves Fund | | | | Short Term Investments | | 0.12% (l) | | | | 12/31/2099 | | 1,134,317 | | | 1,134,317 | | | 1,134,317 | | 0.3% | |
| Total Short Term Investments | | | 12,940,997 | | | 12,940,997 | | 2.9% | |
| TOTAL INVESTMENTS —135.8%(m) | | $ | 602,757,860 | | | 611,305,845 | | 135.80% | |
| LIABILITIES IN EXCESS OF OTHER ASSETS—(35.8%) | | (161,309,341 | ) | (35.80)% | |
| NET ASSETS—100.0% | $ | 449,996,504 | | 100.00% | |
| * | Non-income producing security. |
| (a) | Security may be an obligation of one or more entities affiliated with the named company. |
| (b) | Denominated in U.S. Dollars unless otherwise noted. |
| (c) | Represents amortized cost for debt securities and cost for common stock. |
| (d) | Non-Control/Non-Affiliate investments are defined by the Investment Company Act of 1940, as amended (“1940 Act”) as investments that are neither Control Investments nor Affiliate Investments. Controlled investments are defined by the 1940 Act as investments in which more than 25% of the voting securities are owned or where the ability to nominate greater than 50% of the board representation is maintained. Affiliate investments are defined by the 1940 Act as investments in which between 5% and 25% of the voting securities are owned and the investments are not classified as Controlled investments. |
| (e) | This security was acquired in a transaction that was exempt from the registration requirements of the Securities Act of 1933, as amended (the “Securities Act”), pursuant to Rule 144A thereunder. This security may be resold only in transactions that are exempt from the registration requirements of the Securities Act, normally to qualified institutional buyers. |
| (f) | The investment is not a qualifying asset as defined in Section 55(a) under the Investment Company Act of 1940, as amended, or the 1940 Act. As of September 30, 2012, the portfolio held 18.2% of non-qualifying assets, as a percentage of total assets. |
| (g) | Security or portion thereof is held within CCT Funding, LLC and is pledged as collateral supporting the amounts outstanding under the revolving credit facility with Deutsche Bank. |
| (h) | Investments classified as Level 3 whereby fair value was determined by the Company’s Board of Directors (see Note 2). |
| (i) | Position or portion thereof unsettled as of September 30, 2012. |
| (j) | A portfolio company domiciled in a foreign country. |
| (k) | A portfolio company investment structured as a credit-linked floating rate note. |
| (l) | 7-day effective yield as of September 30, 2012. |
See notes to condensed consolidated financial statements.
Corporate Capital Trust, Inc. and Subsidiary
Condensed Consolidated Schedule of Investments (unaudited) (continued)
As of September 30, 2012
| (m) | As of September 30, 2012, the aggregate gross unrealized appreciation for all securities in which there was an excess of value over tax cost was $11,724,430; the aggregate gross unrealized depreciation for all securities in which there was an excess of tax cost over value was $3,176,445; the net unrealized appreciation was $8,547,985; the aggregate cost of securities for Federal income tax purposes was $602,757,860. |
| (n) | Delayed draw term loan. |
| Abbreviations: |
| | DE - Germany |
| | EUR - Euro; principal amount is denominated in Euros currency. €1 / US $1.285 as of September 30, 2012. |
| | GBP - British Pound Sterling; principal amount is denominated in Pound Sterling. £ 1 / US $1.615 as of September 30, 2012. |
| | IE - Ireland |
| | L = LIBOR - London Interbank Offered Rate, typically 3-Month |
| | LU - Luxembourg |
| | PIK - Payment-in-kind |
| | SE - Sweden |
| | SG - Singapore |
| | UK - United Kingdom |
See notes to condensed consolidated financial statements.
Corporate Capital Trust, Inc. and Subsidiary
As of December 31, 2011
| Company (b) | | Industry (c) | | Investments | | Interest Rate | | EURIBOR/ LIBOR Floor | | Maturity Date | | | Principal Amount / No. Shares (m) | | | Cost (d) | | | Fair Value | | | % of Net Assets |
Non-Control/Non-Affiliate Investments(a)—163.6% | | | | | | | | | | | | | | | | | | | | | | | | |
| Alliant Holdings I, Inc. | | Insurance | | Senior Debt(e) | | L + 300 | | | | | 8/21/2014 | | | $ | 85,889 | | | $ | 78,083 | | | $ | 83,689 | | | 0.1% |
| Allison Transmission, Inc. | | Automobiles & Components | | Senior Debt(e) | | L + 250 | | | | | 8/7/2014 | | | | 7,564 | | | | 7,018 | | | | 7,389 | | | 0.0% |
| Ally Financial, Inc. | | Banks | | Preferred Stocks(e)(f) | | | | | | | | | | | 5,575 | | | | 99,595 | | | | 102,524 | | | 0.2% |
| Amkor Technologies, Inc. | | Semiconductors & Semiconductor Equipment | | Subordinated Debt(e)(f) | | 7.38% | | | | | 5/1/2018 | | | | 208,000 | | | | 205,404 | | | | 212,680 | | | 0.3% |
| Aramark Corp. | | Commercial & Professional Services | | Subordinated Debt(e) | | 8.50% | | | | | 2/1/2015 | | | | 1,187,000 | | | | 1,222,134 | | | | 1,216,675 | | | 1.9% |
| Aspect Software, Inc. | | Technology Hardware & Equipment | | Subordinated Debt(e) | | 10.63% | | | | | 5/15/2017 | | | | 1,484,000 | | | | 1,529,365 | | | | 1,539,650 | | | 2.4% |
| Aspen Dental Management, Inc. | | Health Care Equipment & Services | | Senior Debt(e)(g) | | L + 450 | | 1.50% | | | 10/6/2016 | | | | 155,886 | | | | 150,857 | | | | 151,989 | | | 0.2% |
| Asset Acceptance Capital Corp. | | Diversified Financials | | Senior Debt(e)(f)(h) | | L + 725 | | 1.50% | | | 11/14/2017 | | | | 480,179 | | | | 449,331 | | | | 463,373 | | | 0.7% |
| Associated Materials, LLC | | Capital Goods | | Senior Debt(e) | | 9.13% | | | | | 11/1/2017 | | | | 13,000 | | | | 13,184 | | | | 11,343 | | | 0.0% |
| Avaya, Inc. | | Technology Hardware & Equipment | | Senior Debt(e)(g) Senior Debt(e)(g) | | L + 275 L + 450 | | | | | 10/24/2014 10/26/2017 | | | | 1,142,373 974,527 | | | | 1,067,943 883,793 | | | | 1,095,010 890,474 | | | 1.7% 1.4% |
| | | | | | | | | | | | | | | | | | | 1,951,736 | | | | 1,985,484 | | | 3.0% |
| Avis Budget Car Rental, LLC | | Transportation | | Senior Debt(e)(f) | | L + 500 | | 1.25% | | | 9/22/2018 | | | | 276,675 | | | | 271,282 | | | | 278,837 | | | 0.4% |
| BJ’s Wholesale Club, Inc. | | Food & Staples Retailing | | Senior Debt(e) | | L + 575 | | 1.25% | | | 9/28/2018 | | | | 1,113,299 | | | | 1,093,129 | | | | 1,118,164 | | | 1.7% |
| Boise Paper Holdings, LLC | | Materials | | Subordinated Debt(e)(f) | | 9.00% | | | | | 11/1/2017 | | | | 146,000 | | | | 154,801 | | | | 156,950 | | | 0.2% |
| Cablevision Systems Corp. | | Media | | Subordinated Debt(e)(f) | | 7.75% | | | | | 4/15/2018 | | | | 426,000 | | | | 431,245 | | | | 451,560 | | | 0.7% |
| Caesars Entertainment Operating Co., Inc. | | Consumer Services | | Senior Debt(e)(g) | | L + 300 | | | | | 1/28/2015 | | | | 12,797 | | | | 11,723 | | | | 11,157 | | | 0.0% |
| | | Senior Debt(e) | | 11.25% | | | | | 6/1/2017 | | | | 1,070,000 | | | | 1,135,422 | | | | 1,135,537 | | | 1.7% |
| | | | | | | | | | | | | | | | | | | | 1,147,145 | | | | 1,146,694 | | | 1.8% |
| California Pizza Kitchen, Inc. | | Food & Staples Retailing | | Senior Debt(e)(g)(h) | | L + 550 | | 1.25% | | | 7/7/2017 | | | | 1,068,431 | | | | 1,023,743 | | | | 1,041,721 | | | 1.6% |
| Calpine Corp. | | Utilities | | Senior Debt(e)(f)(g) | | L + 325 | | 1.25% | | | 4/1/2018 | | | | 68,276 | | | | 65,451 | | | | 67,090 | | | 0.1% |
| CDW, LLC | | Technology Hardware & Equipment | | Senior Debt(e) | | L + 350 | | | | | 10/10/2014 | | | | 1,229,473 | | | | 1,201,984 | | | | 1,194,316 | | | 1.8% |
| | | | Subordinated Debt(e) | | 11.50% CASH | | | | | 10/12/2015 | | | | 135,000 | | | | 142,433 | | | | 141,750 | | | 0.2% |
| | | | | | or 12.50% PIK | | | | | | | | | | | | | 1,344,417 | | | | 1,336,066 | | | 2.1% |
| Cengage Learning Acquisitions, Inc. | | Media | | Senior Debt(e)(g) | | L + 225 | | | | | 7/3/2014 | | | | 1,954,781 | | | | 1,624,504 | | | | 1,670,243 | | | 2.6% |
| Ceridian Corp. | | Software & Services | | Senior Debt(e)(g) | | L + 300 | | | | | 11/10/2014 | | | | 1,793,378 | | | | 1,652,772 | | | | 1,621,330 | | | 2.5% |
| Charter Communications Operating Holdings, LLC | | Media | | Subordinated Debt(e)(f) | | 7.25% | | | | | 10/30/2017 | | | | 573,000 | | | | 583,128 | | | | 603,799 | | | 0.9% |
| CHS / Community Health Systems, Inc. | | Health Care Equipment & Services | | Subordinated Debt(e)(f) | | 8.88% | | | | | 7/15/2015 | | | | 433,565 | | | | 439,405 | | | | 447,656 | | | 0.7% |
| Citco III, Ltd. (IE)(i) | | Diversified Financials | | Senior Debt(e)(f)(g) | | L + 500 | | 1.25% | | | 6/29/2018 | | | | 17,307 | | | | 17,349 | | | | 16,572 | | | 0.0% |
| ClubCorp Club Operations, Inc. | | Consumer Services | | Senior Debt(e)(g) | | L + 450 | | 1.50% | | | 11/30/2016 | | | | 137,092 | | | | 129,554 | | | | 136,864 | | | 0.2% |
| Continental Airlines, Inc. | | Transportation | | Senior Debt(e)(f) | | 8.31% | | | | | 4/2/2018 | | | | 691,761 | | | | 686,329 | | | | 672,738 | | | 1.0% |
| CRC Health Corp. | | Health Care Equipment & Services | | Senior Debt(e) | | L + 450 | | | | | 11/16/2015 | | | | 973,846 | | | | 926,057 | | | | 883,766 | | | 1.4% |
| | | | Subordinated Debt(e) | | 10.75% | | | | | 2/1/2016 | | | | 1,114,000 | | | | 1,065,237 | | | | 1,058,300 | | | 1.6% |
| | | | | | | | | | | | | | | | | | | 1,991,294 | | | | 1,942,066 | | | 3.0% |
See notes to condensed consolidated financial statements.
Corporate Capital Trust, Inc. and Subsidiary
Condensed Consolidated Schedule of Investments (continued)
As of December 31, 2011
| Company (b) | | Industry (c) | | Investments | | Interest Rate | | EURIBOR/ LIBOR Floor | | Maturity Date | | | Principal Amount / No. Shares (m) | | | Cost (d) | | | Fair Value | | | % of Net Assets |
| Cricket Communications, Inc. | | Telecommunication Services | | Senior Debt(e)(f) | | 7.75% | | | | | 5/15/2016 | | | $ | 1,529,000 | | | $ | 1,541,150 | | | $ | 1,578,692 | | | 2.4% |
| Datatel, Inc. | | Software & Services | | Senior Debt(e) Senior Debt(e) Senior Debt(e)(g) | | L + 350 L + 725 L + 525 | | 1.50% 1.50% 1.50% | | | 2/20/2017 2/19/2018 9/15/2018 | | | | 556,984 150,000 406,204 | | | | 554,944 153,568 400,111 | | | | 557,750 150,750 406,840 | | | 0.9% 0.2% 0.6% |
| | | | | | | | | | | | | | | | | | | 1,108,623 | | | | 1,115,340 | | | 1.7% |
| DineEquity, Inc. | | Consumer Services | | Senior Debt(e)(f)(g) | | L + 300 | | 1.25% | | | 10/19/2017 | | | | 75,685 | | | | 72,728 | | | | 74,791 | | | 0.1% |
| DuPont Fabros Technology, LP | | Real Estate | | Subordinated Debt(e)(f) | | 8.50% | | | | | 12/15/2017 | | | | 100,000 | | | | 106,616 | | | | 107,000 | | | 0.2% |
| E*TRADE Financial Corp. | | Diversified Financials | | Subordinated Debt(e)(f) | | 7.88% | | | | | 12/1/2015 | | | | 1,269,000 | | | | 1,264,604 | | | | 1,275,345 | | | 2.0% |
| Easton-Bell Sports, Inc. | | Consumer Durables & Apparel | | Senior Debt(e) | | 9.75% | | | | | 12/1/2016 | | | | 1,190,000 | | | | 1,275,766 | | | | 1,297,100 | | | 2.0% |
| Education Management, LLC | | Consumer Services | | Subordinated Debt(e)(f) | | 8.75% | | | | | 6/1/2014 | | | | 1,728,000 | | | | 1,732,881 | | | | 1,732,320 | | | 2.7% |
| Emergency Medical Services Corp. | | Health Care Equipment & Services | | Senior Debt(e)(g) | | L + 375 | | 1.50% | | | 5/25/2018 | | | | 216,967 | | | | 205,433 | | | | 211,814 | | | 0.3% |
| Express, LLC / Express Finance Corp. | | Retailing | | Subordinated Debt(e)(f) | | 8.75% | | | | | 3/1/2018 | | | | 43,000 | | | | 46,248 | | | | 46,547 | | | 0.1% |
Fidelity National Information Services, Inc. | | Software & Services | | Subordinated Debt(e)(f)
Subordinated Debt(e)(f) | | 7.63%
7.88% | | | | | 7/15/2017 7/15/2020 | | | | 46,000 122,000 | | | | 48,686 130,244 | | | | 49,795 131,760 | | | 0.1% 0.2% |
| | | | | | | | | | | | | | | | | | 178,930 | | | | 181,555 | | | 0.3% |
| Fifth Third Processing Solutions, LLC | | Software & Services | | Senior Debt(e)(g) | | L + 325 | | 1.25% | | | 11/3/2016 | | | | 61,304 | | | | 59,554 | | | | 61,258 | | | 0.1% |
| FTI Consulting, Inc. | | Diversified Financials | | Subordinated Debt(e)(f) | | 6.75% | | | | | 10/1/2020 | | | | 87,000 | | | | 86,817 | | | | 89,827 | | | 0.1% |
| GCI, Inc. | | Telecommunication Services | | Subordinated Debt(e) | | 8.63% | | | | | 11/15/2019 | | | | 2,294,000 | | | | 2,438,105 | | | | 2,434,507 | | | 3.7% |
| General Nutrition Centers, Inc. | | Retailing | | Senior Debt(e)(f) | | L + 300 | | 1.25% | | | 3/2/2018 | | | | 23,369 | | | | 23,370 | | | | 23,029 | | | 0.0% |
| Good Sam Enterprises, LLC | | Media | | Senior Debt(e) | | 11.50% | | | | | 12/1/2016 | | | | 1,375,000 | | | | 1,343,093 | | | | 1,347,500 | | | 2.1% |
| Goodman Global, Inc. | | Capital Goods | | Senior Debt(e)(g) | | L + 700 | | 2.00% | | | 10/30/2017 | | | | 948,221 | | | | 952,962 | | | | 954,541 | | | 1.5% |
| Great Lakes Dredge & Dock Corp. | | Capital Goods | | Subordinated Debt(e)(f) | | 7.38% | | | | | 2/1/2019 | | | | 96,000 | | | | 94,738 | | | | 95,040 | | | 0.1% |
| Guitar Center, Inc. | | Retailing | | Senior Debt(e)(g) | | L + 525 | | | | | 4/9/2017 | | | | 4,238,739 | | | | 3,716,872 | | | | 3,736,449 | | | 5.7% |
| The Gymboree Corp. | | Retailing | | Senior Debt(e)(g) Subordinated Debt(e) | | L + 350 9.13% | | 1.50% | | | 2/23/2018 12/1/2018 | | | | 904,502 748,000 | | | | 847,281 609,721 | | | | 807,607 654,500 | | | 1.2% 1.0% |
| | | | | | | | | | | | | | | | | | | | 1,457,002 | | | | 1,462,107 | | | 2.2% |
| High Plains Broadcasting Operating Co. | | Media | | Senior Debt(g) | | L + 675 | | 3.00% | | | 9/14/2016 | | | | 351,687 | | | | 347,295 | | | | 349,561 | | | 0.5% |
| HUB International, Ltd. | | Insurance | | Senior Debt(e)(g) | | L + 250 | | 2.00% | | | 6/13/2014 | | | | 1,134,886 | | | | 1,088,373 | | | | 1,089,139 | | | 0.5% |
| | | | Senior Debt(e)(g) | | L + 475 | | | | | 6/13/2014 | | | | 332,350 | | | | 332,350 | | | | 331,283 | | | 1.7% |
| | | | | | | | | | | | | | | | | | | 1,420,723 | | | | 1,420,422 | | | 2.2% |
| Hubbard Radio, LLC | | Media | | Senior Debt(e)(g) | | L + 375 | | 1.50% | | | 4/28/2017 | | | | 606,123 | | | | 601,661 | | | | 598,359 | | | 0.9% |
| | | | | Senior Debt(e)(g) | | L + 725 | | 1.50% | | | 4/30/2018 | | | | 2,834,070 | | | | 2,819,267 | | | | 2,798,644 | | | 4.3% |
| | | | | | | | | | | | | | | | | | | | 3,420,928 | | | | 3,397,003 | | | 5.2% |
See notes to condensed consolidated financial statements.
Corporate Capital Trust, Inc. and Subsidiary
Condensed Consolidated Schedule of Investments (continued)
As of December 31, 2011
| Company (b) | | Industry (c) | | Investments | | Interest Rate | | EURIBOR/ LIBOR Floor | | Maturity Date | | | Principal Amount / No. Shares (m) | | | Cost (d) | | | Fair Value | | | % of Net Assets |
| Husky Injection Molding Systems, Ltd. (CA)(i) | | Capital Goods | | Senior Debt(e)(f)(g) | | L + 525 | | 1.25% | | | 6/29/2018 | | | $ | 1,159,646 | | | $ | 1,149,330 | | | $ | 1,159,194 | | | 1.8% |
| Immucor, Inc. | | Health Care Equipment & Services | | Senior Debt(e)(g) | | L + 575 | | 1.50% | | | 8/19/2018 | | | | 2,528,757 | | | | 2,533,137 | | | | 2,547,407 | | | 3.9% |
| Ineos Holdings, Ltd. (UK)(i) | | Materials | | Subordinated Debt(f)(g) (EUR) | | E + 600 PIK | | 3.00% | | | 6/16/2015 | | | € | 889,214 | | | $ | 1,109,884 | | | $ | 1,061,432 | | | 1.6% |
| Infor Enterprise Solutions Holdings, Inc. | | Software & Services | | Senior Debt(e)(g) | | L + 575 | | | | | 7/28/2015 | | | $ | 1,610,000 | | | | 1,541,287 | | | | 1,521,450 | | | 2.3% |
| Interactive Data Corp. | | Diversified Financials | | Senior Debt(e)(g) | | L + 325 | | 1.25% | | | 2/11/2018 | | | | 18,262 | | | | 17,899 | | | | 18,037 | | | 0.0% |
| iPayment, Inc. | | Software & Services | | Senior Debt(e)(g) | | L + 425 | | 1.50% | | | 5/8/2017 | | | | 1,953,798 | | | | 1,931,324 | | | | 1,932,629 | | | 3.0% |
| | | Subordinated Debt(e)(j) | | 10.25% | | | | | 5/15/2018 | | | | 415,000 | | | | 375,604 | | | | 390,100 | | | 0.6% |
| | | | | | | | | | | | | | | | | | | | 2,306,928 | | | | 2,322,729 | | | 3.6% |
| IPC Systems, Inc. | | Technology Hardware & Equipment | | Senior Debt(e)(g) | | L + 225 | | | | | 6/2/2014 | | | | 4,855 | | | | 4,515 | | | | 4,535 | | | 0.0% |
| J. Crew Group, Inc. | | Retailing | | Senior Debt(e)(g) | | L + 350 | | 1.25% | | | 3/7/2018 | | | | 2,765,351 | | | | 2,588,677 | | | | 2,604,366 | | | 4.0% |
| | | | Subordinated Debt(e) | | 8.13% | | | | | 3/1/2019 | | | | 1,026,000 | | | | 963,411 | | | | 979,830 | | | 1.5% |
| | | | | | | | | | | | | | | | | | | 3,552,088 | | | | 3,584,196 | | | 5.5% |
| Jo-Ann Stores, Inc. | | Retailing | | Senior Debt(e) | | L + 350 | | 1.25% | | | 3/16/2018 | | | | 23,488 | | | | 23,262 | | | | 22,453 | | | 0.0% |
| Kinetic Concepts, Inc. | | Health Care Equipment & Services | | Senior Debt(e)(f) | | L + 525 | | 1.25% | | | 11/4/2016 | | | | 329,847 | | | | 320,184 | | | | 329,642 | | | 0.5% |
| | | Senior Debt(e)(f)(g) | | L + 575 | | 1.25% | | | 5/4/2018 | | | | 375,178 | | | | 366,342 | | | | 379,071 | | | 0.6% |
| | | | | | | | | | | | | | | | | | 686,526 | | | | 708,713 | | | 1.1% |
| Lamar Media Corp. | | Media | | Subordinated Debt(e)(f) | | 6.63% | | | | | 8/15/2015 | | | | 206,000 | | | | 206,000 | | | | 210,120 | | | 0.3% |
| Lawson Software, Inc. | | Software & Services | | Senior Debt(e) | | L + 525 | | 1.50% | | | 7/5/2017 | | | | 1,766,446 | | | | 1,735,811 | | | | 1,726,542 | | | 2.6% |
| Local TV Finance, LLC | | Media | | Senior Debt(e) | | L + 200 | | | | | 5/7/2013 | | | | 370,225 | | | | 352,992 | | | | 358,191 | | | 0.5% |
| The Manitowoc Co., Inc. | | Capital Goods | | Subordinated Debt(e)(f) | | 9.50% | | | | | 2/15/2018 | | | | 21,000 | | | | 22,983 | | | | 22,365 | | | 0.0% |
| McJunkin Red Man Corp. | | Energy | | Senior Debt(e) | | 9.50% | | | | | 12/15/2016 | | | | 3,393,000 | | | | 3,374,953 | | | | 3,443,895 | | | 5.3% |
| MedAssets, Inc. | | Health Care Equipment & Services | | Senior Debt(e)(f)(g) | | L + 375 | | 1.50% | | | 11/16/2016 | | | | 699,792 | | | | 699,730 | | | | 698,742 | | | 1.1% |
| | | | Subordinated Debt(e)(f) | | 8.00% | | | | | 11/15/2018 | | | | 316,000 | | | | 311,267 | | | | 309,680 | | | 0.5% |
| | | | | | | | | | | | | | | | | | | 1,010,997 | | | | 1,008,422 | | | 1.5% |
| MetroPCS Wireless, Inc. | | Telecommunication Services | | Subordinated Debt(e)(f) | | 7.88% | | | | | 9/1/2018 | | | | 281,000 | | | | 284,117 | | | | 284,864 | | | 0.4% |
| Michaels Stores, Inc. | | Retailing | | Senior Debt(e) | | L + 225 | | | | | 10/31/2013 | | | | 215,942 | | | | 202,264 | | | | 212,726 | | | 0.3% |
| | | | Senior Debt(e)(g) | | L + 450 | | | | | 7/31/2016 | | | | 681,714 | | | | 667,113 | | | | 671,659 | | | 1.0% |
| | | | | | | | | | | | | | | | | | | | 869,377 | | | | 884,385 | | | 1.4% |
| Momentive Performance Materials USA, Inc. | | Materials | | Senior Debt(e)(g) | | L + 350 | | | | | 5/5/2015 | | | | 1,212,164 | | | | 1,161,622 | | | | 1,158,623 | | | 1.8% |
| Mondrian Investment Partners, Ltd. (UK)(i) | | Diversified Financials | | Senior Debt(e)(f)(g) | | L + 425 | | 1.25% | | | 7/12/2018 | | | | 488,020 | | | | 484,049 | | | | 488,020 | | | 0.7% |
| Mueller Water Products, Inc. | | Capital Goods | | Subordinated Debt(e)(f) | | 7.38% | | | | | 6/1/2017 | | | | 1,034,000 | | | | 871,542 | | | | 940,940 | | | 1.4% |
| | | Subordinated Debt(e)(f) | | 8.75% | | | | | 9/1/2020 | | | | 250,000 | | | | 253,683 | | | | 271,562 | | | 0.4% |
| | | | | | | | | | | | | | | | | | | 1,125,225 | | | | 1,212,502 | | | 1.9% |
See notes to condensed consolidated financial statements.
Corporate Capital Trust, Inc. and Subsidiary Condensed Consolidated Schedule of Investments (continued)
As of December 31, 2011
| Company (b) | | Industry (c) | | Investments | | Interest Rate | | EURIBOR/ LIBOR Floor | | Maturity Date | | | Principal Amount / No. Shares (m) | | | Cost (d) | | | Fair Value | | | % of Net Assets |
| N.E.W. Holdings I, LLC | | Software & Services | | Senior Debt(e) | | L + 425 | | 1.75% | | | 3/23/2016 | | | $ | 8,655 | | | $ | 8,250 | | | $ | 8,407 | | | 0.0% |
| | | Subordinated Debt(e)(h) | | L + 750 | | 2.00% | | | 3/23/2017 | | | | 998,480 | | | | 986,123 | | | | 963,533 | | | 1.5% |
| | | | | | | | | | | | | | | | | | 994,373 | | | | 971,940 | | | 1.5% |
| NBTY, Inc. | | Household & Personal Products | | Senior Debt(e)(g) | | L + 325 | | 1.00% | | | 10/1/2017 | | | | 26,355 | | | | 26,031 | | | | 26,126 | | | 0.0% |
| The Neiman Marcus Group, Inc. | | Retailing | | Senior Debt(e) | | L + 350 | | 1.25% | | | 5/16/2018 | | | | 188,713 | | | | 181,660 | | | | 182,344 | | | 0.3% |
| | | | Subordinated Debt(e) | | 10.38% | | | | | 10/15/2015 | | | | 1,967,000 | | | | 2,040,359 | | | | 2,043,241 | | | 3.1% |
| | | | | | | | | | | | | | | | | | | | 2,222,019 | | | | 2,225,585 | | | 3.4% |
| Nexstar Broadcasting, Inc. | | Media | | Senior Debt(e)(f) | | 8.88% | | | | | 4/15/2017 | | | | 170,000 | | | | 177,868 | | | | 174,250 | | | 0.3% |
| NPC International, Inc. | | Consumer Services | | Senior Debt(e)(g) | | L + 525 | | 1.50% | | | 11/7/2018 | | | | 1,515,463 | | | | 1,519,252 | | | | 1,521,146 | | | 2.3% |
| NuSil Technology, LLC | | Materials | | Senior Debt(e)(g) | | L + 400 | | 1.25% | | | 4/7/2017 | | | | 25,312 | | | | 25,312 | | | | 24,848 | | | 0.0% |
| Nuveen Investments, Inc. | | Diversified Financials | | Senior Debt(e)(f) | | L + 300 | | | | | 11/13/2014 | | | | 25,629 | | | | 25,290 | | | | 24,556 | | | 0.0% |
| | | Senior Debt(e)(f) | | L + 550 | | | | | 5/13/2017 | | | | 133,224 | | | | 130,890 | | | | 128,395 | | | 0.2% |
| | | | Senior Debt(e)(f)(g) | | L + 600 | | 1.25% | | | 5/13/2017 | | | | 282,184 | | | | 276,540 | | | | 278,891 | | | 0.4% |
| | | | | Subordinated Debt(e)(f) | | 10.50% | | | | | 11/15/2015 | | | | 1,715,000 | | | | 1,671,568 | | | | 1,702,137 | | | 2.6% |
| | | | | | | | | | | | | | | | | | | | 2,104,288 | | | | 2,133,979 | | | 3.3% |
| Ocwen Financial Corp. | | Banks | | Senior Debt(e)(f)(g) | | L + 550 | | 1.50% | | | 9/1/2016 | | | | 1,400,877 | | | | 1,381,333 | | | | 1,380,359 | | | 2.1% |
| Penn National Gaming, Inc. | | Consumer Services | | Subordinated Debt(e)(f) | | 8.75% | | | | | 8/15/2019 | | | | 401,000 | | | | 432,531 | | | | 436,087 | | | 0.7% |
| Petco Animal Supplies, Inc. | | Retailing | | Senior Debt(e) | | L + 325 | | 1.25% | | | 11/24/2017 | | | | 120,101 | | | | 114,129 | | | | 117,280 | | | 0.2% |
| Pharmaceutical Product Development, Inc. | | Pharmaceuticals, Biotechnology & Life Sciences | | Senior Debt(e)(f)(g) | | L + 500 | | 1.25% | | | 12/5/2018 | | | | 808,662 | | | | 798,202 | | | | 804,938 | | | 1.2% |
| Pinnacle Entertainment, Inc. | | Consumer Services | | Subordinated Debt(e)(f) | | 8.63% | | | | | 8/1/2017 | | | | 167,000 | | | | 176,491 | | | | 176,602 | | | 0.3% |
| Pinnacle Foods Finance, LLC | | Food & Staples Retailing | | Senior Debt(e)(g) | | L + 250 | | | | | 4/2/2014 | | | | 547,748 | | | | 530,579 | | | | 537,133 | | | 0.8% |
| Realogy Corp. | | Real Estate | | Senior Debt(e) | | L + 425 | | | | | 10/10/2016 | | | | 1,566,113 | | | | 1,379,558 | | | | 1,403,269 | | | 2.2% |
| | | | Senior Debt(e) | | L - 15 | | | | | 10/10/2016 | | | | 123,163 | | | | 108,445 | | | | 110,357 | | | 0.2% |
| | | | | | | | | | | | | | | | | | | | 1,488,003 | | | | 1,513,626 | | | 2.3% |
| Ryerson, Inc. | | Materials | | Senior Debt(e)(f) | | L + 737.5 | | | | | 11/1/2014 | | | | 98,000 | | | | 97,346 | | | | 90,160 | | | 0.1% |
| | | | | Senior Debt(e)(f) | | 12.00% | | | | | 11/1/2015 | | | | 44,000 | | | | 46,519 | | | | 44,440 | | | 0.1% |
| | | | | | | | | | | | | | | | | | | | 143,865 | | | | 134,600 | | | 0.2% |
| Sabre, Inc. | | Transportation | | Senior Debt(e)(g) | | L + 200 | | | | | 9/30/2014 | | | | 3,257,513 | | | | 2,788,750 | | | | 2,704,632 | | | 4.2% |
| SandRidge Energy, Inc. | | Energy | | Subordinated Debt(e)(f) | | L + 362.5 | | | | | 4/1/2014 | | | | 23,000 | | | | 22,952 | | | | 22,352 | | | 0.0% |
| Scitor Corp. | | Capital Goods | | Senior Debt(e)(g) | | L + 350 | | 1.50% | | | 2/15/2017 | | | | 23,310 | | | | 23,255 | | | | 22,203 | | | 0.0% |
| Sedgwick Claims Management Services Holdings, Inc. | | Insurance | | Senior Debt(e)(g)(h) | | L + 350 | | 1.50% | | | 12/31/2016 | | | | 113,219 | | | | 107,480 | | | | 111,662 | | | 0.2% |
| | | Senior Debt(e)(h) | | L + 750 | | 1.50% | | | 5/30/2017 | | | | 907,195 | | | | 882,412 | | | | 898,123 | | | 1.4% |
| | | | | | | | | | | | | | | | | | | 989,892 | | | | 1,009,785 | | | 1.5% |
See notes to condensed consolidated financial statements.
Corporate Capital Trust, Inc. and Subsidiary
Condensed Consolidated Schedule of Investments (continued)
As of December 31, 2011
| Company (b) | | Industry (c) | | Investments | | Interest Rate | | EURIBOR/ LIBOR Floor | | Maturity Date | | | Principal Amount / No.
Shares (m) | | | Cost (d) | | | Fair Value | | | % of Net Assets |
| Sheridan Holdings, Inc. | | Health Care Equipment & Services | | Senior Debt(e)(g) | | L + 225 | | | | | 6/13/2014 | | | $ | 348,178 | | | $ | 321,180 | | | $ | 329,899 | | | 0.5% |
| The SI Organization, Inc. | | Capital Goods | | Senior Debt(e)(g) | | L + 325 | | 1.25% | | | 11/22/2016 | | | | 187,907 | | | | 175,980 | | | | 177,572 | | | 0.3% |
| Sinclair Television Group, Inc. | | Media | | Subordinated Debt(e)(f) | | 8.38% | | | | | 10/15/2018 | | | | 27,000 | | | | 28,364 | | | | 27,877 | | | 0.0% |
| Skilled Healthcare Group, Inc. | | Health Care Equipment & Services | | Senior Debt(e)(f)(g) | | L + 375 | | 1.50% | | | 4/9/2016 | | | | 16,179 | | | | 15,723 | | | | 15,125 | | | 0.0% |
| SNL Financial, LC | | Commercial & Professional Services | | Senior Debt(e)(g)(h) | | L + 700 | | 1.50% | | | 8/17/2018 | | | | 709,520 | | | | 712,180 | | | | 707,746 | | | 1.1% |
| Solutia, Inc. | | Materials | | Subordinated Debt(e)(f) | | 7.88% | | | | | 3/15/2020 | | | | 120,000 | | | | 126,355 | | | | 130,500 | | | 0.2% |
| The Sports Authority, Inc. | | Retailing | | Senior Debt(e)(g) | | L + 600 | | 1.50% | | | 11/16/2017 | | | | 1,413,097 | | | | 1,366,092 | | | | 1,367,171 | | | 2.1% |
| Springleaf Financial Funding Co. | | Diversified Financials | | Senior Debt(e)(f)(g) | | L + 425 | | 1.25% | | | 5/10/2017 | | | | 2,551,580 | | | | 2,275,043 | | | | 2,230,502 | | | 3.4% |
| Sprint Nextel Corp. | | Telecommunication Services | | Subordinated Debt(e)(f) | | 8.38% | | | | | 8/15/2017 | | | | 664,000 | | | | 574,028 | | | | 595,110 | | | 0.9% |
| SSI Investments II, Ltd. | | Software & Services | | Subordinated Debt(e) | | 11.13% | | | | | 6/1/2018 | | | | 1,422,000 | | | | 1,512,863 | | | | 1,503,765 | | | 2.3% |
| Symphony / IRI Group, Inc. | | Commercial & Professional Services | | Senior Debt(e)(g) | | L + 375 | | 1.25% | | | 12/1/2017 | | | | 20,023 | | | | 19,610 | | | | 19,914 | | | 0.0% |
| The TelX Group, Inc. | | Telecommunication Services | | Senior Debt(e)(g) | | L + 650 | | 1.25% | | | 9/25/2017 | | | | 333,726 | | | | 314,266 | | | | 333,726 | | | 0.5% |
| TowerCo Finance, LLC | | Real Estate | | Senior Debt | | L + 375 | | 1.50% | | | 2/2/2017 | | | | 30,333 | | | | 29,710 | | | | 30,345 | | | 0.0% |
| TransUnion, LLC | | Diversified Financials | | Subordinated Debt(e) | | 11.38% | | | | | 6/15/2018 | | | | 1,403,000 | | | | 1,559,885 | | | | 1,602,927 | | | 2.5% |
| Triple Point Technology, Inc. | | Software & Services | | Senior Debt(e) | | L + 650 | | 1.50% | | | 10/27/2017 | | | | 200,566 | | | | 192,696 | | | | 201,067 | | | 0.3% |
| Univar, Inc. | | Materials | | Senior Debt(e)(g) | | L + 350 | | 1.50% | | | 6/30/2017 | | | | 962,906 | | | | 933,677 | | | | 931,010 | | | 1.4% |
| Vision Solutions, Inc. | | Commercial & Professional Services | | Senior Debt(e)(h) | | L + 450 | | 1.50% | | | 7/23/2016 | | | | 1,443,750 | | | | 1,427,658 | | | | 1,429,312 | | | 2.2% |
| VWR Funding, Inc. | | Pharmaceuticals, Biotechnology & Life Sciences | | Senior Debt(e)(g) | | L + 250 | | | | | 6/30/2014 | | | | 147,590 | | | | 136,713 | | | | 140,358 | | | 0.2% |
| | | | | Subordinated Debt(e) | | 10.25% CASH or | | | | | 7/15/2015 | | | | 3,051,000 | | | | 3,155,464 | | | | 3,150,157 | | | 4.8% |
| | | | | | | 11.25% PIK | | | | | | | | | | | | | 3,292,177 | | | | 3,290,515 | | | 5.0% |
| Warner Chilcott Co., LLC | | Pharmaceuticals, Biotechnology & Life Sciences | | Subordinated Debt(e)(f) | | 7.75% | | | | | 9/15/2018 | | | | 1,225,000 | | | | 1,218,819 | | | | 1,251,031 | | | 1.9% |
| West Corp. | | Software & Services | | Senior Debt | | L + 425 | | | | | 7/15/2016 | | | | 5,000 | | | | 4,846 | | | | 4,979 | | | 0.0% |
| | | | Subordinated Debt(e)(g) | | 7.88% | | | | | 1/15/2019 | | | | 1,743,000 | | | | 1,730,393 | | | | 1,729,927 | | | 2.7% |
| | | | Subordinated Debt(e) | | 8.63% | | | | | 10/1/2018 | | | | 2,600,000 | | | | 2,646,996 | | | | 2,626,000 | | | 4.0% |
| | | | | | | | | | | | | | | | | | | | 4,382,235 | | | | 4,360,906 | | | 6.7% |
| Wm. Bolthouse Farms, Inc. | | Food, Beverage & Tobacco | | Senior Debt(e) | | L + 750 | | 2.00% | | | 8/11/2016 | | | | 500,000 | | | | 499,608 | | | | 498,905 | | | 0.8% |
| Zayo Group, LLC | | Telecommunication Services | | Senior Debt(e)(g) | | L + 550 | | 1.50% | | | 12/1/2016 | | | | 2,749,427 | | | | 2,715,285 | | | | 2,740,835 | | | 4.2% |
| | | Senior Debt(e)(g) | | 10.25% | | | | | 3/15/2017 | | | | 1,549,000 | | | | 1,649,012 | | | | 1,653,557 | | | 2.5% |
| | | | | | | | | | | | | | | | | | | 4,364,297 | | | | 4,394,392 | | | 6.7% |
See notes to condensed consolidated financial statements.
Corporate Capital Trust, Inc. and Subsidiary Condensed Consolidated Schedule of Investments (continued)
As of December 31, 2011
Company (b) | | Industry (c) | | Investments | | Interest Rate | | EURIBOR/ LIBOR Floor | | Maturity Date | | | Principal Amount / No.
Shares (m) | | | Cost (d) | | | Fair Value | | | % of Net Assets |
| Total Non-Control/Non-Affiliate Investments | | | | | | | | | | | | | | | | | | $ | 106,111,246 | | | $ | 106,589,757 | | | 163.6% |
Short Term Investments—11.8% | | | | | | | | | | | | | | | | | | | | | | | | | | |
Goldman Sachs Financial Square Funds - Prime Obligations Fund | | | | Short Term Investments(e) | | 0.11%(k) | | | | | NA | | | | 6,541,055 | | | | 6,541,055 | | | | 6,541,055 | | | 10.0% |
| State Street Institutional Liquid Reserves Fund | | Short Term Investments | | 0.15%(k) | | | | | NA | | | | 1,173,697 | | | | 1,173,697 | | | | 1,173,697 | | | 1.8% |
| Total Short Term Investments | | | | | | | | | | | | | | | | | | | 7,714,752 | | | | 7,714,752 | | | 11.8% |
| TOTAL INVESTMENTS —175.4%(l) | | | | | | | | | | | | | | | | | | $ | 113,825,998 | | | | 114,304,509 | | | 175.4% |
LIABILITIES IN EXCESS OF OTHER ASSETS—(75.4%) | | | | | | | | | | | | | | | | | | | | | (49,141,780 | ) | | -75.4% |
NET ASSETS—100.0% | | | | | | | | | | | | | | | | | | | | | | $ | 65,162,729 | | | 100.0% |
| (a) | Non-Control/Non-Affiliate investments are defined by the Investment Company Act of 1940, as amended (“1940 Act”) as investments that are neither Control Investments nor Affiliate Investments. Controlled investments are defined by the 1940 Act as investments in which more than 25% of the voting securities are owned or where the ability to nominate greater than 50% of the board representation is maintained. Affiliate investments are defined by the 1940 Act as investments in which between 5% and 25% of the voting securities are owned and the investments are not classified as Controlled investments. |
| (b) | Security may be an obligation of one or more entities affiliated with the named company. |
| (c) | Unaudited. |
| (d) | Represents amortized cost for debt securities and cost for preferred stock. |
| (e) | Security or portion thereof held within CCT Funding, LLC and is pledged as collateral supporting the amounts outstanding under the revolving credit facility with Deutsche Bank. |
| (f) | The investment is not a qualifying asset under the Investment Company Act of 1940, as amended, or the 1940 Act. |
| (g) | Position or portion thereof unsettled as of December 31, 2011. |
| (h) | Fair value was determined by the Company’s Board of Directors (see Note 2). |
| (i) | A portfolio company domiciled in a foreign country. |
| (j) | This security was acquired in a transaction that was exempt from the registration requirements of the Securities Act of 1933, as amended (the “Securities Act”), pursuant to Rule 144A thereunder. This security may be resold only in transactions that are exempt from the registration requirements of the Securities Act, normally to qualified institutional buyers. |
| (k) | 7-day effective yield as of December 31, 2011. |
| (l) | As of December 31, 2011, the aggregate gross unrealized appreciation for all securities in which there was an excess of value over tax cost was $971,241; the aggregate gross unrealized depreciation for all securities in which there was an excess of tax cost over value was $492,730; the net unrealized appreciation was $478,511; the aggregate cost of securities for Federal income tax purposes was $113,825,998. |
| (m) | Denominated in U.S. Dollars unless otherwise noted. |
Abbreviations:
CA - Canada
EUR - Euros; principal amount is denominated in Euros currency
E = EURIBOR - Euro Interbank Offered Rate
IE - Ireland
L = LIBOR - London Interbank Offered Rate, typically 3-month rate
PIK - Payment-in-kind
UK - United Kingdom
See notes to condensed consolidated financial statements.
CORPORATE CAPITAL TRUST, INC. AND SUBSIDIARY
| 1. | Principal Business and Organization |
Corporate Capital Trust, Inc. (the “Company”) was incorporated under the general corporation laws of the State of Maryland on June 9, 2010. The Company is a non-diversified closed-end management investment company and it is regulated as a business development company (“BDC”) under the Investment Company Act of 1940 (the “40 Act”). The Company’s investment objective is to provide its shareholders with current income and, to a lesser extent, long-term capital appreciation, by investing primarily in the debt of privately owned U.S. companies with a focus on originated transactions sourced through the networks of its advisors.
The Company is externally managed by CNL Fund Advisors Company (“CNL”) and KKR Asset Management LLC (“KKR”) (collectively the “Advisors”), which are responsible for sourcing potential investments, analyzing and conducting due diligence on prospective investment opportunities, structuring investments and monitoring the Company’s investment portfolio on an ongoing basis. Both Advisors are registered as investment advisers with the Securities and Exchange Commission (“SEC”). CNL also provides the administrative services necessary for the Company to operate.
The Company is currently selling shares of its common stock pursuant to a registration statement on Form N-2 (as amended and supplemented, the “Registration Statement”) and it is offering to sell, on a continuous basis, 150 million shares of common stock for approximately $1.6 billion (the “Offering”). The Registration Statement was declared effective by the SEC on April 4, 2011 and the Company commenced its Offering. The Company commenced business operations on June 17, 2011 and it commenced investment operations on July 1, 2011.
As of September 30, 2012, the Company had one wholly owned financing subsidiary, CCT Funding LLC (“CCT Funding”), which was established on July 15, 2011 for the purpose of arranging a secured, revolving credit facility with a bank and to borrow money to invest in portfolio companies.
| 2. | Significant Accounting Policies |
Basis of Presentation and Principles of Consolidation - The accompanying financial statements of the Company are prepared in accordance with the instructions to Form 10-Q and accounting principles generally accepted in the United States of America (“GAAP”). In the opinion of management, all adjustments, consisting solely of normal recurring accruals, considered necessary for the fair presentation of financial statements for the interim periods, have been included. The results of operations for interim periods are not indicative of results to be expected for the full year.
Certain financial information that is normally included in annual financial statements, including certain financial statement footnotes, prepared in accordance with GAAP, is not required for interim reporting purposes and has been condensed or omitted herein. These financial statements should be read in conjunction with the Company’s financial statements and notes related thereto included in the Company’s Annual Report on Form 10-K for the year ended December 31, 2011, which was filed with the SEC on March 16, 2012. The condensed consolidated financial statements include the accounts of the Company and its wholly owned subsidiary. All intercompany account balances and transactions have been eliminated in consolidation.
Use of Estimates - The preparation of condensed consolidated financial statements in conformity with GAAP requires management to make estimates and assumptions that affect (i) the reported amounts of assets and liabilities at the date of the condensed consolidated financial statements, (ii) the reported amounts of income and expenses during the reported period and (iii) disclosure of contingent assets and liabilities at the date of the condensed consolidated financial statements. Actual results could differ from those estimates.
Cash and Cash Equivalents - Cash and cash equivalents consist of demand deposits, repurchase agreements, foreign currency, and highly liquid investments with original maturities of three months or less.
Valuation of Investments - The Company measures the value of its investments in accordance with Accounting Standards Codification Topic 820, Fair Value Measurements and Disclosure (“ASC Topic 820”), issued by the Financial Accounting Standards Board (“FASB”). Fair value is the price that would be received to sell an asset or paid to transfer a liability in an orderly transaction between market participants at the measurement date.
Investments for which market quotations are readily available are valued using market quotations, which are generally obtained from independent pricing services, broker-dealers or market makers. With respect to the Company’s portfolio investments for which market quotations are not readily available, the Company’s board of directors is responsible for determining in good faith the fair value in accordance with the valuation policy approved by the board of directors. The board of directors will make this fair value determination on a quarterly basis and any other time when a decision regarding the fair value of the portfolio investments is required. A determination of fair value involves subjective judgments and estimates. Due to the inherent uncertainty of determining the fair value of portfolio investments that do not have a readily available market value, the fair value of the investments may differ significantly from the values that would have been used had a readily available market value existed for such investments, and the differences could be material.
ASC Topic 820 also defines hierarchical levels directly related to the amount of subjectivity associated with the inputs to fair valuations of these assets and liabilities, and the hierarchical levels are described as follows:
Level 1 – Quoted prices are available in active markets for identical investments as of the reporting date. Publicly listed equities, debt securities and publicly listed derivatives are generally included in Level 1. The Company does not adjust the quoted price for these investments. The Company’s money market fund/short term investment funds and foreign currency are included in this category.
Level 2 – Pricing inputs are other than quoted prices in active markets, which are either directly or indirectly observable as of the reporting date, and fair value is determined through the use of models or other valuation methodologies. In certain cases, debt and equity securities are valued on the basis of prices from orderly transactions for similar investments in active markets between market participants and provided by reputable dealers or independent pricing services. In determining the value of a particular investment, pricing services may use certain information with respect to transactions in such investments, quotations from dealers, pricing matrices, market transactions in comparable investments, and various relationships between investments. Investments generally included in this category are corporate bonds and loans, convertible debt indexed to publicly listed securities, foreign currency forward contracts and certain over-the-counter derivatives.
Level 3 – Pricing inputs are unobservable for the investment and include situations where there is little, if any, market activity for the investment. The inputs into the determination of fair value require significant judgment or estimation. Investments generally included in this category are corporate bonds, corporate loans and common stock investments that lack observable market pricing.
In certain cases, the inputs used to measure fair value may fall into different levels of the fair value hierarchy. In such cases, an investment’s level within the fair value hierarchy is based on the lowest level of input that is significant to the fair value measurement. The Company’s assessment of the significance of a particular input to the fair value measurement in its entirety requires judgment, and it considers factors specific to the investment.
The Company has implemented Accounting Standard Update (“ASU”) No. 2011-04, Fair Value Measurement: Amendments to Achieve Common Fair Value Measurement and Disclosure Requirements in U.S. GAAP and International Financial Reporting Standards (“ASU 2011-04”), which amends the existing fair value guidance within ASC Topic 820.
Security Transactions, Realized/Unrealized Gains or Losses, and Income Recognition - Security transactions are recorded on a trade-date basis. The Company measures realized gains or losses from the repayment or sale of investments using the specific identification method. The amortized cost basis of investments includes (i) the original cost and (ii) adjustments for the accretion/amortization of market discounts and premiums, original issue discount and loan origination fees. The Company reports changes in fair value of investments that are measured at fair value as a component of net change in unrealized appreciation (depreciation) on investments in the condensed consolidated statement of operations.
Interest income is recorded on an accrual basis and includes amortization of premiums to par value and accretion of discounts to par value. Discounts and premiums to par value on securities purchased are accreted/amortized into interest income over the life of the respective security using the effective interest method. Premiums and discounts are determined based on the cash flows expected to be collected for a particular investment. Structuring service fees, origination, closing, commitment and other upfront fees are generally non-recurring and recognized as revenue when earned. Loan origination fees received in connection with the closing of investments are accreted over the contractual life of the loan based on the effective interest method as interest income. Upon prepayment of a loan or debt security, any prepayment penalties, unamortized loan origination fees, unamortized original issue discount, and unamortized market discounts are recorded as interest income.
The Company has investments in debt securities which contain a contractual payment-in-kind, or PIK, interest provision. If the borrower elects to pay, or is obligated to pay, PIK interest, and if deemed collectible in management’s judgment, then the PIK interest is computed at the contractual rate specified in the investment’s credit agreement, the computed PIK interest is added to the principal balance of the investment, and the computed PIK interest is recorded as interest income.
Loans or debt securities are placed on non-accrual status when principal or interest payments are at least 90 days past due or when there is reasonable doubt that principal or interest will be collected. Generally, accrued interest is reversed when a loan or a debt security is placed on non-accrual status. Interest payments received on non-accrual loans or debt securities may be recognized as income or applied to principal depending upon management’s judgment. Non-accrual loans and debt securities are restored to accrual status when past due principal and interest is paid and, in management’s judgment, are likely to remain current. The Company may make exceptions to this treatment if the loan has sufficient collateral value and is in the process of collection.
Deferred Financing Costs - Deferred financing costs represent fees and other direct costs incurred in connection with arranging the Company’s borrowings. These amounts are initially recorded as deferred financing costs on the condensed consolidated statements of assets and liabilities and then subsequently amortized over the contractual term of the credit facility as interest expense. Deferred financing costs are stated separately on the Company’s condensed consolidated statements of assets and liabilities.
Paid In Capital - The Company records the proceeds from the sale of its common stock on a net basis to (i) capital stock and (ii) paid in capital in excess of par value, excluding all commissions and marketing support fees.
Foreign Currency Translation, Transactions and Gains/Losses - Foreign currency amounts are translated into U.S. dollars on the following basis: (i) at the exchange rate on the last business day of the reporting period for the fair value of investment securities, other assets and liabilities; and (ii) at the rates of exchange prevailing on the respective recording dates for the purchase and sale of investment securities, income, expenses, gains and losses.
Net assets and fair values are presented based on the applicable foreign exchange rates described above and the Company does not isolate that portion of the results of operations resulting from changes in foreign exchange rates on investments from the fluctuations arising from changes in fair values of investments held; therefore the fluctuations related to foreign exchange rate conversion are included with the net realized gain (loss) and unrealized appreciation (depreciation) on investments.
Net realized foreign exchange gains or losses arise from activity in foreign currency forward contracts, sales of foreign currency, currency gains or losses realized between the trade and settlement dates on securities transactions, and the difference between the amounts of dividends, interest, and foreign withholding taxes recorded by the Company and the U.S. dollar equivalent of the amounts actually received or paid by the Company. Unrealized appreciation (depreciation) from currency translation for foreign currency forward contracts and other receivables or payables is presented as net change in unrealized appreciation (depreciation) on foreign currency translation on the condensed consolidated statements of operations. Unrealized appreciation (depreciation) on foreign currency forward contracts is also reported as separate line items on the condensed consolidated statements of assets and liabilities.
Management Fees - The Company accrues for the base management fee (recorded as investment advisory fees) and performance-based incentive fees, including (i) a subordinated incentive fee on income and (ii) an incentive fee on capital gains. The Company records the liability for the incentive fee on capital gains based on a hypothetical liquidation of its investment portfolio at the end of each reporting period. Therefore the accrual for incentive fee on capital gains includes the recognition of incentive fee on both net realized gains and net unrealized appreciation, if any, although any such incentive fee associated with net unrealized appreciation is neither earned nor payable to the Advisors until net unrealized appreciation is realized as net realized gains. Additionally the determination of whether the accrued incentive fee associated with net realized gains is earned and payable to the Advisors can only be made at the end of the calendar year. The components of performance-based incentive fees are combined and expensed on the condensed consolidated statement of operations and accrued on the condensed consolidated statements of assets and liabilities as accrued performance-based incentive fees.
Organization and Offering Expenses - Organization expenses, including reimbursement payments to Advisors, are expensed on the Company’s condensed consolidated statement of operations. Continuous offering expenses, including reimbursement payments to Advisors, but excluding commission and marketing support fees, are accumulated monthly and capitalized on the condensed consolidated statements of assets and liabilities as deferred offering expenses and then subsequently expensed over a 12-month period.
Earnings per Share - Earnings per share is calculated based upon the daily weighted average number of shares of common stock outstanding during the reporting period.
Dividends and Distributions - Dividends and distributions are declared by the Company’s board of directors each calendar quarter and recognized as distribution liabilities on the ex-dividend date. The ex-dividend date for the Company’s common stock is the same as the record date. Net realized gains, if any, generally are distributed at least annually, although the Company may decide to retain such net realized gains for investment.
The Company has adopted a distribution reinvestment plan that provides for reinvestment of distributions on behalf of shareholders. Shareholders who have elected to participate in the distribution reinvestment plan will have their cash distribution automatically reinvested in additional shares of common stock at a price per share equivalent to the public offering price on the distribution payment date, net of commissions and marketing support fees.
Federal Income Taxes - The Company has elected to be treated for federal income tax purposes, and intends to maintain its qualification as a regulated investment company (“RIC”) under Subchapter M of the Internal Revenue Code (the “Code”). Generally, a RIC is not subject to federal income taxes on distributed income and gains if it distributes at least 90% of “Investment Company Taxable Income,” as defined in the Code. The Company intends to distribute sufficient dividends to maintain its RIC status each year and it does not anticipate paying a material level of federal income taxes in the future.
The Company is also generally subject to nondeductible federal excise taxes if it does not distribute an amount at least equal to the sum (i) 98% of net ordinary income, (ii) 98.2% of the Company’s capital gains in excess of capital losses for the one-year period generally ending on October 31 of the calendar year and (iii) any ordinary income and net capital gains for preceding years that were not distributed during such years and on which the Company paid no federal income tax. The Company, at its discretion, may carry forward taxable income in excess of calendar year distributions and pay a 4% excise tax on this excess taxable income.
3. Investments
The Company is engaged in a strategy to invest primarily in the debt of privately owned U.S. companies. The primary investment concentrations include (i) senior debt securities and (ii) subordinated debt securities. The fair value of senior and subordinated debt investments will generally fluctuate with, among other things, changes in prevailing interest rates, the general supply of, and demand for, debt capital among private and public companies, general domestic and global economic conditions, the condition of certain financial markets, developments or trends in any particular industry and changes in the financial condition and credit quality of each security’s issuer.
Investment purchases, sales and principal payments/paydowns are summarized below for the three months and nine months ended September 30, 2012 and the three and nine months ended September 30, 2011. These purchase and sale amounts exclude short-term investments (i.e. money market fund investments) purchase and sale transactions.
| | | Three Months Ended September 30, 2012 | | | Nine Months Ended September 30, 2012 | | | Three and Nine Months Ended September 30, 2011 | |
| Investment purchases, at cost | | $ | 253,861,006 | | | $ | 598,361,856 | | | $ | 15,267,304 | |
| Investment sales, proceeds | | | 61,376,035 | | | | 100,188,011 | | | | 33,270 | |
| Principal payments/paydowns, proceeds | | | 6,922,073 | | | | 16,323,261 | | | | 10,923 | |
The Company’s investment portfolio may contain loans that are in the form of lines of credit or revolving credit facilities, which require the Company to provide funding when requested by portfolio companies in accordance with the terms of the underlying loan agreements. As of September 30, 2012, the Company had two unfunded delayed draw loan commitments that amounted to $1,561,876. The Company maintains sufficient cash on hand to fund such unfunded loan commitments should the need arise.
As of September 30, 2012, none of the Company’s debt investments were on non-accrual status or in monetary default.
As of September 30, 2012, the Company’s investment portfolio consisted of the following:
| Asset Category | | Cost | | | Fair Value | | | Percentage of Portfolio | | | Percentage of Net Assets | |
| Senior debt securities | | $ | 388,393,914 | | | $ | 394,921,745 | | | | 66.0 | % | | | 87.7 | % |
| Subordinated debt securities | | | 200,974,041 | | | | 202,881,969 | | | | 33.9 | | | | 45.1 | |
| Total debt securities | | | 589,367,955 | | | | 597,803,714 | | | | 99.9 | | | | 132.8 | |
| Common stock | | | 448,908 | | | | 561,134 | | | | 0.1 | | | | 0.1 | |
| Subtotal | | | 589,816,863 | | | | 598,364,848 | | | | 100.0 | % | | | 132.9 | |
| Short term investments | | | 12,940,997 | | | | 12,940,997 | | | | | | | | 2.9 | |
| Total investments | | $ | 602,757,860 | | | $ | 611,305,845 | | | | | | | | 135.8 | % |
At December 31, 2011, the Company’s investment portfolio consisted of the following:
| Asset Category | | Cost | | | Fair Value | | | Percentage of Portfolio | | | Percentage of Net Assets | |
| Senior debt securities | | $ | 71,398,157 | | | $ | 71,609,433 | | | | 67.2 | % | | | 109.9 | % |
| Subordinated debt securities | | | 34,613,494 | | | | 34,877,800 | | | | 32.7 | | | | 53.5 | |
| Total debt securities | | | 106,011,651 | | | | 106,487,233 | | | | 99.9 | | | | 163.4 | |
| Preferred stock | | | 99,595 | | | | 102,524 | | | | 0.1 | | | | 0.2 | |
| Subtotal | | | 106,111,246 | | | | 106,589,757 | | | | 100.0 | % | | | 163.6 | |
| Short term investments | | | 7,714,752 | | | | 7,714,752 | | | | | | | | 11.8 | |
| Total investments | | $ | 113,825,998 | | | $ | 114,304,509 | | | | | | | | 175.4 | % |
The industry composition, geographic dispersion, and local currencies of the Company’s investment portfolio at fair value, excluding short-term investments, as of September 30, 2012 and December 31, 2011 was as follows:
| | | | | | | |
| Industry Composition | | September 30, 2012 | | | December 31, 2011 | |
| Media | | | 16.0 | % | | | 8.1 | % |
| Materials | | | 13.6 | | | | 3.4 | |
| Software & Services | | | 10.3 | | | | 14.6 | |
| Retailing | | | 7.9 | | | | 12.6 | |
| Capital Goods | | | 6.5 | | | | 3.4 | |
| Health Care Equipment & Services | | | 6.0 | | | | 6.9 | |
| Insurance | | | 5.7 | | | | 2.4 | |
| Technology Hardware & Equipment | | | 5.4 | | | | 4.6 | |
| Telecommunication Services | | | 4.7 | | | | 9.0 | |
| Consumer Services | | | 4.6 | | | | 4.9 | |
| Diversified Financials | | | 3.8 | | | | 7.8 | |
| Remaining Industries | | | 15.5 | | | | 22.3 | |
| Total | | | 100.0 | % | | | 100.0 | % |
| | | | | | | | | |
Geographic Dispersion (1) | | | | | | | | |
| United States | | | 94.5 | % | | | 97.4 | % |
| United Kingdom | | | 2.4 | | | | 1.5 | |
| Luxembourg | | | 1.6 | | | | — | |
| Canada | | | — | | | | 1.1 | |
| Singapore | | | 0.6 | | | | — | |
| Germany | | | 0.5 | | | | — | |
| Remaining Countries | | | 0.4 | | | <0.1 | |
| Total | | | 100.0 | % | | | 100.0 | % |
| | | | | | | | | |
| Local Currency | | | | | | | | |
| U.S. Dollar | | | 98.2 | % | | | 99.0 | % |
| Euro | | | 1.7 | | | | 1.0 | |
| British Pound Sterling | | <0.1 | | | | — | |
| Total | | | 100.0 | % | | | 100.0 | % |
(1) The geographic dispersion is determined by the portfolio company’s country of domicile.
During the nine months ended September 30, 2012, the Company did not hold any non-controlled investments where it owned 5% or more of a portfolio company’s outstanding voting securities as investments in “affiliated” companies. In addition, the Company did not hold any investments in “controlled” companies where it owned more than 25% of a portfolio company’s outstanding voting securities.
4. Foreign Currency Forward Contracts
The Company may enter into foreign currency forward contracts from time to time to facilitate settlement of purchases and sales of investments denominated in foreign currencies and to economically hedge the impact that an adverse change in foreign exchange rates would have on the value of the Company’s investments denominated in foreign currencies. A foreign currency forward contract is a commitment to purchase or sell a foreign currency at a future date (usually the security transaction settlement date) at a negotiated forward rate. These contracts are marked-to-market by recognizing the difference between the contract exchange rate and the current market exchange rate as unrealized appreciation or depreciation. Realized gains or losses are recognized when forward contracts are settled. Risks may arise as a result of the potential inability of the counterparties to meet the terms of their contracts; the Company attempts to limit counterparty risk by only dealing with creditworthy counterparties.
There were no open foreign currency forward contracts at December 31, 2011. At September 30, 2012, the details of the Company’s open foreign currency forward contracts were as follows:
| Foreign Currency | | Settlement Date | | | Amount and Transaction | | US$ Value at Settlement Date | | | US$ Value at September 30, 2012 | | | Unrealized Appreciation/ (Depreciation) | |
| EUR | | Nov. 29, 2012 | | | € | 5,300,000 Sold | | $ | 6,644,080 | | | $ | 6,814,769 | | | $ | (170,689 | ) |
| EUR | | Jan. 3, 2013 | | | € | 2,300,000 Sold | | | 2,917,964 | | | | 2,958,660 | | | | (40,696 | ) |
| Total | | | | | | | | $ | 9,562,044 | | | $ | 9,773,429 | | | $ | (211,385 | ) |
| 5. | Fair Value of Financial Instruments |
The Company’s investments were categorized in the fair value hierarchy as follows as of September 30, 2012 and December 31, 2011:
| | | September 30, 2012 | |
| Investment Type | | Level 1 | | | Level 2 | | | Level 3 | | | Total | |
| Senior debt securities | | $ | — | | | $ | 340,332,165 | | | $ | 54,589,580 | | | $ | 394,921,746 | |
| Subordinated debt securities | | | — | | | | 196,778,269 | | | | 6,103,700 | | | | 202,881,968 | |
| Common stock | | | — | | | | — | | | | 561,134 | | | | 561,134 | |
| Subtotal | | | — | | | | 537,110,434 | | | | 61,254,414 | | | | 598,364,848 | |
| Short term investments | | | 12,940,997 | | | | — | | | | — | | | | 12,940,997 | |
| Total | | $ | 12,940,997 | | | $ | 537,110,434 | | | $ | 61,254,414 | | | $ | 611,305,845 | |
| Derivative Type | | Level 1 | | | Level 2 | | | Level 3 | | | Total | |
| Foreign currency forward contracts | | $ | — | | | $ | (211,385 | ) | | $ | — | | | $ | (211,385 | ) |
| | | December 31, 2011 | |
| Investment Type | | Level 1 | | | Level 2 | | | Level 3 | | | Total | |
| Senior debt securities | | $ | — | | | $ | 66,957,496 | | | $ | 4,651,937 | | | $ | 71,609,433 | |
| Subordinated debt securities | | | — | | | | 33,914,267 | | | | 963,533 | | | | 34,877,800 | |
| Preferred stock | | | 102,524 | | | | — | | | | — | | | | 102,524 | |
| Subtotal | | | 102,524 | | | | 100,871,763 | | | | 5,615,470 | | | | 106,589,757 | |
| Short term investments | | | 7,714,752 | | | | — | | | | — | | | | 7,714,752 | |
| Total | | $ | 7,817,276 | | | $ | 100,871,763 | | | $ | 5,615,470 | | | $ | 114,304,509 | |
At September 30, 2012, the Company held 22 distinct investment positions that were classified as Level 3, representing an aggregate fair value of $ 61,254,414 and 10.0% of the total investment portfolio. The ranges of unobservable inputs used in the fair value measurement of the Company’s Level 3 investments as of September 30, 2012 were as follows:
| | | | | | | | | | | Range |
| Asset Group | | | Fair Value | | Valuation Techniques (1) | | Unobservable Input (2) | | (Weighted Average) |
| | | | $ | 11,836,822 | | Broker Quotes | | Mid price | | 96.75 – 102.25 (98.45) |
| | | | | | | Broker Quotes | | Mid price | | 93 – 101.5 (99.8) |
| Senior debt securities | | | | | | | | Yield-to-maturity | | 5.1 – 11.8% (8.69%) |
| | | | | 42,752,758 | | Market Comparables | | Discount margin | | 427 - 1062 bps (795 bps) |
| | | | | | | | | Net EBITDA multiple | | 3.8x (NA) |
| | | | | | | | | Illiquidity discount | | 0.86 – 1.0% (0.99%) |
| | | | | | | | | Par Value | | 100 (NA) |
| | | | | | | Broker Quotes | | Bid price | | 103.46 (NA) |
| | | | | | | | | Yield | | 12.1 – 14.1% (13.21%) |
Subordinated debt securities | | | | 6,103,700 | | Market Comparables | | Discount margin | | 1074-1350 bps (1223 bps) |
| | | | | | | | | Illiquidity discount | | 2% (NA) |
| | | | | | | Market Comparables | | EBITDA multiple | | 1.93x (NA) |
| Common stock | | | | 561,134 | | | | Illiquidity discount | | 15% (NA) |
| | | | | | | Discounted Cash Flow | | Weighted avg. cost of capital | | 12.5% (NA) |
| Total | | | $ | 61,254,414 | | | | . | | |
| (1) | For the assets and investment that have more than one valuation technique, the Company may rely on the stated techniques individually or in the aggregate based on a weight ascribed to each valuation technique, ranging from 0 – 100%. Broker quotes obtained for valuation purposes are reviewed by the Company relative to other valuation techniques. |
| (2) | Weighted average amounts are based on the estimated fair values. If noted as NA, then the number of inputs is too few to compute the weighted average for the range. |
The more significant unobservable inputs used in the fair value measurement of the Company’s senior and subordinated loan investments are quotes obtained from unaffiliated brokers. In the event that there are limited broker quotes, then the valuation process will further rely on the inputs from comparable investments and/or discounted cash flow analysis. Depending on the type of loan investment position held by the Company, the relative comparable value analysis may rely on any of (i) market yields, (ii) discount margin, (iii) illiquidity discount and (iv) leverage EBITDA multiples analysis to either confirm a single broker quote, or to generate a fair value in the absence of any broker quote. Other significant unobservable inputs used in the fair value measurement of the Company’s investments are also disclosed in the table above. Any significant increases or decreases in these unobservable inputs would result in significant increases or decreases in the fair value of the Company’s investments.
The following is reconciliation for the three months ended September 30, 2012 of investments for which Level 3 inputs were used in determining fair value:
| | | | | | | | | | | | | |
| | | Senior Debt Securities | | | Subordinated Debt Securities | | | Common Stock | | | Total | |
| Fair Value Balance as of July 1, 2012 | | $ | 16,900,787 | | | $ | 7,060,285 | | | $ | 480,331 | | | $ | 24,441,403 | |
| Purchases | | | 19,021,926 | | | | — | | | | — | | | | 19,021,926 | |
| Net realized gain | | | 104,042 | | | | — | | | | — | | | | 104,042 | |
Net change in unrealized appreciation (1) | | | 834,936 | | | | 150,187 | | | | 80,803 | | | | 1,065,926 | |
| Sales or repayments | | | (2,961,727 | ) | | | — | | | | — | | | | (2,961,727 | ) |
| Net discount accretion | | | 34,192 | | | | (890 | ) | | | — | | | | 33,302 | |
| Transfers out of Level 3 | | | (4,295,039 | ) | | | (1,105,882 | ) | | | — | | | | (5,400,921 | ) |
| Transfers into Level 3 | | | 24,950,463 | | | | — | | | | — | | | | 24,950,463 | |
| Fair Value Balance as of September 30, 2012 | | $ | 54,589,580 | | | $ | 6,103,700 | | | $ | 561,134 | | | $ | 61,254,414 | |
Change in net unrealized appreciation (depreciation) in investments still held as of September 30, 2012 (1) | | $ | 811,168 | | | $ | 165,921 | | | $ | 80,803 | | | $ | 1,057,892 | |
| | (1) Amount is included in the related amount on investments in the condensed consolidated statement of operations. |
The following is reconciliation for the nine months ended September 30, 2012 of investments for which Level 3 inputs were used in determining fair value:
| | | Senior Debt Securities | | | Subordinated Debt Securities | | | Common Stock | | | Total | |
| Fair Value Balance as of January 1, 2012 | | $ | 4,651,937 | | | $ | 963,533 | | | $ | — | | | $ | 5,615,470 | |
| Purchases | | | 33,207,361 | | | | 7,090,290 | | | | 448,908 | | | | 40,746,559 | |
| Net realized gain | | | 105,009 | | | | 11,960 | | | | — | | | | 116,962 | |
Net change in unrealized appreciation (1) | | | 978,967 | | | | 143,859 | | | | 112,226 | | | | 1,235,052 | |
| Sales or repayments | | | (5,254,346 | ) | | | (998,479 | ) | | | — | | | | (6,252,825 | ) |
| Net discount accretion | | | 44,161 | | | | (1,581 | ) | | | — | | | | 42,580 | |
| Transfers out of Level 3 | | | (4,295,039 | ) | | | (1,105,882 | ) | | | — | | | | (5,400,921 | ) |
| Transfers into Level 3 | | | 25,151,530 | | | | — | | | | — | | | | 25,151,530 | |
| Fair Value Balance as of September 30, 2012 | | $ | 54,589,580 | | | $ | 6,103,700 | | | $ | 561,134 | | | $ | 61,254,414 | |
Change in net unrealized appreciation (depreciation) in investments still held as of September 30, 2012 (1) | | $ | 982,784 | | | $ | 137,002 | | | $ | 112,226 | | | $ | 1,232,012 | |
| | (1) Amount is included in the related amount on investments in the condensed consolidated statement of operations. |
The following is a reconciliation for the period ended September 30, 2011 of investments for which Level 3 inputs were used in determining fair value:
| | | Senior Debt Securities | | | Total | |
| Fair Value Balance as of July 1, 2011 | | $ | — | | | $ | — | |
| Purchases | | | 107,471 | | | | 107,471 | |
| Sales | | | — | | | | — | |
| Net realized gain | | | — | | | | — | |
Net change in unrealized appreciation (1) | | | 885 | | | | 885 | |
| Principal reduction | | | (175 | ) | | | (175 | ) |
| Net discount accretion | | | 111 | | | | 111 | |
| Transfers into Level 3 | | | — | | | | — | |
| Fair Value Balance as of September 30, 2011 | | $ | 108,292 | | | $ | 108,292 | |
Change in net unrealized appreciation (depreciation) in investments still held as of September 30, 2011 (1) | | $ | 885 | | | $ | 885 | |
| | (1) | Amount is included in the related amount on investments in the condensed consolidated statement of operations. |
Eight securities were transferred into the Level 3 hierarchy and two securities were transferred out of the Level 3 hierarchy during the nine months ended September 30, 2012. These investments were transferred at fair value as of the beginning of the quarter in which they were transferred. The classification transfers between Level 2 and Level 3 were based on the observed changes in liquidity based on information supplied by third party pricing sources, whereby such liquidity information is routinely reviewed no less frequently than monthly. All realized and unrealized gains and losses are included in earnings (changes in net assets) and are reported as separate line items within the Company’s condensed consolidated statements of operations.
The carrying values of receivables, other assets, accounts payable and accrued expenses approximate fair value due to their short maturities. The carrying value of cash and foreign currency is classified as Level 1 with respect to the fair value hierarchy. The carrying value of the revolving credit facility approximates its fair value and it would be classified as Level 2 with respect to the fair value hierarchy.
| 6. | Agreements and Related Party Transactions |
The Company entered into a managing dealer agreement with CNL Securities Corp., an affiliate of CNL. CNL Securities Corp. serves as the managing dealer of the Offering and in connection therewith receives selling commissions of up to 7% of gross offering proceeds, a marketing support fee of up to 3% of gross offering proceeds, and reimbursement of due diligence and certain other expenses incurred in connection with the Offering. All or any portion of these fees and expense reimbursements may be reallowed to participating brokers. The Company will pay a maximum sales load of 10% of gross offering proceeds for all combined selling commissions, marketing support fees and expense reimbursements.
The Company entered into an investment advisory agreement with CNL (together with one amendment, the “Investment Advisory Agreement”) for the overall management of the Company’s investment activities. The Company and CNL have entered into a sub-advisory agreement with KKR (the “Sub-Advisory Agreement”), under which KKR is responsible for the day-to-day management of the Company’s investment portfolio. CNL earns a base management fee equal to an annual rate of 2% of the Company’s average gross assets and it is computed and paid monthly. CNL also earns a performance-based incentive fee that is comprised of the following two parts: (i) a subordinated incentive fee on pre-incentive fee net investment income, and (ii) an incentive fee on capital gains. The subordinated incentive fee, paid quarterly if earned, is computed as the sum of (A) 100% of quarterly pre-incentive fee net investment income in excess of 1.75% of average adjusted capital up to a limit of 0.4375% of average adjusted capital, and (B) 20% of pre-incentive net investment income in excess of 2.1875% of average adjusted capital. The incentive fee on capital gains, paid annually if earned, is equal to 20% of realized capital gains on a cumulative basis from inception, net of (A) all realized capital losses and unrealized depreciation on a cumulative basis and (B) net of the aggregate amount of any previously paid incentive fee on capital gains. CNL compensates KKR for advisory services that it provides to the Company with 50% of the base management fees and performance-based incentive fees that CNL receives under the Investment Advisory Agreement.
The terms of the Investment Advisory Agreement entitle CNL (and indirectly KKR) to receive up to 5% of gross proceeds in connection with the Offering as reimbursement for organization and offering expenses incurred by the Advisors on behalf of the Company. The Advisors waived the requirement for the Company to reimburse them for organization and offering expenses for the period from June 17, 2011 through January 31, 2012. The waiver of the organization and offering expense reimbursement requirements did not reduce the overall amount of organization and offering expenses incurred by the Advisors that is eligible for reimbursement by the Company in future periods. Beginning February 1, 2012, the Company implemented a reimbursement rate of 0.75% of gross offering proceeds to initiate the reimbursement of organization and offering expenses incurred by the Advisors.
The Company entered into an administrative services agreement with CNL (the “Administrative Services Agreement”) whereby CNL performs, and oversees the performance of, various administrative services on behalf of the Company. Administrative services may include transfer agency oversight and supervisory services, shareholder communication services, general ledger accounting, maintaining required financial records, financial reporting, internal audit, preparations of report to the Company’s board of directors and lenders, calculating the Company’s net asset value, filing tax returns, preparing and filing SEC reports, preparing, printing and disseminating shareholder reports, overseeing the payment of the Company’s expenses, oversight of services providers and the performance of administrative and professional services rendered to the Company by others. CNL may also enter into agreements with its affiliates for the performance of select administrative services or the retention of personnel. The Company reimburses CNL and its affiliates for the professional services and expenses it incurs in performing its administrative obligations on behalf of the Company.
CNL, certain CNL affiliates, and KKR receive compensation and reimbursement of expenses in connection with (i) the performance and supervision of administrative services and (ii) the Offering. Related party fees, expenses and reimbursement of expenses incurred in the three and nine month periods ended September 30, 2012 and three and nine month periods ended September 30, 2011 are summarized below:
Related Party | | Source Agreement | | Description | | Three Months Ended September 30, 2012 | | | Three Months Ended September 30, 2011 | | | Nine Months Ended September 30, 2012 | | | Nine Months Ended September 30, 2011 | |
| CNL Securities Corp. | | Managing Dealer Agreement | | Selling commissions and marketing support fees | | $ | 16,309,337 | | | $ | 1,629,143 | | | $ | 38,945,377 | | | $ | 1,629,143 | |
| CNL and KKR | | Investment Advisory Agreement | | Base management fees (investment advisory fees) | | | 2,703,871 | | | | 41,344 | | | | 5,219,690 | | | | 41,344 | |
| CNL and KKR | | Investment Advisory Agreement | | Performance-based incentive fees (1) | | | 1,387,595 | | | | — | | | | 1,920,562 | | | | — | |
| CNL and KKR | | Investment Advisory Agreement | | Organization and offering expenses reimbursement (2) | | | 1,311,505 | | | | — | | | | 2,927,145 | | | | — | |
| CNL | | Administrative Services Agreement | | Administrative and compliance services | | | 263,407 | | | | 63,989 | | | | 581,822 | | | | 76,628 | |
| (1) | During the nine months ended September 30, 2012, the Company recorded performance-based incentive fee expense of $1,920,562, comprised of (i) $1,920,562 expense provision for incentive fee on capital gains and (ii) no expense provision for subordinated incentive fee on income. The incentive fee on capital gains was accrued based on the hypothetical liquidation of the investment portfolio as of the end of each reporting period. The incentive fee on capital gains was not earned by the Advisors nor payable to the Advisors as of September 30, 2012. |
| (2) | The Advisors received reimbursement payments for organization and offering expenses in the amount of $2,569,687 in the nine months ended September 30, 2012, including $896,218 for organization expenses and $1,673,469 for offering expenses. The Company recorded a reimbursement payable to the Advisors in the amount of $357,458 for offering expenses as of September 30, 2012 which is included in other accrued expenses and liabilities on the condensed consolidated statements of assets and liabilities. |
On June 7, 2011, the Company entered into an Expense Support and Conditional Reimbursement Agreement (the “Expense Support Agreement”) with CNL and KKR pursuant to which CNL and KKR jointly and severally agreed to pay to the Company all operating expenses (an “Expense Support Payment”) during the Expense Support Payment Period between June 17, 2011 to December 31, 2011. On December 16, 2011, the Company and the Advisors entered into an amendment to the Expense Support Agreement, effective January 1, 2012, that extended the terminal date of the Expense Support Payment Period to March 31, 2012 and reduced the Reimbursement Ratio from 100% to 65% of the Company’s Operating Expenses. The Amendment also redefined Operating Expenses as all operating costs and expenses paid or incurred by the Company, as determined under GAAP, including base advisory fees payable pursuant to the Investment Advisory Agreement, and excluding (i) performance-based incentive fees payable pursuant to the Investment Advisory Agreement, (ii) organization and offering expenses, and (iii) all interest costs related to borrowings for such period. On March 16, 2012, the Company and the Advisors entered into an amendment and restatement of the Expense Support Agreement, effective April 1, 2012, that extended the terminal date of the Expense Support Payment Period to June 30, 2012 and reduced the Reimbursement Ratio from 65% to 25% of the Company’s Operating Expenses. Expense support payments ceased on July 1, 2012.
Presented below is a summary of Expense Support Payments and the associated terminal eligibility dates for Reimbursement Payments for the year ending December 31, 2011 and the nine months ended September 30, 2012.
| Period Ended | | Expense Support Payments Received from Advisors | | | Expense Support Payments Reimbursed to Advisors1 | | | Unreimbursed Support Payments | | Eligible forReimbursement through |
| December 31, 2011 | | $ | 1,375,592 | | | $ | — | | | $ | 1,375,592 | | December 31, 2014 |
| Nine months September 30, 2012 | | | 1,590,221 | | | | — | | | | 1,590,221 | | December 31, 2015 |
| Total | | $ | 2,965,813 | | | $ | — | | | $ | 2,965,813 | | |
| | (1) | As of September 30, 2012 the Company has accrued $828,347 for potential annual year-end reimbursement payment to Advisors. |
During the term of the Expense Support Agreement, the Advisors are entitled to an annual year-end reimbursement payment by the Company for unreimbursed Expense Support Payments made under the Expense Support Agreement (a “Reimbursement Payment”), but such Reimbursement Payments may only be paid (i) within three years after the year in which such Expense Support Payments are attributable, (ii) to the extent that it would not cause the Company’s Other Operating Expenses (Operating Expenses excluding base advisory fees) to exceed 1.91% of average net assets attributable to common shares as of the end of any such calendar year and (iii) after January 1, 2013. As a result, the Other Operating Expense-to-average net asset ratio is equal to 1.91%, annualized. The Company records the liability for the Reimbursement Payments based on a hypothetical liquidation of its investment portfolio at the end of each reporting period. Management believes that additional liabilities for Reimbursement Payments are not probable as of September 30, 2012.
Indemnification - The Investment Advisory Agreement and the Sub-Advisory Agreement provide certain indemnification to the Advisors, their directors, officers, persons associated with the Advisors, and their affiliates. The managing dealer agreement provides certain indemnification to the managing dealer and each participating broker and their respective officers, directors, partners, employees, associated persons, agents and control persons. As of September 30, 2012, management believes that the risk of incurring any losses for such indemnification is remote.
The following information sets forth the computation of basic and diluted net increase in net assets from operations per share (earnings per share).
| | | Basic and Diluted Net Increase (Decrease) in Net Assets Per Share | |
| | | Three Months
Ended September 30, 2012 | | | Three Months
Ended September 30, 2011 | | | Nine Months Ended September 30, 2012 | | | Nine Months Ended September 30, 2011 | |
| Numerator - net increase (decrease) in net assets resulting from operations | | $ | 11,175,827 | | | $ | (209,088 | ) | | $ | 18,727,214 | | | $ | (209,088 | ) |
| Denominator - Weighted average shares outstanding | | | 37,881,506 | | | | 736,093 | | | | 23,696,227 | | | | 275,541 | |
Basic/diluted net increase (decrease) in net assets from operations per share (1) | | $ | 0.30 | | | $ | (0.28 | ) | | $ | 0.79 | | | $ | (0.76 | ) |
| | (1) | Diluted and basic net increase in net assets from operations per share were equivalent in each period because there were no common stock equivalents outstanding in each period. |
The Company’s board of directors declared distributions for 39 record dates in the nine months ended September 30, 2012. Declared distributions are paid monthly. The total of declared distributions and the sources of distribution payments for the nine months ended September 30, 2012 are presented in the table below.
| Distributions | | Per Share | | | Amount | | | Allocation | |
| For three months ended March 31, 2012 (13 record dates) | | $ | 0.19 | | | $ | 1,987,103 | | | | |
| For three months ended June 30, 2012 (13 record dates) | | | 0.19 | | | | 4,107,381 | | | | |
| For three months ended September 30, 2012 (13 record dates) | | | 0.19 | | | | 7,066,863 | | | | |
| Total Distributions for the nine months ended September 30, 2012 | | $ | 0.57 | | | $ | 13,161,347 | | | | 100.0 | % |
| From Net Investment Income | | $ | 0.39 | | | $ | 9,152,601 | | | | 70.0 | |
| From Realized Gains | | | 0.08 | | | | 1,763,664 | | | | 13.0 | |
| From Other Sources | | | 0.10 | | | | 2,245,082 | | | | 17.0 | |
| | | | | | | | | | | | | |
| Total Distributions for the three months ended September 30, 2011 | | $ | 0.19 | | | $ | 127,941 | | | | 100.0 | % |
| From Net Investment Income | | $ | 0.11 | | | $ | 74,650 | | | | 58.3 | |
| From Other Sources | | | 0.08 | | | | 53,291 | | | | 41.7 | |
On September 27, 2012, the Company’s board of directors declared a distribution of $0.014606 per share for 9 record dates beginning October 2, 2012 and ending on November 27, 2012.
For federal income tax purposes, the distributions paid to shareholders for the nine months ended September 30, 2012 are expected to be primarily taxable as ordinary income and management does not expect to classify any portion of the distributions as return of capital on a tax basis. The tax classification of the calendar year 2012 distributions will be finalized after the end of the calendar year and then reported to shareholders.
9. Share Transactions
On January 4, 2012, January 23, 2012, February 28, 2012 and September 17, 2012, the Company’s board of directors increased the public offering price per share of common stock under the Offering to $10.40, $10.65, $10.85 and 10.95, respectively, to ensure that the associated net offering price per share, exclusive of sales load ($9.360, $9.585, $9.765 and $9.855 respectively) equaled or exceeded the net asset value per share on each subsequent subscription closing date and distribution reinvestment date.
On July 9, 2012, the Company commenced its quarterly share repurchase program and filed its tender offer statement with the SEC on Schedule TO. The Company offered to repurchase up to 236,604 shares of common stock at a cash price of $9.64 per share and its offer was made upon the terms and subject to the conditions set forth in the Offer to Purchase. The Company’s offer to repurchase shares expired on August 15, 2012 and the Company repurchased 47,481 shares shortly thereafter.
Transactions in shares of common stock were as follows for the nine months ended September 30, 2012 and September 30, 2011:
| | | Nine Months Ended September 30, 2012 | | | Nine Months Ended September 30, 2011 | |
| | | Shares | | | Amount | | | Shares | | | Amount | |
| Gross Proceeds from Offering | | | 38,290,080 | | | $ | 411,855,507 | | | | 1,718,149 | | | $ | 17,092,490 | |
| Commissions and Marketing Support Fees | | | — | | | | (38,945,377 | ) | | | — | | | | (1,629,143 | ) |
| Net Proceeds to Company | | | 38,290,080 | | | | 372,910,130 | | | | 1,718,149 | | | | 15,463,347 | |
| Reinvestment of Distributions | | | 698,628 | | | | 6,815,498 | | | | 8,215 | | | | 73,931 | |
| Share Repurchase Program | | | (47,481 | ) | | | (457,720 | ) | | | — | | | | — | |
| Net Proceeds from Share Transactions | | | 38,941,227 | | | $ | 379,267,908 | | | | 1,726,364 | | | $ | 15,537,278 | |
| Average Net Proceeds Per Share | | $9.74 | | | $9.00 | |
The following per share data and financial ratios have been derived from information provided in the consolidated condensed financial statements. The following is a schedule of financial highlights for a common share outstanding during the nine months ended September 30, 2012 and during the period from June 17, 2011 (commencement of operations) through September 30, 2011:
| Beginning of Period | | January 1, 2012 | | | June 17, 2012 | |
| End of Period | | September 30, 2012 | | | September 30, 2011 | |
| OPERATING PERFORMANCE PER SHARE | | | | | | |
| Net Asset Value, Beginning of Period | | $ | 9.21 | | | $ | 9.00 | |
Net Investment Income (Loss), Before Expense Support (1) | | | 0.32 | | | | (0.48 | ) |
Expense Support (1) | | | 0.07 | | | | 0.59 | |
| | | | | | | | | |
Net Investment Income (1) | | | 0.39 | | | | 0.11 | |
Net Realized and Unrealized Gain (Loss) (1)(2) | | | 0.66 | | | | (0.42 | ) |
| | | | | | | | | |
| Net Increase (Decrease) Resulting from Investment Operations | | | 1.05 | | | | (0.31 | ) |
Distributions from Net Investment Income (3) | | | (0.39 | ) | | | (0.11 | ) |
Distributions from Realized Gains (3) | | | (0.08 | ) | | | — | |
Distributions from Other Sources (3) | | | (0.10 | ) | | | (0.08 | ) |
| | | | | | | | | |
| Net Decrease Resulting from Distributions to Common Shareholders | | | (0.57 | ) | | | (0.19 | ) |
Capital share transactions –Issuance of common stock above net asset value (4) | | | 0.09 | | | | 0.31 | |
| Net Increase Resulting from Capital Share Transactions | | | 0.09 | | | | 0.31 | |
| | | | | | | | | |
| Net Asset Value, End of Period – September 30 | | $ | 9.78 | | | $ | 8.81 | |
| | | | | | | | | |
| INVESTMENT RETURNS | | | | | | | | |
Total Investment Return-Net Price (5) | | | 12.3 | % | | | — | % |
Total Investment Return-Net Asset Value (6) | | | 12.5 | % | | | (0.05 | )% |
| | | | | | | | | |
RATIOS/SUPPLEMENTAL DATA (all amounts in thousands) | | | | | | | | |
| Net Assets, End of Period | | $ | 449,997 | | | $ | 15,400 | |
Average Net Assets (7) | | $ | 228,786 | | | $ | 5,920 | |
| Average Credit Facility Borrowings | | $ | 86,870 | | | $ | — | |
| Shares Outstanding, End of Period | | | 46,014 | | | | 1,749 | |
| Weighted Average Shares Outstanding | | | 23,696 | | | | 669 | |
| | | | | | | | | |
Ratios to Average Net Assets: (7) | | | | | | | | |
| Total Expenses Before Operating Expense Support | | | 5.92 | % | | | 6.63 | % |
| Total Expenses After Operating Expense Support | | | 5.23 | % | | | — | % |
| Net Investment Income | | | 4.00 | % | | | 1.26 | % |
| Portfolio Turnover Rate | | | 30.24 | % | | | 0.56 | % |
Asset Coverage Ratio (8) | | | 3.80 | | | | — | |
| (1) | The per share data was derived by using the weighted average shares outstanding during the period. |
| (2) | The amount shown at this caption is the balancing figure derived from the other figures in the schedule. The amount shown at this caption for a share outstanding throughout the entire period may not agree with the change in the aggregate net realized and unrealized gains and losses in portfolio securities for the period because of the timing of sales of the Company’s shares in relation to fluctuating market values for the portfolio securities. |
| (3) | The per share data for distributions is the actual amount of distributions paid or payable per share of common stock outstanding during the entire period; distributions per share are rounded to the nearest $0.01. |
| (4) | The continuous issuance of shares of common stock may cause an incremental increase in net asset value per share due to the sale of shares at the then prevailing public offering price and the receipt of net proceeds per share by the Company in excess of net asset value per share on each subscription closing date. The per share data was derived by computing (i) the sum of (A) the number of shares issued in connection with subscriptions and/or distribution reinvestment on each share transaction date times (B) the differences between the net proceeds per share and the net asset value per share on each share transaction date, divided by (ii) the total shares outstanding at the end of the period. |
| (5) | Total investment return-net price is a measure of total return for shareholders who purchased the Company’s common stock at the beginning of the period, including dividends paid or payable during the period. Total investment return-net price is based on (i) the purchase of one share at the public offering price, net of sales load, on the first day of the period, (ii) the sale at the net asset value per share on the last day of the period, of (A) one share plus (B) any fractional shares issued in connection with the reinvestment of monthly distributions, and (iii) the cash payment for distributions payable, if any, on the last day of the period. The total investment return-net price calculation assumes that (i) monthly cash distributions are reinvested in accordance with the Company’s distribution reinvestment plan and (ii) the fractional shares issued pursuant to the distribution reinvestment plan are issued at the then public offering price, net of sales load, on each monthly distribution payment date. Since there is no public market for the Company’s shares, then current market value is assumed to be equal to net asset value per share on the last day of the period. Total investment return is not annualized. The Company’s performance changes over time and currently may be different than that shown above. Past performance is no guarantee of future results. |
| (6) | Total investment return-net asset value is a measure of the change in total value for shareholders who held the Company’s common stock at the beginning and end of the period, including dividends paid or payable during the period. Total investment return-net asset value is based on (i) the beginning period net asset value per share on the first day of the period, (ii) the net asset value per share on the last day of the period, of (A) one share plus (B) any fractional shares issued in connection with the reinvestment of monthly distributions, and (iii) the value of distributions payable, if any, on the last day of the period. The total investment return-net asset value calculation assumes that (i) monthly cash distributions are reinvested in accordance with the Company’s distribution reinvestment plan and (ii) the fractional shares issued pursuant to the distribution reinvestment plan are issued at the then public offering price, net of sales load, on each monthly distribution payment date. Since there is no public market for the Company’s shares, then current market value is assumed to be equal to net asset value per share on the last day of the period. Total investment return-net asset value is not annualized. The Company’s performance changes over time and currently may be different than that shown above. Past performance is no guarantee of future results. |
| (7) | The computation of average net assets during the period is based on the daily value of net assets. Ratios are not annualized. |
| (8) | Asset coverage ratio is equal to (i) the sum of (A) net assets at the end of the period and (B) total debt outstanding at the end of the period, divided by (ii) total debt outstanding at the end of the period. |
11. Revolving Credit Facility and Borrowings
On August 22, 2011, CCT Funding entered into a revolving credit facility agreement (including an amendment, the “Credit Agreement”) with Deutsche Bank AG, New York Branch (“Deutsche Bank”). Deutsche Bank is the sole initial lender and serves as administrative agent under the Credit Agreement. The Credit Agreement currently provides for borrowings in an aggregate amount up to $175 million on a committed basis, consisting of an initial borrowing commitment of $75 million (the “Tranche A Loans”) and a second borrowing commitment of $100 million (the “Tranche B Loans”). On August 20, 2012, CCT Funding, entered into an amendment (the “Second Amendment”) to its credit facility to partially exercise the available accordion feature provided in the revolving credit facility. The Second Amendment provides for the extension of additional borrowings on an uncommitted basis in an aggregate amount up to $65 million (the “Tranche C Loans”), for total maximum borrowings of $240 million available under the revolving credit facility. Under the Credit Agreement, CCT Funding has made certain representations and warranties and it is required to comply with various covenants, reporting requirements and other customary requirements for credit agreements of this nature. As of September 30, 2012 management believes that the Company was in compliance with the covenants of the revolving credit facility. As of September 30, 2012, the Company has incurred deferred financing costs of $305,558 in connection with obtaining and amending the revolving credit facility.
| Revolving Credit Facility Summary | |
| | | Loan Tranche | | | | |
| | | | A | | | | B | | | | C | | | Total | |
| Borrowing Commitment Amount (Tranche C Uncommitted) | | $ | 75,000,000 | | | $ | 100,000,000 | | | $ | 65,000,000 | | | $ | 240,000,000 | |
| Amount Borrowed as of January 1, 2012 | | | 25,340,000 | | | | — | | | | — | | | | 25,340,000 | |
| Net Amount Borrowed-nine months ended September 30, 2012 | | | 49,660,000 | | | | 85,920,000 | | | | — | | | | 135,580,000 | |
| Amount Borrowed as of September 30, 2012 | | | 75,000,000 | | | | 85,920,000 | | | | — | | | | 160,920,000 | |
| Unused Borrowing Balance as of September 30, 2012 | | $ | — | | | $ | 14,080,000 | | | $ | 65,000,000 | | | $ | 79,080,000 | |
| | | | | | | | | | | | | | | | | |
| Unused Commitment Fee | | | 0.75 | % | | | 0.75 | % | | | — | % | | | | |
| Base Interest Rate (reset monthly) | | 30-day LIBOR | | | 90-day LIBOR | | | 90-day LIBOR | | | | | |
| Spread | | | 1.70 | % | | | 2.35 | % | | | 1.70 | % | | | | |
| Interest Rate/Annualized Interest Rate as of September 30, 2012 | | | 1.93%/1.96 | % | | | 2.76%/2.80 | % | | | —%/— | % | | | | |
| | | | | | | | | | | | | | | | | |
For the three months ended September 30, 2012: | | | | | | | | | | | | | | | | |
| Weighted Average Interest Rate | | | 1.94 | % | | | 2.79 | % | | | 2.11 | % | | | 2.28 | % |
| Average Borrowings | | $ | 75,000,000 | | | $ | 59,359,783 | | | $ | 1,494,783 | | | $ | 135,854,565 | |
| Direct Interest Expense | | | 371,964 | | | | 421,672 | | | | 8,052 | | | | 801,688 | |
| Unused Commitment Fees | | | | | | | | | | | | | | | 77,894 | |
| Amortization of Deferred Financing Costs | | | | | | | | | | | | | | | 38,310 | |
| Total Interest Expense | | | | | | | | | | | | | | $ | 917,892 | |
For the nine months ended September 30, 2012: | | | | | | | | | | | | | | | | |
| Weighted Average Interest Rate | | | 1.95 | % | | | 2.79 | % | | | 2.11 | % | | | 2.06 | % |
| Average Borrowings | | $ | 66,279,416 | | | $ | 20,088,394 | | | $ | 501,898 | | | $ | 86,869,708 | |
| Direct Interest Expense | | | 982,565 | | | | 425,048 | | | | 8,052 | | | | 1,415,665 | |
| Unused Commitment Fees | | | | | | | | | | | | | | | 228,293 | |
| Amortization of Deferred Financing Costs | | | | | | | | | | | | | | | 107,699 | |
| Total Interest Expense | | | | | | | | | | | | | | $ | 1,751,657 | |
| 12. | Guarantees and Commitments |
In the normal course of business, the Company may enter into guarantees on behalf of portfolio companies. Under these arrangements, the Company would be required to make payments to third parties if the portfolio companies were to default on their related payment obligations. The Company has no such guarantees outstanding at September 30, 2012 and December 31, 2011. As of September 30, 2012, the Company was committed to fund $1,561,876 for two delayed draw term loans associated with one portfolio company. The Company received a non-refundable fee of $60,976 in connection with these two investment commitments.
The Company’s management has evaluated subsequent events through the date of issuance of the condensed consolidated financial statements included herein. There have been no subsequent events that occurred during such period that would require disclosure in this Form 10-Q or would be required to be recognized in the condensed consolidated financial statements as of and for the nine months ended September 30, 2012, except as disclosed below.
On October 9, 2012, the Company filed its tender offer statement with the SEC on Schedule TO. The Company is offering to repurchase up to 470,031 shares of common stock at a cash price of $9.79 per share and its offer is made upon the terms and subject to the conditions set forth in the Offer to Purchase and the related Letter of Transmittal. The Company’s offer to repurchase shares will expire on November 15, 2012.
As of November 8, 2012, the total amount borrowed under the revolving credit facility was $182,620,000.
| Item 2. | Management’s Discussion and Analysis of Financial Condition and Results of Operations |
The information contained in this section should be read in conjunction with our unaudited consolidated financial statements and related notes thereto appearing elsewhere in this quarterly report on Form 10-Q. In this report, “we”, “our”, “us” and “our company” refer to Corporate Capital Trust, Inc.
STATEMENT REGARDING FORWARD LOOKING INFORMATION
The following information contains statements that constitute forward-looking statements, within the meaning of Section 27A of the Securities Act of 1933, as amended, and Section 21E of the Securities Exchange Act of 1934, as amended (the “Exchange Act”). These statements generally are characterized by the use of terms such as “may,” “should,” “plan,” “anticipate,” “estimate,” “intend,” “predict,” “believe” and “expect” or the negative of these terms or other comparable terminology. Although we believe that the expectations reflected in such forward-looking statements are based upon reasonable assumptions, our actual results could differ materially from those set forth in the forward-looking statements. Some factors that might cause such a difference include the following: the current global economic downturn, increased direct competition, changes in government regulations or accounting rules, changes in local, national and global capital market conditions, our ability to obtain or access credit lines or credit facilities on satisfactory terms, changes in interest rates, availability of proceeds from our offering of shares, our ability to identify suitable investments, our ability to close on identified investments, inaccuracies of our accounting estimates, our ability to locate suitable borrowers to borrow from us on favorable terms to us, and the ability of such borrowers to make payments to us under their respective loans terms and conditions with us. Given these uncertainties, we caution you not to place undue reliance on such statements, which apply only as of the date hereof. We undertake no obligation to publicly release the results of any revisions to these forward-looking statements that may be made to reflect future events or circumstances or to reflect the occurrence of unanticipated events. The forward-looking statements should be read in light of the risk factors identified in the “Risk Factors” section of our annual report on Form 10-K filing for the year ended December 31, 2011.
CRITICAL ACCOUNTING POLICIES AND ESTIMATES
Our discussion and analysis of our financial condition and results of operations are based upon our condensed consolidated financial statements which have been prepared in accordance with GAAP. The preparation of these condensed consolidated financial statements requires management to make estimates and assumptions that affect the reported amounts of assets, liabilities, revenues and expenses. Changes in the economic environment, financial markets and any other parameters used in determining such estimates could cause actual results to differ.
Our critical accounting policies are described in the notes to the condensed consolidated financial statements. Accordingly see Note 2 to the condensed consolidated financial statements for a description of critical accounting policies. We consider these accounting policies critical because they involve management judgments and assumptions, require estimates about matters that are inherently uncertain and because they are important for understanding and evaluating our reported financial results. These judgments will affect the reported amounts of assets and liabilities and our disclosure of contingent assets and liabilities at the dates of the financial statements and the reported amounts of revenue and expenses during the reporting periods. With different estimates or assumptions, materially different amounts could be reported in our financial statements.
RECENT ACCOUNTING PRONOUNCEMENTS
See Note 2 to the condensed consolidated financial statements for a description of recently issued accounting pronouncements. We do not believe that any recently issued but not yet effective accounting pronouncements, if adopted, would have a material effect on our condensed consolidated financial statements.
EXECUTIVE OVERVIEW
We are a non-diversified closed-end management investment company that has elected to be treated as a business development company (“BDC”) under the Investment Company Act of 1940 (the “1940 Act”). Formed as a Maryland corporation on June 9, 2010, our investment portfolio is externally managed by CNL Fund Advisors Company (“CNL”) and KKR Asset Management LLC (“KKR”), collectively, the “Advisors”, which are responsible for sourcing potential investments, conducting due diligence on prospective investments, analyzing investment opportunities, structuring investments and monitoring our portfolio on an ongoing basis, and determining the amount of leverage employed in our investment portfolio. Both Advisors are registered as investment advisers with the SEC. CNL also provides the administrative services necessary for us to operate.
Investment Objective and Investments
Our investment objective is to provide our shareholders with current income and, to a lesser extent, long-term capital appreciation. We intend to meet our investment objective by investing primarily in the debt of privately owned U.S. companies (also referred to as “portfolio companies”) with a focus on originated transactions sourced through the networks of our Advisors. We anticipate that a substantial portion of our portfolio will consist of senior and subordinated debt, which we believe offer opportunities for superior risk-adjusted returns and income generation. Our debt investments may take the form of corporate loans or bonds, may be secured or unsecured and may, in some cases, be accompanied by warrants, options or other forms of equity participation. We may also potentially purchase common or preferred equity interests in portfolio companies.
The level of our investment activity can and does vary substantially from period to period depending on many factors, including: the amount of equity capital we raise from offering common stock in our company, the amount of capital we may borrow under our revolving credit facility, the amount of debt and equity capital available at large from various potential capital providers to finance the business activities of portfolio companies, the demand for debt from creditworthy privately owned U.S. companies, the level of merger, acquisition and refinancing activity involving private companies, the availability of credit to finance transactions, the general economic environment, and competitive environment for the types of investments we currently seek and intend to seek in the future.
As a BDC, we are required to comply with certain regulatory requirements. For instance, we may not acquire any assets other than “qualifying assets” specified in the 1940 Act unless, at the time the acquisition is made, at least 70% of our total assets are qualifying assets (with certain limited exceptions). Qualifying assets include investments in “eligible portfolio companies.” Under the relevant SEC rules, the term “eligible portfolio company” includes all private companies, companies whose securities are not listed on a national securities exchange, and certain public companies that have listed their securities on a national securities exchange and have a market capitalization of less than $250 million. These rules also permit us to include as qualifying assets certain follow-on investments in companies that were eligible portfolio companies at the time of initial investment but that no longer meet the definition.
Revenues
We generate revenue primarily in the form of interest on the debt securities of portfolio companies that we acquire and hold for investment purposes. Our investments in debt securities generally have an expected maturity of three to ten years, although we have no lower or upper constraint on maturity, and typically bear interest at a fixed or floating rates. Interest on our debt securities is generally payable quarterly or semi-annually. In some cases, our debt investments may partially defer cash interest payments with payment-in-kind provisions. Any outstanding principal amount of our debt securities and any accrued but unpaid interest will generally become due at the maturity date. In addition, we may generate revenue in the form of prepayment fees, commitment fees, origination fees, and fees for providing significant managerial assistance.
Operating Expenses
Our primary operating expenses include the payment of a base management fee and, depending on our operating results, performance-based incentive fees, reimbursable expenses under the investment advisory agreement, interest expense and financing fees, fund administrative expenses, and third-party expenses incurred under the administrative services agreement and custody/accounting agreements. The base management fee and performance-based incentive fees compensate the Advisors for their efforts and resources in identifying, evaluating, negotiating, closing and monitoring our investments. We bear all other costs and expenses of our operations and transactions.
FINANCIAL AND OPERATING HIGHLIGHTS
At September 30, 2012 ($ in millions except per share data) | | | | |
Total assets | | $ | 646.92 | |
| Adjusted total assets (Total assets net of payable for investments purchased) | | $ | 616.11 | |
Investment in portfolio companies | | $ | 598.36 | |
Borrowings (under credit facility) | | $ | 160.92 | |
Net assets | | $ | 449.99 | |
Average net assets (year to date) | | $ | 228.79 | |
Average credit facility borrowings (year to date) | | $ | 86.87 | |
Increase in total assets since December 31, 2011 (not annualized) | | | +457 | % |
Increase in net assets since December 31, 2011 (not annualized) | | | +591 | % |
Net asset value per share | | $ | 9.78 | |
Asset coverage ratio ((Borrowings + Net assets)/Borrowings) | | | 3.80 | |
Leverage ratio (Borrowings/Adjusted total assets) | | | 26 | % |
| | | | | |
Portfolio Activity for the Nine Months Ended September 30, 2012 ($ in millions except per share data) | | | |
Cost of Investments purchased | | $ | 598.36 | |
Sales, principal payments and other exits | | $ | 116.51 | |
Net change in portfolio companies | | | +35 | |
Number of portfolio companies at end of period | | | 145 | |
Net investment income before incentive fees | | $ | 11.07 | |
Net investment income | | $ | 9.15 | |
Net realized gains on investments and foreign currency transactions | | $ | 1.77 | |
| Net change in unrealized appreciation on investments and foreign currency translation: | | $ | 7.82 | |
Net increase in net assets from operations | | $ | 18.73 | |
Total distributions declared | | $ | 13.12 | |
Calendar year paid distribution as % of taxable income | | | 92 | % |
Net investment income before incentive fees per share | | $ | 0.48 | |
Net investment income per share | | $ | 0.39 | |
Earnings per share | | $ | 0.79 | |
Distributions declared per share outstanding for the entire period | | $ | 0.57 | |
Common Stock Offering Summary for the Nine Months Ended September 30, 2012 ($ in millions except per share data) | | | | |
Gross proceeds | | $ | 411.86 | |
Net proceeds to Company | | $ | 372.91 | |
Average net proceeds per share | | $ | 9.74 | |
Shares issued in connection with offering | | | 38.29 | |
BUSINESS ENVIRONMENT
Presently the current economic environment remains relatively volatile. The U.S. economy has grown at a moderate rate this year, but key indicators of sustainable growth remain under pressure. Furthermore, in 2013 a variety of tax rates are scheduled to increase simultaneously with automatic reductions in government spending. Such a tightening of fiscal policy and the uncertainty about the resolution of these fiscal issues may further slow U.S. economic growth and adversely impact the global economy. During the third quarter of 2012, the credit markets continued to experience overall price appreciation as evidenced through the S&P/LSTA Leveraged Loan Index, a primary measure of senior debt, and the Merrill Lynch High Yield Master II Index, a primary measure of subordinated debt. Both indices appreciated in the third quarter registering total returns of 3.4% and 4.6%, respectively. Additionally, for the first nine months of 2012, senior debt generated a total return of 8.1% and subordinated debt also performed well by increasing 12.0%.
PORTFOLIO AND INVESTMENT ACTIVITY
Portfolio Investment Activity for the Three Months Ended September 30, 2012
On July 1, 2011, we commenced investment operations and began executing on our strategy of investing primarily in the debt securities of privately-owned U.S. companies. During the three months ended September 30, 2012, we acquired investment positions in portfolio companies totaling $253.86 million, we sold investment positions totaling $61.38 million and we collected principal payments of $6.92 million. As of September 30, 2012, our investment portfolio consisted of investment interests in 145 portfolio companies, for a total fair value of $598.36 million and an associated cost basis of $589.82 million. During the three months ended September 30, 2012, we added 13 new portfolio companies with an aggregate investment of approximately $69.04 million and we completely exited from our investment positions in nine portfolio companies that had been held in the investment portfolio at June 30, 2012.
None of our portfolio investments were on non-accrual or in monetary default as of September 30, 2012.
The following table summarizes the composition of our investment portfolio at cost and fair value as of September 30, 2012.
| | | | | | | | | | | | | |
| Asset Category | | Cost | | | Fair Value | | | Percentage of Portfolio | | | Percentage of Net Assets | |
| Senior debt securities | | $ | 388,393,914 | | | $ | 394,921,745 | | | | 66.0 | % | | | 87.7 | % |
| Subordinated debt securities | | | 200,974,041 | | | | 202,881,969 | | | | 33.9 | | | | 45.1 | |
| Total debt securities | | | 589,367,955 | | | | 597,803,714 | | | | 99.9 | | | | 132.8 | |
| Common stock | | | 448,908 | | | | 561,134 | | | | 0.1 | | | | 0.1 | |
| Subtotal | | | 589,816,863 | | | | 598,364,848 | | | | 100.0 | % | | | 132.9 | |
| Short term investments | | | 12,940,997 | | | | 12,940,997 | | | | | | | | 2.9 | |
| Total investments | | $ | 602,757,860 | | | $ | 611,305,845 | | | | | | | | 135.8 | % |
The primary investment concentrations include (i) senior debt and (ii) subordinated debt securities. The debt investments in our portfolio were purchased at an average price of 99.9% of par value. At September 30, 2012, 42.7% of our debt investments featured floating interest rates, generally index based on London Interbank Offered Rate (“LIBOR”), and 57.3% of our debt investments featured fixed interest rates. Approximately 81.8% of our floating rate debt investments featured interest rate floors with a weighted average interest rate floor of 1.49%.
All of our floating rate debt investments have index reset frequencies of less than twelve months with the majority resetting at least quarterly. With regards to our floating rate debt investment sub-portfolio, the weighted average coupon spread to LIBOR was 600 basis points as of September 30, 2012 and 468 basis points as of December 31, 2011, and the weighted average years to maturity was 5.0 years as of September 30, 2012, as compared to 4.9 years as of December 31, 2011. With regards to our fixed rate debt investment sub-portfolio, the weighted average coupon rate was 9.7% as of September 30, 2012 and 9.3% as of December 31, 2011, and the average years to maturity was 5.3 years as of both September 30, 2012 and December 31, 2011. Weighted average coupon, coupon spreads and weighted average years to maturity are calculated based on par values.
The following table summarizes our top ten portfolio companies as measured by fair value as of September 30, 2012:
| Portfolio Company | | Industry | | Fair Value
($ millions) | | % of Fair
Value | | Investments | | Interest
Rate (1) | | Base Rate
Floor | | Maturity Date |
| Catalina Marketing Corp. | | Media | | $ | 28.51 | | 4.8 | % | | Senior Debt | | L+550 | | | | 9/29/2017 |
| | | | | | | | | | | Subordinated Debt | | 10.50% | | | | 10/1/2015 |
| The Gymboree Corp. | | Retailing | | | 21.72 | | 3.6 | | | Senior Debt | | L+350 | | 1.50% | | 2/23/2018 |
| | | | | | | | | | | Subordinated Debt | | 9.125% | | | | 12/1/2018 |
| Ryerson, Inc. | | Materials | | | 20.31 | | 3.4 | | | Senior Debt | | 12.00% | | | | 11/1/2015 |
| | | | | | | | | | | Senior Debt | | 9.00% | | | | 10/15/2017 |
| | | | | | | | | | | Senior Debt | | L+737.5 | | | | 11/1/2014 |
| HUB International, Ltd. | | Insurance | | | 19.89 | | 3.3 | | | Senior Debt | | L+450 | | | | 6/13/2017 |
| | | | | | | | | | | Senior Debt | | L+475 | | 2.00% | | 12/13/2017 |
| | | | | | | | | | | Subordinated Debt | | 8.13% | | | | 10/15/2018 |
| GCI, Inc. | | Telecommunication Services | | | 15.94 | | 2.7 | | | Subordinated Debt | | 8.625% | | | | 11/15/2019 |
| | | | | | | | | | | Subordinated Debt | | 6.75% | | | | 6/1/2021 |
| Data Device Corp. | | Capital Goods | | | 15.77 | | 2.6 | | | Senior Debt | | L+600 | | 1.50% | | 7/11/2018 |
| | | | | | | | | | | Senior Debt | | L+1000 | | 1.50% | | 7/11/2019 |
| Cengage Learning Acquisitions, Inc. | | Media | | | 15.65 | | 2.6 | | | Senior Debt | | 11.50% | | | | 4/15/2020 |
| Hubbard Radio, LLC | | Media | | | 15.43 | | 2.6 | | | Senior Debt | | L+725 | | 1.50% | | 4/30/2018 |
| | | | | | | | | | | Senior Debt | | L+375 | | 1.50% | | 4/28/2017 |
| E*TRADE Financial Corp. | | Diversified Financials | | | 13.61 | | 2.23 | | | Subordinated Debt | | 12.50% | | | | 11/30/2017 |
| | | | | | | | | | | Subordinated Debt | | 7.875% | | | | 12/1/2015 |
| | | | | | | | | | | Subordinated Debt | | 6.75% | | | | 6/1/2016 |
| Wilton Brands, LLC | | Materials | | | 13.13 | | 2.2 | | | Senior Debt | | L+625 | | 1.25% | | 8/30/2018 |
| Total | | | | $ | 179.96 | | 27.45 | % | | | | | | | | |
(1) “L” is the three month LIBOR. For example, the interest rate of L+550 is equal to the sum of (i) LIBOR on the interest reset date and (ii) 5.5%.
We have implemented a currency hedging strategy to compensate us for declines in the value of the Euro relative to the US dollar. At September 30, 2012, we held four investment positions in debt securities denominated in Euro totaling €8,213,000 in principal amount. Concurrently we held two foreign exchange forward contracts for the sale of €7,600,000 between November 2012 and January 2013 at settlement date currency exchange rates that range between €1.0/US$1.2536 and €1.0/US$1.26868.
The table below presents a diversification summary of our portfolio company investments arranged by industry classifications at September 30, 2012 and December 31, 2011. As of September 30, 2012, our investment portfolio of 145 portfolio companies was diversified across 23 industry classifications, as compared to our investment portfolio as of December 31, 2011 that consisted of 110 portfolio companies diversified across 24 distinct industry classifications.
| | | | | | | |
| Industry Classification | | September 30, 2012 | | | December 31, 2011 | |
Media | | | 16.0 | % | | | 8.1 | % |
Materials | | | 13.6 | | | | 3.4 | |
Software & Services | | | 10.3 | | | | 14.6 | |
Retailing | | | 7.9 | | | | 12.6 | |
Capital Goods | | | 6.5 | | | | 3.4 | |
Health Care Equipment & Services | | | 6.0 | | | | 6.9 | |
Insurance | | | 5.7 | | | | 2.4 | |
Technology Hardware & Equipment | | | 5.4 | | | | 4.6 | |
Telecommunication Services | | | 4.7 | | | | 9.0 | |
Consumer Services | | | 4.6 | | | | 4.9 | |
Diversified Financials | | | 3.8 | | | | 7.8 | |
Food & Staples Retailing | | | 3.2 | | | | 2.5 | |
Energy | | | 2.9 | | | | 3.3 | |
| Pharmaceuticals, Biotechnology & Life Sciences | | | 2.7 | | | | 5.0 | |
Transportation | | | 2.5 | | | | 3.4 | |
| Commercial & Professional Services | | | 1.4 | | | | 3.2 | |
Remaining Industries (7/8) | | | 2.8 | | | | 4.9 | |
Total | | | 100.0 | % | | | 100.0 | % |
We neither “control” nor are we an “affiliated person” (each as defined in the 1940 Act) of any of our portfolio companies. Under the 1940 Act, we generally would be presumed to “control” a portfolio company if we own beneficially, either directly or through one or more controlled companies, 25% or more of its voting securities; and generally would be an “affiliated person” of a portfolio company if we directly or indirectly own or otherwise control 5% or more of its voting securities.
LIQUIDITY AND CAPITAL RESOURCES
We generate cash primarily from (i) the net proceeds from our continuous public offering of common stock (the “Offering”) (ii) borrowing funds under a revolving credit facility, (iii) interest income, dividends, fees earned from our portfolio investments, and principal payments, (iv) proceeds from sales of our portfolio investments and (v) the reinvestment of distributions based on the election of our shareholders. Net proceeds from our Offering are our primary source of capital to expand our investment portfolio of portfolio companies; interest income, net of expenses, is our primary source of cash to pay distributions to our shareholders.
Offering of Common Stock
On June 23, 2010, we filed a registration statement with the SEC on Form N-2 (as amended and supplemented, the “Registration Statement”) to register the Offering. The Offering, which relates to the sale of up to 150 million of shares of common stock, commenced on April 4, 2011 when the Registration Statement was declared effective. We raised net proceeds of $162.3 million in the three months ended September 30, 2012 and $444.1 million since the start of our Offering, including the reinvestment of distributions into shares of our common stock. Nearly all of this equity capital has been employed to acquire investment positions in portfolio companies.
Credit Facility
We borrow funds to invest alongside the equity capital proceeds of our Offering to increase our investment positions in portfolio companies and to further diversify the number of portfolio company investment positions. In 2011, our wholly owned subsidiary CCT Funding LLC (“CCT Funding”) entered into a revolving credit facility agreement (the “Credit Agreement”) with Deutsche Bank AG, New York Branch (“Deutsche Bank”). Deutsche Bank is the sole initial lender and serves as administrative agent under the Credit Agreement. CCT Funding has appointed us to manage its investment portfolio pursuant to the terms of an investment management agreement. CCT Funding’s obligations to Deutsche Bank are secured by a first priority security interest in substantially all of the assets of CCT Funding, including its investment portfolio. The obligations of CCT Funding under the revolving credit facility are non-recourse to us.
The Credit Agreement currently provides for borrowings in an aggregate amount up to $240.00 million, including $175.00 million on a committed basis and $75.00 million on an uncommitted basis. We have incurred costs of $0.31 million in connection with obtaining the credit facility and amending the Credit Agreement, primarily consisting of legal fees.
Tranche A Loans ($75.00 million commitment) generally bear interest based on one-month adjusted LIBOR plus a spread of 1.70% per annum. Tranche B Loans ($100 million commitment) generally bear interest based on a three-month adjusted LIBOR plus a spread of 2.35% per annum. Tranche C Loans ($65.00 million uncommitted) generally bear interest based on a three-month adjusted LIBOR plus a spread of 1.70% per annum. The interest rates are reset monthly and interest is payable monthly in arrears. We incur a continuing unused commitment fee of 0.75% per annum on any unused commitment balances on the Tranche A Loans and Tranche B Loans. All amounts borrowed as Tranches A and B Loans will mature, and all accrued and unpaid interest thereunder, will be due and payable on August 22, 2013. All amounts borrowed as Tranche C Loans of the revolving credit facility will mature, and all accrued and unpaid interest thereunder, will be due and payable on August 20, 2014.
During the three months ended September 30, 2012, we increased our net borrowing balance by $82.98 million. As of September 30, 2012, $75.00 million was borrowed and outstanding as Tranche A Loans and $85.92 million was borrowed and outstanding as Tranche B Loans. The unused commitment balance was $14.08 million under the Tranche B Loans commitment. As of September 30, 2012, the ratio of credit facility borrowings-to-adjusted total assets was 26%. (Adjusted total assets is equal to total assets excluding payable for investments purchased.) For the three and nine month periods ending September 30, 2012, the all-in cost of financing, including fees and expenses, was 2.69%. We will continue to draw on the revolving credit facility and combine borrowed funds with equity capital to increase and expand our investment positions in portfolio companies. Additionally, we may further increase the aggregate maximum credit commitment in the future beyond the current amount of $240.00 million.
Distributions Paid and Declared
We pay our monthly distributions in the form of cash; shareholders may elect to reinvest their monthly distributions in additional shares of our common stock pursuant to the terms our distribution reinvestment plan. Any distributions reinvested under our distribution reinvestment plan will nevertheless remain taxable for U.S. shareholders.
We paid total distributions of $7.07 million and $13.16 million for the three-month and nine-month periods ended September 30, 2012 respectively. Approximately 52% of the distributions we paid in the nine month period ended September 30, 2012 were reinvested in shares of our common stock at the prevailing net price per share at the time of distribution payments and represent an additional source of capital to invest in portfolio companies. See Note 8 to the condensed consolidated financial statements for a discussion of the sources of distributions on a GAAP basis. The incentive fee on capital gains payable to the Advisors was not earned as of September 30, 2012, represents a non-cash expense, and is considered an additional source of distributions; accordingly the net incentive income before incentive fees was $11.07 million for the nine months ended September 30, 2012 and represented 84% of paid distributions over the same period.
We anticipate our distributions for the current year, in the aggregate, will be substantially supported by taxable income, consisting primarily of taxable ordinary income and net capital gains. We also estimate that 100% of the our distributions paid in the nine months ended September 30, 2012 were covered by taxable ordinary income and net capital gains. We do not expect to use equity capital or borrowed funds to pay distributions to shareholders nor do we expect our shareholders to incur a return of capital on a tax basis in connection with paid distributions.
Distribution Coverage as of September 30, 2012 (1) | | Amount ($ millions) | | | Payout
Ratio | |
| | | | | | | |
| Taxable Income | | $ | 14.17 | | | | |
| Current Tax Year Paid Distributions | | | 13.05 | | | | |
| Paid Distributions as % of Taxable Income | | | | | | | 92.1 | % |
| | (1) | The tax classification of the calendar year 2012 paid distributions will be finalized after the end of the calendar year and then reported to shareholders. Taxable income is estimated. |
Our shareholders who held our common stock during the entire three months and nine months ended September 30, 2012 received distributions of approximately $0.19 per share and $0.57 per share, respectively. The annualized distribution rate was 7.0% of our public offering price for shares of common stock during the nine months ended September 30, 2012. The following table provides the details of cash distributions per share that we have declared and paid on our shares of common stock during the nine months ended September 30, 2012.
| Distribution Record Date | | Distribution Payment Date | | Distribution Amount
Per Share Per Record Date | |
| January 3 and 10, 2012 | | February 1, 2012 | | $ | 0.013798 | |
| January 17 and 24, 2012 | | February 1, 2012 | | | 0.014000 | |
| January 31, 2012 | | February 1, 2012 | | | 0.014336 | |
| February 7, 14, 21 and 28, 2012 | | February 29, 2012 | | | 0.014336 | |
| March 6, 13, 20, and 27, 2012 | | March 28, 2012 | | | 0.014606 | |
| April 3, 10, 17, and 24, 2012 | | April 25, 2012 | | | 0.014606 | |
| May 1, 8, 15, 22 and 29, 2012 | | May 30, 2012 | | | 0.014606 | |
| June 5, 12, 19, and 26, 2012 | | June 27, 2012 | | | 0.014606 | |
| July 3, 10, 17, 24, and 31, 2012 | | August 1, 2012 | | | 0.014606 | |
| August 7, 14, 21 and 28, 2012 | | August 29, 2012 | | | 0.014606 | |
| September 4, 11, 18, and 25, 2012 | | September 26, 2012 | | | 0.014606 | |
On September 27, 2012, our board of directors declared a distribution of $0.014606 per share for nine record dates beginning October 2, 2012 and ending on November 27, 2012. The distributions will be paid to shareholders at the end of each month.
RESULTS OF OPERATIONS
RESULTS COMPARISONS FOR THE THREE MONTHS ENDED SEPTEMBER 30, 2012 AND 2011
Set forth below are our results of operations for the three months ended September 30, 2012 and September 30, 2011. Our portfolio investment activity commenced on July 1, 2011 and the three months of operations ending September 30, 2011 represented our initial full quarter of investment operations. Our investment portfolio growth since July 1, 2011 is due to growth in equity capital, and this rise in both capital available for investment and investment activity primarily accounted for the significant increases in investment income, operating expenses, net investment income and net assets between the comparative periods, as discussed below.
Investment income
Investment income for the three months ended September 30, 2012 was $11.48 million, consisting primarily of interest income. Incremental amounts of equity capital were deployed throughout the three-month period ended September 30, 2012 in the acquisition of portfolio investments as we received net proceeds from our Offering on a weekly basis. Our investment portfolio grew significantly during the three months ended September 30, 2012 and, accordingly, we believe that reported investment income for the three months ended September 30, 2012 is not representative of our stabilized performance or our future performance. We expect further increases in investment income in future periods due to (i) an increasing proportion of investments held for the entire period relative to incremental net investment activity during each quarter, and (ii) a growing base of portfolio company investments that we expect to result from the expected increases in equity capital available to us for investment purposes from our Offering. We generated investment income of $0.07 million in the three months ended September 30, 2011.
Operating expenses
Operating expenses, before Expense Support Payments and Reimbursement Payments, were $6.38 million for the three months ended September 30, 2012. Investment advisory fees and performance-based incentive fees totaled $4.09 million, or 64% of total operating expenses. Performance-based incentive fees were $1.39 million and this expense was directly attributable to our net realized gain and unrealized net appreciation of approximately $6.88 million in the three months ended September 30, 2012, since our accrual for incentive fees on capital gains tracks the overall changes in our realized and unrealized net gains. Furthermore, $0.80 million in additional operating expenses were incurred by the accrual of probable Reimbursement Payments for prior Expense Support Payments, resulting in net operating expenses of $7.18 million for the three months ended September 30, 2012. We incurred $0.35 million in total operating expenses for the three-month period ended September 30, 2011, of which 100% was then offset by Expense Support Payments.
We continued with a reimbursement rate of 0.75% of gross offering proceeds to reimburse for offering expenses incurred by the Advisors. During the three months ended September 30, 2012, we made reimbursement payments to the Advisors in the amount of $1.31 million which were capitalized as deferred offering expenses and then reduced through the amortization of offering expenses on the condensed consolidated statement of operations.
As of September 30, 2012, the weighted average interest rate for Tranche A, B and C Loans was 1.94%, 2.79% and 2.11%, respectively, exclusive of any unused commitment fees and the amortization of deferred financing costs related to establishing the credit facility. On a combined basis, the weighted average interest rate for the three months ended September 30, 2012, exclusive of any unused commitment fees and of other deferred financing costs related to establishing the credit facility, was 2.28%. For the three-month period ended September 30, 2012, we incurred total interest cost, including direct interest expense, unused commitment fees and amortization of deferred financing costs, of $0.92 million in connection with borrowings under the Tranche A, B and C Loans commitments, resulting in an all-in cost of financing of 2.69%. We did not have any amounts outstanding under the revolving credit facility during the three-month period ended September 30, 2011. (See “Note 11. Revolving Credit Facility and Borrowings” of our condensed consolidated financial statements for additional information regarding the revolving credit facility.)
We consider the following expense categories to be relatively stable in the near term: administrative services, directors’ fees and expenses, directors’ and officers’ insurance policy premiums, and a component of other operating expenses related to compliance services and investor services. Gradual increasing operating expenses include third-party custodian and accounting fees, sub-fund administration costs and revolving credit facility administration costs that are initially tied to minimum base fees coupled with contractual provisions that increase the compensation to these third party service providers as the consolidated asset base of our Company increases. Variable operating expenses that may increase and decrease over sequential periods include professional services (audit and legal services), investment advisory fees, performance-based incentive fees, and interest expense. Step-up increasing operating expenses include transfer agency services, administrative transfer agency support services, and shareholder reporting services which will increase with the growth in our shareholder base. We expect certain operating expenses to continue to increase at a faster rate relative to fixed operating costs, either in connection with the growth in (i) the leveraged asset base (investment advisory fees and interest expense), (ii) the number of open shareholder accounts (transfer agency services, transfer agency support services, and shareholder reporting services) or (iii) the complexity of our investment processes and portfolio holdings, the reporting on our financial condition and capital structure, and the arrangement of additional borrowing capacity (financial reporting, audit and professional legal services).
Net investment income
Net investment income was $4.30 million for the three months ended September 30, 2012, or approximately $0.11 per share. Net investment income before incentive fees was $5.69 million over the same period, or $0.15 per share. Net investment income and net investment income before incentive fees was $0.07 million for the three months ended September 30, 2011, or approximately $0.10 per share.
Net realized gain
Net realized gain of $0.45 million for the three months ended September 30, 2012 was the result of $0.48 million from realized gain on investments and $0.03 million in net realized loss on foreign currency transactions. Realized losses were negligible for the three months ended September 30, 2011.
Net unrealized appreciation or depreciation
For the three months ended September 30, 2012, there was an increase in net unrealized appreciation of $6.43 million, comprised of an increase in net unrealized appreciation on investments of $6.55 million and an increase in net unrealized depreciation on foreign currency translation $0.12 million. Market-wide price movements and valuations changes are not necessarily indicative of any fundamental change in the condition or prospects of our portfolio companies. For the three months ended September 30, 2011, there was net unrealized depreciation on investments of $0.28 million
Net increase in net assets resulting from operations
We recorded an increase in net assets resulting from operations for the three months ended September 30, 2012 of $11.18 million. The increase primarily reflects (i) the increase in net investment income, (ii) some modest lift from realized gains and (iii) a substantial increase in net assets attributable to the net unrealized appreciation for the three months ended September 30, 2012. We recorded a decrease in net assets resulting from operations for the three months ended September 30, 2011 of $0.21 million. The decrease primarily reflects (i) the increase in net investment income, and (ii) decrease in net assets attributable to the net unrealized depreciation for the three months ended September 30, 2011.
RESULTS COMPARISONS FOR THE NINE MONTHS ENDED SEPTEMBER 30, 2012 AND 2011
Investment income
We generated investment income of $21.11 million and $0.07 million for the nine months ended September 30, 2012, and September 30, 2011, respectively. Our investment income primarily consists of interest earned on senior and subordinated debt investments held in our portfolio. This comparative increase in investment income is due to the growth of our portfolio since commencing investment operations in July 2011. The level of interest income we receive is directly related to (i) our rate of investing equity capital and borrowed funds into the investment securities of portfolio companies, (ii) the weighted average balance of interest-bearing investments throughout the period, and (iii) the weighted average yield of our investments.
Operating expenses
Our total operating expenses were $12.72 million and $0.39 million for the nine months ended September 30, 2012 and 2011, respectively. Our operating expenses included $5.22 million and $0.04 million in base management fees attributed to the investment advisory services of CNL and KKR for the nine months ended September 30, 2012 and 2011, respectively. Our operating expenses also include administrative services expenses attributed to CNL of $0.58 million and $0.08 million for the nine months ended September 30, 2012 and 2011, respectively.
Our Advisors are eligible to receive incentive fees based on performance. We recorded incentive fee expense of $1.92 million for the nine months ended September 30, 2012. A significant portion of incentive fees on capital gains is accrued with respect to net unrealized appreciation in our investment portfolio, although no such incentive fee is actually payable by us with respect to such net unrealized appreciation unless and until the net unrealized appreciation is actually realized. The determination of the actual amount due and payable to the Advisors is conducted at the end of the calendar year The Advisors have not received any payment of incentive fees on capital gains since the inception of the Company.
We recorded interest expense of $1.75 million and $0.01 million for the nine months ended September 30, 2012 and 2011, respectively, in connection with borrowing under our revolving credit facility which became effective on August 23, 2011. Professional services expenses, primarily consisting of audit and legal fees, grew to $0.75 million in the nine months ended September 30, 2012 as compared to $0.06 million in the nine months ended September 30, 2011, reflecting (i) an increase in routine external audit services and (ii) legal services in connection with our SEC exemptive relief application and other corporate legal services.
As our asset base and number of investors have grown, our general and administrative expenses have increased accordingly, but at a slower rate compared to the growth rate in the asset base. We expect certain variable operating expenses to continue to increase because of the anticipated growth in the size of our asset base and the number of open shareholder accounts. During the nine months ended September 30, 2012, the ratio of operating expenses (excluding investment advisory fees, interest expense and reimbursement of organization and offering expenses) to average net assets was 1.91%. We generally expect operating expenses to remain relatively stable as a percentage of our total assets during periods of asset growth over the next several calendar quarters. Incentive fees and interest expense, among other things, may also increase or decrease our operating expenses in relation to our expense ratios relative to comparative periods depending on portfolio performance and changes in benchmark interest rates such as LIBOR, among other factors.
Expense Support Payments and Reimbursement Payments - Expense support payments were $1.59 million and $0.39 million for the nine months ended September 30, 2012 and 2011, respectively. The provisions of the Expense Support Agreement that provide for Expense Support Payments from the Advisors to us were not extended beyond June 30, 2012. (See “_Contractual Agreements, Expense Support Agreement, below for further details about the Expense Support Agreement.) Additionally, we accrued $0.83 million as probable Reimbursement Payment obligation relative to the cumulative Expense Support Payments of $3.0 million as of September 30, 2012. The Reimbursement Payment obligation, when combined with Other Operating Expenses, results in an Other Operating Expense ratio of 1.91% as a percentage of average weighted net assets as of September 30, 2012 on an annualized basis. (See “Note 6. Agreements and Related Party Transactions” included within our condensed consolidated financial statements for additional disclosures regarding the Expense Support Payments and Reimbursement Payments.)
Net investment income
Our net investment income totaled $9.15 million ($0.39 per share) and $0.07 ($0.27 per share) for the nine months ended September 30, 2012 and 2011, respectively.
Net realized gain
We sold investments and received principal payments of $100.73 million and $16.23 million, respectively, during the nine months ended September 30, 2012, from which we realized net gains of $1.75 million. Foreign currency transactions contributed an additional $0.01 million in realized gains. We sold investments of $0.03 million during the nine months ended September 30, 2011, from which we realized a negligible net loss.
Net unrealized appreciation or depreciation
For the nine months ended September 30, 2012, the net change in unrealized appreciation on investments totaled $8.07 million and the net change in unrealized depreciation on foreign currency translation totaled $0.25 million. This change in unrealized appreciation on investments was primarily driven by the market appreciation, including tighter credit spreads, as reflected in several investment positions held in our portfolio. For the nine months ended September 30, 2011, the net change in unrealized depreciation on investments was $0.28 million. There was no net change in unrealized depreciation on foreign currency translation.
Net increase in net assets resulting from operations
For the nine months ended September 30, 2012, the net increase in net assets resulting from operations was $18.73 million compared to a net decrease in net assets resulting from operations of $0.21 million during the nine months ended September 30, 2011.
Net Assets, Net Asset Value per Share and Total Investment Returns
Net assets increased $384.83 million during the nine-month period ended September 30, 2012. The most significant increase in net assets during the nine months ended September 30, 2012 was attributable to the new issuance of shares of common stock and reinvestment of distributions, net of share repurchases, in the combined amount of $379.26 million. Net investment income contributed $9.15 million to the growth in net assets during the nine months ended September 30, 2012. Other increases in net assets were attributable to (i) unrealized appreciation on investments of $7.82 million and (ii) net realized gains of $1.76 million. Distributions to shareholders in the amount of $13.16 million contributed to a reduction in net assets in the nine months ended September 30, 2012.
Net assets increased $15.20 million during the nine-month period ended September 30, 2011. The most significant increase in net assets during the nine months ended September 30, 2011 was attributable to the new issuance of shares of common stock and reinvestment of distributions in the combined amount of $15.54 million. Net investment income contributed $0.07 million to the growth in net assets during the nine months ended September 30, 2011. Unrealized depreciation on investments of $0.28 million and distributions to shareholders in the amount of $0.13 million contributed to a reduction in net assets in the nine months ended September 30, 2011.
Our net asset value per share was $9.21 and $9.78 on December 31, 2011 and September 30, 2012, respectively. After considering (i) the overall changes in net asset value per share, (ii) paid distributions of approximately $0.57 per share in the nine months ended September 30, 2012, and (iii) the assumed reinvestment of those distributions at 90% of the prevailing offering price per share, then the total investment return was 12.5% (not annualized) for shareholders who held our shares over the nine month period ending September 30, 2012.
Initial shareholders participating in the Offering with an initial investment of $10,000 and an initial purchase price equal to $9.00 per share (public offering price net of sales load) have seen the value of their investment grow by 19.8% (see chart below), or an annualized return of 15.0%. Initial shareholders participating in the Offering with an initial investment of $10,000 and an initial purchase price equal to $10.00 per share (the initial public offering price) have registered a total investment return of 7.9%, or an annualized return of 6.0%. Over the same time period the S&P/LSTA Leveraged Loan Index, a primary measure of senior debt covering the U.S. leveraged loan market which currently consists of approximately 1,100 credit facilities throughout numerous industries, and the Merrill Lynch US High Yield Master II Index, a primary measure of subordinated debt consisting of approximately 2,000 high yield corporate bonds, had total returns of approximately 7.0% and 11.9% respectively.
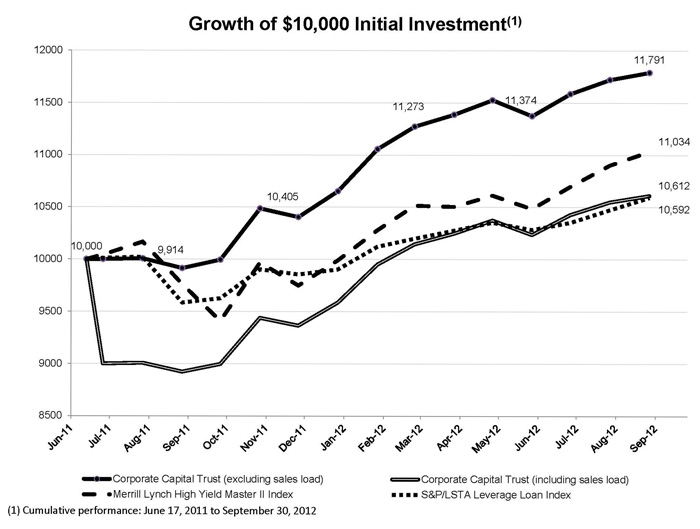
Our shares are illiquid investments for which there is not a secondary market, and we do not expect a secondary market in our shares to develop in the future. You should not expect to be able to resell your shares regardless of how we perform. If you are able to sell your shares, you will likely receive less than your purchase price. Our net asset value and annualized return — which are based upon determinations of fair value by our board of directors, not active market quotations — are inherently uncertain. Past performance is not a guarantee of future results.
Capital Stock Activity
The number of shares outstanding of our common stock increased by 38.94 million shares during the nine months ended September 30, 2012, including shares sold in our Offering and shares issued in connection with our distribution reinvestment plan. The public offering price was increased four times and it ranged between $10.25 per share to $10.95 per share during the nine months ended September 30, 2012. As of September 30, 2012, the net offering price (net of sales load) was $9.855 per share. Net asset value was $9.78 per share on September 30, 2012, or 99.2% of the net public offering price.
On July 9, 2012, the Company commenced its quarterly share repurchase program and filed its tender offer statement with the SEC on Schedule TO. The Company offered to repurchase up to 236,604 shares of common stock at a cash price of $9.64 per share and its offer was made upon the terms and subject to the conditions set forth in the Offer to Purchase. The Company repurchased 47,481 shares for consideration of $457,720.
OFF-BALANCE SHEET ARRANGEMENTS
We had no off-balance sheet arrangements as of September 30, 2012.
CONTRACTUAL OBLIGATIONS
Investment Advisory Agreements –We have entered into the Investment Advisory Agreement with CNL for the overall management of our investment activities. We and CNL have also entered into the Sub-Advisory Agreement with KKR, under which KKR is responsible for the day-to-day management of our investment portfolio. Pursuant to the Investment Advisory Agreement, CNL earns a management fee equal to an annual rate of 2% of our average gross assets, and an incentive fee based on our performance. The incentive fee is comprised of the following two parts: (i) a subordinated incentive fee on pre-incentive fees net investment income, and (ii) an incentive fee on capital gains. CNL compensates KKR for advisory services that it provides to us with 50% of the fees that CNL receives under the Investment Advisory Agreement.
The terms of the Investment Advisory Agreement entitle CNL (and indirectly KKR) to receive up to 5% of gross proceeds in connection with the Offering as reimbursement for organization and offering expenses incurred by the Advisors on our behalf. The Advisors waived our requirement to reimburse them for organization and offering expenses for the period from June 17, 2011 through January 31, 2012. The waiver of the reimbursement requirements did not reduce the amount of organization and offering expenses incurred by the Advisors that are eligible for reimbursement in future periods. Beginning February 1, 2012, we implemented an expense reimbursement rate equal to 0.75% of gross offering proceeds to initiate the reimbursement of organization and offering expenses incurred by the Advisors. As of September 30, 2012, the Advisors have been reimbursed in the amounts of $0.90 million for organization expenses and $2.03 million for offering expenses. As of September 30, 2012, the Advisors carried a balance of approximately $4.48 million for offering expenses incurred on our behalf, net of (i) incremental offering expenses incurred by the Advisors on our behalf and (ii) our reimbursement payments to the Advisors and any payable balances for reimbursement of offering expense.
We will continue to reimburse the Advisors for offering expenses in connection with gross proceeds raised under the Offering only to the extent that the reimbursement payments would not cause the total organization and offering expenses borne by us to exceed 5% of the aggregate gross proceeds from our Offering. The Advisors continue to be responsible for the payment of our offering expenses to the extent they exceed 5% of the aggregate gross proceeds from the Offering, without recourse against or reimbursement by us.
See “Note 6 Agreements and Related Party Transactions” in our condensed consolidated financial statements for expanded discussion of the Investment Advisory Agreements.
Expense Support Agreement -We are party to an Expense Support and Conditional Reimbursement Agreement with CNL and KKR (as amended, the “Expense Support Agreement”) pursuant to which CNL and KKR jointly and severally agreed to reimburse us for a specified percentage of our operating expenses (an “Expense Support Payment”) during the Expense Support Payment Period beginning on June 17, 2011. On December 16, 2011, the Company and the Advisors amended the Expense Support Agreement, effective January 1, 2012, to extend the terminal date of the Expense Support Payment Period from December 31, 2011 to March 31, 2012 and reduced the operating expense reimbursement ratio from 100% to 65% of our operating expenses. This amendment also redefined Operating Expenses as all costs and expenses paid or incurred by us, as determined under GAAP, including base advisory fees payable pursuant to the Investment Advisory Agreement, and excluding (i) incentive advisory fees payable pursuant to the Investment Advisory Agreement, (ii) offering and organization expenses, and (iii) all interest costs related to indebtedness for such period. On March 16, 2012, we and the Advisors entered into an amendment and restatement of the Expense Support Agreement, effective April 1, 2012, that extended the terminal date of the Expense Support Payment Period to June 30, 2012 and reduced the operating expense reimbursement ratio from 65% to 25%. As of September 30, 2012, the Advisors had incurred $3.0 million of Expense Support Payments. The Advisors’ commitment to make Expense Support Payments was not extended beyond June 30, 2012.
During the term of the Expense Support Agreement, the Advisors are entitled to an annual year-end reimbursement payment by us for unreimbursed Expense Support Payments made under the Agreement (a “Reimbursement Payment”), but such Reimbursement Payments may only be made within three years after the calendar year in which such Expense Support Payments are made. No Reimbursement Payment may be paid by us to the extent that it would cause our Other Operating Expenses (Other Operating Expenses is equal to Operating Expenses, but excluding base advisory fees and including a Reimbursement Payment) to exceed 1.91% of average net assets attributable to common shares as of the calendar year-end. The Expense Support Agreement also states that in no event shall we be required to make any Reimbursement Payment prior to January 1, 2013. As of September 30, 2012 we have accrued $0.83 million for probable Reimbursement Payment obligation. As a result, the Other Operating Expense-to-average net asset ratio is equal to 1.91% as of September 30, 2012, annualized. The Company records the liability for the Reimbursement Payments based on a hypothetical liquidation of its investment portfolio at the end of each reporting period. Management believes that additional liabilities for Reimbursement Payments are not probable as of September 30, 2012. Management continues to periodically assess the likelihood of whether additional Reimbursement Payments are probable.
The Expense Support Agreement will automatically terminate in the event of (a) the termination by us of either our Investment Advisory Agreement or our Sub-Advisory Agreement, or (b) our dissolution or liquidation. If the Expense Support Agreement is terminated due to termination of the Investment Advisory Agreement or the Sub-Advisory Agreement, then we must make a Reimbursement Payment to the Advisors, pro rata based on the aggregate unreimbursed Expense Support Payments made by each Advisor.
Revolving Credit Facility –As discussed above under “Financial Condition, Liquidity and Capital Resources – Credit Facility,” CCT Funding has entered into a revolving credit facility with Deutsche Bank. The credit facility provides for borrowings in an aggregate amount up to $240 million on a committed basis. As of September 30, 2012, $160.92 million was borrowed and outstanding under the credit facility. (See “— Liquidity and Capital Resources — Credit Facility” above and “Note 11. Revolving Credit Facility and Borrowings” in our condensed consolidated financial statements for expanded discussion of the revolving credit facility.)
A summary of our significant contractual payment obligations for the repayment of outstanding borrowings and interest expense and other fees related to the credit facility at September 30, 2012 is as follows:
| | | | | | | | | | | | | | | | |
| | Total | | < 1 year | | 1-3 years | | 3-5 years | | After 5 years | |
Revolving Credit Facility (1) | | $ | 160.92 | | | $ | 160.92 | | | $ | — | | | $ | — | | | $ | — | |
Interest and Credit Facility Fees Payable | | | 0.24 | | | | 0.24 | | | | — | | | | — | | | | — | |
| | (1) | At September 30, 2012 our unused commitment amount of Tranche B Loans was $14.08 million under our revolving credit facility. |
| Quantitative and Qualitative Disclosures about Market Risks |
We are subject to financial market risks, in particular changes in interest rates. Future changes in interest rates will likely have effects on the interest income we earn on our portfolio investments, the fair value of our fixed income investments, the interest rates and interest expenses associates with the money we borrow for investment purposes, and the fair value of loan balances.
Subject to the requirements of the 1940 Act, we may hedge against interest rate fluctuations by using standard hedging instruments such as futures, options and forward contracts. Although hedging activities may insulate us against adverse changes in interest rates, they may also limit our ability to participate in the benefits of lower interest rates. During the period from January 1, 2012 to September 30, 2012, we did not engage in interest rate hedging activities.
Interest Rates: Assets
As of September 30, 2012, approximately 42.7% of our portfolio of debt investments, or approximately $254.97 million measured at fair value, featured floating or variable interest rates. The variable interest rate investments are usually based on a floating LIBOR (the base rate) and typically have durations of three months after which the base rates are reset to current market interest rates. At September 30, 2012, approximately 81.8% of our portfolio of variable interest rate debt investments, or approximately $208.63 million measured at fair value, featured minimum base rates, or base rate floors, and the weighted average base rate floor for such investments was 1.49%. Variable interest rate investments that feature a base rate floor generally reset to the current base rate only if the reset base rate exceeds the base rate floor on the applicable interest reset date, in which cases we may benefit through an increase in interest income from such investments after the interest reset date.
At September 30, 2012, we held an aggregate investment position of $46.34 million at fair value in variable interest rate debt investments that featured variable interest rates without any minimum base rates, or approximately 18.2% of our portfolio of variable interest rate debt investments. In the case of these “no base floor” variable interest debt investments held in our portfolio, we may benefit from increases in the base rates that may subsequently result in an increase in interest income after the interest reset date.
Assuming that the condensed consolidated schedule of investments as of September 30, 2012 was to remain constant with regards to the investment portfolio and no actions were taken to alter the existing interest rate sensitivity or investment portfolio allocations, the table below presents an estimated and hypothetical increase in interest income due to an immediate and persistent 12-month increase in the base rates associated with our debt investments featuring variable interest rates.
| | | | | | | | | | | | | | | | | | |
| | | Par Amount | | Weighted Avg. Floor | Increases in Short-Term LIBOR | |
($ in millions except per share data) | | | + 50 bps | | + 100 bps | | + 150 bps | | + 200 bps | |
| | | | | | | | | | | | | | | | | | |
No base rate floor | | $ | 46.73 | | | $ | 0.210 | | $ | 0.420 | | $ | 0.630 | | $ | 0.839 | |
Base rate floor | | $ | 210.92 | | 1.49% | | 0.000 | | | 0.093 | | | 0.795 | | | 1.665 | |
Increase in Floating Rate Interest Income | | | | | | | 0.210 | | | 0.513 | | | 1.425 | | | 2.504 | |
| | | | | | | | | | | | | | | | | | |
| | | | | | LIBOR + Spread | | | | | | | | | | | | |
Tranche A Loans | | $ | 75.00 | | L(30) + 170 bps | $ | (0.375 | ) | $ | (0.750 | ) | $ | (1.125 | ) | $ | (1.500 | ) |
Tranche B Loans | | $ | 85.92 | | L(90) + 235 bps | | (0.430 | ) | | (0.859 | ) | | (1.289 | ) | | (1.718 | ) |
Increase to Floating Rate Interest Expense | | | | | | | (0.805 | ) | | (1.609 | ) | | (2.414 | ) | | (3.218 | ) |
| | | | | | | | | | | | | | | | | | |
Change in Floating Rate Net Interest Income | | | | | | $ | (0.595 | ) | $ | (1.096 | ) | $ | (0.989 | ) | $ | (0.713 | ) |
| Change in Floating Rate Net Interest Income per share outstanding as of September 30, 2012 | | | | | | $ | (0.01 | ) | $ | (0.02 | ) | $ | (0.02 | ) | $ | (0.02 | ) |
In addition, any fluctuations in prevailing interest rates may affect the fair value of our fixed rate debt instruments and result in changes in unrealized gains and losses, and may affect a net increase or decrease in net assets resulting from operations. Such changes in unrealized appreciation and depreciation will materialize into realized gains and losses if we are compelled to sell our investments before the debt maturity date.
Although management believes that this analysis and presentation is indicative of our interest income sensitivity to interest rate changes in relation to our assets as of September 30, 2012, it does not adjust for potential changes in the credit market, credit quality, size and composition of the assets on the consolidated statements of assets and liabilities and other business developments that could affect net investment income and net increases in net assets resulting from operations. Accordingly, no assurances can be given that actual results would not differ materially from the estimates above. Additionally, an increase in interest rates and interest income should make it easier for us to meet or exceed our quarterly preferred return that triggers the quarterly subordinated incentive fee on income, as defined in our investment advisory agreement, and may result in a substantial increase in our net investment income and the amount of incentive fees payable to our Advisors with respect to an increase in pre-incentive fee net investment income.
Interest Rates: Liabilities (Borrowings)
Because we borrow money to make investments, our net investment income is partially dependent upon the difference between the interest rate at which we invest borrowed funds and the interest rate at which we borrow funds. In periods of rising interest rates and when we have borrowed capital with floating interest rates, then our interest expense would increase, which could increase our financing costs and reduce our net investment income, especially to the extent we continue to acquire and hold fixed-rate debt investments. As a result, there can be no assurance that a significant change in market interest rates will not have a material adverse effect on our net investment income. Pursuant to the terms of our revolving credit facility agreement as discussed above (see “— Financial Condition, Liquidity and Capital Resources — Credit Facility”), as of September 30, 2012, CCT Funding borrows at a floating base rate of (i) 30-day LIBOR plus 1.70% for Tranche A Loans ($75.0 million loan balance outstanding), (ii) 90-day LIBOR plus 2.35% for Tranche B Loans ($85.92 million loan balance outstanding and $14.08 million unused commitment) and (iii) 90-day LIBOR plus 1.70% for Tranche C Loans ($65.00 million unused commitment). Therefore, if we were to completely draw down the unused Trance B Loans commitment and the maximum Tranche C Loans amount, we expect that our weighted average direct interest cost will decrease by approximately 5 basis points, as compared to our current weighted average direct interest cost for borrowed funds, assuming no change in the interest rate margin applicable to Tranche C Loans. We expect that any expansion of the current revolving credit facility, or any future credit facilities that we or any subsidiary may enter into, will also be based on a floating base rate. As a result, we are subject to continuous risks relating to changes in market interest rates.
The exhibit above also presents sensitivity analysis for a persistent 12-month increase in the base interest rates that apply to our floating rate credit facility and the associated increase in interest expense. For persistent LIBOR increases of less than 100 basis points, the increase in interest expense may be partially offset by the hypothetical increase in interest income associated with our floating rate debt investments; for a persistent LIBOR increase greater than 150 basis points, then the increase in interest expense may be wholly offset by the hypothetical increase in interest income associated with our floating rate debt investments, in both cases assuming that the condensed consolidated schedule of investments as of September 30, 2012 was to remain constant with regards to the investment portfolio and no actions were taken to alter the existing interest rate sensitivity or investment portfolio allocations.
Evaluation of Disclosure Controls and Procedures
Pursuant to Rule 13a-15(b) under the Exchange Act of 1934, under the supervision and with the participation of our management, including our principal executive officer and principal financial officer, we conducted an evaluation of the effectiveness of our disclosure controls and procedures (as defined under Rule 13a-15(e) under the Exchange Act) as of the end of the period covered by this report. Based upon that evaluation, our management, including our principal executive officer and principal financial officer, concluded that our disclosure controls and procedures are effective as of the end of the period covered by this report.
We believe, however, that a controls system, no matter how well designed and operated, cannot provide absolute assurance that the objectives of the controls systems are met, and no evaluation of controls can provide absolute assurance that all control issues and instances of fraud or error, if any, within a company have been detected.
Changes in Internal Control over Financial Reporting
In the most recent fiscal quarter, there was no change in our internal controls over financial reporting (as defined under Rule 13a-15(f) under the Exchange Act) that has materially affected, or is reasonably likely to materially affect, our internal controls over financial reporting.
| Unregistered Sales of Equity Securities and Use of Proceeds - None |
| Defaults Upon Senior Securities - None |
| Mine Safety Disclosures – Not applicable |
The exhibits required by this item are set forth in the Exhibit Index attached hereto and are filed or incorporated as part of this report.
Pursuant to the requirements of the Securities Exchange Act of 1934, as amended, the registrant has duly caused this report to be signed on its behalf by the undersigned thereunto duly authorized, on the 14th day of November, 2012.
| | | |
| | CORPORATE CAPITAL TRUST, INC. |
| | | |
| | By: | /s/ Andrew A. Hyltin | |
| | | ANDREW A. HYLTIN |
| | | Chief Executive Officer |
| | | (Principal Executive Officer) |
| | | |
| | By: | /s/ Paul S. Saint-Pierre | |
| | | PAUL S. SAINT-PIERRE |
| | | Chief Financial Officer |
| | | (Principal Financial Officer) |
The following exhibits are filed or incorporated as part of this report.
| | 3.1 | Second Amended and Restated Articles of Incorporation of the Registrant. (Incorporated by reference to Exhibit 3.1 to the Company’s current report on Form 8-K filed on May 8, 2012.) |
| | 3.2 | Amended and Restated Bylaws of the Registrant. (Incorporated by reference to Exhibit 2(b) filed with Amendment No. 3 to the Company’s registration statement on Form N-2 (File No. 333-167730) filed on March 29, 2011.) |
| | 10.1 | Form of Managing Dealer Agreement by and between Registrant and CNL Securities Corp. (Incorporated by reference to Exhibit 2(h)(1) filed with Amendment No. 2 to the Company’s registration statement on Form N-2 (File No. 333-167730) filed on February 18, 2011.) |
| | 10.2 | Form of Participating Broker Agreement. (Incorporated by reference to Exhibit 2(h)(2) filed with Amendment No. 2 to the Company’s registration statement on Form N-2 (File No. 333-167730) filed on February 18, 2011.) |
| | 10.3 | Form of Distribution Reinvestment Plan. (Incorporated by reference to Exhibit 2(e) filed with Amendment No. 2 to the Company’s registration statement on Form N-2 (File No. 333-167730) filed on February 18, 2011.) |
| | 10.4 | Intellectual Property License Agreement by and between Registrant and CNL Intellectual Properties, Inc. (Incorporated by reference to Exhibit 2(k)(3) filed with Amendment No. 2 to the Company’s registration statement on Form N-2 (File No. 333-167730) filed on February 18, 2011.) |
| | 10.5 | Administrative Services Agreement by and between the Registrant and CNL Fund Advisors Company. (Incorporated by reference to Exhibit 2(k)(2) filed with Amendment No. 3 to the Company’s registration statement on Form N-2 (File No. 333-167730) filed on March 29, 2011.) |
| | 10.6 | Custodian Agreement. (Incorporated by reference to Exhibit 2(j) filed with Amendment No. 3 to the Company’s registration statement on Form N-2 (File No. 333-167730) filed on March 29, 2011.) |
| | 10.7 | Investment Advisory Agreement by and between Registrant and CNL Fund Advisors Company. (Incorporated by reference to Exhibit 2(g)(1) filed with Amendment No. 3 to the Company’s registration statement on Form N-2 (File No. 333-167730) filed on March 29, 2011.) |
| | 10.8 | Sub-Advisory Agreement by and among the Registrant, CNL Fund Advisors Company and KKR Asset Management LLC. (Incorporated by reference to Exhibit 2(g)(2) filed with Amendment No. 3 to the Company’s registration statement on Form N-2 (File No. 333-167730) filed on March 29, 2011.) |
| | 10.9 | Amended and Restated Escrow Agreement by and among Registrant, UMB Bank N.A., and CNL Securities Corp. (Incorporated by reference to Exhibit 10.10 to the Company’s Quarterly Report on Form 10-Q filed on August 12, 2011.) |
| | 10.10 | Selected Dealer Agreement among the Registrant, CNL Securities Corp., CNL Fund Advisors Company, CNL Financial Group, LLC, KKR Asset Management LLC and Ameriprise Financial Services, Inc. (Incorporated by reference to Exhibit 10.12 to the Company’s Quarterly Report on Form 10-Q filed on November 10, 2011.) (Confidential portions of this exhibit have been omitted pursuant to a request for confidential treatment and filed separately with the SEC.) |
| | 10.11 | Limited Liability Company Agreement of CCT Funding LLC. (Incorporated by reference to Exhibit 10.13 to the Company’s Quarterly Report on Form 10-Q filed on November 10, 2011.) |
| | 10.12 | Credit Agreement between CCT Funding LLC and Deutsche Bank AG, New York Branch. (Incorporated by reference to Exhibit 10.14 to the Company’s Quarterly Report on Form 10-Q filed on November 10, 2011.) (Confidential portions of this exhibit have been omitted pursuant to a request for confidential treatment and filed separately with the SEC.) |
| | 10.13 | Custodial Agreement among the Registrant, CCT Funding LLC, Deutsche Bank AG, New York Branch and Deutsche Bank Trust Company Americas. (Incorporated by reference to Exhibit 10.15 to the Company’s Quarterly Report on Form 10-Q filed on November 10, 2011.) (Confidential portions of this exhibit have been omitted pursuant to a request for confidential treatment and filed separately with the SEC.) |
| | 10.14 | Asset Contribution Agreement between the Registrant and CCT Funding LLC. (Incorporated by reference to Exhibit 10.16 to the Company’s Quarterly Report on Form 10-Q filed on November 10, 2011.) |
| | 10.15 | Security Agreement between CCT Funding LLC and Deutsche Bank AG, New York Branch. (Incorporated by reference to Exhibit 10.17 to the Company’s Quarterly Report on Form 10-Q filed on November 10, 2011.) |
| | 10.16 | Investment Management Agreement between the Registrant and CCT Funding LLC. (Incorporated by reference to Exhibit 10.18 to the Company’s Quarterly Report on Form 10-Q filed on November 10, 2011.) |
| | 10.17 | First Amendment to Credit Agreement between CCT Funding LLC and Deutsche Bank AG, New York Branch. (Incorporated by reference to Exhibit 10.17 to the Company’s Annual Report on Form 10-K filed on March 16, 2012.) (Confidential portions of this exhibit have been omitted pursuant to a request for confidential treatment and filed separately with the SEC.) |
| | 10.18 | Amended and Restated Expense Support and Conditional Reimbursement Agreement by and among the Registrant, CNL Fund Advisors Company and KKR Asset Management LLC. (Incorporated by reference to Exhibit 10.18 to the Company’s Annual Report on Form 10-K filed on March 16, 2012.) |
| | 10.19 | Amendment No. 1 to Investment Advisory Agreement by and between Registrant and CNL Fund Advisors Company. (Incorporated by reference to Exhibit 10.19 to the Company’s Annual Report on Form 10-K filed on March 16, 2012.) |
| | 10.20 | Second Amendment to Credit Agreement between CCT Funding LLC and Deutsche Bank AG, New York Branch. (Incorporated by reference to Exhibit 10.1 to the Company’s Form 8-K filed on August 24, 2012.) (Confidential portions of this exhibit have been omitted pursuant to a request for confidential treatment and filed separately with the SEC.) |
55