Exhibit 1

MERGER OF FS INVESTMENT CORPORATION & CORPORATE CAPITAL TRUST Investor presentation JULY 23, 2018

All data in presentation as of 3/31/2018 unless otherwise stated 1. Assumes existing analyst coverage for FSIC and CCT continue for combined company 2. Sum of CCT and FSIC average daily trading volume (ADTV) as of 7/20/2018. NEAR TERM BENEFIT LONG TERM BENEFIT Increased scale & secondary market liquidity • Pro forma 2 nd largest publicly - traded BDC by total assets • Expanded equity research coverage to reach a broader set of investors 1 • Potential trading volume of ~$13M 2 per day provides path for greater institutional ownership • Provides framework to maximize economies of $18 billion platform and ultimately construct the industry’s largest public BDC Enhanced portfolio diversification • Expect to optimize usage of combined 30% capacity for non - eligible portfolio companies • Reduces pro forma concentration of top 10 holdings • Creates pro forma portfolio comprised of 221 portfolio companies with investments across 23 different industries Reduced operating expenses • Eliminates duplicative operating expenses • Larger asset base should lead to lower combined expense ratio Lower financing costs • Ability to consolidate existing borrowing facilities • Potential to improve access to debt capital markets • Reduced financing spreads have generally been available for larger BDCs STRATEGIC RATIONALE 2 Combination of FS Investment Corporation (FSIC) and Corporate Capital Trust (CCT) expected to generate significant value for both FSIC and CCT shareholders through enhanced portfolio diversification, potential improved secondary market liquidity and expected cost savings
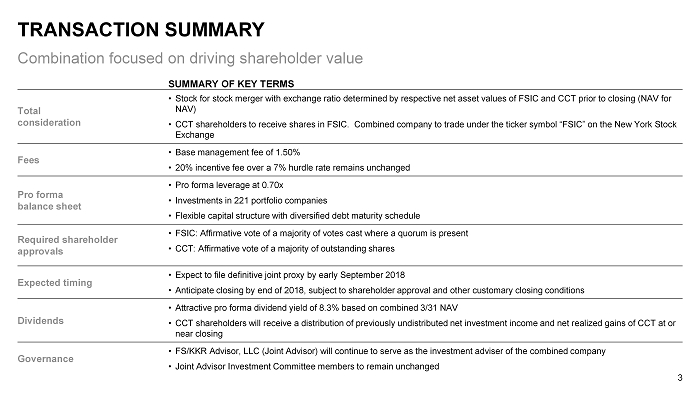
SUMMARY OF KEY TERMS Total consideration • Stock for stock merger with exchange ratio determined by respective net asset values of FSIC and CCT prior to closing (NAV fo r NAV) • CCT shareholders to receive shares in FSIC. Combined company to trade under the ticker symbol “FSIC” on the New York Stock Exchange Fees • Base management fee of 1.50% • 20% incentive fee over a 7% hurdle rate remains unchanged Pro forma balance sheet • Pro forma leverage at 0.70x • Investments in 221 portfolio companies • Flexible capital structure with diversified debt maturity schedule Required shareholder approvals • FSIC: Affirmative vote of a majority of votes cast where a quorum is present • CCT: Affirmative vote of a majority of outstanding shares Expected timing • Expect to file definitive joint proxy by early September 2018 • Anticipate closing by end of 2018, subject to shareholder approval and other customary closing conditions Dividends • Attractive pro forma dividend yield of 8.3% based on combined 3/31 NAV • CCT shareholders will receive a distribution of previously undistributed net investment income and net realized gains of CCT at or near closing Governance • FS/KKR Advisor, LLC (Joint Advisor) will continue to serve as the investment adviser of the combined company • Joint Advisor Investment Committee members to remain unchanged TRANSACTION SUMMARY 3 Combination focused on driving shareholder value

$12.7B $8.3B $5.9B $4.3B $4.1B $2.4B $2.3B $2.1B $2.B $1.9B $1.8B $0B $2B $4B $6B $8B $10B $12B $14B ARCC Combined Company PSEC CCT FSIC MAIN AINV NMFC CGBD TSLX GBDC SCALE: CREATES ONE OF THE LARGEST BDCS IN THE SECTOR 4 Public BDCs by total assets 1. Analyst coverage totals derived from publicly disclosed information on respective peer website; Combined company analyst coverage is sum of current FSIC and CCT analyst coverage Portfolio Companies 360 221 121 128 94 187 90 89 87 48 189 Analyst coverage 1 12 9 5 4 6 5 11 3 3 9 6

28.9% 6.0% 12.3% 3.9% 9.5% 4.2% 4.6% 6.3% 6.2% 5.7% 0.5% 11.9% Capital Goods Software & Services Commercial & Professional Services Diversified Financials Materials Consumer Durables & Apparel Retailing Health Care Equipment & Services Energy Consumer Services SCJV Automobiles & Components Other 14.7% 11.8% 2.8% 10.7% 4.7% 7.3% 6.4% 4.3% 2.2% 2.6% 7.6% 5.7% 19.2% 21.6% 9.0% 7.5% 7.4% 7.0% 5.8% 5.5% 5.3% 4.2% 4.1% 3.9% 3.2% 15.5% 65.2% 3.9% 4.3% 12.9% 1.4% 12.3% 1st Lien 2nd Lien Other Sr Secured Subordinated Debt Asset Based Finance SCJV Equity/other 38.6% 24.4% 4.9% 10.2% 9.6% 7.6% 4.7% 51.5% 14.4% 4.6% 11.6% 5.6% 3.9% 8.4% FSIC CCT Combined Company Number of Portfolio Companies 94 128 221 % Represented by Top 10 Issuers 1 35% 27% 19% Investments at Fair Value 2 $3,804 $3,992 $7,796 5 ENHANCES PORTFOLIO DIVERSIFICATION ASSET CLASS INDUSTRY 1. Excludes CCT’s Strategic Credit Opportunities Partners (SCJV) 2. $ in millions
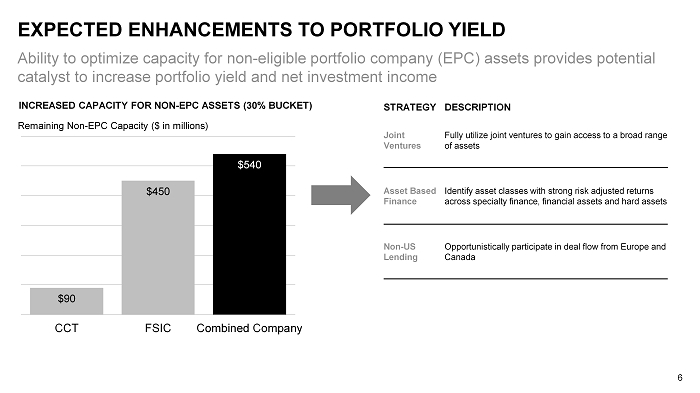
Ability to optimize capacity for non - eligible portfolio company (EPC) assets provides potential catalyst to increase portfolio yield and net investment income 6 EXPECTED ENHANCEMENTS TO PORTFOLIO YIELD $90 $450 $540 CCT FSIC Combined Company Remaining Non - EPC Capacity ($ in millions) INCREASED CAPACITY FOR NON - EPC ASSETS (30% BUCKET) STRATEGY DESCRIPTION Joint Ventures Fully utilize joint ventures to gain access to a broad range of assets Asset Based Finance Identify asset classes with strong risk adjusted returns across specialty finance, financial assets and hard assets Non - US Lending Opportunistically participate in deal flow from Europe and Canada
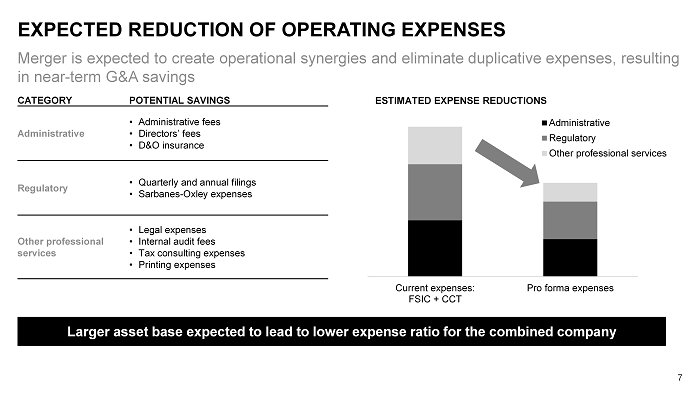
Merger is expected to create operational synergies and eliminate duplicative expenses, resulting in near - term G&A savings 7 EXPECTED REDUCTION OF OPERATING EXPENSES CATEGORY POTENTIAL SAVINGS Administrative • Administrative fees • Directors’ fees • D&O insurance Regulatory • Quarterly and annual filings • Sarbanes - Oxley expenses Other professional services • Legal expenses • Internal audit fees • Tax consulting expenses • Printing expenses Current expenses: FSIC + CCT Pro forma expenses ESTIMATED EXPENSE REDUCTIONS Administrative Regulatory Other professional services Larger asset base expected to lead to lower expense ratio for the combined company
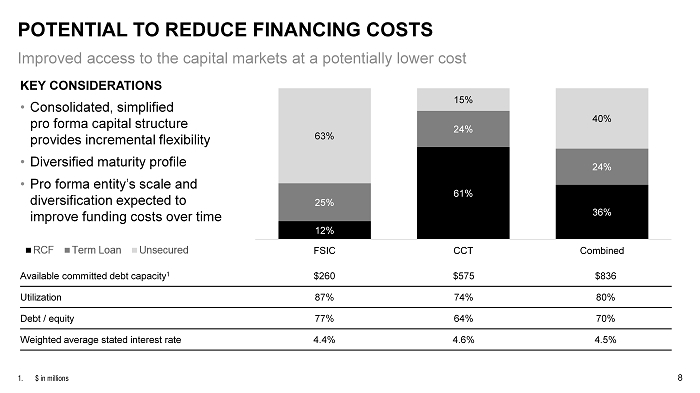
KEY CONSIDERATIONS • Consolidated, simplified pro forma capital structure provides incremental flexibility • Diversified maturity profile • Pro forma entity’s scale and diversification expected to improve funding costs over time POTENTIAL TO REDUCE FINANCING COSTS 8 1. $ in millions Improved access to the capital markets at a potentially lower cost 12% 61% 36% 25% 24% 24% 63% 15% 40% FSIC CCT Combined Available committed debt capacity 1 $260 $575 $836 Utilization 87% 74% 80% Debt / equity 77% 64% 70% Weighted average stated interest rate 4.4% 4.6% 4.5%
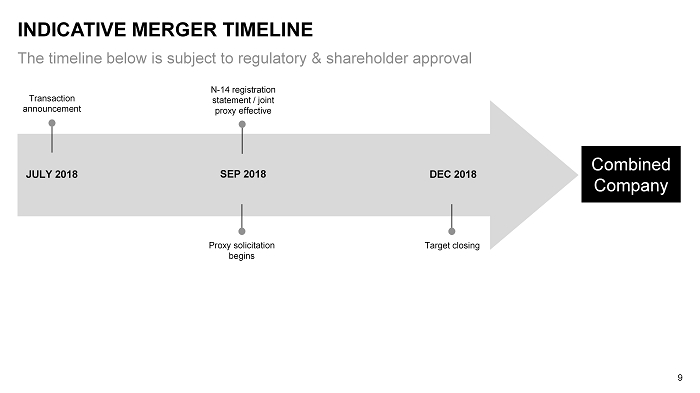
The timeline below is subject to regulatory & shareholder approval INDICATIVE MERGER TIMELINE 9 JULY 2018 Transaction announcement Proxy solicitation begins SEP 2018 DEC 2018 Target closing Combined Company N - 14 registration statement / joint proxy effective

Improved dividend coverage Increased portfolio yield Increased unsecured leverage Improved quality of earnings Reduced exposure to non - income producing equity Ability to utilize non - EPC capacity through exposure to SCJV EXPECTED FUND - SPECIFIC BENEFITS OF THE MERGER 10 CCT FSIC Increased scale and improved secondary market liquidity Enhanced portfolio diversification Reduced operating expenses Lower financing costs

11 APPENDIX
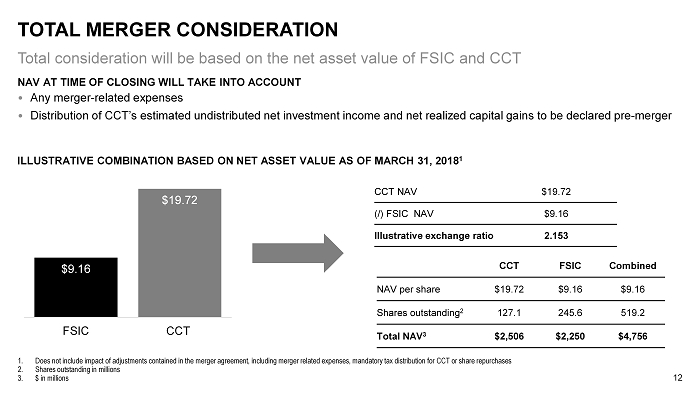
NAV AT TIME OF CLOSING WILL TAKE INTO ACCOUNT • Any merger - related expenses • Distribution of CCT’s estimated undistributed net investment income and net realized capital gains to be declared pre - merger TOTAL MERGER CONSIDERATION 12 Total consideration will be based on the net asset value of FSIC and CCT 1. Does not include impact of adjustments contained in the merger agreement, including merger related expenses, mandatory tax di str ibution for CCT or share repurchases 2. Shares outstanding in millions 3. $ in millions $9.16 $19.72 FSIC CCT CCT NAV $19.72 (/) FSIC NAV $9.16 Illustrative exchange ratio 2.153 ILLUSTRATIVE COMBINATION BASED ON NET ASSET VALUE AS OF MARCH 31, 2018 1 CCT FSIC Combined NAV per share $19.72 $9.16 $9.16 Shares outstanding 2 127.1 245.6 519.2 Total NAV 3 $2,506 $2,250 $4,756
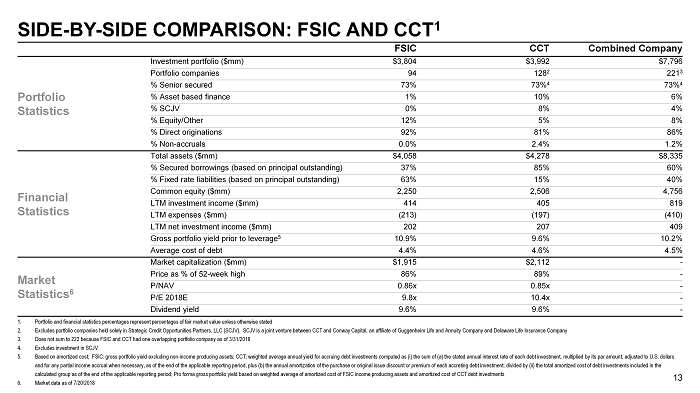
FSIC CCT Combined Company Portfolio Statistics Investment portfolio ($mm) $3,804 $3,992 $7,796 Portfolio companies 94 128 2 221 3 % Senior secured 73% 73% 4 73% 4 % Asset based finance 1% 10% 6% % SCJV 0% 8% 4% % Equity /Other 12% 5% 8% % Direct originations 92% 81% 86% % Non - accruals 0.0% 2.4% 1.2% Financial Statistics Total assets ($mm) $4,058 $4,278 $8,335 % Secured borrowings (based on principal outstanding) 37% 85% 60% % Fixed rate liabilities (based on principal outstanding) 63% 15% 40% Common equity ($mm) 2,250 2,506 4,756 LTM investment income ($mm) 414 405 819 LTM expenses ($mm) (213) (197) (410) LTM net investment income ($mm) 202 207 409 Gross portfolio yield prior to leverage 5 10.9% 9.6% 10.2% Average cost of debt 4.4% 4.6% 4.5% Market Statistics 6 Market capitalization ($mm) $1,915 $2,112 - Price as % of 52 - week high 86% 89% - P/NAV 0.86x 0.85x - P/E 2018E 9.8x 10.4x - Dividend yield 9.6% 9.6% - SIDE - BY - SIDE COMPARISON: FSIC AND CCT 1 13 1. Portfolio and financial statistics percentages represent percentages of fair market value unless otherwise stated 2. Excludes portfolio companies held solely in Strategic Credit Opportunities Partners, LLC (SCJV). SCJV is a joint venture bet wee n CCT and Conway Capital, an affiliate of Guggenheim Life and Annuity Company and Delaware Life Insurance Company 3. Does not sum to 222 because FSIC and CCT had one overlapping portfolio company as of 3/31/2018 4. Excludes investment in SCJV 5. Based on amortized cost; FSIC: gross portfolio yield excluding non - income producing assets; CCT: weighted average annual yield for accruing debt investments computed as (i) the sum of (a) the stated annual interest rate of each debt investment, multipl ied by its par amount, adjusted to U.S. dollars and for any partial income accrual when necessary, as of the end of the applicable reporting period, plus (b) the annual amor tiz ation of the purchase or original issue discount or premium of each accreting debt investment; divided by (ii) the total amor tiz ed cost of debt investments included in the calculated group as of the end of the applicable reporting period; Pro forma gross portfolio yield based on weighted average of amortized cost of FSIC income producing assets and amortized cost of CCT debt investments 6. Market data as of 7/20/2018
14 DISCLAIMER Forward - Looking Statements Statements included herein may constitute “forward - looking” statements as that term is defined in Section 27A of the Securities Act of 1933, as amended, and Section 21E of the Securities Exchange Act of 1934, as amended by the Private Securities Litigation Reform Act of 1995, including statements with regard to future events o r t he future performance or operations of FS Investment Corporation (“FSIC”) and Corporate Capital Trust, Inc. (CCT and together with FSIC, the “Funds”). Words such as “believes,” “expects,” “projects,” and “f uture” or similar expressions are intended to identify forward - looking statements. These forward - looking statements are subject to the inherent uncertainties in predicting future results and conditio ns. Certain factors could cause actual results to differ materially from those projected in these forward - looking statements. Factors that could cause actual results to differ materially include changes in t he economy, risks associated with possible disruption to a Fund’s operations or the economy generally due to terrorism or natural disasters, future changes in laws or regulations and conditions in a Fund’s op erating area, failure to obtain requisite shareholder approval for the Proposals (as defined below) set forth in the Proxy Statement (as defined below), failure to consummate the business combination transa cti on involving the Funds, the price at which shares of FSIC’s and CCT’s common stock trade on the New York Stock Exchange, uncertainties as to the timing of the consummation of the business combina tio n transaction involving the Funds, unexpected costs, charges or expenses resulting from the business combination transaction involving the Funds, and failure to realize the anticipated bene fit s of the business combination transaction involving the Funds. Some of these factors are enumerated in the filings the Funds made with the Securities and Exchange Commission (the “SEC”) and will also be co ntained in the Proxy Statement when such document becomes available. The inclusion of forward - looking statements should not be regarded as a representation that any plans, estimates or expectations will be achieved. Any forward - looking statements speak only as of the date of this communication. Except as required by federal securities laws, the Funds undertake no obligation to update or revise any for ward - looking statements, whether as a result of new information, future events or otherwise. Readers are cautioned not to place undue reliance on any of these forward - looking statements. Additional Information and Where to Find It This presentation relates to a proposed business combination involving the Funds, along with related proposals for which shar eho lder approval will be sought (collectively, the “Proposals”). In connection with the Proposals, the Funds intend to file relevant materials with the SEC, including a registration statement on Form N - 14, which will include a joint proxy statement of FSIC and CCT and a prospectus of FSIC (the “Proxy Statement”). This communication does not constitute an offer to sell or the solicitation of an offer to buy any s ecu rities or a solicitation of any vote or approval. No offer of securities shall be made except by means of a prospectus meeting the requirements of Section 10 of the Securities Act of 1933, as amended. SHAREHOLDERS O F THE FUNDS ARE URGED TO READ ALL RELEVANT DOCUMENTS FILED WITH THE SEC, INCLUDING THE PROXY STATEMENT WHEN IT BECOMES AVAILABLE, AS WELL AS ANY AMENDMENTS OR SUPPLEMEN TS THERETO, BECAUSE THEY WILL CONTAIN IMPORTANT INFORMATION ABOUT FSIC, CCT, THE BUSINESS COMBINATION TRANSACTION INVOLVING THE FUNDS AND THE PROPOSAL S. Investors and security holders will be able to obtain the documents filed with the SEC free of charge at the SEC’s web site, http://www.sec.gov, from FS Investme nt Corporation’s website at www.fsinvestmentcorp.com and Corporate Capital Trust, Inc.'s website at www.corporatecapitaltrust.com. Participants in the Solicitation The Funds and their respective directors, executive officers and certain other members of management and employees, including em ployees of FS/KKR Advisor, LLC, FS Investments, KKR Credit Advisors (US) LLC and their respective affiliates, may be deemed to be participants in the solicitation of proxies from the shareholde rs of the Funds in connection with the Proposals. Information regarding the persons who may, under the rules of the SEC, be considered participants in the solicitation of the Funds’ shareholders in connection wit h the Proposals will be contained in the Proxy Statement when such document becomes available. This document may be obtained free of charge from the sources indicated above.