
Building a Leading ENT / Allergy Specialty Company C o r p o r a t e P r e s e n t a t i o n N o v e m b e r 9 , 2 0 2 3 Exhibit 99.2
2 Forward-Looking Statements This presentation and our accompanying remarks contain “forward-looking statements” within the meaning of the U.S. Private Securities Litigation Reform Act of 1995. All statements that are not historical facts are hereby identified as forward-looking statements for this purpose and include, among others, statements relating to: the generation of XHANCE prescriptions and net revenues and factors impacting the generation of future prescriptions and net revenues; prescription, net revenue, prescriber and other business trends; potential effects of INS market seasonality on XHANCE prescriptions; potential early year effects on price and volume related to patient insurance; impact of payor utilization management criteria; commercial strategies; projected GAAP operating expenses (selling, general & administrative expenses and research & development expenses) and stock-based compensation for 2023; projected XHANCE net revenues for 2023; projected XHANCE average net revenue per prescription for 2023; impact of changes to XHANCE co-pay assistance program; the potential benefits of XHANCE for the treatment of chronic sinusitis; the potential for an FDA action on the sNDA in December 2023; the potential for XHANCE to be the first FDA-approved drug treatment for chronic rhinosinusitis and the potential market expansion opportunities and other benefits of obtaining such indication; our plan to seek a partner to promote XHANCE in primary care and the prospects for, and potential benefits of, such potential partnership; potential non-compliance with certain covenants under the A&R Pharmakon Note Purchase Agreement and the potential consequences thereof; and other statements regarding to our future operations, financial performance, prospects, intentions, strategies, objectives and other future events. Forward-looking statements are based upon management’s current expectations and assumptions and are subject to a number of risks, uncertainties and other factors that could cause actual results and events to differ materially and adversely from those indicated by such forward-looking statements including, among others: impact of, and the uncertainties caused by, physician and patient acceptance of XHANCE for its current and any potential future indication; our ability to maintain adequate third party reimbursement for XHANCE (market access) including any potential future indication; our ability to efficiently generate XHANCE prescriptions and net revenues; the prevalence of chronic sinusitis and market opportunities for XHANCE may be smaller than expected; unexpected costs and expenses; our ability to achieve our financial guidance; potential for varying interpretation of the results from the ReOpen Program; uncertainties related to the clinical development program and regulatory approval of XHANCE for the treatment of chronic rhinosinusitis; our ability to comply with the covenants and other terms of the A&R Pharmakon Note Purchase Agreement; our ability to continue as a going concern; risks and uncertainties relating to intellectual property; and the risks, uncertainties and other factors discussed in the “Risk Factors” section and elsewhere in our most recent Form 10-K and Form 10-Q filings with the Securities and Exchange Commission – which are available at http://www.sec.gov. As a result, you are cautioned not to place undue reliance on any forward-looking statements. Any forward-looking statements made in this presentation speak only as of the date of this presentation, and we undertake no obligation to update such forward-looking statements, whether as a result of new information, future developments or otherwise.
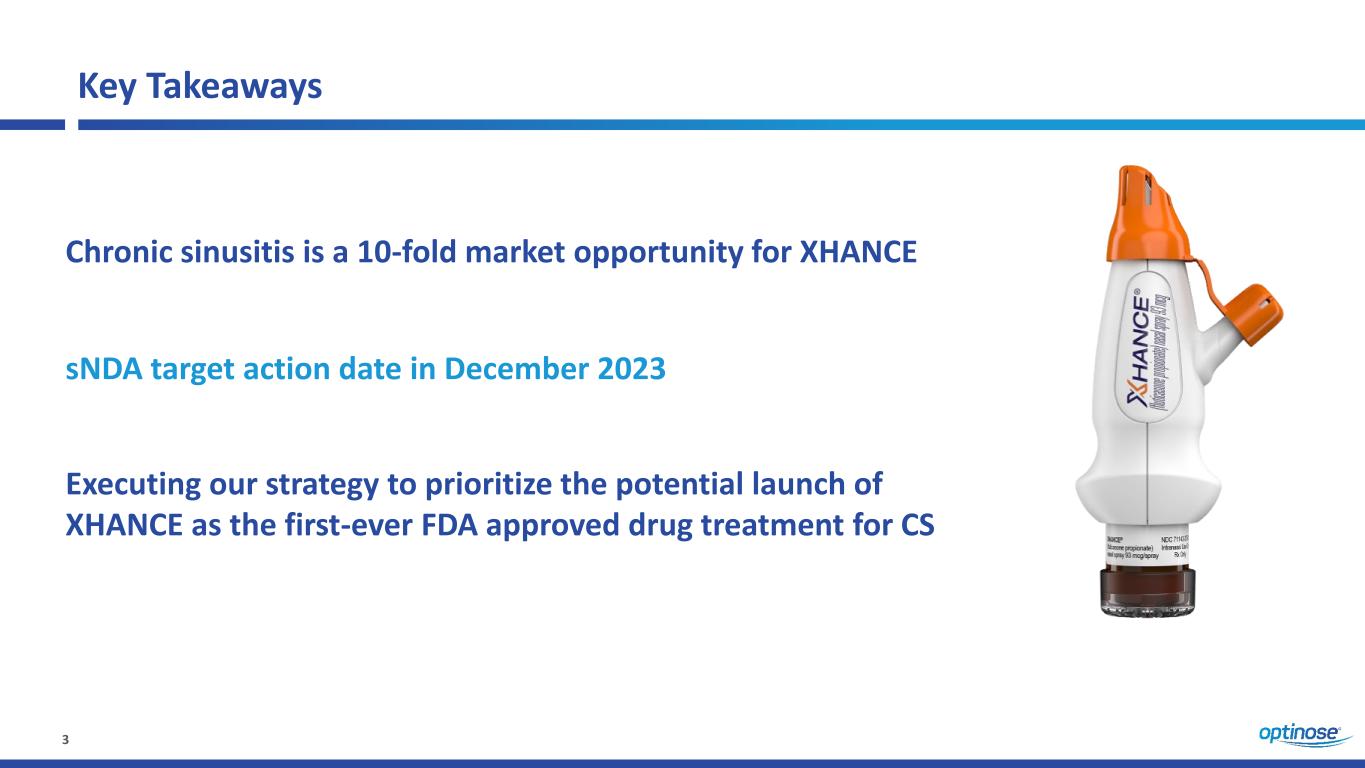
3 Key Takeaways Chronic sinusitis is a 10-fold market opportunity for XHANCE Executing our strategy to prioritize the potential launch of XHANCE as the first-ever FDA approved drug treatment for CS sNDA target action date in December 2023
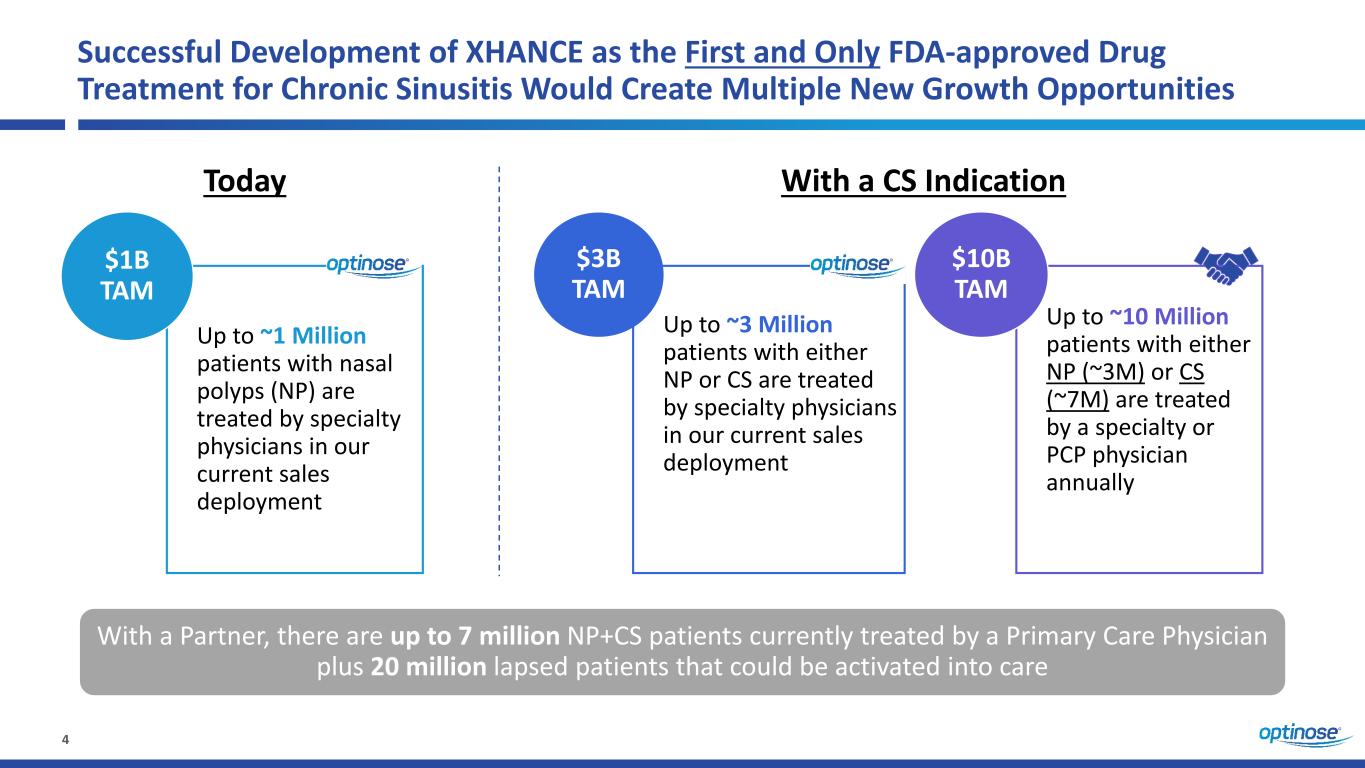
4 Successful Development of XHANCE as the First and Only FDA-approved Drug Treatment for Chronic Sinusitis Would Create Multiple New Growth Opportunities Up to ~1 Million patients with nasal polyps (NP) are treated by specialty physicians in our current sales deployment $1B TAM $3B TAM Up to ~10 Million patients with either NP (~3M) or CS (~7M) are treated by a specialty or PCP physician annually $10B TAM Today With a CS Indication Up to ~3 Million patients with either NP or CS are treated by specialty physicians in our current sales deployment With a Partner, there are up to 7 million NP+CS patients currently treated by a Primary Care Physician plus 20 million lapsed patients that could be activated into care
ReOpen Program Update
6 CS Supplemental NDA - Anticipated Next Steps FDA accepted for review our supplemental new drug application (sNDA) in pursuit of a new indication PDUFA target action date is December 16, 2023 - Standard review period was applied
Q3 2023 Performance
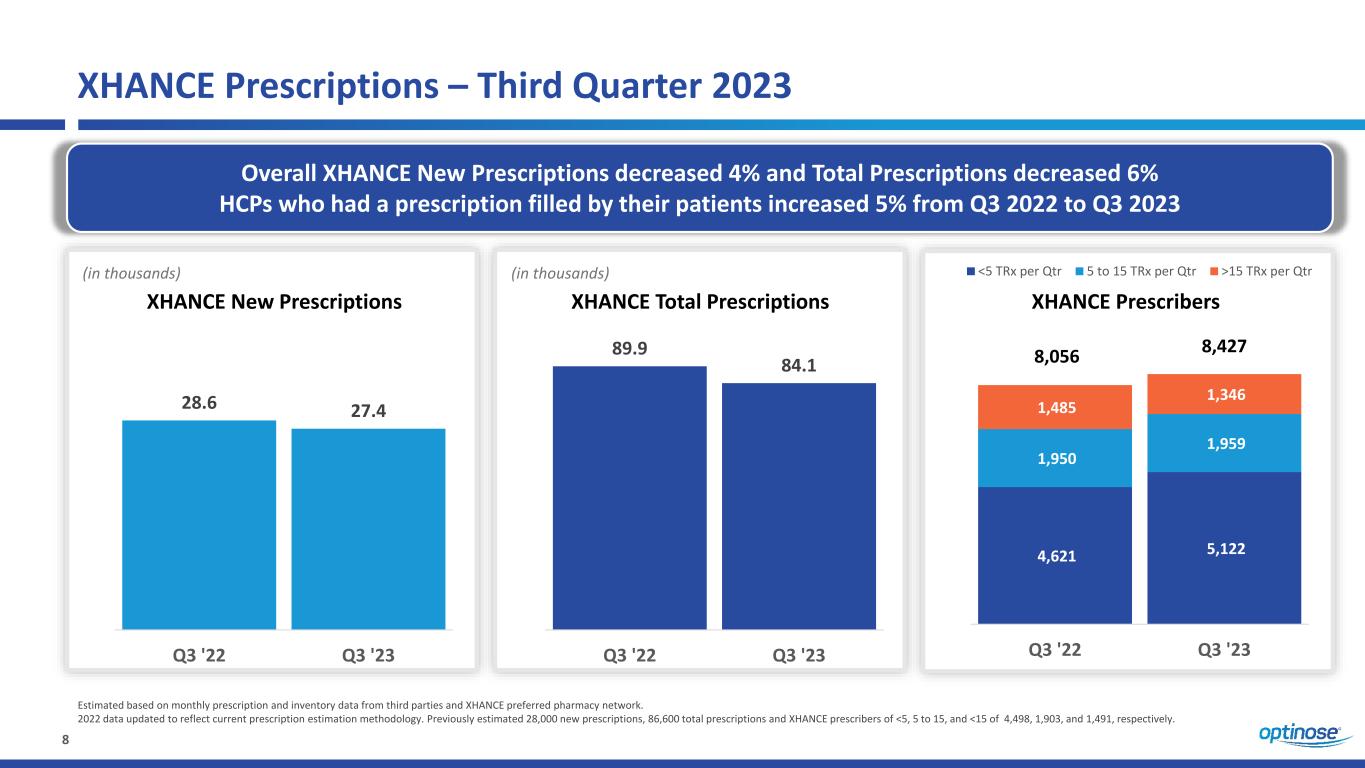
8 XHANCE Prescriptions – Third Quarter 2023 Overall XHANCE New Prescriptions decreased 4% and Total Prescriptions decreased 6% HCPs who had a prescription filled by their patients increased 5% from Q3 2022 to Q3 2023 28.6 27.4 Q3 '22 Q3 '23 (in thousands) XHANCE New Prescriptions 89.9 84.1 Q3 '22 Q3 '23 XHANCE Total Prescriptions (in thousands) XHANCE Prescribers 4,621 5,122 1,950 1,959 1,485 1,346 Q3 '22 Q3 '23 <5 TRx per Qtr 5 to 15 TRx per Qtr >15 TRx per Qtr Estimated based on monthly prescription and inventory data from third parties and XHANCE preferred pharmacy network. 2022 data updated to reflect current prescription estimation methodology. Previously estimated 28,000 new prescriptions, 86,600 total prescriptions and XHANCE prescribers of <5, 5 to 15, and <15 of 4,498, 1,903, and 1,491, respectively. 8,056 8,427
Q3 2023 Financial Update
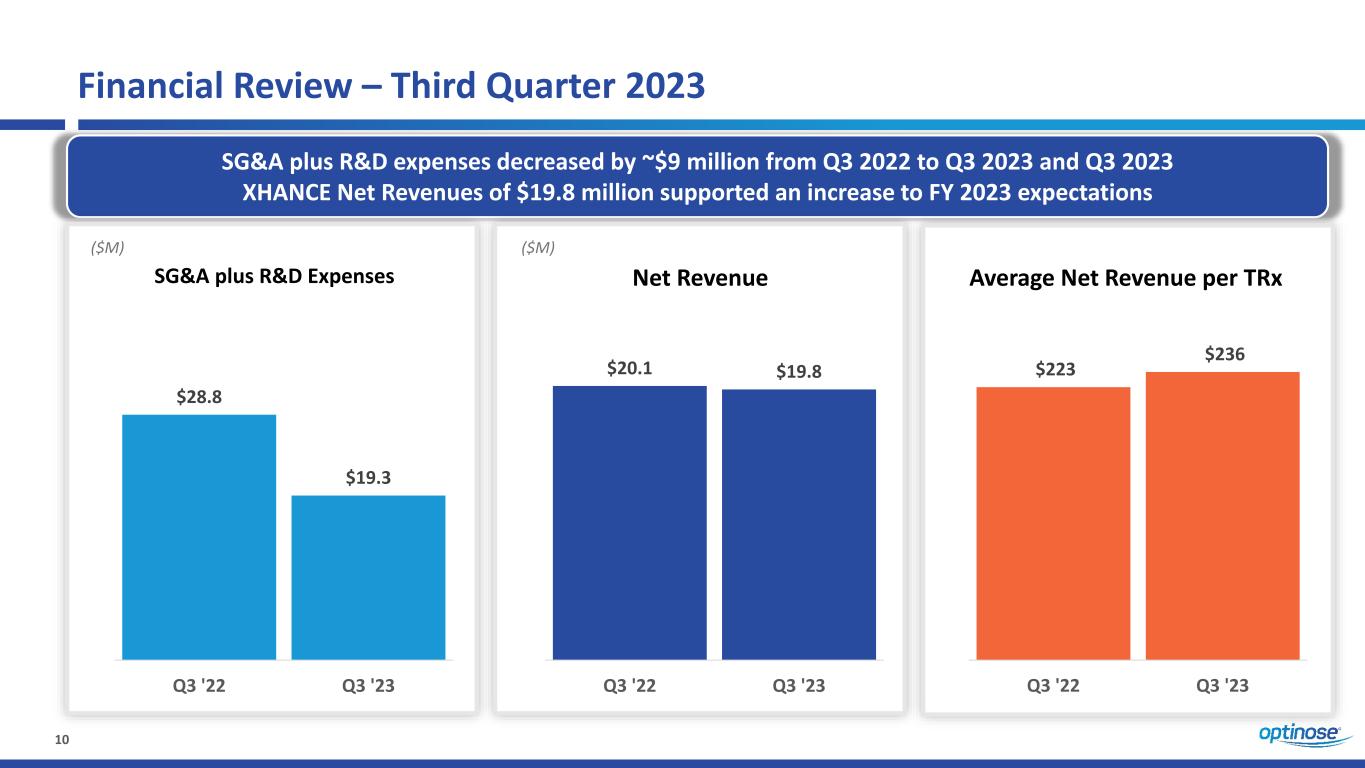
10 Financial Review – Third Quarter 2023 SG&A plus R&D expenses decreased by ~$9 million from Q3 2022 to Q3 2023 and Q3 2023 XHANCE Net Revenues of $19.8 million supported an increase to FY 2023 expectations $28.8 $19.3 Q3 '22 Q3 '23 ($M) SG&A plus R&D Expenses $20.1 $19.8 Q3 '22 Q3 '23 ($M) Net Revenue Average Net Revenue per TRx $223 $236 Q3 '22 Q3 '23

2023 Outlook
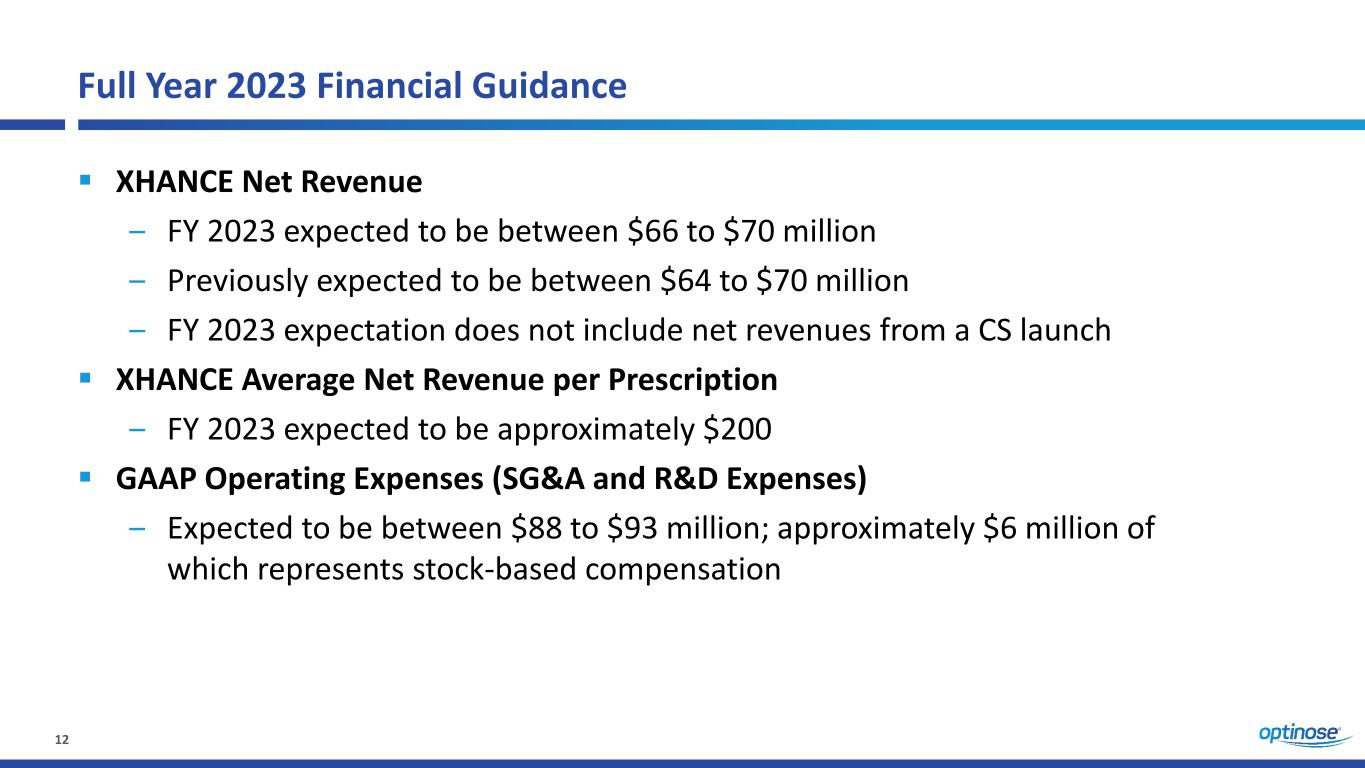
12 Full Year 2023 Financial Guidance XHANCE Net Revenue ‒ FY 2023 expected to be between $66 to $70 million ‒ Previously expected to be between $64 to $70 million ‒ FY 2023 expectation does not include net revenues from a CS launch XHANCE Average Net Revenue per Prescription ‒ FY 2023 expected to be approximately $200 GAAP Operating Expenses (SG&A and R&D Expenses) ‒ Expected to be between $88 to $93 million; approximately $6 million of which represents stock-based compensation
Closing Remarks
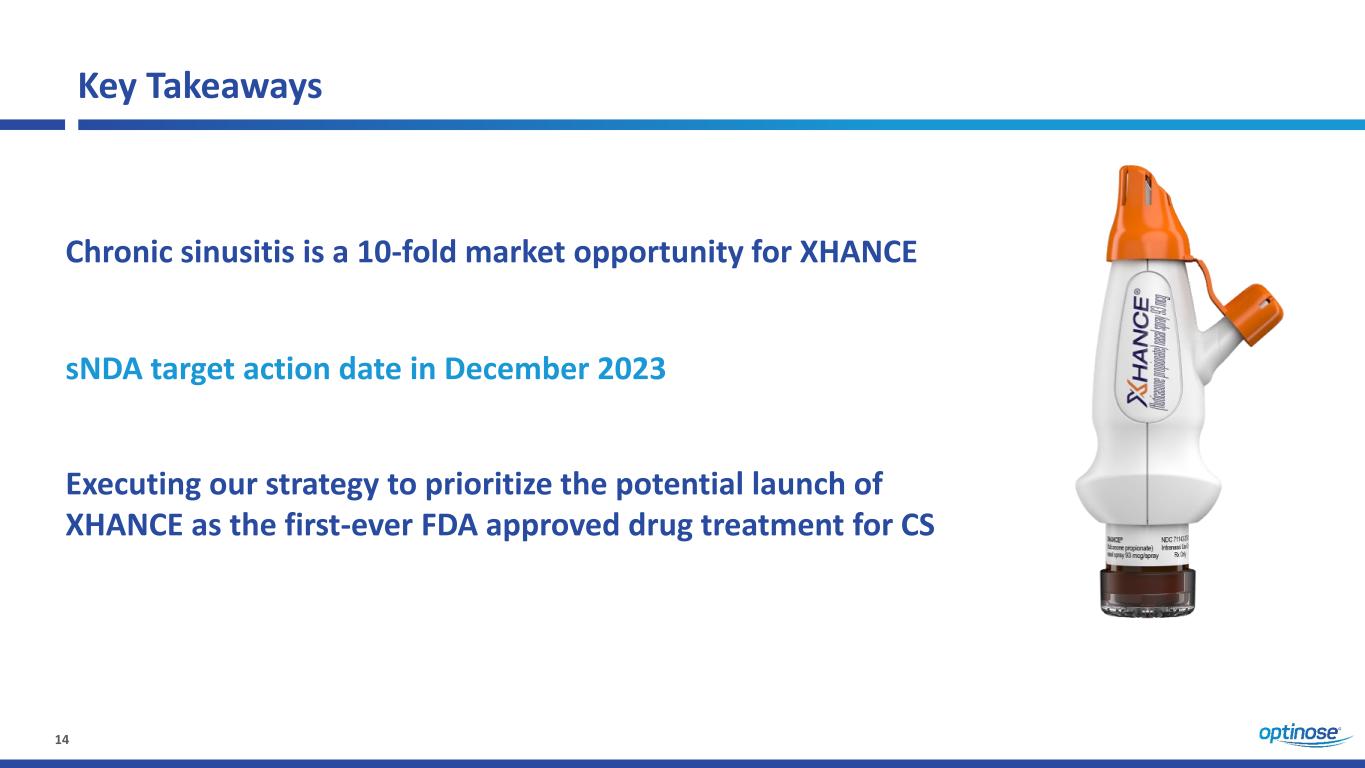
14 Key Takeaways Chronic sinusitis is a 10-fold market opportunity for XHANCE Executing our strategy to prioritize the potential launch of XHANCE as the first-ever FDA approved drug treatment for CS sNDA target action date in December 2023
15 Investor Relations – NASDAQ: OPTN Optinose Investor Contact Jonathan Neely, VP, Investor Relations and Business Development 267-521-0531 Investors@optinose.com As of September 30, 2023: – $66.8 million in cash – Debt: $130 million – 112 million common shares o/s – 45 million options, warrants & RSUs o/s 1 - Optinose is followed by the analysts listed above. Please note that any opinions, estimates or forecasts regarding the Company’s performance made by these analysts are theirs alone and do not represent opinions, forecasts or predictions of Optinose or its management. Optinose does not by its reference above or distribution imply its endorsement of or concurrence with such information, conclusions or recommendations. investors@optinose.com www.optinose.com @optinose Analyst Coverage 1 Jefferies: Glen Santangelo Lake Street: Thomas Flaten Piper Sandler: David Amsellem
Appendix - ReOpen Program Co-Primary Endpoints
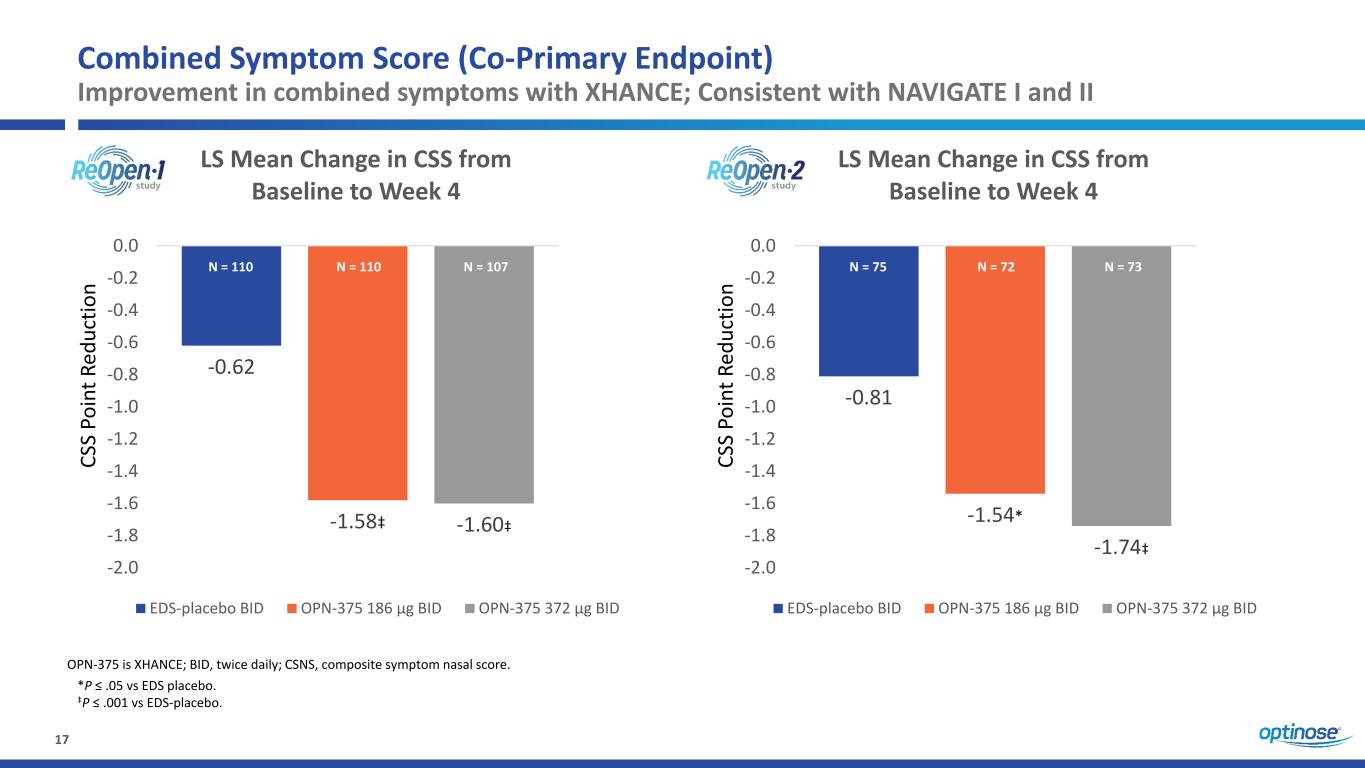
17 Combined Symptom Score (Co-Primary Endpoint) Improvement in combined symptoms with XHANCE; Consistent with NAVIGATE I and II 1 -0.81 -1.54* -1.74‡ -2.0 -1.8 -1.6 -1.4 -1.2 -1.0 -0.8 -0.6 -0.4 -0.2 0.0 CS S Po in t R ed uc tio n LS Mean Change in CSS from Baseline to Week 4 EDS-placebo BID OPN-375 186 μg BID OPN-375 372 μg BID OPN-375 is XHANCE; BID, twice daily; CSNS, composite symptom nasal score. N = 75 N = 72 N = 73 *P ≤ .05 vs EDS placebo. ‡P ≤ .001 vs EDS-placebo. 1 -0.62 -1.58‡ -1.60‡ -2.0 -1.8 -1.6 -1.4 -1.2 -1.0 -0.8 -0.6 -0.4 -0.2 0.0 CS S Po in t R ed uc tio n LS Mean Change in CSS from Baseline to Week 4 EDS-placebo BID OPN-375 186 μg BID OPN-375 372 μg BID N = 110 N = 110 N = 107
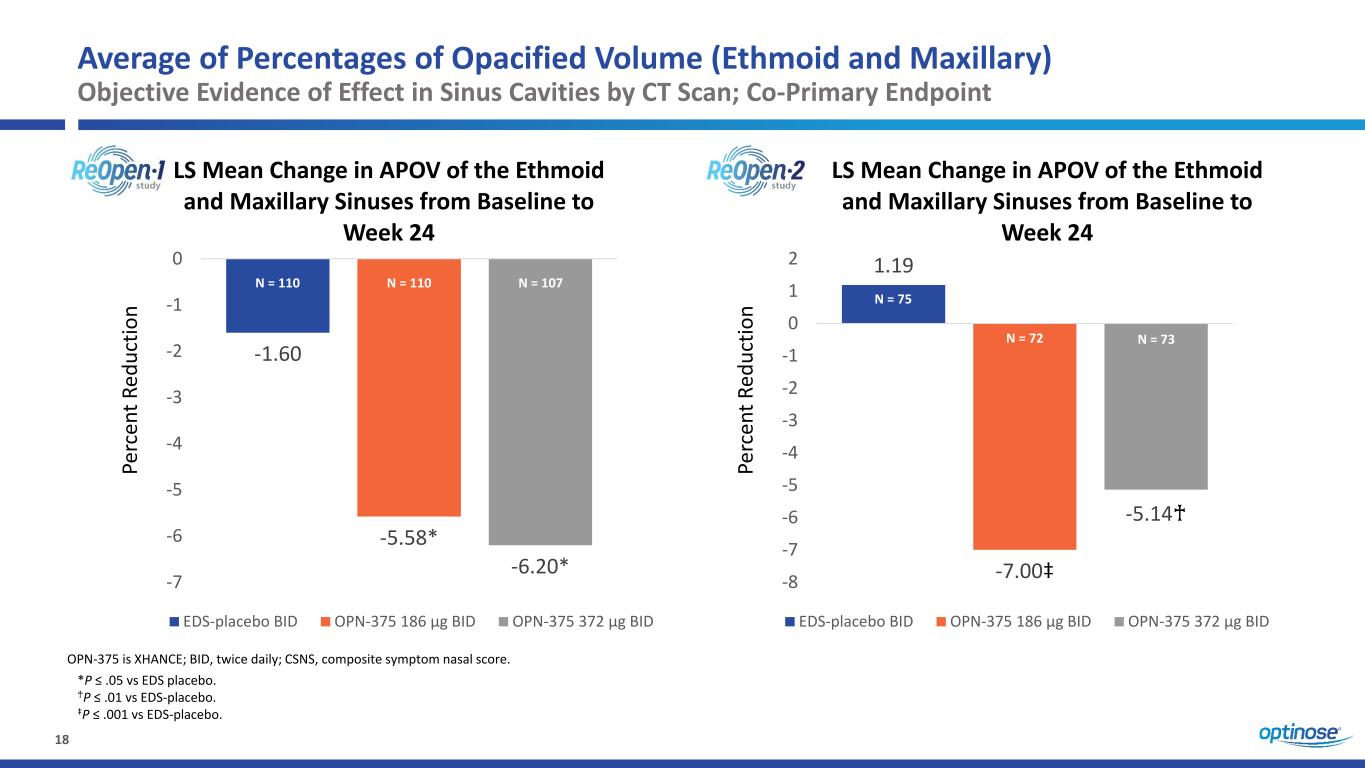
18 Average of Percentages of Opacified Volume (Ethmoid and Maxillary) Objective Evidence of Effect in Sinus Cavities by CT Scan; Co-Primary Endpoint 1.19 -7.00‡ -5.14♰ -8 -7 -6 -5 -4 -3 -2 -1 0 1 2 Pe rc en t R ed uc tio n LS Mean Change in APOV of the Ethmoid and Maxillary Sinuses from Baseline to Week 24 EDS-placebo BID OPN-375 186 μg BID OPN-375 372 μg BID N = 75 N = 72 N = 73 *P ≤ .05 vs EDS placebo. ♰P ≤ .01 vs EDS-placebo. ‡P ≤ .001 vs EDS-placebo. -1.60 -5.58* -6.20* -7 -6 -5 -4 -3 -2 -1 0 Pe rc en t R ed uc tio n LS Mean Change in APOV of the Ethmoid and Maxillary Sinuses from Baseline to Week 24 EDS-placebo BID OPN-375 186 μg BID OPN-375 372 μg BID N = 110 N = 110 N = 107 OPN-375 is XHANCE; BID, twice daily; CSNS, composite symptom nasal score.
Appendix – Year to Date Prescription and Financial Results
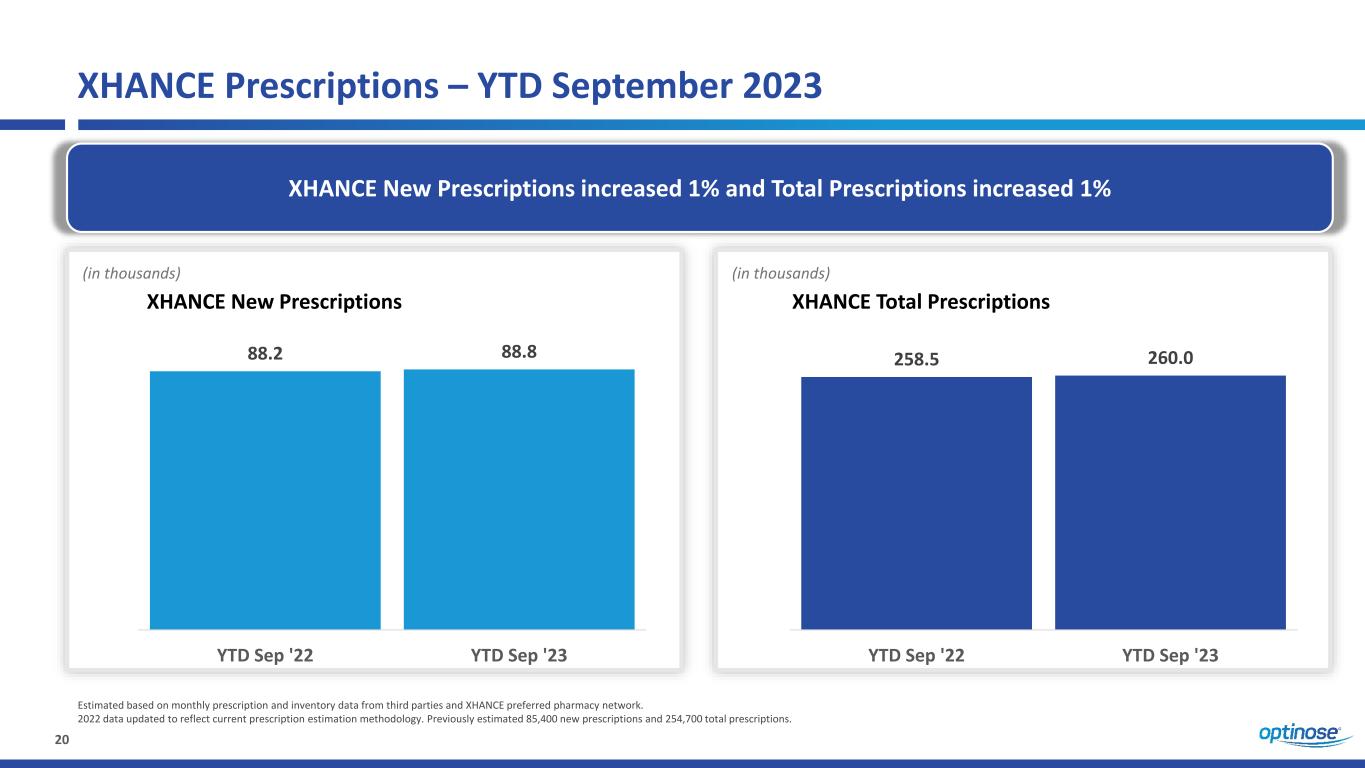
20 XHANCE Prescriptions – YTD September 2023 XHANCE New Prescriptions increased 1% and Total Prescriptions increased 1% 88.2 88.8 YTD Sep '22 YTD Sep '23 (in thousands) XHANCE New Prescriptions 258.5 260.0 YTD Sep '22 YTD Sep '23 XHANCE Total Prescriptions (in thousands) Estimated based on monthly prescription and inventory data from third parties and XHANCE preferred pharmacy network. 2022 data updated to reflect current prescription estimation methodology. Previously estimated 85,400 new prescriptions and 254,700 total prescriptions.
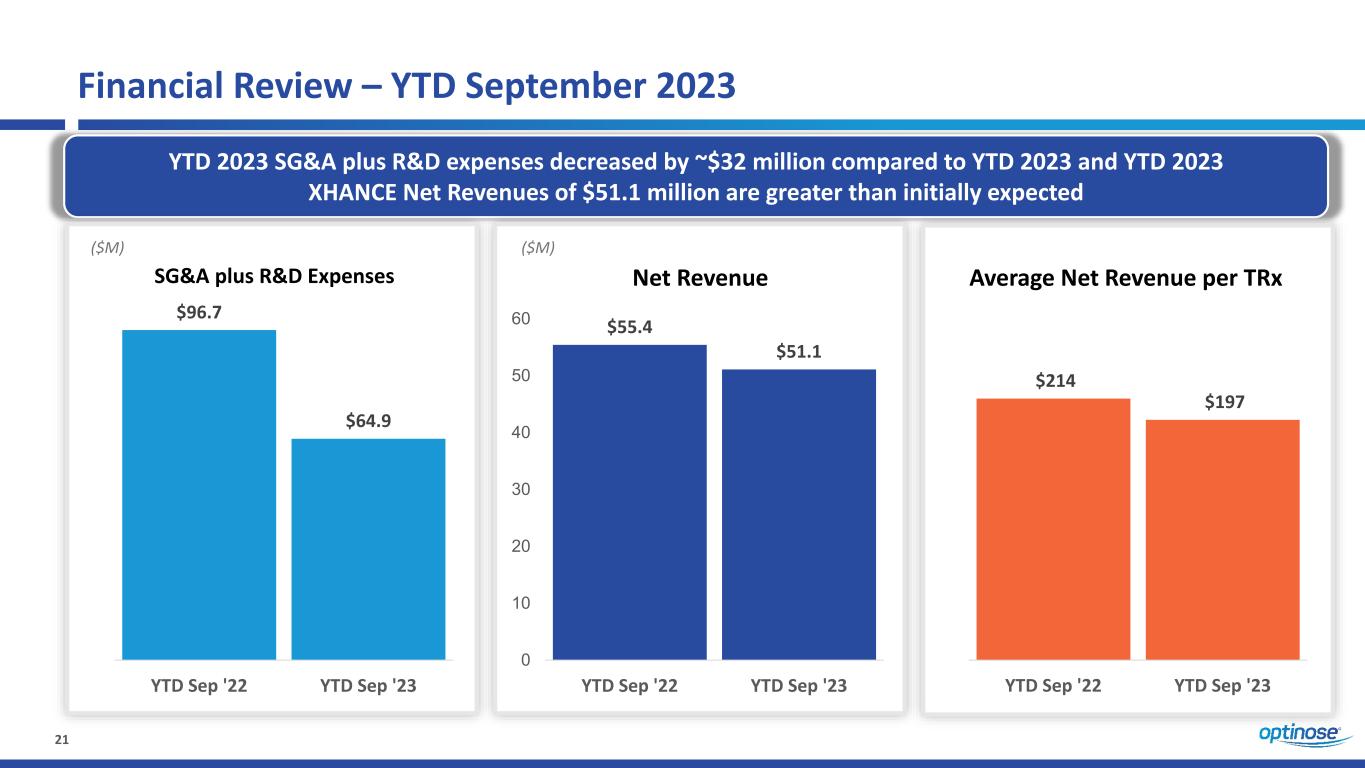
21 Financial Review – YTD September 2023 YTD 2023 SG&A plus R&D expenses decreased by ~$32 million compared to YTD 2023 and YTD 2023 XHANCE Net Revenues of $51.1 million are greater than initially expected $96.7 $64.9 YTD Sep '22 YTD Sep '23 ($M) SG&A plus R&D Expenses $55.4 $51.1 0 10 20 30 40 50 60 YTD Sep '22 YTD Sep '23 ($M) Net Revenue Average Net Revenue per TRx $214 $197 YTD Sep '22 YTD Sep '23
Building a Leading ENT / Allergy Specialty Company C o r p o r a t e P r e s e n t a t i o n N o v e m b e r 9 , 2 0 2 3


