UNITED STATES
SECURITIES AND EXCHANGE COMMISSION
Washington, D.C. 20549
________
FORM N-CSRS
________
CERTIFIED SHAREHOLDER REPORT OF REGISTERED MANAGEMENT
INVESTMENT COMPANIES
Investment Company Act File Number 811-22431
RiverPark Funds Trust
(Exact name of registrant as specified in charter)
________
156 West 56th Street, 17th Floor
New York, NY 10019
(Address of principal executive offices) (Zip code)
Morty Schaja
156 West 56th Street, 17th Floor
New York, NY 10019
(Name and address of agent for service)
With a copy to:
Thomas R. Westle
Blank Rome LLP
1271 Avenue of the Americas
New York, NY 10020
Registrant’s telephone number, including area code: 212-484-2100
Date of fiscal year end: September 30, 2024
Date of reporting period: March 31, 2024
Item 1. Reports to Stockholders.
(a) A copy of the report transmitted to stockholders pursuant to Rule 30e-1 under the Investment Company Act of 1940, as amended (the “Act”) (17 CFR § 270.30e-1), is attached hereto.
| |
Semi-Annual Report March 31, 2024 (Unaudited) | |
RiverPark Large Growth Fund Retail Class Shares and Institutional Class Shares Wedgewood Fund Retail Class Shares and Institutional Class Shares RiverPark Short Term High Yield Fund Retail Class Shares and Institutional Class Shares RiverPark Long/Short Opportunity Fund Retail Class Shares and Institutional Class Shares RiverPark Floating Rate CMBS Fund Retail Class Shares and Institutional Class Shares RiverPark/Next Century Growth Fund Retail Class Shares and Institutional Class Shares RiverPark/Next Century Large Growth Fund Retail Class Shares and Institutional Class Shares | |

Investment Adviser:
RiverPark Advisors, LLC
|
|

Table of Contents
Schedules of Investments | |
RiverPark Large Growth Fund | 1 |
Wedgewood Fund | 2 |
RiverPark Short Term High Yield Fund | 3 |
RiverPark Long/Short Opportunity Fund | 7 |
RiverPark Floating Rate CMBS Fund | 10 |
RiverPark/Next Century Growth Fund | 12 |
RiverPark/Next Century Large Growth Fund | 13 |
Statements of Assets and Liabilities | 14 |
Statements of Operations | 17 |
Statements of Changes in Net Assets | 20 |
Financial Highlights | 24 |
Notes to Financial Statements | 30 |
Disclosure of Fund Expenses | 50 |
Approval of the Investment Advisory and Investment Sub-Advisory Agreements | 52 |
The RiverPark Funds file their complete schedules of fund holdings with the Securities and Exchange Commission (the “Commission”) for the first and third quarters of each fiscal year on Form N-Q or as an exhibit to its reports on Form N-PORT within sixty days after the end of the period. The Funds’ Forms N-Q and Form N-PORT reports are available on the Commission’s website at http://www.sec.gov, and may be reviewed and copied at the Commission’s Public Reference Room in Washington, D.C. Information on the operation of the Public Reference Room may be obtained by calling 1-800-SEC-0330.
A description of the policies and procedures that the Funds use to determine how to vote proxies relating to fund securities, as well as information relating to how a Fund voted proxies relating to fund securities during the most recent 12-month period ended June 30 is available (i) without charge, upon request, by calling 888-564-4517; and (ii) on the Commission’s website at http://www.sec.gov.
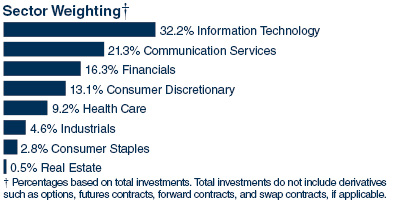
| RiverPark Large Growth Fund March 31, 2024 (Unaudited) |

Description | Shares | Value (000) | ||||||
Schedule of Investments | ||||||||
Common Stock — 97.8%** | ||||||||
Communication Services – 20.8% | ||||||||
Alphabet, Cl A * | 8,068 | $ | 1,218 | |||||
Alphabet, Cl C * | 8,006 | 1,219 | ||||||
Meta Platforms, Cl A | 4,216 | 2,047 | ||||||
Netflix * | 2,604 | 1,581 | ||||||
Pinterest, Cl A * | 21,765 | 755 | ||||||
Snap, Cl A * | 51,149 | 587 | ||||||
Walt Disney | 12,788 | 1,565 | ||||||
| 8,972 | ||||||||
Consumer Discretionary – 12.8% | ||||||||
Amazon.com * | 11,337 | 2,045 | ||||||
Booking Holdings | 338 | 1,226 | ||||||
Lululemon Athletica * | 1,125 | 439 | ||||||
McDonald’s | 1,290 | 364 | ||||||
NIKE, Cl B | 11,375 | 1,069 | ||||||
Starbucks | 4,044 | 370 | ||||||
| 5,513 | ||||||||
Consumer Staples – 2.8% | ||||||||
Costco Wholesale | 1,003 | 735 | ||||||
PepsiCo | 2,645 | 463 | ||||||
| 1,198 | ||||||||
Financials – 15.9% | ||||||||
Adyen ADR * | 53,720 | 908 | ||||||
Blackstone, Cl A | 9,893 | 1,300 | ||||||
Charles Schwab | 16,541 | 1,197 | ||||||
KKR | 10,623 | 1,069 | ||||||
Mastercard, Cl A | 2,866 | 1,380 | ||||||
Visa, Cl A | 3,635 | 1,014 | ||||||
| 6,868 | ||||||||
Health Care – 9.0% | ||||||||
Eli Lilly | 1,231 | $ | 957 | |||||
Illumina * | 3,467 | 476 | ||||||
Intuitive Surgical * | 2,871 | 1,146 | ||||||
UnitedHealth Group | 1,524 | 754 | ||||||
Zoetis, Cl A | 3,132 | 530 | ||||||
| 3,863 | ||||||||
Industrials – 4.5% | ||||||||
Lockheed Martin | 785 | 357 | ||||||
Uber Technologies * | 20,822 | 1,603 | ||||||
| 1,960 | ||||||||
Information Technology – 31.5% | ||||||||
Adobe * | 1,620 | 817 | ||||||
Apple | 9,383 | 1,609 | ||||||
Autodesk * | 3,116 | 812 | ||||||
Datadog, Cl A * | 5,083 | 628 | ||||||
Five9 * | 12,359 | 768 | ||||||
Intuit | 1,590 | 1,034 | ||||||
Microsoft | 5,488 | 2,309 | ||||||
NVIDIA | 2,201 | 1,989 | ||||||
RingCentral, Cl A * | 11,926 | 414 | ||||||
ServiceNow * | 1,307 | 996 | ||||||
Shopify, Cl A * | 17,380 | 1,341 | ||||||
Workday, Cl A * | 3,123 | 852 | ||||||
| 13,569 | ||||||||
Real Estate – 0.5% | ||||||||
Equinix | 257 | 212 | ||||||
Total Common Stock | ||||||||
(Cost $21,135) (000) | 42,155 | |||||||
Total Investments — 97.8% | ||||||||
(Cost $21,135) (000) | $ | 42,155 | ||||||
As of March 31, 2024, all of the Fund’s investments were considered Level 1 in accordance with the authoritative guidance on fair value measurements and disclosure under U.S. GAAP.
Percentages are based on Net Assets of $43,090 (000). |
* | Non-income producing security. |
** | More narrow industries are utilized for compliance purposes, whereas broad sectors are utilized for reporting purposes. |
Cl — Class
ADR — American Depositary Receipt
The accompanying notes are an integral part of the financial statements.
1
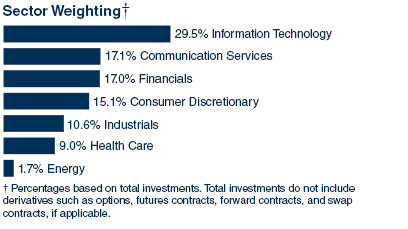
| Wedgewood Fund March 31, 2024 (Unaudited) |

Description | Shares | Value (000) | ||||||
Schedule of Investments | ||||||||
Common Stock — 96.9%** | ||||||||
Communication Services – 16.4% | ||||||||
Alphabet, Cl A * | 15,696 | $ | 2,369 | |||||
Meta Platforms, Cl A | 4,922 | 2,390 | ||||||
| 4,759 | ||||||||
Consumer Discretionary – 14.6% | ||||||||
Booking Holdings | 361 | 1,310 | ||||||
O’Reilly Automotive * | 524 | 591 | ||||||
Pool | 1,906 | 769 | ||||||
Tractor Supply | 5,982 | 1,566 | ||||||
| 4,236 | ||||||||
Energy – 1.7% | ||||||||
Texas Pacific Land | 837 | 484 | ||||||
Financials – 16.5% | ||||||||
PayPal Holdings * | 30,248 | 2,027 | ||||||
S&P Global | 1,460 | 621 | ||||||
Visa, Cl A | 7,676 | 2,142 | ||||||
| 4,790 | ||||||||
Health Care – 10.3% | ||||||||
Edwards Lifesciences * | 13,056 | 1,248 | ||||||
UnitedHealth Group | 3,490 | 1,726 | ||||||
| 2,974 | ||||||||
Industrials – 8.8% | ||||||||
Copart * | 29,652 | 1,718 | ||||||
Old Dominion Freight Line | 3,736 | 819 | ||||||
| 2,537 | ||||||||
Information Technology – 28.6% | ||||||||
Apple | 10,744 | $ | 1,842 | |||||
CDW | 5,644 | 1,444 | ||||||
Microsoft | 4,170 | 1,754 | ||||||
Motorola Solutions | 4,017 | 1,426 | ||||||
Taiwan Semiconductor Manufacturing ADR | 13,445 | 1,829 | ||||||
| 8,295 | ||||||||
Total Common Stock | ||||||||
(Cost $15,385) (000) | 28,075 | |||||||
Total Investments — 96.9% | ||||||||
(Cost $15,385) (000) | $ | 28,075 | ||||||
As of March 31, 2024, all of the Fund’s investments were considered Level 1 in accordance with the authoritative guidance on fair value measurements and disclosure under U.S. GAAP.
Percentages are based on Net Assets of $28,965 (000). |
* | Non-income producing security. |
** | More narrow industries are utilized for compliance purposes, whereas broad sectors are utilized for reporting purposes. |
ADR — American Depositary Receipt
Cl — Class
The accompanying notes are an integral part of the financial statements.
2
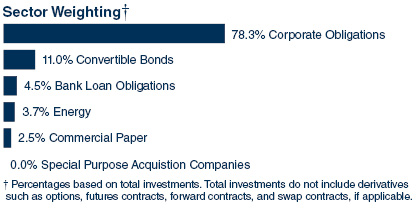
| RiverPark Short Term High Yield Fund March 31, 2024 (Unaudited) |

Description | Face | Value (000) | ||||||
Schedule of Investments | ||||||||
Corporate Obligations — 77.5% | ||||||||
Communication Services – 11.6% | ||||||||
AMC Networks | ||||||||
4.750%, 08/01/25 | 37,693 | $ | 37,699 | |||||
Getty Images | ||||||||
9.750%, 03/01/27 (a) | 7,500 | 7,522 | ||||||
Opnet | ||||||||
10.891%, EUR003M + 7.000%, 02/09/26 (a) (b) | EUR 19,254 | 20,720 | ||||||
TEGNA | ||||||||
4.750%, 03/15/26 (a) | 8,064 | 7,911 | ||||||
Videotron | ||||||||
5.375%, 06/15/24 (a) | 18,136 | 18,090 | ||||||
| 91,942 | ||||||||
Consumer Discretionary – 18.7% | ||||||||
American Greetings | ||||||||
8.750%, 04/15/25 (a) | 15,356 | 15,381 | ||||||
Brinker International | ||||||||
5.000%, 10/01/24 (a) | 10,638 | 10,568 | ||||||
Caesars Entertainment | ||||||||
6.250%, 07/01/25 (a) | 5,775 | 5,781 | ||||||
Las Vegas Sands | ||||||||
3.200%, 08/08/24 | 18,251 | 18,060 | ||||||
MGM Resorts International | ||||||||
6.750%, 05/01/25 | 180 | 180 | ||||||
Michael Kors USA | ||||||||
4.250%, 11/01/24 (a) | 5,982 | 5,909 | ||||||
Nordstrom | ||||||||
2.300%, 04/08/24 | 9,103 | 9,101 | ||||||
Travel + Leisure | ||||||||
5.650%, 04/01/24 | 22,518 | 22,518 | ||||||
TRI Pointe Group | ||||||||
5.875%, 06/15/24 | 18,055 | 18,045 | ||||||
Valvoline | ||||||||
4.250%, 02/15/30 (a) | 42,732 | 42,669 | ||||||
| 148,212 | ||||||||
Consumer Staples – 3.9% | ||||||||
Coty | ||||||||
6.500%, 04/15/26 (a) | 8,704 | $ | 8,724 | |||||
Performance Food Group | ||||||||
6.875%, 05/01/25 (a) | 22,480 | 22,497 | ||||||
| 31,221 | ||||||||
Energy – 22.9% | ||||||||
Baytex Energy | ||||||||
8.750%, 04/01/27 (a) | 1,200 | 1,253 | ||||||
Callon Petroleum | ||||||||
8.000%, 08/01/28 (a) | 7,628 | 8,000 | ||||||
6.375%, 07/01/26 | 9,254 | 9,352 | ||||||
Crescent Energy Finance | ||||||||
7.250%, 05/01/26 (a) | 33,000 | 33,656 | ||||||
CrownRock | ||||||||
5.625%, 10/15/25 (a) | 23,000 | 22,964 | ||||||
CSI Compressco LP | ||||||||
7.500%, 04/01/25 (a) | 5,087 | 5,087 | ||||||
Floatel International | ||||||||
11.250%, 03/23/26 | 1,433 | 1,559 | ||||||
PDC Energy | ||||||||
5.750%, 05/15/26 | 47,178 | 47,128 | ||||||
Permian Resources Operating | ||||||||
6.875%, 04/01/27 (a) | 8,271 | 8,279 | ||||||
USA Compression Partners | ||||||||
6.875%, 04/01/26 | 31,619 | 31,608 | ||||||
Weatherford International | ||||||||
6.500%, 09/15/28 (a) | 12,046 | 12,429 | ||||||
| 181,315 | ||||||||
Financials – 4.8% | ||||||||
Brookfield Finance | ||||||||
4.000%, 04/01/24 | 983 | 983 | ||||||
Kistefos | ||||||||
10.450%, NIBOR3M + 5.750%, 09/11/24 (a) (b) | NOK 19,600 | 1,812 | ||||||
StoneX Group | ||||||||
8.625%, 06/15/25 (a) | 35,068 | 35,248 | ||||||
| 38,043 | ||||||||
Health Care – 2.2% | ||||||||
Cannabist Holdings | ||||||||
13.000%, 05/14/24 | 3,088 | 3,085 | ||||||
9.500%, 02/03/26 (a) | 8,000 | 6,800 | ||||||
Perrigo Finance Unlimited | ||||||||
3.900%, 12/15/24 | 7,361 | 7,237 | ||||||
| 17,122 | ||||||||
The accompanying notes are an integral part of the financial statements.
3
| RiverPark Short Term High Yield Fund |

Description | Face | Value (000) | ||||||
Industrials – 13.4% | ||||||||
Delta Air Lines Pass-Through Trust | ||||||||
3.204%, 04/25/24 | 13,018 | $ | 13,008 | |||||
Hawaiian Airlines Pass-Through Certificates, Ser 2013-1, Cl A | ||||||||
3.900%, 01/15/26 | 4,640 | 4,340 | ||||||
Husky III Holding | ||||||||
13.000%cash/0% PIK, 02/15/25 (a) | 6,750 | 6,770 | ||||||
Icahn Enterprises | ||||||||
4.750%, 09/15/24 | 52,273 | 52,070 | ||||||
IEA Energy Services | ||||||||
6.625%, 08/15/29 (a) | 8,025 | 7,743 | ||||||
Mangrove Luxco III SARL | ||||||||
7.775%, 10/09/25 | EUR 8,347 | 8,897 | ||||||
TransDigm | ||||||||
7.500%, 03/15/27 | 3,470 | 3,476 | ||||||
WESCO Distribution | ||||||||
7.125%, 06/15/25 (a) | 10,875 | 10,895 | ||||||
| 107,199 | ||||||||
Total Corporate Obligations | ||||||||
(Cost $617,566) (000) | 615,054 | |||||||
Convertible Bonds — 10.8% | ||||||||
Communication Services – 0.3% | ||||||||
Liberty TripAdvisor Holdings | ||||||||
0.500%, 06/30/51 | 3,000 | 2,844 | ||||||
Consumer Staples – 0.8% | ||||||||
Turning Point Brands | ||||||||
2.500%, 07/15/24 | 6,500 | 6,386 | ||||||
Health Care – 1.8% | ||||||||
Jazz Investments I | ||||||||
1.500%, 08/15/24 | 14,552 | 14,367 | ||||||
Industrials – 2.7% | ||||||||
Kaman | ||||||||
3.250%, 05/01/24 | 21,552 | 21,581 | ||||||
Information Technology – 5.2% | ||||||||
Alteryx | ||||||||
1.000%, 08/01/26 | 2,650 | $ | 2,629 | |||||
0.500%, 08/01/24 | 1,800 | 1,792 | ||||||
Splunk | ||||||||
1.125%, 06/15/27 | 36,435 | 36,519 | ||||||
| 40,940 | ||||||||
Total Convertible Bonds | ||||||||
(Cost $85,679) (000) | 86,118 | |||||||
Bank Loan Obligations — 4.5% | ||||||||
Communication Services – 1.8% | ||||||||
Univision Communications Inc., Term Loan, 1st Lien | ||||||||
8.691%, 03/15/26 (b) (c) | 13,868 | 13,878 | ||||||
Consumer Discretionary – 0.9% | ||||||||
Carrols Restaurant, Term Loan B, 1st Lien | ||||||||
8.677%, 04/30/26 | 7,106 | 7,106 | ||||||
Energy – 0.4% | ||||||||
Energy Acquisition, Term Loan, 1st Lien | ||||||||
7.500%, 06/26/25 | 3,388 | $ | 3,320 | |||||
Financials – 1.4% | ||||||||
Blackhawk Network Holdings Inc., Term Loan, 1st Lien | ||||||||
3.147%, 06/15/25 (a) (b) (c) (f) | 11,341 | 11,341 | ||||||
Total Bank Loan Obligations | ||||||||
(Cost $35,711) (000) | 35,645 | |||||||
The accompanying notes are an integral part of the financial statements.
4
| RiverPark Short Term High Yield Fund |

Description | Shares/ | Value (000) | ||||||
Preferred Stock — 3.7% | ||||||||
Energy – 3.7% | ||||||||
Energy Transfer | ||||||||
7.600%(b) | 1,153,565 | 29,185 | ||||||
Total Preferred Stock | ||||||||
(Cost $29,199) (000) | 29,185 | |||||||
Commercial Paper — 2.5% | ||||||||
Consumer Discretionary – 1.0% | ||||||||
VF Corporation | ||||||||
6.484%, 07/24/24 (d) | 7,916 | 7,775 | ||||||
Consumer Staples – 1.5% | ||||||||
Walgreens Boots Alliance | ||||||||
6.497%, 04/22/24 (d) | 12,000 | 11,949 | ||||||
Total Commercial Paper | ||||||||
(Cost $19,713) (000) | 19,724 | |||||||
Special Purpose Acquisition Company — 0.0% | ||||||||
Common Stock– 0.0% | ||||||||
Diversified Financials – 0.0% | ||||||||
Plum Acquisition Corp III, Founder Shares * (e) (f) | 45,106 | 6 | ||||||
Total Special Purpose Acquisition Company | ||||||||
(Cost $–) (000) | 6 | |||||||
Total Investments — 99.0% | ||||||||
(Cost $787,868) (000) | $ | 785,732 | ||||||
A list of the open forward foreign currency contracts held by the Fund at March 31, 2024, is as follows (000):
Counterparty | Maturity | Currency | Currency to | Unrealized | ||||||||||||||||||||
Brown Brothers Harriman | 04/03/24 | USD | 4,882 | EUR | 4,459 | $ | (71 | ) | ||||||||||||||||
Brown Brothers Harriman | 04/03/24 | EUR | 32,460 | USD | 35,421 | 400 | ||||||||||||||||||
Brown Brothers Harriman | 04/03/24 | NOK | 20,159 | USD | 1,922 | 65 | ||||||||||||||||||
| $ | 394 | |||||||||||||||||||||||
The following is a summary of the inputs used as of March 31, 2024 in valuing the Fund’s investments and other financial instruments carried at value (000), in accordance with the authoritative guidance on fair value measurements and disclosure under U.S. GAAP:
Investments in | Level 1 | Level 2 | Level 3 | Total | ||||||||||||
Corporate Obligations | $ | — | $ | 615,054 | $ | — | $ | 615,054 | ||||||||
Convertible Bonds | — | 86,118 | — | 86,118 | ||||||||||||
Bank Loan Obligations | — | 35,645 | — | 35,645 | ||||||||||||
Preferred Stock | 29,185 | — | — | 29,185 | ||||||||||||
Commercial Paper | — | 19,724 | — | 19,724 | ||||||||||||
Special Purpose Acquisition Company | — | — | 6 | 6 | ||||||||||||
Total Investments in Securities | $ | 29,185 | $ | 756,541 | $ | 6 | $ | 785,732 | ||||||||
Other Financial | Level 1 | Level 2 | Level 3 | Total | ||||||||||||
Forwards Contracts* | ||||||||||||||||
Unrealized Appreciation | $ | — | $ | 465 | $ | — | $ | 465 | ||||||||
Unrealized Depreciation | — | (71 | ) | — | (71 | ) | ||||||||||
Total Other Financial Instruments | $ | — | $ | 394 | $ | — | $ | 394 | ||||||||
* | Forward contracts are valued at the unrealized appreciation (depreciation) on the instrument. See Note 2 in Notes to Financial Statements for additional information. |
The accompanying notes are an integral part of the financial statements.
5
| RiverPark Short Term High Yield Fund |

For the year ended March 31, 2024, there were no transfers in or out of Level 3.
Percentages are based on Net Assets of $793,387 (000). |
‡ | In U.S. Dollar unless otherwise indicated. |
* | Non-income producing security. |
(a) | Securities sold within terms of a private placement memorandum, exempt from registration under Section 144A of the Securities Act of 1933, as amended, and may be sold only to dealers in that program or other “accredited investors.” These securities have been determined to be liquid under guidelines established by the Board of Trustees. At March 31, 2024, these securities amounted to $338,048 (000) or 42.6% of Net Assets. |
(b) | Variable or floating rate security. The rate shown is the effective interest rate as of period end. The rates for certain securities are not based on published reference rates and spreads and are either determined by the issuer or agent based on current market conditions; by using a formula based on the rates of underlying loans; or by adjusting periodically based on prevailing interest rates. |
(c) | Unsettled bank loan. Interest rate may not be available. |
(d) | Security is fair valued. |
(e) | The rate reported on the Schedule of Investments is the effective yield at the time of purchase. |
(f) | Level 3 security in accordance with fair value hierarchy. As of March 31, 2024, the total amount of Level 3 securities held by the Fund was $6 (000). |
Cl — Class
EUR — Euro
NIBOR — Norwegian Inter Bank Rate
NOK — Norwegian Krone
Ser — Series
EUR003M — Three-Month Euribor
USD — U.S. Dollar
Amounts designated as “-’’ are $0 or have been rounded to $0.
The accompanying notes are an integral part of the financial statements.
6
| RiverPark Long/Short Opportunity Fund March 31, 2024 (Unaudited) |

Description | Shares | Value (000) | ||||||
Schedule of Investments | ||||||||
Common Stock — 83.7%** | ||||||||
Communication Services – 18.9% | ||||||||
Alphabet, Cl A * | 7,603 | $ | 1,147 | |||||
Alphabet, Cl C * | 7,546 | 1,149 | ||||||
Meta Platforms, Cl A | 4,056 | 1,970 | ||||||
Netflix * | 2,631 | 1,598 | ||||||
Pinterest, Cl A * | 20,860 | 723 | ||||||
Snap, Cl A * | 49,283 | 566 | ||||||
Walt Disney | 11,603 | 1,420 | ||||||
| 8,573 | ||||||||
Consumer Discretionary – 12.0% | ||||||||
Amazon.com * | 10,713 | 1,932 | ||||||
Booking Holdings | 336 | 1,219 | ||||||
Lululemon Athletica * | 1,216 | 475 | ||||||
McDonald’s | 1,536 | 433 | ||||||
NIKE, Cl B | 11,321 | 1,064 | ||||||
Starbucks | 3,291 | 301 | ||||||
| 5,424 | ||||||||
Consumer Staples – 2.6% | ||||||||
Costco Wholesale | 986 | 723 | ||||||
PepsiCo | 2,710 | 474 | ||||||
| 1,197 | ||||||||
Financials – 11.8% | ||||||||
Adyen ADR * | 49,150 | 831 | ||||||
Blackstone, Cl A | 9,301 | 1,222 | ||||||
KKR | 9,990 | 1,005 | ||||||
Mastercard, Cl A (a) | 2,539 | 1,223 | ||||||
Visa, Cl A | 3,770 | 1,052 | ||||||
| 5,333 | ||||||||
Health Care – 8.1% | ||||||||
Eli Lilly | 984 | 766 | ||||||
Illumina * | 3,432 | 471 | ||||||
Intuitive Surgical * | 2,737 | 1,092 | ||||||
UnitedHealth Group | 1,612 | 797 | ||||||
Zoetis, Cl A | 3,327 | 563 | ||||||
| 3,689 | ||||||||
Industrials – 4.1% | ||||||||
Lockheed Martin | 750 | $ | 341 | |||||
Uber Technologies * | 19,933 | 1,535 | ||||||
| 1,876 | ||||||||
Information Technology – 25.6% | ||||||||
Adobe * | 1,742 | 879 | ||||||
Apple | 9,958 | 1,707 | ||||||
Autodesk * | 3,145 | 819 | ||||||
Datadog, Cl A * | 5,527 | 683 | ||||||
Five9 * | 13,320 | 828 | ||||||
Intuit | 1,606 | 1,044 | ||||||
Microsoft | 6,522 | 2,744 | ||||||
NVIDIA (a) | 268 | 242 | ||||||
ServiceNow * | 1,350 | 1,029 | ||||||
Shopify, Cl A * | 17,515 | 1,352 | ||||||
Workday, Cl A *(a) | 980 | 267 | ||||||
| 11,594 | ||||||||
Real Estate – 0.6% | ||||||||
Equinix | 306 | 252 | ||||||
Total Common Stock | ||||||||
(Cost $18,314) (000) | 37,938 | |||||||
Total Investments — 83.7% | ||||||||
(Cost $18,314) (000) | $ | 37,938 | ||||||
The accompanying notes are an integral part of the financial statements.
7
| RiverPark Long/Short Opportunity Fund |

A list of open swap agreements held by the Fund at March 31, 2024 was as follows:
Long Exposure | ||||||||||||||||||||||
Company Reference | Counterparty | Fund Pays | Payment | Maturity | Notional | Value | Net | |||||||||||||||
Charles Schwab | Goldman Sachs International | USD-SOFR + 0.61% | Maturity | 05/01/2024 | $ | 906 | $ | 1,176 | $ | 270 | ||||||||||||
Mastercard, Class A | Goldman Sachs International | USD-SOFR + 0.61% | Maturity | 07/09/2024 | 186 | 234 | 48 | |||||||||||||||
NVIDIA | Goldman Sachs International | USD-SOFR + 0.61% | Maturity | 04/26/2024 | 492 | 1,627 | 1,135 | |||||||||||||||
Ringcentral | Goldman Sachs International | USD-SOFR + 0.61% | Maturity | 03/24/2025 | 403 | 451 | 48 | |||||||||||||||
Workday, Class A | Goldman Sachs International | USD-SOFR + 0.61% | Maturity | 10/30/2024 | 430 | 498 | 68 | |||||||||||||||
| $ | 2,417 | $ | 3,986 | $ | 1,569 | |||||||||||||||||
Short Exposure | ||||||||||||||||||||||||||||||||
Company Reference | Counterparty | Fund | Fund | Payment | Maturity Date | Notional | Value | Net | ||||||||||||||||||||||||
Ares Management, Class A | Goldman Sachs International | USD-SOFR | -0.50% | Maturity | 04/19/2024 | $ | (222 | ) | $ | (353 | ) | $ | (131 | ) | ||||||||||||||||||
Block, Class A | Goldman Sachs International | USD-SOFR | -0.50% | Maturity | 01/02/2025 | (221 | ) | (284 | ) | (63 | ) | |||||||||||||||||||||
Boston Properties | Goldman Sachs International | USD-SOFR | -0.50% | Maturity | 11/06/2024 | (209 | ) | (252 | ) | (43 | ) | |||||||||||||||||||||
Capital One Financial Corp | Goldman Sachs International | USD-SOFR | -0.50% | Maturity | 12/26/2024 | (243 | ) | (338 | ) | (95 | ) | |||||||||||||||||||||
Carmax | Goldman Sachs International | USD-SOFR | -0.50% | Maturity | 12/26/2024 | (258 | ) | (336 | ) | (78 | ) | |||||||||||||||||||||
Entegris | Goldman Sachs International | USD-SOFR | -0.50% | Maturity | 11/06/2024 | (228 | ) | (345 | ) | (117 | ) | |||||||||||||||||||||
Fidelity National Information Services | Goldman Sachs International | USD-SOFR | -0.50% | Maturity | 11/06/2024 | (285 | ) | (391 | ) | (106 | ) | |||||||||||||||||||||
Flex Ltd. | Goldman Sachs International | USD-SOFR | -0.50% | Maturity | 05/14/2024 | (182 | ) | (233 | ) | (51 | ) | |||||||||||||||||||||
Hilton Worldwide Holdings | Goldman Sachs International | USD-SOFR | -0.50% | Maturity | 02/20/2025 | (290 | ) | (336 | ) | (46 | ) | |||||||||||||||||||||
Invesco QQQ Trust ETF | Goldman Sachs International | USD-SOFR | -0.50% | Maturity | 10/23/2024 | (1,990 | ) | (2,220 | ) | (230 | ) | |||||||||||||||||||||
Iron Mountain | Goldman Sachs International | USD-SOFR | -0.50% | Maturity | 11/06/2024 | (200 | ) | (268 | ) | (68 | ) | |||||||||||||||||||||
iShares Expanded Tech - Software Sector ETF | Goldman Sachs International | USD-SOFR | -0.50% | Maturity | 07/10/2024 | (1,075 | ) | (1,190 | ) | (115 | ) | |||||||||||||||||||||
Lyondellbasell Industries N.V., Class A | Goldman Sachs International | USD-SOFR | -0.50% | Maturity | 02/20/2025 | (313 | ) | (341 | ) | (28 | ) | |||||||||||||||||||||
Marriott International, Class A | Goldman Sachs International | USD-SOFR | -0.50% | Maturity | 02/20/2025 | (304 | ) | (336 | ) | (32 | ) | |||||||||||||||||||||
Planet Fitness, Class A | Goldman Sachs International | USD-SOFR | -0.50% | Maturity | 01/02/2025 | (312 | ) | (281 | ) | 31 | ||||||||||||||||||||||
Ralph Lauren Corp, Class A | Goldman Sachs International | USD-SOFR | -0.50% | Maturity | 02/12/2025 | (306 | ) | (394 | ) | (88 | ) | |||||||||||||||||||||
SPDR S&P Homebuilders ETF | Goldman Sachs International | USD-SOFR | -0.75% | Maturity | 08/15/2024 | (229 | ) | (301 | ) | (72 | ) | |||||||||||||||||||||
Squarespace | Goldman Sachs International | USD-SOFR | -0.50% | Maturity | 06/24/2024 | (321 | ) | (387 | ) | (66 | ) | |||||||||||||||||||||
Surgery Partners | Goldman Sachs International | USD-SOFR | -0.50% | Maturity | 11/06/2024 | (286 | ) | (311 | ) | (25 | ) | |||||||||||||||||||||
Synchrony Financial | Goldman Sachs International | USD-SOFR | -0.50% | Maturity | 10/30/2024 | (243 | ) | (340 | ) | (97 | ) | |||||||||||||||||||||
Twilio, Class A | Goldman Sachs International | USD-SOFR | -0.50% | Maturity | 11/06/2024 | (276 | ) | (280 | ) | (4 | ) | |||||||||||||||||||||
Ventas | Goldman Sachs International | USD-SOFR | -0.50% | Maturity | 11/06/2024 | (211 | ) | (228 | ) | (17 | ) | |||||||||||||||||||||
Wynn Resorts, Ltd. | Goldman Sachs International | USD-SOFR | -0.50% | Maturity | 11/06/2024 | (212 | ) | (232 | ) | (20 | ) | |||||||||||||||||||||
| $ | (8,416 | ) | $ | (9,977 | ) | $ | (1,561 | ) | ||||||||||||||||||||||||
1 | The payment frequency is the maturity date of each swap contract or the settlement date of a closing transaction, whichever comes first. |
† | Inclusive of accrued dividends and interest related to Total Return Swaps. |
The accompanying notes are an integral part of the financial statements.
8
| RiverPark Long/Short Opportunity Fund |

The following is a summary of the inputs used as of March 31, 2024 in valuing the Fund’s investments and other financial instruments carried at value (000), in accordance with the authoritative guidance on fair value measurements and disclosure under U.S. GAAP:
Investments in | Level 1 | Level 2 | Level 3 | Total | ||||||||||||
Common Stock | $ | 37,938 | $ | — | $ | — | $ | 37,938 | ||||||||
Total Investments in Securities | $ | 37,938 | $ | — | $ | — | $ | 37,938 | ||||||||
Other Financial | Level 1 | Level 2 | Level 3 | Total | ||||||||||||
Equity Swaps‡ | ||||||||||||||||
Appreciation | $ | — | $ | 1,600 | $ | — | $ | 1,600 | ||||||||
Depreciation | — | (1,592 | ) | — | (1,592 | ) | ||||||||||
Total Other Financial Instruments | $ | — | $ | 8 | $ | — | $ | 8 | ||||||||
‡ | Equity Swaps are valued at the unrealized appreciation (depreciation) on the instrument. |
Percentages are based on Net Assets of $45,305 (000). |
* | Non-income producing security. |
(a) | Underlying security for a Total Return Swap. |
** | More narrow industries are utilized for compliance purposes, whereas broad sectors are utilized for reporting purposes. |
ADR — American Depositary Receipt
Cl — Class
ETF — Exchange Traded Fund
Ltd. — Limited
SOFR — Secured Overnight Financing Rate
SPDR — Standard & Poor’s Depository Receipt
S&P — Standard & Poor’s
USD — United States Dollar
Amounts designated as “— “ are $0 or rounded to $0.
The accompanying notes are an integral part of the financial statements.
9
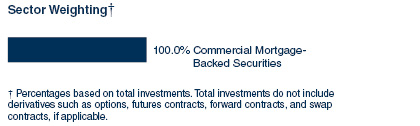
| RiverPark Floating Rate CMBS Fund March 31, 2024 (Unaudited) |

Description | Face | Value (000) | ||||||
Schedule of Investments | ||||||||
Commercial Mortgage-Backed Securities — 98.2% | ||||||||
Non-Agency Mortgage-Backed Obligation – 98.2% | ||||||||
BLP Commercial Mortgage Trust, Ser 2024-IND2, Cl A | ||||||||
6.668%, TSFR1M + 1.342%, 03/15/41 (a) (b) | $ | 1,000 | $ | 1,000 | ||||
BX Commercial Mortgage Trust, Ser 2021-VOLT, Cl F | ||||||||
7.840%, TSFR1M + 2.514%, 09/15/36 (a) (b) | 500 | 495 | ||||||
BX Commercial Mortgage Trust, Ser 2021-SOAR, Cl F | ||||||||
7.791%, TSFR1M + 2.464%, 06/15/38 (a) (b) | 1,765 | 1,745 | ||||||
BX Commercial Mortgage Trust, Ser 2021-XL2, Cl F | ||||||||
7.684%, TSFR1M + 2.359%, 10/15/38 (a) (b) | 2,346 | 2,322 | ||||||
BX Commercial Mortgage Trust, Ser 2021-SOAR, Cl E | ||||||||
7.241%, TSFR1M + 1.914%, 06/15/38 (a) (b) | 883 | 873 | ||||||
BX Commercial Mortgage Trust, Ser 2021-CIP, Cl D | ||||||||
7.111%, TSFR1M + 1.785%, 12/15/38 (a) (b) | 1,500 | 1,479 | ||||||
BX Commercial Mortgage Trust, Ser 2024-XL5, Cl A | ||||||||
6.692%, TSFR1M + 1.392%, 03/15/41 (a) (b) | 2,000 | 2,001 | ||||||
BX Commercial Mortgage Trust, Ser 2021-SOAR, Cl C | ||||||||
6.541%, TSFR1M + 1.214%, 06/15/38 (a) (b) | 406 | 402 | ||||||
BX Commercial Mortgage Trust, Ser 2021-ACNT, Cl A | ||||||||
6.290%, TSFR1M + 0.964%, 11/15/38 (a) (b) | 1,438 | 1,424 | ||||||
BX Trust, Ser 2022-IND, Cl E | ||||||||
9.312%, TSFR1M + 3.987%, 04/15/37 (a) (b) | 1,531 | 1,498 | ||||||
BX Trust, Ser 2019-MMP, Cl F | ||||||||
8.161%, TSFR1M + 2.836%, 08/15/36 (a) (b) | $ | 2,985 | $ | 2,764 | ||||
BX Trust, Ser 2022-PSB, Cl A | ||||||||
7.776%, TSFR1M + 2.451%, 08/15/39 (a) (b) | 1,843 | 1,854 | ||||||
BX Trust, Ser 2021-MFM1, Cl E | ||||||||
7.690%, TSFR1M + 2.364%, 01/15/34 (a) (b) | 766 | 757 | ||||||
BX Trust, Ser 2024-CNYN, Cl A | ||||||||
6.742%, TSFR1M + 1.442%, 04/15/29 (a) (b) | 2,000 | 2,000 | ||||||
BX Trust, Ser 2021-RISE, Cl A | ||||||||
6.187%, TSFR1M + 0.862%, 11/15/36 (a) (b) | 1,834 | 1,820 | ||||||
ILPT Commercial Mortgage Trust, Ser 2022-LPF2, Cl E | ||||||||
11.265%, TSFR1M + 5.940%, 10/15/39 (a) (b) | 1,000 | 962 | ||||||
ILPT Commercial Mortgage Trust, Ser 2022-LPF2, Cl C | ||||||||
8.818%, TSFR1M + 3.493%, 10/15/39 (a) (b) | 2,000 | 1,970 | ||||||
JP Morgan Chase Commercial Mortgage Securities Trust, Ser 2021-MHC, Cl E | ||||||||
7.891%, TSFR1M + 2.564%, 04/15/38 (a) (b) | 1,300 | 1,286 | ||||||
MHC Trust, Ser 2021-MHC2, Cl B | ||||||||
6.540%, TSFR1M + 1.214%, 05/15/38 (a) (b) | 1,336 | 1,323 | ||||||
MHP, Ser 2021-STOR, Cl F | ||||||||
7.641%, TSFR1M + 2.314%, 07/15/38 (a) (b) | 1,500 | 1,479 | ||||||
OPG Trust, Ser 2021-PORT F | ||||||||
7.389%, TSFR1M + 2.062%, 10/15/36 (a) (b) | 658 | 644 | ||||||
TTAN, Ser 2021-MHC, Cl D | ||||||||
7.191%, TSFR1M + 1.864%, 03/15/38 (a) (b) | 1,511 | 1,496 | ||||||
Total Commercial Mortgage-Backed Securities | ||||||||
(Cost $31,905) (000) | 31,594 | |||||||
Total Investments — 98.2% | ||||||||
(Cost $31,905) (000) | $ | 31,594 | ||||||
The accompanying notes are an integral part of the financial statements.
10
| RiverPark Floating Rate CMBS Fund |

As of March 31, 2024, all of the Fund’s investments were considered Level 2 in accordance with the authoritative guidance on fair value measurements and disclosure under U.S. GAAP.
Percentages are based on Net Assets of $32,189 (000). |
(a) | Variable or floating rate security. The rate shown is the effective interest rate as of period end. The rates for certain securities are not based on published reference rates and spreads and are either determined by the issuer or agent based on current market conditions; by using a formula based on the rates of underlying loans; or by adjusting periodically based on prevailing interest rates. |
(b) | Securities sold within terms of a private placement memorandum, exempt from registration under Section 144A of the Securities Act of 1933, as amended, and may be sold only to dealers in that program or other “accredited investors.” These securities have been determined to be liquid under guidelines established by the Board of Trustees. At March 31, 2024, these securities amounted to $31,594 (000) or 98.2% of Net Assets. |
Cl — Class
Ser — Series
TSFR1M — 1 Month Term Secured Overnight Financing Rate
The accompanying notes are an integral part of the financial statements.
11
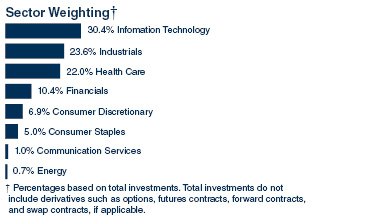
| RiverPark/Next Century Growth Fund March 31, 2024 (Unaudited) |

Description | Shares | Value (000) | |||
Schedule of Investments | |||||
Common Stock — 96.6%** | |||||
Communication Services – 0.9% | |||||
QuinStreet * | 7,207 | $ | 127 | ||
Consumer Discretionary – 6.7% | |||||
Cava Group * | 1,695 | 119 | |||
Floor & Decor Holdings, Cl A * | 604 | 78 | |||
Global-E Online, Cl E * | 3,650 | 133 | |||
Kura Sushi USA, Cl A * | 1,452 | 167 | |||
LGI Homes * | 3,407 | 396 | |||
| 893 | |||||
Consumer Staples – 4.8% | |||||
Celsius Holdings * | 4,500 | 373 | |||
Freshpet * | 2,342 | 272 | |||
| 645 | |||||
Energy – 0.7% | |||||
Permian Resources, Cl A | 5,132 | 91 | |||
Financials – 10.1% | |||||
Flywire * | 14,726 | 365 | |||
Goosehead Insurance, Cl A * | 1,557 | 104 | |||
Kinsale Capital Group | 1,134 | 595 | |||
Paymentus Holdings, Cl A * | 5,967 | 136 | |||
Ryan Specialty Holdings, Cl A | 2,773 | 154 | |||
| 1,354 | |||||
Health Care – 21.3% | |||||
Alphatec Holdings * | 19,443 | 268 | |||
Castle Biosciences * | 2,861 | 63 | |||
Inspire Medical Systems * | 773 | 166 | |||
Medpace Holdings * | 554 | 224 | |||
Natera * | 2,952 | 270 | |||
Penumbra * | 507 | 113 | |||
Progyny * | 4,934 | 188 | |||
RxSight * | 3,082 | 159 | |||
SI-BONE * | 11,357 | 186 | |||
Tactile Systems Technology * | 8,610 | 140 | |||
Tandem Diabetes Care * | 10,153 | 360 | |||
TransMedics Group * | 6,082 | 450 | |||
Treace Medical Concepts * | 8,993 | 117 | |||
Vericel * | 2,826 | $ | 147 | ||
| 2,851 | |||||
Industrials – 22.8% | |||||
AeroVironment * | 1,788 | 274 | |||
Astronics * | 26,802 | 510 | |||
ExlService Holdings * | 7,417 | 236 | |||
Hexcel | 4,498 | 328 | |||
Knight-Swift Transportation Holdings, Cl A | 1,165 | 64 | |||
MYR Group * | 893 | 158 | |||
Paylocity Holding * | 383 | 66 | |||
Quanta Services | 639 | 166 | |||
RBC Bearings * | 906 | 245 | |||
Saia * | 1,005 | 588 | |||
Verra Mobility, Cl A * | 16,946 | 423 | |||
| 3,058 | |||||
Information Technology – 29.3% | |||||
Aehr Test Systems * | 2,069 | 26 | |||
Agilysys * | 1,766 | 149 | |||
Appfolio, Cl A * | 668 | 165 | |||
Braze, Cl A * | 1,802 | 80 | |||
Clearwater Analytics Holdings, Cl A * | 5,366 | 95 | |||
CyberArk Software * | 704 | 187 | |||
DoubleVerify Holdings * | 1,529 | 54 | |||
Five9 * | 2,483 | 154 | |||
Globant * | 269 | 54 | |||
Guidewire Software * | 1,160 | 135 | |||
JFrog * | 3,176 | 140 | |||
Lattice Semiconductor * | 3,787 | 296 | |||
MACOM Technology Solutions Holdings * | 4,258 | 407 | |||
Monday.com * | 577 | 130 | |||
Napco Security Technologies | 7,709 | 310 | |||
Q2 Holdings * | 6,146 | 323 | |||
Sprout Social, Cl A * | 5,750 | 343 | |||
SPS Commerce * | 1,631 | 302 | |||
Vertex, Cl A * | 15,309 | 486 | |||
Workiva, Cl A * | 1,140 | 97 | |||
| 3,933 | |||||
Total Common Stock | |||||
(Cost $12,294) (000) | 12,952 | ||||
Total Investments — 96.6% | |||||
(Cost $12,294) (000) | $ | 12,952 | |||
As of March 31, 2024, all of the Fund’s investments were considered Level 1 in accordance with the authoritative guidance on fair value measurements and disclosure under U.S. GAAP.
Percentages are based on Net Assets of $13,405 (000). |
* | Non-income producing security. |
** | More narrow industries are utilized for compliance purposes, whereas broad sectors are utilized for reporting purposes. |
Cl — Class
The accompanying notes are an integral part of the financial statements.
12
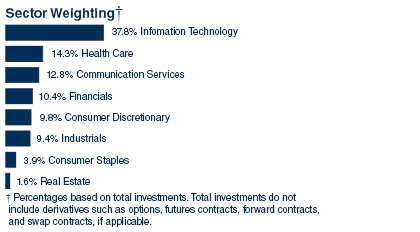
| RiverPark/Next Century Large Growth Fund March 31, 2024 (Unaudited) |

Description | Shares | Value (000) | |||
Schedule of Investments | |||||
Common Stock — 96.5% | |||||
Communication Services – 12.4% | |||||
Alphabet, Cl A * | 1,002 | $ | 151 | ||
Meta Platforms, Cl A | 220 | 107 | |||
Netflix * | 63 | 38 | |||
| 296 | |||||
Consumer Discretionary – 9.5% | |||||
Amazon.com * | 768 | 139 | |||
Chipotle Mexican Grill, Cl A * | 8 | 23 | |||
DR Horton | 177 | 29 | |||
Lululemon Athletica * | 42 | 16 | |||
Tesla * | 111 | 20 | |||
| 227 | |||||
Consumer Staples – 3.8% | |||||
Celsius Holdings * | 370 | 31 | |||
Costco Wholesale | 82 | 60 | |||
| 91 | |||||
Financials – 10.0% | |||||
Goldman Sachs Group | 107 | 45 | |||
Kinsale Capital Group | 79 | 41 | |||
Mastercard, Cl A | 118 | 57 | |||
Progressive | 183 | 38 | |||
Visa, Cl A | 215 | 60 | |||
| 241 | |||||
Health Care – 13.7% | |||||
Boston Scientific * | 438 | 30 | |||
Dexcom * | 397 | 55 | |||
Eli Lilly | 106 | 83 | |||
Intuitive Surgical * | 58 | 23 | |||
Novo Nordisk ADR | 396 | 51 | |||
UnitedHealth Group | 65 | 32 | |||
Vertex Pharmaceuticals * | 132 | 55 | |||
| 329 | |||||
Industrials – 9.0% | |||||
Boeing * | 318 | $ | 61 | ||
Old Dominion Freight Line | 262 | 58 | |||
Quanta Services | 96 | 25 | |||
Symbotic, Cl A * | 823 | 37 | |||
Vertiv Holdings, Cl A | 434 | 35 | |||
| 216 | |||||
Information Technology – 36.5% | |||||
Adobe * | 87 | 44 | |||
Advanced Micro Devices * | 335 | 60 | |||
Apple | 594 | 102 | |||
ARM Holdings ADR * | 170 | 21 | |||
Cadence Design Systems * | 82 | 25 | |||
Crowdstrike Holdings, Cl A * | 161 | 52 | |||
Microsoft | 578 | 243 | |||
Monolithic Power Systems | 40 | 27 | |||
NVIDIA | 180 | 163 | |||
Palo Alto Networks * | 140 | 40 | |||
ServiceNow * | 98 | 75 | |||
Workday, Cl A * | 80 | 22 | |||
| 874 | |||||
Real Estate – 1.6% | |||||
CoStar Group * | 387 | 37 | |||
Total Common Stock | |||||
(Cost $2,016) (000) | 2,311 | ||||
Total Investments — 96.5% | |||||
(Cost $2,016) (000) | $ | 2,311 | |||
As of March 31, 2024, all of the Fund’s investments were considered Level 1 in accordance with the authoritative guidance on fair value measurements and disclosure under U.S. GAAP.
Percentages are based on Net Assets of $2,395 (000). |
* | Non-income producing security. |
ADR — American Depositary Receipt
Cl — Class
The accompanying notes are an integral part of the financial statements.
13
Statements of Assets and Liabilities (000) March 31, 2024 (Unaudited) |
|

RiverPark Large | Wedgewood Fund | RiverPark Short Term | ||||||||||
Assets: | ||||||||||||
Investments in Securities, at Value (Note 2) | $ | 42,155 | $ | 28,075 | $ | 785,732 | ||||||
Deposits with Brokers | — | — | 3 | |||||||||
Cash and Cash Equivalents | 749 | 663 | 17,702 | |||||||||
Foreign Currency (Note 2) | — | — | 574 | |||||||||
Receivable for Investment Securities Sold | 206 | 230 | 5,008 | |||||||||
Receivable for Capital Shares Sold | 21 | — | 1,073 | |||||||||
Receivable for Dividend and Interest Income | 11 | 13 | 11,885 | |||||||||
Reclaim Receivable | — | — | 1 | |||||||||
Unrealized Appreciation on Forward Foreign Currency Contracts | — | — | 465 | |||||||||
Prepaid Expenses | 21 | 23 | 79 | |||||||||
Total Assets | 43,163 | 29,004 | 822,522 | |||||||||
Liabilities: | ||||||||||||
Payable for Capital Shares Redeemed | 29 | 5 | 948 | |||||||||
Income Distribution Payable | — | — | 276 | |||||||||
Unrealized Depreciation on Forward Foreign Currency Contracts | — | — | 71 | |||||||||
Payable for Investment Securities Purchased | — | — | 27,049 | |||||||||
Payable Due to Adviser (Note 4) | 24 | 15 | 433 | |||||||||
Payable for Administrative Services, Retail Class Shares (Note 4) | 5 | 1 | 2 | |||||||||
Payable Due to Shareholder Servicing Agent (Note 4) | 3 | 3 | 11 | |||||||||
Payable Due to Administrator (Note 4) | 2 | 1 | 40 | |||||||||
Payable for Administrative Services, Institutional Class Shares (Note 4) | 2 | 8 | 101 | |||||||||
Payable for Primer Broker Fees | — | — | 5 | |||||||||
Chief Compliance Officer Fees Payable (Note 4) | — | — | 6 | |||||||||
Other Accrued Expenses | 8 | 6 | 193 | |||||||||
Total Liabilities | 73 | 39 | 29,135 | |||||||||
Net Assets | $ | 43,090 | $ | 28,965 | $ | 793,387 | ||||||
Net Assets Consist of: | ||||||||||||
Paid-in Capital | $ | 21,654 | $ | 14,173 | $ | 822,214 | ||||||
Total Distributable Earnings/(Accumulated Losses) | 21,436 | 14,792 | (28,827 | ) | ||||||||
Net Assets | $ | 43,090 | $ | 28,965 | $ | 793,387 | ||||||
Investments in Securities, at Cost | $ | 21,135 | $ | 15,385 | $ | 787,868 | ||||||
Foreign Currency, at Cost | — | — | 574 | |||||||||
Net Assets - Institutional Class Shares(1) | $ | 30,266,513 | $ | 21,232,690 | $ | 773,388,634 | ||||||
Net Assets - Retail Class Shares(1) | $ | 12,823,822 | $ | 7,732,545 | $ | 19,998,336 | ||||||
Institutional Class Shares: | ||||||||||||
Outstanding Shares of Beneficial Interest(1) | ||||||||||||
(Unlimited Authorization — No Par Value) | 1,128,122 | 4,086,047 | 79,876,530 | |||||||||
Retail Class Shares: | ||||||||||||
Outstanding Shares of Beneficial Interest(1) | ||||||||||||
(Unlimited Authorization — No Par Value) | 497,754 | 1,665,584 | 2,075,560 | |||||||||
Institutional Class Shares: | ||||||||||||
Net Asset Value, Offering and Redemption | ||||||||||||
Price Per Share — Institutional Class Shares | $ | 26.83 | $ | 5.20 | $ | 9.68 | ||||||
Retail Class Shares: | ||||||||||||
Net Asset Value, Offering and Redemption | ||||||||||||
Price Per Share — Retail Class Shares | $ | 25.76 | $ | 4.64 | $ | 9.64 | ||||||
(1) | Shares and Net Assets have not been rounded. |
Amounts designated as “—” are either not applicable, $0 or have been rounded to $0.
The accompanying notes are an integral part of the financial statements.
14
Statements of Assets and Liabilities (000) March 31, 2024 (Unaudited) |
|

RiverPark Long/Short | RiverPark Floating | Riverpark/Next | ||||||||||
Assets: | ||||||||||||
Investments in Securities, at Value (Note 2) | $ | 37,938 | $ | 31,594 | $ | 12,952 | ||||||
Cash and Cash Equivalents | 6,441 | 1,124 | 306 | |||||||||
Swaps Contracts, at Value (Note 2) | 1,600 | — | — | |||||||||
Cash Collateral on Swap Contracts | 500 | — | — | |||||||||
Receivable for Investment Securities Sold | 391 | 904 | — | |||||||||
Receivable for Dividend and Interest Income | 122 | 119 | 2 | |||||||||
Receivable for Capital Shares Sold | 3 | 514 | 247 | |||||||||
Receivable Due from Adviser (Note 4) | — | — | 3 | |||||||||
Deferred Offering Costs | — | — | 17 | |||||||||
Prepaid Expenses | 33 | 20 | 6 | |||||||||
Total Assets | 47,028 | 34,275 | 13,533 | |||||||||
Liabilities: | ||||||||||||
Swaps Contracts, at value (Note 2) | 1,592 | — | — | |||||||||
Payable for Capital Shares Redeemed | 44 | 19 | — | |||||||||
Income Distribution Payable | — | 45 | — | |||||||||
Payable for Investment Securities Purchased | — | 1,995 | 128 | |||||||||
Payable Due to Adviser (Note 4) | 57 | 12 | — | |||||||||
Payable for Administrative Services, Institutional Class Shares (Note 4) | 6 | 3 | — | |||||||||
Payable Due to Administrator (Note 4) | 2 | 2 | — | |||||||||
Payable for Administrative Services, Retail Class Shares (Note 4) | — | 1 | — | |||||||||
Other Accrued Expenses | 22 | 9 | — | |||||||||
Total Liabilities | 1,723 | 2,086 | 128 | |||||||||
Net Assets | $ | 45,305 | $ | 32,189 | $ | 13,405 | ||||||
Net Assets Consist of: | ||||||||||||
Paid-in Capital | $ | 101,874 | $ | 59,675 | $ | 12,952 | ||||||
Total Earnings Distributable/(Accumulated Losses) | (56,569 | ) | (27,486 | ) | 453 | |||||||
Net Assets | $ | 45,305 | $ | 32,189 | $ | 13,405 | ||||||
Investments in Securities, at Cost | $ | 18,314 | $ | 31,905 | $ | 12,294 | ||||||
Net Assets - Institutional Class Shares(1) | $ | 35,878,399 | $ | 28,978,131 | $ | 13,371,529 | ||||||
Net Assets - Retail Class Shares(1) | $ | 9,426,921 | $ | 3,210,744 | $ | 33,638 | ||||||
Institutional Class Shares: | ||||||||||||
Outstanding Shares of Beneficial Interest(1) | ||||||||||||
(Unlimited Authorization — No Par Value) | 2,736,507 | 3,311,443 | 1,299,768 | |||||||||
Retail Class Shares: | ||||||||||||
Outstanding Shares of Beneficial Interest(1) | ||||||||||||
(Unlimited Authorization — No Par Value) | 732,532 | 369,288 | 3,281 | |||||||||
Institutional Class Shares: | ||||||||||||
Net Asset Value, Offering and Redemption | ||||||||||||
Price Per Share — Institutional Class Shares | $ | 13.11 | $ | 8.75 | $ | 10.29 | ||||||
Retail Class Shares: | ||||||||||||
Net Asset Value, Offering and Redemption | ||||||||||||
Price Per Share — Retail Class Shares | $ | 12.87 | $ | 8.69 | $ | 10.25 | ||||||
(1) | Shares and Net Assets have not been rounded. |
Amounts designated as “—” are either not applicable, $0 or have been rounded to $0.
The accompanying notes are an integral part of the financial statements.
15
Statements of Assets and Liabilities (000) March 31, 2024 (Unaudited) |
|

Riverpark/Next | ||||
Assets: | ||||
Investments in Securities, at Value (Note 2) | $ | 2,311 | ||
Cash and Cash Equivalents | 36 | |||
Deferred Offering Costs | 40 | |||
Receivable Due from Adviser (Note 4) | 5 | |||
Receivable for Dividend and Interest Income | 1 | |||
Prepaid Expenses | 2 | |||
Total Assets | 2,395 | |||
Liabilities: | ||||
Total Liabilities | — | |||
Net Assets | $ | 2,395 | ||
Net Assets Consist of: | ||||
Paid-in Capital | $ | 2,100 | ||
Total Distributable Earnings | 295 | |||
Net Assets | $ | 2,395 | ||
Investments in Securities, at Cost | $ | 2,016 | ||
Net Assets - Institutional Class Shares(1) | $ | 2,393,429 | ||
Net Assets - Retail Class Shares(1) | $ | 1,140 | ||
Institutional Class Shares: | ||||
Outstanding Shares of Beneficial Interest(1) | ||||
(Unlimited Authorization — No Par Value) | 209,775 | |||
Retail Class Shares: | ||||
Outstanding Shares of Beneficial Interest(1) | ||||
(Unlimited Authorization — No Par Value) | 100 | |||
Institutional Class Shares: | ||||
Net Asset Value, Offering and Redemption | ||||
Price Per Share — Institutional Class Shares | $ | 11.41 | ||
Retail Class Shares: | ||||
Net Asset Value, Offering and Redemption | ||||
Price Per Share — Retail Class Shares | $ | 11.40 | ||
(1) | Shares and Net Assets have not been rounded. |
Amounts designated as “—” are either not applicable, $0 or have been rounded to $0.
The accompanying notes are an integral part of the financial statements.
16
Statements of Operations (000) For the Six Month Period Ended |
|

RiverPark Large | Wedgewood Fund | RiverPark Short Term | ||||||||||
Investment Income: | ||||||||||||
Dividends | $ | 103 | $ | 98 | $ | 1,325 | ||||||
Interest | 38 | 8 | 24,197 | |||||||||
Dividends from Master Limited Partnerships | 19 | — | — | |||||||||
Foreign Taxes Withheld | — | (3 | ) | — | ||||||||
Total Investment Income | 160 | 103 | 25,522 | |||||||||
Expenses: | ||||||||||||
Investment Advisory Fees (Note 4) | 134 | 92 | 2,538 | |||||||||
Administrator Fees (Note 4) | 12 | 9 | 235 | |||||||||
Administrative Services Fee, Institutional Class Shares (Note 4) | 12 | 12 | 365 | |||||||||
Administrative Services Fee, Retail Class Shares (Note 4) | 7 | 3 | 10 | |||||||||
Shareholder Service Fees(1) (Note 4) | 17 | 9 | 25 | |||||||||
Trustees’ Fees (Note 4) | 3 | 2 | 50 | |||||||||
Chief Compliance Officer Fees (Note 4) | 2 | 1 | 38 | |||||||||
Registration Fees | 19 | 21 | 28 | |||||||||
Transfer Agent Fees | 7 | 5 | 129 | |||||||||
Professional Fees | 5 | 3 | 96 | |||||||||
Printing Fees | 2 | 2 | 41 | |||||||||
Custodian Fees | 1 | 1 | 18 | |||||||||
Prime Broker Fee | — | — | 30 | |||||||||
Insurance and Other Fees | 6 | 4 | 100 | |||||||||
Total Expenses | 227 | 164 | 3,703 | |||||||||
Fees Waived by Adviser (Note 4) | (3 | ) | (12 | ) | — | |||||||
Net Expenses | 224 | 152 | 3,703 | |||||||||
Net Investment Income (Loss) | (64 | ) | (49 | ) | 21,819 | |||||||
Net Realized and Unrealized Gain (Loss): | ||||||||||||
Net Realized Gain (Loss) From: | ||||||||||||
Investments | 2,553 | 2,565 | 1,104 | |||||||||
Forward Foreign Currency Contracts | — | — | (237 | ) | ||||||||
Foreign Currency Transactions | — | — | (41 | ) | ||||||||
Net Realized Gain (Loss) | 2,553 | 2,565 | 826 | |||||||||
Net Change in Unrealized Appreciation on: | ||||||||||||
Investments | 8,332 | 3,722 | 2,662 | |||||||||
Forward Foreign Currency Contracts | — | — | 73 | |||||||||
Foreign Currency Translation | — | — | 3 | |||||||||
Net Change in Unrealized Appreciation (Depreciation) | 8,332 | 3,722 | 2,738 | |||||||||
Net Realized and Unrealized Gain | 10,885 | 6,287 | 3,564 | |||||||||
Net Increase in Net Assets Resulting from Operations | $ | 10,821 | $ | 6,238 | $ | 25,383 | ||||||
(1) | Attributable to Retail Class Shares only. |
Amounts designated as “—” are either not applicable, $0 or have been rounded to $0.
The accompanying notes are an integral part of the financial statements.
17
Statements of Operations (000) For the Six Month Period Ended |
|

RiverPark Long/Short | RiverPark Floating | Riverpark/Next | ||||||||||
Investment Income: | ||||||||||||
Interest | $ | 176 | $ | 1,365 | $ | 3 | ||||||
Dividends | 120 | — | 1 | |||||||||
Total Investment Income | 296 | 1,365 | 4 | |||||||||
Expenses: | ||||||||||||
Investment Advisory Fees (Note 4) | 347 | 103 | 12 | |||||||||
Administrative Services Fee, Institutional Class Shares (Note 4) | 19 | 8 | — | |||||||||
Administrator Fees (Note 4) | 14 | 9 | 1 | |||||||||
Shareholder Service Fees(1) (Note 4) | 12 | 2 | — | |||||||||
Administrative Services Fee, Retail Class Shares (Note 4) | 6 | 1 | — | |||||||||
Trustees’ Fees (Note 4) | 3 | 2 | — | |||||||||
Chief Compliance Officer Fees (Note 4) | 2 | 2 | — | |||||||||
Registration Fees | 21 | 24 | 3 | |||||||||
Transfer Agent Fees | 8 | 5 | 1 | |||||||||
Professional Fees | 6 | 4 | — | |||||||||
Printing Fees | 3 | 2 | — | |||||||||
Custodian Fees | 1 | 2 | 2 | |||||||||
Offering Costs | — | — | 35 | |||||||||
Insurance and Other Fees | 8 | 11 | 2 | |||||||||
Total Expenses | 450 | 175 | 56 | |||||||||
Fees Waived by Adviser (Note 4) | (13 | ) | (36 | ) | (12 | ) | ||||||
Reimbursement from Adviser (Note 4) | — | — | (27 | ) | ||||||||
Net Expenses | 437 | 139 | 17 | |||||||||
Net Investment Income (Loss) | (141 | ) | 1,226 | (13 | ) | |||||||
Net Realized and Unrealized Gain (Loss): | ||||||||||||
Net Realized Gain (Loss) From: | ||||||||||||
Investments | 3,707 | (235 | ) | (154 | ) | |||||||
Swap Contracts | (268 | ) | — | — | ||||||||
Net Realized Gain (Loss) | 3,439 | (235 | ) | (154 | ) | |||||||
Net Change in Unrealized Appreciation (Depreciation on: | ||||||||||||
Investments | 6,436 | 535 | 827 | |||||||||
Swap Contracts | (83 | ) | — | — | ||||||||
Net Change in Unrealized Appreciation (Depreciation) | 6,353 | 535 | 827 | |||||||||
Net Realized and Unrealized Gain | 9,792 | 300 | 673 | |||||||||
Net Increase in Net Assets Resulting from Operations | $ | 9,651 | $ | 1,526 | $ | 660 | ||||||
(1) | Attributable to Retail Class Shares only. |
Amounts designated as “—” are either not applicable, $0 or have been rounded to $0.
The accompanying notes are an integral part of the financial statements.
18
Statements of Operations (000) For the Six Month Period Ended |
|

Riverpark/Next | ||||
Investment Income: | ||||
Dividends | $ | 2 | ||
Interest | 1 | |||
Total Investment Income | 3 | |||
Expenses: | ||||
Investment Advisory Fees (Note 4) | 4 | |||
Adminstrative Services Fee, Institutional Class Shares (Note 4) | — | |||
Adminstrator Fees (Note 4) | — | |||
Shareholder Service Fees(1) (Note 4) | — | |||
Adminstrative Services Fee, Retail Class Shares (Note 4) | — | |||
Trustees’ Fees (Note 4) | — | |||
Chief Compliance Officer Fees (Note 4) | — | |||
Registration Fees | — | |||
Transfer Agent Fees | — | |||
Professional Fees | — | |||
Printing Fees | — | |||
Org & Offering Costs | 24 | |||
Custodian Fees | 1 | |||
Insurance and Other Fees | — | |||
Total Expenses | 29 | |||
Reimbursement from Adviser (Note 4) | (24 | ) | ||
Net Expenses | 5 | |||
Net Investment Loss | (2 | ) | ||
Net Realized and Unrealized Gain (Loss): | ||||
Net Realized Gain From: | ||||
Investments | 2 | |||
Net Realized Gain (Loss) | 2 | |||
Net Change in Unrealized Appreciation on: | ||||
Investments | 295 | |||
Net Change in Unrealized Appreciation (Depreciation) | 295 | |||
Net Realized and Unrealized Gain | 297 | |||
Net Increase in Net Assets Resulting from Operations | $ | 295 | ||
* | Commenced operations on close of business December 29, 2023. |
Amounts designated as “—” are either not applicable, $0 or have been rounded to $0.
The accompanying notes are an integral part of the financial statements.
19
Statements of Changes in Net Assets (000)
|
|

RiverPark Large Growth Fund | Wedgewood Fund | |||||||||||||||
Six Month Period | Year Ended | Six Month Period | Year Ended | |||||||||||||
Operations: | ||||||||||||||||
Net Investment Loss | $ | (64 | ) | $ | (239 | ) | $ | (49 | ) | $ | (76 | ) | ||||
Net Realized Gain | 2,553 | 1,813 | 2,565 | 523 | ||||||||||||
Net Change in Unrealized Appreciation | 8,332 | 7,660 | 3,722 | 4,855 | ||||||||||||
Net Increase in Net Assets Resulting from Operations | 10,821 | 9,234 | 6,238 | 5,302 | ||||||||||||
Distributions: | ||||||||||||||||
Institutional Class Shares | — | (1 | ) | (453 | ) | (2,523 | ) | |||||||||
Retail Class Shares | — | — | (169 | ) | (1,099 | ) | ||||||||||
Total Distributions to Shareholders | — | (1 | ) | (622 | ) | (3,622 | ) | |||||||||
Capital Share Transactions: | ||||||||||||||||
Institutional Class Shares: | ||||||||||||||||
Shares Issued | 93 | 2,724 | 222 | 1,976 | ||||||||||||
Shares Issued as Reinvestment of Distributions | — | 1 | 443 | 2,457 | ||||||||||||
Shares Redeemed | (2,191 | ) | (4,169 | ) | (3,501 | ) | (5,573 | ) | ||||||||
Net Decrease in Net Assets from Institutional Class Shares Transactions | (2,098 | ) | (1,444 | ) | (2,836 | ) | (1,140 | ) | ||||||||
Retail Class Shares: | ||||||||||||||||
Shares Issued | 2,206 | 336 | 38 | 137 | ||||||||||||
Shares Issued as Reinvestment of Distributions | — | — | 166 | 1,083 | ||||||||||||
Shares Redeemed | (4,027 | ) | (6,942 | ) | (983 | ) | (1,531 | ) | ||||||||
Net Decrease in Net Assets from Retail Class Shares Transactions | (1,821 | ) | (6,606 | ) | (779 | ) | (311 | ) | ||||||||
Net Decrease in Net Assets from Capital Share Transactions | (3,919 | ) | (8,050 | ) | (3,615 | ) | (1,451 | ) | ||||||||
Net Increase in Net Assets | 6,902 | 1,183 | 2,001 | 229 | ||||||||||||
Net Assets: | ||||||||||||||||
Beginning of period | 36,188 | 35,005 | 26,964 | 26,735 | ||||||||||||
End of period | $ | 43,090 | $ | 36,188 | $ | 28,965 | $ | 26,964 | ||||||||
Shares Issued and Redeemed: | ||||||||||||||||
Institutional Class Shares: | ||||||||||||||||
Shares Issued | 4 | 142 | 50 | 481 | ||||||||||||
Shares Issued as Reinvestment of Distributions | — | — | 96 | 660 | ||||||||||||
Shares Redeemed | (94 | ) | (233 | ) | (731 | ) | (1,330 | ) | ||||||||
Net Decrease in Institutional Class Shares | (90 | ) | (91 | ) | (585 | ) | (189 | ) | ||||||||
Retail Class Shares: | ||||||||||||||||
Shares Issued | 94 | 18 | 9 | 37 | ||||||||||||
Shares Issued as Reinvestment of Distributions | — | — | 40 | 324 | ||||||||||||
Shares Redeemed | (163 | ) | (386 | ) | (239 | ) | (413 | ) | ||||||||
Net Decrease in Retail Class Shares | (69 | ) | (368 | ) | (190 | ) | (52 | ) | ||||||||
Net Decrease in Share Transactions | (159 | ) | (459 | ) | (775 | ) | (241 | ) | ||||||||
The accompanying notes are an integral part of the financial statements.
20
Statements of Changes in Net Assets (000)
|
|

RiverPark Short Term High Yield Fund | RiverPark Long/Short Opportunity Fund | |||||||||||||||
Six Month Period | Year Ended | Six Month Period | Year Ended | |||||||||||||
Operations: | ||||||||||||||||
Net Investment Income (Loss) | $ | 21,819 | $ | 40,399 | $ | (141 | ) | $ | (661 | ) | ||||||
Net Realized Gain (Loss) | 826 | 1,462 | 3,439 | (11,151 | ) | |||||||||||
Net Change in Unrealized Appreciation | 2,738 | 6,893 | 6,353 | 24,519 | ||||||||||||
Net Increase in Net Assets Resulting from Operations | 25,383 | 48,754 | 9,651 | 12,707 | ||||||||||||
Distributions: | ||||||||||||||||
Institutional Class Shares | (22,493 | ) | (45,243 | ) | — | — | ||||||||||
Retail Class Shares | (575 | ) | (1,259 | ) | — | — | ||||||||||
Total Distributions to Shareholders | (23,068 | ) | (46,502 | ) | — | — | ||||||||||
Capital Share Transactions: | ||||||||||||||||
Institutional Class Shares: | ||||||||||||||||
Shares Issued | 104,034 | 182,983 | 3,907 | 3,515 | ||||||||||||
Shares Issued as Reinvestment of Distributions | 20,449 | 41,300 | — | — | ||||||||||||
Shares Redeemed | (105,233 | ) | (371,305 | ) | (8,737 | ) | (62,580 | ) | ||||||||
Net Increase (Decrease) in Net Assets from Institutional Class Shares Transactions | 19,250 | (147,022 | ) | (4,830 | ) | (59,065 | ) | |||||||||
Retail Class Shares: | ||||||||||||||||
Shares Issued | 2,194 | 5,453 | 2,011 | 1,855 | ||||||||||||
Shares Issued as Reinvestment of Distributions | 552 | 1,224 | — | — | ||||||||||||
Shares Redeemed | (3,361 | ) | (14,360 | ) | (3,821 | ) | (5,131 | ) | ||||||||
Net Decrease in Net Assets from Retail Class Shares Transactions | (615 | ) | (7,683 | ) | (1,810 | ) | (3,276 | ) | ||||||||
Net Increase (Decrease) in Net Assets from Capital Share Transactions | 18,635 | (154,705 | ) | (6,640 | ) | (62,341 | ) | |||||||||
Net Increase (Decrease) in Net Assets | 20,950 | (152,453 | ) | 3,011 | (49,634 | ) | ||||||||||
Net Assets: | ||||||||||||||||
Beginning of period | 772,437 | 924,890 | 42,294 | 91,928 | ||||||||||||
End of period | $ | 793,387 | $ | 772,437 | $ | 45,305 | $ | 42,294 | ||||||||
Shares Issued and Redeemed: | ||||||||||||||||
Institutional Class Shares: | ||||||||||||||||
Shares Issued | 10,744 | 18,943 | 333 | 369 | ||||||||||||
Shares Issued as Reinvestment of Distributions | 2,115 | 4,289 | — | — | ||||||||||||
Shares Redeemed | (10,871 | ) | (38,460 | ) | (719 | ) | (6,899 | ) | ||||||||
Net Increase (Decrease) in Institutional Class Shares | 1,988 | (15,228 | ) | (386 | ) | (6,530 | ) | |||||||||
Retail Class Shares: | ||||||||||||||||
Shares Issued | 228 | 566 | 167 | 182 | ||||||||||||
Shares Issued as Reinvestment of Distributions | 57 | 128 | — | — | ||||||||||||
Shares Redeemed | (349 | ) | (1,495 | ) | (316 | ) | (540 | ) | ||||||||
Net Decrease in Retail Class Shares | (64 | ) | (801 | ) | (149 | ) | (358 | ) | ||||||||
Net Increase (Decrease) in Share Transactions | 1,924 | (16,029 | ) | (535 | ) | (6,888 | ) | |||||||||
The accompanying notes are an integral part of the financial statements.
21
Statements of Changes in Net Assets (000)
|
|

RiverPark Floating Rate CMBS Fund | Riverpark/Next Century Growth Fund | |||||||||||||||
Six Month Period | Year Ended | Six Month Period | Period Ended | |||||||||||||
Operations: | ||||||||||||||||
Net Investment Income (Loss) | $ | 1,226 | $ | 2,716 | $ | (13 | ) | $ | (1 | ) | ||||||
Net Realized Loss | (235 | ) | (168 | ) | (154 | ) | (40 | ) | ||||||||
Net Change in Unrealized Appreciation (Depreciation) | 535 | 1,129 | 827 | (169 | ) | |||||||||||
Net Increase (Decrease) in Net Assets Resulting from Operations | 1,526 | 3,677 | 660 | (210 | ) | |||||||||||
Distributions: | ||||||||||||||||
Institutional Class Shares | (1,136 | ) | (2,564 | ) | — | — | ||||||||||
Retail Class Shares | (73 | ) | (113 | ) | — | — | ||||||||||
Total Distributions to Shareholders | (1,209 | ) | (2,677 | ) | — | — | ||||||||||
Capital Share Transactions: | ||||||||||||||||
Institutional Class Shares: | ||||||||||||||||
Shares Issued | 1,506 | 17,724 | 10,908 | 2,306 | ||||||||||||
Shares Issued as Reinvestment of Distributions | 785 | 1,912 | — | — | ||||||||||||
Shares Redeemed | (8,365 | ) | (20,784 | ) | (290 | ) | — | |||||||||
Net Increase (Decrease) in Net Assets from Institutional Class Shares Transactions | (6,074 | ) | (1,148 | ) | 10,618 | 2,306 | ||||||||||
Retail Class Shares: | ||||||||||||||||
Shares Issued | 2,742 | 3,471 | 12 | 33 | ||||||||||||
Shares Issued as Reinvestment of Distributions | 72 | 113 | — | — | ||||||||||||
Shares Redeemed | (966 | ) | (3,543 | ) | (14 | ) | — | |||||||||
Net Increase (Decrease) in Net Assets from Retail Class Shares Transactions | 1,848 | 41 | (2 | ) | 33 | |||||||||||
Net Increase (Decrease) in Net Assets from Capital Share Transactions | (4,226 | ) | (1,107 | ) | 10,616 | 2,339 | ||||||||||
Net Increase (Decrease) in Net Assets | (3,909 | ) | (107 | ) | 11,276 | 2,129 | ||||||||||
Net Assets: | ||||||||||||||||
Beginning of period | 36,098 | 36,205 | 2,129 | — | ||||||||||||
End of period | $ | 32,189 | $ | 36,098 | $ | 13,405 | $ | 2,129 | ||||||||
Shares Issued and Redeemed: | ||||||||||||||||
Institutional Class Shares: | ||||||||||||||||
Shares Issued | 173 | 2,048 | 1,098 | 232 | ||||||||||||
Shares Issued as Reinvestment of Distributions | 91 | 222 | — | — | ||||||||||||
Shares Redeemed | (967 | ) | (2,393 | ) | (30 | ) | — | |||||||||
Net Increase (Decrease) in Institutional Class Shares | (703 | ) | (123 | ) | 1,068 | 232 | ||||||||||
Retail Class Shares: | ||||||||||||||||
Shares Issued | 317 | 404 | 2 | 3 | ||||||||||||
Shares Issued as Reinvestment of Distributions | 8 | 13 | — | — | ||||||||||||
Shares Redeemed | (112 | ) | (411 | ) | (2 | ) | — | |||||||||
Net Increase in Retail Class Shares | 213 | 6 | — | 3 | ||||||||||||
Net Increase (Decrease) in Share Transactions | (490 | ) | (117 | ) | 1,068 | 235 | ||||||||||
Amounts designated as “—” are either not applicable, $0 or have been rounded to $0.
* | Commenced operations close of business June 30, 2023. |
The accompanying notes are an integral part of the financial statements.
22
Statements of Changes in Net Assets (000)
|
|

Riverpark/Next | ||||
Period Ended | ||||
Operations: | ||||
Net Investment Loss | $ | (2 | ) | |
Net Realized Gain | 2 | |||
Net Change in Unrealized Appreciation | 295 | |||
Net Increase in Net Assets Resulting from Operations | 295 | |||
Capital Share Transactions: | ||||
Institutional Class Shares: | ||||
Shares Issued | 2,100 | |||
Net Increase in Net Assets from Institutional Class Shares Transactions | 2,100 | |||
Net Increase in Net Assets from Capital Share Transactions | 2,100 | |||
Net Increase in Net Assets | 2,395 | |||
Net Assets: | ||||
Beginning of period | — | |||
End of period | $ | 2,395 | ||
Shares Issued and Redeemed: | ||||
Institutional Class Shares: | ||||
Shares Issued | 210 | |||
Net Increase in Institutional Class Shares | 210 | |||
Retail Class Shares: | ||||
Net Increase in Share Transactions | 210 | |||
Amounts designated as “—” are either not applicable, $0 or have been rounded to $0.
* | Commenced operations close of business December 29, 2023. |
The accompanying notes are an integral part of the financial statements.
23
Financial Highlights For a Share Outstanding Throughout Each Period |
|
| Net Asset | Net | Realized and | Total from | Distributions of | Distributions from | Total | |||||||||||||||||||||||||||||||||||||||||
RiverPark Large Growth Fund | ||||||||||||||||||||||||||||||||||||||||||||||||
Institutional Class Shares | ||||||||||||||||||||||||||||||||||||||||||||||||
2024† | $ | 20.52 | $ | (0.03 | ) | $ | 6.34 | $ | 6.31 | $ | — | $ | — | $ | — | |||||||||||||||||||||||||||||||||
2023 | 15.83 | (0.11 | ) | 4.80 | 4.69 | — | (2) | — | — | |||||||||||||||||||||||||||||||||||||||
2022 | 35.40 | (0.16 | ) | (15.33 | ) | (15.49 | ) | — | (4.08 | ) | (4.08 | ) | ||||||||||||||||||||||||||||||||||||
2021 | 28.43 | (0.16 | ) | 9.24 | 9.08 | — | (2.11 | ) | (2.11 | ) | ||||||||||||||||||||||||||||||||||||||
2020 | 22.61 | (0.07 | ) | 8.44 | 8.37 | — | (2.55 | ) | (2.55 | ) | ||||||||||||||||||||||||||||||||||||||
2019 | 25.45 | — | (2) | (0.05 | ) | (0.05 | ) | — | (2.79 | ) | (2.79 | ) | ||||||||||||||||||||||||||||||||||||
Retail Class Shares | ||||||||||||||||||||||||||||||||||||||||||||||||
2024† | $ | 19.73 | $ | (0.05 | ) | $ | 6.08 | $ | 6.03 | $ | — | $ | — | $ | — | |||||||||||||||||||||||||||||||||
2023 | 15.26 | (0.15 | ) | 4.62 | 4.47 | — | — | — | ||||||||||||||||||||||||||||||||||||||||
2022 | 34.36 | (0.23 | ) | (14.79 | ) | (15.02 | ) | — | (4.08 | ) | (4.08 | ) | ||||||||||||||||||||||||||||||||||||
2021 | 27.73 | (0.25 | ) | 8.99 | 8.74 | — | (2.11 | ) | (2.11 | ) | ||||||||||||||||||||||||||||||||||||||
2020 | 22.17 | (0.14 | ) | 8.25 | 8.11 | — | (2.55 | ) | (2.55 | ) | ||||||||||||||||||||||||||||||||||||||
2019 | 25.08 | (0.06 | ) | (0.06 | ) | (0.12 | ) | — | (2.79 | ) | (2.79 | ) | ||||||||||||||||||||||||||||||||||||
Wedgewood Fund | ||||||||||||||||||||||||||||||||||||||||||||||||
Institutional Class Shares | ||||||||||||||||||||||||||||||||||||||||||||||||
2024† | $ | 4.26 | $ | (0.01 | ) | $ | 1.05 | $ | 1.04 | $ | (0.10 | ) | $ | — | $ | (0.10 | ) | |||||||||||||||||||||||||||||||
2023 | 4.05 | (0.01 | ) | 0.81 | 0.80 | — | (0.59 | ) | (0.59 | ) | ||||||||||||||||||||||||||||||||||||||
2022 | 5.86 | (0.01 | ) | (1.10 | ) | (1.11 | ) | — | (0.70 | ) | (0.70 | ) | ||||||||||||||||||||||||||||||||||||
2021 | 8.33 | (0.02 | ) | 1.84 | 1.82 | — | (4.29 | ) | (4.29 | ) | ||||||||||||||||||||||||||||||||||||||
2020 | 9.12 | (0.02 | ) | 2.07 | 2.05 | — | (2.84 | ) | (2.84 | ) | ||||||||||||||||||||||||||||||||||||||
2019 | 19.91 | (0.01 | ) | (1.38 | ) | (1.39 | ) | — | (9.40 | ) | (9.40 | ) | ||||||||||||||||||||||||||||||||||||
Retail Class Shares | ||||||||||||||||||||||||||||||||||||||||||||||||
2024† | $ | 3.82 | $ | (0.01 | ) | $ | 0.93 | $ | 0.92 | $ | (0.10 | ) | $ | — | $ | (0.10 | ) | |||||||||||||||||||||||||||||||
2023 | 3.70 | (0.02 | ) | 0.73 | 0.71 | — | (0.59 | ) | (0.59 | ) | ||||||||||||||||||||||||||||||||||||||
2022 | 5.42 | (0.02 | ) | (1.00 | ) | (1.02 | ) | — | (0.70 | ) | (0.70 | ) | ||||||||||||||||||||||||||||||||||||
2021 | 8.01 | (0.03 | ) | 1.73 | 1.70 | — | (4.29 | ) | (4.29 | ) | ||||||||||||||||||||||||||||||||||||||
2020 | 8.89 | (0.04 | ) | 2.00 | 1.96 | — | (2.84 | ) | (2.84 | ) | ||||||||||||||||||||||||||||||||||||||
2019 | 19.71 | (0.04 | ) | (1.38 | ) | (1.42 | ) | — | (9.40 | ) | (9.40 | ) | ||||||||||||||||||||||||||||||||||||
The accompanying notes are an integral part of the financial statements.
24
|

Net Asset | Total Return* | Net Asset Value, | Ratio of Net | Ratio of Total | Ratio of Net | Portfolio | |||||||||||||||||||||
| $ | 26.83 | 30.75 | %‡ | $ | 30,266 | 1.00 | % | 1.01 | % | (0.23 | )% | 10 | %‡ | ||||||||||||||
| 20.52 | 29.64 | 24,999 | 1.00 | 1.01 | (0.57 | ) | 20 | ||||||||||||||||||||
| 15.83 | (49.30 | ) | 20,731 | 0.95 | 0.95 | (0.64 | ) | 89 | |||||||||||||||||||
| 35.40 | 33.14 | 39,489 | 0.91 | 0.91 | (0.46 | ) | 36 | ||||||||||||||||||||
| 28.43 | 40.78 | 29,296 | 0.93 | 0.93 | (0.30 | ) | 53 | ||||||||||||||||||||
| 22.61 | 2.18 | 24,786 | 0.95 | 0.95 | — | 58 | |||||||||||||||||||||
| $ | 25.76 | 30.61 | %‡ | $ | 12,824 | 1.25 | % | 1.27 | % | (0.47 | )% | 10 | %‡ | ||||||||||||||
| 19.73 | 29.29 | 11,189 | 1.25 | 1.31 | (0.81 | ) | 20 | ||||||||||||||||||||
| 15.26 | (49.44 | ) | 14,274 | 1.23 | 1.23 | (0.90 | ) | 89 | |||||||||||||||||||
| 34.36 | 32.73 | 49,259 | 1.20 | 1.20 | (0.76 | ) | 36 | ||||||||||||||||||||
| 27.73 | 40.38 | 34,798 | 1.23 | 1.23 | (0.59 | ) | 53 | ||||||||||||||||||||
| 22.17 | 1.91 | 29,521 | 1.23 | 1.23 | (0.27 | ) | 58 | ||||||||||||||||||||
| $ | 5.20 | 24.71 | %‡ | $ | 21,233 | 1.00 | % | 1.09 | % | (0.28 | )% | 5 | %‡ | ||||||||||||||
| 4.26 | 21.73 | 19,884 | 1.00 | 1.09 | (0.21 | ) | 15 | ||||||||||||||||||||
| 4.05 | (22.35 | ) | 19,682 | 1.00 | 1.01 | (0.28 | ) | 21 | |||||||||||||||||||
| 5.86 | 34.93 | 30,901 | 0.95 | 0.95 | (0.27 | ) | 16 | ||||||||||||||||||||
| 8.33 | 28.14 | 33,324 | 0.86 | 0.86 | (0.23 | ) | 75 | ||||||||||||||||||||
| 9.12 | 2.63 | 80,209 | 0.86 | 0.86 | (0.07 | ) | 28 | ||||||||||||||||||||
| $ | 4.64 | 24.40 | %‡ | $ | 7,732 | 1.25 | % | 1.31 | % | (0.53 | )% | 5 | %‡ | ||||||||||||||
| 3.82 | 21.33 | 7,080 | 1.25 | 1.34 | (0.46 | ) | 15 | ||||||||||||||||||||
| 3.70 | (22.52 | ) | 7,053 | 1.25 | 1.26 | (0.53 | ) | 21 | |||||||||||||||||||
| 5.42 | 34.66 | 10,372 | 1.24 | 1.24 | (0.56 | ) | 16 | ||||||||||||||||||||
| 8.01 | 27.74 | 9,606 | 1.13 | 1.13 | (0.51 | ) | 75 | ||||||||||||||||||||
| 8.89 | 2.34 | 12,236 | 1.13 | 1.13 | (0.34 | ) | 28 | ||||||||||||||||||||
* | Returns shown do not reflect the deduction of taxes that a shareholder would pay on Fund distributions or upon the redemption of Fund shares. |
† | Unless otherwise indicated, all ratios for the period have been annualized. |
‡ | Not Annualized. |
(1) | Per share data was calculated using average shares for the period. |
(2) | Amount represents less than $0.01 per share. |
The accompanying notes are an integral part of the financial statements.
25
Financial Highlights For a Share Outstanding Throughout Each Period |
|
| Net Asset | Net | Realized and | Total from | Distributions of | Distributions from | Total | |||||||||||||||||||||||||||||||||||||||||
RiverPark Short Term High Yield Fund | ||||||||||||||||||||||||||||||||||||||||||||||||
Institutional Class Shares | ||||||||||||||||||||||||||||||||||||||||||||||||
2024† | $ | 9.65 | $ | 0.27 | $ | 0.05 | $ | 0.32 | $ | (0.29 | ) | $ | — | $ | (0.29 | ) | ||||||||||||||||||||||||||||||||
2023 | 9.63 | 0.46 | 0.08 | 0.54 | (0.52 | ) | — | (0.52 | ) | |||||||||||||||||||||||||||||||||||||||
2022 | 9.67 | 0.19 | (0.02 | ) | 0.17 | (0.21 | ) | — | (0.21 | ) | ||||||||||||||||||||||||||||||||||||||
2021 | 9.65 | 0.19 | 0.02 | (2) | 0.21 | (0.19 | ) | — | (0.19 | ) | ||||||||||||||||||||||||||||||||||||||
2020 | 9.76 | 0.24 | (0.12 | ) | 0.12 | (0.23 | ) | — | (0.23 | ) | ||||||||||||||||||||||||||||||||||||||
2019 | 9.78 | 0.29 | (0.02 | ) | 0.27 | (0.29 | ) | — | (0.29 | ) | ||||||||||||||||||||||||||||||||||||||
Retail Class Shares | ||||||||||||||||||||||||||||||||||||||||||||||||
2024† | $ | 9.61 | $ | 0.26 | $ | 0.04 | $ | 0.30 | $ | (0.27 | ) | $ | — | $ | (0.27 | ) | ||||||||||||||||||||||||||||||||
2023 | 9.59 | 0.42 | 0.10 | 0.52 | (0.50 | ) | — | (0.50 | ) | |||||||||||||||||||||||||||||||||||||||
2022 | 9.63 | 0.16 | (0.01 | ) | 0.15 | (0.19 | ) | — | (0.19 | ) | ||||||||||||||||||||||||||||||||||||||
2021 | 9.61 | 0.17 | 0.02 | (2) | 0.19 | (0.17 | ) | — | (0.17 | ) | ||||||||||||||||||||||||||||||||||||||
2020 | 9.72 | 0.23 | (0.13 | ) | 0.10 | (0.21 | ) | — | (0.21 | ) | ||||||||||||||||||||||||||||||||||||||
2019 | 9.74 | 0.26 | (0.01 | ) | 0.25 | (0.27 | ) | — | (0.27 | ) | ||||||||||||||||||||||||||||||||||||||
RiverPark Long/Short Opportunity Fund | ||||||||||||||||||||||||||||||||||||||||||||||||
Institutional Class Shares | ||||||||||||||||||||||||||||||||||||||||||||||||
2024† | $ | 10.60 | $ | (0.03 | ) | $ | 2.54 | $ | 2.51 | $ | — | $ | — | $ | — | |||||||||||||||||||||||||||||||||
2023 | 8.46 | (0.12 | ) | 2.26 | 2.14 | — | — | — | ||||||||||||||||||||||||||||||||||||||||
2022 | 19.46 | (0.20 | ) | (10.80 | ) | (11.00 | ) | — | — | — | ||||||||||||||||||||||||||||||||||||||
2021 | 16.59 | (0.24 | ) | 3.11 | 2.87 | — | — | — | ||||||||||||||||||||||||||||||||||||||||
2020 | 12.59 | (0.16 | ) | 5.56 | 5.40 | (0.11 | ) | (1.29 | ) | (1.40 | ) | |||||||||||||||||||||||||||||||||||||
2019 | 13.95 | (0.10 | ) | 0.02 | (0.08 | ) | (0.11 | ) | (1.17 | ) | (1.28 | ) | ||||||||||||||||||||||||||||||||||||
Retail Class Shares | ||||||||||||||||||||||||||||||||||||||||||||||||
2024† | $ | 10.42 | $ | (0.04 | ) | $ | 2.49 | $ | 2.45 | $ | — | $ | — | $ | — | |||||||||||||||||||||||||||||||||
2023 | 8.32 | (0.13 | ) | 2.23 | 2.10 | — | — | — | ||||||||||||||||||||||||||||||||||||||||
2022 | 19.19 | (0.25 | ) | (10.62 | ) | (10.87 | ) | — | — | — | ||||||||||||||||||||||||||||||||||||||
2021 | 16.41 | (0.28 | ) | 3.06 | 2.78 | — | — | — | ||||||||||||||||||||||||||||||||||||||||
2020 | 12.46 | (0.21 | ) | 5.53 | 5.32 | (0.08 | ) | (1.29 | ) | (1.37 | ) | |||||||||||||||||||||||||||||||||||||
2019 | 13.81 | (0.13 | ) | 0.03 | (0.10 | ) | (0.08 | ) | (1.17 | ) | (1.25 | ) | ||||||||||||||||||||||||||||||||||||
The accompanying notes are an integral part of the financial statements.
26
|

Net Asset | Total Return* | Net Asset Value, | Ratio of Net | Ratio of Total | Ratio of Net | Portfolio | |||||||||||||||||||||
| $ | 9.68 | 3.32 | %‡ | $ | 773,389 | 0.94 | % | 0.94 | % | 5.60 | % | 175 | %‡ | ||||||||||||||
| 9.65 | 5.78 | 751,883 | 0.92 | 0.92 | 4.72 | 372 | |||||||||||||||||||||
| 9.63 | 1.82 | 896,699 | 0.90 | 0.90 | 1.99 | 164 | |||||||||||||||||||||
| 9.67 | 2.19 | 1,118,494 | 0.89 | 0.89 | 1.95 | 158 | |||||||||||||||||||||
| 9.65 | 1.26 | 653,883 | 0.90 | 0.90 | 2.45 | 266 | |||||||||||||||||||||
| 9.76 | 2.81 | 777,925 | 0.88 | 0.88 | 2.96 | 112 | |||||||||||||||||||||
| $ | 9.64 | 3.10 | %‡ | $ | 19,998 | 1.20 | % | 1.20 | % | 5.34 | % | 175 | %‡ | ||||||||||||||
| 9.61 | 5.54 | 20,554 | 1.19 | 1.19 | 4.42 | 372 | |||||||||||||||||||||
| 9.59 | 1.56 | 28,191 | 1.17 | 1.17 | 1.67 | 164 | |||||||||||||||||||||
| 9.63 | 1.95 | 66,020 | 1.14 | 1.14 | 1.76 | 158 | |||||||||||||||||||||
| 9.61 | 1.01 | 65,998 | 1.05 | 1.05 | 2.35 | 266 | |||||||||||||||||||||
| 9.72 | 2.56 | 31,196 | 1.18 | 1.18 | 2.68 | 112 | |||||||||||||||||||||
| $ | 13.11 | 23.68 | %‡ | $ | 35,878 | 1.85 | % | 1.88 | % | (0.57 | )% | 4 | %‡ | ||||||||||||||
| 10.60 | 25.30 | 33,113 | 1.85 | 1.89 | (1.21 | ) | 17 | ||||||||||||||||||||
| 8.46 | (56.53 | ) | 81,623 | 1.75 | 1.75 | (1.40 | ) | 51 | |||||||||||||||||||
| 19.46 | 17.30 | 452,886 | 1.73 | 1.73 | (1.29 | ) | 33 | ||||||||||||||||||||
| 16.59 | 47.71 | 304,772 | 1.75 | 1.75 | (1.12 | ) | 28 | ||||||||||||||||||||
| 12.59 | 0.75 | 79,984 | 2.18 | (3) | 2.18 | (0.83 | ) | 63 | |||||||||||||||||||
| $ | 12.87 | 23.51 | %‡ | $ | 9,427 | 2.00 | % | 2.15 | % | (0.72 | )% | 4 | %‡ | ||||||||||||||
| 10.42 | 25.24 | 9,181 | 2.00 | 2.14 | (1.36 | ) | 17 | ||||||||||||||||||||
| 8.32 | (56.64 | ) | 10,305 | 2.00 | 2.04 | (1.67 | ) | 51 | |||||||||||||||||||
| 19.19 | 16.94 | 71,339 | 2.00 | 2.03 | (1.52 | ) | 33 | ||||||||||||||||||||
| 16.41 | 47.47 | 64,411 | 2.00 | 2.03 | (1.41 | ) | 28 | ||||||||||||||||||||
| 12.46 | 0.50 | 4,012 | 2.38 | (3) | 2.48 | (1.04 | ) | 63 | |||||||||||||||||||
* | Returns shown do not reflect the deduction of taxes that a shareholder would pay on Fund distributions or upon the redemption of Fund shares. |
† | Unless otherwise indicated, all ratios for the period have been annualized. |
‡ | Not Annualized. |
(1) | Per share data was calculated using average shares for the period. |
(2) | Realized and unrealized gains and losses per share in this caption are balancing amounts necessary to reconcile the change in net asset value per share for the period, and may not reconcile with the aggregate gains and losses in the Statement of Operations due to share transactions for the period. |
(3) | Dividend expense and stock loan fee totaled 0.38% of average net assets for the period ended September 30, 2019. Had these expenses not been included the ratios would have been 1.80% and 2.00%, respectively. As of April 1, 2019, dividend expense and stock loan fees on short positions were eliminated on a going forward basis. |
The accompanying notes are an integral part of the financial statements.
27
Financial Highlights For a Share Outstanding Throughout Each Period |
|
| Net Asset | Net | Realized and | Total from | Distributions of | Distributions from | Total | |||||||||||||||||||||||||||||||||||||||||
RiverPark Floating Rate CMBS Fund | ||||||||||||||||||||||||||||||||||||||||||||||||
Institutional Class Shares | ||||||||||||||||||||||||||||||||||||||||||||||||
2024† | $ | 8.66 | $ | 0.34 | $ | 0.09 | $ | 0.43 | $ | (0.34 | ) | $ | — | $ | (0.34 | ) | ||||||||||||||||||||||||||||||||
2023 | 8.44 | 0.63 | 0.22 | 0.85 | (0.63 | ) | — | (0.63 | ) | |||||||||||||||||||||||||||||||||||||||
2022 | 8.93 | 0.24 | (0.50 | ) | (0.26 | ) | (0.23 | ) | — | (0.23 | ) | |||||||||||||||||||||||||||||||||||||
2021 | 9.02 | 0.22 | (0.08 | )(2) | 0.14 | (0.23 | ) | — | (0.23 | ) | ||||||||||||||||||||||||||||||||||||||
2020 | 9.98 | 0.31 | (0.97 | ) | (0.66 | ) | (0.30 | )** | — | (3) | (0.30 | ) | ||||||||||||||||||||||||||||||||||||
2019 | 10.14 | 0.36 | (0.06 | ) | 0.30 | (0.35 | ) | (0.11 | ) | (0.46 | ) | |||||||||||||||||||||||||||||||||||||
Retail Class Shares | ||||||||||||||||||||||||||||||||||||||||||||||||
2024† | $ | 8.61 | $ | 0.31 | $ | 0.10 | $ | 0.41 | $ | (0.33 | ) | $ | — | $ | (0.33 | ) | ||||||||||||||||||||||||||||||||
2023 | 8.41 | 0.61 | 0.20 | 0.81 | (0.61 | ) | — | (0.61 | ) | |||||||||||||||||||||||||||||||||||||||
2022 | 8.91 | 0.21 | (0.51 | ) | (0.30 | ) | (0.20 | ) | — | (0.20 | ) | |||||||||||||||||||||||||||||||||||||
2021 | 9.01 | 0.18 | (0.07 | )(2) | 0.11 | (0.21 | ) | — | (0.21 | ) | ||||||||||||||||||||||||||||||||||||||
2020 | 9.98 | 0.28 | (0.97 | ) | (0.69 | ) | (0.28 | )** | — | (3) | (0.28 | ) | ||||||||||||||||||||||||||||||||||||
2019(5) | 10.14 | 0.29 | (0.05 | ) | 0.24 | (0.29 | ) | (0.11 | ) | (0.40 | ) | |||||||||||||||||||||||||||||||||||||
Riverpark/Next Century Growth Fund | ||||||||||||||||||||||||||||||||||||||||||||||||
Institutional Class Shares | ||||||||||||||||||||||||||||||||||||||||||||||||
2024† | $ | 9.05 | $ | (0.04 | ) | $ | 1.28 | $ | 1.24 | $ | — | $ | — | $ | — | |||||||||||||||||||||||||||||||||
2023(6) | 10.00 | (0.01 | ) | (0.94 | ) | (0.95 | ) | — | — | — | ||||||||||||||||||||||||||||||||||||||
Retail Class Shares | ||||||||||||||||||||||||||||||||||||||||||||||||
2024† | $ | 9.03 | $ | (0.05 | ) | $ | 1.27 | $ | 1.22 | $ | — | $ | — | $ | — | |||||||||||||||||||||||||||||||||
2023(6) | 10.00 | (0.02 | ) | (0.95 | ) | (0.97 | ) | — | — | — | ||||||||||||||||||||||||||||||||||||||
Riverpark/Next Century Large Growth Fund | ||||||||||||||||||||||||||||||||||||||||||||||||
Institutional Class Shares | ||||||||||||||||||||||||||||||||||||||||||||||||
2024† (7) | $ | 10.00 | $ | (0.01 | ) | $ | 1.42 | $ | 1.41 | $ | — | $ | — | $ | — | |||||||||||||||||||||||||||||||||
Retail Class Shares | ||||||||||||||||||||||||||||||||||||||||||||||||
2024† (7) | $ | 10.00 | $ | (0.02 | ) | $ | 1.42 | $ | 1.40 | $ | — | $ | — | $ | — | |||||||||||||||||||||||||||||||||
The accompanying notes are an integral part of the financial statements.
28
|

Net Asset | Total Return* | Net Asset Value, | Ratio of Net | Ratio of Total | Ratio of Net | Portfolio | |||||||||||||||||||||
| $ | 8.75 | 5.17 | %‡ | $ | 28,978 | 0.85 | % | 1.08 | % | 7.79 | % | 18 | %‡ | ||||||||||||||
| 8.66 | 10.24 | 34,756 | 0.85 | 0.99 | 7.32 | 42 | |||||||||||||||||||||
| 8.44 | (2.98 | ) | 34,945 | 0.85 | 0.96 | 2.70 | 27 | ||||||||||||||||||||
| 8.93 | 1.61 | 44,527 | 0.85 | 0.94 | 2.44 | 45 | |||||||||||||||||||||
| 9.02 | (6.63 | ) | 333,855 | 0.85 | 0.87 | 3.31 | 85 | ||||||||||||||||||||
| 9.98 | 3.15 | 191,548 | 0.90 | (4) | 0.93 | 3.64 | 87 | ||||||||||||||||||||
| $ | 8.69 | 4.84 | %‡ | $ | 3,211 | 1.25 | % | 1.44 | % | 7.29 | % | 18 | %‡ | ||||||||||||||
| 8.61 | 9.89 | 1,342 | 1.25 | 1.34 | 7.12 | 42 | |||||||||||||||||||||
| 8.41 | (3.34 | ) | 1,260 | 1.25 | 1.30 | 2.39 | 27 | ||||||||||||||||||||
| 8.91 | 1.24 | 1,566 | 1.25 | 1.29 | 2.04 | 45 | |||||||||||||||||||||
| 9.01 | (6.96 | ) | 3,886 | 1.16 | 1.16 | 3.02 | 85 | ||||||||||||||||||||
| 9.98 | 2.50 | 2,329 | 1.24 | 1.24 | 3.24 | 87 | |||||||||||||||||||||
| $ | 10.29 | 13.70 | %‡ | $ | 13,371 | 1.15 | % | 3.68 | % | (0.86 | )% | 24 | %‡ | ||||||||||||||
| 9.05 | (9.50 | ) | 2,098 | 1.15 | 6.18 | (0.55 | ) | 9 | |||||||||||||||||||
| $ | 10.25 | 13.51 | %‡ | $ | 34 | 1.40 | % | 4.53 | % | (1.17 | )% | 24 | %‡ | ||||||||||||||
| 9.03 | (9.70 | ) | 31 | 1.40 | 5.89 | (0.78 | ) | 9 | |||||||||||||||||||
| $ | 11.41 | 14.10 | %‡ | $ | 2,394 | 1.00 | % | 5.23 | % | (0.38 | )% | 6 | %‡ | ||||||||||||||
| $ | 11.40 | 14.00 | %‡ | $ | 1 | 1.25 | % | 5.14 | % | (0.63 | )% | 6 | %‡ | ||||||||||||||
* | Returns shown do not reflect the deduction of taxes that a shareholder would pay on Fund distributions or upon the redemption of Fund shares. |
** | Includes return of capital of $0.0002 per share. |
† | Unless otherwise indicated, all ratios for the period have been annualized. |
‡ | Not Annualized. |
(1) | Per share data was calculated using average shares for the period. |
(2) | Realized and unrealized gains and losses per share in this caption are balancing amounts necessary to reconcile the change in net asset value per share for the period, and may not reconcile with the aggregate gains and losses in the Statement of Operations due to share transactions for the period. |
(3) | Amounts represent less than $0.01 per share. |
(4) | During the period, the Expense Limitation Agreement was amended on two separate occasions. The amendments were made effective March 21, 2019 and July 1, 2019 whereby the Total Annual Fund Operation Expenses After Fee Waiver and for Expense Reimbursement would not exceed, on an annual basis 0.90% and 0.85%, respectively for the Institutional Class Shares. |
(5) | Commenced operations on November 12, 2018. All ratios for the period have been annualized, except for the Total Return and Portfolio Turnover Rate. |
(6) | Commenced operations close of business June 30, 2023. All ratios for the period have been annualized, except for the Total Return and Portfolio Turnover Rate. |
(7) | Commenced operations close of business December 29, 2023. All ratios for the period have been annualized, except for the Total Return and Portfolio Turnover Rate. |
The accompanying notes are an integral part of the financial statements.
29
Notes to Financial Statements March 31, 2024 (Unaudited) |
|

1. Organization
RiverPark Funds Trust (the “Trust”), was formed on June 22, 2010 as an open-end registered management investment company under the Investment Act of 1940. As of March 31, 2024, the Trust was comprised of seven funds: the RiverPark Large Growth Fund, Wedgewood Fund, RiverPark Short Term High Yield Fund, RiverPark Long/Short Opportunity Fund, RiverPark Floating Rate CMBS Fund, RiverPark/Next Century Growth Fund and RiverPark/Next Century Large Growth Fund (each a “Fund” and collectively the “Funds”). The investment objective of the RiverPark Large Growth Fund, Wedgewood Fund and RiverPark/Next Century Growth Fund and the RiverPark/Next Century Large Growth Fund is to seek long term capital appreciation. The investment objective of the RiverPark Short Term High Yield Fund and the RiverPark Floating Rate CMBS Fund is to seek high current income and capital appreciation consistent with the preservation of capital. The investment objective of the RiverPark Long/Short Opportunity Fund is to seek long-term capital appreciation while managing downside volatility. Each of the Funds is diversified with the exception of the Wedgewood Fund, the RiverPark Floating Rate CMBS Fund and the RiverPark/Next Century Large Growth Fund which are non-diversified. Each Fund is registered to offer Institutional Class Shares and Retail Class Shares. Each of the Funds, except the RiverPark Short Term High Yield Fund, the RiverPark Floating Rate CMBS Fund, RiverPark/Next Century Growth Fund and RiverPark/Next Century Large Growth Fund, have registered Class C Shares but they are not intended to be offered at this time. Each class differs as to ongoing fees.
Effective as of 9 a.m. on October 11, 2023, Retail and Institutional Class Shares of the RiverPark Short Term High Yield Fund are open to purchase by all investors without restriction. The RiverPark Short Term High Yield Fund reserves the right, in its sole discretion, to reject any purchase order. Sales of Retail Class Shares and Institutional Class Shares of the RiverPark Short Term High Yield Fund may be restricted or reopened in the future.
RiverPark/Next Century Growth Fund commenced operations on close of business June 30, 2023.
RiverPark/Next Century Large Growth Fund commenced operations on close of business December 29, 2023.
2. Summary of Significant Accounting Policies
The following is a summary of significant accounting policies followed by the Trust in preparation of its financial statements. These policies are in conformity with accounting principles generally accepted in the United States of America (“GAAP”). The preparation of the financial statements in conformity with GAAP requires management to make estimates and assumptions that affect the reported amounts of assets and liabilities and disclosure of contingent assets and liabilities at the date of the financial statements and the reported amounts of increases and decreases in net assets from operations during the reporting period. Actual results could differ from those estimates. The Funds are investment companies and accordingly follow investment company accounting and reporting guidance of the Financial Accounting Standards Board (FASB) Accounting Standards Codification Topic 946 Financial Services – Investment Companies.
Valuation of Investments — Securities listed on a national securities exchange or traded on the NASDAQ system are valued on their last sale price. Portfolio securities traded on NASDAQ will be valued at the NASDAQ Official Closing Price on each business day for the New York Stock Exchange (“NYSE”). If there is no such reported sale on an exchange or NASDAQ, the portfolio security will be valued at the mean between the most recent quoted bid and asked price. Price information on listed securities is taken from the exchange where the security is primarily traded. Other equity securities and debt securities for which market quotations are readily available are valued at the mean between their bid and asked price, except that debt securities maturing within 60 days are valued on an amortized cost basis. Debt securities are valued according to the broadest and most representative market, which will ordinarily be over-the-counter. Debt securities may be valued based on prices provided by a pricing service when such prices are believed to reflect the fair value of such securities. Securities for which market quotations are not readily available are required to be fair valued under 1940 Act.
Rule 2a-5 under the 1940 Act, set forth requirements to determine fair value in good faith for purposes of the 1940 Act. The rule permits fund boards to designate a fund’s investment adviser to perform fair-value determinations, subject to board oversight and certain other conditions. The rule also defines when market quotations are “readily available” for purposes
30
Notes to Financial Statements March 31, 2024 (Unaudited) |
|

2. Summary of Significant Accounting Policies (continued)
of the 1940 Act and requires a fund to fair value a portfolio investment when a market quotation is not readily available. The SEC also adopted new Rule 31a-4 under the 1940 Act, which sets forth recordkeeping requirements associated with fair-value determinations. The compliance date for Rule 2a-5 and Rule 31a-4 was September 8, 2022.
RiverPark Advisors, LLC (“RiverPark”) serves as the Funds’ investment adviser (the “Adviser”). Pursuant to the requirements of Rule 2a-5, the Trust’s Board of Trustees has since designated the Adviser as the Board’s valuation designee to perform fair-value determinations for the Funds through a Fair Value Committee established by the Adviser and approved new Adviser Fair Value Procedures for the Funds. Prior to this designation of the Advisor by the Board, fair-value determinations were performed in accordance with the Trust’s Fair Value Procedures established by the Funds’ Board of Trustees and were implemented through a Fair Value Committee designated by the Board.
To the extent that a Fund invests in non-U.S. dollar denominated securities, the value of all assets and liabilities not denominated in United States dollars will be translated into United States dollars on the valuation date. Trading in securities on European and Far Eastern securities exchanges and over-the-counter markets is normally completed well before the close of business on each day the NYSE is open for business (a “business day”). In addition, European or Far Eastern securities trading generally or in a particular country or countries may not take place on all business days in New York. Furthermore, trading takes place in various foreign markets on days, which are not business days in New York, and on which net asset value is not calculated. Such calculation does not take place contemporaneously with the determination of the prices of the majority of the portfolio securities used in such calculation. Events affecting the values of portfolio securities that occur between the time their prices are determined and the close of the NYSE will not be reflected in a Fund’s calculation of net assets unless the Trustees deem that the particular event would materially affect net asset value, in which case an adjustment will be made.
Options are valued at the last quoted sales price. If there is no such reported sale on the valuation date, long positions are valued at the most recent bid price, and short positions are valued at the most recent ask price.
Foreign currency forward contracts are valued at the current day’s interpolated foreign exchange rate, as calculated using forward rates provided by an independent source.
Swaps are marked-to-market daily based upon quotations from market makers and the resulting changes in market values, are recorded as an unrealized gain or loss in the Statements of Operations.
In accordance with the authoritative guidance on fair value measurement and disclosure under GAAP, the Funds disclose the fair value of their investments in a hierarchy that prioritizes the inputs to valuation techniques used to measure the fair value. The objective of a fair value measurement is to determine the price that would be received to sell an asset or paid to transfer a liability in an orderly transaction between market participants at the measurement date (an exit price). Accordingly, the fair value hierarchy gives the highest priority to quoted prices (unadjusted) in active markets for identical assets or liabilities (Level 1) and the lowest priority to unobservable inputs (Level 3).
The three levels of the fair value hierarchy are described below:
● Level 1 — | Unadjusted quoted prices in active markets for identical, unrestricted assets or liabilities that the Funds have the ability to access at the measurement date; |
● Level 2 — | Other significant observable inputs (includes quoted prices for similar securities, interest rates, prepayment speeds, credit risk, referenced indices, quoted prices in inactive markets, adjusted quoted prices in active markets, etc.); and |
● Level 3 — | Prices, inputs or exotic modeling techniques which are both significant to the fair value measurement and unobservable (supported by little or no market activity). |
Investments are classified within the level of the lowest significant input considered in determining fair value. Investments classified within Level 3 whose fair value measurement considers several inputs may include Level 1 or Level 2 inputs as components of the overall fair value measurement.
31
Notes to Financial Statements March 31, 2024 (Unaudited) |
|

2. Summary of Significant Accounting Policies (continued)
For details of the investment classification, refer to the Schedules of Investments, lists of open forward currency contracts, and list of open swap contracts.
Written/Purchased Options — Each of the Funds may purchase call and put options on securities to seek capital growth or for hedging purposes. Each Fund may also write and sell covered call and put options as well as purchase and write options on stock indices (such as the S&P 500 Index) listed on domestic or foreign securities exchanges or traded in the over-the-counter market for hedging purposes. Additionally, the RiverPark Long/Short Opportunity Fund may sell uncovered call and put options on securities and stock indices. For the period ended March 31, 2024, the Funds did not hold any options.
The RiverPark Long/Short Opportunity Fund may invest up to 50% of the value of its assets, represented by premiums paid, to purchase call and put options on securities and securities indices. The Fund may write covered call and put options on securities and securities indices, so long as the aggregate nominal value does not exceed 200% of the value of its assets.
An option on a security provides the purchaser, or “holder,” with the right, but not the obligation, to purchase, in the case of a “call” option, or sell, in the case of a “put” option, the security or securities underlying the option, for a fixed exercise price up to a stated expiration date. The holder pays a nonrefundable purchase price for the option, known as the “premium.” The maximum amount of risk the purchaser of the option assumes is equal to the premium plus related transaction costs, although the entire amount may be lost. The risk of the seller, or “writer,” however, is potentially unlimited, unless the option is “covered,” which is generally accomplished through the writer’s ownership of the underlying security, in the case of a call option, or the writer’s segregation of an amount of cash or securities equal to the exercise price, in the case of a put option. If the writer’s obligation is not covered, it is subject to the risk of the full change in value of the underlying security from the time the option is written until exercise.
The realized and unrealized gain (loss) from purchased and written options, if any, are disclosed separately on the Statements of Operations.
Swap Agreements — The Funds may invest in equity-linked securities, including, but not limited to, participation notes, certificates, and equity swaps. Equity-linked securities are privately issued securities whose investment results are designed to correspond generally to the performance of a specified stock index or “basket” of stocks, or a single stock. To the extent that the Funds invest in equity-linked securities whose return corresponds to the performance of a foreign security index or one or more foreign stocks, investing in equity-linked securities will involve risks similar to the risks of investing in foreign securities and subject to each Fund’s restrictions on investments in foreign securities.
Equity swaps allow the parties to a swap agreement to exchange the dividend income or other components of return on an equity investment (for example, a group of equity securities or an index) for a component of return on another non-equity or equity investment. An equity swap may be used by a Fund to invest in a market without owning or taking physical custody of securities in circumstances in which direct investment may be restricted for legal reasons or is otherwise deemed impractical or disadvantageous. Equity swaps may also be used for hedging purposes or to seek to increase exposure and total return. A Fund’s ability to enter into certain swap transactions may be limited by tax considerations. The counterparty to an equity swap contract will typically be a bank, investment banking firm or broker/dealer.
Equity swaps are derivatives and their value can be very volatile. Equity swaps normally do not involve the delivery of securities or other underlying assets. Accordingly, the risk of loss with respect to equity swaps is normally limited to the net amount of payments that a Fund is contractually obligated to make. If the counterparty to an equity swap defaults, a Fund’s risk of loss consists of the net amount of payments that such Fund is contractually entitled to receive. Because some swap agreements have a leverage component, adverse changes in the value or level of the underlying asset, reference rate, or index can result in a loss substantially greater than the cost of the underlying asset without the use of leverage. In addition, the value of some components of an equity swap (such as the dividends on a common stock) may also be sensitive to changes in interest rates. To the extent that the Adviser does not accurately analyze and predict the potential
32
Notes to Financial Statements March 31, 2024 (Unaudited) |
|

2. Summary of Significant Accounting Policies (continued)
relative fluctuation of the components swapped with another party, a Fund may suffer a loss. Because equity swaps can be illiquid, a Fund may be unable to terminate its obligations when desired. When entering into swap contracts, a Fund must “set aside” liquid assets, or engage in other appropriate measures to “cover” its obligation under the swap contract.
Swaps are marked-to-market daily and are valued at the unrealized appreciation or depreciation on the instrument based upon quotations from market makers or a pricing service and the resulting changes in market values, if any, are recorded as an unrealized gain or loss in the Statements of Operations. Periodic reset payments on the total return swap are inclusive of interest, commissions and dividends, all of which are recorded as part of the net realized gains and losses in the Statements of Operations. For the period ended March 31, 2024, (subject to equity risk exposure) the average notional value of equity swaps for the Long/Short Opportunity Fund was as follows (000):
RiverPark Long/Short Opportunity Fund | ||||
Average Monthly Notional Value Long | $ | 2,951 | ||
Average Monthly Notional Value Short | $ | 9,169 |
There is the risk that the counterparty refuses to continue to enter into swap agreements with the Funds in the future, or requires increased fees, which could impair the Funds’ ability to achieve their investment objective. A counterparty may also increase its collateral requirements, which may limit the Funds’ ability to use leverage and reduce investment returns. In addition, if the Funds cannot locate a counterparty willing to enter into transactions with the Funds, they will not be able to implement their investment strategy. For the period ended March 31, 2024, the RiverPark Long/Short Opportunity Fund entered into swap agreements with only one counterparty, Goldman Sachs International.
To reduce counterparty risk with respect to Over-the-Counter (“OTC”) transactions, the Funds have entered into master netting arrangements, established within the Funds’ International Swap and Derivatives Association, Inc. (“ISDA”) master agreements, which allow the Funds to make (or to have an entitlement to receive) a single net payment in the event of default (close-out netting) for outstanding payables and receivables with respect to certain OTC positions in purchased equity options and swaps for each individual counterparty. In addition, the Funds may require that certain counterparties post cash and/or securities in collateral accounts to cover their net payment obligations for those derivative contracts subject to ISDA master agreements. If the counterparty fails to perform under these contracts and agreements, the cash and/or securities will be made available to the Funds.
33
Notes to Financial Statements March 31, 2024 (Unaudited) |
|

2. Summary of Significant Accounting Policies (continued)
The following is a summary by counterparty of the market value of swap agreements and collateral (received)/pledged for the RiverPark Long/Short Opportunity Fund as of March 31, 2024 (000)*†:
Gross Amounts not offset in the | ||||||||||||||||||||||||
| Gross | Gross | Net Amounts | Financial | Cash | Net Amount | ||||||||||||||||||
| $ | 1,600 | $ | — | $ | 1,600 | $ | (1,592 | ) | $ | — | $ | 8 | ||||||||||||
Gross Amounts not offset in the | ||||||||||||||||||||||||
| Gross | Gross | Net Amounts | Financial | Cash | Net Amount | ||||||||||||||||||
| $ | (1,592 | ) | $ | — | $ | (1,592 | ) | $ | 1,592 | $ | — | $ | — | |||||||||||
† | Net exposures represents the net receivable/(payable) that would be due from/to the counterparty in the event of default. Exposure from swaps can only be netted across transactions governed under the same master agreement with the same legal entity. |
* | Collateral received/pledged is limited to the net outstanding amount due to/from an individual counterparty. The actual collateral amount received/pledged may exceed this amount and may fluctuate in value. |
For financial reporting purposes, the Funds do not offset derivative assets and derivative liabilities that are subject to netting arrangements in the Statements of Assets and Liabilities. Bankruptcy or insolvency laws of a particular jurisdiction may impose restrictions on or prohibitions against the right of offset in bankruptcy, insolvency or other events.
Collateral terms are contract specific for OTC derivatives. For derivatives traded under an ISDA master agreement, the collateral requirements are typically calculated by netting the mark to market amount of each transaction under such agreement and comparing that amount to the value of any collateral currently pledged by the Funds or the counterparty.
For financial reporting purposes, cash collateral that has been pledged to cover obligations of the Funds, if any, is reported separately on the Statements of Assets and Liabilities as cash pledged as collateral. Non-cash collateral pledged by the Funds, if any, is noted in the Schedules of Investments. Generally, the amount of collateral due from or to a party must exceed a minimum transfer amount threshold before a transfer has to be made. To the extent amounts due to the Funds from its counterparties are not fully collateralized, contractually or otherwise, the Funds bear the risk of loss from counterparty nonperformance.
Master Limited Partnerships — The Funds may invest in master limited partnerships (“MLPs”). MLPs are limited partnerships or limited liability companies, whose partnership units or limited liability interests are listed and traded on a U.S. securities exchange, and are treated as publicly traded partnerships for federal income tax purposes. To qualify to be treated as a partnership for tax purposes, an MLP must receive at least 90% of its income from qualifying sources as set forth in Section 7704(d) of the Internal Revenue Code of 1986, as amended (the “Code”). These qualifying sources include interest, dividend, real property rent, gain from sale or other disposition of real property and income from activities such as
34
Notes to Financial Statements March 31, 2024 (Unaudited) |
|

2. Summary of Significant Accounting Policies (continued)
the exploration, development, mining, production, processing, refining, transportation, storage and marketing of mineral or natural resources. MLPs generally have two classes of owners, the general partner and limited partners. MLPs that are formed as limited liability companies generally have two analogous classes of owners, the managing member and the members. For purposes of this section, references to general partners also apply to managing members and references to limited partners also apply to members. The general partner is typically owned by a major energy company, an investment fund, the direct management of the MLP or is an entity owned by one or more of such parties. The general partner may be structured as a private or publicly traded corporation or other entity. The general partner typically controls the operations and management of the MLP through an equity interest of as much as 2% in the MLP plus, in many cases, ownership of common units and subordinated units. Limited partners own the remainder of the MLP through ownership of common units and have a limited role in the MLP’s operations and management.
An investment in MLP units involves certain risks which differ from an investment in the securities of a corporation. Holders of MLP units have limited control and voting rights on matters affecting the partnership. In addition, there are certain tax risks associated with an investment in MLP units and conflicts of interest exist between common unit holders and the general partner, including those arising from incentive distribution payments. As a partnership, an MLP has no tax liability at the entity level. If, as a result of a change in current law or a change in an MLP’s business, an MLP were treated as a corporation for federal income tax purposes, such MLP would be obligated to pay federal income tax on its income at the corporate tax rate. If an MLP were classified as a corporation for federal income tax purposes, the amount of cash available for distribution by the MLP would be reduced and distributions received by investors would be taxed under federal income tax laws applicable to corporate dividends (as dividend income, return of capital, or capital gain). Therefore, treatment of an MLP as a corporation for federal income tax purposes would result in a reduction in the after-tax return to investors, likely causing a reduction in the value of the Funds’ shares. Dividends from MLPs are recorded on the ex-dividend date.
Investment Transactions — Security transactions are accounted for on the trade date, the date the order to buy or sell is executed. Costs used in determining realized gains and losses on the sales of investment securities are those of the specific securities sold. Discounts or premiums are accreted or amortized to interest income using the effective interest method. Interest income is recognized on the accrual basis from settlement date. Dividend income and expenses and other distributions are recorded on the ex-dividend date, except certain dividends and distributions from foreign securities which are recorded as soon as a Fund is informed after the ex-dividend date. Withholding taxes on foreign dividends have been provided for in accordance with the Funds’ understanding of the applicable country’s tax rules and rates. The ability of issuers of debt securities held by the Funds to meet their obligations may be affected by economic and political developments in a specific country or region.
Defaulted Investments — Debt obligations may be placed on non-accrual status and related interest income may be reduced by ceasing current accruals and writing off interest receivable when the collection of all or a portion of interest has become doubtful based on consistently applied procedures. A debt obligation is removed from non-accrual status when the issuer resumes interest payments or when collectability of interest is reasonably assured.
Expenses — Expenses of the Trust that can be directly attributed to a particular Fund are borne by that Fund. Expenses which cannot be directly attributed to a Fund are apportioned among the Funds of the Trust based on the number of Funds and/or relative net assets.
Classes — Class specific expenses are borne by that class of shares. Income, realized and unrealized gains and losses and non-class specific expenses are allocated to the respective class on the basis of relative daily net assets.
Foreign Currency Translation — The books and records of the Funds are maintained in U.S. dollars. Investment securities and other assets and liabilities denominated in a foreign currency are translated into U.S. dollars on the date of valuation. The Funds do not isolate that portion of realized or unrealized gains and losses resulting from changes in the foreign exchange rate from fluctuations arising from changes in the market prices of the securities. These gains and losses are included in net realized and unrealized gains and losses on investments on the Statements of Operations. Net realized and unrealized gains and losses on foreign currency transactions represent net foreign exchange gains or losses from
35
Notes to Financial Statements March 31, 2024 (Unaudited) |
|

2. Summary of Significant Accounting Policies (continued)
foreign currency exchange contracts, disposition of foreign currencies, currency gains or losses realized between trade and settlement dates on securities transactions and the difference between the amount of the investment income and foreign withholding taxes recorded on the Fund’s books and the U.S. dollar equivalent amounts actually received or paid.
Forward Foreign Currency Exchange Contracts — Each Fund may, but is not obligated to, enter into forward foreign currency exchange contracts (“forward contracts”) in order to protect against uncertainty in the level of future foreign exchange rates in the purchases and sale of securities. A forward contract generally has no deposit requirement, and no commissions are charged at any stage for trades. Although foreign exchange dealers do not charge a fee for commissions, they do realize a profit based on the difference between the price at which they are buying and selling various currencies. Although forward contracts are intended to minimize currency risk — the risk of loss due to a decline in the value of the hedged currencies — at the same time, they tend to limit any potential gain which might result should the value of such currencies increase. As of March 31, 2024, the RiverPark Short Term High Yield Fund held forward contracts as currency hedges against foreign bonds. It is the Funds’ policy to present the gross unrealized appreciation and gross unrealized depreciation of the forward contracts separately on the Statements of Assets and Liabilities, as the Funds do not have a master netting agreement with the counterparty to the forward contracts. As of March 31, 2024, the RiverPark Short Term High Yield Fund entered into one-month forward contracts with one counterparty, Brown Brothers Harriman. In accordance with this policy, the unrealized appreciation and depreciation as of March 31, 2024, is presented as unrealized appreciation or depreciation on forward foreign currency contracts on the Statements of Assets and Liabilities. Realized and change in unrealized gains (losses) on forward foreign currency contracts are disclosed separately on the Statements of Operations.
For the period ended March 31, 2024, subject to currency risk exposure, the average balances of the forward contracts were as follows (000).
Average Monthly Notional Contracts: | ||||
RiverPark Short Term High Yield Fund | $ | 28,202 |
Dividends and Distributions to Shareholders — Dividends from net investment income are declared and paid to shareholders annually for the RiverPark Large Growth Fund, Wedgewood Fund, RiverPark Long/Short Opportunity Fund, RiverPark/Next Century Growth Fund and RiverPark/Next Century Large Growth Fund and declared and paid monthly for the RiverPark Short Term High Yield Fund and the RiverPark Floating Rate CMBS Fund. Dividends and distributions are recorded on the ex-dividend date. Any net realized capital gains will be distributed at least annually by the Funds.
Income Taxes — Each Fund intends to qualify or continue to qualify as a “regulated investment company” under Sub-chapter M of the Internal Revenue Code of 1986, as amended. If so qualified, each Fund will not be subject to federal income tax to the extent it distributes substantially all of its net investment income and net capital gains to its shareholders.
The Funds evaluate tax positions taken or expected to be taken in the course of preparing the Funds’ tax returns to determine whether it is “more-likely-than not” (i.e., greater than 50-percent) that each tax position will be sustained upon examination by a taxing authority based on the technical merits of the position. Tax positions not deemed to meet the more-likely-than-not threshold are recorded as a tax benefit or expense in the current year. The Funds did not record any tax provision in the current period. However, management’s conclusions regarding tax positions taken may be subject to review and adjustment at a later date based on factors including, but not limited to, examination by tax authorities (i.e., the last 3 tax year ends, as applicable), on-going analysis of, and changes to, tax laws, regulations and interpretations thereof.
As of and during the period ended March 31, 2024, the Funds did not have a tax liability for any unrecognized tax benefits. The Funds recognize interest and penalties, if any, related to unrecognized tax benefits as income tax expense in the Statements of Operations. During the period, the Funds did not incur any significant interest or penalties.
Cash and Cash Equivalents — Cash equivalents include short-term, highly liquid investments with a maturity date at time of purchase of three months or less. The Funds maintain cash and cash equivalent balances which, at times during the period, exceeded the $250,000 amount insured by the Federal Deposit Insurance Corporation. The Manager manages the risk of loss by banking with major institutions.
36
Notes to Financial Statements March 31, 2024 (Unaudited) |
|

2. Summary of Significant Accounting Policies (continued)
Deferred Offering Costs — Offering costs, including costs of printing initial prospectus, legal and registration fees, are amortized over twelve-months from inception of the Funds. During the period ended March 31, 2024, the RiverPark/Next Century Growth Fund and the RiverPark/Next Century Large Growth Fund expensed $35 (000) and $24 (000), respectively, in offering costs.
3. Derivatives Transactions
The following tables include exposure by type of risk on derivatives held throughout the period.
The fair value of derivative instruments as of March 31, 2024, was as follows:
Riverpark Short-Term High Yield Fund
Derivative Assets | Derivatives Liabilities | |||||||||
Statement of Assets | Fair Value | Statement of Assets | Fair Value | |||||||
Derivatives not accounted for as hedging instruments under GAAP: | ||||||||||
Foreign exchange contracts (Currency Risk) | Unrealized appreciation on forward foreign currency contracts | $ | 465 | Unrealized depreciation on forward foreign currency contracts | $ | 71 | ||||
Total Derivatives not accounted for as hedging instruments under GAAP | $ | 465 | $ | 71 | ||||||
Riverpark Long/Short Opportunity Fund
Derivative Assets | Derivatives Liabilities | |||||||||
Statement of Assets | Fair Value | Statement of Assets | Fair Value | |||||||
Derivatives not accounted for as hedging instruments under GAAP: | ||||||||||
Total Return Swap (Equity Risk) | Unrealized appreciation on swap contracts | $ | 1,600 | Unrealized depreciation on swap contracts | $ | (1,592 | ) | |||
Total Derivatives not accounted for as hedging instruments under GAAP | $ | 1,600 | $ | (1,592 | ) | |||||
37
Notes to Financial Statements March 31, 2024 (Unaudited) |
|

3. Derivatives Transactions (continued)
The effect of derivative instruments on the Statements of Operations for the period ended March 31, 2024, was as follows:
The amount of realized gain (loss) on derivatives recognized in income (000):
RiverPark Short Term | Forward | Purchased | Written | Swaps | Totals | |||||||||||||||
Foreign exchange contracts (Currency Risk) | $ | (237 | ) | $ | — | $ | — | $ | — | $ | (237 | ) | ||||||||
Total | $ | (237 | ) | $ | — | $ | — | $ | — | $ | (237 | ) | ||||||||
RiverPark Long/Short | Forward | Purchased | Written | Swaps | Totals | |||||||||||||||
Total return swap contracts (Equity Risk) | $ | — | $ | — | $ | — | $ | (268 | ) | $ | (268 | ) | ||||||||
Total | $ | — | $ | — | $ | — | $ | (268 | ) | $ | (268 | ) | ||||||||
The amount of unrealized appreciation (depreciation) on derivatives recognized in income (000):
RiverPark Short Term | Forward | Purchased | Written | Swaps | Totals | |||||||||||||||
Foreign exchange contracts (Currency Risk) | $ | 73 | $ | — | $ | — | $ | — | $ | 73 | ||||||||||
Total | $ | 73 | $ | — | $ | — | $ | — | $ | 73 | ||||||||||
RiverPark Long/Short | Forward | Purchased | Written | Swaps | Totals | |||||||||||||||
Total return swap contracts (Equity Risk) | $ | — | $ | — | $ | — | $ | (83 | ) | $ | (83 | ) | ||||||||
Total | $ | — | $ | — | $ | — | $ | (83 | ) | $ | (83 | ) | ||||||||
38
Notes to Financial Statements March 31, 2024 (Unaudited) |
|

4. Agreements
Investment Advisory Agreement — RiverPark Advisors, LLC (“RiverPark”) serves as the Funds’ investment adviser (the “Adviser”). The Adviser has contractually agreed to waive its fees and to absorb expenses of each Fund through January 31, 2025 to the extent necessary to ensure that ordinary operating expenses of each class (excluding interest, brokerage commissions, dividends on short sales and interest expense on securities sold short, not yet purchased, acquired fund fees and expenses and extraordinary expenses) do not exceed, on an annual basis, certain levels as set forth below.
The table below shows the rate of each Funds’ investment advisory fee and the Adviser’s contractual expense limitation for each Fund:
Fund | Advisory | Expense | Expense | Expense |
RiverPark Large Growth Fund | 0.65% | 1.00% | 1.25% | 2.00% |
Wedgewood Fund | 0.65% | 1.00% | 1.25% | 2.00% |
RiverPark Short Term High Yield Fund | 0.65% | 1.00% | 1.25% | N/A |
RiverPark Long/Short Opportunity Fund | 1.50% | 1.85% | 2.00% | 2.85% |
RiverPark Floating Rate CMBS Fund | 0.65% | 0.85% | 1.25% | N/A |
RiverPark/Next Century Growth Fund | 0.80% | 1.15% | 1.40% | N/A |
RiverPark/ Next Century Large Growth Fund | 0.65% | 1.00% | 1.25% | N/A |
* | Class C Shares are not currently being offered for sale to investors. |
The Funds have each agreed to repay the Adviser in the amount of any fees waived and Fund expenses absorbed, subject to the limitations that: (1) the reimbursement is made only for fees and expenses incurred not more than three years prior to the date of reimbursement; and (2) the reimbursement will not be made if it would cause the annual expense limitation in effect at the time of the waiver or at the time of the reimbursement to be exceeded. This arrangement will remain in effect unless and until the Board approves its modification or termination. The Adviser can recapture any fees it has waived within a three-year period subject to the applicable annual rates in the above table.
For the period ended March 31, 2024, the Adviser fee waiver analysis is as follows:
| Unexpired Fee | Fees Waived | Fees | Fee Waivers | Unexpired Fee | |||||||||||||||
RiverPark Large Growth Fund | $ | 10,399 | $ | 3,022 | $ | (193 | ) | $ | — | $ | 13,228 | |||||||||
Wedgewood Fund | 31,042 | 11,810 | — | — | 42,852 | |||||||||||||||
RiverPark Long/Short Opportunity Fund | 71,068 | 13,203 | — | — | 84,271 | |||||||||||||||
RiverPark Floating Rate CMBS Fund | 171,665 | 36,048 | — | — | 207,713 | |||||||||||||||
RiverPark/Next Century Growth Fund* | 26,975 | 39,253 | — | — | 66,228 | |||||||||||||||
RiverPark/Next Century Large Growth Fund** | — | 24,228 | — | — | 24,228 | |||||||||||||||
* | Commenced operations on close of business June 30, 2023. |
** | Commenced operations on close of business December 29, 2023. |
39
Notes to Financial Statements March 31, 2024 (Unaudited) |
|

4. Agreements (continued)
As of March 31, 2024, the amounts of waivers/reimbursements subject to recapture are as follows:
| Expiring | Expiring | Expiring | Expiring | Total | |||||||||||||||
RiverPark Large Growth | $ | — | $ | — | $ | 10,206 | $ | 3,022 | $ | 13,228 | ||||||||||
Wedgewood Fund | — | 5,315 | 25,727 | 11,810 | 42,852 | |||||||||||||||
RiverPark Long/Short Opportunity Fund | 23,350 | 14,766 | 32,952 | 13,203 | 84,271 | |||||||||||||||
RiverPark Floating Rate CMBS Fund | 77,127 | 41,934 | 52,604 | 36,048 | 207,713 | |||||||||||||||
RiverPark/Next Century Growth Fund* | — | — | 26,975 | 39,253 | 66,228 | |||||||||||||||
RiverPark/Next Century Large Growth Fund** | — | — | — | 24,228 | 24,228 | |||||||||||||||
* | Commenced operations close of business June 30, 2023. |
** | Commenced operations close of business December 29, 2023. |
RiverPark provides day-to-day portfolio management services to the RiverPark Large Growth Fund, RiverPark Long/Short Opportunity Fund and the RiverPark Floating Rate CMBS Fund. The Adviser has discretion to purchase and sell securities in accordance with these Funds’ objectives, policies, and restrictions.
RiverPark oversees the day-to-day portfolio management services provided by the following sub-advisers:
Fund | Investment Sub-Adviser |
Wedgewood Fund | Wedgewood Partners, Inc. |
RiverPark Short Term High Yield Fund | CrossingBridge Advisors, LLC* |
RiverPark/Next Century Growth Fund | Next Century Growth Investors, LLC |
RiverPark/Next Century Large Growth Fund | Next Century Growth Investors, LLC |
* | Effective March 9, 2024, Cohanzick Management, LLC transitioned its investment advisory business to its affiliate CrossingBridge Advisors, LLC. |
The discretion to purchase and sell securities in accordance with these Funds’ objectives, policies, and restrictions has been delegated by the Adviser to Wedgewood Partners, Inc., CrossingBridge Advisors, LLC and Next Century Growth Investors, LLC with regard to each respective Fund to which such parties serve as sub-adviser. The Adviser pays the sub-advisers a monthly fee based upon the net assets managed by such sub-adviser from the management fee paid to the Adviser pursuant to the Investment Advisory Agreement. The Funds are not responsible for the payment of the sub-advisory fees.
RiverPark (and its affiliated advisers) and Wedgewood may be considered to be affiliates as RiverPark shareholders own approximately 6% of Wedgewood Partners. For its services as sub-adviser to the Wedgewood Fund, Wedgewood is entitled to a fee to be paid from RiverPark’s adviser fee, and such fee is calculated daily and paid monthly at an annual rate of 0.325% of Wedgewood Fund’s average net assets.
Administrator, Custodian and Transfer Agent — SEI Investments Global Funds Services (the “Administrator”) serves as the Funds’ administrator pursuant to an Administration Agreement under which the Administrator provides administrative and accounting services. For these services, the Administrator is paid an asset-based fee, which will vary depending on the number of share classes and average daily net assets of the Fund. The Funds in the Trust are charged fees using a tiered fee structure on their total average net assets.
40
Notes to Financial Statements March 31, 2024 (Unaudited) |
|

4. Agreements (continued)
For the period ended March 31, 2024, the Funds incurred the following fees for these services in the table below:
Fund | Administration | |||
RiverPark Large Growth Fund | $ | 12,337 | ||
Wedgewood Fund | 8,505 | |||
RiverPark Short Term High Yield Fund | 234,505 | |||
RiverPark Long/Short Opportunity Fund | 13,880 | |||
RiverPark Floating Rate CMBS Fund | 9,490 | |||
Riverpark/Next Century Growth Fund* | 930 | |||
Riverpark/Next Century Large Growth Fund** | 344 | |||
* | Commenced operations on close of business June 30, 2023. |
** | Commenced operations on close of business December 29, 2023. |
Brown Brothers Harriman & Co. (the “Custodian”) serves as the Funds’ custodian pursuant to a Custodian Agreement.
SS&C Global Investor & Distribution Solutions, Inc. (the “Transfer Agent”) serves as the Funds’ transfer agent pursuant to an Agency Agreement.
Distribution Agreement — SEI Investments Distribution Co., a wholly-owned subsidiary of SEI Investments Company and an affiliate of the Administrator (the “Distributor”) serves as the Funds’ distributor pursuant to a Distribution Agreement.
The Trust has adopted a shareholder services plan under which a shareholder servicing fee may be paid at an annual rate of up to 0.25% of average daily net assets attributable to Retail Class Shares and Institutional Class Shares of the Funds to banks and their affiliates and other institutions, including broker-dealers, as compensation for providing non-distribution related shareholder services. As of March 31, 2024, there were no shareholder servicing fees charged to Institutional Class Shares.
The Trust has adopted an administrative services plan under which each Fund may pay a non-distribution related administrative services fee at an annual rate of up to 0.20% of the average daily net assets of the Retail Class Shares and 0.15% of the average daily net assets of the Institutional Class Shares, to financial institutions, retirement plans, broker-dealers, depository institutions, institutional shareholders of record, registered investment advisers and other financial intermediaries and various brokerage firms or other industry recognized service providers of fund supermarkets or similar programs who provide administrative, recordkeeping and support servicing to their customers.
For the Retail Class Shares, at no time will the shareholder servicing fees and the administrative servicing fees in the aggregate exceed on an annual basis 0.40% of the average daily net assets until changed by the Board of Trustees.
For the Institutional Class Shares, at no time will the shareholder servicing fees and the administrative servicing fees in the aggregate exceed on an annual basis 0.15% of the average daily net assets until changed by the Board of Trustees.
Other — Certain officers and Trustees of the Trust are also officers of the Adviser and the Administrator. Such officers are paid no fees by the Trust for serving as officers of the Trust.
The services provided by the Chief Compliance Officer (“CCO”) and any staff are paid for by the Funds as incurred. The services include regulatory oversight of the Trust’s Adviser, sub-advisers and service providers as required by SEC regulations.
41
Notes to Financial Statements March 31, 2024 (Unaudited) |
|

5. Investment Transactions
The cost of security purchases and proceeds from security sales and maturities, other than short-term investments, short sales, purchases to cover, written and purchased options, and short-term securities for the period ended March 31, 2024, were as follows:
Fund | Purchases | Proceeds from | ||||||
RiverPark Large Growth Fund | $ | 3,867 | $ | 7,251 | ||||
Wedgewood Fund | 1,384 | 6,389 | ||||||
RiverPark Short Term High Yield Fund | 749,719 | 364,876 | ||||||
RiverPark Long/Short Opportunity Fund | 1,640 | 9,822 | ||||||
RiverPark Floating Rate CMBS Fund | 4,987 | 9,807 | ||||||
Riverpark/Next Century Growth Fund | 11,199 | 913 | ||||||
Riverpark/Next Century Large Growth Fund* | 2,138 | 123 | ||||||
* | Commenced operations on close of business December 29, 2023. |
6. Federal Tax Information
The amount and character of income and capital gain distributions to be paid, if any, are determined in accordance with Federal income tax regulations, which may differ from U.S. GAAP. These book/tax differences may be temporary or permanent. To the extent these differences are permanent in nature, they are charged or credited to paid-in capital or distributable earnings, as appropriate, in the period that the differences arise.
Accordingly the following permanent differences are primarily attributable to net operating losses. Adjustments which have been classified to/from the following components of net assets are as follows (000):
Fund | Total | Paid-in Capital | ||||||
RiverPark Large Growth Fund | $ | 356 | $ | (356 | ) | |||
Wedgewood Fund | 17 | (17 | ) | |||||
RiverPark Long/Short Opportunity Fund | 672 | (672 | ) | |||||
Riverpark/Next Century Growth Fund | 3 | (3 | ) | |||||
42
Notes to Financial Statements March 31, 2024 (Unaudited) |
|

6. Federal Tax Information (continued)
The tax character of dividends and distributions declared during the last two years ended September 30, 2023 and 2022 was as follows (000):
Fund | Ordinary | Long-Term | Return of | Total | ||||||||||||
RiverPark Large Growth Fund | ||||||||||||||||
2023 | $ | 1 | $ | — | $ | — | $ | 1 | ||||||||
2022 | 2,479 | 7,771 | — | 10,250 | ||||||||||||
Wedgewood Fund | ||||||||||||||||
2023 | 48 | 3,574 | — | 3,622 | ||||||||||||
2022 | 47 | 4,890 | — | 4,937 | ||||||||||||
RiverPark Short Term High Yield Fund | ||||||||||||||||
2023 | 46,502 | — | — | 46,502 | ||||||||||||
2022 | 22,346 | — | — | 22,346 | ||||||||||||
RiverPark Long/Short Opportunity Fund | ||||||||||||||||
2023 | — | — | — | — | ||||||||||||
2022 | — | — | — | — | ||||||||||||
RiverPark Floating Rate CMBS Fund | ||||||||||||||||
2023 | 2,677 | — | — | 2,677 | ||||||||||||
2022 | 991 | — | — | 991 | ||||||||||||
Riverpark/Next Century Growth Fund* | ||||||||||||||||
2023 | — | — | — | — | ||||||||||||
* | Commenced operations on close of business June 30, 2023. |
As of September 30, 2023, the components of distributable earnings/(accumulated losses) on a tax basis were as follows (000):
Fund | Undistributed | Undistributed | Capital Loss | Post-October | Unrealized | Other Temporary | Late Year Loss | Total | ||||||||||||||||||||||||
RiverPark Large Growth Fund | $ | — | $ | — | $ | (547 | ) | $ | — | $ | 11,349 | $ | 3 | $ | (190 | ) | $ | 10,615 | ||||||||||||||
Wedgewood Fund | — | 622 | — | — | 8,615 | (2 | ) | (59 | ) | 9,176 | ||||||||||||||||||||||
RiverPark Short Term High Yield Fund | 2,522 | — | (28,652 | ) | — | (5,015 | ) | 3 | — | (31,142 | ) | |||||||||||||||||||||
RiverPark Long/Short Opportunity Fund | — | — | (62,149 | ) | (11,606 | ) | 8,265 | (730 | ) | — | (66,220 | ) | ||||||||||||||||||||
RiverPark Floating Rate CMBS Fund | 13 | — | (25,786 | ) | (1,099 | ) | (930 | ) | (1 | ) | — | (27,803 | ) | |||||||||||||||||||
Riverpark/Next Century Growth Fund | — | — | — | (35 | ) | (173 | ) | 1 | — | (207 | ) | |||||||||||||||||||||
Post-October losses represent losses realized on investment transactions from November 1, 2022 through September 30, 2023, that, in accordance with Federal income tax regulations, the Funds elect to defer and treat as having arisen in the following fiscal year.
43
Notes to Financial Statements March 31, 2024 (Unaudited) |
|

6. Federal Tax Information (continued)
Deferred late-year losses represent ordinary losses realized on investment transactions from January 1, 2023 through September 30, 2023 and specified losses realized on investment transactions from November 1, 2022 through September 30, 2023.
The RiverPark Long/Short Opportunity Fund, RiverPark/Next Century Growth Fund and RiverPark Floating Rate CMBS Fund had Post-October losses of $11,606,263, $35,438 and $1,098,854, respectively. The Funds elect to treat each as having arisen in the following fiscal year.
Funds are permitted to carry forward capital losses indefinitely and such losses will retain their character as either short-term or long-term. As of September 30, 2023, the Funds had capital loss carryforwards as follows (000):
Short-Term Loss | Long-Term Loss | Total | ||||||||||
RiverPark Large Growth Fund | $ | 547 | $ | — | $ | 547 | ||||||
RiverPark Short Term High Yield Fund | 13,507 | 15,145 | 28,652 | |||||||||
RiverPark Long/Short Opportunity Fund | 59,651 | 2,498 | 62,149 | |||||||||
RiverPark Floating Rate CMBS Fund | 15,630 | 10,156 | 25,786 | |||||||||
During the year ended September 30, 2023, the Funds did not utilize capital loss carryforwards to offset capital gains.
For federal income tax purposes, the cost of investments owned at March 31, 2024 and the net realized gains or losses on securities sold for the period could be different from amounts reported for financial reporting purposes, due to partnership basis adjustments and book versus tax adjustment such as wash sales which cannot be used for federal income tax purposes in the current year and have been deferred for use in future years. The federal tax cost and aggregate gross unrealized appreciation and depreciation on investments, foreign currency and derivatives held by the Funds were as follows (000):
Fund | Federal | Aggregate | Aggregate | Net | ||||||||||||
RiverPark Large Growth Fund | $ | 21,135 | $ | 21,853 | $ | (833 | ) | $ | 21,020 | |||||||
Wedgewood Fund | 15,385 | 12,733 | (43 | ) | 12,690 | |||||||||||
RiverPark Short Term High Yield Fund | 787,868 | 1,091 | (3,227 | ) | (2,136 | ) | ||||||||||
RiverPark Long/Short Opportunity Fund | 18,314 | 19,949 | (325 | ) | 19,624 | |||||||||||
RiverPark Floating Rate CMBS Fund | 31,905 | 71 | (382 | ) | (311 | ) | ||||||||||
Riverpark/Next Century Growth Fund | 12,294 | 768 | (110 | ) | 658 | |||||||||||
Riverpark/Next Century Large Growth Fund | 2,016 | 350 | (55 | ) | 295 | |||||||||||
7. Risks
The RiverPark Short Term High Yield Fund invests in fixed-income instruments that are or are rated below investment grade by Moody’s Investors Service, Inc. and Standard & Poor’s Corporation and accordingly involve greater risk. Such securities are regarded as predominantly speculative with respect to the issuer’s capacity to pay interest and repay principal in accordance with the terms of the obligations and involve major risk to adverse conditions. These securities offer higher returns than bonds with higher ratings as compensation for holding an obligation of an issuer perceived to be less creditworthy. Changes in economic conditions or developments regarding issuers of non-investment grade debt securities
44
Notes to Financial Statements March 31, 2024 (Unaudited) |
|

7. Risks (continued)
are more likely to cause price volatility and weaken the capacity of such issuers to make principal and interest payments than is the case for higher grade debt securities. In addition, the market for lower grade debt securities may be thinner and less active than for higher grade debt securities.
High-yield securities are generally not exchange-traded and, as a result, these instruments trade in a smaller secondary market than exchange-traded bonds. In addition, the Funds invest in bonds of issuers that do not have publicly traded equity securities, making it more difficult to hedge the risks associated with such investments.
The RiverPark Short Term High Yield Fund may invest in securities of companies that are experiencing significant financial or business difficulties, including companies involved in bankruptcy or other reorganization and liquidation proceedings. Although such investments may result in significant returns to the Funds, they involve a substantial degree of risk.
The RiverPark Long/Short Opportunity Fund is exposed to the risks of using leverage and short sales. The RiverPark Long/Short Opportunity Fund may use leverage. Leverage is the practice of borrowing money to purchase securities. These investment practices involve special risks. Leverage can increase the investment returns of the RiverPark Long/Short Opportunity Fund if the securities purchased increase in value in an amount exceeding the cost of the borrowing. However, if the securities decrease in value, the RiverPark Long/Short Opportunity Fund will suffer a greater loss than would have resulted without the use of leverage. A short sale is the sale by the RiverPark Long/Short Opportunity Fund of a security which it does not own in anticipation of purchasing the same security in the future at a lower price to close the short position. A short sale will be successful if the price of the shorted security decreases. However, if the underlying security goes up in price during the period in which the short position is outstanding, the RiverPark Long/Short Opportunity Fund will recognize a loss. The risk on a standalone or unhedged short sale is unlimited because the RiverPark Long/Short Opportunity Fund must buy the shorted security at the higher price to complete the transaction. Therefore, short sales may be subject to greater risks than investments in long positions. With a long position, the maximum sustainable loss is limited to the amount paid for the security plus the transaction costs, whereas there is no maximum attainable price of the shorted security.
The RiverPark Long/Short Opportunity Fund and RiverPark/Next Century Growth Fund are able to invest in options which expose investors to the risks inherent in trading options. These risks include, but are not limited to, volatile movements in the price of the underlying instrument and misjudgments as to the future prices of the options and/or the underlying instrument. Increased option volatility can increase both the profit potential and the risk associated with a fund’s trading. While volatility can be monitored and reacted to, there is no cost-effective means of hedging against market volatility.
Selling options creates additional risks. The seller of a “naked” call option (or the seller of a put option who has a short position in the underlying instrument) is subject to the risk of a rise in the price in the underlying instrument above the strike price, which risk is reduced only by the premium received for selling the option. In exchange for the proceeds received from selling the call option (in lieu of an outright short position), the option seller gives up (or will not participate in) all of the potential gain resulting from a decrease in the price of the underlying instrument below the strike price prior to expiration of the option.
The seller of a “naked” put option (or the seller of a call option who has a long position in the underlying instrument) is subject to the risk of a decline in price of the underlying instrument below the strike price, which risk is reduced only by the proceeds received from selling the option. In exchange for the premium received for selling the put option (in lieu of an outright long position), the option seller gives up (or will not participate in) all of the potential gain resulting from an increase in the price of the underlying instrument above the strike price prior to the expiration of the option. Due to the inherent leveraged nature of options, a relatively small adverse move in the price of the underlying instrument may result in immediate and substantial losses to a Fund.
The RiverPark Long/Short Opportunity Fund invests in swaps. The use of swaps is a highly specialized activity that involves investment techniques, risk analyses and tax planning different from those associated with ordinary portfolio securities transactions. These transactions can result in sizeable realized and unrealized capital gains and losses relative to the gains
45
Notes to Financial Statements March 31, 2024 (Unaudited) |
|

7. Risks (continued)
and losses from the Fund’s direct investments in the reference assets and short sales. Transactions in swaps can involve greater risks than if the RiverPark Long/Short Opportunity Fund had invested directly in the reference asset because, in addition to general market risks, swaps are also subject to liquidity risk, counterparty risk, credit risk and valuation risk. Because they are two-party contracts and because they may have terms of greater than seven days, swap transactions may be considered to be illiquid. Swaps may also be subject to pricing or “basis” risk, which exists when a particular swap becomes extraordinarily expensive relative to historical prices or the price of corresponding cash market instruments. Under certain market conditions it may not be economically feasible to initiate a transaction or liquidate a position in time to avoid a loss or take advantage of an opportunity. As a registered investment company, the Fund must “set aside” liquid assets (often referred to as “asset segregation”), or engage in other approved measures to “cover” open positions with respect to certain kinds of derivatives instruments. The Fund reserves the right to modify its asset segregation policies in the future to comply with any changes in the SEC’s positions regarding asset segregation.
The RiverPark Long/Short Opportunity Fund is exposed to counterparty credit risk through its investment in swap contracts. The RiverPark Long/Short Opportunity Fund bears the risk of loss of the amount expected to be received under a swap agreement in the event of default or bankruptcy of the counterparty, or if the counterparty fails to honor its obligations. The RiverPark Long/Short Opportunity Fund has entered into swap agreements with a single counterparty (Goldman Sachs International), focusing its exposure to the counterparty credit risk of that single counterparty. Furthermore, the swap counterparty’s obligation to the RiverPark Long/Short Opportunity Fund likely will not be collateralized. The RiverPark Long/Short Opportunity Fund typically resets swap agreements on a rolling 13-month basis.
The RiverPark Short Term High Yield Fund may invest in bank loan obligations. The secondary market for loans is a private, unregulated inter-dealer or inter-bank resale market. Purchases and sales of loans are generally subject to contractual restrictions that must be satisfied before a loan can be bought or sold. These restrictions may impede the Fund’s ability to buy or sell loans and may negatively impact the transaction price. It may take longer than seven days for transactions in loans to settle.
The Fund may hold cash, sell investments or temporarily borrow from banks or other lenders to meet short-term liquidity needs due to the extended loan settlement process, such as to satisfy redemption requests from Fund shareholders.
The Wedgewood Fund, RiverPark Floating Rate CMBS Fund and RiverPark/Next Century Large Growth Fund are non-diversified, which means that it may hold larger positions in a smaller number of individual securities than if it were diversified. This means that increases or decreases in the value of any of the individual securities owned by the Funds may have a greater impact on the Fund’s net asset value and total return than a diversified fund which would likely hold more securities. Therefore, the Fund’s value may fluctuate more, and it could incur greater losses as a result of decreases in the value of any one of its holdings, than if it had invested in a larger number of stocks.
The Information Technology sector is an important sector for growth-oriented strategies and thus may represent a large percentage of the investments of RiverPark Large Growth, RiverPark Long/Short, Wedgewood, RiverPark/Next Century Growth Fund and RiverPark/Next Century Large Growth Fund. The sector includes a number of important industries such as software & services, hardware & equipment, and semiconductors. Investments in Information Technology are potentially riskier than investments in more mature industries because the nature of technology is that it is rapidly changing. Therefore, products or services that may initially look promising may subsequently fail or become obsolete and barriers to entry are difficult to determine. Additionally, valuations are often higher, and price movements may be more volatile.
The RiverPark Floating Rate CMBS Fund will invest in commercial real estate debt securities (“CRE Debt”). CRE Debt securities are not backed by the full faith and credit of the U.S. government and are subject to risk of default on the underlying mortgages. CRE Debt may react differently to changes in interest rates than other bonds and the prices of CRE Debt may reflect adverse economic and market conditions. Small movements in interest rates may significantly reduce the value of CRE Debt.
46
Notes to Financial Statements March 31, 2024 (Unaudited) |
|

7. Risks (continued)
The CRE Debt securities in which the Fund is expected to invest are subject to the risks of the underlying mortgage loans. Commercial mortgage loans are secured by commercial property and are subject to risks of delinquency and foreclosure, and risks of loss. The ability of a borrower to repay a loan secured by an income-producing property typically is dependent primarily upon the successful operation of such property rather than upon the existence of independent income or assets of the borrower. If the net operating income of the property is reduced, the borrower’s ability to repay the loan may be impaired. Net operating income of an income-producing property can be affected by, among other things, tenant mix, success of tenant businesses, property management decisions, property location and condition, competition from comparable types of properties, changes in laws that increase operating expense or limit rents that may be charged, any need to address environmental contamination at the property, the occurrence of any uninsured casualty at the property, changes in national, regional or local economic conditions and/or specific industry segments, declines in regional or local real estate values, declines in regional or local rental or occupancy rates, increases in interest rates, real estate tax rates and other operating expenses, changes in governmental rules, regulations and fiscal policies, including environmental legislation, acts of God, terrorism, social unrest and civil disturbances.
Difficult conditions in the markets for CRE Debt securities and mortgage-related assets as well as the broader financial markets have in the past resulted in a temporary but significant contraction in liquidity for CRE Debt securities. Liquidity relates to the ability of the Fund to sell its investments in a timely manner at a price approximately equal to its value on the Fund’s books. To the extent that the market for CRE Debt securities suffers such a contraction, securities that were considered liquid at the time of investment could become temporarily illiquid, and the Advisor may experience delays or difficulty in selling assets at the prices at which the Fund carries such assets, which may result in a loss to the Fund. There is no way to predict reliably when such market conditions could re-occur or how long such conditions could persist.
CMBS may involve the risks of delinquent payments of interest and principal, early prepayments and potentially unrecoverable principal loss from the sale of foreclosed property. Subordinated classes of CMBS are generally entitled to receive repayment of principal only after all required principal payments have been made to more senior classes and also have subordinated rights as to receipt of interest distributions. Such subordinated classes are subject to a greater risk of non-payment than are senior classes.
Geopolitical and Health Crisis Risks. Geopolitical events and health crises, including pandemics, war, terrorism, trade disputes, government shutdowns, market closures, natural and environmental disasters, and other public health crises and related events and governments’ reactions to such events have led, and in the future may lead, to economic uncertainty, decreased economic activity, increased market volatility and other disruptive effects on U.S. and global economies and markets. The increasing interconnectedness of markets around the world may result in many markets being affected by such events even if they occur in a single country or region. Such events may have significant adverse direct or indirect effects on the Funds and their investments. A health crisis may also exacerbate other pre-existing risks.
CLOs (collateralized loan obligations) and other similarly structured securities are types of asset-backed securities. The cash flows from the CLO trust are split into two or more portions, called tranches, varying in risk and yield. The riskiest portion is the “equity” tranche which bears the bulk of defaults from the loans in the trust and serves to protect the other, more senior tranches from default. Since it is partially protected from defaults, a senior tranche from CLO trust typically has higher ratings and lower yields than the underlying securities, and can be rated investment grade. Despite the protection from the equity tranche, CLO tranches can experience substantial losses due to actual defaults, increased sensitivity to defaults due to collateral default and disappearance of protecting tranches, market anticipation of defaults and aversion to CLO securities as a class. The risks of an investment in a CLO depend largely on the collateral and the class of the CLO in which the Fund invests. Normally, CLOs and other similarly structured securities are privately offered and sold, and thus are not registered under the securities laws.
The RiverPark Short Term High Yield Fund may invest in securities that are purchased in private investment in public equity (“PIPE”) transactions. Securities acquired by the Fund in such transactions are subject to resale restrictions under securities laws. While issuers in PIPE transactions typically agree that they will register the securities for resale by the Fund after the transaction closes (thereby removing resale restrictions), there is no guarantee that the securities will in fact
47
Notes to Financial Statements March 31, 2024 (Unaudited) |
|

7. Risks (continued)
be registered. In addition, a PIPE issuer may require the Fund to agree to other resale restrictions as a condition to the sale of such securities. Thus, the Fund’s ability to resell securities acquired in PIPE transactions may be limited, and even though a public market may exist for such securities, the securities held by the Fund may be deemed illiquid.
The RiverPark Short Term High Yield Fund may invest in stock, warrants, and other securities of special purpose acquisition companies (“SPACs”) or similar special purpose entities that pool funds to seek potential acquisition opportunities. Unless and until an acquisition is completed, a SPAC generally invests its assets (less a portion retained to cover expenses) in U.S. Government securities, money market fund securities and cash; if an acquisition that meets the requirements for the SPAC is not completed within a pre-established period of time, the invested funds are returned to the entity’s shareholders. Because SPACs and similar entities are in essence blank check companies without an operating history or ongoing business other than seeking acquisitions, the value of their securities is particularly dependent on the ability of the entity’s management to identify and complete a profitable acquisition. Some SPACs may pursue acquisitions only within certain industries or regions, which may increase the volatility of their prices. In addition, these securities, which are typically traded in the over-the-counter market, may be considered illiquid and/or be subject to restrictions on resale.
A more complete description of risks is included in each Fund’s prospectus and statement of additional information.
8. Other
As of March 31, 2024, the Funds had the following concentrations of shareholders holding 10% or more of the outstanding shares of the Funds. These represent omnibus shareholder accounts comprised of one or many individual shareholders. As of March 31, 2024, the RiverPark/Next Century Large Growth Fund had two shareholders that beneficially owned 91% of the outstanding shares of the Institutional share class and one shareholder who owned 100% of the retail share class. These shareholders are also affiliated with the Adviser and sub-adviser of the Fund. As of the same date, the RiverPark Floating Rate CMBS Fund had one shareholder that owned 31% of the outstanding shares of the institutional share class.
Fund | |
RiverPark Large Growth Fund | |
Institutional Class Shares | 90% |
Retail Class Shares | 74% |
Wedgewood Fund | |
Institutional Class Shares | 66% |
Retail Class Shares | 58% |
RiverPark Short Term High Yield Fund | |
Institutional Class Shares | 75% |
Retail Class Shares | 80% |
RiverPark Long/Short Opportunity Fund | |
Institutional Class Shares | 77% |
Retail Class Shares | 83% |
RiverPark Floating Rate CMBS Fund |
|
Institutional Class Shares | 94% |
Retail Class Shares | 58% |
RiverPark/Next Century Growth Fund | |
Institutional Class Shares | 84% |
Retail Class Shares | 93% |
RiverPark/Next Century Large Growth Fund | |
Institutional Class Shares | 91% |
Retail Class Shares | 100% |
48
Notes to Financial Statements March 31, 2024 (Unaudited) |
|

8. Other (continued)
In the normal course of business, the Trust enters into contracts that contain a variety of representations which provide general indemnifications. The Trust’s maximum exposure under these arrangements cannot be known; however, the Trust expects any risk of loss to be remote.
9. Regulatory Matters
The U.K. Financial Conduct Authority stopped compelling or inducing banks to submit certain London Inter-Bank Offered Rate (LIBOR) rates. The publication of LIBOR on a representative basis ceased for the one-week and two-month U.S. dollar LIBOR settings immediately after December 31, 2021, and ceased for the remaining U.S. dollar LIBOR settings immediately after June 30, 2023. Investments impacted by the discontinuation of LIBOR may include bank loans, derivatives, floating rate securities, and other assets or liabilities tied to LIBOR. Actions by regulators have resulted in the establishment of alternative reference rates to LIBOR in most major currencies. The U.S. Federal Reserve, based on the recommendations of the New York Federal Reserve’s Alternative Reference Rate Committee (comprised of major derivative market participants and their regulators), has begun publishing a Secured Overnight Financing Rate (SOFR), which is intended to replace U.S. dollar LIBOR. Alternative reference rates for other currencies have also been announced or have already begun publication. In response to the discontinuation of LIBOR, investors have added fallback provisions to existing contracts for investments whose value is tied to LIBOR, with most fallback provisions requiring the adoption of SOFR as a replacement rate. On March 15, 2022, President Biden signed the Adjustable Interest Rate Act into law (the “LIBOR Act”), which, in conjunction with regulations adopted by the Federal Reserve Board, establishes SOFR as the default fallback rate for any U.S. contract without a fallback provision. In addition, on March 4, 2023, the U.K. Financial Conduct Authority announced that, starting July 1, 2023 and continuing through September 30, 2024, it will permit the publishing of 1-, 3- and 6-month synthetic U.S. dollar LIBOR settings based on SOFR to serve as a fallback for non-U.S. contracts.
10. Subsequent Events
The Funds have evaluated the need for additional disclosures and/or adjustments resulting from subsequent events through the date the financial statements were issued. Based on this evaluation, no adjustments were required to the financial statements.
49
Disclosure of Fund Expenses (Unaudited) |
|

All mutual funds have operating expenses. As a shareholder of a mutual fund, your investment is affected by these ongoing costs, which include (among others) costs for portfolio management, administrative services, and shareholder reports like this one. It is important for you to understand the impact of these costs on your investment returns.
Operating expenses such as these are deducted from a mutual fund’s gross income and directly reduce its final investment return. These expenses are expressed as a percentage of a mutual fund’s average net assets; this percentage is known as a mutual fund’s expense ratio.
The following examples use the expense ratio and are intended to help you understand the ongoing costs (in dollars) of investing in your Fund and to compare these costs with those of other mutual funds. The examples are based on an investment of $1,000 made at the beginning of the period shown and held for the entire period.
The table on the following page illustrates your Fund’s costs in two ways.
● Actual Fund Return. This section helps you to estimate the actual expenses after fee waivers that your Fund incurred over the period. The “Expenses Paid During Period” column shows the actual dollar expense incurred by a $1,000 investment in the Fund, and the “Ending Account Value” number is derived from deducting that expense from the Fund’s gross investment return.
You can use this information, together with the actual amount you invested in the Fund, to estimate the expenses you paid over that period. Simply divide your actual account value by $1,000 to arrive at a ratio (for example, an $8,600 account value divided by $1,000 = 8.6), then multiply that ratio by the number shown for your Fund under “Expenses Paid During Period”.
● Hypothetical 5% Return. This section helps you compare your Fund’s costs with those of other mutual funds. It assumes that the Fund had an annual 5% return before expenses during the year, but that the expense ratio (Column 3) for the period is unchanged. This example is useful in making comparisons because the Securities and Exchange Commission requires all mutual funds to make this 5% calculation. You can assess your Fund’s comparative cost by comparing the hypothetical result for your Fund in the “Expenses Paid During Period” column with those that appear in the same charts in the shareholder reports for other mutual funds.
Note: Because the return is set at 5% for comparison purposes — NOT your Fund’s actual return—the account values shown may not apply to your specific investment.
| Beginning | Ending | Net | Expenses | ||||||||||||
RiverPark Large Growth Fund — Institutional Class Shares | ||||||||||||||||
Actual Fund Return | $ | 1,000.00 | $ | 1,307.50 | 1.00 | % | $ | 5.77 | ||||||||
Hypothetical 5% Return | 1,000.00 | 1,020.00 | 1.00 | 5.05 | ||||||||||||
| ||||||||||||||||
RiverPark Large Growth Fund — Retail Class Shares | ||||||||||||||||
Actual Fund Return | 1,000.00 | 1,306.10 | 1.25 | 7.21 | ||||||||||||
Hypothetical 5% Return | 1,000.00 | 1,018.75 | 1.25 | 6.31 | ||||||||||||
| ||||||||||||||||
Wedgewood Fund — Institutional Class Shares | ||||||||||||||||
Actual Fund Return | 1,000.00 | 1,247.10 | 1.00 | % | $ | 5.62 | ||||||||||
Hypothetical 5% Return | 1,000.00 | 1,020.06 | 1.00 | 5.05 | ||||||||||||
| ||||||||||||||||
Wedgewood Fund — Retail Class Shares | ||||||||||||||||
Actual Fund Return | 1,000.00 | 1,244.00 | 1.25 | 7.01 | ||||||||||||
Hypothetical 5% Return | 1,000.00 | 1,018.75 | 1.25 | 6.31 | ||||||||||||
| ||||||||||||||||
50
Disclosure of Fund Expenses (Unaudited) (Concluded) |
|

| Beginning | Ending | Net | Expenses | ||||||||||||
RiverPark Short Term High Yield Fund — Institutional Class Shares | ||||||||||||||||
Actual Fund Return | $ | 1,000.00 | $ | 1,033.20 | 0.94 | % | $ | 4.78 | ||||||||
Hypothetical 5% Return | 1,000.00 | 1,020.30 | 0.94 | 4.75 | ||||||||||||
| ||||||||||||||||
RiverPark Short Term High Yield Fund — Retail Class Shares | ||||||||||||||||
Actual Fund Return | 1,000.00 | 1,031.00 | 1.20 | 6.09 | ||||||||||||
Hypothetical 5% Return | 1,000.00 | 1,019.00 | 1.20 | 6.06 | ||||||||||||
| ||||||||||||||||
RiverPark Long/Short Opportunity Fund — Institutional Class Shares | ||||||||||||||||
Actual Fund Return | 1,000.00 | 1,236.80 | 1.85 | % | $ | 10.35 | ||||||||||
Hypothetical 5% Return | 1,000.00 | 1,015.75 | 1.85 | 9.32 | ||||||||||||
| ||||||||||||||||
RiverPark Long/Short Opportunity Fund — Retail Class Shares | ||||||||||||||||
Actual Fund Return | 1,000.00 | 1,235.10 | 2.00 | 11.18 | ||||||||||||
Hypothetical 5% Return | 1,000.00 | 1,015.00 | 2.00 | 10.08 | ||||||||||||
| ||||||||||||||||
RiverPark Floating Rate CMBS Fund — Institutional Class Shares | ||||||||||||||||
Actual Fund Return | 1,000.00 | 1,051.70 | 0.85 | % | $ | 4.36 | ||||||||||
Hypothetical 5% Return | 1,000.00 | 1,020.75 | 0.85 | 4.29 | ||||||||||||
| ||||||||||||||||
RiverPark Floating Rate CMBS Fund — Retail Class Shares | ||||||||||||||||
Actual Fund Return | 1,000.00 | 1,048.40 | 1.25 | 6.40 | ||||||||||||
Hypothetical 5% Return | 1,000.00 | 1,018.75 | 1.25 | 6.31 | ||||||||||||
| ||||||||||||||||
Riverpark/Next Century Growth Fund — Institutional Class Shares | ||||||||||||||||
Actual Fund Return | 1,000.00 | 1,137.00 | 1.15 | % | $ | 6.14 | ||||||||||
Hypothetical 5% Return | 1,000.00 | 1,019.25 | 1.15 | 5.81 | ||||||||||||
| ||||||||||||||||
Riverpark/Next Century Growth Fund — Retail Class Shares | ||||||||||||||||
Actual Fund Return | 1,000.00 | 1,135.10 | 1.40 | 7.47 | ||||||||||||
Hypothetical 5% Return | 1,000.00 | 1,018.00 | 1.40 | 7.06 | ||||||||||||
| ||||||||||||||||
Riverpark/Next Century Large Growth Fund — Institutional Class Shares*** | ||||||||||||||||
Actual Fund Return | 1,000.00 | 1,141.00 | 1.00 | % | $ | 2.72 | ** | |||||||||
Hypothetical 5% Return | 1,000.00 | 1,010.16 | 1.00 | 2.55 | ** | |||||||||||
| ||||||||||||||||
Riverpark/Next Century Large Growth Fund — Retail Class Shares*** | ||||||||||||||||
Actual Fund Return | 1,000.00 | 1,140.00 | 1.25 | 3.40 | ** | |||||||||||
Hypothetical 5% Return | 1,000.00 | 1,009.53 | 1.25 | 3.19 | ** | |||||||||||
* | Expenses are equal to the Fund’s annualized expense ratio multiplied by the average account value over the account period, multiplied by 183/366 (to reflect the one-half year period). |
** | Expenses are equal to the Fund’s annualized expense ratio multiplied by the average account value over the period, multiplied by 93/366 (to reflect the period since inception). |
*** | Commenced operations close of business December 29, 2023. |
51
Approval of the Investment Advisory and Investment Sub-Advisory Agreements (Unaudited) |
|

Approval of Investment Advisory and Sub-Advisory Agreement for the RiverPark/Next Century Large Growth Fund (in this section, the “Fund”)
At the November 15, 2023 meeting of the Board of Trustees, Fund Counsel reviewed with the Board of Trustees, a memorandum, a copy of which had previously been provided to the Board, that described certain factors that the Board should consider with respect to the approval of the advisory and sub-advisory agreements for the Fund, including: (i) the nature, extent, and quality of services to be provided by the investment adviser and the sub-adviser, as appropriate, (ii) the investment performance of mutual funds with similar investment strategies, (iii) the proposed fees and estimated expenses under the investment advisory and sub-advisory agreements, (iv) the economies of scale expected to be achieved, and (v) the investment adviser’s anticipated profitability. Fund Counsel emphasized that the Trustees should also consider any additional factors they deem relevant and should use their own business judgment in determining the material factors to consider in evaluating the investment advisory and sub-advisory agreements and the weight to be given to each factor. Fund Counsel also noted that each Trustee may weigh the various factors differently in reaching his conclusions with respect to the investment advisory and sub-advisory agreements. Fund Counsel stated that to assist the Trustees in making a determination, comparative data (particularly as to fees and expenses and performance) for other mutual funds and peer groups was provided to the Trustees by the Adviser as part of the Board materials.
Executive Session of Independent Trustees
The Independent Trustees then met with Fund Counsel in executive session and considered, among other things, the adviser’s and the sub-adviser’s responses to the 15(c) questionnaires provided to them by Fund Counsel.
Investment Advisory Agreement Between RiverPark Advisors, LLC (the “Adviser”) and RiverPark Funds Trust
Nature, Extent and Quality of Service. The Trustees noted that the Adviser will provide trading, accounting, compliance, and marketing services to the Fund within the Trust. The Trustees reviewed the background information on the key personnel that will be responsible for advising the Fund, noting that the Adviser’s team has worked together for 20-25 years and has extensive experience and expertise in managing mutual funds and the operations of mutual funds. The Trustees indicated that they were satisfied with the experience of the Adviser’s employees that will be managing the Fund. The Trustees reviewed the Adviser’s plan with respect to risk management relating to the investment strategies of the Fund and the steps that will be used to mitigate the risks, including thoroughly researching investments to be included in the Fund’s portfolio. The Trustees noted their comfort with the Adviser’s experience in supervising sub-advisory relationships. The Trustees concluded that the Adviser would provide a high-caliber quality of service to the Fund for the benefit of its shareholders.
Performance. The Board noted that the Adviser provided the performance of a custom peer group in the Board materials, which included mutual funds that employ a similar large-cap equity strategy. The Trustees noted that they were familiar with the capabilities of the Adviser with respect to the other mutual funds it managed. The Trustees concluded that Fund’s overall performance was expected to be satisfactory.
Fees and Expenses. The Trustees expressed that they had reviewed the advisory fee to be paid by the Fund and the comparative data provided by the Adviser for the Fund. They agreed that the advisory fee structure was fair and competitive in comparison to other comparable mutual funds as well as other accounts managed by the Adviser. The Trustees also took into account that the Adviser had agreed to reimburse expenses to limit net annual operating expenses (exclusive of any, interest, brokerage commissions, dividends on short sales and interest expense on securities sold short, acquired fund fees and expenses and extraordinary expenses) to 1.25% and 1.00% of the average net assets of the Retail Class shares and the Institutional Class shares, respectively. After discussion, the Trustees concluded that the advisory fee to be paid to the Adviser by the Fund was not unreasonable and was within the range of fees charged by other comparable funds.
Economies of Scale. The Trustees considered whether the Adviser would realize economies of scale with respect to its management of the Fund. The Trustees concluded that at current and projected asset levels for the initial term of the Advisory Agreement, economies of scale were not a consideration at this time but that the Trustees would consider whether economies of scale exist in the future.
52
Approval of the Investment Advisory and Investment Sub-Advisory Agreements (Unaudited) (Continued) |
|

Profitability. The Trustees considered the proposed profitability of the Adviser and whether such profits would be reasonable in light of the services to be provided to the Fund by the Adviser. The Trustees reviewed estimated profitability analyses prepared by the Adviser and concluded that, based on the estimated costs of launching and managing the Fund during its first year of operations, the anticipated profitability, if any, of the Adviser from its relationship with the Fund did not appear to be excessive.
Conclusion. Having requested and received such information from the Adviser as the Trustees believed to be reasonably necessary to evaluate the terms of the advisory agreement, and as assisted by Fund Counsel, the Trustees concluded that the fee structure was reasonable and that the approval of the advisory agreement was in the best interests of the shareholders of the Fund. In considering the approval of the advisory agreement, the Trustees considered a variety of factors, including those discussed above, and also considered other factors (including conditions and trends prevailing generally in the economy, the securities markets, and the industry). The Trustees did not identify any one factor as determinative, and each Independent Trustee may have weighed each factor differently.
Sub-Advisory Agreement by and among RiverPark Advisors, LLC, Next Century Growth Investors LLC (“Next Century” or the “Sub-Adviser”) and RiverPark Funds Trust
Nature, Extent, and Quality of Service. The Trustees noted that Next Century would provide portfolio management and trading services to the Fund. The Trustees noted that Next Century currently provides investment sub-advisory services to the RiverPark/Next Century Growth Fund, a recently-launched series of the Trust. The Trustees reviewed materials provided by Next Century, including a description of Next Century’s trading process; an overview of the personnel that would perform services for the Fund and their background and experience; a summary of the financial condition of Next Century; Next Century’s compliance policies and procedures, including its business continuity and cybersecurity policies and a code of ethics containing provisions reasonably necessary to prevent Access Persons, as that term is defined in Rule 17j-1 under the 1940 Act, from engaging in conduct prohibited by Rule 17j-1(b); information regarding risk management processes and liquidity management; an annual review of the operation of Next Century’s compliance program; and information regarding Next Century’s compliance and regulatory history. The Trustees also considered Next Century’s experience managing accounts in the large-cap equity space. The Trustees discussed that they were comfortable with the strategies of the Fund and concluded that Next Century would deliver high quality service to the Fund and the Adviser for the benefit of the Fund’s shareholders.
Performance. The Trustees noted that the Next Century does not currently manage a comparable ETF or mutual fund with a performance track record for comparison; however, it does manage accounts with investment strategies similar to those that will be employed by the Fund. The Trustees considered that Next Century provided annual performance information for a composite account over the prior ten-year period. The Trustees concluded that Fund’s overall performance was expected to be satisfactory.
Fees and Expenses. The Trustees discussed the sub-advisory fees to be paid to Next Century and the sub-advisory services to be provided by Next Century to the Fund. The Trustees noted that such sub-advisory fees will be paid by the Adviser and not the Fund. After discussion, the Trustees concluded that the proposed sub-advisory fee was not unreasonable with respect to the Fund.
Economies of Scale. The Trustees considered whether Next Century would realize economies of scale with respect to the Fund. The Trustees concluded that at current and projected asset levels for the initial term of the Sub-Advisory Agreement, economies of scale were not a consideration at this time but that the Trustees would consider whether economies of scale exist in the future.
Profitability. The Trustees considered the proposed profitability of Next Century and whether such profits would be reasonable in light of the services to be provided to the Fund by Next Century. The Trustees reviewed estimated profitability analyses prepared by Next Century and concluded that, based on the estimated costs of launching and managing the Fund during its first year of operations, the anticipated profitability, if any, of Next Century from its relationship with the Fund did not appear to be excessive.
53
Approval of the Investment Advisory and Investment Sub-Advisory Agreements (Unaudited) (Concluded) |
|

Conclusion. Having requested and received such information from Next Century as the Trustees believed to be reasonably necessary to evaluate the terms of the sub-advisory agreement, and as assisted by Fund Counsel, the Trustees concluded that the fee structure was reasonable and that the approval of the sub-advisory agreement was in the best interests of the shareholders of the Fund. In considering the approval of the sub-advisory agreement, the Trustees considered a variety of factors, including those discussed above, and also considered other factors (including conditions and trends prevailing generally in the economy, the securities markets, and the industry). The Trustees did not identify any one factor as determinative, and each Independent Trustee may have weighed each factor differently.
54
(This page intentionally left blank)
(This page intentionally left blank)
(This page intentionally left blank)
INVESTMENT ADVISER
RiverPark Advisors, LLC
156 West 56th Street, 17th Floor
New York, New York 10019
CUSTODIAN
Brown Brothers Harriman & Co.
50 Post Office Square
Boston, Massachusetts 02110
PRIME BROKER
Goldman Sachs & Co.
200 West Street, 3rd Floor
New York, New York 10282
TRANSFER AGENT
SS&C Global Investor & Distribution Solutions, Inc.
333 West 11th Street, 5th Floor
Kansas City, Missouri 64105
ADMINISTRATOR
SEI Investments Global Funds Services
One Freedom Valley Drive
Oaks, Pennsylvania 19456
INDEPENDENT REGISTERED PUBLIC ACCOUNTING FIRM
Cohen & Company, Ltd.
1350 Euclid Avenue, Suite 800
Cleveland, Ohio 44115
DISTRIBUTOR
SEI Investments Distribution Co.
One Freedom Valley Drive
Oaks, Pennsylvania 19456
FUND COUNSEL
Blank Rome LLP
1271 Avenue of the Americas
New York, New York 10020
This information must be preceded or accompanied by a
current prospectus for the Trust.
RPF-SA-001-1400
(b) Not applicable.
Item 2. Code of Ethics.
Not applicable for semi-annual report.
Item 3. Audit Committee Financial Expert.
Not applicable for semi-annual report.
Item 4. Principal Accountant Fees and Services.
Not applicable for semi-annual report.
Item 5. Audit Committee of Listed Registrants.
Not applicable to unlisted registrants.
Item 6. Investments.
Schedule of Investments is included as part of the Report to Shareholders filed under Item 1 of this form.
Item 7. Disclosure of Proxy Voting Policies and Procedures for Closed-End Management Investment Companies.
Not applicable to open-end management investment companies.
Item 8. Portfolio Managers of Closed-End Management Investment Companies.
Not applicable to open-end management investment companies.
Item 9. Purchases of Equity Securities by Closed-End Management Company and Affiliated Purchasers.
Not applicable to open-end management investment companies.
Item 10. Submission of Matters to a Vote of Security Holders.
None.
Item 11. Controls and Procedures.
(a) The Registrant’s principal executive and principal financial officers, or persons performing similar functions, have concluded that the Registrant’s disclosure controls and procedures (as defined in Rule 30a-3(c) under the Act (17 CFR § 270.30a-3(c)) as of a date within 90 days of the filing date of the report, are effective based on the evaluation of these controls and procedures required by Rule 30a-3(b) under the Act (17 CFR § 270.30a-3(b)) and Rules 13a-15(b) or 15d-15(b) under the Exchange Act of 1934 (17 CFR § 240.13a-15(b) or § 240.15d-15(b)).
(b) There were no changes in the Registrant’s internal controls over financial reporting (as defined in Rule 30a-3(d) under the Act (17 CFR § 270.30a-3(d)) that occurred during the period covered by this report that has materially affected, or is reasonably likely to materially affect, the Registrant’s internal control over financial reporting.
Item 12. Disclosure of Securities Lending Activities for Closed-End Management Investment Companies.
Not applicable to open-end management investment companies.
Item 18. Recovery of Erroneously Awarded Compensation
(a) Not applicable.
(b) Not applicable.
Items 19. Exhibits.
(a)(1) Not applicable for semi-annual report.
(a)(2) Not applicable.
SIGNATURES
Pursuant to the requirements of the Securities Exchange Act of 1934 and the Investment Company Act of 1940, the Registrant has duly caused this report to be signed on its behalf by the undersigned, thereunto duly authorized.
| (Registrant) | RiverPark Funds Trust | |
| By (Signature and Title)* | /s/ Morty Schaja | |
| Morty Schaja, | ||
| Principal Executive Officer | ||
| Date: June 6, 2024 |
Pursuant to the requirements of the Securities Exchange Act of 1934 and the Investment Company Act of 1940, this report has been signed below by the following persons on behalf of the registrant and in the capacities and on the dates indicated.
| By (Signature and Title)* | /s/ Morty Schaja | |
| Morty Schaja, | ||
| Principal Executive Officer | ||
| Date: June 6, 2024 |
| By (Signature and Title)* | /s/ Andrew Metzger | |
| Andrew Metzger, | ||
| Principal Financial Officer | ||
| Date: June 6, 2024 |
* Print the name and title of each signing officer under his or her signature.