Healthcare Trust of America, Inc. Largest Dedicated Owner of Medical Office Properties Investor Presentation – July 2018
FORWARD LOOKING STATEMENTS This document contains both historical and forward‐looking statements. Forward‐looking statements are based on current expectations, plans, estimates, assumptions and beliefs, including expectations, plans, estimates, assumptions and beliefs about our company, the real estate industry, pending acquisitions, future medical office building performance and the debt and equity capital markets. All statements other than statements of historical fact are, or may be deemed to be, forward‐looking statements within the meaning of Section 27A of the Securities Act of 1933, as amended, and Section 21E of the Securities Exchange Act of 1934, as amended. Forward‐looking statements include information concerning possible or assumed future results of operations of our Company. The forward‐looking statements included in this document are subject to numerous risks and uncertainties that could cause actual results to differ materially from those expressed or implied in the forward‐looking statements. Assumptions relating to the foregoing involve judgments with respect to, among other things, future economic, competitive and market conditions and future business decisions, all of which are difficult or impossible to predict accurately and many of which are beyond our control. Although we believe that the expectations reflectedinsuchforward‐lookingstatementsarebasedonreasonable assumptions, our actual results and performance could differ materially from those set forth in the forward‐looking statements. Factors which could have a material adverse effect on our operations and future prospects include, but are not limited to: changes in economic conditions affecting the healthcare property sector, the commercial real estate market and the credit market; our ability to complete our pending acquisitions; competition for acquisition of medical office buildings and other facilities that serve the healthcare industry; economic fluctuations in certain states in which our property investments are geographically concentrated; retention of our senior management team; financial stability and solvency of our tenants; supply and demand for operating properties in the market areas in which we operate; our ability to acquire properties, and to successfully operate those properties once acquired; changes in property taxes; legislative and regulatory changes, including changes to laws governing the taxation of REITs and changes to laws governing the healthcare industry; fluctuations in reimbursements from third party payors such as Medicare and Medicaid; changes in interest rates; the availability of capital and financing; restrictive covenants in our credit facilities; changes in our credit ratings; our ability to remain qualified as a REIT; and the risk factors set forth in our 2017 Annual Report on Form 10‐K filed on February 20, 2018. Forward‐looking statements speak only as of the date made. Except as otherwise required by the federal securities laws, we undertake no obligation to update any forward‐looking statements to reflect the events or circumstances arising after the date as of which they are made. As a result of these risks and uncertainties, readers are cautioned not to place undue reliance on the forward looking statements included in this document or that may be made elsewhere from time to time by, or on behalf of, us. For definitions of terms and reconciliations for certain financial measures disclosed herein, including, but not limited to, funds from operations(FFO), normalized funds from operations (Normalized FFO), annualized base rents (ABR), net operating income (NOI), and on‐campus/aligned, please see our Company’s earnings press release issued on February 15, 2018 and our Company’s Supplemental Financial Package for the quarter and year ended December 31, 2017, each of which is available in the investor relations section of our Company’s website located at www.htareit.com. www.htareit.com Leading owner of Medical Office Buildings Investor Presentation | July 2018 PAGE 2
Near Term Strategy 1. Drive Same Store Growth of 2‐3% due to a combination of: • Revenue growth from improving lease rates, increased occupancy levels and in‐place escalators ‐‐ while at the same time keeping TI costs low. • Expense savings as we leverage economies of scale and rebid national vendor contracts across platform. 2. Optimize Portfolio for Long Term Profitability • Recycle out of non core markets; use proceeds to pay down debt or redeploy into key markets. • Redeployment will be a combination of development and/or acquisitions that are accretive to shareholders. In addition, will optimize firm profitability as the portfolio will be located in faster growing markets and the concentration leverages the asset management platform. 3. Balance Sheet • Will lower leverage as we pay off DRE seller financing in Q218. • Balance Sheet remains strong with $1.1 billion in liquidity and limited NT maturities. www.htareit.com Leading owner of Medical Office Buildings Investor Presentation | July 2018 PAGE 3
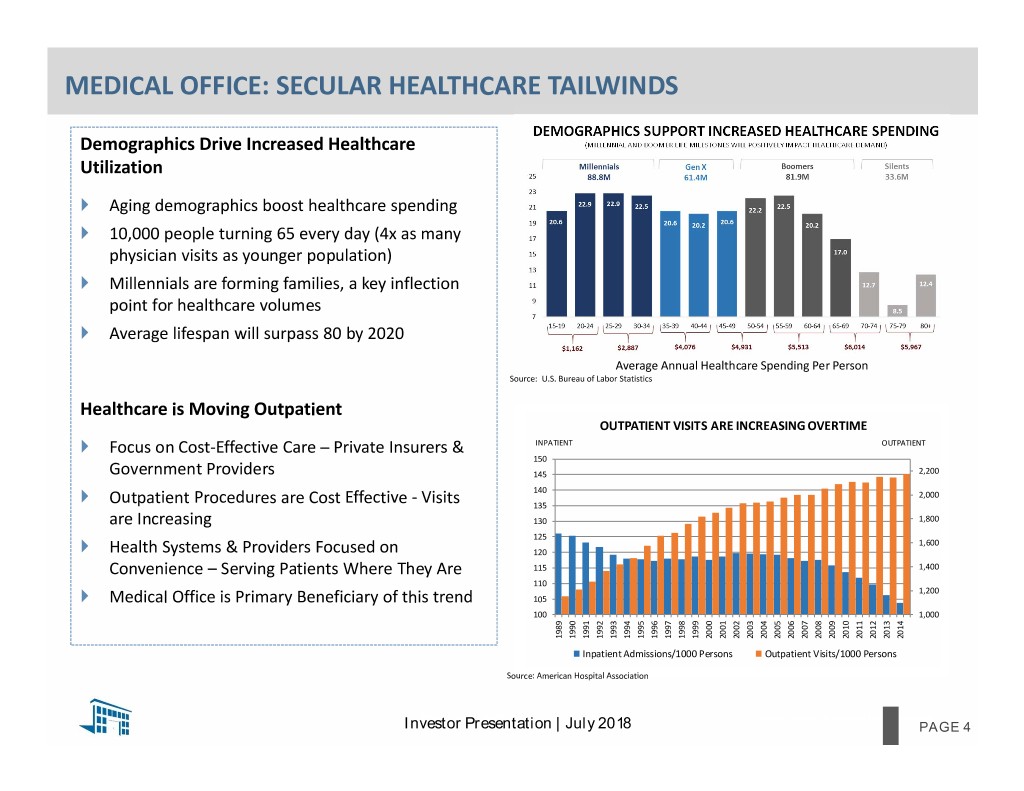
MEDICAL OFFICE: SECULAR HEALTHCARE TAILWINDS DEMOGRAPHICS SUPPORT INCREASED HEALTHCARE SPENDING Demographics Drive Increased Healthcare (MILLENNIAL AND BOOMER LIFE MILESTONES WILL POSITIVELY IMPACT HEALTHCARE DEMAND) Utilization Aging demographics boost healthcare spending 10,000 people turning 65 every day (4x as many physician visits as younger population) Millennials are forming families, a key inflection point for healthcare volumes Average lifespan will surpass 80 by 2020 Average Annual Healthcare Spending Per Person Source: U.S. Bureau of Labor Statistics Healthcare is Moving Outpatient OUTPATIENT VISITS ARE INCREASING OVERTIME Focus on Cost‐Effective Care – Private Insurers & INPATIENT OUTPATIENT 150 Government Providers 145 2,200 140 2,000 Outpatient Procedures are Cost Effective ‐ Visits 135 are Increasing 130 1,800 125 1,600 Health Systems & Providers Focused on 120 Convenience – Serving Patients Where They Are 115 1,400 110 1,200 Medical Office is Primary Beneficiary of this trend 105 100 1,000 1989 1990 1991 1992 1993 1994 1995 1996 1997 1998 1999 2000 2001 2002 2003 2004 2005 2006 2007 2008 2009 2010 2011 2012 2013 2014 Inpatient Admissions/1000 Persons Outpatient Visits/1000 Persons Source: American Hospital Association www.htareit.com Leading owner of Medical Office Buildings Investor Presentation | July 2018 PAGE 4
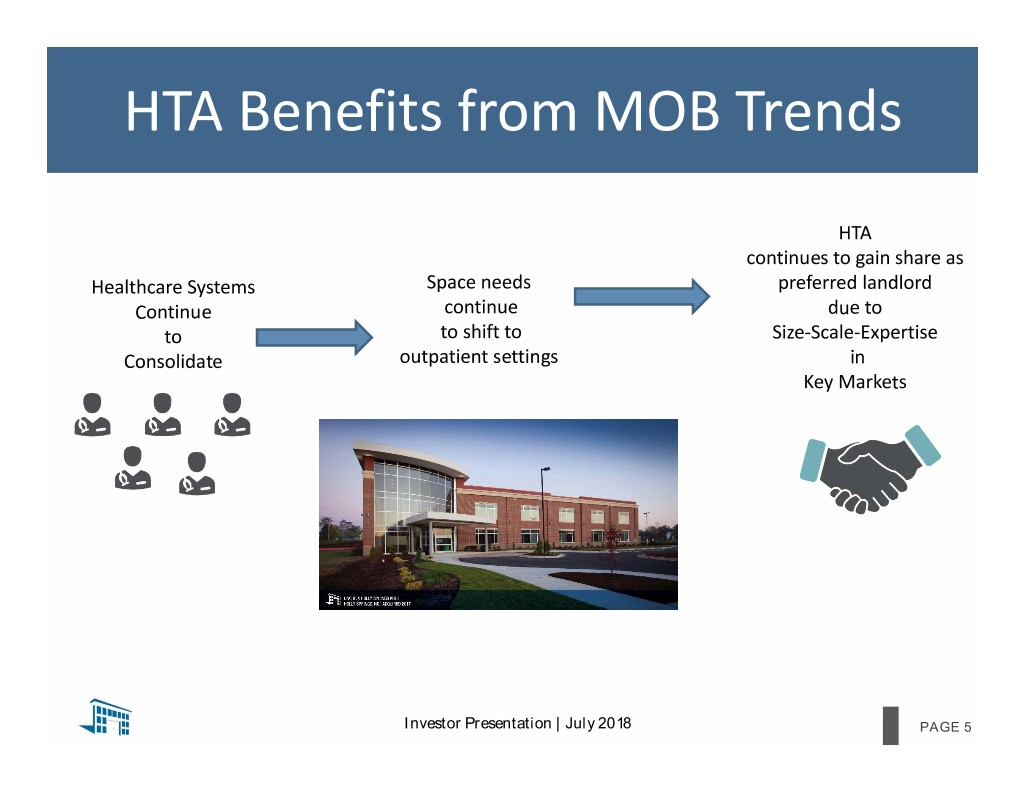
HTA Benefits from MOB Trends HTA continues to gain share as Healthcare Systems Space needs preferred landlord Continue continue due to to to shift to Size‐Scale‐Expertise Consolidate outpatient settings in Key Markets www.htareit.com Leading owner of Medical Office Buildings Investor Presentation | July 2018 PAGE 55
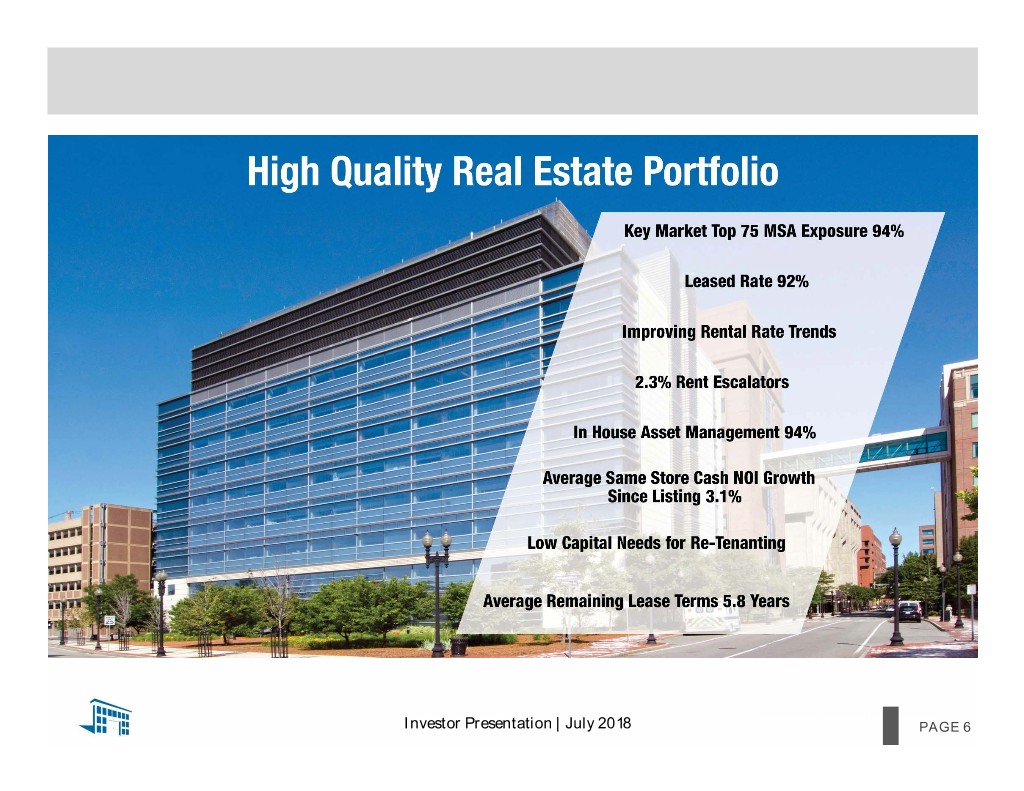
www.htareit.com Leading owner of Medical Office Buildings Investor Presentation | July 2018 PAGE 6
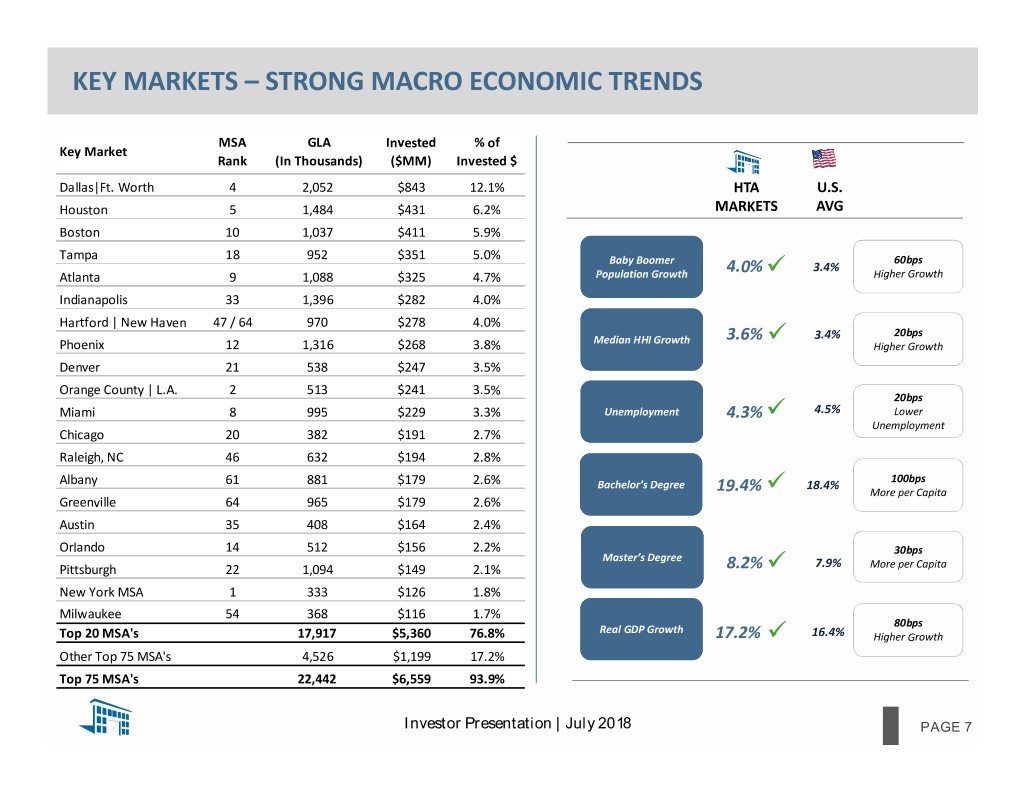
KEY MARKETS – STRONG MACRO ECONOMIC TRENDS MSA GLA Invested % of Key Market Rank (In Thousands) ($MM) Invested $ Dallas|Ft. Worth 4 2,052 $843 12.1% HTA U.S. Houston 5 1,484 $431 6.2% MARKETS AVG Boston 10 1,037 $411 5.9% Tampa 18 952 $351 5.0% Baby Boomer 60bps 4.0% 3.4% Atlanta 9 1,088 $325 4.7% Population Growth Higher Growth Indianapolis 33 1,396 $282 4.0% Hartford | New Haven 47 / 64 970 $278 4.0% 20bps Median HHI Growth 3.6% 3.4% Phoenix 12 1,316 $268 3.8% Higher Growth Denver 21 538 $247 3.5% Orange County | L.A. 2 513 $241 3.5% 20bps Miami 8 995 $229 3.3% Unemployment 4.3% 4.5% Lower Unemployment Chicago 20 382 $191 2.7% Raleigh, NC 46 632 $194 2.8% 100bps Albany 61 881 $179 2.6% Bachelor’s Degree 18.4% 19.4% More per Capita Greenville 64 965 $179 2.6% Austin 35 408 $164 2.4% Orlando 14 512 $156 2.2% 30bps Master’s Degree Pittsburgh 22 1,094 $149 2.1% 8.2% 7.9% More per Capita New York MSA 1 333 $126 1.8% Milwaukee 54 368 $116 1.7% 80bps Real GDP Growth Top 20 MSA's 17,917 $5,360 76.8% 17.2% 16.4% Higher Growth Other Top 75 MSA's 4,526 $1,199 17.2% Top 75 MSA's 22,442 $6,559 93.9% www.htareit.com Leading owner of Medical Office Buildings Investor Presentation | July 2018 PAGE 77
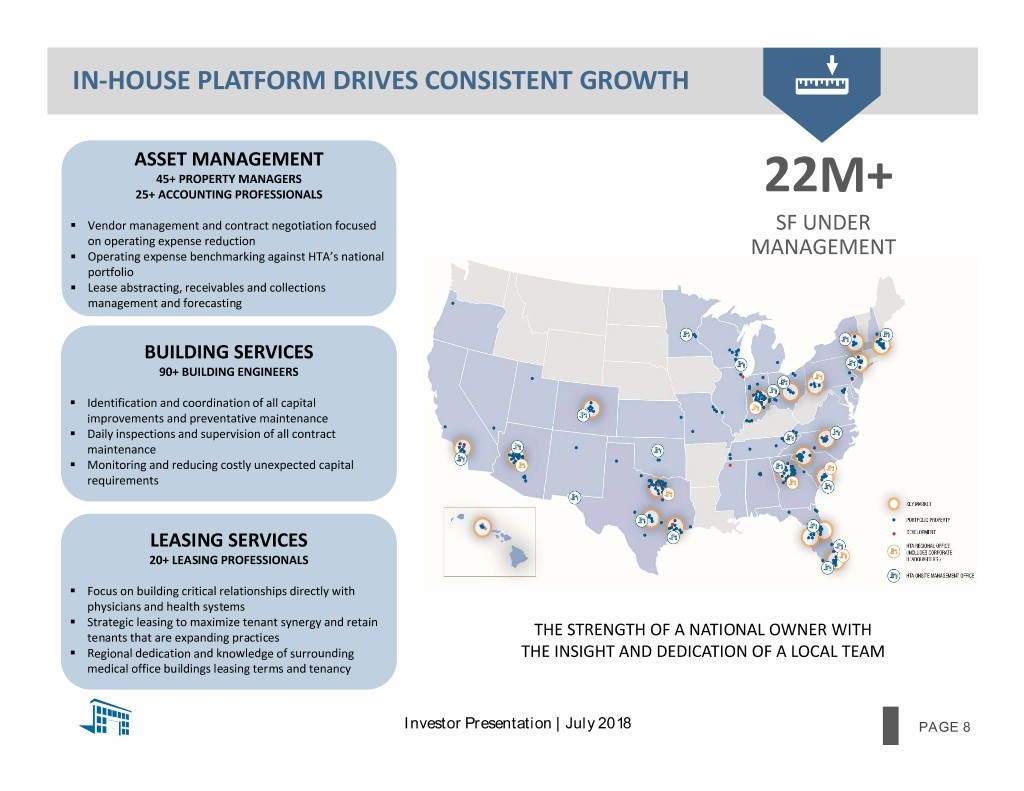
IN‐HOUSE PLATFORM DRIVES CONSISTENT GROWTH ASSET MANAGEMENT 45+ PROPERTY MANAGERS 25+ ACCOUNTING PROFESSIONALS 22M+ . Vendor management and contract negotiation focused SF UNDER on operating expense reduction . Operating expense benchmarking against HTA’s national MANAGEMENT portfolio . Lease abstracting, receivables and collections management and forecasting BUILDING SERVICES 90+ BUILDING ENGINEERS . Identification and coordination of all capital improvements and preventative maintenance . Daily inspections and supervision of all contract maintenance . Monitoring and reducing costly unexpected capital requirements LEASING SERVICES 20+ LEASING PROFESSIONALS . Focus on building critical relationships directly with physicians and health systems . Strategic leasing to maximize tenant synergy and retain tenants that are expanding practices THE STRENGTH OF A NATIONAL OWNER WITH . Regional dedication and knowledge of surrounding THE INSIGHT AND DEDICATION OF A LOCAL TEAM medical office buildings leasing terms and tenancy www.htareit.com Leading owner of Medical Office Buildings Investor Presentation | July 2018 PAGE 8
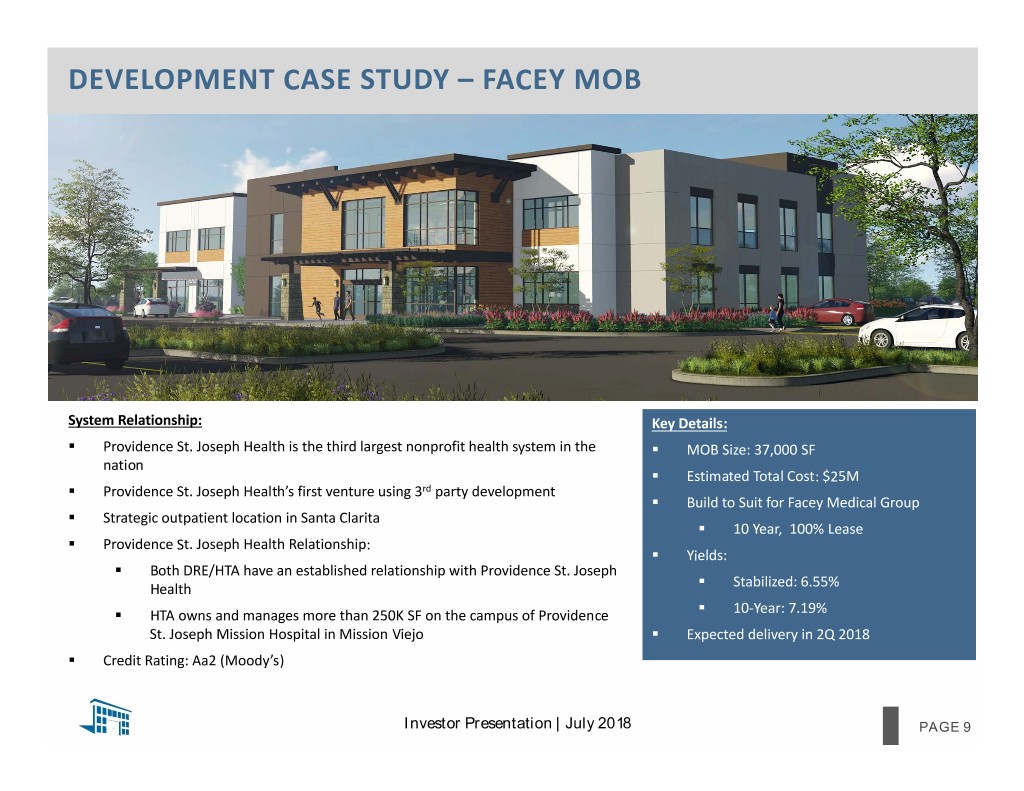
DEVELOPMENT CASE STUDY – FACEY MOB System Relationship: Key Details: . Providence St. Joseph Health is the third largest nonprofit health system in the . MOB Size: 37,000 SF nation . Estimated Total Cost: $25M . Providence St. Joseph Health’s first venture using 3rd party development . Build to Suit for Facey Medical Group . Strategic outpatient location in Santa Clarita . 10 Year, 100% Lease . Providence St. Joseph Health Relationship: . Yields: . Both DRE/HTA have an established relationship with Providence St. Joseph . Health Stabilized: 6.55% . . HTA owns and manages more than 250K SF on the campus of Providence 10‐Year: 7.19% St. Joseph Mission Hospital in Mission Viejo . Expected delivery in 2Q 2018 . Credit Rating: Aa2 (Moody’s) www.htareit.com Leading owner of Medical Office Buildings Investor Presentation | July 2018 PAGE 9
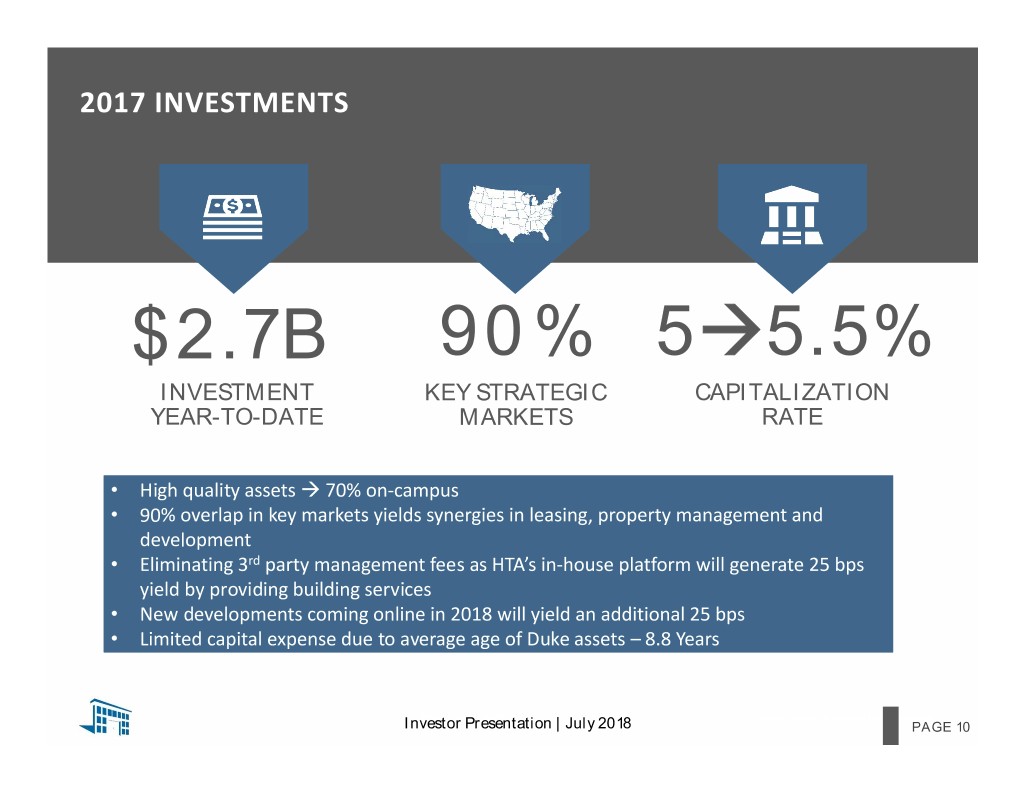
2017 INVESTMENTS $2.7B 90% 55.5% INVESTMENT KEY STRATEGIC CAPITALIZATION YEAR-TO-DATE MARKETS RATE • High quality assets 70% on‐campus • 90% overlap in key markets yields synergies in leasing, property management and development • Eliminating 3rd party management fees as HTA’s in‐house platform will generate 25 bps yield by providing building services • New developments coming online in 2018 will yield an additional 25 bps • Limited capital expense due to average age of Duke assets – 8.8 Years www.htareit.com Leading owner of Medical Office Buildings Investor Presentation | July 2018 PAGE 10
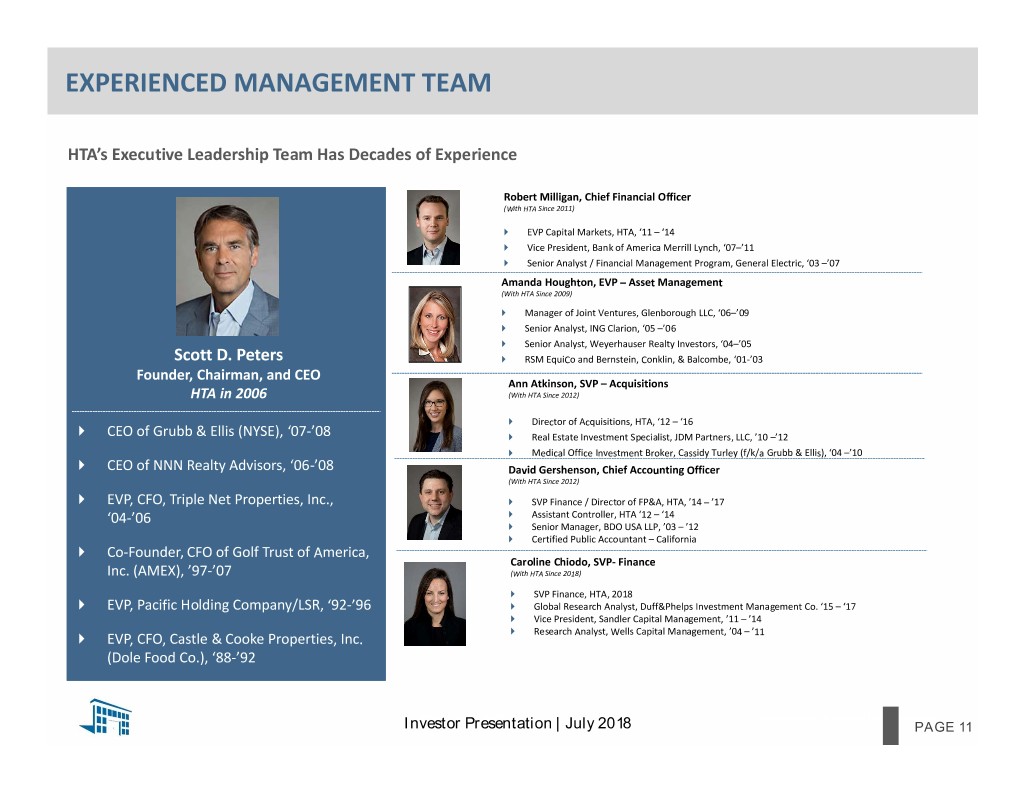
EXPERIENCED MANAGEMENT TEAM HTA’s Executive Leadership Team Has Decades of Experience Robert Milligan, Chief Financial Officer (With HTA Since 2011) EVP Capital Markets, HTA, ‘11 – ‘14 Vice President, Bank of America Merrill Lynch, ‘07–’11 Senior Analyst / Financial Management Program, General Electric, ‘03 –’07 Amanda Houghton, EVP – Asset Management (With HTA Since 2009) Manager of Joint Ventures, Glenborough LLC, ‘06–’09 Senior Analyst, ING Clarion, ‘05 –’06 Senior Analyst, Weyerhauser Realty Investors, ‘04–’05 Scott D. Peters RSM EquiCo and Bernstein, Conklin, & Balcombe, ‘01‐’03 Founder, Chairman, and CEO Ann Atkinson, SVP – Acquisitions HTA in 2006 (With HTA Since 2012) Director of Acquisitions, HTA, ‘12 – ‘16 CEO of Grubb & Ellis (NYSE), ‘07‐’08 Real Estate Investment Specialist, JDM Partners, LLC, ’10 –’12 Medical Office Investment Broker, Cassidy Turley (f/k/a Grubb & Ellis), ‘04 –’10 CEO of NNN Realty Advisors, ‘06‐’08 David Gershenson, Chief Accounting Officer (With HTA Since 2012) EVP, CFO, Triple Net Properties, Inc., SVP Finance / Director of FP&A, HTA, ’14 – ’17 ‘04‐’06 Assistant Controller, HTA ‘12 – ‘14 Senior Manager, BDO USA LLP, ’03 – ’12 Certified Public Accountant – California Co‐Founder, CFO of Golf Trust of America, Caroline Chiodo, SVP‐ Finance Inc. (AMEX), ’97‐’07 (With HTA Since 2018) SVP Finance, HTA, 2018 EVP, Pacific Holding Company/LSR, ‘92‐’96 Global Research Analyst, Duff&Phelps Investment Management Co. ‘15 – ‘17 Vice President, Sandler Capital Management, ’11 – ’14 Research Analyst, Wells Capital Management, ’04 – ’11 EVP, CFO, Castle & Cooke Properties, Inc. (Dole Food Co.), ‘88‐’92 www.htareit.com Leading owner of Medical Office Buildings Investor Presentation | July 2018 PAGE 1111

DEEP BENCH OF DISTINGUISHED LEADERS ACCOUNTING AND FINANCE Olivia Waalboer –Corporate Controller (With HTA Since 2016) Scott D. PetersMichelle Murphy‐Director of Financial Reporting (With HTA Since 2014) Founder, Chairman, and CEO HTA in 2006 ASSET MANAGEMENT AND LEASING Alisa Connolly‐Corporate Vice President‐Leasing (With HTA Since 2012) Chris Clements‐ Corporate Vice President‐Facilities & Construction (With HTA Since 2012) Jaime Northam‐ Senior Vice President‐Leasing (With HTA Since 2010) Todd Sloan‐ Senior Vice President‐Leasing (With HTA Since 2011) Julia Ehret‐Senior Vice President‐Leasing (With HTA Since 2013) Andrew Nordhoff‐Senior Vice President‐Leasing (With HTA Since 2011) www.htareit.com Leading owner of Medical Office Buildings Investor Presentation | July 2018 PAGE 12
Healthcare Trust of America, Inc. www.htareit.com Leading owner of Medical Office Buildings Investor Presentation | July 2018 PAGE 13


