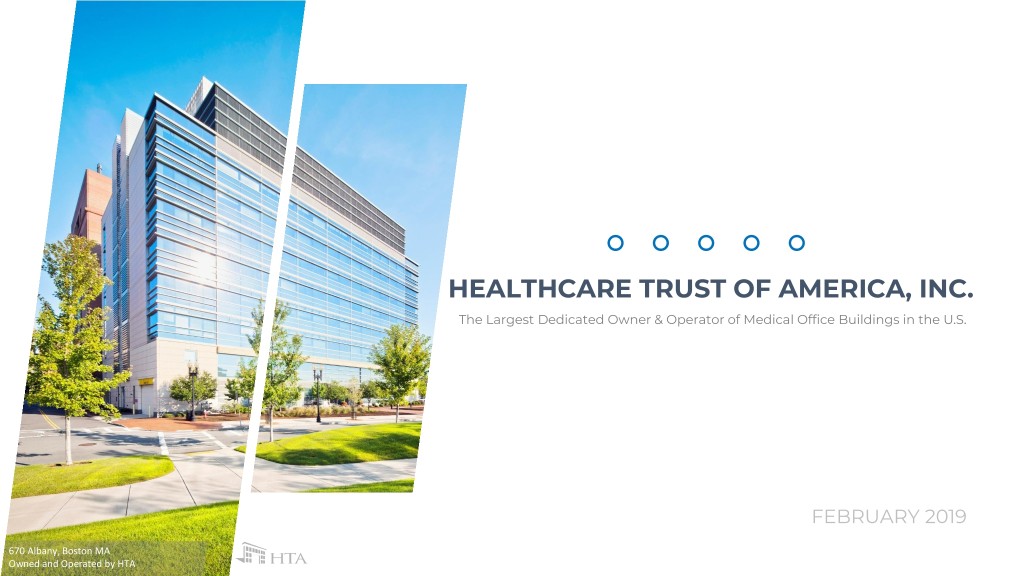
HEALTHCARE TRUST OF AMERICA, INC. The Largest Dedicated Owner & Operator of Medical Office Buildings in the U.S. FEBRUARY 2019 670 Albany, Boston MA Owned and Operated by HTA
F O R W A R D L O O K I N G S T A T E M E N T S This document contains both historical and forward‐looking statements. Forward‐looking statements are based on current expectations, plans, estimates, assumptions and beliefs, including expectations, plans, estimates, assumptions and beliefs about our company, the real estate industry, pending acquisitions, future medical office building performance and the debt and equity capital markets. All statements other than statements of historical fact are, or may be deemed to be, forward‐looking statements within the meaning of Section 27A of the Securities Act of 1933, as amended, and Section 21E of the Securities Exchange Act of 1934, as amended. Forward‐looking statements include information concerning possible or assumed future results of operations of our Company. The forward‐looking statements included in this document are subject to numerous risks and uncertainties that could cause actual results to differ materially from those expressed or implied in the forward‐looking statements. Assumptions relating to the foregoing involve judgments with respect to, among other things, future economic, competitive and market conditions and future business decisions, all of which are difficult or impossible to predict accurately and many of which are beyond our control. Although we believe that the expectations reflected in such forward‐looking statements are based on reasonable assumptions, our actual results and performance could differ materially from those set forth in the forward‐looking statements. Factors which could have a material adverse effect on our operations and future prospects include, but are not limited to: changes in economic conditions affecting the healthcare property sector, the commercial real estate market and the credit market; our ability to complete our pending acquisitions; competition for acquisition of medical office buildings and other facilities that serve the healthcare industry; economic fluctuations in certain states in which our property investments are geographically concentrated; retention of our senior management team; financial stability and solvency of our tenants; supply and demand for operating properties in the market areas in which we operate; our ability to acquire properties, and to successfully operate those properties once acquired; changes in property taxes; legislative and regulatory changes, including changes to laws governing the taxation of REITs and changes to laws governing the healthcare industry; fluctuations in reimbursements from third party payors such as Medicare and Medicaid; changes in interest rates; the availability of capital and financing; restrictive covenants in our credit facilities; changes in our credit ratings; our ability to remain qualified as a REIT; and the risk factors set forth in our 2017 Annual Report on Form 10‐K filed on February 20, 2018. Forward‐looking statements speak only as of the date made. Except as otherwise required by the federal securities laws, we undertake no obligation to update any forward‐looking statements to reflect the events or circumstances arising after the date as of which they are made. As a result of these risks and uncertainties, readers are cautioned not to place undue reliance on the forward looking statements included in this document or that may be made elsewhere from time to time by, or on behalf of, us. For definitions of terms and reconciliations for certain financial measures disclosed herein, including, but not limited to, funds from operations (FFO), normalized funds from operations (Normalized FFO), annualized base rents (ABR), net operating income (NOI), and on‐campus/aligned, please see our Company’s earnings press release issued on February 14, 2019 and our Company’s Supplemental Financial Package for the quarter and year ended December 31, 2018, each of which is available in the investor relations section of our Company’s website located at www.htareit.com. 2
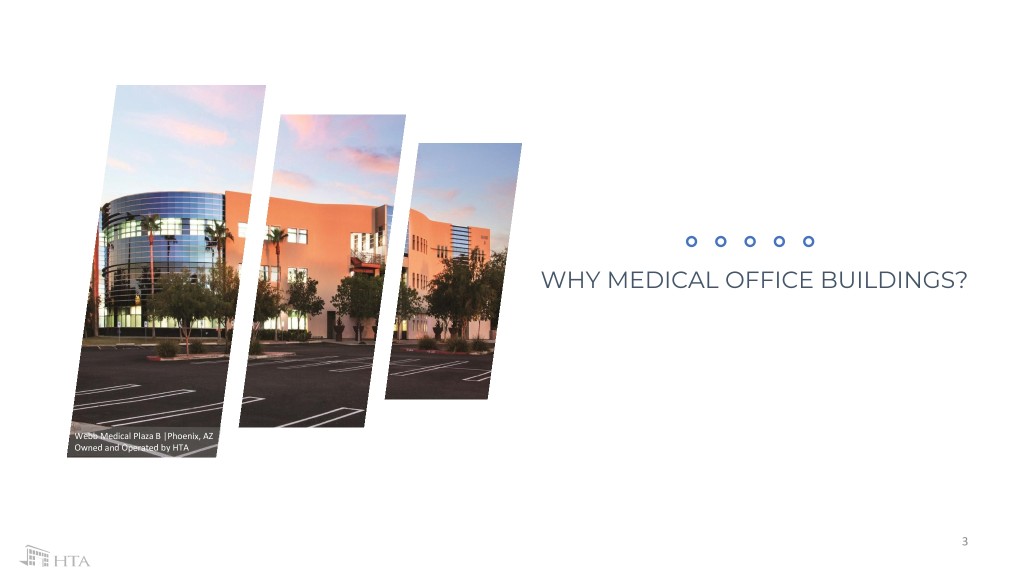
WHY MEDICAL OFFICE BUILDINGS? Webb Medical Plaza B |Phoenix, AZ Owned and Operated by HTA 3
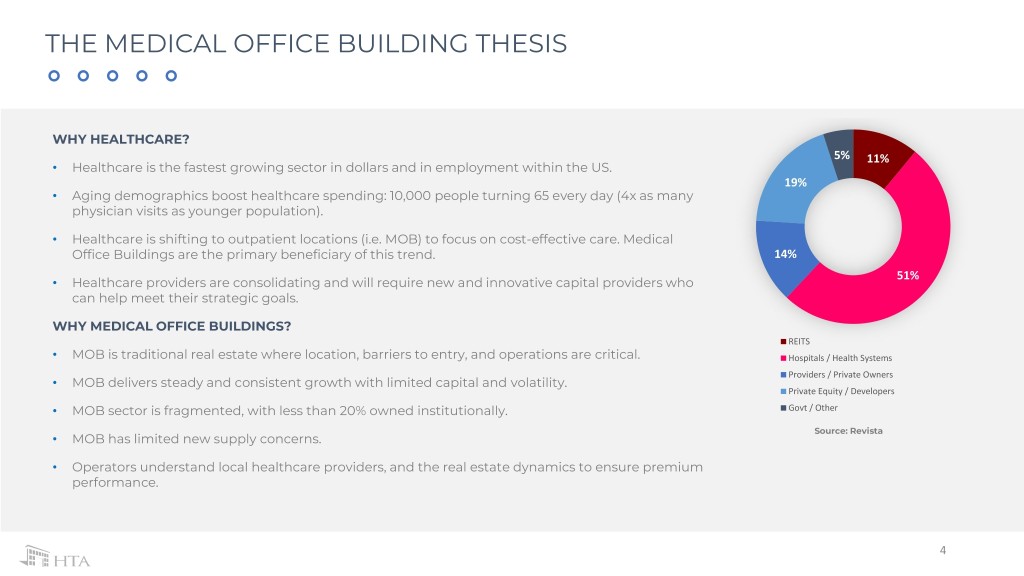
THE MEDICAL OFFICE BUILDING THESIS WHY HEALTHCARE? 5% 11% • Healthcare is the fastest growing sector in dollars and in employment within the US. 19% • Aging demographics boost healthcare spending: 10,000 people turning 65 every day (4x as many physician visits as younger population). • Healthcare is shifting to outpatient locations (i.e. MOB) to focus on cost-effective care. Medical Office Buildings are the primary beneficiary of this trend. 14% 51% • Healthcare providers are consolidating and will require new and innovative capital providers who can help meet their strategic goals. WHY MEDICAL OFFICE BUILDINGS? REITS • MOB is traditional real estate where location, barriers to entry, and operations are critical. Hospitals / Health Systems Providers / Private Owners • MOB delivers steady and consistent growth with limited capital and volatility. Private Equity / Developers • MOB sector is fragmented, with less than 20% owned institutionally. Govt / Other Source: Revista • MOB has limited new supply concerns. • Operators understand local healthcare providers, and the real estate dynamics to ensure premium performance. 4
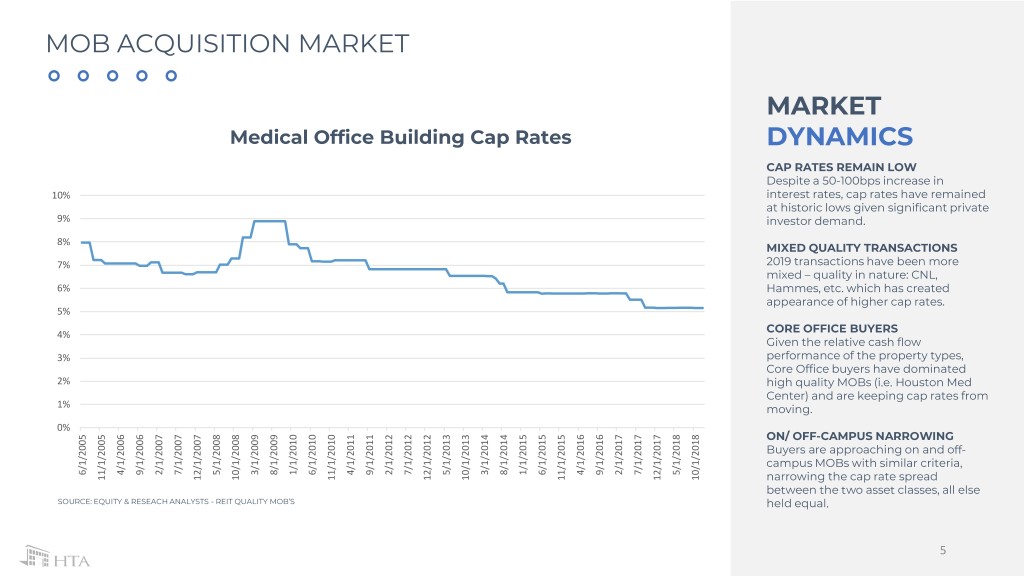
MOB ACQUISITION MARKET MARKET Medical Office Building Cap Rates DYNAMICS CAP RATES REMAIN LOW Despite a 50-100bps increase in 10% interest rates, cap rates have remained at historic lows given significant private 9% investor demand. 8% MIXED QUALITY TRANSACTIONS 7% 2019 transactions have been more mixed – quality in nature: CNL, 6% Hammes, etc. which has created appearance of higher cap rates. 5% 4% CORE OFFICE BUYERS Given the relative cash flow 3% performance of the property types, Core Office buyers have dominated 2% high quality MOBs (i.e. Houston Med Center) and are keeping cap rates from 1% moving. 0% ON/ OFF-CAMPUS NARROWING Buyers are approaching on and off- campus MOBs with similar criteria, 1/1/2015 2/1/2017 6/1/2005 4/1/2006 9/1/2006 2/1/2007 7/1/2007 5/1/2008 3/1/2009 8/1/2009 1/1/2010 6/1/2010 4/1/2011 9/1/2011 2/1/2012 7/1/2012 5/1/2013 3/1/2014 8/1/2014 6/1/2015 4/1/2016 9/1/2016 7/1/2017 5/1/2018 12/1/2012 12/1/2007 10/1/2008 11/1/2010 10/1/2013 11/1/2015 12/1/2017 10/1/2018 11/1/2005 narrowing the cap rate spread between the two asset classes, all else SOURCE: EQUITY & RESEACH ANALYSTS - REIT QUALITY MOB’S held equal. 5
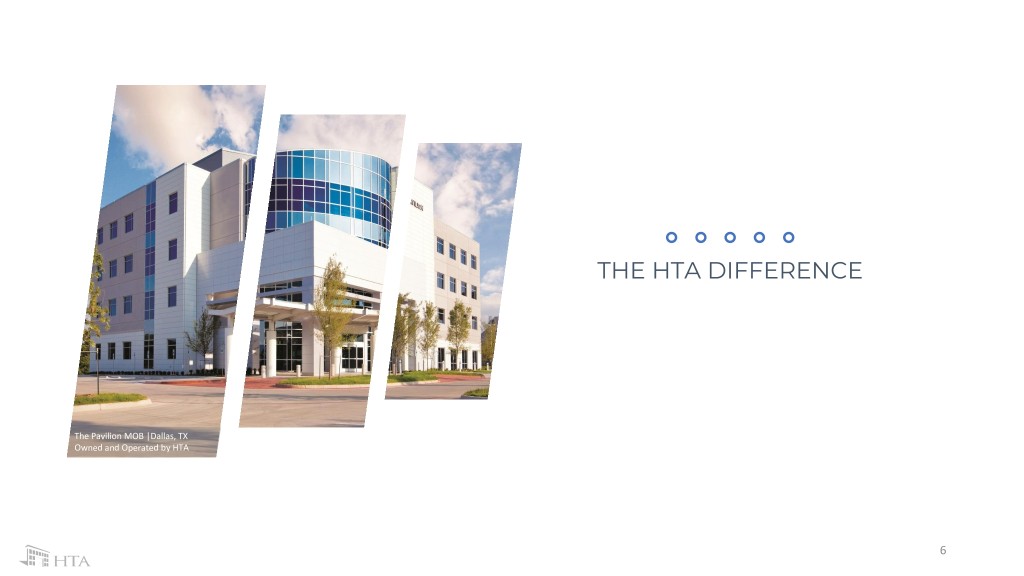
THE HTA DIFFERENCE The Pavilion MOB |Dallas, TX Owned and Operated by HTA 6

HTA IS THE LARGEST DEDICATED OWNER & OPERATOR OF MEDICAL OFFICE BUILDINGS IN THE U.S. CORE, CRITICAL MEDICAL REAL ESTATE DISCIPLINED, ACCRETIVE GROWTH STRATEGY • On-campus and core community off-campus focus within high • Disciplined record of acquiring and developing MOBs with demand medical hubs for the future of healthcare delivery strong accretion and NOI growth in competitive markets • $7+ billion invested over the past decade • Platform adds incremental accretion to investments CRITICAL MASS IN ESTABLISHED GATEWAY MARKETS STRONG, INVESTMENT GRADE BALANCE SHEET • Disciplined market focus on 20-25 key markets with growing • Management has long-term track record of successful financial economies and favorable demographic trends management discipline • Operational scale achieved with 15 markets over 500k SF • Low leverage balance sheet with investment grade ratings creating operating synergies and enhanced relationships that drive growth FULL SERVICE, BEST-IN-CLASS PLATFORM SEASONED, SKILLED MANAGEMENT TEAM • Dedicated property management and leasing platform leads to • Decades of experience, acquiring, owning and operating superior operating margins and leasing performance commercial real estate • Development team adds depth of opportunities and allows HTA • 12-year track record of delivering consistent shareholder value to capitalize on new and existing relationships 7
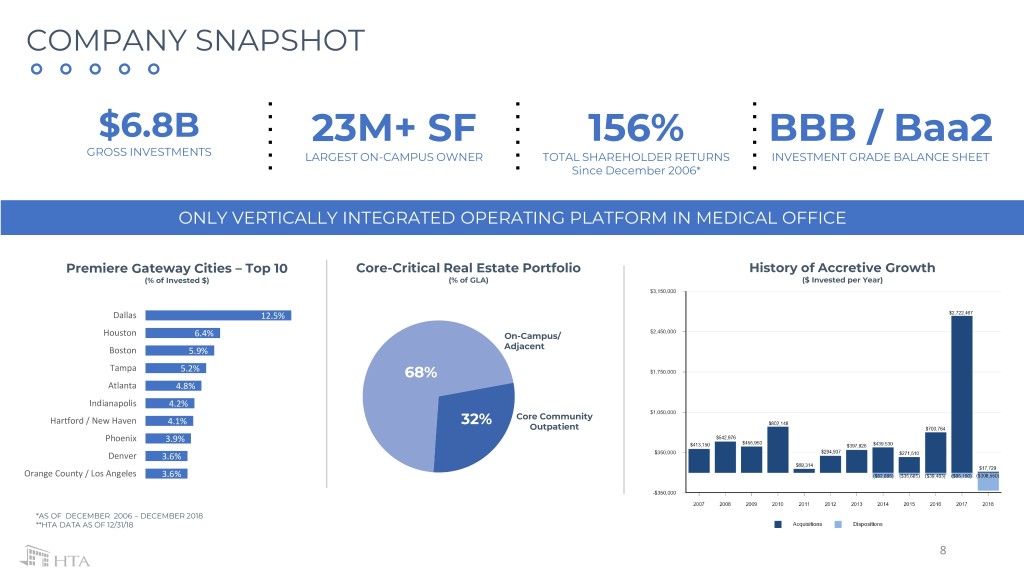
COMPANY SNAPSHOT $6.8B 23M+ SF 156% BBB / Baa2 GROSS INVESTMENTS LARGEST ON-CAMPUS OWNER TOTAL SHAREHOLDER RETURNS INVESTMENT GRADE BALANCE SHEET Since December 2006* ONLY VERTICALLY INTEGRATED OPERATING PLATFORM IN MEDICAL OFFICE Premiere Gateway Cities – Top 10 Core-Critical Real Estate Portfolio History of Accretive Growth (% of Invested $) (% of GLA) ($ Invested per Year) Dallas 12.5% Houston 6.4% On-Campus/ Boston 5.9% Adjacent Tampa 5.2% 68% Atlanta 4.8% Indianapolis 4.2% Hartford / New Haven 4.1% Core Community 32% Outpatient Phoenix 3.9% Denver 3.6% Orange County / Los Angeles 3.6% *AS OF DECEMBER 2006 – DECEMBER 2018 **HTA DATA AS OF 12/31/18 8
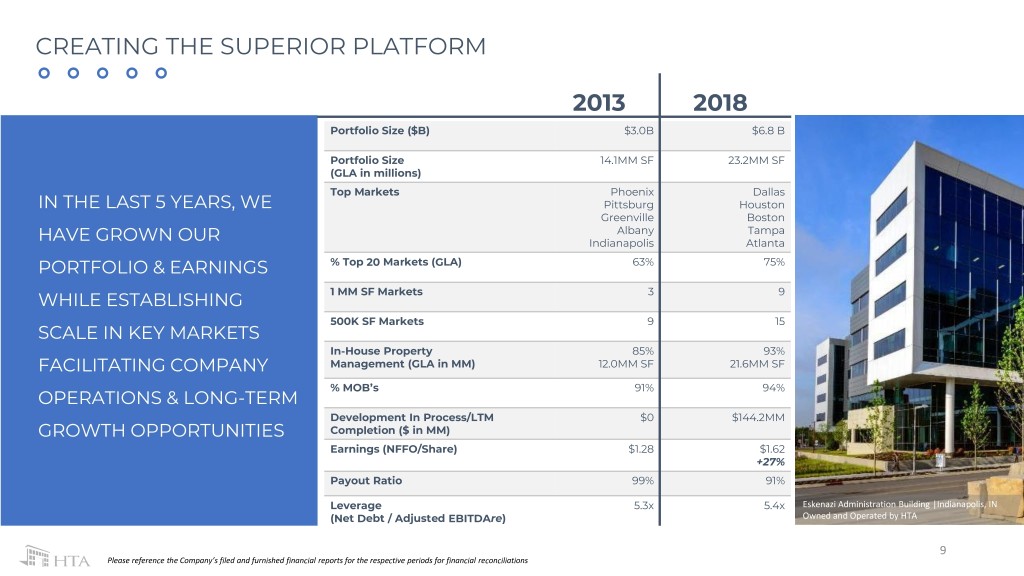
CREATING THE SUPERIOR PLATFORM 2013 2018 Portfolio Size ($B) $3.0B $6.8 B Portfolio Size 14.1MM SF 23.2MM SF (GLA in millions) Top Markets Phoenix Dallas IN THE LAST 5 YEARS, WE Pittsburg Houston Greenville Boston Albany Tampa HAVE GROWN OUR Indianapolis Atlanta PORTFOLIO & EARNINGS % Top 20 Markets (GLA) 63% 75% WHILE ESTABLISHING 1 MM SF Markets 3 9 500K SF Markets 9 15 SCALE IN KEY MARKETS In-House Property 85% 93% FACILITATING COMPANY Management (GLA in MM) 12.0MM SF 21.6MM SF % MOB’s 91% 94% OPERATIONS & LONG-TERM Development In Process/LTM $0 $144.2MM GROWTH OPPORTUNITIES Completion ($ in MM) Earnings (NFFO/Share) $1.28 $1.62 +27% Payout Ratio 99% 91% Leverage 5.3x 5.4x Eskenazi Administration Building |Indianapolis, IN (Net Debt / Adjusted EBITDAre) Owned and Operated by HTA 9 Please reference the Company’s filed and furnished financial reports for the respective periods for financial reconciliations
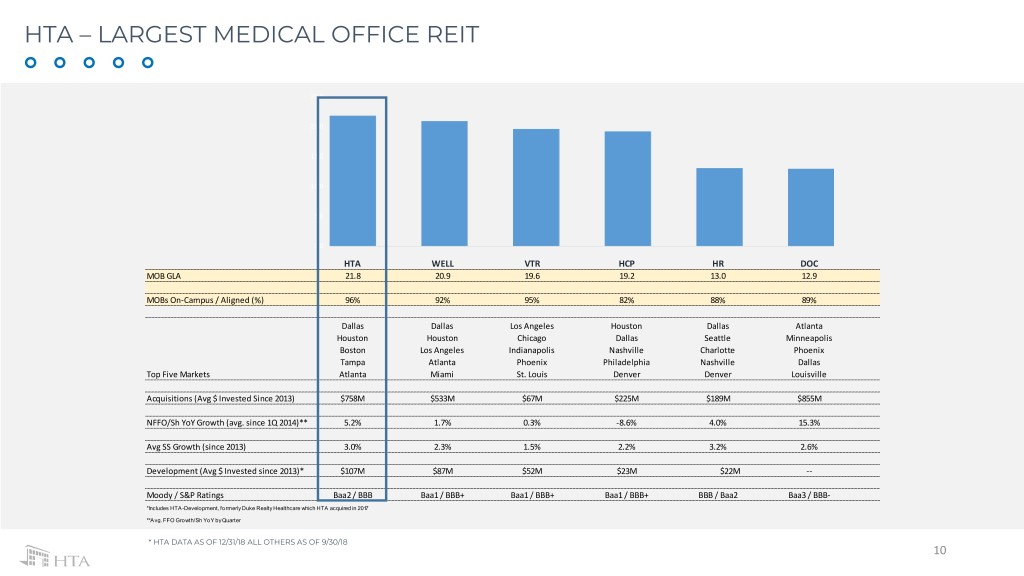
HTA – LARGEST MEDICAL OFFICE REIT 25.0 20.0 15.0 10.0 5.0 0.0 HTA WELL VTR HCP HR DOC MOB GLA 21.8 20.9 19.6 19.2 13.0 12.9 MOBs On-Campus / Aligned (%) 96% 92% 95% 82% 88% 89% Dallas Dallas Los Angeles Houston Dallas Atlanta Houston Houston Chicago Dallas Seattle Minneapolis Boston Los Angeles Indianapolis Nashville Charlotte Phoenix Tampa Atlanta Phoenix Philadelphia Nashville Dallas Top Five Markets Atlanta Miami St. Louis Denver Denver Louisville Acquisitions (Avg $ Invested Since 2013) $758M $533M $67M $225M $189M $855M NFFO/Sh YoY Growth (avg. since 1Q 2014)** 5.2% 1.7% 0.3% -8.6% 4.0% 15.3% Avg SS Growth (since 2013) 3.0% 2.3% 1.5% 2.2% 3.2% 2.6% Development (Avg $ Invested since 2013)* $107M $87M $52M $23M $22M -- Moody / S&P Ratings Baa2 / BBB Baa1 / BBB+ Baa1 / BBB+ Baa1 / BBB+ BBB / Baa2 Baa3 / BBB- *Includes HTA-Development, formerly Duke Realty Healthcare which HTA acquired in 2017 **Avg. FFO Growth/Sh YoY by Quarter * HTA DATA AS OF 12/31/18 ALL OTHERS AS OF 9/30/18 10
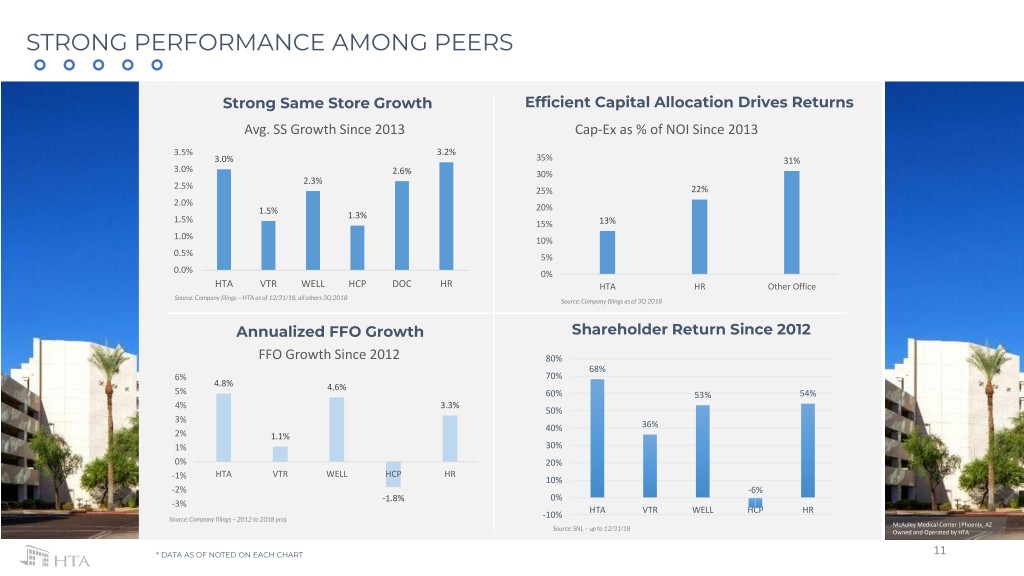
STRONG PERFORMANCE AMONG PEERS Strong Same Store Growth Efficient Capital Allocation Drives Returns Avg. SS Growth Since 2013 Cap-Ex as % of NOI Since 2013 3.5% 3.2% 3.0% 35% 31% 3.0% 2.6% 30% 2.3% 2.5% 25% 22% 2.0% 20% 1.5% 1.3% 1.5% 15% 13% 1.0% 10% 0.5% 5% 0.0% 0% HTA VTR WELL HCP DOC HR HTA HR Other Office Source: Company filings – HTA as of 12/31/18, all others 3Q 2018 Source: Company filings as of 3Q 2018 Annualized FFO Growth Shareholder Return Since 2012 FFO Growth Since 2012 80% 68% 6% 70% 4.8% 4.6% 5% 60% 53% 54% 4% 3.3% 50% 3% 40% 36% 2% 1.1% 1% 30% 0% 20% HTA VTR WELL HCP HR -1% 10% -2% -6% -1.8% 0% -3% HTA VTR WELL HCP HR Source: Company filings – 2012 to 2018 proj. -10% McAuley Medical Center |Phoenix, AZ Source: SNL – up to 12/31/18 Owned and Operated by HTA * DATA AS OF NOTED ON EACH CHART 11

2018 – INTEGRATING THE PLATFORM & INCREASING DRY POWDER Same Store Growth + 2.5% • Base revenue growth – 2.2% driving performance. • Leasing strong – Increasing leasing spreads to 2.6% FY and 4.4% in 4Q. Retention of 81% FY. • Expense savings – Bundling & using scale to drive base margin expansion of 20bps. Integration of 2017 Investments Creates MOB Leader • Achieved $7MM of operating synergies from 2017 investments, increasing yield 50bps since closing. • Economies of scale in key markets: growing importance to health systems, increasing operating capabilities & service bundling. Kick Start Development Platform • Completed $87MM of developments acquired from Duke. • Announced 2 new development/ re-developments totaling $71MM of investment at 6.5% blended yield. • Pipeline of > $75MM in new projects under discussion. Accretive Capital Allocation • Capitalized on strong private market. Sold $309MM of non-core assets at forward cap rates in the low 5’s. • Repurchased $67MM of stock at implied cap rate around 6%. Fortified Fortress Balance Sheet, Prepared for Growth • Utilized cash flows disposition proceeds and forward equity to pay down over $241MM of debt. • Lowered leverage to 5.4x Net Debt/ Adjusted EBITDAre - over 1x turn of Adjusted EBITDA from YE 12 and 0.5x pre-Duke. • Cash / Liquidity – Ended year with $126MM of cash to deploy and undrawn $1.0B revolving credit facility. Earnings Flat to Prior Year Despite Lowering Leverage & Dry Powder • Normalized FFO per share of $1.62 per share FY. 1200 Binz | Houston, TX 12 Owned and Operated by HTA
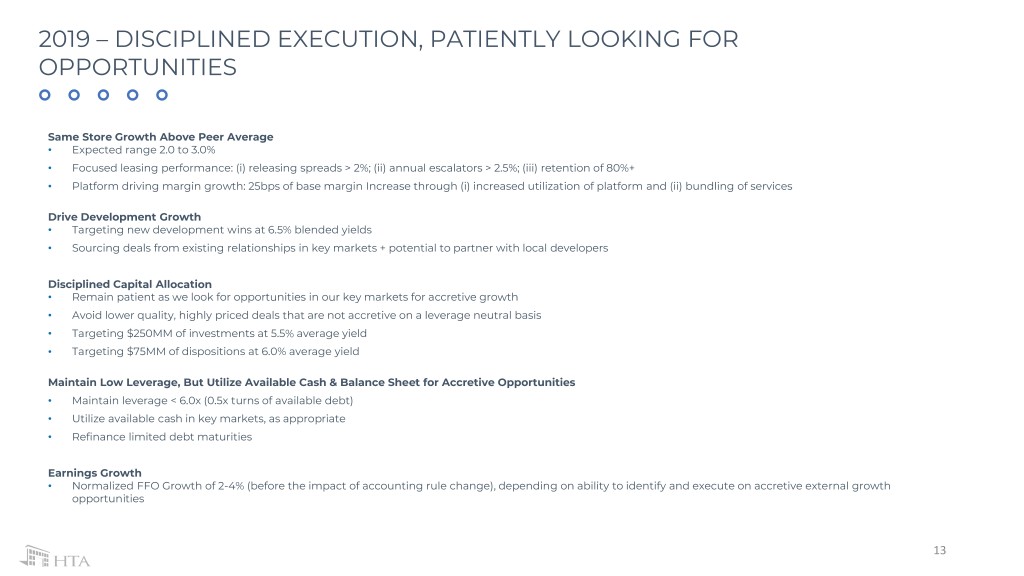
2019 – DISCIPLINED EXECUTION, PATIENTLY LOOKING FOR OPPORTUNITIES Same Store Growth Above Peer Average • Expected range 2.0 to 3.0% • Focused leasing performance: (i) releasing spreads > 2%; (ii) annual escalators > 2.5%; (iii) retention of 80%+ • Platform driving margin growth: 25bps of base margin Increase through (i) increased utilization of platform and (ii) bundling of services Drive Development Growth • Targeting new development wins at 6.5% blended yields • Sourcing deals from existing relationships in key markets + potential to partner with local developers Disciplined Capital Allocation • Remain patient as we look for opportunities in our key markets for accretive growth • Avoid lower quality, highly priced deals that are not accretive on a leverage neutral basis • Targeting $250MM of investments at 5.5% average yield • Targeting $75MM of dispositions at 6.0% average yield Maintain Low Leverage, But Utilize Available Cash & Balance Sheet for Accretive Opportunities • Maintain leverage < 6.0x (0.5x turns of available debt) • Utilize available cash in key markets, as appropriate • Refinance limited debt maturities Earnings Growth • Normalized FFO Growth of 2-4% (before the impact of accounting rule change), depending on ability to identify and execute on accretive external growth opportunities 13
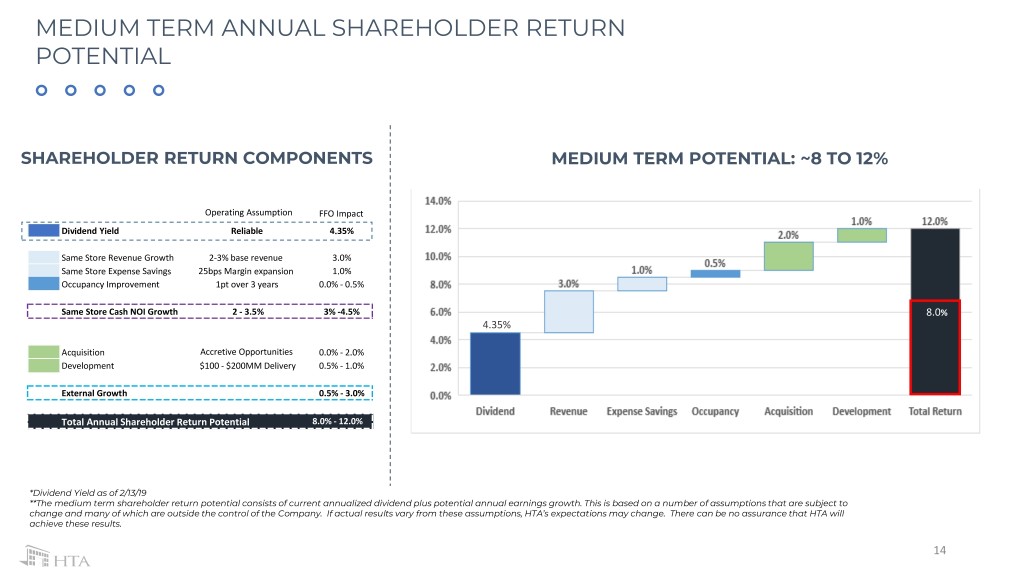
8.7% MEDIUM TERM ANNUAL SHAREHOLDER RETURN POTENTIAL SHAREHOLDER RETURN COMPONENTS MEDIUM TERM POTENTIAL: ~8 TO 12% Operating Assumption FFO Impact Dividend Yield Reliable 4.35% Same Store Revenue Growth 2-3% base revenue 3.0% Same Store Expense Savings 25bps Margin expansion 1.0% Occupancy Improvement 1pt over 3 years 0.0% - 0.5% Same Store Cash NOI Growth 2 - 3.5% 3% -4.5% 8.0% 4.35% Acquisition Accretive Opportunities 0.0% - 2.0% Development $100 - $200MM Delivery 0.5% - 1.0% External Growth 0.5% - 3.0% Total Annual Shareholder Return Potential 8.0% - 12.0% *Dividend Yield as of 2/13/19 **The medium term shareholder return potential consists of current annualized dividend plus potential annual earnings growth. This is based on a number of assumptions that are subject to change and many of which are outside the control of the Company. If actual results vary from these assumptions, HTA’s expectations may change. There can be no assurance that HTA will achieve these results. 14

THE LEADING MOB OPERATOR Lincoln Medical Center |Parker, CO Owned and Operated by HTA 15
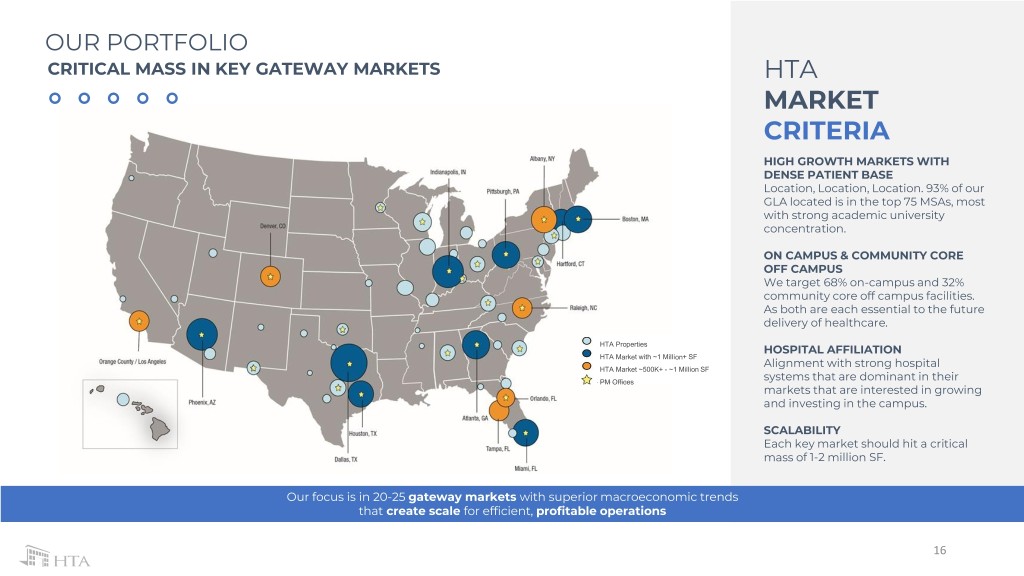
OUR PORTFOLIO CRITICAL MASS IN KEY GATEWAY MARKETS HTA MARKET CRITERIA HIGH GROWTH MARKETS WITH DENSE PATIENT BASE Location, Location, Location. 93% of our GLA located is in the top 75 MSAs, most with strong academic university concentration. ON CAMPUS & COMMUNITY CORE OFF CAMPUS We target 68% on-campus and 32% community core off campus facilities. As both are each essential to the future delivery of healthcare. HTA Properties HOSPITAL AFFILIATION HTA Market with ~1 Million+ SF HTA Market ~500K+ - ~1 Million SF Alignment with strong hospital PM Offices systems that are dominant in their markets that are interested in growing and investing in the campus. SCALABILITY Each key market should hit a critical mass of 1-2 million SF. Our focus is in 20-25 gateway markets with superior macroeconomic trends that create scale for efficient, profitable operations 16

HEALTH SYSTEM DIVERSIFICATION NO MORE THAN 4.4% of ABR WITH ANY ONE TENANT HEALTH SYSTEM OUR PARTNERS ARE THE TOP HEALTH SYSTEMS IN THE US UNDERWRITING • HTA monitors hospital campuses and performance using proprietary financial analysis, performance metrics, and on-the ground reporting from its local property management & leasing teams. • We proactively identify campuses and health system viability to position our portfolio for long term performance. (1) The amounts in this table illustrate only direct leases with selected top health systems in the HTA portfolio and is not inclusive of all HTA’s health system tenants. (2) Amounts presented in years. (3) Credit rating refers to Highmark, Inc. 7900 Fannin |Houston, TX Owned and Operated by HTA * HTA DATA AS OF 12/31/18 17
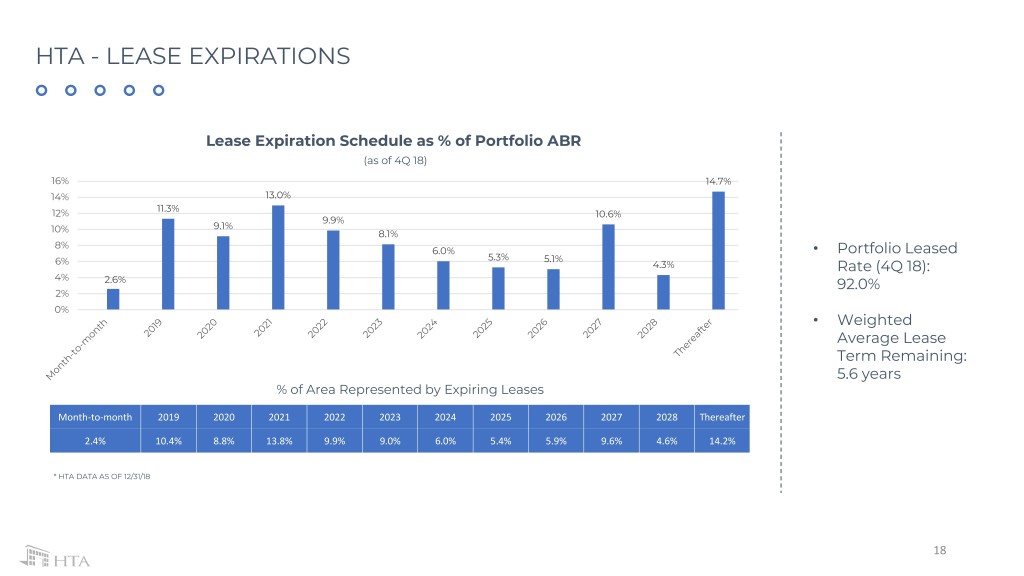
HTA - LEASE EXPIRATIONS Lease Expiration Schedule as % of Portfolio ABR (as of 4Q 18) 16% 14.7% 14% 13.0% 11.3% 12% 10.6% 9.9% 10% 9.1% 8.1% 8% 6.0% • Portfolio Leased 5.3% 5.1% 6% 4.3% Rate (4Q 18): 4% 2.6% 92.0% 2% 0% • Weighted Average Lease Term Remaining: 5.6 years % of Area Represented by Expiring Leases Month-to-month 2019 2020 2021 2022 2023 2024 2025 2026 2027 2028 Thereafter 2.4% 10.4% 8.8% 13.8% 9.9% 9.0% 6.0% 5.4% 5.9% 9.6% 4.6% 14.2% * HTA DATA AS OF 12/31/18 18
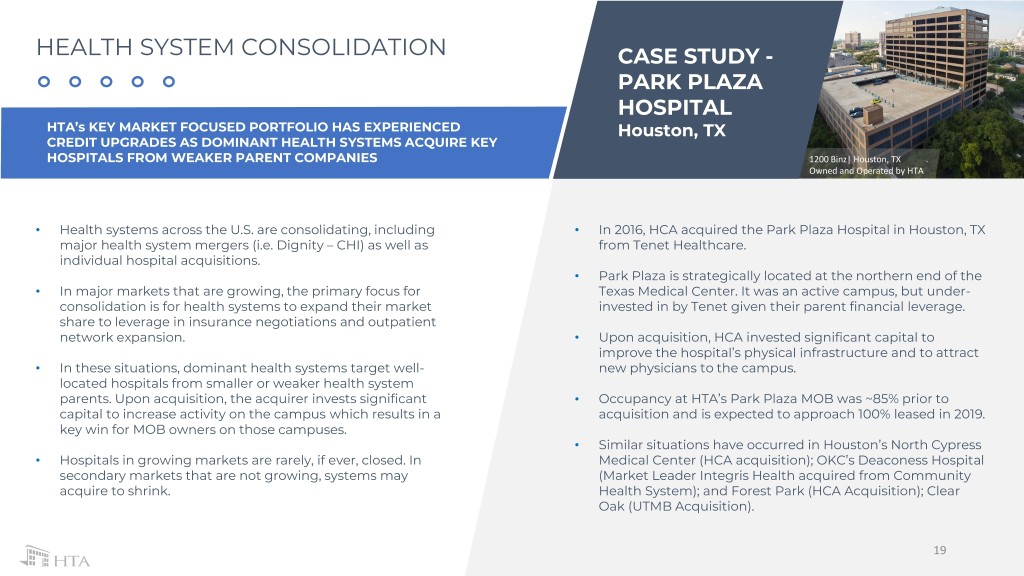
HEALTH SYSTEM CONSOLIDATION CASE STUDY - PARK PLAZA HOSPITAL HTA’s KEY MARKET FOCUSED PORTFOLIO HAS EXPERIENCED Houston, TX CREDIT UPGRADES AS DOMINANT HEALTH SYSTEMS ACQUIRE KEY HOSPITALS FROM WEAKER PARENT COMPANIES 1200 Binz| Houston, TX Owned and Operated by HTA • Health systems across the U.S. are consolidating, including • In 2016, HCA acquired the Park Plaza Hospital in Houston, TX major health system mergers (i.e. Dignity – CHI) as well as from Tenet Healthcare. individual hospital acquisitions. • Park Plaza is strategically located at the northern end of the • In major markets that are growing, the primary focus for Texas Medical Center. It was an active campus, but under- consolidation is for health systems to expand their market invested in by Tenet given their parent financial leverage. share to leverage in insurance negotiations and outpatient network expansion. • Upon acquisition, HCA invested significant capital to improve the hospital’s physical infrastructure and to attract • In these situations, dominant health systems target well- new physicians to the campus. located hospitals from smaller or weaker health system parents. Upon acquisition, the acquirer invests significant • Occupancy at HTA’s Park Plaza MOB was ~85% prior to capital to increase activity on the campus which results in a acquisition and is expected to approach 100% leased in 2019. key win for MOB owners on those campuses. • Similar situations have occurred in Houston’s North Cypress • Hospitals in growing markets are rarely, if ever, closed. In Medical Center (HCA acquisition); OKC’s Deaconess Hospital secondary markets that are not growing, systems may (Market Leader Integris Health acquired from Community acquire to shrink. Health System); and Forest Park (HCA Acquisition); Clear Oak (UTMB Acquisition). 19
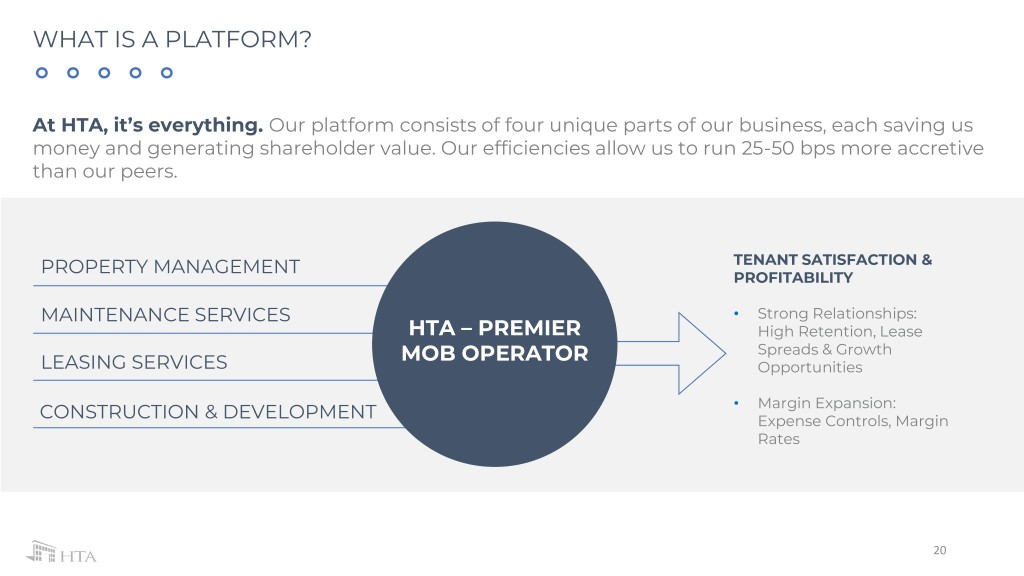
WHAT IS A PLATFORM? At HTA, it’s everything. Our platform consists of four unique parts of our business, each saving us money and generating shareholder value. Our efficiencies allow us to run 25-50 bps more accretive than our peers. PROPERTY MANAGEMENT TENANT SATISFACTION & PROFITABILITY MAINTENANCE SERVICES • Strong Relationships: HTA – PREMIER High Retention, Lease MOB OPERATOR Spreads & Growth LEASING SERVICES Opportunities • Margin Expansion: CONSTRUCTION & DEVELOPMENT Expense Controls, Margin Rates 20

PLATFORM HAS PRODUCED FAVORABLE OPERATING RESULTS SS EXPENSE TREND VS PEERS In 2017 / 2018, our team has successfully integrated the $2.8B / 6MM SF in assets acquired in 2017 onto HTA’s property management & leasing platform. Key achievements included: SS Expense Growth YoY (Avg. Since 2014) • Achieved $7.5MM of annual synergies, including over $5MM of property management fee elimination and $2MM of profits 3.0% from building maintenance services. 2.5% 2.5% • Completed over 100k SF of leasing on the acquired property 2.1% Platform 2.0% 1.8% Peer Average 1.5% • Utilized economies of scale to drive in house HTA engineering 1.2% services for higher value transactions: (i) HVAC, (ii) plumbing, 1.0% 0.8% and (iii) electrical 0.5% In 2019, our team is focused on utilizing its scale in markets to drive cost savings and profits to our bottom line. Key areas of 0.0% HTA WELL VTR HCP DOC HR focus include: -0.5% • Energy Management -1.0% • Bundling of Utilities -1.1% -1.5% • Centralized Procurement In total, we are targeting over 2% expense reduction from these actions which will offset increased expenditures on property * DATA 1Q 2014 TO 3Q 2018 taxes. 21
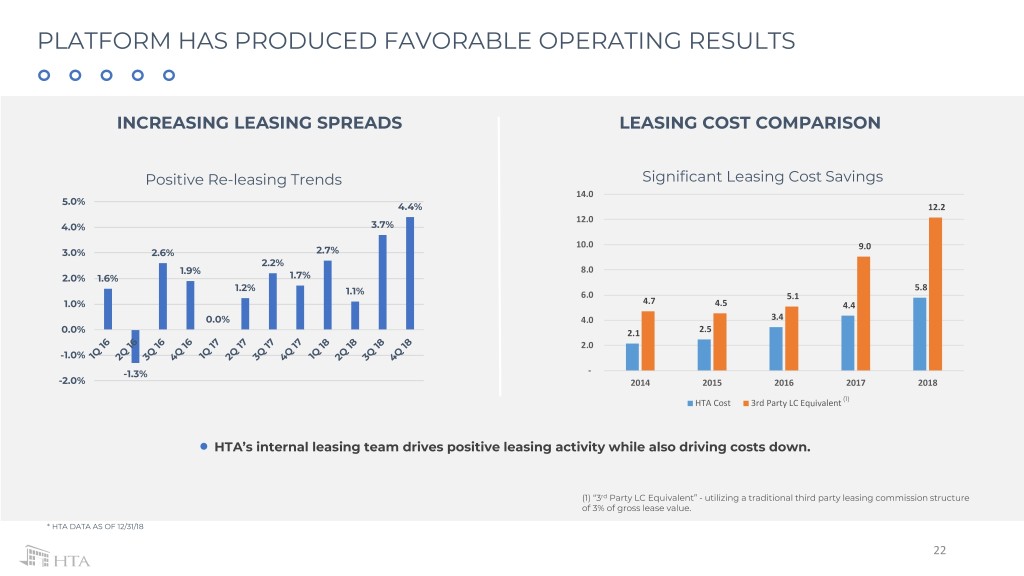
PLATFORM HAS PRODUCED FAVORABLE OPERATING RESULTS INCREASING LEASING SPREADS LEASING COST COMPARISON Positive Re-leasing Trends Significant Leasing Cost Savings 14.0 5.0% 4.4% 12.2 12.0 4.0% 3.7% 10.0 9.0 3.0% 2.6% 2.7% 2.2% 1.9% 8.0 2.0% 1.6% 1.7% 1.2% 5.8 1.1% 6.0 5.1 1.0% 4.7 4.5 4.4 0.0% 4.0 3.4 0.0% 2.1 2.5 2.0 -1.0% -1.3% - -2.0% 2014 2015 2016 2017 2018 HTA Cost 3rd Party LC Equivalent (1) HTA’s internal leasing team drives positive leasing activity while also driving costs down. (1) “3rd Party LC Equivalent” - utilizing a traditional third party leasing commission structure of 3% of gross lease value. * HTA DATA AS OF 12/31/18 22
EXTERNAL GROWTH OPPORTUNITIES Lake Norman MOB |Charlotte, SC Owned and Operated by HTA 23

PROVEN HISTORY INVESTING IN COMPETITIVE MARKETS LARGE, FRAGMENTED INDUSTRY WITH HISTORY OF TARGETED ACQUISITIONS AMPLE INVESTMENT OPPORTUNITIES (AS OF DECEMBER 31, 2018) 5% 11% 19% REITS Hospitals / Health Systems Providers / Private Owners Private Equity / Developers 14% Govt / Other 51% $ millions Leading Investor of Medical Office Buildings Relationships & Scale Drive Opportunities • Target key markets with dynamic and growing economies and health systems • Focusing in key markets where we have strong relationships • Focus on critical locations primarily located directly on-campus or in core- & opportunities for growth community outpatient locations • Utilize our platform to achieve incremental 25 – 50bps of • Underwrite well-occupied MOB assets with strong same-store growth potential yield on acquisitions in our markets on HTA’s platform • Local market teams drives opportunities and focus on • Accretive to HTA’s cost of capital and commitment to a low leveraged balance market scale sheet 24 www.htareit.com
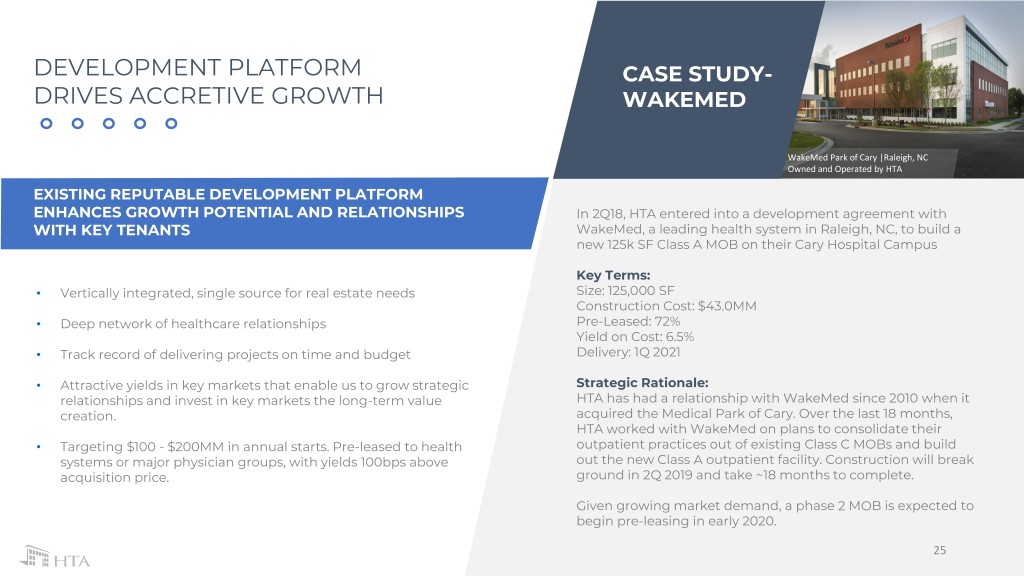
DEVELOPMENT PLATFORM CASE STUDY- DRIVES ACCRETIVE GROWTH WAKEMED WakeMed Park of Cary |Raleigh, NC Owned and Operated by HTA EXISTING REPUTABLE DEVELOPMENT PLATFORM ENHANCES GROWTH POTENTIAL AND RELATIONSHIPS In 2Q18, HTA entered into a development agreement with WITH KEY TENANTS WakeMed, a leading health system in Raleigh, NC, to build a new 125k SF Class A MOB on their Cary Hospital Campus Key Terms: • Vertically integrated, single source for real estate needs Size: 125,000 SF Construction Cost: $43.0MM • Deep network of healthcare relationships Pre-Leased: 72% Yield on Cost: 6.5% • Track record of delivering projects on time and budget Delivery: 1Q 2021 • Attractive yields in key markets that enable us to grow strategic Strategic Rationale: relationships and invest in key markets the long-term value HTA has had a relationship with WakeMed since 2010 when it creation. acquired the Medical Park of Cary. Over the last 18 months, HTA worked with WakeMed on plans to consolidate their • Targeting $100 - $200MM in annual starts. Pre-leased to health outpatient practices out of existing Class C MOBs and build systems or major physician groups, with yields 100bps above out the new Class A outpatient facility. Construction will break acquisition price. ground in 2Q 2019 and take ~18 months to complete. Given growing market demand, a phase 2 MOB is expected to begin pre-leasing in early 2020. 25
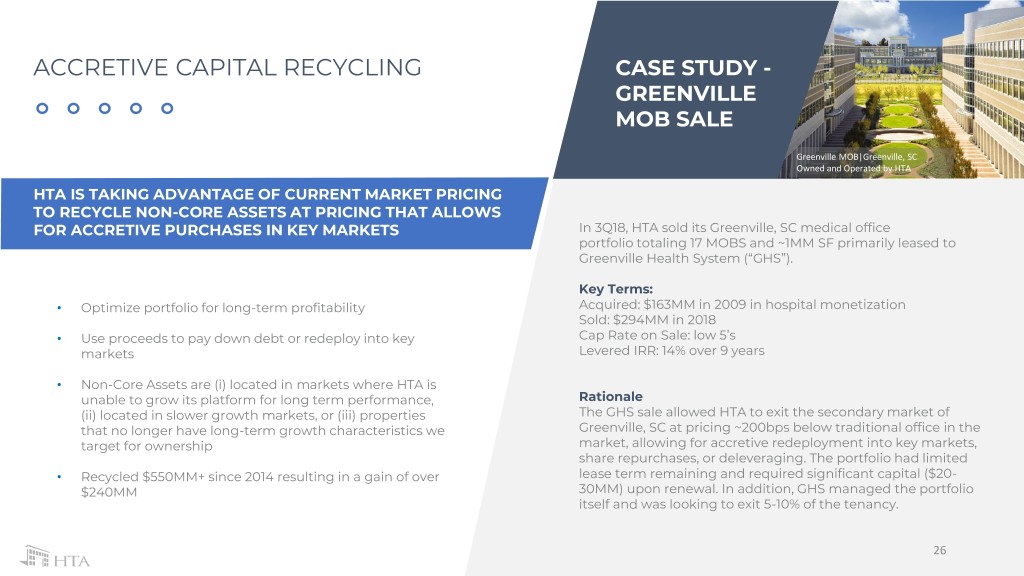
ACCRETIVE CAPITAL RECYCLING CASE STUDY - GREENVILLE MOB SALE Greenville MOB|Greenville, SC Owned and Operated by HTA HTA IS TAKING ADVANTAGE OF CURRENT MARKET PRICING TO RECYCLE NON-CORE ASSETS AT PRICING THAT ALLOWS FOR ACCRETIVE PURCHASES IN KEY MARKETS In 3Q18, HTA sold its Greenville, SC medical office portfolio totaling 17 MOBS and ~1MM SF primarily leased to Greenville Health System (“GHS”). Key Terms: • Optimize portfolio for long-term profitability Acquired: $163MM in 2009 in hospital monetization Sold: $294MM in 2018 • Use proceeds to pay down debt or redeploy into key Cap Rate on Sale: low 5’s markets Levered IRR: 14% over 9 years • Non-Core Assets are (i) located in markets where HTA is unable to grow its platform for long term performance, Rationale (ii) located in slower growth markets, or (iii) properties The GHS sale allowed HTA to exit the secondary market of that no longer have long-term growth characteristics we Greenville, SC at pricing ~200bps below traditional office in the target for ownership market, allowing for accretive redeployment into key markets, share repurchases, or deleveraging. The portfolio had limited • Recycled $550MM+ since 2014 resulting in a gain of over lease term remaining and required significant capital ($20- $240MM 30MM) upon renewal. In addition, GHS managed the portfolio itself and was looking to exit 5-10% of the tenancy. 26

PERFORMANCE TO THE BOTTOM LINE Cherokee Medical Center |Woodstock, GA Owned and Operated by HTA 27

FINANCIAL PERFORMANCE TO BOTTOM LINE INCREASING NORMALIZED FFO/ SHARE CONSISTENT SAME STORE GROWTH – 3.0% SINCE LISTING 3.0% HTA Avg. 2.6% REIT MOB Avg. * HTA DATA AS OF 12/31/18 28
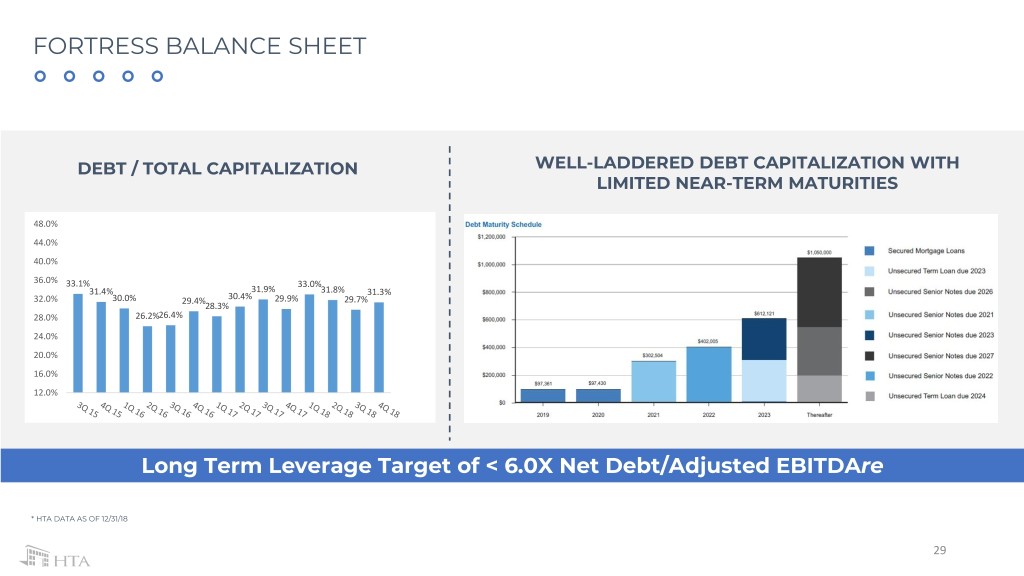
FORTRESS BALANCE SHEET DEBT / TOTAL CAPITALIZATION WELL-LADDERED DEBT CAPITALIZATION WITH LIMITED NEAR-TERM MATURITIES 48.0% 44.0% 40.0% 36.0% 33.1% 33.0% 31.4% 31.9% 31.8% 31.3% 32.0% 30.0% 29.4% 30.4% 29.9% 29.7% 28.3% 28.0% 26.2%26.4% 24.0% 20.0% 16.0% 12.0% Long Term Leverage Target of < 6.0X Net Debt/Adjusted EBITDAre * HTA DATA AS OF 12/31/18 29
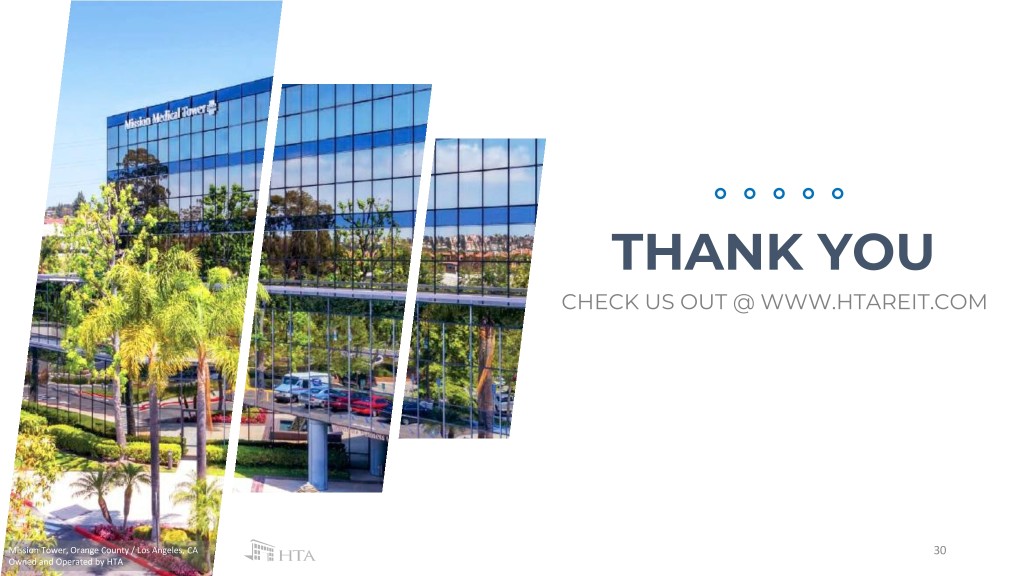
THANK YOU CHECK US OUT @ WWW.HTAREIT.COM Mission Tower, Orange County / Los Angeles, CA 30 Owned and Operated by HTA


