
HEALTHCARE TRUST OF AMERICA, INC. The Largest Dedicated Owner & Operator of Medical Office Buildings in the U.S. 2019 Annual Meeting 670 Albany, Boston MA Owned and Operated by HTA
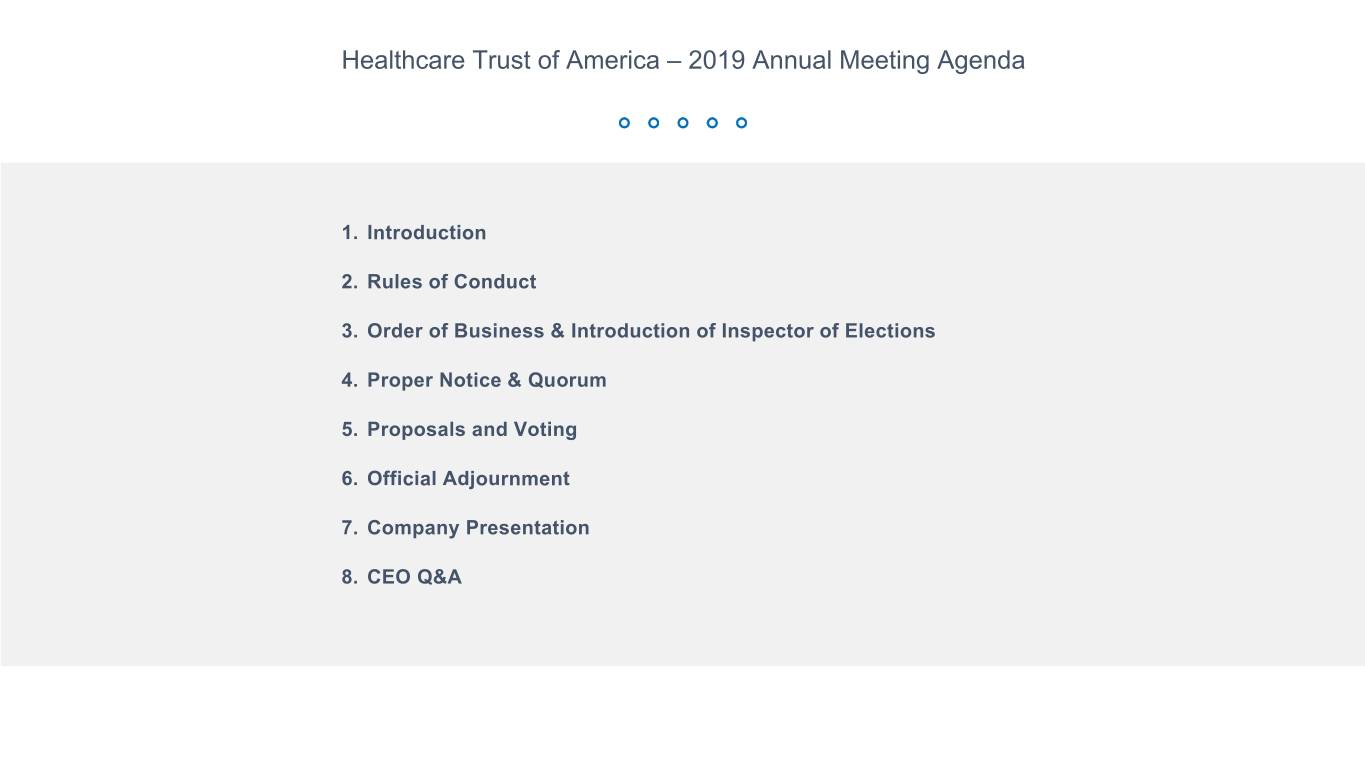
Healthcare Trust of America – 2019 Annual Meeting Agenda 1. Introduction 2. Rules of Conduct 3. Order of Business & Introduction of Inspector of Elections 4. Proper Notice & Quorum 5. Proposals and Voting 6. Official Adjournment 7. Company Presentation 8. CEO Q&A

Company Presentation The Pavilion MOB |Dallas, TX Owned and Operated by HTA

F O R W A R D L O O K I N G S T A T E M E N T S This document contains both historical and forward‐looking statements. Forward‐looking statements are based on current expectations, plans, estimates, assumptions and beliefs, including expectations, plans, estimates, assumptions and beliefs about our company, the real estate industry, pending acquisitions, future medical office building performance and the debt and equity capital markets. All statements other than statements of historical fact are, or may be deemed to be, forward‐looking statements within the meaning of Section 27A of the Securities Act of 1933, as amended, and Section 21E of the Securities Exchange Act of 1934, as amended. Forward‐looking statements include information concerning possible or assumed future results of operations of our Company. The forward‐looking statements included in this document are subject to numerous risks and uncertainties that could cause actual results to differ materially from those expressed or implied in the forward‐looking statements. Assumptions relating to the foregoing involve judgments with respect to, among other things, future economic, competitive and market conditions and future business decisions, all of which are difficult or impossible to predict accurately and many of which are beyond our control. Although we believe that the expectations reflected in such forward‐looking statements are based on reasonable assumptions, our actual results and performance could differ materially from those set forth in the forward‐looking statements. Factors which could have a material adverse effect on our operations and future prospects include, but are not limited to: changes in economic conditions affecting the healthcare property sector, the commercial real estate market and the credit market; our ability to complete our pending acquisitions; competition for acquisition of medical office buildings and other facilities that serve the healthcare industry; economic fluctuations in certain states in which our property investments are geographically concentrated; retention of our senior management team; financial stability and solvency of our tenants; supply and demand for operating properties in the market areas in which we operate; our ability to acquire properties, and to successfully operate those properties once acquired; changes in property taxes; legislative and regulatory changes, including changes to laws governing the taxation of REITs and changes to laws governing the healthcare industry; fluctuations in reimbursements from third party payors such as Medicare and Medicaid; changes in interest rates; the availability of capital and financing; restrictive covenants in our credit facilities; changes in our credit ratings; our ability to remain qualified as a REIT; and the risk factors set forth in our 2018 Annual Report on Form 10‐K filed on February 19, 2019. Forward‐looking statements speak only as of the date made. Except as otherwise required by the federal securities laws, we undertake no obligation to update any forward‐looking statements to reflect the events or circumstances arising after the date as of which they are made. As a result of these risks and uncertainties, readers are cautioned not to place undue reliance on the forward looking statements included in this document or that may be made elsewhere from time to time by, or on behalf of, us. For definitions of terms and reconciliations for certain financial measures disclosed herein, including, but not limited to, funds from operations (FFO), normalized funds from operations (Normalized FFO), annualized base rents (ABR), net operating income (NOI), and on‐campus/aligned, please see our Company’s earnings press release issued on April 25, 2019 and our Company’s Supplemental Financial Package for the quarter ended March 31, 2019 and year ended December 31, 2018, each of which is available in the investor relations section of our Company’s website located at www.htareit.com.
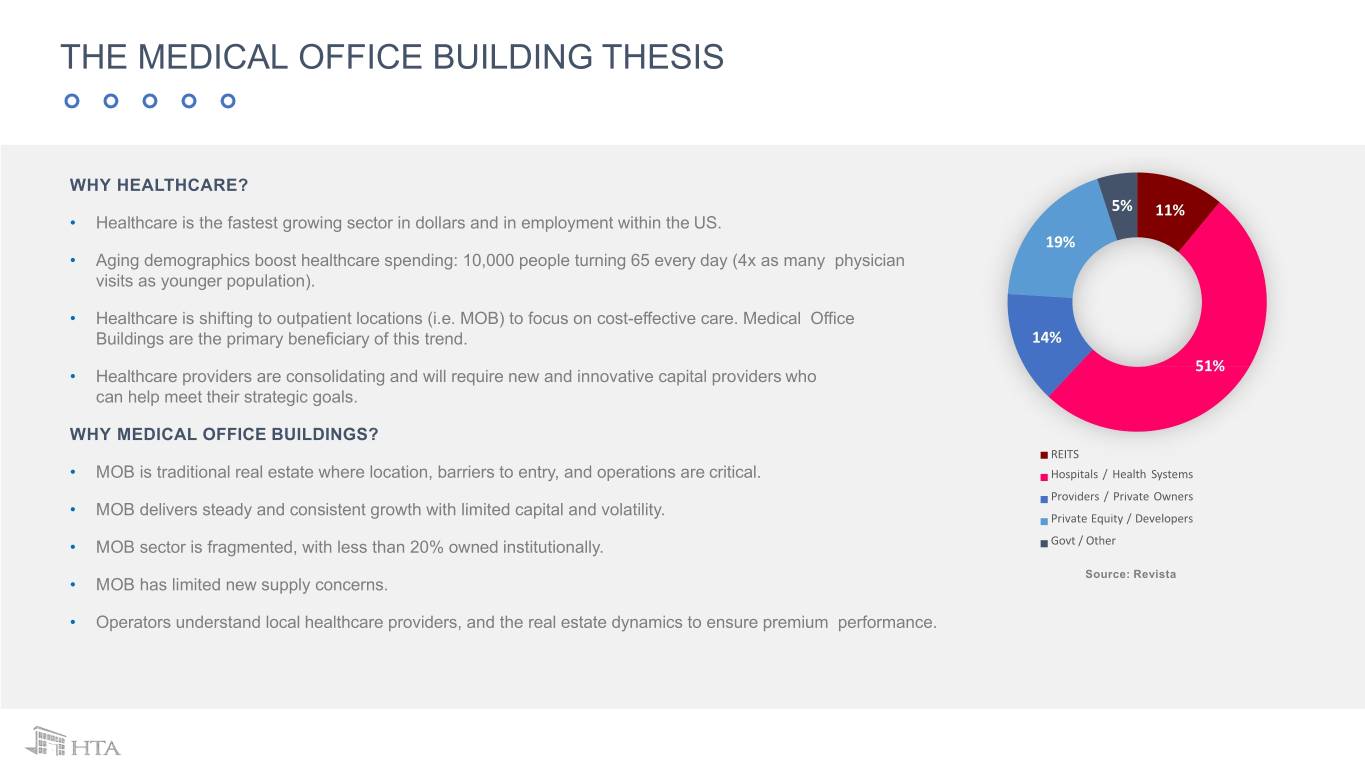
THE MEDICAL OFFICE BUILDING THESIS WHY HEALTHCARE? 5% 11% • Healthcare is the fastest growing sector in dollars and in employment within the US. 19% • Aging demographics boost healthcare spending: 10,000 people turning 65 every day (4x as many physician visits as younger population). • Healthcare is shifting to outpatient locations (i.e. MOB) to focus on cost-effective care. Medical Office Buildings are the primary beneficiary of this trend. 14% 51% • Healthcare providers are consolidating and will require new and innovative capital providers who can help meet their strategic goals. WHY MEDICAL OFFICE BUILDINGS? REITS • MOB is traditional real estate where location, barriers to entry, and operations are critical. Hospitals / Health Systems Providers / Private Owners • MOB delivers steady and consistent growth with limited capital and volatility. Private Equity / Developers • MOB sector is fragmented, with less than 20% owned institutionally. Govt / Other Source: Revista • MOB has limited new supply concerns. • Operators understand local healthcare providers, and the real estate dynamics to ensure premium performance.
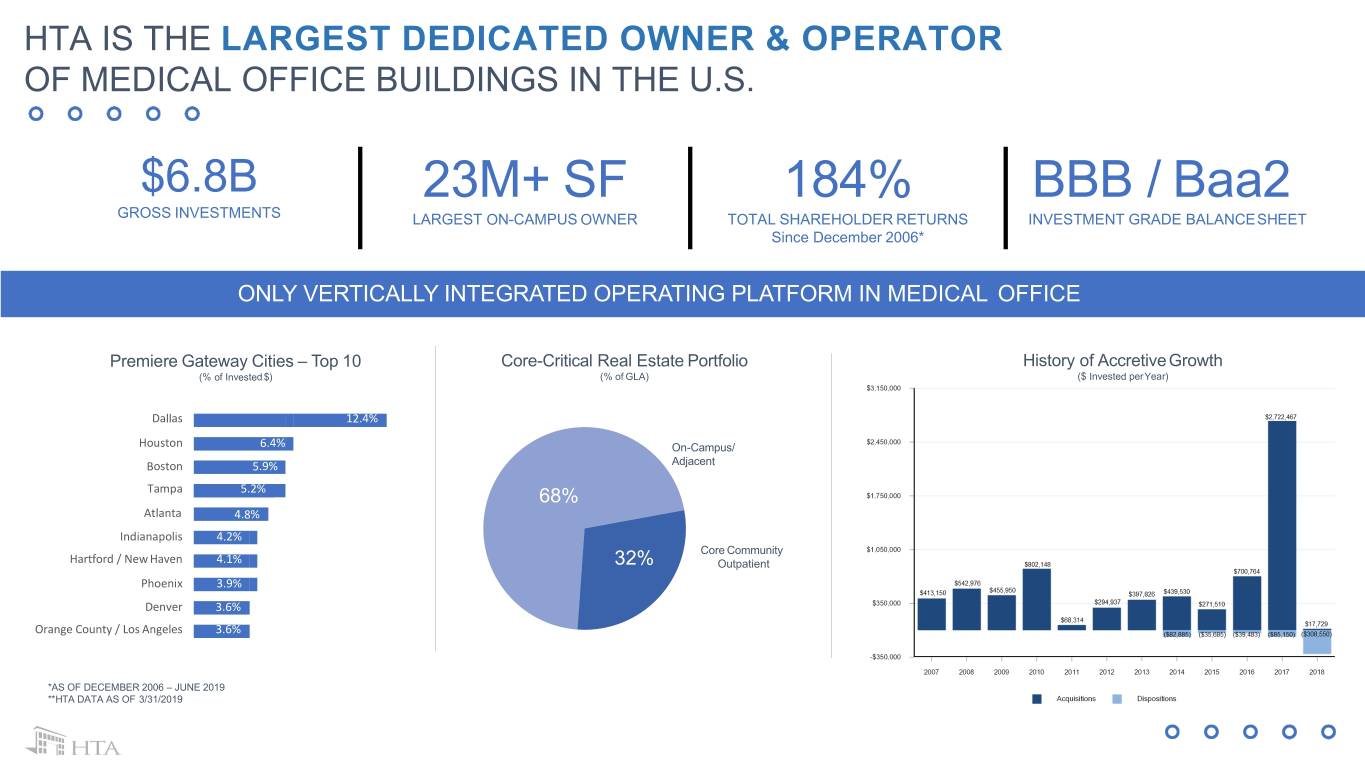
HTA IS THE LARGEST DEDICATED OWNER & OPERATOR OF MEDICAL OFFICE BUILDINGS IN THE U.S. $6.8B 23M+ SF 184% BBB / Baa2 GROSS INVESTMENTS LARGEST ON-CAMPUS OWNER TOTAL SHAREHOLDER RETURNS INVESTMENT GRADE BALANCESHEET Since December 2006* ONLY VERTICALLY INTEGRATED OPERATING PLATFORM IN MEDICAL OFFICE Premiere Gateway Cities – Top 10 Core-Critical Real Estate Portfolio History of Accretive Growth (% of Invested$) (% of GLA) ($ Invested perYear) Dallas 12.4% Houston 6.4% On-Campus/ Boston 5.9% Adjacent Tampa 5.2% 68% Atlanta 4.8% Indianapolis 4.2% Core Community Hartford / New Haven 4.1% 32% Outpatient Phoenix 3.9% Denver 3.6% Orange County / Los Angeles 3.6% *AS OF DECEMBER 2006 – JUNE 2019 **HTA DATA AS OF 3/31/2019
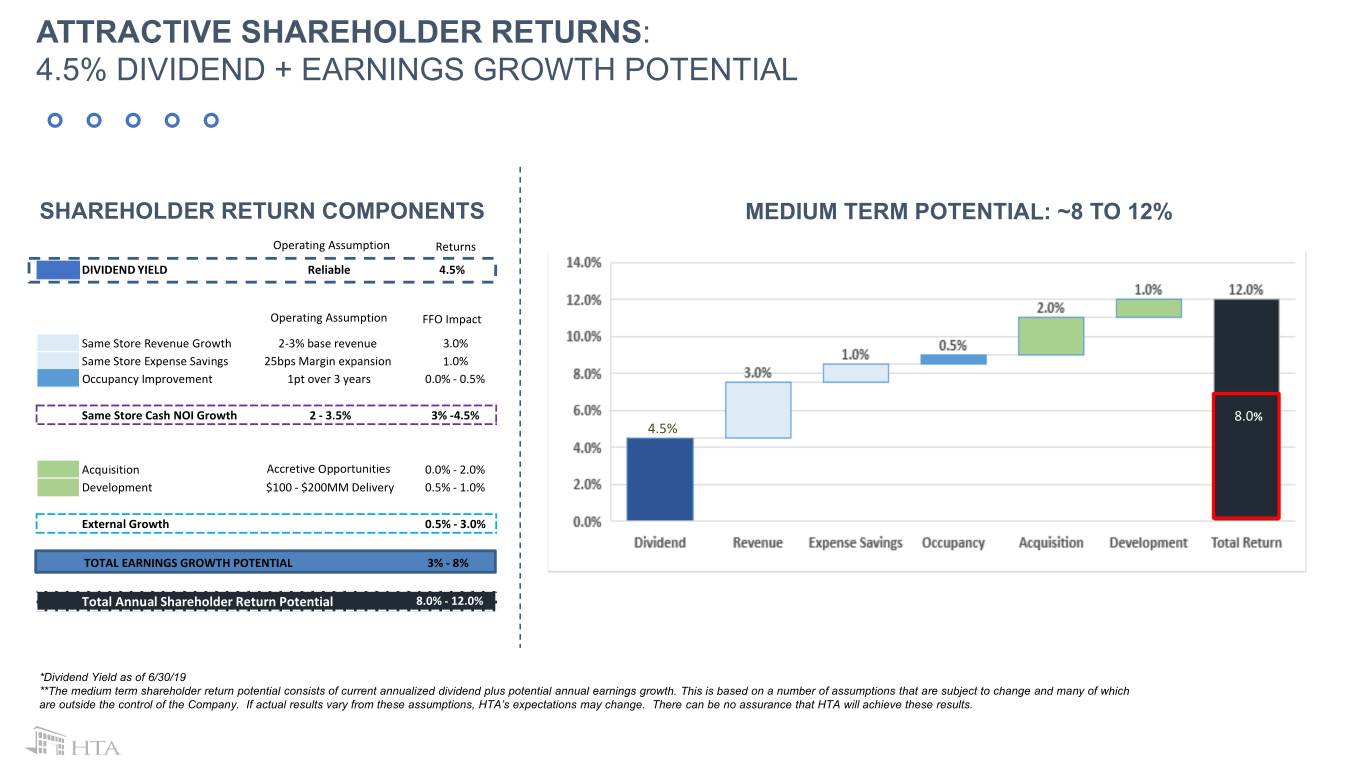
8.7% ATTRACTIVE SHAREHOLDER RETURNS: 4.5% DIVIDEND + EARNINGS GROWTH POTENTIAL SHAREHOLDER RETURN COMPONENTS MEDIUM TERM POTENTIAL: ~8 TO 12% Operating Assumption Returns DIVIDEND YIELD Reliable 4.5% Operating Assumption FFO Impact Same Store Revenue Growth 2-3% base revenue 3.0% Same Store Expense Savings 25bps Margin expansion 1.0% Occupancy Improvement 1pt over 3 years 0.0% - 0.5% Same Store Cash NOI Growth 2 - 3.5% 3% -4.5% 8.0% 4.5% Acquisition Accretive Opportunities 0.0% - 2.0% Development $100 - $200MM Delivery 0.5% - 1.0% External Growth 0.5% - 3.0% TOTAL EARNINGS GROWTH POTENTIAL 3% - 8% Total Annual Shareholder Return Potential 8.0% - 12.0% *Dividend Yield as of 6/30/19 **The medium term shareholder return potential consists of current annualized dividend plus potential annual earnings growth. This is based on a number of assumptions that are subject to change and many of which are outside the control of the Company. If actual results vary from these assumptions, HTA’s expectations may change. There can be no assurance that HTA will achieve these results.

OUR STRATEGIC FOCUS CORE, CRITICAL MEDICAL REAL ESTATE DISCIPLINED, ACCRETIVE GROWTH STRATEGY • On-campus and core community off-campus focus within high demand • Disciplined record of acquiring and developing MOBs with strong medical hubs for the future of healthcare delivery accretion and NOI growth in competitive markets • $7+ billion invested over the past decade • Acquisitions & development provide different tracks for consistent, external growth CRITICAL MASS IN ESTABLISHED GATEWAY MARKETS • Platform adds incremental accretion to investments • Disciplined market focus on 20-25 key markets with growing economies STRONG, INVESTMENT GRADE BALANCE SHEET and favorable demographic trends • Operational scale achieved with 15 markets over 500k SF creating • Management has long-term track record of successful financial operating synergies and enhanced relationships that drive growth management discipline • Low leverage balance sheet with investment grade ratings FULL SERVICE, BEST-IN-CLASS PLATFORM SEASONED, SKILLED MANAGEMENT TEAM • Dedicated property management and leasing platform leads to superior operating margins and leasing performance • Decades of experience, acquiring, owning and operating • Development team adds depth of opportunities and allows HTA to commercial real estate capitalize on new and existing relationships • 12-year track record of delivering consistent shareholder value

EXECUTION CREATES THE SUPERIOR PLATFORM 2013 2018 Portfolio Size ($B) $3.0B $6.8 B Portfolio Size 14.1MM SF 23.2MM SF (GLA in millions) Top Markets Phoenix Dallas IN THE LAST 5 YEARS, WE Pittsburgh Houston Greenville Boston HAVE GROWN OUR Albany Tampa Indianapolis Atlanta PORTFOLIO & EARNINGS % Top 20 Markets (GLA) 63% 75% WHILE ESTABLISHING 1 MM SF Markets 3 9 500K SF Markets 9 15 SCALE IN KEY MARKETS In-House Property 85% 93% FACILITATING COMPANY Management (GLA in MM) 12.0MM SF 21.6MM SF 91% 94% OPERATIONS & LONG-TERM % MOB’s Development In Process/LTM $0 $144.2MM GROWTH OPPORTUNITIES Completion ($ in MM) Earnings (NFFO/Share) $1.28 $1.62 +27% Payout Ratio 99% 91% Leverage 5.3x 5.4x Eskenazi Administration Building |Indianapolis, IN (Net Debt / Adjusted EBITDAre) Owned and Operated by HTA Please reference the Company’s filed and furnished financial reports for the respective periods for financial reconciliations

STRONG PERFORMANCE AMONG PEERS Strong Same Store Growth Efficient Capital Allocation Drives Returns Avg. SS Growth Since 2013 Cap-Ex as % of NOI Since 2013 3.5% 3.2% 3.0% 35% 31% 3.0% 2.6% 30% 2.3% 2.5% 25% 22% 2.0% 1.5% 20% 1.5% 1.3% 15% 13% 1.0% 10% 0.5% 5% 0.0% 0% HTA VTR WELL HCP DOC HR HTA HR Other Office Source: Company filings – HTA as of 12/31/18, all others 3Q 2018 Source: Company filings as of 3Q 2018 Annualized FFO Growth Shareholder Return Since 2012 FFO Growth Since 2012 80% 68% 6% 70% 4.8% 4.6% 5% 60% 53% 54% 4% 3.3% 50% 3% 36% 40% 2% 1.1% 1% 30% 0% 20% -1% HTA VTR WELL HCP HR 10% -2% -6% -3% -1.8% 0% HTA VTR WELL HCP HR Source: Company filings – 2012 to 2018 proj. -10% McAuley Medical Center |Phoenix, AZ Source: SNL – up to 12/31/18 Owned and Operated by HTA * DATA AS OF NOTED ON EACH CHART
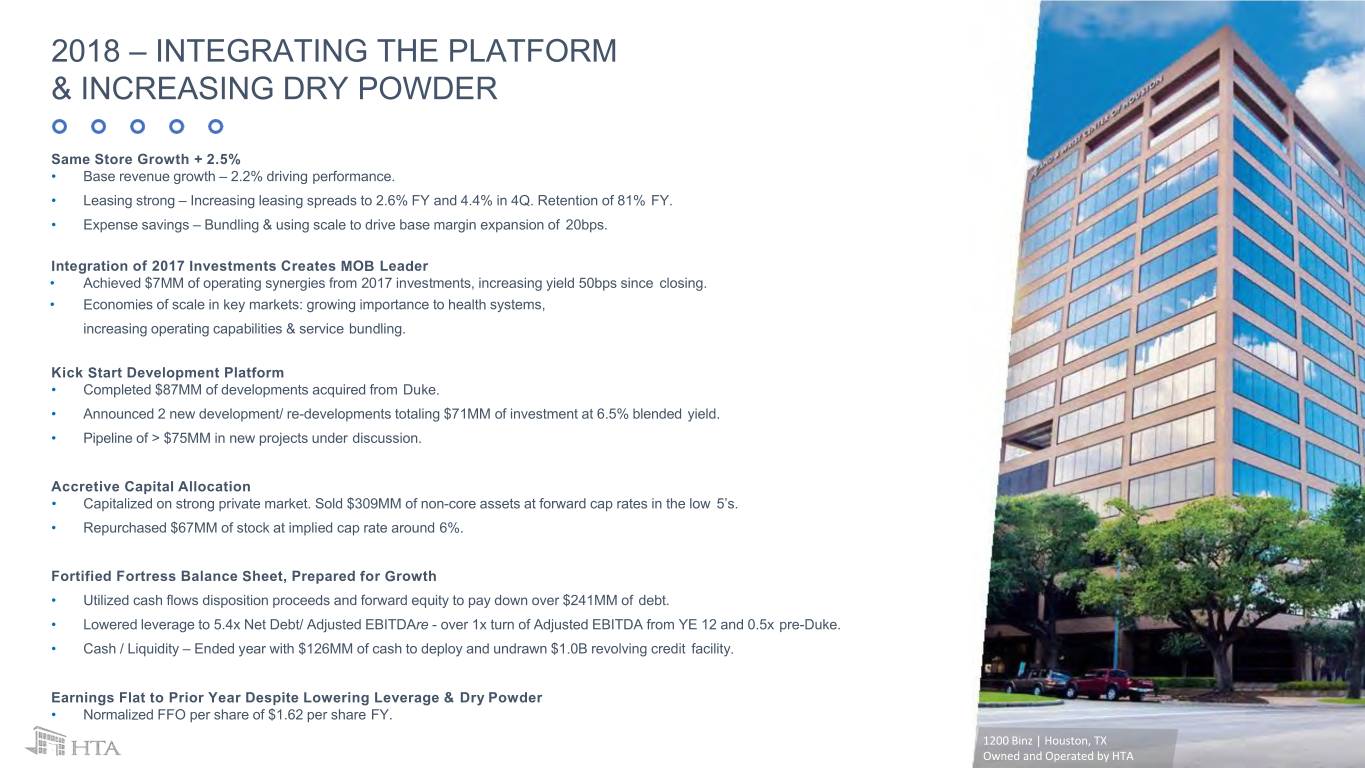
2018 – INTEGRATING THE PLATFORM & INCREASING DRY POWDER Same Store Growth + 2.5% • Base revenue growth – 2.2% driving performance. • Leasing strong – Increasing leasing spreads to 2.6% FY and 4.4% in 4Q. Retention of 81% FY. • Expense savings – Bundling & using scale to drive base margin expansion of 20bps. Integration of 2017 Investments Creates MOB Leader • Achieved $7MM of operating synergies from 2017 investments, increasing yield 50bps since closing. • Economies of scale in key markets: growing importance to health systems, increasing operating capabilities & service bundling. Kick Start Development Platform • Completed $87MM of developments acquired from Duke. • Announced 2 new development/ re-developments totaling $71MM of investment at 6.5% blended yield. • Pipeline of > $75MM in new projects under discussion. Accretive Capital Allocation • Capitalized on strong private market. Sold $309MM of non-core assets at forward cap rates in the low 5’s. • Repurchased $67MM of stock at implied cap rate around 6%. Fortified Fortress Balance Sheet, Prepared for Growth • Utilized cash flows disposition proceeds and forward equity to pay down over $241MM of debt. • Lowered leverage to 5.4x Net Debt/ Adjusted EBITDAre - over 1x turn of Adjusted EBITDA from YE 12 and 0.5x pre-Duke. • Cash / Liquidity – Ended year with $126MM of cash to deploy and undrawn $1.0B revolving credit facility. Earnings Flat to Prior Year Despite Lowering Leverage & Dry Powder • Normalized FFO per share of $1.62 per share FY. 1200 Binz | Houston, TX Owned and Operated by HTA

2019 – DISCIPLINED EXECUTION, PATIENTLY LOOKING FOR OPPORTUNITIES Same Store Growth Above Peer Average • Expected range 2.0 to 3.0% • Focused leasing performance: (i) releasing spreads > 2%; (ii) annual escalators > 2.5%; (iii) retention of 80%+ • Platform driving margin growth: 25bps of base margin Increase through (i) increased utilization of platform and (ii) bundling of services Disciplined Capital Allocation • Remain patient as we look for opportunities in our key markets for accretive growth • Avoid lower quality, highly priced deals that are not accretive on a leverage neutral basis • Targeting $250MM of investments at 5.5% average yield • Targeting $75MM of dispositions at 6.0% average yield Drive Development Growth • Targeting new development wins at 6.5% blended yields • Sourcing deals from existing relationships in key markets + potential to partner with local developers Maintain Low Leverage, But Utilize Available Cash & Balance Sheet for Accretive Opportunities • Maintain leverage < 6.0x (0.5x turns of available debt) • Utilize available cash in key markets, as appropriate • Refinance limited debt maturities Earnings Growth • Normalized FFO Growth of 2-4% (before the impact of accounting rule change), depending on ability to identify and execute on accretive external growth opportunities
THANK YOU CHECK US OUT @ WWW.HTAREIT.COM Mission Tower, Orange County / Los Angeles, CA Owned and Operated by HTA


