UNITED STATES
SECURITIES AND EXCHANGE COMMISSION
Washington, D.C. 20549
FORM N-CSR
CERTIFIED SHAREHOLDER REPORT OF REGISTERED
MANAGEMENT INVESTMENT COMPANIES
Investment Company Act file number 811-22436
EntrepreneurShares Series Trust
(Exact name of registrant as specified in charter)
40 Grove Street, Suite 200
Wellesly Square, MA 02482
(Address of principal executive offices) (Zip code)
Joel Shulman
40 Grove Street, Suite 200
Wellesley Square, MA 02482
(Name and address of agent for service)
(877) 271-8811
Registrant's telephone number, including area code
Date of fiscal year end: June 30
Date of reporting period: December 31, 2010
Item 1. Report to Stockholders.
Semi-Annual Report
December 31, 2010
EntrepreneurShares Global Fund™
c/o U.S. Bancorp Fund Services, LLC
P.O. Box 1181
Milwaukee, WI 53201-1181
EntrepreneurShares Global Fund
February 25, 2011
Dear Shareholders,
On 11/11/2010 EntrepreneurShares was launched. Our first few weeks of existence provided strong performance, buoyed by a strong bull market and growth in revenues and profits from many companies including our underlying Global Entrepreneurial companies. As we look forward to our first Calendar year of 2011, we express cautious optimism.
During our 6 week period in 2010, we earned approximately 5.96% return on our EntrepreneurShares Global Fund. Our comparative benchmark, MSCI World Index generated a return of approximately 2.82%. Much of our return was generated from strong performance from our smaller cap, technology securities based in the United States, which outperformed many of the other equity markets throughout the world. By contrast, some of our financial service sector companies detracted from our performance during this same period. Overall, though our Fund has only been available to the Public for a short time period, we are encouraged by our strong, relative performance.
As we look forward to 2011, we continue to see opportunities, though realize the navigation of our Global Equity markets has risk to all investors. On the one hand, we see a world with many Global Entrepreneurs, now leaner and more focused owing to the global crisis from 2007-2010. These Entrepreneurs are starting to generate large profits and have been positioning their companies to take advantage of the economic turnaround. However, much of their future growth has already been captured in large stock price appreciation since the market depths in February 2009. Many stocks have appreciated more than 100% since they hit market lows in 2009 and are now approaching their peak from October 2007. Daily comparisons to these historic levels are making some market investors uneasy about continued stock price appreciation and may result in increasing volatility in the broader market. Moreover, recent unrest in the Middle East has generated a spike in oil prices with concern over flow disruptions and further escalations among key oil producing nations.
These political uprisings and the spread with which they have been moving from country to country, are yet another stark reminder about the power of technology and the inter-relationship among our varying global capital markets.
As we look forward to 2011, we are optimistic of the possibilities of a rising equity market amidst a peaceful and well-functioning global economy. Yet, we are also mindful of the hazards awaiting an unprepared investor pursuing equity appreciation.
2
EntrepreneurShares Global Fund
We approach our future investment strategy with a balanced portfolio spread among a number of Global Entrepreneurial companies. We have confidence that a savvy entrepreneur can manage his/her company within the parameters of complex market conditions. With a diversified basket of entrepreneurial managers, spread among companies in different geographic, sector and market cap sizes we believe we will continue to provide our investors a superior risk-adjusted portfolio of securities.
We appreciate the support of our investors and look forward to providing you with more updates in 2011.
/s/ Joel Shulman
Joel Shulman Ph.D., CFA
Chief Investment Officer
EntrepreneurShares
Past performance is no guarantee of future results.
Must be preceded or accompanied by a current prospectus.
The MSCI World Index is a free float-adjusted market capitalization weighted index that is designed to measure the equity market performance of developed markets.
Fund holdings are subject to change and are not recommendations to buy or sell any security.
Please refer to pages 7 – 16 for a complete list of Fund holdings.
Opinions expressed are subject to change, are not guaranteed and should not be considered recommendations to buy or sell any security.
3
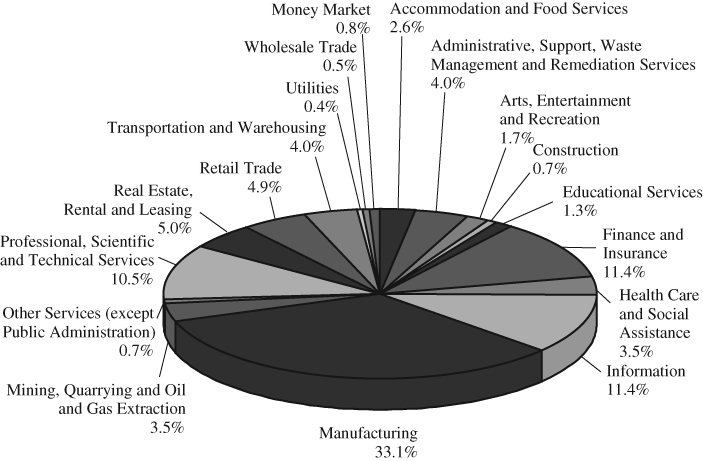
EntrepreneurShares Global Fund
SECTOR ALLOCATION OF PORTFOLIO INVESTMENTS
December 31, 2010 (Unaudited)
4
EntrepreneurShares Global Fund
EXPENSE EXAMPLE
December 31, 2010 (Unaudited)
As a shareholder of The EntrepreneurShares Global Fund (the “Fund”), you incur two types of costs: (1) transaction costs, including sales charges (loads) on purchase payments of Class A shares; and (2) ongoing costs, including investment advisory fees, distribution and/or shareholder servicing fees, and other Fund expenses, which are indirectly paid by shareholders. This example is intended to help you understand your ongoing costs (in dollars) of investing in the Fund and to compare these costs with the ongoing costs of investing in other mutual funds.
The example is based on an investment of $1,000 invested at the Fund’s inception and held for the entire period from November 11, 2010 – December 31, 2010.
ACTUAL EXPENSES
The first line of the table below for each share class of the Fund provides information about actual account values and actual expenses. However, the table does not include shareholder specific fees, such as the $15.00 fee charged for wire redemptions. The table also does not include portfolio trading commissions and related trading costs. You may use the information in this line, together with the amount you invested, to estimate the expenses that you paid over the period. Simply divide your account value by $1,000 (for example, an $8,600 account value divided by $1,000 = 8.6), then multiply the result by the number in the first line under the heading entitled “Expenses Paid During Period” to estimate the expenses you paid on your account during this period.
HYPOTHETICAL EXAMPLE FOR COMPARISON PURPOSES
The second line of the table below provides information about hypothetical account values and hypothetical expenses based on the actual expense ratios for each share class of the Fund and an assumed rate of return of 5% per year before expenses, which is not the Fund’s actual return. The hypothetical account values and expenses may not be used to estimate the actual ending account balance or expenses you paid for the period. You may use this information to compare the ongoing costs of investing in the Fund and other funds. To do so, compare this 5% hypothetical example with the 5% hypothetical examples that appear in the shareholder reports of the other funds. Please note that the expenses shown in the table are meant to highlight your ongoing costs only and do not reflect any transactional costs, such as sales charges (loads), redemption fees, or exchange fees. Therefore, the second line of the table is useful in comparing ongoing costs only, and will not help you determine the relative total costs of owning different funds.
5
EntrepreneurShares Global Fund
EXPENSE EXAMPLE (continued)
December 31, 2010 (Unaudited)
ENTREPRENEURSHARES GLOBAL FUND – RETAIL CLASS
| Expenses Paid | ||||||||||||
| Beginning | Ending | During Period* | ||||||||||
| Account Value | Account Value | November 11, 2010(1) - | ||||||||||
November 11, 2010(1) | December 31, 2010 | December 31, 2010 | ||||||||||
| Actual | $ | 1,000.00 | $ | 1,059.60 | $ | 2.88 | ||||||
| Hypothetical (5% annual | ||||||||||||
| return before expenses) | 1,000.00 | 1,004.05 | 2.80 | |||||||||
| * | Expenses are equal to the Fund’s annualized expense ratio (including extraordinary expenses) of 2.04%, multiplied by the average account value over the period, multiplied by 50/365 to reflect the partial year period. |
ENTREPRENEURSHARES GLOBAL FUND – INSTITUTIONAL CLASS
| Expenses Paid | ||||||||||||
| Beginning | Ending | During Period* | ||||||||||
| Account Value | Account Value | November 11, 2010(1) - | ||||||||||
November 11, 2010(1) | December 31, 2010 | December 31, 2010 | ||||||||||
| Actual | $ | 1,000.00 | $ | 1,059.90 | $ | 2.53 | ||||||
| Hypothetical (5% annual | ||||||||||||
| return before expenses) | 1,000.00 | 1,004.40 | 2.46 | |||||||||
| * | Expenses are equal to the Fund’s annualized expense ratio (including extraordinary expenses) of 1.79%, multiplied by the average account value over the period, multiplied by 50/365 to reflect the partial year period. |
ENTREPRENEURSHARES GLOBAL FUND – CLASS A
| Expenses Paid | ||||||||||||
| Beginning | Ending | During Period* | ||||||||||
| Account Value | Account Value | November 11, 2010(1) - | ||||||||||
November 11, 2010(1) | December 31, 2010 | December 31, 2010 | ||||||||||
| Actual | $ | 1,000.00 | $ | 1,059.40 | $ | 2.88 | ||||||
| Hypothetical (5% annual | ||||||||||||
| return before expenses) | 1,000.00 | 1,004.05 | 2.80 | |||||||||
| * | Expenses are equal to the Fund’s annualized expense ratio (including extraordinary expenses) of 2.04%, multiplied by the average account value over the period, multiplied by 50/365 to reflect the partial year period. |
| (1) | Inception date of Fund. |
6
EntrepreneurShares Global Fund
SCHEDULE OF INVESTMENTS
December 31, 2010 (Unaudited)
| Shares | Value | ||||||
COMMON STOCKS - 84.88% | |||||||
| Administrative and Support Services - 3.11% | |||||||
| 1,650 | EnerNOC, Inc. (a) | $ | 39,452 | ||||
| 1,800 | Expedia, Inc. | 45,162 | |||||
| 2,390 | The Geo Group, Inc. (a) | 58,937 | |||||
| 3,860 | Liquidity Services, Inc. (a) | 54,233 | |||||
| 897 | Mantech International Corp. (a) | 37,073 | |||||
| 2,700 | Portfolio Recovery Associates, Inc. (a) | 203,040 | |||||
| 437,897 | |||||||
| Air Transportation - 0.36% | |||||||
| 3,260 | SkyWest, Inc. | 50,921 | |||||
Ambulatory Health Care Services - 2.79% | |||||||
| 2,400 | Amedisys, Inc. (a) | 80,400 | |||||
| 3,600 | American Dental Partners, Inc. (a) | 48,636 | |||||
| 2,120 | AmSurg Corp. (a) | 44,414 | |||||
| 2,240 | Bio-Reference Labs, Inc. (a) | 49,683 | |||||
| 4,000 | Genoptix, Inc. (a) | 76,080 | |||||
| 1,430 | LHC Group, Inc. (a) | 42,900 | |||||
| 750 | Mednax, Inc. (a) | 50,468 | |||||
| 392,581 | |||||||
| Amusement, Gambling, and | |||||||
| Recreation Industries - 1.48% | |||||||
| 3,400 | Las Vegas Sands Corp. (a) | 156,230 | |||||
| 500 | Wynn Resorts Ltd. | 51,920 | |||||
| 208,150 | |||||||
| Apparel Manufacturing - 2.03% | |||||||
| 4,890 | Bebe Stores, Inc. | 29,144 | |||||
| 936 | Guess?, Inc. | 44,291 | |||||
| 8,180 | Quiksilver, Inc. (a) | 41,473 | |||||
| 1,296 | Under Armour, Inc. (a) | 71,073 | |||||
| 2,270 | Volcom, Inc. | 42,835 | |||||
| 2,120 | Zumiez, Inc. (a) | 56,964 | |||||
| 285,780 | |||||||
The accompanying notes are in integral part of these financial statements.
7
EntrepreneurShares Global Fund
SCHEDULE OF INVESTMENTS (continued)
December 31, 2010 (Unaudited)
| Shares | Value | ||||||
COMMON STOCKS - 84.88% (continued) | |||||||
| Building Material, Garden | |||||||
| Equipment and Supplies Dealers - 0.78% | |||||||
| 1,780 | Lumber Liquidators Holdings, Inc. (a) | $ | 44,340 | ||||
| 3,400 | Titan Machinery, Inc. (a) | 65,620 | |||||
| 109,960 | |||||||
| Chemical Manufacturing - 8.36% | |||||||
| 1,800 | Abaxis, Inc. (a) | 48,330 | |||||
| 799 | Alexion Pharmaceuticals, Inc. (a) | 64,359 | |||||
| 15,280 | DURECT Corp. (a) | 52,716 | |||||
| 12,550 | Dyax Corp. (a) | 26,857 | |||||
| 2,830 | Emergent BioSolutions, Inc. (a) | 66,392 | |||||
| 7,300 | Enzo Biochem, Inc. (a) | 38,544 | |||||
| 12,620 | Immunomedics, Inc. (a) | 45,180 | |||||
| 3,070 | Inter Parfums, Inc. | 57,869 | |||||
| 3,990 | Jazz Pharmaceuticals, Inc. (a) | 78,523 | |||||
| 2,950 | LSB Industries, Inc. (a) | 71,567 | |||||
| 6,540 | MannKind Corp. (a) | 52,712 | |||||
| 2,900 | MAP Pharmaceuticals, Inc. (a) | 48,546 | |||||
| 1,735 | Medicis Pharmaceutical Corp. | 46,481 | |||||
| 2,400 | Meridian Bioscience, Inc. | 55,584 | |||||
| 3,960 | Optimer Pharmaceuticals, Inc. (a) | 44,788 | |||||
| 7,280 | Pain Therapeutics, Inc. (a) | 49,140 | |||||
| 1,667 | Regeneron Pharmaceuticals, Inc. (a) | 54,728 | |||||
| 5,980 | Rigel Pharmaceuticals, Inc. (a) | 45,029 | |||||
| 3,812 | Seattle Genetics, Inc. (a) | 56,989 | |||||
| 3,400 | Theravance, Inc. (a) | 85,238 | |||||
| 760 | United Therapeutics Corp. (a) | 48,047 | |||||
| 4,110 | Vanda Pharmaceuticals, Inc. (a) | 38,881 | |||||
| 1,176,500 | |||||||
| Clothing and Clothing Accessories Stores - 1.17% | |||||||
| 990 | Blue Nile, Inc. (a) | 56,489 | |||||
| 6,060 | Coldwater Creek, Inc. (a) | 19,210 | |||||
| 2,730 | Finish Line, Inc. | 46,929 | |||||
| 1,706 | The Men’s Wearhouse, Inc. | 42,616 | |||||
| 165,244 | |||||||
The accompanying notes are in integral part of these financial statements.
8
EntrepreneurShares Global Fund
SCHEDULE OF INVESTMENTS (continued)
December 31, 2010 (Unaudited)
| Shares | Value | ||||||
COMMON STOCKS - 84.88% (continued) | |||||||
| Computer and Electronic | |||||||
| Product Manufacturing - 11.21% | |||||||
| 1,700 | Acme Packet, Inc. (a) | $ | 90,372 | ||||
| 100 | Apple, Inc. (a) | 32,256 | |||||
| 2,410 | Applied Signal Technology, Inc. | 91,315 | |||||
| 3,334 | Aruba Networks, Inc. (a) | 69,614 | |||||
| 12,630 | BigBand Networks, Inc. (a) | 35,364 | |||||
| 1,280 | Cabot Microelectronics Corp. (a) | 53,056 | |||||
| 1,725 | Cavium Networks, Inc. (a) | 64,998 | |||||
| 2,670 | Compellent Technologies, Inc. (a) | 73,665 | |||||
| 3,451 | Cypress Semiconductor Corp. (a) | 64,120 | |||||
| 1,140 | Illumina, Inc. (a) | 72,208 | |||||
| 5,250 | Infinera Corporation (a) | 54,232 | |||||
| 2,600 | IPG Photonics Corp. (a) | 82,212 | |||||
| 5,180 | IXYS Corp. (a) | 60,192 | |||||
| 2,000 | Microchip Technology, Inc. | 68,420 | |||||
| 2,080 | Monolithic Power Systems, Inc. (a) | 34,362 | |||||
| 1,228 | National Instruments Corp. | 46,222 | |||||
| 6,500 | OmniVision Technologies, Inc. (a) | 192,465 | |||||
| 1,257 | SBA Communications Corp. (a) | 51,462 | |||||
| 848 | Silicon Laboratories, Inc. (a) | 39,025 | |||||
| 3,930 | STEC, Inc. (a) | 69,364 | |||||
| 1,920 | Stratasys, Inc. (a) | 62,669 | |||||
| 1,730 | Supertex, Inc. (a) | 41,831 | |||||
| 5,284 | Tellabs, Inc. | 35,825 | |||||
| 1,267 | ViaSat, Inc. (a) | 56,267 | |||||
| 4,190 | Zoran Corp. (a) | 36,872 | |||||
| 1,578,388 | |||||||
| Construction of Buildings - 0.65% | |||||||
| 2,300 | Meritage Homes Corp. (a) | 51,060 | |||||
| 2,145 | Toll Brothers, Inc. (a) | 40,755 | |||||
| 91,815 | |||||||
| Credit Intermediation and Related Activities - 2.32% | |||||||
| 1,000 | Capital One Financial Corp. | 42,560 | |||||
| 7,371 | CapitalSource, Inc. | 52,334 | |||||
The accompanying notes are in integral part of these financial statements.
9
EntrepreneurShares Global Fund
SCHEDULE OF INVESTMENTS (continued)
December 31, 2010 (Unaudited)
| Shares | Value | ||||||
COMMON STOCKS - 84.88% (continued) | |||||||
| Credit Intermediation and | |||||||
| Related Activities - 2.32% (continued) | |||||||
| 3,762 | Euronet Worldwide, Inc. (a) | $ | 65,609 | ||||
| 16,260 | The First Marblehead Corp. (a) | 35,284 | |||||
| 4,240 | Hercules Technology Growth Capital, Inc. | 43,927 | |||||
| 6,000 | PrivateBancorp, Inc. | 86,280 | |||||
| 325,994 | |||||||
| Data Processing, Hosting and Related Services - 1.75% | |||||||
| 1,150 | CoStar Group, Inc. (a) | 66,194 | |||||
| 2,790 | ExlService Holdings, Inc. (a) | 59,929 | |||||
| 12,120 | Limelight Networks, Inc. (a) | 70,417 | |||||
| 1,100 | Red Hat, Inc. (a) | 50,215 | |||||
| 246,755 | |||||||
| Educational Services - 1.13% | |||||||
| 1,725 | Bridgepoint Education, Inc. (a) | 32,775 | |||||
| 468 | Capella Education Company (a) | 31,160 | |||||
| 7,400 | Corinthian Colleges, Inc. (a) | 38,554 | |||||
| 1,990 | K12, Inc. (a) | 57,033 | |||||
| 159,522 | |||||||
| Electrical Equipment, Appliance and | |||||||
| Component Manufacturing - 2.27% | |||||||
| 1,443 | American Superconductor Corp. (a) | 41,255 | |||||
| 10,420 | Ener1, Inc. (a) | 39,492 | |||||
| 3,080 | iRobot Corp. (a) | 76,631 | |||||
| 17,250 | TASER International, Inc. (a) | 81,075 | |||||
| 7,000 | Zoltek Cos., Inc. (a) | 80,850 | |||||
| 319,303 | |||||||
| Fabricated Metal Product Manufacturing - 0.70% | |||||||
| 1,521 | BE Aerospace, Inc. (a) | 56,323 | |||||
| 1,228 | The Shaw Group, Inc. (a) | 42,034 | |||||
| 98,357 | |||||||
| Food Manufacturing - 0.88% | |||||||
| 2,570 | The Hain Celestial Group, Inc. (a) | 69,544 | |||||
The accompanying notes are in integral part of these financial statements.
10
EntrepreneurShares Global Fund
SCHEDULE OF INVESTMENTS (continued)
December 31, 2010 (Unaudited)
| Shares | Value | ||||||
COMMON STOCKS - 84.88% (continued) | |||||||
| Food Manufacturing - 0.88% (continued) | |||||||
| 1,120 | J & J Snack Foods Corp. | $ | 54,029 | ||||
| 123,573 | |||||||
| Food Services and Drinking Places - 2.36% | |||||||
| 351 | Chipotle Mexican Grill, Inc. (a) | 74,644 | |||||
| 526 | Panera Bread Co. (a) | 53,236 | |||||
| 1,740 | Papa Johns International, Inc. (a) | 48,198 | |||||
| 1,600 | Starbucks Corp. | 51,408 | |||||
| 6,057 | Texas Roadhouse, Inc. (a) | 103,999 | |||||
| 331,485 | |||||||
| Funds, Trusts and Other Financial Vehicles - 0.67% | |||||||
| 497 | Greenhill & Co., Inc. | 40,595 | |||||
| 4,340 | PennantPark Investment Corp. | 53,122 | |||||
| 93,717 | |||||||
| Hospitals - 0.38% | |||||||
| 1,360 | IPC The Hospitalist Co., Inc. (a) | 53,054 | |||||
Insurance Carriers and Related Activities - 2.11% | |||||||
| 399 | American National Insurance Co. | 34,162 | |||||
| 5,770 | Meadowbrook Insurance Group, Inc. | 59,143 | |||||
| 984 | Mercury General Corp. | 42,322 | |||||
| 1,880 | Molina Healthcare, Inc. (a) | 52,358 | |||||
| 2,250 | National Interstate Corp. | 48,150 | |||||
| 1,220 | The Navigators Group, Inc. (a) | 61,427 | |||||
| 297,562 | |||||||
| Machinery Manufacturing - 0.90% | |||||||
| 2,747 | II-VI, Inc. (a) | 127,351 | |||||
Merchant Wholesalers, Durable Goods - 0.36% | |||||||
| 5,880 | Brightpoint, Inc. (a) | 51,332 | |||||
Miscellaneous Manufacturing - 1.56% | |||||||
| 3,510 | BioMimetic Therapeutics, Inc. (a) | 44,577 | |||||
| 1,390 | ICU Medical, Inc. (a) | 50,735 | |||||
| 250 | Intuitive Surgical, Inc. (a) | 64,438 | |||||
The accompanying notes are in integral part of these financial statements.
11
EntrepreneurShares Global Fund
SCHEDULE OF INVESTMENTS (continued)
December 31, 2010 (Unaudited)
| Shares | Value | ||||||
COMMON STOCKS - 84.88% (continued) | |||||||
| Miscellaneous Manufacturing - 1.56% (continued) | |||||||
| 3,320 | JAKKS Pacific, Inc. (a) | $ | 60,490 | ||||
| 220,240 | |||||||
| Motion Picture and Sound Recording Industries - 0.87% | |||||||
| 1,082 | DreamWorks Animation SKG, Inc. (a) | 31,887 | |||||
| 516 | NetFlix, Inc. (a) | 90,661 | |||||
| 122,548 | |||||||
| Motor Vehicle and Parts Dealers - 0.52% | |||||||
| 5,500 | Sonic Automotive, Inc. (a) | 72,820 | |||||
Nonstore Retailers - 1.90% | |||||||
| 100 | Amazon.com, Inc. (a) | 18,000 | |||||
| 1,257 | Copart, Inc. (a) | 46,949 | |||||
| 3,200 | Sohu.com, Inc. (a) | 203,168 | |||||
| 268,117 | |||||||
| Oil and Gas Extraction - 1.65% | |||||||
| 4,390 | ATP Oil & Gas Corp. (a) | 73,489 | |||||
| 920 | Contango Oil & Gas Company (a) | 53,295 | |||||
| 600 | Devon Energy Corp. | 47,106 | |||||
| 3,180 | Venoco, Inc. (a) | 58,671 | |||||
| 232,561 | |||||||
| Other Information Services - 1.67% | |||||||
| 200 | Google, Inc. (a) | 118,794 | |||||
| 2,820 | Travelzoo, Inc. (a) | 116,240 | |||||
| 235,034 | |||||||
| Personal and Laundry Services - 0.67% | |||||||
| 5,660 | The Knot, Inc. (a) | 55,921 | |||||
| 4,611 | Service Corp International | 38,041 | |||||
| 93,962 | |||||||
| Pipeline Transportation - 1.56% | |||||||
| 6,500 | Copano Energy LLC | 219,375 | |||||
Primary Metal Manufacturing - 0.33% | |||||||
| 2,505 | Steel Dynamics, Inc. | 45,841 | |||||
The accompanying notes are in integral part of these financial statements.
12
EntrepreneurShares Global Fund
SCHEDULE OF INVESTMENTS (continued)
December 31, 2010 (Unaudited)
| Shares | Value | ||||||
COMMON STOCKS - 84.88% (continued) | |||||||
| Professional, Scientific and Technical Services - 9.40% | |||||||
| 1,900 | Administaff, Inc. | $ | 55,670 | ||||
| 965 | Advent Software, Inc. (a) | 55,893 | |||||
| 6,140 | Affymetrix, Inc. (a) | 30,884 | |||||
| 5,190 | Albany Molecular Research, Inc. (a) | 29,168 | |||||
| 1,189 | athenahealth, Inc. (a) | 48,725 | |||||
| 2,880 | comScore, Inc. (a) | 64,253 | |||||
| 3,380 | Fundtech Ltd. (a)(b) | 54,655 | |||||
| 4,990 | Internet Capital Group, Inc. (a) | 70,958 | |||||
| 2,680 | Kendle International, Inc. (a) | 29,185 | |||||
| 3,210 | Netscout Systems, Inc. (a) | 73,862 | |||||
| 1,833 | PAREXEL International Corp. (a) | 38,914 | |||||
| 2,540 | Resources Connection, Inc. | 47,219 | |||||
| 3,060 | Riverbed Technology, Inc. (a) | 107,620 | |||||
| 1,101 | Solera Holdings, Inc. | 56,503 | |||||
| 1,960 | Sourcefire, Inc. (a) | 50,823 | |||||
| 3,750 | SYKES Enterprises, Inc. (a) | 75,975 | |||||
| 2,360 | Synchronoss Technologies, Inc. (a) | 63,036 | |||||
| 1,072 | Syntel, Inc. | 51,231 | |||||
| 1,608 | VCA Antech, Inc. (a) | 37,450 | |||||
| 1,647 | VeriSign, Inc. (a) | 53,807 | |||||
| 4,310 | Virtusa Corp. (a) | 70,512 | |||||
| 18,000 | VisionChina Media, Inc. - ADR (a) | 83,520 | |||||
| 2,630 | Vocus, Inc. (a) | 72,746 | |||||
| 1,322,609 | |||||||
| Publishing Industries (except Internet) - 5.00% | |||||||
| 1,004 | Concur Technologies, Inc. (a) | 52,138 | |||||
| 3,310 | Kenexa Corp. (a) | 72,125 | |||||
| 3,180 | NetSuite, Inc. (a) | 79,500 | |||||
| 2,870 | OPNET Technologies, Inc. | 76,830 | |||||
| 1,150 | Pegasystems, Inc. | 42,125 | |||||
| 3,030 | Renaissance Learning, Inc. | 35,875 | |||||
| 2,590 | RightNow Technologies, Inc. (a) | 61,305 | |||||
| 4,600 | Smith Micro Software, Inc. (a) | 72,404 | |||||
| 2,115 | SuccessFactors, Inc. (a) | 61,250 | |||||
| 1,901 | Synopsys, Inc. (a) | 51,156 | |||||
The accompanying notes are in integral part of these financial statements.
13
EntrepreneurShares Global Fund
SCHEDULE OF INVESTMENTS (continued)
December 31, 2010 (Unaudited)
| Shares | Value | ||||||
COMMON STOCKS - 84.88% (continued) | |||||||
| Publishing Industries | |||||||
| (except Internet) - 5.00% (continued) | |||||||
| 6,120 | TeleCommunication Systems, Inc. (a) | $ | 28,580 | ||||
| 1,440 | The Ultimate Software Group, Inc. (a) | 70,027 | |||||
| 703,315 | |||||||
| Real Estate - 1.33% | |||||||
| 12,500 | E-House (China) Holdings Ltd. - ADR | 187,000 | |||||
Securities, Commodity Contracts, Other Financial | |||||||
| Investments and Related Activities - 4.48% | |||||||
| 526 | Affiliated Managers Group, Inc. (a) | 52,190 | |||||
| 2,973 | The Blackstone Group LP | 42,068 | |||||
| 1,900 | The Charles Schwab Corp. | 32,509 | |||||
| 3,290 | Cohen & Steers, Inc. | 85,869 | |||||
| 1,570 | Evercore Partners, Inc. | 53,380 | |||||
| 9,960 | FBR Capital Markets Corp. (a) | 38,047 | |||||
| 1,638 | Federated Investors, Inc. | 42,866 | |||||
| 2,860 | Interactive Brokers Group, Inc. | 50,965 | |||||
| 400 | IntercontinentalExchange, Inc. (a) | 47,660 | |||||
| 916 | Morningstar, Inc. (a) | 48,621 | |||||
| 2,583 | Och-Ziff Capital Management Group LLC | 40,243 | |||||
| 2,750 | optionsXpress Holdings, Inc. (a) | 43,093 | |||||
| 1,310 | Westwood Holdings Group, Inc. | 52,348 | |||||
| 629,859 | |||||||
| Semiconductor Related Products - 0.39% | |||||||
| 8,000 | JA Solar Holdings Co. Ltd. - ADR (a) | 55,360 | |||||
Support Activities for Mining - 1.45% | |||||||
| 11,400 | W&T Offshore, Inc. | 203,718 | |||||
Telecommunications - 0.90% | |||||||
| 3,320 | Cbeyond, Inc. (a) | 50,730 | |||||
| 5,937 | Clearwire Corp. (a) | 30,575 | |||||
| 2,490 | Oplink Communications, Inc. (a) | 45,990 | |||||
| 127,295 | |||||||
The accompanying notes are in integral part of these financial statements.
14
EntrepreneurShares Global Fund
SCHEDULE OF INVESTMENTS (continued)
December 31, 2010 (Unaudited)
| Shares | Value | ||||||
COMMON STOCKS - 84.88% (continued) | |||||||
| Transportation Equipment Manufacturing - 0.96% | |||||||
| 4,000 | Orbital Sciences Corp. (a) | $ | 68,520 | ||||
| 2,500 | Tesla Motors, Inc. (a) | 66,575 | |||||
| 135,095 | |||||||
| Utilities - 0.35% | |||||||
| 789 | ITC Holdings Corp. | 48,902 | |||||
Waste Management and Remediation Services - 0.47% | |||||||
| 789 | Clean Harbors, Inc. (a) | 66,339 | |||||
Water Transportation - 1.65% | |||||||
| 8,530 | Eagle Bulk Shipping, Inc. (a) | 42,480 | |||||
| 2,240 | Hornbeck Offshore Services, Inc. (a) | 46,771 | |||||
| 41,500 | Paragon Shipping, Inc. | 142,345 | |||||
| 231,596 | |||||||
| TOTAL COMMON STOCKS | |||||||
| (Cost $11,419,972) | 11,946,827 | ||||||
| REAL ESTATE INVESTMENT TRUSTS - 3.47% | |||||||
Funds, Trusts and Other Financial Vehicles - 0.29% | |||||||
| 1,930 | Healthcare Realty Trust, Inc. | 40,858 | |||||
Real Estate - 3.18% | |||||||
| 1,638 | AMB Property Corp. | 51,941 | |||||
| 2,291 | Apartment Investment & Management Co. | 59,199 | |||||
| 8,180 | CapLease, Inc. | 47,608 | |||||
| 8,472 | DCT Industrial Trust, Inc. | 44,986 | |||||
| 2,080 | DuPont Fabros Technology, Inc. | 44,242 | |||||
| 1,000 | Equity Residential | 51,950 | |||||
| 458 | Essex Property Trust, Inc. | 52,313 | |||||
| 8,813 | Medical Properties Trust, Inc. | 95,445 | |||||
| 447,684 | |||||||
| TOTAL REAL ESTATE INVESTMENT TRUSTS | |||||||
| (Cost $486,266) | 488,542 | ||||||
The accompanying notes are in integral part of these financial statements.
15
EntrepreneurShares Global Fund
SCHEDULE OF INVESTMENTS (continued)
December 31, 2010 (Unaudited)
| Shares | Value | ||||||
| CLOSED-ENDED FUNDS - 0.33% | |||||||
| Funds, Trusts and Other Financial Vehicles - 0.33% | |||||||
| 2,788 | Ares Capital Corp. | $ | 45,946 | ||||
| TOTAL CLOSED-ENDED FUNDS | |||||||
| (Cost $46,406) | 45,946 | ||||||
| SHORT-TERM INVESTMENTS - 0.68% | |||||||
| Money Market Funds - 0.68% | |||||||
| 31,932 | Fidelity Institutional Money Market Funds - | ||||||
| Government Portfolio, 0.02% (c) | 31,932 | ||||||
| 31,932 | First American Government | ||||||
| Obligations Fund, 0.00% (c) | 31,932 | ||||||
| 31,933 | First American Treasury | ||||||
| Obligations Fund, 0.00% (c) | 31,933 | ||||||
| TOTAL SHORT-TERM INVESTMENTS | |||||||
| (Cost $95,797) | 95,797 | ||||||
| Total Investments | |||||||
| (Cost $12,048,441) - 89.36% | 12,577,112 | ||||||
| Other Assets in Excess of Liabilities - 10.64% | 1,497,156 | ||||||
| TOTAL NET ASSETS - 100.00% | $ | 14,074,268 | |||||
ADR - American Depository Receipt
| (a) | Non-income producing security. |
| (b) | Foreign issued security. Foreign concentration was as follows: Cayman Islands 2.32%; Marshall Islands 1.31%; Israel 0.39%. |
| (c) | Variable rate security. The rate listed is as of December 31, 2010. |
The accompanying notes are in integral part of these financial statements.
16
EntrepreneurShares Global Fund
STATEMENT OF ASSETS AND LIABILITIES
December 31, 2010 (Unaudited)
| ASSETS: | ||||
| Investments, at value (cost $12,048,441) | $ | 12,577,112 | ||
| Income receivable | 6,188 | |||
| Cash | 1,460,522 | |||
| Other assets | 46,477 | |||
| Total Assets | 14,090,299 | |||
| LIABILITIES: | ||||
| Payable to Investment Adviser | 3,281 | |||
| Accrued distribution fee | 9 | |||
| Other accrued expenses | 12,741 | |||
| Total Liabilities | 16,031 | |||
| NET ASSETS | $ | 14,074,268 | ||
| NET ASSETS CONSIST OF: | ||||
| Capital stock | 13,527,430 | |||
| Unrealized appreciation on investments | 528,671 | |||
| Accumulated net investment loss | (2,515 | ) | ||
| Accumulated undistributed net realized gain | 20,682 | |||
| Total Net Assets | $ | 14,074,268 | ||
| NET ASSETS CONSIST OF: | ||||
| Retail Class Shares: | ||||
| Net assets | $ | 30,430 | ||
| Shares outstanding | 2,877 | |||
| Net Asset Value and Redemption Price Per Share | ||||
| (Unlimited shares of no par value authorized) | $ | 10.58 | ||
| Institutional Class Shares: | ||||
| Net assets | $ | 14,042,780 | ||
| Shares outstanding | 1,327,112 | |||
| Net Asset Value and Redemption Price Per Share | ||||
| (Unlimited shares of no par value authorized) | $ | 10.58 | ||
| Class A Shares: | ||||
| Net assets | $ | 1,058 | ||
| Shares outstanding | 100 | |||
| Net Asset Value and Redemption Price Per Share | ||||
| (Unlimited shares of no par value authorized) | $ | 10.58 | ||
Maximum Offering Price Per Share(1) | $ | 11.11 | ||
| (1) | Includes a sales load of 4.75%. See Footnote 9. |
The accompanying notes are in integral part of these financial statements.
17
EntrepreneurShares Global Fund
STATEMENT OF OPERATIONS
For the period ended December 31, 2010(1) (Unaudited)
| INVESTMENT INCOME: | ||||
| Dividend income | $ | 47,330 | ||
| Interest income | 2 | |||
| 47,332 | ||||
| EXPENSES: | ||||
| Investment advisory fees | 17,470 | |||
| Legal fees | 3,350 | |||
| Federal and state registration fees | 3,090 | |||
| Audit fees | 2,500 | |||
| Other expenses | 2,252 | |||
| Trustees’ fees and expenses | 2,150 | |||
| Extraordinary fees | 1,218 | |||
| Transfer agent and shareholder service fees | 1,200 | |||
| Fund accounting fees | 960 | |||
| Administration fees | 699 | |||
| Reports to shareholders | 600 | |||
| Custody fees | 70 | |||
| Distribution fees (Retail and Class A only) | 9 | |||
| Total expenses | 35,568 | |||
| Expense Reimbursement | (10,581 | ) | ||
| Net Expenses | 24,987 | |||
| NET INVESTMENT INCOME | 22,345 | |||
| REALIZED AND UNREALIZED GAIN ON INVESTMENTS: | ||||
| Net realized gain on investment transactions | 20,682 | |||
| Change in unrealized appreciation on investments | 528,671 | |||
| Net gain on investments | 549,353 | |||
| NET INCREASE IN NET ASSETS | ||||
| RESULTING FROM OPERATIONS | $ | 571,698 | ||
| (1) | Inception date of the Fund was November 11, 2010. |
The accompanying notes are in integral part of these financial statements.
18
EntrepreneurShares Global Fund
STATEMENT OF CHANGES IN NET ASSETS
| Period From | ||||
| November 11, 2010* | ||||
| to December 31, 2010 | ||||
| (Unaudited) | ||||
| OPERATIONS: | ||||
| Net investment income | $ | 22,345 | ||
| Net realized gain on investment transactions | 20,682 | |||
| Change in unrealized appreciation on investments | 528,671 | |||
| Net increase in net assets resulting from operations | 571,698 | |||
| CAPITAL SHARE TRANSACTIONS: | ||||
| Proceeds from shares sold - Retail Class | 28,500 | |||
| Proceeds from shares sold - Institutional Class | 13,480,499 | |||
| Proceeds from shares sold - Class A | 1,000 | |||
| Proceeds from shares issued to holders in | ||||
| reinvestment of dividends - Retail Class | 45 | |||
| Proceeds from shares issued to holders in | ||||
| reinvestment of dividends - Institutional Class | 17,385 | |||
| Proceeds from shares issued to holders in | ||||
| reinvestment of dividends - Class A | 1 | |||
| Net increase in net assets resulting | ||||
| from capital share transactions | 13,527,430 | |||
| DIVIDENDS AND DISTRIBUTIONS TO SHAREHOLDERS: | ||||
| Net investment income - Institutional Class | (24,813 | ) | ||
| Net investment income - Retail Class | (46 | ) | ||
| Net investment income - Class A | (1 | ) | ||
| Total dividends and distributions | (24,860 | ) | ||
| INCREASE IN NET ASSETS | 14,074,268 | |||
| NET ASSETS: | ||||
| Beginning of Period | — | |||
| End of Period | $ | 14,074,268 | ||
| * | The Fund was incepted on November 11, 2010. |
The accompanying notes are in integral part of these financial statements.
19
EntrepreneurShares Global Fund
FINANCIAL HIGHLIGHTS
Retail Class
| Period From | ||||
November 11, 2010(1) | ||||
| to December 31, 2010 | ||||
| (Unaudited) | ||||
| Per Share Data: | ||||
| Net asset value, beginning of period | $ | 10.00 | ||
| Income from investment operations: | ||||
| Net investment income | 0.02 | |||
| Net realized and unrealized gains on investments | 0.58 | |||
| Total from investment operations | 0.60 | |||
| Less distributions: | ||||
| Dividends from net investment income | (0.02 | ) | ||
| Total distributions | (0.02 | ) | ||
| Net asset value, end of period | $ | 10.58 | ||
| Total return | 5.96 | %(2) | ||
| Supplemental data and ratios: | ||||
| Net assets, end of period (000’s) | $ | 30 | ||
| Ratio of expenses to average net assets | 1.95 | %(3)(4)(5) | ||
| Ratio of net investment income to average net assets | 1.54 | %(3)(5) | ||
| Portfolio turnover rate | 1.32 | %(2) | ||
(1)Inception of Fund.
(2)Not annualized for the period ended December 31, 2010.
(3)Annualized for the period ended December 31, 2010.
(4)Including extraordinary expenses increases the ratio by 0.09%.
(5)Net of fees waived of 0.76%.
The accompanying notes are in integral part of these financial statements.
20
EntrepreneurShares Global Fund
FINANCIAL HIGHLIGHTS (Continued)
Institutional Class
| Period From | ||||
November 11, 2010(1) | ||||
| to December 31, 2010 | ||||
| (Unaudited) | ||||
| Per Share Data: | ||||
| Net asset value, beginning of period | $ | 10.00 | ||
| Income from investment operations: | ||||
| Net investment income | 0.02 | |||
| Net realized and unrealized gains on investments | 0.58 | |||
| Total from investment operations | 0.60 | |||
| Less distributions: | ||||
| Dividends from net investment income | (0.02 | ) | ||
| Total distributions | (0.02 | ) | ||
| Net asset value, end of period | $ | 10.58 | ||
| Total return | 5.99 | %(2) | ||
| Supplemental data and ratios: | ||||
| Net assets, end of period (000’s) | $ | 14,043 | ||
| Ratio of expenses to average net assets | 1.70 | %(3)(4)(5) | ||
| Ratio of net investment income to average net assets | 1.60 | %(3)(5) | ||
| Portfolio turnover rate | 1.32 | %(2) | ||
(1)Inception of Fund.
(2)Not annualized for the period ended December 31, 2010.
(3)Annualized for the period ended December 31, 2010.
(4)Including extraordinary expense increases the ratio by 0.09%.
(5)Net of fees waved of 0.76%.
The accompanying notes are in integral part of these financial statements.
21
EntrepreneurShares Global Fund
FINANCIAL HIGHLIGHTS (Continued)
Class A
| Period From | ||||
November 11, 2010(1) | ||||
| to December 31, 2010 | ||||
| (Unaudited) | ||||
| Per Share Data: | ||||
| Net asset value, beginning of period | $ | 10.00 | ||
| Income from investment operations: | ||||
| Net investment income | 0.02 | |||
| Net realized and unrealized gains on investments | 0.57 | |||
| Total from investment operations | 0.59 | |||
| Less distributions: | ||||
| Dividends from net investment income | (0.01 | ) | ||
| Total distributions | (0.01 | ) | ||
| Net asset value, end of period | $ | 10.58 | ||
| Total return | 5.94 | %(2)(6) | ||
| Supplemental data and ratios: | ||||
| Net assets, end of year (000’s) | $ | 1 | ||
| Ratio of expenses to average net assets | 1.95 | %(3)(4)(5) | ||
| Ratio of net investment income to average net assets | 1.26 | %(3)(5) | ||
| Portfolio turnover rate | 1.32 | %(2) | ||
| (1) | Inception of Fund. |
| (2) | Not annualized for the period ended December 31, 2010. |
| (3) | Annualized for the period ended December 31, 2010. |
| (4) | Includes extraordinary expense increases the ratio by 0.09%. |
| (5) | Net of fees waived of 0.76%. |
| (6) | The total return calculation does not reflect the sales load imposed on the purchase of shares. (See Footnote 9) |
The accompanying notes are in integral part of these financial statements.
22
EntrepreneurShares Global Fund
NOTES TO FINANCIAL STATEMENTS
December 31, 2010 (Unaudited)
1.ORGANIZATION
EntrepreneurShares™ Series Trust, a Delaware statutory trust (the “Trust”), was formed on July 1, 2010, and has authorized capital of unlimited shares of beneficial interest. The Trust is a open-end management investment company registered under the Investment Company Act of 1940, as amended (the “Investment Company Act”), and is authorized to issue multiple series and classes of shares. EntrepreneurShares Global Fund (the “Fund”) is currently the sole series of the Trust and is classified as a “diversified” series, as defined in the 1940 Act. The Fund commenced operations on November 11, 2010.
The investment goal of the Fund is to seek long-term capital appreciation. The Fund seeks these investment results through active principles-based securities selection. The Fund mainly invests in equity securities of global companies with market capitalizations that are above $150 million at the time of initial purchase and possess entrepreneurial characteristics, as determined by the Fund’s portfolio manager.
As described in the Fund’s prospectus, the Class A and Retail Class shares are subject to a 0.25% 12b-1 fee and the Class A shares have a sales load. The Institutional Class shares have neither a 12b-1 fee nor a sales load. Each class of shares has identical rights and privileges, except with respect to the sales load and 12b-1 fee, and voting rights on matters affecting a single class of shares.
2.SUMMARY OF SIGNIFICANT ACCOUNT POLICIES
The following is a summary of significant accounting policies consistently followed by the Fund in the preparation of its financial statements. These policies are in conformity with accounting principles generally accepted in the United States of America (GAAP).
Investment Valuations
In determining the NAV of the Fund’s shares, securities that are listed on a national securities exchange (other than The Nasdaq OMX Group, Inc., referred to as NASDAQ) are valued at the last sale price on the day the valuation is made. Securities that are traded on NASDAQ under one of its three listing tiers, NASDAQ Global Select Market, NASDAQ Global Market and NASDAQ Capital Market, are valued at the Nasdaq Official Closing Price. Securities price information on listed stocks is taken from the exchange where the security is primarily traded. Securities which are listed on an exchange but which are not traded on the valuation date are valued at the most recent bid price. Unlisted securities held by the Fund are valued at the average of the quoted bid and asked prices in the OTC market. Securities and
23
EntrepreneurShares Global Fund
NOTES TO FINANCIAL STATEMENTS (continued)
December 31, 2010 (Unaudited)
other assets for which market quotations are not readily available are valued by appraisal at their fair value as determined in good faith by EntrepreneurShares, LLC (the “Sub-Advisor”) under procedures established by and under the general supervision and responsibility of the Board.
Short-term investments held with a remaining maturity of 60 days or less generally are valued at amortized cost, as the Board believes that this method of valuing short-term investments approximates market value. Short-term investments with 61 days or more to maturity at time of purchase are valued at market value through the 61st day prior to maturity, based on quotations received from market makers or other appropriate sources; thereafter, they are generally valued at amortized cost.
There is no definitive set of circumstances under which the Fund may elect to use fair value procedures to value a security. Types of securities that the Fund may hold for which fair value pricing might be required include, but are not limited to: (a) illiquid securities, including restricted securities and private placements for which there is no public market; (b) options not traded on a securities exchange; (c) securities of an issuer that has entered into a restructuring; (d) securities whose trading has been halted or suspended, as permitted by the Securities and Exchange Commission (the SEC); (e) foreign securities, if an event or development has occurred subsequent to the close of the foreign market and prior to the close of regular trading on the NYSE that would materially affect the value of the security; and (f) fixed income securities that have gone into default and for which there is not a current market value quotation. Valuing securities at fair value involves greater reliance on judgment than securities that have readily available market quotations. There can be no assurance that the Fund could obtain the fair value assigned to a security if it were to sell the security at approximately the time at which the Fund determines its NAV per share.
Use of Estimates and Indemnifications:
The preparation of the financial statements in conformity with accounting principles generally accepted in the United States (GAAP) requires management to make estimates and assumptions that affect the reported amounts and disclosures in these financial statements. Actual results could differ from those estimates.
In the normal course of business the Trust enters into contracts that contain a variety of representations which provide general indemnifications. The Trust’s maximum exposure under these arrangements cannot be known; however, the Trust expects any risk of loss to be remote.
24
EntrepreneurShares Global Fund
NOTES TO FINANCIAL STATEMENTS (continued)
December 31, 2010 (Unaudited)
Federal Income Tax:
The Fund intends to qualify as a “regulated investment company” under Subchapter M of the Internal Revenue Code of 1986, as amended. If so qualified, the Fund will not be subject to federal income tax to the extent it distributes substantially all of its net investment income and capital gains to shareholders.
Fair Value Measurement:
The Fund has adopted authoritative fair valuation accounting standards which establish an authoritative definition of fair value and set out a hierarchy for measuring fair value. These standards require additional disclosures about the various inputs and valuation techniques used to develop the measurements of fair value and a discussion of changes in valuation techniques and related inputs during the period. The hierarchy gives the highest priority to unadjusted quoted prices in active markets for identical assets or liabilities (level 1 measurement) and the lowest priority to unobservable inputs (level 3 measurements). The three levels of the fair value hierarchy are as follows:
| Level 1: | Inputs that reflect unadjusted quoted prices in active markets for identical assets or liabilities that the Fund has the ability to access at the measurement date; |
| Level 2: | Inputs other than quoted prices that are observable for the asset or liability either directly or indirectly, including inputs in markets that are not considered to be active; |
| Level 3: | Inputs that are unobservable. |
Inputs are used in applying the various valuation techniques and broadly refer to the assumptions that market participants use to make valuation decisions, including assumptions about risk. Inputs may include price information, volatility statistics, specific and broad credit data, liquidity statistics, and other factors. A financial instrument’s level within the fair value hierarchy is based on the lowest level of any input that is significant to the fair value measurement. However, the determination of what constitutes “observable” requires significant judgment by the Fund. The Fund considers observable data to be that market data which is readily available, regularly distributed or updated, reliable and verifiable, not proprietary, and provided by independent sources that are actively involved in the relevant market. The categorization of a financial instrument within the hierarchy is based upon the pricing transparency of the instrument and does not necessarily correspond to the Fund’s perceived risk of that instrument.
Investments whose values are based on quoted market prices in active markets, and are therefore classified within level 1, include active listed equities and real
25
EntrepreneurShares Global Fund
NOTES TO FINANCIAL STATEMENTS (continued)
December 31, 2010 (Unaudited)
estate investment trusts, closed-end mutual funds, and certain money market securities. Investments that trade in markets that are not considered to be active, but are valued based on quoted market prices, dealer quotations or alternative pricing sources supported by observable inputs are classified within level 2. Investments classified within level 3 have significant unobservable inputs, as they trade infrequently or not at all. The table below is a summary of the inputs used to value the Fund’s investments as of December 31, 2010.
| Investments at Value | Total | Level 1 | Level 2 | Level 3 | ||||||||||||
| Total Common Stock* | $ | 11,946,827 | $ | 11,946,827 | $ | — | $ | — | ||||||||
| Total Real Estate | ||||||||||||||||
| Investment Trusts* | 488,542 | 488,542 | — | — | ||||||||||||
| Total Closed-Ended | ||||||||||||||||
| Mutual Funds | 45,946 | 45,946 | — | — | ||||||||||||
| Total Money Market Funds | 95,797 | 95,797 | — | — | ||||||||||||
| Total Investments | $ | 12,577,112 | $ | 12,577,112 | $ | — | $ | — | ||||||||
| * | For further information regarding security characteristics, please see the Schedule of Investments. |
The Fund did not hold any Level 3 securities during the period ended December 31, 2010. There were no transfers of securities between levels during the period ended December 31, 2010.
Distribution to Shareholders
The Fund intends to distribute to its shareholders any net investment income and any net realized long or short-term capital gains, if any, at least annually. Distributions are recorded on ex-dividend date. The Fund may periodically make reclassifications among certain of its capital accounts as a result of the characterization of certain income and realized gains determined annually in accordance with federal tax regulations that may differ from generally accepted accounting principles.
Foreign Currency Transactions
The books and records are maintained in U.S. dollars. Foreign currency denominated transactions (i.e. market value of investment securities, assets and liabilities, purchases and sales of investment securities and income and expenses) are translated into U.S. dollars at the current rate of exchange. The Fund does not isolate that portion of the results of operations resulting from changes in foreign exchange rates on investments from the fluctuations arising from changes in market prices of securities held. Such fluctuations are included with the net realized and unrealized gain or loss from investments.
26
EntrepreneurShares Global Fund
NOTES TO FINANCIAL STATEMENTS (continued)
December 31, 2010 (Unaudited)
Other
Investment transactions are recorded on the trade date. Dividend income, less any foreign tax withheld is recognized on ex-dividend date and interest income is recognized on an accrual basis, including amortization/accretion of premiums or discounts.
Net investment income, other than class specific expenses, and realized and unrealized gains and losses are allocated daily to each class of shares based upon the relative net asset value of outstanding shares of each class of shares at the beginning of the day.
3.AGREEMENTS
Investment Advisory Agreement
Weston Capital Advisors, LLC (the “Advisor”) oversees the performance of the Fund and is responsible for overseeing the management of the investment portfolio of the Fund. These services are provided under the terms of an Investment Advisory Agreement dated October 14, 2010 (the “Investment Advisory Agreement”) between the Trust and the Advisor, pursuant to which the Advisor receives an annual advisory fee equal to 1.25% of the Fund’s average net assets.
Through October 31, 2011, the Advisor agrees to waive and/or reimburse the Fund for its management fee and, to the extent necessary, bear other expenses, to limit the total annualized expenses (excluding borrowing and investment-related costs and fees, taxes, extraordinary expenses and fees and expenses of underlying funds) of Class A shares, Retail Class shares and Institutional Class shares of the Fund to the amounts of 1.95%, 1.95% and 1.70% per annum, respectively, of net assets attributable to such shares of the Fund. The Advisor shall be permitted to recover expenses it has borne subsequent to the effective date of this agreement (whether through reduction of its management fee or otherwise) in later periods to the extent that the Fund’s expenses fall below the annual rates set forth above, provided, however, that the Fund is not obligated to pay any such reimbursed fees more than three years after the end of the fiscal year in which the expense was borne by the Advisor. The Advisor has waived $10,581, all of which expires on June 30, 2014.
27
EntrepreneurShares Global Fund
NOTES TO FINANCIAL STATEMENTS (continued)
December 31, 2010 (Unaudited)
4.DISTRIBUTION PLAN
The Trust has adopted distribution and service (Rule 12b-1) plans for the Fund’s Class A and Retail Class shares in accordance with Rule 12b-1 under the Investment Company Act of 1940, as amended. Each Plan allows the Fund to use up to 0.25% of the average daily net assets attributable to the relevant class of Fund shares, to pay sales, distribution, and other fees for the sale of that share class and for services provided to holders of that class of shares. Because these fees are paid out of the Fund’s assets, over time, these fees will increase the cost of your investment in Class A or Retail Class shares and may cost you more than paying other types of sales charges. The Fund’s Institutional Class shares are not subject to any distribution and service (Rule 12b-1) fees.
5.ORGANIZATION AND OFFERING COSTS
Organization costs consist of costs incurred to establish the Trust and enable it legally to do business. These expenses were advanced by the Advisor, subject to potential recovery (see Note 3). Offering costs include legal fees regarding the preparation of the initial registration statement. These costs were paid by the Fund. The total amount of the organization costs and offering costs incurred by the Trust and Fund is estimated at approximately $23,669 and $166, respectively
6.CAPITAL
The Trust has authorized capital of unlimited shares of no par value which may be issued in more than one class or series. Currently the Trust consists of one series, the Fund.
Transactions in shares of the Fund were as follows:
| Period Ended | ||||
| December 31, 2010 | ||||
| (Unaudited) | ||||
| Retail Class | ||||
| Shares sold | 2,873 | |||
| Shares issued to holders in reinvestment of dividends | 4 | |||
| Shares redeemed | — | |||
| Net increase | 2,877 | |||
| Shares outstanding: | ||||
| Beginning of period | — | |||
| End of period | 2,877 | |||
28
EntrepreneurShares Global Fund
NOTES TO FINANCIAL STATEMENTS (continued)
December 31, 2010 (Unaudited)
| Period Ended | ||||
| December 31, 2010 | ||||
| (Unaudited) | ||||
| Institutional Class | ||||
| Shares sold | 1,325,478 | |||
| Shares issued to holders in reinvestment of dividends | 1,634 | |||
| Shares redeemed | — | |||
| Net increase | 1,327,112 | |||
| Shares outstanding: | ||||
| Beginning of period | — | |||
| End of period | 1,327,112 | |||
| Class A | ||||
| Shares sold | 100 | |||
| Shares issued to holders in reinvestment of dividends | — | |||
| Shares redeemed | — | |||
| Net increase | 100 | |||
| Shares outstanding: | ||||
| Beginning of period | — | |||
| End of period | 100 | |||
7.RELATED PARTIES
At December 31, 2010, certain officers of the Trust were also employees of the Advisor.
8.SUBSEQUENT EVENTS EVALUATION
In preparing the statement of assets and liabilities, the Fund has evaluated events and transactions for potential recognition or disclosure through the date the financial statements were available to be issued. This evaluation did not result in any subsequent events that necessitated disclosure and/or adjustments.
9.OFFERING PRICE PER SHARE
The public offering price for Class A share is the net asset value plus a sales charge, which varies in accordance with the amount of the purchase up to a maximum of 4.75%. The public offering price for the Retail and Institutional Classes are the net asset value.
The Distributor retains the entire sales charge when it makes sales directly to the public. Otherwise, when sales are made through dealers, the Distributor receives a
29
EntrepreneurShares Global Fund
NOTES TO FINANCIAL STATEMENTS (continued)
December 31, 2010 (Unaudited)
portion of the related sales charge. For the period from November 11, 2010 to December 31, 2010, the Distributor received no sales charges on behalf of EntrepreneurShares Global Fund Class A. Sales charges are not an expense of the Fund and are not reflected in the financial statements of the Fund.
10.INVESTMENT TRANSACTIONS
During the period ended December 31, 2010, the aggregate purchase and sales of securities (excluding short-term) were:
| Purchases: | $12,139,012 |
| Sales: | $ 144,464 |
30
EntrepreneurShares Global Fund
ADDITIONAL INFORMATION
(Unaudited)
1.INVESTMENT ADVISORY AGREEMENT DISCLOSURE
On October 14, 2010, the Board of Trustees of EntrepreneurShares Series Trust approved the investment advisory agreement between the EntrepreneurShares Global Fund (the “Fund”) and Weston Capital Advisors, LLC (the “Advisor”). The Board also approved a sub-advisory agreement between the Advisor and EntrepreneurShares, LLC (the “Sub-Advisor”) under which the Advisor agreed to delegate portfolio management decisions, including purchasing and selling portfolio securities, to the Sub-Advisor. Under the sub-advisory agreement, the Advisor agreed to compensate the Sub-Advisor for its services from it own assets, not those of the Fund.
Prior to approving the agreements, the Board considered:
| • | The nature, extent and quality of the services to be provided by the Advisor and Sub-Advisor |
| • | The investment history performance of different investment vehicles managed by the Advisor and/or Sub-Advisor |
| • | The cost of the services to be provided and profits to be realized by Weston Capital Advisors from its relationship with the Fund |
| • | The extent to which economies of scale would be realized as the Fund grows and whether fee levels reflect any such economies of scale |
| • | The projected expense ratio of the Fund |
In considering the nature, extent and quality of the services to be provided by Weston Capital Advisors, LLC and EntrepreneurShares, LLC, the Board considered the Advisor’s and Sub-Advisor’s expected quality of investment management to be provided to the Fund, the Advisor’s and Sub-Advisor’s management history and the Advisor’s and Sub-Advisor’s ability to attract investors for the Fund. The Board concluded that the nature, extent and quality of the services to be provided by the Advisor and Sub-Advisor would be satisfactory.
The Board reviewed the investment performance of the other financial vehicles managed by the Advisor and/or Sub-Advisor and discussed that the Fund would be managed with a similar strategy. After further discussion, the Board concluded that the performance history of the Advisor and Sub-Advisor was satisfactory.
The Board considered the cost of services provided and the profits to be realized by the Advisor and Sub-Advisor, by reviewing reports provided by the Fund’s administrator that compared the Fund’s investment advisory fee to those of other comparable mutual funds. The Board concluded that the investment advisory fees were fair and within the range of the industry averages.
31
EntrepreneurShares Global Fund
ADDITIONAL INFORMATION (continued)
(Unaudited)
The Board considered the extent to which economies of scale would be realized as the Fund grows, including a consideration of breakpoints in the Agreement fee schedules. The Board concluded that given the expected growth of assets of the Funds in the next year, the Advisor and Sub-Advisor were unlikely to realize economies of scale and the proposed fee schedules were acceptable.
The Board reviewed reports from the Fund’s administrator that compared the Fund’s total expense ratio to those of other comparable mutual funds. The Board concluded that the total expenses of the Fund was reasonable and within the range of the industry averages.
| 2. | AVAILABILITY OF QUARTERLY PORTFOLIO HOLDINGS SCHEDULES |
The Fund is required to file their complete schedule of portfolio holdings with the SEC for the first and third quarters of each fiscal year on Form N-Q. Once filed, the Fund’s Form N-Q is available without charge, upon request on the SEC’s website (http://www.sec.gov) and may be available by calling 1.877.271.8811. You may also obtain copies at the SEC’s Public Reference Room in Washington, D.C. Information on the operation of the Public Reference Room may be obtained by calling 1.800.SEC.0330.
As of the date of this report, the Fund has not yet been required to file a Form N-Q.
| 3. | PROXY VOTING POLICIES AND PROCEDURES AND PROXY VOTING RECORD |
A description of the policies and procedures that the Fund uses to determine howto vote proxies relating to portfolio securities is available without charge, upon request, by calling 1.877.271.8811 and on the SEC’s website (http://www.sec.gov). The Fund is required to file how they voted proxies related to portfolio securities during the most recent 12-month period ended June 30. Once filed, the information is available without charge, upon request, by calling 1.877.271.8811 and on the SEC’s website (http://www.sec.gov).
As of the date of this report, the Fund has not yet been required to file how it voted its proxies related to portfolio securities.
32
(This Page Intentionally Left Blank.)
Investment Advisor
Weston Capital Advisors, LLC
40 Grove Street, Suite 200
Wellesly Square, MA 02482
Investment Sub-Advisor
EntrepreneurShares, LLC
40 Grove Street, Suite 200
Wellesly Square, MA 02482
Independent Public Accounting Firm
Ernst & Young LLP
220 South Sixth Street Suite 1400
Minneapolis, MN 55402
Legal Counsel
K& L Gates LLP
One Lincoln Street
Boston, MA 02111
Custodian
U.S. Bank, N.A.
1555 N. RiverCenter Drive, Suite 302
Milwaukee, WI 53212
Distributor
Rafferty Capital Markets, LLC
59 Hilton Ave.
Garden City, NY 11530
Administrator, Transfer Agent
And Dividend Disbursing Agent
U.S. Bancorp Fund Services, LLC
615 East Michigan Street
Milwaukee, WI 53202
Item 2. Code of Ethics.
Not applicable for semi-annual reports.
Item 3. Audit Committee Financial Expert.
Not applicable for semi-annual reports.
Item 4. Principal Accountant Fees and Services.
Not applicable for semi-annual reports.
Item 5. Audit Committee of Listed Registrants.
Not applicable to registrants who are not listed issuers (as defined in Rule 10A-3 under the Securities Exchange Act of 1934).
Item 6. Schedule of Investments.
Schedule of Investments is included as part of the report to shareholders filed under Item 1 of this Form.
Item 7. Disclosure of Proxy Voting Policies and Procedures for Closed-End Management Investment Companies.
Not applicable to open-end investment companies.
Item 8. Portfolio Managers of Closed-End Management Investment Companies.
Not applicable to open-end investment companies.
Item 9. Purchases of Equity Securities by Closed-End Management Investment Company and Affiliated Purchasers.
Not applicable to open-end investment companies.
Item 10. Submission of Matters to a Vote of Security Holders.
There have been no material changes to the procedures by which shareholders may recommend nominees to the registrant’s board of directors.
Item 11. Controls and Procedures.
| (a) | The Registrant’s President/Chief Executive Officer and Treasurer/Chief Financial Officer have reviewed the Registrant's disclosure controls and procedures (as defined in Rule 30a-3(c) under the Investment Company Act of 1940 (the “Act”)) as of a date within 90 days of the filing of this report, as required by Rule 30a-3(b) under the Act and Rules 13a-15(b) or 15d-15(b) under the Securities Exchange Act of 1934. Based on their review, such officers have concluded that the disclosure controls and procedures are effective in ensuring that information required to be disclosed in this report is appropriately recorded, processed, summarized and reported and made known to them by others within the Registrant and by the Registrant’s service provider. |
| (b) | There were no changes in the Registrant's internal control over financial reporting (as defined in Rule 30a-3(d) under the Act) that occurred during the Registrant’s last fiscal half-year that has materially affected, or is reasonably likely to materially affect, the Registrant's internal control over financial reporting. |
Item 12. Exhibits.
| (a) | (1) Any code of ethics or amendment thereto, that is subject of the disclosure required by Item 2, to the extent that the registrant intends to satisfy Item 2 requirements through filing an exhibit. Not Applicable. |
(2) Certifications pursuant to Section 302 of the Sarbanes-Oxley Act of 2002. Filed herewith.
(3) Any written solicitation to purchase securities under Rule 23c-1 under the Act sent or given during the period covered by the report by or on behalf of the registrant to 10 or more persons. Not applicable to open-end investment companies.
| (b) | Certification pursuant to Section 906 of the Sarbanes-Oxley Act of 2002. Furnished herewith. |
SIGNATURES
Pursuant to the requirements of the Securities Exchange Act of 1934 and the Investment Company Act of 1940, the registrant has duly caused this report to be signed on its behalf by the undersigned, thereunto duly authorized.
(Registrant) EntrepreneurShares Series Trust
By (Signature and Title)* /s/ Joel Shulman
Joel Shulman, President
Date March 3, 2011
Pursuant to the requirements of the Securities Exchange Act of 1934 and the Investment Company Act of 1940, this report has been signed below by the following persons on behalf of the registrant and in the capacities and on the dates indicated.
By (Signature and Title)* /s/ Joel Shulman
Joel Shulman, President
Date March 3, 2011
By (Signature and Title)* /s/ David Cragg
David Cragg, Treasurer
Date March 3, 2011
* Print the name and title of each signing officer under his or her signature.