Semi-Annual Report
December 31, 2017
EntrepreneurShares Global Fund
Entrepreneur U.S. Small Cap Fund
Entrepreneur U.S. Large Cap Fund
Each a series of EntrepreneurShares Series Trust
c/o UMB Fund Services, Inc.
235 W. Galena Street
Milwaukee, Wisconsin 53212
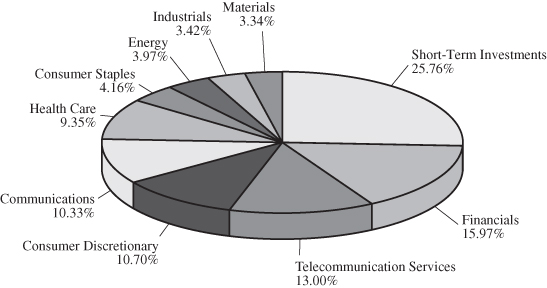
EntrepreneurShares Global Fund
SECTOR ALLOCATION(1)
December 31, 2017 (Unaudited)
As a Percentage of Total Investments
TOP TEN HOLDINGS(1)(2)
as of December 31, 2017 (Unaudited)
Issuer | % of Net Assets | |
| Berkshire Hathaway, Inc. – Class B | 1.76% | |
| Amazon.com, Inc. | 1.56% | |
| Facebook, Inc. | 1.46% | |
| SoftBank Group Corp. | 1.45% | |
| salesforce.com, Inc. | 1.44% | |
| FedEx Corp. | 1.44% | |
| BlackRock, Inc. | 1.43% | |
| Walgreens Boots Alliance, Inc. | 1.43% | |
| Intercontinental Exchange, Inc. | 1.41% | |
| Sino Biopharmaceutical Ltd. | 1.41% | |
(1) | Fund holdings and sector allocations are subject to change at any time and are not recommendations to buy or sell any security. |
(2) | Short-term investments are not included. |
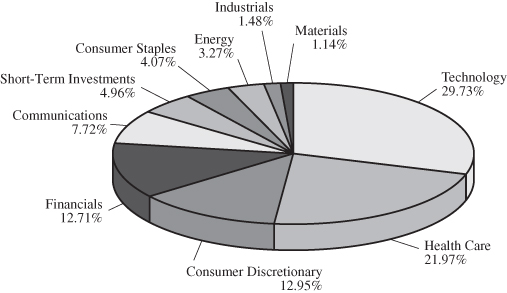
Entrepreneur U.S. Small Cap Fund
SECTOR ALLOCATION(1)
December 31, 2017 (Unaudited)
As a Percentage of Total Investments
TOP TEN HOLDINGS(1)(2)
as of December 31, 2017 (Unaudited)
Issuer | % of Net Assets | |
| EPAM Systems, Inc. | 1.58% | |
| LGI Homes, Inc. | 1.53% | |
| LendingTree, Inc. | 1.51% | |
| Globus Medical, Inc. | 1.45% | |
| Insperity, Inc. | 1.45% | |
| Matador Resources Co. | 1.40% | |
| HubSpot, Inc. | 1.39% | |
| Green Dot Corp. | 1.37% | |
| Monolithic Power Systems, Inc. | 1.36% | |
| World Wrestling Entertainment, Inc. | 1.32% | |
(1) | Fund holdings and sector allocations are subject to change at any time and are not recommendations to buy or sell any security. |
(2) | Short-term investments are not included. |
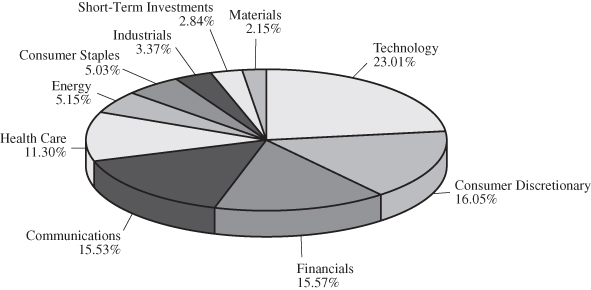
Entrepreneur U.S. Large Cap Fund
SECTOR ALLOCATION(1)
December 31, 2017 (Unaudited)
As a Percentage of Total Investments
TOP TEN HOLDINGS(1)(2)
as of December 31, 2017 (Unaudited)
Issuer | % of Net Assets | |
| Amazon.com, Inc. | 5.42% | |
| Alphabet, Inc. – Class A | 5.19% | |
| Facebook, Inc. – Class A | 4.81% | |
| Apple, Inc. | 2.97% | |
| NVIDIA Corp. | 2.75% | |
| Continental Resources, Inc. | 2.71% | |
| UnitedHealth Group, Inc. | 2.49% | |
| FedEx Corp. | 2.43% | |
| salesforce.com, Inc. | 2.39% | |
| Netflix, Inc. | 2.33% | |
(1) | Fund holdings and sector allocations are subject to change at any time and are not recommendations to buy or sell any security. |
(2) | Short-term investments are not included. |
EntrepreneurShares Series Trust
EXPENSE EXAMPLE
December 31, 2017 (Unaudited)
As a shareholder of the EntrepreneurShares Global Fund, the Entrepreneur U.S. Small Cap Fund, or the Entrepreneur U.S. Large Cap Fund (the “Funds”), you incur two types of costs: (1) transaction costs, including redemption fees on shares held less than 5 business days and exchange fees; and (2) ongoing costs, including management fees, distribution (12b-1) fees and other specific expenses for the Funds. This example is intended to help you understand your ongoing costs (in dollars) of investing in the Fund and to compare these costs with the ongoing costs of investing in other mutual funds. The example is based on an investment of $1,000 invested at the beginning of the period and held for the most recent six-month period.
The Actual Expense comparison provides information about actual account values and actual expenses. A shareholder may use the information in this line, together with the amount invested, to estimate the expenses paid over the period. A shareholder may divide his/her account value by $1,000 (for example, an $8,600 account value divided by $1,000 = 8.6), then multiply the result by the number in the first line under the heading entitled “Expenses Paid During Period” to estimate the expenses paid on his/her account during the period.
The Hypothetical Example for Comparison Purposes provides information about hypothetical account values and hypothetical expenses based on the Funds’ actual expense ratios and an assumed rate of return of 5% per year before expenses, which is not the Funds’ actual return. The hypothetical account values and expenses may not be used to estimate the actual ending account balance or expenses paid for the period. A shareholder may use this information to compare the ongoing costs of investing in the Funds and other funds. To do so, a shareholder would compare this 5% hypothetical example with the 5% hypothetical examples that appear in the shareholder reports of other funds. The expenses shown in the table are meant to highlight ongoing costs only and do not reflect any transactional costs, such as redemptions fees or exchange fees. Therefore, the Hypothetical Example for Comparison Purposes is useful in comparing ongoing costs only, and will not help determine the relevant total cost of owning different funds. In addition, if these transactional costs were included, shareholder costs would be higher.
EntrepreneurShares Global Fund
| | | | Expenses Paid |
| | Beginning | Ending | During Period(1) |
| | Account Value | Account Value | July 1, 2017 – |
| | July 1, 2017 | December 31, 2017 | December 31, 2017 |
Institutional Class – Actual(2) | $1,000.00 | $1,132.60 | $9.14 |
| Institutional Class – Hypothetical | | | |
| (5% return before expenses) | $1,000.00 | $1,016.63 | $8.65 |
(1) | Expenses are equal to the Fund’s annualized expense ratio of 1.70%, multiplied by the average account value over the period, multiplied by 184/365 (to reflect the one-half year period). |
(2) | Based on actual returns for the six-month period ended December 31, 2017 of 13.26%. |
Entrepreneur U.S. Small Cap Fund
| | | | Expenses Paid |
| | Beginning | Ending | During Period(1) |
| | Account Value | Account Value | July 1, 2017 – |
| | July 1, 2017 | December 31, 2017 | December 31, 2017 |
Institutional Class – Actual(2) | $1,000.00 | $1,097.00 | $4.48 |
| Institutional Class – Hypothetical | | | |
| (5% return before expenses) | $1,000.00 | $1,020.93 | $4.32 |
(1) | Expenses are equal to the Fund’s annualized expense ratio of 0.85%, multiplied by the average account value over the period, multiplied by 184/365 (to reflect the one-half year period). |
(2) | Based on actual returns for the six-month period ended December 31, 2017 of 9.70%. |
EntrepreneurShares Series Trust
EXPENSE EXAMPLE (Continued)
December 31, 2017 (Unaudited)
Entrepreneur U.S. Large Cap Fund
| | | | Expenses Paid |
| | Beginning | Ending | During Period(1) |
| | Account Value | Account Value | July 1, 2017 – |
| | July 1, 2017 | December 31, 2017 | December 31, 2017 |
Institutional Class – Actual(2) | $1,000.00 | $1,137.50 | $4.03 |
| Institutional Class – Hypothetical | | | |
| (5% return before expenses) | $1,000.00 | $1,021.43 | $3.81 |
(1) | Expenses are equal to the Fund’s annualized expense ratio of 0.75%, multiplied by the average account value over the period, multiplied by 184/365 (to reflect the one-half year period). |
(2) | Based on actual returns for the six-month period ended December 31, 2017 of 13.75%. |
EntrepreneurShares Global Fund
SCHEDULE OF INVESTMENTS
December 31, 2017 (Unaudited)
| Shares | | | | Fair Value | |
| | | | | | |
| | | COMMON STOCKS – 95.1% | | | |
| | | | | | |
| | | Apparel & Textile Products – 1.7% | | | |
| | 31,580 | | Gildan Activewear, Inc.1 | | $ | 1,020,258 | |
| | | | | | | | |
| | | | Asset Management – 3.6% | | | | |
| | 2,143 | | BlackRock, Inc. | | | 1,100,881 | |
| | 1,551 | | Partners Group Holding A.G.1 | | | 1,063,179 | |
| | | | | | | 2,164,060 | |
| | | | | | | | |
| | | | Biotechnology & Pharmaceutical – 10.3% | | | | |
| | 10,799 | | Galapagos N.V.*1 | | | 1,023,404 | |
| | 6,107 | | Genmab A/S*1 | | | 1,012,797 | |
| | 7,579 | | Jazz Pharmaceuticals PLC* | | | 1,020,513 | |
| | 2,730 | | Regeneron Pharmaceuticals, Inc.* | | | 1,026,371 | |
| | 608,452 | | Sino Biopharmaceutical Ltd.1 | | | 1,079,387 | |
| | 6,735 | | United Therapeutics Corp.* | | | 996,443 | |
| | | | | | | 6,158,915 | |
| | | | | | | | |
| | | | Chemicals – 1.8% | | | | |
| | 1,611,395 | | Fufeng Group Ltd.1 | | | 1,051,865 | |
| | | | | | | | |
| | | | Commercial Services – 4.3% | | | | |
| | 6,694 | | Cintas Corp. | | | 1,043,126 | |
| | 90,129 | | Clipper Logistics PLC1 | | | 535,396 | |
| | 51,700 | | JAC Recruitment Co., Ltd.1 | | | 1,002,569 | |
| | | | | | | 2,581,091 | |
| | | | | | | | |
| | | | Consumer Products – 1.7% | | | | |
| | 33,993 | | Fevertree Drinks PLC1 | | | 1,044,985 | |
| | | | | | | | |
| | | | Containers & Packaging – 0.9% | | | | |
| | 319,472 | | Nine Dragons Paper Holdings Ltd.1 | | | 511,947 | |
| | | | | | | | |
| | | | Electrical Equipment – 2.5% | | | | |
| | 16,641 | | Cognex Corp. | | | 1,017,764 | |
| | 7,191 | | Renishaw PLC1 | | | 507,263 | |
| | | | | | | 1,525,027 | |
| | | | | | | | |
| | | | Gaming, Lodging & Restaurants – 1.7% | | | | |
| | 6,128 | | Wynn Resorts Ltd. | | | 1,033,119 | |
| | | | | | | | |
| | | | Health Care Facilities & Services – 1.7% | | | | |
| | 8,984 | | Universal Health Services, Inc. – Class B | | | 1,018,336 | |
| | | | | | | | |
| | | | Institutional Financial Services – 3.5% | | | | |
| | 15,335 | | Intercontinental Exchange, Inc. | | | 1,082,038 | |
| | 14,389 | | SEI Investments Co. | | | 1,033,993 | |
| | | | | | | 2,116,031 | |
| | | | | | | | |
| | | | Insurance – 3.9% | | | | |
| | 19,528 | | Athene Holding Ltd. – Class A* | | | 1,009,793 | |
| | 6,837 | | Berkshire Hathaway, Inc. – Class B* | | | 1,355,230 | |
| | | | | | | 2,365,023 | |
The accompanying notes are an integral part of these financial statements.
EntrepreneurShares Global Fund
SCHEDULE OF INVESTMENTS (Continued)
December 31, 2017 (Unaudited)
| Shares | | | | Fair Value | |
| | | | | | |
| | | Iron & Steel – 1.7% | | | |
| | 23,135 | | Steel Dynamics, Inc. | | $ | 997,812 | |
| | | | | | | | |
| | | | Leisure Products – 1.6% | | | | |
| | 22,072 | | Spin Master Corp.*1,2 | | | 948,552 | |
| | | | | | | | |
| | | | Media – 9.6% | | | | |
| | 911 | | Alphabet, Inc. – Class A* | | | 959,647 | |
| | 6,371 | | Facebook, Inc. – Class A* | | | 1,124,227 | |
| | 58,073 | | GMO internet, Inc.1 | | | 988,027 | |
| | 3,321 | | Netflix, Inc.* | | | 637,499 | |
| | 68,940 | | SEEK Ltd.1 | | | 1,022,588 | |
| | 9,088 | | VeriSign, Inc.* | | | 1,040,031 | |
| | | | | | | 5,772,019 | |
| | | | | | | | |
| | | | Oil, Gas & Coal – 5.1% | | | | |
| | 19,098 | | Continental Resources, Inc.* | | | 1,011,621 | |
| | 58,666 | | Kinder Morgan, Inc. | | | 1,060,094 | |
| | 33,188 | | Parsley Energy, Inc. – Class A* | | | 977,055 | |
| | | | | | | 3,048,770 | |
| | | | | | | | |
| | | | Real Estate – 5.1% | | | | |
| | 15,342 | | Colliers International Group, Inc.1 | | | 926,012 | |
| | 77,350 | | Hemfosa Fastigheter A.B.1 | | | 1,036,287 | |
| | 16,660 | | Prologis, Inc. – REIT | | | 1,074,737 | |
| | | | | | | 3,037,036 | |
| | | | | | | | |
| | | | Retail – Consumer Staples – 3.6% | | | | |
| | 20,187 | | Alimentation Couche-Tard, Inc. – Class B1 | | | 1,053,354 | |
| | 15,073 | | Walgreens Boots Alliance, Inc. | | | 1,094,601 | |
| | | | | | | 2,147,955 | |
| | | | | | | | |
| | | | Retail – Discretionary – 4.4% | | | | |
| | 1,023 | | Amazon.com, Inc.* | | | 1,196,368 | |
| | 112,116 | | Rakuten, Inc.1 | | | 1,027,377 | |
| | 11,165 | | Ted Baker PLC1 | | | 408,645 | |
| | | | | | | 2,632,390 | |
| | | | | | | | |
| | | | Semiconductors – 2.9% | | | | |
| | 11,842 | | Microchip Technology, Inc. | | | 1,040,675 | |
| | 3,447 | | NVIDIA Corp. | | | 666,994 | |
| | | | | | | 1,707,669 | |
| | | | | | | | |
| | | | Software – 10.4% | | | | |
| | 15,392 | | Cerner Corp.* | | | 1,037,267 | |
| | 10,063 | | Check Point Software Technologies Ltd.*1 | | | 1,042,728 | |
| | 1,705 | | Constellation Software, Inc.1 | | | 1,033,607 | |
| | 2,795 | | NetEase, Inc. – ADR1 | | | 964,471 | |
| | 10,837 | | salesforce.com, Inc.* | | | 1,107,866 | |
| | 12,219 | | Synopsys, Inc.* | | | 1,041,548 | |
| | | | | | | 6,227,487 | |
The accompanying notes are an integral part of these financial statements.
EntrepreneurShares Global Fund
SCHEDULE OF INVESTMENTS (Continued)
December 31, 2017 (Unaudited)
| Shares | | | | Fair Value | |
| | | | | | |
| | | Specialty Finance – 4.3% | | | |
| | 82,339 | | Financial Products Group Co., Ltd.1 | | $ | 1,000,418 | |
| | 5,423 | | FleetCor Technologies, Inc.* | | | 1,043,548 | |
| | 43,923 | | Plus500 Ltd.1 | | | 538,734 | |
| | | | | | | 2,582,700 | |
| | | | | | | | |
| | | | Technology Services – 3.4% | | | | |
| | 81,828 | | Qudian, Inc. – ADR*1 | | | 1,026,123 | |
| | 7,144 | | Teleperformance1 | | | 1,023,939 | |
| | | | | | | 2,050,062 | |
| | | | | | | | |
| | | | Telecommunication Services – 1.7% | | | | |
| | 40,663 | | Vision, Inc.*1 | | | 1,045,852 | |
| | | | | | | | |
| | | | Telecommunications – 1.9% | | | | |
| | 14,080 | | SoftBank Group Corp.1 | | | 1,114,654 | |
| | | | | | | | |
| | | | Transportation & Logistics – 1.8% | | | | |
| | 4,427 | | FedEx Corp. | | | 1,104,714 | |
| | | | TOTAL COMMON STOCKS (Cost $51,310,304) | | | 57,008,329 | |
| | | | | | | | |
| | | | | | | | |
| | | | SHORT-TERM INVESTMENTS – 33.0% | | | | |
| | 19,782,637 | | Fidelity Investments Treasury Only Portfolio – Institutional Class, 1.084%3 | | | 19,782,637 | |
| | | | TOTAL SHORT-TERM INVESTMENTS (Cost $19,782,637) | | | 19,782,637 | |
| | | | | | | | |
| | | | Total Investments (Cost $71,092,941) – 128.1% | | | 76,790,966 | |
| | | | Liabilities in Excess of Other Assets – (28.1)% | | | (16,859,605 | ) |
| | | | TOTAL NET ASSETS – 100.0% | | $ | 59,931,361 | |
Percentages are stated as a percent of net assets.
ADR – American Depositary Receipt
PLC – Public Limited Company
REIT – Real Estate Investment Trust
| * | Non-income producing security |
1 | Global Security, as classified by the Fund’s Investment Advisor, in accordance to the definition in the Fund’s prospectus. |
2 | Security exempt from registration under Rule 144A of the Securities Act of 1933. These securities are restricted and may be resold in transactions exempt from registration normally to qualified institutional buyers. The absolute value of these securities is $948,552 which represents 1.6% of Net Assets. |
3 | The rate is the annualized seven-day yield at period end. |
The accompanying notes are an integral part of these financial statements.
EntrepreneurShares Global Fund
SCHEDULE OF INVESTMENTS (Continued)
December 31, 2017 (Unaudited)
| | | Percent of Net |
| Country of Risk | | Assets |
| United States | | | 84.7 | % |
| Japan | | | 10.3 | % |
| Canada | | | 8.3 | % |
| China | | | 5.1 | % |
| United Kingdom | | | 4.2 | % |
| Hong Kong | | | 2.6 | % |
| Israel | | | 2.6 | % |
| Switzerland | | | 1.8 | % |
| Sweden | | | 1.7 | % |
| Australia | | | 1.7 | % |
| France | | | 1.7 | % |
| Belgium | | | 1.7 | % |
| Denmark | | | 1.7 | % |
| | | | 128.1 | % |
The accompanying notes are an integral part of these financial statements.
Entrepreneur U.S. Small Cap Fund
SCHEDULE OF INVESTMENTS
December 31, 2017 (Unaudited)
| Shares | | | | Fair Value | |
| | | | | | |
| | | COMMON STOCKS – 95.1% | | | |
| | | | | | |
| | | Apparel & Textile Products – 1.3% | | | |
| | 44,593 | | Skechers U.S.A., Inc. – Class A* | | $ | 1,687,399 | |
| | | | | | | | |
| | | | Asset Management – 1.2% | | | | |
| | 32,333 | | Cohen & Steers, Inc. | | | 1,529,028 | |
| | | | | | | | |
| | | | Banking – 3.9% | | | | |
| | 52,912 | | Live Oak Bancshares, Inc. | | | 1,261,951 | |
| | 18,526 | | Pinnacle Financial Partners, Inc. | | | 1,228,274 | |
| | 23,732 | | Preferred Bank | | | 1,394,967 | |
| | 56,037 | | TriState Capital Holdings, Inc.* | | | 1,288,851 | |
| | | | | | | 5,174,043 | |
| | | | | | | | |
| | | | Biotechnology & Pharmaceutical – 12.7% | | | | |
| | 47,126 | | Aclaris Therapeutics, Inc.* | | | 1,162,127 | |
| | 21,881 | | Clovis Oncology, Inc.* | | | 1,487,908 | |
| | 78,194 | | Corcept Therapeutics, Inc.* | | | 1,412,184 | |
| | 31,603 | | FibroGen, Inc.* | | | 1,497,982 | |
| | 93,341 | | Ironwood Pharmaceuticals, Inc. – Class A* | | | 1,399,182 | |
| | 27,602 | | Juno Therapeutics, Inc.* | | | 1,261,687 | |
| | 63,226 | | Omeros Corp.* | | | 1,228,481 | |
| | 14,909 | | Puma Biotechnology, Inc.* | | | 1,473,755 | |
| | 21,889 | | Seattle Genetics, Inc.* | | | 1,171,061 | |
| | 29,180 | | Supernus Pharmaceuticals, Inc.* | | | 1,162,823 | |
| | 9,841 | | TESARO, Inc.* | | | 815,524 | |
| | 200,707 | | TherapeuticsMD, Inc.* | | | 1,212,270 | |
| | 9,429 | | United Therapeutics Corp.* | | | 1,395,020 | |
| | | | | | | 16,680,005 | |
| | | | | | | | |
| | | | Commercial Services – 3.5% | | | | |
| | 85,382 | | Hackett Group, Inc. | | | 1,341,351 | |
| | 33,320 | | Insperity, Inc. | | | 1,910,902 | |
| | 36,065 | | National Research Corp. – Class A | | | 1,345,225 | |
| | | | | | | 4,597,478 | |
| | | | | | | | |
| | | | Consumer Products – 4.1% | | | | |
| | 29,828 | | Hain Celestial Group, Inc.* | | | 1,264,409 | |
| | 30,751 | | Inter Parfums, Inc. | | | 1,336,131 | |
| | 11,146 | | J&J Snack Foods Corp. | | | 1,692,297 | |
| | 11,002 | | National Beverage Corp. | | | 1,072,035 | |
| | | | | | | 5,364,872 | |
| | | | | | | | |
| | | | Consumer Services – 1.0% | | | | |
| | 49,422 | | Carriage Services, Inc. | | | 1,270,640 | |
| | | | | | | | |
| | | | Design, Manufacturing & Distribution – 0.8% | | | | |
| | 31,529 | | Sanmina Corp.* | | | 1,040,457 | |
The accompanying notes are an integral part of these financial statements.
Entrepreneur U.S. Small Cap Fund
SCHEDULE OF INVESTMENTS (Continued)
December 31, 2017 (Unaudited)
| Shares | | | | Fair Value | |
| | | | | | |
| | | Gaming, Lodging & Restaurants – 3.4% | | | |
| | 34,579 | | Cheesecake Factory, Inc. | | $ | 1,666,016 | |
| | 18,933 | | Papa John’s International, Inc. | | | 1,062,331 | |
| | 33,044 | | Texas Roadhouse, Inc. | | | 1,740,758 | |
| | | | | | | 4,469,105 | |
| | | | | | | | |
| | | | Hardware – 7.0% | | | | |
| | 180,290 | | A10 Networks, Inc.* | | | 1,391,839 | |
| | 27,027 | | Nutanix, Inc. – Class A* | | | 953,513 | |
| | 91,582 | | Pure Storage, Inc.* | | | 1,452,490 | |
| | 45,043 | | Super Micro Computer, Inc.* | | | 942,525 | |
| | 22,827 | | Ubiquiti Networks, Inc.* | | | 1,621,173 | |
| | 19,648 | | ViaSat, Inc.* | | | 1,470,653 | |
| | 65,131 | | Vicor Corp.* | | | 1,361,238 | |
| | | | | | | 9,193,431 | |
| | | | | | | | |
| | | | Health Care Facilities & Services – 4.6% | | | | |
| | 63,403 | | Diplomat Pharmacy, Inc.* | | | 1,272,498 | |
| | 59,383 | | Ensign Group, Inc. | | | 1,318,303 | |
| | 31,827 | | HealthEquity, Inc.* | | | 1,485,048 | |
| | 19,701 | | LHC Group, Inc.* | | | 1,206,686 | |
| | 91,993 | | Natera, Inc.* | | | 827,017 | |
| | | | | | | 6,109,552 | |
| | | | | | | | |
| | | | Home & Office Products – 3.8% | | | | |
| | 49,598 | | Century Communities, Inc.* | | | 1,542,498 | |
| | 26,876 | | LGI Homes, Inc.* | | | 2,016,506 | |
| | 29,459 | | Meritage Homes Corp.* | | | 1,508,301 | |
| | | | | | | 5,067,305 | |
| | | | | | | | |
| | | | Institutional Financial Services – 1.2% | | | | |
| | 32,249 | | Moelis & Co. – Class A | | | 1,564,076 | |
| | | | | | | | |
| | | | Insurance – 1.0% | | | | |
| | 30,884 | | Kinsale Capital Group, Inc. | | | 1,389,780 | |
| | | | | | | | |
| | | | Iron & Steel – 1.1% | | | | |
| | 34,980 | | Steel Dynamics, Inc. | | | 1,508,687 | |
| | | | | �� | | | |
| | | | Media – 5.3% | | | | |
| | 221,657 | | Entravision Communications Corp. – Class A | | | 1,584,848 | |
| | 51,858 | | HealthStream, Inc.* | | | 1,201,031 | |
| | 36,375 | | Shutterstock, Inc.* | | | 1,565,216 | |
| | 21,027 | | Trade Desk, Inc. – Class A* | | | 961,565 | |
| | 57,166 | | World Wrestling Entertainment, Inc. – Class A | | | 1,748,136 | |
| | | | | | | 7,060,796 | |
| | | | | | | | |
| | | | Medical Equipment & Devices – 4.7% | | | | |
| | 46,636 | | Globus Medical, Inc. – Class A* | | | 1,916,740 | |
| | 18,940 | | Masimo Corp.* | | | 1,606,112 | |
The accompanying notes are an integral part of these financial statements.
Entrepreneur U.S. Small Cap Fund
SCHEDULE OF INVESTMENTS (Continued)
December 31, 2017 (Unaudited)
| Shares | | | | Fair Value | |
| | 34,038 | | Merit Medical Systems, Inc.* | | $ | 1,470,442 | |
| | 49,897 | | NxStage Medical, Inc.* | | | 1,209,004 | |
| | | | | | | 6,202,298 | |
| | | | | | | | |
| | | | Oil, Gas & Coal – 2.2% | | | | |
| | 59,032 | | Matador Resources Co.* | | | 1,837,666 | |
| | 37,579 | | Parsley Energy, Inc. – Class A* | | | 1,106,326 | |
| | | | | | | 2,943,992 | |
| | | | | | | | |
| | | | Real Estate – 1.8% | | | | |
| | 47,184 | | GEO Group, Inc. – REIT | | | 1,113,542 | |
| | 87,150 | | Medical Properties Trust, Inc. – REIT | | | 1,200,927 | |
| | | | | | | 2,314,469 | |
| | | | | | | | |
| | | | Renewable Energy – 1.0% | | | | |
| | 159,376 | | Ameresco, Inc. – Class A* | | | 1,370,634 | |
| | | | | | | | |
| | | | Semiconductors – 3.9% | | | | |
| | 31,652 | | Impinj, Inc.* | | | 713,120 | |
| | 6,537 | | IPG Photonics Corp.* | | | 1,399,768 | |
| | 50,476 | | IXYS Corp.* | | | 1,208,900 | |
| | 15,982 | | Monolithic Power Systems, Inc. | | | 1,795,737 | |
| | | | | | | 5,117,525 | |
| | | | | | | | |
| | | | Software – 11.4% | | | | |
| | 39,394 | | Benefitfocus, Inc.* | | | 1,063,638 | |
| | 73,294 | | Box, Inc.* | | | 1,547,969 | |
| | 20,748 | | HubSpot, Inc.* | | | 1,834,123 | |
| | 27,079 | | New Relic, Inc.* | | | 1,564,354 | |
| | 27,421 | | Omnicell, Inc.* | | | 1,329,918 | |
| | 21,720 | | Paycom Software, Inc.* | | | 1,744,768 | |
| | 79,828 | | PDF Solutions, Inc.* | | | 1,253,300 | |
| | 25,166 | | Pegasystems, Inc. | | | 1,186,577 | |
| | 30,835 | | SS&C Technologies Holdings, Inc. | | | 1,248,201 | |
| | 46,249 | | Twilio, Inc. – Class A* | | | 1,091,476 | |
| | 20,301 | | Veeva Systems, Inc. – Class A* | | | 1,122,239 | |
| | | | | | | 14,986,563 | |
| | | | | | | | |
| | | | Specialty Finance – 3.6% | | | | |
| | 11,856 | | Euronet Worldwide, Inc.* | | | 999,105 | |
| | 29,951 | | Green Dot Corp. – Class A* | | | 1,804,847 | |
| | 5,859 | | LendingTree, Inc.* | | | 1,994,697 | |
| | | | | | | 4,798,649 | |
| | | | | | | | |
| | | | Technology Services – 6.7% | | | | |
| | 19,415 | | EPAM Systems, Inc.* | | | 2,085,754 | |
| | 24,589 | | ExlService Holdings, Inc.* | | | 1,483,946 | |
| | 29,881 | | Forrester Research, Inc. | | | 1,320,740 | |
| | 6,460 | | MarketAxess Holdings, Inc. | | | 1,303,305 | |
The accompanying notes are an integral part of these financial statements.
Entrepreneur U.S. Small Cap Fund
SCHEDULE OF INVESTMENTS (Continued)
December 31, 2017 (Unaudited)
| Shares | | | | Fair Value | |
| | 22,590 | | Medidata Solutions, Inc.* | | $ | 1,431,528 | |
| | 31,415 | | TeleTech Holdings, Inc. | | | 1,264,454 | |
| | | | | | | 8,889,727 | |
| | | | | | | | |
| | | | Telecommunications – 2.4% | | | | |
| | 31,422 | | Cogent Communications Holdings, Inc. | | | 1,423,417 | |
| | 35,131 | | RingCentral, Inc. – Class A* | | | 1,700,340 | |
| | | | | | | 3,123,757 | |
| | | | | | | | |
| | | | Waste & Environment Services Equipment & Facilities – 1.5% | | | | |
| | 21,046 | | Clean Harbors, Inc.* | | | 1,140,693 | |
| | 135,010 | | Hudson Technologies, Inc.* | | | 819,511 | |
| | | | | | | 1,960,204 | |
| | | | TOTAL COMMON STOCKS (Cost $90,378,180) | | | 125,414,471 | |
| | | | | | | | |
| | | | | | | | |
| | | | SHORT-TERM INVESTMENTS – 4.9% | | | | |
| | 6,544,282 | | Fidelity Investments Treasury Only Portfolio – Institutional Class, 1.084%1 | | | 6,544,282 | |
| | | | TOTAL SHORT-TERM INVESTMENTS (Cost $6,544,282) | | | 6,544,282 | |
| | | | | | | | |
| | | | Total Investments (Cost $96,922,462) – 100.0% | | | 131,958,753 | |
| | | | Liabilities in Excess of Other Assets – (0.0)% | | | (38,454 | ) |
| | | | TOTAL NET ASSETS – 100.0% | | $ | 131,920,299 | |
Percentages are stated as a percent of net assets.
REIT – Real Estate Investment Trust
| * | Non-income producing security |
1 | The rate is the annualized seven-day yield at period end. |
The accompanying notes are an integral part of these financial statements.
Entrepreneur U.S. Large Cap Fund
SCHEDULE OF INVESTMENTS
December 31, 2017 (Unaudited)
| Shares | | | | Fair Value | |
| | | | | | |
| | | COMMON STOCKS – 97.2% | | | |
| | | | | | |
| | | Aerospace & Defense – 1.0% | | | |
| | 4,452 | | Huntington Ingalls Industries, Inc. | | $ | 1,049,336 | |
| | | | | | | | |
| | | | Apparel & Textile Products – 1.3% | | | | |
| | 99,976 | | Under Armour, Inc. – Class A* | | | 1,442,654 | |
| | | | | | | | |
| | | | Asset Management – 2.0% | | | | |
| | 4,300 | | BlackRock, Inc. | | | 2,208,953 | |
| | | | | | | | |
| | | | Automotive – 1.0% | | | | |
| | 52,675 | | Gentex Corp. | | | 1,103,541 | |
| | | | | | | | |
| | | | Banking – 1.5% | | | | |
| | 19,345 | | First Republic Bank | | | 1,676,051 | |
| | | | | | | | |
| | | | Biotechnology & Pharmaceutical – 4.0% | | | | |
| | 5,654 | | Jazz Pharmaceuticals PLC* | | | 761,311 | |
| | 4,450 | | Regeneron Pharmaceuticals, Inc.* | | | 1,673,022 | |
| | 18,606 | | Seattle Genetics, Inc.* | | | 995,421 | |
| | 6,671 | | United Therapeutics Corp.* | | | 986,975 | |
| | | | | | | 4,416,729 | |
| | | | | | | | |
| | | | Commercial Services – 1.0% | | | | |
| | 7,032 | | Cintas Corp. | | | 1,095,797 | |
| | | | | | | | |
| | | | Consumer Products – 4.2% | | | | |
| | 18,973 | | Brown-Forman Corp. – Class B | | | 1,302,876 | |
| | 5,764 | | Constellation Brands, Inc. – Class A | | | 1,317,477 | |
| | 19,476 | | Hain Celestial Group, Inc.* | | | 825,588 | |
| | 19,491 | | Monster Beverage Corp.* | | | 1,233,585 | |
| | | | | | | 4,679,526 | |
| | | | | | | | |
| | | | Gaming, Lodging & Restaurants – 5.9% | | | | |
| | 5,405 | | Chipotle Mexican Grill, Inc.* | | | 1,562,207 | |
| | 35,180 | | Las Vegas Sands Corp. | | | 2,444,658 | |
| | 15,057 | | Wynn Resorts Ltd. | | | 2,538,460 | |
| | | | | | | 6,545,325 | |
| | | | | | | | |
| | | | Hardware – 4.3% | | | | |
| | 19,376 | | Apple, Inc. | | | 3,279,001 | |
| | 6,373 | | Arista Networks, Inc.* | | | 1,501,351 | |
| | | | | | | 4,780,352 | |
| | | | | | | | |
| | | | Health Care Facilities & Services – 5.1% | | | | |
| | 19,024 | | MEDNAX, Inc.* | | | 1,016,642 | |
| | 12,509 | | UnitedHealth Group, Inc. | | | 2,757,734 | |
| | 16,799 | | Universal Health Services, Inc. – Class B | | | 1,904,167 | |
| | | | | | | 5,678,543 | |
| | | | | | | | |
| | | | Institutional Financial Services – 4.1% | | | | |
| | 29,410 | | Intercontinental Exchange, Inc. | | | 2,075,170 | |
| | 33,443 | | SEI Investments Co. | | | 2,403,214 | |
| | | | | | | 4,478,384 | |
The accompanying notes are an integral part of these financial statements.
Entrepreneur U.S. Large Cap Fund
SCHEDULE OF INVESTMENTS (Continued)
December 31, 2017 (Unaudited)
| Shares | | | | Fair Value | |
| | | | | | |
| | | Iron & Steel – 2.2% | | | |
| | 55,054 | | Steel Dynamics, Inc. | | $ | 2,374,479 | |
| | | | | | | | |
| | | | Media – 13.6% | | | | |
| | 5,445 | | Alphabet, Inc. – Class A* | | | 5,735,763 | |
| | 29,711 | | DISH Network Corp. – Class A* | | | 1,418,701 | |
| | 30,133 | | Facebook, Inc. – Class A* | | | 5,317,269 | |
| | 13,421 | | Netflix, Inc.* | | | 2,576,295 | |
| | | | | | | 15,048,028 | |
| | | | | | | | |
| | | | Medical Equipment & Devices – 2.2% | | | | |
| | 3,654 | | Intuitive Surgical, Inc.* | | | 1,333,491 | |
| | 5,493 | | Waters Corp.* | | | 1,061,192 | |
| | | | | | | 2,394,683 | |
| | | | | | | | |
| | | | Oil, Gas & Coal – 5.2% | | | | |
| | 44,551 | | Antero Resources Corp.* | | | 846,469 | |
| | 56,539 | | Continental Resources, Inc.* | | | 2,994,871 | |
| | 41,471 | | Kinder Morgan, Inc. | | | 749,381 | |
| | 37,579 | | Parsley Energy, Inc. – Class A* | | | 1,106,326 | |
| | | | | | | 5,697,047 | |
| | | | | | | | |
| | | | Real Estate – 3.5% | | | | |
| | 15,087 | | Alexandria Real Estate Equities, Inc. – REIT | | | 1,970,212 | |
| | 29,630 | | Prologis, Inc. – REIT | | | 1,911,431 | |
| | | | | | | 3,881,643 | |
| | | | | | | | |
| | | | Retail – Consumer Staples – 0.8% | | | | |
| | 12,145 | | Walgreens Boots Alliance, Inc. | | | 881,970 | |
| | | | | | | | |
| | | | Retail – Discretionary – 6.8% | | | | |
| | 5,132 | | Amazon.com, Inc.* | | | 6,001,720 | |
| | 44,290 | | Urban Outfitters, Inc.* | | | 1,552,807 | |
| | | | | | | 7,554,527 | |
| | | | | | | | |
| | | | Semiconductors – 5.8% | | | | |
| | 5,491 | | IPG Photonics Corp.* | | | 1,175,788 | |
| | 24,455 | | Microchip Technology, Inc. | | | 2,149,105 | |
| | 15,683 | | NVIDIA Corp. | | | 3,034,661 | |
| | | | | | | 6,359,554 | |
| | | | | | | | |
| | | | Software – 12.0% | | | | |
| | 38,735 | | Akamai Technologies, Inc.* | | | 2,519,324 | |
| | 30,773 | | Cerner Corp.* | | | 2,073,792 | |
| | 24,448 | | Fortinet, Inc.* | | | 1,068,133 | |
| | 25,807 | | salesforce.com, Inc.* | | | 2,638,250 | |
| | 23,211 | | SS&C Technologies Holdings, Inc. | | | 939,581 | |
| | 24,140 | | Synopsys, Inc.* | | | 2,057,694 | |
| | 19,654 | | Workday, Inc. – Class A* | | | 1,999,598 | |
| | | | | | | 13,296,372 | |
The accompanying notes are an integral part of these financial statements.
Entrepreneur U.S. Large Cap Fund
SCHEDULE OF INVESTMENTS (Continued)
December 31, 2017 (Unaudited)
| Shares | | | | Fair Value | |
| | | | | | |
| | | Specialty Finance – 4.5% | | | |
| | 12,817 | | FleetCor Technologies, Inc.* | | $ | 2,466,375 | |
| | 72,006 | | Square, Inc. – Class A* | | | 2,496,448 | |
| | | | | | | 4,962,823 | |
| | | | | | | | |
| | | | Technology Services – 0.9% | | | | |
| | 3,361 | | CoStar Group, Inc.* | | | 998,049 | |
| | | | | | | | |
| | | | Telecommunications – 1.9% | | | | |
| | 57,444 | | Zayo Group Holdings, Inc.* | | | 2,113,939 | |
| | | | | | | | |
| | | | Transportation & Logistics – 2.4% | | | | |
| | 10,747 | | FedEx Corp. | | | 2,681,806 | |
| | | | TOTAL COMMON STOCKS (Cost $82,614,763) | | | 107,400,111 | |
| | | | | | | | |
| | | | | | | | |
| | | | SHORT-TERM INVESTMENTS – 2.8% | | | | |
| | 3,133,775 | | Fidelity Investments Treasury Only Portfolio – Institutional Class, 1.084%1 | | | 3,133,775 | |
| | | | TOTAL SHORT-TERM INVESTMENTS (Cost $3,133,775) | | | 3,133,775 | |
| | | | | | | | |
| | | | Total Investments (Cost $85,748,538) – 100.0% | | | 110,533,886 | |
| | | | Liabilities in Excess of Other Assets – (0.0)% | | | (52,845 | ) |
| | | | TOTAL NET ASSETS – 100.0% | | $ | 110,481,041 | |
Percentages are stated as a percent of net assets.
PLC – Public Limited Company
REIT – Real Estate Investment Trust
| * | Non-income producing security |
1 | The rate is the annualized seven-day yield at period end. |
The accompanying notes are an integral part of these financial statements.
EntrepreneurShares Series Trust
STATEMENTS OF ASSETS AND LIABILITIES
December 31, 2017 (Unaudited)
| | | EntrepreneurShares | | | Entrepreneur | | | Entrepreneur | |
| | | Global | | | U.S. Small | | | U.S. Large | |
| | | Fund | | | Cap Fund | | | Cap Fund | |
| ASSETS: | | | | | | | | | |
| Investments, at cost | | $ | 71,092,941 | | | $ | 96,922,462 | | | $ | 85,748,538 | |
| Investments, at value | | $ | 76,790,966 | | | $ | 131,958,753 | | | $ | 110,533,886 | |
| Receivables: | | | | | | | | | | | | |
| Dividends and interest | | | 60,293 | | | | 67,086 | | | | 44,546 | |
| Investment securities sold | | | 8,412,907 | | | | — | | | | — | |
| Due from custodian | | | 1,436,418 | | | | 4,401 | | | | 3,566 | |
| Prepaid expenses | | | 8,222 | | | | 13,244 | | | | 12,577 | |
| Total assets | | | 86,708,806 | | | | 132,043,484 | | | | 110,594,575 | |
| | | | | | | | | | | | | |
| LIABILITIES: | | | | | | | | | | | | |
| Payables: | | | | | | | | | | | | |
| Investment securities purchased | | | 26,704,278 | | | | — | | | | — | |
| Fund shares redeemed | | | — | | | | — | | | | 25,000 | |
| Advisory fees | | | 50,209 | | | | 77,964 | | | | 56,048 | |
| Auditing fees | | | 11,520 | | | | 11,522 | | | | 11,522 | |
| Transfer agent fees and expenses | | | 3,697 | | | | 7,784 | | | | 4,335 | |
| Legal fees | | | 2,576 | | | | 11,451 | | | | 7,249 | |
| Pricing fees | | | 1,563 | | | | 828 | | | | 771 | |
| Custody fees | | | 1,330 | | | | 334 | | | | — | |
| Shareholder reporting fees | | | 1,016 | | | | 4,851 | | | | 3,203 | |
| Trustees’ fees and expenses | | | 708 | | | | 2,894 | | | | 2,487 | |
| Fund accounting and administration fees | | | 347 | | | | 5,300 | | | | 2,691 | |
| Chief Compliance Officer fees | | | 201 | | | | 257 | | | | 228 | |
| Total liabilities | | | 26,777,445 | | | | 123,185 | | | | 113,534 | |
| | | | | | | | | | | | | |
| NET ASSETS | | $ | 59,931,361 | | | $ | 131,920,299 | | | $ | 110,481,041 | |
| | | | | | | | | | | | | |
| COMPONENTS OF NET ASSETS: | | | | | | | | | | | | |
| Paid-in capital (par value of $0.01 per share with an | | | | | | | | | | | | |
| unlimited number of shares authorized) | | $ | 52,932,352 | | | $ | 96,384,917 | | | $ | 85,584,485 | |
| Accumulated net investment loss | | | (98,854 | ) | | | (92,032 | ) | | | (86,872 | ) |
| Accumulated net realized gain on investments and | | | | | | | | | | | | |
| foreign currency transactions | | | 1,399,735 | | | | 591,088 | | | | 198,054 | |
| Unrealized appreciation on: | | | | | | | | | | | | |
| Investments | | | 5,698,025 | | | | 35,036,291 | | | | 24,785,348 | |
| Foreign currency translations | | | 103 | | | | 35 | | | | 26 | |
| NET ASSETS | | $ | 59,931,361 | | | $ | 131,920,299 | | | $ | 110,481,041 | |
| Institutional Class: | | | | | | | | | | | | |
| Shares of beneficial interest issued and outstanding | | | 3,907,550 | | | | 10,428,734 | | | | 8,471,816 | |
| Net asset value per share | | $ | 15.34 | | | $ | 12.65 | | | $ | 13.04 | |
The accompanying notes are an integral part of these financial statements.
EntrepreneurShares Series Trust
STATEMENTS OF OPERATIONS
For the period ended December 31, 2017 (Unaudited)
| | | EntrepreneurShares | | | Entrepreneur | | | Entrepreneur | |
| | | Global | | | U.S. Small | | | U.S. Large | |
| | | Fund | | | Cap Fund | | | Cap Fund | |
| INVESTMENT INCOME: | | | | | | | | | |
| Dividend income* | | $ | 199,659 | | | $ | 440,166 | | | $ | 298,009 | |
| Interest income | | | 5,420 | | | | 22,616 | | | | 12,367 | |
| Total investment income | | | 205,079 | | | | 462,782 | | | | 310,376 | |
| | | | | | | | | | | | | |
| EXPENSES: | | | | | | | | | | | | |
| Advisory fees | | | 221,106 | | | | 477,234 | | | | 344,381 | |
| Custody fees | | | 11,591 | | | | 3,226 | | | | 2,769 | |
| Transfer agent fees and expenses | | | 11,472 | | | | 19,223 | | | | 14,929 | |
| Auditing fees | | | 9,529 | | | | 9,527 | | | | 9,528 | |
| Registration fees | | | 7,727 | | | | 3,882 | | | | 6,589 | |
| Fund administration fees | | | 7,472 | | | | 27,563 | | | | 22,581 | |
| Fund accounting fees and expenses | | | 5,303 | | | | 13,967 | | | | 11,146 | |
| Pricing expense | | | 2,953 | | | | 1,794 | | | | 1,420 | |
| Legal fees | | | 2,075 | | | | 9,644 | | | | 6,004 | |
| Miscellaneous | | | 1,487 | | | | 303 | | | | 302 | |
| Trustees’ fees and expenses | | | 1,382 | | | | 5,123 | | | | 4,585 | |
| Shareholder reporting fees | | | 812 | | | | 3,092 | | | | 2,636 | |
| Insurance fees | | | 560 | | | | 3,649 | | | | 2,287 | |
| Chief Compliance Officer fees | | | 525 | | | | 1,481 | | | | 1,348 | |
| Total expenses | | | 283,994 | | | | 579,708 | | | | 430,505 | |
| Advisory fees recovered/(waived) | | | 19,939 | | | | (39,415 | ) | | | (33,456 | ) |
| Net expenses | | | 303,933 | | | | 540,293 | | | | 397,049 | |
| NET INVESTMENT LOSS | | | (98,854 | ) | | | (77,511 | ) | | | (86,673 | ) |
| | | | | | | | | | | | | |
| REALIZED AND UNREALIZED GAIN (LOSS) | | | | | | | | | | | | |
| ON INVESTMENTS AND FOREIGN CURRENCY: | | | | | | | | | | | | |
| Net realized gain (loss) on: | | | | | | | | | | | | |
| Investments | | | 1,796,025 | | | | 6,763,238 | | | | 4,945,441 | |
| Foreign currency transactions | | | (75 | ) | | | — | | | | — | |
| Net realized gain | | | 1,795,950 | | | | 6,763,238 | | | | 4,945,441 | |
| Net change in unrealized appreciation/depreciation on: | | | | | | | | | | | | |
| Investments | | | 2,745,509 | | | | 4,969,199 | | | | 8,468,177 | |
| Foreign currency translations | | | 40 | | | | 35 | | | | 26 | |
| Net change in unrealized appreciation/depreciation | | | 2,745,549 | | | | 4,969,234 | | | | 8,468,203 | |
| Net realized and unrealized gain on investments and | | | | | | | | | | | | |
| foreign currency | | | 4,541,499 | | | | 11,732,472 | | | | 13,413,644 | |
| NET INCREASE IN NET ASSETS | | | | | | | | | | | | |
| FROM OPERATIONS | | $ | 4,442,645 | | | $ | 11,654,961 | | | $ | 13,326,971 | |
| * Net of foreign tax withheld of: | | $ | 6,902 | | | $ | — | | | $ | — | |
The accompanying notes are an integral part of these financial statements.
EntrepreneurShares Global Fund
STATEMENTS OF CHANGES IN NET ASSETS
| | | Six Months Ended | | | Year Ended | |
| | | December 31, 2017 | | | June 30, 2017 | |
| | | (Unaudited) | | | | |
| INCREASE (DECREASE) IN NET ASSETS FROM: | | | | | | |
| OPERATIONS: | | | | | | |
| Net investment loss | | $ | (98,854 | ) | | $ | (127,789 | ) |
| Net realized gain on investments and foreign currency transactions | | | 1,795,950 | | | | 3,033,705 | |
| Net change in unrealized appreciation/depreciation on investments | | | | | | | | |
| and foreign currency translations | | | 2,745,549 | | | | 2,340,735 | |
| Net increase in net assets resulting from operations | | | 4,442,645 | | | | 5,246,651 | |
| | | | | | | | | |
| DISTRIBUTIONS TO SHAREHOLDERS: | | | | | | | | |
| Institutional Class | | | | | | | | |
| From net realized gains | | | (3,034,872 | ) | | | — | |
| Total distributions to shareholders | | | (3,034,872 | ) | | | — | |
| | | | | | | | | |
| CAPITAL TRANSACTIONS: | | | | | | | | |
| Institutional Class | | | | | | | | |
| Proceeds from shares sold | | | 30,580,158 | | | | 324,310 | |
| Reinvestment of distributions | | | 2,898,919 | | | | — | |
Cost of shares redeemed1 | | | (1,888,476 | ) | | | (419,557 | ) |
| Net increase (decrease) in net assets from capital transactions | | | 31,590,601 | | | | (95,247 | ) |
| | | | | | | | | |
| TOTAL INCREASE IN NET ASSETS | | | 32,998,374 | | | | 5,151,404 | |
| | | | | | | | | |
| NET ASSETS: | | | | | | | | |
| Beginning of Period | | | 26,932,987 | | | | 21,781,583 | |
| End of Period | | $ | 59,931,361 | | | $ | 26,932,987 | |
| Accumulated net investment loss | | $ | (98,854 | ) | | $ | — | |
1 | Net of redemption fee proceeds of $5 and $0, respectively. |
The accompanying notes are an integral part of these financial statements.
Entrepreneur U.S. Small Cap Fund
STATEMENTS OF CHANGES IN NET ASSETS
| | | Six Months Ended | | | Year Ended | |
| | | December 31, 2017 | | | June 30, 2017 | |
| | | (Unaudited) | | | | |
| INCREASE (DECREASE) IN NET ASSETS FROM: | | | | | | |
| OPERATIONS: | | | | | | |
| Net investment income (loss) | | $ | (77,511 | ) | | $ | 197,201 | |
| Net realized gain on investments | | | 6,763,238 | | | | 12,964,649 | |
| Net change in unrealized appreciation/depreciation on investments | | | 4,969,234 | | | | 26,882,423 | |
| Net increase in net assets resulting from operations | | | 11,654,961 | | | | 40,044,273 | |
| | | | | | | | | |
| DISTRIBUTIONS TO SHAREHOLDERS: | | | | | | | | |
| Institutional Class | | | | | | | | |
| From net investment income | | | — | | | | (256,005 | ) |
| From net realized gains | | | (12,726,215 | ) | | | — | |
| Total distributions to shareholders | | | (12,726,215 | ) | | | (256,005 | ) |
| | | | | | | | | |
| CAPITAL TRANSACTIONS: | | | | | | | | |
| Institutional Class | | | | | | | | |
| Proceeds from shares sold | | | 454,381 | | | | 338,231 | |
| Reinvestment of distributions | | | 12,645,894 | | | | 253,729 | |
| Cost of shares redeemed | | | (955,995 | ) | | | (50,237,062 | ) |
Retail Class1 | | | | | | | | |
| Proceeds from shares sold | | | — | | | | 10,000 | |
Cost of shares redeemed2 | | | (11,280 | ) | | | — | |
| Net increase (decrease) in net assets from capital transactions | | | 12,133,000 | | | | (49,635,102 | ) |
| | | | | | | | | |
| TOTAL INCREASE (DECREASE) IN NET ASSETS | | | 11,061,746 | | | | (9,846,834 | ) |
| | | | | | | | | |
| NET ASSETS: | | | | | | | | |
| Beginning of Period | | | 120,858,553 | | | | 130,705,387 | |
| End of Period | | $ | 131,920,299 | | | $ | 120,858,553 | |
| Accumulated net investment loss | | $ | (92,032 | ) | | $ | (14,521 | ) |
1 | Inception date of Retail Class was March 10, 2017. The Retail Class was liquidated on July 31, 2017. |
2 | Net of redemption fee proceeds of $6 and $0, respectively. |
The accompanying notes are an integral part of these financial statements.
Entrepreneur U.S. Large Cap Fund
STATEMENTS OF CHANGES IN NET ASSETS
| | | Six Months Ended | | | Year Ended | |
| | | December 31, 2017 | | | June 30, 2017 | |
| | | (Unaudited) | | | | |
| INCREASE (DECREASE) IN NET ASSETS FROM: | | | | | | |
| OPERATIONS: | | | | | | |
| Net investment income (loss) | | $ | (86,673 | ) | | $ | 318,015 | |
| Net realized gain on investments | | | 4,945,441 | | | | 6,025,810 | |
| Net change in unrealized appreciation/depreciation on investments | | | 8,468,203 | | | | 11,686,488 | |
| Net increase in net assets resulting from operations | | | 13,326,971 | | | | 18,030,313 | |
| | | | | | | | | |
| DISTRIBUTIONS TO SHAREHOLDERS: | | | | | | | | |
| Institutional Class | | | | | | | | |
| From net investment income | | | (74,946 | ) | | | (512,197 | ) |
| From net realized gains | | | (10,089,163 | ) | | | (984,631 | ) |
| Total distributions to shareholders | | | (10,164,109 | ) | | | (1,496,828 | ) |
| | | | | | | | | |
| CAPITAL TRANSACTIONS: | | | | | | | | |
| Institutional Class | | | | | | | | |
| Proceeds from shares sold | | | 2,031,661 | | | | 3,755,788 | |
| Reinvestment of distributions | | | 9,867,252 | | | | 1,434,053 | |
Cost of shares redeemed1 | | | (12,404,048 | ) | | | (2,394,894 | ) |
| Net increase (decrease) in net assets from capital transactions | | | (505,135 | ) | | | 2,794,947 | |
| | | | | | | | | |
| TOTAL INCREASE IN NET ASSETS | | | 2,657,727 | | | | 19,328,432 | |
| | | | | | | | | |
| NET ASSETS: | | | | | | | | |
| Beginning of Period | | | 107,823,314 | | | | 88,494,882 | |
| End of Period | | $ | 110,481,041 | | | $ | 107,823,314 | |
| Accumulated net investment income (loss) | | $ | (86,872 | ) | | $ | 74,747 | |
1 | Net of redemption fee proceeds of $137 and $0, respectively. |
The accompanying notes are an integral part of these financial statements.
EntrepreneurShares Global Fund
FINANCIAL HIGHLIGHTS
For a capital share outstanding throughout each period.
| | | Six Months | | | | | | | | | | | | | | | | |
| | | Ended | | | | |
| | | December 31, | | | Years Ended June 30, | |
| | | 2017 | | | 2017 | | | 2016 | | | 2015 | | | 2014 | | | 2013 | |
| | | (Unaudited) | | | | | | | | | | | | | | | | |
| Per Share Data: | | | | | | | | | | | | | | | | | | |
| Net asset value, beginning of period | | $ | 14.65 | | | $ | 11.81 | | | $ | 12.19 | | | $ | 13.19 | | | $ | 11.82 | | | $ | 10.15 | |
| | | | | | | | | | | | | | | | | | | | | | | | | |
| Income from investment operations: | | | | | | | | | | | | | | | | | | | | | | | | |
Net investment loss1 | | | (0.04 | ) | | | (0.07 | ) | | | (0.07 | ) | | | (0.08 | ) | | | (0.03 | ) | | | (0.02 | ) |
| Net realized and unrealized | | | | | | | | | | | | | | | | | | | | | | | | |
| gain (loss) on investments | | | 1.98 | | | | 2.91 | | | | (0.27 | ) | | | 0.48 | | | | 2.10 | | | | 1.77 | |
| Total from investment operations | | | 1.94 | | | | 2.84 | | | | (0.34 | ) | | | 0.40 | | | | 2.07 | | | | 1.75 | |
| | | | | | | | | | | | | | | | | | | | | | | | | |
| Less distributions: | | | | | | | | | | | | | | | | | | | | | | | | |
| From net investment income | | | — | | | | — | | | | (0.04 | ) | | | — | | | | — | | | | — | |
| From net realized gain | | | (1.25 | ) | | | — | | | | — | | | | (1.40 | ) | | | (0.70 | ) | | | (0.08 | ) |
| Total distributions | | | (1.25 | ) | | | — | | | | (0.04 | ) | | | (1.40 | ) | | | (0.70 | ) | | | (0.08 | ) |
| Net asset value, end of period | | $ | 15.34 | | | $ | 14.65 | | | $ | 11.81 | | | $ | 12.19 | | | $ | 13.19 | | | $ | 11.82 | |
Total return2 | | | 13.26 | %6 | | | 24.05 | % | | | (2.75 | )% | | | 3.49 | % | | | 17.67 | % | | | 17.33 | % |
| | | | | | | | | | | | | | | | | | | | | | | | | |
| Ratios and Supplemental Data: | | | | | | | | | | | | | | | | | | | | | | | | |
| Net assets, end of period (000’s) | | $ | 59,931 | | | $ | 26,933 | | | $ | 21,782 | | | $ | 5,517 | | | $ | 24,402 | | | $ | 22,552 | |
| Ratio of expenses to average net assets: | | | | | | | | | | | | | | | | | | | | | | | | |
| Before fees waived/recovered | | | 1.59 | %7 | | | 1.74 | % | | | 2.52 | % | | | 2.03 | % | | | 2.24 | % | | | 2.34 | % |
| After fees waived/recovered | | | 1.70 | %7 | | | 1.70 | % | | | 1.70 | % | | | 1.70 | % | | | 1.70 | % | | | 1.71 | %3 |
| Ratio of net investment loss | | | | | | | | | | | | | | | | | | | | | | | | |
| to average net assets: | | | | | | | | | | | | | | | | | | | | | | | | |
| Before fees waived/recovered | | | (0.44 | )%7 | | | (0.57 | )% | | | (1.43 | )% | | | (0.96 | )% | | | (0.79 | )% | | | (0.84 | )% |
| After fees waived/recovered | | | (0.55 | )%7 | | | (0.53 | )% | | | (0.61 | )% | | | (0.63 | )% | | | (0.25 | )% | | | (0.21 | )%4 |
| Portfolio turnover rate | | | 43 | %6 | | | 65 | % | | | 71 | % | | | 69 | %5 | | | 64 | % | | | 14 | % |
1 | Based on average shares method. |
2 | Total returns would have been lower/higher had expenses not been waived/recovered by the Advisor. Returns shown do not reflect the deduction of taxes that a shareholder would pay on Fund distributions or the redemption of Fund shares. |
3 | Includes expenses related to the Retail Class that was merged into the Institutional Class on January 10, 2013. In the absence of these expenses, the ratio would have been 1.70%. |
4 | Includes income and expenses attributed to the Retail Class that was merged into the Institutional Class on January 10, 2013. In the absence of these expenses, the ratio would have been (0.20)%. |
5 | Includes the value of portfolio securities delivered as a result of an in-kind redemption. |
6 | Not annualized. |
7 | Annualized. |
The accompanying notes are an integral part of these financial statements.
Entrepreneur U.S. Small Cap Fund
FINANCIAL HIGHLIGHTS
For a capital share outstanding throughout each period.
| | | | | | | | | | | | | | | Period From | |
| | | Six Months | | | | | | | | | | | | December 17, | |
| | | Ended | | | | | | | 2013* | |
| | | December 31, | | | Years Ended June 30, | | | through June 30, | |
| | | 2017 | | | 2017 | | | 2016 | | | 2015 | | | | 2014 | |
| | | (Unaudited) | | | | | | | | | | | | | | |
| Per Share Data: | | | | | | | | | | | | | | | | |
| Net asset value, beginning of period | | $ | 12.75 | | | $ | 9.72 | | | $ | 11.45 | | | $ | 10.68 | | | $ | 10.00 | |
| | | | | | | | | | | | | | | | | | | | | |
| Income from investment operations: | | | | | | | | | | | | | | | | | | | | |
Net investment income (loss)1 | | | (0.01 | ) | | | 0.01 | | | | 0.02 | | | | — | 2 | | | 0.01 | |
| Net realized and unrealized | | | | | | | | | | | | | | | | | | | | |
| gain (loss) on investments | | | 1.26 | | | | 3.04 | | | | (1.14 | ) | | | 0.77 | | | | 0.68 | |
| Total from investment operations | | | 1.25 | | | | 3.05 | | | | (1.12 | ) | | | 0.77 | | | | 0.69 | |
| | | | | | | | | | | | | | | | | | | | | |
| Less distributions: | | | | | | | | | | | | | | | | | | | | |
| From net investment income | | | — | | | | (0.02 | ) | | | — | 2 | | | — | 2 | | | (0.01 | ) |
| From net realized gain | | | (1.35 | ) | | | — | | | | (0.61 | ) | | | — | | | | — | |
| Total distributions | | | (1.35 | ) | | | (0.02 | ) | | | (0.61 | ) | | | — | 2 | | | (0.01 | ) |
| Net asset value, end of period | | $ | 12.65 | | | $ | 12.75 | | | $ | 9.72 | | | $ | 11.45 | | | $ | 10.68 | |
Total return3 | | | 9.70 | %4 | | | 31.39 | % | | | (9.63 | )% | | | 7.26 | % | | | 6.85 | %4 |
| | | | | | | | | | | | | | | | | | | | | |
| Ratios and Supplemental Data: | | | | | | | | | | | | | | | | | | | | |
| Net assets, end of period (000’s) | | $ | 131,920 | | | $ | 120,847 | | | $ | 130,705 | | | $ | 143,122 | | | $ | 133,422 | |
| Ratio of expenses to average net assets: | | | | | | | | | | | | | | | | | | | | |
| Before fees waived | | | 0.91 | %5 | | | 0.90 | % | | | 0.91 | % | | | 0.89 | % | | | 0.97 | %5 |
| After fees waived | | | 0.85 | %5 | | | 0.85 | % | | | 0.85 | % | | | 0.85 | % | | | 0.85 | %5 |
| Ratio of net investment income (loss) | | | | | | | | | | | | | | | | | | | | |
| to average net assets: | | | | | | | | | | | | | | | | | | | | |
| Before fees waived | | | (0.18 | )%5 | | | (0.18 | )% | | | 0.11 | % | | | (0.08 | )% | | | (0.03 | )%5 |
| After fees waived | | | (0.12 | )%5 | | | (0.13 | )% | | | 0.17 | % | | | (0.04 | )% | | | 0.09 | %5 |
| Portfolio turnover rate | | | 18 | %4 | | | 53 | % | | | 67 | % | | | 107 | % | | | 55 | %4,6 |
| * | Inception date of the Institutional Class was December 17, 2013. |
1 | Based on average shares method. |
2 | Amount represents less than $0.01 per share. |
3 | Total returns would have been lower had expenses not been waived or absorbed by the Advisor. Returns shown do not reflect the deduction of taxes that a shareholder would pay on Fund distributions or the redemption of Fund shares. |
4 | Not annualized. |
5 | Annualized. |
6 | Excludes the value of portfolio securities received as a result of in-kind purchases of the Fund’s capital shares. |
The accompanying notes are an integral part of these financial statements.
Entrepreneur U.S. Large Cap Fund
FINANCIAL HIGHLIGHTS
For a capital share outstanding throughout each period.
| | | | | | | | | | | | | | | Period From | |
| | | Six Months | | | | | | | | | | | | December 17, | |
| | | Ended | | | | | | | 2013* | |
| | | December 31, | | | Years Ended June 30, | | | through June 30, | |
| | | 2017 | | | 2017 | | | 2016 | | | 2015 | | | | 2014 | |
| | | (Unaudited) | | | | | | | | | | | | | | |
| Per Share Data: | | | | | | | | | | | | | | | | |
| Net asset value, beginning of period | | $ | 12.61 | | | $ | 10.65 | | | $ | 10.77 | | | $ | 10.00 | | | $ | 10.00 | |
| | | | | | | | | | | | | | | | | | | | | |
| Income from investment operations: | | | | | | | | | | | | | | | | | | | | |
Net investment income (loss)1 | | | (0.01 | ) | | | 0.04 | | | | 0.07 | | | | 0.04 | | | | — | |
| Net realized and unrealized | | | | | | | | | | | | | | | | | | | | |
| gain (loss) on investments | | | 1.76 | | | | 2.10 | | | | (0.12 | ) | | | 0.74 | | | | — | 2 |
| Total from investment operations | | | 1.75 | | | | 2.14 | | | | (0.05 | ) | | | 0.78 | | | | — | |
| | | | | | | | | | | | | | | | | | | | | |
| Less distributions: | | | | | | | | | | | | | | | | | | | | |
| From net investment income | | | (0.01 | ) | | | (0.06 | ) | | | (0.07 | ) | | | (0.01 | ) | | | — | |
| From net realized gain | | | (1.31 | ) | | | (0.12 | ) | | | — | | | | — | | | | — | |
| Total distributions | | | (1.32 | ) | | | (0.18 | ) | | | (0.07 | ) | | | (0.01 | ) | | | — | |
| Net asset value, end of period | | $ | 13.04 | | | $ | 12.61 | | | $ | 10.65 | | | $ | 10.77 | | | $ | 10.00 | |
Total return3 | | | 13.75 | %4 | | | 20.26 | % | | | (0.49 | )% | | | 7.77 | % | | | 0.00 | %4 |
| | | | | | | | | | | | | | | | | | | | | |
| Ratios and Supplemental Data: | | | | | | | | | | | | | | | | | | | | |
| Net assets, end of period (000’s) | | $ | 110,481 | | | $ | 107,823 | | | $ | 88,495 | | | $ | 82,980 | | | $ | 75,001 | |
| Ratio of expenses to average net assets: | | | | | | | | | | | | | | | | | | | | |
| Before fees waived | | | 0.81 | %5 | | | 0.82 | % | | | 0.83 | % | | | 0.83 | % | | | 0.01 | %5,6 |
| After fees waived | | | 0.75 | %5 | | | 0.75 | % | | | 0.75 | % | | | 0.75 | % | | | 0.00 | %5,6 |
| Ratio of net investment income (loss) | | | | | | | | | | | | | | | | | | | | |
| to average net assets: | | | | | | | | | | | | | | | | | | | | |
| Before fees waived | | | (0.22 | )%5 | | | 0.26 | % | | | 0.59 | % | | | 0.28 | % | | | (0.01 | )%5,6 |
| After fees waived | | | (0.16 | )%5 | | | 0.33 | % | | | 0.67 | % | | | 0.36 | % | | | 0.00 | %5,6 |
| Portfolio turnover rate | | | 27 | %4 | | | 43 | % | | | 77 | % | | | 90 | % | | | 0 | %4,7 |
| * | Inception date of the Institutional Class was June 30, 2014. |
1 | Based on average shares method. |
2 | Amount represents less than $0.01 per share. |
3 | Total returns would have been lower had expenses not been waived or absorbed by the Advisor. Returns shown do not reflect the deduction of taxes that a shareholder would pay on Fund distributions or the redemption of Fund shares. |
4 | Not annualized. |
5 | Annualized. |
6 | Amount is based on a one-day fiscal year and is not indicative of future Fund expenses or income. |
7 | Excludes the value of portfolio securities received as a result of in-kind purchases of the Fund’s capital shares. |
The accompanying notes are an integral part of these financial statements.
EntrepreneurShares Series Trust
NOTES TO FINANCIAL STATEMENTS
December 31, 2017 (Unaudited)
1. ORGANIZATION
EntrepreneurShares™ Series Trust, a Delaware statutory trust (the “Trust”), was formed on July 1, 2010, and has authorized capital of unlimited shares of beneficial interest. The Trust is an open-end management investment company registered under the Investment Company Act of 1940, as amended (the “1940 Act”), and is authorized to issue multiple series and classes of shares. The EntrepreneurShares Global Fund (the “Global Fund”), the Entrepreneur U.S. Small Cap Fund (the “U.S. Small Cap Fund”) and the Entrepreneur U.S. Large Cap Fund (the “U.S. Large Cap Fund”) (each separately a “Fund”, or collectively, “the Funds”) are each classified as a “diversified” series, as defined in the 1940 Act. The Funds are investment companies and, accordingly, follow the investment company accounting and reporting guidance of the Financial Accounting Standards Board Accounting Standards Codification Topic 946 – Investment Companies. The Global Fund commenced operations on November 11, 2010. The U.S. Small Cap Fund commenced operations on December 17, 2013. The U.S. Large Cap Fund commenced operations on June 30, 2014.
The investment objective of the Global Fund is long-term capital appreciation. The Global Fund seeks to achieve its objective by investing in equity securities of global companies with market capitalizations that are above $300 million at the time of initial purchase and possess entrepreneurial characteristics, as determined by EntrepreneurShares, LLC, the Global Fund’s Sub-Advisor, and Weston Capital Advisors, LLC, the Global Fund’s investment advisor.
The investment objective of the U.S. Small Cap Fund is long-term capital appreciation. The U.S. Small Cap Fund seeks to achieve its objective by investing at least 80% of its net assets (plus any borrowing for investment purposes) in equity securities of U.S. companies with market capitalization that are above $300 million at the time of initial purchase and possess entrepreneurial characteristics, as determined by Capital Impact Advisors, LLC, the U.S. Small Cap Fund’s investment advisor.
The investment objective of the U.S. Large Cap Fund is long-term capital appreciation. The U.S. Large Cap Fund seeks to achieve its objective by investing in equity securities of U.S. companies with market capitalizations that are above $5 billion at the time of initial purchase and possess entrepreneurial characteristics, as determined by Capital Impact Advisors, LLC, the U.S. Large Cap Fund’s investment advisor. Weston Capital Advisors, LLC and Capital Impact Advisors, LLC (together “Advisors”) are majority owned by Dr. Shulman.
The Global Fund, U.S. Small Cap Fund and the U.S. Large Cap Fund offer one share class, the Institutional Class. Effective June 29, 2012 the Global Fund ceased offering Class A shares to the public. The remaining Class A shares were converted into Retail Class shares. Effective January 10, 2013 the Global Fund ceased offering Retail Class shares to the public. The remaining Retail shares were converted into Institutional shares. Effective June 30, 2017, the U.S. Small Cap Fund ceased offering Retail Class shares to the public. As described in the Prospectus, the Institutional Class shares do not have a 12b-1 fee. The U.S. Small Cap Fund Retail Class shares were subject to a 0.25% distribution fee of average daily net assets. On July 31, 2017, the U.S. Small Cap Fund Retail Class shares were liquidated at the net asset value.
2. SUMMARY OF SIGNIFICANT ACCOUNTING POLICIES
The following is a summary of significant accounting policies consistently followed by the Funds in the preparation of their financial statements. These policies are in conformity with accounting principles generally accepted in the United States of America (“GAAP”).
Investment Valuations
The following is a summary of the Funds’ pricing procedures. It is intended to be a general discussion and may not necessarily reflect all pricing procedures followed by the Funds.
In determining the net asset value (“NAV”) of the Funds’ shares, securities that are listed on a national securities exchange (other than the National Association of Securities Dealers’ Automatic Quotation System (“NASDAQ”)) are valued at the last sale price on the day the valuation is made. Securities that are traded on NASDAQ under one of its three listing tiers, NASDAQ Global Select Market, NASDAQ Global Market and NASDAQ Capital Market, are valued at the NASDAQ Official Closing Price. Price information on listed securities is taken from the exchange where the security is primarily traded. Securities which are listed on an exchange but which are not traded on the valuation date are valued at the most recent bid price.
EntrepreneurShares Series Trust
NOTES TO FINANCIAL STATEMENTS (Continued)
December 31, 2017 (Unaudited)
Unlisted securities held by the Funds are valued at the average of the quoted bid and ask prices in the over the-counter (“OTC”) market. Securities and other assets for which market quotations are not readily available are valued at their fair value as determined in good faith under procedures established by and under the general supervision and responsibility of the EntrepreneurShares Series Trust Board of Trustees (the “Board”). Investments in registered open-end investment companies other than exchange-traded funds are valued at the reported NAV.
Short-term investments with 61 days or more to maturity at time of purchase are valued at market value through the 61st day prior to maturity, based on quotations received from market makers or other appropriate sources; thereafter, they are generally valued at amortized cost. There is no definitive set of circumstances under which the Funds may elect to use fair value procedures to value a security. Types of securities that the Funds may hold for which fair value pricing might be required include, but are not limited to: (a) illiquid securities, including restricted securities and private placements for which there is no public market; (b) options not traded on a securities exchange; (c) securities of an issuer that has entered into a restructuring; (d) securities whose trading has been halted or suspended, as permitted by the Securities and Exchange Commission (the “SEC”); (e) foreign securities, if an event or development has occurred subsequent to the close of the foreign market and prior to the close of regular trading on the New York Stock Exchange that would materially affect the value of the security; and (f) fixed income securities that have gone into default and for which there is not a current market value quotation.
Valuing securities at fair value involves greater reliance on judgment than securities that have readily available market quotations. There can be no assurance that the Funds could obtain the fair value price assigned to a security upon sale.
Securities that are not listed on an exchange are valued by the Funds’ Advisors, under the supervision of the Board. There is no single standard for determining the fair value of a security. Rather, in determining the fair value of a security, the Advisors and the Board take into account the relevant factors and surrounding circumstances, which may include: (1) the nature and pricing history (if any) of the security; (2) whether any dealer quotations for the security are available; (3) possible valuation methodologies that could be used to determine the fair value of the security; (4) the recommendation of the portfolio manager of the Fund with respect to the valuation of the security; (5) whether the same or similar securities are held by other funds managed by the Advisors or other funds and the method used to price the security in those funds; (6) the extent to which the fair value to be determined for the security will result from the use of data or formulae produced by third parties independent of the Advisors; and (7) the liquidity or illiquidity of the market for the security.
Fair Value Measurement
The Funds have adopted authoritative fair valuation accounting standards which establish an authoritative definition of fair value and set out a hierarchy for measuring fair value. These standards require additional disclosures about the various inputs and valuation techniques used to develop the measurements of fair value, a discussion of changes in valuation techniques and related inputs during the year and expanded disclosure of valuation levels for major security types. The hierarchy gives the highest priority to unadjusted quoted prices in active markets for identical assets or liabilities (Level 1 measurement) and the lowest priority to unobservable inputs (Level 3 measurements). The three levels of the fair value hierarchy are as follows:
| | Level 1: | Unadjusted quoted prices in active markets for identical assets that the Fund has the ability to access at the measurement date; |
| | | |
| | Level 2: | Observable inputs other than quoted prices included in Level 1 that are observable for the asset either directly or indirectly. These inputs may include quoted prices for identical instruments on inactive markets, quoted prices for similar instruments, interest rates, prepayment spreads, credit risk, yield curves, default rates, and similar data; |
| | | |
| | Level 3: | Significant unobservable inputs for the asset to the extent that relevant observable inputs are not available, representing the Fund’s own assumptions that a market participant would use in valuing the asset, and would be based on the best information available. |
EntrepreneurShares Series Trust
NOTES TO FINANCIAL STATEMENTS (Continued)
December 31, 2017 (Unaudited)
Inputs are used in applying the various valuation techniques and broadly refer to the assumptions that market participants use to make valuation decisions, including assumptions about risk. Inputs may include price information, volatility statistics, specific and broad credit data, liquidity statistics, and other factors. A financial instrument’s level within the fair value hierarchy is based on the lowest level of any input that is significant to the fair value measurement. However, the determination of what constitutes “observable” requires significant judgment by the Funds. The Funds consider observable data to be that market data which is readily available, regularly distributed or updated, reliable and verifiable, not proprietary, and provided by independent sources that are actively involved in the relevant market. The categorization of a financial instrument within the hierarchy is based upon the pricing transparency of the instrument and does not necessarily correspond to the Funds’ perceived risk of that instrument.
Investments whose values are based on quoted market prices in active markets, and are therefore classified within Level 1, include active listed equities and real estate investment trusts, and certain money market securities. Investments that trade in markets that are not considered to be active, but are valued based on quoted market prices, dealer quotations or alternative pricing sources supported by observable inputs are classified within Level 2. Investments classified within Level 3 have significant unobservable inputs, as they trade infrequently or not at all. The tables below are a summary of the inputs used to value the Funds’ investments as of December 31, 2017.
| Global Fund | | | | | | | | | | | | |
Investments at Fair Value* | | Level 1 | | | Level 2 | | | Level 3 | | | Total | |
| Common Stocks | | $ | 57,008,329 | | | $ | — | | | $ | — | | | $ | 57,008,329 | |
| Short-Term Investments | | | 19,782,637 | | | | — | | | | — | | | | 19,782,637 | |
| Total Investments | | $ | 76,790,966 | | | $ | — | | | $ | — | | | $ | 76,790,966 | |
| | | | | | | | | | | | | | | | | |
| U.S. Small Cap Fund | | | | | | | | | | | | | | | | |
Investments at Fair Value* | | Level 1 | | | Level 2 | | | Level 3 | | | Total | |
| Common Stocks | | $ | 125,414,471 | | | $ | — | | | $ | — | | | $ | 125,414,471 | |
| Short-Term Investments | | | 6,544,282 | | | | — | | | | — | | | | 6,544,282 | |
| Total Investments | | $ | 131,958,753 | | | $ | — | | | $ | — | | | $ | 131,958,753 | |
| | | | | | | | | | | | | | | | | |
| U.S. Large Cap Fund | | | | | | | | | | | | | | | | |
Investments at Fair Value* | | Level 1 | | | Level 2 | | | Level 3 | | | Total | |
| Common Stocks | | $ | 107,400,111 | | | $ | — | | | $ | — | | | $ | 107,400,111 | |
| Short-Term Investments | | | 3,133,775 | | | | — | | | | — | | | | 3,133,775 | |
| Total Investments | | $ | 110,533,886 | | | $ | — | | | $ | — | | | $ | 110,533,886 | |
| * | For further information regarding security characteristics, please see the Schedules of Investments. |
For the period ended December 31, 2017, the Funds had no transfers of securities between levels and no investments in derivative instruments. Transfers between levels are recognized at the end of the reporting year. The Funds did not have any Level 3 instruments during the year.
Use of Estimates and Indemnifications
The preparation of the financial statements in conformity with GAAP requires management to make estimates and assumptions that affect the reported amounts and disclosures in these financial statements. Actual results could differ from those estimates.
In the normal course of business, the Trust, on behalf of the Funds, enters into contracts that contain a variety of representations which provide general indemnifications. The Trust’s maximum exposure under these arrangements is unknown; however, the Trust has not had claims or losses pursuant to these contracts and the Trust expects any risk of loss to be remote.
EntrepreneurShares Series Trust
NOTES TO FINANCIAL STATEMENTS (Continued)
December 31, 2017 (Unaudited)
Federal Income Taxes
The Funds intend to continue to qualify as a “regulated investment company” under Sub-chapter M of the Internal Revenue Code of 1986, as amended. If so qualified, the Funds will not be subject to federal income tax to the extent it distributes substantially all of their net investment income and net realized gains to shareholders.
The Funds have reviewed all open tax years and major jurisdictions and concluded that the Funds did not have any tax positions that did not meet the “more-likely-than-not” threshold of being sustained by the applicable tax authority for the period ended December 31, 2017. The Funds would recognize interest and penalties, if any, related to uncertain tax benefits in the Statements of Operations. During the period ended December 31, 2017, the Funds did not incur any interest or penalties. Tax returns filed within the prior three years remain subject to examination by Federal and State tax authorities.
Distribution to Shareholders
The Funds intend to continue to distribute to its shareholders any net investment income and any net realized long or short-term capital gains, if any, at least annually. Distributions are recorded on the ex-dividend date. The Funds may periodically make reclassifications among certain of its capital accounts as a result of the characterization of certain income and realized gains determined annually in accordance with federal tax regulations that may differ from GAAP.
Foreign Currency Transactions
The Funds’ books and records are maintained in U.S. dollars. Foreign currency denominated transactions (i.e. fair value of investment securities, assets and liabilities, purchases and sales of investment securities and income and expenses) are translated into U.S. dollars at the current rate of exchange. The Funds isolate portions of the results of operations resulting from changes in foreign exchange rates on investments from the fluctuations arising from changes in market prices of securities held. Such fluctuations are reflected as net realized and unrealized gain or loss on foreign currency.
Investment Transactions and Investment Income
Investment transactions are recorded on the trade date. Dividend income, less any foreign tax withheld, is recognized on the ex-dividend date and interest income is recognized on an accrual basis, including amortization/accretion of premiums or discounts. Net realized gains or losses are determined using the best tax identification method.
3. AGREEMENTS
Global Fund’s Investment Advisory Agreement
Weston Capital Advisors, LLC, a related party of the Global Fund, oversees the performance of the Global Fund and is responsible for overseeing the management of the investment portfolio of the Global Fund. These services are provided under the terms of an investment advisory agreement between the Trust and Weston Capital Advisors, LLC, pursuant to which Weston Capital Advisors, LLC receives an annual advisory fee equal to 1.25% of the Global Fund’s average net assets.
Through November 1, 2018, the Advisor has agreed to waive and/or reimburse the Global Fund for its advisory fee, and to the extent necessary, bear other expenses, to limit the total annualized expenses (excluding borrowing and investment- related costs and fees, taxes, extraordinary expenses and fees and expenses of underlying funds) of the Institutional Class shares of the Global Fund to the amounts of 1.70% per annum of net assets attributable to such shares of the Global Fund.
Weston Capital Advisors, LLC shall be permitted to recover expenses it has borne subsequent to the effective date of this agreement (whether through reduction of its advisory fee or otherwise) in later periods to the extent that the Global Fund’s expenses fall below the annual rates set forth above, given that such a rate is not greater than the rate that was in place at the time of the waiver, provided, however, that the Global Fund is not obligated to pay any such reimbursed fees more than three years after the end of the fiscal year in which the expense was borne by Weston Capital Advisors, LLC.
EntrepreneurShares Series Trust
NOTES TO FINANCIAL STATEMENTS (Continued)
December 31, 2017 (Unaudited)
Waived fees subject to recovery by year of expiration are as follows:
Global Fund/Weston Capital Advisors, LLC
| | Year of Expiration | | Potential Recovery | |
| | 6/30/2021 | | $ | — | |
| | 6/30/2020 | | $ | 9,986 | |
| | 6/30/2019 | | $ | 68,444 | |
| | 6/30/2018 | | $ | 40,110 | |
| | Total | | $ | 118,540 | |
Sub-Advisory services are provided to the Global Fund, pursuant to an agreement between Weston Capital Advisors, LLC and EntrepreneurShares, LLC (the “Sub-Advisor”). Under the terms of this sub-advisory agreement, Weston Capital Advisors, LLC, not the Global Fund, compensates the Sub-Advisor based on the Global Fund’s average net assets. Certain officers of Weston Capital Advisors, LLC are also officers of the Sub-Advisor. Dr. Shulman is a majority owner of both Weston Capital Advisors, LLC and the Sub-Advisor.
U.S. Small Cap Fund and U.S. Large Cap Fund Investment Advisory Agreement
Capital Impact Advisors, LLC, a related party of the U.S. Small Cap Fund and the U.S. Large Cap Fund, oversees the performance of the U.S. Small Cap Fund and the U.S. Large Cap Fund and is responsible for overseeing the management of the investment portfolio of the U.S. Small Cap Fund and the U.S. Large Cap Fund. These services are provided under the terms of investment advisory agreements between the Trust and Capital Impact Advisors, LLC, pursuant to which Capital Impact Advisors, LLC receives an annual advisory fee equal to 0.75% of the U.S. Small Cap Fund’s average net assets and 0.65% of the U.S. Large Cap Fund’s average net assets.
Through November 1, 2018 for the U.S. Small Cap Fund and the U.S. Large Cap Fund, Capital Impact Advisors, LLC has agreed to waive and/or reimburse the U.S. Small Cap Fund and the U.S. Large Cap Fund for its advisory fee, and to the extent necessary, bear other expenses, to limit the total annualized expenses (excluding borrowing and investment-related costs and fees, taxes, extraordinary expenses and fees and expenses of underlying funds) of the Institutional Class shares of the U.S. Small Cap Fund to the amounts of 0.85% per annum of net assets attributable to such shares of the U.S. Small Cap Fund and 0.75% per annum of net assets attributable to shares of the U.S. Large Cap Fund. Capital Impact Advisors, LLC shall be permitted to recover expenses it has borne subsequent to the effective date of this agreement (whether through reduction of its advisory fee or otherwise) in later periods to the extent that the U.S. Small Cap Fund or the U.S. Large Cap Fund’s expenses fall below the annual rates set forth above, given that such a rate is not greater than the rate that was in place at the time of the waiver, provided, however, that the U.S. Small Cap Fund and the U.S. Large Cap Fund are not obligated to pay any such reimbursed fees more than three years after the end of the fiscal year in which the expense was borne by Capital Impact Advisors, LLC.
Waived fees subject to recovery by year of expiration are as follows:
U.S. Small Cap & U.S. Large Cap/Capital Impact Advisors, LLC
| | Year of Expiration | | Potential Recovery | |
| | | | U.S. Small Cap Fund | | | U.S. Large Cap Fund | |
| | 6/30/2021 | | $ | 39,415 | | | $ | 33,456 | |
| | 6/30/2020 | | $ | 77,461 | | | $ | 70,689 | |
| | 6/30/2019 | | $ | 72,431 | | | $ | 66,377 | |
| | 6/30/2018 | | $ | 58,334 | | | $ | 66,315 | |
| | Total | | $ | 247,641 | | | $ | 236,837 | |
4. DISTRIBUTION PLAN
The Trust has adopted distribution and service (Rule 12b-1) plans (the “Plan”) for the Funds’ Retail Class shares (not available for sale at this time) and the Global Fund’s Class A shares (not available for sale at this time). The Plan allows the Funds to use up to 0.25% of the average daily net assets attributable to the Retail Class shares of the Funds to pay
EntrepreneurShares Series Trust
NOTES TO FINANCIAL STATEMENTS (Continued)
December 31, 2017 (Unaudited)
sales, distribution, and other fees for the sale of that share class and for services provided to holders of Retail Class shares. The Plan allows the Global Fund to use up to 0.25% of the average daily net assets attributable to the Class A shares to pay sales, distribution, and other fees for the sale of that class and for services provided to holders of Class A shares. Because these fees are paid out of the Funds’ assets, over time, these fees will increase the cost of an investment in Retail Class or Class A shares, as applicable, and may cost the shareholder more than paying other types of sales charges. The Funds’ Institutional Class shares are not subject to any distribution and service (Rule 12b-1) fees. For the period ended December 31, 2017, the U.S. Small Cap Fund Retail Class incurred expenses of $0 pursuant to the Plan.
5. INCOME TAXES
The Funds plan to distribute substantially all of the net investment income and net realized gains that it has realized on the sale of securities. These income and gains distributions will generally be paid once each year, on or before December 31. The character of distributions made during the year from net investment income or net realized gains may differ from the characterization for federal income tax differences in the recognition of income, expense or gain items for financial reporting and tax reporting purposes.
The tax character of distributions paid during the year ended June 30, 2017 and the year ended June 30, 2016 was as follows:
| | | | Ordinary | | | Long-Term | | | | |
| | Global Fund | | Income* | | | Capital Gain | | | Total | |
| | June 30, 2017 | | $ | — | | | $ | — | | | $ | — | |
| | June 30, 2016 | | $ | 19,570 | | | $ | — | | | $ | 19,570 | |
| | | | Ordinary | | | Long-Term | | | | | |
| | U.S. Small Cap Fund | | Income* | | | Capital Gain | | | Total | |
| | June 30, 2017 | | $ | 256,005 | | | $ | — | | | $ | 256,005 | |
| | June 30, 2016 | | $ | 24,155 | | | $ | 7,648,839 | | | $ | 7,672,994 | |
| | | | Ordinary | | | Long-Term | | | | | |
| | U.S. Large Cap Fund | | Income* | | | Capital Gain | | | Total | |
| | June 30, 2017 | | $ | 1,092,097 | | | $ | 404,731 | | | $ | 1,496,828 | |
| | June 30, 2016 | | $ | 508,011 | | | $ | — | | | $ | 508,011 | |
| | | | | | | | | | | | | | |
| | * For federal income tax purposes, distribution of short-term capital gains are treated as ordinary income distributions. | | | | | | | | | | | | |
The Funds designate long-term capital gain dividends, pursuant to Internal Revenue Code Section 852(b)(3), the amount necessary to reduce the earnings and profits for the Fund related to net capital gains to zero for the tax year ended June 30, 2017.
As of June 30, 2017, the cost of investments, gross unrealized appreciation and depreciation of investments and distributable income for tax purposes are:
| | | | | | | U.S. Small | | | U.S. Large | |
| | | | Global Fund | | | Cap Fund | | | Cap Fund | |
| | Cost of investments | | $ | 24,027,296 | | | $ | 90,792,553 | | | $ | 91,664,956 | |
| | Unrealized appreciation | | | 3,458,089 | | | | 31,322,333 | | | | 20,039,116 | |
| | Unrealized depreciation | | | (514,120 | ) | | | (1,290,315 | ) | | | (3,870,145 | ) |
| | Net unrealized appreciation | | | 2,943,969 | | | | 30,032,018 | | | | 16,168,971 | |
| | Undistributed ordinary income | | | 1,397,881 | | | | — | | | | 2,267,093 | |
| | Undistributed long-term capital gain | | | 1,249,323 | | | | 6,589,139 | | | | 3,297,630 | |
| | Distributable income | | | 2,647,204 | | | | 6,589,139 | | | | 5,564,723 | |
| | Other accumulated gain (loss) | | | 63 | | | | (14,521 | ) | | | — | |
| | Total accumulated gain | | $ | 5,591,236 | | | $ | 36,606,636 | | | $ | 21,733,694 | |
The table above differs from the financial statements due to timing differences related to the deferral of losses due to wash sales, partnership interests and Passive Foreign Investment Companies.
EntrepreneurShares Series Trust
NOTES TO FINANCIAL STATEMENTS (Continued)
December 31, 2017 (Unaudited)
As of June 30, 2017, the Funds had capital loss carry forwards which could be used to offset future gains of:
| | | | Capital Loss | | | | |
| | | | Carryover | | | Character | |
| | Global Fund | | $ | — | | | | N/A | |
| | U.S. Small Cap Fund | | $ | — | | | | N/A | |
| | U.S. Large Cap Fund | | $ | — | | | | N/A | |
As of June 30, 2017, the Funds had deferred qualified late year ordinary losses of:
| | Global Fund | | $ | — | | |
| | U.S. Small Cap Fund | | $ | 14,521 | | |
| | U.S. Large Cap Fund | | $ | — | | |
As of June 30, 2017, the Funds had deferred qualified post October losses of:
| | Global Fund | | $ | — | | |
| | U.S. Small Cap Fund | | $ | — | | |
| | U.S. Large Cap Fund | | $ | — | | |
6. CAPITAL SHARE TRANSACTIONS
The Trust has authorized capital of unlimited shares of no par value which may be issued in more than one class or series. Currently, the Trust consists of three series, the Funds. Transactions in shares of the Funds were as follows:
| | | | Period Ended | | | Year Ended | |
| Global Fund | | December 31, 2017 | | | June 30, 2017 | |
| | Institutional Class | | | | | | |
| | Shares sold | | | 2,005,672 | | | | 24,904 | |
| | Shares issued on reinvestment | | | 188,609 | | | | — | |
| | Shares redeemed | | | (125,163 | ) | | | (31,358 | ) |
| | Net decrease in capital share transactions | | | 2,069,118 | | | | (6,454 | ) |
| | | | | | | | |
| | | | Period Ended | | | Year Ended | |
| U.S. Small Cap Fund | | December 31, 2017 | | | June 30, 2017 | |
| | Institutional Class | | | | | | | | |
| | Shares sold | | | 33,755 | | | | 30,216 | |
| | Shares issued on reinvestment | | | 991,058 | | | | 22,355 | |
| | Shares redeemed | | | (73,692 | ) | | | (4,016,823 | ) |
| | Net decrease in capital share transactions | | | 951,121 | | | | (3,964,252 | ) |
| | | | | | | | | | |
| | Retail Class1 | | | | | | | | |
| | Shares sold | | | — | | | | 872 | |
| | Shares issued on reinvestment | | | — | | | | — | |
| | Shares redeemed | | | (872 | ) | | | — | |
| | Net decrease in capital share transactions | | | (872 | ) | | | 872 | |
| | | | | | | | |
| | | | Period Ended | | | Year Ended | |
| U.S. Large Cap Fund | | December 31, 2017 | | | June 30, 2017 | |
| | Institutional Class | | | | | | | | |
| | Shares sold | | | 151,370 | | | | 320,047 | |
| | Shares issued on reinvestment | | | 750,361 | | | | 125,355 | |
| | Shares redeemed | | | (979,818 | ) | | | (206,800 | ) |
| | Net decrease in capital share transactions | | | (78,087 | ) | | | 238,602 | |
1 | Inception date of U.S. Small Cap Fund Retail Class was March 10, 2017. The Retail Class was liquidated on July 31, 2017. |
EntrepreneurShares Series Trust
NOTES TO FINANCIAL STATEMENTS (Continued)
December 31, 2017 (Unaudited)
7. RELATED PARTIES
At December 31, 2017, certain officers of the Trust were also employees of the Advisors. However, these officers were not compensated directly by the Funds. Refer to Note 3 for more information.
8. BENEFICIAL OWNERSHIP
The beneficial ownership, either directly or indirectly, of more than 25% of the voting securities of a fund creates a presumption of control of a fund, under Section 2(a)(9) of the 1940 Act. As of December 31, 2017, for the benefit of its shareholders, MAC & Co., held 59.5%, and National Financial Services, LLC held 29.3% of the total Global Fund shares outstanding. As of December 31, 2017, for the benefit of its shareholders, MAC & Co., an affiliate of the U.S. Small Cap Fund, held 95.5% of the total U.S. Small Cap Fund Institutional Class shares outstanding. As of December 31, 2017, for the benefit of its shareholders, MAC & Co., an affiliate of the U.S. Large Cap Fund, held 89.3% of the total U.S. Large Cap Fund shares outstanding.
9. INVESTMENT TRANSACTIONS
During the period ended December 31, 2017, the aggregate purchases and sales of securities (excluding in-kind transactions and short-term securities) were:
| | | | | | | U.S. Small | | | U.S. Large | |
| | | | Global Fund | | | Cap Fund | | | Cap Fund | |
| | Purchases: | | $ | 42,189,492 | | | $ | 22,264,454 | | | $ | 27,515,326 | |
| | Sales: | | $ | 15,716,022 | | | $ | 24,219,548 | | | $ | 37,535,346 | |
The Funds did not have any purchases or sales of U.S. Government Securities.
10. FOREIGN INVESTMENT RISK
The Global Fund generally invests a significant portion of its total assets in securities principally traded in markets outside the U.S. The foreign markets in which the Global Fund invests in are sometimes open on days when the New York Stock Exchange (“NYSE”) is not open and the Global Fund does not calculate its net asset value (“NAV”), and sometimes are not open on days when the NYSE is open and the Global Fund does calculate its NAV. Even on days on which both the foreign market and the NYSE are open, several hours may pass between the time when trading in the foreign market closes and the time at which the Global Fund calculates its NAV. That is generally the case for markets in Europe, Asia, Australia and other far eastern markets; the regular closing time of foreign markets in North and South America is generally the same as the closing time of the NYSE and the time at which the Global Fund calculate its NAV.
Foreign stocks, as an asset class, may underperform U.S. stocks, and foreign stocks may be more volatile than U.S. stocks. Risks relating to investment in foreign securities (including, but not limited to, depository receipts and participation certificates) include: currency exchange rate fluctuation; less available public information about the issuers of securities; less stringent regulatory standards; lack of uniform accounting, auditing and financial reporting standards; and country risk including less liquidity, high inflation rates, unfavorable economic practices and political instability. The risks of foreign investments are typically greater in emerging and less developed markets.
11. ACCOUNTING PRONOUNCEMENTS
On October 13, 2016 the Securities and Exchange Commission amended existing rules intended to modernize reporting and disclosure of information. These amendments relate to Regulation S-X which sets forth the form and content of financial statements. At this time, management is evaluating the implications of adopting these amendments and their impact on the financial statements and accompanying notes.
12. SUBSEQUENT EVENTS EVALUATION
Management has performed an evaluation of subsequent events through the date the financial statements were issued and has determined that no additional items require recognition or disclosure.
EntrepreneurShares Series Trust
ADDITIONAL INFORMATION
December 31, 2017 (Unaudited)
1. RENEWAL OF THE INVESTMENT ADVISORY AGREEMENTS
On September 13, 2017, all of the Trustees of EntrepreneurShares Series Trust (the “Trust”) met in person to discuss, among other things, the continuation of the investment advisory and sub-advisory agreements for the EntrepreneurShares Global Fund (the “Global Fund”), the Entrepreneur U.S. Small Cap Fund (the “Small Cap Fund”), and the Entrepreneur U.S. Large Cap Fund (the “Large Cap Fund”) (collectively referred to as the “Funds”). Weston Capital Advisors, LLC (“Weston”) is the Global Fund’s investment advisor, and EntrepreneurShares, LLC (“EntrepreneurShares”) is the Global Fund’s investment sub-advisor. Capital Impact Advisors, LLC (“Capital Impact Advisors”) is the investment advisor to both the Small Cap Fund and the Large Cap Fund. Weston, EntrepreneurShares, and Capital Impact Advisors are referred to herein as the “Advisers,” and the investment advisory agreements for the Global Fund, the Small Cap Fund, and the Large Cap Fund, along with the sub-advisory agreement for the Global Fund, are referred to herein as the “Advisory Agreements.” The Advisers are responsible for management of the investment portfolio of the Funds, and for overall management of the Funds’ business and affairs pursuant to the Advisory Agreements.
At the meeting, the Trustees had ample opportunity to consider matters they deemed relevant in considering the approval of the Advisory Agreements, and to request any additional information they considered reasonably necessary to their deliberations, without undue time constraints. In addition to the materials requested by the Trustees in connection with their consideration of the continuation of the Advisory Agreements, the Trustees received materials in advance of each regular quarterly meeting of the Board of Trustees that provided information relating to the services provided by the Advisers.
In advance of the meeting, the Advisers sent detailed information to the Trustees to assist them in their evaluation of the Advisory Agreements. This information included, but was not limited to, a memorandum that summarized the legal standards applicable to the Trustees’ consideration of the Advisory Agreements; information regarding the Advisers’ personnel and investment process; comparative information relating to the Funds’ management fees and other expenses of the Funds; information regarding fees paid and other payments; information on the Advisers’ profitability; financial information about the Advisers; information about brokerage commissions; comparative information relating to the Funds’ performance; information about sales and redemptions of the Funds; information about amounts paid to financial intermediaries; information about the Funds’ compliance program; and other information the Trustees believed was useful in evaluating the approval of the Advisory Agreements.
All of the factors discussed by the Trustees were considered as a whole, and were considered separately by the members of the Board of Trustees who are not deemed “interested persons” (as that term is defined by the Investment Company Act of 1940) of the Funds (the “Independent Trustees”), meeting in executive session. The factors were viewed in their totality by the Trustees, with no single factor being the principal or determinative factor in the Trustees’ determination of whether to approve the continuation of the Advisory Agreements. The Trustees recognized that the management and fee arrangements for the Funds are the result of years of review and discussion between the Independent Trustees and the Advisers, that certain aspects of such arrangements may receive greater scrutiny in some years than in others and that the Trustees’ conclusions may be based, in part, on their consideration of these same arrangements and information received during the course of the year and in prior years.
The material determinations of the Board of Trustees, including all of the Independent Trustees, are described below:
Nature and Quality of Investment Advisory Services
The Trustees concluded that the nature, extent and quality of the investment advisory services provided to the Funds by the Advisers are good, and that the nature and extent of the services provided by the Advisers are appropriate to assure that the Fund’s operations are conducted in compliance with applicable laws, rules and regulations. They believe that the following factors, among others, support these conclusions: the Advisers maintain sufficient staff and resources to support the Funds, which allows the Advisers to meet the investment objectives of the Funds; the Advisers have engaged service providers to the Funds, who provide administrative and distribution services on behalf of the Funds and are overseen by the Advisers, that have strong backgrounds and experience in the mutual fund industry; and past actions of the Advisers demonstrate the Advisers’ active oversight of service providers to the Funds, as they have taken actions to ensure that such service providers are performing well, and have, when necessary, replaced service providers who do not perform well.
EntrepreneurShares Series Trust
ADDITIONAL INFORMATION (Continued)
December 31, 2017 (Unaudited)
Comparative Fees and Expenses
The Trustees noted positively, that the advisory fees and net expense ratios of the Small Cap Fund and the Large Cap Fund were less than their peer groups’ average advisory fees and net expense ratios. While the Global Fund’s advisory fee and net expense ratio were greater than its peer group’s average advisory fee and net expense ratio, the Trustees felt that they were within a reasonable range of comparable mutual funds. So, the Trustees concluded that the advisory fees and net expense ratios of the Funds were reasonable, and they believe that the following factors, among others, support these conclusions: the long-term returns of the Global Fund and the Small Cap Fund exceeded their peer groups, and the long-term return of the Large Cap Fund was on par with the performance of its peer group; and the Funds are still relatively small in assets under management, and the Advisers are subsidizing the expenses of the Funds to ensure the Funds remain competitive with other funds.
Comparison of Fee Structures of Other Accounts
The Trustees concluded that the differential in advisory fees between the Funds and the separate accounts managed by the Advisers is reasonable, and concluded that the fee rates charged to the Funds in comparison to those charged to the Advisers’ other clients are reasonable. They believe that the following factors, among others, support these conclusions: the services performed by the Advisers for the Funds generally require a higher level of service and compliance oversight than the services performed for the separate accounts; the Advisers provide tailored investment advisory services to the Funds in order to accommodate the cash flow volatility presented by the purchases and redemptions of shareholders; and increasingly investors in the Funds invest through brokerage platforms (intermediaries), with fewer investors going directly to the Funds’ transfer agent, and the Advisers absorb a significant portion of the costs associated with these intermediaries (as a result, the cost of obtaining, retaining and servicing shareholders for the Funds is significantly higher than the costs for separate accounts).
Performance
The Trustees concluded that the performance of the Funds has been good on a relative basis and on an absolute basis. They continue to believe that the Advisers’ discipline should lead to favorable results in the long-term, and concluded that renewal of the Advisory Agreements was in the best interest of the Funds’ shareholders. They believe that the following factors, among others, support these conclusions: the Advisers manage the Funds in a manner that is materially consistent with their stated investment objective and style; and the long-term returns of the Global Fund and the Small Cap Fund exceeded their peer groups, and the long-term return of the Large Cap Fund was on par with the performance of its peer group.
Costs and Profitability
The Trustees recognized that it is difficult to make comparisons of profitability from investment advisory contracts. This is because comparative information is not generally publicly available and is affected by numerous factors, including the structure of the particular adviser, the type of clients it advises, its business mix, and numerous assumptions regarding allocations and the adviser’s capital structure and cost of capital. The Trustees concluded that the level of profitability realized by the Advisers from their provision of services to the Funds is reasonable, and, as noted above, that the overall expense ratios and investment advisory fees were fair and reasonable. They believe that the following factors, among others, support these conclusions: taking into account the intermediary fees that the Advisers pay in connection with managing the Funds, the cost of obtaining, retaining and servicing shareholders for the Funds is significantly higher than the costs for separate accounts; the Advisers expend significant resources and revenue to manage and distribute the Funds; and the Advisers are subsidizing the expenses of the Funds to ensure the Funds remain competitive with other funds.
Economies of Scale
The Trustees concluded that the current fees were appropriate at foreseeable asset levels without the need for breakpoints. They believe that the following factors, among others, support these conclusions: based on the materials reviewed at the meeting and the size of the Funds, the Funds have not realized economies of scale; and many of the Funds’ expenses increase as the Funds’ assets grow, such as the intermediary service fees and the costs of conducting research to explore additional investments.
EntrepreneurShares Series Trust
ADDITIONAL INFORMATION (Continued)
December 31, 2017 (Unaudited)
Fall-Out Benefits
The Trustees concluded that the other benefits realized by the Advisers from their relationship with the Funds were reasonable. They believe that the following factors, among others, support this conclusion: while the Advisers may derive ancillary benefits from their association with the Funds in the form of proprietary and third party research products and services received from broker dealers that execute portfolio trades for the Funds, the Trustees determined such products and services have been used for legitimate purposes relating to the Funds by providing assistance in the investment decision-making process; and while managing the Funds may have provided more visibility for the Advisers in the industry in general, the primary focus of this visibility has been the Funds, and it has been beneficial to the Funds.
Conclusion
After reviewing the material provided for the meeting, management’s presentation, as well as other information regularly provided at the Board’s quarterly meetings throughout the year regarding the quality of services provided by the Advisers, the performance of the Funds, expense information, regulatory compliance issues, trading information and related matters and other factors deemed relevant by the Board, the Trustees, including all of the Independent Trustees, concluded that the Advisory Agreements are fair and reasonable and that the continuation of the Advisory Agreement is in the best interest of the Funds and their shareholders. Accordingly, the Trustees, including the Independent Trustees voting separately, approved the continuation of the Advisory Agreements.
EntrepreneurShares Series Trust
ADDITIONAL INFORMATION (Continued)
December 31, 2017 (Unaudited)
2. AVAILABILITY OF QUARTERLY PORTFOLIO HOLDINGS SCHEDULES
The Funds file complete schedules of portfolio holdings with the SEC for the first and third quarters of each fiscal year on Form N-Q, which is available on the SEC’s website at www.sec.gov. The Funds’ Form N-Q may be reviewed and copied at the SEC’s Public Reference Room in Washington, D.C. For information on the Public Reference Room call 1-800-SEC-0330. In addition, the Funds’ Form N-Q is available without charge, upon request, by calling 1-877-271-8811.
3. PROXY VOTING POLICIES AND PROCEDURES AND PROXY VOTING RECORD
A description of the Funds’ proxy voting policies and procedures and information regarding how the Funds voted proxies relating to portfolio securities during the most recent 12 month period ended June 30, is available (1) without charge, upon request, by calling 1-877-271-8811, and (2) on the SEC’s website at www.sec.gov.
4. HOUSEHOLDING
To reduce expenses, each Fund generally mails only one copy of its prospectus and each annual and semi-annual report to those addresses shared by two or more accounts and to shareholders that such Fund reasonably believes are from the same family and household. This is referred to as “householding.” If you wish to discontinue householding and would like to receive individual copies of these documents, please call us at 1-877-271-8811. Once a Fund receives notice to stop householding, the Fund will begin sending individual copies 30 days after receiving requests. This policy does not apply to account statements.
(This Page Intentionally Left Blank.)
EntrepreneurShares Global Fund Investment Advisor
Weston Capital Advisors, LLC
175 Federal Street, Suite #875
Boston, MA 02110
EntrepreneurShares Global Fund Investment Sub-Advisor
EntrepreneurShares, LLC
175 Federal Street, Suite #875
Boston, MA 02110
Entrepreneur U.S. Small Cap Fund and Entrepreneur U.S. Large Cap Fund Investment Advisor
Capital Impact Advisors, LLC
175 Federal Street, Suite #875
Boston, MA 02110
Independent Registered Public Accounting Firm
RSM US LLP
80 City Square
Boston, MA 02129
Custodian
UMB Bank, N.A.
928 Grand Boulevard, 5th Floor
Kansas City, MO 64106
Distributor
Rafferty Capital Markets, LLC
59 Hilton Avenue
Garden City, NY 11530
Administrator, Accountant, Transfer Agent and Dividend Disbursing Agent
UMB Fund Services, Inc.
235 West Galena Street
Milwaukee, WI 53212
Counsel
Foley & Lardner LLP
777 East Wisconsin Avenue
Milwaukee, WI 53202
This report should be accompanied or preceded by a prospectus.
The Funds’ Statement of Additional Information contains additional information about the
Funds’ trustees and is available without charge upon request by calling 1-877-271-8811.
Semi-Annual Report
EntrepreneurShares Series Trust™
EntrepreneurShares Series Trust (“Trust”) is a registered investment company consisting of separate investment portfolios called “Funds.” This Semi-Annual Report relates solely to the following Fund:
| Name | | Ticker Symbol |
| ERShares Entrepreneur 30 ETF | | ENTR |
The Fund is an exchange-traded fund. This means that shares of the Fund are listed on NYSE Arca, Inc. (“NYSE Arca”) and trade at market prices. The market price for the Fund’s shares may be different from its net asset value per share (“NAV”).
December 31, 2017
175 Federal Street
Suite #875
Boston, MA 02110
Toll Free: 877-271-8811
| Expense Example | December 31, 2017 (Unaudited) |
As a Fund shareholder, you may incur two types of costs: (1) transaction costs, including commissions on trading, as applicable; and (2) ongoing costs, including advisory fees and other Fund expenses. These examples are intended to help you understand your ongoing costs (in dollars) of investing in a Fund and to compare these costs with the ongoing costs of investing in other mutual funds.
The expense example below is based on an investment of $1,000 invested on November 7, 2017 and held through the period ended December 31, 2017.
The Actual Expense figures in the table below provide information about actual account values and actual expenses. You may use this information, together with the amount you invested, to estimate the expenses that you paid over the period. Simply divide your account value by $1,000 (for example, an $8,600 account value divided by $1,000 = 8.6), then multiply the result by the number in the table under the heading entitled “Actual Expenses Paid” to estimate the expenses you paid on your account during this period.
The Hypothetical Expense figures in the table below provide information about hypothetical account values and hypothetical expenses based on the Fund’s actual expense ratio and an assumed rate of return of 5% per year before expenses, the return of 5% is hypothetical, not the Fund’s actual return. The hypothetical account values and expenses may not be used to estimate the actual ending account balance or expenses you paid for the period. You may use this information to compare the ongoing costs of investing in your Fund and other funds. To do so, compare this 5% hypothetical example with the 5% hypothetical examples that appear in the shareholder reports of the other funds.
Please note that the expenses shown in the table are meant to highlight your ongoing costs only and do not reflect any transactional costs. Therefore, the examples are useful in comparing ongoing costs only and will not help you determine the relative total cost of owning different funds. In addition, if these transactional costs were included, your costs would have been higher.
| | �� | Actual | Hypothetical | | | | |
| | Beginning | Ending | Ending | | | | |
| | Account | Account | Account | Actual | | Hypothetical | Annualized |
| | Value | Value | Value | Expenses | Total | Expenses | Net Expense |
| Fund | 11/7/17(1) | 12/31/17 | 12/31/17 | Paid(2) | Return | Paid(3)(4) | Ratio |
| ERShares Entrepreneur 30 ETF | $1,000.00 | $1,019.50 | $1,022.74 | $0.75 | 1.95% | $2.50 | 0.49% |
(1) | Commencement of operations. |
(2) | Information shown reflects values for the period November 7, 2017 through December 31, 2017, and has been calculated using expense ratios and rates of return of the same period. |
(3) | Expenses are equal to the average hypothetical account value of the period multiplied by the Fund’s annualized expense ratio, multiplied by the number of days in the most recent fiscal half-year divided by the number of days in the fiscal year (to reflect the one-half year period). |
(4) | Represents the hypothetical 5% annual return before taxes. |
Semi-Annual Shareholder Report
2
| Portfolio of Investments Summary | December 31, 2017 (Unaudited) |
ERShares Entrepreneur 30 ETF
| | | Percentage of Fair Value |
| Communications | | | 24.9 | % |
| Consumer Discretionary | | | 16.6 | % |
| Energy | | | 2.9 | % |
| Financials | | | 21.8 | % |
| Health Care | | | 5.5 | % |
| Industrials | | | 4.3 | % |
| Technology | | | 24.0 | % |
| Total | | | 100.0 | % |
Portfolio holdings and allocations are subject to change. As of December 31, 2017, percentages in the table above are based on total investments. Such total investments may differ from the percentages set forth in the following Portfolio of Investments which are computed using the Fund’s total net assets.
Portfolio of Investments
| Shares | | | | Fair Value | |
| | | | |
| Common Stocks — 99.9% | | | |
| | | | |
| Communications — 24.9% | | | |
| | 34,363 | | Alphabet, Inc., Class A† | | $ | 4,595,985 | |
| | 30,590 | | DISH Network Corp., Class A† | | | 1,460,673 | |
| | 23,100 | | Facebook, Inc., Class A† | | | 4,076,226 | |
| | 11,545 | | Netflix, Inc.† | | | 2,216,178 | |
| | 26,110 | | Zayo Group Holdings, Inc.† | | | 960,848 | |
| | | | | | | 13,309,910 | |
| | | | | |
| Consumer Discretionary — 16.6% | | | | |
| | 3,705 | | Amazon.com, Inc.† | | | 4,332,886 | |
| | 3,500 | | Chipotle Mexican Grill, Inc.† | | | 1,011,605 | |
| | 30,590 | | Las Vegas Sands Corp. | | | 2,125,699 | |
| | 8,190 | | Wynn Resorts, Ltd. | | | 1,380,752 | |
| | | | | | | 8,850,942 | |
| | | | | |
| Energy — 2.9% | | | | |
| | 29,120 | | Continental Resources, Inc.† | | | 1,542,486 | |
| | | | | |
| Financials — 21.8% | | | | |
| | 8,540 | | Alexandria Real Estate Equities, Inc. | | | 1,115,239 | |
| | 4,690 | | BlackRock, Inc. | | | 2,409,300 | |
| | 12,810 | | First Republic Bank | | | 1,109,858 | |
| | 7,135 | | FleetCor Technologies, Inc.† | | | 1,372,988 | |
| | 26,945 | | Intercontinental Exchange, Inc. | | | 1,901,239 | |
| | 25,690 | | Prologis, Inc. | | | 1,657,262 | |
| | 15,465 | | SEI Investments Co. | | | 1,111,315 | |
| | 28,420 | | Square, Inc., Class A† | | | 985,321 | |
| | | | | | | 11,662,522 | |
| | | | | |
| Health Care — 5.5% | | | | |
| | 4,690 | | Regeneron Pharmaceuticals, Inc.† | | | 1,763,252 | |
| | 10,141 | | Universal Health | | | | |
| | | | Services, Inc., Class B | | | 1,149,482 | |
| | | | | | | 2,912,734 | |
| | | | | |
| Industrials — 4.3% | | | | |
| | 9,165 | | FedEx Corp. | | | 2,287,034 | |
| | | | | |
| Technology — 23.9% | | | | |
| | 17,915 | | Akamai Technologies, Inc.† | | | 1,165,192 | |
| | 21,420 | | Cerner Corp.† | | | 1,443,494 | |
| | 3,355 | | CoStar Group, Inc.† | | | 996,267 | |
| | 4,755 | | IPG Photonics Corp.† | | | 1,018,188 | |
| | 14,551 | | Microchip Technology, Inc. | | | 1,278,742 | |
| | 12,245 | | NVIDIA Corp. | | | 2,369,408 | |
| | 20,995 | | Salesforce.com, Inc.† | | | 2,146,319 | |
| | 12,670 | | Synopsys, Inc.† | | | 1,079,991 | |
| | 12,665 | | Workday, Inc., Class A† | | | 1,288,537 | |
| | | | | | | 12,786,138 | |
| Total Common Stocks | | | | |
| (Cost $52,525,979) | | $ | 53,351,766 | |
| Total Investments — 99.9% | | | | |
| (Cost $52,525,979) | | $ | 53,351,766 | |
| Other Assets less Liabilities — 0.1% | | | 50,680 | |
| Net Assets — 100.0% | | $ | 53,402,446 | |
† | Non-income producing security |
(The accompanying notes are an integral part of these Financial Statements)
Semi-Annual Shareholder Report
3
| Statement of Assets and Liabilities | December 31, 2017 (Unaudited) |
| | | ERShares |
| | | Entrepreneur 30 ETF |
| Assets: | | | |
| Investments, at value (Cost $52,525,979) | | $ | 53,351,766 | |
| Cash | | | 55,101 | |
| Dividends and interest receivable | | | 16,450 | |
| Total Assets | | | 53,423,317 | |
| Liabilities: | | | | |
| Accrued expenses: | | | | |
| Management fee | | | 20,871 | |
| Total Liabilities | | | 20,871 | |
| Net Assets | | $ | 53,402,446 | |
| Net Assets consist of: | | | | |
| Capital | | $ | 52,579,050 | |
| Accumulated net investment loss | | | (1,697 | ) |
| Accumulated net realized loss from investment transactions | | | (694 | ) |
| Net unrealized appreciation on investments | | | 825,787 | |
| Net Assets | | $ | 53,402,446 | |
| Net Assets: | | $ | 53,402,446 | |
| Shares of Beneficial Interest Outstanding | | | | |
| (unlimited number of shares authorized, no par value): | | | 3,500,000 | |
| Net Asset Value (offering and redemption price per share): | | $ | 15.26 | |
(The accompanying notes are an integral part of these Financial Statements)
Semi-Annual Shareholder Report
4
| Statement of Operations | For the period ended December 31, 2017 (Unaudited) |
| | | ERShares |
| | | Entrepreneur 30 ETF(a) |
| Investment Income: | | | |
| Dividend income | | $ | 73,713 | |
| Total Investment Income | | | 73,713 | |
| Expenses: | | | | |
| Management fee | | | 31,426 | |
| Total Net Expenses | | | 31,426 | |
| Net Investment Income | | | 42,287 | |
| Realized and Unrealized Gains (Losses) on Investments: | | | | |
| Net realized losses from investment transactions | | | (694 | ) |
| Change in unrealized appreciation on investments | | | 825,787 | |
| Net Realized and Unrealized Gains (Losses) on Investments | | | 825,093 | |
| Change in Net Assets Resulting From Operations | | $ | 867,380 | |
(a) | For the period from the commencement of operations on November 7, 2017 through December 31, 2017. |
(The accompanying notes are an integral part of these Financial Statements)
Semi-Annual Shareholder Report
5
Statement Changes in Net Assets
| | | ERShares | |
| | | Entrepreneur 30 ETF | |
| | | For the period | |
| | | November 7, 2017(a) | |
| | | through | |
| | | December 31, 2017 | |
| From Investment Activities: | | | |
| Operations: | | | |
| Net investment income | | $ | 42,287 | |
| Net realized losses from investment transactions | | | (694 | ) |
| Change in unrealized appreciation on investments | | | 825,787 | |
| Change in net assets resulting from operations | | | 867,380 | |
| Distributions to Shareholders From: | | | | |
| Net investment income | | | (43,984 | ) |
| Change in net assets from distributions | | | (43,984 | ) |
| Capital Transactions: | | | | |
| Proceeds from shares issued | | | 52,579,050 | |
| Change in net assets from capital transactions | | | 52,579,050 | |
| Change in net assets | | | 53,402,446 | |
| Net Assets: | | | | |
| Beginning of period | | | — | |
| End of period | | $ | 53,402,446 | |
| Accumulated undistributed net investment loss | | $ | (1,697 | ) |
| Share Transactions: | | | | |
| Issued | | | 3,500,000 | |
| Change in shares | | | 3,500,000 | |
(a) | Commencement of operations. |
(The accompanying notes are an integral part of these Financial Statements)
Semi-Annual Shareholder Report
6
Financial Highlights
ERShares Entrepreneur 30 ETF
| | | | | | | | | | | | Ratio of | | |
| | | | | | | | | | | | Net | | |
| | | | Net | | | | | | | | Investment | Net | |
| | | | Realized & | | | | | | | Ratio | Income | Assets | |
| | | | Unrealized | | | | Net | | Total | of Net | (Loss) to | at | |
| | Net Asset | | Gains & | Total | Distributions | | Asset | | Return | Expenses | Average | End | |
| | Value, | Net | (Losses) | from | from Net | Total | Value, | Total | at | to Net | Net | of | Portfolio |
| | Beginning | Investment | on | Investment | Investment | Distri- | End of | Return | Market | Assets | Assets | Period | Turnover |
| | of Period | Income | Investments | Activities | Income | butions | Period | (a)(b) | (a)(c) | (d) | (d) | (000’s) | (a) |
November 7, 2017(e) through | | | | | | | | | | | | |
| December 31, 2017 | $14.98 | 0.01 | 0.28 | 0.29 | (0.01) | (0.01) | $15.26 | 1.95% | 2.10% | 0.49% | 0.66% | $53,402 | —%(f) |
(a) | Not annualized for periods less than one year. |
(b) | Net asset value total return is calculated assuming an initial investment made at the net asset value at the beginning of the period, reinvestment of all dividends and distributions at net asset value during the period, if any, and redemption on the last day of the period at net asset value. This percentage is not an indication of the performance of a shareholder’s investment in the Fund based on market value due to differences between the market price of the shares and the net asset value per share of the Fund. |
(c) | Market value total return is calculated assuming an initial investment made at the market value at the beginning of the period, reinvestment of all dividends and distributions at net asset value during the period, if any, and redemption on the last day of the period at market value. Market value is determined by the composite closing price. Composite closing security price is defined as the last reported sale price from any primary listing market (e.g., NYSE Arca) or participating regional exchanges or markets. The composite closing price is the last reported sale price from any of the eligible sources, regardless of volume and not an average price and may have occurred on a date prior to the close of the reporting period. Market value may be greater or less than net asset value, depending on the Fund’s closing price on the listing market. |
(d) | Annualized for periods less than one year. |
(e) | Commencement of operations. |
(f) | Amount less than 0.05%. |
(The accompanying notes are an integral part of these Financial Statements)
Semi-Annual Shareholder Report
7
| Notes to Financial Statements | December 31, 2017 (Unaudited) |
(1) Organization
EntrepreneurShares Series Trust™ (the “Trust”) was organized on July 1, 2010 as a Delaware statutory trust. The Trust is registered under the Investment Company Act of 1940 (the “1940 Act”) as an open-end management investment company and thus is determined to be an investment company for accounting purposes. The Trust is comprised of four funds and is authorized to issue an unlimited number of shares of beneficial interest (“Shares”). The accompanying financial statements are those of the ERShares Entrepreneur 30 ETF (the “Fund”). The Fund is an exchange-traded fund whose investment objective is to seek investment results that correspond (before fees and expenses) to the performance of its underlying index, the Entrepreneur 30 Index. The Fund’s prospectus provides a description the Fund’s investment objectives, policies, and strategies. The assets of the Fund are segregated and a shareholder’s interest is limited to the Fund in which shares are held. The Fund commenced operations on November 7, 2017.
Shares of the Fund are listed and traded on the NYSE Arca. Market prices for the Shares may be different from their net asset value (“NAV”). The Fund issues and redeems Shares on a continuous basis at NAV only in large blocks of Shares, currently 50,000 Shares (“Creation Units”). Creation Units are issued and redeemed principally in-kind for securities included in a specified universe. Once created, Shares generally trade in the secondary market at market prices that change throughout the day in amounts less than a Creation Unit.
Under the Trust’s organizational documents, its officers and Board of Trustees (“the Board”) are indemnified against certain liabilities arising out of the performance of their duties to the Funds. In addition, in the normal course of business, the Trust may enter into contracts with vendors and others that provide for general indemnifications. The Trust’s maximum exposure under these arrangements is unknown, as this would involve future claims that may be made against the Trust. However, based on experience, the Trust expects that risk of loss to be remote.
(2) Significant Accounting Policies
The following is a summary of significant accounting policies consistently followed by the Fund in the preparation of its financial statements. These policies are in conformity with generally accepted accounting principles in the United States of America (“GAAP”). The Fund is an investment company and accordingly follows the investment company accounting and reporting guidance of the Financial Accounting Standards Board (“FASB”) Accounting Standard Codification Topic 946 Financial Services – Investment Companies. The preparation of financial statements in conformity with GAAP requires management to make estimates and assumptions that affect the amounts of assets, liabilities and disclosure of contingent assets and liabilities at the date of the financial statements and the reported amounts of income and expenses for the period. Actual results could differ from those estimates.
A. Investment Valuations
The Fund holds investments at fair value. Fair value is defined as the price that would be expected to be received to sell an asset or paid to transfer a liability in an orderly transaction between market participants at the measurement date. The valuation techniques used to determine fair value are further described below.
Security values are ordinarily obtained through the use of independent pricing services in accordance with procedures adopted by the Trust’s Board. Pursuant to these procedures, the Funds may use a pricing service, bank, or broker-dealer experienced in such matters to value the Fund’s securities. When reliable market quotations are not readily available for any security, the fair value of that security will be determined by a committee established by the Board in accordance with procedures adopted by the Board. The fair valuation process is designed to value the subject security at the price the Fund would reasonably expect to receive upon its current sale. Additional consideration is given to securities that have experienced a decrease in the volume or level of activity or to circumstances that indicate that a transaction is not orderly.
The Trust has a three-tier fair value hierarchy that is dependent upon the various “inputs” used to determine the value of the Fund’s investments. The valuation techniques described below maximize the use of observable inputs and minimize the use of unobservable inputs in determining fair value. These inputs are summarized in the three broad levels listed below:
| | Level 1 – | Quoted prices in active markets for identical assets. |
| | | |
| | Level 2 – | Other observable pricing inputs at the measurement date (including quoted prices for similar securities, interest rates, prepayment speeds, credit risk, etc.). |
| | | |
| | Level 3 – | Significant unobservable pricing inputs at the measurement date (including the Fund’s own assumptions in determining the fair value of investments). |
Semi-Annual Shareholder Report
8
| Notes to Financial Statements (Continued) | December 31, 2017 (Unaudited) |
The inputs or methodology used for valuing investments are not necessarily an indication of the risk associated with investing in those investments.
Equity securities (including foreign equity securities) traded on a securities exchange are valued at the last reported sales price on the principal exchange. Equity securities quoted by NASDAQ are valued at the NASDAQ official closing price. If there is no reported sale on the principal exchange, and in the case of over-the-counter securities, equity securities are valued at a bid price estimated by the security pricing service. In each of these situations, valuations are typically categorized as Level 1 in the fair value hierarchy.
The following table provides the fair value measurement as of December 31, 2017, while the breakdown, by category, of common stocks is disclosed in the Portfolio of Investments for the Fund.
| | Level 1 | Total Investments |
| ERShares Entrepreneur 30 ETF | | |
Common Stocks(1) | $53,351,766 | $53,351,766 |
| Total Investments | $53,351,766 | $53,351,766 |
(1) | Please see the Portfolio of Investments for industry classifications. |
The Trust’s policy is to disclose transfers between fair value hierarchy levels based on valuations at the end of the reporting period. There were no transfers between Levels 1, 2, or 3 for the period ended December 31, 2017. As of December 31, 2017, no securities were categorized as Level 2 or Level 3.
B. Security Transactions and Related Income
Investment transactions are accounted for no later than the first calculation of the net asset value (“NAV”) on the business day following the trade date. For financial reporting purposes, however, security transactions are accounted for on the trade date on the last business day of the reporting period. Discounts and premiums on securities purchased are amortized over the lives of the respective securities. Securities gains and losses are calculated on the identified cost basis. Interest income and expenses are accrued daily. Dividends, less foreign tax withholding, if any, are recorded on the ex-dividend date. Investment income from non-U.S. sources received by a Fund is generally subject to non-U.S. withholding taxes at rates ranging up to 30%. Such withholding taxes may be reduced or eliminated under the terms of applicable U.S. income tax treaties. The Fund may be subject to foreign taxes on gains in investments or currency repatriation. The Fund accrues such taxes, as applicable, based on its current interpretation of tax rules in the foreign markets in which it invests.
C. Cash
Idle cash may be swept into various overnight demand deposits and is classified as cash on the Statement of Assets and Liabilities. The Fund maintains cash in bank deposit accounts which, at times, may exceed United States federally insured limits. Amounts swept overnight are available on the next business day.
D. Dividends and Distributions to Shareholders
The Fund intends to distribute to its shareholders any net investment income and net realized long or short-term capital gains, if any, at least annually. Distributions are recorded on the ex-dividend date. The amount of dividends from net investment income and net realized gains is determined in accordance with federal income tax regulations, which may differ from GAAP. These “book/tax” differences are considered either temporary or permanent in nature. To the extent these differences are permanent in nature (e.g., distributions and income received from pass-through investments), such amounts are reclassified within the capital accounts based on their nature for federal income tax purposes; temporary differences do not require reclassification. Temporary differences are primarily due to return of capital from investments.
E. Allocation of Expenses
Expenses directly attributable to a Fund are charged to that Fund. Expenses not directly attributable to a Fund are allocated proportionally among all Funds within the Trust in relation to the net assets of each Fund or on another reasonable basis.
Semi-Annual Shareholder Report
9
| Notes to Financial Statements (Continued) | December 31, 2017 (Unaudited) |
(3) Investment Advisory and Other Contractual Services
A. Investment Advisory Fees
Capital Impact Advisors, LLC (the “Advisor”) serves as the Fund’s investment advisor pursuant to an Investment Advisory Agreement. Subject at all times to the supervision and approval of the Board, the Advisor is responsible for the overall management of the Trust. The Advisor has arranged for distribution, custody, fund administration, transfer agency and all other services necessary for the Fund to operate. The Advisor receives a fee for its services, computed daily and paid monthly, of 0.49% of the Fund’s average daily net assets. Out of the management fee, the Advisor is obligated to pay or arrange for the payment of substantially all expenses of the Fund, including the cost of transfer agency, custody, fund administration, legal, audit, independent trustees and other services, except for interest expenses, distribution fees or expenses, brokerage expenses, acquired fund fees and expenses, taxes and extraordinary expenses such as litigation and other expenses not incurred in the ordinary course of the Fund’s business. The Advisor’s management fee is designed to cause substantially all of the Fund’s expenses to be paid and to compensate the Advisor for providing services for the Fund.
B. General
Certain officers of the Trust are officers, directors and/or trustees of the above company.
(4) Investment Transactions
Purchases and sales of investments, excluding in-kind transactions and short-term investments, for the period ended December 31, 2017 were as follows:
| | | Purchases | | | Sales | |
| ERShares Entrepreneur 30 ETF | | $ | 62,869 | | | $ | 7,767 | |
Purchases and sales of in-kind transactions for the period ended December 31, 2017 were as follows:
| | | Purchases | | | Sales | |
| ERShares Entrepreneur 30 ETF | | $ | 52,571,553 | | | $ | — | |
(5) Capital Share Transactions
Shares are issued and redeemed by the Fund only in aggregations of a specified number of shares or multiples thereof at net asset value. Except when aggregated in Creation Units, shares of the Fund are not redeemable. Transactions in shares for the Fund are disclosed in detail on the Statements of Changes in Net Assets.
The consideration for the purchase of Creation Units of the Fund generally consists of the in-kind deposit of a designated basket of securities, which constitutes an optimized representation of the securities of that Fund’s specified universe, and an amount of cash. Investors purchasing and redeeming Creation Units may be charged a transaction fee to cover the transfer and other transactional costs it incurs to issue or redeem Creation Units. The standard transaction fee charge is $250.
From time to time, settlement of securities related to subscriptions-in-kind or redemptions-in-kind may be delayed. In such cases, securities related to in-kind contributions are reflected as “Due from custodian” and securities related to in-kind redemptions are reflected as “Securities payable related to in-kind transactions” on the Statements of Assets and Liabilities.
During the period ended December 31, 2017, the Fund received securities in exchange for subscriptions of capital shares (subscriptions-in-kind) as follows:
| | | Fair Value | |
| ERShares Entrepreneur 30 ETF | | $ | 52,571,553 | |
(6) Federal Income Taxes
It is the policy of the Fund to qualify as a regulated investment company by complying with the provisions available to certain investment companies, as defined in applicable sections of the Internal Revenue Code, and to make distributions of net investment income and net realized capital gains sufficient to relieve it from all, or substantially all, federal income taxes.
Semi-Annual Shareholder Report
10
| Notes to Financial Statements (Continued) | December 31, 2017 (Unaudited) |
The Trust has evaluated tax positions taken or expected to be taken in the course of preparing the Fund’s tax returns to determine whether it is more-likely-than not (i.e., greater than 50-percent chance) that each tax position will be sustained upon examination by a taxing authority based on the technical merits of the position. A tax position that meets the more-likely-than-not recognition threshold is measured to determine the amount of benefit to recognize in the financial statements. Differences between tax positions taken in a tax return and amounts recognized in the financial statements will generally result in an increase in a liability for taxes payable (or a reduction of a tax refund receivable), including the recognition of any related interest and penalties as an operating expense. Tax positions taken in tax years remain subject to examination by tax authorities (generally three years plus the interim tax period since then for federal income tax purposes). The determination has been made that there are not any uncertain tax positions that would require the Fund to record a tax liability and, therefore, there is no impact to the Fund’s financial statements.
As of December 31, 2017, the tax cost of securities and the breakdown of unrealized appreciation (depreciation) for the Fund was as follows:
| | | | | Net Unrealized |
| | Tax Cost | Unrealized | Unrealized | Appreciation/ |
| | of Securities | Appreciation | Depreciation | (Depreciation) |
| ERShares Entrepreneur 30 ETF | $52,525,979 | $1,668,077 | $842,290 | $825,787 |
(7) Investment Risks
ETF Risk
The NAV of the Fund can fluctuate up or down, and you could lose money investing in the Fund if the prices of the securities owned by the Fund decline. In addition, the Fund may be subject to the following risks: (1) the market price of the Fund’s shares may trade above or below their NAV; (2) an active trading market for the Fund’s shares may not develop or be maintained; or (3) trading of the Fund’s shares may be halted if the listing exchange’s officials deem such action appropriate, the shares are delisted from the exchange, or the activation of market-wide “circuit breakers” (which are tied to large decreases in stock prices) halts stock trading generally.
(8) Subsequent Events
Management of the Fund has evaluated the need for disclosures and/or adjustments resulting from subsequent events through the date these financial statements were issued. Based upon this evaluation, no additional disclosures or adjustments were required to the financial statements as of December 31, 2017.
Semi-Annual Shareholder Report
11
| Additional Information | December 31, 2017 (Unaudited) |
CONSIDERATION AND APPROVAL OF MANAGEMENT AGREEMENT AND ADVISORY AGREEMENT –
ERShares Entrepreneur 30 ETF
On September 13, 2017, all of the Trustees of EntrepreneurShares Series Trust (the “Trust”) met in person to discuss, among other things, the initial approval of the investment advisory agreement for the ERShares Entrepreneur 30 ETF, between the Trust, on behalf of the ERShares Entrepreneur 30 ETF, and Capital Impact Advisors, LLC (the “Advisor”). The ERShares Entrepreneur 30 ETF was a newly formed fund at the time of the meeting, with no operations as it did not commence operations until November 2017. The Advisor is responsible for management of the investment portfolio of the ERShares Entrepreneur 30 ETF, and for overall management of the ERShares Entrepreneur 30 ETF’s business and affairs pursuant to the investment advisory agreement.
At the meeting, the Trustees had ample opportunity to consider matters they deemed relevant in considering the approval of the investment advisory agreement, and to request any additional information they considered reasonably necessary to their deliberations, without undue time constraints. In addition to the materials requested by the Trustees in connection with their consideration of the approval of the investment advisory agreement, the Trustees received materials regarding the investment advisory and sub-advisory agreements of the other series of the Trust, which supported some of the Trustees’ determination by analogy.
In advance of the meeting, the Advisor sent detailed information to the Trustees to assist them in their evaluation of the investment advisory agreement. This information included, but was not limited to, a memorandum that summarized the legal standards applicable to the Trustees’ consideration of the investment advisory agreement; information regarding the Advisor’s personnel and investment process; information relating to the ERShares Entrepreneur 30 ETF’s proposed management fee and estimated expenses; information on the Advisor’s profitability; financial information about the Advisor; information about the ERShares Entrepreneur 30 ETF’s compliance program; and other information the Trustees believed was useful in evaluating the approval of the investment advisory agreement.
All of the factors discussed by the Trustees were considered as a whole, and were considered separately by the members of the Board of Trustees who are not deemed “interested persons” (as that term is defined by the Investment Company Act of 1940) of the ERShares Entrepreneur 30 ETF (the “Independent Trustees”), meeting in executive session. The factors were viewed in their totality by the Trustees, with no single factor being the principal or determinative factor in the Trustees’ determination of whether to approve the investment advisory agreement.
The material determinations of the Board of Trustees, including all of the Independent Trustees, are described below:
Nature and Quality of Investment Advisory Services
The Trustees concluded that the nature, extent and quality of the investment advisory services to be provided to the ERShares Entrepreneur 30 ETF by the Advisor are good, based on their experience with the Advisor to date, and that the nature and extent of the services to be provided by the Advisor are appropriate to assure that the ERShares Entrepreneur 30 ETF’s operations will be conducted in compliance with applicable laws, rules and regulations. In making these conclusions, the Trustees noted their experience with the services the Advisor provides the Entrepreneur U.S. Small Cap Fund (the “Small Cap Fund”), and the Entrepreneur U.S. Large Cap Fund (the “Large Cap Fund”), both existing series of the Trust, noting that they are pleased with quality of these services. They believe that the following factors, among others, support these conclusions: the Advisor maintains sufficient staff and resources to support the ERShares Entrepreneur 30 ETF, which will allow the Advisor to meet the investment objective of the ERShares Entrepreneur 30 ETF; and the Advisor has engaged service providers to the ERShares Entrepreneur 30 ETF that are experienced in exchange traded funds, and have strong experience in exchange traded products.
Comparative Fees and Expenses
The Trustees discussed the proposed management fee and estimated expenses of the ERShares Entrepreneur 30 ETF, and discussed how they compare to similar exchange traded funds. Based on this discussion, the Trustees determined that the proposed management fee and estimated expenses were within a reasonable range of comparable exchange traded funds. So, the Trustees concluded that the proposed management fee is reasonable.
Comparison of Fee Structures of Other Accounts
The Trustees concluded that the differential in management fees between the ERShares Entrepreneur 30 ETF and the separate accounts managed by the Advisor is reasonable. They believe that the following factors, among others, support this conclusion: the services to be performed by the Advisor for the ERShares Entrepreneur 30 ETF generally require a higher level of service and compliance oversight than the services performed for the separate accounts; the Advisor will provide tailored investment advisory services to the ERShares Entrepreneur 30 ETF in order to accommodate the cash flow volatility that may be presented by the purchases and redemptions of Fund shares.
Semi-Annual Shareholder Report
12
| Additional Information (Continued) | December 31, 2017 (Unaudited) |
Performance
The Trustees noted that the ERShares Entrepreneur 30 ETF has not yet begun operations. By analogy, they examined the positive performance of the Small Cap Fund and the Large Cap Fund, which are advised by the Advisor. While the performance of those Funds is not necessarily comparable to what can be expected for the ERShares Entrepreneur 30 ETF, as the ERShares Entrepreneur 30 ETF is an index fund and an exchange traded fund, the Trustees determined that they believe the Advisor has demonstrated good investment advisory skills, which should benefit the ERShares Entrepreneur 30 ETF and its future shareholders. The Trustees also discussed the index methodology for the Entrepreneur 30 Index with the Advisor, and reviewed the 10-year back- tested performance of the Entrepreneur 30 Index compared to the Russell 1000 Growth Index, which showed outperformance of the Index. While the Trustees understand that past performance does not guarantee future results and that the value of the back-tested performance has limitations, they concluded that they believe the Index has the potential to provide positive performance for the ERShares Entrepreneur 30 ETF’s future shareholders.
Costs and Profitability
The Trustees recognized that it is difficult to make comparisons of profitability from investment advisory contracts. This is because comparative information is not generally publicly available and is affected by numerous factors, including the structure of the particular advisor, the type of clients it advises, its business mix, and numerous assumptions regarding allocations and the advisor’s capital structure and cost of capital. The Trustees concluded that the level of profitability estimated to be realized by the Advisor from its provision of services to the Fund is reasonable, and, as noted above, that the estimated expense ratio and proposed management fee are fair and reasonable. They believe that the following factors, among others, support these conclusions: the Advisor has expended, and has stated that it will expend, significant resources and revenue to manage and distribute the Fund; and the Advisor has demonstrated a willingness to support the growth of the Fund for the foreseeable future.
Economies of Scale
The Trustees concluded that the proposed management fee, which is a “unified fee,” is appropriate given the nature of the ERShares Entrepreneur 30 ETF as an index fund and an exchange traded fund. They noted that the Fund is newly formed, with no operations, and has not realized economies of scale, which further supports the reasonableness of the current management fee.
Fall-Out Benefits
The Trustees concluded that the other benefits that may be realized by the Advisor from its relationship with the ERShares Entrepreneur 30 ETF are reasonable. They believe that the following factors, among others, support this conclusion: while the Advisor may derive ancillary benefits from its association with the Fund in the form of proprietary and third party research products and services received from broker dealers that execute portfolio trades for the Fund, the Trustees determined that based on the past practice of the Advisor such products and services will be used for legitimate purposes; and while managing the Fund may provide more visibility for the Advisor in the industry in general, based on past experience, the primary focus of this visibility will be the Fund, and it is expected it will be beneficial to the Fund.
Conclusion
After reviewing the material provided for the meeting, management’s presentation and related matters and other factors deemed relevant by the Board, the Trustees, including all of the Independent Trustees, concluded that the investment advisory agreement is fair and reasonable and that entering into the investment advisory agreement is in the best interest of the Fund and its future shareholders. Accordingly, the Trustees, including the Independent Trustees voting separately, approved the investment advisory agreement.
AVAILABILITY OF QUARTERLY PORTFOLIO HOLDINGS SCHEDULES(1)
The Funds file complete schedules of portfolio holdings with the SEC for the first and third quarters of each fiscal year on Form N-Q, which is available on the SEC’s website at www.sec.gov. The Funds’ Form N-Q may be reviewed and copied at the SEC’s Public Reference Room in Washington, D.C. For information on the Public Reference Room call 1-800-SEC-0330. In addition, the Funds’ Form N-Q is available without charge, upon request, by calling 1- 877-271-8811.
PROXY VOTING POLICIES AND PROCEDURES AND PROXY VOTING RECORD(1)
A description of the Funds’ proxy voting policies and procedures and information regarding how the Funds voted proxies relating to portfolio securities during the most recent 12 month period ended June 30, is available (1) without charge, upon request, by calling 1-877-271-8811, and (2) on the SEC’s website at www.sec.gov.
(1) | Because the Fund began on November 7, 2017, these items as disclosed will become available in future periods. |
Semi-Annual Shareholder Report
13
Privacy Policy
As part of the EntrepreneurShares Series Trust fund family long tradition of trust, the confidentiality of personal information is paramount. We maintain high standards to safeguard your personal information. We will remain vigilant and professional in protecting that information and in using it in a fair and lawful manner. As part of this commitment to fulfilling your trust we have formulated this Privacy Policy.
Safeguarding Customer Information and Documents
To conduct regular business, we may collect nonpublic personal information from sources such as:
| | • | Account Applications and other forms, which may include a customer’s name, address, social security number, and information about a customer’s investment goals and risk tolerances; |
| | | |
| | • | Account History, including information about the transactions and balances in a customer’s account; and |
| | | |
| | • | Correspondence, written, telephonic, or electronic between a customer and Capital Impact Advisors and/or EntrepreneurShares, or service providers to Capital Impact Advisors and/or EntrepreneurShares. |
To conduct regular business we collect non-public customer data in checklists, forms, in written notations, and in documentation provided to us by our customers for evaluation, registration, licensing or related consulting services. We also create internal lists of such data.
EntrepreneurShares will internally safeguard your nonpublic personal information by restricting access to only those employees who provide products or services to you or those who need access to your information to service your account. In addition, we will maintain physical, electronic and procedural safeguards that meet federal and/or state standards to guard your nonpublic personal information. Failure to observe EntrepreneurShares’ procedures regarding customer and consumer privacy will result in discipline and may lead to termination.
Sharing Nonpublic Personal and Financial Information
As the Firm shares nonpublic information solely to service our client accounts, we do not disclose any nonpublic personal information about our customers or former customers to anyone, except as permitted by law or otherwise disclosed herein.
EntrepreneurShares is committed to the privacy and protection of our customers’ personal and financial information. We will not share any such information with any affiliated or nonaffiliated third party except:
| | • | When necessary to complete transactions in a customer account, such as clearing firm. |
| | • | When required to service and/or maintain your account. |
| | • | In order to resolve a customer dispute or inquiry. |
| | • | With persons acting in a fiduciary or representative capacity on behalf of the customer. |
| | • | With rating agencies, persons assessing compliance with industry standards, or to the attorneys, accountants and auditors of the firm. |
| | • | In connection with any sale and / or merger of EntrepreneurShares’ business. |
| | • | To prevent or protect against actual or potential fraud, identity theft, unauthorized transactions, claims or other liability. |
| | • | To comply with all federal, state or local laws, rules, statutes and other applicable legal requirements |
| | • | In connection with a written agreement to provide advisory services or investment management when the information is released solely for the purpose of providing products or services covered by pursuant to the EntrepreneurShares Wrap Fee Program. |
| | • | Upon the customers specific instruction, consent or request. |
Note: When we share your nonpublic information with any third party for the reasons stated above, we make certain that there are written restrictions in place regarding the use and/or disclosure of said information.
Opt-Out Provisions
It is not a policy of EntrepreneurShares to share nonpublic personal and financial information with affiliated or unaffiliated third parties except under the circumstances noted above. Since sharing under the circumstances noted above is necessary to service customer accounts or is mandated by law, there are no allowances made for clients to opt out.
Semi-Annual Shareholder Report
14
(This Page Intentionally Left Blank.)
ERShares Entrepreneur 30 ETF Advisor
Capital Impact Advisors, LLC
175 Federal Street, Suite #875
Boston, MA 02110
Entrepreneur 30 Index Sponsor
EntrepreneurShares LLC
175 Federal Street, Suite #875
Boston, MA 02110
Independent Registered Public Accounting Firm
RSM US LLP
80 City Square
Boston, MA 02129
Custodian
Citibank, N.A.
111 Wall Street
New York, NY 10005
Distributor
Foreside Fund Services, LLC
Three Canal Plaza, Suite 100
Portland, ME 04101
Administrator, Accountant, Transfer Agent And Dividend Disbursing Agent
Citi Fund Services Ohio, Inc.
4400 Easton Commons, Suite 200
Columbus, OH 43219
Counsel
Foley & Lardner LLP
777 East Wisconsin Avenue
Milwaukee, WI 53202
This report should be accompanied or preceded by a prospectus.
The Funds’ Statement of Additional Information contains additional information about the
Funds’ trustees and is available without charge upon request by calling 1-877-271-8811.