UNITED STATES
SECURITIES AND EXCHANGE COMMISSION
Washington, D.C. 20549
FORM 10-K
| (Mark One) | |
| x | ANNUAL REPORT PURSUANT TO SECTION 13 OR 15(d) OF THE SECURITIES EXCHANGE ACT OF 1934 |
| For the fiscal year ended December 31, 2012 OR | |
| o | TRANSITION REPORT PURSUANT TO SECTION 13 OR 15(d) OF THE SECURITIES EXCHANGE ACT OF 1934 |
| For the transition period from ____ to ____ | |
Commission file number 001-35009
Fortegra Financial Corporation
(Exact name of Registrant as specified in its charter)
| Delaware | 58-1461399 | |
| (State or other jurisdiction of incorporation or organization) | (I.R.S. Employer Identification No.) | |
| 10151 Deerwood Park Boulevard, Building 100, Suite 330, Jacksonville, FL | 32256 | |
| (Address of principal executive offices) | (Zip Code) | |
| Registrant's telephone number, including area code: | (866)-961-9529 | |
| Securities registered pursuant to Section 12(b) of the Act: | ||
| Title of each class | Name of each exchange on which registered | |
| Common Stock, $0.01 par value per share | New York Stock Exchange | |
Securities registered pursuant to Section 12(g) of the Act: None | ||
Indicate by check mark if the registrant is a well-known seasoned issuer, as defined in Rule 405 of the Securities Act. Yes o No x
Indicate by check mark if the registrant is not required to file reports pursuant to Section 13 or Section 15(d) of the Exchange Act. Yes o No x
Note - Checking the box above will not relieve any registrant required to file reports pursuant to Section 13 or 15(d) of the Exchange Act from their obligations under those Sections.
Indicate by check mark whether the Registrant (1) has filed all reports required to be filed by Section 13 or 15(d) of the Securities Exchange Act of 1934 during the preceding 12 months (or for such shorter period that the Registrant was required to file such reports), and (2) has been subject to such filing requirements for the past 90 days. Yes x No o
Indicate by check mark whether the registrant has submitted electronically and posted on its corporate Web site, if any, every Interactive Data File required to be submitted and posted pursuant to Rule 405 of Regulation S-T (§232.405 of this chapter) during the preceding 12 months (or for such shorter period that the registrant was required to submit and post such files). Yes x No o
Indicate by check mark if disclosure of delinquent filers pursuant to Item 405 of Regulation S-K (§ 229.405 of this chapter) is not contained herein, and will not be contained, to the best of Registrant's knowledge, in definitive proxy or information statements incorporated by reference in Part III of this Form 10-K or any amendment to this Form 10-K. o
Indicate by check mark whether the registrant is a large accelerated filer, an accelerated filer, a non-accelerated filer, or a smaller reporting company. See the definitions of "large accelerated filer," "accelerated filer" and "smaller reporting company" in Rule 12b-2 of the Exchange Act.
Large accelerated filer o Accelerated filer o
Non-accelerated filer x (Do not check if a smaller reporting company) Smaller reporting company o
Indicate by check mark whether the registrant is a shell company (as defined in Rule 12b-2 of the Exchange Act). Yes o No x
The aggregate market value of the voting common equity held by non-affiliates of the registrant was $53,422,712 at June 29, 2012 (last day of the registrant's most recently completed second quarter) based on the closing sale price of $8.00 per share for the common stock on such date as traded on the New York Stock Exchange.
The number of outstanding shares of the registrant's Common Stock, $0.01 par value, outstanding as of March 14, 2013 was 19,831,697.
Documents Incorporated by Reference
Certain specifically designated portions of Fortegra Financial Corporation's definitive proxy statement for its 2013 Annual meeting of Stockholders (the "Proxy Statement"), which will be filed on or prior to 120 days following the end of Fortegra Financial Corporation's fiscal year ended December 31, 2012, are incorporated by reference into Parts III and IV of this Form 10-K.
FORTEGRA FINANCIAL CORPORATION
ANNUAL REPORT ON FORM 10-K
DECEMBER 31, 2012
TABLE OF CONTENTS
| Page Number | ||
| Item 1. | ||
| Item 1A. | ||
| Item 1B. | ||
| Item 2. | ||
| Item 3. | ||
| Item 4. | Mine Safety Disclosures | |
| Executive Officers of the Registrant | ||
| Item 5. | ||
| Item 6. | ||
| Item 7. | ||
| Item 7A. | ||
| Item 8. | ||
| Item 9. | ||
| Item 9A. | ||
| Item 9B. | ||
| Item 10. | ||
| Item 11. | ||
| Item 12. | ||
| Item 13. | ||
| Item 14. | ||
| Item 15. | ||
1
EXPLANATORY STATEMENT REGARDING RESTATEMENT
In this Annual Report on Form 10-K ("Form 10-K"), the terms "Fortegra Financial," "Fortegra," "we," "us," "our," "the Company" or similar terms refer to Fortegra Financial Corporation and its subsidiaries unless the context requires otherwise.
This Form 10-K is for our year ended December 31, 2012, and restates the following previously issued Consolidated Financial Statements, data and related disclosures:
| 1. | Our Consolidated Balance Sheet as of December 31, 2011, and the related Consolidated Statements of Income, Comprehensive Income, Stockholders' Equity and Cash Flows for the years ended December 31, 2011 and 2010, located in Part II, Item 8 of this Form 10-K; |
| 2. | Our selected financial data as of and for the years ended December 31, 2011, and 2010, located in Part II, Item 6 of this Form 10-K; |
| 3. | Our management's discussion and analysis of financial condition and results of operations as of and for the years ended December 31, 2011 and 2010, located in Part II, Item 7 of this Form 10-K; |
| 4. | Our unaudited quarterly financial information for the quarterly periods ended March, 31 2012, June 30, 2012 and September 30, 2012 and for the quarterly periods ended March 31, June 30, September 30, and December 31, 2011 and 2010, respectively, located in the Note, "Summarized Quarterly Information (Unaudited)," the Note, " Quarterly Information - Restated (Unaudited)" and the Note, "Quarterly Segment Results - Restated (Unaudited)," of the Notes to Consolidated Financial Statements in Part II, Item 8 of this Form 10-K; and |
| 5. | Our management's discussion and analysis of financial condition and results of operations for the quarterly periods ended March 31, June 30, and September 30, 2010, 2011 and 2012, respectively, located in Part II, Item 7 of this Form 10-K. |
We are restating the previously issued Consolidated Financial Statements, data and related disclosures described above to correct the presentation of revenues and expenses of the Motor Clubs division in our Payment Protection segment. As discussed in the Note, "Restatement of the Consolidated Financial Statements," the Company performed an analysis and determined that, under the guidance in Accounting Standards Codification 605, "Revenue Recognition," our revenues for service and administrative fees generated by the Motor Clubs division should be reported on a gross basis with the corresponding gross reporting of member benefit claims and commission expenses. Historically, these revenues and expenses were presented on a combined net basis in service and administrative fees on the Consolidated Statements of Income. The effect of this correction does not impact our net income, basic or diluted earnings per share amounts, comprehensive income or loss, net cash provided by operating activities or stockholders' equity for the affected periods. We also corrected immaterial errors in revenue recognition, purchase accounting and cash flows, as also discussed in the Note, "Restatement of the Consolidated Financial Statements".
The financial information for the periods indicated above that are included in the Company's Annual Reports on Form 10-K, Quarterly Reports on Form 10-Q, Current Reports on Form 8-K, and earnings, press releases and similar communications issued prior to the filing of this Form 10-K should not be relied on and are superseded by this Form 10-K.
2
PART I
Unless the context requires otherwise, references in this Annual Report on Form 10-K ("Form 10-K") to "Fortegra Financial," "Fortegra," "we," "us," "the Company" or similar terms refer to Fortegra Financial Corporation and its subsidiaries.
FORWARD-LOOKING STATEMENTS
This Form 10-K contains forward-looking statements within the meaning of Section 27A of the Securities Act of 1933, as amended (the "Securities Act"), and Section 21E of the Securities Exchange Act of 1934, as amended (the "Exchange Act"), which are made in reliance upon the protection provided by such act for forward-looking statements. Such statements are subject to risks and uncertainties. All statements other than statements of historical fact included in this Form 10-K are forward-looking statements. Forward-looking statements give our current expectations and projections relating to our financial condition, results of operations, plans, objectives, future performance and business. You can identify forward-looking statements by the fact that they do not relate strictly to historical or current facts. These statements may include words such as "anticipate," "estimate," "expect," "project,'' "plan," "intend," "believe," "may," "should," "can have," "will," "likely" and other words and terms of similar meaning in connection with any discussion of the timing or nature of future operating results or financial performance or other events.
The forward-looking statements contained in this Form 10-K are based on assumptions that we have made in light of our industry experience and our perceptions of historical trends, current conditions, expected future developments and other factors we believe are appropriate under the circumstances. As you read this Form 10-K, you should understand that these statements are not guarantees of performance or results. They involve risks, uncertainties (some of which are beyond our control) and assumptions. Although we believe that these forward-looking statements are based on reasonable assumptions, you should be aware that many factors could affect our actual financial results and cause them to differ materially from those anticipated in the forward-looking statements. We believe these factors include, but are not limited to, those described under PART I, ITEM 1A. RISK FACTORS and PART II, ITEM 7. MANAGEMENT'S DISCUSSION AND ANALYSIS OF FINANCIAL CONDITION AND RESULTS OF OPERATIONS. Should one or more of these risks or uncertainties materialize, or should any of these assumptions prove incorrect, our actual results may vary materially from those projected in these forward-looking statements.
Any forward-looking statement made by us in this Form 10-K speaks only as of the date on which we make it. Factors or events that could cause our actual results to differ may emerge from time to time, and it is not possible for us to predict all of them. We undertake no obligation to publicly update any forward-looking statement, whether as a result of new information, future developments or otherwise, except as may be required by law.
ITEM 1. BUSINESS
Corporate Overview
Fortegra Financial Corporation is an insurance services company that provides distribution and administration services to insurance companies, insurance brokers and agents and other financial services companies primarily in the United States. We were incorporated in 1981 in the State of Georgia and in 2010 we re-incorporated in the State of Delaware. We sell our services and products principally through clients rather than directly to consumers. We initially provided credit life and disability insurance for financial institutions, primarily small community banks in Georgia, and their customers under our Life of the South brand. In 2008, we changed our name from Life of the South Corporation to Fortegra Financial Corporation. Most of our business is generated through networks of small to mid-sized community and regional banks, small loan companies and automobile dealerships. Our majority-owned and controlled subsidiaries, are as follows:
| • | LOTS Intermediate Co. ("LOTS IM") |
| • | Bliss and Glennon, Inc. ("B&G") |
| • | CRC Reassurance Company, Ltd. ("CRC") |
| • | Insurance Company of the South ("ICOTS") |
| • | Life of the South Insurance Company ("LOTS") and its subsidiary, Bankers Life of Louisiana ("Bankers Life") |
| • | LOTS Reassurance Company ("LOTS RE") |
| • | LOTSolutions, Inc. |
| • | Lyndon Southern Insurance Company ("Lyndon Southern") |
| • | Southern Financial Life Insurance Company ("SFLAC"), 85% owned |
| • | South Bay Acceptance Corporation ("South Bay") |
| • | Continental Car Club, Inc. ("Continental") |
| • | United Motor Club of America, Inc. ("United") |
| • | Auto Knight Motor Club, Inc. ("Auto Knight") |
| • | eReinsure.com, Inc. ("eReinsure") |
| • | Pacific Benefits Group Northwest, LLC ("PBG") |
| • | Magna Insurance Company ("Magna") |
3
| • | Digital Leash, LLC, d/b/a ProtectCELL ("ProtectCELL"), 62.4% owned |
| • | 4Warranty Corporation ("4Warranty") |
In June 2007, entities affiliated with Summit Partners, a growth equity investment firm, acquired 91.2% of our capital stock. The acquisition was financed through (i) $20.0 million of subordinated debentures maturing in 2013 issued to affiliates of Summit Partners, (ii) $35.0 million of preferred trust securities maturing in 2037 and (iii) an equity investment of $43.1 million by affiliates of Summit Partners. In connection with the acquisition, all of our $11.5 million of redeemable preferred stock outstanding prior to the acquisition remained outstanding and certain stockholders prior to the acquisition continued to hold such shares after the acquisition. In addition to acquiring our capital stock in the acquisition, the proceeds from the equity and debt financings were used to repay pre-transaction indebtedness of $10.1 million and pay transaction costs of $5.8 million. We refer to the foregoing transactions collectively as the "Summit Partners Transactions." In April 2009, in connection with our acquisition of Bliss and Glennon, Inc., affiliates of Summit Partners acquired additional shares of our common stock for $6.0 million.
On December 17, 2010, we completed our initial public offering (the "IPO") and began trading on the New York Stock Exchange ("NYSE") under the symbol "FRF". In conjunction with our IPO we issued 6,000,000 shares of common stock at an IPO price of $11.00 per share, of which 4,265,637 shares were sold by us and 1,734,363 shares were sold by selling stockholders. In connection with the IPO, Summit Partners sold 1,548,675 common shares of stock. At December 31, 2012, affiliates of Summit Partners beneficially owned approximately 63.2% of our common stock. At December 31, 2012, we had 20,710,370 shares of common stock outstanding.
Business Overview
We began over 30 years ago as a provider of credit insurance products and, through our transformational efforts, have evolved into a diversified insurance services company. From 1994 to 2003, through a series of strategic acquisitions and organic growth, we expanded our payment protection client (or producer) base to include consumer finance companies, retailers, automobile dealers, credit card issuers, credit unions and regional and community banks throughout the United States. During this period, we expanded our product and service offerings to include credit property, debt cancellation and warranty products.
We now leverage our proprietary technology infrastructure, internally developed best practices and access to specialty insurance markets to provide our clients with distribution and administration services and insurance-related products. Our services and products complement consumer credit offerings, provide outsourcing solutions designed to reduce the costs associated with the administration of insurance and other financial products and facilitate the distribution of excess and surplus lines insurance products through insurance companies, brokers and agents. These services and products are designed to increase revenues, improve customer value and loyalty and reduce costs for our clients.
We generally target market segments that are niche and specialty in nature, which we believe are underserved by competitors and have high barriers to entry. We focus on building quality client relationships and emphasizing customer service. This focus, along with our ability to help clients enhance revenue and reduce costs, has enabled us to develop and maintain numerous long-term client relationships. Over 80% of our clients have been with us for more than five years.
Our fee-driven revenue model is focused on delivering a high volume of recurring transactions through our clients and producing attractive profit margins and operating cash flows. Historically, our business has grown both organically and through acquisitions of complementary businesses. For the year ended December 31, 2012, our total revenues increased 3.6% or $10.1 million to $291.6 million from $281.6 million, for the year ended December 31, 2011, which includes the impact of the restatement and the immaterial correction of a prior period error as discussed in the Note, "Restatement of the Consolidated Financial Statements," of the Notes to Consolidated Financial Statements. Our net income was $15.2 million for the year ended December 31, 2012 compared to $13.5 million for the year ended December 31, 2011. Our adjusted earnings before interest expense, taxes, non-controlling interest, depreciation and amortization ("Adjusted EBITDA") totaled $40.6 million and $39.3 million for the years ended December 31, 2012 and 2011, respectively. See the section titled "Results of Operations - Segments" included in Item 7 of this Annual Report for more information and a Reconciliation of Adjusted EBITDA.
Financial Information About Our Business Segments
Financial information with respect to our business segments, including revenue, and operating income or loss with respect to our operations outside the United States, is contained in the Note, "Segment Results" in the Notes to Consolidated Financial Statements and is incorporated herein by reference.
Our Business Segments
Fortegra operates in three business segments: (i) Payment Protection, (ii) Business Process Outsourcing ("BPO") and (iii) Brokerage. Payment Protection specializes in protecting lenders and their consumers from death, disability or other events that could otherwise impair their ability to repay a debt and also offers warranty and service contracts for mobile handsets, furniture and major appliances, and motor club solutions to consumers. BPO provides an assortment of administrative services tailored to insurance and other financial services companies through a virtual insurance company platform. Brokerage uses a pure wholesale sell-through model to sell specialty
4
casualty and surplus lines insurance and also provides web-hosted applications used by insurers, reinsurers and reinsurance brokers for the global reinsurance market.
In each segment, we deliver services and products that generate incremental revenues and utilize technology to reduce operating costs. Our businesses benefit from efficiencies by sharing accounting, compliance, legal, technology, human resources and administrative services. Please see the Note, "Segment Results," in the Notes to the Consolidated Financial Statements included in Item 8 of this Form 10-K for additional information.
Payment Protection
Our Payment Protection segment, marketed under our Life of the South, ProtectCELL, 4Warranty, Continental Car Club, United Motor Club and Auto Knight Motor Club brands, delivers credit insurance, debt protection, warranty and service contracts, motor club solutions and membership plans to consumer finance companies, regional banks, community banks, retailers, small loan companies, warranty administrators, automobile dealers, vacation ownership developers, credit unions and independent wireless retailers. Our clients then offer these products to their customers in conjunction with consumer transactions.
We own and operate insurance company subsidiaries to facilitate, on behalf of our Payment Protection clients, the distribution of credit insurance and payment protection services and products. This allows our clients to sell these services and products to their customers without having to establish their own insurance companies, which saves our clients the cost and time of undertaking and complying with substantial regulatory and licensing requirements. Our clients typically retain underwriting risk related to such products either through retrospective commission arrangements or fully-collateralized reinsurance companies owned by them, which we administer on their behalf. While the majority of our Payment Protection revenue is fee-based, we assume insurance underwriting risk in select instances to meet clients' needs and to enhance our profitability. In addition, our insurance company's subsidiaries issue contractual liability policies to warranty companies and service providers in relation to warranty and service contracts.
Our Payment Protection business generates service and administrative fees for distributing and administering payment protection products on behalf of our clients. We also earn ceding commissions in our Payment Protection business for credit insurance that we cede to reinsurers through coinsurance arrangements. We elect to cede to reinsurers a significant portion of the credit insurance that we distribute to participate in the underwriting profits of these products and to maximize our return on capital. Our Payment Protection business also generates net investment income from our invested assets portfolio.
BPO
Our BPO segment, marketed under the Consecta and Pacific Benefits Group Northwest, LLC brands, provides a broad range of administrative services tailored to insurance and other financial services companies. Our BPO business is one of our most technology-driven segments. Through our operating platform, which utilizes our proprietary technology, we provide sales and marketing, electronic underwriting, premium billing and collections, policy administration, claims adjudication and call center management services on behalf of our clients. In addition our BPO segment markets and sells health, accident, critical illness and life insurance policies to customers in the U.S.
Our proprietary administrative technology platform allows our clients to outsource the fixed costs and complexity associated with internal development and ongoing administration of insurance products at a lower cost than if our client performs these functions on its own. In addition, the scalability of our operating platform allows us to add new clients or additional services for clients without incurring significant incremental costs.
Our BPO business generates service and administrative fees and other income under per-unit priced contracts. Service and administrative fees for our BPO business are based on the complexity and volume of business that we manage on behalf of our clients. We do not take any insurance underwriting risk in our BPO business.
Brokerage
Our Brokerage segment is marketed under our Bliss & Glennon, eReinsure.com, Inc. and South Bay Acceptance Corporation brands. We acquired eReinsure in March 2011, which allows us to broaden our relationships with major insurers, reinsurers and brokers worldwide who use the eReinsure system to assist in the management of facultative reinsurance transactions. Bliss & Glennon, acquired in April 2009, is one of the largest surplus lines brokers in California according to the Surplus Line Association of California, and ranked in the top 10 wholesale brokers in the United States in 2012 by premium volume according to Business Insurance, an industry publication.
The Brokerage segment uses a wholesale model to sell specialty property and casualty ("P&C") and surplus lines insurance through retail insurance brokers and agents and insurance companies, as well as the placement of reinsurance risks on reinsurers. We believe that our emphasis on customer service, rapid responsiveness to submissions and underwriting integrity in this segment has resulted in high customer satisfaction among retail insurance brokers and agents and insurance companies.
5
Our Brokerage business provides retail insurance brokers and agents and insurance companies the ability to obtain various types of commercial insurance coverages outside of their core areas of focus, broader access to insurance markets and the expertise to place complex risks. We also provide underwriting services for ancillary or niche insurance products as a managing general agent ("MGA") for specialized insurance carriers. We believe that insurance carriers value their relationship with us because we provide them with access to new markets without the need for costly distribution infrastructure. Our Brokerage business also utilizes our technology platform to provide its clients with administrative services, including policy underwriting, premium and claim administration and actuarial analysis. Through South Bay we finance premiums on insurance and insurance-related products.
Our Brokerage business earns wholesale brokerage commissions and fees for the placement of specialty insurance products. We also earn profit commissions which we receive from carriers based upon the ultimate profitability of the insurance policies that we place with those carriers. We do not take any insurance underwriting risk in our Brokerage business. Our Brokerage segment also derives fees from master license agreements to use the eReinsure system together with fees for the transactions completed through its platform.
Recent Business Acquisitions and Dispositions
One of the main drivers of our success has been growth from business acquisitions. Our 2012 and 2011 acquisitions are detailed below:
Acquisitions in 2012
On December 31, 2012, we acquired a 62.4% ownership interest in Digital Leash, LLC, d/b/a ProtectCELL and an option to purchase the remaining 37.6% ownership interest in ProtectCELL after 2014. ProtectCELL provides membership plans that afford protection for mobile wireless devices and other benefits including data management and identity theft protection. ProtectCELL is one of the leaders in mobile device protection plans and will spearhead Fortegra's efforts to expand its warranty and service contract business in the mobile and wireless device space.
On December 31, 2012, we acquired 100% of the outstanding stock ownership of 4Warranty Corporation, a leading warranty and extended service contract administrator with extensive expertise in furniture, electronics, appliance, lawn and garden, and fitness equipment extended service contracts. 4Warranty complements the Company's rapidly expanding warranty business within its Payment Protection segment.
On April 24, 2012, we acquired a 100% ownership interest in MHA & Associates LLC, for $0.3 million, obtaining the renewal rights of the business and hiring the prior owner to maintain and increase the block of business.
Acquisitions in 2011
In January 2011, the Company acquired 100% of the outstanding stock ownership of Auto Knight Motor Club, Inc., of Palm Springs, CA. Auto Knight provides motor club memberships, vehicle service plans and tire and wheel programs, which are offered by automobile and truck dealerships and retailers in the United States and Canada. The acquisition expands the Company's geographic reach to Canada, where Auto Knight offers its products through retailers as a subscription benefit.
In March 2011, the Company acquired 100% of the outstanding stock ownership of eReinsure.com, Inc.. eReinsure provides web-hosted applications for the reinsurance market by leveraging Internet technologies in application architecture, network communication and information delivery to facilitate reinsurance transactions.
In October 2011, the Company acquired Pacific Benefits Group Northwest, LLC, a leading U.S. independent insurance agency. PBG markets and sells health, accident, critical illness and life insurance policies. PBG is headquartered in Beaverton, OR and is licensed as an agent in 42 states.
Effective December 1, 2011, the Company's Payment Protection subsidiary, Life of the South Insurance Co., entered into an assumption reinsurance transaction with Magna Insurance Company in which LOTS assumed all the outstanding liabilities for insurance policies underwritten by Magna, including its credit, annuity and mortgage life policies. The value of the insurance liabilities assumed, net of reinsurance was approximately $11.3 million. These policies are running off and no new policies are being underwritten.
Effective December 29, 2011, the Company acquired Magna from Hancock Holding Company. Magna does not have any ongoing insurance business, but does have twelve State Certificates of Authority, which are redundant with certificates held by other Fortegra subsidiaries.
We historically have used a combination of borrowings under our credit facilities and cash on hand to pay the purchase price of our acquisitions. The following table summarizes our acquisition activity for the year ended:
6
| (in thousands, except number of acquisitions closed) | December 31, 2012 | ||
| Number of acquisitions closed | 3 | ||
| Total cash consideration | $ | 23,166 | |
Market Opportunity
We operate in the insurance, consumer finance and commercial finance industries principally in the United States, offering our services and products through the brands and distribution bases of our clients. We believe that we are well positioned to capitalize on the following key industry trends:
Financial Performance of Financial Services Companies and Retailers. Financial services companies and retailers offer complementary services and products, including payment protection and insurance-related services and products, which we believe increase their revenues, enhance customer value and loyalty and improve their profitability.
Growth of Outsourcing in the Insurance Industry. By outsourcing business functions that can be more efficiently and cost effectively provided by specialized service providers, we believe that insurance companies can increase productivity, focus on core competencies and reduce operating costs.
Growth of the Specialty P&C Insurance Market. We believe the market for specialty P&C insurance products has grown as a result of increased acceptance of these products by insured parties and the development of new risk management products by insurance carriers. Insurance carriers operating in the surplus lines market generally distribute their products through wholesale insurance brokers, such as Bliss & Glennon.
Our Competitive Strengths
We believe the following to be the key strengths of our business model:
Strong Value Proposition for Our Clients and Their Customers. Our solutions manage the essential aspects of insurance distribution and administration, providing low-cost access to complex, often highly-regulated markets, which we believe enables our clients to generate high-margin, incremental revenues, enter new markets, mitigate risk, improve operating efficiencies and enhance customer loyalty.
Proprietary Technology and Low-Cost Operating Platform. Our proprietary technology delivers low-cost, highly automated services to our clients without significant up-front investments and enables us to automate core business processes and reduce our clients' operating costs.
Scalability. We believe that our scalable and flexible technology infrastructure, together with our highly trained and knowledgeable information technology personnel and consultants, enables us to add new clients and launch new services and products and expand our transaction volume quickly and easily without significant incremental expense.
High Barriers to Entry. We believe that each of our businesses would be time consuming and expensive for new market participants to replicate due to the barriers to entry provided by our long-term relationships with clients and other market participants and substantial experience in the markets that we serve.
Experienced Management Team. We have an experienced management team with extensive operating and industry experience in the markets that we serve. Our management team has successfully developed profitable new services and products and completed the acquisition of thirteen complementary businesses since January 1, 2008.
While we believe these strengths will enable us to compete effectively, there are various risk factors that could materially and adversely affect our competitive position. See ITEM 1A. RISK FACTORS, for a discussion on these factors.
Key Attributes of Our Business Model
We believe the following are the key attributes of our business model:
Recurring Revenue Generation. Our business model, which includes the deployment of our technology with many of our clients, has historically generated substantial recurring revenues, high profit margins and significant operating cash flows.
Long-Term Relationships. By delivering value-added services and products to our clients' customers, and offering fixed-term contracts, we become an important part of our clients' businesses and develop long-term relationships.
Wholesale Distribution. We provide most of our services and products to businesses on a wholesale basis enabling our clients to enhance their customer relationships and allowing us to take advantage of economies of scale.
7
Business Diversification. Our businesses and results of operations are highly diversified within the financial services industry and among retailers, which positions us to take better advantage of emerging industry trends and to better manage business and insurance cycles than companies that operate in only one sector of the financial services industry.
Our Growth Strategy
We believe the following are the key contributors to our growth strategy:
Provide High Value Solutions. We continue to enhance our technologies and processes and focus on integrating our operations with those of our clients in order to provide our clients with services and products that will allow them to generate incremental revenues while reducing the costs of providing insurance and other financial products.
Increase Revenue from Our Existing Clients. We will seek to leverage our long-standing relationships with our existing clients by providing them with additional services and products, introducing new services and products for them to market to their customers and establishing volume-based fee arrangements.
Expand Client Base in Existing Markets. We intend to take advantage of business opportunities to develop new client relationships through our direct sales force, from referrals from existing clients and business partners, by responding to requests for proposals and through our participation in industry events.
Enter New Geographic Markets. We will look to expand our market presence in new geographic markets in the United States and internationally by broadening the jurisdictions in which we operate, hiring new employees, opening new offices, seeking additional licenses and regulatory approvals and pursuing acquisition opportunities.
Pursue Strategic Acquisitions. We plan to continue pursuing acquisitions of complementary businesses to expand our service offerings, access new markets and expand our client base.
Competition
Our businesses focus on niche segments within broader insurance markets. While we face competition in each of our businesses, we believe that no single competitor competes against us in all of our segments and the markets in which we operate are generally characterized by a limited number of competitors. Competition in our operating segments is based on many factors, including price, industry knowledge, quality of client service, the effectiveness of our sales force, technology platforms and processes, the security and integrity of our information systems, the financial strength ratings of our insurance subsidiaries, office locations, breadth of products and services and brand recognition and reputation. Some competitors may offer a broader array of services and products, may have a greater diversity of distribution resources, may have a better brand recognition, may have lower cost structures or, with respect to insurers, may have higher financial strength or claims paying ratings. Some competitors also have larger client bases than we do. In addition, new competitors could enter our markets in the future. The relative importance of these factors varies by product and market. The competitive landscape for each of our business segments is described below.
In our Payment Protection business, we compete with insurance companies, financial institutions and other insurance service providers. The principal competitors for our Payment Protection business include the payment protection groups of The Warranty Group, Assurant, Inc., Asurion Corporation and smaller regional companies. As a result of state and federal regulatory developments and changes in prior years, certain financial institutions are able to offer debt cancellation plans and are also able to affiliate with other insurance companies in order to offer services similar to those in our Payment Protection business. As financial institutions gain experience with payment protection programs, their reliance on our services and products may diminish. ProtectCELL principally serves independent wireless retailers. Competitors offering similar products and services to ProtectCELL include eSecuritel Holdings, LLC, Asurion, LLC and Global Warranty Group, LLC.
Our BPO business competes with a variety of companies, including large multinational firms that provide consulting, technology and/or business process services, off-shore business process service providers in low-cost locations like India, and in-house captive insurance companies of potential clients. Our principal business process outsourcing competitors include Aon Corporation, Computer Sciences Corporation, Direct Response Insurance Administrative Services, Inc., Marsh & McLennan Companies, Inc., Dell Services and Unisys Corporation. The trend toward outsourcing and technological changes may also result in new and different competitors entering our markets. There could also be newer competitors with strong competitive positions as a result of strategic consolidation of smaller competitors or of companies that each provide different services or serve different industries. In addition, a client or potential client may choose not to outsource its business, including by setting up captive outsourcing operations or by performing formerly outsourced services themselves.
Our Brokerage business competes with numerous firms for retail insurance clients, including AmWINS Group, Inc., Arthur J. Gallagher & Co., Brown & Brown, Inc. and The Swett & Crawford Group, Inc. Many of our Brokerage competitors have relationships with insurance companies or have a significant presence in niche insurance markets that may give them an advantage over us. Because relationships between insurance intermediaries and insurance companies or clients are often local or regional in nature, this potential competitive disadvantage is particularly pronounced outside of California. This could also impact our ability to compete effectively
8
in any new states or regions that we enter. A number of standard market insurance companies are engaged in the sale of products that compete with those products we offer. These carriers sell their products directly through retail agents and brokers, without the involvement of a wholesale broker, which may yield higher commissions to retail agents and brokers and may impact our ability to compete. In addition, the Internet continues to evolve as a source for direct placement of personal lines insurance business. Although we are uniquely positioned in the Facultative Reinsurance marketplace with no comparable companies currently providing similar services, systems such as Aon's FAConnect, the LexisNexis Insurance Exchange and the Lloyd's Exchange have technology platforms that could provide solutions which could directly compete with us in the future.
In addition, the Gramm-Leach-Bliley Financial Services Modernization Act of 1999 and regulations enacted thereunder permit banks, securities firms and insurance companies to affiliate. As a result, the financial services industry has experienced and may continue to experience consolidation, which in turn has resulted and could continue to result in increased competition from diversified financial institutions, including competition for acquisition prospects.
Regulation
We are subject to the reporting requirements of the Exchange Act, and its rules and regulations, which requires us to file reports, proxy statements and other information with the Securities and Exchange Commission ("SEC").
Our Payment Protection, BPO and Brokerage businesses are subject to extensive regulation and supervision, including at the federal, state, local and foreign level. We cannot predict the impact of future changes to such laws or regulations on our business. Future laws and regulations, or the interpretation thereof, may have a material adverse effect on our results of operations, financial condition and cash flows.
Regulation - Payment Protection Segment
State Regulation
Our insurance operations and subsidiaries are subject to regulation in the various states and jurisdictions in which they transact business. State insurance laws and regulations regulate most aspects of our insurance businesses, and our insurance subsidiaries are regulated by the insurance departments of the states in which they are domiciled and licensed. Our non-U.S. insurance operations are principally regulated by insurance regulatory authorities in the jurisdictions in which they are domiciled (i.e., Turks and Caicos). Our insurance products and thus our businesses also are affected by U.S. federal, state and local tax laws, and the tax laws of non-U.S. jurisdictions.
The extent of U.S. state insurance regulation varies, but generally derives from statutes that delegate regulatory, supervisory and administrative authority to a department of insurance in each state. The purpose of the laws and regulation affecting our insurance operations is primarily to protect the policyholders and not our stockholders or our agents (i.e., the financial institutions that sell our products to their customers). The regulation, supervision and administration by state departments of insurance relate, among other things, to: standards of solvency that must be met and maintained; the payment of dividends; changes in control of insurance companies; the licensing of insurers and their agents and other producers; the types of insurance that may be written; privacy practices; the ability to enter and exit certain insurance markets; the nature of and limitations on investments and premium rates, or restrictions on the size of risks that may be insured under a single policy; reserves and provisions for unearned premiums, losses and other obligations; deposits of securities for the benefit of policyholders; payment of sales compensation to third parties; approval of policy forms; and the regulation of market conduct, including underwriting and claims practices.
Insurance Holding Company Statutes. As a holding company, we are not regulated as an insurance company, but because we own capital stock in insurance subsidiaries, we are subject to the state insurance holding company statutes, as well as certain other laws of each of the states of domicile of our insurance subsidiaries. All holding company statutes, as well as other laws, require disclosure and in many instances, prior regulatory approval of material transactions between an insurance company and an affiliate. The holding company statutes, as well as other laws, also require, among other things, prior regulatory approval of an acquisition of control of a domestic insurer, certain transactions between affiliates and payments of extraordinary dividends or distributions. Transactions within the holding company system affecting insurers must be fair and reasonable, and each insurer's policyholder surplus following any such transaction must be both reasonable in relation to its outstanding liabilities and adequate for its needs.
Dividends Limitations. We are a holding company and have limited direct operations. Our holding company assets consist primarily of the capital stock of our subsidiaries. Accordingly, our future cash flows depend upon the availability of dividends and other payments from our subsidiaries, including statutorily permissible payments from our insurance company subsidiaries, as well as payments under our tax allocation agreement and management agreements with our subsidiaries. The ability of our insurance company subsidiaries to pay such dividends and to make such other payments will be limited by applicable laws and regulations of the states in which our subsidiaries are domiciled and in which our subsidiaries operate, which vary from state to state and by type of insurance provided by the applicable subsidiary. These laws and regulations require, among other things, our insurance subsidiaries to maintain minimum solvency requirements and limit the amount of dividends these subsidiaries can pay to the holding company. Along with solvency regulations, the primary factor in determining the amount of capital available for potential dividends is the level of capital needed to maintain desired financial strength ratings from A.M. Best for our insurance company subsidiaries. Given recent economic events that
9
have affected the insurance industry, both regulators and rating agencies could become more conservative in their methodology and criteria, including increasing capital requirements for our insurance subsidiaries which, in turn, could negatively affect our capital resources. The following table sets forth the dividends paid to us by our insurance company subsidiaries for the following periods:
| For the Years Ended December 31, | |||||||||||
| (in thousands) | 2012 | 2011 | 2010 | ||||||||
| Ordinary dividends | $ | 2,783 | $ | 6,956 | $ | 7,572 | |||||
| Extraordinary dividends | — | 830 | 2,474 | ||||||||
| Total dividends | $ | 2,783 | $ | 7,786 | $ | 10,046 | |||||
Regulation of Investments. Our insurance company subsidiaries must comply with their respective state of domicile's laws regulating insurance company investments. These laws prescribe the kind, quality and concentration of investments and while unique to each state, the laws are modeled on the standards promulgated by the National Association of Insurance Commissioners ("NAIC"). Such investment laws are generally permissive with respect to federal, state and municipal obligations, and more restrictive with respect to corporate obligations, particularly non-investment grade obligations, foreign investment, equity securities and real estate investments. Each insurance company is therefore limited by the investment laws of its state of domicile from making excessive investments in any given security (such as single issuer limitations) or in certain classes or riskier investments (such as aggregate limitation in non-investment grade bonds). The diversification requirements are broadly consistent with our investment strategies. Failure to comply with these laws and regulations would cause investments exceeding regulatory limitations to be treated as non-admitted assets for the purpose of measuring surplus, and, in some instances, would require divestiture of such non-complying investments. We believe the investments made by our insurance subsidiaries comply with these laws and regulations.
Risk-Based Capital Requirements. The NAIC has adopted a model act with risk-based capital ("RBC") formulas to be applied to insurance companies. RBC is a method of measuring the amount of capital appropriate for an insurance company to support its overall business operations in light of its size and risk profile. RBC standards are used by state insurance regulators to determine appropriate regulatory actions relating to insurers that show signs of weak or deteriorating conditions. The domiciliary states of our insurance subsidiaries have adopted laws substantially similar to the NAIC's RBC model act. RBC requirements determine minimum capital requirements and are intended to raise the level of protection for policyholder obligations. RBC levels are not intended as a measure to rank insurers generally, and the insurance laws in the domiciliary states of our subsidiaries generally restrict the public dissemination of insurers' RBC levels. Under laws adopted by individual states, insurers having total adjusted capital less than that required by the RBC calculation will be subject to varying degrees of regulatory action, depending on the level of capital inadequacy.
Federal Regulation
Dodd-Frank Wall Street Reform and Consumer Protection Act. In July 2010, President Obama signed into law the Dodd-Frank Wall Street Reform and Consumer Protection Act (the "Dodd-Frank Act"), which implements comprehensive changes to the regulatory landscape of financial services in the U.S. Many aspects of the Dodd-Frank Act are subject to rule-making and will take effect over several years, making it difficult to anticipate the overall financial impact on our business, our customers or the insurance and financial services industries.
In addition, Congress created the Consumer Financial Protection Bureau (the "CFPB"). While the CFPB does not have direct jurisdiction over insurance products, it is possible that regulations promulgated by the CFPB may extend its authority to cover these products and thereby potentially affecting the Company's business or the clients that we serve.
Gramm-Leach-Bliley Act. On November 12, 1999, the Gramm-Leach-Bliley Act of 1999 became law, implementing fundamental changes in the regulation of the financial services industry in the United States. The Gramm-Leach-Bliley Act permits the transformation of the already converging banking, insurance and securities industries by permitting mergers that combine commercial banks, insurers and securities firms under one holding company. Under the Gramm-Leach-Bliley Act, community banks retain their existing ability to sell insurance products in some circumstances. Privacy provisions of the Gramm-Leach-Bliley Act became fully effective in 2001. These provisions established consumer protections regarding the security and confidentiality of nonpublic personal information and, as implemented through state insurance laws and regulations, require us to make full disclosure of our privacy policies to customers.
Health Insurance Portability and Accountability Act of 1996 ("HIPAA"). Through HIPAA, the Department of Health and Human Services imposes obligations for issuers of health and dental insurance coverage and health and dental benefit plan sponsors. HIPAA established requirements for maintaining the confidentiality and security of individually identifiable health information and new standards for electronic health care transactions. The Department of Health and Human Services promulgated final HIPAA regulations in 2002. The privacy regulations required compliance by April 2003, the electronic transactions regulations by October 2003 and the security regulations by April 2005. Recently, parts of HIPAA were amended under the HITECH Act, and pursuant to these amendments, new regulations have been issued requiring notification of government agencies and consumers in the event of certain security breaches involving personal health information.
10
HIPAA is far-reaching and complex and proper interpretation and practice under the law continue to evolve. Consequently, our efforts to measure, monitor and adjust our business practices to comply with HIPAA are ongoing. Failure to comply could result in regulatory fines and civil lawsuits. Knowing and intentional violations of these rules may also result in federal criminal penalties.
Foreign Jurisdictions. A portion of our business is ceded to our reinsurance subsidiaries domiciled in Turks and Caicos. Those subsidiaries must satisfy local regulatory requirements, such as filing annual financial statements, filing annual certificates of compliance and paying annual fees. If we fail to maintain compliance with applicable laws, rules and regulations, the licenses issued by the regulatory authority in Turks and Caicos could be subject to modification or revocation, and our subsidiaries could be prevented from conducting business.
Regulation - BPO Segment
We are subject to federal and state laws and regulations, particularly related to our administration of insurance products on behalf of other insurers. In order for us to process and administer insurance products of other companies, we are required to maintain licenses of a third party administrator in the states where those insurance companies operate. With regard to our third party administration operations, we also must comply with the related federal and state privacy laws that similarly apply to our insurance operations.
We are also subject to laws and regulations on direct marketing, such as the Telemarketing Consumer Fraud and Abuse Prevention Act and the Telemarketing Sales Rule, the Telephone Consumer Protection Act, the Do-Not-Call Implementation Act and rules promulgated by the Federal Communications Commission and the Federal Trade Commission and the CAN-SPAM Act. Failure to comply with the provisions of such acts and rules could result in fines and penalties.
As a business process outsourcer for insurers and financial institutions, we are subject to data protection and privacy laws, such as the Gramm-Leach-Bliley Act as well as HIPAA and certain state data privacy laws. In addition, the terms of our contracts typically require us to comply with applicable laws and regulations. If we fail to comply with any applicable laws or regulations, we may be restricted in our ability to provide services and may also be subject to civil or criminal penalties, litigation as well as contract termination.
Regulation - Brokerage Segment
Our Brokerage and premium finance operations are subject to regulation at the federal, state and local levels. B&G and our designated employees must be licensed to act as agents, brokers, producers and/or agencies by state regulatory authorities in the states where we conduct business. Regulations and licensing laws vary by state and are often complex and subject to interpretation and enforcement by the relevant departments of insurance.
Laws and regulations vary from state to state and are always subject to amendment or interpretation by regulatory authorities. These authorities have substantial discretion as to the decision to grant, renew and revoke licenses and approvals. Our continuing ability to do business in the states in which we currently operate depends on the validity of and continued good standing under the licenses and approvals pursuant to which we operate. More restrictive laws, rules or regulations may be adopted in the future that could make compliance more difficult and expensive or adversely affect our business. For further information, see "Item 1A. Risk Factors" of this Annual Report under "Risks Related to Regulatory and Legal Matters - We are subject to extensive governmental laws and regulations, which increase our costs and could restrict the conduct of our business."
Seasonality
Our financial results may be affected by seasonal variations. Revenues in our Payment Protection business may fluctuate seasonally based on consumer spending trends, where consumer spending has historically been higher in September and December, corresponding to back-to-school and the holiday season. Accordingly, our Payment Protection revenues may reflect higher third and fourth quarters than in the first half of the year.
Revenues in our Brokerage business may fluctuate seasonally based on policy renewal dates, which are typically concentrated in July and December, the months during our third and fourth quarters. In addition, our quarterly revenues may be affected by new placements, cancellations or non-renewals of large policies because commission revenues are earned on the effective date as opposed to ratably over the year. Our quarterly Brokerage revenues may also be affected by the amount of profit commissions received from insurance carriers, since profit commissions are primarily received in the first and second quarters of each year.
Employees
At December 31, 2012, we employed approximately 700 people, which includes the employees from the December 31, 2012 acquisitions of ProtectCELL and 4Warranty, on a full or part-time basis. None of our employees are represented by unions or trade organizations. We believe that our relations with our employees are satisfactory.
Intellectual Property
We own or license a number of trademarks, patents, trade names, copyrights, service marks, trade secrets and other intellectual property rights that relate to our services and products. Although we believe that these intellectual property rights are, in the aggregate, of
11
material importance to our businesses, we believe that none of our businesses are materially dependent upon any particular trademark, trade name, copyright, service mark, license or other intellectual property right. U.S. trademark and service mark registrations are generally for a term of 10 years, renewable every 10 years as long as the trademark or service mark is used in the regular course of trade. We have entered into confidentiality agreements with our clients. These agreements impose restrictions on such clients' use of our proprietary software and other intellectual property rights.
Web Site Access to Fortegra's Filings with the SEC
We maintain an Internet website at www.fortegra.com. The information that appears on our website is not part of, and is not incorporated into, this Annual Report. We will make available free of charge on our website our annual report on Form 10-K, quarterly reports on Form 10-Q, current reports on Form 8-K, and amendments to those reports filed or furnished pursuant to Section 13(a) or 15(d) of the Exchange Act and the rules promulgated thereunder, as soon as reasonably practicable after electronically filing or furnishing such material to the SEC. All filings with the SEC are posted to our website in the "Investor Relations" tab under the section "Financial Information." Upon written request of any stockholder of record on December 31, 2012, Fortegra will provide, without charge, a printed copy of its 2012 Annual Report as required to be filed with the SEC. To obtain a copy of the 2012 Annual Report, Contact: Investor Relations, Fortegra Financial Corporation, 10151 Deerwood Park Boulevard, Building 100, Suite 330, Jacksonville, FL, 32256, or call (866)-961-9529.
Copies of all of Fortegra's filings and other information may also be obtained electronically from the SEC's website at www.sec.gov. or may be read and copied at the: SEC Public Reference Room, 100 F Street, NE, Washington, D.C. 20549. Information on the operation of the Public Reference Room may be obtained by calling the SEC at 1-800-SEC-0330.
ITEM 1A. RISK FACTORS
The following are certain risks that management believes are specific to our business. This should not be viewed as an all-inclusive list of risks or presenting the risk factors listed in any particular order. You should carefully consider the risks described below, together with the other information contained in this report and in our other filings with the SEC when evaluating our Company. Should any of the events discussed in the risk factors below occur, our business, results of operations or financial condition could be materially affected. Additional risks unknown at this time, or risks we currently deem immaterial, may also impact our financial condition or results of operations.
Risks Related to our Business and Industries
General economic and financial market conditions may have a material adverse effect on the business, results of operations, cash flows and financial condition of all of our business segments.
General economic and financial market conditions, including the availability and cost of credit, the loss of consumer confidence, reduction in consumer or business spending, inflation, unemployment, energy costs and geopolitical issues, have contributed to increased uncertainty and volatility as well as diminished expectations for the U.S. economy and the financial markets. These conditions could materially and adversely affect each of our businesses. Adverse economic and financial market conditions could result in:
| • | a reduction in the demand for, and availability of, consumer credit, which could result in reduced demand by consumers for our Payment Protection products and our Payment Protection clients opting to no longer make such products available; |
| • | higher than anticipated loss ratios on our Payment Protection products due to rising unemployment or disability claims; |
| • | higher risk of increased fraudulent insurance claims; |
| • | individuals terminating loans or canceling credit insurance policies, thereby reducing our revenues; |
| • | A reduction in the demand for consumer warranty products, service contract offerings, and motor club memberships; |
| • | individuals terminating warranty products, service contract or motor club memberships, thereby reducing our revenues; |
| • | businesses reducing the amount of coverage under surplus lines and specialty admitted insurance policies or allowing such policies to lapse thereby reducing our premium or commission income in our Brokerage business; |
| • | a reduction in demand for new surplus lines and specialty insurance policies from retail insurance brokers and agents or retail insurance brokers and agents and insurance companies ceasing to offer our surplus lines and specialty insurance products and related services from our Brokerage business; |
| • | a contraction in the reinsurance market caused by reduced demand by major insurers, reduced supply by reinsurers or other factors or reduced reinsurance demand by our insurance customers due to market conditions; |
| • | our clients being more likely to experience financial distress or declare bankruptcy or liquidation, which could have an adverse impact on demand for our services and products and the remittance of premiums from such customers, as well as the collection of receivables from such clients for items such as unearned premiums, commissions or BPO-related accounts receivable, which could make the collection of receivables from our clients more difficult; |
| • | increased pricing sensitivity or reduced demand for our services and products; |
| • | increased costs associated with, or the inability to obtain, debt financing to fund acquisitions or the expansion of our businesses; and |
| • | defaults in our fixed income investment portfolio or lower than anticipated rates of return as a result of low interest rate environments. |
12
If we are unable to successfully anticipate changing economic or financial market conditions, we may be unable to effectively plan for or respond to such changes, and our business, results of operations and financial condition could be materially and adversely affected.
We face significant competitive pressures in each of our businesses, which could materially and adversely affect our business, results of operations and financial condition.
We face significant competition in each of our businesses. Competition in our businesses is based on many factors, including price, industry knowledge, quality of client service, the effectiveness of our sales force, technology platforms and processes, the security and integrity of our information systems, the financial strength ratings of our insurance subsidiaries, office locations, breadth of services and products and brand recognition and reputation. Some competitors may offer a broader array of services and products, may have a greater diversity of distribution resources, may have better brand recognition, may have lower cost structures or, with respect to insurers, may have higher financial strength or claims paying ratings. Some competitors also have larger client bases than we do. In addition, new competitors could enter our markets in the future, and existing competitors may gain strength by forging new business relationships. The competitive landscape for each of our businesses is described below.
| • | Payment Protection - In our Payment Protection business, we compete with insurance companies, financial institutions, extended service plan providers, membership plan providers and other insurance and warranty service providers. The principal competitors for our Payment Protection business include The Warranty Group, Assurant, Inc., Asurion Corporation, eSecuritel Holdings, LLC, Asurion, LLC, Global Warranty Group, LLC and smaller regional companies. As a result of state and federal regulatory developments and changes in prior years, certain financial institutions are able to offer debt cancellation plans and are also able to affiliate with other insurance companies in order to offer services similar to those in our Payment Protection business. This has resulted in new competitors, some of whom have significant financial resources, entering some of our markets. As financial institutions gain experience with payment protection and warranty programs, their reliance on our services and products may diminish. |
| • | BPO - Our BPO business competes with a variety of companies, including large multinational firms that provide consulting, technology and/or business process services, off-shore business process service providers in low-cost locations like India, and in-house captive insurance companies of potential clients. Our principal business process outsourcing competitors include Aon Corporation, Computer Sciences Corporation, Direct Response Insurance Administrative Services, Inc., Marsh & McLennan Companies, Inc., Dell Services and Unisys Corporation. The trend toward outsourcing and technological changes may also result in new and different competitors entering our markets. There could also be newer competitors with strong competitive positions as a result of consolidation of smaller competitors or of companies that each provide different services or serve different industries. |
| • | Brokerage - Our Brokerage business competes for retail insurance clients with numerous firms, including AmWINS Group, Inc., Arthur J. Gallagher & Co., Brown & Brown, Inc. and The Swett & Crawford Group, Inc. Many of our Brokerage competitors have relationships with insurance companies or have a significant presence in niche insurance markets that may give them an advantage over us. Because relationships between insurance intermediaries and insurance companies or clients are often local or regional in nature, this potential competitive disadvantage is particularly pronounced outside of California. This could also impact our ability to compete effectively in any new states or regions that we enter. A number of standard market insurance companies are engaged in the sale of products that compete with those products we offer. These carriers sell their products directly through retail agents and brokers without the involvement of a wholesale broker, which may yield higher commissions to retail agents and brokers and may impact our ability to compete. Although we are uniquely positioned in the Facultative Reinsurance marketplace with no comparable companies currently providing similar services. Systems such as Aon's FAConnect, the LexisNexis Insurance Exchange and the Lloyd's Exchange have technology platforms that could provide solutions which could directly compete with us in the future. |
We expect competition to intensify in each of our businesses. Increased competition may result in lower prices and volumes, higher personnel and sales and marketing costs, increased technology expenditures and lower profitability. We may not be able to supply clients with services or products that they deem superior and at competitive prices and we may lose business to our competitors. If we are unable to compete effectively in any of our business segments, it would have a material adverse effect on our business, results of operations and financial condition.
Our results of operations may fluctuate significantly, which makes our future results of operations difficult to predict. If our results of operations fall below expectations, the price of our common stock could decline.
Our annual and quarterly results of operations have fluctuated in the past and may fluctuate significantly in the future due to a variety of factors, many of which are beyond our control. In addition, our expenses as a percentage of revenues may be significantly different than our historical rates. As a result, comparing our results of operations on a period-to-period basis may not be meaningful. Factors that may cause our results of operations to fluctuate from period-to-period include:
| • | demand for our services and products; |
| • | the length of our sales cycle; |
| • | the amount of sales to new clients: |
| • | the timing of implementations of our services and products with new clients; |
| • | pricing and availability of surplus lines and other specialty insurance products coverages; |
13
| • | seasonality; |
| • | the timing of acquisitions; |
| • | competitive factors; |
| • | prevailing interest rates; |
| • | pricing changes by us or our competitors; |
| • | transaction volumes in our clients' businesses; |
| • | the introduction of new services and products by us and our competitors; |
| • | changes in strategic partnerships; |
| • | changes in regulatory and accounting standards; and |
| • | our ability to control costs. |
In addition, our Payment Protection revenues can vary depending on the level of consumer activity and the success of our clients in selling products. In our Brokerage business, our commission and fee income can vary due to the timing of policy renewals, as well as the timing and amount of the receipt of profit commission payments and fees and the net effect of new and lost business production. We do not control the factors that cause these variations. Specifically, third party customers' demand for insurance products can influence the timing of renewals, new business, lost business (which includes policies that are not renewed) and cancellations. In addition, we rely on retail insurance brokers and agents and insurance companies for the payment of certain commissions. Because these payments are processed internally by these companies, we may not receive a payment that is otherwise expected from a particular firm in one period until after the end of that period, which can adversely affect our ability to budget for such period.
Our results of operations could be materially and adversely affected if we fail to retain our existing clients, cannot sell additional services and products to our existing clients, do not introduce new or enhanced services and products or are not able to attract and retain new clients.
Our revenue and revenue growth are dependent on our ability to retain clients, to sell those clients additional services and products, to introduce new services and products and to attract new clients in each of our businesses. Our ability to increase revenues will depend on a variety of factors, including:
| • | the quality and perceived value of our product and service offerings by existing and new clients; |
| • | the effectiveness of our sales and marketing efforts; |
| • | the speed with which our Brokerage business can respond to requests for price quotes from retail insurance agents and brokers, and the availability of competitive services and products from our carriers; |
| • | the successful installation and implementation of our services and products for new and existing Payment Protection and BPO clients; |
| • | availability of capital to complete investments in new or complementary products, services and technologies; |
| • | the availability of adequate reinsurance for us and our clients, including the ability of our clients to form, capitalize and operate captive reinsurance companies; |
| • | our ability to find suitable acquisition candidates, successfully complete such acquisitions and effectively integrate such acquisitions; |
| • | our ability to integrate technology into our services and products to avoid obsolescence and provide scalability; |
| • | the reliability, execution and accuracy of our services, particularly our BPO services; and |
| • | client willingness to accept any price increases for our services and products. |
In addition, we are subject to risks of losing clients due to consolidation in each of the markets we serve. Our inability to retain existing clients, sell additional services and products, or successfully develop and implement new and enhanced services and products and attract new clients and, accordingly, increase our revenues could have a material adverse effect on our results of operations.
We typically face a long selling cycle to secure new clients in each of our businesses as well as long implementation periods that require significant resource commitments, which result in a long lead time before we receive revenues from new client relationships.
The industries in which we compete generally consist of mature businesses and markets and the companies that participate in these industries have well-established business operations, systems and relationships. Accordingly, each of our businesses typically faces a long selling cycle to secure a new client. Even if we are successful in obtaining a new client engagement, it is generally followed by a long implementation period in which the services are planned in detail and we demonstrate to the client that we can successfully integrate our processes and resources with their operations. We also typically negotiate and enter into a contractual relationship with the new client during this period. There is then a long implementation period in order to commence providing the services.
We typically incur significant business development expenses during the selling cycle. We may not succeed in winning a new client's business, in which case we receive no revenues and may receive no reimbursement for such expenses. Even if we succeed in developing a relationship with a potential client and begin to plan the services in detail, such potential client may choose a competitor or decide to retain the work in-house prior to the time a final contract is signed. If we enter into a contract with a client, we will typically receive no revenues until implementation actually begins. In addition, a significant portion of our revenue is based upon the success of our clients' marketing programs, which may not generate the transaction volume we anticipate. Our clients may also experience delays in obtaining internal approvals or delays associated with technology or system implementations, thereby further lengthening the implementation cycle. If we are not successful in obtaining contractual commitments after the selling cycle, in maintaining contractual
14
commitments after the implementation cycle or in maintaining or reducing the duration of unprofitable initial periods in our contracts, it may have a material adverse effect on our business, results of operations and financial condition. Furthermore, the time and effort required to complete the implementation phases of new contracts makes it difficult to accurately predict the timing of revenues from new clients as well as our costs.
Acquisitions are a significant part of our growth strategy and we may not be successful in identifying suitable acquisition candidates, completing such acquisitions or integrating the acquired businesses, which could have a material adverse effect on our business, results of operations, financial condition or growth.
Historically, acquisitions have played a significant role in our expansion into new businesses and in the growth of some of our businesses. Acquiring complementary businesses is a significant component of our growth strategy. Accordingly, we frequently evaluate possible acquisition transactions for our business. However, we may not be able to identify suitable acquisitions, and such transactions may not be financed and completed on acceptable terms. We may incur significant expenses in evaluating such acquisitions. Furthermore, any future acquisitions may not be successful. In addition, we may be competing with larger competitors with substantially greater resources for acquisition targets. Any deficiencies in the process of integrating companies we may acquire could have a material adverse effect on our results of operations and financial condition. Acquisitions entail a number of risks including, among other things:
| • | failure to achieve anticipated revenues, earnings or cash flow; |
| • | increased expenses; |
| • | diversion of management time and attention; |
| • | failure to retain the acquired business' customers or personnel; |
| • | difficulties in realizing projected efficiencies; |
| • | ability to realize synergies and cost savings; |
| • | difficulties in integrating systems and personnel; and |
| • | inaccurate assessment of liabilities. |
Our failure to adequately address these acquisition risks could have a material adverse effect on our business, results of operations, financial condition and growth. Future acquisitions may reduce our cash resources available to fund our operations and capital expenditures and could result in increased amortization expense related to any intangible assets acquired, potentially dilutive issuances of equity securities or the incurrence of debt, which could increase our interest expense.
Our business, results of operations, financial condition or liquidity may be materially and adversely affected by errors and omissions and the outcome of certain actual and potential claims, lawsuits and proceedings.
We are subject to various actual and potential claims, lawsuits and other proceedings relating principally to alleged errors and omissions in connection with our conduct in each of our businesses, including the handling and adjudicating of claims and the placement of insurance. Because such placement of insurance and handling claims can involve substantial amounts of money, clients may assert errors and omissions claims against us alleging potential liability for all or part of the amounts in question. Claimants may seek large damage awards, and these claims may involve potentially significant legal costs. Such claims, lawsuits and other proceedings could, for example, include claims for damages based on allegations that our employees or sub-agents improperly failed to procure coverage, report claims on behalf of clients, provide insurance companies with complete and accurate information relating to the risks being insured or appropriately apply funds that we hold for our clients on a fiduciary basis.
While we would expect most of the errors and omissions claims made against us (subject to our self-insured deductibles) to be covered by our professional indemnity insurance, our results of operations, financial condition and liquidity may be materially and adversely affected if, in the future, our insurance coverage proves to be inadequate or unavailable, or if there is an increase in liabilities for which we self-insure. Our ability to obtain professional indemnity insurance in the amounts and with the deductibles we desire in the future may be materially and adversely impacted by general developments in the market for such insurance or our own claims experience. In addition, claims, lawsuits and other proceedings may harm our reputation or divert management resources away from operating our business.
We may lose clients or business as a result of consolidation within the financial services industry.
There has been considerable consolidation in the financial services industry, driven primarily by the acquisition of small and mid-size organizations by larger entities. We expect this trend to continue. As a result, we may lose business or suffer decreased revenues from retail insurance brokerage firms that are acquired by other firms. Similarly, we may lose business or suffer decreased revenues if one or more of our Payment Protection clients or distributors consolidate or align themselves with other companies. To date, our business has not been materially affected by consolidation. However, we may be affected by industry consolidation that occurs in the future, particularly if any of our significant clients are acquired by organizations that already possess the operations, services and products that we provide.
Our ability to implement and execute our strategic plans may not be successful and, accordingly, we may not be successful in achieving our strategic goals, which may materially and adversely affect our business.
We may not be successful in developing and implementing our strategic plans for our businesses or the operational plans that have been or need to be developed to implement these strategic plans. If the development or implementation of such plans is not successful,
15
we may not produce the revenue, margins, earnings or synergies that we need to be successful. We may also face delays or difficulties in implementing service, product, process and system improvements, which could adversely affect the timing or effectiveness of margin improvement efforts in our businesses and our ability to successfully compete in the markets we serve. The execution of our strategic and operating plans will, to some extent, also be dependent on external factors that we cannot control. In addition, these strategic and operational plans need to continue to be assessed and reassessed to meet the challenges and needs of our businesses in order for us to remain competitive. The failure to implement and execute our strategic and operating plans in a timely manner or at all, realize the cost savings or other benefits or improvements associated with such plans, have financial resources to fund the costs associated with such plans or incur costs in excess of anticipated amounts, or sufficiently assess and reassess these plans could have a material and adverse effect on our business or results of operations.
We may not effectively manage our growth, which could materially harm our business.
The growth of our business has placed and may continue to place significant demands on our management, personnel, systems and resources. To manage our growth, we must continue to improve our operational and financial systems and managerial controls and procedures, and we will need to continue to expand, train and manage our personnel. We must also maintain close coordination among our technology, compliance, legal, risk management, accounting, finance, marketing and sales organizations. We may not manage our growth effectively, and if we fail to do so, our business could be materially and adversely harmed.
If we continue to grow, we may be required to increase our investment in facilities, personnel and financial and management systems and controls. Continued growth, especially in connection with expansion into new business lines, may also require expansion of our procedures for monitoring and assuring our compliance with applicable regulations and that we recruit, integrate, train and manage a growing employee base. The expansion of our existing businesses, our expansion into new businesses and the resulting growth of our employee base increase our need for internal audit and monitoring processes that are more extensive and broader in scope than those we have historically required. We may not be successful in implementing all of the processes that are necessary. Further, unless our growth results in an increase in our revenues that is proportionate to the increase in our costs associated with this growth, our operating margins and profitability will be materially and adversely affected.
As a holding company, we depend on the ability of our subsidiaries to transfer funds to us to pay dividends and to meet our obligations.
We act as a holding company for our subsidiaries and do not have any significant operations of our own. Dividends from our subsidiaries are our principal sources of cash to meet our obligations and pay dividends, if any, on our common stock. These obligations include our operating expenses and interest and principal payments on our current and any future borrowings. The agreements governing our credit facilities restrict our subsidiaries' ability to pay dividends or otherwise transfer cash to us. Under our credit facility, our subsidiaries are permitted to make distributions to us if no default or event of default has occurred and is continuing at the time of such distribution. If the cash we receive from our subsidiaries pursuant to dividends or otherwise is insufficient for us to fund any of these obligations, or if a subsidiary is unable to pay dividends to us, we may be required to raise cash through the incurrence of additional debt, the issuance of additional equity or the sale of assets.
The payment of dividends and other distributions to us by each of the regulated insurance company subsidiaries in our Payment Protection segment is regulated by insurance laws and regulations of the states in which they operate. In general, dividends in excess of prescribed limits are deemed "extraordinary" and require insurance regulatory approval. Ordinary dividends, for which no regulatory approval is generally required, are limited to amounts determined by a formula, which varies by state. Some states have an additional stipulation that dividends may only be paid out of earned surplus. States also regulate transactions between our insurance company subsidiaries and our other subsidiaries, such as those relating to the shared services, and in some instances, require prior approval of such transactions within the holding company structure. If insurance regulators determine that payment of an ordinary dividend or any other payments by our insurance subsidiaries to us (such as payments for employee or other services) would be adverse to policyholders or creditors, the regulators may block or otherwise restrict such payments that would otherwise be permitted without prior approval. In addition, there could be future regulatory actions restricting the ability of our insurance subsidiaries to pay dividends or share services.
Our success is dependent upon the retention and acquisition of talented people and the skills and abilities of our management team and key personnel.
Our business depends on the efforts, abilities and expertise of our senior executives, particularly our Chairman, President and Chief Executive Officer, Richard S. Kahlbaugh. Mr. Kahlbaugh and our other senior executives are important to our success because they have been instrumental in setting our strategic direction, operating our business, identifying, recruiting and training key personnel, maintaining relationships with our clients, and identifying business opportunities. The loss of one or more of these key individuals could impair our business and development until qualified replacements are found. We may not be able to replace these individuals quickly or with persons of equal experience and capabilities. Although we have employment agreements with certain of these individuals, we cannot prevent them from terminating their employment with us. In addition, our non-compete agreements with such individuals may not be enforced by the courts. We do not maintain key man life insurance policies on any of our executive officers except for Mr. Kahlbaugh. If we are unable to attract and retain talented employees, it could have a material adverse effect on our business, operating results and financial condition.
16
We may need to raise additional capital in the future, but there is no assurance that such capital will be available on a timely basis, on acceptable terms or at all.
We may need to raise additional funds in order to grow our businesses or fund our strategy or acquisitions. Additional financing may not be available in sufficient amounts or on terms acceptable to us and may be dilutive to existing stockholders if raised through additional equity offerings. A significant portion of our funding is under our existing credit facility, which matures in June 2017. Additionally, any securities issued to raise such funds may have rights, preferences and privileges senior to those of our existing stockholders. If adequate funds are not available on a timely basis or on acceptable terms, our ability to expand, develop or enhance our services and products, enter new markets, consummate acquisitions or respond to competitive pressures could be materially limited.
Risks Related to Our Payment Protection Business
Our Payment Protection business relies on independent financial institutions, lenders and retailers to distribute its services and products, and the loss of these distribution sources, or the failure of our distribution sources to sell our Payment Protection products could materially and adversely affect our business and results of operations.
We distribute our Payment Protection products through financial institutions, lenders and retailers. Although our contracts with these clients are typically exclusive, they can be canceled on relatively short notice. In addition, the distributors typically do not have any minimum performance or sales requirements and our Payment Protection revenue is dependent on the level of business conducted by the distributor as well as the effectiveness of their sales efforts for our Payment Protection products, each of which is beyond our control. The impairment of our distribution relationships, the loss of a significant number of our distribution relationships, the failure to establish new distribution relationships, the failure to offer increasingly competitive products, the increase in sales of competitors' services and products by these distributors or the decline in their overall business activity or the effectiveness of their sales of our Payment Protection products could materially reduce our Payment Protection sales and revenues. Also, the growth of our Payment Protection business is dependent in part on our ability to identify, attract and retain new distribution relationships and successfully implement our information systems with those of our new distributors.
Reinsurance may not be available or adequate to protect us against losses, and we are subject to the credit risk of reinsurers.
As part of our overall risk and capacity management strategy, we purchase reinsurance for a substantial portion of the risks underwritten by our Payment Protection business through captive reinsurance companies owned by our Payment Protection clients as well as third party reinsurance companies. Market conditions beyond our control determine the availability and cost of the reinsurance protection we seek to renew or purchase. Our clients may face difficulties forming, capitalizing and operating captive reinsurance companies, which could impact their ability to reinsure future business that we typically cede to them. States also could impose restrictions on these reinsurance arrangements, such as requiring the insurance company subsidiary to retain a minimum amount of underwriting risk, which could affect our profitability and results of operations. Reinsurance for certain types of catastrophes generally could become unavailable or prohibitively expensive for some of our businesses. Such changes could substantially increase our exposure to the risk of significant losses from natural or man-made catastrophes and could hinder our ability to write future business.
Although the reinsurer is liable to the respective insurance subsidiary to the extent of the ceded reinsurance, the insurance company remains liable to the insured as the direct insurer on all risks reinsured. Ceded reinsurance arrangements, therefore, do not eliminate our insurance company obligation to pay claims. While the captive reinsurance companies owned by our clients are generally required to maintain trust accounts with sufficient assets to cover the reinsurance liabilities and we manage these trust accounts on behalf of these reinsurance companies, we are subject to credit risk with respect to our ability to recover amounts due from reinsurers. The inability to collect amounts due from reinsurers could have a material adverse effect on our results of operations and financial condition.
Our reinsurance facilities are generally subject to annual renewal. We may not be able to maintain our current reinsurance facilities and our clients may not be able to continue to operate their captive reinsurance companies. As a result, even where highly desirable or necessary, we may not be able to obtain other reinsurance facilities in adequate amounts and at favorable rates. If we are unable to renew our expiring facilities or to obtain or structure new reinsurance facilities, either our net exposures would increase or, if we are unwilling to bear an increase in net exposures, we may have to reduce the level of our underwriting commitments. Either of these potential developments could have a material adverse effect on our results of operations and financial condition.
Due to the structure of some of our commissions, we are exposed to risks related to the creditworthiness of some of our agents.
We are subject to the credit risk of some of the agents with which we contract within our Payment Protection business. We typically advance agents' commissions as part of our product offerings. These advances are a percentage of the premium charged. If we over-advance such commissions to agents, they may not be able to fulfill their payback obligations, and it could have a material adverse effect on our results of operations and financial condition.
A downgrade in the ratings of our insurance company subsidiaries may materially and adversely affect relationships with clients and adversely affect our results of operations.
Claims paying ability and financial strength ratings are each a factor in establishing the competitive position of our insurance company subsidiaries. A ratings downgrade, or the potential for such a downgrade, could, among other things, materially and adversely affect
17
relationships with clients, brokers and other distributors of our services and products, thereby negatively impacting our results of operations, and materially and adversely affect our ability to compete in our markets. Rating agencies can be expected to continue to monitor our financial strength and claims paying ability, and no assurances can be given that future ratings downgrades will not occur, whether due to changes in our performance, changes in rating agencies' industry views or ratings methodologies, or a combination of such factors.
Our actual claims losses may exceed our reserves for claims, which may require us to establish additional reserves that may materially and adversely reduce our business, results of operations and financial condition.
We maintain reserves to cover our estimated ultimate exposure for claims with respect to reported claims and incurred but not reported claims as of the end of each accounting period. Reserves, whether calculated under accounting principles generally accepted in the United States or statutory accounting principles, do not represent an exact calculation of exposure. Instead, they represent our best estimates, generally involving actuarial projections, of the ultimate settlement and administration costs for a claim or group of claims, based on our assessment of facts and circumstances known at the time of calculation. The adequacy of reserves will be impacted by future trends in claims severity, frequency, judicial theories of liability and other factors. These variables are affected by external factors such as changes in the economic cycle, unemployment, changes in the social perception of the value of work, emerging medical perceptions regarding physiological or psychological causes of disability, emerging health issues, new methods of treatment or accommodation, inflation, judicial trends, legislative changes, as well as changes in claims handling procedures. Many of these items are not directly quantifiable, particularly on a prospective basis. Reserve estimates are refined as experience develops. Adjustments to reserves, both positive and negative, are reflected in the statement of income of the period in which such estimates are updated. Because the establishment of reserves is an inherently uncertain process involving estimates of future losses, we can give no assurances that ultimate losses will not exceed existing claims reserves. In general, future loss development could require reserves to be increased, which could have a material adverse effect on our business, results of operations and financial condition.
Our investment portfolio is subject to several risks that may diminish the fair value of our invested assets and cash and may materially and adversely affect our business and profitability.
Investment returns are an important part of our overall profitability and significant interest rate fluctuations, or prolonged periods of low interest rates, could impair our profitability. Interest rates are highly sensitive to many factors, including governmental monetary policies, domestic and international economic and political conditions and other factors beyond our control. We have a significant portion of our investments in cash and highly liquid short-term investments. Accordingly, during prolonged periods of declining or low market interest rates, such as those we have been experiencing since 2008, the interest we receive on such investments decreases and affects our profitability. In addition, certain factors affecting our business, such as volatility of claims experience, could force us to liquidate securities prior to maturity, causing us to incur capital losses. If we do not structure our investment portfolio so that it is appropriately matched with our insurance liabilities, we may be forced to liquidate investments prior to maturity at a significant loss to cover such liabilities.
The fair value of the fixed maturity securities in our portfolio and the investment income from these securities fluctuate depending on general economic and market conditions. Because all of our fixed maturity securities are classified as available for sale, changes in the fair value of these securities are reflected on our Consolidated Balance Sheets. The fair value generally increases or decreases in an inverse relationship with fluctuations in interest rates, while net investment income realized by us from future investments in fixed maturity securities will generally increase or decrease with interest rates. In addition, actual net investment income and/or cash flows from investments that carry prepayment risk may differ from those anticipated at the time of investment as a result of interest rate fluctuations.
We employ asset/liability management strategies to reduce the adverse effects of interest rate volatility and to increase the likelihood that cash flows are available to pay claims as they become due. Our asset/liability management strategies may fail to eliminate or reduce the adverse effects of interest rate volatility, and significant fluctuations in the level of interest rates may therefore have a material adverse effect on our results of operations and financial condition.
We are subject to credit risk in our investment portfolio, primarily from our investments in corporate bonds and municipal bonds. Defaults by third parties in the payment or performance of their obligations could reduce our investment income and realized investment gains or result in the recognition of investment losses. The fair value of our investments may be materially and adversely affected by increases in interest rates, downgrades in the corporate bonds included in the portfolio and by other factors that may result in the recognition of other-than-temporary impairments. Each of these events may cause us to reduce the fair value of our investment portfolio.
Further, the fair value of any particular fixed maturity security is subject to impairment based on the creditworthiness of a given issuer. Our fixed maturity portfolio may include below investment grade securities (rated "BB" or lower by nationally recognized securities rating organizations). These investments generally provide higher expected returns, but present greater risk and can be less liquid than investment grade securities. A significant increase in defaults and impairments on our fixed maturity investment portfolio could have a material adverse effect on our results of operations and financial condition.
18
Risks Related to Our BPO Business
A significant portion of our BPO revenues are attributable to one client, and any loss of business from, or change in our relationship with this client could materially and adversely affect our business, results of operations and financial condition.
We have derived and are likely to continue to derive a significant portion of our BPO revenues from a limited number of clients, specifically, in our BPO business, services provided to National Union Fire Insurance Company of Pittsburgh, PA ("NUFIC"). See the section "QUANTITATIVE AND QUALITATIVE DISCLOSURES ABOUT MARKET RISK - Concentration Risk in this report, regarding our concentration risk. The loss of business or a reduction in the fees or other change in relationship with any of our significant clients, particularly NUFIC, could have a material adverse effect on our business, results of operations and financial condition. Additionally, there is no guarantee that we would be able to generate new business in the event that we lose a significant client.
The profitability of our BPO business will suffer if we are not able to price our outsourcing services appropriately, maintain asset utilization levels and control our costs.
The profitability of our BPO business is largely a function of the efficiency with which we utilize our assets and the pricing that we are able to obtain for our services. Our utilization rates are affected by a number of factors, including hiring and assimilating new employees, forecasting demand for our services and our need to devote time and resources to training, professional development and other typically non-chargeable activities. The prices we are able to charge for our services are affected by a number of factors, including our clients' perceptions of our ability to add value through our services, competition, the introduction of new services or products by us or our competitors and general economic conditions. Our ability to accurately estimate, attain and sustain revenues over increasingly longer contract periods could negatively impact our margins and cash flows. Therefore, if we are unable to price appropriately or manage our asset utilization levels, there could be a material adverse effect on our business, results of operations and financial condition. The profitability of our BPO business is also a function of our ability to control our costs and improve our efficiency. As we increase the number of our employees and grow our business, we may not be able to manage the significantly larger workforce that may result and our profitability may be adversely and materially affected.
We enter into fixed-term contracts and per-unit priced contracts with our BPO clients, and our failure to correctly price these contracts may negatively affect our profitability.
The pricing of our services is usually included in contracts entered into with our clients, many of which are for terms of between one and three years. In certain cases, we have committed to pricing over this period with only limited sharing of risk regarding inflation. If we fail to estimate accurately future wage inflation rates or our costs, or if we fail to accurately estimate the productivity benefits we can achieve under a contract, it could have a material adverse effect on our profitability.
Some of our BPO contracts contain provisions which, if triggered, could result in the payment of penalties or lower future revenues and could materially and adversely affect our business, results of operations and financial condition.
Many of our BPO contracts contain service level and performance provisions, including standards relating to the quality of our services, that would provide our clients with the right to terminate their contract if we do not meet pre-agreed service level requirements and in the case of our contract with NUFIC, require us to pay penalties. Our contract with NUFIC also provides that, during the term of the contract and for 18 months thereafter, we may not develop or service products for NUFIC's competitors that are substantially similar to those we administer on behalf of NUFIC. Failure to meet these requirements could result in the payment of significant penalties by us to our clients which, in turn, could have a material adverse effect on our business, results of operations and financial condition.
Risks Related to our Brokerage Business
We may not be able to accurately forecast our brokerage commissions and fee revenues because our commissions and fees depend on premiums charged by insurance companies, which historically have varied and, as a result, have been difficult to predict.
Our Brokerage business derives revenue principally from commissions and fees paid by insurance companies. Commissions and fees are based upon a percentage of premiums paid by customers for insurance products. The amount of such commissions and fees are therefore highly dependent on premium rates charged by insurance companies. We do not determine insurance premium rates. Premium rates are determined by insurance companies based on a fluctuating market and in many cases are regulated by the states in which they operate. We have generally encountered declining rates for P&C insurance since late 2006.
Premium pricing within the commercial P&C insurance market in which we operate historically has been cyclical based on the underwriting capacity of the insurance carriers operating in this market and has been impacted by general economic conditions. In a period of decreasing insurance capacity, insurance carriers typically raise premium rates. This type of market frequently is referred to as a "hard" market. In a period of increasing insurance capacity, insurance carriers tend to reduce premium rates. This type of market frequently is referred to as a "soft" market, which the commercial P&C market has experienced since 2006, with a slight firming of the market in 2012. Because our commission rates usually are calculated as a percentage of the gross premium charged for the insurance products that we place, our revenues are affected by the pricing cycle of the market and the amount of risk that is insured. General economic conditions may impact the amount of risk that is insured by companies by affecting the value of the insured properties, the size of company workforces and the willingness of companies to self-insure certain risks to reduce insurance expenses. The frequency and severity of natural disasters and other catastrophic events can affect the timing, duration and extent of industry cycles for many
19
of the product lines we distribute. It is very difficult to predict the severity, timing or duration of these cycles. The cyclical nature of premium pricing in the commercial P&C insurance market may make our results of operations volatile and unpredictable. To the extent that an economic downturn and/or "soft" market persists for an extended period of time, our Brokerage commissions and fees, financial condition and results of operations may be materially and adversely affected.
We may experience reductions in the commission revenues we receive from risk-bearing insurance companies as these insurance companies seek to reduce their expenses by reducing commission rates payable to non-affiliated brokers or agents such as us, which may significantly affect the profitability of our Brokerage business.
As traditional risk-bearing insurance companies continue to outsource the production of premium revenues to non-affiliated brokers or agents such as us, those insurance companies may seek to reduce further their expenses by reducing the commission rates payable to those insurance agents or brokers. The reduction of these commission rates, along with general volatility and/or declines in premiums, may significantly affect the profitability of our Brokerage business. Because we do not determine the timing or extent of premium pricing changes, we may not be able to accurately forecast our commission revenues, including whether they will significantly decline. As a result, we may have to adjust our budgets to account for unexpected changes in revenues, and any decreases in premium rates may have a material adverse effect on our results of operations.
The loss of the services of any of our highly qualified brokers could harm our business and operating results.
Our future performance depends on our ability to recruit and retain highly qualified brokers, including brokers who work in the businesses that we have acquired or may acquire in the future. Competition for productive brokers is intense, and our inability to recruit or retain these brokers could harm our business and operating results. While many of our senior brokers own an equity interest in us and many have entered into employment agreements with us, these brokers may not serve the term of their employment agreements or renew their employment agreements upon expiration. Moreover, any of the brokers who leave our firm may not comply with the provisions of their employment agreements that preclude them from competing with us or soliciting our customers and employees, or these provisions may not be enforceable under applicable law or sufficient to protect us from the loss of any business. In addition, we do not have employment, non-competition or non-solicitation agreements with all of our brokers. We may not be able to retain or replace the business generated by a broker who leaves our firm or replace that broker with an equally qualified broker who is acceptable to our clients.
Because our Brokerage business is highly concentrated in California, adverse economic conditions or regulatory changes in that state could materially and adversely affect our financial condition, results of operations and cash flows.
A significant portion of our Brokerage business is concentrated in California. We believe the regulatory environment for insurance intermediaries in California currently is no more restrictive than in other states. The insurance business is a state-regulated industry, and therefore, state legislatures may enact laws, and state insurance regulators may adopt regulations, that adversely affect the profitability of insurance industries in their states. Because our Brokerage business is concentrated in a few states, we face greater exposure to unfavorable changes in regulatory conditions in those states than insurance intermediaries whose operations are more diversified through a greater number of states. In addition, the occurrence of adverse economic conditions, natural or other disasters, or other circumstances specific to or otherwise significantly impacting these states could have a material adverse effect on our financial condition, results of operations and cash flows.
If insurance carriers begin to transact business without relying on wholesale insurance brokers, our business, results of operations, financial condition and cash flows could suffer.
Our Brokerage business acts as an intermediary between retail agents and insurance carriers that, in some cases, will not transact business directly with retail insurance brokers and agents. If insurance carriers change the way they conduct business and begin to transact business with retail agents without including us or if retail agents are enabled to transact business directly with insurance carriers as a result of changes in the surplus lines and specialty insurance markets, technological advancements or other factors, our role in the distribution of surplus lines and specialty insurance products could be eliminated or substantially reduced, and our business, results of operations, financial condition and cash flows could suffer. In addition, if insurers retain more risk or cede risks that have traditionally been placed facultatively to treaty reinsurance arrangements, then revenue and cash flow attributable to eReinsure could suffer.
Our growth strategy may involve opening or acquiring new offices and expanding internationally and will involve hiring new brokers and underwriters for our Brokerage business, which will require substantial investment by us and may materially and adversely affect our results of operations and cash flows.
Our ability to grow our Brokerage business organically depends in part on our ability to open or acquire new offices, expand internationally and recruit new brokers and underwriters. We may not be successful in any efforts to open new offices, expand internationally or hire new brokers or underwriters. The costs of opening a new office, expanding internationally and hiring the necessary personnel to staff the office can be substantial, and we often are required to commit to multi-year, non-cancelable lease agreements. It has been our experience that our new Brokerage offices may not achieve profitability on a stand-alone basis until they have been in operation for at least three years. In addition, we often hire new brokers and underwriters with the expectation that they will not become profitable until 12 months after they are hired. The cost of investing in new offices, brokers and underwriters may have a material
20
adverse effect on our results of operations and cash flows. Moreover, we may not be able to recover our investments or these offices, brokers and underwriters may not achieve profitability.
Our financial results may be materially and adversely affected by the occurrence of catastrophes.
Portions of our Brokerage business involve the placement of insurance policies that cover losses from unpredictable events such as hurricanes, windstorms, hailstorms, earthquakes, fires, industrial explosions, freezes, riots, floods and other man-made or natural disasters, including acts of terrorism. The incidence and severity of these catastrophes in any given period are inherently unpredictable, and climate change could further exacerbate the severity and frequency of weather-related events. We are generally eligible to earn profit commissions, which are commissions we receive from carriers based upon the ultimate profitability of the business that we place with those carriers. The occurrence and severity of catastrophes could impair the amount of profit commissions that we receive in the future which could have a material adverse effect on our results of operations and financial condition. Capacity in the reinsurance market is adversely impacted by catastrophes, which can adversely impact our results of operations.
We are subject to risks related to our profit commission arrangements and other compensation arrangements.
We derive a portion of our Brokerage revenues from profit commissions based on the profitability of the insurance business we place with a carrier. Due to the inherent uncertainty of loss in our industry and changes in underwriting criteria due in part to the high loss ratios experienced by some carriers, we cannot predict the receipt of these profit commissions and the amount of such profit commissions may be less than we anticipated. Because profit commissions affect our revenues, any decrease in such amounts could have a material adverse effect on our results of operations and financial condition.
In addition, other companies have been the subject of investigations regarding profit commission arrangements by various governmental authorities within the past several years. Some of these investigations have focused on whether retail insurance brokers have adequately disclosed to their customers the receipt of profit commissions that are paid by insurance carriers to brokers based on the volume of business placed by the broker with the insurance carrier and other factors. We have not been subject to any investigations that are focused on our disclosure of profit commissions. The legislatures of various states may adopt new laws addressing profit commission arrangements, including laws limiting or prohibiting such arrangements, and adding new or different disclosure of such arrangements to insureds. Various state departments of insurance may also adopt new regulations addressing these matters. While we cannot predict the outcome of future governmental actions regarding commission payment practices or the responses by the market and government regulators, any unfavorable resolution of these matters could have a material adverse effect on our results of operations.
Risks Related to Regulatory and Legal Matters
We are subject to extensive governmental laws and regulations, which increase our costs and could restrict the conduct of our business.
Our operating subsidiaries are subject to extensive regulation and supervision in the jurisdictions in which they do business. Such regulation or compliance could reduce our profitability or limit our growth by increasing the costs of compliance, limiting or restricting the products or services we sell, or the methods by which we sell our services and products, or subjecting our businesses to the possibility of regulatory actions or proceedings. In all jurisdictions, the applicable laws and regulations are subject to amendment or interpretation by regulatory authorities. Generally, such authorities have broad discretion to grant, renew or revoke licenses and approvals and to implement new regulations. We may be precluded or temporarily suspended from carrying on some or all of our activities or otherwise fined or penalized in any jurisdiction in which we operate. We can give no assurances that our businesses can continue to be conducted in each jurisdiction as they have been in the past. Such regulation is generally designed to protect the interests of policyholders. To that end, the laws of the various states establish insurance departments with broad powers with respect to matters, such as:
| • | licensing and authorizing companies and agents to transact business; |
| • | regulating capital and surplus and dividend requirements; |
| • | regulating underwriting limitations; |
| • | regulating the ability of companies to enter and exit markets; |
| • | imposing statutory accounting requirements and annual statement disclosures; |
| • | approving changes in control of insurance companies; |
| • | regulating premium rates, including the ability to increase or maintain premium rates; |
| • | regulating trade billing and claims practices; |
| • | regulating certain transactions between affiliates; |
| • | regulating reinsurance arrangements, including the balance sheet credit that may be taken by the ceding or direct insurer; |
| • | mandating certain insurance benefits; |
| • | regulating the content of disclosures to consumers; |
| • | regulating the type, amounts and valuation of investments; |
| • | mandating assessments or other surcharges for guaranty funds and the ability to recover such assessments in the future through premium increases; |
| • | regulating market conduct and sales practices of insurers and agents, including compensation arrangements; and |
| • | regulating a variety of other financial and non-financial components of an insurer's business. |
21
Our non-insurance operations and certain aspects of our insurance operations are subject to various other federal and state regulations, including state and federal consumer protection, privacy and other laws.
An insurer's ability to write new business is partly a function of its statutory surplus. Maintaining appropriate levels of surplus as measured by Statutory Accounting Principles is considered important by insurance regulatory authorities and the private agencies that rate insurers' claims-paying abilities and financial strength. Failure to maintain certain levels of statutory surplus could result in increased regulatory scrutiny, a downgrade by rating agencies or enforcement action by regulatory authorities.
We may be unable to maintain all required licenses and approvals and, despite our best efforts, our business may not fully comply with the wide variety of applicable laws and regulations or the relevant regulators' interpretations of such laws and regulations. Also, some regulatory authorities have relatively broad discretion to grant, renew or revoke licenses and approvals or to limit or restrain operations in their jurisdiction. If we do not have the requisite licenses and approvals or do not comply with applicable regulatory requirements, the insurance regulatory authorities could preclude or temporarily suspend us from operating, limit some or all of our activities or financially penalize us. These types of actions could have a material adverse effect on our results of operations and financial condition.
Failure to protect our clients' confidential information and privacy could result in the loss of our reputation and customers, reduction in our profitability and subject us to fines, penalties and litigation and adversely affect our results of operations and financial condition.
We retain confidential information in our information systems, and we are subject to a variety of privacy regulations and confidentiality obligations. For example, some of our activities are subject to the privacy regulations of the Gramm-Leach-Bliley Act. We also have contractual obligations to protect confidential information we obtain from our clients. These obligations generally require us, in accordance with applicable laws, to protect such information to the same extent that we protect our own confidential information. We have implemented physical, administrative and logical security systems with the intent of maintaining the physical security of our facilities and systems and protecting our, our clients' and their customers' confidential information and personally-identifiable information against unauthorized access through our information systems or by other electronic transmission or through the misdirection, theft or loss of data. Despite such efforts, we may be subject to a breach of our security systems that results in unauthorized access to our facilities and/or the information we are trying to protect. Anyone who is able to circumvent our security measures and penetrate our information systems could access, view, misappropriate, alter, or delete any information in the systems, including personally identifiable customer information and proprietary business information. In addition, most states require that customers be notified if a security breach results in the disclosure of personally-identifiable customer information. Any compromise of the security of our information systems that results in inappropriate disclosure of such information could result in, among other things, unfavorable publicity and damage to our reputation, governmental inquiry and oversight, difficulty in marketing our services, loss of clients, significant civil and criminal liability and the incurrence of significant technical, legal and other expenses, any of which may have a material adverse effect on our results of operations and financial condition.
Changes in regulation may adversely affect our business, results of operations and financial condition and limit our growth.
Legislation or other regulatory reform that increases the regulatory requirements imposed on us or that changes the way we are able to do business may significantly harm our business or results of operations in the future. If we were unable for any reason to comply with these requirements, it could result in substantial costs to us and may have a material adverse effect on our results of operations and financial condition. Legislative or regulatory changes that could significantly harm us and our subsidiaries include, but are not limited to:
| • | prohibiting retailers from providing debt cancellation policies or other ancillary products; |
| • | prohibiting insurers from fronting captive reinsurance arrangements; |
| • | placing or reducing interest rate caps on the consumer finance products our clients offer; |
| • | limitations or imposed reductions on premium levels or the ability to raise premiums on existing policies; |
| • | increases in minimum capital, reserves and other financial viability requirements; |
| • | impositions of increased fines, taxes or other penalties for improper licensing, the failure to promptly pay claims, however defined, or other regulatory violations; |
| • | increased licensing requirements; |
| • | restrictions on the ability to offer certain types of products; |
| • | new or different disclosure requirements on certain types of products; and |
| • | imposition of new or different requirements for coverage determinations. |
In recent years, the state insurance regulatory framework has come under increased federal scrutiny and some state legislatures have considered or enacted laws that may alter or increase state authority to regulate insurance companies and insurance holding companies. Further, the National Association of Insurance Commissioners ("NAIC") and state insurance regulators are re-examining existing laws and regulations, specifically focusing on modifications to holding company regulations, interpretations of existing laws and the development of new laws and regulations. Additionally, there have been attempts by the NAIC and several states to limit the use of discretionary clauses in policy forms. The elimination of discretionary clauses could increase our costs under our Payment Protection products. New interpretations of existing laws and the passage of new legislation may harm our ability to sell new services and products and increase our claims exposure on policies we issued previously. In addition, the NAIC's proposed expansion of the Market Conduct
22
Annual Statement could increase the likelihood of examinations of insurance companies operating in niche markets. Court decisions that impact the insurance industry could result in the release of previously protected confidential and privileged information by departments of insurance, which could increase the risk of litigation.
Traditionally, the U.S. federal government has not directly regulated the business of insurance. However, federal legislation and administrative policies in several areas can significantly and adversely affect insurance companies. These areas include financial services regulation, securities regulation, privacy, tort reform legislation and taxation. In view of recent events involving certain financial institutions and the financial markets, Congress passed and the President signed into law the Dodd-Frank Act, which provides for the enhanced federal supervision of financial institutions, including insurance companies in certain circumstances, and financial activities that represent a systemic risk to financial stability or the U.S. economy.
Under the Dodd-Frank Act, the Federal Insurance Office was established within the U.S. Treasury Department to monitor all aspects of the insurance industry and its authority would likely extend to all lines of insurance that our insurance subsidiaries write. The director of the Federal Insurance Office will serve in an advisory capacity to the Financial Stability Oversight Council and have the ability to recommend that an insurance company or an insurance holding company be subject to heightened prudential standards by the Federal Reserve, if it is determined that financial distress at the company could pose a threat to the financial stability of the U.S. economy. The Dodd-Frank Act also provides for the preemption of state laws when inconsistent with certain international agreements and would streamline the regulation of reinsurance and surplus lines insurance. At this time, we cannot assess whether any other proposed legislation or regulatory changes will be adopted, or what impact, if any, the Dodd-Frank Act or any other legislation or changes could have on our results of operations, financial condition or liquidity.
With regard to payment protection products, there are federal and state laws and regulations that govern the disclosures related to lenders' sales of those products. Our ability to administer those products on behalf of financial institutions is dependent upon their continued ability to sell those products. To the extent that federal or state laws or regulations change to restrict or prohibit the sale of these products, our administration services and fees revenues would be adversely affected. The Dodd-Frank Act created a new Consumer Financial Protection Bureau ("CFPB") designed to add new regulatory oversight for these lender products. Recently, the CFPB's enforcement actions have resulted in large refunds and civil penalties against financial institutions in connection with their marketing of payment protection and other products. Due to such regulatory actions, some lenders may reduce their sales and marketing of payment protection and other ancillary products, which may adversely affect our administration services and fees revenues. The full impact of the CFPB's oversight is unpredictable and has not yet been realized fully.
Further, in a time of financial uncertainty or a prolonged economic downturn, regulators may choose to adopt more restrictive insurance laws and regulations. For example, insurance regulators may choose to restrict the ability of insurance subsidiaries to make payments to their parent companies or reject rate increases due to the economic environment.
With respect to the P&C insurance policies our Payment Protection business underwrites, federal legislative proposals regarding National Catastrophe Insurance, if adopted, could reduce the business need for some of the related products we provide. Additionally, as the U.S. Congress continues to respond to the recent housing foreclosure crisis, it could enact legislation placing additional barriers on creditor-placed insurance.
In recent years, several large organizations became subjects of intense public scrutiny due to high-profile data security breaches involving sensitive financial and health information. These events focused national attention on identity theft and the duty of organizations to notify impacted consumers in the event of a data security breach. Existing legislation in most states requires customer notification in the event of a data security breach. In addition, some states are adopting laws and regulations requiring minimum information security practices with respect to the collection and storage of personally-identifiable consumer data, and several bills before Congress contain provisions directed to national information security standards and breach notification requirements. Several significant legal, operational and reputational risks exist with regard to a data breach and customer notification. A breach of data security requiring public notification can result in regulatory fines, penalties or sanctions, civil lawsuits, loss of reputation, loss of clients and reduction of our profitability.
Our business is subject to risks related to litigation and regulatory actions.
We may be materially and adversely affected by judgments, settlements, unanticipated costs or other effects of legal and administrative proceedings now pending or that may be instituted in the future, or from investigations by regulatory bodies or administrative agencies. From time to time, we have had inquiries from regulatory bodies and administrative agencies relating to the operation of our business. Such inquiries may result in various audits, reviews and investigations. An adverse outcome of any investigation by, or other inquiries from, such bodies or agencies could have a material adverse effect on us and result in the institution of administrative or civil proceedings, sanctions and the payment of fines and penalties, changes in personnel, and increased review and scrutiny of us by our clients, regulatory authorities, potential litigants, the media and others.
23
In particular, our insurance-related operations are subject to comprehensive regulation and oversight by insurance departments in jurisdictions in which we do business. These insurance departments have broad administrative powers with respect to all aspects of the insurance business and, in particular, monitor the manner in which an insurance company offers, sells and administers its products. Therefore, we may from time to time be subject to a variety of legal and regulatory actions relating to our current and past business operations, including, but not limited to:
| • | disputes over coverage or claims adjudication; |
| • | disputes over claim payment amounts and compliance with individual state regulatory requirements; |
| • | disputes regarding sales practices, disclosures, premium refunds, licensing, regulatory compliance, underwriting and compensation arrangements; |
| • | disputes with taxation and insurance authorities regarding our tax liabilities; |
| • | periodic examinations of compliance with applicable federal and state laws; and |
| • | industry-wide investigations regarding business practices including, but not limited to, the use of finite reinsurance and the marketing and refunding of insurance policies or certificates of insurance. |
The prevalence and outcomes of any such actions cannot be predicted, and such actions or any litigation may have a material adverse effect on our results of operations and financial condition. In addition, if we were to experience difficulties with our relationship with a regulatory body in a given jurisdiction, it could have a material adverse effect on our ability to do business in that jurisdiction.
In addition, plaintiffs continue to bring new types of legal claims against insurance and related companies. Current and future court decisions and legislative activity may increase our exposure to these types of claims. Multi-party or class action claims may present additional exposure to substantial economic, non-economic and/or punitive damage awards. The success of even one of these claims, if it resulted in a significant damage award or a detrimental judicial ruling could have a material adverse effect on our results of operations and financial condition. This risk of potential liability may make reasonable settlements of claims more difficult to obtain. We cannot determine with any certainty what new theories of liability or recovery may evolve or what their impact may be on our businesses.
We cannot predict at this time the effect that current litigation, investigations and regulatory activity will have on the industries in which we operate or our business. In light of the regulatory and judicial environments in which we operate, we will likely become subject to further investigations and lawsuits from time to time in the future. Our involvement in any investigations and lawsuits would cause us to incur legal and other costs and, if we were found to have violated any laws, we could be required to pay fines and damages, perhaps in material amounts. In addition, we could be materially and adversely affected by the negative publicity for the insurance and other financial services industries related to any such proceedings and by any new industry-wide regulations or practices that may result from any such proceedings.
Our cash and cash equivalents could be adversely affected if the financial institutions with which our cash and cash equivalents are deposited fail.
We maintain cash and cash equivalents with major third party financial institutions, including interest-bearing money market accounts. In the United States, these accounts were fully insured by the Federal Deposit Insurance Corporation ("FDIC") regardless of account balance through the Transaction Account Guarantee ("TAG") program created by Dodd-Frank § 343. The expiration of the TAG program on December 31, 2012, caused the FDIC's standard insurance limit of $250,000 per depositor per institution to be reimposed on January 1, 2013. Thus, our accounts containing cash and cash equivalents may exceed the FDIC's standard $250,000 insurance limit from time to time.
Risks Related to Our Indebtedness
Our indebtedness may limit our financial and operating activities and may materially and adversely affect our ability to incur additional debt to fund future needs.
Our debt service obligations vary annually based on the amount of our indebtedness and the associated fixed and floating interest rates. See "Management Discussion & Analysis -- Liquidity and Capital Resources -- Liquidity" regarding the amount of outstanding debt and our annual debt service. Our total indebtedness was $124.4 million at December 31, 2012 compared to $108.0 million at December 31, 2011. Although we believe that our current cash flow will be sufficient to cover our annual interest expense, any increase in our indebtedness or any decline in the amount of cash available increases the possibility that we could not pay, when due, the principal of, interest on or other amounts due with respect to our indebtedness. In addition, our indebtedness and any future indebtedness we may incur could:
| • | make it more difficult for us to satisfy our obligations with respect to our indebtedness, including financial and other restrictive covenants, which could result in an event of default under the agreements governing our indebtedness; |
| • | make us more vulnerable to adverse changes in general economic, industry and competitive conditions and adverse changes in government regulation; |
| • | require us to dedicate a substantial portion of our cash flow from operations to payments on our indebtedness, thereby reducing the availability of our cash flows to fund working capital, capital expenditures, acquisitions and other general corporate purposes; |
| • | limit our flexibility in planning for, or reacting to, changes in our business and the industry in which we operate; |
| • | place us at a competitive disadvantage compared to competitors that have less debt; and |
24
| • | limit our ability to borrow additional amounts for working capital, capital expenditures, acquisitions, debt service requirements, execution of our business strategy or other purposes. |
Any of the above-listed factors could have a material adverse effect on our business, financial condition, results of operations and cash flows.
Increases in interest rates could increase interest payable under our variable rate indebtedness.
We are subject to interest rate risk in connection with our variable rate indebtedness. See "QUANTITATIVE AND QUALITATIVE DISCLOSURES ABOUT MARKET RISK- Interest Rate Risk" regarding our interest rate risk and "MANAGEMENT'S DISCUSSION AND ANALYSIS OF FINANCIAL CONDITION AND RESULTS OF OPERATIONS - Liquidity and Capital Resources - Liquidity" regarding the amount of outstanding variable rate debt. Interest rate changes could increase the amount of our interest payments and thus negatively impact our future earnings and cash flows. If we do not have sufficient earnings, we may be required to refinance all or part of our existing debt, sell assets, borrow more money or sell more securities, none of which we can guarantee we will be able to do.
We may enter into hedging transactions that may become ineffective which adversely impact our financial condition.
Part of our interest rate risk strategy involves entering into hedging transactions to mitigate the risk of variable interest rate instruments by converting the variable interest rate to a fixed interest rate. Each hedging item must be regularly evaluated for hedge effectiveness. If it is determined that a hedging transaction is ineffective, we may be required to record losses reflected in our results of operations which could adversely impact our financial condition.
Despite our indebtedness levels, we and our subsidiaries may still be able to incur more indebtedness, which could further exacerbate the risks related to our indebtedness described above.
We and our subsidiaries may be able to incur substantial additional indebtedness in the future subject to the limitations contained in the agreements governing our indebtedness. If we or our subsidiaries incur additional debt, the risks that we and they now face as a result of our indebtedness could intensify.
Restrictive covenants in the agreements governing our indebtedness may restrict our ability to pursue our business strategies.
The agreements governing our indebtedness contain a number of restrictive covenants that impose significant operating and financial restrictions on us and may limit our ability to pursue our business strategies or undertake actions that may be in our best interests. The agreements governing our indebtedness include covenants restricting, among other things, our ability to:
| • | incur or guarantee additional debt; |
| • | incur liens; |
| • | complete mergers, consolidations and dissolutions; |
| • | sell certain of our assets that have been pledged as collateral; and |
| • | undergo a change in control. |
Our assets have been pledged to secure some of our existing indebtedness.
Our credit facility, entered into in August 2012, with Wells Fargo Bank is secured by substantially all of our property and assets and property and assets owned by LOTS Intermediate Co. and certain of our subsidiaries that act as guarantors of our existing indebtedness. Such assets include the stock of LOTS Intermediate Co. and the right, title and interest of the borrowers and each guarantor in their respective material real estate property, fixtures, accounts, equipment, investment property, inventory, instruments, general intangibles, intellectual property, money, cash or cash equivalents, software and other assets and, in each case, the proceeds thereof, subject to certain exceptions. In the event of a default under our indebtedness, the lender could foreclose against the assets securing such obligations. A foreclosure on these assets would have a material adverse effect on our business, financial condition, results of operations and cash flows.
Risks Related to Our Technology and Intellectual Property
Our information systems may fail or their security may be compromised, which could damage our business and materially and adversely affect our results of operations and financial condition.
Our business is highly dependent upon the effective operation of our information systems and our ability to store, retrieve, process and manage significant databases and expand and upgrade our information systems. We rely on these systems throughout our businesses for a variety of functions, including marketing and selling our Payment Protection products, providing our BPO services, providing eReinsure's services to the reinsurance market, managing our operations, processing claims and applications, providing information to clients, performing actuarial analyses and maintaining financial records. The interruption or loss of our information processing capabilities through the loss of stored data, programming errors, the breakdown or malfunctioning of computer equipment or software systems, telecommunications failure or damage caused by weather or natural disasters or any other significant disruptions could harm our business, ability to generate revenues, client relationships, competitive position and reputation. Although we have additional data processing locations in Jacksonville, Florida and Atlanta, Georgia, disaster recovery procedures and insurance to protect against certain contingencies, such measures may not be effective or insurance may not continue to be available at reasonable prices, cover all such
25
losses or be sufficient to compensate us for the loss of business that may result from any failure of our information systems. In addition, our information systems may be vulnerable to physical or electronic intrusions, computer viruses or other attacks which could disable our information systems and our security measures may not prevent such attacks. The failure of our systems as a result of any security breaches, intrusions or attacks could cause significant interruptions to our operations, which could result in a material adverse effect on our business, results of operations and financial condition.
The failure to effectively maintain and modernize our systems to keep up with technological advances could materially and adversely affect our business.
Our businesses are dependent upon our ability to ensure that our information systems keep up with technological advances. Our ability to keep our systems integrated with those of our clients is critical to the success of our businesses. If we do not effectively maintain our systems and update them to address technological advancements, our relationships and ability to do business with our clients may be materially and adversely affected. Our businesses depend significantly on effective information systems, and we have many different information systems for our various businesses. We must commit significant resources to maintain and enhance existing information systems and develop new systems that allow us to keep pace with continuing changes in information processing technology, evolving industry, regulatory and legal standards and changing client preferences. A failure to maintain effective and efficient information systems, or a failure to efficiently and effectively consolidate our information systems and eliminate redundant or obsolete applications, could have a material adverse effect on our results of operations and financial condition or our ability to do business in particular jurisdictions. If we do not effectively maintain adequate systems, we could experience adverse consequences, including:
| • | the inability to effectively market and price our services and products and make underwriting and reserving decisions; |
| • | the loss of existing clients; |
| • | difficulty attracting new clients; |
| • | regulatory problems, such as a failure to meet prompt payment obligations; |
| • | internal control problems; |
| • | exposure to litigation; |
| • | security breaches resulting in loss of data; and |
| • | increases in administrative expenses. |
Our success will depend, in part, on our ability to protect our intellectual property rights and our ability not to infringe upon the intellectual property rights of third parties.
The success of our business will depend, in part, on preserving our trade secrets, maintaining the security of our know-how and data and operating without infringing upon patents and proprietary rights held by third parties. Failure to protect, monitor and control the use of our intellectual property rights could cause us to lose a competitive advantage and incur significant expenses. We rely on a combination of contractual provisions, confidentiality procedures and copyright, trademark, service mark and trade secret laws to protect the proprietary aspects of our brands, technology and data. These legal measures afford only limited protection, and competitors or others may gain access to our intellectual property and proprietary information.
Our trade secrets, data and know-how could be subject to unauthorized use, misappropriation, or disclosure. Our trademarks could be challenged, forcing us to re-brand our services or products, resulting in loss of brand recognition and requiring us to devote resources to advertising and marketing new brands or licensing. If we are found to have infringed upon the intellectual property rights of third parties, we may be subject to injunctive relief restricting our use of affected elements of intellectual property used in the business, or we may be required to, among other things, pay royalties or enter into licensing agreements in order to obtain the rights to use necessary technologies, which may not be possible on commercially reasonable terms, or redesign our systems, which may not be feasible.
Furthermore, litigation may be necessary to enforce our intellectual property rights, to protect our trade secrets and to determine the validity and scope of our proprietary rights. The intellectual property laws and other statutory and contractual arrangements we currently depend upon may not provide sufficient protection in the future to prevent the infringement, use or misappropriation of our trademarks, data, technology and other services and products. Policing unauthorized use of intellectual property rights can be difficult and expensive, and adequate remedies may not be available. Any future litigation, regardless of outcome, could result in substantial expense and diversion of resources with no assurance of success and could have a material adverse effect on our business, results of operation and financial condition.
Risks Related to Our Common Stock
There may not be an active, liquid trading market for our common stock.
Prior to our Initial Public Offering, there had been no public market for shares of our common stock. We cannot predict the extent to which investor interest in the Company will continue to maintain a trading market on the New York Stock Exchange ("NYSE") or how liquid that market may continue to be. If an active trading market in our common stock does not continue, you may have difficulty selling any of our common stock that you purchase.
As a public company, we are subject to additional financial and other reporting and corporate governance requirements that may be difficult for us to satisfy.
26
We are required to file with the SEC, annual and quarterly information and other reports that are specified in the Exchange Act. We are required to ensure that we have the ability to prepare financial statements that are fully compliant with all SEC reporting requirements on a timely basis. We are subject to other reporting and corporate governance requirements, including the requirements of the NYSE and certain provisions of the Sarbanes-Oxley Act of 2002 ("SOX") and the regulations promulgated thereunder, which impose significant compliance obligations upon us. Should we fail to comply with these rules and regulations we may face de-listing from the NYSE and face disciplinary actions from the SEC which may adversely affect our stock price.
If our internal controls are found to be ineffective, our financial results or our stock price may be adversely affected.
Our most recent evaluation resulted in our conclusion that as of December 31, 2012, we were not in compliance with Section 404 of SOX. Our management concluded that our internal control over financial reporting was ineffective as of December 31, 2012.
We have identified material weaknesses in our internal control over financial reporting, which have required management resources to be diverted to efforts to remediate these material weaknesses.
During the course of year end accounting procedures for the fiscal year ended December 31, 2012, and as discussed in Item 9A, "Controls and Procedures," of this Annual Report on Form 10-K, we have identified control deficiencies relating to a) the application of generally accepted accounting principles in a timely and accurate manner in the reporting of revenue, member benefit claims, and commissions of our Motor Clubs division, and b) the support and verification of retrospective commission accrual estimates in our Payment Protection segment. . Management has concluded that these control deficiencies constituted material weaknesses in internal control over financial reporting as of December 31, 2012. A "material weakness in internal control over financial reporting" is one or more deficiencies in a process that create a reasonable possibility that a material misstatement of a company's annual or interim financial statements will not be prevented or detected in a timely manner. The deficiency in the application of our controls relating to the timely application of accounting principles generally accepted in the United States of America ("U.S .GAAP") for revenue recognition of our Motor Clubs division on a gross basis rather than net resulted in a material misstatement of line item amounts in previously reported Consolidated Statements of Income, which have been restated herein. This material misstatement of our financial statements was not prevented or detected by us in the normal course of our financial statement close process. The deficiencies relating to retrospective commissions did not result in errors in prior period financial statements but we have determined that controls were not adequate to prevent or detect a material misstatement.
While we believe that the remediation efforts we have recently instituted are adequate to correct the problems we have identified, we cannot be certain that these efforts will eliminate the material weaknesses we identified or ensure that we design, implement and maintain adequate controls over our financial processes and reporting in the future. There is also no assurance that we will not discover additional material weaknesses in our controls and procedures in the future.
Our principal stockholder has substantial control over us.
Affiliates of Summit Partners collectively and beneficially own approximately 63.2% of our outstanding common stock at December 31, 2012. As a consequence, Summit Partners or its affiliates continue to be able to exert a significant degree of influence or actual control over our management and affairs and matters requiring stockholder approval, including the election of directors, a merger, consolidation or sale of all or substantially all of our assets, and any other significant transaction. The interests of this stockholder may not always coincide with our interests or the interests of our other stockholders. For instance, this concentration of ownership may have the effect of delaying or preventing a change in control of us otherwise favored by our other stockholders and could depress our stock price.
We expect that our stock price will fluctuate significantly, which could cause a decline in the stock price, and holders of our common stock may not be able to resell shares at or above the cost of such shares.
Securities markets worldwide have experienced, and are likely to continue to experience, significant price and volume fluctuations. This market volatility, as well as general economic, market or political conditions, could reduce the market price of our common stock regardless of our operating performance. The trading price of our common stock may be volatile and subject to wide price fluctuations in response to various factors, including:
| • | market conditions in the broader stock market; |
| • | actual or anticipated fluctuations in our quarterly financial and operating results; |
| • | introduction of new products or services by us or our competitors; |
| • | issuance of new or changed securities analysts' reports or recommendations; |
| • | investor perceptions of us and the industries in which we operate; |
| • | sales, or anticipated sales, of large blocks of our stock; |
| • | additions or departures of key personnel; |
| • | regulatory or political developments; |
| • | litigation and governmental investigations; and |
| • | changing economic conditions. |
These and other factors may cause the market price and demand for our common stock to fluctuate substantially, which may limit or prevent investors from readily selling their shares of common stock and may otherwise negatively affect the liquidity of our common stock. In addition, in the past, when the market price of a stock has been volatile, holders of that stock have sometimes instituted
27
securities class action litigation against the company that issued the stock. If any of our stockholders brought a lawsuit against us, we could incur substantial costs defending the lawsuit. Such a lawsuit could also divert the time and attention of our management from our business, which could significantly harm our results of operations and reputation.
If a substantial number of shares become available for sale and are sold in a short period of time, the market price of our common stock could decline.
At December 31, 2012, we had 20,710,370 shares of common stock outstanding, including shares held in treasury, with our directors, executive officers and affiliates holding a significant majority of these shares. If our stockholders sell substantial amounts of our common stock in the public market, the market price of our common stock could decrease significantly. The perception in the public market that our existing stockholders might sell shares of common stock could also depress the market price of our common stock. A decline in the market price of our common stock might impede our ability to raise capital through the issuance of additional shares of our common stock or other equity securities.
If securities or industry analysts do not publish research or reports about our business, publish research or reports containing negative information about our business, adversely change their recommendations regarding our stock or if our results of operations do not meet their expectations, our stock price and trading volume could decline.
The trading market for our common stock is influenced by the research and reports that industry or securities analysts publish about us or our business. If one or more of these analysts cease coverage of our Company or fail to publish reports on us regularly, we could lose visibility in the financial markets, which in turn could cause our stock price or trading volume to decline. Moreover, if one or more of the analysts who cover us downgrade our stock, or if our results of operations do not meet their expectations, our stock price could decline.
Some provisions of Delaware law and our amended and restated certificate of incorporation and bylaws may deter third parties from acquiring us and diminish the value of our common stock.
Our amended and restated certificate of incorporation and bylaws provide for, among other things:
| • | restrictions on the ability of our stockholders to call a special meeting and the business that can be conducted at such meeting; |
| • | restrictions on the ability of our stockholders to remove a director or fill a vacancy on the Board of Directors; |
| • | our ability to issue preferred stock with terms that the Board of Directors may determine, without stockholder approval; |
| • | the absence of cumulative voting in the election of directors; |
| • | a prohibition of action by written consent of stockholders unless such action is recommended by all directors then in office; and |
| • | advance notice requirements for stockholder proposals and nominations. |
These provisions in our amended and restated certificate of incorporation and bylaws may discourage, delay or prevent a transaction involving a change in control of the Company that is in the best interest of our non-controlling stockholders. Even in the absence of a takeover attempt, the existence of these provisions may adversely affect the prevailing market price of our common stock if they are viewed as discouraging future takeover attempts.
Applicable insurance laws may make it difficult to effect a change in control of us.
State insurance regulatory laws contain provisions that require advance approval, by the state insurance commissioner, of any change in control of an insurance company that is domiciled, or, in some cases, having such substantial business that it is deemed to be commercially domiciled, in that state. We own, directly or indirectly, all of the shares of stock of insurance companies domiciled in Delaware, Georgia, Mississippi and Louisiana, and 85% of the shares of stock of an insurance company domiciled in Kentucky. Because any purchaser of shares of our common stock representing 10% or more of the voting power of the capital stock of Fortegra generally will be presumed to have acquired control of these insurance company subsidiaries, the insurance change in control laws of California, Delaware, Georgia, Louisiana and Kentucky would apply to such a transaction.
In addition, the laws of many states contain provisions requiring pre-notification to state agencies prior to any change in control of a non-domestic insurance company subsidiary that transacts business in that state. While these pre-notification statutes do not authorize the state agency to disapprove the change in control, they do authorize issuance of cease and desist orders with respect to the non-domestic insurer if it is determined that conditions, such as undue market concentration, would result from the change in control.
These laws may discourage potential acquisition proposals and may delay, deter or prevent a change of control of the Company, including through transactions, and in particular unsolicited transactions, that some or all of our stockholders might consider to be desirable.
We do not anticipate paying any cash dividends for the foreseeable future.
We currently intend to retain our future earnings, if any, for the foreseeable future, to repay indebtedness and for general corporate purposes. We do not intend to pay any dividends for the foreseeable future to holders of our common stock. As a result, capital appreciation in the price of our common stock, if any, will be your only source of gain on an investment in our common stock.
28
ITEM 1B. UNRESOLVED STAFF COMMENTS
None.
ITEM 2. PROPERTIES
At December 31, 2012, Fortegra Financial leased its principal executive offices located at Deerwood Park Boulevard, Building 100, Jacksonville, Florida, 32256, consisting of approximately 58,000 square feet, which is used by each of our businesses other than Brokerage. In addition, we lease approximately 120,000 square feet of office space in approximately 25 locations principally in the United States. Most of our leases have lease terms ranging from three to eleven years with provisions for renewals. We believe our properties are adequate for our business as presently conducted. Please see the Notes, "Property and Equipment" and "Leases," in the Notes to Consolidated Financial Statements included in Item 8 of this Form 10-K for additional information.
ITEM 3. LEGAL PROCEEDINGS
The information set forth in the Note, "Commitments and Contingencies" of the Notes to Consolidated Financial Statements in Part II, Item 8 of this Form 10-K is incorporated herein by reference.
ITEM 4. MINE SAFETY DISCLOSURES
Not applicable.
EXECUTIVE OFFICERS OF THE REGISTRANT
Fortegra's executive officers as of December 31, 2012, including their age, position held, and principal occupation and employment during the past five years for our executive officers were as follows:
Richard S. Kahlbaugh, age 52, has been our President and Chief Executive Officer and a director since June 2007 and has been our Chairman since June 2010. Prior to becoming President and Chief Executive Officer, Mr. Kahlbaugh was our Chief Operating Officer from 2003 to 2007. He also serves as the Chairman of all of our insurance subsidiaries. Prior to joining us in 2003, Mr. Kahlbaugh served as President and Chief Executive Officer of Volvo's Global Insurance Group. He also served as the first General Counsel of the Walshire Assurance Group, a publicly traded insurance company, and practiced law with McNees, Wallace and Nurick. Mr. Kahlbaugh holds a J.D. from Delaware Law School of Widener University and a B.A. from the University of Delaware. Mr. Kahlbaugh was selected to serve on our board of directors in light of his significant knowledge of our products and markets and his ability to provide valuable insight to our Board of Directors as to day-to-day business issues we face in his role as our Chief Executive Officer.
Walter P. Mascherin, age 58, has been our Executive Vice President and Chief Financial Officer since October 2010. Prior to joining us, Mr. Mascherin worked at Volvo Financial Services for 14 years where he served as Senior Vice President of Organization Development and Workouts from 2009 to 2010, Senior Vice President and Chief Credit Officer from 2006 to 2009, Vice President of Corporate Development (US) in 2006 and Vice President and Chief Operating Officer from 2004 to 2005. Mr. Mascherin holds an M.B.A. from Heriot Watt University, Edinburgh, Scotland and a Business Administration Diploma from Ryerson University, Ontario, Canada.
Christopher D. Romaine, age 41, has been our Senior Vice President, General Counsel and Secretary since June 2011 and was our Associate General Counsel from September 2010. Prior to joining Fortegra, Mr. Romaine acted as Managing Counsel at Toyota Financial Services from 2006 to 2009 and as First Vice President and Senior Counsel at MBNA Corporation from 2002 to 2006. Mr. Romaine holds a J.D. from the University of Pennsylvania School of Law and an A.B., magna cum laude, from Brown University.
Joseph R. McCaw, age 61, has been our Executive Vice President and President of [Payment Protection since November 2008.] He also serves as the Chief Executive Officer of our insurance subsidiaries. Mr. McCaw joined us in 2003 as our First Vice President of Finance/Retail. Prior to joining us, Mr. McCaw served as President of Financial Institution Group for Protective Life Corporation. Mr. McCaw holds an M.B.A. from Lindenwood University and a B.A. from Westminster College.
Robert Abramson, age 60, has been our Executive Vice President and President of Bliss & Glennon since August 2011, and has been a leader of Bliss & Glennon in various capacities since 1977. He served as Director of Bliss & Glennon from March 2009 to August 2011 and as National Director of Excess and Surplus Lines from 2006 to 2009 for HRH, a former parent of Bliss & Glennon. He served as President and owner of Bliss & Glennon from 1993 until selling to HRH. Mr. Abramson graduated with honors with a B.S. in Finance from San Diego State and earned his CPCU designation in 1981.
29
W. Dale Bullard, age 54, has been our Executive Vice President and President of Motor Clubs since January 2013. Mr. Bullard joined us in 1994 as a Senior Vice President and has over 28 years of experience in the insurance industry. Most recently, Mr. Bullard served as our Chief Marketing Officer from May 2006 until assuming his current role. Prior to joining us, Mr. Bullard held various positions at Independent Insurance Group from 1979 to 1994, most recently as a Senior Vice President in 1988. Mr. Bullard holds a B.S. from the University of South Carolina. Mr. Bullard currently serves on the board of directors of the Consumer Credit Insurance Association and previously served as its president.
Robert P. Emery, age 44, has been our Executive Vice President and President of Digital Leash LLC, d/b/a ProtectCELL, since January 2013. Mr. Emery is a co-founder of ProtectCELL and served as ProtectCELL's President from April 2006 to March 2011. Mr. Emery later served as ProtectCELL's COO from March 2011 until working in his current capacity, upon Fortegra's acquisition of a majority interest in ProtectCELL. In addition to his work with ProtectCELL, Mr. Emery is the Owner and President of Emery Electronics Inc., also known as Cellular and More.
Steven R. Wood, age 54, has been our Senior Vice President and Chief Administrative Officer since January 2013. Mr. Wood served as our Assistant Vice President from 1995 to 2005 and more recently as our Vice President of Corporate Initiatives from 2005 to 2010. Mr. Wood moved on to serve as the Director of Franchise Operations for Express Tax, Inc., an H&R Block company, from February 2010 to January 2012. Mr. Wood then rejoined our company in March 2012 as the Director of Project Management, prior to serving in his current capacity. Mr. Wood holds a B.S. in Business Administration from Auburn University.
PART II
ITEM 5. MARKET FOR REGISTRANT'S COMMON EQUITY, RELATED STOCKHOLDER MATTERS AND ISSUER PURCHASES OF EQUITY SECURITIES
Stockholders
Fortegra Financial Corporation's common stock is listed and traded on the NYSE under the symbol "FRF" and began trading on December 17, 2010. At March 14, 2013, there were 19,831,697 shares of our common stock outstanding and approximately 787 stockholders of record.
Price Range of Common Stock and Dividends Declared
The table below sets forth the price high and low sales prices and the last price for the periods indicated for our common stock as reported on the NYSE Composite Tape and any cash dividends declared:
| 2012 | High | Low | Last | Cash Dividends Per Share | ||||||||||||
| First Quarter | $ | 8.45 | $ | 6.49 | $ | 8.36 | $ | — | ||||||||
| Second Quarter | 8.50 | 7.71 | 8.00 | — | ||||||||||||
| Third Quarter | 8.36 | 7.44 | 7.93 | — | ||||||||||||
| Fourth Quarter | 9.17 | 7.94 | 8.89 | — | ||||||||||||
| 2011 | ||||||||||||||||
| First Quarter | $ | 12.20 | $ | 10.72 | $ | 11.36 | $ | — | ||||||||
| Second Quarter | 11.69 | 7.48 | 7.84 | — | ||||||||||||
| Third Quarter | 8.18 | 4.81 | 5.25 | — | ||||||||||||
| Fourth Quarter | 6.80 | 4.91 | 6.68 | — | ||||||||||||
Dividend Policy
We have not declared or paid cash dividends on our common stock in the past three years and do not anticipate paying any cash dividends on our common stock in the foreseeable future. We intend to retain all available funds and any future earnings to reduce debt and fund the development and growth of our business. Any future determination to pay dividends will be at the discretion of our Board of Directors and will take into account: restrictions in our debt instruments; general economic business conditions; our financial condition and results of operations; the ability of our operating subsidiaries to pay dividends and make distributions to us; and such other factors as our Board of Directors may deem relevant.
Sales of Unregistered Securities
During 2012 and 2011, we did not issue any unregistered securities.
30
Issuer Purchases of Equity Securities
As of December 31, 2012, Fortegra had a share repurchase plan which allows the Company to purchase up to $10.0 million of the Company's common stock from time to time through open market or private transactions. The plan was approved by the Board of Directors in November 2011 and provides for shares to be repurchased for general corporate purposes, which may include serving as a resource for funding potential acquisitions and employee benefit plans. The timing, price and quantity of purchases are at our discretion, and the plan may be discontinued or suspended at any time. The following table shows Fortegra's share repurchase plan activity for the three months ended December 31, 2012:
| Period | Total Number of Shares Purchased | Average Price Paid Per Share | Total Number of Shares Purchased as Part of Publicly Announced Plan | Maximum Approximate Dollar Value of Shares that May Yet Be Purchased Under the Plan | ||||||||||||
| 979,634 | $ | 3,524,376 | ||||||||||||||
| October 1, 2012 | to | October 31, 2012 | — | $ | — | — | 3,524,376 | |||||||||
| November 1, 2012 | to | November 30, 2012 | — | — | — | 3,524,376 | ||||||||||
| December 1, 2012 | to | December 31, 2012 | — | — | — | 3,524,376 | ||||||||||
| Total | — | $ | — | 979,634 | ||||||||||||
Equity Compensation Plans
Our 2013 Proxy Statement, for our 2013 Annual Meeting of Stockholders to be filed with the SEC within 120 days after the end of the year ended December 31, 2012, includes information relating to the compensation plans under which our equity securities are authorized for issuance, under the heading "Equity Compensation Plan," and we incorporate such information herein by reference. Please see the Note, "Stock-Based Compensation," in the Notes to the Consolidated Financial Statements included in Item 8 of this Annual Report for additional information relating to our compensation plans under which our equity securities are authorized for issuance.
Comparison of Cumulative Total Return Since the Company's Initial Public Offering
The following performance graph and table do not constitute soliciting material and the performance graph and table should not be deemed filed or incorporated by reference into any other previous or future filings by us under the Securities Act, except to the extent that we specifically incorporate the performance graph and table by reference therein.
The performance graph below compares the cumulative total stockholder return on our common stock with the cumulative total return on the Russell 2000 Index and the Financial Select Sector SPDR Fund for the period beginning on December 17, 2010 (the date our common stock commenced trading on the New York Stock Exchange) through December 31, 2012, assuming an initial investment of $100. Subsequent to our initial public offering in December 17, 2010, we have not declared or paid cash dividends on our common stock, while the data for the Russell 2000 Index and the Financial Select Sector SPDR Fund assumes reinvestment of dividends.
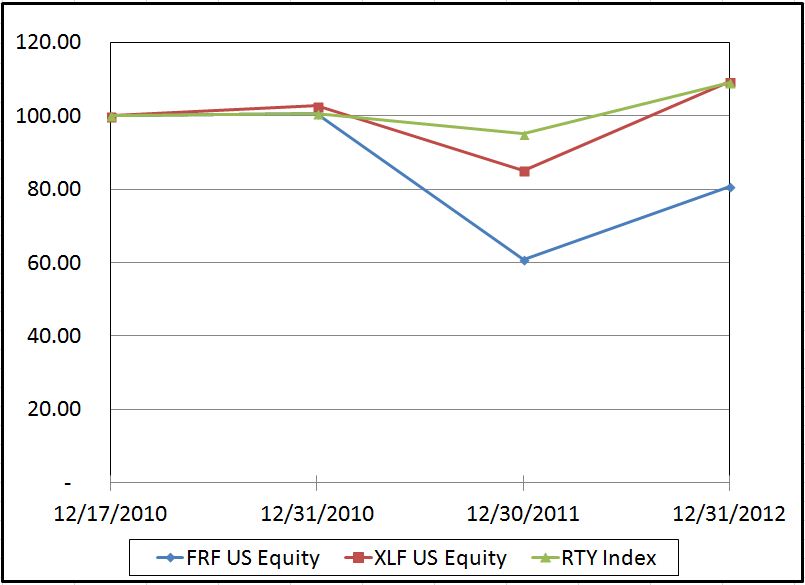
31
| December 17, 2010 | December 31, 2010 | December 30, 2011 | December 31, 2012 | |||||||||
| Fortegra Financial - FRF US Equity | $ | 100.00 | $ | 100.45 | $ | 60.73 | $ | 80.82 | ||||
| Russell 2000 - RTY Index | 100.00 | 100.53 | 95.05 | 108.96 | ||||||||
| Financial Select Sector SPDR Fund - XLF US Equity | 100.00 | 102.70 | 85.10 | 109.28 | ||||||||
ITEM 6. SELECTED FINANCIAL DATA
The following tables set forth our consolidated selected financial data for the periods and as of the dates indicated and are derived from our audited Consolidated Financial Statements. The following consolidated financial data should be read in conjunction with Management's Discussion and Analysis of Financial Condition and Results of Operations ("MD&A") in Part II, Item 7 of this Annual Report and the Consolidated Financial Statements and related Notes included in Part II, Item 8 of this Annual Report. All acquisitions by Fortegra during the five years ended December 31, 2012 are included in results of operations since their respective dates of acquisition.
| (in thousands, except shares and per share amounts) | Years Ended December 31, | ||||||||||||||||||
| Consolidated Statement of Income Data: | 2012 | 2011 (1) | 2010 (1) | 2009 (1) | 2008 (1) | ||||||||||||||
| As restated | As restated | ||||||||||||||||||
| Revenues: | |||||||||||||||||||
| Service and administrative fees | $ | 90,550 | $ | 94,464 | $ | 56,254 | $ | 31,829 | $ | 24,279 | |||||||||
| Brokerage commissions and fees | 35,306 | 34,396 | 24,620 | 16,309 | — | ||||||||||||||
| Ceding commission | 34,825 | 29,495 | 28,767 | 24,075 | 26,215 | ||||||||||||||
| Net investment income | 3,068 | 3,368 | 4,073 | 4,759 | 5,560 | ||||||||||||||
| Net realized investment gains | 3 | 4,193 | 650 | 54 | (1,921 | ) | |||||||||||||
| Net earned premium | 127,625 | 115,503 | 111,805 | 108,116 | 112,774 | ||||||||||||||
| Other income | 269 | 170 | 230 | 971 | 178 | ||||||||||||||
| Total revenues | 291,646 | 281,589 | 226,399 | 186,113 | 167,085 | ||||||||||||||
| Expenses: | |||||||||||||||||||
| Net losses and loss adjustment expenses | 40,219 | 37,949 | 36,035 | 32,566 | 29,854 | ||||||||||||||
| Member benefit claims | 4,642 | 4,409 | 466 | — | — | ||||||||||||||
| Commissions | 128,741 | 126,918 | 92,646 | 70,449 | 81,226 | ||||||||||||||
| Personnel costs | 48,648 | 44,547 | 36,361 | 31,365 | 21,742 | ||||||||||||||
| Other operating expenses | 30,354 | 31,140 | 24,426 | 21,788 | 12,752 | ||||||||||||||
| Depreciation and amortization | 3,933 | 3,077 | 1,396 | 801 | 532 | ||||||||||||||
| Amortization of intangibles | 4,953 | 4,952 | 3,232 | 2,706 | 2,097 | ||||||||||||||
| Interest expense | 6,624 | 7,641 | 8,464 | 7,800 | 7,255 | ||||||||||||||
| Loss on sale of subsidiary | — | 477 | — | — | — | ||||||||||||||
| Total expenses | 268,114 | 261,110 | 203,026 | 167,475 | 155,458 | ||||||||||||||
| Income before income taxes and non-controlling interests | 23,532 | 20,479 | 23,373 | 18,638 | 11,627 | ||||||||||||||
| Income taxes | 8,295 | 7,140 | 8,159 | 6,727 | 4,024 | ||||||||||||||
| Income before non-controlling interests | 15,237 | 13,339 | 15,214 | 11,911 | 7,603 | ||||||||||||||
| Less: net income (loss) attributable to non-controlling interests | 72 | (170 | ) | 20 | 26 | (82 | ) | ||||||||||||
| Net income | $ | 15,165 | $ | 13,509 | $ | 15,194 | $ | 11,885 | $ | 7,685 | |||||||||
| Earnings per share: | |||||||||||||||||||
| Basic | $ | 0.77 | $ | 0.66 | $ | 0.95 | $ | 0.77 | $ | 0.53 | |||||||||
| Diluted | $ | 0.74 | $ | 0.64 | $ | 0.88 | $ | 0.71 | $ | 0.50 | |||||||||
| Weighted average common shares outstanding: | |||||||||||||||||||
| Basic | 19,655,492 | 20,352,027 | 15,929,181 | 15,388,706 | 14,549,703 | ||||||||||||||
| Diluted | 20,600,362 | 21,265,801 | 17,220,029 | 16,645,928 | 15,520,108 | ||||||||||||||
32
| Years Ended December 31, | |||||||||||||||||||
| 2012 | 2011 (1) | 2010 (1) | 2009 (1) | 2008 (1) | |||||||||||||||
| As restated | As restated | ||||||||||||||||||
| Consolidated Statement of Cash Flows Data: | |||||||||||||||||||
| Operating activities | $ | 31,988 | $ | 11,166 | $ | 13,102 | $ | 13,393 | $ | 12,998 | |||||||||
| Investing activities | (59,291 | ) | (45,795 | ) | (29,801 | ) | (26,532 | ) | (26,069 | ) | |||||||||
| Financing activities | 11,173 | 22,579 | 30,148 | 20,997 | (1,875 | ) | |||||||||||||
| (in thousands) | |||||||||||||||||||
| Consolidated Balance Sheet Data: | At December 31, | ||||||||||||||||||
| 2012 | 2011 (1) | 2010 (1) | 2009 (1) | 2008 (1) | |||||||||||||||
| As restated | As restated | ||||||||||||||||||
| Cash and cash equivalents | $ | 15,209 | $ | 31,339 | $ | 43,389 | $ | 29,940 | $ | 22,082 | |||||||||
| Total assets | 728,011 | 605,353 | 535,202 | 473,472 | 436,976 | ||||||||||||||
| Note(s) payable | 89,438 | 73,000 | 36,713 | 31,487 | 20,000 | ||||||||||||||
| Preferred trust securities | 35,000 | 35,000 | 35,000 | 35,000 | 35,000 | ||||||||||||||
| Redeemable preferred securities | — | — | 11,040 | 11,540 | 11,540 | ||||||||||||||
| Total stockholders’ equity | 150,970 | 127,086 | 119,701 | 77,616 | 53,516 | ||||||||||||||
(1) - The December 31, 2008 through 2011 Consolidated Statement of Income Data, Consolidated Statement of Cash Flows Data and Consolidated Balance Sheet Data has been adjusted to properly reflect the retrospective adoption of ASU 2010-26, Accounting for Costs Associated with Acquiring or Renewing Insurance Contracts, as described in the Note, "Restatement of the Consolidated Financial Statements," of Notes to the Consolidated Financial Statements.
ITEM 7. MANAGEMENT'S DISCUSSION AND ANALYSIS OF FINANCIAL CONDITION AND RESULTS OF OPERATIONS
Management's Discussion and Analysis of Financial Condition and Results of Operations ("MD&A") represents an overview of our results of operations and financial condition and should be read in conjunction with the Consolidated Financial Statements and Notes thereto included in Part II, Item 8 of this Form 10-K. Except for the historical information contained herein, the discussions in MD&A contain forward-looking statements that involve risks and uncertainties. Our future results could differ materially from those discussed herein. Factors that could cause or contribute to such differences include, but are not limited to, those discussed in "Item 1A. Risk Factors" of this Form 10-K.
As discussed in Item 8. Financial Statements and Supplementary Data—Notes to Consolidated Financial Statements, in the Note, "Restatement of the Consolidated Financial Statements," we have restated our previously issued audited Consolidated Financial Statements for years ended December 31, 2011 and 2010 and our unaudited quarterly financial information for the quarterly periods ended March 31, June 30 and September 30, for the years 2012, 2011 and 2010, respectively. Accordingly, Management’s Discussion and Analysis of Financial Condition and Results of Operations have been revised for the effects of the restatement.
Executive Summary
Our net income for the year ended December 31, 2012 increased $1.7 million, or 12.3%, to $15.2 million from $13.5 million for the year ended December 31, 2011, with the 2012 results including $1.1 million attributable to the change in accounting estimate associated with income recognition on our unearned premium reserves in the Payment Protection Segment, which is explained in Item 8, in the Note "Summary of Significant Accounting Policies," of the Notes to the Consolidated Financial Statements, and a full year of results from our October 2011 acquisition of PBG, while 2011 includes six months of results from our July 1, 2011 divestiture of CIRG and the related loss on the sale of that subsidiary as well as a higher level of realized gains on the sale of investments. Earnings per diluted share increased 15.6% to $0.74 for the year ended December 31, 2012 from $0.64 for the same period in 2011 and included a $0.05 per diluted share increase from the change in accounting estimate.
For the year ended December 31, 2012, our overall revenues increased $10.1 million, or 3.6%, to $291.6 million from $281.6 million for the same period in 2011, and include a $5.3 million increase in revenues attributable to the change in accounting estimate. This increase was also due to increased net earned premiums, ceding commissions and brokerage commissions, which was partially offset by lower net realized investment gains and net investment income.
33
Total expenses increased $7.0 million, or 2.7%, to $268.1 million for the year ended December 31, 2012 from $261.1 million for the same period in 2011. The majority of the increase was due to increases in commissions of $1.8 million, of which $3.9 million was from the change in accounting estimate, net losses and loss adjustment expenses of $2.3 million, and personnel costs of $4.1 million. Partially offsetting this increase was a reduction of $0.8 million in other operating expenses due to higher acquisition related charges and the loss on the sale of CIRG impacting 2011. Additionally, interest expense decreased $1.0 million due to lower borrowing costs and the effect of the swap, which was partially offset by the $0.7 million charge for previously capitalized transaction costs on the termination of the SunTrust Bank, N.A. revolving credit facility.
On December 31, 2012, we acquired a 62.4% ownership in Digital Leash, LLC, d/b/a ProtectCELL and an option to purchase the remaining 37.6% ownership interest in ProtectCELL after 2014. ProtectCELL provides membership plans that afford protection for mobile wireless devices and other benefits including data management and identity theft protection. ProtectCELL is one of the leaders in mobile device protection plans and will spearhead Fortegra's efforts to expand its warranty and service contract business in the mobile and wireless device space.
On December 31, 2012, we acquired 100% of the outstanding stock ownership of 4Warranty Corporation, a leading warranty and extended service contract administrator with extensive expertise in furniture, electronics, appliance, lawn and garden, and fitness equipment. 4Warranty complements the company's rapidly expanding warranty business within its Payment Protection segment.
On April 24, 2012, we acquired a 100% ownership interest in MHA & Associates LLC, for $0.3 million, obtaining the renewal rights of the business and hiring the prior owner to maintain and increase the block of business.
In addition, we entered into a new five-year $125.0 million secured credit agreement (the "Credit Agreement") in August 2012 with a syndicate of lenders, among them Wells Fargo Bank, N.A., who also serves as administrative agent. This Credit Agreement provides for a $50.0 million term loan facility, as well as a $75.0 million revolving credit facility. The Credit Agreement includes a provision pursuant to which, from time to time, the Borrowers may request that the lenders in their discretion increase the maximum amount of
commitments under the Facilities by an amount not to exceed $50.0 million. In connection with the new Credit Agreement, we terminated our $85.0 million revolving line of credit with SunTrust Bank, N.A. In conjunction with this termination we recorded a charge of $0.7 million to interest expense during 2012 for previously capitalized transaction costs. We feel this new Credit Agreement will give us additional liquidity to further expand our existing businesses and pursue strategic growth plans.
During 2012, we acquired a total of 508,080 shares under our share repurchase plan at an aggregate value of $3.9 million. Our share repurchase plan is an effective method of creating stockholder value and a prudent use of available cash.
In January 2013, we announced a plan to consolidate our fulfillment, claims administration and information technology functions for all our insurance related products (the "Plan"). Prior to the Plan, such functions resided in our individual business units. The decision is part of our efforts to streamline our operations, focus our resources and provide first in class service to our customers. When fully implemented, approximately 40 employee and contract positions will be eliminated.
We estimate the Plan pre-tax costs will range from approximately $1.3 million to $1.7 million, including approximately $1.1 million to $1.3 million of cash payments under existing employment agreements and severance arrangements and approximately $0.2 million to $0.4 million of other cash costs, such as legal, relocation and information technology. We expect that substantially all the costs will be recorded during the three months ending March 31, 2013 and paid during 2013. We also estimate that the Plan will result in annual pre-tax savings of approximately $4.0 million, a substantial majority of which is expected to commence in the first quarter of 2013.
Critical Accounting Policies
We prepare our Consolidated Financial Statements in accordance with generally accepted accounting principles in the United States of America ("U.S. GAAP") which requires management to make significant estimates and assumptions that affect the reported amounts of our assets, liabilities, revenues and expenses. See "Use of Estimates" and "Summary of Significant Accounting Policies" in the Notes to Consolidated Financial Statements, included in Item 8 of this Form 10-K for additional information.
We periodically evaluate our estimates, which are based on historical experience and on various other assumptions that management believes to be reasonable under the circumstances. Critical accounting policies are those that are most important to the portrayal of our financial condition and results of operations and require management's most difficult, subjective or complex judgments, as a result of the need to make estimates about the effect of matters that are inherently uncertain. If actual performance should differ from historical experience or if the underlying assumptions were to change, our financial condition and results of operations may be materially impacted. In addition, some accounting policies require significant judgment to apply complex principles of accounting to certain transactions, such as acquisitions, in determining the most appropriate accounting treatment. We believe that the significant accounting estimates and policies described below are material to our financial reporting and are subject to a degree of subjectivity and/or complexity. We also discuss our critical accounting policies and estimates with the Audit Committee of the Board of Directors.
34
Change in Accounting Estimate - Unearned Premium Reserves for the Payment Protection Segment
During the period ended September 30, 2012, we reviewed our unearned premium reserves in relation to the loss patterns and the related recognition of income for certain types of credit property and vendor single interest payment protection products, and based on our analysis determined that a change to the Rule of 78s method results in a more accurate estimate of net earned premium reserves for these products. The change is being accounted for as a change in accounting estimate and was applied prospectively. See the Note, "Summary of Significant Accounting Policies" of the Notes to the Consolidated Financial Statements of this Form 10-K for the effect of this change in accounting estimate.
Investments
We regularly monitor our investment portfolio to ensure investments that may be other-than-temporarily impaired are identified in a timely fashion, properly valued, and if necessary, written down to their fair value through a charge against earnings in the proper period. The determination that a security has incurred an other-than-temporary decline in fair value requires the judgment of management. The analysis takes into account relevant factors, both quantitative and qualitative in nature. Among the factors considered are the following: the length of time and the extent to which fair value has been less than cost; issuer-specific considerations, including an issuer's short-term prospects and financial condition, recent news that may have an adverse impact on its results, and an event of missed or late payment or default; the occurrence of a significant economic event that may affect the industry in which an issuer participates; and for loan-backed and structured securities, the undiscounted estimated future cash flows as compared to the current book value. When such impairments occur, the decrease in fair value is reported in net income as a realized investment loss and a new cost basis is established.
With respect to securities where the decline in fair value is determined to be temporary and the security's fair value is not written down, a subsequent decision may be made to sell that security and realize a loss. If we do not expect for a security's decline in fair value to be fully recovered prior to the expected time of sale, we would record an other-than-temporary impairment in the period in which the decision to sell is made.
There are inherent risks and uncertainties involved in making these judgments. Changes in circumstances and critical assumptions such as a continued weak economy, a more pronounced economic downturn or unforeseen events which affect one or more companies, industry sectors or countries could result in additional impairments in future periods for other-than-temporary declines in fair value. See the Note, "Investments" in the Notes to the Consolidated Financial Statements included in ITEM 8 of this Form 10-K for additional information and ITEM 1A. RISK FACTORS - "Risks Related to Our Payment Protection Business - Our investment portfolio is subject to several risks that may diminish the fair value of our invested assets and cash and may materially and adversely affect our business and profitability" and "Liquidity and Capital Resources - Liquidity" contained elsewhere in this Form 10-K.
Reinsurance
Reinsurance receivables include amounts related to paid benefits and estimated amounts related to unpaid policy and contract claims, future policyholder benefits and policyholder contract deposits. The cost of reinsurance is accounted for over the terms of the underlying reinsured policies using assumptions consistent with those used to account for the underlying policies. Amounts recoverable from reinsurers are estimated in a manner consistent with claim and claim adjustment expense reserves or future policy benefits reserves and are reported in our Consolidated Balance Sheets. In the ordinary course of business, we are involved in both the assumption and cession of reinsurance with non-affiliated companies, including reinsurance companies owned by our clients.
| The following table reflects the components of the reinsurance receivables: | At December 31, | ||||||
| 2012 | 2011 | ||||||
| Prepaid reinsurance premiums (1): | |||||||
| Life | $ | 53,117 | $ | 59,545 | |||
| Accident and health | 34,266 | 30,759 | |||||
| Property | 85,805 | 80,758 | |||||
| Total | 173,188 | 171,062 | |||||
| Ceded claim reserves: | |||||||
| Life | 1,786 | 1,794 | |||||
| Accident and health | 9,263 | 9,896 | |||||
| Property | 8,663 | 7,743 | |||||
| Total ceded claim reserves recoverable | 19,712 | 19,433 | |||||
| Other reinsurance settlements recoverable | 11,088 | 4,245 | |||||
| Reinsurance receivables | $ | 203,988 | $ | 194,740 | |||
| (1) Including policyholder account balances ceded. | |||||||
35
We utilize reinsurance for loss protection and capital management. See ITEM 1A. RISK FACTORS - "Risks Related to Our Payment Protection Business - Reinsurance may not be available or adequate to protect us against losses, and we are subject to the credit risk of reinsurers."
Property and Equipment
Property and equipment are carried at cost, net of accumulated depreciation and amortization of capitalized software. Gains and losses on sales and disposals of property and equipment are based on the net book value of the related asset at the disposal date using the specific identification method with the corresponding gain or loss recorded to operations when incurred. Maintenance and repairs, which do not materially extend asset useful life and minor replacements, are charged to earnings when incurred. Depreciation expense is computed using the straight-line method over the estimated useful lives of the respective assets with three years for computers and five years for furniture, fixtures and equipment. Amortization of capitalized software is computed using the straight-line method over the estimated useful lives of five years. Leasehold improvements are depreciated over the remaining life of the lease. We also lease certain equipment and software under a capital lease. Assets under capital leases are depreciated over the remaining life of the lease or their estimated productive lives.
We capitalize internally developed software costs on a project-by-project basis in accordance with Accounting Standards Codification ("ASC") 350-40, Intangibles - Goodwill and Other: Internal-Use Software. All costs to establish the technological feasibility of computer software development are expensed to operations when incurred. Internally developed software development costs are carried at the lower of unamortized cost or net realizable value and are amortized based on the current and estimated useful life of the software. Amortization over the estimated useful life of five years begins when the software is ready for its intended use.
Deferred Acquisition Costs - Insurance Related
Accounting for Costs Associated with Acquiring or Renewing Insurance Contracts
On January 1, 2012, we adopted the new guidance for Accounting for Costs Associated with Acquiring or Renewing Insurance Contracts. This guidance was adopted on a retrospective basis and has been applied to all prior period financial information contained in our Consolidated Financial Statements. See the Note, "Recent Accounting Standards" of the Notes to Consolidated Financial Statements of this Form 10-K for the effect of the retrospective application.
We defer certain costs of acquiring new business and retaining existing business in accordance with the guidance in ASU 2010-26. These costs are limited to direct costs that resulted from successful contract transactions and would not have been incurred by our insurance entities had the transactions not occurred. These capitalized costs are amortized as the related premium is earned. The amortization of deferred acquisition costs are recorded in commissions expense or other operating expense in our Consolidated Statements of Income.
| The following table shows the amortization of deferred acquisition costs for the: | Years Ended December 31, | ||||||||||
| 2012 | 2011 | 2010 | |||||||||
| Total amortization of deferred acquisition costs - insurance related | $ | 61,042 | $ | 55,958 | $ | 57,300 | |||||
We evaluate whether deferred acquisition costs-insurance related are recoverable at year-end, and periodically if deemed necessary, and consider investment income in the recoverability analysis. As a result of our evaluations, no write-offs for unrecoverable deferred acquisition costs were recognized during the years ended December 31, 2012, 2011 and 2010.
Deferred Acquisition Costs - Non-insurance Related
We defer certain costs of acquiring new business and retaining existing business in our Payment Protection Segment related to non-insurance subsidiary transactions. These costs are limited to direct costs, typically commissions and contract transaction fees, that resulted from successful contract transactions and would not have been incurred by us had the transactions not occurred. These capitalized costs are amortized as the related service and administrative fees are earned. The following table shows the amortization of deferred acquisition costs for our non-insurance subsidiaries:
| Years Ended December 31, | |||||||||||
| 2012 | 2011 | 2010 | |||||||||
| Total amortization of deferred acquisition costs - non-insurance related | $ | 52,539 | $ | 57,358 | $ | 26,504 | |||||
We evaluate whether deferred acquisition costs - non-insurance related are recoverable at year-end, and periodically if deemed necessary. As a result of our evaluations, no write-offs for unrecoverable deferred acquisition costs were recognized during the years ended December 31, 2012, 2011 and 2010.
Goodwill and Other Intangible Assets
Goodwill represents the excess cost of an acquisition over the fair value of the net assets acquired in a business combination. Our other intangible assets consist of finite-lived intangible assets including customer related and contract based assets and are comprised
36
primarily of client lists and non−compete arrangements and acquired software, while our indefinite-lived intangible assets consist of trademarks. Goodwill and other intangible assets are carried as assets on the Consolidated Balance Sheets. Goodwill represented $119.5 million, $104.9 million, and $75.0 million of our total assets as of December 31, 2012, 2011 and 2010, respectively while other intangible assets represented $79.3 million, $54.4 million, and $40.0 million of our total assets as of December 31, 2012, 2011 and 2010, respectively.
Our goodwill is not amortized but is reviewed annually in the fourth quarter for impairment or more frequently if certain indicators arise. Our impairment testing is performed at the segment level. In 2011 we adopted Accounting Standards Update ("ASU") 2011-08, Intangibles – Goodwill and Other (Topic 350): Testing Goodwill for Impairment. ASU 2011-08 allows for the goodwill impairment analysis to start with an assessment of qualitative factors to determine whether it is more likely than not that the fair value of a reporting unit is less than its carrying amount. If, after assessing the qualitative factors, management determines that it is more likely than not that the fair value of a reporting unit is less than its carrying amount, then we perform the two-part quantitative impairment test under Topic 350. If the carrying amount of the goodwill of the reporting unit exceeds the implied fair value, an impairment charge is recorded equal to the excess.
The goodwill impairment review is highly judgmental and involves the use of significant estimates and assumptions. The estimates and assumptions have a significant impact on the amount of any impairment charge recorded. Discounted cash flow methods are dependent upon assumption of future sales trends, market conditions and cash flows of each reporting unit over several years. Actual cash flows in the future may differ significantly from those previously forecasted. Other significant assumptions include growth rates and the discount rate applicable to future cash flows.
Management assessed goodwill as of December 31, 2012, 2011 and 2010 and determined that no impairment existed as of those dates.
Unpaid Claims
Unpaid claims are reserve estimates that are established in accordance with U.S. GAAP using generally accepted actuarial methods. Credit life, credit disability and accidental death and dismemberment ("AD&D") unpaid claims reserves include claims in the course of settlement and incurred but not reported ("IBNR"). For all other product lines, unpaid claims reserves are entirely IBNR. We use a number of algorithms in establishing our unpaid claims reserves. These algorithms are used to calculate unpaid claims as a function of paid losses, earned premium, target loss ratios, in force amounts, unearned premium reserves; industry recognized morbidity tables or a combination of these factors. The factors used to develop the IBNR vary by product line. However, in general terms, the factor used to develop IBNR for credit life insurance is a function of the amount of life insurance in force. The factor can vary from $0.60 to $1.00 per $1,000 of in force coverage. The factor used to develop IBNR for credit disability is a function of the pro-rata unearned premium reserve and is typically 5% of the unearned premium reserve. Finally, IBNR for AD&D policies is a function of in force coverage and is currently $0.15 per $1,000 of in force coverage.
In accordance with applicable statutory insurance company regulations, our unpaid claims reserves are evaluated by appointed actuaries. The appointed actuaries perform this function in compliance with the Standards of Practice and Codes of Conduct of the American Academy of Actuaries. The appointed actuaries perform their actuarial analysis each year and prepare opinions, statements and reports documenting their determinations. The appointed actuaries conduct their actuarial analysis on a basis gross of reinsurance. The same estimates used as a basis in calculating the gross unpaid claims reserves are then used as the basis for calculating the net unpaid claims reserves, which take into account the impact of reinsurance.
Anticipated future loss development patterns form a key assumption underlying these analyses. Our claims are generally reported and settled quickly resulting in a consistent historical loss development pattern. From the anticipated loss development patterns, a variety of actuarial loss projection techniques are employed, such as chain ladder method, the Bornhuetter-Ferguson method and expected loss ratio method.
Our unpaid claims reserves do not represent an exact calculation of exposure, but instead represent our best estimates, generally involving actuarial projections at a given time. The process used in determining our unpaid claims reserves cannot be exact since actual claim costs are dependent upon a number of complex factors such as changes in doctrines of legal liabilities and damage awards. These factors are not directly quantifiable, particularly on a prospective basis. We periodically review and update our methods of making such unpaid claims reserve estimates and establishing the related liabilities based on our actual experience. We have not made any changes to our methodologies for determining unpaid claims reserves in the periods presented.
37
The following table provides unpaid claims reserve information by Payment Protection product line, net of reserves ceded under reinsurance arrangements:
| (in thousands) | As of December 31, 2012 | As of December 31, 2011 | As of December 31, 2010 | ||||||||||||||||||||||||||||||||
| Product Type | In Course of Settlement(1) | IBNR(2) | Total Claim Reserve | In Course of Settlement(1) | IBNR(2) | Total Claim Reserve | In Course of Settlement(1) | IBNR(2) | Total Claim Reserve | ||||||||||||||||||||||||||
| Property | $ | — | $ | 3,534 | $ | 3,534 | $ | 213 | $ | 3,189 | $ | 3,402 | $ | — | $ | 2,784 | $ | 2,784 | |||||||||||||||||
| Surety | — | 204 | 204 | — | 173 | 173 | — | 641 | 641 | ||||||||||||||||||||||||||
General liability(3) | — | 3,168 | 3,168 | — | 2,167 | 2,167 | — | 2,084 | 2,084 | ||||||||||||||||||||||||||
| Credit life | 629 | 1,573 | 2,202 | 539 | 2,267 | 2,806 | 526 | 1,967 | 2,493 | ||||||||||||||||||||||||||
| Credit disability | 145 | 3,211 | 3,356 | 204 | 3,540 | 3,744 | 118 | 3,731 | 3,849 | ||||||||||||||||||||||||||
| AD&D | 109 | 489 | 598 | 176 | 614 | 790 | 131 | 436 | 567 | ||||||||||||||||||||||||||
| Other | 1 | 56 | 57 | 1 | 68 | 69 | — | 23 | 23 | ||||||||||||||||||||||||||
| Total | $ | 884 | $ | 12,235 | $ | 13,119 | $ | 1,133 | $ | 12,018 | $ | 13,151 | $ | 775 | $ | 11,666 | $ | 12,441 | |||||||||||||||||
(1) "In Course of Settlement" represents amounts reserved to pay claims known but are not yet paid.
(2) IBNR reserves represent amounts reserved to pay claims where the insured event has occurred and has not yet been reported. IBNR reserves for credit disability also include the net present value of future claims payment of $1,243, $1,354 and $1,094 as of December 31, 2012, 2011 and 2010, respectively.
(3) General liability primarily represents amounts reserved to pay claims on contractual liability policies behind debt cancellation products.
Most of our credit insurance business is written on a retrospective commission basis, which permits management to adjust commissions based on claims experience. Thus, any adjustment to prior years' incurred claims in this line of business is partially offset by a change in retrospective commissions.
While management has used its best judgment in establishing the estimate of required unpaid claims, different assumptions and variables could lead to significantly different unpaid claims estimates. Two key measures of loss activity are loss frequency, which is a measure of the number of claims per unit of insured exposure, and loss severity, which is based on the average size of claims. Factors affecting loss frequency and loss severity include changes in claims reporting patterns, claims settlement patterns, judicial decisions, legislation, economic conditions, morbidity patterns and the attitudes of claimants towards settlements. The adequacy of our unpaid claims reserves will be impacted by future trends that impact these factors.
While our cost of claims has not varied significantly from our reserves in prior periods, if the actual level of loss frequency and severity are higher or lower than expected, our paid claims will be different than management's estimate. We believe that, based on our actuarial analysis, an aggregate change that is greater than ± 10% (or 5% for each of loss frequency and severity) is not probable. The effect of higher and lower levels of loss frequency and severity levels on our ultimate cost for claims occurring in 2012 would be as follows (dollars in thousands):
| Sensitivity Change in Both Loss Frequency and Severity For All Payment Protection Products | Claims Cost | Change in Claims Cost | |||||
| 5% higher | $ | 14,464 | $ | 1,345 | |||
| 3% higher | 13,918 | 799 | |||||
| 1% higher | 13,383 | 264 | |||||
| Base scenario | 13,119 | — | |||||
| 1% lower | 12,855 | (264 | ) | ||||
| 3% lower | 12,320 | (799 | ) | ||||
| 5% lower | 11,774 | (1,345 | ) | ||||
Adjustments to our unpaid claims reserves, both positive and negative, are reflected in our statement of income for the period in which such estimates are updated. Because the establishment of our unpaid claims reserves is an inherently uncertain process involving estimates of future losses, there can be no certainty that ultimate losses will not exceed existing claims reserves. Future loss development could require our reserves to be increased, which could have a material adverse effect on our earnings in the periods in which such increases are made.
Unearned Premiums
Premiums written are earned over the life of the respective policy using the Rule of 78's, pro rata, or other actuarial method as appropriate for the type of business. Unearned premiums represent the portion of premiums that will be earned in the future. A premium deficiency reserve is recorded if anticipated losses, loss adjustment expenses, deferred acquisition costs - insurance related and policy maintenance costs exceed the recorded unearned premium reserve and anticipated investment income. As of December 31, 2012, 2011 and 2010, respectively, no such reserve was recorded.
38
Income Taxes
The calculation of tax liabilities is complex, and requires the use of estimates and judgments by management since it involves application of complex tax laws. We record deferred income taxes in accordance with the asset and liability method. Under the asset and liability method, deferred tax assets and liabilities are recorded based on the difference between the tax basis of assets and liabilities and their carrying amounts for financial reporting purposes, referred to as temporary differences, and are based on the enacted tax laws and statutory tax rates applicable to the periods in which we expect the temporary differences to reverse.
Under ASC Topic 740, Income Taxes, a deferred tax asset should be reduced by a valuation allowance if, based on the weight of all available evidence, it is more likely than not that some portion or all of the deferred tax asset will not be realized. The valuation allowance should be sufficient to reduce the deferred tax asset to the amount that is more likely than not to be realized. In determining whether our deferred tax asset is realizable, we considered all available evidence, including both positive and negative evidence. The realization of deferred tax assets depends upon the existence of sufficient taxable income of the same character during the carry-back or carry-forward period. We considered all sources of taxable income available to realize the deferred tax asset, including the future reversal of existing temporary differences, future taxable income exclusive of reversing temporary differences and carry forwards, taxable income in carry-back years and tax-planning strategies.
Management has evaluated its deferred tax assets to determine realization in the foreseeable future and accordingly, a valuation allowance has been established. The detailed components of our deferred tax assets and liabilities are included in the Note, "Income Taxes" in the Notes to the Consolidated Financial Statements included in Item 8 of this Form 10-K.
Contingencies
We follow the requirements of the contingencies guidance, which is included within ASC Topic 450, Contingencies. This requires management to evaluate each contingent matter separately. A loss is reported if reasonably estimable and probable. We establish reserves for these contingencies at the best estimate, or, if no one estimated number within the range of possible losses is more probable than any other, we report an estimated reserve at the midpoint of the estimated range. Contingencies affecting us include litigation matters which are inherently difficult to evaluate and are subject to significant changes.
Service and Administrative Fees
We earn service and administrative fees from a variety of activities, including the administration of credit insurance, the administration of debt cancellation programs, the administration of motor club programs, the administration of warranty programs and the administration of collateral tracking and asset recovery programs.
The Payment Protection administrative service revenue is recognized consistent with the earnings recognition pattern of the underlying insurance policies, debt cancellation contracts and motor club memberships being administered, using Rule of 78's, modified Rule of 78's, pro rata, or other methods as appropriate for the contract. Management selects the appropriate method based on available information, and periodically reviews the selections as additional information becomes available.
The BPO service fee revenue is recognized as the services are performed. These services include fulfillment, BPO software development, and claims handling for our customers. Collateral tracking fee income is recognized when the service is performed and billed. Asset recovery service revenue is recognized upon the location of a recovered unit and or the location and delivery of a unit. Management reviews the financial results under each significant BPO contract on a monthly basis. Any losses that may occur due to a specific contract would be recognized in the period in which the loss occurs. During the years ended December 31, 2012, 2011 and 2010, we have not incurred a loss with respect to a specific significant BPO contract.
Brokerage Commissions and Fees
We earn brokerage commission and fee income by providing wholesale brokerage services to retail insurance brokers and agents and insurance companies. Brokerage commission income is primarily recognized when the underlying insurance policies are issued. A portion of the brokerage commission income is derived from profit agreements with insurance carriers. These commissions are received from carriers based upon the underlying underwriting profitability of the business that we place with those carriers. Profit commission income is generally recognized as revenue on the receipt of cash based on the terms of the respective carrier contracts. In certain instances, profit commission income may be recognized in advance of cash receipt where the profit commission income due to be received has been calculated or has been confirmed by the insurance carrier. We also derive fees from master license agreements to use the eReinsure system together with fees for the transactions completed through its platform. See - "Revenues - Brokerage Commissions and Fees" in this MD&A for a discussion of various factors that impact our brokerage commissions and fees.
Ceding Commissions
Ceding commissions earned under coinsurance agreements are based on contractual formulas that take into account, in part, underwriting performance and investment returns experienced by the assuming companies. As experience changes, adjustments to the ceding commissions are reflected in the period incurred. Experience adjustments are based on the claim experience of the related policy. The adjustment is calculated by adding the earned premium and investment income from the assets held in trust for our benefit less earned
39
commissions, incurred claims and the reinsurer's fee for the coverage. See - "Revenues - Ceding Commissions" for additional information on our ceding commissions.
Our experience adjustments, exclusive of investment income, are as follows: (in thousands) | Years Ended December 31, | ||||||||||
| 2012 | 2011 | 2010 | |||||||||
| Experience Adjustments | $ | 8,635 | $ | 7,245 | $ | 6,072 | |||||
Net Earned Premium
Net earned premium is from direct and assumed earned premium consisting of revenue generated from the direct sale of Payment Protection insurance policies by our distributors and premiums written for Payment Protection insurance policies by another carrier and assumed by us. Whether direct or assumed, the premium is earned over the life of the respective policy using methods appropriate to the pattern of losses for the type of business. Methods used include the Rule of 78's, pro rata, and actuarial methods. Management selects the appropriate method based on available information, and periodically reviews the selections as additional information becomes available. Direct and assumed premiums are offset by premiums ceded to our reinsurers, including producer owned reinsurance companies ("PORCs"), earned in the same manner. The amount ceded is proportional to the amount of risk assumed by the reinsurer.
Commissions
The commission costs include the commissions paid to the distributors for credit insurance policies, -motor club memberships, and warranty service contracts. The commission costs for credit insurance also include retrospective commission adjustments. These retrospective commission adjustments are payments made or adjustments to future commission expense based on claims experience. Under these retrospective commission arrangements, the commissions paid are adjusted based on actual losses incurred compared to premium earned after a specified net allowance is retained by us.
Net Investment Income
We earn net investment income from interest payments and dividends received from our investment portfolio, and interest earned on our cash accounts and notes receivable, less portfolio management expenses. Our investment portfolio is primarily invested in fixed maturity securities which tend to produce consistent levels of investment income. The fair value of the fixed maturity securities in our portfolio and the investment income from these securities fluctuate depending on general economic and market conditions. The fair value generally increases or decreases in an inverse relationship with fluctuations in interest rates. Investment income can be significantly impacted by changes in interest rates. Interest rate volatility can increase or reduce unrealized gains or unrealized losses in our portfolios. Interest rates are highly sensitive to many factors, including governmental monetary policies, domestic and international economic and political conditions and other factors beyond our control. Fluctuations in interest rates affect our returns on, and the fair value of, fixed maturity and short-term investments.
We also have investments that carry prepayment risk, such as mortgage-backed and asset-backed securities. Actual net investment income and/or cash flows from investments that carry prepayment risk may differ from estimates at the time of investment as a result of interest rate fluctuations. In periods of declining interest rates, mortgage prepayments generally increase and mortgage-backed securities, commercial mortgage obligations and bonds are more likely to be prepaid or redeemed as borrowers seek to borrow at lower interest rates. Therefore, we may be required to reinvest those funds in lower interest-bearing investments. Conversely, in times of rising interest rates, prepayments slow as borrowers tend to be less likely to refinance borrowings at higher interest rates, which tends to increase the duration of our investment holdings. With the increase in investment duration, we will have less cash flows from prepayments to invest at higher prevailing market rates.
Stock-Based Compensation
We currently have stock options outstanding under our 2005 Equity Incentive Plan and time- and performance-based stock options and restricted stock awards outstanding under The 2010 Omnibus Incentive Plan. Time-based stock options and restricted stock awards are grants that vest based on the passage of time whereas performance-based stock options and restricted stock awards are grants that vest based on us attaining certain financial metrics. We record stock-based compensation in accordance with ASC 718, Compensation - Stock Compensation, ("ASC 718"), which addresses the accounting for share-based awards, including stock options and restricted stock. Under ASC 718, compensation expense is measured using fair value and is recorded over the requisite service or performance period of the awards. We measure stock-based compensation expense using the calculated value method. Under this method, we estimate the fair value of each stock option on the grant date using the Black-Scholes valuation model. We use historical data to estimate expected employee behavior related to stock award exercises and forfeitures. Since there is not sufficient historical market experience for shares of our stock, we have chosen to estimate volatility, by using the average volatility of a selected peer group of publicly traded companies operating in the same industry. Expected dividends are based on the assumption that no dividends are expected to be distributed in the near future. The risk-free rate is based on the U.S. Treasury yield curve in effect at the time of grant for periods corresponding with the expected life of the options. The fair value of restricted stock awards is based on the market price of our common stock at the grant date. We typically recognize stock-based compensation expense for time-based awards on a straight-line basis over the requisite service and on a graded vesting attribution model for performance-based awards. Our current policy is to issue new shares upon the exercise of stock options. Please see the Note, "Stock-Based Compensation" in the Notes to Consolidated Financial Statements included in Item 8 of this Form 10-K for additional information.
40
Recently Issued Accounting Standards
For a discussion of recently issued accounting standards see the Note "Recent Accounting Standards" of the Notes to Consolidated Financial Statements of this Form 10-K.
COMPONENTS OF REVENUES AND EXPENSES
REVENUES
Service and Administrative Fees. We earn service and administrative fees from our Payment Protection and BPO business segments. Such fees are typically positively correlated with transaction volume and are recognized as revenue as they become both realized and earned. We earn service and administrative fees from a variety of activities, including the administration of credit insurance, the administration of debt cancellation programs, the administration of motor club programs, the administration of warranty programs and the administration of collateral tracking and asset recovery programs.
Payment Protection. The Payment Protection administrative service revenue is recognized consistent with the earnings recognition pattern of the underlying insurance policies, debt cancellation contracts and motor club memberships being administered, using Rule of 78's, modified Rule of 78's, pro rata, or other methods as appropriate for the contract. Management selects the appropriate method based on available information, and periodically reviews the selections as additional information becomes available.
Our Payment Protection products are sold as complementary products to consumer retail and credit transactions and are thus subject to the volatility of volume of consumer purchase and credit activities. We receive service and administrative fees for administering Payment Protection products that are sold by our clients, such as credit insurance, debt protection, motor club and warranty solutions. We earn administrative fees for administering debt cancellation plans, facilitating the distribution and administration of warranty or extended service contracts, providing motor club membership benefits and providing related services for our clients. For credit insurance products, our clients typically retain the risk associated with credit insurance products that they sell to their customers through economic arrangements with us. Our Payment Protection revenue includes revenue earned from reinsurance arrangements with producer owned reinsurance companies owned by our clients. Our clients own producer owned reinsurance companies ("PORCs") that assume the credit insurance premiums and associated risk that they originate in exchange for fees paid to us for ceding the premiums. In addition, our Payment Protection revenue includes administrative fees charged by us under retrospective commission arrangements with producers, where the commissions paid are adjusted based on actual losses incurred compared to premium earned after a specified net allowance retained by us. Under these arrangements, our insurance companies receive the insurance premiums and administer the policies that are distributed by our clients. The producer of the credit insurance policies receives a retrospective commission if the premium generated by that producer in the accounting period exceeds the costs associated with those polices, which includes our administrative fees, incurred claims, reserves and premium taxes. If the net result is negative, we either offset that negative amount against future retrospective commission payments, reduce the producer's up-front commission on a prospective basis to increase the likelihood that it will return to a positive position or request payment of the negative amount from the producer. Revenues in our Payment Protection business may fluctuate seasonally based on consumer spending trends, where consumer spending has historically been higher in September and December, corresponding to back-to-school and the holiday season. Accordingly, our Payment Protection revenues may reflect higher third and fourth quarters than in the first half of the year.
BPO. The BPO revenues are recognized as the services are performed and consist primarily of service and administrative fees for providing a broad set of administrative services tailored to insurance and other financial services companies including ongoing sales and marketing support, premium billing and collections, policy administration, claims adjudication, call center management services and the development of web-hosted applications for the reinsurance market. In addition, our BPO segment markets and sells health, accident, critical illness and life insurance policies to customers in the U.S. Our BPO revenues are based on the volume of business that we manage on behalf of our clients. Our BPO segment typically charges fees on a per-unit of service basis as a percentage of our client's insurance premiums.
Brokerage Commissions and Fees. Brokerage commissions and fees consist of commissions paid to us by insurance companies, net of the portion of the commissions we share with retail insurance brokers and agents. The commissions we receive from insurance carriers are typically calculated as a percentage of the premiums paid for the specialized and complex insurance products (commonly known as "surplus lines") we distribute. We typically earn our commissions on the later of the effective date of the policy or the date coverage is bound. We pay our retail insurance agent and broker clients a portion of the gross commissions we receive from insurance carriers for placing insurance. In certain cases, our Brokerage segment also charges fees for policy issuance, inspections and other types of transactions. Our Brokerage segment also derives fees from master license agreements to use the eReinsure system together with fees for the transactions completed through its platform.
Brokerage commissions and fees are generally affected by fluctuations in the amount of premium charged by insurance carriers. The premiums charged fluctuate based on, among other factors, the amount of capital available in the insurance marketplace, the type of risk being insured, the nature of the insured party and the terms of the insurance purchased. If premiums increase or decrease, our
41
revenues are typically affected in a corresponding fashion. In a declining premium rate environment, the resulting decline in our revenue may be offset, in whole or in part, by an increase in commission rates from insurance carriers and by an increased likelihood that insured parties may use the savings generated by the reduction in premium rates to purchase greater coverage. In an increasing pricing environment, the resulting increase in our revenue may be offset, in whole or in part, by a decrease in commission rates by insurance carriers and by an increased likelihood that insured parties may determine to reduce the amount of coverage they purchase. The market for P&C insurance products is cyclical from a capacity and pricing perspective. We refer to a period of reduced capacity and rising premium rates as a "hard" market and a period of increased capacity and declining premium rates as a "soft" market.
Gross commission rates for the products that we distribute in our Brokerage segment, whether acting as a wholesale broker or as a Managing General Agent ("MGA"), generally range from 15% to 25% of the annual premium for the policy. Brokerage commissions and fees net of commissions paid to our retail insurance agent and broker clients typically approximate 10%.
Demand for surplus lines insurance products also affects our premium volume and net commissions. State regulations generally require a buyer of insurance to have been turned down by three or more traditional carriers before being eligible to purchase the surplus lines distributed by us. As standard insurance carriers eliminate non-core lines of business and implement more conservative risk selection techniques, demand for excess and surplus lines insurance improves.
We also receive profit commissions for certain arrangements with certain insurance carriers on binding authority business. These profit commissions are based on the profitability of the business that we underwrite or broker on the insurance carrier's behalf. Profit commissions typically range from 0.6% to 1.7% of the annual premium and are paid periodically based on the terms of the individual carrier contract.
Our surplus lines brokerage commission and fee revenues fluctuate seasonally based on policy renewal dates and timing of profit commissions, and have historically been higher in the first two calendar quarters compared to the last two calendar quarters. In addition, our fee revenues at eReinsure are subject to seasonal fluctuations and are generally higher in the second and fourth quarters.
Ceding Commissions. Ceding commission earned under coinsurance agreements are based on contractual formulas that take into account, in part, underwriting performance and investment returns experienced by assuming companies. As experience changes, adjustments to the ceding commissions are reflected in the period incurred. Ceding commissions are only generated by our Payment Protection segment on credit insurance products.
We elect to cede to reinsurers under coinsurance arrangements a significant portion of the credit insurance that we distribute on behalf of our clients. We continue to provide all policy administration for credit insurance that we cede to reinsurers. Ceding commissions consist of commissions paid to us by our reinsurers to reimburse us for costs related to the acquisition, administration and servicing of policies and premiums that we cede to reinsurers. In addition, a portion of the ceding commission is determined based on the underwriting profits of the ceded credit insurance. The credit insurance that we distribute has historically generated attractive underwriting profits. Furthermore, some reinsurers pay to us a portion or all of the investment income earned on reserves that are maintained in trust accounts.
Ceding commissions are generally positively correlated with our credit insurance transaction and premium volumes. The portion of our ceding commissions that is related to the underwriting profits of the ceded credit insurance also fluctuates based on the claims made on such policies. The portion of our ceding commissions that is related to investment income can be impacted by the amount of reserves that are maintained in trust accounts and changes in interest rates. Ceding commissions are earned over the life of the policy.
Net Earned Premium. Net earned premium is from direct and assumed earned premium consisting of revenue generated from the direct sale of Payment Protection insurance policies by our distributors and premiums written for Payment Protection insurance policies by another carrier and assumed by us. Whether direct or assumed, the premium is earned over the life of the respective policy using methods appropriate to the pattern of losses for the type of business. Methods used include the Rule of 78's, pro rata, and actuarial methods. Management selects the appropriate method based on available information, and periodically reviews the selections as additional information becomes available. Direct and assumed premiums are offset by premiums ceded to our reinsurers, including producer owned reinsurance companies ("PORCs"), earned in the same manner. The amount ceded is proportional to the amount of risk assumed by the reinsurer.
The principal factors affecting net earned premiums are: (i) the proportion of the risk assumed by our reinsurers as defined in the applicable reinsurance treaty; (ii) increases and decreases in written premium; (iii) increases and decreases in policy cancellation rates; (iv) the average duration of the policies written; and (v) changes in regulation that would modify the earning patterns for the policies underwritten and administered.
42
We limit the underwriting risk we take in our Payment Protection insurance policies. When we do assume risk in our Payment Protection insurance policies, we utilize both reinsurance (e.g., quota share and excess of loss) and retrospective commission agreements to manage and mitigate our risk.
Net Realized Investment Gains (Losses). We realize gains when invested assets are sold for an amount greater than the amortized cost in the case of fixed maturity securities and cost basis for equity securities. We recognize realized losses for invested assets sold for an amount less than their carrying cost or when fixed maturity securities or equity securities are written down as a result of an other-than-temporary impairment ("OTTI").
Net Investment Income. We earn net investment income from interest payments and dividends received from our investment portfolio, and interest earned on our cash accounts and notes receivable, less portfolio management expenses. Our investment portfolio is invested primarily in fixed maturity securities which tend to produce consistent levels of investment income. The fair value of the fixed maturity securities in our portfolio and the investment income from these securities fluctuate depending on general economic and market conditions. The fair value generally increases or decreases in an inverse relationship with fluctuations in interest rates. Investment income can be significantly impacted by changes in interest rates. Interest rate volatility can increase or reduce unrealized gains or unrealized losses in our portfolios. Interest rates are highly sensitive to many factors, including governmental monetary policies, domestic and international economic and political conditions and other factors beyond our control. Fluctuations in interest rates affect our returns on, and the fair value of, fixed maturity and short-term investments.
We also have investments that carry prepayment risk, such as mortgage-backed and asset-backed securities. Actual net investment income and/or cash flows from investments that carry prepayment risk may differ from estimates at the time of investment as a result of interest rate fluctuations. In periods of declining interest rates, mortgage prepayments generally increase and mortgage-backed securities, commercial mortgage obligations and bonds are more likely to be prepaid or redeemed as borrowers seek to borrow at lower interest rates. Therefore, we may be required to reinvest those funds in lower interest-bearing investments. Conversely, in times of rising interest rates, prepayments slow as borrowers tend to be less likely to refinance borrowings at higher interest rates, which tends to increase the duration of our investment holdings. With the increase in investment duration, we will have less cash flows from prepayments to invest at higher prevailing market rates.
Other Income. Other income consists primarily of miscellaneous fees generated by our Brokerage and Payment Protection segments.
EXPENSES
Net Losses and Loss Adjustment Expenses. Net losses and loss adjustment expenses include actual paid claims and the change in unpaid claim reserves and consist of direct and assumed losses less ceded losses. Our profitability depends in part on accurately predicting net loss and loss adjustment expenses. Incurred claims are impacted by loss frequency, which is the measure of the number of claims per unit of insured exposure, and loss severity, which is based on the average size of claims. Factors affecting loss frequency and loss severity include changes in claims reporting patterns, claims settlement patterns, judicial decisions, legislation, economic conditions, morbidity patterns and the attitudes of claimants towards settlements.
Actual claims paid are claims payments made to the policyholder or beneficiary during the accounting period. The change in unpaid claim reserve is an increase or reduction to the unpaid claim reserve in the accounting period to maintain the unpaid claim reserve at the levels evaluated by our actuaries.
Unpaid claims are reserve estimates that are established in accordance with U.S. GAAP using generally accepted actuarial methods. Credit life and AD&D unpaid claims reserves include claims in the course of settlement and incurred but not reported ("IBNR"). Credit disability unpaid claims reserves also include continuing claim reserves for open disability claims. For all other product lines, unpaid claims reserves are bulk reserves and are entirely IBNR. We use a number of algorithms in establishing our unpaid claims reserves. These algorithms are used to calculate unpaid claims as a function of paid losses, earned premium, target loss ratios, in-force amounts, unearned premium reserves, industry recognized morbidity tables or a combination of these factors.
In arriving at our unpaid claims reserves, we conduct an actuarial analysis on a basis gross of reinsurance. The same estimates used as a basis in calculating the gross unpaid claims reserves are then used as the basis for calculating the net unpaid claims reserves, which take into account the impact of reinsurance. Anticipated future loss development patterns form a key assumption underlying these analyses. Our claims are generally reported and settled quickly, resulting in a consistent historical loss development pattern. From the anticipated loss development patterns, a variety of actuarial loss projection techniques are employed, such as the chain ladder method, the Bornhuetter-Ferguson method and expected loss ratio method.
Our unpaid claims reserves do not represent an exact calculation of exposure, but instead represent our best estimates, generally involving actuarial projections at a given time. The process used in determining our unpaid claims reserves cannot be exact since actual claim costs are dependent upon a number of complex factors such as changes in doctrines of legal liabilities and damage awards. These factors are not directly quantifiable, particularly on a prospective basis. We periodically review and update our methods of making
43
such unpaid claims reserve estimates and establishing the related liabilities based on our actual experience. We have not made any changes to our methodologies for determining unpaid claims reserves in the periods presented.
Member Benefit Claims.
Member Benefit Claims represent claims paid on behalf of contract holders directly to third parties providers for roadside assistance and for the repair or replacement of covered products. Claims can also be paid directly to contract holders as a reimbursement payment provided supporting documentation of loss is submitted to us. Claims are recognized as expense when incurred.
Commissions. Commissions include the commissions paid to distributors selling credit insurance policies, motor club memberships, and warranty service contracts offered by our Payment Protection segment. Credit insurance commission rates, in many instances, are set by state regulators and are also impacted by market conditions. In certain instances, our commissions are subject to retrospective adjustment based on the profitability of the related policies. These retrospective commission adjustments are payments made or adjustments to future commission expense based on claims experience. Under these retrospective commission arrangements, the producer of the credit insurance policies, which is typically our client, receives a retrospective commission if the premium generated by that producer in the accounting period exceeds the costs associated with those policies, which includes our administrative fees, claims, reserves and premium taxes. If the net result is negative, we either offset that negative amount against future retrospective commission payments, reduce the producer's up-front commission on a prospective basis to increase the likelihood that it will return to a positive position or request payment of the negative amount from the producer.
Personnel Costs. Personnel costs represent the amounts attributable to wages, salaries, bonuses and benefits for our full and part-time employees, as well as expense related to our stock-based compensation. In addition to our general personnel costs, some of the employees in our Brokerage and Payment Protections segments are paid a percentage of revenues they generate. Accordingly, compensation for brokers in our Brokerage segment is predominantly variable. Bonuses for the remaining employees are discretionary and are based on an evaluation of their individual performance and the performance of their particular business segment, as well as our entire company.
Other Operating Expenses. Other operating expenses consist primarily of rent, insurance, investigation fees, transaction expenses, professional fees, technology costs, travel and entertainment and advertising, and may include variable costs based on the volume of business we process. Other operating expenses are a significant portion of our expenses.
Depreciation. Depreciation expense is the allocation of the capitalized cost of property and equipment over the periods benefited by the use of the asset.
Amortization of Intangibles. Amortization of finite-lived intangibles is an expense recorded to allocate the cost of finite-lived intangible assets, such as purchased customer accounts and non-compete agreements acquired as part of our business acquisitions, over their estimated useful lives.
Interest Expense. Interest expense includes interest payable on our credit facilities, notes payable and preferred trust securities, net of the impact of the interest rate swap, and is directly correlated to the balances outstanding and the prevailing interest rates on these debt instruments.
Income Taxes. Income taxes are comprised of federal and state taxes based on income in multiple jurisdictions and changes in uncertain tax positions, if any.
44
RESULTS OF OPERATIONS
The following tables set forth our Consolidated Statements of Income for the following periods:
| (in thousands, except shares, per share amounts and percentages) | For the Years Ended December 31, | ||||||||||||||
| 2012 | 2011 (1) | $ Change from 2011 | % Change from 2011 | 2010 (1) | |||||||||||
| As Restated | As Restated | ||||||||||||||
| Revenues: | |||||||||||||||
| Service and administrative fees | $ | 90,550 | $ | 94,464 | $ | (3,914 | ) | (4.1 | )% | $ | 56,254 | ||||
| Brokerage commissions and fees | 35,306 | 34,396 | 910 | 2.6 | 24,620 | ||||||||||
| Ceding commission | 34,825 | 29,495 | 5,330 | 18.1 | 28,767 | ||||||||||
| Net investment income | 3,068 | 3,368 | (300 | ) | (8.9 | ) | 4,073 | ||||||||
| Net realized investment gains | 3 | 4,193 | (4,190 | ) | (99.9 | ) | 650 | ||||||||
| Net earned premium | 127,625 | 115,503 | 12,122 | 10.5 | 111,805 | ||||||||||
| Other income | 269 | 170 | 99 | 58.2 | 230 | ||||||||||
| Total revenues | 291,646 | 281,589 | 10,057 | 3.6 | 226,399 | ||||||||||
| Expenses: | |||||||||||||||
| Net losses and loss adjustment expenses | 40,219 | 37,949 | 2,270 | 6.0 | 36,035 | ||||||||||
| Member benefit claims | 4,642 | 4,409 | 233 | 5.3 | 466 | ||||||||||
| Commissions | 128,741 | 126,918 | 1,823 | 1.4 | 92,646 | ||||||||||
| Personnel costs | 48,648 | 44,547 | 4,101 | 9.2 | 36,361 | ||||||||||
| Other operating expenses | 30,354 | 31,140 | (786 | ) | (2.5 | ) | 24,426 | ||||||||
| Depreciation and amortization | 3,933 | 3,077 | 856 | 27.8 | 1,396 | ||||||||||
| Amortization of intangibles | 4,953 | 4,952 | 1 | — | 3,232 | ||||||||||
| Interest expense | 6,624 | 7,641 | (1,017 | ) | (13.3 | ) | 8,464 | ||||||||
| Loss on sale of subsidiary | — | 477 | (477 | ) | 100.0 | — | |||||||||
| Total expenses | 268,114 | 261,110 | 7,004 | 2.7 | 203,026 | ||||||||||
| Income before income taxes and non-controlling interests | 23,532 | 20,479 | 3,053 | 14.9 | 23,373 | ||||||||||
| Income taxes | 8,295 | 7,140 | 1,155 | 16.2 | 8,159 | ||||||||||
| Income before non-controlling interests | 15,237 | 13,339 | 1,898 | 14.2 | 15,214 | ||||||||||
| Less: net income (loss) attributable to non-controlling interests | 72 | (170 | ) | 242 | (142.4 | ) | 20 | ||||||||
| Net income | $ | 15,165 | $ | 13,509 | $ | 1,656 | 12.3 | % | $ | 15,194 | |||||
| Earnings per share: | |||||||||||||||
| Basic | $ | 0.77 | $ | 0.66 | $ | 0.95 | |||||||||
| Diluted | $ | 0.74 | $ | 0.64 | $ | 0.88 | |||||||||
| Weighted average common shares outstanding: | |||||||||||||||
| Basic | 19,655,492 | 20,352,027 | 15,929,181 | ||||||||||||
| Diluted | 20,600,362 | 21,265,801 | 17,220,029 | ||||||||||||
(1) - The December 31, 2011 and 2010 Consolidated Statement of Income results have been adjusted to properly reflect the retrospective adoption of ASU 2010-26, Accounting for Costs Associated with Acquiring or Renewing Insurance Contracts, as described in the Note, "Restatement of the Consolidated Financial Statements," of Notes to the Consolidated Financial Statements.
REVENUES
Service and Administrative Fees
Service and administrative fees for the year ended December 31, 2012 decreased $3.9 million, or 4.1%, to $90.6 million from $94.5 million for the year ended December 31, 2011. The decrease resulted primarily from a $5.6 million decrease in our Motor Clubs division revenues resulting from lower revenues in Continental and Auto Knight and $0.7 million related to the sale of CIRG in July 2011. This decrease was partially offset by a $2.7 million increase in administrative fees from our acquisition of PBG in October 2011.
Service and administrative fees for the year ended December 31, 2011 increased $38.2 million, or 67.9%, to $94.5 million from $56.3 million for the year ended December 31, 2010. The results for 2011 principally reflect the full impact of the 2011 acquisition of Auto Knight and our 2010 car club acquisitions, which mostly occurred in the latter part of 2010 and contributed $41.1 million of the increase
45
and from an additional growth in our core business of $0.6 million. These increases were partially offset by a $1.5 million reduction in our BPO segment revenues and $1.9 million of lower debt collection and collection recovery fees.
Brokerage Commissions and Fees
Brokerage commissions and fees for the year ended December 31, 2012 increased $0.9 million, or 2.6%, to $35.3 million from $34.4 million for the year ended December 31, 2011. The 2012 period includes a full year of results for eReinsure, while the same period in 2011 includes eReinsure's results from the acquisition on March 3, 2011. For the 2012 period, B&G contributed $1.3 million to the increase while eReinsure decreased $0.4 million principally due to lower license fees.
Brokerage commissions and fees for the year ended December 31, 2011 increased $9.8 million or 39.7%, to $34.4 million from $24.6 for the year ended December 31, 2010. The acquisition of eReinsure in March 2011 contributed $8.8 million in fees and Bliss & Glennon contributed an increase of $1.0 million in contingent commissions and net commissions and fees.
Ceding Commissions
Ceding commissions for the year ended December 31, 2012 increased $5.3 million, or 18.1%, to $34.8 million from $29.5 million for the year ended December 31, 2011. This increase primarily resulted from improved underwriting results due to growth in earned premiums and favorable loss experience along with additional administrative fees earned from increased insurance production in 2012, and the change in accounting estimate which accounted for $2.8 million of the increase. For the year ended December 31, 2012, ceding commissions included $25.6 million in service and administrative fees, $8.6 million in underwriting profits and $0.6 million in net investment income.
Ceding commissions for the year ended December 31, 2011 increased $0.7 million, or 2.5%, to $29.5 million from $28.8 million for the year ended December 31, 2010. This increase was due to additional service and administrative fees of $1.4 million from increased insurance production in 2011. In addition, underwriting profits increased $1.2 million due to positive underwriting performance. Net investment income, including realized gains, from assets held in trust by our reinsurers decreased $1.9 million during the period. For the year ended December 31, 2011, ceding commissions included $21.0 million in service and administrative fees, $7.2 million in underwriting profits from positive underwriting performance and $1.3 million in net investment income.
Net Investment Income
Net investment income for the year ended December 31, 2012 decreased $0.3 million, or 8.9%, to $3.1 million compared to $3.4 million for the year ended December 31, 2011. The decrease from 2011 was principally due to lower income earned on fixed income securities and to a lesser extent a lower amount of income earned on cash. Yields on the investment portfolio decreased 21 basis points to 2.67% for the year ended December 31, 2012 from 2.88% for the year ended December 31, 2011.
Net investment income for the year ended December 31, 2011 was $3.4 million and $4.1 million for the year ended December 31, 2010. The decrease from 2010 was principally due to lower income earned on fixed income securities and to a lesser extent a lower amount of income earned on cash. Yields on the investment portfolio decreased 134 basis points to 2.88% for the year ended December 31, 2011 from 4.22% for the year ended December 31, 2010.
Net Realized Investment Gains
Net realized gains on the sale of investments totaled $3 thousand for the year ended December 31, 2012 compared to net realized gains of $4.2 million for the year ended December 31, 2011. The decrease for 2012 was due to higher levels of investment sales occurring in 2011 that were not repeated in 2012. This net gain for 2012 included a $16.0 thousand net realized loss attributable to an OTTI charge for the write-down of a single equity security compared to an OTTI charge of $0.2 million for the year ended December 31, 2011 for ten equity securities.
Net realized gains for the year ended December 31, 2011 totaled $4.2 million, an increase of $3.5 million from the same period in 2010, from the sale of approximately $62.3 million in securities during the year compared to $8.8 million sold in 2010.
Net Earned Premium
Net earned premium for the year ended December 31, 2012 increased $12.1 million, or 10.5%, to $127.6 million from $115.5 million for the year ended December 31, 2011, with the change in accounting estimate increasing net earned premium by $2.5 million for the 2012 period. For the 2012 period, direct and assumed earned premium increased $38.4 million resulting from increased production from existing clients and new clients distributing our credit insurance and warranty products and geographic expansion. Because of this increase, ceded earned premiums increased $26.3 million, or 12.8%, for the year ended December 31, 2012. On average, we maintained a 64.5% overall cession rate of direct and assumed earned premium for the year ended December 31, 2012 compared with 64.1% in 2011.
Net earned premium for the year ended December 31, 2011 increased $3.7 million, or 3.3%, to $115.5 million from $111.8 million for the year ended December 31, 2010. Direct and assumed earned premium increased $13.5 million resulting from an increase in direct
46
and assumed written premium due to new clients distributing our credit insurance and warranty products. Because of this increase, ceded earned premiums increased $9.8 million or 5.0%. On average, we maintained a 64% overall cession rate of direct and assumed earned premium for both the years ended December 31, 2011 and 2010, respectively.
Other Income
Other income was relatively consistent for all periods presented and totaled $0.3 million, $0.2 million and $0.2 million for the years ended December 31, 2012, 2011 and 2010, respectively.
EXPENSES
Net Losses and Loss Adjustment Expenses
Net losses and loss adjustment expenses for the year ended December 31, 2012 increased $2.3 million, or 6% to $40.2 million, from $37.9 million for the year ended December 31, 2011. Our net losses and loss adjustment expense ratio improved from 32.9% in 2011 to 31.5% in 2012, with the change in accounting estimate improving the net losses and loss adjustment expense ratio by 63 basis points. The increase in net losses and loss adjustment expenses was primarily driven by increased earned premiums and warranty claims. For the 2012 period, our direct and assumed losses increased by $4.6 million, or 5.6%, as compared with the same period in 2011. For the 2012 period, our ceded losses were higher by $2.3 million, or 5.2%, compared with the same period in 2011, partially offsetting the increase in direct and assumed losses. On average, we maintained a 53.5% and 53.6% overall cession rate of direct and assumed losses and loss adjustment expenses for the year ended December 31, 2012 and 2011, respectively.
Net losses and loss adjustment expenses for the year ended December 31, 2011 increased $1.9 million, or 5.3% to $37.9 million, from $36.0 million for the year ended December 31, 2010. For the year ended December 31, 2011, our direct and assumed losses increased by $2.4 million, or 3.1%, as compared with the same period in 2010 due to a slightly unfavorable loss experience for 2011. For the year ended December 31, 2011, our ceded losses were higher by $0.5 million, or 1.2%, compared with the year ended December 31, 2010, thereby decreasing our net losses and loss adjustment expenses by the corresponding amount. On average, we maintained a 54% overall cession rate of direct and assumed losses and loss adjustment expenses for the year ended December 31, 2011, compared to 55% for the year ended December 31, 2010.
Member Benefit Claims
Member benefit claims for the year ended December 31, 2012 increased $0.2 million, or 5.3%, to $4.6 million, from $4.4 million for the year ended December 31, 2011. The increase for 2012, compared to 2011, resulted from higher than expected claims paid for one Auto Knight program that was terminated in 2012.
Member benefit claims for the year ended December 31, 2011 increased $3.9 million, or 846.1%, to $4.4 million, from $0.5 million for the year ended December 31, 2010. The increase for 2011, compared to 2010, was principally due to 2011 results containing a full year of results for Auto Knight, Continental, and United, whereas 2010 results included only eight months of activity for Continental and four months of activity for United.
Commissions
Commissions for the year ended December 31, 2012 increased $1.8 million, or 1.4%, to $128.7 million, from $126.9 million for the year ended December 31, 2011. The increase for 2012, compared to 2011, resulted from growth in net earned premiums and from the change in accounting estimate, which increased commissions for 2012 by $3.9 million.
Commissions for the year ended December 31, 2011 increased $34.3 million, or 37.0%, to $126.9 million, from $92.6 million for the year ended December 31, 2010. The increase for 2011, compared to 2010, was principally due to 2011 results containing a full year of results for Auto Knight, Continental, and United, whereas 2010 results included only eight months of activity for Continental and four months of activity for United. In addition we saw a $4.5 million increase in net commissions due to growth in net written premiums. Retrospective commission expense increased $1.3 million due to favorable underwriting results and a decrease of $2.6 million in deferred policy acquisition cost amortization.
Personnel Costs
Personnel costs for the year ended December 31, 2012 increased $4.1 million, or 9.2%, to $48.6 million from $44.5 million for the year ended December 31, 2011. The increase resulted primarily from $1.9 million for the 2011 PBG acquisition and the increased headcount across the business. Total employees at December 31, 2012 increased to 589, which excludes the employees of ProtectCELL and 4Warranty, compared to 545 at December 31, 2011. In addition, the sale of CIRG in 2011 reduced personnel costs in 2012 by $0.3 million. Stock-based compensation expense included in personnel costs totaled $0.7 million and $0.6 million for the year ended December 31, 2012 and 2011, respectively.
Personnel costs for the year ended December 31, 2011 increased $8.2 million, or 22.5%, to $44.5 million from $36.4 million for the year ended December 31, 2010. The majority of the increase resulted from our 2011 and 2010 acquisitions, which increased personnel costs by $5.7 million, and $1.1 million associated with being a public company. Total employees at December 31, 2011 increased to
47
545 compared to 460 at December 31, 2010. For the year ended December 31, 2011 we recorded total stock based compensation expense of $0.6 million compared to $0.2 million for the year ended December 31, 2010.
Other Operating Expenses
Other operating expenses for the year ended December 31, 2012 decreased $0.8 million, or 2.5%, to $30.4 million from $31.1 million for the year ended December 31, 2011. Other Operating expenses declined by $2.6 million led by transaction costs and other one-time expenses decreasing $0.4 million and $1.4 million, respectively. These improvements were offset in part by the impact of a full year of other operating expenses from PBG which we acquired during the final quarter in 2011. For 2012, PBG's other operating expenses were $2.1 million compared with 2011's other operating expenses of $0.3 million.
Other operating expenses for the year ended December 31, 2011 increased $6.7 million, or 27.5%, to $31.1 million from $24.4 million for the year ended December 31, 2010. The increase in other operating expenses is primarily due to $1.9 million in non-recurring charges, which included $1.0 million in costs related to contemplated acquisitions, $0.2 million in costs for corporate governance matters, $0.2 million for office relocation expenses, and $0.1 million in non-recurring statutory audits related to expanded licensing activities. In addition, $1.5 million of the increase is attributable to public company costs, including increased auditing and professional fees, corporate insurance and director fees. Also, our 2011 and 2010 acquisitions increased other operating expenses by $3.2 million.
Depreciation and Amortization
Depreciation and amortization expense for the year ended December 31, 2012 increased $0.9 million or 27.8% to $3.9 million from $3.1 million for the year ended December 31, 2011, with the increase attributable to higher levels of depreciable and amortizable assets in service during 2012 compared to 2011.
Depreciation and amortization expense for the year ended December 31, 2011 increased $1.7 million, or 120.4%, to $3.1 million from $1.4 million for the year ended December 31, 2010. The increase was primarily due to higher levels of depreciable and amortizable assets in service at 2011 compared to 2010.
Amortization of Intangibles
Amortization expense on intangibles totaled $5.0 million for the year ended December 31, 2012 and 2011, respectively. Amortization expense on intangibles increased $1.7 million, or 53.2%, to $5.0 million for the year ended December 31, 2011 from $3.2 million for the year ended December 31, 2010. The increase was primarily due to the 2011 and 2010 acquisitions which increased the level of amortizable intangibles in 2011.
Interest Expense
Interest expense for the year ended December 31, 2012 decreased $1.0 million, or 13.3%, to $6.6 million from $7.6 million for the year ended December 31, 2011 and was positively impacted by a lower interest rate on outstanding borrowings and our new credit facility with Wells Fargo Bank, N.A., which took effect on August 2, 2012 and the impact of the interest rate swap, which took effect in mid-June 2012. These decreases were partially offset by a $0.7 million charge to interest expense for previously capitalized transaction costs associated with the termination of the SunTrust Bank, N.A. revolving credit facility in August.
Interest expense for the year ended December 31, 2011 decreased $0.8 million, or 9.7%, to $7.6 million from $8.5 million for the year ended December 31, 2010. Interest expense for the year ended December 31, 2011 included the write off of $0.3 million during the first quarter of 2011 for capitalized issuance costs associated with the redemption of preferred stock. Interest expense for the year ended December 31, 2011 was positively impacted by the use of proceeds of our IPO funds to eliminate higher rate debt late in 2010 and to a lesser extent the changing of our base rate for our revolving line of credit to a EURO Dollar Funding thereby reducing our interest rate from 6.00% to 4.10% on $53.0 million in outstanding borrowings during the latter part of 2011. The reduction in higher rate borrowings was partially offset by the addition of approximately $41.8 million on our credit facility to fund the Auto Knight and eReinsure acquisitions in the first quarter of 2011 and to a lesser extent an additional $7.0 million borrowed to fund the PBG acquisition in the fourth quarter of 2011.
Loss on sale of subsidiary
On July 1, 2011, we sold our wholly-owned subsidiary, CIRG, for a sales price of $1.2 million, for cash and a $1.1 million secured note receivable. For the year ended December 31, 2011, we recorded a $0.5 million loss on the sale of CIRG.
Income Taxes
Income taxes for the year ended December 31, 2012 increased $1.2 million, or 16.2%, to $8.3 million from $7.1 million for the year ended December 31, 2011, with the increase primarily attributable to a higher level of pretax income. Our effective tax rate was 35.2% for the year ended December 31, 2012 compared to 34.9% for the same period in 2011.
48
Income taxes for the year ended December 31, 2011 decreased $1.0 million, or 12.5%, to $7.1 million compared with $8.2 million for 2010 due primarily to lower income before income taxes. Our effective tax rate was 34.9% for the year ended December 31, 2011 and 2010, respectively.
As of December 31, 2012, we were under examination by the Internal Revenue Service ("IRS") for the 2009 and 2010 tax years. In February 2013, the IRS completed its field audit for those tax years and presented preliminary findings. We have agreed to those findings and paid $57.0 thousand, an amount considered immaterial to the consolidated group as of December 31, 2012. In March 2013, we received notice from the IRS that the audit report has been fully approved. The assessment will be expensed in the 1st quarter of 2013.
RESULTS OF OPERATIONS - SEGMENTS
We conduct our business through three business segments: (i) Payment Protection; (ii) BPO; and (iii) Brokerage. The revenue for each segment is presented to reflect the operating characteristics of the segment. We allocate certain revenues and costs to our segments. These items consist primarily of corporate-related income, transaction related costs, executive stock compensation and other overhead expenses. For additional information regarding segment net revenues and operating expenses, see the Note, "Segment Results" in the Notes to the Consolidated Financial Statements included in this Form 10-K.
In this Form 10-K, we present EBITDA, segment EBITDA margin and Adjusted EBITDA. These financial measures as presented in this Form 10-K are considered Non-GAAP financial measures and are not recognized terms under U.S. GAAP and should not be used as an indicator of, and are not an alternative to, net income as a measure of operating performance. EBITDA as used in this Form 10-K is net income before interest expense, income taxes, non-controlling interest, depreciation and amortization. Adjusted EBITDA, as used in this Form 10-K means "Consolidated Adjusted EBITDA" which is defined under our credit facility with Well Fargo Bank, N.A., is generally consolidated net income before consolidated interest expense, consolidated amortization expense, consolidated depreciation expense and consolidated income tax expense. The other items excluded in this calculation may include if applicable, but are not limited to, specified acquisition costs, impairment of goodwill and other non-cash charges, stock-based compensation expense and unusual or non-recurring charges. The calculation below does not give effect to certain additional adjustments permitted under our credit facility, which if included, would increase the amount of Adjusted EBITDA reflected in this table. We believe presenting EBITDA and Adjusted EBITDA provides investors with a supplemental financial measure of our operating performance.
In addition to the financial covenant requirements under our credit facility, management uses EBITDA and Adjusted EBITDA as financial measures of operating performance for planning purposes, which may include, but are not limited to, the preparation of budgets and projections, the determination of bonus compensation for executive officers, the analysis of the allocation of resources and the evaluation of the effectiveness of business strategies. Although we use EBITDA and Adjusted EBITDA as financial measures to assess the operating performance of our business, both measures have significant limitations as analytical tools because they exclude certain material expenses. For example, they do not include interest expense and the payment of income taxes, which are both a necessary element of our costs and operations. Since we use property and equipment to generate service revenues, depreciation expense is a necessary element of our costs. In addition, the omission of amortization expense associated with our intangible assets further limits the usefulness of this financial measure. Management believes the inclusion of the adjustments to EBITDA and Adjusted EBITDA are appropriate to provide additional information to investors about certain material non-cash items and about unusual items that we do not expect to continue at the same level in the future. Because EBITDA and Adjusted EBITDA do not account for these expenses, its utility as a financial measure of our operating performance has material limitations. Due to these limitations, management does not view EBITDA and Adjusted EBITDA in isolation or as a primary financial performance measure.
We believe EBITDA and Adjusted EBITDA are frequently used by securities analysts, investors and other interested parties in the evaluation of similar companies in similar industries and to measure the company's ability to service its debt and other cash needs. Because the definitions of EBITDA and Adjusted EBITDA (or similar financial measures) may vary among companies and industries, they may not be comparable to other similarly titled financial measures used by other companies.
49
The following tables present segment revenue and expense information, segment EBITDA and EBITDA margin information and a reconciliation to net income:
| (in thousands, except percentages) | For the Years Ended December 31, | |||||||||||||||
| 2012 | 2011 (1) | $ Change from 2011 | % Change from 2011 | 2010 (1) | ||||||||||||
| As Restated | As Restated | |||||||||||||||
| Payment Protection: | ||||||||||||||||
| Service and administrative fees | $ | 70,365 | $ | 76,244 | $ | (5,879 | ) | (7.7 | )% | $ | 34,568 | |||||
| Ceding commission | 34,825 | 29,495 | 5,330 | 18.1 | 28,767 | |||||||||||
| Net investment income | 3,068 | 3,368 | (300 | ) | (8.9 | ) | 4,073 | |||||||||
| Net realized investment gains | 3 | 4,193 | (4,190 | ) | (99.9 | ) | 650 | |||||||||
| Other income | 269 | 170 | 99 | 58.2 | 230 | |||||||||||
| Net earned premium | 127,625 | 115,503 | 12,122 | 10.5 | 111,805 | |||||||||||
| Net losses and loss adjustment expenses | (40,219 | ) | (37,949 | ) | (2,270 | ) | 6.0 | (36,035 | ) | |||||||
| Member benefit claims | (4,642 | ) | (4,409 | ) | (233 | ) | (15.8 | ) | (466 | ) | ||||||
| Commissions | (128,741 | ) | (126,918 | ) | (1,823 | ) | 1.4 | (92,646 | ) | |||||||
| Payment Protection revenue, net | 62,553 | 59,697 | 2,856 | 4.8 | 50,946 | |||||||||||
| Operating expenses - Payment Protection | 36,420 | 33,514 | 2,906 | 8.7 | 25,126 | |||||||||||
| EBITDA | 26,133 | 26,183 | (50 | ) | (0.2 | ) | 25,820 | |||||||||
| EBITDA margin | 41.8 | % | 43.9 | % | 50.7 | % | ||||||||||
| Depreciation and amortization | 3,590 | 4,205 | (615 | ) | (14.6 | ) | 2,352 | |||||||||
| Interest Expense | 4,146 | 4,649 | (503 | ) | (10.8 | ) | 7,197 | |||||||||
| Income before income taxes and non-controlling interests | 18,397 | 17,329 | 1,068 | 6.2 | 16,271 | |||||||||||
| BPO: | ||||||||||||||||
| BPO revenue | 18,424 | 15,584 | 2,840 | 18.2 | 17,069 | |||||||||||
| Operating expenses | 14,227 | 11,598 | 2,629 | 22.7 | 10,002 | |||||||||||
| EBITDA | 4,197 | 3,986 | 211 | 5.3 | 7,067 | |||||||||||
| EBITDA margin | 22.8 | % | 25.6 | % | 41.4 | % | ||||||||||
| Depreciation and amortization | 2,290 | 1,124 | 1,166 | 103.7 | 598 | |||||||||||
| Interest Expense | 1,035 | 419 | 616 | 147.0 | 433 | |||||||||||
| Income before income taxes and non-controlling interests | 872 | 2,443 | (1,571 | ) | (64.3 | ) | 6,036 | |||||||||
| Brokerage: | ||||||||||||||||
| Brokerage revenue | 37,067 | 37,032 | 35 | 0.1 | 29,237 | |||||||||||
Operating expenses (2) | 28,355 | 29,289 | (934 | ) | (3.2 | ) | 23,529 | |||||||||
EBITDA (2) | 8,712 | 7,743 | 969 | 12.5 | 5,708 | |||||||||||
| EBITDA margin | 23.5 | % | 20.9 | % | 19.5 | % | ||||||||||
| Depreciation and amortization | 3,006 | 2,700 | 306 | 11.3 | 1,678 | |||||||||||
| Interest expense | 1,443 | 2,573 | (1,130 | ) | (43.9 | ) | 834 | |||||||||
| Income before income taxes and non-controlling interests | 4,263 | 2,470 | 1,793 | 72.6 | 3,196 | |||||||||||
| Corporate: | ||||||||||||||||
| Corporate revenue | — | — | — | — | — | |||||||||||
| Operating expenses | — | 1,763 | (1,763 | ) | (100.0 | ) | 2,130 | |||||||||
| EBITDA | — | (1,763 | ) | 1,763 | (100.0 | ) | (2,130 | ) | ||||||||
| EBITDA margin | — | — | — | |||||||||||||
| Depreciation and amortization | — | — | — | — | — | |||||||||||
| Interest Expense | — | — | — | — | — | |||||||||||
| (Loss) before income taxes and non-controlling interests | — | (1,763 | ) | 1,763 | (100.0 | ) | (2,130 | ) | ||||||||
| Segment net revenue | 118,044 | 112,313 | 5,731 | 5.1 | 97,252 | |||||||||||
| Net losses and loss adjustment expenses | 40,219 | 37,949 | 2,270 | 6.0 | 36,035 | |||||||||||
| Member benefit claims | 4,642 | 4,409 | 233 | 5.3 | 466 | |||||||||||
| Commissions | 128,741 | 126,918 | 1,823 | 1.4 | 92,646 | |||||||||||
| Total revenue | 291,646 | 281,589 | 10,057 | 3.6 | 226,399 | |||||||||||
| Segment operating expenses | 79,002 | 76,164 | 2,838 | 3.7 | 60,787 | |||||||||||
| Net losses and loss adjustment expenses | 40,219 | 37,949 | 2,270 | 6.0 | 36,035 | |||||||||||
50
| (in thousands, except percentages) | For the Years Ended December 31, | |||||||||||||||
| 2012 | 2011 (1) | $ Change from 2011 | % Change from 2011 | 2010 (1) | ||||||||||||
| As Restated | As Restated | |||||||||||||||
| Member benefit claims | 4,642 | 4,409 | 233 | 5.3 | 466 | |||||||||||
| Commissions | 128,741 | 126,918 | 1,823 | 1.4 | 92,646 | |||||||||||
| Total expenses before depreciation, amortization and interest expense | 252,604 | 245,440 | 7,164 | 2.9 | 189,934 | |||||||||||
| Total EBITDA | 39,042 | 36,149 | 2,893 | 8.0 | 36,465 | |||||||||||
| Depreciation and amortization | 8,886 | 8,029 | 857 | 10.7 | 4,628 | |||||||||||
| Interest Expense | 6,624 | 7,641 | (1,017 | ) | (13.3 | ) | 8,464 | |||||||||
| Total income before income taxes and non-controlling interests | 23,532 | 20,479 | 3,053 | 14.9 | 23,373 | |||||||||||
| Income taxes | 8,295 | 7,140 | 1,155 | 16.2 | 8,159 | |||||||||||
| Less: net income (loss) attributable to non-controlling interests | 72 | (170 | ) | 242 | (142.4 | ) | 20 | |||||||||
| Net income | $ | 15,165 | $ | 13,509 | $ | 1,656 | 12.3 | % | $ | 15,194 | ||||||
(1) - The December 31, 2011 and 2010 Segment results have been adjusted to properly reflect the retrospective adoption of ASU 2010-26, Accounting for Costs Associated with Acquiring or Renewing Insurance Contracts, as described in the Note, "Restatement of the Consolidated Financial Statements," of Notes to the Consolidated Financial Statements.
(2)- Includes a $477 loss on the sale of subsidiary for the year ended December 31, 2011.
The table below presents a reconciliation of net income to EBITDA and Adjusted EBITDA for the following periods:
| For the Years Ended December 31, | |||||||||||
| (in thousands) | 2012 | 2011 | 2010 | ||||||||
| As Restated | As Restated | ||||||||||
| Net income | $ | 15,165 | $ | 13,509 | $ | 15,194 | |||||
| Depreciation | 3,933 | 3,077 | 1,396 | ||||||||
| Amortization of intangibles | 4,953 | 4,952 | 3,232 | ||||||||
| Interest expense | 6,624 | 7,641 | 8,464 | ||||||||
| Income taxes | 8,295 | 7,140 | 8,159 | ||||||||
| Net income (loss) attributable to non-controlling interests | 72 | (170 | ) | 20 | |||||||
| EBITDA | 39,042 | 36,149 | 36,465 | ||||||||
Transaction costs (a) | 601 | 989 | 486 | ||||||||
| Corporate governance study | — | 248 | — | ||||||||
| Relocation expenses | — | 207 | — | ||||||||
| Statutory audits | — | 98 | — | ||||||||
| Loss on sale of subsidiary | — | 477 | — | ||||||||
| Legal expenses | — | 360 | — | ||||||||
| Stock-based compensation expense | 954 | 747 | 176 | ||||||||
| Re-audit expense | — | — | 1,644 | ||||||||
| Adjusted EBITDA | $ | 40,597 | $ | 39,275 | $ | 38,771 | |||||
(a) Represents transaction costs associated with acquisitions. | |||||||||||
Payment Protection Segment
Net revenues for the year ended December 31, 2012 increased $2.9 million, or 4.8%, to $62.6 million from $59.7 million for the year ended December 31, 2011. The change in accounting estimate increased net revenues by $1.3 million for the 2012 period. Ceding commission increased $2.5 million, after deducting the impact from the change in accounting estimate, primarily from improved underwriting results due to growth in ceded earned premiums and favorable loss experience along with additional administrative fees earned from increased insurance production in 2012, which was partially offset by a $5.9 million decrease in service and administrative fees in our Motor Clubs Division. In addition, after deducting the impact from the change in accounting estimate, net earned premium was $9.7 million above the 2011 period and resulted from increased premium growth.Net loss and loss adjustment expenses were $2.3 million above the 2011 period due to increased earned premium and warranty claims. Commissions decreased $2.1 million, after deducting the impact from the change in accounting estimate, primarily due to the decrease in Motor Club service and administrative fees partially offset by growth in commissions in our credit insurance products. Net investment income on our portfolio decreased by $0.3 million due to lower investment yields. Net realized gains on the sale of investments decreased by $4.2 million due to the sale of investment securities in 2011 not repeated in the 2012 period. Service fee income decreased by $2.4 million primarily due to reduced motor club revenue.
51
Net revenues for the year ended December 31, 2011 increased $8.8 million, or 17.2%, to $59.7 million from $50.9 million for the year ended December 31, 2010. The 2011 results include a full year of revenues from the acquisitions of Auto Knight, Continental and United, which added $6.9 million of revenue. Net realized gains on the sale of investments increased by $3.5 million. Service and administrative fee income for the core business was $0.6 million above prior year and resulted from increased debt cancellation and service fees primarily in the Consumer Finance channel. Ceding commission increased $0.7 million due to additional service and administrative fees from increased insurance production in 2011. These increases were offset by lower net investment income on our portfolio of $0.7 million due to lower investment yields. In addition, underwriting revenue was $1.3 million below prior year 2010 and resulted from increased commissions in the Consumer Finance channel and an increase in loss ratio in our risk retained business.
Operating expenses for the year ended December 31, 2012 increased $2.9 million, or 8.7%, to $36.4 million from $33.5 million for the year ended December 31, 2011. The increase in 2012 resulted primarily from growth in variable expenses to expand our payment protection business while the change in accounting estimate decreased 2012 by $0.4 million.
Operating expenses for the year ended December 31, 2011 increased $8.4 million, or 33.4%, to $33.5 million from $25.1 million for the year ended December 31, 2010. This increase resulted primarily from $2.8 million in expenses associated with being a public company, $1.3 million in non-recurring expenses and additional stock-based compensation expense of $0.6 million. Also contributing to this increase was $3.2 million of expense from the acquisitions of Auto Knight, Continental and United.
EBITDA for the year ended December 31, 2012 increased $0.1 million, or 0.2%, to $26.1 million from $26.2 million for the same period in 2011. EBITDA margin was 41.8% and 43.9% for the years ended December 31, 2012 and 2011, respectively.
EBITDA for the year ended December 31, 2011 increased $0.4 million, or 1.4%, to $26.2 million from $25.8 million for the year ended December 31, 2010. As a result, EBITDA margin for the year ended December 31, 2011 was 43.9% compared with 50.7% for the year ended December 31, 2010.
BPO Segment
The BPO segment for 2012 includes a full year of results for PBG, which was acquired in October 2011.
Revenues for the year ended December 31, 2012 increased $2.8 million, or 18.2%, to $18.4 million from $15.6 million for the year ended December 31, 2011. The increase in 2012 primarily reflects additional revenues of $2.7 million from our PBG acquisition and an increase in service and administrative fees of $0.9 million on debt cancellation programs for credit card companies and $0.3 million fee for the implementation of a new term life program for a new life insurance carrier client. These increases were partially offset by lower service and administrative fees for our insurance company clients, which decreased $1.2 million due to regulatory changes that slowed the production for one of our main customers in 2012.
Revenues for the year ended December 31, 2011 decreased $1.5 million or 8.7%, to $15.6 million from $17.1 million for the year ended December 31, 2010. The decrease was driven by lower service and administrative fees for our insurance company clients which decreased $2.5 million due to regulatory changes that slowed the production for one of our main customers in 2011. This was offset by an increase in service and administrative fees of $0.1 million on debt cancellation programs for credit card companies and $0.9 million of additional revenue from our 2011 fourth quarter acquisition of PBG.
Operating expenses for the year ended December 31, 2012 increased $2.6 million, or 22.7%, to $14.2 million from $11.6 million for the year ended December 31, 2011. The increase resulted primarily from additional expenses of $4.4 million from our PBG acquisition, offset by a $1.4 million reduction in operating expenses resulting from lower variable costs for processing and fulfillment associated with the decline in Consecta revenue.
Operating expenses for the year ended December 31, 2011 increased $1.6 million or 16.0%, to $11.6 million from $10.0 million for the year ended December 31, 2010. This primarily resulted from additional expenses of $0.9 million from our 2011 acquisition of Pacific Benefits Group and higher expenses related to being a public company which was offset by lower personnel costs and variable costs for processing and fulfillment associated with the decline in revenue.
EBITDA for the year ended December 31, 2012 was $4.2 million compared to $4.0 million for the same period in 2011. EBITDA margin was 22.8% and 25.6% for the years ended December 31, 2012 and 2011, respectively.
EBITDA for the year ended December 31, 2011 decreased $3.1 million, or 43.6%, to $4.0 million from $7.1 million for the year ended December 31, 2010. As a result, EBITDA margin for the year ended December 31, 2011 was 25.6% compared to 41.4% for the year ended December 31, 2010.
Brokerage Segment
52
The Brokerage segment for 2012 includes a full year of results for eReinsure while 2011 includes eReinsure's results from the date of acquisition on March 3, 2011 and six months of CIRG results, which was sold in July 2011.
Revenues totaled $37.1 million for the year ended December 31, 2012 compared to $37.0 million for the year ended December 31, 2011 and were comprised primarily of $24.5 million in standard commissions and fees, $2.4 million in profit commissions, $2.0 million of premium financing and collateral recovery fees and $8.4 million in fees from eReinsure. Revenues for the year ended December 31, 2011 of $37.0 million were comprised primarily of $23.7 million in standard commissions and fees, $1.9 million in profit commissions, $8.8 million in fees from eReinsure, and $2.0 million of premium financing and collateral recovery fees. Revenues for the year ended December 31, 2010 were $29.2 million and were comprised primarily of $23.1 million of standard commissions and fees, $1.2 million of profit commission revenue and $4.9 million of debt collection, premium financing and collateral recovery fees.
Operating expenses for the year ended December 31, 2012 were $28.4 million, compared to $29.3 million for the same period in 2011. For the years ended December 31, 2012 and 2011, the majority of our expenses were personnel costs, which totaled $15.6 million and $14.9 million, respectively. For the year ended December 31, 2012, eReinsure accounted for $3.1 million of the personnel costs and $0.9 million of the operating expenses compared to $3.3 million and $1.4 million, respectively for the same period in 2011.
Operating expenses for the year ended December 31, 2011 were $29.3 million, which includes a $0.5 million loss on sale of CIRG, compared to $23.5 million for the same period in 2010. For the year ended December 31, 2011 and 2010, the majority of our expenses were personnel costs, which totaled $19.8 million and $16.5 million, respectively.
EBITDA, for the year ended December 31, 2012 was $8.7 million compared to $7.7 million for the same period in 2011. EBITDA margin was 23.5% and 20.9% for the years ended December 31, 2012 and 2011, respectively.
EBITDA, excluding the loss on the sale of subsidiary of $0.5 million, for the year ended December 31, 2011 was $8.2 million compared to $5.7 million for the year ended December 31, 2010. As a result, EBITDA margin for the Brokerage segment was 22.2% and 19.8% for 2011 and 2010, respectively.
Corporate Segment
No income or expenses were allocated to the Corporate segment for the year ended December 31, 2012. Operating expenses for the year ended December 31, 2011 were $1.8 million compared to $2.1 million for the year ended December 31, 2010. The expenses for the year ended December 31, 2011 included professional fees, transaction costs and costs associated with the moving of our Jacksonville, FL based operations. Operating expenses for the year ended December 31, 2010 were attributable to acquisition costs and re-audit professional fees and travel costs.
Goodwill by Business Segment
During 2012, we acquired ProtectCELL and 4Warranty and recorded preliminary goodwill amounts of $11.7 million and $2.7 million, respectively. In addition, during 2012, we determined the final valuation for eReinsure and PBG and reduced the amount of goodwill associated with these acquisitions by $2.6 million and $2.7 million, respectively, to reflect the final valuation of intangibles acquired.
The following table shows goodwill assigned to each business segment at: (in thousands) | December 31, 2012 | ||
| Payment Protection: | |||
| Summit Partners Transactions | $ | 22,763 | |
| Darby & Associates | 642 | ||
| Continental | 5,427 | ||
| United | 4,581 | ||
| Auto Knight | 4,215 | ||
| ProtectCELL | 11,732 | ||
| 4Warranty | 2,724 | ||
| Total Payment Protection | 52,084 | ||
| BPO: | |||
| Summit Partners Transactions | 8,902 | ||
| PBG | 4,068 | ||
| Total BPO | 12,970 | ||
| Brokerage: | |||
| B&G | 30,468 | ||
| South Bay | 478 | ||
| eReinsure | 23,512 | ||
| Total Brokerage | 54,458 | ||
| Total Goodwill | $ | 119,512 | |
53
RESTATEMENT OF INTERIM FINANCIAL STATEMENTS
RESULTS OF OPERATIONS - RESTATED QUARTERLY RESULTS
The following tables present our restated results of operations for the quarters ending March 31, June 30, and September 30 for the years 2012, 2011 and 2010, respectively, as discussed in the Note, "Restatement of the Consolidated Financial Statements," of Notes to the Consolidated Financial Statements.
| For the Three Months Ended | |||||||||||||||||||
| (in thousands, except shares, per share amounts and percentages) | March 31, 2012 | March 31, 2011 | 2012 $ Change from 2011 | 2012 % Change from 2011 | March 31, 2010 | 2011 $ Change from 2010 | 2011 % Change from 2010 | ||||||||||||
| As Restated | As Restated | As Restated | |||||||||||||||||
| Revenues: | |||||||||||||||||||
| Service and administrative fees | $ | 22,511 | $ | 21,192 | $ | 1,319 | 6.2 | % | $ | 7,975 | $ | 13,217 | 165.7 | % | |||||
| Brokerage commissions and fees | 9,520 | 7,867 | 1,653 | 21.0 | 6,730 | 1,137 | 16.9 | ||||||||||||
| Ceding commission | 7,064 | 8,158 | (1,094 | ) | (13.4 | ) | 6,624 | 1,534 | 23.2 | ||||||||||
| Net investment income | 743 | 941 | (198 | ) | (21.0 | ) | 948 | (7 | ) | (0.7 | ) | ||||||||
| Net realized investment (losses)gains | (3 | ) | 95 | (98 | ) | (103.2 | ) | 2 | 93 | 4,650.0 | |||||||||
| Net earned premium | 31,972 | 28,437 | 3,535 | 12.4 | 28,493 | (56 | ) | (0.2 | ) | ||||||||||
| Other income | 72 | 82 | (10 | ) | (12.2 | ) | 81 | 1 | 1.2 | ||||||||||
| Total revenues | 71,879 | 66,772 | 5,107 | 7.6 | 50,853 | 15,919 | 31.3 | ||||||||||||
| Expenses: | |||||||||||||||||||
| Net losses and loss adjustment expenses | 11,266 | 9,373 | 1,893 | 20.2 | 8,777 | 596 | 6.8 | ||||||||||||
| Member benefit claims | 1,303 | 867 | 436 | 50.3 | — | 867 | — | ||||||||||||
| Commissions | 31,988 | 29,906 | 2,082 | 7.0 | 19,349 | 10,557 | 54.6 | ||||||||||||
| Personnel costs | 11,392 | 10,992 | 400 | 3.6 | 9,081 | 1,911 | 21.0 | ||||||||||||
| Other operating expenses | 6,739 | 7,214 | (475 | ) | (6.6 | ) | 5,792 | 1,422 | 24.6 | ||||||||||
| Depreciation and amortization | 738 | 583 | 155 | 26.6 | 275 | 308 | 112.0 | ||||||||||||
| Amortization of intangibles | 1,482 | 1,052 | 430 | 40.9 | 779 | 273 | 35.0 | ||||||||||||
| Interest expense | 1,652 | 2,031 | (379 | ) | (18.7 | ) | 1,891 | 140 | 7.4 | ||||||||||
| Total expenses | 66,560 | 62,018 | 4,542 | 7.3 | 45,944 | 16,074 | 35.0 | ||||||||||||
| Income before income taxes and non-controlling interests | 5,319 | 4,754 | 565 | 11.9 | 4,909 | (155 | ) | (3.2 | ) | ||||||||||
| Income taxes | 1,887 | 1,609 | 278 | 17.3 | 1,846 | (237 | ) | (12.8 | ) | ||||||||||
| Income before non-controlling interests | 3,432 | 3,145 | 287 | 9.1 | 3,063 | 82 | 2.7 | ||||||||||||
| Less: net income (loss) attributable to non-controlling interests | 18 | (174 | ) | 192 | (110.3 | ) | 15 | (189 | ) | (1,260.0 | ) | ||||||||
| Net income | $ | 3,414 | $ | 3,319 | $ | 95 | 2.9 | $ | 3,048 | $ | 271 | 8.9 | |||||||
| Earnings per share: | |||||||||||||||||||
| Basic | $ | 0.17 | $ | 0.16 | $ | 0.19 | |||||||||||||
| Diluted | $ | 0.16 | $ | 0.15 | $ | 0.18 | |||||||||||||
| Weighted average common shares outstanding: | |||||||||||||||||||
| Basic | 19,904,819 | 20,464,592 | 15,742,336 | ||||||||||||||||
| Diluted | 20,739,196 | 21,668,333 | 16,941,372 | ||||||||||||||||
54
| For the Three Months Ended | |||||||||||||||||||
| (in thousands, except shares, per share amounts and percentages) | June 30, 2012 | June 30, 2011 | 2012 $ Change from 2011 | 2012 % Change from 2011 | June 30, 2010 | 2011 $ Change from 2010 | 2011 % Change from 2010 | ||||||||||||
| As Restated | As Restated | As Restated | |||||||||||||||||
| Revenues: | |||||||||||||||||||
| Service and administrative fees | $ | 21,786 | $ | 21,121 | $ | 665 | 3.1 | % | $ | 11,925 | $ | 9,196 | 77.1 | % | |||||
| Brokerage commissions and fees | 9,364 | 9,208 | 156 | 1.7 | 6,404 | 2,804 | 43.8 | ||||||||||||
| Ceding commission | 7,210 | 6,243 | 967 | 15.5 | 6,389 | (146 | ) | (2.3 | ) | ||||||||||
| Net investment income | 732 | 894 | (162 | ) | (18.1 | ) | 986 | (92 | ) | (9.3 | ) | ||||||||
| Net realized investment gains | 13 | 1,132 | (1,119 | ) | (98.9 | ) | 47 | 1,085 | 2,308.5 | ||||||||||
| Net earned premium | 31,905 | 27,536 | 4,369 | 15.9 | 26,669 | 867 | 3.3 | ||||||||||||
| Other income | 48 | 38 | 10 | 26.3 | 45 | (7 | ) | (15.6 | ) | ||||||||||
| Total revenues | 71,058 | 66,172 | 4,886 | 7.4 | 52,465 | 13,707 | 26.1 | ||||||||||||
| Expenses: | |||||||||||||||||||
| Net losses and loss adjustment expenses | 9,576 | 9,251 | 325 | 3.5 | 7,316 | 1,935 | 26.4 | ||||||||||||
| Member benefit claims | 1,098 | 1,309 | (211 | ) | (16.1 | ) | (23 | ) | 1,332 | (5,791.3 | ) | ||||||||
| Commissions | 31,282 | 28,727 | 2,555 | 8.9 | 20,955 | 7,772 | 37.1 | ||||||||||||
| Personnel costs | 12,367 | 11,428 | 939 | 8.2 | 9,332 | 2,096 | 22.5 | ||||||||||||
| Other operating expenses | 6,937 | 9,298 | (2,361 | ) | (25.4 | ) | 6,058 | 3,240 | 53.5 | ||||||||||
| Depreciation and amortization | 975 | 814 | 161 | 19.8 | 284 | 530 | 186.6 | ||||||||||||
| Amortization of intangibles | 1,166 | 1,378 | (212 | ) | (15.4 | ) | 779 | 599 | 76.9 | ||||||||||
| Interest expense | 1,590 | 1,925 | (335 | ) | (17.4 | ) | 1,985 | (60 | ) | (3.0 | ) | ||||||||
| Total expenses | 64,991 | 64,130 | 861 | 1.3 | 46,686 | 17,444 | 37.4 | ||||||||||||
| Income before income taxes and non-controlling interests | 6,067 | 2,042 | 4,025 | 197.1 | 5,779 | (3,737 | ) | (64.7 | ) | ||||||||||
| Income taxes | 2,108 | 750 | 1,358 | 181.1 | 2,162 | (1,412 | ) | (65.3 | ) | ||||||||||
| Income before non-controlling interests | 3,959 | 1,292 | 2,667 | 206.4 | 3,617 | (2,325 | ) | (64.3 | ) | ||||||||||
| Less: net income (loss) attributable to non-controlling interests | 15 | 2 | 13 | 650.0 | (46 | ) | 48 | (104.3 | ) | ||||||||||
| Net income | $ | 3,944 | $ | 1,290 | $ | 2,654 | 205.7 | $ | 3,663 | $ | (2,373 | ) | (64.8 | ) | |||||
| Earnings per share: | |||||||||||||||||||
| Basic | $ | 0.20 | $ | 0.06 | $ | 0.23 | |||||||||||||
| Diluted | $ | 0.19 | $ | 0.06 | $ | 0.21 | |||||||||||||
| Weighted average common shares outstanding: | |||||||||||||||||||
| Basic | 19,705,276 | 20,510,254 | 15,742,336 | ||||||||||||||||
| Diluted | 20,632,233 | 21,592,418 | 17,040,432 | ||||||||||||||||
55
| For the Three Months Ended | |||||||||||||||||||
| (in thousands, except shares, per share amounts and percentages) | September 30, 2012 | September 30, 2011 | 2012 $ Change from 2011 | 2012 % Change from 2011 | September 30, 2010 | 2011 $ Change from 2010 | 2011 % Change from 2010 | ||||||||||||
| As Restated | As Restated | As Restated | |||||||||||||||||
| Revenues: | |||||||||||||||||||
| Service and administrative fees | $ | 22,898 | $ | 26,956 | $ | (4,058 | ) | (15.1 | )% | $ | 17,967 | $ | 8,989 | 50.0 | % | ||||
| Brokerage commissions and fees | 8,411 | 8,611 | (200 | ) | (2.3 | ) | 6,034 | 2,577 | 42.7 | ||||||||||
| Ceding commission | 11,122 | 7,027 | 4,095 | 58.3 | 9,455 | (2,428 | ) | (25.7 | ) | ||||||||||
| Net investment income | 744 | 801 | (57 | ) | (7.1 | ) | 865 | (64 | ) | (7.4 | ) | ||||||||
| Net realized investment (losses)gains | (16 | ) | 1,196 | (1,212 | ) | (101.3 | ) | 107 | 1,089 | 1,017.8 | |||||||||
| Net earned premium | 33,893 | 28,673 | 5,220 | 18.2 | 28,255 | 418 | 1.5 | ||||||||||||
| Other income | 52 | 18 | 34 | 188.9 | (6 | ) | 24 | (400.0 | ) | ||||||||||
| Total revenues | 77,104 | 73,282 | 3,822 | 5.2 | 62,677 | 10,605 | 16.9 | ||||||||||||
| Expenses: | |||||||||||||||||||
| Net losses and loss adjustment expenses | 11,430 | 9,714 | 1,716 | 17.7 | 10,993 | (1,279 | ) | (11.6 | ) | ||||||||||
| Member benefit claims | 1,157 | 945 | 212 | 22.4 | 211 | 734 | 347.9 | ||||||||||||
| Commissions | 33,377 | 33,937 | (560 | ) | (1.7 | ) | 24,959 | 8,978 | 36.0 | ||||||||||
| Personnel costs | 12,708 | 10,945 | 1,763 | 16.1 | 9,526 | 1,419 | 14.9 | ||||||||||||
| Other operating expenses | 7,959 | 7,267 | 692 | 9.5 | 6,625 | 642 | 9.7 | ||||||||||||
| Depreciation and amortization | 871 | 886 | (15 | ) | (1.7 | ) | 431 | 455 | 105.6 | ||||||||||
| Amortization of intangibles | 1,127 | 998 | 129 | 12.9 | 788 | 210 | 26.6 | ||||||||||||
| Interest expense | 2,025 | 1,906 | 119 | 6.2 | 2,246 | (340 | ) | (15.1 | ) | ||||||||||
| Loss on sale of subsidiary | — | 477 | (477 | ) | — | — | 477 | — | |||||||||||
| Total expenses | 70,654 | 67,075 | 3,579 | 5.3 | 55,779 | 11,296 | 20.3 | ||||||||||||
| Income before income taxes and non-controlling interests | 6,450 | 6,207 | 243 | 3.9 | 6,898 | (691 | ) | (10.0 | ) | ||||||||||
| Income taxes | 2,397 | 2,209 | 188 | 8.5 | 2,532 | (323 | ) | (12.8 | ) | ||||||||||
| Income before non-controlling interests | 4,053 | 3,998 | 55 | 1.4 | 4,366 | (368 | ) | (8.4 | ) | ||||||||||
| Less: net income attributable to non-controlling interests | 29 | 1 | 28 | 2,800.0 | — | 1 | — | ||||||||||||
| Net income | $ | 4,024 | $ | 3,997 | $ | 27 | 0.7 | $ | 4,366 | $ | (369 | ) | (8.5 | ) | |||||
| Earnings per share: | |||||||||||||||||||
| Basic | $ | 0.21 | $ | 0.20 | $ | 0.28 | |||||||||||||
| Diluted | $ | 0.20 | $ | 0.19 | $ | 0.26 | |||||||||||||
| Weighted average common shares outstanding: | |||||||||||||||||||
| Basic | 19,531,694 | 20,404,441 | 15,742,336 | ||||||||||||||||
| Diluted | 20,463,238 | 21,214,365 | 17,057,157 | ||||||||||||||||
The following MD&A presents the discussion of the Consolidated Income Statement line items that were impacted by the restatements described in the Note, "Restatement of the Consolidated Financial Statements," of Notes to the Consolidated Financial Statements
REVENUES
Service and Administrative Fees
2012 compared to 2011
56
Service and administrative fees for the three months ended March 31, 2012 increased $1.3 million, or 6.2%, to $22.5 million from $21.2 million for the same period in 2011. The increase resulted primarily from an increase of $1.0 million in Motor Clubs fees, a $0.6 million increase in our BPO segment revenues, including the benefit of a $0.9 million increase in administrative fees from our 2011 acquisition of PBG offset by decreased revenue in Consecta of $0.3 million. In addition, we had a $0.1 million increase in administrative fees in our Payment Protection segment. These increases were partially offset by a $0.5 million lower debt collection and collateral recovery fees.
Service and administrative fees for the three months ended June 30, 2012 increased $0.7 million, or 3.1%, to $21.8 million from $21.1 million for the same period in 2011. The increase resulted primarily from a $0.7 million increase in our BPO segment revenues from our 2011 acquisition of PBG in October 2011 and a $0.1 million increase in administrative fees in our Payment Protection segment. These increases were partially offset by reduction of $0.2 million in Motor Clubs revenue and debt collection and collateral recovery fees declining $0.2 million compared to the same period in 2011.
Service and administrative fees for the three months ended September 30, 2012 decreased $4.1 million, or 15.1% to $22.9 million from $27.0 million for the same period in 2011. The decrease resulted primarily from lower Motor Club revenues of $5.0 million offset primarily from a $1.1 million increase in our BPO segment revenues, including the benefit of a $1.0 million increase in administrative fees from our acquisition of PBG in October 2011 and an increase in Consecta of $0.1 million.
2011 compared to 2010
Service and administrative fees increased 165.7%, or $13.2 million, to $21.2 million for the three months ended March 31, 2011 from $8.0 million for the three months ended March 31, 2010. The increase resulted from a $14.9 million increase in administrative fees in our Payment Protection segment. This resulted principally from a $14.7 million increase from our 2011 acquisition of Auto Knight and the full impact of our 2010 acquisitions, which mostly occurred in the latter part of 2010. These increases were partially offset by a $0.5 million reduction in our Brokerage service and administrative
Service and administrative fees increased $9.2 million, or 77.1%, to $21.1 million for the three months ended June 30, 2011, from $11.9 million for the three months ended June 30, 2010. The increase resulted principally from a $10.9 million increase from our 2011 acquisition of Auto Knight and the full impact of our 2010 acquisitions, which mostly occurred in the latter part of 2010. These increases were offset by a $0.6 million reduction in our BPO segment revenues and $0.6 million of lower debt collection and collection recovery fees.
Service and administrative fees for the three months ended September 30, 2011 increased $9.0 million or50.0% to $27.0 million from $18.0 million for the three months ended September 30, 2010. This increase resulted from a $10.6 million increase in administrative fees in our Payment Protection segment. This resulted principally from a $10.2 million increase from our 2011 acquisition of Auto Knight and the full impact of our 2010 acquisitions, which mostly occurred in the latter part of 2010, and growth in our core business of $0.4 million. These increases were offset by a $0.9 million reduction in our BPO segment revenues and $0.5 million of lower debt collection and collection recovery fees.
EXPENSES
Member Benefit Claims
2012 compared to 2011
Member benefit claims for the three months ended March 31, 2012 increased $0.4 million, or 50.3%, to $1.3 million from $0.9 million for the three months ended March 31, 2011. The increase resulted from increased claims activity in our Motor Clubs division as a result of increased in force policies.
Member benefit claims for the three months ended June 30, 2012 decreased $0.2 million, or 16.1%, to $1.1 million, from $1.3 million for the same period in 2011, resulting from lower Motor Clubs claims activity.
Member benefit claims for the three months ended September 30, 2012 increased $0.2 million, or 22.4%, to $1.1 million from $0.9 million for the same period in 2011. The increase was attributable principally to higher claims expense associated with one Motor Club program.
2011 compared to 2010
Member benefit claims was $0.9 million for the three months ended March 31, 2011. Since the first acquisition of a motor club did not occur until the second quarter of 2010, there was no corresponding member benefit claims expense for the same period in 2010.
Member benefit claims were $1.3 million for the three months ended June 30, 2011. There was no comparable claims cost in the same period 2010 as the Continental Car Club acquisition did not occur until the latter part of the quarter.
57
Member benefit claims for the three months ended September 30, 2011 increased $0.7 to $0.9 million from $0.2 million for the three months ended September 30, 2010. The increase in member benefit claims reflects the full impact of the Motor Club acquisitions in the third quarter 2011 compared to only partial operations during the third quarter 2010.
Commissions
2012 compared to 2011
Commissions for the three months ended March 31, 2012 increased $2.1 million, or 7.0%, to $32.0 million, from $29.9 million for the same period in 2011.The $2.1 million increase in commission expense resulted from growth in net earned premiums and the associated increase of $1.5 million in commission expense in our Payment Protection division and higher Service and administrative fees with a corresponding increase of commission expense of $0.6 million in our Motor Clubs division.
Commissions for the three months ended June 30, 2012 increased $2.6 million, or 8.9%, to $31.3 million, from $28.7 million for the same period in 2011.The increase in commission expense resulted from growth in Payment Protection net earned premiums and Motor Clubs Service and administrative fees.
Commissions for the three months ended September 30, 2012 decreased $0.6 million, or 1.7%, to $33.4 million, from $33.9 million for the same period in 2011. Commissions associated with Motor Clubs decreased $4.0 million consistent with the reduction in revenues for the period, offset by higher commission expense of $0.9 million which resulted from growth in net earned premiums and from the third quarter 2012 change in accounting estimate, which increased commissions in the third quarter 2012 by $2.7 million.
2011 compared to 2010
Commissions increased $10.6 million, or 54.6%, to $29.9 million for the three months ended March 31, 2011, from $19.3 million for the three months ended March 31, 2010. The increase in commission expense resulted from an $11.4 million increase in Motor Club commissions in the three months of 2011 with no comparable costs in the prior year period and a $0.9 million increase in deferred policy acquisition cost amortization offset by a decrease of $1.3 million in Retrospective Commissions due to unfavorable underwriting results and a $0.5 million decrease in commissions earned on assumed credit insurance products sold.
Commissions increased $7.8 million, or 37.1%, to $28.7 million for the three months ended June 30, 2011, from $20.1 million for the three months ended June 30, 2010. The increase in commission expense resulted from a $8.3 million increase in commissions expense associated with our 2011 acquisition of Auto Knight and the full impact of our 2010 acquisitions and a $0.8 million increase in net commissions due to growth in net written premium. This increase was offset in part by a $0.5 million decrease in commissions earned on assumed credit insurance products sold, lower retrospective commission expense of $0.4 million due to unfavorable underwriting results and lower deferred policy acquisition amortization cost of $0.3 million.
Commissions for the three months ended September 30, 2011 increased $9.0 million, or 36.0%, to $33.9 million for the three months ended September 30, 2011, from $25.0 million for the three months ended September 30, 2010. Motor Club commission expense increased $7.5 million during the third quarter 2011 compared to the same 2010 period. In addition, deferred policy acquisition cost amortization increased by $1.4 million.
RESTATEMENT OF INTERIM FINANCIAL STATEMENTS - SEGMENTS
RESULTS OF OPERATIONS - SEGMENTS - RESTATED QUARTERLY RESULTS
The following tables present our restated results of operations for our segments for the quarters ending March, 31, June 30, and September 30 for years 2012, 2011 and 2010, respectively, as discussed in the Note, "Restatement of the Consolidated Financial Statements," of the Notes to the Consolidated Financial Statements
| (in thousands, except percentages) | For the Three Months Ended | ||||||||||||||||||
| March 31, 2012 | March 31, 2011 | 2012 $ Change from 2011 | 2012 % Change from 2011 | March 31, 2010 | 2011 $ Change from 2010 | 2011 % Change from 2010 | |||||||||||||
| As Restated | As Restated | As Restated | |||||||||||||||||
| Payment Protection: | |||||||||||||||||||
| Service and administrative fees | $ | 17,803 | $ | 16,604 | $ | 1,199 | 7.2 | % | $ | 1,881 | $ | 14,723 | 782.7 | % | |||||
| Ceding commission | 7,064 | 8,158 | (1,094 | ) | (13.4 | ) | 6,624 | 1,534 | 23.2 | ||||||||||
| Net investment income | 743 | 941 | (198 | ) | (21.0 | ) | 948 | (7 | ) | (0.7 | ) | ||||||||
| Net realized investment (losses) gains | (3 | ) | 95 | (98 | ) | (103.2 | ) | 2 | 93 | 4,650.0 | |||||||||
58
| (in thousands, except percentages) | For the Three Months Ended | ||||||||||||||||||
| March 31, 2012 | March 31, 2011 | 2012 $ Change from 2011 | 2012 % Change from 2011 | March 31, 2010 | 2011 $ Change from 2010 | 2011 % Change from 2010 | |||||||||||||
| As Restated | As Restated | As Restated | |||||||||||||||||
| Other income | 72 | 82 | (10 | ) | (12.2 | ) | 81 | 1 | 1.2 | ||||||||||
| Net earned premium | 31,972 | 28,437 | 3,535 | 12.4 | 28,493 | (56 | ) | (0.2 | ) | ||||||||||
| Net losses and loss adjustment expenses | (11,266 | ) | (9,373 | ) | (1,893 | ) | 20.2 | (8,777 | ) | (596 | ) | 6.8 | |||||||
| Member benefit claims | (1,303 | ) | (867 | ) | (436 | ) | 50.3 | — | (867 | ) | — | ||||||||
| Commissions | (31,988 | ) | (29,906 | ) | (2,082 | ) | 7.0 | (19,349 | ) | (10,557 | ) | 54.6 | |||||||
| Payment Protection revenue, net | 13,094 | 14,171 | (1,077 | ) | (7.6 | ) | 9,903 | 4,268 | 43.1 | ||||||||||
| Operating expenses - Payment Protection | 7,913 | 8,768 | (855 | ) | (9.8 | ) | 5,750 | 3,018 | 52.5 | ||||||||||
| EBITDA | 5,181 | 5,403 | (222 | ) | (4.1 | ) | 4,153 | 1,250 | 30.1 | ||||||||||
| EBITDA margin | 39.6 | % | 38.1 | % | 41.9 | % | |||||||||||||
| Depreciation and amortization | 849 | 953 | (104 | ) | (10.9 | ) | 470 | 483 | 102.8 | ||||||||||
| Interest Expense | 1,012 | 1,526 | (514 | ) | (33.7 | ) | 1,661 | (135 | ) | (8.1 | ) | ||||||||
| Income before income taxes and non-controlling interests | 3,320 | 2,924 | 396 | 13.5 | 2,022 | 902 | 44.6 | ||||||||||||
| BPO: | |||||||||||||||||||
| BPO revenue | 4,205 | 3,564 | 641 | 18.0 | 4,563 | (999 | ) | (21.9 | ) | ||||||||||
| Operating expenses | 3,133 | 2,619 | 514 | 19.6 | 2,774 | (155 | ) | (5.6 | ) | ||||||||||
| EBITDA | 1,072 | 945 | 127 | 13.4 | 1,789 | (844 | ) | (47.2 | ) | ||||||||||
| EBITDA margin | 25.5 | % | 26.5 | % | 39.2 | % | |||||||||||||
| Depreciation and amortization | 503 | 240 | 263 | 109.6 | 174 | 66 | 37.9 | ||||||||||||
| Interest Expense | 267 | 63 | 204 | 323.8 | 106 | (43 | ) | (40.6 | ) | ||||||||||
| Income before income taxes and non-controlling interests | 302 | 642 | (340 | ) | (53.0 | ) | 1,509 | (867 | ) | (57.5 | ) | ||||||||
| Brokerage: | |||||||||||||||||||
| Brokerage revenue | 10,023 | 8,891 | 1,132 | 12.7 | 8,261 | 630 | 7.6 | ||||||||||||
| Operating expenses | 7,085 | 6,819 | 266 | 3.9 | 6,119 | 700 | 11.4 | ||||||||||||
| EBITDA | 2,938 | 2,072 | 866 | 41.8 | 2,142 | (70 | ) | (3.3 | ) | ||||||||||
| EBITDA margin | 29.3 | % | 23.3 | % | 25.9 | % | |||||||||||||
| Depreciation and amortization | 868 | 442 | 426 | 96.4 | 410 | 32 | 7.8 | ||||||||||||
| Interest expense | 373 | 442 | (69 | ) | (15.6 | ) | 124 | 318 | 256.5 | ||||||||||
| Income before income taxes and non-controlling interests | 1,697 | 1,188 | 509 | 42.8 | 1,608 | (420 | ) | (26.1 | ) | ||||||||||
| Corporate: | |||||||||||||||||||
| Corporate revenue | — | — | — | — | — | — | — | ||||||||||||
| Operating expenses | — | — | — | — | 230 | (230 | ) | (100.0 | ) | ||||||||||
| EBITDA | — | — | — | — | (230 | ) | 230 | (100.0 | ) | ||||||||||
| EBITDA margin | — | — | — | ||||||||||||||||
| Depreciation and amortization | — | — | — | — | — | — | — | ||||||||||||
| Interest Expense | — | — | — | — | — | — | — | ||||||||||||
| (Loss) before income taxes and non-controlling interests | — | — | — | — | (230 | ) | 230 | (100.0 | ) | ||||||||||
59
| (in thousands, except percentages) | For the Three Months Ended | ||||||||||||||||||
| March 31, 2012 | March 31, 2011 | 2012 $ Change from 2011 | 2012 % Change from 2011 | March 31, 2010 | 2011 $ Change from 2010 | 2011 % Change from 2010 | |||||||||||||
| As Restated | As Restated | As Restated | |||||||||||||||||
| Segment net revenue | 27,322 | 26,626 | 696 | 2.6 | 22,727 | 3,899 | 17.2 | ||||||||||||
| Net losses and loss adjustment expenses | 11,266 | 9,373 | 1,893 | 20.2 | 8,777 | 596 | 6.8 | ||||||||||||
| Member benefit claims | 1,303 | 867 | 436 | 50.3 | — | 867 | — | ||||||||||||
| Commissions | 31,988 | 29,906 | 2,082 | 7.0 | 19,349 | 10,557 | 54.6 | ||||||||||||
| Total revenue | 71,879 | 66,772 | 5,107 | 7.6 | 50,853 | 15,919 | 31.3 | ||||||||||||
| Segment operating expenses | 18,131 | 18,206 | (75 | ) | (0.4 | ) | 14,873 | 3,333 | 22.4 | ||||||||||
| Net losses and loss adjustment expenses | 11,266 | 9,373 | 1,893 | 20.2 | 8,777 | 596 | 6.8 | ||||||||||||
| Member benefit claims | 1,303 | 867 | 436 | 50.3 | — | 867 | — | ||||||||||||
| Commissions | 31,988 | 29,906 | 2,082 | 7.0 | 19,349 | 10,557 | 54.6 | ||||||||||||
| Total expenses before depreciation, amortization and interest expense | 62,688 | 58,352 | 4,336 | 7.4 | 42,999 | 15,353 | 35.7 | ||||||||||||
| Total EBITDA | 9,191 | 8,420 | 771 | 9.2 | 7,854 | 566 | 7.2 | ||||||||||||
| Depreciation and amortization | 2,220 | 1,635 | 585 | 35.8 | 1,054 | 581 | 55.1 | ||||||||||||
| Interest Expense | 1,652 | 2,031 | (379 | ) | (18.7 | ) | 1,891 | 140 | 7.4 | ||||||||||
| Total income before income taxes and non-controlling interests | 5,319 | 4,754 | 565 | 11.9 | 4,909 | (155 | ) | (3.2 | ) | ||||||||||
| Income taxes | 1,887 | 1,609 | 278 | 17.3 | 1,846 | (237 | ) | (12.8 | ) | ||||||||||
| Less: net income (loss) attributable to non-controlling interests | 18 | (174 | ) | 192 | (110.3 | ) | 15 | (189 | ) | (1,260.0 | ) | ||||||||
| Net income | $ | 3,414 | $ | 3,319 | $ | 95 | 2.9 | $ | 3,048 | $ | 271 | 8.9 | |||||||
| (in thousands, except percentages) | For the Three Months Ended | ||||||||||||||||||
| June 30, 2012 | June 30, 2011 | 2012 $ Change from 2011 | 2012 % Change from 2011 | June 30, 2010 | 2011 $ Change from 2010 | 2011 % Change from 2010 | |||||||||||||
| As Restated | As Restated | As Restated | |||||||||||||||||
| Payment Protection: | |||||||||||||||||||
| Service and administrative fees | $ | 16,959 | $ | 16,802 | $ | 157 | 0.9 | % | $ | 6,322 | $ | 10,480 | 165.8 | % | |||||
| Ceding commission | 7,210 | 6,243 | 967 | 15.5 | 6,389 | (146 | ) | (2.3 | ) | ||||||||||
| Net investment income | 732 | 894 | (162 | ) | (18.1 | ) | 986 | (92 | ) | (9.3 | ) | ||||||||
| Net realized investment gains | 13 | 1,132 | (1,119 | ) | (98.9 | ) | 47 | 1,085 | 2,308.5 | ||||||||||
| Other income | 48 | 38 | 10 | 26.3 | 45 | (7 | ) | (15.6 | ) | ||||||||||
| Net earned premium | 31,905 | 27,536 | 4,369 | 15.9 | 26,669 | 867 | 3.3 | ||||||||||||
| Net losses and loss adjustment expenses | (9,576 | ) | (9,251 | ) | (325 | ) | 3.5 | (7,316 | ) | (1,935 | ) | 26.4 | |||||||
| Member benefit claims | (1,098 | ) | (1,309 | ) | 211 | (16.1 | ) | 23 | (1,332 | ) | (5,791.3 | ) | |||||||
| Commissions | (31,282 | ) | (28,727 | ) | (2,555 | ) | 8.9 | (20,955 | ) | (7,772 | ) | 37.1 | |||||||
| Payment Protection revenue, net | 14,911 | 13,358 | 1,553 | 11.6 | 12,210 | 1,148 | 9.4 | ||||||||||||
| Operating expenses - Payment Protection | 8,729 | 8,644 | 85 | 1.0 | 6,358 | 2,286 | 36.0 | ||||||||||||
60
| (in thousands, except percentages) | For the Three Months Ended | ||||||||||||||||||
| June 30, 2012 | June 30, 2011 | 2012 $ Change from 2011 | 2012 % Change from 2011 | June 30, 2010 | 2011 $ Change from 2010 | 2011 % Change from 2010 | |||||||||||||
| As Restated | As Restated | As Restated | |||||||||||||||||
| EBITDA | 6,182 | 4,714 | 1,468 | 31.1 | 5,852 | (1,138 | ) | (19.4 | ) | ||||||||||
| EBITDA margin | 41.5 | % | 35.3 | % | 47.9 | % | |||||||||||||
| Depreciation and amortization | 865 | 1,324 | (459 | ) | (34.7 | ) | 585 | 739 | 126.3 | ||||||||||
| Interest Expense | 971 | 1,043 | (72 | ) | (6.9 | ) | 1,704 | (661 | ) | (38.8 | ) | ||||||||
| Income before income taxes and non-controlling interests | 4,346 | 2,347 | 1,999 | 85.2 | 3,563 | (1,216 | ) | (34.1 | ) | ||||||||||
| BPO: | |||||||||||||||||||
| BPO revenue | 4,409 | 3,691 | 718 | 19.5 | 4,327 | (636 | ) | (14.7 | ) | ||||||||||
| Operating expenses | 3,351 | 2,828 | 523 | 18.5 | 2,635 | 193 | 7.3 | ||||||||||||
| EBITDA | 1,058 | 863 | 195 | 22.6 | 1,692 | (829 | ) | (49.0 | ) | ||||||||||
| EBITDA margin | 24.0 | % | 23.4 | % | 39.1 | % | |||||||||||||
| Depreciation and amortization | 498 | 277 | 221 | 79.8 | 80 | 197 | 246.3 | ||||||||||||
| Interest Expense | 259 | 99 | 160 | 161.6 | 92 | 7 | 7.6 | ||||||||||||
| Income before income taxes and non-controlling interests | 301 | 487 | (186 | ) | (38.2 | ) | 1,520 | (1,033 | ) | (68.0 | ) | ||||||||
| Brokerage: | |||||||||||||||||||
| Brokerage revenue | 9,782 | 9,836 | (54 | ) | (0.5 | ) | 7,680 | 2,156 | 28.1 | ||||||||||
| Operating expenses | 7,224 | 7,527 | (303 | ) | (4.0 | ) | 5,785 | 1,742 | 30.1 | ||||||||||
| EBITDA | 2,558 | 2,309 | 249 | 10.8 | 1,895 | 414 | 21.8 | ||||||||||||
| EBITDA margin | 26.2 | % | 23.5 | % | 24.7 | % | |||||||||||||
| Depreciation and amortization | 778 | 591 | 187 | 31.6 | 398 | 193 | 48.5 | ||||||||||||
| Interest expense | 360 | 783 | (423 | ) | (54.0 | ) | 189 | 594 | 314.3 | ||||||||||
| Income before income taxes and non-controlling interests | 1,420 | 935 | 485 | 51.9 | 1,308 | (373 | ) | (28.5 | ) | ||||||||||
| Corporate: | |||||||||||||||||||
| Corporate revenue | — | — | — | — | — | — | — | ||||||||||||
| Operating expenses | — | 1,727 | (1,727 | ) | (100.0 | ) | 612 | 1,115 | 182.2 | ||||||||||
| EBITDA | — | (1,727 | ) | 1,727 | (100.0 | ) | (612 | ) | (1,115 | ) | 182.2 | ||||||||
| EBITDA margin | — | — | — | ||||||||||||||||
| Depreciation and amortization | — | — | — | — | — | — | — | ||||||||||||
| Interest Expense | — | — | — | — | — | — | — | ||||||||||||
| (Loss) before income taxes and non-controlling interests | — | (1,727 | ) | 1,727 | (100.0 | ) | (612 | ) | (1,115 | ) | 182.2 | ||||||||
| Segment net revenue | 29,102 | 26,885 | 2,217 | 8.2 | 24,217 | 2,668 | 11.0 | ||||||||||||
| Net losses and loss adjustment expenses | 9,576 | 9,251 | 325 | 3.5 | 7,316 | 1,935 | 26.4 | ||||||||||||
| Member benefit claims | 1,098 | 1,309 | (211 | ) | (16.1 | ) | (23 | ) | 1,332 | (5,791.3 | ) | ||||||||
| Commissions | 31,282 | 28,727 | 2,555 | 8.9 | 20,955 | 7,772 | 37.1 | ||||||||||||
| Total revenue | 71,058 | 66,172 | 4,886 | 7.4 | 52,465 | 13,707 | 26.1 | ||||||||||||
| Segment operating expenses | 19,304 | 20,726 | (1,422 | ) | (6.9 | ) | 15,390 | 5,336 | 34.7 | ||||||||||
61
| (in thousands, except percentages) | For the Three Months Ended | ||||||||||||||||||
| June 30, 2012 | June 30, 2011 | 2012 $ Change from 2011 | 2012 % Change from 2011 | June 30, 2010 | 2011 $ Change from 2010 | 2011 % Change from 2010 | |||||||||||||
| As Restated | As Restated | As Restated | |||||||||||||||||
| Net losses and loss adjustment expenses | 9,576 | 9,251 | 325 | 3.5 | 7,316 | 1,935 | 26.4 | ||||||||||||
| Member benefit claims | 1,098 | 1,309 | (211 | ) | (16.1 | ) | (23 | ) | 1,332 | (5,791.3 | ) | ||||||||
| Commissions | 31,282 | 28,727 | 2,555 | 8.9 | 20,955 | 7,772 | 37.1 | ||||||||||||
| Total expenses before depreciation, amortization and interest expense | 61,260 | 60,013 | 1,247 | 2.1 | 43,638 | 16,375 | 37.5 | ||||||||||||
| Total EBITDA | 9,798 | 6,159 | 3,639 | 59.1 | 8,827 | (2,668 | ) | (30.2 | ) | ||||||||||
| Depreciation and amortization | 2,141 | 2,192 | (51 | ) | (2.3 | ) | 1,063 | 1,129 | 106.2 | ||||||||||
| Interest Expense | 1,590 | 1,925 | (335 | ) | (17.4 | ) | 1,985 | (60 | ) | (3.0 | ) | ||||||||
| Total income before income taxes and non-controlling interests | 6,067 | 2,042 | 4,025 | 197.1 | 5,779 | (3,737 | ) | (64.7 | ) | ||||||||||
| Income taxes | 2,108 | 750 | 1,358 | 181.1 | 2,162 | (1,412 | ) | (65.3 | ) | ||||||||||
| Less: net income (loss) attributable to non-controlling interests | 15 | 2 | 13 | 650.0 | (46 | ) | 48 | (104.3 | ) | ||||||||||
| Net income | $ | 3,944 | $ | 1,290 | $ | 2,654 | 205.7 | $ | 3,663 | $ | (2,373 | ) | (64.8 | ) | |||||
| (in thousands, except percentages) | For the Three Months Ended | ||||||||||||||||||
| September 30, 2012 | September 30, 2011 | 2012 $ Change from 2011 | 2012 % Change from 2011 | September 30, 2010 | 2011 $ Change from 2010 | 2011 % Change from 2010 | |||||||||||||
| As Restated | As Restated | As Restated | |||||||||||||||||
| Payment Protection: | |||||||||||||||||||
| Service and administrative fees | $ | 17,519 | $ | 22,526 | $ | (5,007 | ) | (22.2 | )% | $ | 12,128 | $ | 10,398 | 85.7 | % | ||||
| Ceding commission | 11,122 | 7,027 | 4,095 | 58.3 | 9,455 | (2,428 | ) | (25.7 | ) | ||||||||||
| Net investment income | 744 | 801 | (57 | ) | (7.1 | ) | 865 | (64 | ) | (7.4 | ) | ||||||||
| Net realized investment (losses) gains | (16 | ) | 1,196 | (1,212 | ) | (101.3 | ) | 107 | 1,089 | 1,017.8 | |||||||||
| Other income | 52 | 18 | 34 | 188.9 | (6 | ) | 24 | (400.0 | ) | ||||||||||
| Net earned premium | 33,893 | 28,673 | 5,220 | 18.2 | 28,255 | 418 | 1.5 | ||||||||||||
| Net losses and loss adjustment expenses | (11,430 | ) | (9,714 | ) | (1,716 | ) | 17.7 | (10,993 | ) | 1,279 | (11.6 | ) | |||||||
| Member benefit claims | (1,157 | ) | (945 | ) | (212 | ) | 22.4 | (211 | ) | (734 | ) | 347.9 | |||||||
| Commissions | (33,377 | ) | (33,937 | ) | 560 | (1.7 | ) | (24,959 | ) | (8,978 | ) | 36.0 | |||||||
| Payment Protection revenue, net | 17,350 | 15,645 | 1,705 | 10.9 | 14,641 | 1,004 | 6.9 | ||||||||||||
| Operating expenses - Payment Protection | 9,563 | 8,445 | 1,118 | 13.2 | 6,560 | 1,885 | 28.7 | ||||||||||||
| EBITDA | 7,787 | 7,200 | 587 | 8.2 | 8,081 | (881 | ) | (10.9 | ) | ||||||||||
| EBITDA margin | 44.9 | % | 46.0 | % | 55.2 | % | |||||||||||||
| Depreciation and amortization | 863 | 927 | (64 | ) | (6.9 | ) | 327 | 600 | 183.5 | ||||||||||
| Interest Expense | 1,359 | 1,053 | 306 | 29.1 | 1,873 | (820 | ) | (43.8 | ) | ||||||||||
| Income before income taxes and non-controlling interests | 5,565 | 5,220 | 345 | 6.6 | 5,881 | (661 | ) | (11.2 | ) | ||||||||||
62
| (in thousands, except percentages) | For the Three Months Ended | ||||||||||||||||||
| September 30, 2012 | September 30, 2011 | 2012 $ Change from 2011 | 2012 % Change from 2011 | September 30, 2010 | 2011 $ Change from 2010 | 2011 % Change from 2010 | |||||||||||||
| As Restated | As Restated | As Restated | |||||||||||||||||
| BPO: | |||||||||||||||||||
| BPO revenue | 4,951 | 3,833 | 1,118 | 29.2 | 4,715 | (882 | ) | (18.7 | ) | ||||||||||
| Operating expenses | 3,836 | 2,717 | 1,119 | 41.2 | 2,588 | 129 | 5.0 | ||||||||||||
| EBITDA | 1,115 | 1,116 | (1 | ) | (0.1 | ) | 2,127 | (1,011 | ) | (47.5 | ) | ||||||||
| EBITDA margin | 22.5 | % | 29.1 | % | 45.1 | % | |||||||||||||
| Depreciation and amortization | 494 | 307 | 187 | 60.9 | 457 | (150 | ) | (32.8 | ) | ||||||||||
| Interest Expense | 294 | 96 | 198 | 206.3 | 126 | (30 | ) | (23.8 | ) | ||||||||||
| Income before income taxes and non-controlling interests | 327 | 713 | (386 | ) | (54.1 | ) | 1,544 | (831 | ) | (53.8 | ) | ||||||||
| Brokerage: | |||||||||||||||||||
| Brokerage revenue | 8,839 | 9,208 | (369 | ) | (4.0 | ) | 7,158 | 2,050 | 28.6 | ||||||||||
| Operating expenses | 7,268 | 7,491 | (223 | ) | (3.0 | ) | 5,783 | 1,708 | 29.5 | ||||||||||
| EBITDA | 1,571 | 1,717 | (146 | ) | (8.5 | ) | 1,375 | 342 | 24.9 | ||||||||||
| EBITDA margin | 17.8 | % | 18.6 | % | 19.2 | % | |||||||||||||
| Depreciation and amortization | 641 | 650 | (9 | ) | (1.4 | ) | 435 | 215 | 49.4 | ||||||||||
| Interest expense | 372 | 757 | (385 | ) | (50.9 | ) | 247 | 510 | 206.5 | ||||||||||
| Income before income taxes and non-controlling interests | 558 | 310 | 248 | 80.0 | 693 | (383 | ) | (55.3 | ) | ||||||||||
| Corporate: | |||||||||||||||||||
| Corporate revenue | — | — | — | — | — | — | — | ||||||||||||
| Operating expenses | — | 36 | (36 | ) | (100.0 | ) | 1,220 | (1,184 | ) | (97.0 | ) | ||||||||
| EBITDA | — | (36 | ) | 36 | (100.0 | ) | (1,220 | ) | 1,184 | (97.0 | ) | ||||||||
| EBITDA margin | — | — | — | ||||||||||||||||
| Depreciation and amortization | — | — | — | — | — | — | — | ||||||||||||
| Interest Expense | — | — | — | — | — | — | — | ||||||||||||
| (Loss) before income taxes and non-controlling interests | — | (36 | ) | 36 | (100.0 | ) | (1,220 | ) | 1,184 | (97.0 | ) | ||||||||
| Segment net revenue | 31,140 | 28,686 | 2,454 | 8.6 | 26,514 | 2,172 | 8.2 | ||||||||||||
| Net losses and loss adjustment expenses | 11,430 | 9,714 | 1,716 | 17.7 | 10,993 | (1,279 | ) | (11.6 | ) | ||||||||||
| Member benefit claims | 1,157 | 945 | 212 | 22.4 | 211 | 734 | 347.9 | ||||||||||||
| Commissions | 33,377 | 33,937 | (560 | ) | (1.7 | ) | 24,959 | 8,978 | 36.0 | ||||||||||
| Total revenue | 77,104 | 73,282 | 3,822 | 5.2 | 62,677 | 10,605 | 16.9 | ||||||||||||
| Segment operating expenses | 20,667 | 18,689 | 1,978 | 10.6 | 16,151 | 2,538 | 15.7 | ||||||||||||
| Net losses and loss adjustment expenses | 11,430 | 9,714 | 1,716 | 17.7 | 10,993 | (1,279 | ) | (11.6 | ) | ||||||||||
| Member benefit claims | 1,157 | 945 | 212 | 22.4 | 211 | 734 | 347.9 | ||||||||||||
| Commissions | 33,377 | 33,937 | (560 | ) | (1.7 | ) | 24,959 | 8,978 | 36.0 | ||||||||||
| Total expenses before depreciation, amortization and interest expense | 66,631 | 63,285 | 3,346 | 5.3 | 52,314 | 10,971 | 21.0 | ||||||||||||
| Total EBITDA | 10,473 | 9,997 | 476 | 4.8 | 10,363 | (366 | ) | (3.5 | ) | ||||||||||
63
| (in thousands, except percentages) | For the Three Months Ended | ||||||||||||||||||
| September 30, 2012 | September 30, 2011 | 2012 $ Change from 2011 | 2012 % Change from 2011 | September 30, 2010 | 2011 $ Change from 2010 | 2011 % Change from 2010 | |||||||||||||
| As Restated | As Restated | As Restated | |||||||||||||||||
| Depreciation and amortization | 1,998 | 1,884 | 114 | 6.1 | 1,219 | 665 | 54.6 | ||||||||||||
| Interest Expense | 2,025 | 1,906 | 119 | 6.2 | 2,246 | (340 | ) | (15.1 | ) | ||||||||||
| Total income before income taxes and non-controlling interests | 6,450 | 6,207 | 243 | 3.9 | 6,898 | (691 | ) | (10.0 | ) | ||||||||||
| Income taxes | 2,397 | 2,209 | 188 | 8.5 | 2,532 | (323 | ) | (12.8 | ) | ||||||||||
| Less: net income attributable to non-controlling interests | 29 | 1 | 28 | 2,800.0 | — | 1 | — | ||||||||||||
| Net income | $ | 4,024 | $ | 3,997 | $ | 27 | 0.7 | $ | 4,366 | $ | (369 | ) | (8.5 | ) | |||||
The following MD&A presents the discussion of the Consolidated Income Statement line items for our Payment Protection Segment impacted by the restatements described in the Note, "Restatement of the Consolidated Financial Statements," of Notes to the Consolidated Financial Statements.
Payment Protection Segment
2012 compared to 2011
Net revenues for the three months ended March 31, 2012 decreased $1.1 million, or 7.6%, to $13.1 million from $14.2 million for the three months ended March 31, 2011. Ceding commission decreased $1.1 million resulting from lower underwriting profits of $1.4 million due to unfavorable loss experience for 2012 and was partially offset by additional service and administrative fees of $0.3 million from increased insurance production in 2012. Net investment income on our portfolio decreased by $0.2 million due to lower investment yields. Net realized gains on the sale of investments decreased by $0.1 million due to the sale of assets in the first quarter of 2011 not repeated in the first quarter of 2012. These decreases were offset by additional service and administrative fee income, which was $0.1 million above prior year period and resulted from increased debt cancellation and service fees primarily in the Vacation Ownership channel. In addition, underwriting revenue was $0.1 million above the 2011 period and resulted from increased earned premiums offset by growth in commissions due to an increase in direct and assumed written premium and an increase in loss ratio in our risk retained business.
Operating expenses for the three months ended March 31, 2012 decreased $0.9 million, or 9.8%, to $7.9 million from $8.8 million for the three months ended March 31, 2011. This decrease resulted primarily from $0.2 million in reduced personnel costs in our core business.
EBITDA for the three months ended March 31, 2012 decreased $0.2 million, or 4.1%, to $5.2 million from $5.4 million for the three months ended March 31, 2011. As a result, EBITDA margin three months ended March 31, 2012 was 39.6% compared with 38.1 % for the three months ended March 31, 2011.
Net revenues for the three months ended June 30, 2012 increased $1.6 million, or 11.6%, to $14.9 million from $13.3 million for the three months ended June 30, 2011. Ceding commission increased $1.0 million resulting from higher underwriting profits of $1.0 million due to more favorable loss experience for 2012 under certain contracts, additional service and administrative fees of $0.1 million from increased insurance production in 2012, offset by net investment income, including realized gains, from assets held in trust by our reinsurers which decreased by $0.1 million during the period. In addition, underwriting revenue was $1.5 million above the 2011 period and resulted from increased earned premiums offset by growth in commissions due to an increase in direct and assumed earned premium and a decrease in loss ratio in our risk retained business. Net investment income on our portfolio decreased by $0.2 million due to lower investment yields. Net realized gains on the sale of investments decreased by $1.1 million due to the sale of assets in the first quarter of 2011 not repeated in the first quarter of 2012.
Operating expenses for the three months ended June 30, 2012 increased $0.1 million, or 1.0%, to $8.7 million from $8.6 million for the three months ended June 30, 2011. This increase resulted primarily from growth in variable expenses to expand the business.
EBITDA for the three months ended June 30, 2012 increased $1.5 million, or 31.1%, to $6.2 million from $4.7 million for the three months ended June 30, 2011. As a result, EBITDA margin three months ended June 30, 2012 was 41.5% compared with 35.3% for the three months ended June 30, 2011.
Net revenues for the three months ended September 30, 2012 increased $1.7 million, or 10.9%, to $17.3 million from $15.3 million for the three months ended September 30, 2011. The change in accounting estimate increased net revenues by $1.2 million for the
64
2012 period. Ceding commission increased $2.0 million, after deducting the impact from the change in accounting estimate, primarily from improved underwriting results due to growth in earned premiums and favorable loss experience along with additional administrative fees earned from increased insurance production in 2012. In addition, after deducting the impact from the change in accounting estimate, underwriting revenue was $0.8 million above the 2011 period and resulted from increased earned premiums offset by growth in commissions due to an increase in direct and assumed earned premium and a decrease in loss ratio in our risk retained business.
Net investment income on our portfolio decreased by $0.1 million due to lower investment yields. Net realized (losses) gains on the sale of investments decreased by $1.2 million due to the sale of investment securities in the third quarter of 2011 not repeated in the third quarter of 2012. Motor club revenue net of commission decreased overall net revenue by $1.0 million.
Operating expenses for the three months ended September 30, 2012 increased $1.1 million, or 13.2%, to $9.6 million from $8.5 million for the three months ended September 30, 2011. This increase resulted primarily from growth in variable expenses to expand the business.
EBITDA for the three months ended September 30, 2012 increased $0.6 million, or 8.2%, to $7.8 million from $7.2 million for the three months ended September 30, 2011. As a result, EBITDA margin three months ended September 30, 2012 was 44.9% compared with 46.0% for the three months ended September 30, 2011.
2011 compared to 2010
Net revenues for the three months ended March 31, 2011 increased $4.3 million, or 43.1%, to $14.2 million from 9.9 million for the three months ended March 31, 2010. The 2011 results include a full quarter of revenues from the acquisitions of Auto Knight, Continental Car Club and United Motor Club, which added $2.2 million of revenue. Ceding commission revenue increased by $1.5 million due to favorable underwriting results and a realized gain on the sale of assets contributed $0.1 million.
Operating expenses for the three months ended March 31, 2011 increased $3.0 million, or 52.5%, to $8.8 million from $5.8 million for the three months ended March 31, 2010. This increase resulted primarily from $1.5 million in expenses associated with being a public company and additional stock-based compensation expense. Also contributing to this increase was $1.0 million of expense from the acquisitions of Auto Knight, Continental Car Club and United Motor Club. In addition, we recorded $0.7 million of expense due to the amortization of previously deferred acquisition costs from additional marketing and administrative costs.
EBITDA for the three months ended March 31, 2011 increased $1.3 million, or 30.1%, to $5.4 million from $4.2 million for the three months ended March 31, 2010. As a result, EBITDA margin three months ended March 31, 2011 was 38.1% compared with 41.9% for the three months ended March 31, 2010.
Net revenues for the three months ended June 30, 2011 increased $1.1 million, or 9.4%, to $13.4 million from $12.2 million for the three months ended June 30, 2010. The 2011 results include a full quarter of revenues from the acquisitions of Auto Knight, Continental Car Club and United Motor Club, which added $0.9 million of revenue. Realized gains on the sale if investments increased by $1.1 million. These increases were partially offset by a decrease in ceding commission revenue of $0.1 million and net underwriting revenue (net earned premium less net losses and loss adjustment expenses less commissions) of $0.5 million due to unfavorable underwriting results.
Operating expenses for the three months ended June 30, 2011 increased $2.3 million, or 36.0%, to $8.6 million from $6.3 million for the three months ended June 30, 2010. This increase resulted primarily from the acquisitions of Auto Knight, Continental Car Club and United Motor Club which increased personnel costs by $0.6 million and other operating expense by $0.3 million. In addition, the increase resulted from additional costs associated with being a public company.
EBITDA for the three months ended June 30, 2011 decreased $1.1 million, or 19.4%, to $4.7 million from $5.8 million for the three months ended June 30, 2011. As a result, EBITDA margin of the three months ended June 30, 2012 was 35.3% compared with 47.9% for the three months ended June 30, 2010.
Net revenues for the three months ended September 30, 2012 increased $1.0 million, or 6.8%, to $15.6 million from $14.6 million for the three months ended September 30, 2011. The 2011 and 2010 acquisitions contributed $1.7 million of revenue (service fee revenue less applicable commissions) and our core business added services fees of $0.4 million. Net realized gains on the sale of investments increased by $1.1 million. Net underwriting revenue (net earned premium less net losses and loss adjustment expenses less commissions) increased $0.2 million due to favorable underwriting results. These increases were partially offset by a decrease in ceding commission revenue of $2.4 million due to the third quarter 2010 realized gain of $2.0 million on the sale of assets held in trust for our benefit that was not repeated in the third quarter of 2011.
Operating expenses for the three months ended September 30, 2012 increased $1.1 million, or 13.2%, to $9.6 million from $8.4 million for the three months ended September 30, 2011. This increase resulted primarily from additional costs associated with being a public
65
company and operating expenses associated with the 2011 and 2010 acquisitions which contributed $0.4 million of personnel costs and $0.1 million of other operating expense.
EBITDA for the three months ended September 30, 2012 decreased $0.9 million, or 10.9%, to $7.2 million from $8.1 million for the three months ended September 30, 2011. As a result, EBITDA margin for the three months ended September 30, 2012 was 46.0% compared with 55.2% for the three months ended September 30, 2011.
LIQUIDITY AND CAPITAL RESOURCES
Liquidity
Liquidity describes the ability of a company to generate sufficient cash flows to meet the cash requirements of its business operations, including working capital needs, capital expenditures, debt service, acquisitions and other commitments and contractual obligations. We historically have derived our liquidity from our invested assets, cash flow from operations, ordinary and extraordinary dividend capacity from our subsidiary insurance companies, our credit facility and investments. When considering our liquidity, it is important to note that we hold cash in a fiduciary capacity as a result of premiums received from insured parties that have not yet been paid to insurance carriers. The fiduciary cash is recorded as an asset on our Consolidated Balance Sheets with a corresponding liability, net of our commissions, to insurance carriers.
Our primary cash requirements include the payment of our operating expenses, interest and principal payments on our debt, capital expenditures and acquisitions. We may also incur unexpected costs and operating expenses related to any unforeseen disruptions to our facilities and equipment, the loss of key personnel or changes in the credit markets and interest rates, which could increase our immediate cash requirements or otherwise impact our liquidity.
Our primary sources of liquidity are our total investments, cash and cash equivalent balances, availability under our revolving credit facility and dividends and other distributions from our subsidiaries. At December 31, 2012, we had total available-for-sale and short-term investments of $118.1 million, which includes restricted investments of $17.9 million, cash and cash equivalents of $15.2 million and $35.6 million of available capacity on our credit facility. At December 31, 2011, we had total investments of $95.8 million, which included restricted investments of $18.3 million, cash and cash equivalents of $31.3 million and $12.0 million of available capacity on our revolving credit facility. Our total indebtedness was $124.4 million at December 31, 2012 compared to $108.0 million at December 31, 2011.
On August 2, 2012, we terminated our existing $85.0 million revolving credit facility with SunTrust Bank, N.A and entered into a new credit facility with Wells Fargo Bank, N.A., which is described in the sections below, "$125.0 Million Credit Facility" and "$85.0 Million Revolving Credit Facility."
We believe that our cash flow from operations and our availability under our revolving credit facility, combined with our low capital expenditure requirements will provide us with sufficient capital to continue to grow our business over the next several years. We intend to use a portion of our available cash flow to pay interest on our outstanding debt, thus limiting the amount available for working capital, capital expenditures and other general corporate purposes. As we continue to expand our business and make acquisitions, we may in the future require additional working capital to meet our future business needs. This additional working capital may be in the form of additional debt or equity. Although we believe we have sufficient liquidity under our revolving credit facility, as discussed above, under adverse market conditions or in the event of a default under our revolving credit facility, there can be no assurance that such funds would be available or sufficient, and, in such a case, we may not be able to successfully obtain additional financing on favorable terms, or at all, or replace our existing credit facility upon maturity in August 2017.
Share Repurchase Plan
During the fourth quarter of 2011, our Board of Directors approved a share repurchase plan. The share repurchase plan allows us to purchase up to $10.0 million of our common stock to be purchased from time to time through open market or private transactions. The plan provides for shares to be repurchased for general corporate purposes, which may include serving as a subsequent resource for funding potential acquisitions and employee benefit plans. The timing, price and quantity of purchases are at our discretion, and the plan may be discontinued or suspended at any time. For the year ended December 31, 2012, we repurchased a total of 508,080 common shares with an average price of $7.72 per share and a total cost of $3.9 million compared to 471,554 common shares at an average price of $5.41 per share at a total cost of $2.6 million for same period in 2011. All repurchased common shares are held in treasury and none of the repurchased common shares have been retired. See Part II, Item 5 and the Note, "Share Repurchase Plan," of the Notes to Consolidated Financial Statements for more information on the share repurchase plan.
Regulatory Requirements
We are a holding company and have limited direct operations. Our holding company assets consist primarily of the capital stock of our subsidiaries. Accordingly, our future cash flows depend upon the availability of dividends and other payments from our subsidiaries, including statutorily permissible payments from our insurance company subsidiaries, as well as payments under our tax allocation agreement and management agreements with our subsidiaries. The ability of our insurance company subsidiaries to pay such dividends
66
and to make such other payments are limited by applicable laws and regulations of the states in which our subsidiaries are domiciled, which vary from state to state and by type of insurance provided by the applicable subsidiary. These laws and regulations require, among other things, our insurance subsidiaries to maintain minimum solvency requirements and limit the amount of dividends these subsidiaries can pay to the holding company. Along with solvency regulations, the primary factor in determining the amount of capital available for potential dividends is the level of capital needed to maintain desired financial strength ratings from A.M. Best for our insurance company subsidiaries. Given recent economic events that have affected the insurance industry, both regulators and rating agencies could become more conservative in their methodology and criteria, including increasing capital requirements for our insurance subsidiaries which, in turn, could negatively affect our capital resources. The following table sets forth the dividends paid to us by our insurance company subsidiaries during the following periods:
| For the Years Ended December 31, | |||||||||||
| (in thousands) | 2012 | 2011 | 2010 | ||||||||
| Ordinary dividends | $ | 2,783 | $ | 6,956 | $ | 7,572 | |||||
| Extraordinary dividends | — | 830 | 2,474 | ||||||||
| Total dividends | $ | 2,783 | $ | 7,786 | $ | 10,046 | |||||
$125.0 Million Credit Facility
On August 2, 2012, we entered into a five-year $125.0 million secured credit agreement (the "Credit Agreement") with a syndicate of lenders, including Wells Fargo Bank, N.A., who also serves as administrative agent ("Wells Fargo" or the "Administrative Agent"). The Credit Agreement provides for a $50.0 million term loan facility (the "Term Loan Facility"), as well as a $75.0 million revolving credit facility (the "Revolving Facility" and collectively with the Term Loan Facility, the "Facilities") with a sub-limit of $10.0 million for swingline loans and $10.0 million for letters of credit. Subject to earlier termination, the Credit Agreement terminates on August 2, 2017. The Credit Agreement includes a provision pursuant to which, from time to time, we may request that the lenders in their discretion increase the maximum amount of commitments under the Facilities by an amount not to exceed $50.0 million.
At our election, borrowings under the Revolving Facility will bear interest either at the base rate plus an applicable interest margin or the adjusted LIBO rate plus an applicable interest margin; provided, however, that all swingline loans will be base rate loans. The base rate is a fluctuating interest rate equal to the highest of: (i) Wells Fargo's publicly announced prime lending rate; (ii) the federal funds rate plus 0.50%; and (iii) the adjusted LIBO rate, determined on a daily basis for an interest period of one month, plus 1.0%. The adjusted LIBO rate is the rate per annum obtained by dividing (i) the London interbank offered rate ("LIBOR") for such interest period by (ii) a percentage equal to 1.00 minus the Eurodollar Reserve Percentage (as defined in the Credit Agreement). The interest margin over the adjusted LIBO rate, initially set at 2.75%, may increase (to a maximum amount of 3.0%) or decrease (to a minimum amount of 2.0%) based on changes in our leverage ratio. The interest margin over the base rate, initially set at 1.75%, may increase (to a maximum amount of 2.0%) or decrease (to a minimum amount of 1.0%) based on changes in our leverage ratio.
In addition to interest payable on the principal amount of indebtedness outstanding from time to time under the Credit Agreement, we are required to pay a commitment fee, initially equal to 0.40% per annum of the unused amount of the Revolving Facility. The percentage rate of such fee may increase (to a maximum amount of .45%) or decrease (to a minimum amount of .25%) based on changes in the Borrowers' leverage ratio. The amount of outstanding swingline loans is not considered usage of the Revolving Facility for the purpose of calculating the commitment fee. We are also required to pay letter of credit participation fees on the undrawn amount of all outstanding letters of credit. We paid one-time upfront fees of approximately $1.3 million to Wells Fargo in connection with the execution of the Credit Agreement.
We may, at our option, prepay any borrowing, in whole or in part, at any time and from time to time without premium or penalty. However, after the end of our fiscal year (commencing with the fiscal year ending December 31, 2015), we are required to make mandatory principal prepayments of loans under the Facilities in an amount determined under the Credit Agreement based upon a percentage (from a maximum of 50% to a minimum of 0% based on the Borrowers' leverage ratio) of our Excess Cash Flow (as defined in the Credit Agreement) minus certain off set amounts relating to permitted acquisitions of ours.
The Credit Agreement contains certain customary representations, warranties and covenants applicable to us for the benefit of the Administrative Agent and the lenders. We may not assign, sell, transfer or dispose of any collateral or effect certain changes to our capital structure and the capital structure of our subsidiaries without the Administrative Agent's prior consent. Our obligations under the Facilities may be accelerated or the commitments terminated upon the occurrence of an event of default under the Credit Agreement, including payment defaults, defaults in the performance of affirmative and negative covenants, the inaccuracy of representations or warranties, bankruptcy and insolvency related defaults, cross defaults to other material indebtedness, defaults arising in connection with changes in control and other customary events of default. The Credit Agreement also contains the following financial covenants, which require us to maintain, as of the end of each fiscal quarter:
| • | a maximum Total Leverage Ratio (as defined in the Credit Agreement) of 3.50:1.00, with step-downs to 3.25:1.00 on December 31, 2013 and 3.00:1.00 on December 31, 2014; |
67
| • | a minimum Fixed Charge Coverage Ratio (as defined in the Credit Agreement) of 2.00:1.00; |
| • | a minimum Reinsurance Ratio (as defined in the Credit Agreement) of 50.0%; and |
| • | a minimum NAIC RBC Ratio (as defined in the NAIC) standards, calculated as of the end of each fiscal year, to the "authorized control level," as defined by the NAIC in its standards) of 250.0%, applicable to each regulated insurance subsidiary of the Borrowers. |
As of December 31, 2012, we were in compliance with the financial covenants contained in the Credit Agreement.
$85.0 Million Revolving Credit Facility
In June 2010, we entered into a $35.0 million revolving credit facility with SunTrust Bank, N.A., which was set to mature in June 2013 (the "Facility"). Subsequent to June 2010, the Facility was increased to $85.0 million.
On August 2, 2012, we terminated the $85.0 million revolving credit facility with SunTrust Bank, N.A. and entered into a new $125.0 million credit facility, which is discussed above. In connection with the termination of the SunTrust Bank, N.A. revolving credit facility, we recorded a charge of $0.7 million to interest expense during the year ended December 31, 2012 for previously capitalized transaction costs associated with this revolving credit facility.
Preferred Trust Securities
In connection with the Summit Partners Transactions, our subsidiary, LOTS Intermediate Co. issued $35.0 million of fixed/floating rate preferred trust securities due in 2037. The preferred trust securities accrued interest at a rate of 9.61% per annum until the June 2012 interest payment date, thereafter, interest accrues at a rate of 3-month LIBOR plus 4.10% for each interest rate period. We were not permitted to redeem the preferred trust securities until after the June 2012 interest payment date, thereafter we may redeem the preferred trust securities, in whole or in part, at a price equal to 100% of the principal amount of such preferred trust securities outstanding plus accrued and unpaid interest. Interest is payable quarterly.
In April 2011, we entered into a forward interest rate swap (the "Swap") with Wells Fargo Bank, N.A., pursuant to which we swapped the floating rate portion of our $35.0 million in outstanding preferred trust securities to a fixed rate of 3.47% per annum payable quarterly resulting in a total rate of 7.57% after adding the applicable margin of 4.10%. The Swap has a five year term, which commenced in June 2012 when the interest rate on the underlying preferred trust securities began to float and will expire in June 2017.
Invested Assets
Our invested assets consist mainly of high quality investments in fixed maturity securities, short-term investments, and a smaller allocation of common and preferred equity securities. We believe that prudent levels of investments in equity securities within our investment portfolio are likely to enhance long-term after-tax total returns without significantly increasing the risk profile of the portfolio. We regularly review our entire portfolio in the context of macroeconomic and capital market conditions. The overall credit quality of the investment portfolio was rated A+ by Standard and Poor's Rating Service at December 31, 2012 and 2011, respectively.
Regulatory Requirements
Our investments must comply with applicable laws and regulations which prescribe the kind, quality and concentration of investments. In general, these laws and regulations permit investments, within specified limits and subject to certain qualifications, in federal, state and municipal obligations, corporate bonds, preferred and common equity securities, mortgage loans, real estate and other investments.
Investment Strategy
Our investment policy and strategy is reviewed and approved by the board of directors of each of our insurance subsidiaries on a regular basis in order to review and consider investment activities, tactics and new investment opportunities. Our investment strategy seeks long-term returns through disciplined security selection, portfolio diversity and an integrated approach to risk management. We select and monitor investments to balance the goals of safety, stability, liquidity, growth and after-tax total return with the need to comply with regulatory investment requirements. Our investment portfolio is managed by a third-party provider of asset management services, which specializes in the insurance sector. Asset liability management is accomplished by setting an asset target duration range that is influenced by the following factors: (i) the estimated reserve payout pattern, (ii) the inclusion of our tactical capital market views into the investment decision making process and (iii) our overall risk tolerance. We aim to achieve a relatively safe and stable income stream by maintaining a broad-based portfolio of investment grade fixed maturity securities. These holdings are supplemented by investments in additional asset types with the objective of further enhancing the portfolio's diversification and expected returns. These additional asset types include common and redeemable preferred stock. We manage our investment risks through consideration of duration of liabilities, diversification, credit limits, careful analytic review of each investment decision, and comprehensive risk assessments of the overall portfolio.
As of December 31, 2012, we held 29 individual fixed maturity and 3 individual equity securities in unrealized loss positions. We do not intend to sell the investments that are in an unrealized loss position at December 31, 2012 and it is more likely than not that we will be able to hold these securities until full recovery of their amortized cost basis for fixed maturity securities or cost for equity
68
securities, although we can give no assurances. At December 31, 2012, based on management's quarterly review, we deemed that a single equity security was other than temporarily impaired and recorded an impairment charge of $16 thousand for the year ended December 31, 2012.
As of December 31, 2011, there were 35 individual fixed maturity and 5 individual equity securities in unrealized loss positions. At December 31, 2011, based on management's quarterly review, we deemed that 10 individual equity securities were other than temporarily impaired and for the year ended December 31, 2011 recorded an impairment charge of $0.2 million. Please see the Note, "Investments" in the Notes to Consolidated Financial Statements for additional information.
Cash Flows
We monitor cash flows at the consolidated, holding company and subsidiary levels. Cash flow forecasts at the consolidated and subsidiary levels are provided on a monthly basis using trend and variance analysis to project future cash needs, with adjustments made as needed. The table below shows our cash flows for the periods presented:
| (in thousands) | Years Ended December 31, | |||||||||||
| Cash provided by (used in): | 2012 | 2011 | 2010 | |||||||||
| Operating activities | $ | 31,988 | $ | 11,166 | $ | 13,102 | ||||||
| Investing activities | (59,291 | ) | (45,795 | ) | (29,801 | ) | ||||||
| Financing activities | 11,173 | 22,579 | 30,148 | |||||||||
| Net change in cash and cash equivalents | $ | (16,130 | ) | $ | (12,050 | ) | $ | 13,449 | ||||
Operating Activities
Net cash provided by operating activities was $32.0 million for the year ended December 31, 2012 and was primarily attributable to our net income and an increase in accrued expenses, accounts payable and other liabilities and unearned premiums, which was partially offset by increases in reinsurance receivables, accounts and premiums receivable, net, and other receivables.
Net cash provided by operating activities was $11.2 million for the year ended December 31, 2011 and was attributable to an increase in unearned premiums and net income, partially offset by payments made for accrued expenses, accounts payable and other liabilities and a decrease in deferred revenue.
Net cash provided from operating activities was $13.1 million for the year ended December 31, 2010, and primarily reflected our net income and collections of reinsurance and other receivables, partially offset by payments made for accrued expenses, accounts payable and other liabilities.
Investing Activities
Net cash used in investing activities was $59.3 million for the year ended December 31, 2012 and was primarily for the purchase of fixed maturity and equity securities, our acquisitions of ProtectCELL and 4Warranty, an increase in restricted cash and the purchase of property and equipment. These uses of cash were partially offset by the cash provided by the proceeds from maturities and sales of maturity of fixed maturity investments.
Net cash used in investing activities was $45.8 million for the year ended December 31, 2011 and primarily reflected cash used for purchases of fixed maturity securities and our acquisitions of Auto Knight, eReinsure, PBG and Magna, partially offset by the sale and maturity of fixed maturity investments. Net cash used in investing activities was $29.8 million for the year ended December 31, 2010 and was primarily used for the purchase of fixed maturity securities, the acquisitions of South Bay, Continental and United and purchases of property and equipment.
Financing Activities
Net cash provided by financing activities was $11.2 million for the year ended December 31, 2012 primarily reflected the borrowings under our lines of credit of $146.9 million, which was nearly offset by the use of $130.5 million used to pay-down our credit facilities and use of $3.9 million to repurchase 508,080 shares of our common stock under our share repurchase plan. Payments and proceeds from our notes payables were also higher for the year ended December 31, 2012, compared to the same period in 2011, due to the payoff of our SunTrust Bank, N.A revolving credit facility and the entry into the new Wells Fargo Bank, N.A. credit facility.
Net cash provided by financing activities was $22.6 million for the year ended December 31, 2011 and primarily reflected borrowings under our lines of credit of $110.6 million, of which approximately $51.6 million was used to complete the acquisitions of Auto Knight, eReinsure and PBG, which was partially offset by $74.3 million used to pay-down our credit facilities and $11.0 million used for the redemption of our redeemable preferred stock. During 2011, we also used $2.6 million to repurchase 471,554 shares of our common stock under our share repurchase plan.
69
Net cash provided by financing activities was $30.1 million for the year ended December 31, 2010 and primarily reflected proceeds of our IPO totaling $43.6 million less IPO related costs of $3.3 million and borrowings under our lines of credit of $25.2 million, partially offset by the redemption of $20.0 million in subordinated debentures and payment of the liquidation preference of $14.1 million paid to Class A stockholders.
Contractual Obligations and Other Commitments
We have obligations and commitments to third parties as a result of our operations. These obligations and commitments, as of December 31, 2012, are detailed in the table below by maturity date as of the periods indicated:
| (in thousands) | Payments Due by Period | ||||||||||||||
| Less than | More than | ||||||||||||||
| Total | 1 Year | 1-3 Years | 4-5 Years | 5 Years | |||||||||||
Note payable (1) | $ | 89,438 | $ | 1,250 | $ | 10,000 | $ | 78,188 | $ | — | |||||
| Preferred trust securities | 35,000 | — | — | — | 35,000 | ||||||||||
Interest payable on total debt(2) | 68,247 | 5,664 | 11,230 | 9,919 | 41,434 | ||||||||||
| Operating leases | 22,545 | 2,574 | 5,618 | 4,900 | 9,453 | ||||||||||
Capital leases (3) | 267 | 134 | 133 | — | — | ||||||||||
| Policyholder account balances | 26,023 | 1,472 | 2,881 | 2,772 | 18,898 | ||||||||||
Unpaid claims (4) | 33,007 | 28,747 | 3,986 | 253 | 21 | ||||||||||
| Total | $ | 274,527 | $ | 39,841 | $ | 33,848 | $ | 96,032 | $ | 104,806 | |||||
(1) - For more information on the credit facility with Wells Fargo Bank, N.A., please see the section above titled "$125.0 Million Credit Facility" in this MD&A and the Note, "Note Payable" in the Notes to the Consolidated Financial Statements.
(2) - Due to the variable interest rate and amortizing payments required on the note payable to Well Fargo and the impact of interest rate swap on the preferred trust securities interest payable, we made certain assumptions regarding future interest rates. The assumptions we made are as follows:
| a. | For interest payable on the note payable, we assumed scheduled principal payments 1,250 per quarter and used the 1-month forward LIBOR curve rate when estimating interest payable on the outstanding principal balance. |
| b. | For interest payable on the preferred trust securities, we used interest swap in effect of 7.57% until June 2017, subsequent to that date we utilized the contractual spread amount of 410 basis points plus the 3-month forward LIBOR curve rate. |
(3) - Includes the interest portion of the capital lease payments.
(4) - Estimated. Net unpaid claims are: total $13,119; less than 1 year $11,426; 1-3 years $1,584; 3-5 years $101; and more than 5 years $8.
As part of the 2012 acquisition of ProtectCELL, we have a conditional commitment to provide up to $10.2 million of additional capital ("Additional Fortegra Capital Contributions") to ProtectCELL if the board of directors of ProtectCELL (the "PC Board") determines that ProtectCELL requires additional funds to support expansion and growth, or other appropriate business needs.
We are obligated to evaluate any such funding request received from the PC Board in good faith to determine whether in our reasonable business judgment the requested capital should be contributed. Fortegra is not required to honor the funding request from the PC Board if we in good faith deem the request to be imprudent or unjustified.
The benefits of such additional funding would inure to Fortegra and to the non-controlling ownership interest of ProtectCell, in proportion to their respective ownership interests. However, in return for each $1,000 of Additional Fortegra Capital Contributions, the Fortegra Members shall receive one Series A Preferred Unit. Any unreturned Series A Preferred contribution is deducted from ProtectCELL's valuation in determining the option price.
Off-Balance Sheet Arrangements
We do not have any off-balance sheet arrangements that are reasonably likely to have a material effect on our financial condition, results of operations, liquidity or capital resources.
ITEM 7A. QUANTITATIVE AND QUALITATIVE DISCLOSURES ABOUT MARKET RISK
Effective risk management is fundamental to our ability to protect both our customers' and stockholders' interests. We are exposed to potential losses from various market risks, in particular interest rate risk and credit risk. Additionally, we are exposed to inflation risk, and concentration risk.
Interest Rate Risk
Interest rate risk is the possibility that the fair value of liabilities will change more or less than the market value of investments in response to changes in interest rates, including changes in the slope or shape of the yield curve and changes in spreads due to credit risks and other factors.
70
Interest rate risk arises as we invest substantial funds in interest-sensitive fixed maturity securities primarily in the United States. There are two forms of interest rate risk: price risk and reinvestment risk. Price risk occurs when fluctuations in interest rates have a direct impact on the market valuation of these investments. As interest rates rise, the market value of these investments fall, and conversely, as interest rates fall, the market value of these investments rise. Reinvestment risk occurs when fluctuations in interest rates have a direct impact on expected cash flows from mortgage-backed and asset-backed securities. As interest rates fall, an increase in prepayments on these assets results in earlier than expected receipt of cash flows forcing us to reinvest the proceeds in an unfavorable lower interest rate environment. Conversely, as interest rates rise, a decrease in prepayments on these assets results in later than expected receipt of cash flows forcing us to forgo reinvesting in a favorable higher interest rate environment.
We manage interest rate risk by selecting investments with characteristics such as duration, yield, currency and liquidity tailored to the anticipated cash outflow characteristics of our insurance and reinsurance liabilities. Increases or decreases in interest rates could also impact interest payable under our variable rate indebtedness. As of December 31, 2012, we had $89.4 million outstanding under our credit facility with Wells Fargo Bank, N.A. at an interest rate of 2.76%.
We have the ability to manage interest rate risk by entering into interest rate swap transactions to mitigate the impact of interest rate changes on our debt obligations. In April 2011, we entered into a forward starting interest rate swap transaction to convert the floating rate portion of our preferred trust securities to a fixed rate. The Swap, commenced in June 2012 and expires in June 2017. This transaction swapped the floating rate portion of our $35.0 million in outstanding preferred trust securities to a fixed rate of 3.47% per annum payable quarterly resulting in a total rate of 7.57% after adding the applicable margin of 4.10%.
Credit Risk
Credit risk is the possibility that counterparties may not be able to meet payment obligations when they become due. We assume counterparty credit risk in many forms. A counterparty is any person or entity from which cash or other forms of consideration are expected to extinguish a liability or obligation to us. Primarily, our credit risk exposure is concentrated in our fixed maturity investment portfolio and, to a lesser extent, in our reinsurance receivables.
We have exposure to credit risk primarily from customers, as a holder of fixed maturity securities and by entering into reinsurance cessions. Our risk management strategy and investment strategy is to invest in debt instruments of high credit quality issuers and to limit the amount of credit exposure with respect to any one issuer. We attempt to limit our credit exposure by imposing fixed maturity portfolio limits on individual issuers based upon credit quality.
We are also exposed to the credit risk of our reinsurers. When we reinsure, we are still liable to our insureds regardless of whether we get reimbursed by our reinsurer. As part of our overall risk and capacity management strategy, we purchase reinsurance for certain risks underwritten by our Payment Protection business segments.
At December 31, 2012, approximately 72.8% of our $204.0 million in reinsurance receivables, compared to 69.4%, or $194.7 million, at December 31, 2011, were protected from credit risk by various types of risk mitigation mechanisms such as collateral trusts, letters of credit or by withholding the assets in a modified coinsurance or co-funds-withheld arrangement. For recoverables that are not protected by these mechanisms, we are dependent solely on the ability of the reinsurer to satisfy claims. Occasionally, the creditworthiness of the reinsurer becomes questionable. The majority of our reinsurance exposure has been ceded to companies rated A- or better by A.M. Best or is supported by letters of credit.
Concentration Risk
Concentration risk is the risk that results from a lack of diversification due to a concentrated exposure on a small number of clients, limited market penetration, or reduced geographic coverage.
A significant portion, approximately 63% at December 31, 2012 compared to 79% at December 31, 2011, of our BPO revenues are attributable to one client, National Union Fire Insurance Company of Pittsburgh, PA. Any loss of business from or change in our relationship with this client could have a material adverse effect on our business. To mitigate this risk, we intend to expand our BPO client base.
We maintain cash and cash equivalents with major third party financial institutions, including interest-bearing money market accounts. In the United States, these accounts were fully insured by the FDIC regardless of account balance through the Transaction Account Guarantee ("TAG") program created by Dodd-Frank § 343. The expiration of the TAG program on December 31, 2012, caused the FDIC's standard insurance limit of $250,000 per depositor per institution to be reimposed on January 1, 2013. Thus, our accounts containing cash and cash equivalents as of January 1, 2012 may exceed the FDIC's standard $250,000 insurance limit from time to time.
The cash balances in money markets accounts exceeding the FDIC insurance limit totaled $8.2 million and $9.0 million at December 31, 2012 and 2011, respectively. To date, we have not experienced any loss of, or lack of access to, our cash or cash equivalents.
71
Although we periodically monitor and adjust the balances of these accounts as needed, the balances of these accounts nonetheless remain subject to unexpected, adverse conditions in the financial markets and could be adversely impacted if a financial institution with which we maintain an account fails. We will continue to monitor the depository institutions at which our accounts are maintained, but cannot guarantee that access to our cash and cash equivalents will not be impacted by, or that we will not lose deposited funds exceeding the FDIC insurance limit due to, adverse conditions in the financial markets or if a financial institution with which we maintain an account fails.
We have two additional forms of concentration risk: (i) geographic (almost two-thirds of our Brokerage segment is in California) and (ii) channel distribution risk (almost half of our Payment Protection revenue is in the consumer finance distribution channel). Our risk mitigation strategies are to continue to expand geographically (in our Brokerage segment) and to continue to increase the volume of business through other distribution channels (in our Payment Protection segment).
Inflation Risk
Inflation risk is the possibility that a change in domestic price levels produces an adverse effect on earnings. This typically happens when either invested assets or liabilities, but not both are indexed to inflation. Inflation did not have a material impact on our financial condition, results of operations or cash flows in the periods presented in our Consolidated Financial Statements.
72
ITEM 8. FINANCIAL STATEMENTS AND SUPPLEMENTARY DATA
REPORT OF INDEPENDENT REGISTERED PUBLIC ACCOUNTING FIRM
To the Board of Directors and Stockholders
Fortegra Financial Corporation
We have audited the accompanying consolidated balance sheets of Fortegra Financial Corporation ("the Company") as of December 31, 2012 and 2011, and the related consolidated statements of income, comprehensive income, changes in stockholders' equity and cash flows for each of the years in the three-year period ended December 31, 2012. Our audits also included the financial statement schedules listed in Item 15. These financial statements are the responsibility of the Company's management. Our responsibility is to express an opinion on these financial statements based on our audits.
We conducted our audits in accordance with the standards of the Public Company Accounting Oversight Board (United States). Those standards require that we plan and perform the audit to obtain reasonable assurance about whether the financial statements are free of material misstatement. An audit includes examining, on a test basis, evidence supporting the amounts and disclosures in the financial statements. An audit also includes assessing the accounting principles used and significant estimates made by management, as well as evaluating the overall financial statement presentation. We believe that our audits provide a reasonable basis for our opinion.
In our opinion, the consolidated financial statements referred to above present fairly, in all material respects, the financial position of Fortegra Financial Corporation as of December 31, 2012 and 2011, and the results of its consolidated operations and its cash flows for each of the years in the three-year period ended December 31, 2012 in conformity with accounting principles generally accepted in the United States. In addition, in our opinion, such financial statement schedules, when considered in relation to the basic financial statements as a whole, present fairly, in all material respects, the information set forth therein.
We also have audited, in accordance with the standards of the Public Company Accounting Oversight Board (United States), the Company's internal control over financial reporting as of December 31, 2012, based on criteria established in Internal Control-Integrated Framework issued by the Committee of Sponsoring Organizations of the Treadway Commission and our report dated March 29, 2013 expressed an adverse opinion thereon.
/s/ Johnson Lambert LLP
Jacksonville, Florida
March 29, 2013
73
FORTEGRA FINANCIAL CORPORATION
CONSOLIDATED BALANCE SHEETS
(All Amounts in Thousands Except Share and Per Share Amounts)
| At December 31, | |||||||
| 2012 | 2011 | ||||||
| Assets: | As Restated | ||||||
| Investments: | |||||||
| Fixed maturity securities available-for-sale, at fair value (amortized cost of $107,095 at December 31, 2012 and $92,311 at December 31, 2011) | $ | 110,641 | $ | 93,509 | |||
Equity securities available-for-sale, at fair value (cost of $6,082 at December 31, 2012 and $1,203 at December 31, 2011) | 6,220 | 1,219 | |||||
| Short-term investments | 1,222 | 1,070 | |||||
| Total investments | 118,083 | 95,798 | |||||
| Cash and cash equivalents | 15,209 | 31,339 | |||||
| Restricted cash | 31,142 | 14,180 | |||||
| Accrued investment income | 1,235 | 929 | |||||
| Notes receivable, net | 11,290 | 3,603 | |||||
| Accounts and premiums receivable, net | 27,026 | 19,690 | |||||
| Other receivables | 13,511 | 9,465 | |||||
| Reinsurance receivables | 203,988 | 194,740 | |||||
| Deferred acquisition costs | 79,165 | 55,628 | |||||
| Property and equipment, net | 17,946 | 15,314 | |||||
| Goodwill | 119,512 | 104,888 | |||||
| Other intangible assets, net | 79,340 | 54,410 | |||||
| Income taxes receivable | 2,897 | — | |||||
| Other assets | 7,667 | 5,369 | |||||
| Total assets | $ | 728,011 | $ | 605,353 | |||
| Liabilities: | |||||||
| Unpaid claims | $ | 33,007 | $ | 32,583 | |||
| Unearned premiums | 235,900 | 227,929 | |||||
| Policyholder account balances | 26,023 | 28,040 | |||||
| Accrued expenses, accounts payable and other liabilities | 58,563 | 33,982 | |||||
| Income taxes payable | — | 1,344 | |||||
| Deferred revenue | 70,452 | 22,420 | |||||
| Note payable | 89,438 | 73,000 | |||||
| Preferred trust securities | 35,000 | 35,000 | |||||
| Deferred income taxes, net | 28,658 | 23,969 | |||||
| Total liabilities | 577,041 | 478,267 | |||||
| Commitments and Contingencies (Note 23) | |||||||
| Stockholders' Equity: | |||||||
Preferred stock, par value $0.01; 10,000,000 shares authorized; none issued | — | — | |||||
Common stock, par value $0.01; 150,000,000 shares authorized; 20,710,370 and 20,561,328 shares issued at December 31, 2012 and 2011, respectively, including shares in treasury | 207 | 206 | |||||
Treasury stock, at cost; 1,024,212 shares and 516,132 shares at December 31, 2012 and 2011, respectively | (6,651 | ) | (2,728 | ) | |||
| Additional paid-in capital | 97,641 | 96,199 | |||||
| Accumulated other comprehensive loss, net of tax | (631 | ) | (1,754 | ) | |||
| Retained earnings | 49,817 | 34,652 | |||||
| Stockholders' equity before non-controlling interests | 140,383 | 126,575 | |||||
| Non-controlling interests | 10,587 | 511 | |||||
| Total stockholders' equity | 150,970 | 127,086 | |||||
| Total liabilities and stockholders' equity | $ | 728,011 | $ | 605,353 | |||
See accompanying notes to these consolidated financial statements.
74
FORTEGRA FINANCIAL CORPORATION
CONSOLIDATED STATEMENTS OF INCOME
(All Amounts in Thousands Except Share and Per Share Amounts)
| For the Years Ended December 31, | |||||||||||
| 2012 | 2011 | 2010 | |||||||||
| Revenues: | As Restated | As Restated | |||||||||
| Service and administrative fees | $ | 90,550 | $ | 94,464 | $ | 56,254 | |||||
| Brokerage commissions and fees | 35,306 | 34,396 | 24,620 | ||||||||
| Ceding commission | 34,825 | 29,495 | 28,767 | ||||||||
| Net investment income | 3,068 | 3,368 | 4,073 | ||||||||
| Net realized investment gains | 3 | 4,193 | 650 | ||||||||
| Net earned premium | 127,625 | 115,503 | 111,805 | ||||||||
| Other income | 269 | 170 | 230 | ||||||||
| Total revenues | 291,646 | 281,589 | 226,399 | ||||||||
| Expenses: | |||||||||||
| Net losses and loss adjustment expenses | 40,219 | 37,949 | 36,035 | ||||||||
| Member benefit claims | 4,642 | 4,409 | 466 | ||||||||
| Commissions | 128,741 | 126,918 | 92,646 | ||||||||
| Personnel costs | 48,648 | 44,547 | 36,361 | ||||||||
| Other operating expenses | 30,354 | 31,140 | 24,426 | ||||||||
| Depreciation and amortization | 3,933 | 3,077 | 1,396 | ||||||||
| Amortization of intangibles | 4,953 | 4,952 | 3,232 | ||||||||
| Interest expense | 6,624 | 7,641 | 8,464 | ||||||||
| Loss on sale of subsidiary | — | 477 | — | ||||||||
| Total expenses | 268,114 | 261,110 | 203,026 | ||||||||
| Income before income taxes and non-controlling interests | 23,532 | 20,479 | 23,373 | ||||||||
| Income taxes | 8,295 | 7,140 | 8,159 | ||||||||
| Income before non-controlling interests | 15,237 | 13,339 | 15,214 | ||||||||
| Less: net income (loss) attributable to non-controlling interests | 72 | (170 | ) | 20 | |||||||
| Net income | $ | 15,165 | $ | 13,509 | $ | 15,194 | |||||
| Earnings per share: | |||||||||||
| Basic | $ | 0.77 | $ | 0.66 | $ | 0.95 | |||||
| Diluted | $ | 0.74 | $ | 0.64 | $ | 0.88 | |||||
| Weighted average common shares outstanding: | |||||||||||
| Basic | 19,655,492 | 20,352,027 | 15,929,181 | ||||||||
| Diluted | 20,600,362 | 21,265,801 | 17,220,029 | ||||||||
See accompanying notes to these consolidated financial statements.
75
FORTEGRA FINANCIAL CORPORATION
CONSOLIDATED STATEMENTS OF COMPREHENSIVE INCOME
(All Amounts in Thousands)
| For the Years Ended December 31, | |||||||||||
| 2012 | 2011 | 2010 | |||||||||
| As Restated | As Restated | ||||||||||
| Net income | $ | 15,165 | $ | 13,509 | $ | 15,194 | |||||
| Other comprehensive income (loss), net of tax: | |||||||||||
| Unrealized gains (losses) on available-for-sale securities: | |||||||||||
| Unrealized holding gains arising during the period | 2,466 | 1,568 | 1,810 | ||||||||
| Related tax (expense) benefit | (862 | ) | (550 | ) | (634 | ) | |||||
| Less: reclassification of losses (gains) included in net income | 3 | (4,193 | ) | (650 | ) | ||||||
| Related tax (expense) benefit | (1 | ) | 1,468 | 228 | |||||||
| Unrealized gains (losses) on available-for-sale securities, net of tax | 1,606 | (1,707 | ) | 754 | |||||||
| Interest rate swap: | |||||||||||
| Unrealized loss on interest rate swap | (611 | ) | (3,601 | ) | — | ||||||
| Related tax benefit | 214 | 1,260 | — | ||||||||
| Add: reclassification of losses included in net income | (126 | ) | — | — | |||||||
| Related tax expense | 44 | — | — | ||||||||
| Unrealized loss on interest rate swap, net of tax | (479 | ) | (2,341 | ) | — | ||||||
| Other comprehensive income (loss) before non-controlling interests, net of tax | 1,127 | (4,048 | ) | 754 | |||||||
| Less: comprehensive income (loss) attributable to non-controlling interests | 4 | (1 | ) | 68 | |||||||
| Other comprehensive income (loss) | 1,123 | (4,047 | ) | 686 | |||||||
| Comprehensive income | $ | 16,288 | $ | 9,462 | $ | 15,880 | |||||
See accompanying notes to these consolidated financial statements.
76
FORTEGRA FINANCIAL CORPORATION
CONSOLIDATED STATEMENT OF STOCKHOLDERS' EQUITY
(All Amounts in Thousands Except Share Amounts)
| Common Stock | Treasury Stock | ||||||||||||||||||||||||||||||||
| Shares | Amount | Shares | Amount | Additional Paid-in Capital | Accumulated Other Comprehensive Income (Loss) | Retained Earnings | Non-controlling Interests | Total Stockholders' Equity | |||||||||||||||||||||||||
| Restated | Restated | Restated | Restated | ||||||||||||||||||||||||||||||
| Balance, January 1, 2010, as previously reported | 15,786,913 | $ | 1,002 | (44,578 | ) | $ | (176 | ) | $ | 53,675 | $ | 1,607 | $ | 23,210 | $ | 1,475 | $ | 80,793 | |||||||||||||||
| Cumulative effect of adjustment resulting from new accounting guidance | — | — | — | — | — | — | (3,156 | ) | (21 | ) | (3,177 | ) | |||||||||||||||||||||
| Balance, January 1, 2010, restated | 15,786,913 | $ | 1,002 | (44,578 | ) | $ | (176 | ) | $ | 53,675 | $ | 1,607 | $ | 20,054 | $ | 1,454 | $ | 77,616 | |||||||||||||||
| Net income, as restated | — | — | — | — | — | — | 15,194 | 20 | 15,214 | ||||||||||||||||||||||||
| Other comprehensive income | — | — | — | — | — | 686 | — | 68 | 754 | ||||||||||||||||||||||||
| Change in par value | — | (844 | ) | — | — | 844 | — | — | — | — | |||||||||||||||||||||||
| Stock-based compensation | 160,000 | 2 | — | — | 174 | — | — | — | 176 | ||||||||||||||||||||||||
| Redemption of minority interest | — | — | — | — | — | — | — | (860 | ) | (860 | ) | ||||||||||||||||||||||
| Options exercised, net of forfeitures | 44,185 | — | — | — | 203 | — | — | — | 203 | ||||||||||||||||||||||||
| Conversion of Class A common stock | — | — | — | — | — | — | (14,105 | ) | — | (14,105 | ) | ||||||||||||||||||||||
| Issuance of common stock | 4,265,637 | 43 | — | — | 40,660 | — | — | — | 40,703 | ||||||||||||||||||||||||
| Balance, December 31, 2010, restated | 20,256,735 | $ | 203 | (44,578 | ) | $ | (176 | ) | $ | 95,556 | $ | 2,293 | $ | 21,143 | $ | 682 | $ | 119,701 | |||||||||||||||
| Net income, as restated | — | — | — | — | — | — | 13,509 | (170 | ) | 13,339 | |||||||||||||||||||||||
| Other comprehensive loss | — | — | — | — | — | (4,047 | ) | — | (1 | ) | (4,048 | ) | |||||||||||||||||||||
| Stock-based compensation | — | — | — | — | 763 | — | — | — | 763 | ||||||||||||||||||||||||
| Shares issued for the Employee Stock Purchase Plan | 10,167 | — | — | — | 58 | — | — | — | 58 | ||||||||||||||||||||||||
| Treasury stock purchased | — | — | (471,554 | ) | (2,552 | ) | — | — | — | — | (2,552 | ) | |||||||||||||||||||||
| Options exercised, net of forfeitures | 294,426 | 3 | — | — | 648 | — | — | — | 651 | ||||||||||||||||||||||||
| Initial public offering costs | — | — | — | — | (826 | ) | — | — | — | (826 | ) | ||||||||||||||||||||||
| Balance, December 31, 2011, restated | 20,561,328 | $ | 206 | (516,132 | ) | $ | (2,728 | ) | $ | 96,199 | $ | (1,754 | ) | $ | 34,652 | $ | 511 | $ | 127,086 | ||||||||||||||
| Net income | — | — | — | — | — | — | 15,165 | 72 | 15,237 | ||||||||||||||||||||||||
| Other comprehensive income | — | — | — | — | — | 1,123 | — | 4 | 1,127 | ||||||||||||||||||||||||
| Stock-based compensation | 87,011 | 1 | — | — | 1,043 | — | — | — | 1,044 | ||||||||||||||||||||||||
| Direct stock awards to employees | 6,020 | — | — | — | 49 | — | — | 49 | |||||||||||||||||||||||||
| Shares issued for the Employee Stock Purchase Plan | 53,511 | — | — | — | 330 | 330 | |||||||||||||||||||||||||||
| Treasury stock purchased | — | — | (508,080 | ) | (3,923 | ) | — | — | — | — | (3,923 | ) | |||||||||||||||||||||
| Options exercised, net of forfeitures | 2,500 | — | — | — | 20 | — | — | — | 20 | ||||||||||||||||||||||||
| Non-controlling interest attributable to ProtectCELL acquisition | — | — | — | — | — | — | — | 10,000 | 10,000 | ||||||||||||||||||||||||
| Balance, December 31, 2012 | 20,710,370 | $ | 207 | (1,024,212 | ) | $ | (6,651 | ) | $ | 97,641 | $ | (631 | ) | $ | 49,817 | $ | 10,587 | $ | 150,970 | ||||||||||||||
See accompanying notes to these consolidated financial statements.
77
FORTEGRA FINANCIAL CORPORATION
CONSOLIDATED STATEMENTS OF CASH FLOWS
(All Amounts in Thousands)
| For the Years Ended December 31, | |||||||||||
| 2012 | 2011 | 2010 | |||||||||
| Operating Activities | As Restated | As Restated | |||||||||
| Net income | $ | 15,165 | $ | 13,509 | $ | 15,194 | |||||
| Adjustments to reconcile net income to net cash flows provided by operating activities: | |||||||||||
| Change in deferred acquisition costs | (3,692 | ) | 3,908 | (4,201 | ) | ||||||
| Depreciation and amortization | 8,886 | 8,029 | 4,628 | ||||||||
| Deferred income tax expense | 4,252 | 1,721 | 4,337 | ||||||||
| Net realized investment (gains) losses | (3 | ) | (4,193 | ) | (650 | ) | |||||
| Loss on sale of subsidiary | — | 477 | — | ||||||||
| Stock-based compensation expense | 1,044 | 763 | 176 | ||||||||
| Direct stock awards to employees | 49 | — | — | ||||||||
| Amortization of premiums and accretion of discounts on investments | 1,283 | 609 | 348 | ||||||||
| Non-controlling interests | 72 | (170 | ) | (772 | ) | ||||||
| Change in allowance for doubtful accounts | (90 | ) | (31 | ) | (30 | ) | |||||
| Changes in operating assets and liabilities, net of the effects of acquisitions and dispositions: | |||||||||||
| Accrued investment income | (306 | ) | (16 | ) | 30 | ||||||
| Accounts and premiums receivable, net | (4,933 | ) | (898 | ) | 3,808 | ||||||
| Other receivables | (4,139 | ) | (1,769 | ) | 1,884 | ||||||
| Reinsurance receivables | (9,248 | ) | (5,181 | ) | 4,416 | ||||||
| Income taxes receivable | (3,628 | ) | 818 | (818 | ) | ||||||
| Other assets | 865 | (389 | ) | (1,600 | ) | ||||||
| Unpaid claims | 248 | (315 | ) | (3,459 | ) | ||||||
| Unearned premiums | 7,971 | 14,373 | (5,222 | ) | |||||||
| Policyholder account balances | (2,017 | ) | (45 | ) | — | ||||||
| Accrued expenses, accounts payable and other liabilities | 20,190 | (14,909 | ) | (7,379 | ) | ||||||
| Income taxes payable | (1,344 | ) | 1,344 | (769 | ) | ||||||
| Deferred revenue | 1,363 | (6,469 | ) | 3,181 | |||||||
| Net cash flows provided by operating activities | 31,988 | 11,166 | 13,102 | ||||||||
| Investing activities | |||||||||||
| Proceeds from maturities, calls and prepayments of available-for-sale investments | 11,138 | 9,691 | 12,114 | ||||||||
| Proceeds from sales of available-for-sale investments | 8,364 | 62,300 | 8,769 | ||||||||
| Net change in short-term investments | 100 | 100 | 50 | ||||||||
| Purchases of available-for-sale investments | (40,445 | ) | (62,147 | ) | (24,047 | ) | |||||
| Purchases of property and equipment | (5,830 | ) | (6,280 | ) | (9,191 | ) | |||||
| Net paid for acquisitions of subsidiaries, net of cash received | (21,820 | ) | (49,873 | ) | (20,548 | ) | |||||
| Sale of subsidiary, net of cash paid | — | (153 | ) | — | |||||||
| Net (issuance) proceeds from notes receivable | (1,346 | ) | (975 | ) | 684 | ||||||
| Change in restricted cash, net of restricted cash received from acquisitions | (9,452 | ) | 1,542 | 2,368 | |||||||
| Net cash flows used in investing activities | (59,291 | ) | (45,795 | ) | (29,801 | ) | |||||
| Financing activities | |||||||||||
| Payments on notes payable | (130,450 | ) | (74,263 | ) | (20,000 | ) | |||||
| Proceeds from notes payable | 146,888 | 110,550 | 25,226 | ||||||||
| Capitalized closing costs for notes payable | (1,692 | ) | — | (1,379 | ) | ||||||
| Net proceeds from the issuance of common stock | — | — | 40,703 | ||||||||
| Payments for initial public offering costs | — | (826 | ) | — | |||||||
| Payments on redeemable preferred stock | — | (11,040 | ) | (500 | ) | ||||||
| Stockholder funds disbursed at purchase | — | — | (14,105 | ) | |||||||
| Net proceeds from exercise of stock options | 20 | 607 | 117 | ||||||||
| Excess tax benefits from stock-based compensation | — | 45 | 86 | ||||||||
| Purchase of treasury stock | (3,923 | ) | (2,552 | ) | — | ||||||
| Net proceeds received from stock issued in the Employee Stock Purchase Plan | 330 | 58 | — | ||||||||
| Net cash flows provided by financing activities | 11,173 | 22,579 | 30,148 | ||||||||
| Net (decrease) increase in cash and cash equivalents | (16,130 | ) | (12,050 | ) | 13,449 | ||||||
| Cash and cash equivalents, beginning of period | 31,339 | 43,389 | 29,940 | ||||||||
| Cash and cash equivalents, end of period | $ | 15,209 | $ | 31,339 | $ | 43,389 | |||||
| Supplemental disclosures of cash payments for: | |||||||||||
| Interest | $ | 5,292 | $ | 6,184 | $ | 7,246 | |||||
| Income taxes | 8,684 | 3,451 | 5,316 | ||||||||
| Non-cash investing activities | |||||||||||
| Non-cash consideration received from the sale of subsidiary | $ | — | $ | 1,143 | $ | — | |||||
See accompanying notes to these consolidated financial statements.
78
FORTEGRA FINANCIAL CORPORATION
NOTES TO CONSOLIDATED FINANCIAL STATEMENTS
(All Amounts in Thousands Except Share Amounts, Per Share Amounts or Unless Otherwise Noted)
Nature of Operations
Fortegra Financial Corporation (Traded on the New York Stock Exchange under the symbol: FRF), including its subsidiaries ("Fortegra" or the "Company"), is a diversified insurance services company headquartered in Jacksonville, Florida that provides distribution and administration services on a wholesale basis to insurance companies, insurance brokers and agents and other financial services companies primarily in the United States. In 2008, the Company changed its name from Life of the South Corporation to Fortegra Financial Corporation. The Company was incorporated in 1981 in the State of Georgia and re-incorporated in the State of Delaware in 2010. Most of the Company's business is generated through networks of small to mid-sized community and regional banks, small loan companies and automobile dealerships. The Company's majority-owned and controlled subsidiaries, are as follows:
| • | LOTS Intermediate Co. ("LOTS IM") |
| • | Bliss and Glennon, Inc. ("B&G") |
| • | CRC Reassurance Company, Ltd. ("CRC") |
| • | Insurance Company of the South ("ICOTS") |
| • | Life of the South Insurance Company ("LOTS") and its subsidiary, Bankers Life of Louisiana ("Bankers Life") |
| • | LOTS Reassurance Company ("LOTS RE") |
| • | LOTSolutions, Inc. |
| • | Lyndon Southern Insurance Company ("Lyndon Southern") |
| • | Southern Financial Life Insurance Company ("SFLAC"), 85% owned |
| • | South Bay Acceptance Corporation ("South Bay") |
| • | Continental Car Club, Inc. ("Continental") |
| • | United Motor Club of America, Inc. ("United") |
| • | Auto Knight Motor Club, Inc. ("Auto Knight") |
| • | eReinsure.com, Inc. ("eReinsure") |
| • | Pacific Benefits Group Northwest, LLC ("PBG") |
| • | Magna Insurance Company ("Magna") |
| • | Digital Leash,LLC, d/b/a ProtectCELL ("ProtectCELL"), 62.4% owned |
| • | 4Warranty Corporation ("4Warranty") |
The Company operates in three business segments: (i) Payment Protection, (ii) Business Process Outsourcing ("BPO") and (iii) Brokerage. Payment Protection specializes in protecting lenders and their consumers from death, disability or other events that could otherwise impair their ability to repay a debt and also offers warranty and service contracts and motor club solutions. BPO provides an assortment of administrative services tailored to insurance and other financial services companies through a virtual insurance company platform. Brokerage uses a pure wholesale sell-through model to sell specialty casualty and surplus lines insurance and also provides web-hosted applications used by insurers, reinsurers and reinsurance brokers for the global reinsurance market.
1. Basis of Presentation
These Consolidated Financial Statements reflect the consolidated financial statements of Fortegra Financial Corporation and its subsidiaries. The accompanying Consolidated Financial Statements of Fortegra have been prepared in conformity with generally accepted accounting principles in the United States of America ("U.S. GAAP") promulgated by the Financial Accounting Standards Board ("FASB"), Accounting Standards Codification ("ASC" or "the guidance").
2. Summary of Significant Accounting Policies
The following is a summary of significant accounting policies followed in the preparation of the Consolidated Financial Statements:
Principles of Consolidation
The Consolidated Financial Statements include the accounts of Fortegra Financial Corporation and its majority-owned and controlled subsidiaries. All material intercompany account balances and transactions have been eliminated. The third-party ownership of 15% of the common stock of SFLAC and 37.6% of the ownership interests of ProtectCELL have been reflected as non-controlling interests on the Consolidated Balance Sheets. Prior to 2011, third parties held a 52% ownership of the preferred stock of CRC Reassurance Company, Ltd. which were redeemed during the year ended December 31, 2010.
Income (loss) attributable to these non-controlling interests has been reflected on the Consolidated Statements of Income as income (loss) attributable to non-controlling interests and on the Consolidated Statements of Comprehensive Income as comprehensive income (loss) attributable to non-controlling interests.
79
FORTEGRA FINANCIAL CORPORATION
NOTES TO CONSOLIDATED FINANCIAL STATEMENTS
(All Amounts in Thousands Except Share Amounts, Per Share Amounts or Unless Otherwise Noted)
Comprehensive Income (Loss)
Comprehensive income (loss) includes both net income and other items of comprehensive income comprised of unrealized gains and losses on investment securities classified as available-for-sale and unrealized gains and losses on the interest rate swap, net of the related tax effects.
Use of Estimates
Preparation of financial statements in accordance with U.S. GAAP requires management to make estimates and assumptions that affect the reported amounts of assets and liabilities and disclosure of contingent assets and liabilities at the date of the financial statements, and the reported amounts of revenues and expenses during the reporting period. Actual results could differ from those estimates.
Reclassifications and Revision of Previously Issued Consolidated Financial Statements
Certain items in prior financial statements have been reclassified to conform to the current presentation, which had no impact on net income, comprehensive income or loss, net cash provided by operating activities or stockholders' equity.
Change in Accounting Estimate - Unearned Premium Reserves for the Payment Protection Segment
Prior to September 30, 2012, the Company's method of estimating unearned premium reserves in relation to the loss patterns and the related recognition of income for certain types of credit property and vendor single interest payment protection products was based on the pro-rata method. The use of the pro-rata method was based on the best information available at the time the Company's financial statements were prepared.
During the past two years the Company has increased the volume of business related to these product types, thereby increasing the volume of policy and claims data specific to the Company's product types. During the three months ended September 30, 2012, the Company determined it had accumulated a sufficient volume of policy and claims data to be able to perform an actuarial analysis in order to determine the preferable estimation approach. As a result of the analysis of the recently collected additional data, the Company has gained better insight into its product loss patterns and can provide improved judgment and estimation to more accurately calculate the unearned premium reserves and the associated recognition of income. Upon completion of the analysis, Management determined that the Rule of 78s applied on a daily basis provides a more accurate representation of historical loss patterns and the recognition of the related income; as such, the estimation method was changed. The change in approach has been accounted for as a change in accounting estimate that is effected by a change in accounting principle and is justifiable in that it is the preferable approach for income recognition based on the Company's actuarial study. This change in accounting estimate was applied prospectively in accordance with ASC 250-10-45-18. Summarized below is the effect of the change in accounting estimate on the Consolidated Statement of Income for the following period:
| For the Nine Months Ended | |||
| September 30, 2012 | |||
| Revenues: | |||
| Net earned premium | $ | 1,845 | |
| Ceding commission | 2,135 | ||
| Net increase to total revenues from the change in accounting estimate | 3,980 | ||
| Expenses: | |||
| Commissions | 2,739 | ||
| Other operating expenses | (268 | ) | |
| Net increase to total expenses from the change in accounting estimate | 2,471 | ||
| Net increase to income before income taxes from the change in accounting estimate | 1,509 | ||
| Income taxes | 533 | ||
| Net increase to net income from the change in accounting estimate | $ | 976 | |
| Increase to earnings per share from the change in accounting estimate: | |||
| Basic | $ | 0.05 | |
| Diluted | $ | 0.05 | |
Subsequent Events
The Company reviewed all material subsequent events that occurred up to the date the Company's Consolidated Financial Statements were issued to determine whether any event required recognition or disclosure in the financial statements and/or disclosure in the notes thereto. For more information, please see the Note, "Subsequent Events."
80
FORTEGRA FINANCIAL CORPORATION
NOTES TO CONSOLIDATED FINANCIAL STATEMENTS
(All Amounts in Thousands Except Share Amounts, Per Share Amounts or Unless Otherwise Noted)
Fair Value
Fair value as defined in the ASC as the price that would be received to sell an asset or paid to transfer a liability in an orderly transaction between market participants at the measurement date.ASC 820-10 - Fair Value Measurements established a three-level hierarchy that prioritizes the inputs to valuation techniques used to measure fair value. The fair value hierarchy gives the highest priority to quoted prices in active markets for identical assets or liabilities (Level 1) and the lowest priority to unobservable inputs (Level 3). If the inputs used to measure the assets or liabilities fall within different levels of the hierarchy, the classification is based on the lowest level input that is significant to the fair value measurement of the asset or liability. Classification of assets and liabilities within the hierarchy considers the markets in which the assets and liabilities are traded and the reliability and transparency of the assumptions used to determine fair value. The hierarchy requires the use of observable market data when available. The levels of the hierarchy and those investments included in each are as follows:
Level 1 - Inputs to the valuation methodology are quoted prices (unadjusted) for identical assets or liabilities traded in active
markets.
Level 2 - Inputs to the valuation methodology include quoted prices for similar assets or liabilities in active markets, quoted
prices for identical or similar assets or liabilities in markets that are not active, inputs other than quoted prices that are observable
for the asset or liability and market-corroborated inputs.
Level 3 - Inputs to the valuation methodology are unobservable for the asset or liability and are significant to the fair value
measurement. These unobservable inputs are derived from the Company's internal calculations, estimates and assumptions and
require significant management judgment or estimation.
The Company's policy is to recognize transfers between levels as of the actual date of the event or change in circumstances that caused the transfer.
The following methods and assumptions were used to estimate the fair value of each class of financial instrument:
Cash and cash equivalents: The estimated fair value of cash and cash equivalents approximates their carrying value.
Fixed maturity securities: Fair values were obtained from market value quotations provided by an independent pricing service.
Equity securities: The fair values of publicly traded common and preferred stocks were obtained from market value quotations provided by an independent pricing service. The fair values of non-publicly traded common and preferred stocks were based on prices obtained from an independent pricing service.
Notes receivable: The carrying amounts approximate fair value because the interest rates charged approximate current market rates for similar credit risks. These values are net of allowance for doubtful accounts.
Accounts and premiums receivable, net, and other receivables: The carrying amounts approximate fair value since no interest rate is charged on these short duration assets.
Short-term investments: The carrying amounts approximate fair value because of the short maturities of these instruments.
Notes payable and preferred trust securities: The carrying amounts approximate fair value because the applicable interest rates approximate current rates offered to the Company for similar instruments.
Interest rate swap: The fair value of the interest rate swap is determined using widely accepted valuation techniques including discounted cash flow analysis on the expected cash flows of the interest rate swap. This analysis reflects the contractual terms of the interest rate swap, including the period to maturity, and uses observable market-based inputs, including interest rate curves and implied volatilities.
The estimated fair values presented for the Company's investment portfolio are based on prices provided by an independent pricing service and a third party investment manager. The prices provided by these services are based on quoted market prices, when available, non-binding broker quotes, or matrix pricing. The independent pricing service and the third party investment manager provide a single price or quote per security. The Company obtains an understanding of the methods, models and inputs used by the independent pricing service and the third party investment manager, and has controls in place to validate that the amounts provided represent fair values.
Revenue Recognition
The Company's revenues are primarily derived from service and administrative fees, wholesale brokerage commissions and related fees, ceding commissions, net investment income and net earned premiums.
81
FORTEGRA FINANCIAL CORPORATION
NOTES TO CONSOLIDATED FINANCIAL STATEMENTS
(All Amounts in Thousands Except Share Amounts, Per Share Amounts or Unless Otherwise Noted)
Service and Administrative Fees
The Company earns service and administrative fees from a variety of activities, including the administration of credit insurance, the administration of debt cancellation programs, the administration of motor club programs, the administration of warranty programs and the administration of collateral tracking and asset recovery programs. The Payment Protection administrative service revenue is recognized consistent with the earnings recognition pattern of the underlying insurance policies, debt cancellation contracts and motor club memberships being administered, using Rule of 78's, modified Rule of 78's, pro rata, or other methods as appropriate for the contract. Management selects the appropriate method based on available information, and periodically reviews the selections as additional information becomes available. The BPO service fee revenue is recognized as the services are performed. These services include fulfillment, BPO software development, and claims handling for the Company's customers. Collateral tracking fee income is recognized when the service is performed and billed. Asset recovery service revenue is recognized upon the location of a recovered unit and or the location and delivery of a unit. Management reviews the financial results under each significant BPO contract on a monthly basis. Any losses that may occur due to a specific contract would be recognized in the period in which the loss occurs. During the years ended December 31, 2012, 2011 and 2010, the Company has not incurred a loss with respect to a specific significant BPO contract.
Brokerage Commissions and Fees
The Company earns brokerage commission and fee income by providing wholesale brokerage services to retail insurance brokers and agents and insurance companies and is primarily recognized when the underlying insurance policies are issued. A portion of the brokerage commission income is derived from profit commission agreements with insurance carriers. These commissions are received from carriers based upon the underlying underwriting profitability of the business that the Company places with those carriers. Profit commission income is generally recognized as revenue on the receipt of cash based on the terms of the respective carrier contracts. In certain instances, profit commission income may be recognized in advance of cash receipt where the profit commission income due to be received has been calculated or has been confirmed by the insurance carrier. The Company also derives fees from master license agreements to use the eReinsure system together with fees for the transactions completed through its platform.
Ceding Commissions
Ceding commissions earned under coinsurance agreements are based on contractual formulas that take into account, in part, underwriting performance and investment returns experienced by the assuming companies. As experience changes, adjustments to the ceding commissions are reflected in the period incurred and are based on the claim experience of the related policy. The adjustment is calculated by adding the earned premium and investment income from the assets held in trust for the Company's benefit less earned commissions, incurred claims and the reinsurer's fee for the coverage.
Net Investment Income
The Company earns net investment income from interest and dividends received from the investment portfolio, less portfolio management expenses and interest earned on cash accounts and notes receivable. Investment income also includes any amortization of premiums and accretion of discounts on securities acquired at other than par value.
Net Earned Premium
Net earned premium is from direct and assumed earned premium consisting of revenue generated from the direct sale of Payment Protection insurance policies by the Company's distributors and premiums written for Payment Protection insurance policies by another carrier and assumed by the Company. Whether direct or assumed, the premium is earned over the life of the respective policy using methods appropriate to the pattern of losses for the type of business. Methods used include the Rule of 78's, pro rata, and actuarial methods. Management selects the appropriate method based on available information, and periodically reviews the selections as additional information becomes available. Direct and assumed premiums are offset by premiums ceded to the Company's reinsurers, including producer owned reinsurance companies ("PORCs"), earned in the same manner. The amount ceded is proportional to the amount of risk assumed by the reinsurer.
Net Losses and Loss Adjustment Expenses
Net losses and loss adjustment expenses include actual claims paid and the change in unpaid claim reserves. The Company's profitability depends in part on accurately predicting net loss and loss adjustment expenses. Incurred claims are impacted by loss frequency, which is the measure of the number of claims per unit of insured exposure, and loss severity, which is based on the average size of claims. Factors affecting loss frequency and loss severity include changes in claims reporting patterns, claims settlement patterns, judicial decisions, legislation, economic conditions, morbidity patterns and the attitudes of claimants towards settlements.
Actual claims paid are claims payments made to the policyholder or beneficiary during the accounting period. The change in unpaid claim reserve is an increase or reduction to the unpaid claim reserve in the accounting period to maintain the unpaid claim reserve at the levels evaluated by our actuaries.
Unpaid claims are reserve estimates that are established in accordance with U.S. GAAP using generally accepted actuarial methods. Credit life and AD&D unpaid claims reserves include claims in the course of settlement and incurred but not reported ("IBNR").
82
FORTEGRA FINANCIAL CORPORATION
NOTES TO CONSOLIDATED FINANCIAL STATEMENTS
(All Amounts in Thousands Except Share Amounts, Per Share Amounts or Unless Otherwise Noted)
Credit disability unpaid claims reserves also include continuing claim reserves for open disability claims. For all other product lines, unpaid claims reserves are bulk reserves and are entirely IBNR. The Company uses a number of algorithms in establishing its unpaid claims reserves. These algorithms are used to calculate unpaid claims as a function of paid losses, earned premium, target loss ratios, in-force amounts, unearned premium reserves, industry recognized morbidity tables or a combination of these factors.
In arriving at the unpaid claims reserves, the Company conducts an actuarial analysis on a basis gross of reinsurance. The same estimates used as a basis in calculating the gross unpaid claims reserves are then used as the basis for calculating the net unpaid claims reserves, which take into account the impact of reinsurance. Anticipated future loss development patterns form a key assumption underlying these analyses. Our claims are generally reported and settled quickly, resulting in a consistent historical loss development pattern. From the anticipated loss development patterns, a variety of actuarial loss projection techniques are employed, such as the chain ladder method, the Bornhuetter-Ferguson method and expected loss ratio method.
The unpaid claims reserves do not represent an exact calculation of exposure, but instead represent the Company's best estimates, generally involving actuarial projections at a given time. The process used in determining the unpaid claims reserves cannot be exact since actual claim costs are dependent upon a number of complex factors such as changes in doctrines of legal liabilities and damage awards. These factors are not directly quantifiable, particularly on a prospective basis. The Company periodically reviews and updates its methods of making such unpaid claims reserve estimates and establishing the related liabilities based on our actual experience. The Company has not made any changes to its methodologies for determining unpaid claims reserves in the periods presented.
Member Benefit Claims
Member Benefit Claims represent claims paid on behalf of contract holders directly to third parties providers for roadside assistance and for the repair or replacement of covered products. Claims can also be paid directly to contract holders as a reimbursement payment provided supporting documentation of loss is submitted to the Company. Claims are recognized as expense when incurred.
Investments
Both fixed maturity securities and equity securities are classified as available-for-sale and carried at fair value with unrealized gains and losses reflected in other comprehensive income, net of tax. The cost of investments sold and any resulting gain or loss is based on the specific identification method and is recognized as of the trade date.
The Company conducts a quarterly review of all fixed maturity and equity securities with fair values less than their cost basis or amortized cost to determine if the decline in the fair value is other-than-temporary. In estimating other-than-temporary impairment ("OTTI") losses, the Company considers the following factors in assessing OTTI for fixed maturity and equity securities:
| • | the length of time and the extent to which fair value has been less than cost; |
| • | if an investment's fair value declines below cost, the Company determines if there is adequate evidence to overcome the presumption that the decline is other-than-temporary. Supporting evidence could include a recovery in the investment's fair value subsequent to the date of the statement of financial position, a return of the investee to profitability and the investee's improved financial performance and future prospects (such as earnings trends or recent dividend payments), or the improvement of financial condition and prospects for the investee's geographic region and industry; |
| • | issuer-specific considerations, including an event of missed or late payment or default, adverse changes in key financial ratios, an increase in nonperforming loans, a decline in earnings substantially below that of the investee's peers, downgrading of the investee's debt rating or suspension of trading in the security; |
| • | the occurrence of a significant economic event that may affect the industry in which an issuer participates, including a change that might adversely impact the investee's ability to achieve profitability in its operations; |
| • | the Company's intent and ability to hold the investment for a sufficient period to allow for any anticipated recovery in fair value; and |
| • | with regards to commercial mortgage-backed securities ("CMBS"), the Company also evaluates key statistics such as breakeven constant default rates and credit enhancement levels. The breakeven constant default rate indicates the percentage of the pool's outstanding loans that must default each and every year with 40 percent loss severity (i.e., a recovery rate of 60 percent) for a CMBS class/tranche to experience its first dollar of principal loss. Credit enhancements indicate how much protection, or "cushion," there is to absorb losses in a particular deal before an actual loss would impact a specific security. |
When, in the opinion of management, a decline in the estimated fair value of an investment is considered to be other-than-temporary or management intends to sell or is required to sell the investment prior to the recovery of cost, the investment is written down to its estimated fair value with the impairment loss included in net realized gains (losses) in the Consolidated Statements of Income. OTTI losses on equity securities and losses related to the credit component of the impairment on fixed maturity securities are recorded in the Consolidated Statements of Income as realized losses on investments and result in a permanent reduction of the cost basis of the underlying investment. Losses relating to the non-credit component of OTTI losses on fixed maturity securities are recorded in accumulated other comprehensive income (loss) ("AOCI") in the Consolidated Balance Sheets. The determination of
83
FORTEGRA FINANCIAL CORPORATION
NOTES TO CONSOLIDATED FINANCIAL STATEMENTS
(All Amounts in Thousands Except Share Amounts, Per Share Amounts or Unless Otherwise Noted)
OTTI is a subjective process, and different judgments and assumptions could affect the fair value determination and the timing of loss realization.
Short-term Investments
Short-term investments consist of certificates of deposits issued by federally insured depository institutions and normally have maturities of less than one year. At various times throughout the year, the Company may have certificates of deposits with financial institutions that exceed the Federal Deposit Insurance Corporation ("FDIC") insurance limit amount of $250,000.The Company had $0 and $0.1 million in certificates of deposit at December 31, 2012 and 2011, respectively, that exceeded the FDIC insurance limit of $250,000. Management reviews the financial viability of these financial institutions on a periodic basis and does not anticipate nonperformance by the financial institutions.
Cash and Cash Equivalents
Cash and cash equivalents consist primarily of highly liquid investments, with original maturities of three months or less when purchased. At various times throughout the year, the Company may have cash deposited with financial institutions that exceed the federally insured deposit amount. Management reviews the financial viability of these financial institutions on a periodic basis and does not anticipate nonperformance by the financial institutions. The Company had approximately $8.2 million and $9.0 million of cash in interest bearing money market accounts at December 31, 2012 and 2011, respectively, that exceeded the FDIC insurance limit of $250,000.
Restricted Cash
Restricted cash primarily represents unremitted premiums received from agents, unremitted claims received from insurers, fiduciary cash for reinsurers and pledged assets for the protection of policy holders in various state jurisdictions. Restricted cash is generally required to be kept in certain bank accounts subject to guidelines which emphasize capital preservation and liquidity; pursuant to the laws of certain states in which the Company's subsidiaries operate and applicable contractual obligations, such funds are not available to service the Company's debt or for other general corporate purposes. The Company is entitled to retain investment income earned on these fiduciary funds. None of the restricted cash was held in interest bearing money market accounts, subject to the FDIC insurance limit of $250,000, at December 31, 2012 and 2011, respectively.
Accounts and Premiums Receivable, Net
Accounts and premiums receivable are presented net of the allowance for doubtful accounts and consist primarily of advance commissions and agents' balances in course of collection and billed but not collected policy premium. For policy premiums that have been billed but not collected, the Company records a receivable on its balance sheet for the full amount of the premium billed, with a corresponding liability, net of its commission, to insurance carriers. The Company earns interest on the premium cash during the period of time between receipt of the funds and payment of these funds to insurance carriers. The Company maintains an allowance for doubtful accounts based on an estimate of uncollectible accounts. The allowance for doubtful accounts totaled $0.5 million and $0.2 million at December 31, 2012 and 2011, respectively,
Other Receivables
Other receivables primarily represent amounts due to the Company from its business partners for retrospective commissions and for motor club fees.
Reinsurance Receivables
The Company has various reinsurance agreements in place whereby the amount of risk in excess of the Company's retention is reinsured by unrelated domestic and foreign insurance companies. The Company remains liable to policyholders in the event that the assuming companies are unable to meet their obligations. Reinsurance receivables include amounts related to paid benefits, unpaid benefits and prepaid reinsurance premiums. Reinsurance receivables are based upon estimates and are reported on the Consolidated Balance Sheets separately as assets, as reinsurance does not relieve the Company of its legal liability to policyholders. The Company is required to pay losses even if a reinsurer fails to meet its obligations under the applicable reinsurance agreement. Management continually monitors the financial condition and agency ratings of the Company's reinsurers and believes that the reinsurance receivables accrued are collectible. Balances recoverable from reinsurers and amounts ceded to reinsurers relating to the unexpired portion of reinsured policies are presented as assets. Experience refunds from reinsurers are recognized based on the underwriting experience of the underlying contracts.
Deferred Acquisition Costs
Deferred Acquisition Costs - Insurance Related
The Company retrospectively adopted the new accounting standard ASU 2010-26, Accounting for Costs Associated with Acquiring or Renewing Insurance Contracts, on January 1, 2012. Please see the Note "Recent Accounting Standards," for more information on the adoption and impact to the Consolidated Balance Sheets, Consolidated Statements of Income and Consolidated Statement of Stockholders' Equity, for the retrospective adoption of this new accounting standard.
84
FORTEGRA FINANCIAL CORPORATION
NOTES TO CONSOLIDATED FINANCIAL STATEMENTS
(All Amounts in Thousands Except Share Amounts, Per Share Amounts or Unless Otherwise Noted)
The Company defers certain costs of acquiring new business and retaining existing business in accordance with the guidance in ASU 2010-26. These costs are limited to direct costs that resulted from successful contract transactions and would not have been incurred by the Company's insurance entities had the transactions not occurred. These capitalized costs are amortized as the related premium is earned. The following table shows the amortization of deferred acquisition costs for the Company's insurance subsidiaries:
| Years Ended December 31, | |||||||||||
| 2012 | 2011 | 2010 | |||||||||
| Total amortization of deferred acquisition costs - insurance related | $ | 61,042 | $ | 55,958 | $ | 57,300 | |||||
The Company evaluates whether deferred acquisition costs-insurance related are recoverable at year-end, and considers investment income in the recoverability analysis. As a result of the Company's evaluations, no write-offs for unrecoverable deferred acquisition costs were recognized during the years ending December 31, 2012, 2011 and 2010.
Deferred Acquisition Costs - Non-insurance Related
The Company defers certain costs of acquiring new business and retaining existing business in its Payment Protection Segment related to non-insurance subsidiary transactions. These costs are limited to direct costs, typically commissions and contract transaction fees, that resulted from successful contract transactions and would not have been incurred by the Company had the transactions not occurred. These capitalized costs are amortized as the related service and administrative fees are earned. The following table shows the amortization of deferred acquisition costs for the Company's non-insurance subsidiaries:
| Years Ended December 31, | |||||||||||
| 2012 | 2011 | 2010 | |||||||||
| Total amortization of deferred acquisition costs - non-insurance related | $ | 52,539 | $ | 57,358 | $ | 26,504 | |||||
The Company evaluates whether deferred acquisition costs - non-insurance related are recoverable at year-end. As a result of the Company's evaluations, no write-offs for unrecoverable deferred acquisition costs were recognized during the years ending December 31, 2012, 2011 and 2010.
Inventory
Inventory, which is included in other assets as a result of the 2012 acquisition of ProtectCELL, consists of cell phone handsets and totaled $1.4 million at December 31, 2012. All inventoried handsets are recorded at actual cost, using the specific identification method, with the exception of repaired devices received from a single supplier relationship, which are recorded using an average cost method. Damaged or obsolete inventory is adjusted out of inventory on a monthly basis and recorded as an expense for the period. Handsets that are either obsolete or beyond economical repair are sent to be recycled. Handsets that are refurbished are recorded into inventory at their repair costs.
Property and Equipment
Property and equipment is carried at cost, net of accumulated depreciation and amortization of capitalized software. Gains and losses on sales and disposals of property and equipment are based on the net book value of the related asset at the disposal date using the specific identification method with the corresponding gain or loss recorded to operations when incurred. Maintenance and repairs, which do not materially extend asset useful life and minor replacements, are charged to earnings when incurred. Depreciation expense is computed using the straight-line method over the estimated useful lives of the respective assets with three years for computers and five years for furniture, fixtures and equipment. Leasehold improvements are depreciated over the remaining life of the lease.
The Company leases certain equipment under a single capital lease. The assets and liabilities under the capital lease are recorded at the lower of the present value of the minimum lease payments or the fair value of the asset. The assets under the capital lease are depreciated over the remaining life of the lease or their estimated productive lives.
The Company also leases certain office space and equipment under operating leases. The Company evaluates the impact of rent escalation clauses, renewal options, lease incentives, including rent abatements included in its operating leases. Rent escalation clauses, renewal options and lease incentives are considered in determining total rent expense to be recognized during the term of the lease, which begins on the date the Company takes control of the leased space. Rent expense related to lease agreements which contain escalation clauses are recorded on a straight-line basis. Renewal options are considered by evaluating the overall term of the lease. In the event that the Company terminates a lease prior to the expiration, the agreed upon lease termination penalty is charged to expense with a corresponding liability recorded on the Consolidated Balance Sheet. The liability is adjusted for changes, if any, resulting from revisions to the termination amount after the cease-use date.
85
FORTEGRA FINANCIAL CORPORATION
NOTES TO CONSOLIDATED FINANCIAL STATEMENTS
(All Amounts in Thousands Except Share Amounts, Per Share Amounts or Unless Otherwise Noted)
Internally Developed Software
The Company capitalizes internally developed software costs on a project-by-project basis in accordance with ASC 350-40, Intangibles - Goodwill and Other: Internal-Use Software. All costs to establish the technological feasibility of computer software development are expensed to operations when incurred. Internally developed software development costs are carried at the lower of unamortized cost or net realizable value and are amortized based on the current and estimated useful life of the software. Amortization is computed using the straight-line method over the estimated useful life of 5 years and begins when the software is ready for its intended use.
Business Combinations and Purchase Price Adjustments
Business Combinations
The Company accounts for business combinations in accordance with ASC 805, Business Combinations, ("ASC 805"). These transactions are accounted for using the purchase method with the related net assets and results of operations being included in the Company’s Consolidated Financial Statements as of the respective acquisition date(s).
The assets acquired may consist of a book of business, management contracts, customer relationships, non-compete agreements, trade name, and the excess of purchase price over the fair value of identifiable net assets acquired, or goodwill (see Summary of Significant Accounting Policies, "Goodwill" for more information ). The determination of estimated useful lives and the allocation of the purchase price to the intangible assets requires significant judgment and affects the amount of future amortization and possible impairment charges.
In certain instances, the Company may acquire less than 100% ownership of an entity, resulting in the recording of a non-controlling interest. The non-controlling interest is initially established at a preliminary estimate of fair value and may be adjusted during the measurement period based upon the results of a valuation study applicable to the business combination. See "Purchase Price Adjustments" below for more information on measurement period adjustments.
Purchase Price Adjustments
The values of certain assets and liabilities acquired in acquisitions are preliminary in nature, and are subject to adjustment as additional information is obtained, including, but not limited to, valuation of separately identifiable intangibles, fixed assets, deferred taxes and deferred revenue. The valuations will be finalized within one year of the close of the acquisition. When the valuations are finalized, any changes to the preliminary valuation of assets acquired or liabilities assumed may result in adjustments to separately identifiable intangible assets and goodwill. A change to the acquisition date value of the identifiable net assets during the measurement period (up to one year from the acquisition date) affects the amount of the purchase price allocated to goodwill. Changes to the purchase price allocation are adjusted retrospectively in the Consolidated Financial Statements.
Goodwill
Goodwill represents the excess cost of an acquisition over the fair value of the net assets acquired in a business combination and is carried as an asset on the Consolidated Balance Sheets. The Company's goodwill is not amortized but is reviewed annually in the fourth quarter for impairment or more frequently if certain indicators arise. The Company's impairment testing is performed at the segment level. In 2011, the Company early adopted Accounting Standards Update ("ASU") 2011-08, Intangibles – Goodwill and Other (Topic 350): Testing Goodwill for Impairment. ASU 2011-08 allows for the goodwill impairment analysis to start with an assessment of qualitative factors to determine whether it is more likely than not that the fair value of a reporting unit is less than its carrying amount. If, after assessing the qualitative factors, management determines that it is more likely than not that the fair value of a reporting unit is less than its carrying amount, then the Company performs the two-part quantitative impairment test under Topic 350. If the carrying amount of the goodwill of the reporting unit exceeds the implied fair value, an impairment charge is recorded equal to the excess.
The goodwill impairment review is highly judgmental and involves the use of significant estimates and assumptions. The estimates and assumptions have a significant impact on the amount of any impairment charge recorded. Discounted cash flow methods are dependent upon assumption of future sales trends, market conditions and cash flows of each reporting unit over several years. Actual cash flows in the future may differ significantly from those previously forecasted. Other significant assumptions include growth rates and the discount rate applicable to future cash flows.
The Company completed its annual assessment of goodwill for the years December 31, 2012, and 2011 in December of each respective year and concluded that the value of its goodwill was not impaired as of December 31, 2012 and 2011, respectively.
Other Intangible Assets
The Company has acquired significant other intangible assets through business acquisitions. The Company's other intangible assets consist of finite-lived intangibles, including customer related and contract based assets representing primarily client lists and non−compete arrangements and acquired software while the Company's indefinite-lived intangible assets consist of trademarks. Finite-
86
FORTEGRA FINANCIAL CORPORATION
NOTES TO CONSOLIDATED FINANCIAL STATEMENTS
(All Amounts in Thousands Except Share Amounts, Per Share Amounts or Unless Otherwise Noted)
lived Intangible assets are amortized over periods ranging from 1 to 15 years. Trademarks are not amortized since these assets have been determined to have indefinite useful lives. The costs to periodically renew other intangible assets are expensed as incurred. Intangible assets are tested for impairment at least annually, or whenever events or circumstances indicate that their carrying amount may not be recoverable using an analysis of expected future cash flows.
Unpaid Claims
Unpaid claims include estimates for losses reported prior to the close of the accounting period and other estimates, including amounts for incurred but not reported claims. These liabilities are continuously reviewed and updated by management. Management believes that such liabilities are adequate to cover the estimated cost of the related claims. When management determines that changes in estimates are required, such changes are included in current operations.
The liability for unpaid claims includes estimates of the ultimate cost of known claims plus supplemental reserves calculated based upon loss projections utilizing certain actuarial assumptions and historical and industry data. In establishing its liability for unpaid claims, the Company utilizes the findings of actuaries.
Considerable uncertainty and variability are inherent in such estimates, and accordingly, the subsequent development of these reserves may not conform to the assumptions inherent in the determination. Management believes that the amounts recorded as the liability for policy and claim liabilities represent its best estimate of such amounts. However, actual loss experience may not conform to the assumptions used in determining the estimated amounts for such liability at the balance sheet date. Accordingly, such ultimate amounts could be significantly in excess of or less than the amounts indicated in the consolidated financial statements. As adjustments to these estimates become necessary, such adjustments are reflected in the Consolidated Statements of Income.
Unearned Premiums
Premiums written are earned over the life of the respective policy using the Rule of 78's, pro rata, or other actuarial method as appropriate for the type of business. Unearned premiums represent the portion of premiums that will be earned in the future. A premium deficiency reserve is recorded if anticipated losses, loss adjustment expenses, deferred acquisition costs and policy maintenance costs exceed the recorded unearned premium reserve and anticipated investment income. As of December 31, 2012, and 2011, no deficiency reserve was recorded.
Policyholder Account Balances
Policyholder account balances relate to investment-type individual annuity contracts in the accumulation phase. Policyholder account balances are carried at accumulated account values, which consist of deposits received, plus interest credited, less withdrawals and assessments. Minimum guaranteed interest credited to these contracts ranges from 3.0% to 4.0%.
Commissions
Commissions include the commissions paid to distributors selling credit insurance policies, motor club memberships, and warranty service contracts. Credit insurance commission rates, in many instances, are set by state regulators and are also impacted by market conditions. In certain instances, credit insurance commissions are subject to retrospective adjustment based on the profitability of the related policies. Under these retrospective commission arrangements, the producer of the credit insurance policies receives a retrospective commission if the premium generated by that producer in the accounting period exceeds the costs associated with those policies, which includes the Company's administrative fees, claims, reserves, and premium taxes. The Company analyzes the retrospective commission calculation on a monthly basis for each producer and, based on the analysis associated with each such producer, the Company records a liability for any positive net retrospective commission earned and due to the producer or, conversely, records a receivable amount due from such producer for instances where the net result of the retrospective commission calculation is negative.
The settlement of net positive retrospective commission with the producer in a subsequent period (usually the following month), is made through a cash payment to the producer. If the net result is negative, the Company offsets the receivable amount due from the producer by:
| • | reducing future retrospective commissions earned and payable against the receivable amount due from the producer; |
| • | reducing the producer's up-front commission associated with current period written premium production, which is credited against the receivable amount due from the producer; or |
| • | invoicing the producer for an amount equal to the amount due to the Company. |
The Company reviews, on a regular basis, all instances where the retrospective result is a net negative amount (receivable due from the producer) to determine the action to be implemented with respect to such producer in order to collect any receivable amount.
Deferred Revenues
Deferred revenues represent the portion of income that will be earned in the future attributable to motor club memberships, mobile device protection plans, and other non-insurance service contracts that are earned over the respective contract periods using Rule of
87
FORTEGRA FINANCIAL CORPORATION
NOTES TO CONSOLIDATED FINANCIAL STATEMENTS
(All Amounts in Thousands Except Share Amounts, Per Share Amounts or Unless Otherwise Noted)
78's, modified Rule of 78's, pro rata, or other methods as appropriate for the contract. A deficiency reserve would be recorded if anticipated contract benefits, deferred acquisition costs and contract service costs exceed the recorded deferred revenues and anticipated investment income. As of December 31, 2012, and 2011, no deficiency reserve was recorded.
Derivative Financial Instruments
Cash Flow Hedge
The Company uses interest rate swaps as part of its risk management strategy to manage interest rate risk and cash flow risk that may arise in connection with the variable interest rate provision of the Company's preferred trust securities. The Company accounts for its derivative financial instruments in accordance with ASC 815, Derivatives and Hedging, which requires all derivative instruments to be carried at fair value on the balance sheet.
Changes in fair value associated with the effective portion of a derivative instrument designated as a qualifying cash flow hedge are recognized initially in other comprehensive income (loss). When the cash flows for which the derivative is hedging materialize and are recorded in income or expense, the associated gain or (loss) from the hedging derivative previously recorded in AOCI is recognized in earnings. If a cash flow hedge is de-designated because it is no longer highly effective, or if the hedge relationship is terminated, the cumulative gain or loss on the hedging derivative to that date will continue to be reported in AOCI unless the hedged forecasted transaction is no longer expected to occur, at which time the cumulative gain or loss is recorded into earnings.
The Company records the fair value of the derivative instrument in other assets or other liabilities. To the extent a derivative is an effective hedge of the cash flow risk of the hedged debt obligation, any change in the derivative's fair value is recorded in AOCI, net of income tax. To the extent the derivative is an ineffective hedge, that portion of the change in fair value is recorded in other operating expenses or interest expense as appropriate. The Company is not a party to leveraged derivatives and does not enter into derivative financial instruments for trading or speculative purposes.
Income Taxes
Under Internal Revenue Code Section 1501, the Company files a consolidated federal income tax return with its affiliates which are at least 80% owned by the group. The Company has a tax sharing agreement with its subsidiaries where each company is apportioned the amount of tax equal to that which would be reported on a separate company basis. The components of other comprehensive income or loss included on the Consolidated Statements of Comprehensive Income and on the Consolidated Statements of Stockholders' Equity have been computed based upon the 35% federal tax rate.
Income taxes are accounted for under the asset and liability method. Under this method, deferred tax assets and liabilities are recognized for the estimated future tax consequences attributable to differences between the financial statement carrying amounts of existing assets and liabilities and their respective tax bases, and operating loss and tax credit carryforwards. Deferred tax assets and liabilities are measured using enacted tax rates in effect for the year in which those temporary differences are expected to be recovered or settled. The effect on deferred tax assets and liabilities of a change in tax rates is recognized in the consolidated statements of income in the period that includes the enactment date. A valuation allowance is recorded to reduce the carrying amounts of deferred tax assets if it is more likely than not that such assets will not be realized.
ASC subtopic 740-10, Income Taxes—Overall ("ASC 740-10") prescribes a comprehensive model for the financial statement recognition, measurement, classification, and disclosure of uncertain tax positions. ASC 740-10 contains a two-step approach to recognizing and measuring uncertain tax positions. The first step is to evaluate the tax position for recognition by determining if the weight of available evidence indicates that it is more likely than not that the position will be sustained on audit, based on the technical merits of the position. The second step is to measure the tax benefit as the largest amount that is more than 50% likely of being realized upon settlement. The Company accounts for penalties and interest related to uncertain tax positions as part of its provision for federal and state income taxes.
Stock-Based Compensation
Stock Options and Restricted Stock Awards
The Company accounts for stock-based compensation in accordance with FASB Topic ASC 718, Compensation—Stock Compensation ("ASC 718"), which addresses accounting for stock-based awards, including stock options and restricted stock. The Company has stock options outstanding under its 2005 Equity Incentive Plan (the "2005 Plan") and time- and performance-based stock options and restricted stock awards outstanding under The 2010 Omnibus Incentive Plan (the "2010 Plan"). Time-based stock options and restricted stock awards are grants that vest based on the passage of time; whereas, performance-based stock options and restricted stock awards are grants that vest based on the Company attaining certain financial metrics.
Under ASC 718, compensation expense is measured using fair value and is recorded over the requisite service or performance period of the awards, or to an employee’s eligible retirement date under the award agreement, if earlier. The Company measures stock-based compensation expense using the calculated value method. Under this method, the Company estimates the fair value of each
88
FORTEGRA FINANCIAL CORPORATION
NOTES TO CONSOLIDATED FINANCIAL STATEMENTS
(All Amounts in Thousands Except Share Amounts, Per Share Amounts or Unless Otherwise Noted)
stock option on the grant date using the Black-Scholes valuation model. The Company uses historical data to estimate expected employee behavior related to stock award exercises and forfeitures. Since there is not sufficient historical market experience for shares of the Company's stock, the Company has chosen to estimate volatility, by using the average volatility of a selected peer group of publicly traded companies operating in the same industry. Expected dividends are based on the assumption that no dividends were expected to be distributed in the near future. The risk-free rate is based on the U.S. Treasury yield curve in effect at the time of grant for periods corresponding with the expected life of the options. The fair value of restricted stock awards is based on the market price of Fortegra's common stock at the grant date. The Company typically recognizes stock-based compensation expense for time-based awards on a straight-line basis over the requisite service period and on a graded vesting attribution model for performance-based awards. Stock-based compensation expense for time- and performance-based stock options and restricted stock awards for employee grants is recognized in personnel costs, while expense for restricted stock awards to directors is included in other operating expenses on the Consolidated Statements of Income. The related income tax expense (benefit) on stock-based compensation is recognized in income tax expense on the Consolidated Statements of Income. The Company's current policy is to issue new shares upon the exercise of stock options.
Earnings Per Share
Basic earnings per share is computed by dividing net income available to common stockholders by the weighted average number of common shares outstanding for the period. Diluted earnings per share is computed by dividing net income available to common stockholders by the weighted average number of common shares outstanding adjusted to include the effect of potentially dilutive common shares, which includes outstanding stock options and non-vested restricted stock awards, using the treasury stock method. Common shares that are considered anti-dilutive are excluded from the computation of diluted earnings per share.
Treasury Stock
All repurchased common shares are recorded as treasury stock and are accounted for under the cost method.
Variable Interest Entities
The Company's investments in less than majority-owned companies in which it has the ability to exercise significant influence over operating and financial policies are accounted for using the equity method except when they qualify as Variable Interest Entities ("VIEs") and the Company is the primary beneficiary, in which case the investments are consolidated in accordance with ASC 810, "Consolidation." Investments that do not meet the above criteria are accounted for under the cost method.
Advertising and Promotion
Advertising and promotional costs are expensed as incurred. Advertising expense for the following periods is presented below:
| Years Ended December 31, | |||||||||||
| 2012 | 2011 | 2010 | |||||||||
| Advertising expense | $ | 1,624 | $ | 583 | $ | 367 | |||||
3. Restatement of the Consolidated Financial Statements
The Company has restated its previously issued Consolidated Balance Sheets, Consolidated Statements of Income and Consolidated Statements of Cash Flows as of and for the years ended December 31, 2011 and 2010, to correct for an error in the presentation of revenue and expense for the Motor Clubs division within the Payment Protection Segment, and errors in accounting as discussed in further detail below.
The effects of these restatements to the Consolidated Statements of Income, Consolidated Balance Sheets, and Consolidated Statements of Cash Flows as of and for the years ended December 31, 2011 and 2010 are presented in the financial statement schedules below, by line item. Also shown in the schedules below are the effects of the Company's retrospective adoption of ASU 2010-26, Accounting for Costs Associated with Acquiring or Renewing Insurance Contracts, because these effects, which are not corrections of errors, are part of the reconciliation from previously reported information to restated amounts.
The Notes "Segment Results," "Quarterly Information - Restated (Unaudited)," and "Quarterly Segment Results - Restated (Unaudited)" disclose the material effects of these restatements by segment, by quarter, and by segment by quarter, respectively.
Correction of Prior Period Errors - Motor Clubs division
During 2010 the Company acquired Continental and United, which began the Company's Motor Clubs division. In 2010 and subsequent reporting periods, the Motor Clubs revenues were presented on a net basis in service and administrative fees on the Consolidated Statements of Income. This net presentation consisted of service and administration fees less member benefit claims expense and commission expense. During 2011, the acquisition of Auto Knight increased the revenues of the Company's Motor Clubs division.
89
FORTEGRA FINANCIAL CORPORATION
NOTES TO CONSOLIDATED FINANCIAL STATEMENTS
(All Amounts in Thousands Except Share Amounts, Per Share Amounts or Unless Otherwise Noted)
Due to the increased growth in and significance of this division to the Company and the Payment Protection segment, the Company reviewed its revenue presentation for service and administrative fees generated by the Motor Clubs division during the fourth quarter of 2012. The Company performed this analysis based on the guidance in ASC 605, Revenue Recognition, to determine the proper presentation of revenues for the Motor Clubs division. Based on its analysis, the Company determined that presentation of gross revenue and expense is most appropriate because the Company was and is the principal in transactions with motor club members, and was and is responsible for future claims and services to be provided to those members.
Thus, the service and administrative fees revenues generated by the Motor Clubs division have been restated to present them on a gross basis with the corresponding gross amounts of member benefit claims and commissions expenses restated in the Consolidated Statements of Income.
The effect of this correction had no impact on net income, basic or diluted earnings per share amounts, balance sheet values, or net cash provided by operating activities.
Concurrent with its review of Motor Clubs revenue presentation, the Company also reviewed its method of Motor Clubs revenue recognition and identified errors in revenue recognition for some of its product lines for the year ended December 31, 2011 and for the nine months ended September 30, 2012, and associated errors in purchase accounting related to deferred revenues and deferred acquisition costs on these products. Management evaluated the materiality of the errors from qualitative and quantitative perspectives and concluded that the errors were immaterial to the periods affected. The immaterial purchase accounting impacts, included in final purchase accounting amounts disclosed in Note "Business Combinations," were increases in deferred revenue liability of $0.7 million, deferred acquisition costs of $0.1 million, and goodwill of $0.4 million, and a decrease in deferred tax liabilities of $0.3 million. For the year ended December 31, 2011, this immaterial correction reduced retained earnings by $0.5 million. In this Form 10-K, the Consolidated Statement of Income, Consolidated Balance Sheet, and Consolidated Statement of Cash Flows as of and for the year ended December 31, 2011 have been restated to reflect the immaterial corrections.
For the nine months ended September 30, 2012, this immaterial correction reduced retained earnings by $0.2 million. The effects of these restatements to the first three quarters of 2012 are included in the Consolidated Statement of Income, Consolidated Balance Sheet, and Consolidated Statement of Cash Flows as of and for the year ended December 31, 2012.
Immaterial Correction of Prior Period Errors - Purchase Accounting Adjustments
As reported in the Company's Quarterly Report on Form 10-Q ("Form 10-Q") for September 30, 2012, during the third quarter 2012 the Company identified errors related to the purchase accounting adjustments for the 2011 acquisition of Auto Knight and the April 2009 acquisition of B&G. As a result, the Company's historical balances for goodwill, property and equipment and deferred taxes were incorrectly reported in prior period filings for the years ended December 31, 2011, 2010 and 2009, respectively. Management evaluated the materiality of the errors from qualitative and quantitative perspectives and concluded that the errors were immaterial to each of the prior periods noted above.
As a result, in this Form 10-K, the Consolidated Balance Sheet data as of December 31, 2011 has been revised to reflect the correction of the error associated with the Auto Knight acquisition, as previously disclosed in the Form 10-Q for the period ended September 30, 2012. This correction, included in final purchase accounting amounts disclosed in Note "Business Combinations" increased goodwill by $0.6 million and increased deferred income tax liabilities by $0.6 million. See the Note, "Goodwill" for more information on this correction. The effect of this correction had no impact on net income, basic or diluted earnings per share amounts, or stockholders' equity.
Further, the Consolidated Balance Sheet data as of December 31, 2009, 2010, and 2011 have been revised to reflect the immaterial correction of the error associated with the B&G acquisition occurring during the year ended December 31, 2009, as previously disclosed in the Company's Form 10-Q for the period ended September 30, 2012. This correction increased goodwill by $0.4 million, decreased deferred income tax liabilities by $0.3 million and decreased other assets by $0.7 million.
Immaterial Correction of Prior Period Error - Cash Flows
The Company identified an error in the Consolidated Statement of Cash Flows for the year ended December 31, 2011 caused primarily by the reporting of certain changes in deferred income taxes as operating rather than investing activities. Management evaluated the materiality of the error from qualitative and quantitative perspectives and concluded that the error was immaterial to the statement. The correction is reflected in the schedule below, and had no effect on other statements.
Retrospective adoption of ASU 2010-26, Accounting for Costs Associated with Acquiring or Renewing Insurance Contracts
As more fully disclosed in Note "Recent Accounting Standards," the Company adopted ASU 2010-26, Accounting for the Costs Associated with Acquiring or Renewing Insurance Contracts, on a retrospective basis as permitted. This is not a correction of an error. However, in order to show all the effects of adjustments and restatements to the prior period financial statements in one set of schedules, the effects of this retrospective adoption are displayed in the schedules below.
90
FORTEGRA FINANCIAL CORPORATION
NOTES TO CONSOLIDATED FINANCIAL STATEMENTS
(All Amounts in Thousands Except Share Amounts, Per Share Amounts or Unless Otherwise Noted)
The following tables present our restated Consolidated Statements of Income, Consolidated Balance Sheets and Consolidated Statements of Cash Flows for the years ended December 31, 2011 and 2010, respectively.
| Consolidated Statement of Income | ||||||||||||
| For the Year Ended | ||||||||||||
| December 31, 2011 | ||||||||||||
| As Previously Reported | Effect of the Restatement- Motor Clubs | Adoption of ASU 2010-26 | As Restated | |||||||||
| Revenues: | ||||||||||||
| Service and administrative fees | $ | 38,200 | $ | 56,264 | $ | — | $ | 94,464 | ||||
| Brokerage commissions and fees | 34,396 | — | — | 34,396 | ||||||||
| Ceding commission | 29,495 | — | — | 29,495 | ||||||||
| Net investment income | 3,368 | — | — | 3,368 | ||||||||
| Net realized investment gains | 4,193 | — | — | 4,193 | ||||||||
| Net earned premium | 115,503 | — | — | 115,503 | ||||||||
| Other income | 170 | — | — | 170 | ||||||||
| Total revenues | 225,325 | 56,264 | — | 281,589 | ||||||||
| Expenses: | ||||||||||||
| Net losses and loss adjustment expenses | 37,949 | — | — | 37,949 | ||||||||
| Member benefit claims | — | 4,409 | — | 4,409 | ||||||||
| Commissions | 74,231 | 52,687 | — | 126,918 | ||||||||
| Personnel costs | 44,547 | — | — | 44,547 | ||||||||
| Other operating expenses | 30,362 | — | 778 | 31,140 | ||||||||
| Depreciation and amortization | 3,077 | — | — | 3,077 | ||||||||
| Amortization of intangibles | 4,952 | — | — | 4,952 | ||||||||
| Interest expense | 7,641 | — | — | 7,641 | ||||||||
| Loss on sale of subsidiary | 477 | — | — | 477 | ||||||||
| Total expenses | 203,236 | 57,096 | 778 | 261,110 | ||||||||
| Income before income taxes and non-controlling interests | 22,089 | (832 | ) | (778 | ) | 20,479 | ||||||
| Income taxes | 7,745 | (333 | ) | (272 | ) | 7,140 | ||||||
| Income before non-controlling interests | 14,344 | (499 | ) | (506 | ) | 13,339 | ||||||
| Less: net (loss) attributable to non-controlling interests | (170 | ) | — | — | (170 | ) | ||||||
| Net income | $ | 14,514 | $ | (499 | ) | $ | (506 | ) | $ | 13,509 | ||
| Earnings per share: | ||||||||||||
| Basic | $ | 0.71 | $ | (0.02 | ) | $ | (0.03 | ) | $ | 0.66 | ||
| Diluted | $ | 0.68 | $ | (0.02 | ) | $ | (0.02 | ) | $ | 0.64 | ||
| Weighted average common shares outstanding: | ||||||||||||
| Basic | 20,352,027 | 20,352,027 | ||||||||||
| Diluted | 21,265,801 | 21,265,801 | ||||||||||
91
FORTEGRA FINANCIAL CORPORATION
NOTES TO CONSOLIDATED FINANCIAL STATEMENTS
(All Amounts in Thousands Except Share Amounts, Per Share Amounts or Unless Otherwise Noted)
| Consolidated Statement of Income | ||||||||||||
| For the Year Ended | ||||||||||||
| December 31, 2010 | ||||||||||||
| As Previously Reported | Effect of the Restatement- Motor Clubs | Adoption of ASU 2010-26 | As Restated | |||||||||
| Revenues: | ||||||||||||
| Service and administrative fees | $ | 34,145 | $ | 22,109 | $ | — | $ | 56,254 | ||||
| Brokerage commissions and fees | 24,620 | — | — | 24,620 | ||||||||
| Ceding commission | 28,767 | — | — | 28,767 | ||||||||
| Net investment income | 4,073 | — | — | 4,073 | ||||||||
| Net realized investment gains | 650 | — | — | 650 | ||||||||
| Net earned premium | 111,805 | — | — | 111,805 | ||||||||
| Other income | 230 | — | — | 230 | ||||||||
| Total revenues | 204,290 | 22,109 | — | 226,399 | ||||||||
| Expenses: | ||||||||||||
| Net losses and loss adjustment expenses | 36,035 | — | — | 36,035 | ||||||||
| Member benefit claims | — | 466 | — | 466 | ||||||||
| Commissions | 71,003 | 21,643 | — | 92,646 | ||||||||
| Personnel costs | 36,361 | — | — | 36,361 | ||||||||
| Other operating expenses | 22,873 | — | 1,553 | 24,426 | ||||||||
| Depreciation and amortization | 1,396 | — | — | 1,396 | ||||||||
| Amortization of intangibles | 3,232 | — | — | 3,232 | ||||||||
| Interest expense | 8,464 | — | — | 8,464 | ||||||||
| Total expenses | 179,364 | 22,109 | 1,553 | 203,026 | ||||||||
| Income before income taxes and non-controlling interests | 24,926 | — | (1,553 | ) | 23,373 | |||||||
| Income taxes | 8,703 | — | (544 | ) | 8,159 | |||||||
| Income before non-controlling interests | 16,223 | — | (1,009 | ) | 15,214 | |||||||
| Less: net income attributable to non-controlling interests | 20 | — | — | 20 | ||||||||
| Net income | $ | 16,203 | $ | — | $ | (1,009 | ) | $ | 15,194 | |||
| Earnings per share: | ||||||||||||
| Basic | $ | 1.02 | $ | — | $ | (0.07 | ) | $ | 0.95 | |||
| Diluted | $ | 0.94 | $ | — | $ | (0.06 | ) | $ | 0.88 | |||
| Weighted average common shares outstanding: | ||||||||||||
| Basic | 15,929,181 | 15,929,181 | ||||||||||
| Diluted | 17,220,029 | 17,220,029 | ||||||||||
92
FORTEGRA FINANCIAL CORPORATION
NOTES TO CONSOLIDATED FINANCIAL STATEMENTS
(All Amounts in Thousands Except Share Amounts, Per Share Amounts or Unless Otherwise Noted)
| Consolidated Balance Sheet | ||||||||||||
| For the Year Ended | ||||||||||||
| December 31, 2011 | ||||||||||||
As Previously Reported (1) | Effect of the Restatement | Adoption of ASU 2010-26 | As Restated | |||||||||
| Assets: | ||||||||||||
| Investments: | ||||||||||||
| Fixed maturity securities available-for-sale | $ | 93,509 | $ | — | $ | — | $ | 93,509 | ||||
| Equity securities available-for-sale | 1,219 | — | — | 1,219 | ||||||||
| Short-term investments | 1,070 | — | — | 1,070 | ||||||||
| Total investments | 95,798 | — | — | 95,798 | ||||||||
| Cash and cash equivalents | 31,339 | — | — | 31,339 | ||||||||
| Restricted cash | 14,180 | — | — | 14,180 | ||||||||
| Accrued investment income | 929 | — | — | 929 | ||||||||
| Notes receivable, net | 3,603 | — | — | 3,603 | ||||||||
| Accounts and premiums receivable, net | 19,690 | — | — | 19,690 | ||||||||
| Other receivables | 9,465 | — | — | 9,465 | ||||||||
| Reinsurance receivables | 194,740 | — | — | 194,740 | ||||||||
| Deferred acquisition costs | 62,755 | 93 | (7,220 | ) | 55,628 | |||||||
| Property and equipment, net | 15,314 | — | — | 15,314 | ||||||||
| Goodwill | 104,888 | — | — | 104,888 | ||||||||
| Other intangible assets, net | 54,410 | — | — | 54,410 | ||||||||
| Other assets | 5,294 | 75 | — | 5,369 | ||||||||
| Total assets | $ | 612,405 | $ | 168 | $ | (7,220 | ) | $ | 605,353 | |||
| Liabilities: | ||||||||||||
| Unpaid claims | $ | 32,583 | $ | — | $ | — | 32,583 | |||||
| Unearned premiums | 227,929 | — | — | 227,929 | ||||||||
| Policyholder account balances | 28,040 | — | — | 28,040 | ||||||||
| Accrued expenses, accounts payable and other liabilities | 33,982 | — | — | 33,982 | ||||||||
| Income taxes payable | 1,344 | — | — | 1,344 | ||||||||
| Deferred revenue | 21,495 | 925 | — | 22,420 | ||||||||
| Note payable | 73,000 | — | — | 73,000 | ||||||||
| Preferred trust securities | 35,000 | — | — | 35,000 | ||||||||
| Deferred income taxes, net | 26,754 | (258 | ) | (2,527 | ) | 23,969 | ||||||
| Total liabilities | 480,127 | 667 | (2,527 | ) | 478,267 | |||||||
| Stockholders' Equity: | ||||||||||||
| Preferred stock | — | — | — | — | ||||||||
| Common stock | 206 | — | — | 206 | ||||||||
| Treasury stock, at cost | (2,728 | ) | — | — | (2,728 | ) | ||||||
| Additional paid-in capital | 96,199 | — | — | 96,199 | ||||||||
| Accumulated other comprehensive loss, net of tax | (1,754 | ) | — | — | (1,754 | ) | ||||||
| Retained earnings | 39,823 | (499 | ) | (4,672 | ) | 34,652 | ||||||
| Stockholders' equity before non-controlling interests | 131,746 | (499 | ) | (4,672 | ) | 126,575 | ||||||
| Non-controlling interests | 532 | — | (21 | ) | 511 | |||||||
| Total stockholders' equity | 132,278 | (499 | ) | (4,693 | ) | 127,086 | ||||||
| Total liabilities and stockholders' equity | $ | 612,405 | $ | 168 | $ | (7,220 | ) | $ | 605,353 | |||
(1) - Includes the business acquisition valuation measurement period adjustments presented in the Notes, "Business Combinations," "Goodwill," and "Other Intangible Assets."
93
FORTEGRA FINANCIAL CORPORATION
NOTES TO CONSOLIDATED FINANCIAL STATEMENTS
(All Amounts in Thousands Except Share Amounts, Per Share Amounts or Unless Otherwise Noted)
| Consolidated Balance Sheet | |||||||||
| For the Year Ended | |||||||||
| December 31, 2010 | |||||||||
| As Previously Reported | Adoption of ASU 2010-26 | As Restated | |||||||
| Assets: | |||||||||
| Investments: | |||||||||
| Fixed maturity securities available-for-sale | $ | 85,786 | $ | — | $ | 85,786 | |||
| Equity securities available-for-sale | 1,935 | — | 1,935 | ||||||
| Short-term investments | 1,170 | — | 1,170 | ||||||
| Total investments | 88,891 | — | 88,891 | ||||||
| Cash and cash equivalents | 43,389 | — | 43,389 | ||||||
| Restricted cash | 15,722 | — | 15,722 | ||||||
| Accrued investment income | 880 | — | 880 | ||||||
| Notes receivable, net | 1,485 | — | 1,485 | ||||||
| Accounts and premiums receivable, net | 17,023 | — | 17,023 | ||||||
| Other receivables | 7,632 | — | 7,632 | ||||||
| Reinsurance receivables | 169,382 | — | 169,382 | ||||||
| Deferred acquisition costs | 65,142 | (6,442 | ) | 58,700 | |||||
| Property and equipment, net | 11,996 | — | 11,996 | ||||||
| Goodwill | 74,430 | — | 74,430 | ||||||
| Other intangible assets, net | 39,997 | — | 39,997 | ||||||
| Income taxes receivable | 818 | — | 818 | ||||||
| Other assets | 4,857 | — | 4,857 | ||||||
| Total assets | $ | 541,644 | $ | (6,442 | ) | $ | 535,202 | ||
| Liabilities: | |||||||||
| Unpaid claims | $ | 32,693 | $ | — | 32,693 | ||||
| Unearned premiums | 210,430 | — | 210,430 | ||||||
| Accrued expenses, accounts payable and other liabilities | 41,579 | — | 41,579 | ||||||
| Income taxes payable | 25,611 | — | 25,611 | ||||||
| Deferred revenue | 36,713 | — | 36,713 | ||||||
| Note payable | 35,000 | — | 35,000 | ||||||
| Preferred trust securities | 11,040 | — | 11,040 | ||||||
| Deferred income taxes, net | 24,691 | (2,255 | ) | 22,436 | |||||
| Total liabilities | 417,757 | (2,255 | ) | 415,502 | |||||
| Stockholders' Equity: | |||||||||
| Preferred stock | — | — | — | ||||||
| Common stock | 203 | — | 203 | ||||||
| Treasury stock, at cost | (176 | ) | — | (176 | ) | ||||
| Additional paid-in capital | 95,556 | — | 95,556 | ||||||
| Accumulated other comprehensive loss, net of tax | 2,293 | — | 2,293 | ||||||
| Retained earnings | 25,308 | (4,166 | ) | 21,142 | |||||
| Stockholders' equity before non-controlling interests | 123,184 | (4,166 | ) | 119,018 | |||||
| Non-controlling interests | 703 | (21 | ) | 682 | |||||
| Total stockholders' equity | 123,887 | (4,187 | ) | 119,700 | |||||
| Total liabilities and stockholders' equity | $ | 541,644 | $ | (6,442 | ) | $ | 535,202 | ||
94
FORTEGRA FINANCIAL CORPORATION
NOTES TO CONSOLIDATED FINANCIAL STATEMENTS
(All Amounts in Thousands Except Share Amounts, Per Share Amounts or Unless Otherwise Noted)
| Consolidated Statement of Cash Flows | |||||||||||||||
| For the Year Ended | |||||||||||||||
| December 31, 2011 | |||||||||||||||
| Operating Activities | As Previously Reported | Immaterial Correction of Prior Period Error | Effect of the Restatement- Motor Clubs | Adoption of ASU 2010-26 | As Restated | ||||||||||
| Net income | $ | 14,514 | $ | — | $ | (499 | ) | $ | (506 | ) | $ | 13,509 | |||
| Adjustments to reconcile net income to net cash flows provided by operating activities: | |||||||||||||||
| Change in deferred acquisition costs | 3,223 | — | (93 | ) | 778 | 3,908 | |||||||||
| Depreciation and amortization | 8,029 | — | — | — | 8,029 | ||||||||||
| Deferred income tax expense | 3,397 | (1,071 | ) | (333 | ) | (272 | ) | 1,721 | |||||||
| Net realized investment (gains) losses | (4,193 | ) | — | — | — | (4,193 | ) | ||||||||
| Loss on sale of subsidiary | 477 | — | — | — | 477 | ||||||||||
| Stock-based compensation expense | 763 | — | — | — | 763 | ||||||||||
| Amortization of premiums and accretion of discounts on investments | 609 | — | — | — | 609 | ||||||||||
| Non-controlling interests | (170 | ) | — | — | — | (170 | ) | ||||||||
| Change in allowance for doubtful accounts | (31 | ) | — | — | — | (31 | ) | ||||||||
| Changes in operating assets and liabilities, net of the effects of acquisitions and dispositions: | |||||||||||||||
| Accrued investment income | (16 | ) | — | — | — | (16 | ) | ||||||||
| Accounts and premiums receivable, net | (898 | ) | — | — | — | (898 | ) | ||||||||
| Other receivables | (1,430 | ) | (339 | ) | — | — | (1,769 | ) | |||||||
| Reinsurance receivables | (5,181 | ) | — | — | — | (5,181 | ) | ||||||||
| Income taxes receivable | 818 | — | — | — | 818 | ||||||||||
| Other assets | (389 | ) | — | — | — | (389 | ) | ||||||||
| Unpaid claims | (315 | ) | — | — | — | (315 | ) | ||||||||
| Unearned premiums | 14,373 | — | — | — | 14,373 | ||||||||||
| Policyholder account balances | (45 | ) | — | — | — | (45 | ) | ||||||||
| Accrued expenses, accounts payable and other liabilities | (14,909 | ) | — | — | — | (14,909 | ) | ||||||||
| Income taxes payable | 1,344 | — | — | — | 1,344 | ||||||||||
| Deferred revenue | (7,394 | ) | — | 925 | — | (6,469 | ) | ||||||||
| Net cash flows provided by operating activities | 12,576 | (1,410 | ) | — | — | 11,166 | |||||||||
| Investing activities | |||||||||||||||
| Proceeds from maturities, calls and prepayments of available-for-sale investments | 9,691 | — | — | — | 9,691 | ||||||||||
| Proceeds from sales of available-for-sale investments | 62,300 | — | — | — | 62,300 | ||||||||||
| Net change in short-term investments | 100 | — | — | — | 100 | ||||||||||
| Purchases of available-for-sale investments | (63,557 | ) | 1,410 | — | — | (62,147 | ) | ||||||||
| Purchases of property and equipment | (6,280 | ) | — | — | — | (6,280 | ) | ||||||||
| Net paid for acquisitions of subsidiaries, net of cash received | (49,873 | ) | — | — | — | (49,873 | ) | ||||||||
| Sale of subsidiary, net of cash paid | (153 | ) | — | — | — | (153 | ) | ||||||||
| Net (issuance) proceeds from notes receivable | (975 | ) | — | — | — | (975 | ) | ||||||||
| Change in restricted cash, net of restricted cash received from acquisitions | 1,542 | — | — | — | 1,542 | ||||||||||
| Net cash flows used in investing activities | (47,205 | ) | 1,410 | — | — | (45,795 | ) | ||||||||
| Financing activities | |||||||||||||||
| Payments on notes payable | (74,263 | ) | — | — | — | (74,263 | ) | ||||||||
| Proceeds from notes payable | 110,550 | — | — | — | 110,550 | ||||||||||
| Payments for initial public offering costs | (826 | ) | — | — | — | (826 | ) | ||||||||
| Payments on redeemable preferred stock | (11,040 | ) | — | — | — | (11,040 | ) | ||||||||
| Net proceeds from exercise of stock options | 607 | — | — | — | 607 | ||||||||||
| Excess tax benefits from stock-based compensation | 45 | — | — | — | 45 | ||||||||||
| Purchase of treasury stock | (2,552 | ) | — | — | — | (2,552 | ) | ||||||||
| Net proceeds received from stock issued in the Employee Stock Purchase Plan | 58 | — | — | — | 58 | ||||||||||
| Net cash flows provided by financing activities | 22,579 | — | — | — | 22,579 | ||||||||||
| Net (decrease) increase in cash and cash equivalents | (12,050 | ) | — | — | — | (12,050 | ) | ||||||||
| Cash and cash equivalents, beginning of period | 43,389 | — | — | — | 43,389 | ||||||||||
| Cash and cash equivalents, end of period | $ | 31,339 | $ | — | $ | — | $ | — | $ | 31,339 | |||||
95
FORTEGRA FINANCIAL CORPORATION
NOTES TO CONSOLIDATED FINANCIAL STATEMENTS
(All Amounts in Thousands Except Share Amounts, Per Share Amounts or Unless Otherwise Noted)
| Consolidated Statement of Cash Flows | |||||||||
| For the Year Ended | |||||||||
| December 31, 2010 | |||||||||
| Operating Activities | As Previously Reported | Adoption of ASU 2010-26 | As Restated | ||||||
| Net income | $ | 16,203 | $ | (1,009 | ) | $ | 15,194 | ||
| Adjustments to reconcile net income to net cash flows provided by operating activities: | |||||||||
| Change in deferred acquisition costs | (5,754 | ) | 1,553 | (4,201 | ) | ||||
| Depreciation and amortization | 4,628 | — | 4,628 | ||||||
| Deferred income tax expense | 4,881 | (544 | ) | 4,337 | |||||
| Net realized investment (gains) losses | (650 | ) | — | (650 | ) | ||||
| Stock-based compensation expense | 176 | — | 176 | ||||||
| Amortization of premiums and accretion of discounts on investments | 348 | — | 348 | ||||||
| Non-controlling interests | (772 | ) | — | (772 | ) | ||||
| Change in allowance for doubtful accounts | (30 | ) | — | (30 | ) | ||||
| Changes in operating assets and liabilities, net of the effects of acquisitions and dispositions: | |||||||||
| Accrued investment income | 30 | — | 30 | ||||||
| Accounts and premiums receivable, net | 3,808 | — | 3,808 | ||||||
| Other receivables | 1,884 | — | 1,884 | ||||||
| Reinsurance receivables | 4,416 | — | 4,416 | ||||||
| Income taxes receivable | (818 | ) | — | (818 | ) | ||||
| Other assets | (1,600 | ) | — | (1,600 | ) | ||||
| Unpaid claims | (3,459 | ) | — | (3,459 | ) | ||||
| Unearned premiums | (5,222 | ) | — | (5,222 | ) | ||||
| Policyholder account balances | — | — | — | ||||||
| Accrued expenses, accounts payable and other liabilities | (7,379 | ) | — | (7,379 | ) | ||||
| Income taxes payable | (769 | ) | — | (769 | ) | ||||
| Deferred revenue | 3,181 | — | 3,181 | ||||||
| Net cash flows provided by operating activities | 13,102 | — | 13,102 | ||||||
| Investing activities | |||||||||
| Proceeds from maturities, calls and prepayments of available-for-sale investments | 12,114 | — | 12,114 | ||||||
| Proceeds from sales of available-for-sale investments | 8,769 | — | 8,769 | ||||||
| Net change in short-term investments | 50 | — | 50 | ||||||
| Purchases of available-for-sale investments | (24,047 | ) | — | (24,047 | ) | ||||
| Purchases of property and equipment | (9,191 | ) | — | (9,191 | ) | ||||
| Net paid for acquisitions of subsidiaries, net of cash received | (20,548 | ) | — | (20,548 | ) | ||||
| Net (issuance) proceeds from notes receivable | 684 | — | 684 | ||||||
| Change in restricted cash, net of restricted cash received from acquisitions | 2,368 | — | 2,368 | ||||||
| Net cash flows used in investing activities | (29,801 | ) | — | (29,801 | ) | ||||
| Financing activities | |||||||||
| Payments on notes payable | (20,000 | ) | — | (20,000 | ) | ||||
| Proceeds from notes payable | 25,226 | — | 25,226 | ||||||
| Capitalized closing costs for notes payable | (1,379 | ) | — | (1,379 | ) | ||||
| Net proceeds from the issuance of common stock | 40,703 | — | 40,703 | ||||||
| Payments on redeemable preferred stock | (500 | ) | — | (500 | ) | ||||
| Stockholder funds disbursed at purchase | (14,105 | ) | — | (14,105 | ) | ||||
| Net proceeds from exercise of stock options | 117 | — | 117 | ||||||
| Excess tax benefits from stock-based compensation | 86 | — | 86 | ||||||
| Net cash flows provided by financing activities | 30,148 | — | 30,148 | ||||||
| Net (decrease) increase in cash and cash equivalents | 13,449 | — | 13,449 | ||||||
| Cash and cash equivalents, beginning of period | 29,940 | — | 29,940 | ||||||
| Cash and cash equivalents, end of period | $ | 43,389 | $ | — | $ | 43,389 | |||
4. Recent Accounting Standards
Recently Adopted Accounting Pronouncements
In June 2011, the FASB issued Accounting Standards Update ("ASU") No. 2011-05, Comprehensive Income (Topic 820), which changes the presentation of comprehensive income. These changes give an entity the option to present the total of comprehensive income, the components of net income and the components of other comprehensive income either in a single continuous statement of comprehensive income or in two separate but consecutive statements; the option to present components of other comprehensive income as part of the statement of changes in stockholders' equity was eliminated. This guidance became effective for the Company on January 1, 2012 and only required a change in the format of the presentation of comprehensive income. The adoption of this guidance did not impact the Company’s consolidated financial position, results of operations or cash flows.
96
FORTEGRA FINANCIAL CORPORATION
NOTES TO CONSOLIDATED FINANCIAL STATEMENTS
(All Amounts in Thousands Except Share Amounts, Per Share Amounts or Unless Otherwise Noted)
In May 2011, the FASB issued ASU 2011-04, Amendments to Achieve Common Fair Value Measurement and Disclosure Requirements in U.S. GAAP and International Financial Reporting Standards ("IFRS"), which provides a consistent definition of fair value and ensures that the fair value measurement and disclosure requirements are similar between U.S. GAAP and IFRS. The guidance changes certain fair value measurement principles and expands the disclosure requirements particularly for Level 3 fair value measurements. The guidance became effective for the Company beginning January 1, 2012 and was applied prospectively. The adoption of this guidance, which primarily relates to disclosure, did not impact the Company’s consolidated financial position, results of operations or cash flows.
In October 2010, the FASB issued ASU 2010-26, Accounting for Costs Associated with Acquiring or Renewing Insurance Contracts, which updates the accounting for deferred acquisition costs. This guidance modifies the definition of the types of costs incurred by insurance entities that can be capitalized in the acquisition of new and renewal insurance contracts. The amendments in this guidance specify that the costs are limited to incremental direct costs that result directly from successful contract transactions and would not have been incurred by the insurance entity had the contract transactions not occurred. These costs must be directly related to underwriting, policy issuance and processing, medical and inspection reports and sales force contract selling. The amendments also specify that advertising costs are only included as deferred acquisition costs if the direct-response advertising criteria are met. ASU 2010-26 is effective for interim and annual reporting periods beginning after December 15, 2011. The Company retrospectively adopted the new standard on January 1, 2012. As of January 1, 2010, the beginning of the earliest period presented, the cumulative effect of the adjustment recorded to adopt this guidance resulted in decreases of $4.9 million to deferred acquisition costs, $1.7 million to deferred income taxes and $3.2 million to retained earnings. See the Note, "Restatement" for the effect of the retrospective adoption on the Company's Consolidated Financial Statement line items for the years ending December 31, 2011 and 2010, respectively.
Recently Issued Accounting Pronouncements
On February 5, 2013, the FASB issued ASU No. 2013-02, Reporting of Amounts Reclassified Out of Accumulated Other Comprehensive Income. This guidance is the culmination of the board’s redeliberation on reporting reclassification adjustments from AOCI. The new requirements will take effect for public companies in interim and annual reporting periods beginning after December 15, 2012 (the first quarter of 2013 for public, calendar-year companies). The Company is evaluating the impact of the ASU. The Company does not expect the adoption of this pronouncement to have a significant impact on the Company's consolidated financial position, results of operations or cash flows.
In July 2012, the FASB issued ASU No. 2012-02, Intangibles-Goodwill and Other (Topic 350): Testing Indefinite-Lived Intangible Assets for Impairment. The ASU permits entities to perform an optional qualitative assessment for determining whether it is more likely than not that an indefinite-lived intangible asset is impaired. The guidance is effective for annual and interim impairment tests performed for fiscal years beginning after September 15, 2012. The Company is evaluating the impact of the ASU. The Company does not expect the adoption of this pronouncement to have a significant impact on the Company's consolidated financial position, results of operations or cash flows.
In December 2011, the FASB issued ASU No. 2011-11, Disclosures About Offsetting Assets and Liabilities. This standard requires the disclosure of both gross and net information about instruments and transactions eligible for offset in the statement of financial position, as well as instruments and transactions subject to an agreement similar to a master netting arrangement. In addition, the standard requires disclosure of collateral received and posted in connection with master netting agreements or similar arrangements. The new requirements are effective for the Company beginning on January 1, 2013. As the provisions of ASU No. 2011-11 only impact the disclosure requirements related to the offsetting of assets and liabilities, the Company does not expect a significant impact on its consolidated financial position, results of operations or cash flows as a result of adoption of these new requirements.
97
FORTEGRA FINANCIAL CORPORATION
NOTES TO CONSOLIDATED FINANCIAL STATEMENTS
(All Amounts in Thousands Except Share Amounts, Per Share Amounts or Unless Otherwise Noted)
5. Earnings Per Share
| Earnings per share is calculated as follows: | For the Years Ended December 31, | ||||||||||
| 2012 | 2011 | 2010 | |||||||||
| As Restated | As Restated | ||||||||||
Numerator: (for both basic and diluted earnings per share) | |||||||||||
| Net income | $ | 15,165 | $ | 13,509 | $ | 15,194 | |||||
| Denominator: | |||||||||||
| Total average basic common shares outstanding | 19,655,492 | 20,352,027 | 15,929,181 | ||||||||
| Effect of dilutive stock options and restricted stock awards | 944,870 | 913,774 | 1,290,848 | ||||||||
| Total average diluted common shares outstanding | 20,600,362 | 21,265,801 | 17,220,029 | ||||||||
| Earnings per share-basic | $ | 0.77 | $ | 0.66 | 0.95 | ||||||
| Earnings per share-diluted | $ | 0.74 | $ | 0.64 | 0.88 | ||||||
Weighted average anti-dilutive common shares (1) | 480,795 | 301,010 | — | ||||||||
(1) The weighted average anti-dilutive common shares presented in the 2011 Form 10-K for the year ended December 31, 2011 only included out-of-the money anti-dilutive stock options and has been revised to include all anti-dilutive stock options and restricted share awards calculated under the treasury method. The revision to the presentation of weighted average anti-dilutive common shares had no impact on the average basic and diluted common shares outstanding or the basic and diluted earnings per share calculations for the year ended December 31, 2011.
6. Variable Interest Entities
In July 2011, the Company sold its 100% interest in Creative Investigations Recovery Group, LLC ("CIRG"). The consideration included a note receivable, included on the Consolidated Balance Sheets, with a first priority lien security interest in the assets of CIRG and other property of the buyers. The Company performed a detailed analysis of the CIRG sale transaction and determined that CIRG is considered a VIE, as defined in ASC 810, because the Company has an interest due to the note financing. The Company further determined that it is not the primary beneficiary because the Company does not have the power to direct the activities of the VIE and has no right to receive the residual returns of CIRG. Therefore, CIRG is not consolidated in the Company's results of operations. The Company's maximum exposure to loss in the VIE is limited to the outstanding balance of the note receivable, which is presented in the table below:
| At December 31, | |||||||
| 2012 | 2011 | ||||||
| The Company's maximum exposure to loss in the VIE | $ | 1,139 | $ | 1,142 | |||
7. Business Acquisitions and Dispositions
Acquisitions in 2012
On December 31, 2012, the Company acquired a 62.4% ownership interest of Digital Leash, LLC, d/b/a ProtectCELL and an option to purchase the remaining 37.6% ownership interest in ProtectCELL after 2014. ProtectCELL provides membership plans that afford protection for mobile wireless devices and other benefits including data management and identity theft protection. ProtectCELL is one of the leaders in mobile device protection plans and will spearhead Fortegra's efforts to expand its warranty and service contract business in the mobile and wireless device space. ProtectCELL's results will be included in the Company's Payment Protection segment.
On December 31, 2012, the Company acquired 100% of the outstanding stock ownership of 4Warranty Corporation, a leading warranty and extended service contract administrator with extensive expertise in furniture, electronics, appliance, lawn and garden, and fitness equipment. 4Warranty complements the Company's rapidly expanding warranty business. 4Warranty's results will be included in the Company's Payment Protection segment.
On April 24, 2012, the Company acquired a 100% ownership interest in MHA & Associates LLC ("MHA"), for $0.3 million, obtaining the renewal rights of the business and hiring the prior owner to maintain and increase the block of business.
The Consolidated Balance Sheets at December 31, 2012, include the accounts of both ProtectCELL and 4Warranty as of December 31, 2012. The financial results for the 2012 acquisitions of ProtectCELL and 4Warranty have not been included in the Company's Consolidated Statements of Income for the year ended December 31, 2012, because both acquisitions closed after business on December 31, 2012.
98
FORTEGRA FINANCIAL CORPORATION
NOTES TO CONSOLIDATED FINANCIAL STATEMENTS
(All Amounts in Thousands Except Share Amounts, Per Share Amounts or Unless Otherwise Noted)
The Company did not issue shares of its common stock in connection with any of the acquisitions completed during the years ended December 31, 2012, 2011 and 2010, respectively.
The following unaudited pro forma summary presents the Company's consolidated financial information as if ProtectCELL and 4Warranty had been acquired on January 1 of each year. Due to the insignificant impact of the MHA acquisition, its pro forma results have been excluded from the table below. These amounts have been calculated after applying the Company's accounting policies and adjusting the results of the acquired company to reflect the additional interest expense associated with the funding necessary to complete the acquisition and any amortization of intangibles that would have been charged to operations assuming the intangible assets would have existed on January 1, 2012 and 2011, excluding the transaction costs and the consequential tax effect.
| Years Ended December 31, | |||||||
| 2012 | 2011 | ||||||
| Revenue | $ | 359,950 | $ | 321,135 | |||
| Net income | $ | 11,615 | $ | 9,549 | |||
The unaudited pro forma results in the above table were prepared for comparative purposes only and do not purport to be indicative of the results of operations which may have actually resulted had the acquisitions of ProtectCELL and 4Warranty occurred at January 1, 2012 and 2011, respectively, nor is it indicative of any future operating results of the Company.
During 2012, the Company received the final valuation studies for identifiable intangible assets to determine the final valuation for the 2011 acquisitions of eReinsure and PBG. Accordingly, the Consolidated Balance Sheet at December 31, 2011 has been retrospectively adjusted to include the effect of the measurement period adjustments as required under ASC 805. Please see the Notes, "Goodwill," and "Other Intangible Assets," for more information on the retrospective measurement period adjustments made in 2012.
The following table presents the preliminary determination of the fair value of the amounts for the identifiable assets acquired, liabilities assumed, non-controlling interests and goodwill recorded for the 2012 acquisitions of ProtectCELL and 4Warranty and the final amounts recorded for the 2011 acquisitions based on their fair values as of the respective acquisition date and the effects of the measurement period adjustments recorded in 2012, as discussed above:
| 2011 Acquisitions | 2012 Acquisitions | ||||||||||||||||||||||
| Auto Knight | eReinsure | PBG | Magna Insurance | 4Warranty | ProtectCELL | ||||||||||||||||||
| Assets: | |||||||||||||||||||||||
| Cash | $ | — | $ | 3,694 | $ | 38 | $ | 400 | $ | 703 | $ | 350 | |||||||||||
| Restricted cash | — | — | — | — | 72 | 7,438 | |||||||||||||||||
| Investments | 1,403 | 1,212 | — | 2,432 | — | — | |||||||||||||||||
| Short-term investments | — | — | — | — | — | 252 | |||||||||||||||||
| Notes receivable | — | — | — | — | — | 6,341 | |||||||||||||||||
| Other receivables | 90 | 1,826 | — | 83 | 199 | 2,312 | |||||||||||||||||
| Deferred acquisition costs | 408 | — | — | — | — | 19,845 | |||||||||||||||||
| Property and equipment, net | — | 142 | 65 | — | 61 | 674 | |||||||||||||||||
| Other intangible assets, net | 1,807 | 13,908 | 3,650 | — | 1,900 | 27,815 | |||||||||||||||||
| Other assets | — | 54 | 23 | — | — | 1,470 | |||||||||||||||||
| Net deferred tax asset | — | — | 127 | — | — | — | |||||||||||||||||
| Liabilities: | |||||||||||||||||||||||
| Unpaid claims | — | — | — | — | — | (176 | ) | ||||||||||||||||
| Accrued expenses and accounts payable | (137 | ) | (2,825 | ) | (304 | ) | (455 | ) | (180 | ) | (2,644 | ) | |||||||||||
| Commissions payable | (116 | ) | — | (60 | ) | — | (41 | ) | — | ||||||||||||||
| Deferred revenue | (2,443 | ) | (835 | ) | — | — | (1,260 | ) | (45,409 | ) | |||||||||||||
| Income taxes payable | — | — | — | — | (296 | ) | — | ||||||||||||||||
| Net deferred tax liability | (477 | ) | (1,757 | ) | — | (36 | ) | (266 | ) | — | |||||||||||||
| Net assets acquired | 535 | 15,419 | 3,539 | 2,424 | 892 | 18,268 | |||||||||||||||||
| Non-controlling interest | — | — | — | — | — | (10,000 | ) | ||||||||||||||||
Purchase consideration (1) (2) | 4,750 | 38,931 | 7,607 | 2,424 | 3,616 | 20,000 | |||||||||||||||||
| Goodwill | $ | 4,215 | $ | 23,512 | $ | 4,068 | $ | — | $ | 2,724 | $ | 11,732 | |||||||||||
(1) - Reflects a purchase price reduction of $0.3 million for the final eReinsure working capital adjustments.
(2) - The purchase consideration for the 4Warranty acquisition includes $0.3 million of contingent consideration and $0.5 million of working capital and hold back reserves, which are expected to be paid out based on the agreed terms of the Stock Purchase Agreement.
99
FORTEGRA FINANCIAL CORPORATION
NOTES TO CONSOLIDATED FINANCIAL STATEMENTS
(All Amounts in Thousands Except Share Amounts, Per Share Amounts or Unless Otherwise Noted)
The Company has determined that none of the goodwill acquired in 2012 is expected to be tax deductible. The following table presents goodwill attributable to acquisitions that is expected to be tax deductible by year of acquisition:
| Year of the Acquisition | |||||||||||
| 2012 | 2011 | 2010 | |||||||||
Total (1) | $ | — | $ | 4,069 | $ | 10,008 | |||||
(1) The amount of goodwill attributable to acquisitions that is expected to be tax deductible for acquisitions completed in 2011 has been revised from the amount presented in the 2011 Annual Report on Form 10-K resulting from adjustments to goodwill for final valuations obtained in 2012 for the 2011 acquisitions.
Dispositions
In July 2011, the Company sold its wholly owned subsidiary, CIRG, for a sales price of $1.2 million, comprised of cash and a $1.1 million secured note receivable. For the year ended December 31, 2011, the Company recorded a $0.5 million loss on the sale of CIRG. This disposition resulted in a non-consolidated VIE. For more information see the Note, "Variable Interest Entity."
8. Goodwill
In 2012, the Company recorded goodwill in conjunction with the ProtectCELL and 4Warranty acquisitions. During 2012, the Company determined the final valuations for the 2011 acquisitions of eReinsure, included in the Brokerage Segment and PBG, included in the BPO segment.
The following table shows the retrospective adjustments made to the balance of goodwill at December 31, 2011 to reflect the effect of these measurement period adjustments made in accordance with accounting requirements under ASC 805 and the adjustments made to goodwill for the immaterial error corrections under ASC 250, that impacted balances prior to January1, 2011, that are discussed in the Note, "Restatement of the Consolidated Financial Statements," of Notes to the Consolidated Financial Statements.
| Goodwill balances by segment are as follows: | Payment Protection | BPO | Brokerage (1) | Total | |||||||||||
Balance at January 1, 2011 (1) | $ | 33,413 | $ | 10,239 | $ | 30,778 | $ | 74,430 | |||||||
| Segment reclassifications | — | (1,337 | ) | 1,337 | — | ||||||||||
| Goodwill disposed of during 2011 | — | — | (1,337 | ) | (1,337 | ) | |||||||||
| Goodwill acquired during 2011 | 3,219 | 6,730 | 26,138 | 36,087 | |||||||||||
| Goodwill adjustment under ASC 250 for the Auto Knight acquisition for the year ending December 31, 2011 | 996 | — | — | 996 | |||||||||||
| Final valuation adjustments as required under ASC 805 for eReinsure | — | — | (2,626 | ) | (2,626 | ) | |||||||||
| Final valuation adjustments as required under ASC 805 for PBG | — | (2,662 | ) | — | (2,662 | ) | |||||||||
| Adjusted balance at December 31, 2011 | 37,628 | 12,970 | 54,290 | 104,888 | |||||||||||
| Goodwill acquired - purchased book of business | — | — | 168 | 168 | |||||||||||
| Goodwill acquired - ProtectCELL acquisition | 11,732 | — | — | 11,732 | |||||||||||
| Goodwill acquired - 4Warranty acquisition | 2,724 | — | — | 2,724 | |||||||||||
| Balance at December 31, 2012 | $ | 52,084 | $ | 12,970 | $ | 54,458 | $ | 119,512 | |||||||
(1) The January 1, 2011 balance includes an increasing adjustment of $0.4 million to goodwill for the immaterial correction of an error adjustment attributable to B&G acquisition for the year ending December 31, 2009, as discussed in the Note, "Restatement of the Consolidated Financial Statements" of Notes to the Consolidated Financial Statements in the section titled "Immaterial correction of Prior Period Errors - Purchase Accounting Adjustments."
9. Other Intangible Assets
The following table shows finite-lived other intangible assets and their respective amortization periods:
| December 31, 2012 | December 31, 2011 | ||||||||||||||||||||||||||
| Amortization Period (Years) | Gross Carrying Amount | Accumulated Amortization | Net Carrying Amount | Gross Carrying Amount | Accumulated Amortization | Net Carrying Amount | |||||||||||||||||||||
| Finite-lived other intangible assets: | |||||||||||||||||||||||||||
| Customer and agent relationships | 5 | to | 15 | $ | 57,780 | $ | (12,340 | ) | $ | 45,440 | $ | 34,552 | $ | (8,724 | ) | $ | 25,828 | ||||||||||
| Software | 5 | to | 10 | 10,118 | (3,385 | ) | 6,733 | 8,773 | (2,345 | ) | 6,428 | ||||||||||||||||
| Present value of future profits | 0.3 | to | 0.75 | 548 | (548 | ) | — | 548 | (548 | ) | — | ||||||||||||||||
| Non-compete agreements | 1.5 | to | 6 | 5,008 | (2,716 | ) | 2,292 | 2,958 | (2,419 | ) | 539 | ||||||||||||||||
| Total finite-lived other intangible assets | $ | 73,454 | $ | (18,989 | ) | $ | 54,465 | $ | 46,831 | $ | (14,036 | ) | $ | 32,795 | |||||||||||||
100
FORTEGRA FINANCIAL CORPORATION
NOTES TO CONSOLIDATED FINANCIAL STATEMENTS
(All Amounts in Thousands Except Share Amounts, Per Share Amounts or Unless Otherwise Noted)
| The following table shows the carrying amount of indefinite-lived other intangible assets: | At December 31, | ||||||
| 2012 | 2011 | ||||||
| Tradenames | $ | 24,875 | $ | 21,615 | |||
The finite-lived and indefinite-lived other intangible assets acquired in 2012 relate to the acquisition of ProtectCELL and 4Warranty and for the purchase of a book of business. In 2012, the Company determined the final valuations for the 2011 acquisitions of eReinsure and PBG and made retrospective adjustments to other intangible assets. The following table includes the retrospective adjustments made to the balance of other intangible assets at December 31, 2011 to reflect the effect of these measurement period adjustments made in accordance with the accounting requirements under ASC 805 and the current period activity.
| Changes in other intangible assets are as follows: | |||
| Balance at January 1, 2011 | $ | 39,997 | |
| Intangible assets acquired in 2011 | 11,977 | ||
| Less: Amortization expense | 4,952 | ||
| Balance at December 31, 2011 | 47,022 | ||
| Final valuation adjustments as required under ASC 805 for eReinsure | 4,508 | ||
| Final valuation adjustments as required under ASC 805 for PBG | 2,880 | ||
| Adjusted balance at December 31, 2011 | 54,410 | ||
| Intangible assets acquired in 2012 - Purchased book of business | 168 | ||
| Intangible assets acquired in 2012 - ProtectCELL acquisition | 27,815 | ||
| Intangible assets acquired in 2012 - 4Warranty acquisition | 1,900 | ||
| Less: Amortization expense | 4,953 | ||
| Balance at December 31, 2012 | $ | 79,340 | |
Estimated amortization of finite-lived other intangible assets for the next five years and thereafter ending December 31 is presented below:
| 2013 | $ | 10,022 | |
| 2014 | 10,010 | ||
| 2015 | 10,003 | ||
| 2016 | 9,378 | ||
| 2017 | 8,031 | ||
| Thereafter | 7,021 | ||
| Total | $ | 54,465 | |
10. Investments
The following table summarizes the Company's available-for-sale fixed maturity and equity securities:
| At December 31, 2012 | |||||||||||||||
| Description of Security | Cost or Amortized Cost | Gross Unrealized Gains | Gross Unrealized Losses | Fair Value | |||||||||||
| Obligations of the U.S. Treasury and U.S. Government agencies | $ | 22,424 | $ | 761 | $ | (7 | ) | $ | 23,178 | ||||||
| Municipal securities | 16,636 | 413 | (8 | ) | 17,041 | ||||||||||
| Corporate securities | 67,627 | 2,461 | (80 | ) | 70,008 | ||||||||||
| Mortgage-backed securities | 285 | 4 | — | 289 | |||||||||||
| Asset-backed securities | 123 | 2 | — | 125 | |||||||||||
| Total fixed maturity securities | $ | 107,095 | $ | 3,641 | $ | (95 | ) | $ | 110,641 | ||||||
| Common stock - publicly traded | $ | 39 | $ | 3 | $ | — | $ | 42 | |||||||
| Preferred stock - publicly traded | 4,975 | 133 | (1 | ) | 5,107 | ||||||||||
| Common stock - non-publicly traded | 59 | 4 | (5 | ) | 58 | ||||||||||
| Preferred stock - non-publicly traded | 1,009 | 4 | — | 1,013 | |||||||||||
| Total equity securities | $ | 6,082 | $ | 144 | $ | (6 | ) | $ | 6,220 | ||||||
101
FORTEGRA FINANCIAL CORPORATION
NOTES TO CONSOLIDATED FINANCIAL STATEMENTS
(All Amounts in Thousands Except Share Amounts, Per Share Amounts or Unless Otherwise Noted)
| At December 31, 2011 | |||||||||||||||
| Description of Security | Cost or Amortized Cost | Gross Unrealized Gains | Gross Unrealized Losses | Fair Value | |||||||||||
| Obligations of the U.S. Treasury and U.S. Government agencies | $ | 25,751 | $ | 611 | $ | (2 | ) | $ | 26,360 | ||||||
| Municipal securities | 17,609 | 388 | (5 | ) | 17,992 | ||||||||||
| Corporate securities | 47,304 | 594 | (426 | ) | 47,472 | ||||||||||
| Mortgage-backed securities | 1,272 | 26 | — | 1,298 | |||||||||||
| Asset-backed securities | 375 | 12 | — | 387 | |||||||||||
| Total fixed maturity securities | $ | 92,311 | $ | 1,631 | $ | (433 | ) | $ | 93,509 | ||||||
| Common stock - publicly traded | $ | 40 | $ | — | $ | (1 | ) | $ | 39 | ||||||
| Preferred stock - publicly traded | 50 | 2 | — | 52 | |||||||||||
| Common stock - non-publicly traded | 104 | 26 | (16 | ) | 114 | ||||||||||
| Preferred stock - non-publicly traded | 1,009 | 5 | — | 1,014 | |||||||||||
| Total equity securities | $ | 1,203 | $ | 33 | $ | (17 | ) | $ | 1,219 | ||||||
Pursuant to certain reinsurance agreements and statutory licensing requirements, the Company has deposited invested assets in custody accounts or insurance department safekeeping accounts. The Company is not permitted to remove invested assets from these accounts without prior approval of the contractual party or regulatory authority. The following table details the Company's restricted investments:
| At December 31, | |||||||
| 2012 | 2011 | ||||||
| Fair value of restricted investments | $ | 17,942 | $ | 18,319 | |||
| Fair value of restricted investments for special deposits required by state insurance departments | $ | 10,988 | $ | 11,618 | |||
The amortized cost and fair value of fixed maturity securities by contractual maturity are shown below. Expected maturities will differ from contractual maturities as borrowers have the right to call or prepay obligations with or without call or prepayment penalties.
| At | |||||||||||||||
| December 31, 2012 | December 31, 2011 | ||||||||||||||
| Amortized Cost | Fair Value | Amortized Cost | Fair Value | ||||||||||||
| Due in one year or less | $ | 5,557 | $ | 5,608 | $ | 3,890 | $ | 3,923 | |||||||
| Due after one year through five years | 58,378 | 60,323 | 51,210 | 51,839 | |||||||||||
| Due after five years through ten years | 24,983 | 25,900 | 23,623 | 23,973 | |||||||||||
| Due after ten years | 17,769 | 18,396 | 11,941 | 12,089 | |||||||||||
| Mortgage-backed securities | 285 | 289 | 1,272 | 1,298 | |||||||||||
| Asset-backed securities | 123 | 125 | 375 | 387 | |||||||||||
| Total fixed maturity securities | $ | 107,095 | $ | 110,641 | $ | 92,311 | $ | 93,509 | |||||||
102
FORTEGRA FINANCIAL CORPORATION
NOTES TO CONSOLIDATED FINANCIAL STATEMENTS
(All Amounts in Thousands Except Share Amounts, Per Share Amounts or Unless Otherwise Noted)
The following table provides information on unrealized losses on investment securities that have been in an unrealized loss position for less than twelve months, and twelve months or greater:
| December 31, 2012 | ||||||||||||||||||||||||||
| Less than Twelve Months | Twelve Months or Greater | Total | ||||||||||||||||||||||||
| Description of Security | Fair Value | Unrealized Losses | # of Securities | Fair Value | Unrealized Losses | # of Securities | Fair Value | Unrealized Losses | # of Securities | |||||||||||||||||
| Obligations of the U.S. Treasury and U.S. Government agencies | $ | 857 | $ | (7 | ) | 11 | $ | — | $ | — | — | $ | 857 | $ | (7 | ) | 11 | |||||||||
| Municipal securities | 734 | (8 | ) | 1 | — | — | — | 734 | (8 | ) | 1 | |||||||||||||||
| Corporate securities | 12,625 | (63 | ) | 16 | 183 | (17 | ) | 1 | 12,808 | (80 | ) | 17 | ||||||||||||||
| Mortgage-backed securities | — | — | — | — | — | — | — | — | — | |||||||||||||||||
| Asset-backed securities | — | — | — | — | — | — | — | — | — | |||||||||||||||||
| Total fixed maturity securities | $ | 14,216 | $ | (78 | ) | 28 | $ | 183 | $ | (17 | ) | 1 | $ | 14,399 | $ | (95 | ) | 29 | ||||||||
| Common stock - publicly traded | $ | — | $ | — | — | $ | — | $ | — | — | $ | — | $ | — | — | |||||||||||
| Preferred stock - publicly traded | 198 | (1 | ) | 1 | — | — | — | 198 | (1 | ) | 1 | |||||||||||||||
| Common stock - non-publicly traded | — | — | — | 39 | (5 | ) | 2 | 39 | (5 | ) | 2 | |||||||||||||||
| Preferred stock - non-publicly traded | — | — | — | — | — | — | — | — | — | |||||||||||||||||
| Total equity securities | $ | 198 | $ | (1 | ) | 1 | $ | 39 | $ | (5 | ) | 2 | $ | 237 | $ | (6 | ) | 3 | ||||||||
| At December 31, 2011 | ||||||||||||||||||||||||||
| Less than Twelve Months | Twelve Months or Greater | Total | ||||||||||||||||||||||||
| Description of Security | Fair Value | Unrealized Losses | # of Securities | Fair Value | Unrealized Losses | # of Securities | Fair Value | Unrealized Losses | # of Securities | |||||||||||||||||
| Obligations of the U.S. Treasury and U.S. Government agencies | $ | 1,902 | $ | (2 | ) | 7 | $ | — | $ | — | — | $ | 1,902 | $ | (2 | ) | 7 | |||||||||
| Municipal securities | 486 | (1 | ) | 1 | 478 | (4 | ) | 1 | 964 | (5 | ) | 2 | ||||||||||||||
| Corporate securities | 16,861 | (426 | ) | 26 | — | — | — | 16,861 | (426 | ) | 26 | |||||||||||||||
| Mortgage-backed securities | — | — | — | — | — | — | — | — | — | |||||||||||||||||
| Asset-backed securities | — | — | — | — | — | — | — | — | — | |||||||||||||||||
| Total fixed maturity securities | $ | 19,249 | $ | (429 | ) | 34 | $ | 478 | $ | (4 | ) | 1 | $ | 19,727 | $ | (433 | ) | 35 | ||||||||
| Common stock - publicly traded | $ | 38 | $ | (1 | ) | 2 | $ | — | $ | — | — | $ | 38 | $ | (1 | ) | 2 | |||||||||
| Preferred stock - publicly traded | — | — | — | — | — | — | — | — | — | |||||||||||||||||
| Common stock - non-publicly traded | 45 | (16 | ) | 3 | — | — | — | 45 | (16 | ) | 3 | |||||||||||||||
| Preferred stock - non-publicly traded | — | — | — | — | — | — | — | — | — | |||||||||||||||||
| Total equity securities | $ | 83 | $ | (17 | ) | 5 | $ | — | $ | — | — | $ | 83 | $ | (17 | ) | 5 | |||||||||
The Company does not intend to sell the investments that are in an unrealized loss position at December 31, 2012 and it is more likely than not that the Company will be able to hold these securities until full recovery of their amortized cost basis for fixed maturity securities or cost for equity securities. At December 31, 2012, based on management's review, the Company deemed that 1 individual equity security was other than temporarily impaired and recorded an impairment charge of $16.0 thousand for the year ended December 31, 2012. For the year ended December 31, 2011 the Company deemed that 10 equity securities were other than temporarily impaired and recorded an impairment charge of $0.2 million.
The following table summarizes the gross proceeds from the sale of available-for-sale investment securities:
| For the Years Ended December 31, | |||||||||||
| 2012 | 2011 | 2010 | |||||||||
| Gross proceeds from sales | $ | 8,364 | $ | 62,300 | $ | 8,769 | |||||
103
FORTEGRA FINANCIAL CORPORATION
NOTES TO CONSOLIDATED FINANCIAL STATEMENTS
(All Amounts in Thousands Except Share Amounts, Per Share Amounts or Unless Otherwise Noted)
The following table summarizes the gross realized gains and gross realized losses for both fixed maturity and equity securities and realized losses for other-than-temporary impairments for available-for-sale investment securities:
| For the Years Ended December 31, | |||||||||||
| 2012 | 2011 | 2010 | |||||||||
| Gross realized gains | $ | 33 | $ | 4,456 | $ | 831 | |||||
| Gross realized losses | (14 | ) | (91 | ) | (116 | ) | |||||
| Total net gains from investment sales | 19 | 4,365 | 715 | ||||||||
| Impairment write-downs (other-than-temporary impairments) | (16 | ) | (172 | ) | (65 | ) | |||||
| Net realized investment gains | $ | 3 | $ | 4,193 | $ | 650 | |||||
| The following schedule details the components of net investment income: | For the Years Ended December 31, | ||||||||||
| 2012 | 2011 | 2010 | |||||||||
| Fixed income securities | $ | 2,670 | $ | 3,188 | $ | 3,666 | |||||
| Cash on hand and on deposit | 193 | 333 | 738 | ||||||||
| Common and preferred stock dividends | 275 | 59 | 60 | ||||||||
| Notes receivable | 267 | 155 | 157 | ||||||||
| Other income | 138 | 141 | (46 | ) | |||||||
| Investment expenses | (475 | ) | (508 | ) | (502 | ) | |||||
| Net investment income | $ | 3,068 | $ | 3,368 | $ | 4,073 | |||||
11. Reinsurance Receivables
The effects of reinsurance on premiums written and earned and on losses and loss adjustment expenses ("LAE") incurred are presented in the tables below:
| Premiums | For the Years Ended December 31, | |||||||||||||||||||
| 2012 | 2011 | 2010 | ||||||||||||||||||
| Written | Earned | Written | Earned | Written | Earned | |||||||||||||||
| Direct and assumed | $ | 367,791 | $ | 359,820 | $ | 338,869 | $ | 321,412 | $ | 302,574 | $ | 307,916 | ||||||||
| Ceded | (236,121 | ) | (232,195 | ) | (214,485 | ) | (205,909 | ) | (191,141 | ) | (196,111 | ) | ||||||||
| Net | $ | 131,670 | $ | 127,625 | $ | 124,384 | $ | 115,503 | $ | 111,433 | $ | 111,805 | ||||||||
| Losses and LAE incurred | For the Years Ended December 31, | |||||||||||
| 2012 | 2011 | 2010 | ||||||||||
| Direct and assumed | $ | 86,409 | $ | 81,843 | $ | 79,403 | ||||||
| Ceded | (46,190 | ) | (43,894 | ) | (43,368 | ) | ||||||
| Net losses and LAE incurred | $ | 40,219 | $ | 37,949 | $ | 36,035 | ||||||
| The following table reflects the components of the reinsurance receivables: | At December 31, | ||||||
| 2012 | 2011 | ||||||
Prepaid reinsurance premiums (1): | |||||||
| Life | $ | 53,117 | $ | 59,545 | |||
| Accident and health | 34,266 | 30,759 | |||||
| Property | 85,805 | 80,758 | |||||
| Total | 173,188 | 171,062 | |||||
| Ceded claim reserves: | |||||||
| Life | 1,786 | 1,794 | |||||
| Accident and health | 9,263 | 9,896 | |||||
| Property | 8,663 | 7,743 | |||||
| Total ceded claim reserves recoverable | 19,712 | 19,433 | |||||
| Other reinsurance settlements recoverable | 11,088 | 4,245 | |||||
| Reinsurance receivables | $ | 203,988 | $ | 194,740 | |||
(1) Including policyholder account balances ceded. | |||||||
104
FORTEGRA FINANCIAL CORPORATION
NOTES TO CONSOLIDATED FINANCIAL STATEMENTS
(All Amounts in Thousands Except Share Amounts, Per Share Amounts or Unless Otherwise Noted)
The following table shows the amount included in reinsurance receivable that is recoverable from three unrelated insurers:
| At December 31, | |||||||
| 2012 | 2011 | ||||||
| Total recoverable from three unrelated reinsurers | $ | 126,633 | $ | 124,160 | |||
At December 31, 2012, the three unrelated reinsurers are: London Life Reinsurance Company (A. M. Best Rating-A); London Life International Reinsurance Corporation (A. M. Best Rating-NR-3) and Spartan Property Insurance Company (A. M. Best Rating - Non-rated). Because Spartan Property Insurance Company does not maintain an A.M. Best rating, the related receivables are collateralized by assets held in trust accounts. At December 31, 2011, the three unrelated reinsurers are: Munich American Reassurance Company (A. M. Best Rating-A+); London Life Reinsurance Company (A. M. Best Rating-A); and London Life International Reinsurance Corporation (A. M. Best Rating-NR-3). Because London Life International Reinsurance Corporation does not maintain an A.M. Best rating, the related receivables are collateralized by assets held in trust accounts and letters of credit. At December 31, 2012, the Company does not believe there is a risk of loss as a result of the concentration of credit risk in the reinsurance program.
12. Property and Equipment
| The components of property and equipment are as follows: | At December 31, | ||||||
| 2012 | 2011 | ||||||
| Furniture, fixtures and equipment | $ | 3,038 | $ | 2,868 | |||
| Computer equipment | 4,126 | 2,356 | |||||
| Equipment and software under capital lease | 229 | — | |||||
Software (1) | 18,632 | 14,416 | |||||
| Leasehold improvements | 568 | 357 | |||||
| Property and equipment, gross | 26,593 | 19,997 | |||||
| Less: accumulated depreciation and amortization | 8,647 | 4,683 | |||||
| Property and equipment, net | $ | 17,946 | $ | 15,314 | |||
(1) Internally developed software not yet placed in service, included in software | $ | 942 | $ | 5,302 | |||
The following reflects depreciation on property and equipment and amortization expense related to capitalized software costs:
| Years Ended December 31, | |||||||||||
| 2012 | 2011 | 2010 | |||||||||
| Depreciation expense on property and equipment | $ | 1,756 | $ | 1,605 | $ | 924 | |||||
| Amortization expense on capitalized software | 2,177 | 1,472 | 472 | ||||||||
| Total depreciation and amortization | $ | 3,933 | $ | 3,077 | $ | 1,396 | |||||
13. Leases
Operating Leases
The Company leases certain office space and equipment under operating leases expiring on various dates from 2013 through 2022. The Company assumed operating leases for office space from related parties in conjunction with the ProtectCELL and 4Warranty acquisitions. The terms of the related party leases are substantially the same as those offered for comparable transactions with non-related parties. The Company did not make payments on the related party lease during 2012. Please see the Note, "Related Party Transactions," for more information. The following table shows the Company's future minimum lease payments under operating leases with initial or remaining non-cancelable lease terms in excess of one year at:
| December 31, 2012 | |||
| 2013 | $ | 2,574 | |
| 2014 | 2,886 | ||
| 2015 | 2,732 | ||
| 2016 | 2,485 | ||
| 2017 | 2,415 | ||
| Thereafter | 9,453 | ||
| Total payments | $ | 22,545 | |
105
FORTEGRA FINANCIAL CORPORATION
NOTES TO CONSOLIDATED FINANCIAL STATEMENTS
(All Amounts in Thousands Except Share Amounts, Per Share Amounts or Unless Otherwise Noted)
| The Company recognized rent expense for the: | Years Ended December 31, | ||||||||||
| 2012 | 2011 | 2010 | |||||||||
| Total rent expense | $ | 3,050 | $ | 3,275 | $ | 2,997 | |||||
Capital Lease
The Company also leases equipment and software under a single capital lease expiring in 2014. The capital lease was assumed by the Company in conjunction with the 2012 acquisition of ProtectCELL. The following table shows the Company's future minimum lease payments for its capital lease at December 31, 2012:
| December 31, 2012 | |||
| 2013 | $ | 134 | |
| 2014 | 133 | ||
| 2015 | — | ||
| 2016 | — | ||
| 2017 | — | ||
| Thereafter | — | ||
| Total minimum payments | $ | 267 | |
| Amounts representing interest | (26 | ) | |
| Obligations under capital lease | 241 | ||
14. Note Payable
| The Company's Notes Payable consisted of the following at: | At December 31, | ||||||
| 2012 | 2011 | ||||||
| Wells Fargo Bank, N.A.- credit facility, maturing August 2017 | $ | 89,438 | $ | — | |||
| Maximum balance allowed on Wells Fargo Bank, N.A credit facility | $ | 125,000 | $ | — | |||
| SunTrust Bank, N.A. - revolving credit facility, maturing June 2013 | $ | — | $ | 73,000 | |||
| Maximum balance allowed on SunTrust Bank, N.A revolving credit facility | $ | — | $ | 85,000 | |||
| Interest rate on the respective note payable at the end of the respective periods: | 2.76 | % | 4.59 | % | |||
Aggregate maturities for the Company's note payable at December 31, 2012 are as follows:
| 2013 | $ | 1,250 | |
| 2014 | 5,000 | ||
| 2015 | 5,000 | ||
| 2016 | 5,000 | ||
| 2017 | 73,188 | ||
| Thereafter | — | ||
| Total | $ | 89,438 | |
$125.0 million Secured Credit Agreement - Wells Fargo Bank, N.A.
At December 31, 2012, the Company had a $125.0 million secured credit agreement (the "Credit Agreement"), entered into on August 2, 2012, with a syndicate of lenders, among them Wells Fargo Bank, N.A., who also serves as administrative agent ("Wells Fargo" or the "Administrative Agent"). The Credit Agreement has a five year term and provides for a $50.0 million term loan facility (the "Term Loan Facility"), as well as a $75.0 million revolving credit facility (the "Revolving Facility" and collectively with the Term Loan Facility, the "Facilities"). Subject to earlier termination, the Credit Agreement terminates on August 2, 2017. The Credit Agreement includes a provision pursuant to which, from time to time, the Company may request that the lenders in their discretion increase the maximum amount of commitments under the Facilities by an amount not to exceed $50.0 million.
At the Company's election, borrowings under the Revolving Facility will bear interest either at the base rate plus an applicable interest margin or the adjusted LIBO rate plus an applicable interest margin; provided, however, that all swingline loans will be base rate loans. The base rate is a fluctuating interest rate equal to the highest of: (i) Wells Fargo's publicly announced prime lending rate; (ii) the federal funds rate plus 0.50%; and (iii) the adjusted LIBO rate, determined on a daily basis for an interest period of one month, plus 1.0%.
106
FORTEGRA FINANCIAL CORPORATION
NOTES TO CONSOLIDATED FINANCIAL STATEMENTS
(All Amounts in Thousands Except Share Amounts, Per Share Amounts or Unless Otherwise Noted)
The adjusted LIBO rate is the rate per annum obtained by dividing (i) the London interbank offered rate ("LIBOR") for such interest period by (ii) a percentage equal to 1.00 minus the Eurodollar Reserve Percentage (as defined in the Credit Agreement). The interest margin over the adjusted LIBO rate, initially set at 2.75%, may increase (to a maximum amount of 3.0%) or decrease (to a minimum amount of 2.0%) based on changes in our leverage ratio. The interest margin over the base rate, initially set at 1.75%, may increase (to a maximum amount of 2.0%) or decrease (to a minimum amount of 1.0%) based on changes in our leverage ratio.
In addition to interest payable on the principal amount of indebtedness outstanding from time to time under the Credit Agreement, the Company is required to pay a commitment fee, initially equal to 0.40% per annum of the unused amount of the Revolving Facility. The percentage rate of such fee may increase (to a maximum amount of 0.45%) or decrease (to a minimum amount of 0.25%) based on changes in the Borrowers' leverage ratio. The amount of outstanding swingline loans is not considered usage of the Revolving Facility for the purpose of calculating the commitment fee. The Company is also required to pay letter of credit participation fees on the undrawn amount of all outstanding letters of credit. The Company paid fees of approximately $1.7 million to Wells Fargo in connection with the execution of the Credit Agreement, which have been capitalized and are being amortized over the life of the Credit Agreement.
The Company, at its option, may prepay any borrowing, in whole or in part, at any time and from time to time without premium or penalty. However, after the end of our fiscal year (commencing with the fiscal year ending December 31, 2015), the Company is required to make mandatory principal prepayments of loans under the Facilities in an amount determined under the Credit Agreement based upon a percentage of the Company's Excess Cash Flow (as defined in the Credit Agreement) minus certain off set amounts relating to permitted acquisitions.
The Credit Agreement contains certain customary representations, warranties and covenants applicable to us for the benefit of the Administrative Agent and the lenders. The Company may not assign, sell, transfer or dispose of any collateral or effect certain changes to our capital structure and the capital structure of our subsidiaries without the Administrative Agent's prior consent. The Company obligations under the Facilities may be accelerated or the commitments terminated upon the occurrence of an event of default under the Credit Agreement, including payment defaults, defaults in the performance of affirmative and negative covenants, the inaccuracy of representations or warranties, bankruptcy and insolvency related defaults, cross defaults to other material indebtedness, defaults arising in connection with changes in control and other customary events of default.
The Credit Agreement also contains the financial covenants which the Company must maintain. See the section below, "Financial Covenants" for a presentation of the Company's more significant covenants associated with the Credit Agreement.
$85.0 million Revolving Credit Facility - SunTrust Bank, N.A.
At December 31, 2011, the Company had an $85.0 million revolving credit facility with SunTrust Bank, N.A.,(the "Facility"). The Facility had an original maturity of June 2013. The Facility bore interest at a variable rate determined based upon the higher of (i) the prime rate, (ii) the federal funds rate plus 0.50% or (iii) LIBOR plus 1%, plus a margin tied to the Company's leverage ratio. The Company could select at its discretion to convert the interest rate for all or a portion of the outstanding balance for a period of up to six months to a fixed EURO Dollar Funding rate which is equal to the adjusted LIBOR rate for the elected interest period in effect at the time of election, plus a margin tied to the Company's leverage ratio.
Termination of the $85.0 million Facility
On August 2, 2012, the Company terminated the Facility and entered into the Credit Agreement. In connection with the termination of the Facility, the Company recorded a charge of $0.7 million to interest expense for the year ending December 31, 2012, for previously capitalized transaction costs associated with the Facility.
Financial Covenants
At December 31, 2012 and 2011, respectively, the Company had to comply with various financial covenants set forth in the Credit Agreement and the Facility, respectively. The following describes the Credit Agreement's more significant financial covenants in effect at December 31, 2012 and the calculations used to arrive at each ratio:
Total Leverage Ratio - the ratio of (i) Consolidated Total Debt as of such date to (ii) Consolidated Adjusted Earnings Before Interest, Taxes, Depreciation and Amortization ("Adjusted EBITDA")for the Measurement Period ending on or immediately prior to such date.
Fixed Charge Coverage Ratio - the ratio of (a) Consolidated Adjusted EBITDA less the actual amount paid by the Borrowers and their Subsidiaries in cash on account of Capital Expenditures less cash taxes paid by the Borrowers and their Subsidiaries to (b) Consolidated Fixed Charges, in each case for the Measurement Period ending on or immediately prior to such date.
107
FORTEGRA FINANCIAL CORPORATION
NOTES TO CONSOLIDATED FINANCIAL STATEMENTS
(All Amounts in Thousands Except Share Amounts, Per Share Amounts or Unless Otherwise Noted)
Reinsurance Ratio - the ratio (expressed as a percentage) of (a) the aggregate amounts recoverable by the Borrowers and its Subsidiaries from reinsurers divided by (b) the sum of (i) policy and claim liabilities plus (ii) unearned premiums, in each case of the Borrowers and their Subsidiaries determined in accordance with GAAP.
RBC Ratio - the ratio (expressed as a percentage) of NAIC RBC (as defined in the NAIC standards) for any Regulated Insurance Company on an individual basis, calculated at the end of any Fiscal Year, to the "authorized control level" (as defined in the NAIC standards).
The following is a summary of the Credit Agreement's more significant financial covenants calculated at December 31, 2012:
| Actual At | |||
| Covenant | Covenant Requirement | December 31, 2012 | |
| Total leverage ratio | not more than 3.50 | 3.10 | |
| Fixed charge coverage ratio | not less than 2.00 | 2.33 | |
| Reinsurance ratio | not less than 50% | 69.0% | |
| RBC Ratio's: | |||
| RBC Ratio - Bankers Life of Louisiana | not less than 250% | 469.0% | |
| RBC Ratio - Southern Financial Life Insurance Company | not less than 250% | 2,155.0% | |
| RBC Ratio - Insurance Company of the South | not less than 250% | 378.0% | |
| RBC Ratio - Lyndon Southern Insurance Company | not less than 250% | 255.0% | |
| RBC Ratio - Life of the South Insurance Company | not less than 250% | 386.0% | |
The following describes the Facility's more significant financial covenants in effect at December 31, 2011 and the calculations used to arrive at each ratio:
Fixed charge coverage ratio - is the ratio of Consolidated Adjusted EBITDA less the actual amount paid by the Company and its Subsidiaries in cash on account of Capital Expenditures less cash taxes to the Consolidated Fixed Charges, in each case measured for the four consecutive Fiscal Quarters ending on or immediately prior to such date.
Total leverage ratio - is the ratio of, as of any date, Consolidated Total Debt as of such date to the Consolidated Adjusted EBITDA for the four consecutive Fiscal Quarters ending on or immediately prior to such date.
Senior leverage ratio - is the ratio of, as of any date, Consolidated Senior Debt as of such date to the Consolidated Adjusted EBITDA for the four consecutive Fiscal Quarters ending on or immediately prior to such date.
Reinsurance ratio - is the ratio (expressed as a percentage) of, as of any date of determination, of the aggregate amounts recoverable by the Company and its Restricted Subsidiaries from reinsurers divided by the sum of (i) policy and claim liabilities plus (ii) unearned premiums, in each case of the Company and its Restricted Subsidiaries determined in accordance with GAAP.
The following is a summary of the Facility's more significant financial covenants in effect at December 31, 2011:
| Actual At | |||
| Covenant | Covenant Requirement | December 31, 2011 | |
| Fixed charge coverage ratio | not less than 1.25 | 4.50 | |
| Total leverage ratio | not more than 3.50 | 2.45 | |
| Senior leverage ratio | not more than 2.50 | 2.45 | |
| Reinsurance ratio | not less than 60% | 75.0% | |
15. Derivative Financial Instruments - Interest Rate Swap
In April 2011, the Company entered into a forward interest rate swap (the "Swap") with Wells Fargo Bank, N.A, pursuant to which the Company swapped the floating rate portion of its outstanding preferred trust securities to a fixed rate. The Swap commenced in June 2012 and expires in June 2017 and is designated as a cash flow hedge.
The following table summarizes the fair value (including accrued interest) and related outstanding notional amounts of derivative instruments and indicates where within the Consolidated Balance Sheets each is reported:
108
FORTEGRA FINANCIAL CORPORATION
NOTES TO CONSOLIDATED FINANCIAL STATEMENTS
(All Amounts in Thousands Except Share Amounts, Per Share Amounts or Unless Otherwise Noted)
| Balance Sheet Location | At December 31, | ||||||||
| 2012 | 2011 | ||||||||
| Derivatives designated as cash flow hedging instruments: | |||||||||
| Interest rate swap - notional value | $ | 35,000 | $ | 35,000 | |||||
| Fair value of the Swap | Other Liabilities | $ | (4,338 | ) | $ | (3,601 | ) | ||
| Unrealized loss, net of tax, on the fair value of the Swap | AOCI | $ | (2,820 | ) | $ | (2,340 | ) | ||
Variable rate of the interest rate swap (1) | 0.31 | % | — | % | |||||
Fixed rate of the interest rate swap (1) | 3.47 | % | — | % | |||||
(1) - The swap took effect in June 2012.
The following table summarizes the pretax impact of the interest rate swap designated as a cash flow hedge on the Consolidated Financial Statements for the following periods:
| Years Ended December 31, | |||||||||||
| 2012 | 2011 | 2010 | |||||||||
| (Loss) recognized in AOCI on the derivative-effective portion | $ | (611 | ) | $ | (3,601 | ) | $ | — | |||
| (Loss) reclassified from AOCI into income-effective portion | $ | 126 | $ | — | $ | — | |||||
| Gain (loss) recognized in income on the derivative-ineffective portion | $ | — | $ | — | $ | — | |||||
The table below shows the estimated amount to be reclassified to earnings from AOCI during the next 12 months. These net losses reclassified into earnings are expected to primarily increase net interest expense related to the respective hedged item.
| At | |||
| December 31, 2012 | |||
| Estimated loss to be reclassified to earnings from AOCI during the next 12 months | $ | 1,117 | |
16. Stock-Based Compensation
At December 31, 2012, the Company has outstanding time-based stock options under its 2005 Plan and outstanding time- and performance-based stock options and restricted stock awards under its 2010 Plan. The 2005 Plan permits awards of (i) Incentive Stock Options, (ii) Non-qualified Stock Options, (iii) Stock Appreciation Rights, (iv) Restricted Stock and (v) Restricted Stock Units. The 2010 Plan permits awards of (i) Incentive Stock Options, (ii) Non-qualified Stock Options, (iii) Stock Appreciation Rights, (iv) Restricted Stock, (v) Other Stock-Based Awards and (vi) Performance-Based Compensation Awards. The following table details the 2005 Plan and the 2010 Plan at December 31, 2012:
| 2005 Plan | 2010 Plan | ||||
| Date the plan was established | October 18, 2005 | December 13, 2010 | |||
| Share permitted to be issued under the plan | 1,312,500 | 4,000,000 | |||
| Maximum contractual term of grants under the plan (in years) | 10.0 | 10.0 | |||
| Time-based stock options outstanding under the plan | 1,545,462 | 470,769 | |||
| Performance-based stock options outstanding under the plan | — | 185,000 | |||
| Time-based restricted stock awards under the plan | — | 103,000 | |||
| Performance-based restricted stock awards outstanding under the plan | — | 80,861 | |||
109
FORTEGRA FINANCIAL CORPORATION
NOTES TO CONSOLIDATED FINANCIAL STATEMENTS
(All Amounts in Thousands Except Share Amounts, Per Share Amounts or Unless Otherwise Noted)
Stock Options
A summary of the Company's time- and performance-based stock option activity is presented below:
| Time-Based | Performance-Based | ||||||||||||||||||||||||||
| Options Outstanding | Weighted Average Exercise Price | Options Exercisable | Weighted Average Exercise Price | Options Outstanding(1) | Weighted Average Exercise Price | Options Exercisable | Weighted Average Exercise Price | ||||||||||||||||||||
| Balance, January 1, 2011 | 1,955,792 | $ | 3.29 | 1,780,663 | $ | 3.00 | — | $ | — | — | $ | — | |||||||||||||||
| Granted | 280,000 | 7.84 | — | — | — | — | — | — | |||||||||||||||||||
| Vested | — | — | 148,705 | 5.78 | — | — | — | — | |||||||||||||||||||
| Exercised | (322,061 | ) | 1.88 | (322,061 | ) | 1.88 | — | — | — | — | |||||||||||||||||
| Canceled/forfeited | (20,000 | ) | 7.84 | — | — | — | — | — | — | ||||||||||||||||||
| Balance, December 31, 2011 | 1,893,731 | $ | 4.15 | 1,607,307 | $ | 3.41 | — | $ | — | — | $ | — | |||||||||||||||
| Granted | 125,000 | 7.97 | — | — | 185,000 | 8.00 | — | — | |||||||||||||||||||
| Vested | — | — | 85,233 | 8.50 | — | — | — | — | |||||||||||||||||||
| Exercised | (2,500 | ) | 7.84 | (2,500 | ) | 7.84 | — | — | — | — | |||||||||||||||||
| Canceled/forfeited | — | — | — | — | — | — | — | — | |||||||||||||||||||
| Balance, December 31, 2012 | 2,016,231 | $ | 4.38 | 1,690,040 | $ | 3.66 | 185,000 | $ | 8.00 | — | $ | — | |||||||||||||||
| Weighted average remaining contractual term at December 31, 2012 (in years) | 5.0 | 4.2 | 9.5 | 0 | |||||||||||||||||||||||
(1) The performance-based stock options granted during the year ended December 31, 2012 will begin to vest equally over three years upon the Company's compensation committee determining that the Company has attained an Adjusted EBITDA of $46.0 million.
The following presents the Company's outstanding and exercisable time- and performance-based stock options by exercise price at December 31, 2012:
| Options Outstanding | Options Exercisable | ||||||||||||||
| Exercise Price | Option Shares Outstanding | Weighted Average Remaining Contractual Life (years) | Weighted Average Exercise Price | Option Shares Outstanding | Weighted Average Remaining Contractual Life (years) | Weighted Average Exercise Price | |||||||||
| $3.03 | 787,500 | 2.88 | $ | 3.03 | 787,500 | 2.88 | $ | 3.03 | |||||||
| 3.25 | 757,963 | 4.82 | 3.25 | 757,963 | 4.82 | 3.25 | |||||||||
| 7.84 | 257,500 | 8.50 | 7.84 | 80,214 | 8.50 | 7.84 | |||||||||
| 7.93 | 15,000 | 9.75 | 7.93 | — | — | — | |||||||||
| 7.97 | 110,000 | 9.67 | 7.97 | — | — | — | |||||||||
| 8.00 | 185,000 | 9.50 | 8.00 | — | — | — | |||||||||
| 11.00 | 88,268 | 7.96 | 11.00 | 64,363 | 7.96 | 11.00 | |||||||||
| Totals | 2,201,231 | 5.35 | $ | 4.69 | 1,690,040 | 4.21 | $ | 3.66 | |||||||
| Information on time- and performance-based stock options, vested and expected to vest, is as follows: | At | |||
| December 31, 2012 | ||||
| Number of shares vested and expected to vest | 2,188,170 | |||
| Weighted average remaining contractual life (in years) | 5.3 | |||
| Weighted average exercise price per option (in dollars) | $ | 4.66 | ||
| Intrinsic value | $ | 9,427 | ||
110
FORTEGRA FINANCIAL CORPORATION
NOTES TO CONSOLIDATED FINANCIAL STATEMENTS
(All Amounts in Thousands Except Share Amounts, Per Share Amounts or Unless Otherwise Noted)
Additional information on time- and performance-based options granted, vested and exercised is presented below:
| Years Ended December 31, | |||||||||||
| 2012 | 2011 | 2010 | |||||||||
| Weighted-average grant date fair value of stock options granted (in dollars) | $ | 2.80 | $ | 2.92 | $ | 3.18 | |||||
| Total stock options granted (in shares) | 310,000 | 280,000 | 88,268 | ||||||||
| Total fair value of stock options vested during the year | $ | 268 | $ | 268 | $ | 167 | |||||
Total intrinsic value of stock options exercised (1) | $ | — | $ | 2,920 | $ | 369 | |||||
| Cash received from stock option exercises | $ | 20 | $ | 607 | $ | 117 | |||||
| Tax benefits realized from exercised stock options | $ | — | $ | 45 | $ | 86 | |||||
| Cash used to settle equity instruments granted under stock-based compensation awards | $ | — | $ | — | $ | — | |||||
| New shares issued upon the exercise of stock options | 2,500 | 322,061 | 44,185 | ||||||||
| Outstanding stock options issued outside of existing plans (in shares) | 272,338 | 272,338 | 296,724 | ||||||||
(1) Calculated as the difference between the market value at the exercise date and the exercise price of the shares.
The weighted average assumptions used to estimate the fair values of all stock options granted is as follows:
| Years Ended December 31, | ||||||||
| 2012 | 2011 | 2010 | ||||||
| Expected term (years) | 6.2 | 6.1 | 5.0 | |||||
| Expected volatility | 34.34 | % | 33.95 | % | 32.71 | % | ||
| Expected dividends | — | % | — | % | — | % | ||
| Risk-free rate | 0.91 | % | 2.22 | % | 2.06 | % | ||
Restricted Stock Awards
A summary of the Company's time- and performance-based restricted stock award activity is presented below:
| Time-Based | Performance-Based | ||||||||||||
| Shares | Weighted Average Grant Date Fair Value | Shares | Weighted Average Grant Date Fair Value | ||||||||||
| Shares outstanding at January 1, 2011 | 60,000 | $ | 11.00 | 100,000 | $ | 11.00 | |||||||
| Grants | 7,000 | 7.64 | — | — | |||||||||
| Vests | (18,500 | ) | 10.36 | — | — | ||||||||
| Forfeitures | (15,500 | ) | 10.90 | (19,139 | ) | 11.00 | |||||||
| Shares outstanding at December 31, 2011 | 33,000 | 10.69 | 80,861 | 11.00 | |||||||||
| Grants | 88,000 | 7.48 | — | — | |||||||||
| Vests | (18,000 | ) | 10.43 | — | — | ||||||||
| Forfeitures | — | — | — | — | |||||||||
| Shares outstanding at December 31, 2012 | 103,000 | $ | 8.00 | 80,861 | $ | 11.00 | |||||||
Stock-based Compensation Expense
Total time- and performance-based stock-based compensation expense and the related income tax (benefit), as recognized on the Consolidated Statements of Income, is as follows:
| Years Ended December 31, | |||||||||||
| 2012 | 2011 | 2010 | |||||||||
| Personnel costs | $ | 661 | $ | 593 | $ | 167 | |||||
| Other operating expenses | 293 | 154 | 9 | ||||||||
| Income tax benefit | (365 | ) | (286 | ) | (67 | ) | |||||
| Net stock-based compensation expense | $ | 589 | $ | 461 | $ | 109 | |||||
| Additional information on total non-vested stock-based compensation is as follows: | At | ||||||
| December 31, 2012 | |||||||
| Stock Options | Restricted Stock Awards | ||||||
| Unrecognized compensation cost related to non-vested awards | $ | 1,180 | $ | 1,039 | |||
| Weighted-average recognition period (in years) | 2.7 | 4.7 | |||||
111
FORTEGRA FINANCIAL CORPORATION
NOTES TO CONSOLIDATED FINANCIAL STATEMENTS
(All Amounts in Thousands Except Share Amounts, Per Share Amounts or Unless Otherwise Noted)
Employee Stock Purchase Plan
The Company has an Employee Stock Purchase Plan ("ESPP"),which allows the Company to issue up to 1,000,000 shares of common stock to all eligible employees, including the Company's named executive officers, under the same offering and eligibility terms. The ESPP qualifies under Section 423 of the Internal Revenue Code and allows eligible employees to contribute, at their discretion, up to 10% of their payroll, up to $25,000 per year, to purchase up to a maximum of 3,500 shares of the Company's common stock per offering period. The purchase price of Fortegra's common stock is equal to 85% of the lesser of the fair market value of the closing stock price of Fortegra's common stock on either the first day of the offering period or the last day of the offering period. Each offering period has a duration of six months and begins on January 1st and July 1st of each year.
| Information related to the Company's ESPP is as follows: | Years Ended December 31, | ||||||||||
| 2012 | 2011 | 2010 (1) | |||||||||
| Common stock issued under the ESPP (in shares) | 53,511 | 10,167 | — | ||||||||
| Weighted-average purchase price per share by participant in the ESPP | $ | 6.18 | $ | 5.68 | $ | — | |||||
| Total cash proceeds received from the issuance of common shares under the ESPP | $ | 330 | $ | 100 | $ | — | |||||
| ESPP compensation costs recognized | $ | 90 | $ | 15 | $ | — | |||||
(1) The Company's ESPP began open enrollment in July 2011.
17. Share Repurchase Plan
Fortegra has an active share repurchase plan which allows the Company to purchase up to $10.0 million in total of the Company's common stock to be purchased from time to time through open market or private transactions. The plan was approved by the Board of Directors in November 2011 and provides for shares to be repurchased for general corporate purposes, which may include serving as a resource for funding potential acquisitions and employee benefit plans. The timing, price and quantity of purchases are at the discretion of Fortegra. The plan may be discontinued or suspended at any time and has no expiration date. None of the shares repurchased during the years ended December 31, 2012 and 2011, respectively, have been retired.
The following table shows the shares repurchased during the following periods:
| Years Ended December 31, | |||||||
| 2012 | 2011 | ||||||
| Shares repurchased during the period | 508,080 | 471,554 | |||||
| Total cost of shares repurchased during the period | $ | 3,923 | $ | 2,552 | |||
| Average price paid per share for shares purchased during the period | $ | 7.72 | $ | 5.41 | |||
From January 1, 2013 through March 29, 2013, the Company did not purchase any of its common stock under the share repurchase plan.
18. 401(k) Profit Sharing Plan
The Company has a 401(k) plan (the "401(k) Plan") available to employees meeting certain eligibility requirements. The 401(k)Plan allows employees to contribute, at their discretion, a percentage of their pre-tax annual compensation and allows for employees to select from various investment options based on their individual investment goals and risk tolerances. Under the 401(k) Plan, the Company will match 100% of each dollar of the employee contribution up to the maximum of 5% of the employee's annual compensation. The contributions of the 401(k) Plan are invested at the election of the employee in one or more investment options by a third party plan administrator. In July 2009, the Company suspended the matching contribution. The matching contribution was reinstated in January 2010 and subsequently suspended in August 2010.
| The Company's matching contributions to the 401(k) Plan are as follows: | Years Ended December 31, | ||||||||||
| 2012 | 2011 | 2010 | |||||||||
| 401(k) matching contribution expense | $ | — | $ | — | $ | 568 | |||||
19. Deferred Compensation Plan
The Company has a nonqualified deferred compensation plan for certain officers. Provision has been made for the compensation which is payable upon their retirement or death. The deferred compensation is to be paid to the individual or their beneficiaries over a period of ten years commencing with the first year following retirement or death. As of December 31, 2012, there were no further payments required under the plan.
112
FORTEGRA FINANCIAL CORPORATION
NOTES TO CONSOLIDATED FINANCIAL STATEMENTS
(All Amounts in Thousands Except Share Amounts, Per Share Amounts or Unless Otherwise Noted)
The Company also has deferred bonus agreements with several key executives whereby funds are contributed to "rabbi" trusts held for the benefit of the executives. The funds held in the rabbi trusts are included in cash and cash equivalents and the corresponding deferred compensation obligation is included in the line item, "Accrued expenses, accounts payable and other liabilities," on the Consolidated Balance Sheets. Pursuant to U.S. GAAP, the portion of the rabbi trusts invested in shares of the Company has been reflected in the treasury stock balance on the Consolidated Balance Sheets at December 31, 2012 and 2011.
20. Income Taxes
| The provision for income taxes consisted of the following: | At December 31, | ||||||||||
| 2012 | 2011 | 2010 | |||||||||
| As Restated | As Restated | ||||||||||
| Current | $ | 4,043 | $ | 5,419 | $ | 3,822 | |||||
| Deferred | 4,252 | 1,721 | 4,337 | ||||||||
| Income taxes | $ | 8,295 | $ | 7,140 | $ | 8,159 | |||||
The reconciliation of the income tax expense at the federal statutory income tax rate of 35% is as follows for the:
| Years Ended December 31, | ||||||||||||||||||||
| 2012 | 2011 - As Restated | 2010 - As Restated | ||||||||||||||||||
| Amount | Percent of Pre-tax Income | Amount | Percent of Pre-tax Income | Amount | Percent of Pre-tax Income | |||||||||||||||
| Income taxes at federal income tax rate | $ | 8,236 | 35.00 | % | $ | 7,168 | 35.00 | % | $ | 8,181 | 35.00 | % | ||||||||
| Effect of: | ||||||||||||||||||||
| Small life deduction | (444 | ) | (1.89 | ) | (375 | ) | (1.83 | ) | (465 | ) | (1.99 | ) | ||||||||
| Non-deductible expenses | 51 | 0.22 | 267 | 1.30 | 179 | 0.77 | ||||||||||||||
| Non-deductible preferred dividends | — | — | 105 | 0.51 | 301 | 1.29 | ||||||||||||||
| Tax exempt interest | (123 | ) | (0.52 | ) | (120 | ) | (0.59 | ) | (117 | ) | (0.50 | ) | ||||||||
| State taxes | 535 | 2.27 | 339 | 1.66 | 597 | 2.55 | ||||||||||||||
| Goodwill amortization | — | — | — | — | (243 | ) | (1.04 | ) | ||||||||||||
| Prior year tax true up | 98 | 0.42 | (506 | ) | (2.47 | ) | (647 | ) | (2.77 | ) | ||||||||||
| Other, net | (58 | ) | (0.25 | ) | 262 | 1.28 | 373 | 1.60 | ||||||||||||
| Income tax expense | $ | 8,295 | 35.25 | % | $ | 7,140 | 34.86 | % | $ | 8,159 | 34.91 | % | ||||||||
| The components of the Company's deferred taxes are as follows: | At December 31, | ||||||
| 2012 | 2011 | ||||||
| Gross deferred tax assets | As Restated | ||||||
| Unearned premiums | $ | 4,852 | $ | 4,825 | |||
| Deferred revenue | 8,002 | 8,140 | |||||
| Net operating loss carryforward | 516 | 1,413 | |||||
| Unrealized loss on interest rate swap | 1,636 | 1,260 | |||||
| Research credit | 671 | 676 | |||||
| Unpaid claims | 146 | 634 | |||||
| Deferred compensation | 483 | 248 | |||||
| Bad debt allowance | 238 | 118 | |||||
| Other deferred assets | 108 | 71 | |||||
| Total gross deferred tax assets | 16,652 | 17,385 | |||||
| Gross deferred tax liabilities | |||||||
| Deferred acquisition costs | 20,250 | 19,235 | |||||
| Other intangible assets | 14,218 | 14,170 | |||||
| Advanced commissions | 4,204 | 2,759 | |||||
| Depreciation on property and equipment | 5,246 | 4,642 | |||||
| Unrealized gains on investments | 1,290 | 424 | |||||
| Other basis differences in investments | 65 | 77 | |||||
| Other deferred tax liabilities | 37 | 47 | |||||
| Total gross deferred tax liabilities | 45,310 | 41,354 | |||||
| Deferred income taxes, net | $ | 28,658 | $ | 23,969 | |||
113
FORTEGRA FINANCIAL CORPORATION
NOTES TO CONSOLIDATED FINANCIAL STATEMENTS
(All Amounts in Thousands Except Share Amounts, Per Share Amounts or Unless Otherwise Noted)
At December 31, 2012, the Company had a net operating loss carry forward of $1.4 million, which is subject to certain limitations under IRC Section 382 and will begin to expire in 2019. The Company expects full utilization of the net operating loss carryforward by the end of 2013.
In addition, the Company has research and experimentation (research) tax credit carry forwards for federal and state income tax purposes in the amount of $0.5 million and $0.2 million, respectively. The federal research credit is also subject to certain limitations under IRC Section 382. The research credit carry forwards will begin to expire in 2019. As part of the valuation determinations of the subsidiary in which the research credit was generated, the Company recorded a $0.2 million liability against the research credit carryforward deferred tax asset.
The Company has reviewed its uncertain tax positions and management has concluded that there are no additional amounts required to be recorded in accordance with ASC 740-10.
As of December 31, 2012, the Company was under examination by the Internal Revenue Service ("IRS") for the 2009 and 2010 tax years. In February 2013, the IRS completed its field audit for those tax years and presented preliminary findings. The Company has agreed to those findings and paid $57.0 thousand, an amount considered immaterial to the consolidated group as of December 31, 2012. In March 2013, the Company received notice from the IRS that the audit report has been fully approved. The assessment will be expensed in the first quarter of 2013.
21. Fair Value of Financial Instruments
| The carrying and fair values of financial instruments are as follows: | At | ||||||||||||||
| December 31, 2012 | December 31, 2011 | ||||||||||||||
| Carrying Value | Fair Value | Carrying Value | Fair Value | ||||||||||||
| Financial assets: | As Restated | As Restated | |||||||||||||
| Cash and cash equivalents | $ | 15,209 | $ | 15,209 | $ | 31,339 | $ | 31,339 | |||||||
| Fixed maturity securities: | |||||||||||||||
| Obligations of the U.S. Treasury and U.S. Government agencies | 23,178 | 23,178 | 26,360 | 26,360 | |||||||||||
| Municipal securities | 17,041 | 17,041 | 17,992 | 17,992 | |||||||||||
| Corporate securities | 70,008 | 70,008 | 47,472 | 47,472 | |||||||||||
| Mortgage-backed securities | 289 | 289 | 1,298 | 1,298 | |||||||||||
| Asset-backed securities | 125 | 125 | 387 | 387 | |||||||||||
| Equity securities: | |||||||||||||||
| Common stock - publicly traded | 42 | 42 | 39 | 39 | |||||||||||
| Preferred stock - publicly traded | 5,107 | 5,107 | 52 | 52 | |||||||||||
| Common stock - non-publicly traded | 58 | 58 | 114 | 114 | |||||||||||
| Preferred stock - non-publicly traded | 1,013 | 1,013 | 1,014 | 1,014 | |||||||||||
| Notes receivable | 11,290 | 11,290 | 3,603 | 3,603 | |||||||||||
| Accounts and premiums receivable, net | 27,026 | 27,026 | 19,690 | 19,690 | |||||||||||
| Other receivables | 13,511 | 13,511 | 9,465 | 9,465 | |||||||||||
| Short-term investments | 1,222 | 1,222 | 1,070 | 1,070 | |||||||||||
| Total financial assets | $ | 185,119 | $ | 185,119 | $ | 159,895 | $ | 159,895 | |||||||
| Financial liabilities: | |||||||||||||||
| Notes payable | $ | 89,438 | $ | 89,438 | $ | 73,000 | $ | 73,000 | |||||||
| Preferred trust securities | 35,000 | 35,000 | 35,000 | 35,000 | |||||||||||
| Interest rate swap | 4,338 | 4,338 | 3,601 | 3,601 | |||||||||||
| Total financial liabilities | $ | 128,776 | $ | 128,776 | $ | 111,601 | $ | 111,601 | |||||||
114
FORTEGRA FINANCIAL CORPORATION
NOTES TO CONSOLIDATED FINANCIAL STATEMENTS
(All Amounts in Thousands Except Share Amounts, Per Share Amounts or Unless Otherwise Noted)
The Company's financial assets and liabilities accounted for at fair value by level within the fair value hierarchy are as follows:
| At December 31, 2012 | Fair Value Measurements Using: | |||||||||||
| Quoted prices in active markets for identical assets | Significant other observable inputs | Significant unobservable inputs | ||||||||||
| Fair Value | (Level 1) | (Level 2) | (Level 3) | |||||||||
| Financial Assets: | ||||||||||||
| Fixed maturity securities: | ||||||||||||
| Obligations of the U.S. Treasury and U.S. Government agencies | $ | 23,178 | $ | — | $ | 23,178 | $ | — | ||||
| Municipal securities | 17,041 | — | 17,041 | — | ||||||||
| Corporate securities | 70,008 | — | 69,956 | 52 | ||||||||
| Mortgage-backed securities | 289 | — | 289 | — | ||||||||
| Asset-backed securities | 125 | — | 125 | — | ||||||||
| Equity securities: | ||||||||||||
| Common stock - publicly traded | 42 | — | 42 | — | ||||||||
| Preferred stock - publicly traded | 5,107 | 5,107 | — | — | ||||||||
| Common stock - non-publicly traded | 58 | — | — | 58 | ||||||||
| Preferred stock - non-publicly traded | 1,013 | — | — | 1,013 | ||||||||
| Short-term investments | 1,222 | 1,222 | — | — | ||||||||
| Total assets | $ | 118,083 | $ | 6,329 | $ | 110,631 | $ | 1,123 | ||||
| Financial Liabilities: | ||||||||||||
| Interest rate swap | $ | 4,338 | $ | — | $ | 4,338 | $ | — | ||||
| At December 31, 2011 | Fair Value Measurements Using: | |||||||||||
| Quoted prices in active markets for identical assets | Significant other observable inputs | Significant unobservable inputs | ||||||||||
| Fair Value | (Level 1) | (Level 2) | (Level 3) | |||||||||
| Financial Assets: | ||||||||||||
| Fixed maturity securities: | ||||||||||||
| Obligations of the U.S. Treasury and U.S. Government agencies | $ | 26,360 | $ | — | $ | 26,360 | $ | — | ||||
| Municipal securities | 17,992 | — | 17,992 | — | ||||||||
| Corporate securities | 47,472 | — | 47,396 | 76 | ||||||||
| Mortgage-backed securities | 1,298 | — | 1,298 | — | ||||||||
| Asset-backed securities | 387 | — | 387 | — | ||||||||
| Equity securities: | ||||||||||||
| Common stock - publicly traded | 39 | 39 | — | — | ||||||||
| Preferred stock - publicly traded | 52 | 52 | — | — | ||||||||
| Common stock - non-publicly traded | 114 | — | — | 114 | ||||||||
| Preferred stock - non-publicly traded | 1,014 | — | — | 1,014 | ||||||||
| Short-term investments | 1,070 | 1,070 | — | — | ||||||||
| Total Assets | $ | 95,798 | $ | 1,161 | $ | 93,433 | $ | 1,204 | ||||
| Financial Liabilities: | ||||||||||||
| Interest rate swap | $ | 3,601 | $ | — | $ | 3,601 | $ | — | ||||
There were no transfers between Level 1 and Level 2 for the year ended December 31, 2012. For the year ended December 31, 2012, a single equity security was transferred from Level 3 to Level 2. This transfer occurred due to the availability of Level 2 pricing for the equity security, which was unavailable in prior periods. The Company's use of Level 3 unobservable inputs included 7 individual securities that accounted for 1.0% of total investments at December 31, 2012. The Company utilized an independent third party pricing service to value 5 of the Level 3 securities. The value of 2 equity securities in Level 3, which are non-publicly traded preferred stocks, were calculated by the Company. One of the equity securities, with a value of $1.0 million was valued by taking into account the strength of the issuer's parent company guaranteeing the dividend of the issuer. The second Level 3 equity security, with a value of $13.0 thousand was valued by estimating the total value of the Class-A shares outstanding by the issuer and a review of the company's audited financial statements. At December 31, 2011, the Company had 12 individual securities valued under Level 3 that accounted for 1.3% of total investments.
115
FORTEGRA FINANCIAL CORPORATION
NOTES TO CONSOLIDATED FINANCIAL STATEMENTS
(All Amounts in Thousands Except Share Amounts, Per Share Amounts or Unless Otherwise Noted)
| The following table summarizes the changes in Level 3 assets measured at fair value: | For the Years Ended December 31, | ||||||
| 2012 | 2011 | ||||||
| Beginning balance, January 1, | $ | 1,204 | $ | 1,425 | |||
| Total investment gains or losses (realized/unrealized): | |||||||
| Included in net income | — | 319 | |||||
| Included in other comprehensive (loss) | (31 | ) | (120 | ) | |||
| Sales | (47 | ) | (522 | ) | |||
| Transfers (out of) into Level 3 | (3 | ) | 102 | ||||
| Ending balance, December 31, | $ | 1,123 | $ | 1,204 | |||
22. Statutory Reporting and Insurance Subsidiaries Dividend Restrictions
The Company's insurance subsidiaries may pay dividends to the Company, subject to statutory restrictions. Payments in excess of statutory restrictions (extraordinary dividends) to the Company are permitted only with prior approval of the insurance departments of the applicable state of domicile. All dividends from subsidiaries were eliminated in the Consolidated Financial Statements. The following table sets forth the dividends paid to the Company by its insurance company subsidiaries for the following periods:
| For the Years Ended December 31, | |||||||
| 2012 | 2011 | ||||||
| Ordinary dividends | $ | 2,783 | $ | 6,956 | |||
| Extraordinary dividends | — | 830 | |||||
| Total dividends | $ | 2,783 | $ | 7,786 | |||
The following table details the combined statutory capital and surplus of the Company's insurance subsidiaries, the required minimum statutory capital and surplus, as required by the laws of the states in which they are domiciled and the combined amount available for ordinary dividends of the Company's insurance subsidiaries for the following periods:
| At December 31, | |||||||
| 2012 | 2011 | ||||||
| Combined statutory capital and surplus of the Company's insurance subsidiaries | $ | 53,885 | $ | 50,230 | |||
| Required minimum statutory capital and surplus | $ | 15,300 | $ | 15,300 | |||
| Amount available for ordinary dividends of the Company's insurance subsidiaries | $ | 4,500 | $ | 2,344 | |||
Under the NAIC's Risk-Based Capital Act of 1995, a company's RBC is calculated by applying certain risk factors to various asset, claim and reserve items. If a company's adjusted surplus falls below calculated RBC thresholds, regulatory intervention or oversight is required. The insurance subsidiaries' RBC levels, as calculated in accordance with the NAIC's RBC instructions, exceeded all RBC thresholds as of December 31, 2012 and 2011, respectively.
23. Commitments and Contingencies
Commitments
The Company, from time to time, may in the ordinary normal business enter into certain contractual obligations or commitments.
As part of the 2012 acquisition of ProtectCELL, the Company has a conditional commitment to provide up to $10.2 million of additional capital ("Additional Fortegra Capital Contributions") to ProtectCELL if the board of directors of ProtectCELL (the "PC Board") determines that ProtectCELL requires additional funds to support expansion and growth, or other appropriate business needs.
The Company is obligated to evaluate any such funding request received from the PC Board in good faith to determine whether in the Company's reasonable business judgment the requested capital should be contributed. Fortegra is not required to honor the funding request from the PC Board if it in good faith deems the request to be imprudent or unjustified.
The benefits of such additional funding would inure to the Company and to the non-controlling ownership interest of ProtectCell, in proportion to their respective ownership interests. However, in return for each $1,000 of Additional Fortegra Capital Contributions, the Fortegra Members shall receive one Series A Preferred Unit. Any unreturned Series A Preferred contribution is deducted from ProtectCELL's valuation in determining the option price.
116
FORTEGRA FINANCIAL CORPORATION
NOTES TO CONSOLIDATED FINANCIAL STATEMENTS
(All Amounts in Thousands Except Share Amounts, Per Share Amounts or Unless Otherwise Noted)
Contingencies
The Company is a party to claims and litigation in the normal course of its operations. Management believes that the ultimate outcome of these matters will not have a material adverse effect on the consolidated financial condition, results of operations or cash flows of the Company.
In the Payment Protection segment, the Company is currently a defendant in lawsuits that relate to marketing and/or pricing issues that involve claims for punitive, exemplary or extra-contractual damages in amounts substantially in excess of the covered claim. Such litigation includes Lawson v. Life of the South Insurance Co., which was filed on March 13, 2006, in the Superior Court of Muscogee County, Georgia, and later moved to the United States District Court for the Middle District of Georgia, Columbus Division. The allegations involve the Company's alleged duty to refund unearned premiums on credit insurance policies, even when the Company has not been informed of the payoff of the underlying finance contract. The action seeks an injunction requiring remedial action, as well as a variety of damages, including punitive damages and attorney fees and costs. The action was brought as a class action, however the Company's May 11, 2012 Motion to Strike or Dismiss Plaintiffs' Class Action Allegations, or in the Alternative, to Deny Class Certification was granted on September 28, 2012. Plaintiff's appeal of such ruling was denied on December 7, 2012. The merits discovery phase continues in the individual, underlying case.
Also in the Payment Protection segment, the Company is currently a defendant in Mullins v. Southern Financial Life Insurance Co., which was filed on February 2, 2006, in the Pike Circuit Court, in the Commonwealth of Kentucky. A class was certified on June 25, 2010. At issue is the duration or term of coverage under certain policies. The action alleges violations of the Consumer Protection Act and certain insurance statutes, as well as common law fraud. The action seeks compensatory and punitive damages, attorney fees and interest. The parties are currently involved in the merits discovery phase and discovery disputes have arisen. Plaintiffs filed a Motion for Sanctions on April 5, 2012 in connection with the Company's efforts to locate and gather certificates and other documents from the Company's agents. While the court did not award sanctions, it did order the Company to subpoena certain records from its agents. The Company filed an appeal of this order, which was denied on August 31, 2012. The Company is currently appealing the denial in the Kentucky Supreme Court. To date, no trial date has been set.
In the Motor Clubs business in the Payment Protection segment, the Company is currently a Defendant in Dill and Thurman v. Continental Car Club, Inc. and Fortegra Financial Corp., which was filed on August 18, 2011 in the Tennessee Chancery Court, Rhea County. The Plaintiffs assert claims for breach of their employment and non-competition agreements, among other claims, and seek injunctive relief and damages in connection with the Company's purchase of Continental Car Club, Inc. from Plaintiffs in May 2010. The trial court ruled in November 2012 that Plaintiffs resigned for good reason from the Company, the result of which is that the Company can enforce the non-competition and non-solicitation provisions contained in the Plaintiffs' employment agreements for a period of up to two years, but that the Company is required to pay Plaintiffs base salary and accrued benefits during such period. As of December 31, 2012, the value of such salary and benefits is $0.4 million; the value would increase over time through the two-year period to an estimated maximum of approximately $0.8 million. The Company has filed for an appeal of this ruling and will vigorously defend its position. The Company believes that it is not probable that the judgment will be upheld through the appeal process, and that reasonably possible outcomes range from $0 to the amount of the judgment. Accordingly, the Company has not recorded a charge with respect to this loss contingency as of December 31, 2012.
The Company considers such litigation customary in its lines of business. In management's opinion, based on information available at this time, the ultimate resolution of such litigation, which it is vigorously defending, should not be materially adverse to the financial position, results of operations or cash flows of the Company. It should be noted that large punitive damage awards, bearing little relation to actual damages sustained by plaintiffs, have been awarded in certain states against other companies in the credit insurance business. Loss contingencies may be taken as developments warrant, although such amounts are not reasonably estimable at this time.
24. Segment Results
The Company conducts business through three business segments: (i) Payment Protection; (ii) BPO; and (iii) Brokerage. The revenue for each segment is presented to reflect the operating characteristics of the segment. The Company allocates certain revenues and expenses to the segments. These items consist primarily of corporate-related income, transaction related costs, executive stock compensation and other overhead expenses. Segment assets are not presented to the Company's chief operating decision maker for operational decision-making and therefore are not disclosed in the accompanying table.
The Company measures the profitability of its business segments with the allocation of Corporate revenues and expenses and without taking into account amortization, depreciation, interest expense and income taxes. The Company refers to this financial performance measure as segment EBITDA (earnings before interest, taxes, depreciation and amortization). The Company's financial measure of segment EBITDA meets the definition of a Non-GAAP financial measure and is not a recognized term under U.S. GAAP, nor is it an alternative to the U.S. GAAP financial measures presented in this Form 10-K. The Non-GAAP financial measure in this Form 10-K should be used in addition to, but not as a substitute for, the U.S. GAAP financial measures presented elsewhere in this Form 10-K.
117
FORTEGRA FINANCIAL CORPORATION
NOTES TO CONSOLIDATED FINANCIAL STATEMENTS
(All Amounts in Thousands Except Share Amounts, Per Share Amounts or Unless Otherwise Noted)
The Company believes that this Non-GAAP financial measure provides useful information to management, analysts and investors regarding financial and business trends relating to the Company's results of operations and financial condition. The variability of the Company's segment EBITDA is significantly affected by segment net revenues because a large portion of the Company's operating expenses are fixed. The Company's industry peers may also provide similar supplemental Non-GAAP financial measures, although they may not use the same or comparable terminology and may not make identical adjustments.
The following table presents the Company's business segment results:
| For the Years Ended December 31, | |||||||||||
| 2012 | 2011 | 2010 | |||||||||
| As Restated | As Restated | ||||||||||
| Segment Net Revenue | |||||||||||
| Payment Protection | |||||||||||
| Service and administrative fees | $ | 70,365 | $ | 76,244 | $ | 34,568 | |||||
| Ceding commission | 34,825 | 29,495 | 28,767 | ||||||||
| Net investment income | 3,068 | 3,368 | 4,073 | ||||||||
| Net realized investment gains (losses) | 3 | 4,193 | 650 | ||||||||
| Other income | 269 | 170 | 230 | ||||||||
| Net earned premium | 127,625 | 115,503 | 111,805 | ||||||||
| Net losses and loss adjustment expenses | (40,219 | ) | (37,949 | ) | (36,035 | ) | |||||
| Member benefit claims | (4,642 | ) | (4,409 | ) | (466 | ) | |||||
| Commissions | (128,741 | ) | (126,918 | ) | (92,646 | ) | |||||
| Total Payment Protection Net Revenue | 62,553 | 59,697 | 50,946 | ||||||||
| BPO | 18,424 | 15,584 | 17,069 | ||||||||
| Brokerage | |||||||||||
| Brokerage commissions and fees | 35,306 | 34,396 | 24,620 | ||||||||
| Service and administrative fees | 1,761 | 2,636 | 4,617 | ||||||||
| Total Brokerage | 37,067 | 37,032 | 29,237 | ||||||||
| Total segment net revenue | 118,044 | 112,313 | 97,252 | ||||||||
| Operating Expenses | |||||||||||
| Payment Protection | 36,420 | 33,514 | 25,126 | ||||||||
| BPO | 14,227 | 11,598 | 10,002 | ||||||||
Brokerage (1) | 28,355 | 29,289 | 23,529 | ||||||||
| Corporate | — | 1,763 | 2,130 | ||||||||
| Total operating expenses | 79,002 | 76,164 | 60,787 | ||||||||
| EBITDA | |||||||||||
| Payment Protection | 26,133 | 26,183 | 25,820 | ||||||||
| BPO | 4,197 | 3,986 | 7,067 | ||||||||
Brokerage (1) | 8,712 | 7,743 | 5,708 | ||||||||
| Corporate | — | (1,763 | ) | (2,130 | ) | ||||||
| Total EBITDA | 39,042 | 36,149 | 36,465 | ||||||||
| Depreciation and Amortization | |||||||||||
| Payment Protection | 3,590 | 4,205 | 2,352 | ||||||||
| BPO | 2,290 | 1,124 | 598 | ||||||||
| Brokerage | 3,006 | 2,700 | 1,678 | ||||||||
| Total depreciation and amortization | 8,886 | 8,029 | 4,628 | ||||||||
| Interest Expense | |||||||||||
| Payment Protection | 4,146 | 4,649 | 7,197 | ||||||||
| BPO | 1,035 | 419 | 433 | ||||||||
| Brokerage | 1,443 | 2,573 | 834 | ||||||||
| Total interest expense | 6,624 | 7,641 | 8,464 | ||||||||
| Income before income taxes and non-controlling interests | |||||||||||
118
FORTEGRA FINANCIAL CORPORATION
NOTES TO CONSOLIDATED FINANCIAL STATEMENTS
(All Amounts in Thousands Except Share Amounts, Per Share Amounts or Unless Otherwise Noted)
| For the Years Ended December 31, | |||||||||||
| 2012 | 2011 | 2010 | |||||||||
| As Restated | As Restated | ||||||||||
| Payment Protection | 18,397 | 17,329 | 16,271 | ||||||||
| BPO | 872 | 2,443 | 6,036 | ||||||||
Brokerage (1) | 4,263 | 2,470 | 3,196 | ||||||||
| Corporate | — | (1,763 | ) | (2,130 | ) | ||||||
| Total income before income taxes and non-controlling interests | 23,532 | 20,479 | 23,373 | ||||||||
| Income taxes | 8,295 | 7,140 | 8,159 | ||||||||
| Less: net income (loss) attributable to non-controlling interests | 72 | (170 | ) | 20 | |||||||
| Net income | $ | 15,165 | $ | 13,509 | $ | 15,194 | |||||
(1) - Includes loss on sale of subsidiary of $477 for the year ended December 31, 2011.
The following table reconciles segment information to the Company's Consolidated Statements of Income and provides a summary of other key financial information for each segment:
Reconciliation of Segment Net Revenue to Total Revenue and EBITDA to Net Income | For the Years Ended December 31, | ||||||||||
| 2012 | 2011 | 2010 | |||||||||
| As Restated | As Restated | ||||||||||
| Segment Net Revenue | |||||||||||
| Payment Protection | $ | 62,553 | $ | 59,697 | $ | 50,946 | |||||
| BPO | 18,424 | 15,584 | 17,069 | ||||||||
| Brokerage | 37,067 | 37,032 | 29,237 | ||||||||
| Segment net revenues | 118,044 | 112,313 | 97,252 | ||||||||
| Net losses and loss adjustment expenses | 40,219 | 37,949 | 36,035 | ||||||||
| Member benefit claims | 4,642 | 4,409 | 466 | ||||||||
| Commissions | 128,741 | 126,918 | 92,646 | ||||||||
| Total segment revenue | 291,646 | 281,589 | 226,399 | ||||||||
| Operating Expenses | |||||||||||
| Payment Protection | 36,420 | 33,514 | 25,126 | ||||||||
| BPO | 14,227 | 11,598 | 10,002 | ||||||||
Brokerage (1) | 28,355 | 29,289 | 23,529 | ||||||||
| Corporate | — | 1,763 | 2,130 | ||||||||
| Total operating expenses | 79,002 | 76,164 | 60,787 | ||||||||
| Net losses and loss adjustment expenses | 40,219 | 37,949 | 36,035 | ||||||||
| Member benefit claims | 4,642 | 4,409 | 466 | ||||||||
| Commissions | 128,741 | 126,918 | 92,646 | ||||||||
| Total operating expenses before depreciation, amortization and interest expense | 252,604 | 245,440 | 189,934 | ||||||||
| EBITDA | |||||||||||
| Payment Protection | 26,133 | 26,183 | 25,820 | ||||||||
| BPO | 4,197 | 3,986 | 7,067 | ||||||||
Brokerage (1) | 8,712 | 7,743 | 5,708 | ||||||||
| Corporate | — | (1,763 | ) | (2,130 | ) | ||||||
| Total EBITDA | 39,042 | 36,149 | 36,465 | ||||||||
| Depreciation and amortization | |||||||||||
| Payment Protection | 3,590 | 4,205 | 2,352 | ||||||||
| BPO | 2,290 | 1,124 | 598 | ||||||||
119
FORTEGRA FINANCIAL CORPORATION
NOTES TO CONSOLIDATED FINANCIAL STATEMENTS
(All Amounts in Thousands Except Share Amounts, Per Share Amounts or Unless Otherwise Noted)
Reconciliation of Segment Net Revenue to Total Revenue and EBITDA to Net Income | For the Years Ended December 31, | ||||||||||
| 2012 | 2011 | 2010 | |||||||||
| As Restated | As Restated | ||||||||||
| Brokerage | 3,006 | 2,700 | 1,678 | ||||||||
| Total depreciation and amortization | 8,886 | 8,029 | 4,628 | ||||||||
| Interest Expense | |||||||||||
| Payment Protection | 4,146 | 4,649 | 7,197 | ||||||||
| BPO | 1,035 | 419 | 433 | ||||||||
| Brokerage | 1,443 | 2,573 | 834 | ||||||||
| Total interest expense | 6,624 | 7,641 | 8,464 | ||||||||
| Income (loss) before income taxes and non-controlling interests | |||||||||||
| Payment Protection | 18,397 | 17,329 | 16,271 | ||||||||
| BPO | 872 | 2,443 | 6,036 | ||||||||
Brokerage (1) | 4,263 | 2,470 | 3,196 | ||||||||
| Corporate | — | (1,763 | ) | (2,130 | ) | ||||||
| Total income before income taxes and non-controlling interests | 23,532 | 20,479 | 23,373 | ||||||||
| Income taxes | 8,295 | 7,140 | 8,159 | ||||||||
| Less: net income (loss) attributable to non-controlling interests | 72 | (170 | ) | 20 | |||||||
| Net income | $ | 15,165 | $ | 13,509 | 15,194 | ||||||
(1) - Includes loss on sale of subsidiary of $477 for the year ended December 31, 2011.
25. Related Party Transactions
In conjunction with the December 31, 2012 acquisition of ProtectCELL, the Company assumed an office space lease between ProtectCELL and 39500 High Pointe, LLC, ("High Pointe"). The ownership of High Pointe includes three members who were the founding members and are currently employees of ProtectCELL. The Company did not make any lease payments to High Pointe for the year ended December 31, 2012.
In addition, ProtectCELL holds a $6.1 million note receivable carrying an interest rate of 8.00% from High Pointe, which is fully secured by a mortgage on the office building owned by High Pointe. For the year ending December 31, 2012, the Company did not receive payments from High Pointe on the note receivable.
An executive officer of ProtectCELL owns multiple wireless retail locations, which sell ProtectCELL protection plans to wireless retail customers. For the year ending December 31, 2012, the Company did not record income related to this related party arrangement.
In conjunction with the December 31, 2012 acquisition of 4Warranty, the Company assumed an office space lease between 4Warranty and Source International Incorporated ("Source"), effective January 1, 2013. The ownership of Source is comprised of two individuals who have consulting relationships with the Company. The Company did not make any lease payments to Source for the year ended December 31, 2012.
In January 2012, the Company recorded a receivable due from an officer of the Company relating to the 2010 acquisition of South Bay Acceptance Corporation, which has a balance of $0.1 million at December 21, 2012 and 2011, respectively.
In December 2011, the Company entered into an information technology support services agreement (the "IT Agreement") with a company for which a member serving on the Company's Board of Directors also serves on the board of the company receiving the information support services. The IT Agreement has no set term and calls for a total of $0.3 million plus reimbursement of expenses to be received by the Company over the duration of the agreement.
In December 2011, the Company entered into a marketing and referral agreement (the "Marketing Agreement") with a company in which a member serving on the Company's Board of Directors also serves on the board of the company providing the marketing services (the "Marketer"). The Marketing Agreement has a five year term and requires the Company to pay the Marketer a per account fee per month based on the number of enrolled customers the Marketer obtains for the Company.
120
FORTEGRA FINANCIAL CORPORATION
NOTES TO CONSOLIDATED FINANCIAL STATEMENTS
(All Amounts in Thousands Except Share Amounts, Per Share Amounts or Unless Otherwise Noted)
In connection with the Summit Partners acquisition of the Company on June 20, 2007, $20.0 million of subordinated debentures were issued to affiliates of Summit Partners, a related party, and reported in the notes payable line of the Consolidated Balance Sheets. The subordinated debentures had an original maturity of June 20, 2012, which was subsequently amended to mature in June 2013, and bore interest at 14% per annum on the principal amount of such subordinated debentures, payable quarterly. In December 2010, the Company paid off the entire $20.0 million of outstanding subordinated debentures for $20.6 million, which included accrued but unpaid interest to the redemption date.
The following table details the amounts recorded on the Company's Consolidated Balance Sheets and Consolidated Statements of Income resulting from related party transactions:
| For the Years Ended December 31, | |||||||||||
| 2012 | 2011 | 2010 | |||||||||
| Income recorded by the Company from related parties | $ | 218 | $ | — | $ | — | |||||
| Related party interest expense | $ | — | $ | — | $ | 2,769 | |||||
| At | |||||||||||
| December 31, 2012 | December 31, 2011 | ||||||||||
| Accounts receivable from related parties | $ | — | $ | 125 | |||||||
| Notes receivable from related parties | $ | 6,269 | $ | — | |||||||
26. Subsequent Events
Subsequent events have been measured through the date on which the Consolidated Financial Statements were filed. Management has determined that the following events merit disclosure as subsequent events:
Stock-Based Compensation Awards
On January 1, 2013, the Company granted 228,981 performance-based stock options and 76,326 performance-based restricted stock awards under the Company's Long-Term Incentive Plan ("LTIP").
The performance-based awards will vest, if at all, should the Company achieves three-year performance goals on or before December 31, 2015 for (i) net revenue (Compound Annual Growth Rate), (ii) earnings growth (Net Income) and (iii) profitable growth (Return on Average Equity). The performance metrics are equally weighted such that achievement of any one target results in vesting of one-third of the total equity award. If any of the target(s) are not attained by December 31, 2015, the award(s) associated with the unattained targets will be canceled.
In February 2013, the Company granted a total of 75,000 time-based restricted stock awards, equally distributed, to five of its Directors. The restricted stock vests equally on each of the three anniversaries of the grant date.
American Taxpayer Relief Act of 2012
On January 2, 2013, U.S. tax law was enacted which extends, through 2013, several expired or expiring temporary business tax provisions. The Company is still quantifying the impact of this law change; however, it is not expected to have a material impact on the Company's Consolidated Financial Statements.
Consolidation of Operations Plan
As disclosed on January 18, 2013 in the Company's Current Report on Form 8-K, effective January 14, 2013, the Company committed to a plan to consolidate the Company's fulfillment, claims administration and information technology functions for all its insurance related products (the "Plan"). Prior to the Plan, such functions resided in the Company's individual business units. The decision is part of the Company's efforts to streamline its operations, focus its resources and provide first in class service to its customers. When fully implemented, approximately 40 employee and contract positions will be eliminated.
Acquisition of Response Indemnity Company of California
On February 1, 2013, the Company acquired 100% of the outstanding stock of Response Indemnity Company of California ("RICC"), from subsidiaries of the Kemper Corporation ("Kemper") for $4.8 million. RICC is a property/casualty insurance company domiciled and licensed in California. RICC has, at the time of purchase, approximately $4.2 million in capital and surplus and no policies in
121
FORTEGRA FINANCIAL CORPORATION
NOTES TO CONSOLIDATED FINANCIAL STATEMENTS
(All Amounts in Thousands Except Share Amounts, Per Share Amounts or Unless Otherwise Noted)
force. All remaining claim liabilities for previously issued policies are fully reinsured by Kemper's subsidiary, Trinity Universal Insurance Company.
Related Party Note Receivable Payoff
On March 15, 2013, the Company's subsidiary ProtectCELL, received $6.1 million representing the full payoff of the outstanding balance of the note receivable from High Pointe.
27. Summarized Quarterly Information (Unaudited)
The quarters ending March 31, 2012, June 30, 2012 and September 30, 2012 and the quarters ending March 31, 2011, June 30, 2011, September 30, 2011 and December 31, 2011 presented in the tables below have been restated as discussed in the Note, "Restatement," of the Consolidated Financial Statements and have been adjusted to reflect the retrospective adoption of ASU 2010-26, Accounting for Costs Associated with Acquiring or Renewing Insurance Contracts. See the Note, "Quarterly Information - Restated (Unaudited)," of the Notes to Consolidated Financial Statements for additional information on the line items impacted for the for the above noted periods.
| 2012 | |||||||||||||||
| First Quarter | Second Quarter | Third Quarter | Fourth Quarter | ||||||||||||
| As Restated | As Restated | As Restated | |||||||||||||
| Revenues | $ | 71,139 | $ | 70,313 | $ | 76,376 | $ | 70,747 | |||||||
| Net investment income | 743 | 732 | 744 | 849 | |||||||||||
| Net realized (losses) gains on the sale of investments | (3 | ) | 13 | (16 | ) | 9 | |||||||||
| Total revenues | 71,879 | 71,058 | 77,104 | 71,605 | |||||||||||
| Total expenses | 66,560 | 64,991 | 70,654 | 65,909 | |||||||||||
| Income before income taxes and non-controlling interest | 5,319 | 6,067 | 6,450 | 5,696 | |||||||||||
| Income taxes | 1,887 | 2,108 | 2,397 | 1,903 | |||||||||||
| Income before non-controlling interest | 3,432 | 3,959 | 4,053 | 3,793 | |||||||||||
| Less: net income attributable to non-controlling interest | 18 | 15 | 29 | 10 | |||||||||||
| Net income | $ | 3,414 | $ | 3,944 | $ | 4,024 | $ | 3,783 | |||||||
| Earnings per share: | |||||||||||||||
| Basic | $ | 0.17 | $ | 0.20 | $ | 0.21 | $ | 0.19 | |||||||
| Diluted | $ | 0.16 | $ | 0.19 | $ | 0.20 | $ | 0.18 | |||||||
| Weighted average common shares outstanding | |||||||||||||||
| Basic | 19,904,819 | 19,705,276 | 19,531,694 | 19,507,733 | |||||||||||
| Diluted | 20,739,196 | 20,632,233 | 20,463,238 | 20,507,329 | |||||||||||
| 2011 | |||||||||||||||
| First Quarter | Second Quarter | Third Quarter | Fourth Quarter | ||||||||||||
| As Restated | As Restated | As Restated | As Restated | ||||||||||||
| Revenues | $ | 65,736 | $ | 64,146 | $ | 71,285 | $ | 72,861 | |||||||
| Net investment income | 941 | 894 | 801 | 732 | |||||||||||
| Net realized gains on the sale of investments | 95 | 1,132 | 1,196 | 1,770 | |||||||||||
| Total revenues | 66,772 | 66,172 | 73,282 | 75,363 | |||||||||||
| Total expenses | 62,018 | 64,130 | 67,075 | 67,887 | |||||||||||
| Income before income taxes and non-controlling interest | 4,754 | 2,042 | 6,207 | 7,476 | |||||||||||
| Income taxes | 1,609 | 750 | 2,209 | 2,572 | |||||||||||
| Income before non-controlling interest | 3,145 | 1,292 | 3,998 | 4,904 | |||||||||||
| Less: net (loss) income attributable to non-controlling interest | (174 | ) | 2 | 1 | 1 | ||||||||||
| Net income | $ | 3,319 | $ | 1,290 | $ | 3,997 | $ | 4,903 | |||||||
| Earnings per share: | |||||||||||||||
| Basic | $ | 0.16 | $ | 0.06 | $ | 0.20 | $ | 0.24 | |||||||
| Diluted | $ | 0.15 | $ | 0.06 | $ | 0.19 | $ | 0.24 | |||||||
| Weighted average common shares outstanding | |||||||||||||||
| Basic | 20,464,592 | 20,510,254 | 20,404,441 | 20,343,038 | |||||||||||
| Diluted | 21,668,333 | 21,592,418 | 21,214,365 | 20,955,690 | |||||||||||
122
FORTEGRA FINANCIAL CORPORATION
NOTES TO CONSOLIDATED FINANCIAL STATEMENTS
(All Amounts in Thousands Except Share Amounts, Per Share Amounts or Unless Otherwise Noted)
28. Quarterly Information - Restated (Unaudited)
The following tables present the Company's restated quarterly information for the quarters ending March 31, 2012, June 30, 2012 and September 30, 2012 and for the quarters ending March 31, June 30, September 30, and December 31, 2011 and 2010, respectively.
Adjustments in the 2012 and 2011 periods to service and administrative fees, member benefit claims, and commissions represent the effects of restatements for the errors in Motor Clubs revenue presentation and revenue recognition as discussed in Note "Restatement" of the Notes to Consolidated Financial Statements, unless otherwise noted.
Adjustments in the 2010 periods to service and administrative fees, member benefit claims, and commissions represent the effects of restatements for the errors in Motor Clubs revenue presentation, as discussed in Note "Restatement".
| For the Three Months Ended | For the Three Months Ended | ||||||||||||||||||
| March 31, 2012 | June 30, 2012 | ||||||||||||||||||
| As Previously Reported | Adjustment | As Restated | As Previously Reported | Adjustment | As Restated | ||||||||||||||
| Revenues: | |||||||||||||||||||
| Service and administrative fees | $ | 9,340 | $ | 13,171 | $ | 22,511 | $ | 9,394 | $ | 12,392 | $ | 21,786 | |||||||
| Brokerage commissions and fees | 9,520 | — | 9,520 | 9,364 | — | 9,364 | |||||||||||||
| Ceding commission | 7,064 | — | 7,064 | 7,210 | — | 7,210 | |||||||||||||
| Net investment income | 743 | — | 743 | 732 | — | 732 | |||||||||||||
| Net realized investment (losses) gains | (3 | ) | — | (3 | ) | 13 | — | 13 | |||||||||||
| Net earned premium | 31,972 | — | 31,972 | 31,905 | — | 31,905 | |||||||||||||
| Other income | 72 | — | 72 | 48 | — | 48 | |||||||||||||
| Total revenues | 58,708 | 13,171 | 71,879 | 58,666 | 12,392 | 71,058 | |||||||||||||
| Expenses: | |||||||||||||||||||
| Net losses and loss adjustment expenses | 11,266 | — | 11,266 | 9,576 | — | 9,576 | |||||||||||||
| Member benefit claims | — | 1,303 | 1,303 | — | 1,098 | 1,098 | |||||||||||||
| Commissions | 20,039 | 11,949 | 31,988 | 19,892 | 11,390 | 31,282 | |||||||||||||
| Personnel costs | 11,392 | — | 11,392 | 12,367 | — | 12,367 | |||||||||||||
| Other operating expenses | 6,739 | — | 6,739 | 6,937 | — | 6,937 | |||||||||||||
| Depreciation and amortization | 738 | — | 738 | 975 | — | 975 | |||||||||||||
| Amortization of intangibles | 1,482 | — | 1,482 | 1,166 | — | 1,166 | |||||||||||||
| Interest expense | 1,652 | — | 1,652 | 1,590 | — | 1,590 | |||||||||||||
| Total expenses | 53,308 | 13,252 | 66,560 | 52,503 | 12,488 | 64,991 | |||||||||||||
| Income before income taxes and non-controlling interests | 5,400 | (81 | ) | 5,319 | 6,163 | (96 | ) | 6,067 | |||||||||||
| Income taxes | 1,919 | (32 | ) | 1,887 | 2,146 | (38 | ) | 2,108 | |||||||||||
| Income before non-controlling interests | 3,481 | (49 | ) | 3,432 | 4,017 | (58 | ) | 3,959 | |||||||||||
| Less: net income attributable to non-controlling interests | 18 | — | 18 | 15 | — | 15 | |||||||||||||
| Net income | $ | 3,463 | $ | (49 | ) | $ | 3,414 | $ | 4,002 | $ | (58 | ) | $ | 3,944 | |||||
| Earnings per share: | |||||||||||||||||||
| Basic | $ | 0.17 | $ | — | $ | 0.17 | $ | 0.20 | $ | — | $ | 0.20 | |||||||
| Diluted | $ | 0.17 | $ | (0.01 | ) | $ | 0.16 | $ | 0.19 | $ | — | $ | 0.19 | ||||||
| Weighted average common shares outstanding: | |||||||||||||||||||
| Basic | 19,904,819 | 19,904,819 | 19,705,276 | 19,705,276 | |||||||||||||||
| Diluted | 20,739,196 | 20,739,196 | 20,632,233 | 20,632,233 | |||||||||||||||
123
FORTEGRA FINANCIAL CORPORATION
NOTES TO CONSOLIDATED FINANCIAL STATEMENTS
(All Amounts in Thousands Except Share Amounts, Per Share Amounts or Unless Otherwise Noted)
| For the Three Months Ended | |||||||||
| September 30, 2012 | |||||||||
| As Previously Reported | Adjustment | As Restated | |||||||
| Revenues: | |||||||||
| Service and administrative fees | $ | 10,056 | $ | 12,842 | $ | 22,898 | |||
| Brokerage commissions and fees | 8,411 | — | 8,411 | ||||||
| Ceding commission | 11,122 | — | 11,122 | ||||||
| Net investment income | 744 | — | 744 | ||||||
| Net realized investment (losses) | (16 | ) | — | (16 | ) | ||||
| Net earned premium | 33,893 | — | 33,893 | ||||||
| Other income | 52 | — | 52 | ||||||
| Total revenues | 64,262 | 12,842 | 77,104 | ||||||
| Expenses: | |||||||||
| Net losses and loss adjustment expenses | 11,430 | — | 11,430 | ||||||
| Member benefit claims | — | 1,157 | 1,157 | ||||||
| Commissions | 21,548 | 11,829 | 33,377 | ||||||
| Personnel costs | 12,708 | — | 12,708 | ||||||
| Other operating expenses | 7,959 | — | 7,959 | ||||||
| Depreciation and amortization | 871 | — | 871 | ||||||
| Amortization of intangibles | 1,127 | — | 1,127 | ||||||
| Interest expense | 2,025 | — | 2,025 | ||||||
| Total expenses | 57,668 | 12,986 | 70,654 | ||||||
| Income before income taxes and non-controlling interests | 6,594 | (144 | ) | 6,450 | |||||
| Income taxes | 2,455 | (58 | ) | 2,397 | |||||
| Income before non-controlling interests | 4,139 | (86 | ) | 4,053 | |||||
| Less: net income attributable to non-controlling interests | 29 | — | 29 | ||||||
| Net income | $ | 4,110 | $ | (86 | ) | $ | 4,024 | ||
| Earnings per share: | |||||||||
| Basic | $ | 0.21 | $ | — | $ | 0.21 | |||
| Diluted | $ | 0.20 | $ | — | $ | 0.20 | |||
| Weighted average common shares outstanding: | |||||||||
| Basic | 19,531,694 | 19,531,694 | |||||||
| Diluted | 20,463,238 | 20,463,238 | |||||||
124
FORTEGRA FINANCIAL CORPORATION
NOTES TO CONSOLIDATED FINANCIAL STATEMENTS
(All Amounts in Thousands Except Share Amounts, Per Share Amounts or Unless Otherwise Noted)
| For the Three Months Ended | For the Three Months Ended | ||||||||||||||||||
| March 31, 2011 | June 30, 2011 | ||||||||||||||||||
| As Previously Reported | Adjustment | As Restated | As Previously Reported | Adjustment | As Restated | ||||||||||||||
| Revenues: | |||||||||||||||||||
| Service and administrative fees | $ | 9,116 | $ | 12,076 | $ | 21,192 | $ | 8,800 | $ | 12,321 | $ | 21,121 | |||||||
| Brokerage commissions and fees | 7,867 | — | 7,867 | 9,208 | — | 9,208 | |||||||||||||
| Ceding commission | 8,158 | — | 8,158 | 6,243 | — | 6,243 | |||||||||||||
| Net investment income | 941 | — | 941 | 894 | — | 894 | |||||||||||||
| Net realized investment gains | 95 | — | 95 | 1,132 | — | 1,132 | |||||||||||||
| Net earned premium | 28,437 | — | 28,437 | 27,536 | — | 27,536 | |||||||||||||
| Other income | 82 | — | 82 | 38 | — | 38 | |||||||||||||
| Total revenues | 54,696 | 12,076 | 66,772 | 53,851 | 12,321 | 66,172 | |||||||||||||
| Expenses: | |||||||||||||||||||
| Net losses and loss adjustment expenses | 9,373 | — | 9,373 | 9,251 | — | 9,251 | |||||||||||||
| Member benefit claims | — | 867 | 867 | — | 1,309 | 1,309 | |||||||||||||
| Commissions | 18,517 | 11,389 | 29,906 | 17,323 | 11,404 | 28,727 | |||||||||||||
| Personnel costs | 10,992 | — | 10,992 | 11,428 | — | 11,428 | |||||||||||||
| Other operating expenses | 7,214 | — | 7,214 | 9,298 | — | 9,298 | |||||||||||||
| Depreciation and amortization | 583 | — | 583 | 814 | — | 814 | |||||||||||||
| Amortization of intangibles | 1,052 | — | 1,052 | 1,378 | — | 1,378 | |||||||||||||
| Interest expense | 2,031 | — | 2,031 | 1,925 | — | 1,925 | |||||||||||||
| Total expenses | 49,762 | 12,256 | 62,018 | 51,417 | 12,713 | 64,130 | |||||||||||||
| Income before income taxes and non-controlling interests | 4,934 | (180 | ) | 4,754 | 2,434 | (392 | ) | 2,042 | |||||||||||
| Income taxes | 1,681 | (72 | ) | 1,609 | 907 | (157 | ) | 750 | |||||||||||
| Income before non-controlling interests | 3,253 | (108 | ) | 3,145 | 1,527 | (235 | ) | 1,292 | |||||||||||
| Less: net (loss) income attributable to non-controlling interests | (174 | ) | — | (174 | ) | 2 | — | 2 | |||||||||||
| Net income | $ | 3,427 | $ | (108 | ) | $ | 3,319 | $ | 1,525 | $ | (235 | ) | $ | 1,290 | |||||
| Earnings per share: | |||||||||||||||||||
| Basic | $ | 0.17 | $ | (0.01 | ) | $ | 0.16 | $ | 0.07 | $ | (0.01 | ) | $ | 0.06 | |||||
| Diluted | $ | 0.16 | $ | (0.01 | ) | $ | 0.15 | $ | 0.07 | $ | (0.01 | ) | $ | 0.06 | |||||
| Weighted average common shares outstanding: | |||||||||||||||||||
| Basic | 20,464,592 | 20,464,592 | 20,510,254 | 20,510,254 | |||||||||||||||
| Diluted | 21,668,333 | 21,668,333 | 21,592,418 | 21,592,418 | |||||||||||||||
125
FORTEGRA FINANCIAL CORPORATION
NOTES TO CONSOLIDATED FINANCIAL STATEMENTS
(All Amounts in Thousands Except Share Amounts, Per Share Amounts or Unless Otherwise Noted)
| For the Three Months Ended | For the Three Months Ended | ||||||||||||||||||
| September 30, 2011 | December 31, 2011 | ||||||||||||||||||
| As Previously Reported | Adjustment | As Restated | As Previously Reported | Adjustment | As Restated | ||||||||||||||
| Revenues: | |||||||||||||||||||
| Service and administrative fees | $ | 10,125 | $ | 16,831 | $ | 26,956 | $ | 10,159 | $ | 15,036 | $ | 25,195 | |||||||
| Brokerage commissions and fees | 8,611 | — | 8,611 | 8,710 | — | 8,710 | |||||||||||||
| Ceding commission | 7,027 | — | 7,027 | 8,067 | — | 8,067 | |||||||||||||
| Net investment income | 801 | — | 801 | 732 | — | 732 | |||||||||||||
| Net realized investment gains | 1,196 | — | 1,196 | 1,770 | — | 1,770 | |||||||||||||
| Net earned premium | 28,673 | — | 28,673 | 30,857 | — | 30,857 | |||||||||||||
| Other income | 18 | — | 18 | 32 | — | 32 | |||||||||||||
| Total revenues | 56,451 | 16,831 | 73,282 | 60,327 | 15,036 | 75,363 | |||||||||||||
| Expenses: | |||||||||||||||||||
| Net losses and loss adjustment expenses | 9,714 | — | 9,714 | 9,611 | — | 9,611 | |||||||||||||
| Member benefit claims | — | 945 | 945 | — | 1,288 | 1,288 | |||||||||||||
| Commissions | 17,926 | 16,011 | 33,937 | 20,465 | 13,883 | 34,348 | |||||||||||||
| Personnel costs | 10,945 | — | 10,945 | 11,182 | — | 11,182 | |||||||||||||
| Other operating expenses | 7,267 | — | 7,267 | 7,361 | — | 7,361 | |||||||||||||
| Depreciation and amortization | 886 | — | 886 | 794 | — | 794 | |||||||||||||
| Amortization of intangibles | 998 | — | 998 | 1,524 | — | 1,524 | |||||||||||||
| Interest expense | 1,906 | — | 1,906 | 1,779 | — | 1,779 | |||||||||||||
| Loss on sale of subsidiary | 477 | — | 477 | — | — | — | |||||||||||||
| Total expenses | 50,119 | 16,956 | 67,075 | 52,716 | 15,171 | 67,887 | |||||||||||||
| Income before income taxes and non-controlling interests | 6,332 | (125 | ) | 6,207 | 7,611 | (135 | ) | 7,476 | |||||||||||
| Income taxes | 2,259 | (50 | ) | 2,209 | 2,626 | (54 | ) | 2,572 | |||||||||||
| Income before non-controlling interests | 4,073 | (75 | ) | 3,998 | 4,985 | (81 | ) | 4,904 | |||||||||||
| Less: net income attributable to non-controlling interests | 1 | — | 1 | 1 | — | 1 | |||||||||||||
| Net income | $ | 4,072 | $ | (75 | ) | $ | 3,997 | $ | 4,984 | $ | (81 | ) | $ | 4,903 | |||||
| Earnings per share: | |||||||||||||||||||
| Basic | $ | 0.20 | $ | — | $ | 0.20 | $ | 0.24 | $ | — | $ | 0.24 | |||||||
| Diluted | $ | 0.19 | $ | — | $ | 0.19 | $ | 0.24 | $ | — | $ | 0.24 | |||||||
| Weighted average common shares outstanding: | |||||||||||||||||||
| Basic | 20,404,441 | 20,404,441 | 20,343,038 | 20,343,038 | |||||||||||||||
| Diluted | 21,214,365 | 21,214,365 | 20,955,690 | 20,955,690 | |||||||||||||||
126
FORTEGRA FINANCIAL CORPORATION
NOTES TO CONSOLIDATED FINANCIAL STATEMENTS
(All Amounts in Thousands Except Share Amounts, Per Share Amounts or Unless Otherwise Noted)
| For the Three Months Ended | For the Three Months Ended | ||||||||||||||||||
| March 31, 2010 | June 30, 2010 | ||||||||||||||||||
| As Previously Reported | Adjustment | As Restated | As Previously Reported | Adjustment | As Restated | ||||||||||||||
| Revenues: | |||||||||||||||||||
| Service and administrative fees | $ | 7,975 | $ | — | $ | 7,975 | $ | 8,843 | $ | 3,082 | $ | 11,925 | |||||||
| Brokerage commissions and fees | 6,730 | — | 6,730 | 6,404 | — | 6,404 | |||||||||||||
| Ceding commission | 6,624 | — | 6,624 | 6,389 | — | 6,389 | |||||||||||||
| Net investment income | 948 | — | 948 | 986 | — | 986 | |||||||||||||
| Net realized investment gains | 2 | — | 2 | 47 | — | 47 | |||||||||||||
| Net earned premium | 28,493 | — | 28,493 | 26,669 | — | 26,669 | |||||||||||||
| Other income | 81 | — | 81 | 45 | — | 45 | |||||||||||||
| Total revenues | 50,853 | — | 50,853 | 49,383 | 3,082 | 52,465 | |||||||||||||
| Expenses: | |||||||||||||||||||
| Net losses and loss adjustment expenses | 8,777 | — | 8,777 | 7,316 | — | 7,316 | |||||||||||||
| Member benefit claims | — | — | — | — | (23 | ) | (23 | ) | |||||||||||
| Commissions | 19,349 | — | 19,349 | 17,850 | 3,105 | 20,955 | |||||||||||||
| Personnel costs | 9,081 | — | 9,081 | 9,332 | — | 9,332 | |||||||||||||
| Other operating expenses | 5,136 | 656 | 5,792 | 5,891 | 167 | 6,058 | |||||||||||||
| Depreciation and amortization | 275 | — | 275 | 284 | — | 284 | |||||||||||||
| Amortization of intangibles | 779 | — | 779 | 779 | — | 779 | |||||||||||||
| Interest expense | 1,891 | — | 1,891 | 1,985 | — | 1,985 | |||||||||||||
| Total expenses | 45,288 | 656 | 45,944 | 43,437 | 3,249 | 46,686 | |||||||||||||
| Income before income taxes and non-controlling interests | 5,565 | (656 | ) | 4,909 | 5,946 | (167 | ) | 5,779 | |||||||||||
| Income taxes | 2,076 | (230 | ) | 1,846 | 2,220 | (58 | ) | 2,162 | |||||||||||
| Income before non-controlling interests | 3,489 | (426 | ) | 3,063 | 3,726 | (109 | ) | 3,617 | |||||||||||
| Less: net income (loss) attributable to non-controlling interests | 15 | — | 15 | (46 | ) | — | (46 | ) | |||||||||||
| Net income | $ | 3,474 | $ | (426 | ) | $ | 3,048 | $ | 3,772 | $ | (109 | ) | $ | 3,663 | |||||
| Earnings per share: | |||||||||||||||||||
| Basic | $ | 0.22 | $ | (0.03 | ) | $ | 0.19 | $ | 0.24 | $ | (0.01 | ) | $ | 0.23 | |||||
| Diluted | $ | 0.21 | $ | (0.03 | ) | $ | 0.18 | $ | 0.22 | $ | (0.01 | ) | $ | 0.21 | |||||
| Weighted average common shares outstanding: | |||||||||||||||||||
| Basic | 15,742,336 | 15,742,336 | 15,742,336 | 15,742,336 | |||||||||||||||
| Diluted | 16,941,372 | 16,941,372 | 17,040,432 | 17,040,432 | |||||||||||||||
127
FORTEGRA FINANCIAL CORPORATION
NOTES TO CONSOLIDATED FINANCIAL STATEMENTS
(All Amounts in Thousands Except Share Amounts, Per Share Amounts or Unless Otherwise Noted)
| For the Three Months Ended | For the Three Months Ended | |||||||||||||||||||||
| September 30, 2010 | December 31, 2010 | |||||||||||||||||||||
| As Previously Reported | Adjustment | As Restated | As Previously Reported | Adjustment | Adoption of ASU 2010-26 | As Restated | ||||||||||||||||
| Revenues: | ||||||||||||||||||||||
| Service and administrative fees | $ | 9,229 | $ | 8,738 | $ | 17,967 | $ | 8,098 | $ | 10,289 | $ | — | $ | 18,387 | ||||||||
| Brokerage commissions and fees | 6,034 | — | 6,034 | 5,452 | — | — | 5,452 | |||||||||||||||
| Ceding commission | 9,455 | — | 9,455 | 6,299 | — | — | 6,299 | |||||||||||||||
| Net investment income | 865 | — | 865 | 1,274 | — | — | 1,274 | |||||||||||||||
| Net realized investment gains | 107 | — | 107 | 494 | — | — | 494 | |||||||||||||||
| Net earned premium | 28,255 | — | 28,255 | 28,388 | — | — | 28,388 | |||||||||||||||
| Other income | (6 | ) | — | (6 | ) | 110 | — | — | 110 | |||||||||||||
| Total revenues | 53,939 | 8,738 | 62,677 | 50,115 | 10,289 | — | 60,404 | |||||||||||||||
| Expenses: | ||||||||||||||||||||||
| Net losses and loss adjustment expenses | 10,993 | — | 10,993 | 8,949 | — | — | 8,949 | |||||||||||||||
| Member benefit claims | — | 211 | 211 | — | 278 | — | 278 | |||||||||||||||
| Commissions | 16,432 | 8,527 | 24,959 | 17,372 | 10,011 | — | 27,383 | |||||||||||||||
| Personnel costs | 9,526 | — | 9,526 | 8,422 | — | — | 8,422 | |||||||||||||||
| Other operating expenses | 6,500 | 125 | 6,625 | 5,346 | — | 605 | 5,951 | |||||||||||||||
| Depreciation and amortization | 431 | — | 431 | 406 | — | — | 406 | |||||||||||||||
| Amortization of intangibles | 788 | — | 788 | 886 | — | — | 886 | |||||||||||||||
| Interest expense | 2,246 | — | 2,246 | 2,342 | — | — | 2,342 | |||||||||||||||
| Total expenses | 46,916 | 8,863 | 55,779 | 43,723 | 10,289 | 605 | 54,617 | |||||||||||||||
| Income before income taxes and non-controlling interests | 7,023 | (125 | ) | 6,898 | 6,392 | — | (605 | ) | 5,787 | |||||||||||||
| Income taxes | 2,576 | (44 | ) | 2,532 | 1,831 | — | (212 | ) | 1,619 | |||||||||||||
| Income before non-controlling interests | 4,447 | (81 | ) | 4,366 | 4,561 | — | (393 | ) | 4,168 | |||||||||||||
| Less: net income attributable to non-controlling interests | — | — | — | 51 | — | — | 51 | |||||||||||||||
| Net income | $ | 4,447 | $ | (81 | ) | $ | 4,366 | $ | 4,510 | $ | — | $ | (393 | ) | $ | 4,117 | ||||||
| Earnings per share: | ||||||||||||||||||||||
| Basic | $ | 0.28 | $ | — | $ | 0.28 | $ | 0.27 | $ | — | $ | (0.02 | ) | $ | 0.25 | |||||||
| Diluted | $ | 0.26 | $ | — | $ | 0.26 | $ | 0.25 | $ | — | $ | (0.02 | ) | $ | 0.23 | |||||||
| Weighted average common shares outstanding: | ||||||||||||||||||||||
| Basic | 15,742,336 | 15,742,336 | 16,483,626 | 16,483,626 | 16,483,626 | 16,483,626 | ||||||||||||||||
| Diluted | 17,057,157 | 17,057,157 | 17,703,334 | 17,703,334 | 17,703,334 | 17,703,334 | ||||||||||||||||
128
FORTEGRA FINANCIAL CORPORATION
NOTES TO CONSOLIDATED FINANCIAL STATEMENTS
(All Amounts in Thousands Except Share Amounts, Per Share Amounts or Unless Otherwise Noted)
29. Quarterly Segment Results - Restated (Unaudited)
The following tables present the Company's restated quarterly Segment Results for the quarters ending March 31, 2012, June 30, 2012 and September 30, 2012 and for the quarters ending March 31, June 30, September 30, and December 31, 2011 and 2010, respectively.
| For the Three Months Ended | For the Three Months Ended | ||||||||||||||||||
| March 31, 2012 | June 30, 2012 | ||||||||||||||||||
| As Previously Reported | Adjustment | As Restated | As Previously Reported | Adjustment | As Restated | ||||||||||||||
| Segment Net Revenue | |||||||||||||||||||
| Payment Protection | |||||||||||||||||||
| Service and administrative fees | $ | 4,632 | $ | 13,171 | $ | 17,803 | $ | 4,567 | $ | 12,392 | $ | 16,959 | |||||||
| Ceding commission | 7,064 | — | 7,064 | 7,210 | — | 7,210 | |||||||||||||
| Net investment income | 743 | — | 743 | 732 | — | 732 | |||||||||||||
| Net realized investment (losses) gains | (3 | ) | — | (3 | ) | 13 | — | 13 | |||||||||||
| Other income | 72 | — | 72 | 48 | — | 48 | |||||||||||||
| Net earned premium | 31,972 | — | 31,972 | 31,905 | — | 31,905 | |||||||||||||
| Net losses and loss adjustment expenses | (11,266 | ) | — | (11,266 | ) | (9,576 | ) | — | (9,576 | ) | |||||||||
| Member benefit claims | — | (1,303 | ) | (1,303 | ) | — | (1,098 | ) | (1,098 | ) | |||||||||
| Commissions | (20,039 | ) | (11,949 | ) | (31,988 | ) | (19,892 | ) | (11,390 | ) | (31,282 | ) | |||||||
| Total Payment Protection Net Revenue | 13,175 | (81 | ) | 13,094 | 15,007 | (96 | ) | 14,911 | |||||||||||
| BPO | 4,205 | — | 4,205 | 4,409 | — | 4,409 | |||||||||||||
| Brokerage | |||||||||||||||||||
| Brokerage commissions and fees | 9,520 | — | 9,520 | 9,364 | — | 9,364 | |||||||||||||
| Service and administrative fees | 503 | — | 503 | 418 | — | 418 | |||||||||||||
| Total Brokerage | 10,023 | — | 10,023 | 9,782 | — | 9,782 | |||||||||||||
| Total segment net revenue | 27,403 | (81 | ) | 27,322 | 29,198 | (96 | ) | 29,102 | |||||||||||
| Operating Expenses | |||||||||||||||||||
| Payment Protection | 7,913 | — | 7,913 | 8,729 | — | 8,729 | |||||||||||||
| BPO | 3,133 | — | 3,133 | 3,351 | — | 3,351 | |||||||||||||
| Brokerage | 7,085 | — | 7,085 | 7,224 | — | 7,224 | |||||||||||||
| Total operating expenses | 18,131 | — | 18,131 | 19,304 | — | 19,304 | |||||||||||||
| EBITDA | |||||||||||||||||||
| Payment Protection | 5,262 | (81 | ) | 5,181 | 6,278 | (96 | ) | 6,182 | |||||||||||
| BPO | 1,072 | — | 1,072 | 1,058 | — | 1,058 | |||||||||||||
| Brokerage | 2,938 | — | 2,938 | 2,558 | — | 2,558 | |||||||||||||
| Total EBITDA | 9,272 | (81 | ) | 9,191 | 9,894 | (96 | ) | 9,798 | |||||||||||
| Depreciation and Amortization | |||||||||||||||||||
| Payment Protection | 849 | — | 849 | 865 | — | 865 | |||||||||||||
| BPO | 503 | — | 503 | 498 | — | 498 | |||||||||||||
| Brokerage | 868 | — | 868 | 778 | — | 778 | |||||||||||||
| Total depreciation and amortization | 2,220 | — | 2,220 | 2,141 | — | 2,141 | |||||||||||||
| Interest Expense | |||||||||||||||||||
| Payment Protection | 1,012 | — | 1,012 | 971 | — | 971 | |||||||||||||
| BPO | 267 | — | 267 | 259 | — | 259 | |||||||||||||
| Brokerage | 373 | — | 373 | 360 | — | 360 | |||||||||||||
| Total interest expense | 1,652 | — | 1,652 | 1,590 | — | 1,590 | |||||||||||||
| Income before income taxes and non-controlling interests | |||||||||||||||||||
| Payment Protection | 3,401 | (81 | ) | 3,320 | 4,442 | (96 | ) | 4,346 | |||||||||||
| BPO | 302 | — | 302 | 301 | — | 301 | |||||||||||||
| Brokerage | 1,697 | — | 1,697 | 1,420 | — | 1,420 | |||||||||||||
129
FORTEGRA FINANCIAL CORPORATION
NOTES TO CONSOLIDATED FINANCIAL STATEMENTS
(All Amounts in Thousands Except Share Amounts, Per Share Amounts or Unless Otherwise Noted)
| For the Three Months Ended | For the Three Months Ended | ||||||||||||||||||
| March 31, 2012 | June 30, 2012 | ||||||||||||||||||
| As Previously Reported | Adjustment | As Restated | As Previously Reported | Adjustment | As Restated | ||||||||||||||
| Total income before income taxes and non-controlling interests | 5,400 | (81 | ) | 5,319 | 6,163 | (96 | ) | 6,067 | |||||||||||
| Income taxes | 1,919 | (32 | ) | 1,887 | 2,146 | (38 | ) | 2,108 | |||||||||||
| Less: net income attributable to non-controlling interests | 18 | — | 18 | 15 | — | 15 | |||||||||||||
| Net income | $ | 3,463 | $ | (49 | ) | $ | 3,414 | $ | 4,002 | $ | (58 | ) | $ | 3,944 | |||||
| For the Three Months Ended | |||||||||
| September 30, 2012 | |||||||||
| As Previously Reported | Adjustment | As Restated | |||||||
| Segment Net Revenue | |||||||||
| Payment Protection | |||||||||
| Service and administrative fees | $ | 4,677 | $ | 12,842 | $ | 17,519 | |||
| Ceding commission | 11,122 | — | 11,122 | ||||||
| Net investment income | 744 | — | 744 | ||||||
| Net realized investment (losses) | (16 | ) | — | (16 | ) | ||||
| Other income | 52 | — | 52 | ||||||
| Net earned premium | 33,893 | — | 33,893 | ||||||
| Net losses and loss adjustment expenses | (11,430 | ) | — | (11,430 | ) | ||||
| Member benefit claims | — | (1,157 | ) | (1,157 | ) | ||||
| Commissions | (21,548 | ) | (11,829 | ) | (33,377 | ) | |||
| Total Payment Protection Net Revenue | 17,494 | (144 | ) | 17,350 | |||||
| BPO | 4,951 | — | 4,951 | ||||||
| Brokerage | |||||||||
| Brokerage commissions and fees | 8,411 | — | 8,411 | ||||||
| Service and administrative fees | 428 | — | 428 | ||||||
| Total Brokerage | 8,839 | — | 8,839 | ||||||
| Total segment net revenue | 31,284 | (144 | ) | 31,140 | |||||
| Operating Expenses | |||||||||
| Payment Protection | 9,563 | — | 9,563 | ||||||
| BPO | 3,836 | — | 3,836 | ||||||
| Brokerage | 7,268 | — | 7,268 | ||||||
| Total operating expenses | 20,667 | — | 20,667 | ||||||
| EBITDA | |||||||||
| Payment Protection | 7,931 | (144 | ) | 7,787 | |||||
| BPO | 1,115 | — | 1,115 | ||||||
| Brokerage | 1,571 | — | 1,571 | ||||||
| Total EBITDA | 10,617 | (144 | ) | 10,473 | |||||
| Depreciation and Amortization | |||||||||
| Payment Protection | 863 | — | 863 | ||||||
| BPO | 494 | — | 494 | ||||||
| Brokerage | 641 | — | 641 | ||||||
| Total depreciation and amortization | 1,998 | — | 1,998 | ||||||
| Interest Expense | |||||||||
| Payment Protection | 1,359 | — | 1,359 | ||||||
| BPO | 294 | — | 294 | ||||||
| Brokerage | 372 | — | 372 | ||||||
130
FORTEGRA FINANCIAL CORPORATION
NOTES TO CONSOLIDATED FINANCIAL STATEMENTS
(All Amounts in Thousands Except Share Amounts, Per Share Amounts or Unless Otherwise Noted)
| For the Three Months Ended | |||||||||
| September 30, 2012 | |||||||||
| As Previously Reported | Adjustment | As Restated | |||||||
| Total interest expense | 2,025 | — | 2,025 | ||||||
| Income before income taxes and non-controlling interests | |||||||||
| Payment Protection | 5,709 | (144 | ) | 5,565 | |||||
| BPO | 327 | — | 327 | ||||||
| Brokerage | 558 | — | 558 | ||||||
| Total income before income taxes and non-controlling interests | 6,594 | (144 | ) | 6,450 | |||||
| Income taxes | 2,455 | (58 | ) | 2,397 | |||||
| Less: net income attributable to non-controlling interests | 29 | — | 29 | ||||||
| Net income | $ | 4,110 | $ | (86 | ) | $ | 4,024 | ||
| For the Three Months Ended | For the Three Months Ended | ||||||||||||||||||
| March 31, 2011 | June 30, 2011 | ||||||||||||||||||
| As Previously Reported | Adjustment | As Restated | As Previously Reported | Adjustment | As Restated | ||||||||||||||
| Segment Net Revenue | |||||||||||||||||||
| Payment Protection | |||||||||||||||||||
| Service and administrative fees | $ | 4,528 | $ | 12,076 | $ | 16,604 | $ | 4,481 | $ | 12,321 | $ | 16,802 | |||||||
| Ceding commission | 8,158 | — | 8,158 | 6,243 | — | 6,243 | |||||||||||||
| Net investment income | 941 | — | 941 | 894 | — | 894 | |||||||||||||
| Net realized investment gains | 95 | — | 95 | 1,132 | — | 1,132 | |||||||||||||
| Other income | 82 | — | 82 | 38 | — | 38 | |||||||||||||
| Net earned premium | 28,437 | — | 28,437 | 27,536 | — | 27,536 | |||||||||||||
| Net losses and loss adjustment expenses | (9,373 | ) | — | (9,373 | ) | (9,251 | ) | — | (9,251 | ) | |||||||||
| Member benefit claims | — | (867 | ) | (867 | ) | — | (1,309 | ) | (1,309 | ) | |||||||||
| Commissions | (18,517 | ) | (11,389 | ) | (29,906 | ) | (17,323 | ) | (11,404 | ) | (28,727 | ) | |||||||
| Total Payment Protection Net Revenue | 14,351 | (180 | ) | 14,171 | 13,750 | (392 | ) | 13,358 | |||||||||||
| BPO | 3,564 | — | 3,564 | 3,691 | — | 3,691 | |||||||||||||
| Brokerage | |||||||||||||||||||
| Brokerage commissions and fees | 7,867 | — | 7,867 | 9,208 | — | 9,208 | |||||||||||||
| Service and administrative fees | 1,024 | — | 1,024 | 628 | — | 628 | |||||||||||||
| Total Brokerage | 8,891 | — | 8,891 | 9,836 | — | 9,836 | |||||||||||||
| Total segment net revenue | 26,806 | (180 | ) | 26,626 | 27,277 | (392 | ) | 26,885 | |||||||||||
| Operating Expenses | |||||||||||||||||||
| Payment Protection | 8,768 | — | 8,768 | 8,644 | — | 8,644 | |||||||||||||
| BPO | 2,619 | — | 2,619 | 2,828 | — | 2,828 | |||||||||||||
| Brokerage | 6,819 | — | 6,819 | 7,527 | — | 7,527 | |||||||||||||
| Corporate | — | — | — | 1,727 | — | 1,727 | |||||||||||||
| Total operating expenses | 18,206 | — | 18,206 | 20,726 | — | 20,726 | |||||||||||||
| EBITDA | |||||||||||||||||||
| Payment Protection | 5,583 | (180 | ) | 5,403 | 5,106 | (392 | ) | 4,714 | |||||||||||
| BPO | 945 | — | 945 | 863 | — | 863 | |||||||||||||
| Brokerage | 2,072 | — | 2,072 | 2,309 | — | 2,309 | |||||||||||||
| Corporate | — | — | — | (1,727 | ) | — | (1,727 | ) | |||||||||||
| Total EBITDA | 8,600 | (180 | ) | 8,420 | 6,551 | (392 | ) | 6,159 | |||||||||||
| Depreciation and Amortization | |||||||||||||||||||
131
FORTEGRA FINANCIAL CORPORATION
NOTES TO CONSOLIDATED FINANCIAL STATEMENTS
(All Amounts in Thousands Except Share Amounts, Per Share Amounts or Unless Otherwise Noted)
| For the Three Months Ended | For the Three Months Ended | ||||||||||||||||||
| March 31, 2011 | June 30, 2011 | ||||||||||||||||||
| As Previously Reported | Adjustment | As Restated | As Previously Reported | Adjustment | As Restated | ||||||||||||||
| Payment Protection | 953 | — | 953 | 1,324 | — | 1,324 | |||||||||||||
| BPO | 240 | — | 240 | 277 | — | 277 | |||||||||||||
| Brokerage | 442 | — | 442 | 591 | — | 591 | |||||||||||||
| Total depreciation and amortization | 1,635 | — | 1,635 | 2,192 | — | 2,192 | |||||||||||||
| Interest Expense | |||||||||||||||||||
| Payment Protection | 1,526 | — | 1,526 | 1,043 | — | 1,043 | |||||||||||||
| BPO | 63 | — | 63 | 99 | — | 99 | |||||||||||||
| Brokerage | 442 | — | 442 | 783 | — | 783 | |||||||||||||
| Total interest expense | 2,031 | — | 2,031 | 1,925 | — | 1,925 | |||||||||||||
| Income before income taxes and non-controlling interests | |||||||||||||||||||
| Payment Protection | 3,104 | (180 | ) | 2,924 | 2,739 | (392 | ) | 2,347 | |||||||||||
| BPO | 642 | — | 642 | 487 | — | 487 | |||||||||||||
| Brokerage | 1,188 | — | 1,188 | 935 | — | 935 | |||||||||||||
| Corporate | — | — | — | (1,727 | ) | — | (1,727 | ) | |||||||||||
| Total income before income taxes and non-controlling interests | 4,934 | (180 | ) | 4,754 | 2,434 | (392 | ) | 2,042 | |||||||||||
| Income taxes | 1,681 | (72 | ) | 1,609 | 907 | (157 | ) | 750 | |||||||||||
| Less: net (loss) income attributable to non-controlling interests | (174 | ) | — | (174 | ) | 2 | — | 2 | |||||||||||
| Net income | $ | 3,427 | $ | (108 | ) | $ | 3,319 | $ | 1,525 | $ | (235 | ) | $ | 1,290 | |||||
| For the Three Months Ended | For the Three Months Ended | ||||||||||||||||||
| September 30, 2011 | December 31, 2011 | ||||||||||||||||||
| As Previously Reported | Adjustment | As Restated | As Previously Reported | Adjustment | As Restated | ||||||||||||||
| Segment Net Revenue | |||||||||||||||||||
| Payment Protection | |||||||||||||||||||
| Service and administrative fees | $ | 5,695 | $ | 16,831 | $ | 22,526 | $ | 5,276 | $ | 15,036 | $ | 20,312 | |||||||
| Ceding commission | 7,027 | — | 7,027 | 8,067 | — | 8,067 | |||||||||||||
| Net investment income | 801 | — | 801 | 732 | — | 732 | |||||||||||||
| Net realized investment gains (losses) | 1,196 | — | 1,196 | 1,770 | — | 1,770 | |||||||||||||
| Other income | 18 | — | 18 | 32 | — | 32 | |||||||||||||
| Net earned premium | 28,673 | — | 28,673 | 30,857 | — | 30,857 | |||||||||||||
| Net losses and loss adjustment expenses | (9,714 | ) | — | (9,714 | ) | (9,611 | ) | — | (9,611 | ) | |||||||||
| Member benefit claims | — | (945 | ) | (945 | ) | — | (1,288 | ) | (1,288 | ) | |||||||||
| Commissions | (17,926 | ) | (16,011 | ) | (33,937 | ) | (20,465 | ) | (13,883 | ) | (34,348 | ) | |||||||
| Total Payment Protection Net Revenue | 15,770 | (125 | ) | 15,645 | 16,658 | (135 | ) | 16,523 | |||||||||||
| BPO | 3,833 | — | 3,833 | 4,496 | — | 4,496 | |||||||||||||
| Brokerage | |||||||||||||||||||
| Brokerage commissions and fees | 8,611 | — | 8,611 | 8,710 | — | 8,710 | |||||||||||||
| Service and administrative fees | 597 | — | 597 | 387 | — | 387 | |||||||||||||
| Total Brokerage | 9,208 | — | 9,208 | 9,097 | — | 9,097 | |||||||||||||
| Total segment net revenue | 28,811 | (125 | ) | 28,686 | 30,251 | (135 | ) | 30,116 | |||||||||||
| Operating Expenses | |||||||||||||||||||
| Payment Protection | 8,445 | — | 8,445 | 7,657 | — | 7,657 | |||||||||||||
| BPO | 2,717 | — | 2,717 | 3,434 | — | 3,434 | |||||||||||||
Brokerage (1) | 7,491 | — | 7,491 | 7,452 | — | 7,452 | |||||||||||||
132
FORTEGRA FINANCIAL CORPORATION
NOTES TO CONSOLIDATED FINANCIAL STATEMENTS
(All Amounts in Thousands Except Share Amounts, Per Share Amounts or Unless Otherwise Noted)
| For the Three Months Ended | For the Three Months Ended | ||||||||||||||||||
| September 30, 2011 | December 31, 2011 | ||||||||||||||||||
| As Previously Reported | Adjustment | As Restated | As Previously Reported | Adjustment | As Restated | ||||||||||||||
| Corporate | 36 | — | 36 | — | — | — | |||||||||||||
| Total operating expenses | 18,689 | — | 18,689 | 18,543 | — | 18,543 | |||||||||||||
| EBITDA | |||||||||||||||||||
| Payment Protection | 7,325 | (125 | ) | 7,200 | 9,001 | (135 | ) | 8,866 | |||||||||||
| BPO | 1,116 | — | 1,116 | 1,062 | — | 1,062 | |||||||||||||
Brokerage (1) | 1,717 | — | 1,717 | 1,645 | — | 1,645 | |||||||||||||
| Corporate | (36 | ) | — | (36 | ) | — | — | — | |||||||||||
| Total EBITDA | 10,122 | (125 | ) | 9,997 | 11,708 | (135 | ) | 11,573 | |||||||||||
| Depreciation and Amortization | |||||||||||||||||||
| Payment Protection | 927 | — | 927 | 1,001 | — | 1,001 | |||||||||||||
| BPO | 307 | — | 307 | 300 | — | 300 | |||||||||||||
| Brokerage | 650 | — | 650 | 1,017 | — | 1,017 | |||||||||||||
| Total depreciation and amortization | 1,884 | — | 1,884 | 2,318 | — | 2,318 | |||||||||||||
| Interest Expense | |||||||||||||||||||
| Payment Protection | 1,053 | — | 1,053 | 1,027 | — | 1,027 | |||||||||||||
| BPO | 96 | — | 96 | 161 | — | 161 | |||||||||||||
| Brokerage | 757 | — | 757 | 591 | — | 591 | |||||||||||||
| Total interest expense | 1,906 | — | 1,906 | 1,779 | — | 1,779 | |||||||||||||
| Income before income taxes and non-controlling interests | |||||||||||||||||||
| Payment Protection | 5,345 | (125 | ) | 5,220 | 6,973 | (135 | ) | 6,838 | |||||||||||
| BPO | 713 | — | 713 | 601 | — | 601 | |||||||||||||
Brokerage (1) | 310 | — | 310 | 37 | — | 37 | |||||||||||||
| Corporate | (36 | ) | — | (36 | ) | — | — | — | |||||||||||
| Total income before income taxes and non-controlling interests | 6,332 | (125 | ) | 6,207 | 7,611 | (135 | ) | 7,476 | |||||||||||
| Income taxes | 2,259 | (50 | ) | 2,209 | 2,626 | (54 | ) | 2,572 | |||||||||||
| Less: net income attributable to non-controlling interests | 1 | — | 1 | 1 | — | 1 | |||||||||||||
| Net income | $ | 4,072 | $ | (75 | ) | $ | 3,997 | $ | 4,984 | $ | (81 | ) | $ | 4,903 | |||||
(1) - Includes loss on sale of subsidiary of $477 for the three months ended September 30, 2011. | |||||||||||||||||||
| For the Three Months Ended | For the Three Months Ended | ||||||||||||||||||
| March 31, 2010 | June 30, 2010 | ||||||||||||||||||
| As Previously Reported | Adjustment | As Restated | As Previously Reported | Adjustment | As Restated | ||||||||||||||
| Segment Net Revenue | |||||||||||||||||||
| Payment Protection | |||||||||||||||||||
| Service and administrative fees | $ | 1,881 | $ | — | $ | 1,881 | $ | 3,240 | $ | 3,082 | $ | 6,322 | |||||||
| Ceding commission | 6,624 | — | 6,624 | 6,389 | — | 6,389 | |||||||||||||
| Net investment income | 948 | — | 948 | 986 | — | 986 | |||||||||||||
| Net realized investment gains | 2 | — | 2 | 47 | — | 47 | |||||||||||||
| Other income | 81 | — | 81 | 45 | — | 45 | |||||||||||||
| Net earned premium | 28,493 | — | 28,493 | 26,669 | — | 26,669 | |||||||||||||
| Net losses and loss adjustment expenses | (8,777 | ) | — | (8,777 | ) | (7,316 | ) | — | (7,316 | ) | |||||||||
| Member benefit claims | — | — | — | — | 23 | 23 | |||||||||||||
133
FORTEGRA FINANCIAL CORPORATION
NOTES TO CONSOLIDATED FINANCIAL STATEMENTS
(All Amounts in Thousands Except Share Amounts, Per Share Amounts or Unless Otherwise Noted)
| For the Three Months Ended | For the Three Months Ended | ||||||||||||||||||
| March 31, 2010 | June 30, 2010 | ||||||||||||||||||
| As Previously Reported | Adjustment | As Restated | As Previously Reported | Adjustment | As Restated | ||||||||||||||
| Commissions | (19,349 | ) | — | (19,349 | ) | (17,850 | ) | (3,105 | ) | (20,955 | ) | ||||||||
| Total Payment Protection Net Revenue | 9,903 | — | 9,903 | 12,210 | — | 12,210 | |||||||||||||
| BPO | 4,563 | — | 4,563 | 4,327 | — | 4,327 | |||||||||||||
| Brokerage | |||||||||||||||||||
| Brokerage commissions and fees | 6,730 | — | 6,730 | 6,404 | — | 6,404 | |||||||||||||
| Service and administrative fees | 1,531 | — | 1,531 | 1,276 | — | 1,276 | |||||||||||||
| Total Brokerage | 8,261 | — | 8,261 | 7,680 | — | 7,680 | |||||||||||||
| Total segment net revenue | 22,727 | — | 22,727 | 24,217 | — | 24,217 | |||||||||||||
| Operating Expenses | |||||||||||||||||||
| Payment Protection | 5,094 | 656 | 5,750 | 6,191 | 167 | 6,358 | |||||||||||||
| BPO | 2,774 | — | 2,774 | 2,635 | — | 2,635 | |||||||||||||
Brokerage (1) | 6,119 | — | 6,119 | 5,785 | — | 5,785 | |||||||||||||
| Corporate | 230 | — | 230 | 612 | — | 612 | |||||||||||||
| Total operating expenses | 14,217 | 656 | 14,873 | 15,223 | 167 | 15,390 | |||||||||||||
| EBITDA | |||||||||||||||||||
| Payment Protection | 4,809 | (656 | ) | 4,153 | 6,019 | (167 | ) | 5,852 | |||||||||||
| BPO | 1,789 | — | 1,789 | 1,692 | — | 1,692 | |||||||||||||
| Brokerage | 2,142 | — | 2,142 | 1,895 | — | 1,895 | |||||||||||||
| Corporate | (230 | ) | — | (230 | ) | (612 | ) | — | (612 | ) | |||||||||
| Total EBITDA | 8,510 | (656 | ) | 7,854 | 8,994 | (167 | ) | 8,827 | |||||||||||
| Depreciation and Amortization | |||||||||||||||||||
| Payment Protection | 470 | — | 470 | 585 | — | 585 | |||||||||||||
| BPO | 174 | — | 174 | 80 | — | 80 | |||||||||||||
| Brokerage | 410 | — | 410 | 398 | — | 398 | |||||||||||||
| Total depreciation and amortization | 1,054 | — | 1,054 | 1,063 | — | 1,063 | |||||||||||||
| Interest Expense | |||||||||||||||||||
| Payment Protection | 1,661 | — | 1,661 | 1,704 | — | 1,704 | |||||||||||||
| BPO | 106 | — | 106 | 92 | — | 92 | |||||||||||||
| Brokerage | 124 | — | 124 | 189 | — | 189 | |||||||||||||
| Total interest expense | 1,891 | — | 1,891 | 1,985 | — | 1,985 | |||||||||||||
| Income before income taxes and non-controlling interests | |||||||||||||||||||
| Payment Protection | 2,678 | (656 | ) | 2,022 | 3,730 | (167 | ) | 3,563 | |||||||||||
| BPO | 1,509 | — | 1,509 | 1,520 | — | 1,520 | |||||||||||||
| Brokerage | 1,608 | — | 1,608 | 1,308 | — | 1,308 | |||||||||||||
| Corporate | (230 | ) | — | (230 | ) | (612 | ) | — | (612 | ) | |||||||||
| Total income before income taxes and non-controlling interests | 5,565 | (656 | ) | 4,909 | 5,946 | (167 | ) | 5,779 | |||||||||||
| Income taxes | 2,076 | (230 | ) | 1,846 | 2,220 | (58 | ) | 2,162 | |||||||||||
| Less: net income (loss) attributable to non-controlling interests | 15 | — | 15 | (46 | ) | — | (46 | ) | |||||||||||
| Net income | $ | 3,474 | $ | (426 | ) | $ | 3,048 | $ | 3,772 | $ | (109 | ) | $ | 3,663 | |||||
134
FORTEGRA FINANCIAL CORPORATION
NOTES TO CONSOLIDATED FINANCIAL STATEMENTS
(All Amounts in Thousands Except Share Amounts, Per Share Amounts or Unless Otherwise Noted)
| For the Three Months Ended | For the Three Months Ended | ||||||||||||||||||
| September 30, 2010 | December 31, 2010 | ||||||||||||||||||
| As Previously Reported | Adjustment | As Restated | As Previously Reported | Adjustment | As Restated | ||||||||||||||
| Segment Net Revenue | |||||||||||||||||||
| Payment Protection | |||||||||||||||||||
| Service and administrative fees | $ | 3,390 | $ | 8,738 | $ | 12,128 | $ | 3,948 | $ | 10,289 | $ | 14,237 | |||||||
| Ceding commission | 9,455 | — | 9,455 | 6,299 | — | 6,299 | |||||||||||||
| Net investment income | 865 | — | 865 | 1,274 | — | 1,274 | |||||||||||||
| Net realized investment gains | 107 | — | 107 | 494 | — | 494 | |||||||||||||
| Other income | (6 | ) | — | (6 | ) | 110 | — | 110 | |||||||||||
| Net earned premium | 28,255 | — | 28,255 | 28,388 | — | 28,388 | |||||||||||||
| Net losses and loss adjustment expenses | (10,993 | ) | — | (10,993 | ) | (8,949 | ) | — | (8,949 | ) | |||||||||
| Member benefit claims | — | (211 | ) | (211 | ) | — | (278 | ) | (278 | ) | |||||||||
| Commissions | (16,432 | ) | (8,527 | ) | (24,959 | ) | (17,372 | ) | (10,011 | ) | (27,383 | ) | |||||||
| Total Payment Protection Net Revenue | 14,641 | — | 14,641 | 14,192 | — | 14,192 | |||||||||||||
| BPO | 4,715 | — | 4,715 | 3,464 | — | 3,464 | |||||||||||||
| Brokerage | |||||||||||||||||||
| Brokerage commissions and fees | 6,034 | — | 6,034 | 5,452 | — | 5,452 | |||||||||||||
| Service and administrative fees | 1,124 | — | 1,124 | 686 | — | 686 | |||||||||||||
| Total Brokerage | 7,158 | — | 7,158 | 6,138 | — | 6,138 | |||||||||||||
| Total segment net revenue | 26,514 | — | 26,514 | 23,794 | — | 23,794 | |||||||||||||
| Operating Expenses | |||||||||||||||||||
| Payment Protection | 6,435 | 125 | 6,560 | 5,853 | 605 | 6,458 | |||||||||||||
| BPO | 2,588 | — | 2,588 | 2,005 | — | 2,005 | |||||||||||||
| Brokerage | 5,783 | — | 5,783 | 5,842 | — | 5,842 | |||||||||||||
| Corporate | 1,220 | — | 1,220 | 68 | — | 68 | |||||||||||||
| Total operating expenses | 16,026 | 125 | 16,151 | 13,768 | 605 | 14,373 | |||||||||||||
| EBITDA | |||||||||||||||||||
| Payment Protection | 8,206 | (125 | ) | 8,081 | 8,339 | (605 | ) | 7,734 | |||||||||||
| BPO | 2,127 | — | 2,127 | 1,459 | — | 1,459 | |||||||||||||
| Brokerage | 1,375 | — | 1,375 | 296 | — | 296 | |||||||||||||
| Corporate | (1,220 | ) | — | (1,220 | ) | (68 | ) | — | (68 | ) | |||||||||
| Total EBITDA | 10,488 | (125 | ) | 10,363 | 10,026 | (605 | ) | 9,421 | |||||||||||
| Depreciation and Amortization | |||||||||||||||||||
| Payment Protection | 327 | — | 327 | 970 | — | 970 | |||||||||||||
| BPO | 457 | — | 457 | (113 | ) | — | (113 | ) | |||||||||||
| Brokerage | 435 | — | 435 | 435 | — | 435 | |||||||||||||
| Total depreciation and amortization | 1,219 | — | 1,219 | 1,292 | — | 1,292 | |||||||||||||
| Interest Expense | |||||||||||||||||||
| Payment Protection | 1,873 | — | 1,873 | 1,959 | — | 1,959 | |||||||||||||
| BPO | 126 | — | 126 | 109 | — | 109 | |||||||||||||
| Brokerage | 247 | — | 247 | 274 | — | 274 | |||||||||||||
| Total interest expense | 2,246 | — | 2,246 | 2,342 | — | 2,342 | |||||||||||||
| Income before income taxes and non-controlling interests | |||||||||||||||||||
| Payment Protection | 6,006 | (125 | ) | 5,881 | 5,410 | (605 | ) | 4,805 | |||||||||||
| BPO | 1,544 | — | 1,544 | 1,463 | — | 1,463 | |||||||||||||
| Brokerage | 693 | — | 693 | (413 | ) | — | (413 | ) | |||||||||||
| Corporate | (1,220 | ) | — | (1,220 | ) | (68 | ) | — | (68 | ) | |||||||||
| Total income before income taxes and non-controlling interests | 7,023 | (125 | ) | 6,898 | 6,392 | (605 | ) | 5,787 | |||||||||||
| Income taxes | 2,576 | (44 | ) | 2,532 | 1,831 | (212 | ) | 1,619 | |||||||||||
135
FORTEGRA FINANCIAL CORPORATION
NOTES TO CONSOLIDATED FINANCIAL STATEMENTS
(All Amounts in Thousands Except Share Amounts, Per Share Amounts or Unless Otherwise Noted)
| For the Three Months Ended | For the Three Months Ended | ||||||||||||||||||
| September 30, 2010 | December 31, 2010 | ||||||||||||||||||
| As Previously Reported | Adjustment | As Restated | As Previously Reported | Adjustment | As Restated | ||||||||||||||
| Less: net income attributable to non-controlling interests | — | — | — | 51 | — | 51 | |||||||||||||
| Net income | $ | 4,447 | $ | (81 | ) | $ | 4,366 | $ | 4,510 | $ | (393 | ) | $ | 4,117 | |||||
The following table reconciles the restated segment information to the Company's Consolidated Statements of Income and provides a summary of other key financial information for each segment, as restated, for the quarters ending March 31, 2012, June 30, 2012 and September 30, 2012 and for the quarters ending March 31, June 30, September 30, and December 31, 2011 and 2010, respectively.
Reconciliation of Segment Net Revenue to Total Revenue and EBITDA to Net Income | For the Three Months Ended | For the Three Months Ended | |||||||||||||||||
| March 31, 2012 | June 30, 2012 | ||||||||||||||||||
| As Previously Reported | Adjustment | As Restated | As Previously Reported | Adjustment | As Restated | ||||||||||||||
| Segment Net Revenue | |||||||||||||||||||
| Payment Protection | $ | 13,175 | $ | (81 | ) | $ | 13,094 | $ | 15,007 | $ | (96 | ) | $ | 14,911 | |||||
| BPO | 4,205 | — | 4,205 | 4,409 | — | 4,409 | |||||||||||||
| Brokerage | 10,023 | — | 10,023 | 9,782 | — | 9,782 | |||||||||||||
| Segment net revenues | 27,403 | (81 | ) | 27,322 | 29,198 | (96 | ) | 29,102 | |||||||||||
| Net losses and loss adjustment expenses | 11,266 | — | 11,266 | 9,576 | — | 9,576 | |||||||||||||
| Member benefit claims | — | 1,303 | 1,303 | — | 1,098 | 1,098 | |||||||||||||
| Commissions | 20,039 | 11,949 | 31,988 | 19,892 | 11,390 | 31,282 | |||||||||||||
| Total segment revenue | 58,708 | 13,171 | 71,879 | 58,666 | 12,392 | 71,058 | |||||||||||||
| Operating Expenses | |||||||||||||||||||
| Payment Protection | 7,913 | — | 7,913 | 8,729 | — | 8,729 | |||||||||||||
| BPO | 3,133 | — | 3,133 | 3,351 | — | 3,351 | |||||||||||||
| Brokerage | 7,085 | — | 7,085 | 7,224 | — | 7,224 | |||||||||||||
| Total operating expenses | 18,131 | — | 18,131 | 19,304 | — | 19,304 | |||||||||||||
| Net losses and loss adjustment expenses | 11,266 | — | 11,266 | 9,576 | — | 9,576 | |||||||||||||
| Member benefit claims | — | 1,303 | 1,303 | — | 1,098 | 1,098 | |||||||||||||
| Commissions | 20,039 | 11,949 | 31,988 | 19,892 | 11,390 | 31,282 | |||||||||||||
| Total operating expenses before depreciation, amortization and interest expense | 49,436 | 13,252 | 62,688 | 48,772 | 12,488 | 61,260 | |||||||||||||
| EBITDA | |||||||||||||||||||
| Payment Protection | 5,262 | (81 | ) | 5,181 | 6,278 | (96 | ) | 6,182 | |||||||||||
| BPO | 1,072 | — | 1,072 | 1,058 | — | 1,058 | |||||||||||||
| Brokerage | 2,938 | — | 2,938 | 2,558 | — | 2,558 | |||||||||||||
| Total EBITDA | 9,272 | (81 | ) | 9,191 | 9,894 | (96 | ) | 9,798 | |||||||||||
| Depreciation and amortization | |||||||||||||||||||
| Payment Protection | 849 | — | 849 | 865 | — | 865 | |||||||||||||
| BPO | 503 | — | 503 | 498 | — | 498 | |||||||||||||
| Brokerage | 868 | — | 868 | 778 | — | 778 | |||||||||||||
| Total depreciation and amortization | 2,220 | — | 2,220 | 2,141 | — | 2,141 | |||||||||||||
| Interest Expense | |||||||||||||||||||
| Payment Protection | 1,012 | — | 1,012 | 971 | — | 971 | |||||||||||||
| BPO | 267 | — | 267 | 259 | — | 259 | |||||||||||||
| Brokerage | 373 | — | 373 | 360 | — | 360 | |||||||||||||
| Total interest expense | 1,652 | — | 1,652 | 1,590 | — | 1,590 | |||||||||||||
136
FORTEGRA FINANCIAL CORPORATION
NOTES TO CONSOLIDATED FINANCIAL STATEMENTS
(All Amounts in Thousands Except Share Amounts, Per Share Amounts or Unless Otherwise Noted)
Reconciliation of Segment Net Revenue to Total Revenue and EBITDA to Net Income | For the Three Months Ended | For the Three Months Ended | |||||||||||||||||
| March 31, 2012 | June 30, 2012 | ||||||||||||||||||
| As Previously Reported | Adjustment | As Restated | As Previously Reported | Adjustment | As Restated | ||||||||||||||
| Income (loss) before income taxes and non-controlling interests | |||||||||||||||||||
| Payment Protection | 3,401 | (81 | ) | 3,320 | 4,442 | (96 | ) | 4,346 | |||||||||||
| BPO | 302 | — | 302 | 301 | — | 301 | |||||||||||||
| Brokerage | 1,697 | — | 1,697 | 1,420 | — | 1,420 | |||||||||||||
| Corporate | — | — | — | — | — | — | |||||||||||||
| Total income before income taxes and non-controlling interests | 5,400 | (81 | ) | 5,319 | 6,163 | (96 | ) | 6,067 | |||||||||||
| Income taxes | 1,919 | (32 | ) | 1,887 | 2,146 | (38 | ) | 2,108 | |||||||||||
| Less: net income attributable to non-controlling interests | 18 | — | 18 | 15 | — | 15 | |||||||||||||
| Net income | $ | 3,463 | $ | (49 | ) | 3,414 | $ | 4,002 | $ | (58 | ) | $ | 3,944 | ||||||
Reconciliation of Segment Net Revenue to Total Revenue and EBITDA to Net Income | For the Three Months Ended | ||||||||
| September 30, 2012 | |||||||||
| As Previously Reported | Adjustment | As Restated | |||||||
| Segment Net Revenue | |||||||||
| Payment Protection | $ | 17,494 | $ | (144 | ) | $ | 17,350 | ||
| BPO | 4,951 | — | 4,951 | ||||||
| Brokerage | 8,839 | — | 8,839 | ||||||
| Segment net revenues | 31,284 | (144 | ) | 31,140 | |||||
| Net losses and loss adjustment expenses | 11,430 | — | 11,430 | ||||||
| Member benefit claims | — | 1,157 | 1,157 | ||||||
| Commissions | 21,548 | 11,829 | 33,377 | ||||||
| Total segment revenue | 64,262 | 12,842 | 77,104 | ||||||
| Operating Expenses | |||||||||
| Payment Protection | 9,563 | — | 9,563 | ||||||
| BPO | 3,836 | — | 3,836 | ||||||
| Brokerage | 7,268 | — | 7,268 | ||||||
| Total operating expenses | 20,667 | — | 20,667 | ||||||
| Net losses and loss adjustment expenses | 11,430 | — | 11,430 | ||||||
| Member benefit claims | — | 1,157 | 1,157 | ||||||
| Commissions | 21,548 | 11,829 | 33,377 | ||||||
| Total operating expenses before depreciation, amortization and interest expense | 53,645 | 12,986 | 66,631 | ||||||
| EBITDA | |||||||||
| Payment Protection | 7,931 | (144 | ) | 7,787 | |||||
| BPO | 1,115 | — | 1,115 | ||||||
| Brokerage | 1,571 | — | 1,571 | ||||||
| Total EBITDA | 10,617 | (144 | ) | 10,473 | |||||
| Depreciation and amortization | |||||||||
| Payment Protection | 863 | — | 863 | ||||||
| BPO | 494 | — | 494 | ||||||
| Brokerage | 641 | — | 641 | ||||||
137
FORTEGRA FINANCIAL CORPORATION
NOTES TO CONSOLIDATED FINANCIAL STATEMENTS
(All Amounts in Thousands Except Share Amounts, Per Share Amounts or Unless Otherwise Noted)
Reconciliation of Segment Net Revenue to Total Revenue and EBITDA to Net Income | For the Three Months Ended | ||||||||
| September 30, 2012 | |||||||||
| As Previously Reported | Adjustment | As Restated | |||||||
| Corporate | — | — | — | ||||||
| Total depreciation and amortization | 1,998 | — | 1,998 | ||||||
| Interest Expense | |||||||||
| Payment Protection | 1,359 | — | 1,359 | ||||||
| BPO | 294 | — | 294 | ||||||
| Brokerage | 372 | — | 372 | ||||||
| Total interest expense | 2,025 | — | 2,025 | ||||||
| Income (loss) before income taxes and non-controlling interests | |||||||||
| Payment Protection | 5,709 | (144 | ) | 5,565 | |||||
| BPO | 327 | — | 327 | ||||||
| Brokerage | 558 | — | 558 | ||||||
| Total income before income taxes and non-controlling interests | 6,594 | (144 | ) | 6,450 | |||||
| Income taxes | 2,455 | (58 | ) | 2,397 | |||||
| Less: net income attributable to non-controlling interests | 29 | — | 29 | ||||||
| Net income | $ | 4,110 | $ | (86 | ) | 4,024 | |||
Reconciliation of Segment Net Revenue to Total Revenue and EBITDA to Net Income | For the Three Months Ended | For the Three Months Ended | |||||||||||||||||
| March 31, 2011 | June 30, 2011 | ||||||||||||||||||
| As Previously Reported | Adjustment | As Restated | As Previously Reported | Adjustment | As Restated | ||||||||||||||
| Segment Net Revenue | |||||||||||||||||||
| Payment Protection | $ | 14,351 | $ | (180 | ) | $ | 14,171 | $ | 13,750 | $ | (392 | ) | $ | 13,358 | |||||
| BPO | 3,564 | — | 3,564 | 3,691 | — | 3,691 | |||||||||||||
| Brokerage | 8,891 | — | 8,891 | 9,836 | — | 9,836 | |||||||||||||
| Segment net revenues | 26,806 | (180 | ) | 26,626 | 27,277 | (392 | ) | 26,885 | |||||||||||
| Net losses and loss adjustment expenses | 9,373 | — | 9,373 | 9,251 | — | 9,251 | |||||||||||||
| Member benefit claims | — | 867 | 867 | — | 1,309 | 1,309 | |||||||||||||
| Commissions | 18,517 | 11,389 | 29,906 | 17,323 | 11,404 | 28,727 | |||||||||||||
| Total segment revenue | 54,696 | 12,076 | 66,772 | 53,851 | 12,321 | 66,172 | |||||||||||||
| Operating Expenses | |||||||||||||||||||
| Payment Protection | 8,768 | — | 8,768 | 8,644 | — | 8,644 | |||||||||||||
| BPO | 2,619 | — | 2,619 | 2,828 | — | 2,828 | |||||||||||||
| Brokerage | 6,819 | — | 6,819 | 7,527 | — | 7,527 | |||||||||||||
| Corporate | — | — | — | 1,727 | — | 1,727 | |||||||||||||
| Total operating expenses | 18,206 | — | 18,206 | 20,726 | — | 20,726 | |||||||||||||
| Net losses and loss adjustment expenses | 9,373 | — | 9,373 | 9,251 | — | 9,251 | |||||||||||||
| Member benefit claims | — | 867 | 867 | — | 1,309 | 1,309 | |||||||||||||
| Commissions | 18,517 | 11,389 | 29,906 | 17,323 | 11,404 | 28,727 | |||||||||||||
| Total operating expenses before depreciation, amortization and interest expense | 46,096 | 12,256 | 58,352 | 47,300 | 12,713 | 60,013 | |||||||||||||
| EBITDA | |||||||||||||||||||
| Payment Protection | 5,583 | (180 | ) | 5,403 | 5,106 | (392 | ) | 4,714 | |||||||||||
138
FORTEGRA FINANCIAL CORPORATION
NOTES TO CONSOLIDATED FINANCIAL STATEMENTS
(All Amounts in Thousands Except Share Amounts, Per Share Amounts or Unless Otherwise Noted)
Reconciliation of Segment Net Revenue to Total Revenue and EBITDA to Net Income | For the Three Months Ended | For the Three Months Ended | |||||||||||||||||
| March 31, 2011 | June 30, 2011 | ||||||||||||||||||
| As Previously Reported | Adjustment | As Restated | As Previously Reported | Adjustment | As Restated | ||||||||||||||
| BPO | 945 | — | 945 | 863 | — | 863 | |||||||||||||
| Brokerage | 2,072 | — | 2,072 | 2,309 | — | 2,309 | |||||||||||||
| Corporate | — | — | — | (1,727 | ) | — | (1,727 | ) | |||||||||||
| Total EBITDA | 8,600 | (180 | ) | 8,420 | 6,551 | (392 | ) | 6,159 | |||||||||||
| Depreciation and amortization | |||||||||||||||||||
| Payment Protection | 953 | — | 953 | 1,324 | — | 1,324 | |||||||||||||
| BPO | 240 | — | 240 | 277 | — | 277 | |||||||||||||
| Brokerage | 442 | — | 442 | 591 | — | 591 | |||||||||||||
| Total depreciation and amortization | 1,635 | — | 1,635 | 2,192 | — | 2,192 | |||||||||||||
| Interest Expense | |||||||||||||||||||
| Payment Protection | 1,526 | — | 1,526 | 1,043 | — | 1,043 | |||||||||||||
| BPO | 63 | — | 63 | 99 | — | 99 | |||||||||||||
| Brokerage | 442 | — | 442 | 783 | — | 783 | |||||||||||||
| Total interest expense | 2,031 | — | 2,031 | 1,925 | — | 1,925 | |||||||||||||
| Income (loss) before income taxes and non-controlling interests | |||||||||||||||||||
| Payment Protection | 3,104 | (180 | ) | 2,924 | 2,739 | (392 | ) | 2,347 | |||||||||||
| BPO | 642 | — | 642 | 487 | — | 487 | |||||||||||||
| Brokerage | 1,188 | — | 1,188 | 935 | — | 935 | |||||||||||||
| Corporate | — | — | — | (1,727 | ) | — | (1,727 | ) | |||||||||||
| Total income before income taxes and non-controlling interests | 4,934 | (180 | ) | 4,754 | 2,434 | (392 | ) | 2,042 | |||||||||||
| Income taxes | 1,681 | (72 | ) | 1,609 | 907 | (157 | ) | 750 | |||||||||||
| Less: net (loss) income attributable to non-controlling interests | (174 | ) | — | (174 | ) | 2 | — | 2 | |||||||||||
| Net income | $ | 3,427 | $ | (108 | ) | 3,319 | $ | 1,525 | $ | (235 | ) | $ | 1,290 | ||||||
Reconciliation of Segment Net Revenue to Total Revenue and EBITDA to Net Income | For the Three Months Ended | For the Three Months Ended | |||||||||||||||||
| September 30, 2011 | December 31, 2011 | ||||||||||||||||||
| As Previously Reported | Adjustment | As Restated | As Previously Reported | Adjustment | As Restated | ||||||||||||||
| Segment Net Revenue | |||||||||||||||||||
| Payment Protection | $ | 15,770 | $ | (125 | ) | $ | 15,645 | $ | 16,658 | $ | (135 | ) | $ | 16,523 | |||||
| BPO | 3,833 | — | 3,833 | 4,496 | — | 4,496 | |||||||||||||
| Brokerage | 9,208 | — | 9,208 | 9,097 | — | 9,097 | |||||||||||||
| Corporate | — | — | — | — | — | — | |||||||||||||
| Segment net revenues | 28,811 | (125 | ) | 28,686 | 30,251 | (135 | ) | 30,116 | |||||||||||
| Net losses and loss adjustment expenses | 9,714 | — | 9,714 | 9,611 | — | 9,611 | |||||||||||||
| Member benefit claims | — | 945 | 945 | — | 1,288 | 1,288 | |||||||||||||
| Commissions | 17,926 | 16,011 | 33,937 | 20,465 | 13,883 | 34,348 | |||||||||||||
| Total segment revenue | 56,451 | 16,831 | 73,282 | 60,327 | 15,036 | 75,363 | |||||||||||||
| Operating Expenses | |||||||||||||||||||
| Payment Protection | 8,445 | — | 8,445 | 7,657 | — | 7,657 | |||||||||||||
| BPO | 2,717 | — | 2,717 | 3,434 | — | 3,434 | |||||||||||||
Brokerage (1) | 7,491 | — | 7,491 | 7,452 | — | 7,452 | |||||||||||||
| Corporate | 36 | — | 36 | — | — | — | |||||||||||||
139
FORTEGRA FINANCIAL CORPORATION
NOTES TO CONSOLIDATED FINANCIAL STATEMENTS
(All Amounts in Thousands Except Share Amounts, Per Share Amounts or Unless Otherwise Noted)
Reconciliation of Segment Net Revenue to Total Revenue and EBITDA to Net Income | For the Three Months Ended | For the Three Months Ended | |||||||||||||||||
| September 30, 2011 | December 31, 2011 | ||||||||||||||||||
| As Previously Reported | Adjustment | As Restated | As Previously Reported | Adjustment | As Restated | ||||||||||||||
| Total operating expenses | 18,689 | — | 18,689 | 18,543 | — | 18,543 | |||||||||||||
| Net losses and loss adjustment expenses | 9,714 | — | 9,714 | 9,611 | — | 9,611 | |||||||||||||
| Member benefit claims | — | 945 | 945 | — | 1,288 | 1,288 | |||||||||||||
| Commissions | 17,926 | 16,011 | 33,937 | 20,465 | 13,883 | 34,348 | |||||||||||||
| Total operating expenses before depreciation, amortization and interest expense | 46,329 | 16,956 | 63,285 | 48,619 | 15,171 | 63,790 | |||||||||||||
| EBITDA | |||||||||||||||||||
| Payment Protection | 7,325 | (125 | ) | 7,200 | 9,001 | (135 | ) | 8,866 | |||||||||||
| BPO | 1,116 | — | 1,116 | 1,062 | — | 1,062 | |||||||||||||
Brokerage (1) | 1,717 | — | 1,717 | 1,645 | — | 1,645 | |||||||||||||
| Corporate | (36 | ) | — | (36 | ) | — | — | — | |||||||||||
| Total EBITDA | 10,122 | (125 | ) | 9,997 | 11,708 | (135 | ) | 11,573 | |||||||||||
| Depreciation and amortization | |||||||||||||||||||
| Payment Protection | 927 | — | 927 | 1,001 | — | 1,001 | |||||||||||||
| BPO | 307 | — | 307 | 300 | — | 300 | |||||||||||||
| Brokerage | 650 | — | 650 | 1,017 | — | 1,017 | |||||||||||||
| Corporate | — | — | — | — | — | — | |||||||||||||
| Total depreciation and amortization | 1,884 | — | 1,884 | 2,318 | — | 2,318 | |||||||||||||
| Interest Expense | |||||||||||||||||||
| Payment Protection | 1,053 | — | 1,053 | 1,027 | — | 1,027 | |||||||||||||
| BPO | 96 | — | 96 | 161 | — | 161 | |||||||||||||
| Brokerage | 757 | — | 757 | 591 | — | 591 | |||||||||||||
| Total interest expense | 1,906 | — | 1,906 | 1,779 | — | 1,779 | |||||||||||||
| Income (loss) before income taxes and non-controlling interests | |||||||||||||||||||
| Payment Protection | 5,345 | (125 | ) | 5,220 | 6,973 | (135 | ) | 6,838 | |||||||||||
| BPO | 713 | — | 713 | 601 | — | 601 | |||||||||||||
Brokerage (1) | 310 | — | 310 | 37 | — | 37 | |||||||||||||
| Corporate | (36 | ) | — | (36 | ) | — | — | — | |||||||||||
| Total income before income taxes and non-controlling interests | 6,332 | (125 | ) | 6,207 | 7,611 | (135 | ) | 7,476 | |||||||||||
| Income taxes | 2,259 | (50 | ) | 2,209 | 2,626 | (54 | ) | 2,572 | |||||||||||
| Less: net income attributable to non-controlling interests | 1 | — | 1 | 1 | — | 1 | |||||||||||||
| Net income | $ | 4,072 | $ | (75 | ) | 3,997 | $ | 4,984 | $ | (81 | ) | $ | 4,903 | ||||||
(1) - Includes loss on sale of subsidiary of $477 for the three months ended September 30, 2011. | |||||||||||||||||||
140
FORTEGRA FINANCIAL CORPORATION
NOTES TO CONSOLIDATED FINANCIAL STATEMENTS
(All Amounts in Thousands Except Share Amounts, Per Share Amounts or Unless Otherwise Noted)
Reconciliation of Segment Net Revenue to Total Revenue and EBITDA to Net Income | For the Three Months Ended | For the Three Months Ended | |||||||||||||||||
| March 31, 2010 | June 30, 2010 | ||||||||||||||||||
| As Previously Reported | Adjustment | As Restated | As Previously Reported | Adjustment | As Restated | ||||||||||||||
| Segment Net Revenue | |||||||||||||||||||
| Payment Protection | $ | 9,903 | $ | — | $ | 9,903 | $ | 12,210 | $ | — | $ | 12,210 | |||||||
| BPO | 4,563 | — | 4,563 | 4,327 | — | 4,327 | |||||||||||||
| Brokerage | 8,261 | — | 8,261 | 7,680 | — | 7,680 | |||||||||||||
| Segment net revenues | 22,727 | — | 22,727 | 24,217 | — | 24,217 | |||||||||||||
| Net losses and loss adjustment expenses | 8,777 | — | 8,777 | 7,316 | — | 7,316 | |||||||||||||
| Member benefit claims | — | — | — | — | (23 | ) | (23 | ) | |||||||||||
| Commissions | 19,349 | — | 19,349 | 17,850 | 3,105 | 20,955 | |||||||||||||
| Total segment revenue | 50,853 | — | 50,853 | 49,383 | 3,082 | 52,465 | |||||||||||||
| Operating Expenses | |||||||||||||||||||
| Payment Protection | 5,094 | 656 | 5,750 | 6,191 | 167 | 6,358 | |||||||||||||
| BPO | 2,774 | — | 2,774 | 2,635 | — | 2,635 | |||||||||||||
| Brokerage | 6,119 | — | 6,119 | 5,785 | — | 5,785 | |||||||||||||
| Corporate | 230 | — | 230 | 612 | — | 612 | |||||||||||||
| Total operating expenses | 14,217 | 656 | 14,873 | 15,223 | 167 | 15,390 | |||||||||||||
| Net losses and loss adjustment expenses | 8,777 | — | 8,777 | 7,316 | — | 7,316 | |||||||||||||
| Member benefit claims | — | — | — | — | (23 | ) | (23 | ) | |||||||||||
| Commissions | 19,349 | — | 19,349 | 17,850 | 3,105 | 20,955 | |||||||||||||
| Total operating expenses before depreciation, amortization and interest expense | 42,343 | 656 | 42,999 | 40,389 | 3,249 | 43,638 | |||||||||||||
| EBITDA | |||||||||||||||||||
| Payment Protection | 4,809 | (656 | ) | 4,153 | 6,019 | (167 | ) | 5,852 | |||||||||||
| BPO | 1,789 | — | 1,789 | 1,692 | — | 1,692 | |||||||||||||
| Brokerage | 2,142 | — | 2,142 | 1,895 | — | 1,895 | |||||||||||||
| Corporate | (230 | ) | — | (230 | ) | (612 | ) | — | (612 | ) | |||||||||
| Total EBITDA | 8,510 | (656 | ) | 7,854 | 8,994 | (167 | ) | 8,827 | |||||||||||
| Depreciation and amortization | |||||||||||||||||||
| Payment Protection | 470 | — | 470 | 585 | — | 585 | |||||||||||||
| BPO | 174 | — | 174 | 80 | — | 80 | |||||||||||||
| Brokerage | 410 | — | 410 | 398 | — | 398 | |||||||||||||
| Total depreciation and amortization | 1,054 | — | 1,054 | 1,063 | — | 1,063 | |||||||||||||
| Interest Expense | |||||||||||||||||||
| Payment Protection | 1,661 | — | 1,661 | 1,704 | — | 1,704 | |||||||||||||
| BPO | 106 | — | 106 | 92 | — | 92 | |||||||||||||
| Brokerage | 124 | — | 124 | 189 | — | 189 | |||||||||||||
| Total interest expense | 1,891 | — | 1,891 | 1,985 | — | 1,985 | |||||||||||||
| Income (loss) before income taxes and non-controlling interests | |||||||||||||||||||
| Payment Protection | 2,678 | (656 | ) | 2,022 | 3,730 | (167 | ) | 3,563 | |||||||||||
| BPO | 1,509 | — | 1,509 | 1,520 | — | 1,520 | |||||||||||||
| Brokerage | 1,608 | — | 1,608 | 1,308 | — | 1,308 | |||||||||||||
| Corporate | (230 | ) | — | (230 | ) | (612 | ) | — | (612 | ) | |||||||||
| Total income before income taxes and non-controlling interests | 5,565 | (656 | ) | 4,909 | 5,946 | (167 | ) | 5,779 | |||||||||||
| Income taxes | 2,076 | (230 | ) | 1,846 | 2,220 | (58 | ) | 2,162 | |||||||||||
| Less: net income (loss) attributable to non-controlling interests | 15 | — | 15 | (46 | ) | — | (46 | ) | |||||||||||
141
FORTEGRA FINANCIAL CORPORATION
NOTES TO CONSOLIDATED FINANCIAL STATEMENTS
(All Amounts in Thousands Except Share Amounts, Per Share Amounts or Unless Otherwise Noted)
Reconciliation of Segment Net Revenue to Total Revenue and EBITDA to Net Income | For the Three Months Ended | For the Three Months Ended | |||||||||||||||||
| March 31, 2010 | June 30, 2010 | ||||||||||||||||||
| As Previously Reported | Adjustment | As Restated | As Previously Reported | Adjustment | As Restated | ||||||||||||||
| Net income | $ | 3,474 | $ | (426 | ) | 3,048 | $ | 3,772 | $ | (109 | ) | $ | 3,663 | ||||||
Reconciliation of Segment Net Revenue to Total Revenue and EBITDA to Net Income | For the Three Months Ended | For the Three Months Ended | |||||||||||||||||
| September 30, 2010 | December 31, 2010 | ||||||||||||||||||
| As Previously Reported | Adjustment | As Restated | As Previously Reported | Adjustment | As Restated | ||||||||||||||
| Segment Net Revenue | |||||||||||||||||||
| Payment Protection | $ | 14,641 | $ | — | $ | 14,641 | $ | 14,192 | $ | — | $ | 14,192 | |||||||
| BPO | 4,715 | — | 4,715 | 3,464 | — | 3,464 | |||||||||||||
| Brokerage | 7,158 | — | 7,158 | 6,138 | — | 6,138 | |||||||||||||
| Segment net revenues | 26,514 | — | 26,514 | 23,794 | — | 23,794 | |||||||||||||
| Net losses and loss adjustment expenses | 10,993 | — | 10,993 | 8,949 | — | 8,949 | |||||||||||||
| Member benefit claims | — | 211 | 211 | — | 278 | 278 | |||||||||||||
| Commissions | 16,432 | 8,527 | 24,959 | 17,372 | 10,011 | 27,383 | |||||||||||||
| Total segment revenue | 53,939 | 8,738 | 62,677 | 50,115 | 10,289 | 60,404 | |||||||||||||
| Operating Expenses | |||||||||||||||||||
| Payment Protection | 6,435 | 125 | 6,560 | 5,853 | 605 | 6,458 | |||||||||||||
| BPO | 2,588 | — | 2,588 | 2,005 | — | 2,005 | |||||||||||||
| Brokerage | 5,783 | — | 5,783 | 5,842 | — | 5,842 | |||||||||||||
| Corporate | 1,220 | — | 1,220 | 68 | — | 68 | |||||||||||||
| Total operating expenses | 16,026 | 125 | 16,151 | 13,768 | 605 | 14,373 | |||||||||||||
| Net losses and loss adjustment expenses | 10,993 | — | 10,993 | 8,949 | — | 8,949 | |||||||||||||
| Member benefit claims | — | 211 | 211 | — | 278 | 278 | |||||||||||||
| Commissions | 16,432 | 8,527 | 24,959 | 17,372 | 10,011 | 27,383 | |||||||||||||
| Total operating expenses before depreciation, amortization and interest expense | 43,451 | 8,863 | 52,314 | 40,089 | 10,894 | 50,983 | |||||||||||||
| EBITDA | |||||||||||||||||||
| Payment Protection | 8,206 | (125 | ) | 8,081 | 8,339 | (605 | ) | 7,734 | |||||||||||
| BPO | 2,127 | — | 2,127 | 1,459 | — | 1,459 | |||||||||||||
| Brokerage | 1,375 | — | 1,375 | 296 | — | 296 | |||||||||||||
| Corporate | (1,220 | ) | — | (1,220 | ) | (68 | ) | — | (68 | ) | |||||||||
| Total EBITDA | 10,488 | (125 | ) | 10,363 | 10,026 | (605 | ) | 9,421 | |||||||||||
| Depreciation and amortization | |||||||||||||||||||
| Payment Protection | 327 | — | 327 | 970 | — | 970 | |||||||||||||
| BPO | 457 | — | 457 | (113 | ) | — | (113 | ) | |||||||||||
| Brokerage | 435 | — | 435 | 435 | — | 435 | |||||||||||||
| Total depreciation and amortization | 1,219 | — | 1,219 | 1,292 | — | 1,292 | |||||||||||||
| Interest Expense | |||||||||||||||||||
| Payment Protection | 1,873 | — | 1,873 | 1,959 | — | 1,959 | |||||||||||||
| BPO | 126 | — | 126 | 109 | — | 109 | |||||||||||||
| Brokerage | 247 | — | 247 | 274 | — | 274 | |||||||||||||
| Total interest expense | 2,246 | — | 2,246 | 2,342 | — | 2,342 | |||||||||||||
| Income (loss) before income taxes and non-controlling interests | |||||||||||||||||||
| Payment Protection | 6,006 | (125 | ) | 5,881 | 5,410 | (605 | ) | 4,805 | |||||||||||
142
FORTEGRA FINANCIAL CORPORATION
NOTES TO CONSOLIDATED FINANCIAL STATEMENTS
(All Amounts in Thousands Except Share Amounts, Per Share Amounts or Unless Otherwise Noted)
Reconciliation of Segment Net Revenue to Total Revenue and EBITDA to Net Income | For the Three Months Ended | For the Three Months Ended | |||||||||||||||||
| September 30, 2010 | December 31, 2010 | ||||||||||||||||||
| As Previously Reported | Adjustment | As Restated | As Previously Reported | Adjustment | As Restated | ||||||||||||||
| BPO | 1,544 | — | 1,544 | 1,463 | — | 1,463 | |||||||||||||
| Brokerage | 693 | — | 693 | (413 | ) | — | (413 | ) | |||||||||||
| Corporate | (1,220 | ) | — | (1,220 | ) | (68 | ) | — | (68 | ) | |||||||||
| Total income before income taxes and non-controlling interests | 7,023 | (125 | ) | 6,898 | 6,392 | (605 | ) | 5,787 | |||||||||||
| Income taxes | 2,576 | (44 | ) | 2,532 | 1,831 | (212 | ) | 1,619 | |||||||||||
| Less: net income attributable to non-controlling interests | — | — | — | 51 | — | 51 | |||||||||||||
| Net income | $ | 4,447 | $ | (81 | ) | 4,366 | $ | 4,510 | $ | (393 | ) | $ | 4,117 | ||||||
ITEM 9. CHANGES IN AND DISAGREEMENTS WITH ACCOUNTANTS ON ACCOUNTING AND
FINANCIAL DISCLOSURE
None.
ITEM 9A. CONTROLS AND PROCEDURES
Evaluation of Disclosure Controls and Procedures
Under the supervision and with the participation of management, including our Chief Executive Officer and Chief Financial Officer, we have evaluated the effectiveness of the design and operation of our disclosure controls and procedures, as defined in Rules 13a-15(e) and 15d-15(e) under the Exchange Act as of December 31, 2012. Based on this evaluation, management, including our Chief Executive Officer and Chief Financial Officer, concluded that our disclosure controls and procedures were not effective as of December 31, 2012, due to material weaknesses in internal control over financial reporting described below.
Material Weakness Related to Revenue Recognition of Motor Clubs Division
The Company filed a Current Report on Form 8-K on March 28, 2013, disclosing that certain previously issued financial statements would be restated in this Annual Report on Form 10-K to correct errors in the reporting of revenue, member benefit claims and commissions of our Motor Clubs division. Specifically, we identified errors and a related control deficiency regarding our interpretation of FASB Accounting Standards Codification No. 605 concerning Revenue Recognition (“ASC 605”). The Company determined that, to be consistent with ASC 605, the revenue generated by the Company's Motor Clubs division should be reported on a gross basis with the corresponding gross expenses restated in the expense section of the Consolidated Statements of Income in the line items, member benefit claims and commissions. Historically, these revenues were presented on a net basis in service and administrative fees on the Consolidated Statements of Income. Additionally, through its review of Motor Clubs revenue recognition, the Company recorded an immaterial correction of an error related to the deferral of revenue and commissions for certain products of the Motor Clubs division. The effects of these errors in revenue presentation and revenue recognition were immaterial to net income, but the corrections for the change in presentation in the Consolidated Statements of Income were material to individual line items, and management therefore concluded that the control deficiency represented a material weakness in the Company's internal control over financial reporting.
Material Weakness Related to Reporting of Commissions of the Company's Payment Protection Segment
Management also identified a deficiency in internal control over financial reporting related to the reporting of retrospective commissions in the Company's Payment Protection segment and the documentation supporting estimation processes and related accrual balances. This deficiency did not result in any accounting errors for retrospective commissions in prior periods. Despite the accuracy of our accounting for retrospective commissions, the associated internal controls over financial reporting were deemed inadequate to prevent or detect material errors in retrospective commission accruals. Management concluded that this control deficiency represented a material weakness in internal control over financial reporting due to the significance of those accruals.
Plan of Remediation of Material Weaknesses
Management has established new workflows, documentary evidence and review procedures to better support the retrospective commission accrual estimates and facilitate effective validation of the amounts recorded. Management has also reinforced with the corporate and business unit accounting groups the requirement to continuously evaluate accounting determinations as circumstances change within the business, particularly when new entities or new types of transactions must be accounted for.
143
Further, management has reassigned accounting personnel to strengthen financial control of the affected areas, filled open positions and added accounting resources in recent months. Management will continue to evaluate the adequacy of staffing and the effectiveness of the organizational structure with respect to accounting and reporting procedures and related internal controls over financial reporting.
Management's Annual Report on Internal Control Over Financial Reporting
Management is responsible for establishing and maintaining adequate internal control over financial reporting, as such term is defined in Exchange Act Rules 13a-15(f) and 15d-15(f). Management, including our Chief Executive Officer and Chief Financial Officer, conducted an evaluation of the effectiveness of our internal control over financial reporting as of December 31, 2012, based on the criteria set forth in Internal Control-Integrated Framework issued by the Committee of Sponsoring Organizations of the Treadway Commission ("COSO").
Management's evaluation of the effectiveness of the Company's internal control over financial reporting excluded ProtectCELL and 4Warranty, which were both acquired on December 31, 2012. The assets of ProtectCELL and 4Warranty are included in the Consolidated Balance Sheets at December 31, 2012. ProtectCELL and 4Warranty contributed approximately 9.1% and 0.4% of total assets at December 31, 2012, respectively, and did not contribute any revenues or net income for the year ended December 31, 2012. Management will include the internal controls of ProtectCELL and 4Warranty in management's assessment of the effectiveness of the Company's internal control over financial reporting for the year ending December 31, 2013.
Because of the material weaknesses in internal control over financial reporting described above, our management, including our Chief Executive Officer and Chief Financial Officer, concluded that our internal control over financial reporting was not effective as of December 31, 2012.
The effectiveness of the Company's internal control over financial reporting as of December 31, 2012 has been audited by Johnson Lambert LLP, the Company's independent registered public accounting firm, as stated in their report that appears below in this Item 9A of this Annual Report on Form 10-K.
Changes in Internal Control Over Financial Reporting
Management, including our Chief Executive Officer and Chief Financial Officer, identified no change in our internal control over financial reporting that occurred during the quarter ended December 31, 2012, that has materially affected, or is reasonably likely to materially affect, our internal control over financial reporting other than the change resulting from the plan of remediation described above.
Inherent Limitations of Disclosure Controls and Procedures and Internal Control Over Financial Reporting
Management, including our Chief Executive Officer and Chief Financial Officer, does not expect that our disclosure controls and internal controls will prevent or detect all errors and all fraud. A control system, no matter how well conceived and operated, can provide only reasonable, not absolute, assurance that the objectives of the control system are met. Further, the design of a control system must reflect the fact that there are resource constraints, and the benefits of controls must be considered relative to their costs. Because of the inherent limitations in all control systems, no evaluation of controls can provide absolute assurance that all control issues and instances of fraud, if any, within the company have been detected. These inherent limitations include the realities that judgments in decision-making can be faulty and that breakdowns can occur because of simple errors or mistakes. Additionally, controls can be circumvented by the individual acts of some persons, by collusion of two or more people, or by management override of the controls. The design of any system of controls also is based in part upon certain assumptions about the likelihood of future events. There can be no assurance that any design will succeed in achieving its stated goals under all potential future conditions. Over time, a control may become inadequate because of changes in conditions or the degree of compliance with the policies or procedures may deteriorate. Because of the inherent limitations in a cost-effective control system, misstatements due to error or fraud may occur and not be detected.
Chief Executive Officer and Chief Financial Officer Certifications
Exhibits 31.1 and 31.2 are the Certifications of our Chief Executive Officer and Chief Financial Officer, respectively, required in accordance with Section 302 of the Sarbanes-Oxley Act of 2002 (the "Section 302 Certifications"). The "Evaluation of Disclosure Controls and Procedures" in this Item 9A is the Evaluation referred to in the Section 302 Certifications, and accordingly, the above information should be read in conjunction with the Section 302 Certifications for a more complete understanding of the topics presented.
144
REPORT OF INDEPENDENT REGISTERED PUBLIC ACCOUNTING FIRM
The Board of Directors and Stockholders of
Fortegra Financial Corporation
We have audited Fortegra Financial Corporation's ("the Company") internal control over financial reporting as December 31, 2012, based on criteria established in Internal Control-Integrated Framework issued by the Committee of Sponsoring Organizations of the Treadway Commission ("COSO"). The Company's management is responsible for maintaining effective internal control over financial reporting, and for its assessment of the effectiveness of internal control over financial reporting included in the accompanying Management's Annual Report on Internal Control over Financial Reporting. Our responsibility is to express an opinion on the Company's internal control over financial reporting based on our audit.
We conducted our audit in accordance with the standards of the Public Company Accounting Oversight Board (United States). Those standards require that we plan and perform the audit to obtain reasonable assurance about whether effective internal control over financial reporting was maintained in all material respects. Our audit included obtaining an understanding of internal control over financial reporting, assessing the risk that a material weakness exists, testing and evaluating the design and operating effectiveness of internal control based on the assessed risk, and performing such other procedures as we considered necessary in the circumstances. We believe that our audit provides a reasonable basis for our opinion.
A company's internal control over financial reporting is a process designed to provide reasonable assurance regarding the reliability of financial reporting and the preparation of financial statements for external purposes in accordance with generally accepted accounting principles. A company's internal control over financial reporting includes those policies and procedures that (1) pertain to the maintenance of records that, in reasonable detail, accurately and fairly reflect the transactions and dispositions of the assets of the company; (2) provide reasonable assurance that transactions are recorded as necessary to permit preparation of financial statements in accordance with accounting principles generally accepted in the United States, and that receipts and expenditures of the company are being made only in accordance with authorizations of management and directors of the company; and (3) provide reasonable assurance regarding prevention or timely detection of unauthorized acquisition, use or disposition of the company's assets that could have a material effect on the financial statements.
Because of its inherent limitations, internal control over financial reporting may not prevent or detect misstatements. Also, projections of any evaluation of effectiveness to future periods are subject to the risk that controls may become inadequate because of changes in conditions, or that the degree of compliance with the policies or procedures may deteriorate.
As described in Management's Annual Report on Internal Control over Financial Reporting, the Company has excluded ProtectCELL ("PC") and 4Warranty Corporation ("4WC") from its assessment of internal control over financial reporting as of December 31, 2012, because both were acquired by the Company on December 31, 2012. Accordingly, our audit of internal control over financial reporting did not include PC and 4WC. PC and 4WC contributed approximately 9.1% and 0.4% of total assets at December 31, 2012, respectively, and did not contribute any revenues or net income for the year ended December 31, 2012.
A material weakness is a deficiency, or combination of deficiencies, in internal control over financial reporting, such that there is a reasonable possibility that a material misstatement of the Company's annual or interim financial statements will not be prevented or detected on a timely basis. The following material weaknesses have been identified and included in management's assessment. Management has identified material weaknesses in controls related to the Company's reporting of revenue, member benefit claims, and commissions of its Motor Clubs division and reporting of retrospective commissions in its Payment Protection segment. We also have audited, in accordance with the standards of the Public Company Accounting Oversight Board (United States), the consolidated balance sheets of the Company as of December 31, 2012 and 2011and the related consolidated statements of income, comprehensive income, changes in stockholders' equity, and cash flows for each of the three years in the period ended December 31, 2012. These material weaknesses were considered in determining the nature, timing and extent of audit tests applied in our audit of the consolidated financial statements as of and for the year ended December 31, 2012 and this report does not affect our report dated March 29, 2013, which expressed an unqualified opinion on those financial statements.
In our opinion, because of the effect of the material weaknesses described above on the achievement of the objectives of the control criteria, Fortegra Financial Corporation has not maintained effective internal control over financial reporting as of December 31, 2012, based on the COSO criteria.
/s/ Johnson Lambert LLP
Jacksonville, Florida
March 29, 2013
145
ITEM 9B. OTHER INFORMATION
None.
PART III
ITEM 10. DIRECTORS, EXECUTIVE OFFICERS AND CORPORATE GOVERNANCE
The information required by this Item will be included in our Proxy Statement for our 2013 Annual Meeting of Stockholders to be filed with the SEC within 120 days after the end of the year ended December 31, 2012 and is incorporated by reference herein.
Code of Ethics
Fortegra has adopted a Code of Business Conduct and Ethics that applies to our directors, officers and employees, including Fortegra's Chief Executive Officer, Chief Financial Officer and other Senior officers. Fortegra's "Code of Ethics for the CEO, CFO and Senior Officers" can be found posted on our website at www.fortegra.com in the "Investor Relations" section under "Corporate Governance" then click the subsection "Governance Documents." Within the time period required by the SEC and the NYSE, we intend to post on our website any amendment to or waiver of our Code of Business Conduct and Ethics.
Upon written request of any stockholder of record on December 31, 2012, Fortegra will provide, without charge, a printed copy of its "Code of Ethics for the CEO, CFO and Senior Officers." To obtain a copy, Contact: Investor Relations, Fortegra Financial Corporation, 10151 Deerwood Park Boulevard, Building 100, Suite 330, Jacksonville, FL, 32256 or call (866)-961-9529.
ITEM 11. EXECUTIVE COMPENSATION
The information required by this Item will be included in our Proxy Statement for our 2013 Annual Meeting of Stockholders to be filed with the SEC within 120 days after the end of the year ended December 31, 2012 and is incorporated by reference herein.
ITEM 12. SECURITY OWNERSHIP OF CERTAIN BENEFICIAL OWNERS AND MANAGEMENT AND RELATED STOCKHOLDER MATTERS
The information required by this Item will be included in our Proxy Statement for our 2013 Annual Meeting of Stockholders to be filed with the SEC within 120 days after the end of the year ended December 31, 2012 and is incorporated by reference herein.
ITEM 13. CERTAIN RELATIONSHIPS AND RELATED TRANSACTIONS, AND DIRECTOR
INDEPENDENCE
The information required by this Item will be included in our Proxy Statement for our 2013 Annual Meeting of Stockholders to be filed with the SEC within 120 days after the end of the year ended December 31, 2012 and is incorporated by reference herein.
ITEM 14. PRINCIPAL ACCOUNTANT FEES AND SERVICES
The information required by this Item will be included in our Proxy Statement for our 2013 Annual Meeting of Stockholders to be filed with the SEC within 120 days after the end of the year ended December 31, 2012 and is incorporated by reference herein.
146
PART IV
ITEM 15. EXHIBITS AND FINANCIAL STATEMENT SCHEDULES
(a)1. Financial Statements:
The following Consolidated Financial Statements of Fortegra Financial Corporation and subsidiaries are included in this report:
| (a) | Report of Independent Registered Public Accounting Firm on the Consolidated Financial Statements. |
| (b) | Consolidated Balance Sheets as of December 31, 2012 and 2011(Restated). |
| (c) | Consolidated Statements of Income for the years ended December 31, 2012, 2011 (Restated) and 2010 (Restated). |
| (d) | Consolidated Statements of Comprehensive Income for the years ended December 31, 2012, 2011 (Restated) and 2010 (Restated). |
| (e) | Consolidated Statements of Stockholders' Equity for the years ended December 31, 2012, 2011(Restated) and 2010(Restated). |
| (f) | Consolidated Statements of Cash Flows the years ended December 31, 2012, 2011(Restated) and 2010 (Restated). |
| (g) | Notes to Consolidated Financial Statements. |
(a)2. Consolidated Financial Statement Schedules
The following financial statement schedule is attached hereto:
Schedule II - Condensed Financial Information of the Registrant
* All other schedules are omitted because they are not applicable, not required, or the information is included in the Consolidated Financial Statements or the Notes thereto.
Schedule II — Condensed Financial Information of Registrant
| FORTEGRA FINANCIAL CORPORATION | |||||||||||
| PARENT COMPANY ONLY CONDENSED STATEMENTS OF INCOME | |||||||||||
| (All Amounts in Thousands) | Years Ended December 31, | ||||||||||
| 2012 | 2011 | 2010 | |||||||||
| Revenues | As Restated | As Restated | |||||||||
| Management fee from subsidiaries* | $ | — | $ | — | $ | — | |||||
| Net investment income | 290 | 298 | 307 | ||||||||
| Other income | — | — | — | ||||||||
| Total net revenue | 290 | 298 | 307 | ||||||||
| Expenses | |||||||||||
| Personnel costs* | — | — | — | ||||||||
| Other operating expenses | 1,036 | 558 | 598 | ||||||||
| Interest expense | 210 | 1,062 | 904 | ||||||||
| Total expenses | 1,246 | 1,620 | 1,502 | ||||||||
| Income before interest and income taxes interest | (956 | ) | (1,322 | ) | (1,195 | ) | |||||
| Income taxes | (335 | ) | (357 | ) | (287 | ) | |||||
| Income before equity in net income in subsidiaries | (621 | ) | (965 | ) | (908 | ) | |||||
| Equity in net income of subsidiaries* | 15,786 | 14,474 | 16,102 | ||||||||
| Net income | $ | 15,165 | $ | 13,509 | $ | 15,194 | |||||
| * Eliminated in consolidation | |||||||||||
147
| FORTEGRA FINANCIAL CORPORATION | |||||||
| PARENT COMPANY ONLY CONDENSED BALANCE SHEETS | |||||||
| (All Amounts in Thousands) | December 31, | ||||||
| 2012 | 2011 | ||||||
| Assets: | As Restated | ||||||
| Investment in subsidiaries * | $ | 120,406 | $ | 102,788 | |||
| Cash and cash equivalents | 279 | 138 | |||||
| Due from subsidiaries, net* | 13,960 | 19,891 | |||||
| Notes receivable* | 4,999 | 3,351 | |||||
| Other assets | 933 | 903 | |||||
| Total assets | $ | 140,577 | $ | 127,071 | |||
| Liabilities: | |||||||
| Long-term debt | $ | — | $ | — | |||
| Other liabilities | 194 | 496 | |||||
| Total liabilities | 194 | 496 | |||||
| Stockholders' equity: | |||||||
| Total stockholders' equity | 140,383 | 126,575 | |||||
| Total liabilities and stockholders' equity | $ | 140,577 | $ | 127,071 | |||
| * Eliminated in consolidation | |||||||
| FORTEGRA FINANCIAL CORPORATION | |||||||||||
| PARENT COMPANY ONLY CONDENSED STATEMENTS OF CASH FLOWS | |||||||||||
| (All Amounts in Thousands) | Years Ended December 31, | ||||||||||
| 2012 | 2011 | 2010 | |||||||||
| Operating Activities: | As Restated | As Restated | |||||||||
| Net income | $ | 15,165 | $ | 13,509 | $ | 15,194 | |||||
| Adjustments to reconcile net income to net cash flows (used in) provided by operating activities | |||||||||||
| Equity in net income of subsidiaries* | (15,786 | ) | (14,474 | ) | (16,102 | ) | |||||
| Cash dividend from subsidiaries | — | — | — | ||||||||
| Deferred income tax expense | — | — | 93 | ||||||||
| Stock based compensation | 384 | 409 | 176 | ||||||||
| Other changes in assets and liabilities: | |||||||||||
| Net due to subsidiaries | 5,931 | 14,012 | (16,083 | ) | |||||||
| Other assets and other liabilities | (332 | ) | 344 | 1,226 | |||||||
| Net cash flows provided by (used in) operating activities | 5,362 | 13,800 | (15,496 | ) | |||||||
| Investing Activities: | |||||||||||
| Proceeds from maturities of investments | — | — | — | ||||||||
| Net paid for the acquisition of subsidiaries | — | — | — | ||||||||
| Proceeds from notes receivable | (1,648 | ) | 84 | 703 | |||||||
| Net cash flows (used in) provided by investing activities | (1,648 | ) | 84 | 703 | |||||||
| Financing Activities: | |||||||||||
| Repayments of notes payable | — | (11,040 | ) | (11,487 | ) | ||||||
| Additional borrowings under notes payable | — | — | — | ||||||||
| Net proceeds from issuance of common stock | — | — | 40,203 | ||||||||
| Initial public offering costs | — | (826 | ) | — | |||||||
| Net proceeds from exercise of stock options | 20 | 651 | 203 | ||||||||
| (Purchase) issuance of treasury stock | (3,923 | ) | (2,552 | ) | — | ||||||
| Net proceeds received from stock issued in the Employee Stock Purchase Plan | 330 | — | — | ||||||||
| Stockholder funds disbursed at purchase | — | — | (14,105 | ) | |||||||
| Net cash flows (used in) provided by financing activities | (3,573 | ) | (13,767 | ) | 14,814 | ||||||
| Net increase in cash and cash equivalents | 141 | 117 | 21 | ||||||||
| Cash and cash equivalents at beginning of period | 138 | 21 | — | ||||||||
| Cash and cash equivalents at end of period | $ | 279 | $ | 138 | $ | 21 | |||||
| * Eliminated in consolidation | |||||||||||
148
(a)3. Exhibits
Exhibits listed in this Exhibit Index of this Annual Report on Form 10-K are filed herein or are incorporated by reference.
| Incorporated by Reference | |||||||
| Exhibit Number | Description of Exhibits | Form | File Number | Date Filed | Original Exhibit Number | Filed Herewith | Furnished Herewith |
| 1.1 | Form of Underwriting Agreement. | S-1/A | 333-169550 | 11/29/2010 | 1.1 | ||
| 2.1 | Agreement and Plan of Merger, dated as of March 7, 2007, by and among, Summit Partners Private Equity Fund VII-A, L.P., Summit Partners Private Equity Fund VII-B, L.P., Summit Subordinated Debt Fund III-A, L.P., Summit Subordinated Debt Fund III-B, L.P., Summit Investors VI, L.P., LOS Acquisition Co., the signing stockholders and Life of the South Corporation and N.G. Houston III, as Stockholder Representative. | S-1 | 333-169550 | 9/23/2010 | 2.1 | ||
| 2.2 | First Amendment to Merger Agreement, dated as of June 20, 2007 by and among Summit Partners Private Equity Fund VII-A, L.P., Summit Partners Private Equity Fund VII-B, L.P., Summit Subordinated Debt Fund III-A, L.P., Summit Subordinated Debt Fund III-B, L.P., Summit Investors VI, L.P., LOS Acquisition Co., Life of the South Corporation and N.G. Houston, III, as Stockholder Representative. | S-1 | 333-169550 | 9/23/2010 | 2.2 | ||
| 2.3 | Stock Purchase Agreement, dated as of April 15, 2009, by and among Willis HRH, Inc., Bliss and Glennon, Inc., LOTS Intermediate Co., Willis North America Inc. and Fortegra Financial Corporation. | S-1 | 333-169550 | 9/23/2010 | 2.3 | ||
| 2.4 | Agreement and Plan of Merger, dated March 3, 2011 by and among eReinsure.com, Inc., a Delaware corporation, Alpine Acquisition Sub., Inc., a Delaware corporation, and Century Capital Partners III, L.P., as Agent solely for the purposes of Section 10.02, and LOTS Intermediate Co., a Delaware corporation. | 8-K | 001-35009 | 3/7/2011 | 2.1 | ||
| 3.1 | Third Amended and Restated Certificate of Incorporation of Fortegra Financial Corporation. | S-1/A | 333-169550 | 12/13/2010 | 3.3 | ||
| 3.3 | Amended and Restated Bylaws of Fortegra Financial Corporation. | S-1/A | 333-169550 | 11/29/2010 | 3.2 | ||
| 4.1 | Form of Common Stock Certificate. | S-1/A | 333-169550 | 12/13/2010 | 4.1 | ||
| 4.2 | Stockholders Agreement, dated as of March 7, 2007, among Life of the South Corporation(together with its successors), the Rollover Stockholders (as defined therein), Employee Stockholders (as defined therein) and Investors (as defined therein). | S-1/A | 333-169550 | 10/29/2010 | 4.2 | ||
| 10.1 | Indenture, dated as of June 20, 2007, between LOTS Intermediate Co. and Wilmington Trust Company. | S-1 | 333-169550 | 9/23/2010 | 10.1 | ||
| 10.2 | Form of Fixed/Floating Rate Senior Debenture (included in Exhibit 10.1). | S-1 | 333-169550 | 9/23/2010 | 10.2 | ||
| 10.3 | Subordinated Debenture Purchase Agreement, dated as of June 20, 2007, among Summit Subordinated Debt Fund III-A, L.P., Summit Subordinated Debt Fund III-B, L.P., Summit Investors VI, L.P. and LOTS Intermediate Co. | S-1 | 333-169550 | 9/23/2010 | 10.3 | ||
| 10.4 | Form of Subordinated Debenture (included in Exhibit 10.3). | S-1 | 333-169550 | 9/23/2010 | 10.4 | ||
| 10.5 | Amended Subordinated Debenture Purchase Agreement, dated June 16, 2010, among Summit Subordinated Debt Fund III-A, L.P., Summit Subordinated Debt Fund III-B, L.P., Summit Investors VI, L.P. and LOTS Intermediate Co. | S-1 | 333-169550 | 9/23/2010 | 10.5 | ||
149
| Incorporated by Reference | |||||||
| Exhibit Number | Description of Exhibits | Form | File Number | Date Filed | Original Exhibit Number | Filed Herewith | Furnished Herewith |
| 10.6 | Revolving Credit Agreement, dated June 16, 2010, among Fortegra Financial Corporation and LOTS Intermediate Co., as borrowers, and the lenders from time to time a party thereto and SunTrust Bank, as administrative agent. | S-1 | 333-169550 | 9/23/2010 | 10.6 | ||
| 10.6.1 | First Amendment to Credit Agreement, dated as of October 6, 2010, by and among Fortegra Financial Corporation and LOTS Intermediate Co., as borrowers, and the lenders from time to time a party thereto and SunTrust Bank, as administrative agent. | S-1/A | 333-169550 | 10/29/2010 | 10.6.1 | ||
| 10.6.2 | Joinder Agreement, dated November 30, 2010, by CB&T, a division of Synovus Bank, Suntrust Bank, as Administrative Agent and Fortegra Financial Corporation and LOTS Intermediate Co., as Borrowers. | S-1/A | 333-169550 | 12/13/2010 | 10.6.2 | ||
| 10.6.3 | Joinder Agreement, dated March 1, 2011, by Wells Fargo Bank, N.A., Suntrust Bank, as Administrative Agent and Fortegra Financial Corporation and LOTS Intermediate Co., as Borrowers | 8-K | 001-35009 | 3/7/2011 | 10.1 | ||
| 10.7 | Revolving Credit Note, dated June 16, 2010, among Fortegra Financial Corporation and LOTS Intermediate Co., as borrowers, and SunTrust Bank, as lender. | S-1 | 333-169550 | 9/23/2010 | 10.7 | ||
| 10.8 | Subsidiary Guaranty Agreement, dated June 16, 2010, among Bliss and Glennon, Inc., LOTSolutions, Inc., as guarantors and SunTrust Bank, as administrative agent. | S-1 | 333-169550 | 9/23/2010 | 10.8 | ||
| 10.9 | Security Agreement, dated June 16, 2010, by Fortegra Financial Corporation and LOTS Intermediate Co., as borrowers and SunTrust Bank, as administrative agent. | S-1 | 333-169550 | 9/23/2010 | 10.9 | ||
| 10.10 | Pledge Agreement, dated June 16, 2010 by and among Fortegra Financial Corporation, as pledgor and SunTrust Bank, as administrative agent. | S-1 | 333-169550 | 9/23/2010 | 10.10 | ||
| 10.11 | Form of Fortegra Financial Corporation Director Indemnification Agreement for John R. Carroll and J.J. Kardwell. | S-1/A | 333-169550 | 11/29/2010 | 10.18 | ||
| 10.12 | Form of Fortegra Financial Corporation Director Indemnification Agreement for Francis M. Colalucci, Frank P. Filipps, Arun Maheshwari, Ted W. Rollins and Sean S. Sweeney. | S-1/A | 333-169550 | 11/29/2010 | 10.19 | ||
| 10.13 | Form of Fortegra Financial Corporation Officer Indemnification Agreement. | S-1/A | 333-169550 | 12/3/2010 | 10.20 | ||
| 10.14 | Form of Indemnity Agreement between Fortegra Financial Corporation and the executive officers serving as plan committee members for the Fortegra Financial Corporation 401(k) Savings Plan. | S-1/A | 333-169550 | 10/29/2010 | 10.21 | ||
| 10.15 * | Executive Employment and Non-Competition Agreement, dated as of March 7, 2007, by and between Life of the South Corporation and Richard S. Kahlbaugh. | S-1/A | 333-169550 | 12/3/2010 | 10.22 | ||
| 10.15.1* | Amendment No. 1 to Executive Employment and Non-Competition Agreement, dated as of November 1, 2010, by and between Fortegra Financial Corporation and Richard S. Kahlbaugh. | S-1/A | 333-169550 | 12/3/2010 | 10.22.1 | ||
| 10.16 * | Executive Employment and Non-Competition Agreement, dated as of October 1, 2010, by and between Fortegra Financial Corporation and Walter P. Mascherin. | S-1/A | 333-169550 | 12/3/2010 | 10.27 | ||
| 10.17 * | 2005 Equity Incentive Plan. | S-1/A | 333-169550 | 10/29/2010 | 10.28 | ||
| 10.18 * | Key Employee Stock Option Plan (1995) Agreement. | S-1/A | 333-169550 | 10/29/2010 | 10.29 | ||
150
| Incorporated by Reference | |||||||
| Exhibit Number | Description of Exhibits | Form | File Number | Date Filed | Original Exhibit Number | Filed Herewith | Furnished Herewith |
| 10.19 | Stock Option Agreement by and between Life of the South Corporation and Richard S. Kahlbaugh, dated as of November 18, 2005, as amended on March 7, 2007 and June 20, 2007. | S-1/A | 333-169550 | 11/16/2010 | 10.30 | ||
| 10.20 | Stock Option Agreement by and between Life of the South Corporation and Richard Kahlbaugh, dated as of October 25, 2007. | S-1/A | 333-169550 | 11/16/2010 | 10.31 | ||
| 10.21 * | 2010 Omnibus Incentive Plan. | S-1/A | 333-169550 | 12/3/2010 | 10.32 | ||
| 10.22 * | Employee Stock Purchase Plan. | S-1/A | 333-169550 | 12/3/2010 | 10.33 | ||
| 10.23 * | Deferred Compensation Agreement, dated January 1, 2006 between Life of the South Corporation and Richard S. Kahlbaugh. | S-1/A | 333-169550 | 10/29/2010 | 10.35 | ||
| 10.24 | Administrative Services Agreement, dated August 1, 2002, by and between Life of the South Insurance Company and National Union Fire Insurance Company of Pittsburgh, PA., as amended on February 1, 2003, October 1, 2003 and August 1, 2008. (CONFIDENTIAL TREATMENT HAS BEEN GRANTED WITH RESPECT TO CERTAIN PORTIONS, WHICH HAVE BEEN FILED SEPERATELY WITH THE SECURTIES AND EXHANGE COMMISSION) | S-1/A | 333-169550 | 11/16/2010 | 10.37 | ||
| 10.24.1 | Amendment No. 4, dated January 31, 2012, to the Administrative Services Agreement, dated August 1, 2002, by and between Life of the South Insurance Company and National Union Fire Insurance Company of Pittsburgh, PA., as amended on February 1, 2003, October 1, 2003 and August 1, 2008 | X | |||||
| 10.24.2 | Amendment No. 5, dated February 1, 2012, to the Administrative Services Agreement, dated August 1, 2002, by and between Life of the South Insurance Company and National Union Fire Insurance Company of Pittsburgh, PA., as amended on February 1, 2003, October 1, 2003, August 1, 2008, and January 31, 2012. | X | |||||
| 10.25 | Claims Services Agreement, dated December 1, 2008, by and between LOTSolutions, Inc. and National Union Fire Insurance Company of Pittsburgh, PA., as amended on August 1, 2010. (CONFIDENTIAL TREATMENT HAS BEEN GRANTED WITH RESPECT TO CERTAIN PORTIONS, WHICH HAVE BEEN FILED SEPERATELY WITH THE SECURTIES AND EXHANGE COMMISSION) | S-1/A | 333-169550 | 11/16/2010 | 10.38 | ||
| 10.25.1 | Amendment No. 2, dated January 1, 2012, to the Claims Services Agreement, dated December 1, 2008, by and between LOTSolutions, Inc. and National Union Fire Insurance Company of Pittsburgh, PA., as amended on August 1, 2010. | X | |||||
| 10.26 * | Form of Restricted Stock Award Agreement for Directors. | S-1/A | 333-169550 | 12/3/2010 | 10.47 | ||
| 10.26.1 * | Amended - Form of Restricted Stock Award Agreement for Directors. | X | |||||
| 10.27 * | Form of Restricted Stock Award Agreement for Employees. | S-1/A | 333-169550 | 12/3/2010 | 10.48 | ||
| 10.28 * | Form of Restricted Stock Award Agreement (Bonus Pool). | S-1/A | 333-169550 | 12/3/2010 | 10.49 | ||
| 10.29 * | Form of Nonqualified Stock Option Award Agreement. | S-1/A | 333-169550 | 12/3/2010 | 10.50 | ||
| 10.30 * | Form of Nonqualified Stock Option Award Agreement for Walter P. Mascherin. | S-1/A | 333-169550 | 12/3/2010 | 10.51 | ||
151
| Incorporated by Reference | |||||||
| Exhibit Number | Description of Exhibits | Form | File Number | Date Filed | Original Exhibit Number | Filed Herewith | Furnished Herewith |
| 10.31* | Executive Employment and Non-Competition Agreement, dated as of January 1, 2011, by and between Fortegra Financial Corporation and Alex Halikias. | 10-Q | 001-35009 | 5/15/2012 | 10.38 | ||
| 10.32 * | Executive Employment and Non-Competition Agreement, dated as of January 1, 2009, by and between Fortegra Financial Corporation and Joseph McCaw. | 10-Q | 001-35009 | 5/15/2012 | 10.39 | ||
| 10.33 * | Executive Employment and Non-Competition Agreement, dated as of October 1, 2010, by and between Fortegra Financial Corporation and John G. Short. | 10-Q | 001-35009 | 5/15/2012 | 10.40 | ||
| 10.34 | Credit Agreement, dated August 2, 2012, among Fortegra Financial Corporation and LOTS Intermediate Co., as borrowers; the initial lenders named therein; Wells Fargo Bank, N.A., as administrative agent, swingline lender, and issuing lender; Wells Fargo Securities, LLC, as bookrunner and joint lead arranger; and Synovus Bank as joint lead arranger and syndication agent. | 8-K | 001-35009 | 8/7/2012 | 10.1 | ||
| 10.35 | Subsidiary Guaranty Agreement, dated August 2, 2012, among certain subsidiaries of Fortegra Financial Corporation and LOTS Intermediate Co., as guarantors, and Wells Fargo Bank, N.A. | 8-K | 001-35009 | 8/7/2012 | 10.2 | ||
| 10.36 | Pledge Agreement, dated August 2, 2012, by Fortegra Financial Corporation and LOTS Intermediate Co., as pledgors, and Wells Fargo Bank, N.A. | 8-K | 001-35009 | 8/7/2012 | 10.3 | ||
| 10.37 | Security Agreement, dated August 2, 2012, among Fortegra Financial Corporation, LOTS Intermediate Co. and certain of its subsidiaries, as grantors, and Wells Fargo Bank, N.A. | 8-K | 001-35009 | 8/7/2012 | 10.4 | ||
| 10.38 | Trademark Security Agreement, dated August 2, 2012, among the Fortegra Financial Corporation, LOTSolutions, Inc., Pacific Benefits Group Northwest, L.L.C., eReinsure.com, Inc., as grantors, and Wells Fargo Bank, N.A. | 8-K | 001-35009 | 8/7/2012 | 10.5 | ||
| 10.39 | Patent Security Agreement, dated August 2, 2012, by eReinsure.com, Inc., as grantor, and Wells Fargo Bank, N.A. | 8-K | 001-35009 | 8/7/2012 | 10.6 | ||
| 10.40* | Executive Employment and Non-Competition Agreement, dated as of January 1, 2011, by and between Fortegra Financial Corporation and Igor Best-Devereux | X | |||||
| 11.1 | Statement Regarding Computation of Per Share Earnings (incorporated by reference to Notes to Consolidated Financial Statements in Part II, Item 8 of this Annual Report on Form 10-K). | ||||||
| 21 | List of Subsidiaries of Fortegra Financial Corporation | X | |||||
| 23 | Consent of Johnson Lambert LLP, Independent Registered Public Accounting Firm | X | |||||
| 31.1 | Rule 13a-14(a)/15d-14(a) Certification of Chief Executive Officer. | X | |||||
| 31.2 | Rule 13a-14(a)/15d-14(a) Certification of Chief Financial Officer. | X | |||||
| 32.1 | Certification of Chief Executive Officer pursuant to 18 U.S.C. Section 1350, as adopted pursuant to Section 906 of the Sarbanes-Oxley Act of 2002. | X | |||||
| 32.1 | Certification of Chief Financial Officer pursuant to 18 U.S.C. Section 1350, as adopted pursuant to Section 906 of the Sarbanes-Oxley Act of 2002. | X | |||||
152
| Incorporated by Reference | |||||||
| Exhibit Number | Description of Exhibits | Form | File Number | Date Filed | Original Exhibit Number | Filed Herewith | Furnished Herewith |
| 101 | The following materials from Fortegra Financial Corporation's Annual Report on Form 10-K for the year ended December 31, 2012, formatted in XBRL (Extensible Business Reporting Language): (i) the Consolidated Balance Sheets at December 31, 2012 and December 31, 2011, (ii) the Consolidated Statements of Income for the years ended December 31, 2012, 2011 and 2011, (iii) the Consolidated Statements of Comprehensive Income for the years ended December 31, 2012, 2011 and 2011, (iv) the Consolidated Statements of Stockholders' Equity for the years ended December 31, 2012, 2011 and 2011, (v) the Consolidated Statements of Cash Flows for the years ended December 31, 2012, 2011 and 2011, and (vi) the Notes to Consolidated Financial Statements. | (1) | |||||
| * | Management contract or compensatory plan or arrangement. | ||||||
| (1) | In accordance with Rule 406T of SEC Regulation S-T, the XBRL related documents in Exhibit 101 to this Annual Report on Form 10-K for the Annual period ended December 31, 2012, are deemed not filed or part of a registration statement or prospectus for purposes of Sections 11 or 12 of the Securities Act of 1933, as amended, are deemed not filed for purposes of Section 18 of the Securities Exchange Act of 1934, as amended, and otherwise are not subject to liability under these Sections. | ||||||
153
SIGNATURES
Pursuant to the requirements of Section 13 or 15(d) of the Securities Exchange Act of 1934, the Registrant has duly caused this Report to be signed on its behalf by the undersigned, thereunto duly authorized.
| Fortegra Financial Corporation | ||||
| Date: | April 1, 2013 | By: | /s/ Richard S. Kahlbaugh | |
| Richard S. Kahlbaugh | ||||
| Chairman, President and Chief Executive Officer | ||||
Pursuant to the requirements of the Securities Exchange Act of 1934, this Report has been signed below by the following persons on behalf of the Registrant and in the capacities and on the dates indicated.
| Signatures | Title | Date | ||
| /s/ Richard S. Kahlbaugh | April 1, 2013 | |||
| Richard S. Kahlbaugh | Chairman, President and Chief Executive Officer | |||
| (Principal Executive Officer) | ||||
| /s/ Walter P. Mascherin | April 1, 2013 | |||
| Walter P. Mascherin | Chief Financial Officer | |||
| (Principal Financial Officer) | ||||
| /s/ John R. Carroll | April 1, 2013 | |||
| John R. Carroll | Director | |||
| /s/ Francis M. Colalucci | April 1, 2013 | |||
| Francis M. Colalucci | Director | |||
| /s/ Frank P. Filipps | April 1, 2013 | |||
| Frank P. Filipps | Director | |||
| /s/ J.J. Kardwell | April 1, 2013 | |||
| J.J. Kardwell | Director | |||
| /s/ Arun Maheshwari | April 1, 2013 | |||
| Arun Maheshwari | Director | |||
| /s/ Sean S. Sweeney | April 1, 2013 | |||
| Sean S. Sweeney | Director | |||
| /s/ Ted W. Rollins | April 1, 2013 | |||
| Ted W. Rollins | Director | |||
154