UNITED STATES
SECURITIES AND EXCHANGE COMMISSION
WASHINGTON, D.C. 20549
FORM N-CSR
CERTIFIED SHAREHOLDER REPORT OF REGISTERED
MANAGEMENT INVESTMENT COMPANIES
Investment Company Act file number: 812-13797
AB ACTIVE ETFs, INC.
(Exact name of registrant as specified in charter)
66 Hudson Boulevard East
New York, New York 10005
(Address of principal executive offices) (Zip code)
Stephen M. Woetzel
AllianceBernstein L.P.
66 Hudson Boulevard East
New York, New York 10005
(Name and address of agent for service)
Registrant’s telephone number, including area code: (800) 221-5672
Date of fiscal year end: November 30, 2024
Date of reporting period: November 30, 2024
ITEM 1. REPORTS TO STOCKHOLDERS.
Please scan QR code for
Fund Information
AB International Low Volatility Equity ETF
Principal Listing Exchange: NYSE Arca
Annual Shareholder Report
This annual shareholder report contains important information about the AB International Low Volatility Equity ETF (the “Fund ”) for the period of December 1, 2023 to November 30, 2024. You can find additional information about the Fund at https://www.abfunds.com/link/AB/ILOW-A. You can also request this information by contacting us at (800) 227 4618.
What were the Fund costs for the last year?
(Based on a hypothetical $10,000 investment)
| Fund Name | Cost of a $10,000 investment | Costs paid as a percentage of a $10,000 investment |
|---|
| AB International Low Volatility Equity ETF | $53 | 0.52% |
|---|
Prior to commencing operations, the Fund acquired the assets and liabilities of AB International Low Volatility Equity Portfolio (a "Predecessor Fund"), a series of AB Cap Fund, Inc., and adopted the accounting and performance history of that fund (a "Reorganization"), as of the close of business on July 12, 2024.The Fund has the same investment objective, strategies, policies and portfolio management team as the Predecessor Fund.
The performance of the Predecessor Fund shown below has not been adjusted to reflect the lower fees and expenses that will be incurred by the Fund. The advisory fees paid, disclosed below includes the impact of advisory fee waiver arrangement of the Predecessor Fund. The Predecessor Fund was a mutual fund, and the average annual total returns as shown below are based on NAV per share, and are not based on market prices for an ETF share as traded on an exchange. Predecessor Fund performance is based on the performance of Advisor Class shares. Prior to the Fund's acquisition of the Predecessor Fund, the other share classes of the Predecessor Fund were converted into Advisor Class shares.
How did the Fund perform last year? What affected the Fund’s performance?
During the 12-month period ended November 30, 2024, the Fund outperformed the Morgan Stanley Capital International Europe, Australasia and the Far East (“MSCI EAFE”) Index (the "benchmark"), before sales charges.. Overall sector allocation and security selection contributed to performance, relative to the benchmark. Security selection within consumer staples and consumer discretionary contributed the most, while selection within real estate and health care detracted. In terms of sector allocation, an overweight to financials and an underweight to materials added to gains and offset losses from an overerweight to energy and an underweight to health care. Country allocation (a result of bottom-up security analysis combined with fundamental research) contributed, led by an overweight to Japan; an underweight to Australia detracted.
Top contributors to performance:
Top detractors from performance:
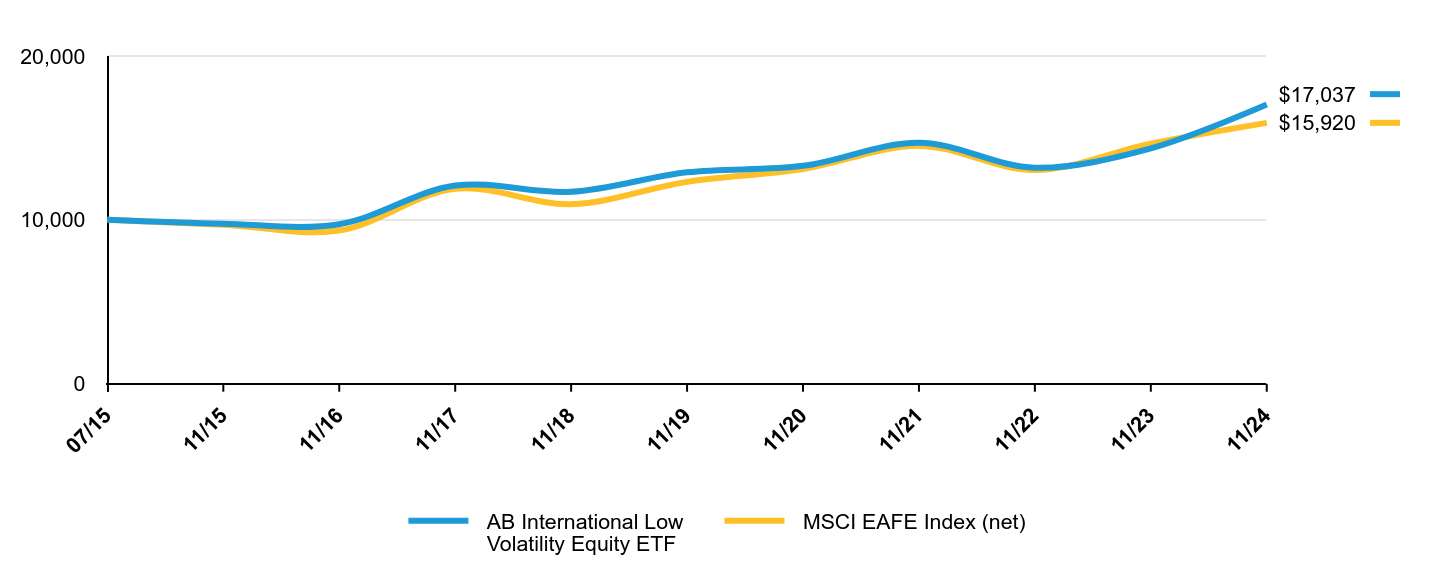
The following graph shows the performance of hypothetical $10,000 investments in the Fund and a broad-based securities market index over the most recently completed 10 fiscal years of the Fund , or since inception, if shorter. The Fund's performance reflects applicable sales charges and assumes the reinvestment of dividends.
| AB International Low Volatility Equity ETF | MSCI EAFE Index (net) |
|---|
| 07/15 | $10,000 | $10,000 |
|---|
| 11/15 | $9,760 | $9,706 |
|---|
| 11/16 | $9,734 | $9,351 |
|---|
| 11/17 | $12,093 | $11,901 |
|---|
| 11/18 | $11,710 | $10,956 |
|---|
| 11/19 | $12,900 | $12,319 |
|---|
| 11/20 | $13,296 | $13,104 |
|---|
| 11/21 | $14,713 | $14,515 |
|---|
| 11/22 | $13,185 | $13,042 |
|---|
| 11/23 | $14,366 | $14,655 |
|---|
| 11/24 | $17,037 | $15,920 |
|---|
Average Annual Total Returns
| AATR | 1 Year | 5 Years | Since Inception 07/29/15 |
|---|
| AB International Low Volatility Equity ETF | 18.59% | 5.72% | 5.87% |
|---|
| MSCI EAFE Index (net) | 11.88% | 5.89% | -3.49% |
|---|
The Fund ’s past performance is not a good predictor of the Fund ’s future performance.
The graph and table do not reflect the deduction of taxes that a shareholder would pay on Fund distributions or the redemption or sale of Fund shares.
Visit https://www.abfunds.com/link/AB/ILOW-A for the most recent performance information.
| Net Assets | $825,953,183 |
|---|
| # of Portfolio Holdings | 89 |
|---|
| Portfolio Turnover Rate | 14% |
|---|
| Total Advisory Fees Paid | $1,770,709 |
|---|
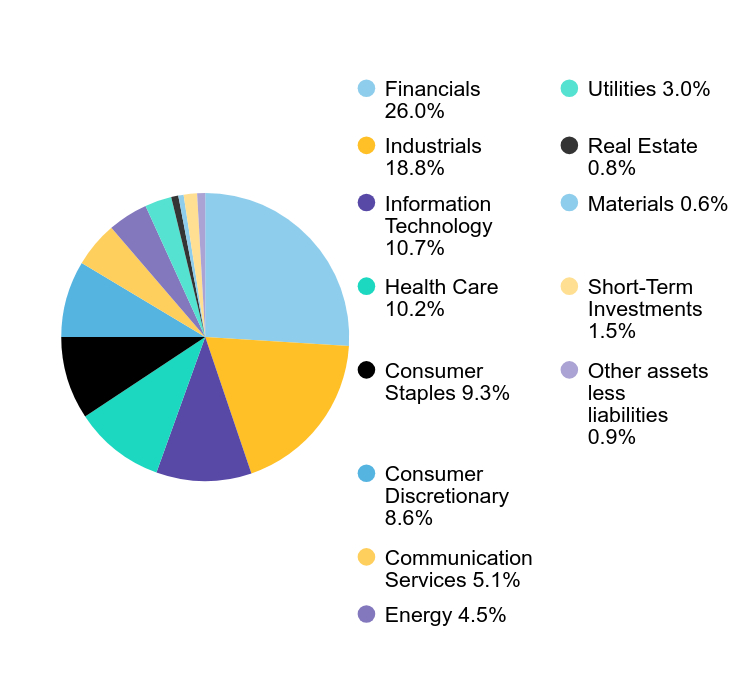
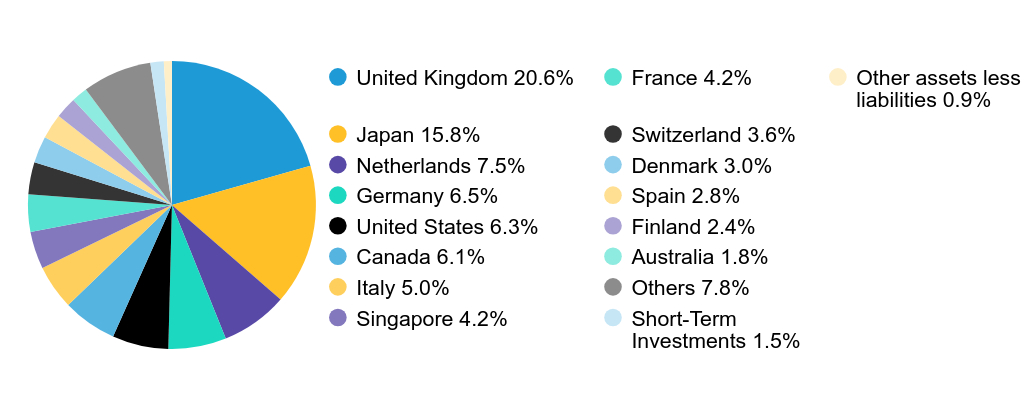
Graphical Representation of Holdings
| Company | U.S. $ Value | % of Net Assets |
|---|
| Novo Nordisk A/S - Class B | $24,980,497 | 3.0% |
| Shell PLC | $21,667,521 | 2.6% |
| Constellation Software, Inc./Canada | $20,780,736 | 2.5% |
| Oversea-Chinese Banking Corp., Ltd. | $18,894,830 | 2.3% |
| RELX PLC (London) | $17,858,995 | 2.2% |
| SAP SE | $16,793,566 | 2.0% |
| NatWest Group PLC | $16,585,087 | 2.0% |
| London Stock Exchange Group PLC | $16,261,440 | 2.0% |
| Tesco PLC | $15,784,385 | 1.9% |
| Prysmian SpA | $15,560,466 | 1.9% |
| Total | $185,167,523 | 22.4% |
| Value | Value |
|---|
| Financials | 26.0% |
| Industrials | 18.8% |
| Information Technology | 10.7% |
| Health Care | 10.2% |
| Consumer Staples | 9.3% |
| Consumer Discretionary | 8.6% |
| Communication Services | 5.1% |
| Energy | 4.5% |
| Utilities | 3.0% |
| Real Estate | 0.8% |
| Materials | 0.6% |
| Short-Term Investments | 1.5% |
| Other assets less liabilities | 0.9% |
| Value | Value |
|---|
| United Kingdom | 20.6% |
| Japan | 15.8% |
| Netherlands | 7.5% |
| Germany | 6.5% |
| United States | 6.3% |
| Canada | 6.1% |
| Italy | 5.0% |
| Singapore | 4.2% |
| France | 4.2% |
| Switzerland | 3.6% |
| Denmark | 3.0% |
| Spain | 2.8% |
| Finland | 2.4% |
| Australia | 1.8% |
| Others | 7.8% |
| Short-Term Investments | 1.5% |
| Other assets less liabilities | 0.9% |
Availability of Additional Information
You can find additional information on the Fund ’s website at https://www.abfunds.com/link/AB/ILOW-A, including the Fund 's:
• Prospectus
• Financial information
• Fund holdings
• Proxy voting information
You can also request this information by contacting us at (800) 227 4618.
Shareholders who have consented to receive a single annual or semi-annual shareholder report at a shared address may revoke this consent by contacting us at (800) 227 4618.
Information Regarding the Review and Approval of the Fund ’s Advisory Agreement
Information regarding the Fund ’s Board of Directors’/Trustees’ review of the advisory agreement is available on the Fund ’s website https://www.abfunds.com/link/AB/ILOW-A. You can request this information, free of charge, by contacting us at (800) 227 4618 or by scanning the QR code below.
AB ETFs are distributed by Foreside Fund Services, LLC; Foreside is not related to AllianceBernstein or its affiliates.
The [A/B] logo and AllianceBernstein® are registered trademarks used by permission of the owner, AllianceBernstein L.P.
Please scan QR code for
Fund Information
Please scan QR code for
Fund Information
AB Short Duration High Yield ETF
Principal Listing Exchange: NYSE Arca
Annual Shareholder Report
This annual shareholder report contains important information about the AB Short Duration High Yield ETF (the “Fund”) for the period of December 1, 2023 to November 30, 2024. You can find additional information about the Fund at https://www.abfunds.com/link/AB/SYFI-A. You can also request this information by contacting us at (800) 227 4618.
What were the Fund costs for the last year?
(Based on a hypothetical $10,000 investment)
| Fund Name | Cost of a $10,000 investment | Costs paid as a percentage of a $10,000 investment |
|---|
| AB Short Duration High Yield ETF | $39 | 0.39% |
|---|
Prior to commencing operations, the Fund acquired the assets and liabilities of AB Short Duration High Yield Portfolio (a “Predecessor Fund”), a series of AB Bond Fund, Inc., and adopted the accounting and performance history of that fund (a “Reorganization”), as of the close of business on June 7, 2024.
The Fund has the same investment objective, strategies, policies and portfolio management team as the Predecessor Fund.
The performance of the Predecessor Fund shown below has not been adjusted to reflect the lower fees and expenses that will be incurred by the Fund. The Predecessor Fund was a mutual fund, and the average annual total returns as shown below are based on NAV per share, and are not based on market prices for an ETF share as traded on an exchange. Predecessor Fund performance is based on the performance of Advisor Class shares. Prior to the Fund's acquisition of the Predecessor Fund, the other share classes of the Predecessor Fund were converted into Advisor Class shares.
How did the Fund perform last year? What affected the Fund’s performance?
Over the 12-month period, the portfolio underperformed the Bloomberg US High Yield 1-5 Year Cash Pay 2% Total Return Index (the “benchmark“), before sales charges. Security selection detracted the most from relative performance, mainly from selections in consumer non-cyclicals, media, telecommunications and services that outweighed gains from selections in energy, other consumer cyclicals and finance. Yield-curve positioning in the US also detracted, particularly from underweights to the six-month and two-year parts of the curve, which were partially offset by a gain from an overweight to the five-year part of the curve. At the country allocation level, off-benchmark exposure to the eurozone contributed to relative performance. Currency decisions did not impact investment results during the period.
Treasury futures were used to manage duration and yield-curve positioning, while currency forwards were used to hedge currency risk. Credit default swaps were used to maintain overall account risk relative to benchmark and to actively take single issuer exposure. Purchased options were used to hedge tail risk; written options were utilized to hedge tail risk via put spreads.
Top contributors to performance:
Top detractors from performance:
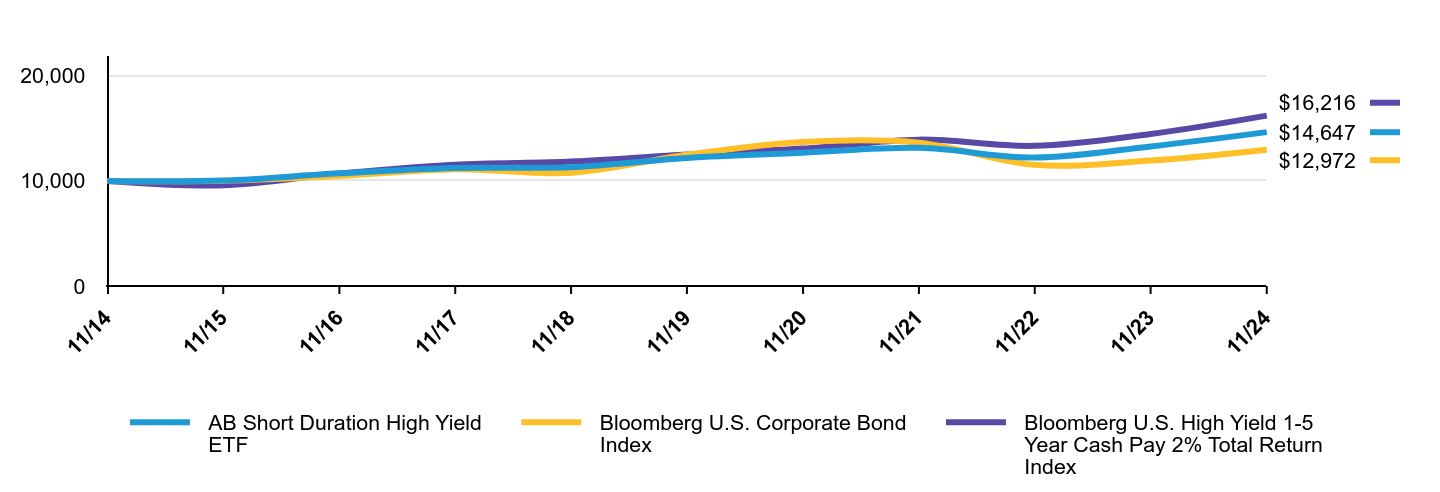
The following graph shows the performance of hypothetical $10,000 investments in the Fund, a broad-based securities market index and an additional index that corresponds to the Fund's investment strategies, over the most recently completed 10 fiscal years of the Fund, or since inception, if shorter. The Fund's performance reflects applicable sales charges and assumes the reinvestment of dividends.
| AB Short Duration High Yield ETF | Bloomberg U.S. Corporate Bond Index | Bloomberg U.S. High Yield 1-5 Year Cash Pay 2% Total Return Index |
|---|
| 11/14 | $10,000 | $10,000 | $10,000 |
|---|
| 11/15 | $10,033 | $10,016 | $9,590 |
|---|
| 11/16 | $10,724 | $10,475 | $10,697 |
|---|
| 11/17 | $11,235 | $11,120 | $11,541 |
|---|
| 11/18 | $11,305 | $10,782 | $11,843 |
|---|
| 11/19 | $12,188 | $12,491 | $12,509 |
|---|
| 11/20 | $12,677 | $13,710 | $13,075 |
|---|
| 11/21 | $13,152 | $13,637 | $13,930 |
|---|
| 11/22 | $12,221 | $11,529 | $13,337 |
|---|
| 11/23 | $13,286 | $11,939 | $14,465 |
|---|
| 11/24 | $14,647 | $12,972 | $16,216 |
|---|
Average Annual Total Returns
| AATR | 1 Year | 5 Years | 10 Years |
|---|
| AB Short Duration High Yield ETF | 10.25% | 3.67% | 3.89% |
|---|
| Bloomberg U.S. Corporate Bond Index | 8.66% | 0.76% | 2.64% |
|---|
| Bloomberg U.S. High Yield 1-5 Year Cash Pay 2% Total Return Index | 12.10% | 5.33% | 4.95% |
|---|
The addition of the Bloomberg U.S. Corporate Bond Index broad-based benchmark provides a comparison of the Fund's performance against the broader market as regulatorily required.
The Fund’s past performance is not a good predictor of the Fund’s future performance.
The graph and table do not reflect the deduction of taxes that a shareholder would pay on Fund distributions or the redemption or sale of Fund shares.
Visit https://www.abfunds.com/link/AB/SYFI-A for the most recent performance information.
| Net Assets | $754,350,983 |
|---|
| # of Portfolio Holdings | 666 |
|---|
| Portfolio Turnover Rate | 4% |
|---|
| Total Advisory Fees Paid | $465,670 |
|---|
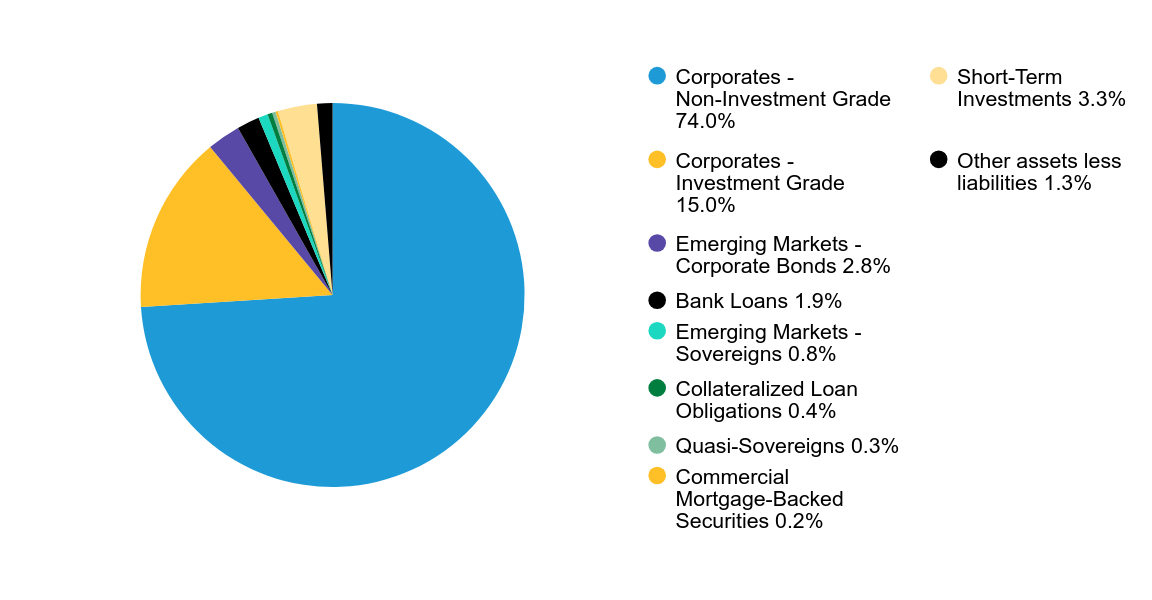
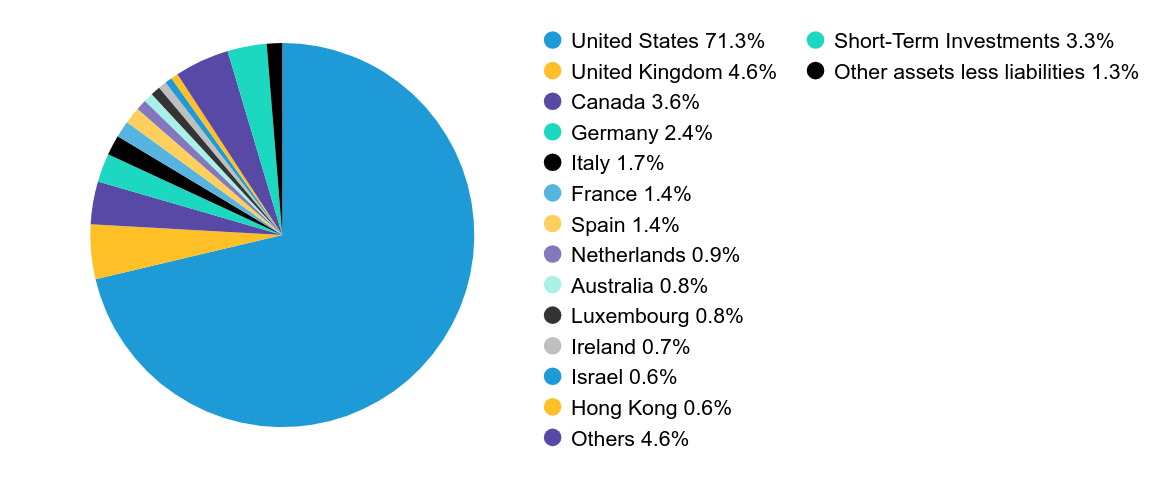
Graphical Representation of Holdings
| |
|---|
| Corporates - Non-Investment Grade | 74.0% |
| Corporates - Investment Grade | 15.0% |
| Emerging Markets - Corporate Bonds | 2.8% |
| Bank Loans | 1.9% |
| Emerging Markets - Sovereigns | 0.8% |
| Collateralized Loan Obligations | 0.4% |
| Quasi-Sovereigns | 0.3% |
| Commercial Mortgage-Backed Securities | 0.2% |
| Short-Term Investments | 3.3% |
| Other assets less liabilities | 1.3% |
| Value | Value |
|---|
| United States | 71.3% |
| United Kingdom | 4.6% |
| Canada | 3.6% |
| Germany | 2.4% |
| Italy | 1.7% |
| France | 1.4% |
| Spain | 1.4% |
| Netherlands | 0.9% |
| Australia | 0.8% |
| Luxembourg | 0.8% |
| Ireland | 0.7% |
| Israel | 0.6% |
| Hong Kong | 0.6% |
| Others | 4.6% |
| Short-Term Investments | 3.3% |
| Other assets less liabilities | 1.3% |
Availability of Additional Information
You can find additional information on the Fund’s website at https://www.abfunds.com/link/AB/SYFI-A, including the Fund's:
• Prospectus
• Financial information
• Fund holdings
• Proxy voting information
You can also request this information by contacting us at (800) 227 4618.
Shareholders who have consented to receive a single annual or semi-annual shareholder report at a shared address may revoke this consent by contacting us at (800) 227 4618.
Information Regarding the Review and Approval of the Fund’s Advisory Agreement
Information regarding the Fund’s Board of Directors’/Trustees’ review of the advisory agreement is available on the Fund’s website https://www.abfunds.com/link/AB/SYFI-A. You can request this information, free of charge, by contacting us at (800) 227 4618 or by scanning the QR code below.
AB ETFs are distributed by Foreside Fund Services, LLC; Foreside is not related to AllianceBernstein or its affiliates.
The [A/B] logo and AllianceBernstein® are registered trademarks used by permission of the owner, AllianceBernstein L.P.
Please scan QR code for
Fund Information
Please scan QR code for
Fund Information
AB Short Duration Income ETF
Principal Listing Exchange: NYSE Arca
Annual Shareholder Report
This annual shareholder report contains important information about the AB Short Duration Income ETF (the “Fund”) for the period of December 1, 2023 to November 30, 2024. You can find additional information about the Fund at https:/www.abfunds.com/link/AB/SDFI-A. You can also request this information by contacting us at (800) 227 4618.
What were the Fund costs for the last year?
(Based on a hypothetical $10,000 investment)
| Fund Name | Cost of a $10,000 investment | Costs paid as a percentage of a $10,000 investment |
|---|
| AB Short Duration Income ETF | $30 | 0.30% |
|---|
Prior to commencing operations, the Fund acquired the assets and liabilities of AB Short Duration Income Portfolio (a "Predecessor Fund"), a series of AB Bond Fund, Inc., and adopted the accounting and performance history of that fund (a "Reorganization"), as of the close of business on June 7, 2024.The Fund has the same investment objective, strategies, policies and portfolio management team as the Predecessor Fund.
The performance of the Predecessor Fund shown below has not been adjusted to reflect the lower fees and expenses that will be incurred by the Fund. The Predecessor Fund was a mutual fund, and the average annual total returns as shown below are based on NAV per share, and are not based on market prices for an ETF share as traded on an exchange. Predecessor Fund performance is based on the performance of Advisor Class shares. Prior to the Fund's acquisition of the Predecessor Fund, the other share classes of the Predecessor Fund were converted into Advisor Class shares.
How did the Fund perform last year? What affected the Fund’s performance?
During the 12-month period, all share chasses of the Fund outperformed the Bloomberg 1-5 Year US Government/Credit Index (the “benchmark”), before sales charges. Industry allocation was the primary contributor to performance, relative to the benchmark, from an underweight to US Treasuries and off-benchmark exposure to collateralized mortgage obligations, commercial mortgage-backed securities and collateral loan obligations that were partially offset by losses from exposure to investment-grade credit default swaps in the US. Security selection also contributed from selections in other asset-backed securities and energy. Overall yield-curve positioning in the US detracted from performance. Off-benchmark country allocation to the eurozone also added to performance. Currency decisions did not impact performance during the period.
The Fund used derivatives in the form of interest rate swaps, currency forwards and credit default swaps. Interest rate futures were used to manage and hedge duration risk and/or take active yield-curve positioning, while currency forwards were used to hedge foreign currency exposure. Credit default swaps were also used to effectively obtain high yield credit/sector exposure.
Top contributors to performance:
Top detractors from performance:
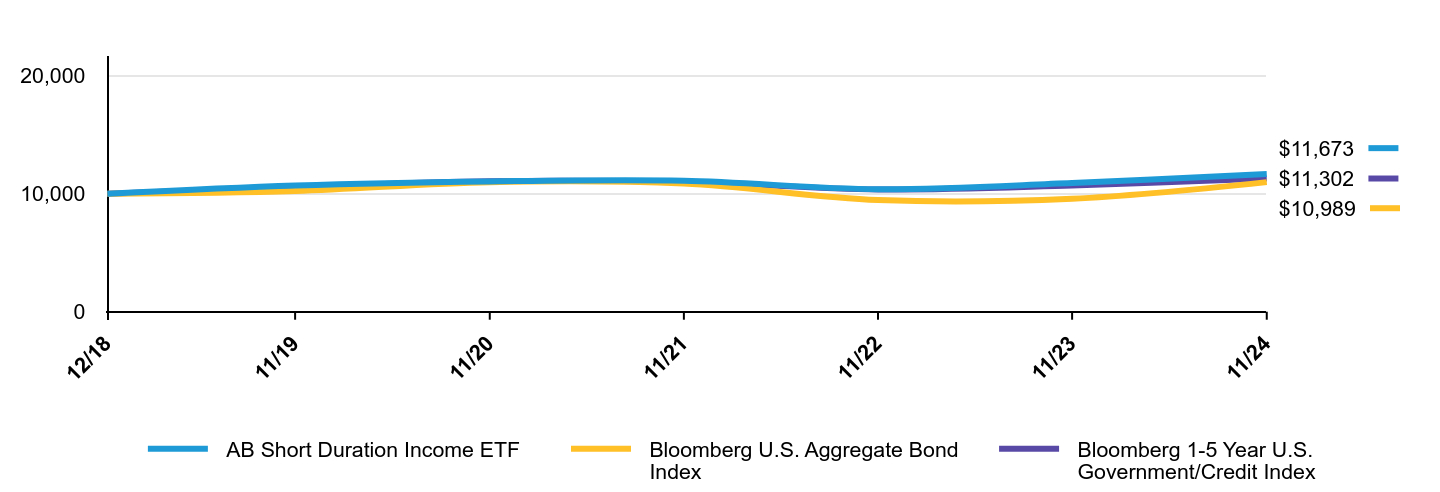
The following graph shows the performance of hypothetical $10,000 investments in the Fund, a broad-based securities market index and an additional index that corresponds to the Fund's investment strategies, over the most recently completed 10 fiscal years of the Fund, or since inception, if shorter. The Fund's performance reflects applicable sales charges and assumes the reinvestment of dividends.
| AB Short Duration Income ETF | Bloomberg U.S. Aggregate Bond Index | Bloomberg 1-5 Year U.S. Government/Credit Index |
|---|
| 12/18 | $10,000 | $10,000 | $10,000 |
|---|
| 11/19 | $10,704 | $10,244 | $10,565 |
|---|
| 11/20 | $11,049 | $10,990 | $11,067 |
|---|
| 11/21 | $11,106 | $10,863 | $10,995 |
|---|
| 11/22 | $10,392 | $9,468 | $10,369 |
|---|
| 11/23 | $10,914 | $9,580 | $10,707 |
|---|
| 11/24 | $11,673 | $10,989 | $11,302 |
|---|
Average Annual Total Returns
| AATR | 1 Year | 5 Years | Since Inception 12/12/18 |
|---|
| AB Short Duration Income ETF | 6.95% | 1.68% | 2.63% |
|---|
| Bloomberg U.S. Aggregate Bond Index | 6.88% | -0.01% | 1.59% |
|---|
| Bloomberg 1-5 Year U.S. Government/Credit Index | 5.56% | 1.36% | 2.07% |
|---|
The addition of the Bloomberg U.S. Aggregate Bond Index broad-based benchmark provides a comparison of the Fund's performance against the broader market as regulatorily required.
The Fund’s past performance is not a good predictor of the Fund’s future performance.
The graph and table do not reflect the deduction of taxes that a shareholder would pay on Fund distributions or the redemption or sale of Fund shares.
Visit https:/www.abfunds.com/link/AB/SDFI-A for the most recent performance information.
| Net Assets | $88,503,364 |
|---|
| # of Portfolio Holdings | 383 |
|---|
| Portfolio Turnover Rate | 1% |
|---|
| Total Advisory Fees Paid | $21,800 |
|---|
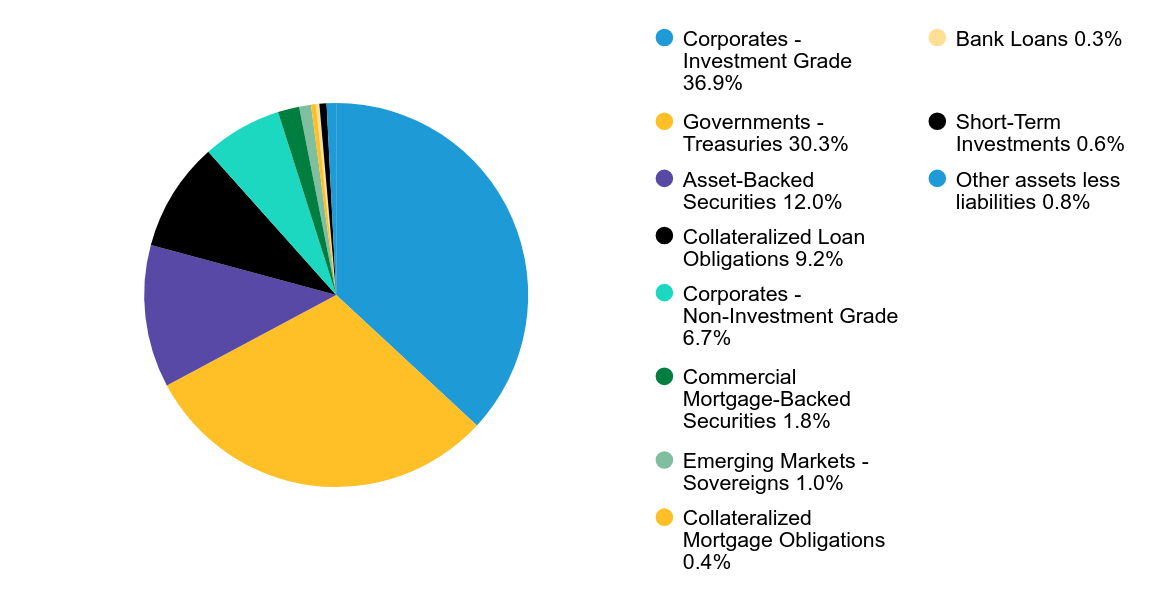
Graphical Representation of Holdings
| Value | Value |
|---|
| Corporates - Investment Grade | 36.9% |
| Governments - Treasuries | 30.3% |
| Asset-Backed Securities | 12.0% |
| Collateralized Loan Obligations | 9.2% |
| Corporates - Non-Investment Grade | 6.7% |
| Commercial Mortgage-Backed Securities | 1.8% |
| Emerging Markets - Sovereigns | 1.0% |
| Collateralized Mortgage Obligations | 0.4% |
| Bank Loans | 0.3% |
| Short-Term Investments | 0.6% |
| Other assets less liabilities | 0.8% |
Availability of Additional Information
You can find additional information on the Fund’s website at https:/www.abfunds.com/link/AB/SDFI-A, including the Fund's:
• Prospectus
• Financial information
• Fund holdings
• Proxy voting information
You can also request this information by contacting us at (800) 227 4618.
Shareholders who have consented to receive a single annual or semi-annual shareholder report at a shared address may revoke this consent by contacting us at (800) 227 4618.
Information Regarding the Review and Approval of the Fund’s Advisory Agreement
Information regarding the Fund’s Board of Directors’/Trustees’ review of the advisory agreement is available on the Fund’s website https:/www.abfunds.com/link/AB/SDFI-A. You can request this information, free of charge, by contacting us at (800) 227 4618 or by scanning the QR code below.
AB ETFs are distributed by Foreside Fund Services, LLC; Foreside is not related to AllianceBernstein or its affiliates.
The [A/B] logo and AllianceBernstein® are registered trademarks used by permission of the owner, AllianceBernstein L.P.
Please scan QR code for
Fund Information
AB Conservative Buffer ETF
Principal Listing Exchange: NASDAQ
Please scan QR code for
Fund Information
Annual Shareholder Report
This annual shareholder report contains important information about the AB Conservative Buffer ETF (the “Fund”) for the period of December 13, 2023 to November 30, 2024. You can find additional information about the Fund at https://www.abfunds.com/link/AB/BUFC-A. You can also request this information by contacting us at (800) 227 4618.
What were the Fund costs for the last year?
(Based on a hypothetical $10,000 investment)
| Fund Name | Cost of a $10,000 investment | Costs paid as a percentage of a $10,000 investment |
|---|
| AB Conservative Buffer ETF | $71 | 0.69% |
|---|
How did the Fund perform last year? What affected the Fund’s performance?
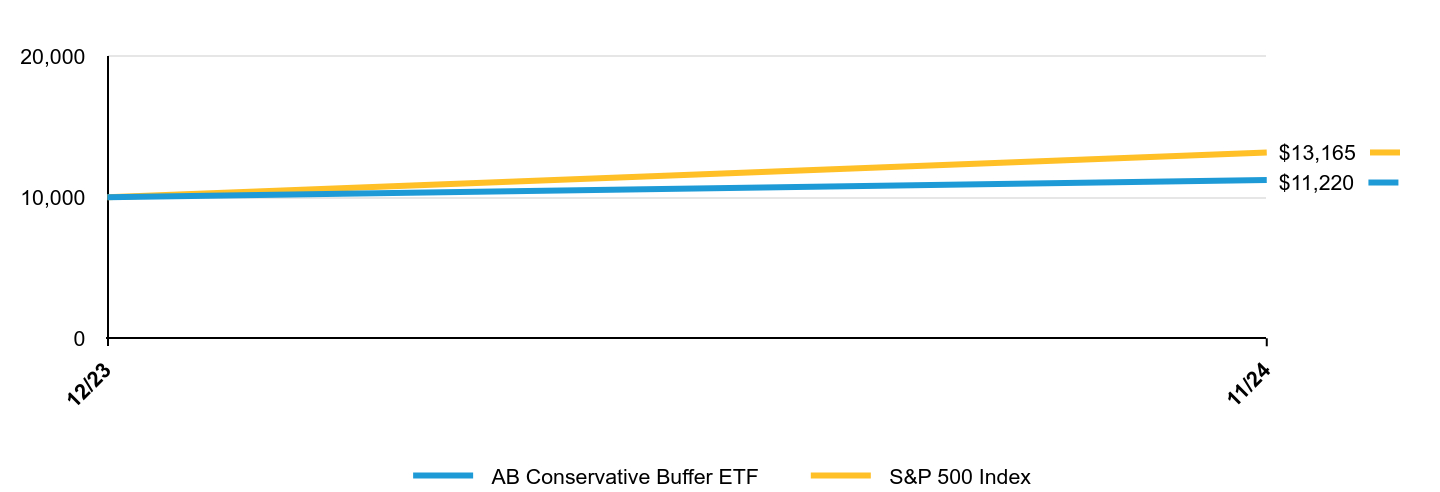
Since inception, the Fund returned 12.31% versus the Standard & Poor’s (“S&P”) 500 Index (the "benchmark") return of 31.65%, achieving its objective of providing market participation, up to a return cap and protecting against market declines of up to 15% over each three-month outcome period. The Fund holds a basket of options on the SPDR S&P 500 ETF, which reflects the S&P 500 Index with no active bets on sectors or asset classes.
The Fund used derivatives in the form of purchased options for hedging and investment purposes, which added to performance. Writing options were used for investment purposes, which detracted from performance.
Top contributors to performance:
As the reference asset, the SPDR S&P 500 ETF, appreciated over the inception period, the Fund participated up to the return cap, which resets at each three-month outcome period.
Top detractors from performance:
The following graph shows the performance of hypothetical $10,000 investments in the Fund and a broad-based securities market index over the most recently completed 10 fiscal years of the Fund, or since inception, if shorter. The Fund's performance reflects applicable sales charges and assumes the reinvestment of dividends.
| AB Conservative Buffer ETF | S&P 500 Index |
|---|
| 12/23 | $10,000 | $10,000 |
|---|
| 11/24 | $11,220 | $13,165 |
|---|
Average Annual Total Returns
| AATR | Since Inception 12/13/23 |
|---|
| AB Conservative Buffer ETF | 12.31% |
|---|
| S&P 500 Index | 31.65% |
|---|
The Fund’s past performance is not a good predictor of the Fund’s future performance.
The graph and table do not reflect the deduction of taxes that a shareholder would pay on Fund distributions or the redemption or sale of Fund shares.
Visit https://www.abfunds.com/link/AB/BUFC-A for the most recent performance information.
| Net Assets | $696,738,691 |
|---|
| # of Portfolio Holdings | 3 |
|---|
| Portfolio Turnover Rate | 0% |
|---|
| Total Advisory Fees Paid | $3,417,651 |
|---|
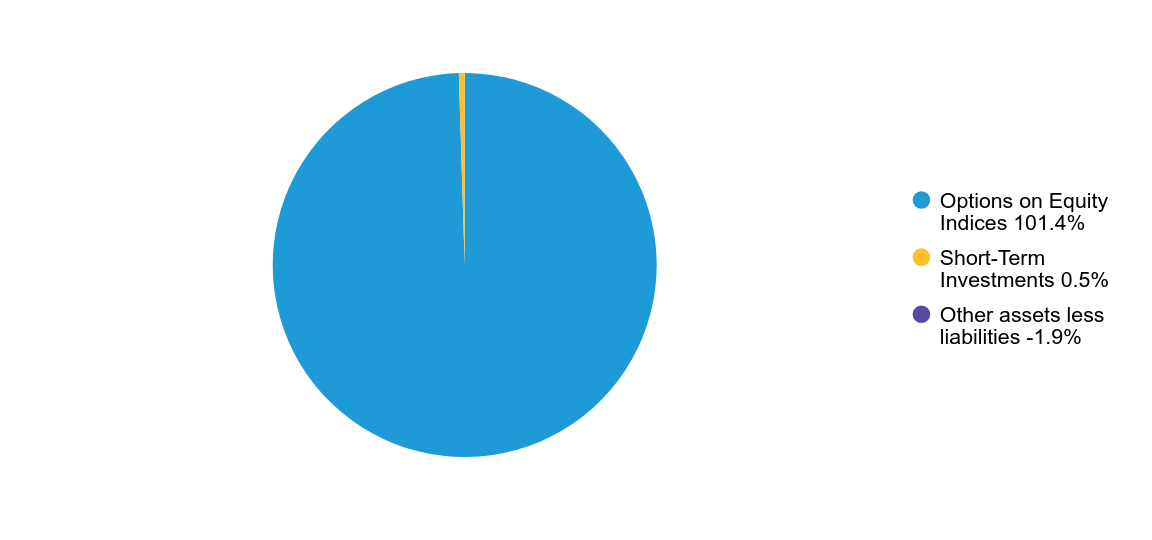
Graphical Representation of Holdings
| Value | Value |
|---|
| Options on Equity Indices | 101.4% |
| Short-Term Investments | 0.5% |
| Other assets less liabilities | -1.9% |
Availability of Additional Information
You can find additional information on the Fund’s website at https://www.abfunds.com/link/AB/BUFC-A, including the Fund's:
• Prospectus
• Financial information
• Fund holdings
• Proxy voting information
You can also request this information by contacting us at (800) 227 4618.
Shareholders who have consented to receive a single annual or semi-annual shareholder report at a shared address may revoke this consent by contacting us at (800) 227 4618.
Information Regarding the Review and Approval of the Fund’s Advisory Agreement
Information regarding the Fund’s Board of Directors’/Trustees’ review of the advisory agreement is available on the Fund’s website https://www.abfunds.com/link/AB/BUFC-A. You can request this information, free of charge, by contacting us at (800) 227 4618 or by scanning the QR code below.
AB ETFs are distributed by Foreside Fund Services, LLC; Foreside is not related to AllianceBernstein or its affiliates.
The [A/B] logo and AllianceBernstein® are registered trademarks used by permission of the owner, AllianceBernstein L.P.
Please scan QR code for
Fund Information
Principal Listing Exchange: NASDAQ
Please scan QR code for
Fund Information
Annual Shareholder Report
This annual shareholder report contains important information about the AB Core Plus Bond ETF (the “Fund”) for the period of December 13, 2023 to November 30, 2024. You can find additional information about the Fund at https://www.abfunds.com/link/AB/CPLS-A. You can also request this information by contacting us at (800) 227 4618.
What were the Fund costs for the last year?
(Based on a hypothetical $10,000 investment)
| Fund Name | Cost of a $10,000 investment | Costs paid as a percentage of a $10,000 investment |
|---|
| AB Core Plus Bond ETF | $32 | 0.32% |
|---|
How did the Fund perform last year? What affected the Fund’s performance?
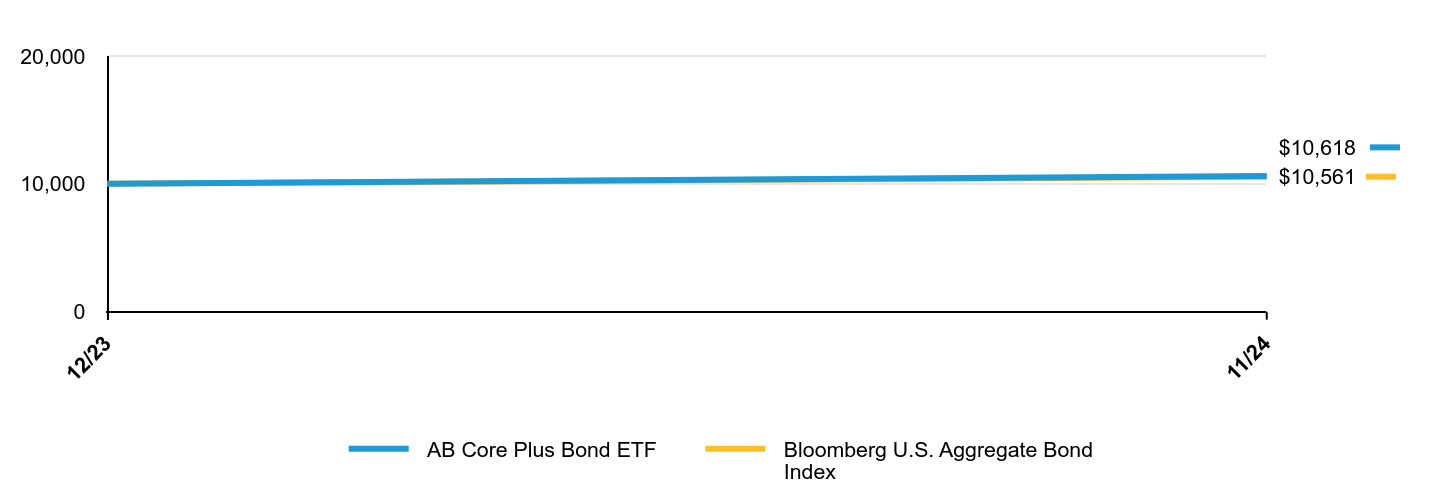
Since inception, the Fund has outperformed the Bloomberg U.S. Aggregate Bond Index (the “benchmark”). Security selection among investment-grade corporate bonds, underweight in mortgage-backed securities, and out-of-benchmark allocation to high-yield corporate bonds contributed, relative to the benchmark. Yield-curve positioning detracted marginally with portfolio running similar benchmark interest rate exposures. Country allocation and currency decisions did not impact performance during the period.
The fund used derivatives in the form of treasury futures for hedging purposes.
Top contributors to performance:
Top detractors from performance:
The following graph shows the performance of hypothetical $10,000 investments in the Fund and a broad-based securities market index over the most recently completed 10 fiscal years of the Fund, or since inception, if shorter. The Fund's performance reflects applicable sales charges and assumes the reinvestment of dividends.
| AB Core Plus Bond ETF | Bloomberg U.S. Aggregate Bond Index |
|---|
| 12/23 | $10,000 | $10,000 |
|---|
| 11/24 | $10,618 | $10,561 |
|---|
Average Annual Total Returns
| AATR | Since Inception 12/13/23 |
|---|
| AB Core Plus Bond ETF | 6.19% |
|---|
| Bloomberg U.S. Aggregate Bond Index | 5.61% |
|---|
The Fund’s past performance is not a good predictor of the Fund’s future performance.
The graph and table do not reflect the deduction of taxes that a shareholder would pay on Fund distributions or the redemption or sale of Fund shares.
Visit https://www.abfunds.com/link/AB/CPLS-A for the most recent performance information.
| Net Assets | $55,382,988 |
|---|
| # of Portfolio Holdings | 458 |
|---|
| Portfolio Turnover Rate | 232% |
|---|
| Total Advisory Fees Paid | $140,742 |
|---|
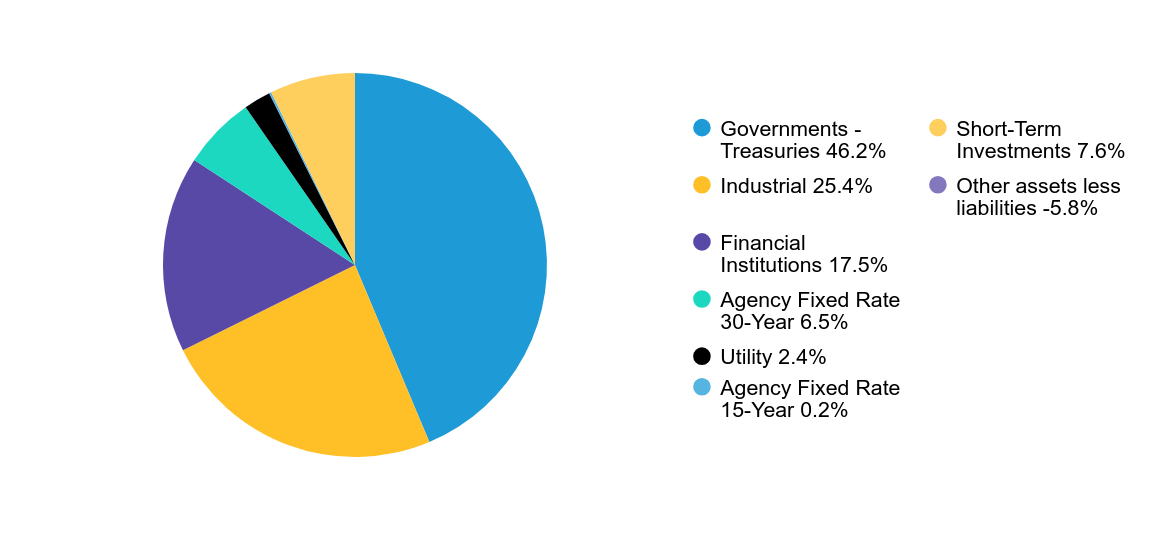
Graphical Representation of Holdings
| Value | Value |
|---|
| Governments - Treasuries | 46.2% |
| Industrial | 25.4% |
| Financial Institutions | 17.5% |
| Agency Fixed Rate 30-Year | 6.5% |
| Utility | 2.4% |
| Agency Fixed Rate 15-Year | 0.2% |
| Short-Term Investments | 7.6% |
| Other assets less liabilities | -5.8% |
Availability of Additional Information
You can find additional information on the Fund’s website at https://www.abfunds.com/link/AB/CPLS-A, including the Fund's:
• Prospectus
• Financial information
• Fund holdings
• Proxy voting information
You can also request this information by contacting us at (800) 227 4618.
Shareholders who have consented to receive a single annual or semi-annual shareholder report at a shared address may revoke this consent by contacting us at (800) 227 4618.
Information Regarding the Review and Approval of the Fund’s Advisory Agreement
Information regarding the Fund’s Board of Directors’/Trustees’ review of the advisory agreement is available on the Fund’s website https://www.abfunds.com/link/AB/CPLS-A. You can request this information, free of charge, by contacting us at (800) 227 4618 or by scanning the QR code below.
AB ETFs are distributed by Foreside Fund Services, LLC; Foreside is not related to AllianceBernstein or its affiliates.
The [A/B] logo and AllianceBernstein® are registered trademarks used by permission of the owner, AllianceBernstein L.P.
Please scan QR code for
Fund Information
Principal Listing Exchange: NASDAQ
Please scan QR code for
Fund Information
Annual Shareholder Report
This annual shareholder report contains important information about the AB Corporate Bond ETF (the “Fund”) for the period of December 13, 2023 to November 30, 2024. You can find additional information about the Fund at https://www.abfunds.com/link/AB/EYEG-A. You can also request this information by contacting us at (800) 227 4618.
What were the Fund costs for the last year?
(Based on a hypothetical $10,000 investment)
| Fund Name | Cost of a $10,000 investment | Costs paid as a percentage of a $10,000 investment |
|---|
| AB Corporate Bond ETF | $30 | 0.30% |
|---|
How did the Fund perform last year? What affected the Fund’s performance?
Since inception, the Fund has outperformed the Bloomberg US Corporate Bond Index (the “benchmark”). Security selection among investment-grade corporate bonds was the largest contributor, relative to the benchmark. Overall yield-curve positioning detracted, mostly from overweights to the five- to 20-year parts of the curve, which were partially offset by gains to the six-month and two-year parts of the curve. Currency decisions did not impact performance during the period.
The Fund used to treasury futures to hedge duration.
Top contributors to performance:
Top detractors from performance:
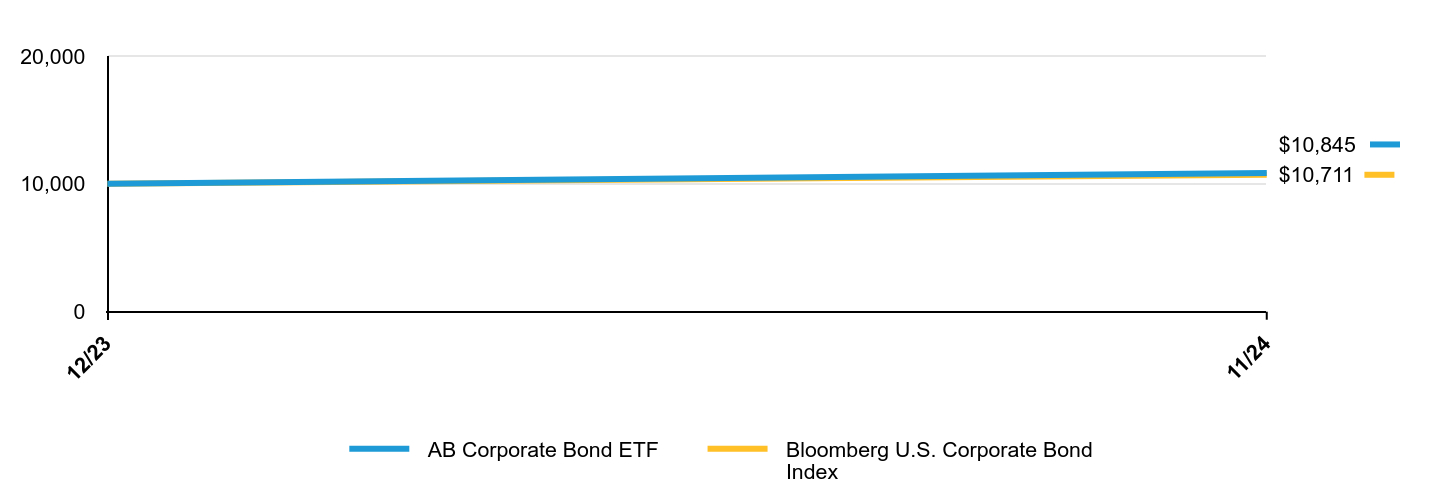
The following graph shows the performance of hypothetical $10,000 investments in the Fund and a broad-based securities market index over the most recently completed 10 fiscal years of the Fund, or since inception, if shorter. The Fund's performance reflects applicable sales charges and assumes the reinvestment of dividends.
| AB Corporate Bond ETF | Bloomberg U.S. Corporate Bond Index |
|---|
| 12/23 | $10,000 | $10,000 |
|---|
| 11/24 | $10,845 | $10,711 |
|---|
Average Annual Total Returns
| AATR | Since Inception 12/13/23 |
|---|
| AB Corporate Bond ETF | 8.24% |
|---|
| Bloomberg U.S. Corporate Bond Index | 7.11% |
|---|
The Fund’s past performance is not a good predictor of the Fund’s future performance.
The graph and table do not reflect the deduction of taxes that a shareholder would pay on Fund distributions or the redemption or sale of Fund shares.
Visit https://www.abfunds.com/link/AB/EYEG-A for the most recent performance information.
| Net Assets | $25,358,442 |
|---|
| # of Portfolio Holdings | 364 |
|---|
| Portfolio Turnover Rate | 175% |
|---|
| Total Advisory Fees Paid | $71,874 |
|---|
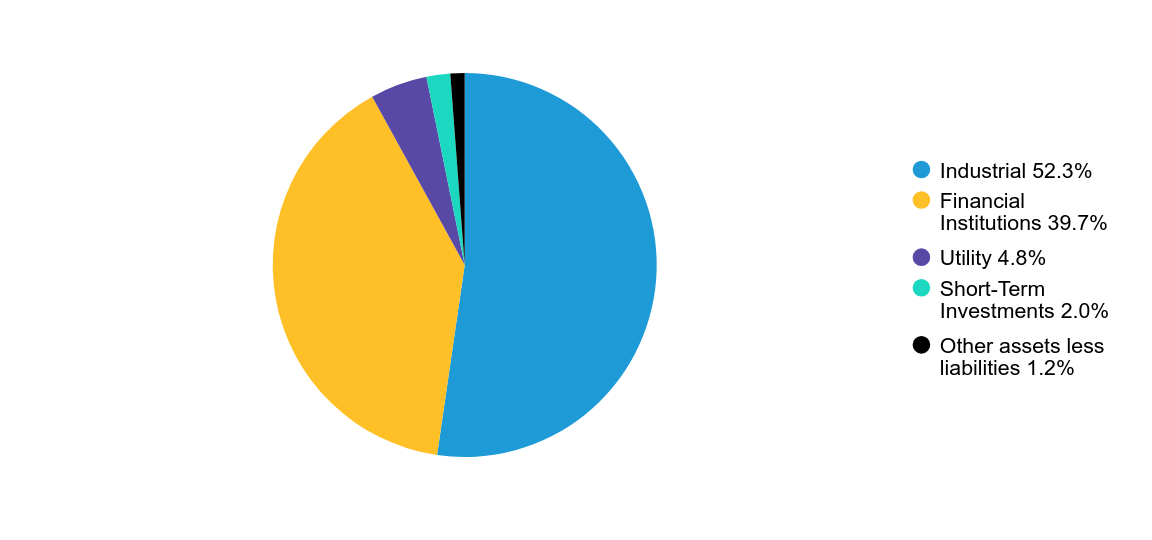
Graphical Representation of Holdings
| Value | Value |
|---|
| Industrial | 52.3% |
| Financial Institutions | 39.7% |
| Utility | 4.8% |
| Short-Term Investments | 2.0% |
| Other assets less liabilities | 1.2% |
Availability of Additional Information
You can find additional information on the Fund’s website at https://www.abfunds.com/link/AB/EYEG-A, including the Fund's:
• Prospectus
• Financial information
• Fund holdings
• Proxy voting information
You can also request this information by contacting us at (800) 227 4618.
Shareholders who have consented to receive a single annual or semi-annual shareholder report at a shared address may revoke this consent by contacting us at (800) 227 4618.
Information Regarding the Review and Approval of the Fund’s Advisory Agreement
Information regarding the Fund’s Board of Directors’/Trustees’ review of the advisory agreement is available on the Fund’s website https://www.abfunds.com/link/AB/EYEG-A. You can request this information, free of charge, by contacting us at (800) 227 4618 or by scanning the QR code below.
AB ETFs are distributed by Foreside Fund Services, LLC; Foreside is not related to AllianceBernstein or its affiliates.
The [A/B] logo and AllianceBernstein® are registered trademarks used by permission of the owner, AllianceBernstein L.P.
Please scan QR code for
Fund Information
Please scan QR code for
Fund Information
Principal Listing Exchange: NYSE Arca
Annual Shareholder Report
This annual shareholder report contains important information about the AB Disruptors ETF (the “Fund”) for the period of December 1, 2023 to November 30, 2024. You can find additional information about the Fund at https://www.abfunds.com/link/AB/FWD-A. You can also request this information by contacting us at (800) 227 4618.
What were the Fund costs for the last year?
(Based on a hypothetical $10,000 investment)
| Fund Name | Cost of a $10,000 investment | Costs paid as a percentage of a $10,000 investment |
|---|
| AB Disruptors ETF | $79 | 0.65% |
|---|
How did the Fund perform last year? What affected the Fund’s performance?
During the 12-month period ended November 30, 2024, the Fund outperformed the Morgan Stanley Capital International (“MSCI”) All Country World Index (“ACWI”) Growth (the “benchmark“), before sales charges. Overall security selection drove the outperformance led by selection within technology and industrials; selection within health care and real estate were the only negative sectors. Sector allocation also contributed: an underweight to consumer staples and an overweight to technology offset losses from underweight to communication services and an overweight to health care.
Top contributors to performance:
Top detractors from performance:
During the 12-month period, selection within, and allocation to, some sectors detracted from performance.
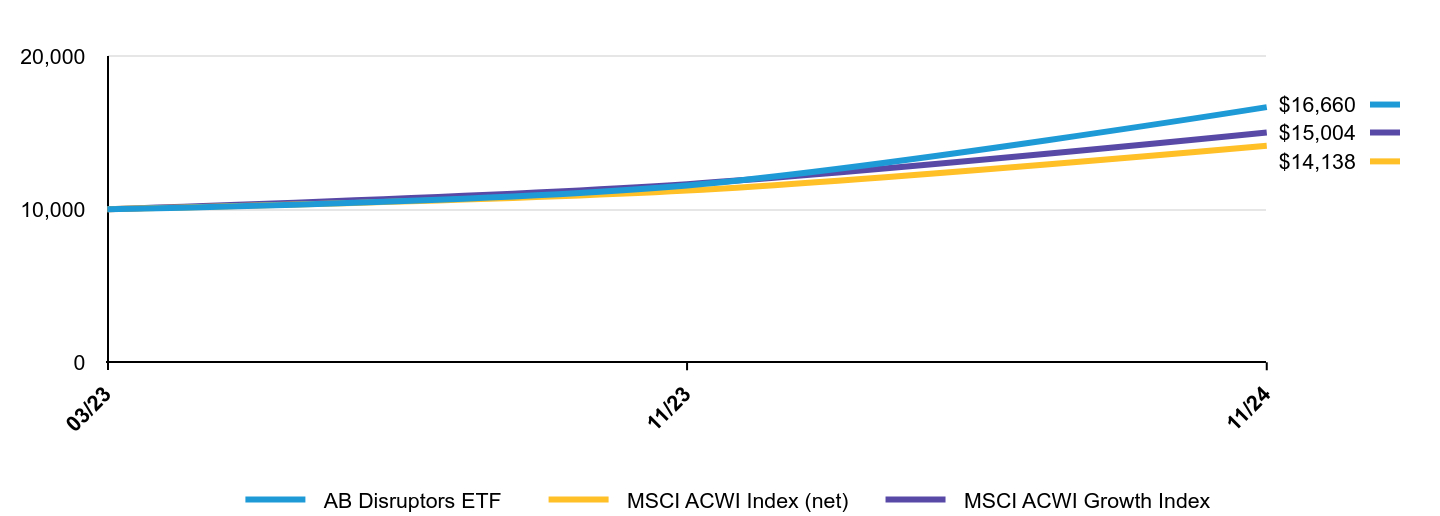
The following graph shows the performance of hypothetical $10,000 investments in the Fund, a broad-based securities market index and an additional index that corresponds to the Fund's investment strategies, over the most recently completed 10 fiscal years of the Fund, or since inception, if shorter. The Fund's performance reflects applicable sales charges and assumes the reinvestment of dividends.
| AB Disruptors ETF | MSCI ACWI Index (net) | MSCI ACWI Growth Index |
|---|
| 03/23 | $10,000 | $10,000 | $10,000 |
|---|
| 11/23 | $11,546 | $11,210 | $11,633 |
|---|
| 11/24 | $16,660 | $14,138 | $15,004 |
|---|
Average Annual Total Returns
| AATR | 1 Year | Since Inception 03/22/23 |
|---|
| AB Disruptors ETF | 43.99% | 34.95% |
|---|
| MSCI ACWI Index (net) | 26.12% | 22.61% |
|---|
| MSCI ACWI Growth Index | 28.98% | 26.98% |
|---|
The addition of the MSCI ACWI Index (net) broad-based benchmark provides a comparison of the Fund's performance against the broader market as regulatorily required.
The Fund’s past performance is not a good predictor of the Fund’s future performance.
The graph and table do not reflect the deduction of taxes that a shareholder would pay on Fund distributions or the redemption or sale of Fund shares.
Visit https://www.abfunds.com/link/AB/FWD-A for the most recent performance information.
| Net Assets | $488,789,797 |
|---|
| # of Portfolio Holdings | 104 |
|---|
| Portfolio Turnover Rate | 163% |
|---|
| Total Advisory Fees Paid | $2,112,143 |
|---|
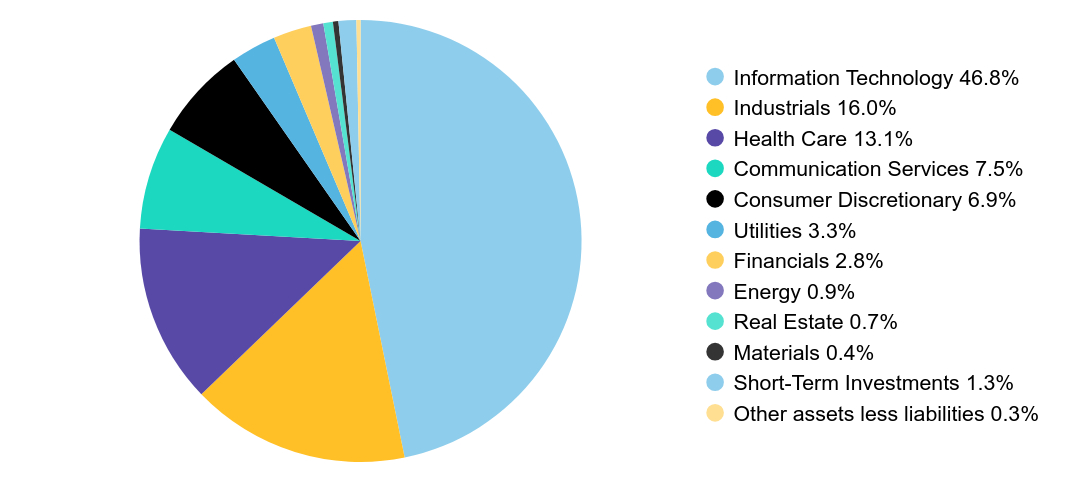
Graphical Representation of Holdings
| Company | U.S. $ Value | % of Net Assets |
|---|
| NVIDIA Corp. | $20,134,592 | 4.1% |
| Tesla, Inc. | $14,858,103 | 3.0% |
| Vistra Corp. | $12,113,315 | 2.5% |
| GE Vernova, Inc. | $9,217,369 | 1.9% |
| Oracle Corp. | $8,542,565 | 1.7% |
| Amazon.com, Inc. | $8,424,534 | 1.7% |
| Arista Networks, Inc. | $7,943,115 | 1.6% |
| Intuitive Surgical, Inc. | $7,816,724 | 1.6% |
| Netflix, Inc. | $7,642,529 | 1.6% |
| Shopify, Inc. - Class A | $7,174,945 | 1.5% |
| Total | $103,867,791 | 21.2% |
| Value | Value |
|---|
| Information Technology | 46.8% |
| Industrials | 16.0% |
| Health Care | 13.1% |
| Communication Services | 7.5% |
| Consumer Discretionary | 6.9% |
| Utilities | 3.3% |
| Financials | 2.8% |
| Energy | 0.9% |
| Real Estate | 0.7% |
| Materials | 0.4% |
| Short-Term Investments | 1.3% |
| Other assets less liabilities | 0.3% |
Availability of Additional Information
You can find additional information on the Fund’s website at https://www.abfunds.com/link/AB/FWD-A, including the Fund's:
• Prospectus
• Financial information
• Fund holdings
• Proxy voting information
You can also request this information by contacting us at (800) 227 4618.
Shareholders who have consented to receive a single annual or semi-annual shareholder report at a shared address may revoke this consent by contacting us at (800) 227 4618.
Information Regarding the Review and Approval of the Fund’s Advisory Agreement
Information regarding the Fund’s Board of Directors’/Trustees’ review of the advisory agreement is available on the Fund’s website https://www.abfunds.com/link/AB/FWD-A. You can request this information, free of charge, by contacting us at (800) 227 4618 or by scanning the QR code below.
AB ETFs are distributed by Foreside Fund Services, LLC; Foreside is not related to AllianceBernstein or its affiliates.
The [A/B] logo and AllianceBernstein® are registered trademarks used by permission of the owner, AllianceBernstein L.P.
Please scan QR code for
Fund Information
Principal Listing Exchange: NYSE Arca
Please scan QR code for
Fund Information
Annual Shareholder Report
This annual shareholder report contains important information about the AB High Yield ETF (the “Fund”) for the period of December 1, 2023 to November 30, 2024. You can find additional information about the Fund at https://www.abfunds.com/link/AB/HYFI-A. You can also request this information by contacting us at (800) 227 4618.
What were the Fund costs for the last year?
(Based on a hypothetical $10,000 investment)
| Fund Name | Cost of a $10,000 investment | Costs paid as a percentage of a $10,000 investment |
|---|
| AB High Yield ETF | $42 | 0.40% |
|---|
How did the Fund perform last year? What affected the Fund’s performance?
During the 12-month period, the Fund underperformed the Bloomberg US Corporate HY 2% Issuer Capped Index (the “benchmark”), before sales charges. Security selection was the largest detractor, relative to the benchmark, from selections in telecommunications, services and banking, which were partially offset by gains from selections in energy. Industry allocation contributed, mainly from an overweight to banking. Yield-curve positioning also contributed, mostly from overweights to the five- and 10-year parts of the curve which partially offset losses from underweights in the six month- and two-year parts of the curve. Currency decisions did not have an impact performance during the period.
During the 12-month period, the Fund utilized derivatives in the form of treasury futures to manage duration and yield-curve positioning. Currency forwards were utilized to hedge currency risk. Credit default swaps were used to maintain overall account risk relative to the benchmark and to actively take a single issuer exposure.
Top contributors to performance:
Top detractors from performance:
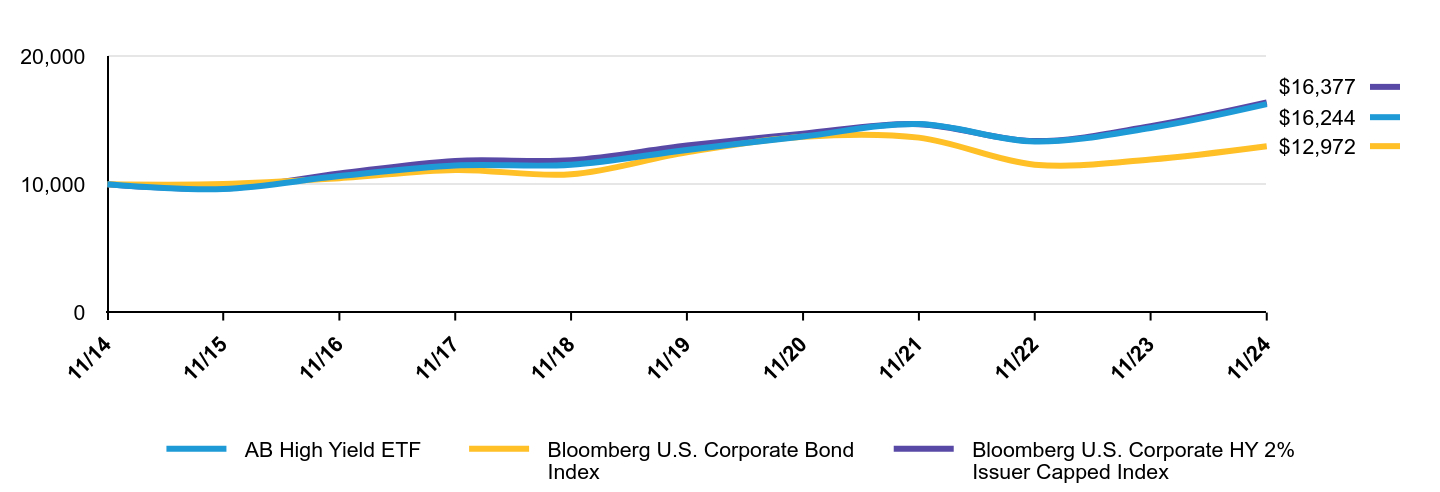
The following graph shows the performance of hypothetical $10,000 investments in the Fund, a broad-based securities market index and an additional index that corresponds to the Fund's investment strategies, over the most recently completed 10 fiscal years of the Fund, or since inception, if shorter. The Fund's performance reflects applicable sales charges and assumes the reinvestment of dividends.
| AB High Yield ETF | Bloomberg U.S. Corporate Bond Index | Bloomberg U.S. Corporate HY 2% Issuer Capped Index |
|---|
| 11/14 | $10,000 | $10,000 | $10,000 |
|---|
| 11/15 | $9,632 | $10,016 | $9,662 |
|---|
| 11/16 | $10,639 | $10,475 | $10,832 |
|---|
| 11/17 | $11,463 | $11,120 | $11,824 |
|---|
| 11/18 | $11,521 | $10,782 | $11,867 |
|---|
| 11/19 | $12,676 | $12,491 | $13,015 |
|---|
| 11/20 | $13,725 | $13,710 | $13,948 |
|---|
| 11/21 | $14,697 | $13,637 | $14,683 |
|---|
| 11/22 | $13,335 | $11,529 | $13,368 |
|---|
| 11/23 | $14,391 | $11,939 | $14,530 |
|---|
| 11/24 | $16,244 | $12,972 | $16,377 |
|---|
Average Annual Total Returns
| AATR | 1 Year | 5 Years | 10 Years |
|---|
| AB High Yield ETF | 12.21% | 4.96% | 4.91% |
|---|
| Bloomberg U.S. Corporate Bond Index | 8.66% | 0.76% | 2.64% |
|---|
| Bloomberg U.S. Corporate HY 2% Issuer Capped Index | 12.71% | 4.70% | 5.06% |
|---|
The addition of the Bloomberg U.S. Corporate Bond Index broad-based benchmark provides a comparison of the Fund's performance against the broader market as regulatorily required.
The Fund’s past performance is not a good predictor of the Fund’s future performance.
The graph and table do not reflect the deduction of taxes that a shareholder would pay on Fund distributions or the redemption or sale of Fund shares.
Visit https://www.abfunds.com/link/AB/HYFI-A for the most recent performance information.
| Net Assets | $175,106,687 |
|---|
| # of Portfolio Holdings | 772 |
|---|
| Portfolio Turnover Rate | 75% |
|---|
| Total Advisory Fees Paid | $510,547 |
|---|
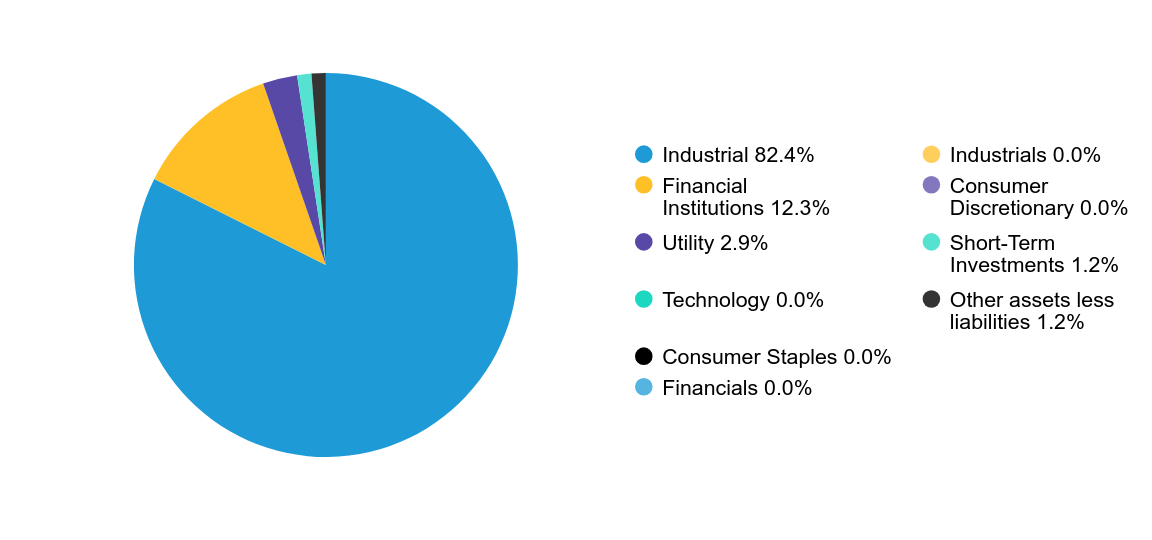
Graphical Representation of Holdings
| Value | Value |
|---|
| Industrial | 82.4% |
| Financial Institutions | 12.3% |
| Utility | 2.9% |
| Technology | 0.0% |
| Consumer Staples | 0.0% |
| Financials | 0.0% |
| Industrials | 0.0% |
| Consumer Discretionary | 0.0% |
| Short-Term Investments | 1.2% |
| Other assets less liabilities | 1.2% |
Availability of Additional Information
You can find additional information on the Fund’s website at https://www.abfunds.com/link/AB/HYFI-A, including the Fund's:
• Prospectus
• Financial information
• Fund holdings
• Proxy voting information
You can also request this information by contacting us at (800) 227 4618.
Shareholders who have consented to receive a single annual or semi-annual shareholder report at a shared address may revoke this consent by contacting us at (800) 227 4618.
Information Regarding the Review and Approval of the Fund’s Advisory Agreement
Information regarding the Fund’s Board of Directors’/Trustees’ review of the advisory agreement is available on the Fund’s website https://www.abfunds.com/link/AB/HYFI-A. You can request this information, free of charge, by contacting us at (800) 227 4618 or by scanning the QR code below.
AB ETFs are distributed by Foreside Fund Services, LLC; Foreside is not related to AllianceBernstein or its affiliates.
The [A/B] logo and AllianceBernstein® are registered trademarks used by permission of the owner, AllianceBernstein L.P.
Please scan QR code for
Fund Information
AB Tax-Aware Intermediate Municipal ETF
Principal Listing Exchange: NYSE Arca
Please scan QR code for
Fund Information
Annual Shareholder Report
This annual shareholder report contains important information about the AB Tax-Aware Intermediate Municipal ETF (the “Fund”) for the period of December 13, 2023 to November 30, 2024. You can find additional information about the Fund at https://www.abfunds.com/link/AB/TAFM-A. You can also request this information by contacting us at (800) 227 4618.
What were the Fund costs for the last year?
(Based on a hypothetical $10,000 investment)
| Fund Name | Cost of a $10,000 investment | Costs paid as a percentage of a $10,000 investment |
|---|
| AB Tax-Aware Intermediate Municipal ETF | $28 | 0.28% |
|---|
How did the Fund perform last year? What affected the Fund’s performance?
Since inception, the Fund outperformed the Bloomberg Municipal Bond Index (the “benchmark”). Industry allocation and security selection contributed to performance, relative to the benchmark. Overweights to prepay energy and not-for-profit health care contributed, while underweights to single-family housing and toll roads/transit detracted. Security selection within not-for-profit health care and electric utility contributed, while an underweight to state general obligation and an overweight to local general obligation detracted. Yield-curve positioning detracted from performance.
The Fund used derivatives in the form of interest rate swaps for hedging purposes, which contributed to performance.
Top contributors to performance:
Top detractors from performance:
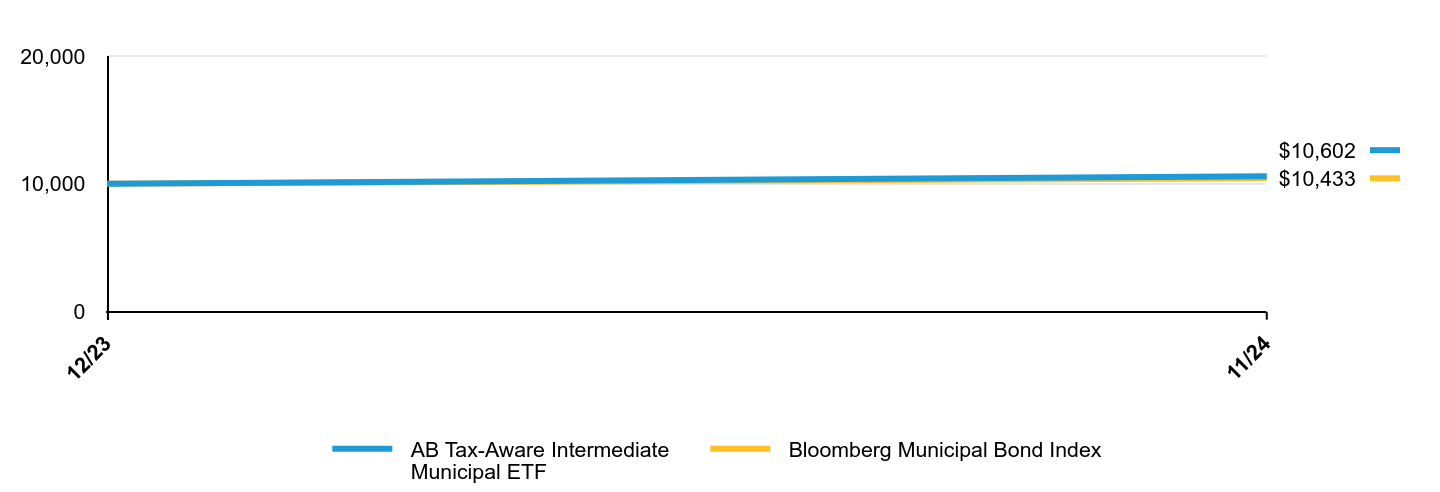
The following graph shows the performance of hypothetical $10,000 investments in the Fund and a broad-based securities market index over the most recently completed 10 fiscal years of the Fund, or since inception, if shorter. The Fund's performance reflects applicable sales charges and assumes the reinvestment of dividends.
| AB Tax-Aware Intermediate Municipal ETF | Bloomberg Municipal Bond Index |
|---|
| 12/23 | $10,000 | $10,000 |
|---|
| 11/24 | $10,602 | $10,433 |
|---|
Average Annual Total Returns
| AATR | Since Inception 12/13/23 |
|---|
| AB Tax-Aware Intermediate Municipal ETF | 5.81% |
|---|
| Bloomberg Municipal Bond Index | 4.33% |
|---|
The Fund’s past performance is not a good predictor of the Fund’s future performance.
The graph and table do not reflect the deduction of taxes that a shareholder would pay on Fund distributions or the redemption or sale of Fund shares.
Visit https://www.abfunds.com/link/AB/TAFM-A for the most recent performance information.
| Net Assets | $92,476,022 |
|---|
| # of Portfolio Holdings | 196 |
|---|
| Portfolio Turnover Rate | 9% |
|---|
| Total Advisory Fees Paid | $99,610 |
|---|
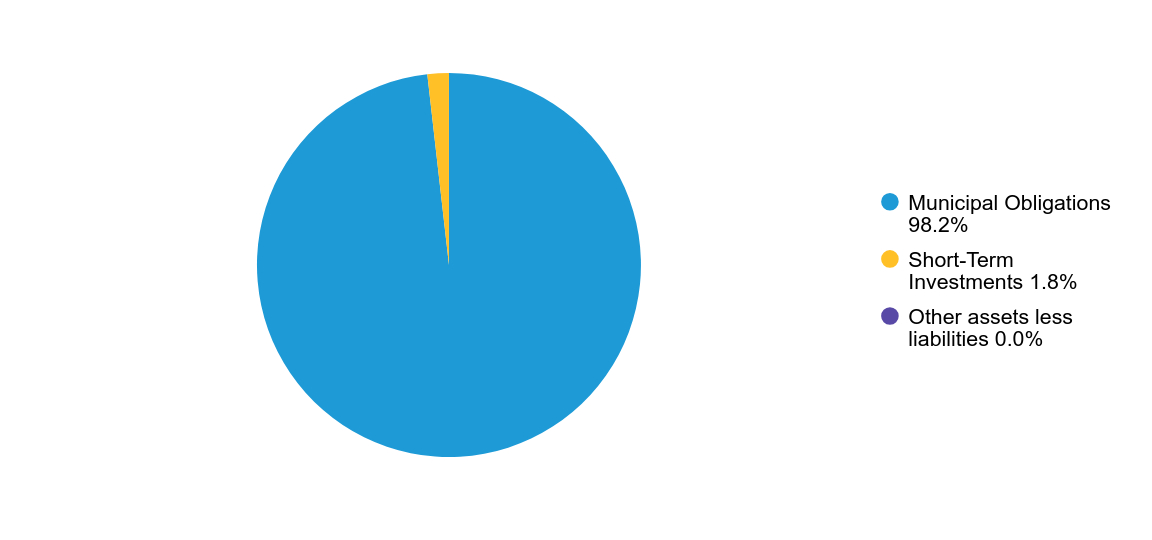
Graphical Representation of Holdings
| Value | Value |
|---|
| Municipal Obligations | 98.2% |
| Short-Term Investments | 1.8% |
| Other assets less liabilities | 0.0% |
Availability of Additional Information
You can find additional information on the Fund’s website at https://www.abfunds.com/link/AB/TAFM-A, including the Fund's:
• Prospectus
• Financial information
• Fund holdings
• Proxy voting information
You can also request this information by contacting us at (800) 227 4618.
Shareholders who have consented to receive a single annual or semi-annual shareholder report at a shared address may revoke this consent by contacting us at (800) 227 4618.
Information Regarding the Review and Approval of the Fund’s Advisory Agreement
Information regarding the Fund’s Board of Directors’/Trustees’ review of the advisory agreement is available on the Fund’s website https://www.abfunds.com/link/AB/TAFM-A. You can request this information, free of charge, by contacting us at (800) 227 4618 or by scanning the QR code below.
AB ETFs are distributed by Foreside Fund Services, LLC; Foreside is not related to AllianceBernstein or its affiliates.
The [A/B] logo and AllianceBernstein® are registered trademarks used by permission of the owner, AllianceBernstein L.P.
Please scan QR code for
Fund Information
AB Tax-Aware Long Municipal ETF
Principal Listing Exchange: NYSE
Please scan QR code for
Fund Information
Annual Shareholder Report
This annual shareholder report contains important information about the AB Tax-Aware Long Municipal ETF (the “Fund”) for the period of December 13, 2023 to November 30, 2024. You can find additional information about the Fund at https://www.abfunds.com/link/AB/TAFL-A. You can also request this information by contacting us at (800) 227 4618.
What were the Fund costs for the last year?
(Based on a hypothetical $10,000 investment)
| Fund Name | Cost of a $10,000 investment | Costs paid as a percentage of a $10,000 investment |
|---|
| AB Tax-Aware Long Municipal ETF | $28 | 0.28% |
|---|
How did the Fund perform last year? What affected the Fund’s performance?
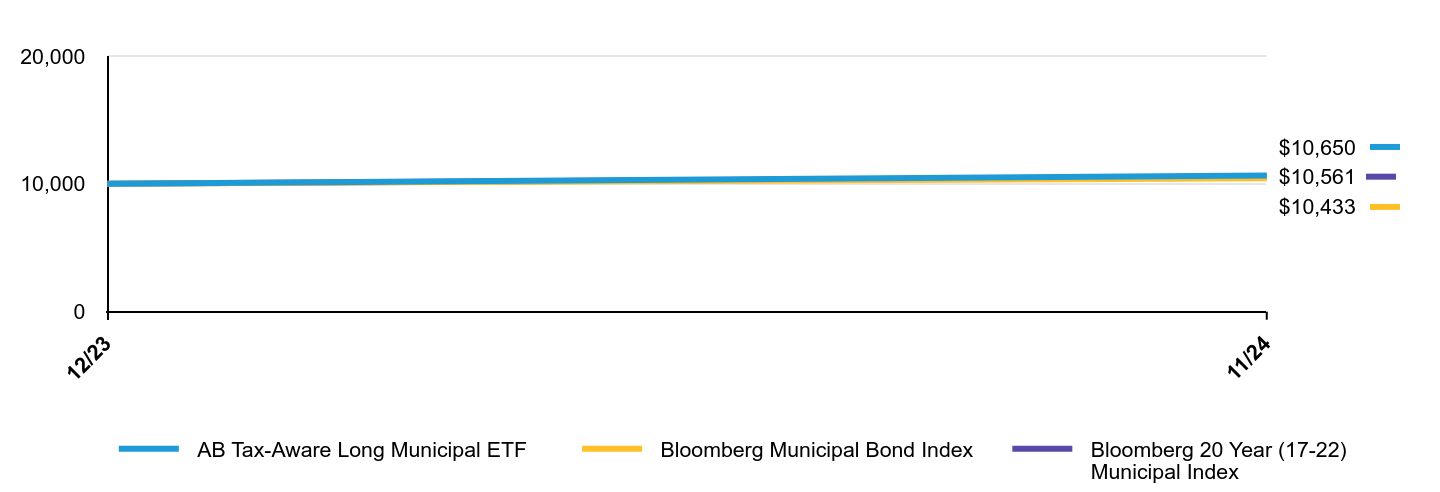
Since inception the Fund outperformed the Bloomberg Municipal Bond Index (the “benchmark”). Industry allocation and security selection, particularly allocations to state general obligation, not-for-profit health care and public higher education, contributed to performance, relative to the benchmark. Yield-curve positioning and security selection within single-family housing detracted from overall performance.
The Fund used derivatives in the form of interest rate swaps and credit default swaps for hedging purposes. Interest rate swaps contributed to performance, while credit default swaps detracted.
Top contributors to performance:
Top detractors from performance:
The following graph shows the performance of hypothetical $10,000 investments in the Fund, a broad-based securities market index and an additional index that corresponds to the Fund's investment strategies, over the most recently completed 10 fiscal years of the Fund, or since inception, if shorter. The Fund's performance reflects applicable sales charges and assumes the reinvestment of dividends.
| AB Tax-Aware Long Municipal ETF | Bloomberg Municipal Bond Index | Bloomberg 20 Year (17-22) Municipal Index |
|---|
| 12/23 | $10,000 | $10,000 | $10,000 |
|---|
| 11/24 | $10,650 | $10,433 | $10,561 |
|---|
Average Annual Total Returns
| AATR | Since Inception 12/13/23 |
|---|
| AB Tax-Aware Long Municipal ETF | 6.19% |
|---|
| Bloomberg Municipal Bond Index | 4.33% |
|---|
| Bloomberg 20 Year (17-22) Municipal Index | 5.61% |
|---|
The Fund’s past performance is not a good predictor of the Fund’s future performance.
The graph and table do not reflect the deduction of taxes that a shareholder would pay on Fund distributions or the redemption or sale of Fund shares.
Visit https://www.abfunds.com/link/AB/TAFL-A for the most recent performance information.
| Net Assets | $29,526,762 |
|---|
| # of Portfolio Holdings | 82 |
|---|
| Portfolio Turnover Rate | 12% |
|---|
| Total Advisory Fees Paid | $75,051 |
|---|
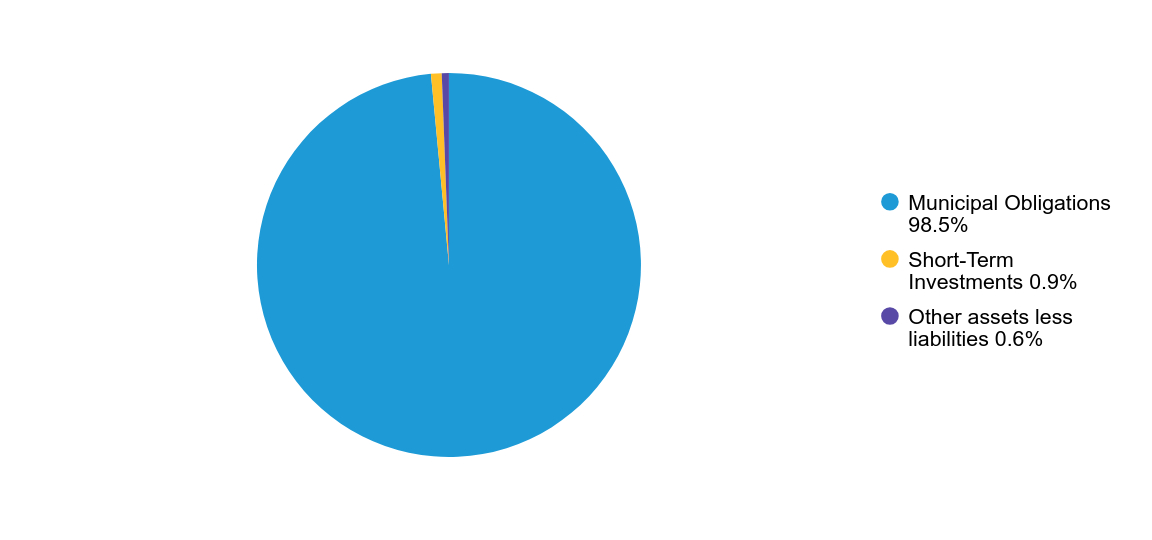
Graphical Representation of Holdings
| Value | Value |
|---|
| Municipal Obligations | 98.5% |
| Short-Term Investments | 0.9% |
| Other assets less liabilities | 0.6% |
Availability of Additional Information
You can find additional information on the Fund’s website at https://www.abfunds.com/link/AB/TAFL-A, including the Fund's:
• Prospectus
• Financial information
• Fund holdings
• Proxy voting information
You can also request this information by contacting us at (800) 227 4618.
Shareholders who have consented to receive a single annual or semi-annual shareholder report at a shared address may revoke this consent by contacting us at (800) 227 4618.
Information Regarding the Review and Approval of the Fund’s Advisory Agreement
Information regarding the Fund’s Board of Directors’/Trustees’ review of the advisory agreement is available on the Fund’s website https://www.abfunds.com/link/AB/TAFL-A. You can request this information, free of charge, by contacting us at (800) 227 4618 or by scanning the QR code below.
AB ETFs are distributed by Foreside Fund Services, LLC; Foreside is not related to AllianceBernstein or its affiliates.
The [A/B] logo and AllianceBernstein® are registered trademarks used by permission of the owner, AllianceBernstein L.P.
Please scan QR code for
Fund Information
Please scan QR code for
Fund Information
AB Tax-Aware Short Duration Municipal ETF
Principal Listing Exchange: NYSE Arca
Annual Shareholder Report
This annual shareholder report contains important information about the AB Tax-Aware Short Duration Municipal ETF (the “Fund”) for the period of December 1, 2023 to November 30, 2024. You can find additional information about the Fund at https://www.abfunds.com/link/AB/TAFI-A. You can also request this information by contacting us at (800) 227 4618.
What were the Fund costs for the last year?
(Based on a hypothetical $10,000 investment)
| Fund Name | Cost of a $10,000 investment | Costs paid as a percentage of a $10,000 investment |
|---|
| AB Tax-Aware Short Duration Municipal ETF | $28 | 0.27% |
|---|
How did the Fund perform last year? What affected the Fund’s performance?
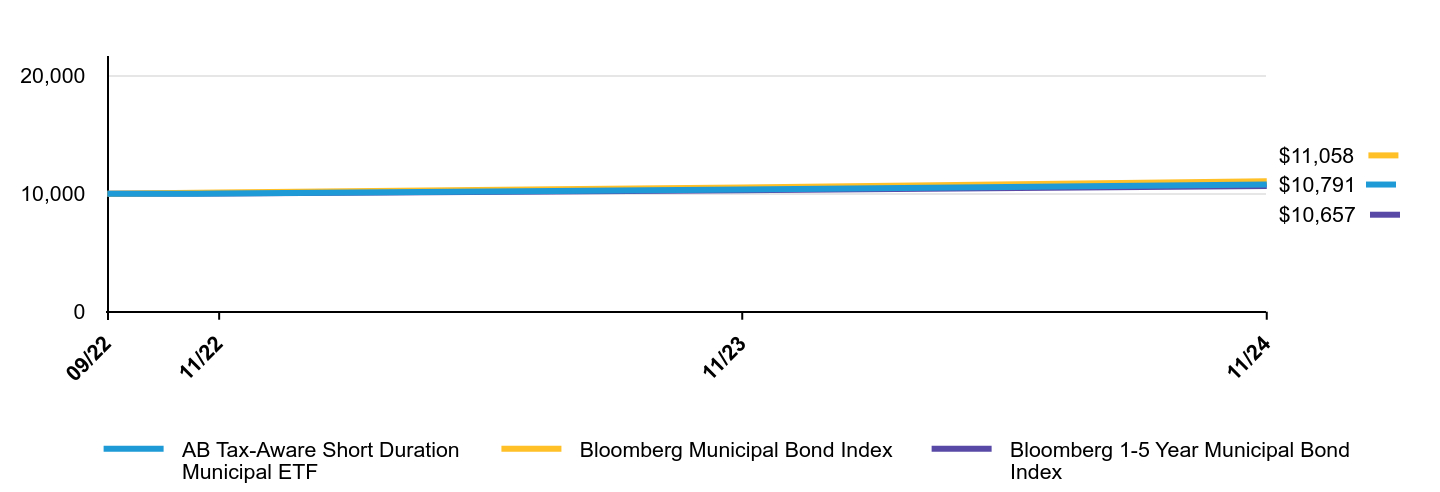
During the 12-month period, the Fund outperformed the Bloomberg 1-5 Year Municipal Bond Index (the “benchmark”). Industry allocation and security selection, particularly allocation to corporate financials, state general obligation and miscellaneous revenue contributed to performance, relative to the benchmark. Yield-curve positioning detracted from performance.
The Fund used derivatives in the form of interest rate swaps for hedging purposes which added to performance.
Top contributors to performance:
Top detractors from performance:
The following graph shows the performance of hypothetical $10,000 investments in the Fund, a broad-based securities market index and an additional index that corresponds to the Fund's investment strategies, over the most recently completed 10 fiscal years of the Fund, or since inception, if shorter. The Fund's performance reflects applicable sales charges and assumes the reinvestment of dividends.
| AB Tax-Aware Short Duration Municipal ETF | Bloomberg Municipal Bond Index | Bloomberg 1-5 Year Municipal Bond Index |
|---|
| 09/22 | $10,000 | $10,000 | $10,000 |
|---|
| 11/22 | $10,022 | $10,106 | $10,031 |
|---|
| 11/23 | $10,364 | $10,539 | $10,308 |
|---|
| 11/24 | $10,791 | $11,058 | $10,657 |
|---|
Average Annual Total Returns
| AATR | 1 Year | Since Inception 09/14/22 |
|---|
| AB Tax-Aware Short Duration Municipal ETF | 4.14% | 3.50% |
|---|
| Bloomberg Municipal Bond Index | 4.93% | 4.64% |
|---|
| Bloomberg 1-5 Year Municipal Bond Index | 3.39% | 2.91% |
|---|
The addition of the Bloomberg Municipal Bond Index broad-based benchmark provides a comparison of the Fund's performance against the broader market as regulatorily required.
The Fund’s past performance is not a good predictor of the Fund’s future performance.
The graph and table do not reflect the deduction of taxes that a shareholder would pay on Fund distributions or the redemption or sale of Fund shares.
Visit https://www.abfunds.com/link/AB/TAFI-A for the most recent performance information.
| Net Assets | $650,593,636 |
|---|
| # of Portfolio Holdings | 418 |
|---|
| Portfolio Turnover Rate | 29% |
|---|
| Total Advisory Fees Paid | $1,331,301 |
|---|
Graphical Representation of Holdings
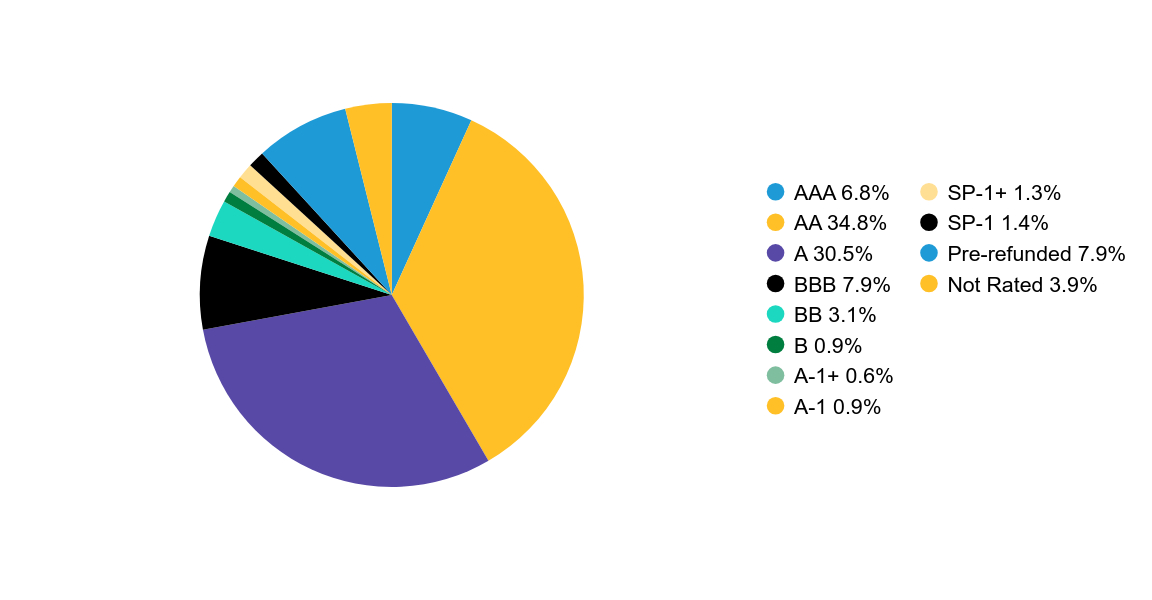
Credit Rating BreakdownFootnote Reference*
| Value | Value |
|---|
| AAA | 6.8% |
| AA | 34.8% |
| A | 30.5% |
| BBB | 7.9% |
| BB | 3.1% |
| B | 0.9% |
| A-1+ | 0.6% |
| A-1 | 0.9% |
| SP-1+ | 1.3% |
| SP-1 | 1.4% |
| Pre-refunded | 7.9% |
| Not Rated | 3.9% |
| Footnote | Description |
Footnote* | The Fund’s quality rating breakdown is expressed as a percentage of the Fund’s total investments in municipal securities and may vary over time. The quality ratings are determined by using the S&P Global Ratings (“S&P”), Moody’s Investors Services, Inc. (“Moody’s”) and Fitch Ratings, Ltd. (“Fitch”). The Fund considers the credit ratings issued by S&P, Moody’s and Fitch and uses the highest rating issued by the agencies. These ratings are a measure of the quality and safety of a bond or portfolio, based on the issuer’s financial condition. AAA is the highest (best) and D is the lowest (worst). If applicable, the pre-refunded category includes bonds which are secured by U.S. Government securities and therefore are deemed high-quality investment grade by AllianceBernstein L.P. (the "Adviser"). If applicable, Not Applicable (N/A) includes non-credit worthy investments, such as equities, currency contracts, futures and options. If applicable, the Not Rated category includes bonds that are not rated by a nationally recognized statistical rating organization. The Adviser evaluates the creditworthiness of non-rated securities based on a number of factors including, but not limited to, cash flows, enterprise value and economic environment. |
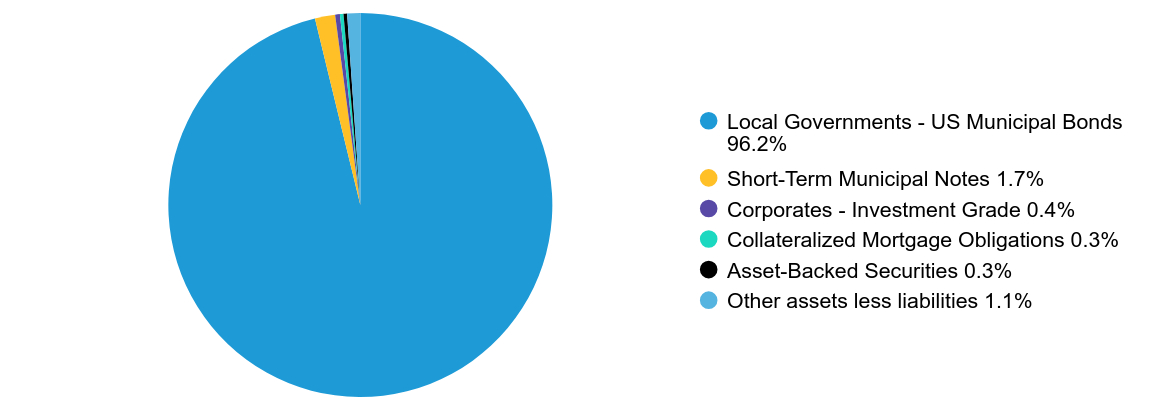
| |
|---|
| Local Governments - US Municipal Bonds | 96.2% |
| Short-Term Municipal Notes | 1.7% |
| Corporates - Investment Grade | 0.4% |
| Collateralized Mortgage Obligations | 0.3% |
| Asset-Backed Securities | 0.3% |
| Other assets less liabilities | 1.1% |
Availability of Additional Information
You can find additional information on the Fund’s website at https://www.abfunds.com/link/AB/TAFI-A, including the Fund's:
• Prospectus
• Financial information
• Fund holdings
• Proxy voting information
You can also request this information by contacting us at (800) 227 4618.
Shareholders who have consented to receive a single annual or semi-annual shareholder report at a shared address may revoke this consent by contacting us at (800) 227 4618.
Information Regarding the Review and Approval of the Fund’s Advisory Agreement
Information regarding the Fund’s Board of Directors’/Trustees’ review of the advisory agreement is available on the Fund’s website https://www.abfunds.com/link/AB/TAFI-A. You can request this information, free of charge, by contacting us at (800) 227 4618 or by scanning the QR code below.
AB ETFs are distributed by Foreside Fund Services, LLC; Foreside is not related to AllianceBernstein or its affiliates.
The [A/B] logo and AllianceBernstein® are registered trademarks used by permission of the owner, AllianceBernstein L.P.
Please scan QR code for
Fund Information
AB Ultra Short Income ETF
Principal Listing Exchange: NYSE Arca
Please scan QR code for
Fund Information
Annual Shareholder Report
This annual shareholder report contains important information about the AB Ultra Short Income ETF (the “Fund”) for the period of December 1, 2023 to November 30, 2024. You can find additional information about the Fund at https://www.abfunds.com/link/AB/YEAR-A. You can also request this information by contacting us at (800) 227 4618.
What were the Fund costs for the last year?
(Based on a hypothetical $10,000 investment)
| Fund Name | Cost of a $10,000 investment | Costs paid as a percentage of a $10,000 investment |
|---|
| AB Ultra Short Income ETF | $25 | 0.24% |
|---|
How did the Fund perform last year? What affected the Fund’s performance?
During the 12-month period, the Fund outperformed the FTSE 3-Month US T-Bill Index (the “benchmark”), before sales charges. Sector allocation contributed to relative performance, from overweights to investment-grade corporate bonds and asset-backed securities. Yield-curve positioning was a minor detractor to overall performance.
During the 12-month period, the Fund used derivatives in the form of futures for hedging and investment purposes, which had no material impact
Top contributors to performance:
Top detractors from performance:
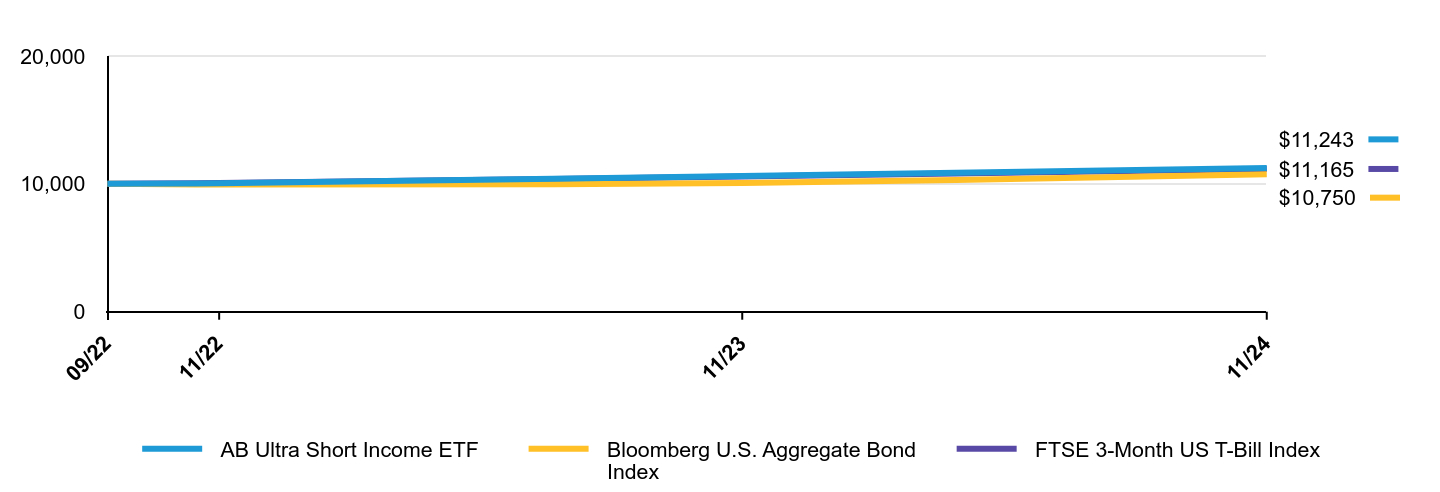
The following graph shows the performance of hypothetical $10,000 investments in the Fund, a broad-based securities market index and an additional index that corresponds to the Fund's investment strategies, over the most recently completed 10 fiscal years of the Fund, or since inception, if shorter. The Fund's performance reflects applicable sales charges and assumes the reinvestment of dividends.
| AB Ultra Short Income ETF | Bloomberg U.S. Aggregate Bond Index | FTSE 3-Month US T-Bill Index |
|---|
| 09/22 | $10,000 | $10,000 | $10,000 |
|---|
| 11/22 | $10,046 | $9,942 | $10,065 |
|---|
| 11/23 | $10,616 | $10,059 | $10,580 |
|---|
| 11/24 | $11,243 | $10,750 | $11,165 |
|---|
Average Annual Total Returns
| AATR | 1 Year | Since Inception 09/14/22 |
|---|
| AB Ultra Short Income ETF | 5.87% | 5.43% |
|---|
| Bloomberg U.S. Aggregate Bond Index | 6.88% | 3.32% |
|---|
| FTSE 3-Month US T-Bill Index | 5.53% | 5.10% |
|---|
The addition of the Bloomberg U.S. Aggregate Bond Index broad-based benchmark provides a comparison of the Fund's performance against the broader market as regulatorily required.
The Fund’s past performance is not a good predictor of the Fund’s future performance.
The graph and table do not reflect the deduction of taxes that a shareholder would pay on Fund distributions or the redemption or sale of Fund shares.
Visit https://www.abfunds.com/link/AB/YEAR-A for the most recent performance information.
| Net Assets | $1,143,129,074 |
|---|
| # of Portfolio Holdings | 190 |
|---|
| Portfolio Turnover Rate | 59% |
|---|
| Total Advisory Fees Paid | $2,360,963 |
|---|
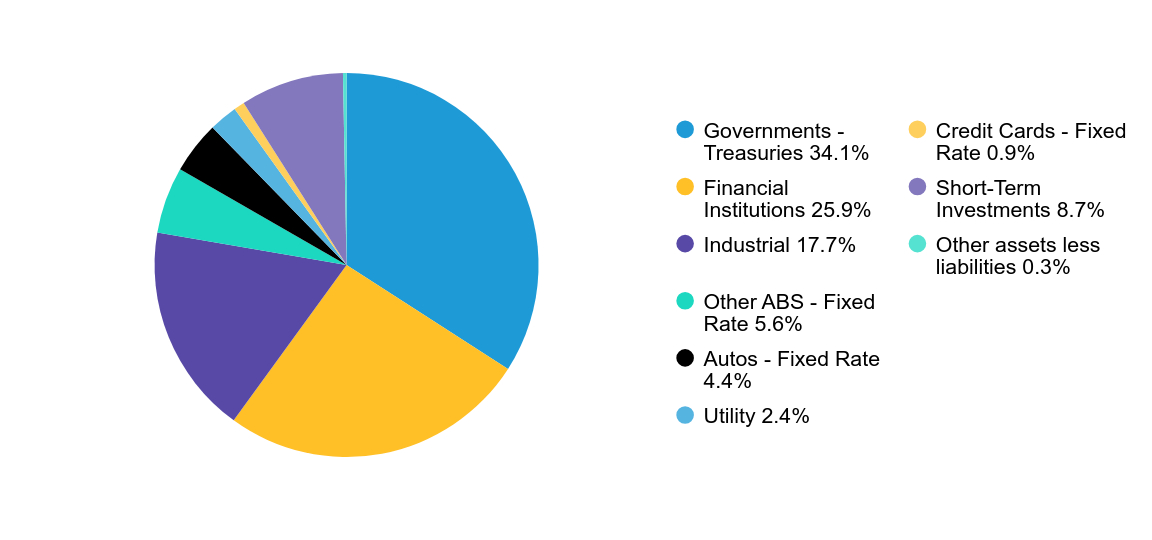
Graphical Representation of Holdings
| Value | Value |
|---|
| Governments - Treasuries | 34.1% |
| Financial Institutions | 25.9% |
| Industrial | 17.7% |
| Other ABS - Fixed Rate | 5.6% |
| Autos - Fixed Rate | 4.4% |
| Utility | 2.4% |
| Credit Cards - Fixed Rate | 0.9% |
| Short-Term Investments | 8.7% |
| Other assets less liabilities | 0.3% |
Availability of Additional Information
You can find additional information on the Fund’s website at https://www.abfunds.com/link/AB/YEAR-A, including the Fund's:
• Prospectus
• Financial information
• Fund holdings
• Proxy voting information
You can also request this information by contacting us at (800) 227 4618.
Shareholders who have consented to receive a single annual or semi-annual shareholder report at a shared address may revoke this consent by contacting us at (800) 227 4618.
Information Regarding the Review and Approval of the Fund’s Advisory Agreement
Information regarding the Fund’s Board of Directors’/Trustees’ review of the advisory agreement is available on the Fund’s website https://www.abfunds.com/link/AB/YEAR-A. You can request this information, free of charge, by contacting us at (800) 227 4618 or by scanning the QR code below.
AB ETFs are distributed by Foreside Fund Services, LLC; Foreside is not related to AllianceBernstein or its affiliates.
The [A/B] logo and AllianceBernstein® are registered trademarks used by permission of the owner, AllianceBernstein L.P.
Please scan QR code for
Fund Information
Please scan QR code for
Fund Information
Principal Listing Exchange: NYSE Arca
Annual Shareholder Report
This annual shareholder report contains important information about the AB US High Dividend ETF (the “Fund”) for the period of December 1, 2023 to November 30, 2024. You can find additional information about the Fund at https://www.abfunds.com/link/AB/HIDV-A. You can also request this information by contacting us at (800) 227 4618.
What were the Fund costs for the last year?
(Based on a hypothetical $10,000 investment)
| Fund Name | Cost of a $10,000 investment | Costs paid as a percentage of a $10,000 investment |
|---|
| AB US High Dividend ETF | $53 | 0.45% |
|---|
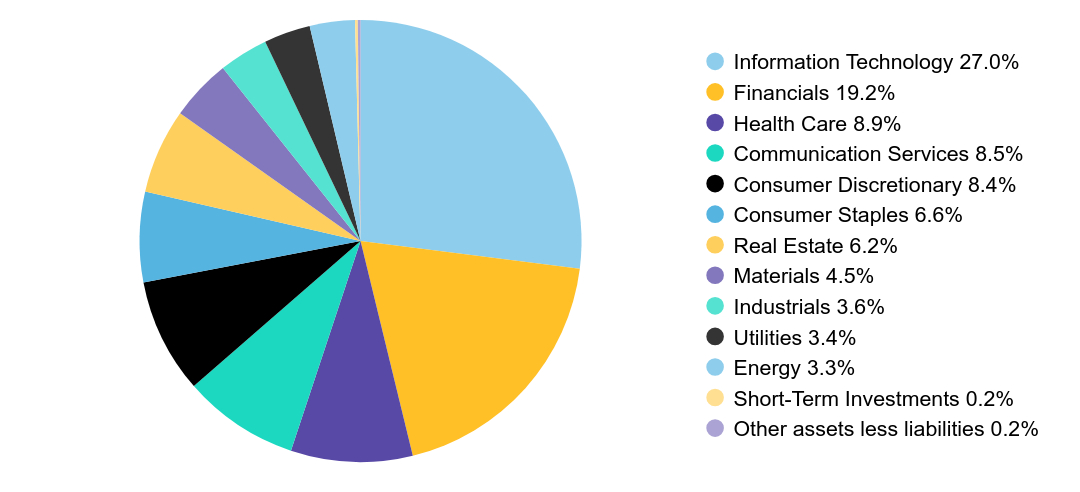
How did the Fund perform last year? What affected the Fund’s performance?
During the 12-month period, the Fund out performed Standarad & Poor's ("S&P") 500 Total Return Index (the "benchmark"). Both security and sector selection contributed, relative to the benchmark. Within security selection, positions within Broadcom and Unum were the largest contributors, while holdings within Civitas Resources and LyondellBasell detracted the most. Overweights to utilities and financials contributed, while an underweight to technology and an overweight to materials detracted from overall performance.
Top contributors to performance:
Top detractors from performance:
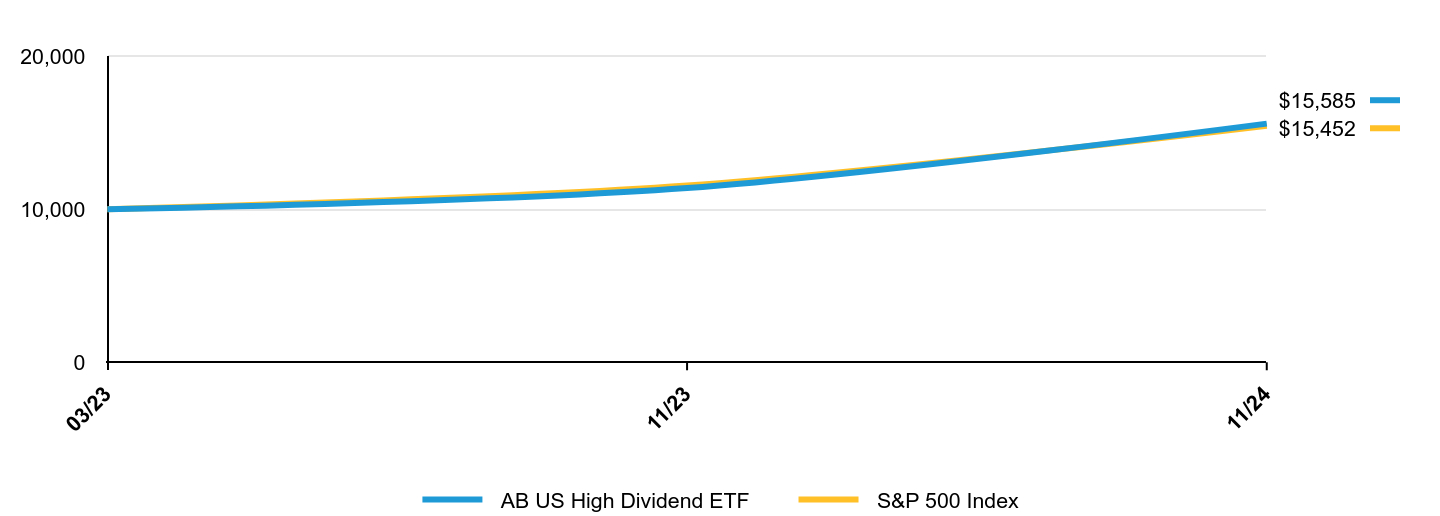
The following graph shows the performance of hypothetical $10,000 investments in the Fund and a broad-based securities market index over the most recently completed 10 fiscal years of the Fund, or since inception, if shorter. The Fund's performance reflects applicable sales charges and assumes the reinvestment of dividends.
| AB US High Dividend ETF | S&P 500 Index |
|---|
| 03/23 | $10,000 | $10,000 |
|---|
| 11/23 | $11,374 | $11,541 |
|---|
| 11/24 | $15,585 | $15,452 |
|---|
Average Annual Total Returns
| AATR | 1 Year | Since Inception 03/22/23 |
|---|
| AB US High Dividend ETF | 36.89% | 29.83% |
|---|
| S&P 500 Index | 33.89% | 29.20% |
|---|
The Fund’s past performance is not a good predictor of the Fund’s future performance.
The graph and table do not reflect the deduction of taxes that a shareholder would pay on Fund distributions or the redemption or sale of Fund shares.
Visit https://www.abfunds.com/link/AB/HIDV-A for the most recent performance information.
| Net Assets | $25,457,354 |
|---|
| # of Portfolio Holdings | 108 |
|---|
| Portfolio Turnover Rate | 175% |
|---|
| Total Advisory Fees Paid | $61,235 |
|---|
Graphical Representation of Holdings
| Company | U.S. $ Value | % of Net Assets |
|---|
| Apple, Inc. | $1,852,361 | 7.3% |
| NVIDIA Corp. | $1,714,715 | 6.7% |
| Microsoft Corp. | $1,405,887 | 5.5% |
| Amazon.com, Inc. | $759,006 | 3.0% |
| Alphabet, Inc. - Class A | $480,494 | 1.9% |
| Meta Platforms, Inc. - Class A | $439,929 | 1.7% |
| Netflix, Inc. | $402,612 | 1.6% |
| Oracle Corp. | $341,954 | 1.3% |
| Merck & Co., Inc. | $335,209 | 1.3% |
| Tesla, Inc. | $326,521 | 1.3% |
| Total | $8,058,688 | 31.6% |
| Value | Value |
|---|
| Information Technology | 27.0% |
| Financials | 19.2% |
| Health Care | 8.9% |
| Communication Services | 8.5% |
| Consumer Discretionary | 8.4% |
| Consumer Staples | 6.6% |
| Real Estate | 6.2% |
| Materials | 4.5% |
| Industrials | 3.6% |
| Utilities | 3.4% |
| Energy | 3.3% |
| Short-Term Investments | 0.2% |
| Other assets less liabilities | 0.2% |
Availability of Additional Information
You can find additional information on the Fund’s website at https://www.abfunds.com/link/AB/HIDV-A, including the Fund's:
• Prospectus
• Financial information
• Fund holdings
• Proxy voting information
You can also request this information by contacting us at (800) 227 4618.
Shareholders who have consented to receive a single annual or semi-annual shareholder report at a shared address may revoke this consent by contacting us at (800) 227 4618.
Information Regarding the Review and Approval of the Fund’s Advisory Agreement
Information regarding the Fund’s Board of Directors’/Trustees’ review of the advisory agreement is available on the Fund’s website https://www.abfunds.com/link/AB/HIDV-A. You can request this information, free of charge, by contacting us at (800) 227 4618 or by scanning the QR code below.
AB ETFs are distributed by Foreside Fund Services, LLC; Foreside is not related to AllianceBernstein or its affiliates.
The [A/B] logo and AllianceBernstein® are registered trademarks used by permission of the owner, AllianceBernstein L.P.
Please scan QR code for
Fund Information
Please scan QR code for
Fund Information
AB US Large Cap Strategic Equities ETF
Principal Listing Exchange: NYSE Arca
Annual Shareholder Report
This annual shareholder report contains important information about the AB US Large Cap Strategic Equities ETF (the “Fund”) for the period of December 1, 2023 to November 30, 2024. You can find additional information about the Fund at https://www.abfunds.com/link/AB/LRGC-A. You can also request this information by contacting us at (800) 227 4618.
What were the Fund costs for the last year?
(Based on a hypothetical $10,000 investment)
| Fund Name | Cost of a $10,000 investment | Costs paid as a percentage of a $10,000 investment |
|---|
| AB US Large Cap Strategic Equities ETF | $56 | 0.48% |
|---|
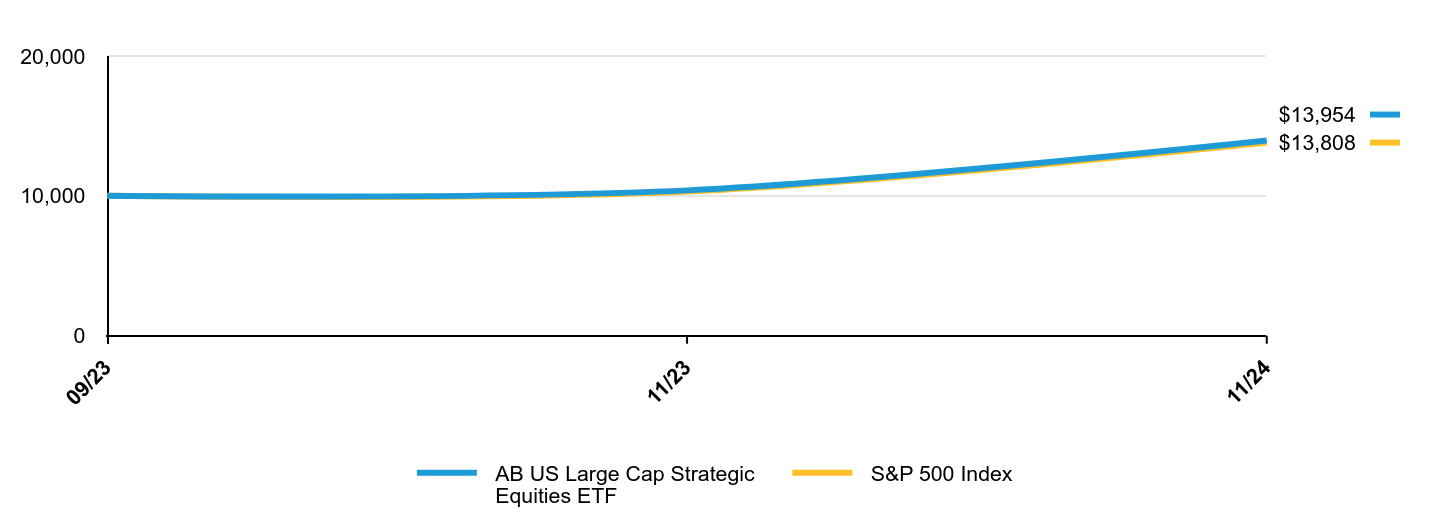
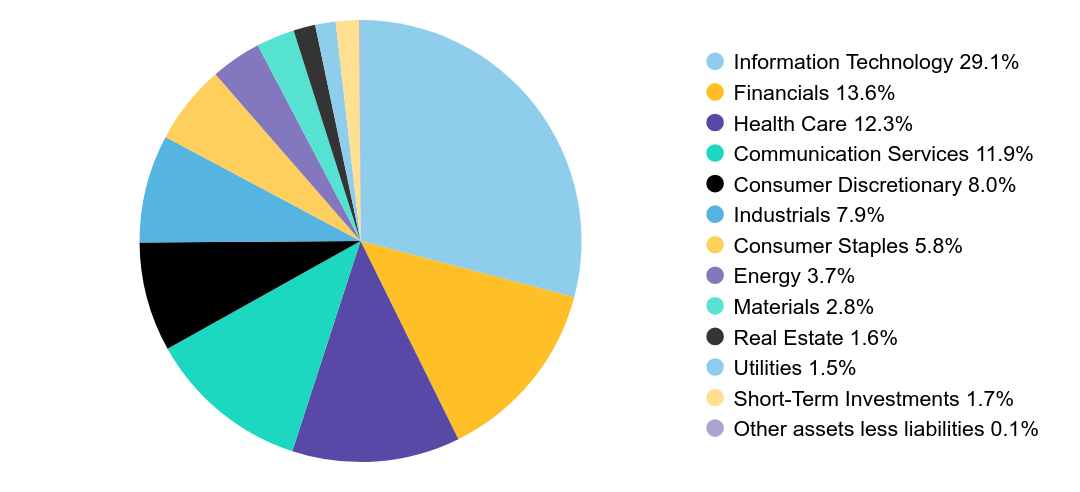
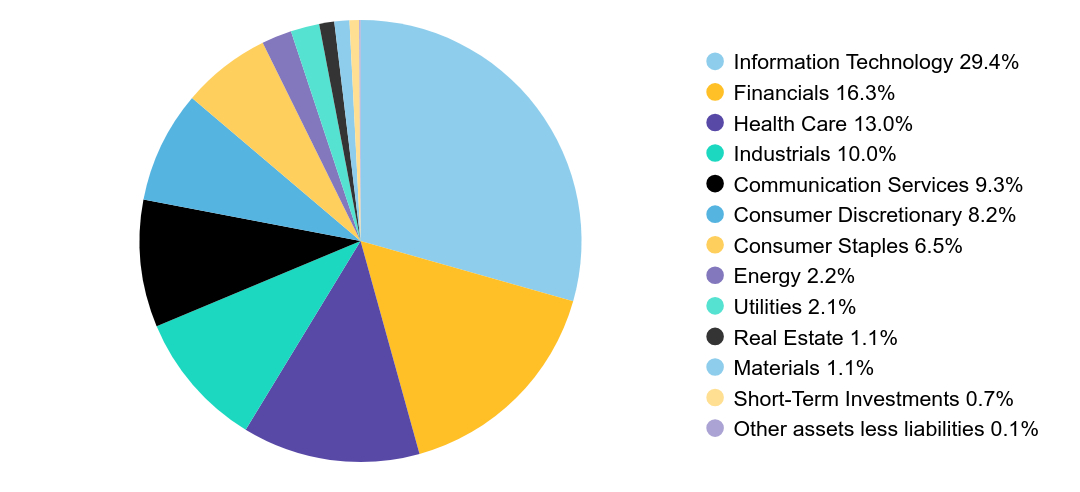
How did the Fund perform last year? What affected the Fund’s performance?
During the 12-month period ended November 30, 2024, the Fund outperformed the Standard & Poor’s (“S&P”) 500 Index (the "benchmark"), before sales charges. Overall security selection was positive, while sector allocation was negative. Security selection within consumer staples and industrials added to gains, while selection within consumer discretionary and health care detracted. In terms of sector allocation, gains from an overweight to communication services and an underweight to energy were offset by an overweight to health care and an underweight to consumer discretionary, which detracted.
Top contributors to performance:
Top detractors from performance:
The following graph shows the performance of hypothetical $10,000 investments in the Fund and a broad-based securities market index over the most recently completed 10 fiscal years of the Fund, or since inception, if shorter. The Fund's performance reflects applicable sales charges and assumes the reinvestment of dividends.
| AB US Large Cap Strategic Equities ETF | S&P 500 Index |
|---|
| 09/23 | $10,000 | $10,000 |
|---|
| 11/23 | $10,392 | $10,313 |
|---|
| 11/24 | $13,954 | $13,808 |
|---|
Average Annual Total Returns
| AATR | 1 Year | Since Inception 09/20/23 |
|---|
| AB US Large Cap Strategic Equities ETF | 34.20% | 32.02% |
|---|
| S&P 500 Index | 33.89% | 30.85% |
|---|
The Fund’s past performance is not a good predictor of the Fund’s future performance.
The graph and table do not reflect the deduction of taxes that a shareholder would pay on Fund distributions or the redemption or sale of Fund shares.
Visit https://www.abfunds.com/link/AB/LRGC-A for the most recent performance information.
| Net Assets | $259,957,424 |
|---|
| # of Portfolio Holdings | 72 |
|---|
| Portfolio Turnover Rate | 19% |
|---|
| Total Advisory Fees Paid | $610,152 |
|---|
Graphical Representation of Holdings
| Company | U.S. $ Value | % of Net Assets |
|---|
| Microsoft Corp. | $19,507,955 | 7.5% |
| NVIDIA Corp. | $18,422,504 | 7.1% |
| Alphabet, Inc. - Class C | $11,884,176 | 4.6% |
| Apple, Inc. | $11,819,034 | 4.5% |
| Amazon.com, Inc. | $10,999,460 | 4.2% |
| Visa, Inc. - Class A | $9,418,371 | 3.6% |
| Meta Platforms, Inc. - Class A | $8,837,062 | 3.4% |
| UnitedHealth Group, Inc. | $7,900,259 | 3.0% |
| Walmart, Inc. | $6,295,088 | 2.4% |
| Oracle Corp. | $5,711,741 | 2.2% |
| Total | $110,795,650 | 42.5% |
| Value | Value |
|---|
| Information Technology | 29.1% |
| Financials | 13.6% |
| Health Care | 12.3% |
| Communication Services | 11.9% |
| Consumer Discretionary | 8.0% |
| Industrials | 7.9% |
| Consumer Staples | 5.8% |
| Energy | 3.7% |
| Materials | 2.8% |
| Real Estate | 1.6% |
| Utilities | 1.5% |
| Short-Term Investments | 1.7% |
| Other assets less liabilities | 0.1% |
Availability of Additional Information
You can find additional information on the Fund’s website at https://www.abfunds.com/link/AB/LRGC-A, including the Fund's:
• Prospectus
• Financial information
• Fund holdings
• Proxy voting information
You can also request this information by contacting us at (800) 227 4618.
Shareholders who have consented to receive a single annual or semi-annual shareholder report at a shared address may revoke this consent by contacting us at (800) 227 4618.
Information Regarding the Review and Approval of the Fund’s Advisory Agreement
Information regarding the Fund’s Board of Directors’/Trustees’ review of the advisory agreement is available on the Fund’s website https://www.abfunds.com/link/AB/LRGC-A. You can request this information, free of charge, by contacting us at (800) 227 4618 or by scanning the QR code below.
AB ETFs are distributed by Foreside Fund Services, LLC; Foreside is not related to AllianceBernstein or its affiliates.
The [A/B] logo and AllianceBernstein® are registered trademarks used by permission of the owner, AllianceBernstein L.P.
Please scan QR code for
Fund Information
Please scan QR code for
Fund Information
AB US Low Volatility Equity ETF
Principal Listing Exchange: NYSE Arca
Annual Shareholder Report
This annual shareholder report contains important information about the AB US Low Volatility Equity ETF (the “Fund”) for the period of December 1, 2023 to November 30, 2024. You can find additional information about the Fund at https://www.abfunds.com/link/AB/LOWV-A. You can also request this information by contacting us at (800) 227 4618.
What were the Fund costs for the last year?
(Based on a hypothetical $10,000 investment)
| Fund Name | Cost of a $10,000 investment | Costs paid as a percentage of a $10,000 investment |
|---|
| AB US Low Volatility Equity ETF | $54 | 0.48% |
|---|
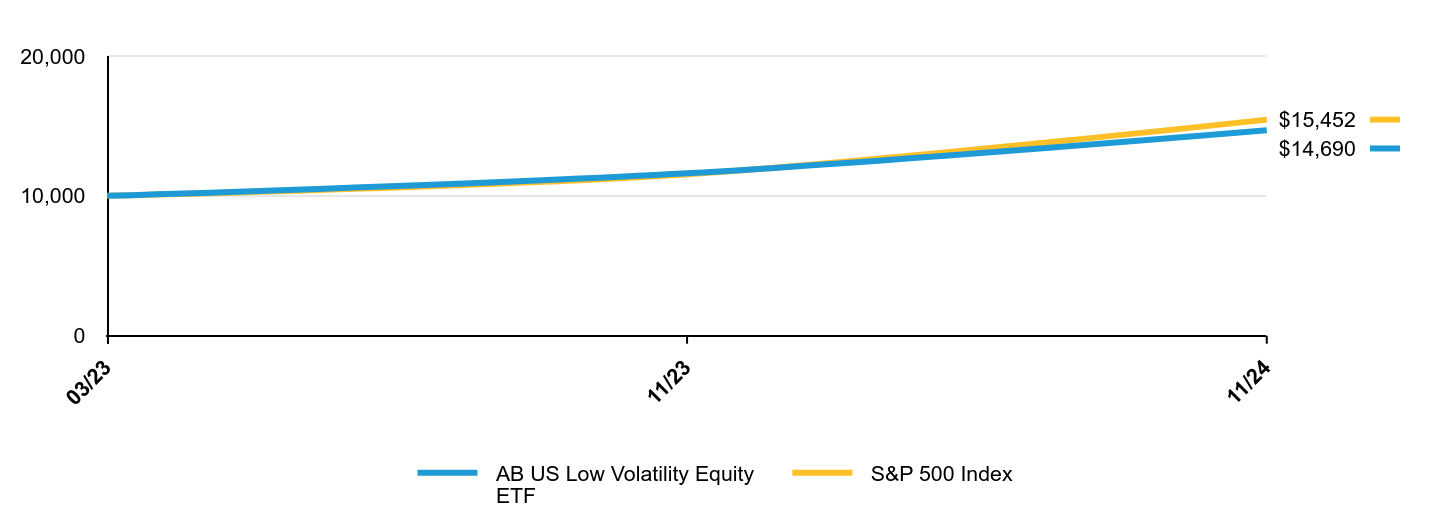
How did the Fund perform last year? What affected the Fund’s performance?
During the 12-month period ended November 30, 2024, the Fund underperformed the Standard & Poor's (“S&P”) 500 Index (the “benchmark”). Overall security selection drove the underperformance. Selection within technology and financials detracted the most, while selection within health care and consumer staples contributed and offset some losses. Sector allocation was also negative. Gains from underweights to materials and energy were offset by losses from overweights to health care and utilities.
Top contributors to performance:
Top detractors from performance:
The following graph shows the performance of hypothetical $10,000 investments in the Fund and a broad-based securities market index over the most recently completed 10 fiscal years of the Fund, or since inception, if shorter. The Fund's performance reflects applicable sales charges and assumes the reinvestment of dividends.
| AB US Low Volatility Equity ETF | S&P 500 Index |
|---|
| 03/23 | $10,000 | $10,000 |
|---|
| 11/23 | $11,609 | $11,541 |
|---|
| 11/24 | $14,690 | $15,452 |
|---|
Average Annual Total Returns
| AATR | 1 Year | Since Inception 03/22/23 |
|---|
| AB US low Volatility Equity ETF | 26.47% | 25.41% |
|---|
| S&P 500 Index | 33.89% | 29.20% |
|---|
The Fund’s past performance is not a good predictor of the Fund’s future performance.
The graph and table do not reflect the deduction of taxes that a shareholder would pay on Fund distributions or the redemption or sale of Fund shares.
Visit https://www.abfunds.com/link/AB/LOWV-A for the most recent performance information.
| Net Assets | $76,717,855 |
|---|
| # of Portfolio Holdings | 79 |
|---|
| Portfolio Turnover Rate | 30% |
|---|
| Total Advisory Fees Paid | $203,598 |
|---|
Graphical Representation of Holdings
| Company | U.S. $ Value | % of Net Assets |
|---|
| Microsoft Corp. | $6,214,276 | 8.1% |
| Alphabet, Inc. - Class C | $3,546,704 | 4.6% |
| Apple, Inc. | $3,081,255 | 4.0% |
| Broadcom, Inc. | $2,406,402 | 3.1% |
| Fiserv, Inc. | $1,920,584 | 2.5% |
| AbbVie, Inc. | $1,686,614 | 2.2% |
| NVIDIA Corp. | $1,652,779 | 2.2% |
| UnitedHealth Group, Inc. | $1,621,301 | 2.1% |
| Oracle Corp. | $1,495,540 | 1.9% |
| Visa, Inc. - Class A | $1,479,931 | 1.9% |
| Total | $25,105,386 | 32.6% |
| Value | Value |
|---|
| Information Technology | 29.4% |
| Financials | 16.3% |
| Health Care | 13.0% |
| Industrials | 10.0% |
| Communication Services | 9.3% |
| Consumer Discretionary | 8.2% |
| Consumer Staples | 6.5% |
| Energy | 2.2% |
| Utilities | 2.1% |
| Real Estate | 1.1% |
| Materials | 1.1% |
| Short-Term Investments | 0.7% |
| Other assets less liabilities | 0.1% |
Availability of Additional Information
You can find additional information on the Fund’s website at https://www.abfunds.com/link/AB/LOWV-A, including the Fund's:
• Prospectus
• Financial information
• Fund holdings
• Proxy voting information
You can also request this information by contacting us at (800) 227 4618.
Shareholders who have consented to receive a single annual or semi-annual shareholder report at a shared address may revoke this consent by contacting us at (800) 227 4618.
Information Regarding the Review and Approval of the Fund’s Advisory Agreement
Information regarding the Fund’s Board of Directors’/Trustees’ review of the advisory agreement is available on the Fund’s website https://www.abfunds.com/link/AB/LOWV-A. You can request this information, free of charge, by contacting us at (800) 227 4618 or by scanning the QR code below.
AB ETFs are distributed by Foreside Fund Services, LLC; Foreside is not related to AllianceBernstein or its affiliates.
The [A/B] logo and AllianceBernstein® are registered trademarks used by permission of the owner, AllianceBernstein L.P.
Please scan QR code for
Fund Information
ITEM 2. CODE OF ETHICS.
(a) The registrant has adopted a code of ethics that applies to its principal executive officer, principal financial officer and principal accounting officer. A copy of the registrant’s code of ethics is filed herewith as Exhibit 19(a)(1).
(b) During the period covered by this report, no material amendments were made to the provisions of the code of ethics adopted in 2(a) above.
(c) During the period covered by this report, no implicit or explicit waivers to the provisions of the code of ethics adopted in 2(a) above were granted.
ITEM 3. AUDIT COMMITTEE FINANCIAL EXPERT.
The registrant’s Board of Directors has determined that independent directors Garry L. Moody, Marshall C. Turner, Jr., Jorge A. Bermudez and Carol C. McMullen qualify as audit committee financial experts.
ITEM 4. PRINCIPAL ACCOUNTANT FEES AND SERVICES.
(a) - (c) The following table sets forth the aggregate fees billed by the independent registered public accounting firm Ernst & Young LLP, for the Fund’s last two fiscal years, for professional services rendered for: (i) the audit of the Fund’s annual financial statements included in the Fund’s annual report to stockholders; (ii) assurance and related services that are reasonably related to the performance of the audit of the Fund’s financial statements and are not reported under (i), which include advice and education related to accounting and auditing issues, quarterly press release review (for those Funds that issue quarterly press releases), and preferred stock maintenance testing (for those Funds that issue preferred stock); and (iii) tax compliance, tax advice and tax return preparation.
| | | | | | | | | | | | | | | | |
| | | | | | Audit Fees | | | Audit-Related
Fees | | | Tax Fees | |
AB Tax Aware Short Duration Municipal ETF | | | 2023 | | | $ | 23,000 | | | $ | — | | | $ | 13,025 | |
| | | 2024 | | | $ | 25,000 | | | $ | — | | | $ | 15,788 | |
AB Ultra Short Income ETF | | | 2023 | | | $ | 23,000 | | | $ | — | | | $ | 14,150 | |
| | | 2024 | | | $ | 25,000 | | | $ | — | | | $ | 17,543 | |
AB Disruptors ETF | | | 2023 | | | $ | 23,000 | | | $ | — | | | $ | 13,286 | |
| | | 2024 | | | $ | 23,000 | | | $ | — | | | $ | 17,361 | |
AB US Low Volatility Equity ETF | | | 2023 | | | $ | 23,000 | | | $ | — | | | $ | 13,000 | |
| | | 2024 | | | $ | 23,000 | | | $ | — | | | $ | 18,647 | |
AB High Yield ETF | | | 2023 | | | $ | 129,450 | | | $ | — | | | $ | 25,836 | |
| | | 2024 | | | $ | 60,000 | | | $ | — | | | $ | 23,710 | |
AB US High Dividend ETF | | | 2023 | | | $ | 23,000 | | | $ | — | | | $ | 13,000 | |
| | | 2024 | | | $ | 23,000 | | | $ | — | | | $ | 21,753 | |
AB US Large Cap Strategic Equities ETF | | | 2023 | | | $ | 23,000 | | | $ | — | | | $ | 11,700 | |
| | | 2024 | | | $ | 23,000 | | | $ | — | | | $ | 30,043 | |
AB Conservative Buffer ETF | | | 2024 | | | $ | 23,000 | | | $ | — | | | $ | 13,646 | |
AB Core Plus Bond ETF | | | 2024 | | | $ | 29,000 | | | $ | — | | | $ | 16,014 | |
AB Corporate Bond ETF | | | 2024 | | | $ | 25,000 | | | $ | — | | | $ | 16,014 | |
AB Tax-Aware Intermediate Municipal ETF | | | 2024 | | | $ | 29,000 | | | $ | — | | | $ | 13,336 | |
AB Tax-Aware Long Municipal ETF | | | 2024 | | | $ | 29,000 | | | $ | — | | | $ | 13,336 | |
AB Short Duration High Yield ETF* | | | 2023 | | | $ | 117,058 | | | $ | — | | | $ | 21,418 | |
| | | 2024 | | | $ | 99,000 | | | $ | — | | | $ | 35,074 | |
AB Short Duration Income ETF* | | | 2023 | | | $ | 43,345 | | | $ | — | | | $ | 17,632 | |
| | | 2024 | | | $ | 95,700 | | | $ | — | | | $ | 39,574 | |
AB International Low Volatility Equity ETF* | | | 2023 | | | $ | 47,201 | | | $ | — | | | $ | 19,527 | |
| | | 2024 | | | $ | 76,201 | | | $ | — | | | $ | 38,367 | |
| * | These fees include fees for services provided to the Acquired Portfolio and the Fund. |
(d) Not applicable.
(e) (1) Beginning with audit and non-audit service contracts entered into on or after May 6, 2003, the Fund’s Audit Committee policies and procedures require the pre-approval of all audit and non-audit services provided to the Fund by the Fund’s independent registered public accounting firm. The Fund’s Audit Committee policies and procedures also require pre-approval of all audit and non-audit services provided to the Adviser and Service Affiliates to the extent that these services are directly related to the operations or financial reporting of the Fund.
(e) (2) No percentage of services addressed by (b) and (c) of this Item 4 were approved pursuant to the waiver provision of paragraph (c)(7)(i)(C) of Rule 2-01 of Regulation S-X. No amounts are reported for Item 4 (d).
(f) Not applicable.
(g) The following table sets forth the aggregate non-audit services provided to the Fund, the Fund’s Adviser and entities that control, are controlled by or under common control with the Adviser that provide ongoing services to the Fund:
| | | | | | | | | | | | |
| | | | | | All Fees for
Non-Audit Services
Provided to the
Portfolio, the Adviser
and Service Affiliates | | | Total Amount of
Foregoing Column Pre-
approved by the Audit
Committee
(Portion Comprised of
Audit Related Fees)
(Portion Comprised of
Tax Fees) | |
AB Tax Aware Short Duration Municipal ETF | | | 2023 | | | $ | 2,124,488 | | | $ | 13,025 | |
| | | | | | | | | | $ | — | |
| | | | | | | | | | $ | (13,025 | ) |
| | | 2024 | | | $ | 1,732,246 | | | $ | 15,788 | |
| | | | | | | | | | $ | — | |
| | | | | | | | | | $ | (15,788 | ) |
AB Ultra Short Income ETF | | | 2023 | | | $ | 2,125,613 | | | $ | 14,150 | |
| | | | | | | | | | $ | — | |
| | | | | | | | | | $ | (14,150 | ) |
| | | 2024 | | | $ | 1,734,001 | | | $ | 17,543 | |
| | | | | | | | | | $ | — | |
| | | | | | | | | | $ | (17,543 | ) |
AB Disruptors ETF | | | 2023 | | | $ | 2,124,749 | | | $ | 13,286 | |
| | | | | | | | | | $ | — | |
| | | | | | | | | | $ | (13,286 | ) |
| | | 2024 | | | $ | 1,733,819 | | | $ | 17,361 | |
| | | | | | | | | | $ | — | |
| | | | | | | | | | $ | (17,361 | ) |
AB US Low Volatility Equity ETF | | | 2023 | | | $ | 2,124,463 | | | $ | 13,000 | |
| | | | | | | | | | $ | — | |
| | | | | | | | | | $ | (13,000 | ) |
| | | 2024 | | | $ | 1,735,105 | | | $ | 18,647 | |
| | | | | | | | | | $ | — | |
| | | | | | | | | | $ | (18,647 | ) |
AB US High Dividend ETF | | | 2023 | | | $ | 2,124,463 | | | $ | 13,000 | |
| | | | | | | | | | $ | — | |
| | | | | | | | | | $ | (13,000 | ) |
| | | 2024 | | | $ | 1,738,211 | | | $ | 21,753 | |
| | | | | | | | | | $ | — | |
| | | | | | | | | | $ | (21,753 | ) |
AB High Yield ETF | | | 2023 | | | $ | 2,133,574 | | | $ | 25,836 | |
| | | | | | | | | | $ | — | |
| | | | | | | | | | $ | (25,836 | ) |
| | | 2024 | | | $ | 1,740,168 | | | $ | 23,710 | |
| | | | | | | | | | $ | — | |
| | | | | | | | | | $ | (23,710 | ) |
AB US Large Cap Strategic Equities ETF | | | 2023 | | | $ | 2,123,163 | | | $ | 11,700 | |
| | | | | | | | | | $ | — | |
| | | | | | | | | | $ | (11,700 | ) |
| | | 2024 | | | $ | 1,746,501 | | | $ | 30,043 | |
| | | | | | | | | | $ | — | |
| | | | | | | | | | $ | (30,043 | ) |
AB Conservative Buffer ETF | | | 2024 | | | $ | 1,730,104 | | | $ | 13,646 | |
| | | | | | | | | | $ | — | |
| | | | | | | | | | $ | (13,646 | ) |
AB Core Plus Bond ETF | | | 2024 | | | $ | 1,732,472 | | | $ | 16,014 | |
| | | | | | | | | | $ | — | |
| | | | | | | | | | $ | (16,014 | ) |
AB Corporate Bond ETF | | | 2024 | | | $ | 1,732,472 | | | $ | 16,014 | |
| | | | | | | | | | $ | — | |
| | | | | | | | | | $ | (16,014 | ) |
AB Tax-Aware Intermediate Municipal ETF | | | 2024 | | | $ | 1,729,794 | | | $ | 13,336 | |
| | | | | | | | | | $ | — | |
| | | | | | | | | | $ | (13,336 | ) |
AB Tax-Aware Long Municipal ETF | | | 2024 | | | $ | 1,729,794 | | | $ | 13,336 | |
| | | | | | | | | | $ | — | |
| | | | | | | | | | $ | (13,336 | ) |
AB Short Duration High Yield ETF | | | 2023 | | | $ | 1,702,448 | | | $ | 21,418 | |
| | | | | | | | | | $ | — | |
| | | | | | | | | | $ | (21,418 | ) |
| | | 2024 | | | $ | 1,751,532 | | | $ | 35,074 | |
| | | | | | | | | | $ | — | |
| | | | | | | | | | $ | (35,074 | ) |
AB Short Duration Income ETF | | | 2023 | | | $ | 1,778,662 | | | $ | 17,632 | |
| | | | | | | | | | $ | — | |
| | | | | | | | | | $ | (17,632 | ) |
| | | 2024 | | | $ | 1,756,032 | | | $ | 39,574 | |
| | | | | | | | | | $ | — | |
| | | | | | | | | | $ | (39,574 | ) |
AB International Low Volatility Equity ETF | | | 2023 | | | $ | 1,562,496 | | | $ | 19,527 | |
| | | | | | | | | | $ | — | |
| | | | | | | | | | $ | (19,527 | ) |
| | | 2024 | | | $ | 1,754,825 | | | $ | 38,367 | |
| | | | | | | | | | $ | — | |
| | | | | | | | | | $ | (38,367 | ) |
(h) The Audit Committee of the Fund has considered whether the provision of any non-audit services not pre-approved by the Audit Committee provided by the Fund’s independent registered public accounting firm to the Adviser and Service Affiliates is compatible with maintaining the auditor’s independence.
(i) Not applicable.
(j) Not applicable.
ITEM 5. AUDIT COMMITTEE OF LISTED REGISTRANTS.
Not applicable to the registrant.
ITEM 6. INVESTMENTS.
Please see Schedule of Investments contained in the Report to Shareholders included under Item 1 of this Form N-CSR.
ITEM 7. FINANCIAL STATEMENTS AND FINANCIAL HIGHLIGHTS FOR OPEN-END MANAGEMENT INVESTMENT COMPANIES.
Not applicable to the registrant.
NOV 11.30.24

ANNUAL FINANCIAL STATEMENTS AND ADDITIONAL INFORMATION
AB TAX-AWARE SHORT DURATION MUNICIPAL ETF
(NYSE: TAFI)

AllianceBernstein L.P. would like to thank you for your interest in the Fund.
| | |
| |
| Investment Products Offered | | • Are Not FDIC Insured • May Lose Value • Are Not Bank Guaranteed |
Investors should consider the investment objectives, risks, charges and expenses of the Fund carefully before investing. For copies of our prospectus or summary prospectus, which contain this and other information, visit us online at www.abfunds.com or contact your AB representative. Please read the prospectus and/or summary prospectus carefully before investing.
This shareholder report must be preceded or accompanied by the Fund’s prospectus for individuals who are not current shareholders of the Fund.
You may obtain a description of the Fund’s proxy voting policies and procedures, and information regarding how the Fund voted proxies relating to portfolio securities during the most recent 12-month period ended June 30, without charge. Simply visit AB’s website at www.abfunds.com, or go to the Securities and Exchange Commission’s (the “Commission”) website at www.sec.gov, or call AB at (800) 227 4618.
The Fund files its complete schedule of portfolio holdings with the Commission for the first and third quarters of each fiscal year as an exhibit to its reports on Form N-PORT. The Fund’s Form N-PORT reports are available on the Commission’s website at www.sec.gov. AB publishes full portfolio holdings for the Fund daily at www.abfunds.com.
Foreside Fund Services, LLC (“Foreside”) is the distributor of the fund. Foreside is a member of FINRA.
The [A/B] logo and AllianceBernstein® are registered trademarks used by permission of the owner, AllianceBernstein L.P.
PORTFOLIO OF INVESTMENTS
November 30, 2024
| | | | | | | | |
| | | Principal
Amount
(000) | | | U.S. $ Value | |
| |
MUNICIPAL OBLIGATIONS – 97.9% | |
Long-Term Municipal Bonds – 96.2% | |
Alabama – 4.9% | |
Black Belt Energy Gas District
(BP PLC)
Series 2024-D
5.00%, 03/01/2055(a) | | $ | 1,500 | | | $ | 1,632,180 | |
Black Belt Energy Gas District
(Goldman Sachs Group, Inc. (The))
Series 2021-B
4.00%, 10/01/2052 | | | 1,200 | | | | 1,208,029 | |
Series 2023-D
4.92% (SOFR + 1.85%), 06/01/2049(b) | | | 1,000 | | | | 1,028,285 | |
Series 2024-B
5.00%, 10/01/2055 | | | 2,750 | | | | 2,944,429 | |
Black Belt Energy Gas District
(Morgan Stanley)
Series 2019-A
4.00%, 12/01/2049 | | | 2,000 | | | | 2,008,029 | |
Black Belt Energy Gas District
(Royal Bank of Canada)
Series 2022-D
4.00%, 12/01/2025 | | | 650 | | | | 652,705 | |
City of Huntsville AL
Series 2016-B
5.00%, 05/01/2028 | | | 470 | | | | 484,773 | |
County of Jefferson AL Sewer Revenue
Series 2024
5.00%, 10/01/2034 | | | 1,000 | | | | 1,133,525 | |
Southeast Alabama Gas Supply District (The)
(Morgan Stanley)
Series 2024
5.00%, 06/01/2049 | | | 1,000 | | | | 1,070,256 | |
Southeast Alabama Gas Supply District (The)
(Pacific Mutual Holding Co.)
Series 2024-A
5.00%, 08/01/2054 | | | 6,000 | | | | 6,448,678 | |
Southeast Energy Authority A Cooperative District (Deutsche Bank AG)
Series 2024-A
5.00%, 11/01/2035 | | | 1,000 | | | | 1,051,768 | |
Southeast Energy Authority A Cooperative District (Goldman Sachs Group, Inc. (The))
Series 2022-B
5.00%, 05/01/2053 | | | 1,000 | | | | 1,044,814 | |
| | |
| |
| abfunds.com | | AB TAX-AWARE SHORT DURATION MUNICIPAL ETF | 1 |
PORTFOLIO OF INVESTMENTS (continued)
| | | | | | | | |
| | | Principal
Amount
(000) | | | U.S. $ Value | |
| |
Southeast Energy Authority A Cooperative District
(Morgan Stanley)
Series 2022-A
5.50%, 01/01/2053 | | $ | 2,000 | | | $ | 2,159,717 | |
Southeast Energy Authority A Cooperative District (Pacific Mutual Holding Co.)
Series 2024-C
5.00%, 11/01/2055 | | | 1,500 | | | | 1,620,752 | |
Southeast Energy Authority A Cooperative District (Royal Bank of Canada)
Series 2023-B
5.00%, 01/01/2054 | | | 3,110 | | | | 3,322,816 | |
Southeast Energy Authority A Cooperative District (Sumitomo Mitsui Financial Group, Inc.)
Series 2023-A
5.00%, 07/01/2027 | | | 1,500 | | | | 1,549,202 | |
5.25%, 01/01/2054 | | | 2,500 | | | | 2,660,424 | |
| | | | | | | | |
| | | | | | | 32,020,382 | |
| | | | | | | | |
Arizona – 2.4% | |
Chandler Industrial Development Authority
(Intel Corp.)
Series 2022
5.00%, 09/01/2042 | | | 3,000 | | | | 3,081,360 | |
5.00%, 09/01/2052 | | | 1,000 | | | | 1,027,256 | |
Series 2024
4.00%, 06/01/2049 | | | 3,000 | | | | 3,033,066 | |
City of Glendale AZ Water & Sewer Revenue
Series 2022-B
5.00%, 07/01/2026 | | | 1,000 | | | | 1,034,396 | |
Industrial Development Authority of the City of Phoenix Arizona (The)
(AZ GFF Tiyan LLC Lease)
Series 2014
5.00%, 02/01/2029 | | | 1,000 | | | | 984,518 | |
Maricopa County Industrial Development Authority
(HonorHealth Obligated Group)
Series 2024-D
5.00%, 12/01/2025 | | | 2,000 | | | | 2,036,851 | |
Maricopa County Special Health Care District
Series 2021-D
5.00%, 07/01/2025 | | | 1,325 | | | | 1,340,409 | |
Scottsdale Municipal Property Corp.
(Pre-refunded – US Treasuries)
Series 2015
4.00%, 07/01/2031 | | | 3,000 | | | | 3,016,709 | |
| | | | | | | | |
| | | | | | | 15,554,565 | |
| | | | | | | | |
| | |
| |
2 | AB TAX-AWARE SHORT DURATION MUNICIPAL ETF | | abfunds.com |
PORTFOLIO OF INVESTMENTS (continued)
| | | | | | | | |
| | | Principal
Amount
(000) | | | U.S. $ Value | |
| |
Arkansas – 0.0% | |
Arkansas Development Finance Authority
(Hybar LLC)
Series 2023
6.875%, 07/01/2048(c) | | $ | 115 | | | $ | 127,097 | |
| | | | | | | | |
|
California – 9.1% | |
Bay Area Toll Authority
Series 2021
3.59% (MUNIPSA + 0.41%), 04/01/2056(b) | | | 3,000 | | | | 2,960,331 | |
California Community Choice Financing Authority
(American General Life Insurance Co.)
Series 2024
5.00%, 08/01/2055 | | | 1,500 | | | | 1,624,898 | |
California Community Choice Financing Authority
(American International Group, Inc.)
Series 2023-D
5.50%, 05/01/2054 | | | 5,000 | | | | 5,347,549 | |
California Community Choice Financing Authority
(Apollo Global Management, Inc.)
Series 2024
5.00%, 11/01/2055 | | | 2,000 | | | | 2,161,999 | |
California Community Choice Financing Authority
(Deutsche Bank AG)
Series 2023
5.25%, 01/01/2054 | | | 1,000 | | | | 1,076,440 | |
California Community Choice Financing Authority
(Goldman Sachs Group, Inc. (The))
Series 2021
4.00%, 10/01/2052 | | | 1,000 | | | | 1,020,980 | |
California Community Choice Financing Authority
(Morgan Stanley)
Series 2024
5.00%, 05/01/2054 | | | 3,500 | | | | 3,797,603 | |
California Community Choice Financing Authority
(Pacific Mutual Holding Co.)
Series 2024-F
5.00%, 02/01/2055 | | | 1,750 | | | | 1,909,792 | |
California Municipal Finance Authority
(Azusa Pacific University)
Series 2015-B
5.00%, 04/01/2026 | | | 1,000 | | | | 999,388 | |
California Municipal Finance Authority
(LAX Integrated Express Solutions LLC)
Series 2018
5.00%, 06/30/2029 | | | 1,000 | | | | 1,043,621 | |
5.00%, 12/31/2033 | | | 1,500 | | | | 1,556,904 | |
| | |
| |
| abfunds.com | | AB TAX-AWARE SHORT DURATION MUNICIPAL ETF | 3 |
PORTFOLIO OF INVESTMENTS (continued)
| | | | | | | | |
| | | Principal
Amount
(000) | | | U.S. $ Value | |
| |
California Pollution Control Financing Authority
Series 2024
4.25%, 11/01/2038 | | $ | 1,000 | | | $ | 1,028,439 | |
California School Finance Authority
(KIPP SoCal Public Schools)
Series 2014-A
5.00%, 07/01/2034(c) | | | 600 | | | | 600,220 | |
5.125%, 07/01/2044(c) | | | 750 | | | | 750,307 | |
California State Public Works Board
(California State Public Works Board Lease)
Series 2017-H
5.00%, 04/01/2031 | | | 1,425 | | | | 1,493,848 | |
California Statewide Communities Development Authority
(CHF-Irvine LLC)
Series 2016
5.00%, 05/15/2025 | | | 1,500 | | | | 1,511,149 | |
California Statewide Communities Development Authority
(Southern California Edison Co.)
Series 2023
4.50%, 11/01/2033 | | | 1,000 | | | | 1,067,243 | |
City of Los Angeles Department of Airports
Series 2017-A
5.00%, 05/15/2030 | | | 3,385 | | | | 3,503,454 | |
Series 2022
5.00%, 05/15/2025 | | | 475 | | | | 478,453 | |
Series 2023
5.00%, 05/15/2028 | | | 1,610 | | | | 1,703,095 | |
County of Los Angeles CA
Series 2024
5.00%, 06/30/2025 | | | 2,000 | | | | 2,025,841 | |
Newport Mesa Unified School District
NATL Series 2007
Zero Coupon, 08/01/2031 | | | 2,000 | | | | 1,639,427 | |
Oakland Unified School District/Alameda County
Series 2016
5.00%, 08/01/2025 | | | 1,000 | | | | 1,014,240 | |
Port of Los Angeles
Series 2014-A
5.00%, 08/01/2044 | | | 2,000 | | | | 2,002,164 | |
Port of Oakland
Series 2021
5.00%, 11/01/2029 | | | 1,575 | | | | 1,697,181 | |
San Diego County Regional Airport Authority
Series 2023
5.00%, 07/01/2029 | | | 1,610 | | | | 1,726,385 | |
| | |
| |
4 | AB TAX-AWARE SHORT DURATION MUNICIPAL ETF | | abfunds.com |
PORTFOLIO OF INVESTMENTS (continued)
| | | | | | | | |
| | | Principal
Amount
(000) | | | U.S. $ Value | |
| |
San Francisco Intl Airport
Series 2018
5.00%, 05/01/2027 | | $ | 1,530 | | | $ | 1,594,811 | |
Series 2019-H
5.00%, 05/01/2027 | | | 1,500 | | | | 1,563,541 | |
Series 2024
5.00%, 05/01/2029 | | | 2,500 | | | | 2,674,949 | |
Southern California Public Power Authority
(American International Group, Inc.)
Series 2024-A
5.00%, 04/01/2055 | | | 1,000 | | | | 1,071,701 | |
State of California
Series 2015-C
5.00%, 09/01/2030 | | | 2,000 | | | | 2,024,747 | |
Stockton Public Financing Authority
(Pre-refunded – Others)
BAM Series 2014
5.00%, 09/01/2028 | | | 1,475 | | | | 1,475,081 | |
Sweetwater Union High School District
(Pre-refunded – US Treasuries)
BAM Series 2014
5.00%, 08/01/2026 | | | 1,075 | | | | 1,075,053 | |
5.00%, 08/01/2029 | | | 1,115 | | | | 1,115,055 | |
Washington Township Health Care District
Series 2020-A
5.00%, 07/01/2031 | | | 650 | | | | 700,266 | |
| | | | | | | | |
| | | | | | | 59,036,155 | |
| | | | | | | | |
Colorado – 3.9% | |
Adams & Weld Counties School District No. 27J Brighton/CO
Series 2016-A
2.50%, 12/01/2027 | | | 1,500 | | | | 1,465,165 | |
City & County of Broomfield CO Sales & Use Tax Revenue
Series 2017
5.00%, 12/01/2034 | | | 2,000 | | | | 2,118,023 | |
City & County of Denver CO Airport System Revenue
Series 2020-B
5.00%, 11/15/2031 | | | 700 | | | | 709,034 | |
Series 2022-D
5.25%, 11/15/2026 | | | 1,020 | | | | 1,055,290 | |
City & County of Denver CO Airport System Revenue
(Denver Intl Airport)
Series 2018-A
5.00%, 12/01/2025 | | | 1,000 | | | | 1,014,779 | |
| | |
| |
| abfunds.com | | AB TAX-AWARE SHORT DURATION MUNICIPAL ETF | 5 |
PORTFOLIO OF INVESTMENTS (continued)
| | | | | | | | |
| | | Principal
Amount
(000) | | | U.S. $ Value | |
| |
5.00%, 12/01/2029 | | $ | 3,000 | | | $ | 3,171,694 | |
5.00%, 12/01/2031 | | | 2,000 | | | | 2,107,003 | |
Colorado Educational & Cultural Facilities Authority
(Ascent Classical Academy Charter Schools, Inc.)
Series 2024
4.75%, 04/01/2034(c) | | | 1,000 | | | | 1,044,873 | |
Colorado State Education Loan Program
Series 2024-A
5.00%, 06/30/2025 | | | 2,000 | | | | 2,023,919 | |
Crowfoot Valley Ranch Metropolitan District No. 2
Series 2018-A
5.75%, 12/01/2048 | | | 3,000 | | | | 3,061,965 | |
Denver City & County School District No. 1
Series 2022-B
5.00%, 12/01/2024 | | | 1,225 | | | | 1,225,000 | |
Douglas County School District No. Re-1
Douglas & Elbert Counties
Series 2019
5.00%, 12/15/2025 | | | 4,480 | | | | 4,578,079 | |
E-470 Public Highway Authority
Series 2024-B
3.819% (SOFR + 0.75%), 09/01/2039(b) | | | 2,000 | | | | 2,000,593 | |
| | | | | | | | |
| | | | | | | 25,575,417 | |
| | | | | | | | |
Connecticut – 1.6% | |
City of New Haven CT
AGM Series 2016-A
5.00%, 08/15/2027 | | | 1,875 | | | | 1,940,925 | |
State of Connecticut
Series 2015-A
4.50%, 03/15/2033 | | | 2,500 | | | | 2,504,884 | |
Series 2018-F
5.00%, 09/15/2025 | | | 2,000 | | | | 2,031,463 | |
Series 2019-B
5.00%, 02/15/2025 | | | 2,000 | | | | 2,007,544 | |
State of Connecticut Special Tax Revenue
Series 2023-B
5.00%, 01/01/2025 | | | 2,000 | | | | 2,002,822 | |
| | | | | | | | |
| | | | | | | 10,487,638 | |
| | | | | | | | |
District of Columbia – 1.4% | |
District of Columbia
Series 2016-A
5.00%, 06/01/2027 | | | 2,500 | | | | 2,583,266 | |
| | |
| |
6 | AB TAX-AWARE SHORT DURATION MUNICIPAL ETF | | abfunds.com |
PORTFOLIO OF INVESTMENTS (continued)
| | | | | | | | |
| | | Principal
Amount
(000) | | | U.S. $ Value | |
| |
District of Columbia
(Plenary Infrastructure DC LLC State Lease)
Series 2022
5.00%, 02/28/2026 | | $ | 1,485 | | | $ | 1,513,152 | |
Metropolitan Washington Airports Authority Aviation Revenue
Series 2017
5.00%, 10/01/2026 | | | 465 | | | | 479,115 | |
Series 2018-A
5.00%, 10/01/2034 | | | 1,075 | | | | 1,123,006 | |
Series 2019-A
5.00%, 10/01/2027 | | | 1,000 | | | | 1,045,563 | |
Series 2020-A
5.00%, 10/01/2032 | | | 2,000 | | | | 2,149,246 | |
| | | | | | | | |
| | | | | | | 8,893,348 | |
| | | | | | | | |
Florida – 6.7% | |
Citizens Property Insurance, Inc.
Series 2015-A
5.00%, 06/01/2025 | | | 3,850 | | | | 3,850,000 | |
City of Jacksonville FL
(Genesis Health, Inc. Obligated Group)
Series 2017
5.00%, 11/01/2026 | | | 600 | | | | 617,738 | |
City of Port St. Lucie FL Utility System Revenue
Series 2016
4.00%, 09/01/2032 | | | 3,560 | | | | 3,591,177 | |
City of Venice FL
Series 2024
4.25%, 01/01/2030(a)(c) | | | 900 | | | | 902,815 | |
Collier County Industrial Development Authority
(NCH Healthcare System, Inc. Obligated Group)
Series 2024
5.00%, 10/01/2054 | | | 2,000 | | | | 2,183,630 | |
County of Brevard FL
(County of Brevard FL Fuel Tax)
AGM Series 2016
5.00%, 08/01/2028 | | | 1,445 | | | | 1,494,220 | |
County of Broward FL Airport System Revenue
(Fort Lauderdale Hollywood Intl Airport)
Series 2015-A
5.00%, 10/01/2025 | | | 930 | | | | 941,641 | |
County of Broward FL Professional Sports Facilities Tax Revenue
Series 2016
5.00%, 09/01/2025 | | | 1,265 | | | | 1,266,835 | |
| | |
| |
| abfunds.com | | AB TAX-AWARE SHORT DURATION MUNICIPAL ETF | 7 |
PORTFOLIO OF INVESTMENTS (continued)
| | | | | | | | |
| | | Principal
Amount
(000) | | | U.S. $ Value | |
| |
County of Charlotte FL
Series 2015
5.00%, 10/01/2027 | | $ | 1,080 | | | $ | 1,096,739 | |
County of Miami-Dade FL
Series 2016
5.00%, 07/01/2032 | | | 1,000 | | | | 1,027,634 | |
County of Miami-Dade FL Aviation Revenue
Series 2024-A
5.00%, 10/01/2030 | | | 1,500 | | | | 1,612,027 | |
5.00%, 10/01/2034 | | | 1,000 | | | | 1,097,065 | |
Florida Development Finance Corp.
(GFL Solid Waste Southeast LLC)
Series 2024
4.375%, 10/01/2054(c) | | | 1,950 | | | | 1,971,128 | |
Florida Insurance Assistance Interlocal Agency, Inc.
(Florida Insurance Guaranty Association, Inc.)
Series 2023-A
5.00%, 09/01/2028 | | | 1,000 | | | | 1,032,476 | |
Greater Orlando Aviation Authority
Series 2019-A
5.00%, 10/01/2025 | | | 1,000 | | | | 1,013,586 | |
Series 2022-A
5.00%, 10/01/2029 | | | 1,020 | | | | 1,092,024 | |
Series 2022-C
5.00%, 10/01/2025 | | | 1,350 | | | | 1,368,341 | |
Hernando County School District
(Hernando County School District COP)
AGM Series 2016-A
5.00%, 07/01/2025 | | | 1,350 | | | | 1,365,284 | |
Hillsborough County Aviation Authority
Series 2024
5.00%, 10/01/2033 | | | 1,425 | | | | 1,579,866 | |
Lee County Industrial Development Authority/FL
(Shell Point Obligated Group)
Series 2024
4.125%, 11/15/2029 | | | 1,000 | | | | 1,006,794 | |
Miami-Dade County Expressway Authority
Series 2016-A
5.00%, 07/01/2028 | | | 1,625 | | | | 1,669,964 | |
5.00%, 07/01/2033 | | | 1,000 | | | | 1,023,784 | |
Mid-Bay Bridge Authority
Series 2015-A
5.00%, 10/01/2025 | | | 1,250 | | | | 1,265,372 | |
Palm Beach County School District
Series 2015-D
5.00%, 08/01/2028 | | | 3,000 | | | | 3,032,884 | |
| | |
| |
8 | AB TAX-AWARE SHORT DURATION MUNICIPAL ETF | | abfunds.com |
PORTFOLIO OF INVESTMENTS (continued)
| | | | | | | | |
| | | Principal
Amount
(000) | | | U.S. $ Value | |
| |
School Board of Miami-Dade County (The)
Series 2016-A
5.00%, 05/01/2030 | | $ | 1,340 | | | $ | 1,372,768 | |
Series 2024
4.50%, 01/07/2025 | | | 2,000 | | | | 2,002,695 | |
Village Community Development District No. 15
Series 2024
3.75%, 05/01/2029(c) | | | 700 | | | | 701,677 | |
West Palm Beach Community Redevelopment Agency
(West Palm Beach Community Redevelopment Agency City Center Community Redev Area)
Series 2015
5.00%, 03/01/2026 | | | 2,590 | | | | 2,628,812 | |
| | | | | | | | |
| | | | | | | 43,808,976 | |
| | | | | | | | |
Georgia – 4.7% | |
Augusta Development Authority
(WellStar Health System Obligated Group)
Series 2018
5.00%, 07/01/2025 | | | 200 | | | | 201,747 | |
City of Atlanta GA Airport Passenger Facility Charge
Series 2023
5.00%, 07/01/2030 | | | 2,000 | | | | 2,159,075 | |
City of Atlanta GA Department of Aviation
Series 2023-G
5.00%, 07/01/2027 | | | 1,000 | | | | 1,041,370 | |
City of Atlanta GA Water & Wastewater Revenue
Series 2015
5.00%, 11/01/2025 | | | 1,000 | | | | 1,008,034 | |
Development Authority of Burke County (The)
(Georgia Power Co.)
Series 2023
3.875%, 10/01/2032 | | | 2,250 | | | | 2,269,640 | |
Series 2024
3.30%, 12/01/2049 | | | 1,500 | | | | 1,505,316 | |
Fayette County Development Authority
(United States Soccer Federation, Inc.)
Series 2024
5.00%, 10/01/2033 | | | 1,000 | | | | 1,111,036 | |
Main Street Natural Gas, Inc.
(Citadel LP)
Series 2022-C
4.00%, 08/01/2052(c) | | | 3,500 | | | | 3,506,629 | |
| | |
| |
| abfunds.com | | AB TAX-AWARE SHORT DURATION MUNICIPAL ETF | 9 |
PORTFOLIO OF INVESTMENTS (continued)
| | | | | | | | |
| | | Principal
Amount
(000) | | | U.S. $ Value | |
| |
Main Street Natural Gas, Inc.
(Citigroup, Inc.)
Series 2019-C
4.00%, 03/01/2050 | | $ | 1,000 | | | $ | 1,008,623 | |
Series 2022-B
5.00%, 12/01/2052 | | | 4,000 | | | | 4,241,240 | |
Series 2024-C
5.00%, 12/01/2054 | | | 3,500 | | | | 3,750,229 | |
Main Street Natural Gas, Inc.
(Pre-refunded – Others)
Series 2019-B
4.00%, 08/01/2049 | | | 2,800 | | | | 2,800,000 | |
Main Street Natural Gas, Inc.
(Royal Bank of Canada)
Series 2023
4.769% (SOFR + 1.70%), 12/01/2053(b) | | | 1,000 | | | | 1,030,978 | |
Municipal Electric Authority of Georgia
Series 2016-A
5.00%, 01/01/2028 | | | 1,820 | | | | 1,871,701 | |
Series 2019-A
5.00%, 01/01/2033 | | | 1,200 | | | | 1,279,600 | |
Series 2020
5.00%, 01/01/2029 | | | 500 | | | | 539,573 | |
Series 2024
5.00%, 01/01/2030 | | | 1,000 | | | | 1,095,666 | |
| | | | | | | | |
| | | | | | | 30,420,457 | |
| | | | | | | | |
Guam – 1.1% | |
Guam Government Waterworks Authority
(Guam Waterworks Authority Water And Wastewater System)
Series 2024-B
5.00%, 07/01/2027 | | | 1,000 | | | | 1,045,659 | |
Territory of Guam
Series 2019
5.00%, 11/15/2031 | | | 815 | | | | 833,887 | |
Territory of Guam
(Guam Section 30 Income Tax)
| | | | | | | | |
Series 2016-A
5.00%, 12/01/2026 | | | 2,000 | | | | 2,059,121 | |
5.00%, 12/01/2031 | | | 3,000 | | | | 3,067,891 | |
| | | | | | | | |
| | | | | | | 7,006,558 | |
| | | | | | | | |
Hawaii – 0.7% | |
City & County of Honolulu HI
Series 2015-B
5.00%, 10/01/2027 | | | 1,000 | | | | 1,017,244 | |
Series 2019-D
5.00%, 08/01/2026 | | | 1,050 | | | | 1,089,796 | |
| | |
| |
10 | AB TAX-AWARE SHORT DURATION MUNICIPAL ETF | | abfunds.com |
PORTFOLIO OF INVESTMENTS (continued)
| | | | | | | | |
| | | Principal
Amount
(000) | | | U.S. $ Value | |
| |
State of Hawaii Harbor System Revenue
Series 2020-A
4.00%, 07/01/2035 | | $ | 2,250 | | | $ | 2,263,904 | |
| | | | | | | | |
| | | | | | | 4,370,944 | |
| | | | | | | | |
Idaho – 0.2% | |
Idaho Health Facilities Authority
(St Luke’s Health System Ltd Obligated Group/ID)
Series 2018
5.00%, 03/01/2027 | | | 1,000 | | | | 1,043,465 | |
| | | | | | | | |
| | |
Illinois – 6.4% | | | | | | | | |
Chicago Board of Education
Series 2017-C
5.00%, 12/01/2030 | | | 1,000 | | | | 1,020,624 | |
Series 2019-A
5.00%, 12/01/2030 | | | 1,575 | | | | 1,637,764 | |
AGM Series 2018-C
5.00%, 12/01/2031 | | | 1,000 | | | | 1,047,370 | |
Chicago O’Hare International Airport
Series 2024-C
5.00%, 01/01/2028 | | | 3,000 | | | | 3,138,205 | |
Chicago O’Hare International Airport
(Pre-refunded – US Treasuries)
Series 2015
5.00%, 01/01/2027 | | | 1,000 | | | | 1,001,117 | |
Chicago Transit Authority
Series 2017
5.00%, 06/01/2026 | | | 1,695 | | | | 1,735,529 | |
Chicago Transit Authority Capital Grant Receipts Revenue
(City of Chicago IL Fed Hwy Grant)
Series 2017
5.00%, 06/01/2025 | | | 1,000 | | | | 1,007,035 | |
Series 2021
5.00%, 06/01/2027 | | | 1,750 | | | | 1,825,507 | |
City of Chicago IL
Series 2020-A
5.00%, 01/01/2026 | | | 2,125 | | | | 2,159,051 | |
City of Chicago IL Waterworks Revenue
AMBAC Series 2001
5.75%, 11/01/2030 | | | 755 | | | | 809,802 | |
Illinois State Toll Highway Authority
Series 2019-A
5.00%, 01/01/2026 | | | 1,000 | | | | 1,022,104 | |
| | |
| |
| abfunds.com | | AB TAX-AWARE SHORT DURATION MUNICIPAL ETF | 11 |
PORTFOLIO OF INVESTMENTS (continued)
| | | | | | | | |
| | | Principal
Amount
(000) | | | U.S. $ Value | |
| |
Metropolitan Pier & Exposition Authority
Series 2023
5.00%, 12/15/2027 | | $ | 1,000 | | | $ | 1,054,264 | |
Metropolitan Water Reclamation District of Greater Chicago
Series 2016-A
5.00%, 12/01/2030 | | | 2,595 | | | | 2,690,027 | |
Northern Illinois University
BAM Series 2020-B
5.00%, 04/01/2031 | | | 725 | | | | 777,340 | |
Sangamon County School District No. 186 Springfield
AGM Series 2020-B
5.00%, 02/01/2032 | | | 690 | | | | 749,650 | |
State of Illinois
Series 2014
5.25%, 02/01/2030 | | | 2,800 | | | | 2,805,846 | |
Series 2017-D
5.00%, 11/01/2026 | | | 2,000 | | | | 2,071,113 | |
Series 2019-A
5.00%, 11/01/2029 | | | 685 | | | | 742,579 | |
Series 2020
5.50%, 05/01/2030 | | | 2,000 | | | | 2,153,567 | |
Series 2021-B
5.00%, 03/01/2025 | | | 1,375 | | | | 1,380,511 | |
Series 2022-A
5.00%, 03/01/2025 | | | 2,570 | | | | 2,580,301 | |
Series 2024
5.00%, 02/01/2031 | | | 2,000 | | | | 2,199,927 | |
Series 2024-B
5.00%, 05/01/2026 | | | 1,000 | | | | 1,025,971 | |
State of Illinois Sales Tax Revenue
Series 2021
5.00%, 06/15/2025 | | | 1,300 | | | | 1,311,000 | |
Series 2021-A
4.00%, 06/15/2028 | | | 605 | | | | 627,629 | |
Series 2024-A
5.00%, 06/15/2025 | | | 1,000 | | | | 1,008,462 | |
5.00%, 06/15/2030 | | | 1,790 | | | | 1,970,291 | |
| | | | | | | | |
| | | | | | | 41,552,586 | |
| | | | | | | | |
Indiana – 1.0% | |
City of Valparaiso IN
(Pratt Paper IN LLC)
Series 2024
4.50%, 01/01/2034(c) | | | 900 | | | | 920,591 | |
| | |
| |
12 | AB TAX-AWARE SHORT DURATION MUNICIPAL ETF | | abfunds.com |
PORTFOLIO OF INVESTMENTS (continued)
| | | | | | | | |
| | | Principal
Amount
(000) | | | U.S. $ Value | |
| |
Indiana Finance Authority
(Ohio Valley Electric Corp.)
Series 2020
3.00%, 11/01/2030 | | $ | 500 | | | $ | 481,187 | |
Series 2022-A
4.25%, 11/01/2030 | | | 2,000 | | | | 2,062,812 | |
Indiana Finance Authority
(Parkview Health System Obligated Group)
Series 2024-B
3.916% (SOFR + 0.71%), 11/01/2046(b)(d) | | | 2,000 | | | | 2,003,454 | |
Indianapolis Local Public Improvement Bond
Bank
Series 2021-A
5.00%, 06/01/2025 | | | 1,000 | | | | 1,009,101 | |
| | | | | | | | |
| | | | | | | 6,477,145 | |
| | | | | | | | |
Iowa – 0.1% | |
Iowa Finance Authority
(Iowa Health System Obligated Group)
Series 2018-B
5.00%, 02/15/2025 | | | 500 | | | | 501,313 | |
| | | | | | | | |
| | |
Kansas – 0.2% | | | | | | | | |
Seward County Unified School District No. 480 Liberal
Series 2017-B
5.00%, 09/01/2026 | | | 1,500 | | | | 1,522,905 | |
| | | | | | | | |
| | |
Kentucky – 0.8% | | | | | | | | |
Kentucky Public Energy Authority
(BP PLC)
Series 2024-B
5.00%, 01/01/2055 | | | 1,000 | | | | 1,075,696 | |
Kentucky Public Energy Authority
(Morgan Stanley)
Series 2023-A
5.25%, 04/01/2054 | | | 2,000 | | | | 2,172,284 | |
Western Kentucky University
Series 2016-A
5.00%, 09/01/2025 | | | 1,660 | | | | 1,679,652 | |
| | | | | | | | |
| | | | | | | 4,927,632 | |
| | | | | | | | |
Louisiana – 1.1% | |
City of Shreveport LA
BAM Series 2016
5.00%, 03/01/2027 | | | 1,400 | | | | 1,445,111 | |
| | |
| |
| abfunds.com | | AB TAX-AWARE SHORT DURATION MUNICIPAL ETF | 13 |
PORTFOLIO OF INVESTMENTS (continued)
| | | | | | | | |
| | | Principal
Amount
(000) | | | U.S. $ Value | |
| |
Louisiana Local Government Environmental Facilities & Community Development Auth
(Louisiana Insurance Guaranty Association)
Series 2022
5.00%, 08/15/2029 | | $ | 665 | | | $ | 694,986 | |
Louisiana Public Facilities Authority
(ElementUS Minerals LLC)
Series 2023
5.00%, 10/01/2043(c) | | | 1,900 | | | | 1,915,993 | |
New Orleans Aviation Board
Series 2015-B
5.00%, 01/01/2040 | | | 1,960 | | | | 1,962,270 | |
Series 2024
5.00%, 01/01/2029 | | | 1,000 | | | | 1,053,954 | |
| | | | | | | | |
| | | | | | | 7,072,314 | |
| | | | | | | | |
Maine – 0.2% | |
Finance Authority of Maine
(Casella Waste Systems, Inc.)
Series 2018-R2
4.375%, 08/01/2035(c) | | | 1,500 | | | | 1,504,858 | |
| | | | | | | | |
| | |
Maryland – 1.5% | | | | | | | | |
County of Montgomery MD
Series 2017-B
5.00%, 06/01/2026 | | | 1,520 | | | | 1,570,778 | |
Maryland Economic Development Corp.
(Purple Line Transit Partners LLC)
Series 2022
5.00%, 11/12/2028 | | | 2,000 | | | | 2,038,139 | |
Maryland Stadium Authority
Series 2024
5.00%, 06/01/2044 | | | 400 | | | | 445,650 | |
Maryland Stadium Authority
(Maryland Stadium Authority State Lease)
Series 2023-A
5.00%, 03/01/2025 | | | 1,850 | | | | 1,858,820 | |
State of Maryland
Series 2017-A
5.00%, 08/01/2025 | | | 1,765 | | | | 1,789,277 | |
State of Maryland Department of Transportation
AGC Series 2024
5.00%, 08/01/2027 | | | 950 | | | | 990,861 | |
State of Maryland Department of Transportation
(Baltimore/Washington International Thurgood Marshall Airport)
Series 2021
5.00%, 08/01/2030 | | | 1,000 | | | | 1,076,733 | |
| | | | | | | | |
| | | | | | | 9,770,258 | |
| | | | | | | | |
| | |
| |
14 | AB TAX-AWARE SHORT DURATION MUNICIPAL ETF | | abfunds.com |
PORTFOLIO OF INVESTMENTS (continued)
| | | | | | | | |
| | | Principal
Amount
(000) | | | U.S. $ Value | |
| |
Massachusetts – 2.1% | |
City of Quincy MA
Series 2024
5.00%, 07/25/2025 | | $ | 2,000 | | | $ | 2,024,692 | |
Massachusetts Development Finance Agency
Series 2015-H
5.00%, 07/01/2025 | | | 415 | | | | 419,078 | |
Series 2016
5.00%, 07/01/2025 | | | 1,250 | | | | 1,261,804 | |
Massachusetts Development Finance Agency
(Beth Israel Lahey Health Obligated Group)
Series 2019
5.00%, 07/01/2025 | | | 1,000 | | | | 1,009,827 | |
5.00%, 07/01/2031 | | | 870 | | | | 948,662 | |
Massachusetts Development Finance Agency
(Pre-refunded – US Treasuries)
Series 2015
5.00%, 07/01/2025 | | | 1,085 | | | | 1,095,982 | |
Massachusetts Development Finance Agency
(UMass Memorial Health Care Obligated Group)
Series 2016
5.00%, 07/01/2030 | | | 1,295 | | | | 1,324,080 | |
Massachusetts Port Authority
Series 2017-A
5.00%, 07/01/2027 | | | 1,120 | | | | 1,170,541 | |
Series 2019-A
5.00%, 07/01/2027 | | | 2,250 | | | | 2,352,671 | |
Series 2019-C
5.00%, 07/01/2025 | | | 2,000 | | | | 2,015,728 | |
| | | | | | | | |
| | | | | | | 13,623,065 | |
| | | | | | | | |
Michigan – 0.8% | |
City of Detroit MI
Series 2018
5.00%, 04/01/2026 | | | 1,000 | | | | 1,020,192 | |
Detroit Downtown Development Authority
(Detroit Downtown Development Authority Catalyst Development Area)
Series 2024
5.00%, 07/01/2048 | | | 1,000 | | | | 1,060,027 | |
Great Lakes Water Authority Water Supply
System Revenue
Series 2018-A
5.00%, 07/01/2028 | | | 1,000 | | | | 1,075,861 | |
Michigan Finance Authority
Series 2024-A
5.00%, 07/21/2025 | | | 2,000 | | | | 2,022,876 | |
| | | | | | | | |
| | | | | | | 5,178,956 | |
| | | | | | | | |
| | |
| |
| abfunds.com | | AB TAX-AWARE SHORT DURATION MUNICIPAL ETF | 15 |
PORTFOLIO OF INVESTMENTS (continued)
| | | | | | | | |
| | | Principal
Amount
(000) | | | U.S. $ Value | |
| |
Minnesota – 1.1% | |
City of St. Cloud MN
Series 2016-A
5.00%, 05/01/2026 | | $ | 1,225 | | | $ | 1,256,541 | |
Metropolitan Council
Series 2016-A
5.00%, 03/01/2025 | | | 1,000 | | | | 1,004,390 | |
State of Minnesota
Series 2016-D
5.00%, 08/01/2025 | | | 2,700 | | | | 2,739,464 | |
Series 2022-A
5.00%, 08/01/2025 | | | 1,000 | | | | 1,014,616 | |
University of Minnesota
Series 2017-A
5.00%, 09/01/2032 | | | 1,000 | | | | 1,052,115 | |
| | | | | | | | |
| | | | | | | 7,067,126 | |
| | | | | | | | |
Missouri – 0.8% | |
City of St. Louis MO Airport Revenue
AGM Series 2017-B
5.00%, 07/01/2025 | | | 2,130 | | | | 2,148,847 | |
County of St. Louis MO
(County of St Louis MO Lease)
Series 2020-A
4.00%, 12/01/2030 | | | 755 | | | | 779,643 | |
Health & Educational Facilities Authority of the State of Missouri
(BJC Healthcare Obligated Group)
Series 2021-B
4.00%, 05/01/2051 | | | 2,000 | | | | 2,022,171 | |
| | | | | | | | |
| | | | | | | 4,950,661 | |
| | | | | | | | |
Nebraska – 0.8% | |
Metropolitan Utilities District of Omaha Gas System Revenue
Series 2022
5.00%, 12/01/2024 | | | 2,710 | | | | 2,710,000 | |
Public Power Generation Agency
Series 2015
5.00%, 01/01/2025 | | | 2,525 | | | | 2,528,519 | |
| | | | | | | | |
| | | | | | | 5,238,519 | |
| | | | | | | | |
Nevada – 0.8% | |
County of Clark Department of Aviation
Series 2021-B
5.00%, 07/01/2025 | | | 3,100 | | | | 3,125,111 | |
| | |
| |
16 | AB TAX-AWARE SHORT DURATION MUNICIPAL ETF | | abfunds.com |
PORTFOLIO OF INVESTMENTS (continued)
| | | | | | | | |
| | | Principal
Amount
(000) | | | U.S. $ Value | |
| |
State of Nevada Department of Business & Industry
(DesertXpress Enterprises LLC)
Series 2024
8.125%, 01/01/2050 | | $ | 1,000 | | | $ | 1,030,464 | |
Tahoe-Douglas Visitors Authority
Series 2020
5.00%, 07/01/2033 | | | 1,000 | | | | 1,055,252 | |
| | | | | | | | |
| | | | | | | 5,210,827 | |
| | | | | | | | |
New Hampshire – 1.8% | |
New Hampshire Business Finance Authority
Series 2024
5.00%, 12/01/2028(c) | | | 1,000 | | | | 1,001,984 | |
New Hampshire Business Finance Authority
(Brazoria-Fort Bend County Municipal Utility District No. 3)
Series 2024
4.875%, 12/01/2033(c) | | | 700 | | | | 701,150 | |
New Hampshire Business Finance Authority
(Bridgeland Water & Utility Districts 490, 491 & 158)
Series 2024
5.375%, 12/15/2035(c) | | | 2,000 | | | | 2,011,030 | |
New Hampshire Business Finance Authority
(Tamarron Project)
Series 2024
5.25%, 12/01/2035(c) | | | 900 | | | | 900,433 | |
New Hampshire Business Finance Authority
(The Highlands Project)
Series 2024
5.125%, 12/15/2030 | | | 1,000 | | | | 1,000,088 | |
New Hampshire Business Finance Authority
(Valencia Project)
Series 2024
5.30%, 12/01/2032(c) | | | 1,500 | | | | 1,508,665 | |
State of New Hampshire
Series 2020-A
5.00%, 12/01/2025 | | | 4,405 | | | | 4,500,071 | |
| | | | | | | | |
| | | | | | | 11,623,421 | |
| | | | | | | | |
New Jersey – 5.9% | |
City of Jersey City NJ
Series 2024-D
4.50%, 10/22/2025 | | | 2,500 | | | | 2,531,472 | |
Garden State Preservation Trust
AGM Series 2005-A
5.75%, 11/01/2028 | | | 2,465 | | | | 2,630,747 | |
| | |
| |
| abfunds.com | | AB TAX-AWARE SHORT DURATION MUNICIPAL ETF | 17 |
PORTFOLIO OF INVESTMENTS (continued)
| | | | | | | | |
| | | Principal
Amount
(000) | | | U.S. $ Value | |
| |
New Brunswick Parking Authority
BAM Series 2016-A
5.00%, 09/01/2030 | | $ | 2,000 | | | $ | 2,064,733 | |
New Jersey Economic Development Authority
(New Jersey Economic Development Authority State Lease)
Series 2015-X
5.00%, 06/15/2025 | | | 3,950 | | | | 3,986,671 | |
New Jersey Economic Development Authority
(New Jersey Transit Corp. State Lease)
Series 2017-B
5.00%, 11/01/2025 | | | 1,400 | | | | 1,423,791 | |
New Jersey Economic Development Authority
(New Jersey-American Water Co., Inc.)
Series 2023
3.75%, 11/01/2034 | | | 2,000 | | | | 2,010,288 | |
New Jersey Economic Development Authority
(State of New Jersey Lease)
Series 2015-A
5.00%, 06/15/2025 | | | 1,000 | | | | 1,009,284 | |
Series 2015-X
5.25%, 06/15/2027 | | | 1,395 | | | | 1,408,658 | |
New Jersey Economic Development Authority
(United Airlines, Inc.)
Series 2012
5.75%, 09/15/2027 | | | 1,805 | | | | 1,807,606 | |
New Jersey Health Care Facilities Financing Authority
(RWJ Barnabas Health Obligated Group)
Series 2021
5.00%, 07/01/2025 | | | 2,000 | | | | 2,021,963 | |
New Jersey Transportation Trust Fund Authority
(Pre-refunded – US Treasuries)
Series 2019
5.00%, 12/15/2024 | | | 2,000 | | | | 2,001,218 | |
5.00%, 06/15/2030 | | | 250 | | | | 272,511 | |
New Jersey Transportation Trust Fund Authority
(State of New Jersey Lease)
Series 2021-A
5.00%, 06/15/2025 | | | 1,950 | | | | 1,968,727 | |
New Jersey Turnpike Authority
(Pre-refunded – US Treasuries)
Series 2015-E
5.00%, 01/01/2034 | | | 3,000 | | | | 3,004,214 | |
Newark Board of Education
BAM Series 2021
5.00%, 07/15/2029 | | | 1,210 | | | | 1,319,775 | |
| | |
| |
18 | AB TAX-AWARE SHORT DURATION MUNICIPAL ETF | | abfunds.com |
PORTFOLIO OF INVESTMENTS (continued)
| | | | | | | | |
| | | Principal
Amount
(000) | | | U.S. $ Value | |
| |
South Jersey Transportation Authority
AGM Series 2019-A
5.00%, 11/01/2030 | | $ | 1,675 | | | $ | 1,812,402 | |
State of New Jersey
Series 2014
5.00%, 06/01/2031 | | | 3,500 | | | | 3,532,603 | |
Series 2020
5.00%, 06/01/2025 | | | 1,000 | | | | 1,009,600 | |
Tobacco Settlement Financing Corp./NJ
Series 2018-A
5.00%, 06/01/2029 | | | 2,645 | | | | 2,792,913 | |
| | | | | | | | |
| | | | | | | 38,609,176 | |
| | | | | | | | |
New York – 7.8% | |
City of New York NY
Series 2020-A
5.00%, 08/01/2025 | | | 1,500 | | | | 1,521,118 | |
Series 2024-A
5.00%, 08/01/2025 | | | 2,000 | | | | 2,028,157 | |
City of Rochester NY
Series 2024-I
5.00%, 07/31/2025 | | | 2,000 | | | | 2,025,858 | |
Metropolitan Transportation Authority
Series 2017
5.00%, 11/15/2025 | | | 2,000 | | | | 2,036,237 | |
5.00%, 11/15/2028 | | | 2,000 | | | | 2,156,646 | |
Series 2017-C
5.00%, 11/15/2025 | | | 630 | | | | 641,415 | |
5.00%, 11/15/2029 | | | 1,000 | | | | 1,061,809 | |
New York City Municipal Water Finance Authority
Series 2018-E
5.00%, 06/15/2032 | | | 1,410 | | | | 1,436,279 | |
New York City Municipal Water Finance Authority
(Pre-refunded – US Treasuries)
Series 2015-G
5.00%, 06/15/2027 | | | 4,000 | | | | 4,042,454 | |
New York City Transitional Finance Authority Future Tax Secured Revenue
Series 2015
5.00%, 02/01/2033 | | | 2,625 | | | | 2,632,477 | |
Series 2016-F
4.00%, 02/01/2034 | | | 2,000 | | | | 2,012,147 | |
New York State Dormitory Authority
Series 2018
5.00%, 08/01/2028 | | | 1,000 | | | | 1,055,968 | |
Series 2024
5.00%, 11/01/2026 | | | 900 | | | | 926,662 | |
5.00%, 10/01/2029 | | | 750 | | | | 802,891 | |
| | |
| |
| abfunds.com | | AB TAX-AWARE SHORT DURATION MUNICIPAL ETF | 19 |
PORTFOLIO OF INVESTMENTS (continued)
| | | | | | | | |
| | | Principal
Amount
(000) | | | U.S. $ Value | |
| |
New York State Dormitory Authority
(New York State Dormitory Authority Lease)
Series 2018
5.00%, 10/01/2031 | | $ | 1,765 | | | $ | 1,822,110 | |
New York State Dormitory Authority
(Pre-refunded – US Treasuries)
Series 2014
5.00%, 07/01/2030 | | | 1,000 | | | | 1,001,513 | |
New York State Energy Research & Development Authority
Series 2018
3.00%, 08/01/2032 | | | 1,000 | | | | 998,137 | |
New York State Environmental Facilities Corp.
(New York City Municipal Water Finance Authority)
Series 2020
2.75%, 09/01/2050 | | | 1,500 | | | | 1,487,710 | |
New York State Urban Development Corp.
(Pre-refunded – US Treasuries)
Series 2015-A
5.00%, 03/15/2026 | | | 1,000 | | | | 1,017,228 | |
New York Transportation Development Corp.
(JFK International Air Terminal LLC)
Series 2020
5.00%, 12/01/2031 | | | 1,000 | | | | 1,069,196 | |
Series 2022
5.00%, 12/01/2030 | | | 2,000 | | | | 2,144,889 | |
Port Authority of New York & New Jersey
Series 2016
5.00%, 10/01/2025 | | | 1,000 | | | | 1,012,106 | |
Series 2018-2
5.00%, 09/15/2029 | | | 1,530 | | | | 1,597,722 | |
5.00%, 09/15/2030 | | | 2,500 | | | | 2,610,097 | |
5.00%, 09/15/2031 | | | 1,075 | | | | 1,119,813 | |
Series 2021-2
3.00%, 10/01/2028 | | | 3,950 | | | | 3,861,035 | |
5.00%, 07/15/2027 | | | 2,445 | | | | 2,550,358 | |
Suffolk Regional Off-Track Betting Co.
Series 2024
5.00%, 12/01/2034 | | | 1,500 | | | | 1,562,691 | |
Triborough Bridge & Tunnel Authority
Series 2017-B
5.00%, 11/15/2033 | | | 1,205 | | | | 1,260,758 | |
Troy Capital Resource Corp.
Series 2015
5.00%, 08/01/2025 | | | 1,000 | | | | 1,010,922 | |
| | | | | | | | |
| | | | | | | 50,506,403 | |
| | | | | | | | |
| | |
| |
20 | AB TAX-AWARE SHORT DURATION MUNICIPAL ETF | | abfunds.com |
PORTFOLIO OF INVESTMENTS (continued)
| | | | | | | | |
| | | Principal
Amount
(000) | | | U.S. $ Value | |
| |
North Carolina – 1.2% | |
County of Gaston NC
Series 2023
4.00%, 05/01/2025 | | $ | 2,600 | | | $ | 2,602,923 | |
County of New Hanover NC
Series 2018
5.00%, 09/01/2026 | | | 1,010 | | | | 1,050,013 | |
County of Wake NC
Series 2021
5.00%, 04/01/2025 | | | 1,000 | | | | 1,006,891 | |
North Carolina Department of Transportation
Series 2015
5.00%, 12/31/2037 | | | 1,405 | | | | 1,409,981 | |
State of North Carolina
Series 2013-B
5.00%, 06/01/2025 | | | 1,000 | | | | 1,010,392 | |
State of North Carolina
(State of North Carolina Lease)
Series 2014-C
3.00%, 05/01/2028 | | | 1,000 | | | | 999,973 | |
| | | | | | | | |
| | | | | | | 8,080,173 | |
| | | | | | | | |
Ohio – 2.6% | |
American Municipal Power, Inc.
(American Municipal Power Combined Hydroelectric Revenue)
Series 2020
5.00%, 02/15/2026 | | | 1,035 | | | | 1,059,707 | |
Buckeye Tobacco Settlement Financing Authority
Series 2020-A
5.00%, 06/01/2028 | | | 1,425 | | | | 1,500,069 | |
Jefferson County Port Authority/OH
(JSW Steel USA Ohio, Inc.)
Series 2023
5.00%, 12/01/2053(c) | | | 1,000 | | | | 1,026,141 | |
Lancaster Port Authority
(Royal Bank of Canada)
Series 2024-A
5.00%, 02/01/2055 | | | 1,000 | | | | 1,072,084 | |
Ohio Air Quality Development Authority
(American Electric Power Co., Inc.)
Series 2019
2.40%, 12/01/2038 | | | 500 | | | | 466,419 | |
Series 2024
3.70%, 07/01/2028 | | | 4,000 | | | | 3,975,698 | |
Ohio Higher Educational Facility Commission
Series 2024
5.00%, 05/01/2033 | | | 650 | | | | 717,843 | |
| | |
| |
| abfunds.com | | AB TAX-AWARE SHORT DURATION MUNICIPAL ETF | 21 |
PORTFOLIO OF INVESTMENTS (continued)
| | | | | | | | |
| | | Principal
Amount
(000) | | | U.S. $ Value | |
| |
Ohio Water Development Authority Water Pollution Control Loan Fund
Series 2016
5.00%, 06/01/2025 | | $ | 4,915 | | | $ | 4,964,618 | |
Reynoldsburg City School District
Series 2013
4.919%, 09/01/2030 | | | 800 | | | | 822,017 | |
State of Ohio
(University Hospitals Health System, Inc. Obligated Group)
Series 2016
5.00%, 01/15/2030 | | | 1,090 | | | | 1,110,440 | |
| | | | | | | | |
| | | | | | | 16,715,036 | |
| | | | | | | | |
Oklahoma – 0.5% | |
Oklahoma Development Finance Authority
(OU Medicine Obligated Group)
Series 2018-B
5.00%, 08/15/2029 | | | 1,000 | | | | 1,040,983 | |
Oklahoma Municipal Power Authority
Series 2014-B
5.00%, 01/01/2025 | | | 1,000 | | | | 1,001,124 | |
Oklahoma Turnpike Authority
Series 2017-D
5.00%, 01/01/2025 | | | 1,090 | | | | 1,091,520 | |
| | | | | | | | |
| | | | | | | 3,133,627 | |
| | | | | | | | |
Oregon – 0.7% | |
Medford Hospital Facilities Authority
(Asante Health System Obligated Group) Series 2020-A
5.00%, 08/15/2027 | | | 1,000 | | | | 1,049,427 | |
Port of Portland OR Airport Revenue
Series 2022-2
5.00%, 07/01/2030 | | | 1,000 | | | | 1,078,483 | |
Port of Portland OR Airport Revenue
(Portland Intl Airport)
Series 2017-2
5.00%, 07/01/2029 | | | 1,000 | | | | 1,029,079 | |
5.00%, 07/01/2031 | | | 1,100 | | | | 1,130,524 | |
| | | | | | | | |
| | | | | | | 4,287,513 | |
| | | | | | | | |
Pennsylvania – 5.1% | |
Allegheny County Hospital Development Authority (UPMC Obligated Group)
Series 2022
3.56% (MUNIPSA + 0.70%), 11/15/2047(b) | | | 1,000 | | | | 991,651 | |
| | |
| |
22 | AB TAX-AWARE SHORT DURATION MUNICIPAL ETF | | abfunds.com |
PORTFOLIO OF INVESTMENTS (continued)
| | | | | | | | |
| | | Principal
Amount
(000) | | | U.S. $ Value | |
| |
Bucks County Industrial Development Authority
(Grand View Hospital/Sellersville PA Obligated Group)
Series 2021
5.00%, 07/01/2032 | | $ | 500 | | | $ | 534,333 | |
City of Philadelphia PA Airport Revenue
Series 2020-C
5.00%, 07/01/2030 | | | 1,220 | | | | 1,312,541 | |
Series 2021
5.00%, 07/01/2025 | | | 945 | | | | 953,416 | |
Commonwealth of Pennsylvania
Series 2017
5.00%, 01/01/2025 | | | 4,580 | | | | 4,587,290 | |
AGM Series 2018
4.00%, 03/01/2034 | | | 1,000 | | | | 1,027,881 | |
County of Allegheny PA
Series 2016-C
5.00%, 11/01/2025 | | | 4,400 | | | | 4,480,162 | |
General Authority of Southcentral Pennsylvania
Series 2015
5.00%, 12/01/2027 | | | 1,275 | | | | 1,290,423 | |
Montgomery County Higher Education and Health Authority
(Thomas Jefferson University Obligated
Group)
Series 2018
5.00%, 09/01/2030 | | | 1,000 | | | | 1,056,089 | |
5.00%, 09/01/2031 | | | 1,500 | | | | 1,582,354 | |
Montgomery County Industrial Development Authority/PA
(Pre-refunded – US Treasuries)
Series 2015
5.25%, 01/15/2045 | | | 2,000 | | | | 2,004,155 | |
Pennsylvania Economic Development Financing Authority
Series 2020
4.00%, 01/01/2026 | | | 1,220 | | | | 1,227,152 | |
Pennsylvania Economic Development Financing Authority
(Commonwealth of Pennsylvania Department of Transportation)
Series 2022
5.00%, 12/31/2032 | | | 2,000 | | | | 2,162,222 | |
Pennsylvania Turnpike Commission
Series 2019
5.00%, 12/01/2024 | | | 1,000 | | | | 1,000,000 | |
| | |
| |
| abfunds.com | | AB TAX-AWARE SHORT DURATION MUNICIPAL ETF | 23 |
PORTFOLIO OF INVESTMENTS (continued)
| | | | | | | | |
| | | Principal
Amount
(000) | | | U.S. $ Value | |
| |
Pennsylvania Turnpike Commission Registration Fee Revenue
Series 2023
4.03% (MUNIPSA + 0.85%), 07/15/2041(b) | | $ | 1,000 | | | $ | 1,000,282 | |
Philadelphia Authority for Industrial Development
(Temple University-of The Commonwealth System of Higher Education)
Series 2015-2
5.00%, 04/01/2029 | | | 1,375 | | | | 1,382,512 | |
Series 2016-2
5.00%, 04/01/2028 | | | 1,550 | | | | 1,558,828 | |
Philadelphia Gas Works Co
Series 2015
5.00%, 08/01/2025 | | | 1,900 | | | | 1,923,244 | |
Philadelphia Municipal Authority
(City of Philadelphia PA)
Series 2017
5.00%, 04/01/2025 | | | 1,325 | | | | 1,331,054 | |
Reading School District
BAM Series 2019-D
5.00%, 04/01/2025 | | | 1,500 | | | | 1,509,040 | |
| | | | | | | | |
| | | | | | | 32,914,629 | |
| | | | | | | | |
Puerto Rico – 0.7% | |
Commonwealth of Puerto Rico
Series 2021-A
5.625%, 07/01/2027 | | | 1,108 | | | | 1,159,211 | |
5.625%, 07/01/2029 | | | 675 | | | | 728,224 | |
Puerto Rico Commonwealth Aqueduct & Sewer Authority
Series 2020-A
5.00%, 07/01/2030(c) | | | 1,000 | | | | 1,060,115 | |
Series 2021-C
3.75%, 07/01/2027(c) | | | 2,000 | | | | 1,877,999 | |
| | | | | | | | |
| | | | | | | 4,825,549 | |
| | | | | | | | |
South Carolina – 2.1% | |
Clover School District No. 2
Series 2024
5.00%, 10/01/2025 | | | 4,000 | | | | 4,068,937 | |
Orangeburg County School District
Series 2024
5.00%, 08/13/2025 | | | 2,000 | | | | 2,026,137 | |
SCAGO Educational Facilities Corp. for Pickens School District
(Pickens County School District/SC)
Series 2015
5.00%, 12/01/2030 | | | 1,000 | | | | 1,007,157 | |
| | |
| |
24 | AB TAX-AWARE SHORT DURATION MUNICIPAL ETF | | abfunds.com |
PORTFOLIO OF INVESTMENTS (continued)
| | | | | | | | |
| | | Principal
Amount
(000) | | | U.S. $ Value | |
| |
SCAGO Educational Facilities Corp. for Pickens School District
(SCAGO Educational Facilities Corp. for Pickens School District Lease)
Series 2015
5.00%, 12/01/2029 | | $ | 1,500 | | | $ | 1,510,950 | |
South Carolina Jobs-Economic Development Authority
(Novant Health Obligated Group)
Series 2024
5.00%, 11/01/2031 | | | 2,000 | | | | 2,249,302 | |
South Carolina Public Service Authority
Series 2016-A
5.00%, 12/01/2034 | | | 1,500 | | | | 1,535,975 | |
AGM Series 2014-C
5.00%, 12/01/2025 | | | 1,500 | | | | 1,501,019 | |
| | | | | | | | |
| | | | | | | 13,899,477 | |
| | | | | | | | |
Tennessee – 0.8% | |
Metropolitan Government Nashville & Davidson County Health & Educational Facilities Board
(Vanderbilt University Medical Center Obligated Group)
Series 2023
5.00%, 07/01/2028 | | | 1,000 | | | | 1,070,180 | |
Metropolitan Nashville Airport Authority (The)
Series 2019-B
5.00%, 07/01/2030 | | | 1,000 | | | | 1,071,662 | |
State of Tennessee
Series 2016-B
5.00%, 08/01/2025 | | | 1,015 | | | | 1,029,163 | |
Tennessee Energy Acquisition Corp.
(Goldman Sachs Group, Inc. (The))
Series 2023-A
5.00%, 05/01/2053 | | | 2,000 | | | | 2,082,034 | |
| | | | | | | | |
| | | | | | | 5,253,039 | |
| | | | | | | | |
Texas – 4.7% | |
Central Texas Regional Mobility Authority | | | | | | | | |
Series 2016
5.00%, 01/01/2028 | | | 1,065 | | | | 1,082,978 | |
Series 2020-F
5.00%, 01/01/2025 | | | 1,315 | | | | 1,317,380 | |
City of San Antonio TX
Series 2023
5.00%, 02/01/2025 | | | 1,000 | | | | 1,003,155 | |
City of San Antonio TX Airport System
Series 2019-A
5.00%, 07/01/2029 | | | 550 | | | | 583,987 | |
| | |
| |
| abfunds.com | | AB TAX-AWARE SHORT DURATION MUNICIPAL ETF | 25 |
PORTFOLIO OF INVESTMENTS (continued)
| | | | | | | | |
| | | Principal
Amount
(000) | | | U.S. $ Value | |
| |
Crowley Independent School District
(Pre-refunded – US Govt Agencies)
Series 2016-B
4.00%, 08/01/2037 | | $ | 1,855 | | | $ | 1,867,104 | |
Harris County Cultural Education Facilities Finance Corp
(Memorial Hermann Health System Obligated Group)
Series 2024
5.00%, 07/01/2054 | | | 3,000 | | | | 3,234,757 | |
Irving Hospital Authority
(Baylor Medical Center at Irving)
Series 2017-A
5.00%, 10/15/2033 | | | 1,000 | | | | 1,017,480 | |
McKinney Independent School District
Series 2024
5.00%, 02/15/2025 | | | 2,000 | | | | 2,007,927 | |
North Texas Tollway Authority
Series 2016-A
5.00%, 01/01/2028 | | | 1,000 | | | | 1,020,004 | |
North Texas Tollway Authority
(North Texas Tollway System)
Series 2014-A
5.00%, 01/01/2025 | | | 1,000 | | | | 1,001,206 | |
Port of Beaumont Navigation District
(Jefferson 2020 Bond Lessee & Borrower LLC Obligated Group)
Series 2024
10.00%, 07/01/2026(c) | | | 1,000 | | | | 1,021,975 | |
Rockwall Independent School District
(Pre-refunded – US Govt Agencies)
Series 2016
5.00%, 02/15/2041 | | | 1,850 | | | | 1,856,701 | |
Texas Municipal Gas Acquisition & Supply Corp. II (JPMorgan Chase & Co.)
Series 2012-C
4.117% (CME Term SOFR 3 Month + 0.86%), 09/15/2027(b) | | | 2,390 | | | | 2,389,854 | |
Texas Municipal Gas Acquisition & Supply Corp. III
(Macquarie Group Ltd.)
Series 2021
5.00%, 12/15/2032 | | | 2,000 | | | | 2,163,263 | |
Texas Municipal Gas Acquisition & Supply Corp. IV
(BP PLC)
Series 2023-A
5.50%, 01/01/2054 | | | 4,000 | | | | 4,328,432 | |
| | |
| |
26 | AB TAX-AWARE SHORT DURATION MUNICIPAL ETF | | abfunds.com |
PORTFOLIO OF INVESTMENTS (continued)
| | | | | | | | |
| | | Principal
Amount
(000) | | | U.S. $ Value | |
| |
Series 2023-B
5.50%, 01/01/2054 | | $ | 1,500 | | | $ | 1,688,501 | |
Texas Private Activity Bond Surface Transportation Corp.
(NTE Mobility Partners LLC)
Series 2019
5.00%, 12/31/2030 | | | 1,000 | | | | 1,076,498 | |
Texas Water Development Board
Series 2023-A
5.00%, 10/15/2026 | | | 1,000 | | | | 1,041,268 | |
Texas Water Development Board
(Texas Water Development Board State Revolving Fund)
Series 2018
5.00%, 08/01/2025 | | | 1,000 | | | | 1,013,225 | |
| | | | | | | | |
| | | | | | | 30,715,695 | |
| | | | | | | | |
Utah – 0.9% | |
Grapevine Wash Local District
(Grapevine Wash Local District Assessment
Area No. 1)
Series 2024-A
5.25%, 12/01/2044(c) | | | 1,000 | | | | 986,579 | |
Utah Board of Higher Education
(University of Utah (The))
NATL Series 1998
5.50%, 04/01/2029 | | | 1,440 | | | | 1,535,692 | |
Utah Infrastructure Agency
Series 2017-A
5.00%, 10/15/2029 | | | 1,000 | | | | 1,034,608 | |
Series 2022
5.00%, 10/15/2032 | | | 1,135 | | | | 1,213,454 | |
Series 2024
5.00%, 10/15/2026 | | | 440 | | | | 450,599 | |
Utah Transit Authority
(Pre-refunded – US Treasuries)
Series 2015-A
4.00%, 06/15/2033 | | | 1,000 | | | | 1,005,708 | |
| | | | | | | | |
| | | | | | | 6,226,640 | |
| | | | | | | | |
Virginia – 0.8% | |
County of Fairfax
Series 2021-A
4.00%, 10/01/2025 | | | 1,245 | | | | 1,255,776 | |
Greater Richmond Convention Center Authority
(Greater Richmond Convention Center Authority Hotel Occupancy Tax)
Series 2015
5.00%, 06/15/2025 | | | 1,800 | | | | 1,817,574 | |
| | |
| |
| abfunds.com | | AB TAX-AWARE SHORT DURATION MUNICIPAL ETF | 27 |
PORTFOLIO OF INVESTMENTS (continued)
| | | | | | | | |
| | | Principal
Amount
(000) | | | U.S. $ Value | |
| |
Virginia College Building Authority
(Commonwealth of Virginia State Lease)
Series 2022
5.00%, 02/01/2025 | | $ | 1,000 | | | $ | 1,003,086 | |
Virginia College Building Authority
(Marymount University)
Series 2015
5.25%, 07/01/2030(c) | | | 1,000 | | | | 961,617 | |
| | | | | | | | |
| | | | | | | 5,038,053 | |
| | | | | | | | |
Washington – 2.6% | |
Energy Northwest
Series 2024-B
5.00%, 07/01/2025 | | | 1,000 | | | | 1,011,726 | |
Pierce County School District No. 10 Tacoma
(Pre-refunded – US Govt Agencies)
Series 2015
5.00%, 12/01/2033 | | | 2,190 | | | | 2,233,625 | |
Port of Seattle WA
Series 2017-C
5.00%, 05/01/2028 | | | 1,260 | | | | 1,303,906 | |
Series 2018-A
5.00%, 05/01/2030 | | | 2,185 | | | | 2,254,486 | |
5.00%, 05/01/2036 | | | 1,010 | | | | 1,032,728 | |
Series 2018-B
5.00%, 05/01/2027 | | | 1,000 | | | | 1,038,110 | |
Snohomish County School District No. 13 Monroe
Series 2015
5.00%, 12/01/2032 | | | 1,000 | | | | 1,008,911 | |
State of Washington
Series 2024-R
5.00%, 07/01/2025 | | | 2,000 | | | | 2,023,800 | |
State of Washington
(Pre-refunded – US Treasuries)
Series 2014-R
5.00%, 07/01/2028 | | | 1,500 | | | | 1,502,168 | |
Tacoma Metropolitan Park District
Series 2014-B
5.00%, 12/01/2024 | | | 1,610 | | | | 1,610,000 | |
Series 2015
5.00%, 12/01/2024 | | | 1,720 | | | | 1,720,000 | |
| | | | | | | | |
| | | | | | | 16,739,460 | |
| | | | | | | | |
West Virginia – 1.3% | |
Tobacco Settlement Finance Authority/WV
Series 2020
4.875%, 06/01/2049 | | | 295 | | | | 283,274 | |
| | |
| |
28 | AB TAX-AWARE SHORT DURATION MUNICIPAL ETF | | abfunds.com |
PORTFOLIO OF INVESTMENTS (continued)
| | | | | | | | |
| | | Principal
Amount
(000) | | | U.S. $ Value | |
| |
West Virginia Economic Development Authority
(Appalachian Power Co.)
Series 2024
3.375%, 03/01/2040 | | $ | 3,000 | | | $ | 2,986,887 | |
West Virginia Economic Development Authority
(Arch Resources, Inc.)
Series 2021
4.125%, 07/01/2045 | | | 1,250 | | | | 1,250,396 | |
West Virginia Economic Development Authority
(Provident Group – Marshall Properties LLC)
AGM Series
2023 5.00%, 07/01/2030 | | | 2,665 | | | | 2,913,714 | |
West Virginia Hospital Finance Authority
(West Virginia United Health System Obligated Group)
Series 2016A
5.00%, 06/01/2025 | | | 1,360 | | | | 1,370,782 | |
| | | | | | | | |
| | | | | | | 8,805,053 | |
| | | | | | | | |
Wisconsin – 2.3% | |
City of Milwaukee
AGM Series 2023-N
5.00%, 04/01/2028 | | | 1,690 | | | | 1,801,512 | |
City of Milwaukee WI
Series 2020-N
5.00%, 04/01/2027 | | | 1,000 | | | | 1,042,176 | |
AGM Series 2023
5.00%, 04/01/2031 | | | 1,000 | | | | 1,115,651 | |
City of Milwaukee WI Sewerage System Revenue
Series 2016-S
4.00%, 06/01/2028 | | | 350 | | | | 354,222 | |
State of Wisconsin
Series 2021-2
5.00%, 05/01/2025 | | | 1,730 | | | | 1,744,438 | |
Wisconsin Health & Educational Facilities Authority
(Forensic Science & Protective Medicine Collaboration, Inc.)
Series 2024
5.00%, 08/01/2027(c) | | | 2,000 | | | | 2,042,865 | |
Wisconsin Public Finance Authority
(Alpha Ranch Water Control & Improvement District of Denton & Wise Counties)
Series 2024
Zero Coupon, 12/15/2038(a)(c) | | | 2,000 | | | | 870,116 | |
Wisconsin Public Finance Authority
(North San Gabriel Municipal Utility District No. 1)
Series 2023
Zero Coupon, 09/01/2029(c) | | | 2,000 | | | | 1,433,559 | |
| | |
| |
| abfunds.com | | AB TAX-AWARE SHORT DURATION MUNICIPAL ETF | 29 |
PORTFOLIO OF INVESTMENTS (continued)
| | | | | | | | |
| | | Principal
Amount
(000) | | | U.S. $ Value | |
| |
Wisconsin Public Finance Authority
(Renown Regional Medical Center Obligated Group)
Series 2020
5.00%, 06/01/2029 | | $ | 755 | | | $ | 806,706 | |
Wisconsin Public Finance Authority
(Signorelli Projects)
Series 2024
5.375%, 12/15/2032(c) | | | 2,000 | | | | 2,003,021 | |
Wisconsin Public Finance Authority
(Southeastern Regional Medical Center Obligated Group)
Series 2022
5.00%, 02/01/2030 | | | 1,000 | | | | 1,000,341 | |
Wisconsin Public Finance Authority
(Waterstone Projects)
Series 2024
5.50%, 12/15/2038(c) | | | 1,000 | | | | 1,005,761 | |
| | | | | | | | |
| | | | | | | 15,220,368 | |
| | | | | | | | |
Total Long-Term Municipal Bonds
(cost $621,524,181) | | | | | | | 625,536,479 | |
| | | | | | | | |
| | | | | | | | |
Short-Term Municipal Notes – 1.7% | | | | | | | | |
California – 0.5% | | | | | | | | |
California Statewide Communities Development Authority
Series 2018
1.80%, 08/15/2047(e) | | | 2,195 | | | | 2,195,000 | |
Nuveen California AMT-Free Quality Municipal Income Fund
Series 2017
3.31%, 10/01/2047(c)(e) | | | 1,000 | | | | 1,000,000 | |
| | | | | | | | |
| | | | | | | 3,195,000 | |
| | | | | | | | |
Colorado – 0.3% | | | | | | | | |
Colorado Educational & Cultural Facilities Authority | | | | | | | | |
Series 2008
3.25%, 02/01/2038(e) | | | 1,190 | | | | 1,190,000 | |
Series 2012
3.25%, 01/01/2039(e) | | | 500 | | | | 500,000 | |
| | | | | | | | |
| | | | | | | 1,690,000 | |
| | | | | | | | |
Indiana – 0.1% | | | | | | | | |
Indiana Finance Authority
(Parkview Health System Obligated Group) | | | | | | | | |
Series 2009-D
3.15%, 11/01/2039(e) | | | 1,000 | | | | 1,000,000 | |
| | | | | | | | |
| | |
| |
30 | AB TAX-AWARE SHORT DURATION MUNICIPAL ETF | | abfunds.com |
PORTFOLIO OF INVESTMENTS (continued)
| | | | | | | | |
| | | Principal
Amount
(000) | | | U.S. $ Value | |
| |
Missouri – 0.0% | | | | | | | | |
Health & Educational Facilities Authority of the State of Missouri
Series 2013-B
3.20%, 10/01/2035(e) | | $ | 250 | | | $ | 250,000 | |
| | | | | | | | |
| | |
Other – 0.3% | | | | | | | | |
Nuveen AMT-Free Municipal Credit Income Fund
Series 2019
3.31%, 03/01/2029(e) | | | 1,000 | | | | 1,000,000 | |
Nuveen AMT-Free Quality Municipal Income Fund
Series 2021
3.31%, 03/01/2029(e) | | | 1,000 | | | | 1,000,000 | |
| | | | | | | | |
| | | | | | | 2,000,000 | |
| | | | | | | | |
Pennsylvania – 0.1% | |
Delaware Valley Regional Finance Authority
Series 2024-B
3.15%, 09/01/2059(e) | | | 470 | | | | 470,000 | |
| | | | | | | | |
| | |
Tennessee – 0.1% | | | | | | | | |
Greeneville Health & Educational Facilities Board
(Ballad Health Obligated Group)
Series 2018-B
2.80%, 07/01/2045(e) | | | 700 | | | | 700,000 | |
| | | | | | | | |
| | |
Virginia – 0.3% | | | | | | | | |
Roanoke Economic Development Authority
(Carilion Clinic Obligated Group)
Series 2020
2.95%, 07/01/2052(e) | | | 2,000 | | | | 2,000,000 | |
| | | | | | | | |
| | |
Total Short-Term Municipal Notes
(cost $11,305,000) | | | | | | | 11,305,000 | |
| | | | | | | | |
| | |
Total Municipal Obligations
(cost $632,829,181) | | | | | | | 636,841,479 | |
| | | | | | | | |
| | | | | | | | |
CORPORATES - INVESTMENT GRADE – 0.4% | | | | | | | | |
Financial Institutions – 0.2% | | | | | | | | |
Banking – 0.2% | | | | | | | | |
Citigroup, Inc.
Series AA
7.625%, 11/15/2028(f) | | | 184 | | | | 194,968 | |
UBS AG/Stamford CT
7.95%, 01/09/2025 | | | 850 | | | | 852,338 | |
| | |
| |
| abfunds.com | | AB TAX-AWARE SHORT DURATION MUNICIPAL ETF | 31 |
PORTFOLIO OF INVESTMENTS (continued)
| | | | | | | | |
| | | Principal
Amount
(000) | | | U.S. $ Value | |
| |
Wells Fargo & Co.
7.625%, 09/15/2028(f) | | $ | 27 | | | $ | 28,848 | |
| | | | | | | | |
| | | | | | | 1,076,154 | |
| | | | | | | | |
Finance – 0.0% | | | | | | | | |
Aviation Capital Group LLC
1.95%, 01/30/2026(c) | | | 290 | | | | 279,963 | |
| | | | | | | | |
| | |
Industrial – 0.2% | | | | | | | | |
Consumer Non-Cyclical – 0.1% | | | | | | | | |
Altria Group, Inc.
3.40%, 05/06/2030 | | | 215 | | | | 200,221 | |
BAT Capital Corp.
4.906%, 04/02/2030 | | | 230 | | | | 229,864 | |
Philip Morris International, Inc.
5.625%, 11/17/2029 | | | 250 | | | | 260,387 | |
| | | | | | | | |
| | | | | | | 690,472 | |
| | | | | | | | |
Technology – 0.1% | | | | | | | | |
CDW LLC/CDW Finance Corp.
2.67%, 12/01/2026 | | | 370 | | | | 353,687 | |
| | | | | | | | |
| | | | | | | 1,044,159 | |
| | | | | | | | |
Total Corporates - Investment Grade
(cost $2,356,488) | | | | | | | 2,400,276 | |
| | | | | | | | |
| | | | | | | | |
COLLATERALIZED MORTGAGE OBLIGATIONS – 0.3% | | | | | | | | |
Risk Share Floating Rate – 0.3% | | | | | | | | |
Connecticut Avenue Securities Trust
Series 2024-R03, Class 2M1
5.875% (CME Term SOFR + 1.15%), 03/25/2044(b)(c) | | | 1,145 | | | | 1,144,645 | |
Federal Home Loan Mortgage Corp. Structured Agency Credit Risk Debt Notes
Series 2023-DNA1, Class M1A
6.825% (CME Term SOFR + 2.10%), 03/25/2043(b)(c) | | | 709 | | | | 719,317 | |
Series 2023-DNA2, Class M1A
6.825% (CME Term SOFR + 2.10%), 04/25/2043(b)(c) | | | 366 | | | | 373,417 | |
| | | | | | | | |
| | |
Total Collateralized Mortgage Obligations
(cost $2,219,562) | | | | | | | 2,237,379 | |
| | | | | | | | |
| | | | | | | | |
ASSET-BACKED SECURITIES – 0.3% | | | | | | | | |
Autos - Fixed Rate – 0.1% | | | | | | | | |
Arivo Acceptance Auto Loan Receivables Trust Series 2024-1A, Class A
6.46%, 04/17/2028(c) | | | 208 | | | | 209,971 | |
| | |
| |
32 | AB TAX-AWARE SHORT DURATION MUNICIPAL ETF | | abfunds.com |
PORTFOLIO OF INVESTMENTS (continued)
| | | | | | | | |
| | | Principal
Amount
(000) | | | U.S. $ Value | |
| |
Carvana Auto Receivables Trust
Series 2023-N1, Class A
6.36%, 04/12/2027(c) | | $ | 86 | | | $ | 86,186 | |
Lendbuzz Securitization Trust
Series 2023-1A, Class A2
6.92%, 08/15/2028(c) | | | 513 | | | | 521,025 | |
Santander Bank Auto Credit-Linked Notes
Series 2023-A, Class B
6.493%, 06/15/2033(c) | | | 105 | | | | 105,647 | |
| | | | | | | | |
| | | | | | | 922,829 | |
| | | | | | | | |
Other ABS - Fixed Rate – 0.2% | | | | | | | | |
Dext ABS LLC
Series 2023-1, Class A2
5.99%, 03/15/2032(c) | | | 307 | | | | 309,487 | |
Marlette Funding Trust
Series 2024-1A, Class A
5.95%, 07/17/2034(c) | | | 591 | | | | 593,719 | |
Pagaya AI Debt Trust
Series 2023-3, Class A
7.60%, 12/16/2030(c) | | | 217 | | | | 217,699 | |
Series 2024-1, Class A
6.66%, 07/15/2031(c) | | | 53 | | | | 54,084 | |
Theorem Funding Trust
Series 2023-1A, Class A
7.58%, 04/15/2029(c) | | | 35 | | | | 35,201 | |
| | | | | | | | |
| | | | | | | 1,210,190 | |
| | | | | | | | |
| | |
Total Asset-Backed Securities
(cost $2,115,523) | | | | | | | 2,133,019 | |
| | | | | | | | |
| | |
| | | Shares | | | | |
SHORT-TERM INVESTMENTS – 0.0% | | | | | | | | |
Investment Companies – 0.0% | | | | | | | | |
AB Fixed Income Shares, Inc. – Government Money Market Portfolio – Class AB,
4.54%(g)(h)(i)
(cost $138,209) | | | 138,209 | | | | 138,209 | |
| | | | | | | | |
| | |
Total Investments – 98.9%
(cost $639,658,963) | | | | | | | 643,750,362 | |
Other assets less liabilities – 1.1% | | | | | | | 6,843,274 | |
| | | | | | | | |
| | |
Net Assets – 100.0% | | | | | | $ | 650,593,636 | |
| | | | | | | | |
| | |
| |
| abfunds.com | | AB TAX-AWARE SHORT DURATION MUNICIPAL ETF | 33 |
PORTFOLIO OF INVESTMENTS (continued)
CENTRALLY CLEARED INFLATION (CPI) SWAPS (see Note D)
| | | | | | | | | | | | | | | | | | | | | | | | | | | | | | |
| | | | | | | | | Rate Type | | | | | | | | | | | | |
Notional
Amount
(000) | | | Termination
Date | | | Payments
made
by the
Fund | | | Payments
received
by the
Fund | | | Payment
Frequency
Paid/
Received | | Market
Value | | | Upfront
Premiums
Paid
(Received) | | | Unrealized
Appreciation
(Depreciation) | |
| USD | | | 6,580 | | | | 10/15/2028 | | | | CPI# | | | | 2.565% | | | Maturity | | $ | 29,563 | | | $ | – 0 | – | | $ | 29,563 | |
| USD | | | 4,503 | | | | 10/15/2029 | | | | 2.516% | | | | CPI# | | | Maturity | | | (15,754 | ) | | | – 0 | – | | | (15,754 | ) |
| USD | | | 4,499 | | | | 10/15/2029 | | | | 2.451% | | | | CPI# | | | Maturity | | | (2,334 | ) | | | – 0 | – | | | (2,334 | ) |
| USD | | | 4,498 | | | | 10/15/2029 | | | | 2.499% | | | | CPI# | | | Maturity | | | (12,214 | ) | | | – 0 | – | | | (12,214 | ) |
| USD | | | 6,920 | | | | 10/15/2030 | | | | CPI# | | | | 2.531% | | | Maturity | | | 36,772 | | | | – 0 | – | | | 36,772 | |
| | | | | | | | | | | | | | | | | | | | | | | | | | | | | | |
| | | | | | | | | | | | | | | | | | | | $ | 36,033 | | | $ | – 0 | – | | $ | 36,033 | |
| | | | | | | | | | | | | | | | | | | | | | | | | | | | | | |
| # | Variable interest rate based on the rate of inflation as determined by the Consumer Price Index (CPI). |
CENTRALLY CLEARED INTEREST RATE SWAPS (see Note D)
| | | | | | | | | | | | | | | | | | | | | | | | | | | | | | |
| | | | | | | | | Rate Type | | | | | | | | | | | | |
Notional
Amount
(000) | | | Termination
Date | | | Payments
made
by the
Fund | | | Payments
received
by the
Fund | | | Payment
Frequency
Paid/
Received | | Market
Value | | | Upfront
Premiums
Paid
(Received) | | | Unrealized
Appreciation
(Depreciation) | |
| USD | | | 4,800 | | | | 03/31/2025 | | |
| 1 Day
SOFR |
| | | 4.099% | | | Annual | | $ | (43,010 | ) | | $ | – 0 | – | | $ | (43,010 | ) |
| USD | | | 3,700 | | | | 03/31/2025 | | |
| 1 Day
SOFR |
| | | 4.013% | | | Annual | | | (36,375 | ) | | | – 0 | – | | | (36,375 | ) |
| USD | | | 15,700 | | | | 05/15/2026 | | |
| 1 Day
SOFR |
| | | 4.202% | | | Annual | | | (23,147 | ) | | | 160 | | | | (23,307 | ) |
| USD | | | 8,310 | | | | 05/15/2026 | | |
| 1 Day
SOFR |
| | | 4.479% | | | Annual | | | 10,679 | | | | – 0 | – | | | 10,679 | |
| USD | | | 2,400 | | | | 05/15/2026 | | |
| 1 Day
SOFR |
| | | 4.012% | | | Annual | | | (18,837 | ) | | | – 0 | – | | | (18,837 | ) |
| USD | | | 5,600 | | | | 10/15/2029 | | |
| 1 Day
SOFR |
| | | 3.785% | | | Annual | | | 7,297 | | | | – 0 | – | | | 7,297 | |
| USD | | | 2,336 | | | | 10/15/2029 | | |
| 1 Day
SOFR |
| | | 3.814% | | | Annual | | | 6,040 | | | | – 0 | – | | | 6,040 | |
| USD | | | 2,332 | | | | 10/15/2029 | | |
| 1 Day
SOFR |
| | | 3.740% | | | Annual | | | (1,971 | ) | | | – 0 | – | | | (1,971 | ) |
| USD | | | 2,332 | | | | 10/15/2029 | | |
| 1 Day
SOFR |
| | | 3.761% | | | Annual | | | 194 | | | | – 0 | – | | | 194 | |
| USD | | | 2,000 | | | | 04/15/2032 | | | | 3.275% | | |
| 1 Day
SOFR |
| | Annual | | | 78,806 | | | | – 0 | – | | | 78,806 | |
| USD | | | 1,000 | | | | 04/15/2032 | | | | 3.215% | | |
| 1 Day
SOFR |
| | Annual | | | 43,664 | | | | – 0 | – | | | 43,664 | |
| | | | | | | | | | | | | | | | | | | | | | | | | | | | | | |
| | | | | | | | | | | | | | | | | | | | $ | 23,340 | | | $ | 160 | | | $ | 23,180 | |
| | | | | | | | | | | | | | | | | | | | | | | | | | | | | | |
| | |
| |
34 | AB TAX-AWARE SHORT DURATION MUNICIPAL ETF | | abfunds.com |
PORTFOLIO OF INVESTMENTS (continued)
| (a) | When-Issued or delayed delivery security. |
| (b) | Floating Rate Security. Stated interest/floor/ceiling rate was in effect at November 30, 2024. |
| (c) | Security is exempt from registration under Rule 144A or Regulation S of the Securities Act of 1933. These securities are considered restricted, but liquid and may be resold in transactions exempt from registration. At November 30, 2024, the aggregate market value of these securities amounted to $40,009,559 or 6.1% of net assets. |
| (d) | Security is exempt from registration under Rule 144A or Regulation S of the Securities Act of 1933. These securities, which represent 0.31% of net assets as of November 30, 2024, are considered illiquid and restricted. Additional information regarding such securities follows: |
| | | | | | | | | | | | | | | | |
144A/Restricted &
Illiquid Securities | | Acquisition
Date | | | Cost | | | Market
Value | | | Percentage of
Net Assets | |
Indiana Finance Authority
(Parkview Health System Obligated Group)
Series 2024-B
3.916%, 11/01/2046 | | | 06/24/2024 | | | $ | 2,000,000 | | | $ | 2,003,454 | | | | 0.31 | % |
| (e) | Variable Rate Demand Notes are instruments whose interest rates change on a specific date (such as coupon date or interest payment date) or whose interest rates vary with changes in a designated base rate (such as the prime interest rate). This instrument is payable on demand and is secured by letters of credit or other credit support agreements from major banks. |
| (f) | Securities are perpetual and, thus, do not have a predetermined maturity date. The date shown, if applicable, reflects the next call date. |
| (g) | Affiliated investments. |
| (h) | The rate shown represents the 7-day yield as of period end. |
| (i) | To obtain a copy of the fund’s shareholder report, please go to the Securities and Exchange Commission’s website at www.sec.gov, or call AB at (800) 227-4618. |
As of November 30, 2024, the Fund’s percentages of investments in municipal bonds that are insured and in insured municipal bonds that have been pre-refunded or escrowed to maturity are 5.9% and 0.0%, respectively.
Glossary:
ABS – Asset-Backed Securities
AGC – Assured Guaranty Corporation
AGM – Assured Guaranty Municipal
AMBAC – Ambac Assurance Corporation
AMT – Alternative Minimum Tax (subject to)
BAM – Build American Mutual
CHF – Collegiate Housing Foundation
CME – Chicago Mercantile Exchange
COP – Certificate of Participation
ID – Improvement District
MUNIPSA – SIFMA Municipal Swap Index
NATL – National Interstate Corporation
SOFR – Secured Overnight Financing Rate
UPMC – University of Pittsburgh Medical Center
See notes to financial statements.
| | |
| |
| abfunds.com | | AB TAX-AWARE SHORT DURATION MUNICIPAL ETF | 35 |
STATEMENT OF ASSETS & LIABILITIES
November 30, 2024
| | | | |
| Assets | |
Investments in securities, at value | |
Unaffiliated issuers (cost $639,520,754) | | $ | 643,612,153 | |
Affiliated issuers (cost $138,209) | | | 138,209 | |
Cash | | | 443 | |
Cash collateral due from broker | | | 517,650 | |
Interest receivable | | | 9,081,604 | |
Receivable for investment securities sold | | | 670,000 | |
Receivable for variation margin on centrally cleared swaps | | | 38,758 | |
Affiliated dividends receivable | | | 35,092 | |
Receivable due from Adviser | | | 1,586 | |
| | | | |
Total assets | | | 654,095,495 | |
| | | | |
| Liabilities | |
Payable for investment securities purchased | | | 3,361,151 | |
Advisory fee payable | | | 140,708 | |
| | | | |
Total liabilities | | | 3,501,859 | |
| | | | |
Net Assets | | $ | 650,593,636 | |
| | | | |
| Composition of Net Assets | |
Capital stock, at par | | $ | 2,580 | |
Additional paid-in capital | | | 645,193,396 | |
Distributable earnings | | | 5,397,660 | |
| | | | |
| Net Assets | | $ | 650,593,636 | |
| | | | |
Net Asset Value Per Share—500 million shares of capital stock authorized, $.0001 par value (based on 25,802,000 shares outstanding) | | $ | 25.21 | |
| | | | |
See notes to financial statements.
| | |
| |
36 | AB TAX-AWARE SHORT DURATION MUNICIPAL ETF | | abfunds.com |
STATEMENT OF OPERATIONS
Year Ended November 30, 2024
| | | | | | | | |
| Investment Income | | | | | | | | |
Interest | | $ | 18,372,237 | | | | | |
Dividends—Affiliated issuers | | | 283,379 | | | $ | 18,655,616 | |
| | | | | | | | |
| Expenses | | | | | | | | |
Advisory fee (see Note B) | | | 1,340,765 | | | | | |
| | | | | | | | |
Total expenses | | | 1,340,765 | | | | | |
Less: expenses waived and reimbursed by the Adviser (see Note B) | | | (9,464 | ) | | | | |
| | | | | | | | |
Net expenses | | | | | | | 1,331,301 | |
| | | | | | | | |
Net investment income | | | | | | | 17,324,315 | |
| | | | | | | | |
| Realized and Unrealized Gain (Loss) on Investment Transactions | | | | | | | | |
Net realized loss on: | | | | | | | | |
Investment transactions | | | | | | | (184,680 | ) |
Swaps | | | | | | | (921,509 | ) |
Net change in unrealized appreciation (depreciation) of: | | | | | | | | |
Investments | | | | | | | 3,074,661 | |
Swaps | | | | | | | 224,962 | |
| | | | | | | | |
Net gain on investment transactions | | | | | | | 2,193,434 | |
| | | | | | | | |
Net Increase in Net Assets from Operations | | | | | | $ | 19,517,749 | |
| | | | | | | | |
See notes to financial statements.
| | |
| |
| abfunds.com | | AB TAX-AWARE SHORT DURATION MUNICIPAL ETF | 37 |
STATEMENT OF CHANGES IN NET ASSETS
| | | | | | | | |
| | | Year Ended
November 30,
2024 | | | Year Ended
November 30,
2023 | |
| Increase (Decrease) in Net Assets from Operations | | | | | | | | |
Net investment income | | $ | 17,324,315 | | | $ | 5,712,875 | |
Net realized gain (loss) on investment transactions | | | (1,106,189 | ) | | | 43,212 | |
Net change in unrealized appreciation (depreciation) of investments | | | 3,299,623 | | | | 700,702 | |
| | | | | | | | |
Net increase in net assets from operations | | | 19,517,749 | | | | 6,456,789 | |
Distribution to Shareholders | | | (15,573,808 | ) | | | (4,857,398 | ) |
| Transactions in Shares of the Fund | | | | | | | | |
Net increase | | | 356,373,925 | | | | 240,931,240 | |
Other capital | | | 154,521 | | | | 98,627 | |
| | | | | | | | |
Total increase | | | 360,472,387 | | | | 242,629,258 | |
| Net Assets | | | | | | | | |
Beginning of period | | | 290,121,249 | | | | 47,491,991 | |
| | | | | | | | |
End of period | | $ | 650,593,636 | | | $ | 290,121,249 | |
| | | | | | | | |
See notes to financial statements.
| | |
| |
38 | AB TAX-AWARE SHORT DURATION MUNICIPAL ETF | | abfunds.com |
NOTES TO FINANCIAL STATEMENTS
November 30, 2024
NOTE A
Significant Accounting Policies
AB Active ETFs, Inc. (the “Corporation”) is registered under the Investment Company Act of 1940 (the “1940 Act”) as an open-end management investment company. The Corporation, which is a Maryland corporation, operates as a series company comprised of 15 funds currently in operation. Each fund is considered to be a separate entity for financial reporting and tax purposes. This report relates only to the AB Tax-Aware Short Duration Municipal ETF (the “Fund”), a diversified portfolio. The Fund commenced investment operations on September 14, 2022. The financial statements have been prepared in conformity with U.S. generally accepted accounting principles (“U.S. GAAP”), which require management to make certain estimates and assumptions that affect the reported amounts of assets and liabilities in the financial statements and amounts of income and expenses during the reporting period. Actual results could differ from those estimates. The Fund is an investment company under U.S. GAAP and follows the accounting and reporting guidance applicable to investment companies. The following is a summary of significant accounting policies followed by the Fund.
1. Security Valuation
Portfolio securities are valued at market value determined on the basis of market quotations or, if market quotations are not readily available or are unreliable, at “fair value” as determined in accordance with procedures approved by and under the oversight of the Fund’s Board of Directors (the “Board”). Pursuant to these procedures, AllianceBernstein L.P. (the “Adviser”) serves as the Fund’s valuation designee pursuant to Rule 2a-5 of the 1940 Act. In this capacity, the Adviser is responsible, among other things, for making all fair value determinations relating to the Fund’s portfolio investments, subject to the Board’s oversight.
In general, the market values of securities which are readily available and deemed reliable are determined as follows: securities listed on a national securities exchange (other than securities listed on the NASDAQ Stock Market, Inc. (“NASDAQ”)) or on a foreign securities exchange are valued at the last sale price at the close of the exchange or foreign securities exchange. If there has been no sale on such day, the securities are valued at the last traded price from the previous day. Securities listed on more than one exchange are valued by reference to the principal exchange on which the securities are traded; securities listed only on NASDAQ are valued in accordance with the NASDAQ Official Closing Price; listed or over the counter (“OTC”) market put or call options are valued at the mid level between the current bid and ask prices. If either a current bid or current ask price is unavailable, the Adviser will have discretion to determine the
| | |
| |
| abfunds.com | | AB TAX-AWARE SHORT DURATION MUNICIPAL ETF | 39 |
NOTES TO FINANCIAL STATEMENTS (continued)
best valuation (e.g., last trade price in the case of listed options); open futures are valued using the closing settlement price or, in the absence of such a price, the most recent quoted bid price. If there are no quotations available for the day of valuation, the last available closing settlement price is used; U.S. Government securities and any other debt instruments having 60 days or less remaining until maturity are generally valued at fair value by an independent pricing service. If an independent fair value price is not available, the securities are valued at amortized cost. This methodology is commonly used for short term securities that have an original maturity of 60 days or less, as well as short term securities that had an original term to maturity that exceeded 60 days. In instances when amortized cost is utilized, the Valuation Committee (the “Committee”) must reasonably conclude that the utilization of amortized cost is approximately the same as the fair value of the security. Factors the Committee will consider include, but are not limited to, an impairment of the creditworthiness of the issuer or material changes in interest rates. Fixed-income securities, including mortgage-backed and asset-backed securities, may be valued on the basis of prices provided by a pricing service or at a price obtained from one or more of the major broker-dealers. In cases where broker-dealer quotes are obtained, the Adviser may establish procedures whereby changes in market yields or spreads are used to adjust, on a daily basis, a recently obtained quoted price on a security. Swaps and other derivatives are valued daily, primarily using independent pricing services, independent pricing models using market inputs, as well as third party broker-dealers or counterparties. Open-end mutual funds are valued at the closing net asset value (“NAV”) per share, while exchange-traded funds are valued at the closing market price per share.
Securities for which market quotations are not readily available (including restricted securities) or are deemed unreliable are valued at fair value as deemed appropriate by the Adviser. Factors considered in making this determination may include, but are not limited to, information obtained by contacting the issuer, analysts, analysis of the issuer’s financial statements or other available documents. In addition, the Fund may use fair value pricing for securities primarily traded in non-U.S. markets because most foreign markets close well before the Fund values its securities at 4:00 p.m., Eastern Time. The earlier close of these foreign markets gives rise to the possibility that significant events may have occurred in the interim and may materially affect the value of those securities. To account for this, the Fund may value foreign equity securities using fair value prices at the discretion of the Adviser.
2. Fair Value Measurements
In accordance with U.S. GAAP regarding fair value measurements, fair value is defined as the price that the Fund would receive to sell an asset or
| | |
| |
40 | AB TAX-AWARE SHORT DURATION MUNICIPAL ETF | | abfunds.com |
NOTES TO FINANCIAL STATEMENTS (continued)
pay to transfer a liability in an orderly transaction between market participants at the measurement date. U.S. GAAP establishes a framework for measuring fair value, and a three-level hierarchy for fair value measurements based upon the transparency of inputs to the valuation of an asset or liability (including those valued based on their market values as described in Note A.1 above). Inputs may be observable or unobservable and refer broadly to the assumptions that market participants would use in pricing the asset or liability. Observable inputs reflect the assumptions market participants would use in pricing the asset or liability based on market data obtained from sources independent of the Fund. Unobservable inputs reflect the Fund’s own assumptions about the assumptions that market participants would use in pricing the asset or liability based on the best information available in the circumstances. Each investment is assigned a level based upon the observability of the inputs which are significant to the overall valuation. The three-tier hierarchy of inputs is summarized below.
| | • | | Level 1—quoted prices in active markets for identical investments |
| | • | | Level 2—other significant observable inputs (including quoted prices for similar investments, interest rates, prepayment speeds, credit risk, etc.) |
| | • | | Level 3—significant unobservable inputs (including the Fund’s own assumptions in determining the fair value of investments) |
The fair value of debt instruments, such as bonds, and over-the-counter derivatives is generally based on market price quotations, recently executed market transactions (where observable) or industry recognized modeling techniques and are generally classified as Level 2. Pricing vendor inputs to Level 2 valuations may include quoted prices for similar investments in active markets, interest rate curves, coupon rates, currency rates, yield curves, option adjusted spreads, default rates, credit spreads and other unique security features in order to estimate the relevant cash flows which are then discounted to calculate fair values. If these inputs are unobservable and significant to the fair value, these investments will be classified as Level 3.
Other fixed income investments, including non-U.S. government and corporate debt, are generally valued using quoted market prices, if available, which are typically impacted by current interest rates, maturity dates and any perceived credit risk of the issuer. Additionally, in the absence of quoted market prices, these inputs are used by pricing vendors to derive a valuation based upon industry or proprietary models which incorporate issuer specific data with relevant yield/spread comparisons with more widely quoted bonds with similar key characteristics. Those investments for which there are observable inputs are classified as Level 2. Where the inputs are not observable, the investments are classified as Level 3.
| | |
| |
| abfunds.com | | AB TAX-AWARE SHORT DURATION MUNICIPAL ETF | 41 |
NOTES TO FINANCIAL STATEMENTS (continued)
The following table summarizes the valuation of the Fund’s investments by the above fair value hierarchy levels as of November 30, 2024:
| | | | | | | | | | | | | | | | |
Investments in Securities: | | Level 1 | | | Level 2 | | | Level 3 | | | Total | |
Assets: | | | | | | | | | | | | | | | | |
Long-Term Municipal Bonds | | $ | – 0 | – | | $ | 625,536,479 | | | $ | – 0 | – | | $ | 625,536,479 | |
Short-Term Municipal Notes | | | – 0 | – | | | 11,305,000 | | | | – 0 | – | | | 11,305,000 | |
Corporates – Investment Grade | | | – 0 | – | | | 2,400,276 | | | | – 0 | – | | | 2,400,276 | |
Collateralized Mortgage Obligations | | | – 0 | – | | | 2,237,379 | | | | – 0 | – | | | 2,237,379 | |
Asset-Backed Securities | | | – 0 | – | | | 2,133,019 | | | | – 0 | – | | | 2,133,019 | |
Investment Companies | | | 138,209 | | | | – 0 | – | | | – 0 | – | | | 138,209 | |
| | | | | | | | | | | | | | | | |
Total Investments in Securities | | | 138,209 | | | | 643,612,153 | | | | – 0 | – | | | 643,750,362 | |
Other Financial Instruments(a): | | | | | | | | | | | | | | | | |
Assets: | | | | | | | | | | | | | | | | |
Centrally Cleared Inflation (CPI) Swaps | | | – 0 | – | | | 66,335 | | | | – 0 | – | | | 66,335 | (b) |
Centrally Cleared Interest Rate Swaps | | | – 0 | – | | | 146,680 | | | | – 0 | – | | | 146,680 | (b) |
Liabilities: | | | | | | | | | | | | | | | | |
Centrally Cleared Inflation (CPI) Swaps | | | – 0 | – | | | (30,302 | ) | | | – 0 | – | | | (30,302 | )(b) |
Centrally Cleared Interest Rate Swaps | | | – 0 | – | | | (123,340 | ) | | | – 0 | – | | | (123,340 | )(b) |
| | | | | | | | | | | | | | | | |
Total | | $ | 138,209 | | | $ | 643,671,526 | | | $ | – 0 | – | | $ | 643,809,735 | |
| | | | | | | | | | | | | | | | |
| (a) | Other financial instruments include derivative instruments, such as futures, forwards and swaps. Derivative instruments are valued at the unrealized appreciation (depreciation) on the instrument. Other financial instruments may also include swaps with upfront premiums, written options and written swaptions which are valued at market value. |
| (b) | Only variation margin receivable (payable) at period end is reported within the statement of assets and liabilities. This amount reflects cumulative unrealized appreciation (depreciation) on futures and centrally cleared swaps as reported in the portfolio of investments. Where applicable, centrally cleared swaps with upfront premiums are presented here at market value. |
3. Currency Translation
Assets and liabilities denominated in foreign currencies and commitments under forward currency exchange contracts are translated into U.S. dollars at the mean of the quoted bid and ask prices of such currencies against the U.S. dollar. Purchases and sales of portfolio securities are translated into U.S. dollars at the rates of exchange prevailing when such securities were acquired or sold. Income and expenses are translated into U.S. dollars at rates of exchange prevailing when accrued.
Net realized gain or loss on foreign currency transactions represents foreign exchange gains and losses from sales and maturities of foreign fixed
| | |
| |
42 | AB TAX-AWARE SHORT DURATION MUNICIPAL ETF | | abfunds.com |
NOTES TO FINANCIAL STATEMENTS (continued)
income investments, holding of foreign currencies, currency gains or losses realized between the trade and settlement dates on foreign investment transactions, and the difference between the amounts of dividends, interest and foreign withholding taxes recorded on the Fund’s books and the U.S. dollar equivalent amounts actually received or paid. Net unrealized currency gains and losses from valuing foreign currency denominated assets and liabilities at period end exchange rates are reflected as a component of net unrealized appreciation or depreciation of foreign currency denominated assets and liabilities.
4. Taxes
It is Fund’s policy to meet the requirements of the Internal Revenue Code applicable to regulated investment companies and to distribute all of its investment company taxable income and net realized gains, if any, to shareholders. Therefore, no provisions for federal income or excise taxes are required. The Fund may be subject to taxes imposed by countries in which it invests. Such taxes are generally based on income and/or capital gains earned or repatriated. Taxes are accrued and applied to net investment income, net realized gains and net unrealized appreciation/depreciation as such income and/or gains are earned.
In accordance with U.S. GAAP requirements regarding accounting for uncertainties in income taxes, management has analyzed the Fund’s tax positions taken or expected to be taken on federal and state income tax returns for all open tax years (the current and prior tax years) and has concluded that no provision for income tax is required in the Fund’s financial statements.
5. Investment Income and Investment Transactions
Dividend income is recorded on the ex-dividend date or as soon as the Fund is informed of the dividend. Interest income is accrued daily. Investment transactions are accounted for on the date the securities are purchased or sold. Investment gains or losses are determined on the identified cost basis. Non-cash dividends, if any, are recorded on the ex-dividend date at the fair value of the securities received. The Fund amortizes premiums and accretes discounts as adjustments to interest income.
The Fund accounts for distributions received from real estate investment trust (“REIT”) investments or from regulated investment companies as dividend income, realized gain, or return of capital based on information provided by the REIT or the investment company.
6. Dividends and Distributions
Dividends and distributions to shareholders, if any, are recorded on the ex-dividend date. Income dividends and capital gains distributions are
| | |
| |
| abfunds.com | | AB TAX-AWARE SHORT DURATION MUNICIPAL ETF | 43 |
NOTES TO FINANCIAL STATEMENTS (continued)
determined in accordance with federal tax regulations and may differ from those determined in accordance with U.S. GAAP. To the extent these differences are permanent, such amounts are reclassified within the capital accounts based on their federal tax basis treatment; temporary differences do not require such reclassification.
7. Offering Expenses
The Adviser has agreed to pay all of the Fund’s organization and offering costs. The Fund is not obligated to repay any such organizational expenses or offering costs paid by the Adviser.
8. Cash and Short-Term Investments
Cash and short-term investments include cash on hand and short-term investments with maturities of less than one year when purchased.
NOTE B
Advisory Fee and Other Transactions with Affiliates
Under the terms of the investment advisory agreement, the Fund pays the Adviser a unitary advisory fee at an annual rate of .27% of the Fund’s average daily net assets. The fees are accrued daily and paid monthly.
Under the investment advisory agreement, in accordance with the unitary fee structure, the Adviser bears the cost of various third-party services required by the Fund, including audit, custodial, accounting, certain legal and transfer agency costs. Also under the investment advisory agreement, the Adviser will reimburse the Fund for the Fund’s share of the acquired funds fees and expenses (advisory fees and other expenses) of any pooled investment vehicle for which the Adviser serves as investment adviser. For the year ended November 30, 2024, such waiver/reimbursements relating to the Fund’s investment in AB Government Money Market Portfolio amounted to $9,464.
A summary of the Fund’s transactions in AB mutual funds for the year ended November 30, 2024 is as follows:
| | | | | | | | | | | | | | | | | | | | |
Fund | | Market Value
11/30/23
(000) | | | Purchases
at Cost
(000) | | | Sales
Proceeds
(000) | | | Market Value
11/30/24
(000) | | | Dividend
Income
(000) | |
AB Government Money Market Portfolio | | $ | 2,352 | | | $ | 293,747 | | | $ | 295,961 | | | $ | 138 | | | $ | 283 | |
NOTE C
Distribution Plan
The Fund has adopted a Distribution and Service Plan pursuant to Rule 12b-1 of the Act which permits the Fund to pay distribution and servicing fees not to exceed .25% per year of the Fund’s average daily net
| | |
| |
44 | AB TAX-AWARE SHORT DURATION MUNICIPAL ETF | | abfunds.com |
NOTES TO FINANCIAL STATEMENTS (continued)
assets. No such fees are currently paid, and the Board has not approved the commencement of payments under the Rule 12b-1 Distribution Plan.
NOTE D
Investment Transactions
Purchases and sales of investment securities (excluding short-term investments and in-kind purchases and sales) for the year ended November 30, 2024 were as follows:
| | | | | | | | |
| | | Purchases | | | Sales | |
In-kind transactions (excluding U.S. government securities) | | $ | 391,431,734 | | | $ | 120,213,163 | |
U.S. government securities | | | 1,381,742 | | | | 2,499,258 | |
During the year ended November 30, 2024, the Fund delivered portfolio securities for the redemption of Fund shares (in-kind redemptions). Cash and portfolio securities were transferred for redemptions at fair value. For financial reporting purposes, the Fund recorded net realized gains and losses in connection with each in-kind redemption transaction. For the year ended November 30, 2024, the Fund had in-kind purchases and in-kind sales as follows:
| | | | | | | | |
| | | Purchases | | | Sales | |
In-kind transactions | | | | | | | | |
Investment securities (excluding U.S. government securities) | | $ | 90,643,738 | | | $ | – 0 | – |
U.S. government securities | | | – 0 | – | | | – 0 | – |
The cost of investments for federal income tax purposes, gross unrealized appreciation and unrealized depreciation are as follows:
| | | | |
Cost | | $ | 639,658,963 | |
| | | | |
Gross unrealized appreciation | | $ | 4,973,089 | |
Gross unrealized depreciation | | | (696,426 | ) |
| | | | |
Net unrealized appreciation | | $ | 4,276,663 | |
| | | | |
1. Derivative Financial Instruments
The Fund may use derivatives in an effort to earn income and enhance returns, to replace more traditional direct investments, to obtain exposure to otherwise inaccessible markets (collectively, “investment purposes”), or to hedge or adjust the risk profile of its portfolio.
| | |
| |
| abfunds.com | | AB TAX-AWARE SHORT DURATION MUNICIPAL ETF | 45 |
NOTES TO FINANCIAL STATEMENTS (continued)
The principal types of derivatives utilized by the Fund, as well as the methods in which they may be used are:
The Fund may enter into swaps for investment purposes or to hedge its exposure to interest rates, credit risk, equity markets or currencies. A swap is an agreement that obligates two parties to exchange a series of cash flows at specified intervals based upon or calculated by reference to changes in specified prices, rates or indexes for a specified amount of an underlying asset or inflation. The payment flows are usually netted against each other, with the difference being paid by one party to the other. In addition, collateral may be pledged or received by the Fund in accordance with the terms of the respective swaps to provide value and recourse to the Fund or its counterparties in the event of default, bankruptcy or insolvency by one of the parties to the swap.
Risks may arise as a result of the failure of the counterparty to the swap to comply with the terms of the swap. The loss incurred by the failure of a counterparty is generally limited to the net interim payment to be received by the Fund, and/or the termination value at the end of the contract. Therefore, the Fund considers the creditworthiness of each counterparty to a swap in evaluating potential counterparty risk. This risk is mitigated by having a netting arrangement between the Fund and the counterparty and by the posting of collateral by the counterparty to the Fund to cover the Fund’s exposure to the counterparty. Additionally, risks may arise from unanticipated movements in interest rates, inflation or in the value of the underlying securities. The Fund accrues for the interim payments on swaps on a daily basis, with the net amount recorded within unrealized appreciation (depreciation) of swaps on the statement of assets and liabilities, where applicable. Once the interim payments are settled in cash, the net amount is recorded as realized gain/(loss) on swaps on the statement of operations, in addition to any realized gain/(loss) recorded upon the termination of swaps. Upfront premiums paid or received for swaps are recognized as cost or proceeds on the statement of assets and liabilities and are amortized on a straight line basis over the life of the contract. Amortized upfront premiums are included in net realized gain/(loss) from swaps on the statement of operations. Fluctuations in the value of swaps are recorded as a component of net change in unrealized appreciation (depreciation) of swaps on the statement of operations.
Certain standardized swaps, including certain interest rate swaps and credit default swaps, are subject to mandatory central clearing. Cleared swaps are transacted through futures commission merchants
| | |
| |
46 | AB TAX-AWARE SHORT DURATION MUNICIPAL ETF | | abfunds.com |
NOTES TO FINANCIAL STATEMENTS (continued)
(“FCMs”) that are members of central clearinghouses, with the clearinghouse serving as central counterparty, similar to transactions in futures contracts. Centralized clearing will be required for additional categories of swaps on a phased-in basis based on requirements published by the Securities and Exchange Commission and Commodity Futures Trading Commission.
At the time the Fund enters into a centrally cleared swap, Fund deposits with the broker or segregates at its custodian cash or securities as collateral to satisfy initial margin requirements set by the clearinghouse on which the transaction is effected. Pursuant to the contract, with respect to cash collateral, the Fund agrees to receive from or pay to the broker an amount of cash equal to the daily fluctuation in the value of the contract; in the case of securities collateral, the Fund agrees to adjust the securities position held in the segregated account accordingly. Such receipts, payments or adjustments are known as variation margin and are recorded by the Fund as unrealized gains or losses. Risks may arise from the potential inability of a counterparty to meet the terms of the contract. The credit/counterparty risk for centrally cleared swaps is generally less than non-centrally cleared swaps, since the clearinghouse, which is the issuer or counterparty to each centrally cleared swap, has robust risk mitigation standards, including the requirement to provide initial and variation margin. When the contract is closed, the Fund records a realized gain or loss equal to the difference between the value of the contract at the time it was opened and the time it was closed.
Interest Rate Swaps:
The Fund is subject to interest rate risk exposure in the normal course of pursuing its investment objectives. Because the Fund holds fixed rate bonds, the value of these bonds may decrease if interest rates rise. To help hedge against this risk and to maintain its ability to generate income at prevailing market rates, the Fund may enter into interest rate swaps. Interest rate swaps are agreements between two parties to exchange cash flows based on a notional amount. The Fund may elect to pay a fixed rate and receive a floating rate, or, receive a fixed rate and pay a floating rate on a notional amount.
In addition, the Fund may also enter into interest rate swap transactions to preserve a return or spread on a particular investment or portion of its portfolio, or protecting against an increase in the price of securities the Fund anticipates purchasing at a later date. Interest rate swaps involve the exchange by the Fund with another party of their respective commitments to pay or receive interest (e.g., an exchange of floating rate payments for fixed rate payments) computed based on a contractually-based principal (or “notional”) amount.
| | |
| |
| abfunds.com | | AB TAX-AWARE SHORT DURATION MUNICIPAL ETF | 47 |
NOTES TO FINANCIAL STATEMENTS (continued)
Interest rate swaps are entered into on a net basis (i.e., the two payment streams are netted out, with the Fund receiving or paying, as the case may be, only the net amount of the two payments).
During the year ended November 30, 2024, the Fund held interest rate swaps for hedging purposes.
Inflation (CPI) Swaps:
Inflation swap agreements are contracts in which one party agrees to pay the cumulative percentage increase in a price index (the Consumer Price Index with respect to CPI swaps) over the term of the swap (with some lag on the inflation index), and the other pays a compounded fixed rate. Inflation swaps may be used to protect the net asset value, or NAV, of a Fund against an unexpected change in the rate of inflation measured by an inflation index since the value of these agreements is expected to increase if there are unexpected inflation increases.
During the year ended November 30, 2024, the Fund held inflation (CPI) swaps for for hedging purposes.
During the year ended November 30, 2024, the Fund had entered into the following derivatives:
| | | | | | | | | | | | |
| | | Asset Derivatives | | | Liability Derivatives | |
Derivative Type | | Statement of
Assets and
Liabilities
Location | | Fair Value | | | Statement of
Assets and
Liabilities
Location | | Fair Value | |
Interest rate contracts | |
Receivable for variation margin on centrally cleared swaps | |
$ |
213,015 |
* | |
Payable for variation margin on centrally cleared swaps | |
$ |
153,802 |
* |
| | | | | | | | | | | | |
Total | | | | $ | 213,015 | | | | | $ | 153,802 | |
| | | | | | | | | | | | |
| * | Only variation margin receivable/payable at period end is reported within the statement of assets and liabilities. |
| | |
| |
48 | AB TAX-AWARE SHORT DURATION MUNICIPAL ETF | | abfunds.com |
NOTES TO FINANCIAL STATEMENTS (continued)
This amount reflects cumulative unrealized appreciation (depreciation) on futures and centrally cleared swaps as reported in the portfolio of investments.
| | | | | | | | | | |
Derivative Type | | Location of
Gain or (Loss)
on Derivatives
Within Statement
of Operations | | Realized Gain
or (Loss) on
Derivatives | | | Change in
Unrealized
Appreciation or
(Depreciation) | |
Interest rate contracts | | Net realized gain (loss) on swaps; Net change in unrealized appreciation (depreciation) of swaps | | $ | (921,509 | ) | | $ | 224,962 | |
| | | | | | | | | | |
Total | | | | $ | (921,509 | ) | | $ | 224,962 | |
| | | | | | | | | | |
The following table represents the average monthly volume of the Fund’s derivative transactions during the year ended November 30, 2024:
| | | | |
Centrally Cleared Interest Rate Swaps: | | | | |
Average notional amount | | $ | 60,950,769 | |
Centrally Cleared Inflation Swaps: | | | | |
Average notional amount | | $ | 20,250,000 | (a) |
| (a) | Positions were open for two months during the year. |
2. Currency Transactions
The Fund may invest in non-U.S. Dollar-denominated securities on a currency hedged or unhedged basis. The Fund may seek investment opportunities by taking long or short positions in currencies through the use of currency-related derivatives, including forward currency exchange contracts, futures and options on futures, swaps, and other options. The Fund may enter into transactions for investment opportunities when it anticipates that a foreign currency will appreciate or depreciate in value but securities denominated in that currency are not held by the Fund and do not present attractive investment opportunities. Such transactions may also be used when the Adviser believes that it may be more efficient than a direct investment in a foreign currency-denominated security. The Fund may also conduct currency exchange contracts on a spot basis (i.e., for cash at the spot rate prevailing in the currency exchange market for buying or selling currencies).
NOTE E
Shares of the Fund
The Fund’s shares may only be bought and sold in a secondary market through a broker-dealer at a market price. Because ETF shares trade at market prices rather than NAV, shares may trade at a price greater than NAV (a premium) or less than NAV (a discount). The Fund issues and
| | |
| |
| abfunds.com | | AB TAX-AWARE SHORT DURATION MUNICIPAL ETF | 49 |
NOTES TO FINANCIAL STATEMENTS (continued)
redeems shares at its NAV only in aggregations of a specified number of shares (a creation unit) generally in exchange for a designated portfolio of securities and/or cash (including any portion of such securities for which cash may be substituted). A fixed transaction fee is imposed on authorized participants in connection with creation unit redemption and creation transactions. Authorized participants may be required to pay an additional variable charge to cover certain costs and expenses related to the execution of trades resulting from creation unit transactions. Such variable charges, if any, are included in other capital within the Statement of Changes in Net Assets.
Transactions in shares of the Fund were as follows:
| | | | | | | | | | | | | | | | | | | | | | | | |
| | | | | | | | | | | | | | | | | | | | | | | | |
| | | Shares | | | | | | Amount | | | | |
| | | Year Ended
November 30,
2024 | | | Year Ended
November 30,
2023 | | | | | | Year Ended
November 30,
2024 | | | Year Ended
November 30,
2023 | | | | |
| | | | | | | | |
Shares sold | | | 16,900,000 | | | | 12,050,000 | | | | | | | $ | 423,947,895 | | | $ | 300,050,480 | | | | | |
| | | | | |
Shares redeemed | | | (2,700,000 | ) | | | (2,350,000 | ) | | | | | | | (67,573,970 | ) | | | (59,119,240 | ) | | | | |
| | | | | |
Net increase | | | 14,200,000 | | | | 9,700,000 | | | | | | | $ | 356,373,925 | | | $ | 240,931,240 | | | | | |
| | | | | |
NOTE F
Risks Involved in Investing in the Fund
Market Risk—The value of the Fund’s assets will fluctuate as the market or markets in which the Fund invests fluctuate. The value of the Fund’s investments may decline, sometimes rapidly and unpredictably, simply because of economic changes or other events, including public health crises (including the occurrence of a contagious disease or illness), interest rate levels, and regional and global conflicts, that affect large portions of the market.
Credit Risk—An issuer or guarantor of a fixed-income security, or the counterparty to a derivatives or other contract, may be unable or unwilling to make timely payments of interest or principal, or to otherwise honor its obligations. The issuer or guarantor may default, causing a loss of the full principal amount of a security and accrued interest. The degree of risk for a particular security may be reflected in its credit rating. There is the possibility that the credit rating of a fixed-income security may be downgraded after purchase, which may adversely affect the value of the security.
Below Investment-Grade Securities Risk—Investments in fixed-income securities with lower ratings (commonly known as “junk bonds”) are subject to a higher probability that an issuer will default or fail to meet its payment obligations. These securities may be subject to greater price volatility due to such factors as specific municipal or corporate developments and negative
| | |
| |
50 | AB TAX-AWARE SHORT DURATION MUNICIPAL ETF | | abfunds.com |
NOTES TO FINANCIAL STATEMENTS (continued)
performance of the junk bond market generally and may be more difficult to trade than other types of securities.
Municipal Market Risk—This is the risk that special factors may adversely affect the value of municipal securities and have a significant effect on the yield or value of the Fund’s investments in municipal securities. These factors include economic conditions, political or legislative changes, public health crises, uncertainties related to the tax status of municipal securities, and the rights of investors in these securities. To the extent that the Fund invests more of its assets in a particular state’s municipal securities, the Fund may be vulnerable to events adversely affecting that state, including economic, political and regulatory occurrences, court decisions, terrorism, public health crises (including the occurrence of a contagious disease or illness) and catastrophic natural disasters, such as hurricanes, fires or earthquakes. The Fund’s investments in certain municipal securities with principal and interest payments that are made from the revenues of a specific project or facility, and not general tax revenues, may have increased risks. Factors affecting the project or facility, such as local business or economic conditions, could have a significant effect on the project’s ability to make payments of principal and interest on these securities.
In addition, changes in tax rates or the treatment of income from certain types of municipal securities, among other things, could negatively affect the municipal securities markets.
The municipal securities issued by Puerto Rico and its government agencies and municipalities may have more risks than those of other U.S. issuers of municipal securities. Puerto Rico continues to face a challenging economic and fiscal environment. If the general economic situation in Puerto Rico continues to persist or worsens, the volatility and credit quality of Puerto Rican municipal securities could continue to be adversely affected, and the market for such securities may deteriorate further.
Tax Risk—From time to time, the U.S. Government and the U.S. Congress consider changes in federal tax law that could limit or eliminate the federal tax exemption for municipal bond income, which would in effect reduce the income received by shareholders from the Fund by increasing taxes on that income. In such event, the Fund’s net asset value (“NAV”) could also decline as yields on municipal bonds, which are typically lower than those on taxable bonds, would be expected to increase to approximately the yield of comparable taxable bonds. Actions or anticipated actions affecting the tax-exempt status of municipal bonds could also result in significant shareholder redemptions of Fund shares as investors anticipate adverse effects on the Fund or seek higher yields to offset the
| | |
| |
| abfunds.com | | AB TAX-AWARE SHORT DURATION MUNICIPAL ETF | 51 |
NOTES TO FINANCIAL STATEMENTS (continued)
potential loss of the tax deduction. As a result, the Fund would be required to maintain higher levels of cash to meet the redemptions, which would negatively affect the Fund’s yield.
Interest-Rate Risk—Changes in interest rates will affect the value of investments in fixed-income securities. When interest rates rise, the value of existing investments in fixed-income securities tends to fall and this decrease in value may not be offset by higher income from new investments. Interest-rate risk is generally greater for fixed-income securities with longer maturities or durations. The Fund may be subject to a greater risk of rising interest rates than would normally be the case due to the recent end of a period of historically low rates and the effects of potential central bank monetary policy, and government fiscal policy, initiatives and market reactions to those initiatives.
Duration Risk—Duration is a measure that relates the expected price volatility of a fixed-income security to changes in interest rates. The duration of a fixed-income security may be shorter than or equal to full maturity of a fixed-income security. Fixed-income securities with longer durations have more risk and will decrease in price as interest rates rise. For example, a fixed-income security with a duration of three years will likely decrease in value by approximately 3% if interest rates increase by 1%.
Inflation Risk—This is the risk that the value of assets or income from investments will be less in the future as inflation decreases the value of money. As inflation increases, the value of the Fund’s assets can decline as can the value of the Fund’s distributions. This risk is significantly greater for fixed-income securities with longer maturities.
Illiquid Investments Risk—Illiquid investments risk exists when certain investments are or become difficult to purchase or sell. Difficulty in selling such investments may result in sales at disadvantageous prices affecting the value of your investment in the Fund. Causes of illiquid investments risk may include low trading volumes and large positions. Municipal securities may have more illiquid investments risk than other fixed-income securities because they trade less frequently and the market for municipal securities is generally smaller than many other markets.
Leverage Risk—When the Fund borrows money or otherwise leverages its investments, its performance may be volatile because leverage tends to exaggerate the effect of any increase or decrease in the value of the Fund’s investments. The Fund may create leverage through the use of reverse repurchase arrangements, forward currency exchange contracts, forward commitments, dollar rolls or futures or by borrowing money. The use of other types of derivative instruments by the Fund, such as options
| | |
| |
52 | AB TAX-AWARE SHORT DURATION MUNICIPAL ETF | | abfunds.com |
NOTES TO FINANCIAL STATEMENTS (continued)
and swaps, may also result in a form of leverage. Leverage may result in higher returns to the Fund than if the Fund were not leveraged, but may also adversely affect returns, particularly if the market is declining.
Derivatives Risk—Derivatives may be difficult to price or unwind and may be leveraged so that small changes may produce disproportionate losses for the Fund. A short position in a derivative instrument involves the risk of a theoretically unlimited increase in the value of the underlying asset, reference rate or index, which could cause the Fund to suffer a potentially unlimited loss. Derivatives, especially over-the-counter derivatives, are also subject to counterparty risk, which is the risk that the counterparty (the party on the other side of the transaction) on a derivative transaction will be unable or unwilling to honor its contractual obligations to the Fund.
Variable and Floating-Rate Securities Risk—Variable and floating-rate securities pay interest at rates that are adjusted periodically, according to a specific formula. Because the interest rate is reset only periodically, changes in the interest rate on these securities may lag behind changes in the prevailing market interest rates. The value of the security may rise or fall depending on changes in interest rates between periodic resets.
When-Issued and Forward Commitment Risks—These securities are purchased before the securities are actually issued or delivered. These securities are subject to the risk that, when delivered, they will be worth less than the agreed-upon purchase price.
ETF Share Price and Net Asset Value Risk—The Fund’s shares are listed for trading on the NYSE Arca, Inc. (the “Exchange”). The Fund’s shares are generally bought and sold in the secondary market at market prices. The NAV per share of the Fund will fluctuate with changes in the market value of the Fund’s holdings. The Fund’s NAV is calculated once per day, at the end of the day. The market price of a share on the Exchange could be higher than the NAV (premium), or lower than the NAV (discount) and may fluctuate during the trading day. When all or a portion of the Fund’s underlying securities trade in a market that is closed when the market for the Fund’s shares is open, there may be differences between the current value of a security and the last quoted price for that security in the closed local market, which could lead to a deviation between the market value of the Fund’s shares and the Fund’s NAV. Disruptions in the creations and redemptions process or the existence of extreme market volatility could result in the Fund’s shares trading above or below NAV. As the Fund may invest in securities traded on foreign exchanges, Fund shares may trade at a larger premium or discount to the Fund’s NAV than shares of other ETFs. In addition, in stressed market conditions, the market for Fund shares may become less liquid in
| | |
| |
| abfunds.com | | AB TAX-AWARE SHORT DURATION MUNICIPAL ETF | 53 |
NOTES TO FINANCIAL STATEMENTS (continued)
response to deteriorating liquidity in the markets for the Fund’s underlying portfolio holdings.
Authorized Participant Risk—Only a limited number of financial institutions that enter into an authorized participant relationship with the Fund (“Authorized Participants”) may engage in creation or redemption transactions. If the Fund’s Authorized Participants decide not to create or redeem shares, Fund shares may trade at a larger premium or discount to the Fund’s NAV per share, or the Fund could face trading halts or de-listing.
Active Trading Market Risk—There is no guarantee that an active trading market for Fund shares will exist at all times. In times of market stress, markets can suffer erratic or unpredictable trading activity, extraordinary volatility or wide bid/ask spreads, which could cause some market makers and Authorized Participants to reduce their market activity or “step away” from making a market in ETF shares. Market makers and Authorized Participants are not obligated to place or execute purchase and redemption orders. This could cause the Fund’s market price to deviate, materially, from the NAV, and reduce the effectiveness of the ETF arbitrage process. Any absence of an active trading market for Fund shares could lead to a heightened risk that there will be a difference between the market price of a Fund share and the underlying value of the Fund share.
Indemnification Risk—In the ordinary course of business, the Fund enters into contracts that contain a variety of indemnifications. The Fund’s maximum exposure under these arrangements is unknown. However, the Fund has not had prior claims or losses pursuant to these indemnification provisions and expects the risk of loss thereunder to be remote. Therefore, the Fund has not accrued any liability in connection with these indemnification provisions.
Management Risk—The Fund is subject to management risk because it is an actively-managed ETF. The Adviser will apply its investment techniques and risk analyses in making investment decisions, but there is no guarantee that its techniques will produce the intended results. Some of these techniques may incorporate, or rely upon, quantitative models, but there is no guarantee that these models will generate accurate forecasts, reduce risk or otherwise perform as expected.
NOTE G
Joint Credit Facility
A number of open-end mutual funds managed by the Adviser, including the Fund, participate in a $325 million revolving credit facility (the “Facility”) intended to provide short-term financing related to redemptions and other
| | |
| |
54 | AB TAX-AWARE SHORT DURATION MUNICIPAL ETF | | abfunds.com |
NOTES TO FINANCIAL STATEMENTS (continued)
short term liquidity requirements, subject to certain restrictions. Commitment fees related to the Facility are paid by the participating funds and are included in miscellaneous expenses in the statement of operations. The Fund did not utilize the Facility during the year ended November 30, 2024.
NOTE H
Distributions to Shareholders
The tax character of distributions paid during the fiscal years ended November 30, 2024 and November 30, 2023 were as follows
| | | | | | | | |
| | | 2024 | | | 2023 | |
Distributions paid from: | | | | | | | | |
Ordinary income | | $ | 1,688,107 | | | $ | 750,870 | |
| | | | | | | | |
Total taxable distributions | | $ | 1,688,107 | | | $ | 750,870 | |
Tax-exempt distributions | | | 13,885,701 | | | | 4,106,528 | |
| | | | | | | | |
Total distributions paid | | $ | 15,573,808 | | | $ | 4,857,398 | |
| | | | | | | | |
As of November 30, 2024, the components of accumulated earnings (deficit) on a tax basis were as follows:
| | | | |
Undistributed tax-exempt income | | $ | 2,064,840 | |
Accumulated capital and other losses | | | (943,843 | )(a) |
Unrealized appreciation (depreciation) | | | 4,276,663 | (b) |
| | | | |
Total accumulated earnings (deficit) | | $ | 5,397,660 | |
| | | | |
| (a) | As of November 30, 2024, the Fund had a net capital loss carryforward of $943,843. |
| (b) | The difference between book-basis and tax-basis unrealized appreciation (depreciation) is attributable primarily to the tax treatment of swaps. |
For tax purposes, net realized capital losses may be carried over to offset future capital gains, if any. Funds are permitted to carry forward capital losses for an indefinite period, and such losses will retain their character as either short-term or long-term capital losses. As of November 30, 2024, the Fund had a net short-term capital loss carryforward of $943,843, which may be carried forward for an indefinite period.
During the current fiscal year, there were no permanent differences that resulted in adjustments to distributable earnings or additional paid-in capital.
NOTE I
Recent Accounting Pronouncements
In December 2022, the Financial Accounting Standards Board issued an Accounting Standards Update, ASU 2022-06, “Reference Rate Reform (Topic 848) – Deferral of the Sunset Date of Topic 848”. ASU 2022-06 is an amendment to ASU 2020-04, which provided optional guidance to ease the potential accounting burden due to the discontinuation of the LIBOR and other interbank-offered based reference rates and which was
| | |
| |
| abfunds.com | | AB TAX-AWARE SHORT DURATION MUNICIPAL ETF | 55 |
NOTES TO FINANCIAL STATEMENTS (continued)
effective as of March 12, 2020 through December 31, 2022. ASU 2022-06 extends the effective period through December 31, 2024. Management is currently evaluating the impact, if any, of applying ASU 2022-06.
In November 2023, the Financial Accounting Standards Board issued Accounting Standards Update, ASU 2023-07, “Segment Reporting (Topic 280)”. ASU 2023-07 requires public entities to provide disclosure of significant segment expenses that are regularly provided to the chief operating decision maker (“CODM”). ASU 2023-07, among other things, (i) requires a single segment public entity to provide all necessary disclosures required by Topic 280 it, (ii) requires a public entity to disclose the title and position of the CODM and an explanation of how the CODM uses the reported measure(s) of segment profit and loss in assessing segment performance and deciding how to allocate resources and (iii) provides the ability for a public entity to elect more than one performance measure. ASU 2023-07 is effective for fiscal years beginning after December 15, 2023, and interim periods within fiscal years beginning after December 15, 2024. Early adoption of ASU 2023-07 is permitted. Management is currently evaluating the impact, if any, of applying ASU 2023-07.
NOTE J
Subsequent Events
Management has evaluated subsequent events for possible recognition or disclosure in the financial statements through the date the financial statements are issued. Management has determined that there are no material events that would require disclosure in the Fund’s financial statements through this date.
| | |
| |
56 | AB TAX-AWARE SHORT DURATION MUNICIPAL ETF | | abfunds.com |
FINANCIAL HIGHLIGHTS
Selected Data For A Share of Capital Stock Outstanding Throughout Each Period
| | | | | | | | | | | | |
| | | Year Ended
November 30, | | | September 14,
2022(a) to
November 30,
2022 | |
| | | 2024 | | | 2023 | |
| | | | |
Net asset value, beginning of period | | | $ 25.01 | | | | $ 24.97 | | | | $ 25.00 | |
| | | | |
Income From Investment Operations | | | | | | | | | | | | |
| | | |
Net investment income(b)(c) | | | .87 | | | | .86 | | | | .16 | |
| | | |
Net realized and unrealized gain (loss) on investment transactions | | | .14 | | | | (.03 | ) | | | (.10 | ) |
| | | | |
Net increase in net asset value from operations | | | 1.01 | | | | .83 | | | | .06 | |
| | | | |
Less: Dividends | | | | | | | | | | | | |
| | | |
Dividends from net investment income | | | (.81 | ) | | | (.79 | ) | | | (.09 | ) |
| | | | |
Net asset value, end of period | | | $ 25.21 | | | | $ 25.01 | | | | $ 24.97 | |
| | | | |
Total Return(d) | | | | | | | | | | | | |
| | | |
Total investment return based on net asset value | | | 4.14 | % | | | 3.41 | % | | | .22 | % |
| | | |
Ratios/Supplemental Data. | | | | | | | | | | | | |
| | | |
Net assets, end of period (000’s omitted) | | | $650,594 | | | | $290,121 | | | | $47,492 | |
| | | |
Ratio to average net assets of: | | | | | | | | | | | | |
| | | |
Expenses, net of waivers/reimbursements | | | .27 | % | | | .27 | % | | | .27 | %^ |
| | | |
Expenses, before waivers/reimbursements | | | .27 | % | | | .27 | % | | | .27 | %^ |
| | | |
Net investment income(c) | | | 3.49 | % | | | 3.46 | % | | | 2.99 | %^ |
| | | |
Portfolio turnover rate(e) | | | 29 | % | | | 25 | % | | | 11 | % |
| (a) | Commencement of operations. |
| (b) | Based on average shares outstanding. |
| (c) | Net of expenses waived/reimbursed by the Adviser. |
| (d) | Total investment return is calculated assuming an initial investment made at the net asset value at the beginning of the period, reinvestment of all dividends and distributions at net asset value during the period, and redemption on the last day of the period. Total investment return does not reflect the deduction of taxes that a shareholder would pay on fund distributions or the redemption of fund shares. Total investment return calculated for a period of less than one year is not annualized. |
| (e) | Excludes the value of portfolio securities received or delivered as a result of in-kind purchases or redemptions of the Fund’s capital shares, including ETF Creation Units. |
See notes to financial statements.
| | |
| |
| abfunds.com | | AB TAX-AWARE SHORT DURATION MUNICIPAL ETF | 57 |
REPORT OF INDEPENDENT REGISTERED
PUBLIC ACCOUNTING FIRM
To the Shareholders and the Board of
Directors of AB Tax-Aware Short Duration Municipal ETF
Opinion on the Financial Statements
We have audited the accompanying statement of assets and liabilities of AB Tax-Aware Short Duration Municipal ETF (the “Fund”) (one of the funds constituting AB Active ETFs, Inc. (the “Corporation”)), including the portfolio of investments, as of November 30, 2024, and the related statement of operations for the year then ended, the statements of changes in net assets for each of the two years in the period then ended and the financial highlights for each of the two years in the period then ended and the period from September 14, 2022 (commencement of operations) to November 30, 2022 and the related notes (collectively referred to as the “financial statements”). In our opinion, the financial statements present fairly, in all material respects, the financial position of the Fund (one of the funds constituting AB Active ETFs, Inc.) at November 30, 2024, the results of its operations for the year then ended and the changes in its net assets for each of the two years in the period then ended and its financial highlights for each of the two years in the period then ended and the period from September 14, 2022 (commencement of operations) to November 30, 2022, in conformity with U.S. generally accepted accounting principles.
Basis for Opinion
These financial statements are the responsibility of the Corporation’s management. Our responsibility is to express an opinion on the Fund’s financial statements based on our audits. We are a public accounting firm registered with the Public Company Accounting Oversight Board (United States) (“PCAOB”) and are required to be independent with respect to the Corporation in accordance with the U.S. federal securities laws and the applicable rules and regulations of the Securities and Exchange Commission and the PCAOB.
We conducted our audits in accordance with the standards of the PCAOB. Those standards require that we plan and perform the audit to obtain reasonable assurance about whether the financial statements are free of material misstatement, whether due to error or fraud. The Corporation is not required to have, nor were we engaged to perform, an audit of the Corporation’s internal control over financial reporting. As part of our audits, we are required to obtain an understanding of internal control over financial reporting but not for the purpose of expressing an opinion on the effectiveness of the Corporation’s internal control over financial reporting. Accordingly, we express no such opinion.
Our audits included performing procedures to assess the risks of material misstatement of the financial statements, whether due to error or fraud,
| | |
| |
58 | AB TAX-AWARE SHORT DURATION MUNICIPAL ETF | | abfunds.com |
REPORT OF INDEPENDENT REGISTERED
PUBLIC ACCOUNTING FIRM (continued)
and performing procedures that respond to those risks. Such procedures included examining, on a test basis, evidence regarding the amounts and disclosures in the financial statements. Our procedures included confirmation of securities owned as of November 30, 2024, by correspondence with the custodian, brokers and others; when replies were not received from brokers or others, we performed other auditing procedures. Our audits also included evaluating the accounting principles used and significant estimates made by management, as well as evaluating the overall presentation of the financial statements. We believe that our audits provide a reasonable basis for our opinion.

We have served as the auditor of one or more of the AB investment companies since 1968.
New York, New York
January 28, 2025
| | |
| |
| abfunds.com | | AB TAX-AWARE SHORT DURATION MUNICIPAL ETF | 59 |
2024 FEDERAL TAX INFORMATION
(unaudited)
For Federal income tax purposes, the following information is furnished with respect to the distributions paid by the Fund during the taxable year ended November 30, 2024. For foreign shareholders, 100% of ordinary income dividends paid may be considered to be qualifying to be taxed as interest-related dividends.
Shareholders should not use the above information to prepare their income tax returns. The information necessary to complete your income tax returns will be included with your Form 1099-DIV which will be sent to you separately in January 2025.
| | |
| |
60 | AB TAX-AWARE SHORT DURATION MUNICIPAL ETF | | abfunds.com |
Information Regarding the Review and Approval of the Fund’s Advisory Agreement
The disinterested directors (the “directors”) of AB Active ETFs, Inc. (the “Company”) unanimously approved the continuance of the Company’s Advisory Agreement with the Adviser in respect of AB Tax-Aware Short Duration Municipal ETF (the “Fund”) at a meeting held in-person on July 30-31, 2024 (the “Meeting”).
Prior to approval of the continuance of the Advisory Agreement, the directors had requested from the Adviser, and received and evaluated, extensive materials. They reviewed the proposed continuance of the Advisory Agreement with the Adviser and with experienced counsel who are independent of the Adviser, who advised on the relevant legal standards. The directors also reviewed additional materials, including comparative analytical data prepared by the Senior Vice President of the Fund. The directors also discussed the proposed continuance in private sessions with counsel.
The directors considered their knowledge of the nature and quality of the services provided by the Adviser to the Fund gained from their experience as directors or trustees of most of the registered investment companies advised by the Adviser, including the other series of the Company that are organized as exchange-traded funds (“ETFs”), their overall confidence in the Adviser’s integrity and competence they have gained from that experience, the Adviser’s initiative in identifying and raising potential issues with the directors and its responsiveness, frankness and attention to concerns raised by the directors in the past, including the Adviser’s willingness to consider and implement organizational and operational changes designed to improve investment results and the services provided to the AB Funds. The directors noted that they have four regular meetings each year, at each of which they review extensive materials and information from the Adviser, including information on the investment performance of the Fund and the money market fund advised by the Adviser in which the Fund invests a portion of its assets.
The directors also considered all factors they believed relevant, including the specific matters discussed below. During the course of their deliberations, the directors evaluated, among other things, the reasonableness of the advisory fee. The directors did not identify any particular information that was all-important or controlling, and different directors may have attributed different weights to the various factors. The directors determined that the selection of the Adviser to manage the Fund and the overall arrangements between the Fund and the Adviser, as provided in the Advisory Agreement, including the advisory fee, were fair and reasonable in light of the services performed, expenses incurred and such other matters as the directors considered relevant in the exercise of their business
| | |
| |
| abfunds.com | | AB TAX-AWARE SHORT DURATION MUNICIPAL ETF | 61 |
judgment. The material factors and conclusions that formed the basis for the directors’ determinations included the following:
Nature, Extent and Quality of Services Provided
The directors considered the scope and quality of services provided by the Adviser under the Advisory Agreement, including the quality of the investment research capabilities of the Adviser and the other resources it has dedicated to performing services for the Fund. The directors noted that the Adviser from time to time reviews the Fund’s investment strategies and may from time to time propose changes intended to improve the Fund’s relative or absolute performance for the directors’ consideration. They also noted the professional experience and qualifications of the Fund’s portfolio management team and other senior personnel of the Adviser. The directors also considered that the Advisory Agreement provides that the Fund will reimburse the Adviser for the cost to it of providing certain clerical, accounting, administrative and other services to the Fund by employees of the Adviser or its affiliates. Requests for these reimbursements will be subject to the directors’ approval on a quarterly basis. The directors noted that the Adviser does not expect to request such reimbursements. The quality of administrative and other services, including the Adviser’s role in coordinating the activities of the Fund’s other service providers, also was considered. The directors concluded that, overall, they were satisfied with the nature, extent and quality of services provided to the Fund under the Advisory Agreement.
Costs of Services Provided and Profitability
The directors reviewed a schedule of the revenues and expenses and related notes indicating the profitability of the Fund to the Adviser for the period ended December 31, 2022 and calendar year 2023 that had been prepared with an expense allocation methodology arrived at in consultation with an independent consultant at the request of the directors. The directors noted that the assumptions and methods of allocation used by the Adviser in preparing profitability data for ETFs and understood that there are a number of potentially acceptable allocation methodologies for information of this type. The directors noted that the profitability information reflected all revenues and expenses of the Adviser’s relationship with the Fund. The directors recognized that it is difficult to make comparisons of the profitability of the Advisory Agreement with the profitability of ETF advisory contracts for unaffiliated ETFs because comparative information is not generally publicly available and is affected by numerous factors. The directors focused on the profitability of the Adviser’s relationship with the Fund before taxes and distribution expenses. The directors noted that the Fund was not profitable to the Adviser in the periods reviewed.
| | |
| |
62 | AB TAX-AWARE SHORT DURATION MUNICIPAL ETF | | abfunds.com |
Fall-Out Benefits
The directors considered the other benefits to the Adviser from its relationship with the Fund and the money market fund advised by the Adviser in which the Fund invests. The directors recognized that the Fund’s unprofitability to the Adviser would be exacerbated without these benefits. The directors understood that the Adviser also might derive reputational and other benefits from its association with the Fund.
Investment Results
In addition to the information reviewed by the directors in connection with the Meeting, the directors have received detailed performance information for the Fund at each regular Board meeting since the Fund’s inception.
At the Meeting, the directors reviewed performance information prepared by an independent service provider (the “15(c) service provider”), showing the Fund’s performance against a group of similar ETFs (“peer group”) and a larger group of similar ETFs (“peer universe”), each selected by the 15(c) service provider, and information prepared by the Adviser showing the Fund’s performance against a broad-based securities market index, in each case for the 1-year period ended May 31, 2024 and (in the case of comparisons with the broad-based securities market index) for the period from inception. Based on their review, the directors concluded that the Fund’s investment performance was acceptable.
Advisory Fees and Other Expenses
The directors considered the advisory fee rate payable by the Fund to the Adviser and information prepared by the 15(c) service provider concerning advisory fee rates payable by other ETFs in the same category as the Fund. The directors noted that the advisory fee is a unitary fee and that the Adviser pays all expenses of the Fund except for certain expenses payable by the Fund such as interest expense, taxes, extraordinary expenses, and brokerage commissions and other transaction costs. The directors recognized that it is difficult to make comparisons of advisory fees because there are variations in the services that are included in the fees payable by other ETFs. The directors compared the Fund’s contractual advisory fee rate against a peer group median and noted that it was equal to the median.
The directors also considered the Adviser’s fee schedule for other clients utilizing investment strategies similar to those of the Fund. For this purpose, they reviewed the relevant advisory fee information from the Adviser’s Form ADV and in a report from the Fund’s Senior Vice President and noted the differences between the Fund’s fee schedule, on the one hand, and the Adviser’s institutional fee schedule, on the other. The directors noted that the Adviser may, in some cases, agree to fee rates with large institutional clients that are lower than those reviewed by the directors and that they had previously discussed with the Adviser its policies in respect of such arrangements. The directors also compared the advisory
| | |
| |
| abfunds.com | | AB TAX-AWARE SHORT DURATION MUNICIPAL ETF | 63 |
fee rate for the Fund with that for another fund advised by the Adviser utilizing similar investment strategies.
The Adviser reviewed with the directors the significantly greater scope of the services it provides to the Fund relative to institutional clients. In this regard, the Adviser noted, among other things, that, compared to institutional accounts, the Fund (i) demands considerably more managerial and administrative resources due to the potential for frequent creations and redemptions of shares; (ii) has more tax and regulatory restrictions and compliance obligations; (iii) must prepare and file or distribute regulatory and other communications about fund operations; and (iv) must provide shareholder servicing to retail investors. The Adviser also reviewed the greater legal risks presented by the large and changing population of Fund shareholders who may assert claims against the Adviser in individual or class actions, and the greater entrepreneurial risk in offering new fund products, which require substantial investment to launch, may not succeed, and generally must be priced to compete with larger, more established funds resulting in lack of to the Adviser until a new fund achieves scale. In light of the substantial differences in services rendered by the Adviser to institutional clients as compared to the Fund, and the different risk profile, the directors considered these fee comparisons inapt and did not place significant weight on them in their deliberations. The directors noted that the unitary fee for the Fund covers additional services provided by third parties and thus is not directly comparable to the Adviser’s institutional fee schedule and the schedule of fees for most other funds advised by the Adviser.
In connection with their review of the Fund’s advisory fee, the directors also considered the Fund’s total expense ratio in comparison to the medians for a peer group and a peer universe selected by the 15(c) service provider. The Fund’s expense ratio was based on the Fund’s latest fiscal year. The directors view expense ratio information as relevant to their evaluation of the Adviser’s services because the Adviser is responsible for coordinating services provided to the Fund by others, and in most cases, the Adviser is responsible for paying for such services under its unitary fee arrangement with the Fund. The directors noted that the Fund’s expense ratio was equal to the medians. Based on their review, the directors concluded that the Fund’s expense ratio was acceptable.
Economies of Scale
The directors noted that the advisory fee schedule for the Fund does not contain breakpoints and that they had discussed their strong preference for breakpoints in advisory contracts with the Adviser. The directors took into consideration prior presentations by an independent consultant on economies of scale in the mutual fund industry and for the AB Funds, and presentations from time to time by the Adviser concerning certain of its views on economies of scale. The directors also had requested and
| | |
| |
64 | AB TAX-AWARE SHORT DURATION MUNICIPAL ETF | | abfunds.com |
received from the Adviser certain updates on economies of scale in advance of the Meeting. The directors believe that economies of scale may be realized (if at all) by the Adviser across a variety of products and services, and not only in respect of a single fund. The directors noted that there is no established methodology for setting breakpoints that give effect to the fund-specific services provided by a fund’s adviser and to the economies of scale that an adviser may realize in its overall mutual fund business or those components of it which directly or indirectly affect a fund’s operations. The directors observed that in the mutual fund industry as a whole, as well as among ETFs similar to the Fund, there is no uniformity or pattern in the fees and asset levels at which breakpoints (if any) apply. The directors also noted that the advisory agreements for many ETFs do not have breakpoints at all. The directors informed the Adviser that they would monitor the Fund’s asset level and its profitability to the Adviser and anticipated revisiting the question of breakpoints in the future if circumstances warranted doing so.
| | |
| |
| abfunds.com | | AB TAX-AWARE SHORT DURATION MUNICIPAL ETF | 65 |
NOTES
| | |
| |
66 | AB TAX-AWARE SHORT DURATION MUNICIPAL ETF | | abfunds.com |
NOTES
| | |
| |
| abfunds.com | | AB TAX-AWARE SHORT DURATION MUNICIPAL ETF | 67 |
NOTES
| | |
| |
68 | AB TAX-AWARE SHORT DURATION MUNICIPAL ETF | | abfunds.com |
AB TAX-AWARE SHORT DURATION MUNICIPAL ETF
66 Hudson Boulevard East
New York, NY 10001
800 221 5672
ETF-TASDM-0151-1124 
NOV 11.30.24

ANNUAL FINANCIAL STATEMENTS AND ADDITIONAL INFORMATION
AB ULTRA SHORT INCOME ETF
(NYSE: YEAR)

| | |
| |
| Investment Products Offered | | • Are Not FDIC Insured • May Lose Value • Are Not Bank Guaranteed |
Investors should consider the investment objectives, risks, charges and expenses of the Fund carefully before investing. For copies of our prospectus or summary prospectus, which contain this and other information, visit us online at www.abfunds.com or contact your AB representative. Please read the prospectus and/or summary prospectus carefully before investing.
This shareholder report must be preceded or accompanied by the Fund’s prospectus for individuals who are not current shareholders of the Fund.
You may obtain a description of the Fund’s proxy voting policies and procedures, and information regarding how the Fund voted proxies relating to portfolio securities during the most recent 12-month period ended June 30, without charge. Simply visit AB’s website at www.abfunds.com, or go to the Securities and Exchange Commission’s (the “Commission”) website at www.sec.gov, or call AB at (800) 227 4618.
The Fund files its complete schedule of portfolio holdings with the Commission for the first and third quarters of each fiscal year as an exhibit to its reports on Form N-PORT. The Fund’s Form N-PORT reports are available on the Commission’s website at www.sec.gov. AB publishes full portfolio holdings for the Fund daily at www.abfunds.com.
Foreside Fund Services, LLC (“Foreside”) is the distributor of the fund. Foreside is a member of FINRA.
The [A/B] logo and AllianceBernstein® are registered trademarks used by permission of the owner, AllianceBernstein L.P.
PORTFOLIO OF INVESTMENTS
November 30, 2024
| | | | | | | | |
| | | Principal
Amount
(000) | | | U.S. $ Value | |
| |
CORPORATES - INVESTMENT GRADE – 46.0% | | | | | | | | |
Financial Institutions – 25.9% | | | | | | | | |
Banking – 19.8% | | | | | | | | |
ABN AMRO Bank NV
4.75%, 07/28/2025(a) | | $ | 15,288 | | | $ | 15,226,848 | |
4.80%, 04/18/2026(a) | | | 800 | | | | 795,992 | |
Ally Financial, Inc.
4.625%, 03/30/2025 | | | 2,524 | | | | 2,516,479 | |
5.80%, 05/01/2025 | | | 122 | | | | 122,157 | |
Banco Santander SA
2.746%, 05/28/2025 | | | 3,000 | | | | 2,967,990 | |
Bank of America Corp.
1.53%, 12/06/2025 | | | 973 | | | | 972,562 | |
Series L
3.95%, 04/21/2025 | | | 9,721 | | | | 9,681,727 | |
Bank of Ireland Group PLC
6.253%, 09/16/2026(a) | | | 5,835 | | | | 5,884,422 | |
Bank of Nova Scotia (The)
3.45%, 04/11/2025 | | | 4,845 | | | | 4,819,709 | |
Barclays PLC
3.65%, 03/16/2025 | | | 12,615 | | | | 12,564,792 | |
BNP Paribas SA
3.375%, 01/09/2025(a) | | | 3,109 | | | | 3,102,316 | |
4.375%, 09/28/2025(a) | | | 3,829 | | | | 3,802,388 | |
BPCE SA
2.375%, 01/14/2025(a) | | | 1,591 | | | | 1,585,957 | |
4.50%, 03/15/2025(a) | | | 6,924 | | | | 6,901,843 | |
Capital One Financial Corp.
4.20%, 10/29/2025 | | | 10,020 | | | | 9,954,369 | |
4.25%, 04/30/2025 | | | 1,643 | | | | 1,639,205 | |
Citigroup, Inc.
3.875%, 03/26/2025 | | | 6,253 | | | | 6,229,739 | |
4.40%, 06/10/2025 | | | 9,970 | | | | 9,939,392 | |
Cooperatieve Rabobank UA
4.375%, 08/04/2025 | | | 16,105 | | | | 15,997,419 | |
Credit Agricole SA
4.375%, 03/17/2025(a) | | | 16,381 | | | | 16,324,977 | |
Danske Bank A/S
3.244%, 12/20/2025(a) | | | 202 | | | | 201,699 | |
Goldman Sachs Group, Inc. (The)
3.50%, 01/23/2025 | | | 4,422 | | | | 4,412,581 | |
4.25%, 10/21/2025 | | | 7,044 | | | | 7,007,583 | |
Manufacturers & Traders Trust Co.
Series B
2.90%, 02/06/2025 | | | 10,539 | | | | 10,493,261 | |
| | |
| |
| abfunds.com | | AB ULTRA SHORT INCOME ETF | 1 |
PORTFOLIO OF INVESTMENTS (continued)
| | | | | | | | |
| | | Principal
Amount
(000) | | | U.S. $ Value | |
| |
Mitsubishi UFJ Financial Group, Inc.
2.193%, 02/25/2025 | | $ | 11,755 | | | $ | 11,682,119 | |
Morgan Stanley
Series G
5.157% (SOFR + 0.51%), 01/22/2025(b) | | | 1,038 | | | | 1,038,353 | |
Santander Holdings USA, Inc.
3.45%, 06/02/2025 | | | 6,045 | | | | 5,993,376 | |
4.50%, 07/17/2025 | | | 5,300 | | | | 5,279,754 | |
Societe Generale SA
2.226%, 01/21/2026(a) | | | 1,471 | | | | 1,464,233 | |
2.625%, 01/22/2025(a) | | | 8,719 | | | | 8,687,524 | |
4.25%, 04/14/2025(a) | | | 5,405 | | | | 5,374,732 | |
4.75%, 11/24/2025(a) | | | 898 | | | | 892,540 | |
Sumitomo Mitsui Financial Group, Inc.
2.348%, 01/15/2025 | | | 11,297 | | | | 11,261,527 | |
Synchrony Financial
4.50%, 07/23/2025 | | | 1,924 | | | | 1,916,112 | |
4.875%, 06/13/2025 | | | 439 | | | | 438,162 | |
Truist Bank
Series B
3.625%, 09/16/2025 | | | 5,060 | | | | 5,007,629 | |
UBS AG/Stamford CT
7.95%, 01/09/2025 | | | 1,872 | | | | 1,877,148 | |
UBS Group AG
3.75%, 03/26/2025 | | | 7,486 | | | | 7,460,323 | |
Western Union Co. (The)
2.85%, 01/10/2025 | | | 4,540 | | | | 4,522,430 | |
| | | | | | | | |
| | | | | | | 226,041,369 | |
| | | | | | | | |
Brokerage – 1.4% | | | | | | | | |
Nomura Holdings, Inc.
1.851%, 07/16/2025 | | | 3,840 | | | | 3,765,197 | |
2.648%, 01/16/2025 | | | 12,198 | | | | 12,160,918 | |
5.099%, 07/03/2025 | | | 493 | | | | 493,256 | |
| | | | | | | | |
| | | | | | | 16,419,371 | |
| | | | | | | | |
Finance – 2.9% | | | | | | | | |
AerCap Ireland Capital DAC/AerCap Global Aviation Trust
3.50%, 01/15/2025 | | | 672 | | | | 670,878 | |
4.45%, 10/01/2025 | | | 539 | | | | 537,464 | |
6.50%, 07/15/2025 | | | 8,128 | | | | 8,199,770 | |
Air Lease Corp.
2.30%, 02/01/2025 | | | 2,597 | | | | 2,583,418 | |
3.375%, 07/01/2025 | | | 3,295 | | | | 3,264,851 | |
Aircastle Ltd.
5.25%, 08/11/2025(a) | | | 9,937 | | | | 9,940,676 | |
| | |
| |
2 | AB ULTRA SHORT INCOME ETF | | abfunds.com |
PORTFOLIO OF INVESTMENTS (continued)
| | | | | | | | |
| | | Principal
Amount
(000) | | | U.S. $ Value | |
| |
Aviation Capital Group LLC
1.95%, 01/30/2026(a) | | $ | 4,192 | | | $ | 4,046,915 | |
1.95%, 09/20/2026(a) | | | 368 | | | | 348,452 | |
4.125%, 08/01/2025(a) | | | 3,237 | | | | 3,214,729 | |
| | | | | | | | |
| | | | | | | 32,807,153 | |
| | | | | | | | |
Insurance – 0.9% | | | | | | | | |
Athene Global Funding
2.50%, 01/14/2025(a) | | | 5,665 | | | | 5,647,892 | |
Lincoln National Corp.
3.35%, 03/09/2025 | | | 4,853 | | | | 4,825,677 | |
| | | | | | | | |
| | | | | | | 10,473,569 | |
| | | | | | | | |
REITs – 0.9% | | | | | | | | |
American Tower Corp.
4.00%, 06/01/2025 | | | 5,297 | | | | 5,271,734 | |
Brixmor Operating Partnership LP
3.85%, 02/01/2025 | | | 1,006 | | | | 1,003,153 | |
Omega Healthcare Investors, Inc.
4.50%, 01/15/2025 | | | 4,119 | | | | 4,112,945 | |
| | | | | | | | |
| | | | | | | 10,387,832 | |
| | | | | | | | |
| | | | | | | 296,129,294 | |
| | | | | | | | |
Industrial – 17.7% | | | | | | | | |
Basic – 0.3% | | | | | | | | |
Eastman Chemical Co.
3.80%, 03/15/2025 | | | 470 | | | | 467,956 | |
Nutrien Ltd.
3.00%, 04/01/2025 | | | 3,075 | | | | 3,055,658 | |
| | | | | | | | |
| | | | | | | 3,523,614 | |
| | | | | | | | |
Capital Goods – 1.1% | | | | | | | | |
3M Co.
2.65%, 04/15/2025 | | | 4,987 | | | | 4,945,009 | |
CNH Industrial Capital LLC
3.95%, 05/23/2025 | | | 1,660 | | | | 1,652,397 | |
Westinghouse Air Brake Technologies Corp.
3.20%, 06/15/2025 | | | 5,895 | | | | 5,834,989 | |
| | | | | | | | |
| | | | | | | 12,432,395 | |
| | | | | | | | |
Communications - Media – 1.3% | | | | | | | | |
Cox Communications, Inc.
3.85%, 02/01/2025(a) | | | 4,566 | | | | 4,553,672 | |
Discovery Communications LLC
3.45%, 03/15/2025 | | | 5,600 | | | | 5,570,544 | |
Fox Corp.
3.05%, 04/07/2025 | | | 4,867 | | | | 4,834,829 | |
| | | | | | | | |
| | | | | | | 14,959,045 | |
| | | | | | | | |
| | |
| |
| abfunds.com | | AB ULTRA SHORT INCOME ETF | 3 |
PORTFOLIO OF INVESTMENTS (continued)
| | | | | | | | |
| | | Principal
Amount
(000) | | | U.S. $ Value | |
| |
Communications - Telecommunications – 0.6% | | | | | | | | |
T-Mobile USA, Inc.
3.50%, 04/15/2025 | | $ | 6,558 | | | $ | 6,521,800 | |
| | | | | | | | |
| | |
Consumer Cyclical - Automotive – 1.2% | | | | | | | | |
Ford Motor Credit Co., LLC
2.30%, 02/10/2025 | | | 1,525 | | | | 1,514,950 | |
5.125%, 06/16/2025 | | | 536 | | | | 535,137 | |
General Motors Financial Co., Inc.
2.75%, 06/20/2025 | | | 5,320 | | | | 5,256,852 | |
3.80%, 04/07/2025 | | | 516 | | | | 513,791 | |
4.00%, 01/15/2025 | | | 499 | | | | 498,122 | |
Harley-Davidson Financial Services, Inc.
3.35%, 06/08/2025(a) | | | 5,102 | | | | 5,044,704 | |
Hyundai Capital America
5.875%, 04/07/2025(a) | | | 535 | | | | 536,113 | |
| | | | | | | | |
| | | | | | | 13,899,669 | |
| | | | | | | | |
Consumer Cyclical - Entertainment – 0.2% | | | | | | | | |
Mattel, Inc.
3.375%, 04/01/2026(a) | | | 2,540 | | | | 2,480,361 | |
| | | | | | | | |
| | |
Consumer Cyclical - Retailers – 2.0% | | | | | | | | |
AutoNation, Inc.
4.50%, 10/01/2025 | | | 747 | | | | 742,794 | |
AutoZone, Inc.
3.25%, 04/15/2025 | | | 4,965 | | | | 4,933,671 | |
Dollar Tree, Inc.
4.00%, 05/15/2025 | | | 5,815 | | | | 5,785,983 | |
Lowe’s Cos., Inc.
4.00%, 04/15/2025 | | | 5,864 | | | | 5,846,643 | |
PVH Corp.
4.625%, 07/10/2025 | | | 5,364 | | | | 5,343,617 | |
| | | | | | | | |
| | | | | | | 22,652,708 | |
| | | | | | | | |
Consumer Non-Cyclical – 3.2% | | | | | | | | |
Altria Group, Inc.
2.35%, 05/06/2025 | | | 5,852 | | | | 5,787,101 | |
Bunge Ltd. Finance Corp.
1.63%, 08/17/2025 | | | 3,857 | | | | 3,770,719 | |
CVS Health Corp.
3.875%, 07/20/2025 | | | 4,053 | | | | 4,025,358 | |
4.10%, 03/25/2025 | | | 1,746 | | | | 1,740,413 | |
HCA, Inc.
5.25%, 04/15/2025 | | | 695 | | | | 695,181 | |
5.375%, 02/01/2025 | | | 5,017 | | | | 5,015,194 | |
| | |
| |
4 | AB ULTRA SHORT INCOME ETF | | abfunds.com |
PORTFOLIO OF INVESTMENTS (continued)
| | | | | | | | |
| | | Principal
Amount
(000) | | | U.S. $ Value | |
| |
Reynolds American, Inc.
4.45%, 06/12/2025 | | $ | 5,709 | | | $ | 5,695,812 | |
Royalty Pharma PLC
1.20%, 09/02/2025 | | | 5,983 | | | | 5,813,143 | |
The Campbell’s Company
3.30%, 03/19/2025 | | | 1,702 | | | | 1,693,167 | |
3.95%, 03/15/2025 | | | 2,702 | | | | 2,692,759 | |
| | | | | | | | |
| | | | | | | 36,928,847 | |
| | | | | | | | |
Energy – 5.1% | |
Boardwalk Pipelines LP
4.95%, 12/15/2024 | | | 4,485 | | | | 4,481,322 | |
Canadian Natural Resources Ltd.
2.05%, 07/15/2025 | | | 5,955 | | | | 5,851,026 | |
Columbia Pipeline Group, Inc.
4.50%, 06/01/2025 | | | 5,635 | | | | 5,616,179 | |
Enbridge, Inc.
2.50%, 01/15/2025 | | | 2,000 | | | | 1,993,360 | |
Energy Transfer LP
4.05%, 03/15/2025 | | | 5,826 | | | | 5,807,939 | |
Marathon Petroleum Corp.
4.70%, 05/01/2025 | | | 2,250 | | | | 2,246,985 | |
MPLX LP
4.875%, 12/01/2024 | | | 5,233 | | | | 5,233,000 | |
ONEOK Partners LP
4.90%, 03/15/2025 | | | 6,290 | | | | 6,289,308 | |
Ovintiv, Inc.
5.65%, 05/15/2025 | | | 5,700 | | | | 5,716,416 | |
Phillips 66
3.85%, 04/09/2025 | | | 4,937 | | | | 4,916,413 | |
Spectra Energy Partners LP
3.50%, 03/15/2025 | | | 5,042 | | | | 5,019,009 | |
Western Midstream Operating LP
3.10%, 02/01/2025(c) | | | 5,111 | | | | 5,088,818 | |
| | | | | | | | |
| | | | | | | 58,259,775 | |
| | | | | |
Services – 1.5% | | | | | | | | |
eBay, Inc.
1.90%, 03/11/2025 | | | 5,635 | | | | 5,586,933 | |
Expedia Group, Inc.
6.25%, 05/01/2025(a) | | | 5,969 | | | | 5,976,939 | |
Global Payments, Inc.
2.65%, 02/15/2025 | | | 5,968 | | | | 5,933,326 | |
| | | | | | | | |
| | | | | | | 17,497,198 | |
| | | | | |
Technology – 0.7% | | | | | | | | |
Intel Corp.
3.40%, 03/25/2025 | | | 5,600 | | | | 5,570,264 | |
| | |
| |
| abfunds.com | | AB ULTRA SHORT INCOME ETF | 5 |
PORTFOLIO OF INVESTMENTS (continued)
| | | | | | | | |
| | | Principal
Amount
(000) | | | U.S. $ Value | |
| |
Oracle Corp.
2.50%, 04/01/2025 | | $ | 2,540 | | | $ | 2,518,943 | |
| | | | | | | | |
| | | | | | | 8,089,207 | |
| | | | | |
Transportation - Airlines – 0.5% | |
Southwest Airlines Co.
5.25%, 05/04/2025 | | | 5,775 | | | | 5,776,559 | |
| | | | | | | | |
| | | | | | | 203,021,178 | |
| | | | | |
Utility – 2.4% | |
Electric – 1.9% | |
American Electric Power Co., Inc.
5.699%, 08/15/2025 | | | 5,775 | | | | 5,801,103 | |
Edison International
4.95%, 04/15/2025 | | | 648 | | | | 647,754 | |
Enel Finance International NV
7.05%, 10/14/2025(a)(c) | | | 1,013 | | | | 1,030,535 | |
Eversource Energy
Series H
3.15%, 01/15/2025 | | | 1,000 | | | | 997,210 | |
FirstEnergy Corp.
2.05%, 03/01/2025 | | | 5,802 | | | | 5,753,669 | |
Sempra
3.30%, 04/01/2025 | | | 5,670 | | | | 5,637,284 | |
Xcel Energy, Inc.
3.30%, 06/01/2025 | | | 1,700 | | | | 1,684,462 | |
| | | | | | | | |
| | | | | | | 21,552,017 | |
| | | | | |
Other Utility – 0.5% | |
American Water Capital Corp.
3.40%, 03/01/2025 | | | 5,655 | | | | 5,632,437 | |
| | | | | | | | |
| | | | | | | 27,184,454 | |
| | | | | |
Total Corporates - Investment Grade
(cost $525,601,576) | | | | | | | 526,334,926 | |
| | | | | |
| | | | | | | | |
GOVERNMENTS - TREASURIES – 34.1% | |
United States – 34.1% | |
U.S. Treasury Notes | | | | | | | | |
3.375%, 09/15/2027 | | | 120,770 | | | | 118,411,211 | |
4.375%, 07/31/2026 | | | 20,565 | | | | 20,609,986 | |
4.589% (US TBILL 3 Month + 0.12%), 07/31/2025(b) | | | 40,000 | | | | 39,988,549 | |
4.633% (US TBILL 3 Month + 0.17%), 04/30/2025(b) | | | 40,000 | | | | 39,991,645 | |
4.634% (US TBILL 3 Month + 0.17%), 10/31/2025(b) | | | 40,000 | | | | 40,007,879 | |
4.646% (US TBILL 3 Month + 0.18%), 07/31/2026(b) | | | 111,000 | | | | 111,069,499 | |
| | |
| |
6 | AB ULTRA SHORT INCOME ETF | | abfunds.com |
PORTFOLIO OF INVESTMENTS (continued)
| | | | | | | | |
| | | Principal
Amount
(000) | | | U.S. $ Value | |
| |
4.709% (US TBILL 3 Month + 0.24%), 01/31/2026(b) | | $ | 20,000 | | | $ | 20,020,194 | |
| | | | | | | | |
| | |
Total Governments - Treasuries
(cost $390,691,374) | | | | | | | 390,098,963 | |
| | | | | |
| | | | | | | | |
ASSET-BACKED SECURITIES – 10.9% | |
Other ABS - Fixed Rate – 5.6% | |
ACHV ABS Trust
Series 2024-2PL, Class A
5.07%, 10/27/2031(a) | | | 6,200 | | | | 6,198,669 | |
Affirm Asset Securitization Trust
Series 2022-Z1, Class A
4.55%, 06/15/2027(a) | | | 57 | | | | 56,749 | |
Series 2023-B, Class 1A
6.82%, 09/15/2028(a) | | | 870 | | | | 881,516 | |
Series 2023-B, Class A
6.82%, 09/15/2028(a) | | | 1,200 | | | | 1,215,884 | |
Series 2023-X1, Class A
7.11%, 11/15/2028(a) | | | 144 | | | | 144,498 | |
Series 2024-X1, Class A
6.27%, 05/15/2029(a) | | | 1,737 | | | | 1,743,084 | |
Series 2024-X2, Class A
5.22%, 12/17/2029(a) | | | 5,706 | | | | 5,707,840 | |
BHG Securitization Trust
Series 2023-A, Class A
5.55%, 04/17/2036(a) | | | 681 | | | | 681,655 | |
Dext ABS LLC
Series 2023-1, Class A2
5.99%, 03/15/2032(a) | | | 482 | | | | 485,894 | |
Equify ABS LLC
Series 2024-1A, Class A
5.43%, 04/18/2033(a) | | | 3,387 | | | | 3,385,629 | |
Granite Park Equipment Leasing LLC
Series 2023-1A, Class A2
6.51%, 05/20/2030(a) | | | 2,061 | | | | 2,085,987 | |
Lendmark Funding Trust
Series 2023-1A, Class A
5.59%, 05/20/2033(a) | | | 1,680 | | | | 1,684,207 | |
Mariner Finance Issuance Trust
Series 2023-AA, Class A
6.70%, 10/22/2035(a) | | | 3,500 | | | | 3,552,520 | |
Marlette Funding Trust
Series 2024-1A, Class A
5.95%, 07/17/2034(a) | | | 1,372 | | | | 1,377,842 | |
NMEF Funding LLC
Series 2023-A, Class A2
6.57%, 06/17/2030(a) | | | 1,351 | | | | 1,365,698 | |
| | |
| |
| abfunds.com | | AB ULTRA SHORT INCOME ETF | 7 |
PORTFOLIO OF INVESTMENTS (continued)
| | | | | | | | |
| | | Principal
Amount
(000) | | | U.S. $ Value | |
| |
Oportun Funding Trust
Series 2024-3, Class A
5.26%, 08/15/2029(a) | | $ | 5,540 | | | $ | 5,541,001 | |
Oportun Issuance Trust
Series 2024-2, Class A
5.86%, 02/09/2032(a) | | | 2,968 | | | | 2,973,952 | |
Pagaya AI Debt Grantor Trust
Series 2024-5, Class A
6.278%, 10/15/2031(a) | | | 755 | | | | 761,821 | |
Pagaya AI Debt Grantor Trust & Pagaya AI Debt Trust
Series 2024-6, Class A
6.093%, 11/15/2031(a) | | | 1,285 | | | | 1,295,078 | |
Pagaya AI Debt Trust
Series 2023-1, Class A
7.556%, 07/15/2030(a) | | | 105 | | | | 105,525 | |
Series 2023-3, Class A
7.60%, 12/16/2030(a) | | | 368 | | | | 370,088 | |
Series 2023-5, Class A
7.179%, 04/15/2031(a) | | | 17 | | | | 17,504 | |
Series 2023-6, Class A
7.128%, 06/16/2031(a) | | | 107 | | | | 106,730 | |
Series 2024-1, Class A
6.66%, 07/15/2031(a) | | | 697 | | | | 705,448 | |
Series 2024-2, Class A
6.319%, 08/15/2031(a) | | | 1,205 | | | | 1,215,572 | |
Series 2024-3, Class A
6.258%, 10/15/2031(a) | | | 731 | | | | 735,182 | |
PEAC Solutions Receivables LLC
Series 2024-2A, Class A2
4.74%, 04/20/2027(a) | | | 6,000 | | | | 5,975,004 | |
Prosper Marketplace Issuance Trust
Series 2023-1A, Class A
7.06%, 07/16/2029(a) | | | 170 | | | | 170,027 | |
Reach ABS Trust
Series 2023-1A, Class A
7.05%, 02/18/2031(a) | | | 71 | | | | 70,908 | |
Service Experts Issuer LLC
Series 2024-1A, Class A
6.39%, 11/20/2035(a) | | | 4,612 | | | | 4,694,367 | |
Theorem Funding Trust
Series 2022-3A, Class A
7.60%, 04/15/2029(a) | | | 260 | | | | 261,890 | |
Series 2023-1A, Class A
7.58%, 04/15/2029(a) | | | 195 | | | | 197,128 | |
Upstart Securitization Trust
Series 2023-2, Class A
6.77%, 06/20/2033(a) | | | 665 | | | | 668,013 | |
| | |
| |
8 | AB ULTRA SHORT INCOME ETF | | abfunds.com |
PORTFOLIO OF INVESTMENTS (continued)
| | | | | | | | |
| | | Principal
Amount
(000) | | | U.S. $ Value | |
| |
Series 2023-3, Class A
6.90%, 10/20/2033(a) | | $ | 678 | | | $ | 684,714 | |
Series 2024-1, Class A
5.33%, 11/20/2034(a) | | | 5,890 | | | | 5,888,904 | |
Verdant Receivables LLC
Series 2023-1A, Class A2
6.24%, 01/13/2031(a) | | | 900 | | | | 912,736 | |
| | | | | | | | |
| | | | | | | 63,919,264 | |
| | | | | | | | |
Autos - Fixed Rate – 4.4% | |
ACM Auto Trust
Series 2024-1A, Class A
7.71%, 01/21/2031(a) | | | 1,203 | | | | 1,206,114 | |
Series 2024-2A, Class A
6.06%, 02/20/2029(a) | | | 5,542 | | | | 5,560,206 | |
Arivo Acceptance Auto Loan Receivables Trust
Series 2024-1A, Class A
6.46%, 04/17/2028(a) | | | 675 | | | | 680,524 | |
BOF VII AL Funding Trust I
Series 2023-CAR3, Class A2
6.291%, 07/26/2032(a) | | | 1,259 | | | | 1,276,903 | |
Carvana Auto Receivables Trust
Series 2023-N3, Class A
6.41%, 09/10/2027(a) | | | 387 | | | | 388,899 | |
Series 2024-N2, Class A2
5.90%, 08/10/2027(a) | | | 6,792 | | | | 6,822,174 | |
CPS Auto Receivables Trust
Series 2024-C, Class A
5.88%, 02/15/2028(a) | | | 3,644 | | | | 3,663,678 | |
FHF Issuer Trust
Series 2023-2A, Class A2
6.79%, 10/15/2029(a) | | | 989 | | | | 1,006,522 | |
Hyundai Auto Receivables Trust
Series 2021-A, Class B
1.09%, 05/17/2027 | | | 5,071 | | | | 4,974,605 | |
Lendbuzz Securitization Trust
Series 2023-1A, Class A2
6.92%, 08/15/2028(a) | | | 575 | | | | 583,548 | |
Series 2023-2A, Class A2
7.09%, 10/16/2028(a) | | | 859 | | | | 874,918 | |
Series 2023-3A, Class A2
7.50%, 12/15/2028(a) | | | 969 | | | | 992,575 | |
Lobel Automobile Receivables Trust
Series 2023-1, Class A
6.97%, 07/15/2026(a) | | | 20 | | | | 20,460 | |
Series 2023-2, Class A
7.59%, 04/16/2029(a) | | | 537 | | | | 542,793 | |
| | |
| |
| abfunds.com | | AB ULTRA SHORT INCOME ETF | 9 |
PORTFOLIO OF INVESTMENTS (continued)
| | | | | | | | |
| | | Principal
Amount
(000) | | | U.S. $ Value | |
| |
Merchants Fleet Funding LLC
Series 2023-1A, Class A
7.21%, 05/20/2036(a) | | $ | 2,843 | | | $ | 2,882,273 | |
Octane Receivables Trust
Series 2023-2A, Class A2
5.88%, 06/20/2031(a) | | | 1,126 | | | | 1,130,980 | |
Research-Driven Pagaya Motor Asset Trust
Series 2023-3A, Class A
7.13%, 01/26/2032(a) | | | 1,693 | | | | 1,709,166 | |
Series 2023-4A, Class A
7.54%, 03/25/2032(a) | | | 979 | | | | 992,810 | |
Research-Driven Pagaya Motor Trust
Series 2024-1A, Class A
7.09%, 06/25/2032(a) | | | 968 | | | | 979,627 | |
Santander Bank Auto Credit-Linked Notes
Series 2023-A, Class B
6.493%, 06/15/2033(a) | | | 262 | | | | 264,118 | |
Santander Drive Auto Receivables Trust
Series 2024-3, Class A2
5.91%, 06/15/2027 | | | 4,860 | | | | 4,879,407 | |
Tricolor Auto Securitization Trust
Series 2024-1A, Class A
6.61%, 10/15/2027(a) | | | 2,146 | | | | 2,163,665 | |
Series 2024-2A, Class A
6.36%, 12/15/2027(a) | | | 1,614 | | | | 1,625,936 | |
Series 2024-3A, Class A
5.22%, 06/15/2028(a) | | | 2,190 | | | | 2,193,301 | |
United Auto Credit Securitization Trust
Series 2024-1, Class A
6.17%, 08/10/2026(a) | | | 675 | | | | 676,156 | |
US Bank NA
Series 2023-1, Class B
6.789%, 08/25/2032(a) | | | 1,642 | | | | 1,664,249 | |
| | | | | | | | |
| | | | | | | 49,755,607 | |
| | | | | | | | |
Credit Cards - Fixed Rate – 0.9% | |
Brex Commercial Charge Card Master Trust
Series 2024-1, Class A1
6.05%, 07/15/2027(a) | | | 4,805 | | | | 4,854,087 | |
Mission Lane Credit Card Master Trust
Series 2024-B, Class A
5.88%, 01/15/2030(a) | | | 5,900 | | | | 5,899,229 | |
| | | | | | | | |
| | | | | | | 10,753,316 | |
| | | | | | | | |
Total Asset-Backed Securities
(cost $123,658,987) | | | | | | | 124,428,187 | |
| | | | | |
| | | | | | | | |
| | |
| |
10 | AB ULTRA SHORT INCOME ETF | | abfunds.com |
PORTFOLIO OF INVESTMENTS (continued)
| | | | | | | | |
| | |
Shares | | | U.S. $ Value | |
| |
SHORT-TERM INVESTMENTS – 8.7% | | | | | | | | |
Investment Companies – 6.8% | | | | | | | | |
AB Fixed Income Shares, Inc. – Government Money Market Portfolio – Class AB, 4.54%(d)(e)(f)
(cost $77,872,233) | | | 77,872,233 | | | $ | 77,872,233 | |
| | | | | | | | |
|
Commercial Paper – 1.9% | |
HSBC USA, Inc.
Zero Coupon, 04/25/2025(a) | | | 10,000 | | | | 9,810,431 | |
Intesa Sanpaolo Funding LLC
Zero Coupon, 01/07/2025 | | | 8,600 | | | | 8,553,650 | |
Zero Coupon, 02/03/2025 | | | 3,000 | | | | 2,972,808 | |
| | | | | | | | |
| | |
Total Commercial Paper
(cost $21,314,991) | | | | | | | 21,336,889 | |
| | | | | | | | |
| | |
Total Short-Term Investments
(cost $99,187,224) | | | | | | | 99,209,122 | |
| | | | | | | | |
| | |
Total Investments – 99.7%
(cost $1,139,139,161) | | | | | | | 1,140,071,198 | |
Other assets less liabilities – 0.3% | | | | | | | 3,057,876 | |
| | | | | | | | |
| | |
Net Assets – 100.0% | | | | | | $ | 1,143,129,074 | |
| | | | | | | | |
FUTURES (see Note D)
| | | | | | | | | | | | | | | | |
| Description | | Number of
Contracts | | | Expiration
Month | | | Current
Notional | | | Value and
Unrealized
Appreciation
(Depreciation) | |
Purchased Contracts | |
U.S. T-Note 2 Yr (CBT) Futures | | | 264 | | | | March 2025 | | | $ | 54,412,875 | | | $ | 156,751 | |
U.S. T-Note 5 Yr (CBT) Futures | | | 458 | | | | March 2025 | | | | 49,281,516 | | | | 355,000 | |
| | | | | | | | | | | | | | | | |
| | | $ | 511,751 | |
| | | | | |
| (a) | Security is exempt from registration under Rule 144A or Regulation S of the Securities Act of 1933. These securities are considered restricted, but liquid and may be resold in transactions exempt from registration. At November 30, 2024, the aggregate market value of these securities amounted to $237,451,065 or 20.8% of net assets. |
| (b) | Floating Rate Security. Stated interest/floor/ceiling rate was in effect at November 30, 2024. |
| (c) | Coupon rate adjusts periodically based upon a predetermined schedule. Stated interest rate in effect at November 30, 2024. |
| (d) | Affiliated investments. |
| (e) | To obtain a copy of the fund’s shareholder report, please go to the Securities and Exchange Commission’s website at www.sec.gov, or call AB at (800) 227-4618. |
| (f) | The rate shown represents the 7-day yield as of period end. |
| | |
| |
| abfunds.com | | AB ULTRA SHORT INCOME ETF | 11 |
PORTFOLIO OF INVESTMENTS (continued)
Glossary:
ABS – Asset-Backed Securities
CBT – Chicago Board of Trade
REIT – Real Estate Investment Trust
SOFR – Secured Overnight Financing Rate
US TBILL 3 Month – U.S. Treasury 3 Month Bill Money Market Yield
See notes to financial statements.
| | |
| |
12 | AB ULTRA SHORT INCOME ETF | | abfunds.com |
STATEMENT OF ASSETS & LIABILITIES
November 30, 2024
| | | | |
| Assets | | | | |
Investments in securities, at value | | | | |
Unaffiliated issuers (cost $1,061,266,928) | | $ | 1,062,198,965 | |
Affiliated issuers (cost $77,872,233) | | | 77,872,233 | |
Cash | | | 406 | |
Cash collateral due from broker | | | 912,200 | |
Interest receivable | | | 7,782,227 | |
Affiliated dividends receivable | | | 193,056 | |
Receivable for variation margin on futures | | | 101,537 | |
Receivable due from Adviser | | | 8,777 | |
| | | | |
Total assets | | | 1,149,069,401 | |
| | | | |
| Liabilities | | | | |
Payable for investment securities purchased | | | 5,705,823 | |
Advisory fee payable | | | 234,504 | |
| | | | |
Total liabilities | | | 5,940,327 | |
| | | | |
Net Assets | | $ | 1,143,129,074 | |
| | | | |
| Composition of Net Assets | | | | |
Capital stock, at par | | $ | 2,258 | |
Additional paid-in capital | | | 1,137,256,394 | |
Distributable earnings | | | 5,870,422 | |
| | | | |
Net Assets | | $ | 1,143,129,074 | |
| | | | |
Net Asset Value Per Share—500 million shares of capital stock authorized, $.0001 par value
(based on 22,576,000 shares outstanding) | | $ | 50.63 | |
| | | | |
See notes to financial statements.
| | |
| |
| abfunds.com | | AB ULTRA SHORT INCOME ETF | 13 |
STATEMENT OF OPERATIONS
Year Ended November 30, 2024
| | | | | | | | |
| Investment Income | | | | | | | | |
Interest | | $ | 51,461,343 | | | | | |
Dividends—Affiliated issuers | | | 2,440,068 | | | $ | 53,901,411 | |
| | | | | | | | |
| Expenses | | | | | | | | |
Advisory fee (see Note B) | | | 2,439,735 | | | | | |
| | | | | | | | |
Total expenses | | | 2,439,735 | | | | | |
Less: expenses waived and reimbursed by the Adviser (see Note B) | | | (78,772 | ) | | | | |
| | | | | | | | |
Net expenses | | | | | | | 2,360,963 | |
| | | | | | | | |
Net investment income | | | | | | | 51,540,448 | |
| | | | | | | | |
| Realized and Unrealized Gain (Loss) on Investment Transactions | | | | | | | | |
Net realized gain (loss) on: | | | | | | | | |
Investment transactions | | | | | | | 25,320 | |
In-kind redemptions | | | | | | | 3,102,598 | |
Futures | | | | | | | (634,205 | ) |
Net change in unrealized appreciation (depreciation) of: | | | | | | | | |
Investments | | | | | | | 255,819 | |
Futures | | | | | | | 327,524 | |
| | | | | | | | |
Net gain on investment transactions | | | | | | | 3,077,056 | |
| | | | | | | | |
Net Increase in Net Assets from Operations | | | | | | $ | 54,617,504 | |
| | | | | | | | |
See notes to financial statements.
| | |
| |
14 | AB ULTRA SHORT INCOME ETF | | abfunds.com |
STATEMENT OF CHANGES IN NET ASSETS
| | | | | | | | |
| | | Year Ended
November 30,
2024 | | | Year Ended
November 30,
2023 | |
| Increase in Net Assets from Operations | | | | | | | | |
Net investment income | | $ | 51,540,448 | | | $ | 20,171,238 | |
Net realized gain on investment transactions | | | 2,493,713 | | | | 18,071 | |
Net change in unrealized appreciation (depreciation) of investments | | | 583,343 | | | | 968,388 | |
| | | | | | | | |
Net increase in net assets from operations | | | 54,617,504 | | | | 21,157,697 | |
Distribution to Shareholders | | | (48,760,403 | ) | | | (18,014,901 | ) |
| Transactions in Shares of the Fund | | | | | | | | |
Net increase | | | 550,731,353 | | | | 433,330,965 | |
Other capital | | | 344 | | | | 64,073 | |
| | | | | | | | |
Total increase | | | 556,588,798 | | | | 436,537,834 | |
| Net Assets | | | | | | | | |
Beginning of period | | | 586,540,276 | | | | 150,002,442 | |
| | | | | | | | |
End of period | | $ | 1,143,129,074 | | | $ | 586,540,276 | |
| | | | | | | | |
See notes to financial statements.
| | |
| |
| abfunds.com | | AB ULTRA SHORT INCOME ETF | 15 |
NOTES TO FINANCIAL STATEMENTS
November 30, 2024
NOTE A
Significant Accounting Policies
AB Active ETFs, Inc. (the “Corporation”) is registered under the Investment Company Act of 1940 (the “1940 Act”) as an open-end management investment company. The Corporation, which is a Maryland corporation, operates as a series company comprised of 15 funds currently in operation. Each fund is considered to be a separate entity for financial reporting and tax purposes. This report relates only to the AB Ultra Short Income ETF (the “Fund”), a diversified portfolio. The Fund commenced investment operations on September 14, 2022. The financial statements have been prepared in conformity with U.S. generally accepted accounting principles (“U.S. GAAP”), which require management to make certain estimates and assumptions that affect the reported amounts of assets and liabilities in the financial statements and amounts of income and expenses during the reporting period. Actual results could differ from those estimates. The Fund is an investment company under U.S. GAAP and follows the accounting and reporting guidance applicable to investment companies. The following is a summary of significant accounting policies followed by the Fund.
1. Security Valuation
Portfolio securities are valued at market value determined on the basis of market quotations or, if market quotations are not readily available or are unreliable, at “fair value” as determined in accordance with procedures approved by and under the oversight of the Funds’s Board of Directors (the “Board”). Pursuant to these procedures, AllianceBernstein L.P. (the “Adviser”) serves as the Fund’s valuation designee pursuant to Rule 2a-5 of the 1940 Act. In this capacity, the Adviser is responsible, among other things, for making all fair value determinations relating to the Fund’s portfolio investments, subject to the Board’s oversight.
In general, the market values of securities which are readily available and deemed reliable are determined as follows: securities listed on a national securities exchange (other than securities listed on the NASDAQ Stock Market, Inc. (“NASDAQ”)) or on a foreign securities exchange are valued at the last sale price at the close of the exchange or foreign securities exchange. If there has been no sale on such day, the securities are valued at the last traded price from the previous day. Securities listed on more than one exchange are valued by reference to the principal exchange on which the securities are traded; securities listed only on NASDAQ are valued in accordance with the NASDAQ Official Closing Price; listed or over the counter (“OTC”) market put or call options are valued at the mid level between the current bid and ask prices. If either a current bid or current ask price is unavailable, the Adviser will have discretion to determine the best valuation (e.g., last trade price in the case of listed options); open
| | |
| |
16 | AB ULTRA SHORT INCOME ETF | | abfunds.com |
NOTES TO FINANCIAL STATEMENTS (continued)
futures are valued using the closing settlement price or, in the absence of such a price, the most recent quoted bid price. If there are no quotations available for the day of valuation, the last available closing settlement price is used; U.S. Government securities and any other debt instruments having 60 days or less remaining until maturity are generally valued at fair value by an independent pricing service. If an independent fair value price is not available, the securities are valued at amortized cost. This methodology is commonly used for short term securities that have an original maturity of 60 days or less, as well as short term securities that had an original term to maturity that exceeded 60 days. In instances when amortized cost is utilized, the Valuation Committee (the “Committee”) must reasonably conclude that the utilization of amortized cost is approximately the same as the fair value of the security. Factors the Committee will consider include, but are not limited to, an impairment of the creditworthiness of the issuer or material changes in interest rates. Fixed-income securities, including mortgage-backed and asset-backed securities, may be valued on the basis of prices provided by a pricing service or at a price obtained from one or more of the major broker-dealers. In cases where broker-dealer quotes are obtained, the Adviser may establish procedures whereby changes in market yields or spreads are used to adjust, on a daily basis, a recently obtained quoted price on a security. Swaps and other derivatives are valued daily, primarily using independent pricing services, independent pricing models using market inputs, as well as third party broker-dealers or counterparties. Open-end mutual funds are valued at the closing net asset value (“NAV”) per share, while exchange-traded funds are valued at the closing market price per share.
Securities for which market quotations are not readily available (including restricted securities) or are deemed unreliable are valued at fair value as deemed appropriate by the Adviser. Factors considered in making this determination may include, but are not limited to, information obtained by contacting the issuer, analysts, analysis of the issuer’s financial statements or other available documents. In addition, the Fund may use fair value pricing for securities primarily traded in non-U.S. markets because most foreign markets close well before the Fund values its securities at 4:00 p.m., Eastern Time. The earlier close of these foreign markets gives rise to the possibility that significant events may have occurred in the interim and may materially affect the value of those securities. To account for this, the Fund generally values many of its foreign equity securities using fair value prices at the discretion of the Adviser.
2. Fair Value Measurements
In accordance with U.S. GAAP regarding fair value measurements, fair value is defined as the price that the Fund would receive to sell an asset or pay to transfer a liability in an orderly transaction between market
| | |
| |
| abfunds.com | | AB ULTRA SHORT INCOME ETF | 17 |
NOTES TO FINANCIAL STATEMENTS (continued)
participants at the measurement date. U.S. GAAP establishes a framework for measuring fair value, and a three-level hierarchy for fair value measurements based upon the transparency of inputs to the valuation of an asset or liability (including those valued based on their market values as described in Note A.1 above). Inputs may be observable or unobservable and refer broadly to the assumptions that market participants would use in pricing the asset or liability. Observable inputs reflect the assumptions market participants would use in pricing the asset or liability based on market data obtained from sources independent of the Fund. Unobservable inputs reflect the Fund’s own assumptions about the assumptions that market participants would use in pricing the asset or liability based on the best information available in the circumstances. Each investment is assigned a level based upon the observability of the inputs which are significant to the overall valuation. The three-tier hierarchy of inputs is summarized below.
| | • | | Level 1—quoted prices in active markets for identical investments |
| | • | | Level 2—other significant observable inputs (including quoted prices for similar investments, interest rates, prepayment speeds, credit risk, etc.) |
| | • | | Level 3—significant unobservable inputs (including the Fund’s own assumptions in determining the fair value of investments) |
The fair value of debt instruments, such as bonds, and over-the-counter derivatives is generally based on market price quotations, recently executed market transactions (where observable) or industry recognized modeling techniques and are generally classified as Level 2. Pricing vendor inputs to Level 2 valuations may include quoted prices for similar investments in active markets, interest rate curves, coupon rates, currency rates, yield curves, option adjusted spreads, default rates, credit spreads and other unique security features in order to estimate the relevant cash flows which are then discounted to calculate fair values. If these inputs are unobservable and significant to the fair value, these investments will be classified as Level 3.
Valuations of mortgage-backed or other asset-backed securities, by pricing vendors, are based on both proprietary and industry recognized models and discounted cash flow techniques. Significant inputs to the valuation of these instruments are value of the collateral, the rates and timing of delinquencies, the rates and timing of prepayments, and default and loss expectations, which are driven in part by housing prices for residential mortgages. Significant inputs are determined based on relative value analyses, which incorporate comparisons to instruments with similar collateral and risk profiles, including relevant indices. Mortgage and asset-backed securities for which management has collected current observable
| | |
| |
18 | AB ULTRA SHORT INCOME ETF | | abfunds.com |
NOTES TO FINANCIAL STATEMENTS (continued)
data through pricing services are generally categorized within Level 2. Those investments for which current observable data has not been provided are classified as Level 3.
Other fixed income investments, including non-U.S. government and corporate debt, are generally valued using quoted market prices, if available, which are typically impacted by current interest rates, maturity dates and any perceived credit risk of the issuer. Additionally, in the absence of quoted market prices, these inputs are used by pricing vendors to derive a valuation based upon industry or proprietary models which incorporate issuer specific data with relevant yield/spread comparisons with more widely quoted bonds with similar key characteristics. Those investments for which there are observable inputs are classified as Level 2. Where the inputs are not observable, the investments are classified as Level 3.
The following table summarizes the valuation of the Fund’s investments by the above fair value hierarchy levels as of November 30, 2024:
| | | | | | | | | | | | | | | | |
Investments in
Securities: | | Level 1 | | | Level 2 | | | Level 3 | | | Total | |
Assets: | | | | | | | | | | | | | | | | |
Corporates – Investment Grade | | $ | – 0 | – | | $ | 526,334,926 | | | $ | – 0 | – | | $ | 526,334,926 | |
Governments – Treasuries | | | – 0 | – | | | 390,098,963 | | | | – 0 | – | | | 390,098,963 | |
Asset-Backed Securities | | | – 0 | – | | | 124,428,187 | | | | – 0 | – | | | 124,428,187 | |
Short-Term Investments: | | | | | | | | | | | | | | | | |
Investment Companies | | | 77,872,233 | | | | – 0 | – | | | – 0 | – | | | 77,872,233 | |
Commercial Paper | | | – 0 | – | | | 21,336,889 | | | | – 0 | – | | | 21,336,889 | |
| | | | | | | | | | | | | | | | |
Total Investments in Securities | | | 77,872,233 | | | | 1,062,198,965 | | | | – 0 | – | | | 1,140,071,198 | |
Other Financial Instruments(a): | | | | | | | | | | | | | | | | |
Assets: | | | | | | | | | | | | | | | | |
Futures | | | 511,751 | | | | – 0 | – | | | – 0 | – | | | 511,751 | (b) |
Liabilities | | | – 0 | – | | | – 0 | – | | | – 0 | – | | | – 0 | – |
| | | | | | | | | | | | | | | | |
Total | | $ | 78,383,984 | | | $ | 1,062,198,965 | | | $ | – 0 | – | | $ | 1,140,582,949 | |
| | | | | | | | | | | | | | | | |
| (a) | Other financial instruments include derivative instruments, such as futures, forwards and swaps. Derivative instruments are valued at the unrealized appreciation (depreciation) on the instrument. Other financial instruments may also include swaps with upfront premiums, written options and written swaptions which are valued at market value. |
| (b) | Only variation margin receivable (payable) at period end is reported within the statement of assets and liabilities. This amount reflects cumulative unrealized appreciation (depreciation) on futures and centrally cleared swaps as reported in the portfolio of investments. Where applicable, centrally cleared swaps with upfront premiums are presented here at market value. |
| | |
| |
| abfunds.com | | AB ULTRA SHORT INCOME ETF | 19 |
NOTES TO FINANCIAL STATEMENTS (continued)
3. Currency Translation
Assets and liabilities denominated in foreign currencies and commitments under forward currency exchange contracts are translated into U.S. dollars at the mean of the quoted bid and ask prices of such currencies against the U.S. dollar. Purchases and sales of portfolio securities are translated into U.S. dollars at the rates of exchange prevailing when such securities were acquired or sold. Income and expenses are translated into U.S. dollars at rates of exchange prevailing when accrued.
Net realized gain or loss on foreign currency transactions represents foreign exchange gains and losses from sales and maturities of foreign fixed income investments, holding of foreign currencies, currency gains or losses realized between the trade and settlement dates on foreign investment transactions, and the difference between the amounts of dividends, interest and foreign withholding taxes recorded on the Fund’s books and the U.S. dollar equivalent amounts actually received or paid. Net unrealized currency gains and losses from valuing foreign currency denominated assets and liabilities at period end exchange rates are reflected as a component of net unrealized appreciation or depreciation of foreign currency denominated assets and liabilities.
4. Taxes
It is Fund’s policy to meet the requirements of the Internal Revenue Code applicable to regulated investment companies and to distribute all of its investment company taxable income and net realized gains, if any, to shareholders. Therefore, no provisions for federal income or excise taxes are required. The Fund may be subject to taxes imposed by countries in which it invests. Such taxes are generally based on income and/or capital gains earned or repatriated. Taxes are accrued and applied to net investment income, net realized gains and net unrealized appreciation/depreciation as such income and/or gains are earned.
In accordance with U.S. GAAP requirements regarding accounting for uncertainties in income taxes, management has analyzed the Fund’s tax positions taken or expected to be taken on federal and state income tax returns for all open tax years (the current and prior years) and has concluded that no provision for income tax is required in the Fund’s financial statements.
5. Investment Income and Investment Transactions
Dividend income is recorded on the ex-dividend date or as soon as the Fund is informed of the dividend. Interest income is accrued daily. Investment transactions are accounted for on the date the securities are purchased or sold. Investment gains or losses are determined on the identified cost basis. Non-cash dividends, if any, are recorded on the
| | |
| |
20 | AB ULTRA SHORT INCOME ETF | | abfunds.com |
NOTES TO FINANCIAL STATEMENTS (continued)
ex-dividend date at the fair value of the securities received. The Fund amortizes premiums and accretes discounts as adjustments to interest income.
The Fund accounts for distributions received from real estate investment trust (“REIT”) investments or from regulated investment companies as dividend income, realized gain, or return of capital based on information provided by the REIT or the investment company.
6. Dividends and Distributions
Dividends and distributions to shareholders, if any, are recorded on the ex-dividend date. Income dividends and capital gains distributions are determined in accordance with federal tax regulations and may differ from those determined in accordance with U.S. GAAP. To the extent these differences are permanent, such amounts are reclassified within the capital accounts based on their federal tax basis treatment; temporary differences do not require such reclassification.
7. Offering Expenses
The Adviser has agreed to pay all of the Fund’s organization and offering costs. The Fund is not obligated to repay any such organizational expenses or offering costs paid by the Adviser.
8. Cash and Short-Term Investments
Cash and short-term investments include cash on hand and short-term investments with maturities of less than one year when purchased.
NOTE B
Advisory Fee and Other Transactions with Affiliates
Under the terms of the investment advisory agreement, the Fund pays the Adviser a unitary advisory fee at an annual rate of .25% of the Fund’s average daily net assets. The fees are accrued daily and paid monthly.
Under the investment advisory agreement, in accordance with the unitary fee structure, the Adviser bears the cost of various third-party services required by the Fund, including audit, custodial, accounting, certain legal and transfer agency costs. Also under the investment advisory agreement, the Adviser will reimburse the Fund for the Fund’s share of the acquired funds fees and expenses (advisory fees and other expenses) of any pooled investment vehicle for which the Adviser serves as investment adviser For the year ended November 30, 2024, such waiver/reimbursements relating to the Fund’s investment in AB Government Money Market Portfolio amounted to $78,772.
| | |
| |
| abfunds.com | | AB ULTRA SHORT INCOME ETF | 21 |
NOTES TO FINANCIAL STATEMENTS (continued)
A summary of the Fund’s transactions in AB mutual funds for the year ended November 30, 2024 is as follows:
| | | | | | | | | | | | | | | | | | | | |
Fund | | Market Value
11/30/23
(000) | | | Purchases
at Cost
(000) | | | Sales
Proceeds
(000) | | | Market Value
11/30/24
(000) | | | Dividend
Income
(000) | |
AB Government Money Market Portfolio | | $ | 1,687 | | | $ | 1,174,387 | | | $ | 1,098,202 | | | $ | 77,872 | | | $ | 2,440 | |
NOTE C
Distribution Plan
The Fund has adopted a Distribution and Service Plan pursuant to Rule 12b-1 of the Act which permits the Fund to pay distribution and servicing fees not to exceed .25% per year of the Fund’s average daily net assets. No such fees are currently paid, and the Board has not approved the commencement of payments under the Rule 12b-1 Distribution Plan.
NOTE D
Investment Transactions
Purchases and sales of investment securities (excluding short-term investments and in-kind purchases and sales) for the year ended November 30, 2024 were as follows:
| | | | | | | | |
| | | Purchases | | | Sales | |
Investment securities (excluding U.S. government securities) | | $ | 245,839,080 | | | $ | 112,006,881 | |
U.S. government securities | | | 656,356,352 | | | | 178,018,619 | |
During the year ended November 30, 2024, the Fund delivered portfolio securities for the redemption of Fund shares (in-kind redemptions). Cash and portfolio securities were transferred for redemptions at fair value. For financial reporting purposes, the Fund recorded net realized gains and losses in connection with each in-kind redemption transaction. For the year ended November 30, 2024, the Fund had in-kind purchases and in-kind sales as follows:
| | | | | | | | |
| | | Purchases | | | Sales | |
In-kind transactions (excluding U.S. government securities) | | $ | – 0 | – | | $ | 120,208,993 | |
U.S. government securities | | | – 0 | – | | | 162,328,210 | |
| | |
| |
22 | AB ULTRA SHORT INCOME ETF | | abfunds.com |
NOTES TO FINANCIAL STATEMENTS (continued)
The cost of investments for federal income tax purposes, gross unrealized appreciation and unrealized depreciation are as follows:
| | | | |
Cost | | $ | 1,139,147,485 | |
| | | | |
Gross unrealized appreciation | | $ | 2,373,982 | |
Gross unrealized depreciation | | | (1,450,268 | ) |
| | | | |
Net unrealized appreciation | | $ | 923,714 | |
| | | | |
1. Derivative Financial Instruments
The Fund may use derivatives in an effort to earn income and enhance returns, to replace more traditional direct investments, to obtain exposure to otherwise inaccessible markets (collectively, “investment purposes”), or to hedge or adjust the risk profile of its portfolio.
The principal types of derivatives utilized by the Fund, as well as the methods in which they may be used are:
The Fund may buy or sell futures for investment purposes or for the purpose of hedging its portfolio against adverse effects of potential movements in the market. The Fund bears the market risk that arises from changes in the value of these instruments and the imperfect correlation between movements in the price of the futures and movements in the price of the assets, reference rates or indices which they are designed to track. Among other things, the Fund may purchase or sell futures for foreign currencies or options thereon for non-hedging purposes as a means of making direct investment in foreign currencies, as described below under “Currency Transactions”.
At the time the Fund enters into futures, the Fund deposits with the broker or segregates at its custodian cash or securities as collateral to satisfy initial margin requirements set by the exchange on which the transaction is effected. Pursuant to the contract, with respect to cash collateral, the Fund agrees to receive from or pay to the broker an amount of cash equal to the daily fluctuation in the value of the contract; in the case of securities collateral, the Fund agrees to adjust the securities position held in the segregated account accordingly. Such receipts, payments or adjustments are known as variation margin and are recorded by the Fund as unrealized gains or losses. Risks may arise from the potential inability of a counterparty to meet the terms of the contract. The credit/counterparty risk for exchange-traded futures is generally less than privately negotiated futures, since the clearinghouse, which is the issuer or counterparty to each exchange-traded future, has robust risk mitigation standards, including the requirement to provide initial and variation margin. When
| | |
| |
| abfunds.com | | AB ULTRA SHORT INCOME ETF | 23 |
NOTES TO FINANCIAL STATEMENTS (continued)
the contract is closed, the Fund records a realized gain or loss equal to the difference between the value of the contract at the time it was opened and the time it was closed.
Use of long futures subjects the Fund to risk of loss in excess of the amounts shown on the statement of assets and liabilities, up to the notional value of the futures. Use of short futures subjects the Fund to unlimited risk of loss. Under some circumstances, futures exchanges may establish daily limits on the amount that the price of futures can vary from the previous day’s settlement price, which could effectively prevent liquidation of unfavorable positions.
During the year ended November 30, 2024, the Fund held futures for hedging and non-hedging purposes.
During the year ended November 30, 2024, the Fund had entered into the following derivatives:
| | | | | | | | | | | | | | |
| | | Asset Derivatives | | | Liability Derivatives | |
Derivative Type | | Statement of
Assets and
Liabilities
Location | | Fair Value | | | Statement of
Assets and
Liabilities
Location | | | Fair Value | |
Interest rate contracts | | Receivable for
variation margin
on futures | | $ | 511,751 | * | | | | | | | | |
| | | | | | | | | | | | | | |
Total | | | | $ | 511,751 | | | | | | | | | |
| | | | | | | | | | | | | | |
| * | Only variation margin receivable/payable at period end is reported within the statement of assets and liabilities. This amount reflects cumulative unrealized appreciation (depreciation) on futures and centrally cleared swaps as reported in the portfolio of investments. |
| | | | | | | | | | |
Derivative Type | | Location of
Gain or (Loss)
on Derivatives
Within Statement
of Operations | | Realized Gain
or (Loss) on
Derivatives | | | Change in
Unrealized
Appreciation or
(Depreciation) | |
Interest rate contracts | | Net realized gain (loss) on futures; Net change in unrealized appreciation (depreciation) of futures | | $ | (634,205 | ) | | $ | 327,524 | |
| | | | | | | | | | |
Total | | | | $ | (634,205 | ) | | $ | 327,524 | |
| | | | | | | | | | |
| | |
| |
24 | AB ULTRA SHORT INCOME ETF | | abfunds.com |
NOTES TO FINANCIAL STATEMENTS (continued)
The following table represents the average monthly volume of the Fund’s derivative transactions during the year ended November 30, 2024:
| | | | |
Futures: | | | | |
Average notional amount of buy contracts | | $ | 81,179,703 | (a) |
Average notional amount of sale contracts | | $ | 48,874,828 | (b) |
| (a) | Positions were open for eleven months during the year. |
| (b) | Positions were open for one month during the year. |
2. Currency Transactions
The Fund may invest in non-U.S. Dollar-denominated securities on a currency hedged or unhedged basis. The Fund may seek investment opportunities by taking long or short positions in currencies through the use of currency-related derivatives, including forward currency exchange contracts, futures and options on futures, swaps, and other options. The Fund may enter into transactions for investment opportunities when it anticipates that a foreign currency will appreciate or depreciate in value but securities denominated in that currency are not held by the Fund and do not present attractive investment opportunities. Such transactions may also be used when the Adviser believes that it may be more efficient than a direct investment in a foreign currency-denominated security. The Fund may also conduct currency exchange contracts on a spot basis (i.e., for cash at the spot rate prevailing in the currency exchange market for buying or selling currencies).
NOTE E
Shares of the Fund
The Fund’s shares may only be bought and sold in a secondary market through a broker-dealer at a market price. Because ETF shares trade at market prices rather than NAV, shares may trade at a price greater than NAV (a premium) or less than NAV (a discount). The Fund issues and redeems shares at its NAV only in aggregations of a specified number of shares (a creation unit) generally in exchange for a designated portfolio of securities and/or cash (including any portion of such securities for which cash may be substituted). A fixed transaction fee is imposed on authorized participants in connection with creation unit redemption and creation transactions. Authorized participants may be required to pay an additional variable charge to cover certain costs and expenses related to the execution of trades resulting from creation unit transactions. Such variable charges, if any, are included in other capital within the Statement of Changes in Net Assets.
| | |
| |
| abfunds.com | | AB ULTRA SHORT INCOME ETF | 25 |
NOTES TO FINANCIAL STATEMENTS (continued)
Transactions in shares of the Fund were as follows:
| | | | | | | | | | | | | | | | | | | | | | | | |
| | | | | | | | | | | | | | | | | | | | | | | | |
| | | Shares | | | | | | Amount | | | | |
| | | Year Ended
November 30,
2024 | | | Year Ended
November 30,
2023 | | | | | | Year Ended
November 30,
2024 | | | Year Ended
November 30,
2023 | | | | |
| | | | | | | | |
Shares sold | | | 18,875,000 | | | | 10,250,000 | | | | | | | $ | 952,667,558 | | | $ | 513,575,312 | | | | | |
| | | | | |
Shares redeemed | | | (7,950,000 | ) | | | (1,600,000 | ) | | | | | | | (401,936,205 | ) | | | (80,244,347 | ) | | | | |
| | | | | |
Net increase | | | 10,925,000 | | | | 8,650,000 | | | | | | | $ | 550,731,353 | | | $ | 433,330,965 | | | | | |
| | | | | |
NOTE F
Risks Involved in Investing in the Fund
Market Risk—The value of the Fund’s assets will fluctuate as the market or markets in which the Fund invests fluctuate. The value of the Fund’s investments may decline, sometimes rapidly and unpredictably, simply because of economic changes or other events, including public health crises (including the occurrence of a contagious disease or illness), interest rate levels, and regional and global conflicts, that affect large portions of the market.
Credit Risk—An issuer or guarantor of a fixed-income security may be unable or unwilling to make timely payments of interest or principal, or to otherwise honor its obligations. The issuer or guarantor may default, causing a loss of the full principal amount of a security and accrued interest. The degree of risk for a particular security may be reflected in its credit rating. There is the possibility that the credit rating of a fixed-income security may be downgraded after purchase, which may adversely affect the value of the security.
Interest Rate Risk—Changes in interest rates will affect the value of investments in fixed-income securities. When interest rates rise, the value of existing investments in fixed-income securities tends to fall and this decrease in value may not be offset by higher income from new investments. Interest-rate risk is generally greater for fixed-income securities with longer maturities or durations. The Fund may be subject to a greater risk of rising interest rates than would normally be the case due to the recent end of a period of historically low rates and the effects of potential central bank monetary policy, and government fiscal policy, initiatives and market reactions to those initiatives.
Duration Risk—Duration is a measure that relates the expected price volatility of a fixed-income security to changes in interest rates. The duration of a fixed-income security may be shorter than or equal to full maturity of a fixed-income security. Fixed-income securities with longer durations have more risk and will decrease in price as interest rates rise. For
| | |
| |
26 | AB ULTRA SHORT INCOME ETF | | abfunds.com |
NOTES TO FINANCIAL STATEMENTS (continued)
example, a fixed-income security with a duration of three years will likely decrease in value by approximately 3% if interest rates increase by 1%.
Inflation Risk—This is the risk that the value of assets or income from investments will be less in the future as inflation decreases the value of money. As inflation increases, the value of the Fund’s assets can decline as can the value of the Fund’s distributions. This risk is significantly greater for fixed-income securities with longer maturities.
Mortgage-Related and Other Asset-Backed Securities Risk—Investments in mortgage-related and other asset-backed securities are subject to certain additional risks. The value of these securities may be particularly sensitive to changes in interest rates. These risks include “extension risk”, which is the risk that, in periods of rising interest rates, issuers may delay the payment of principal, and “prepayment risk”, which is the risk that in periods of falling interest rates, issuers may pay principal sooner than expected, exposing the Fund to a lower rate of return upon reinvestment of principal. Mortgage-backed securities offered by nongovernmental issuers and other asset-backed securities may be subject to other risks, such as higher rates of default in the mortgages or assets backing the securities or risks associated with the nature and servicing of mortgages or assets backing the securities. Some mortgage-backed securities are “TBA” securities, which have additional risks.
Foreign (Non-U.S.) Investments Risk—Investments in securities of non-U.S. issuers may involve more risk than those of U.S. issuers. These securities may fluctuate more widely in price and may be more difficult to trade than domestic securities due to adverse market, economic, political, regulatory or other factors.
Illiquid Investments Risk—Illiquid investments risk exists when certain investments are or become difficult to purchase or sell. Difficulty in selling such investments may result in sales at disadvantageous prices affecting the value of your investment in the Fund. Causes of illiquid investments risk may include low trading volumes and large positions. Foreign fixed-income securities may have more illiquid investments risk because secondary trading markets for these securities may be smaller and less well-developed and the securities may trade less frequently than domestic securities. Illiquid investments risk may be higher in a rising interest rate environment, when the value and liquidity of fixed-income securities generally go down.
Active Trading Risk—The Fund expects to engage in active and frequent trading of its portfolio securities and its portfolio turnover rate may greatly exceed 100%. A higher rate of portfolio turnover increases transaction costs, which may negatively affect the Fund’s return. In addition, a high
| | |
| |
| abfunds.com | | AB ULTRA SHORT INCOME ETF | 27 |
NOTES TO FINANCIAL STATEMENTS (continued)
rate of portfolio turnover may result in substantial short-term gains, which may have adverse tax consequences for Fund shareholders.
Investment in Other Investment Companies Risk—As with other investments, investments in other investment companies are subject to market and selection risk. In addition, shareholders of the Fund bear both their proportionate share of expenses in the Fund (including management fees) and, indirectly, the expenses of the investment companies in which the Fund invests (to the extent these expenses are not waived or reimbursed by the Adviser).
ETF Share Price and Net Asset Value Risk—The Fund’s shares are listed for trading on the NYSE Arca, Inc. (the “Exchange”). The Fund’s shares are generally bought and sold in the secondary market at market prices. The NAV per share of the Fund will fluctuate with changes in the market value of the Fund’s holdings. The Fund’s NAV is calculated once per day, at the end of the day. The market price of a share on the Exchange could be higher than the NAV (premium), or lower than the NAV (discount) and may fluctuate during the trading day. When all or a portion of the Fund’s underlying securities trade in a market that is closed when the market for the Fund’s shares is open, there may be differences between the current value of a security and the last quoted price for that security in the closed local market, which could lead to a deviation between the market value of the Fund’s shares and the Fund’s NAV. Disruptions in the creations and redemptions process or the existence of extreme market volatility could result in the Fund’s shares trading above or below NAV. As the Fund may invest in securities traded on foreign exchanges, Fund shares may trade at a larger premium or discount to the Fund’s NAV per share than shares of other ETFs. In addition, in stressed market conditions, the market for Fund shares may become less liquid in response to deteriorating liquidity in the markets for the Fund’s underlying portfolio holdings.
Authorized Participant Risk—Only a limited number of financial institutions that enter into an authorized participant relationship with the Fund (“Authorized Participants”) may engage in creation or redemption transactions. If the Fund’s Authorized Participants decide not to create or redeem shares, Fund shares may trade at a larger premium or discount to the Fund’s NAV per share, or the Fund could face trading halts or de-listing.
Active Trading Market Risk—There is no guarantee that an active trading market for Fund shares will exist at all times. In times of market stress, markets can suffer erratic or unpredictable trading activity, extraordinary volatility or wide bid/ask spreads, which could cause some market makers
| | |
| |
28 | AB ULTRA SHORT INCOME ETF | | abfunds.com |
NOTES TO FINANCIAL STATEMENTS (continued)
and Authorized Participants to reduce their market activity or “step away” from making a market in ETF shares. Market makers and Authorized Participants are not obligated to place or execute purchase and redemption orders. This could cause the Fund’s market price to deviate, materially, from the NAV, and reduce the effectiveness of the ETF arbitrage process. Any absence of an active trading market for Fund shares could lead to a heightened risk that there will be a difference between the market price of a Fund share and the underlying value of the Fund share.
Indemnification Risk—In the ordinary course of business, the Fund enters into contracts that contain a variety of indemnifications. The Fund’s maximum exposure under these arrangements is unknown. However, the Fund has not had prior claims or losses pursuant to these indemnification provisions and expects the risk of loss thereunder to be remote. Therefore, the Fund has not accrued any liability in connection with these indemnification provisions.
Management Risk—The Fund is subject to management risk because it is an actively-managed ETF. The Adviser will apply its investment techniques and risk analyses in making investment decisions, but there is no guarantee that its techniques will produce the intended results. Some of these techniques may incorporate, or rely upon, quantitative models, but there is no guarantee that these models will generate accurate forecasts, reduce risk or otherwise perform as expected.
NOTE G
Joint Credit Facility
A number of ETFs managed by the Adviser, including the Fund, participate in a $325 million revolving credit facility (the “Facility”) intended to provide short-term financing related to redemptions and other short term liquidity requirements, subject to certain restrictions. Commitment fees related to the Facility are paid by the participating funds and are included in miscellaneous expenses in the statement of operations. The Fund did not utilize the Facility during the year ended November 30, 2024.
NOTE H
Distributions to Shareholders
The tax character of distributions paid during the fiscal years ended November 30, 2024 and November 30, 2023 were as follows:
| | | | | | | | |
| | | 2024 | | | 2023 | |
Distributions paid from: | | | | | | | | |
Ordinary income | | $ | 48,760,403 | | | $ | 18,014,901 | |
| | | | | | | | |
Total taxable distributions | | $ | 48,760,403 | | | $ | 18,014,901 | |
| | | | | | | | |
| | |
| |
| abfunds.com | | AB ULTRA SHORT INCOME ETF | 29 |
NOTES TO FINANCIAL STATEMENTS (continued)
As of November 30, 2024, the components of accumulated earnings (deficit) on a tax basis were as follows:
| | | | |
Undistributed ordinary income | | $ | 5,508,568 | |
Accumulated capital and other losses | | | (561,860 | )(a) |
Unrealized appreciation (depreciation) | | | 923,714 | (b) |
| | | | |
Total accumulated earnings (deficit) | | $ | 5,870,422 | |
| | | | |
| (a) | As of November 30, 2024, the Fund had a net capital loss carryforward of $551,345. As of November 30, 2024, the cumulative deferred loss on straddles was $10,515. |
| (b) | The differences between book-basis and tax-basis unrealized appreciation (depreciation) are attributable primarily to the recognition for tax purposes of unrealized gains (losses) on certain derivative instruments and the tax treatment of callable bonds. |
For tax purposes, net realized capital losses may be carried over to offset future capital gains, if any. Funds are permitted to carry forward capital losses for an indefinite period, and such losses will retain their character as either short-term or long-term capital losses. As of November 30, 2024, the Fund had a net short-term capital loss carryforward of $551,345, which may be carried forward for an indefinite period.
During the current fiscal year, permanent differences primarily due to the tax treatment of gains from a redemption-in-kind resulted in a net decrease in distributable earnings and a net increase in additional paid-in capital. These reclassifications had no effect on net assets.
NOTE I
Recent Accounting Pronouncements
In December 2022, the Financial Accounting Standards Board issued an Accounting Standards Update, ASU 2022-06, “Reference Rate Reform (Topic 848) – Deferral of the Sunset Date of Topic 848”. ASU 2022-06 is an amendment to ASU 2020-04, which provided optional guidance to ease the potential accounting burden due to the discontinuation of the LIBOR and other interbank-offered based reference rates and which was effective as of March 12, 2020 through December 31, 2022. ASU 2022-06 extends the effective period through December 31, 2024. Management is currently evaluating the impact, if any, of applying ASU 2022-06.
In November 2023, the Financial Accounting Standards Board issued Accounting Standards Update, ASU 2023-07, “Segment Reporting (Topic 280)”. ASU 2023-07 requires public entities to provide disclosure of significant segment expenses that are regularly provided to the chief operating decision maker (“CODM”). ASU 2023-07, among other things, (i) requires a single segment public entity to provide all necessary disclosures required by Topic 280 it, (ii) requires a public entity to disclose the title and position of the CODM and an explanation of how the CODM uses the reported measure(s) of segment profit and loss in assessing segment
| | |
| |
30 | AB ULTRA SHORT INCOME ETF | | abfunds.com |
NOTES TO FINANCIAL STATEMENTS (continued)
performance and deciding how to allocate resources and (iii) provides the ability for a public entity to elect more than one performance measure. ASU 2023-07 is effective for fiscal years beginning after December 15, 2023, and interim periods within fiscal years beginning after December 15, 2024. Early adoption of ASU 2023-07 is permitted. Management is currently evaluating the impact, if any, of applying ASU 2023-07.
NOTE J
Subsequent Events
Management has evaluated subsequent events for possible recognition or disclosure in the financial statements through the date the financial statements are issued. Management has determined that there are no material events that would require disclosure in the Fund’s financial statements through this date.
| | |
| |
| abfunds.com | | AB ULTRA SHORT INCOME ETF | 31 |
FINANCIAL HIGHLIGHTS
Selected Data For A Share of Capital Stock Outstanding Throughout Each Period
| | | | | | | | | | | | |
| | | Year Ended
November 30, | | | September 14,
2022(a) to
November 30, 2022 | |
| | | 2024 | | | 2023 | |
| | | | |
Net asset value, beginning of period | | | $ 50.34 | | | | $ 49.98 | | | | $ 50.00 | |
| | | | |
Income From Investment Operations | | | | | | | | | | | | |
| | | |
Net investment income(b)(c) | | | 2.66 | | | | 2.63 | | | | .42 | |
| | | |
Net realized and unrealized gain (loss) on investment transactions | | | .22 | | | | .14 | | | | (.20 | ) |
| | | | |
Net increase in net asset value from operations | | | 2.88 | | | | 2.77 | | | | .22 | |
| | | | |
Less: Dividends | | | | | | | | | | | | |
| | | |
Dividends from net investment income | | | (2.59 | ) | | | (2.41 | ) | | | (.24 | ) |
| | | | |
Net asset value, end of period | | | $ 50.63 | | | | $ 50.34 | | | | $ 49.98 | |
| | | | |
| | | |
Total Return | | | | | | | | | | | | |
| | | |
Total investment return based on net asset value(d) | | | 5.87 | % | | | 5.66 | % | | | .46 | % |
| | | |
Ratios/Supplemental Data | | | | | | | | | | | | |
| | | |
Net assets, end of period (000’s omitted) | | | $1,143,129 | | | | $586,540 | | | | $150,002 | |
| | | |
Ratio to average net assets of: | | | | | | | | | | | | |
| | | |
Expenses, net of waivers/reimbursements(e) | | | .24 | % | | | .25 | % | | | .25 | %^ |
| | | |
Expenses, before waivers/reimbursements(e) | | | .25 | % | | | .25 | % | | | .25 | %^ |
| | | |
Net investment income(c) | | | 5.28 | % | | | 5.30 | % | | | 3.98 | %^ |
| | | |
Portfolio turnover rate(f) | | | 59 | % | | | 114 | % | | | 35 | % |
| (a) | Commencement of operations. |
| (b) | Based on average shares outstanding. |
| (c) | Net of expenses waived/reimbursed by the Adviser. |
| (d) | Total investment return is calculated assuming an initial investment made at the net asset value at the beginning of the period, reinvestment of all dividends and distributions at net asset value during the period, and redemption on the last day of the period. Total investment return does not reflect the deduction of taxes that a shareholder would pay on fund distributions or the redemption of fund shares. Total investment return calculated for a period of less than one year is not annualized. |
| (e) | In connection with the Fund’s investments in affiliated underlying portfolios, the Fund incurs no direct expenses, but bears proportionate shares of the fees and expenses (i.e., operating, administrative and investment advisory fees) of the affiliated underlying portfolios. The Adviser has contractually agreed to waive its fees from the Fund in an amount equal to the Fund’s pro rata share of certain acquired fund fees and expenses, and for the year ended November 30, 2024, such waiver amounted to .01%. |
| (f) | Excludes the value of portfolio securities received or delivered as a result of in-kind purchases or redemptions of the fund’s capital shares, including ETF Creation Units. |
See notes to financial statements.
| | |
| |
32 | AB ULTRA SHORT INCOME ETF | | abfunds.com |
REPORT OF INDEPENDENT REGISTERED
PUBLIC ACCOUNTING FIRM
To the Shareholders and the Board of Directors of
AB Ultra Short Income ETF
Opinion on the Financial Statements
We have audited the accompanying statement of assets and liabilities of AB Ultra Short Income ETF (the “Fund”) (one of the funds constituting AB Active ETFs, Inc. (the “Corporation”)), including the portfolio of investments, as of November 30, 2024, and the related statement of operations for the year then ended, the statements of changes in net assets for each of the two years in the period then ended and the financial highlights for each of the two years in the period then ended and the period from September 14, 2022 (commencement of operations) to November 30, 2022 and the related notes (collectively referred to as the “financial statements”). In our opinion, the financial statements present fairly, in all material respects, the financial position of the Fund (one of the funds constituting AB Active ETFs, Inc.) at November 30, 2024, the results of its operations for the year then ended and the changes in its net assets for each of the two years in the period then ended and its financial highlights for each of the two years in the period then ended and the period from September 14, 2022 (commencement of operations) to November 30, 2022, in conformity with U.S. generally accepted accounting principles.
Basis for Opinion
These financial statements are the responsibility of the Corporation’s management. Our responsibility is to express an opinion on the Fund’s financial statements based on our audits. We are a public accounting firm registered with the Public Company Accounting Oversight Board (United States) (“PCAOB”) and are required to be independent with respect to the Corporation in accordance with the U.S. federal securities laws and the applicable rules and regulations of the Securities and Exchange Commission and the PCAOB.
We conducted our audits in accordance with the standards of the PCAOB. Those standards require that we plan and perform the audit to obtain reasonable assurance about whether the financial statements are free of material misstatement, whether due to error or fraud. The Corporation is not required to have, nor were we engaged to perform, an audit of the Corporation’s internal control over financial reporting. As part of our audits, we are required to obtain an understanding of internal control over financial reporting but not for the purpose of expressing an opinion on the effectiveness of the Corporation’s internal control over financial reporting. Accordingly, we express no such opinion.
| | |
| |
| abfunds.com | | AB ULTRA SHORT INCOME ETF | 33 |
REPORT OF INDEPENDENT REGISTERED
PUBLIC ACCOUNTING FIRM (continued)
Our audits included performing procedures to assess the risks of material misstatement of the financial statements, whether due to error or fraud, and performing procedures that respond to those risks. Such procedures included examining, on a test basis, evidence regarding the amounts and disclosures in the financial statements. Our procedures included confirmation of securities owned as of November 30, 2024, by correspondence with the custodian, brokers and others; when replies were not received from brokers or others, we performed other auditing procedures. Our audits also included evaluating the accounting principles used and significant estimates made by management, as well as evaluating the overall presentation of the financial statements. We believe that our audits provide a reasonable basis for our opinion.

We have served as the auditor of one or more of the AB investment companies since 1968.
New York, New York
January 28, 2025
| | |
| |
34 | AB ULTRA SHORT INCOME ETF | | abfunds.com |
2024 FEDERAL TAX INFORMATION
(unaudited)
For Federal income tax purposes, the following information is furnished with respect to the distributions paid by the Fund during the taxable year ended November 30, 2024. For foreign shareholders, 78.68% of ordinary income dividends paid may be considered to be qualifying to be taxed as interest-related dividends.
Shareholders should not use the above information to prepare their income tax returns. The information necessary to complete your income tax returns will be included with your Form 1099-DIV which will be sent to you separately in January 2025.
| | |
| |
| abfunds.com | | AB ULTRA SHORT INCOME ETF | 35 |
Information Regarding the Review and Approval of the Fund’s Advisory Agreement
The disinterested directors (the “directors”) of AB Active ETFs, Inc. (the “Company”) unanimously approved the continuance of the Company’s Advisory Agreement with the Adviser in respect of AB Ultra Short Income ETF (the “Fund”) at a meeting held in-person on July 30-31, 2024 (the “Meeting”).
Prior to approval of the continuance of the Advisory Agreement, the directors had requested from the Adviser, and received and evaluated, extensive materials. They reviewed the proposed continuance of the Advisory Agreement with the Adviser and with experienced counsel who are independent of the Adviser, who advised on the relevant legal standards. The directors also reviewed additional materials, including comparative analytical data prepared by the Senior Vice President of the Fund. The directors also discussed the proposed continuance in private sessions with counsel.
The directors considered their knowledge of the nature and quality of the services provided by the Adviser to the Fund gained from their experience as directors or trustees of most of the registered investment companies advised by the Adviser, including the other series of the Company that are organized as exchange-traded funds (“ETFs”), their overall confidence in the Adviser’s integrity and competence they have gained from that experience, the Adviser’s initiative in identifying and raising potential issues with the directors and its responsiveness, frankness and attention to concerns raised by the directors in the past, including the Adviser’s willingness to consider and implement organizational and operational changes designed to improve investment results and the services provided to the AB Funds. The directors noted that they have four regular meetings each year, at each of which they review extensive materials and information from the Adviser, including information on the investment performance of the Fund and the money market fund advised by the Adviser in which the Fund invests a portion of its assets.
The directors also considered all factors they believed relevant, including the specific matters discussed below. During the course of their deliberations, the directors evaluated, among other things, the reasonableness of the advisory fee. The directors did not identify any particular information that was all-important or controlling, and different directors may have attributed different weights to the various factors. The directors determined that the selection of the Adviser to manage the Fund and the overall arrangements between the Fund and the Adviser, as provided in the Advisory Agreement, including the advisory fee, were fair and reasonable in light of the services performed, expenses incurred and such other matters as the directors considered relevant in the exercise of their business
| | |
| |
36 | AB ULTRA SHORT INCOME ETF | | abfunds.com |
judgment. The material factors and conclusions that formed the basis for the directors’ determinations included the following:
Nature, Extent and Quality of Services Provided
The directors considered the scope and quality of services provided by the Adviser under the Advisory Agreement, including the quality of the investment research capabilities of the Adviser and the other resources it has dedicated to performing services for the Fund. The directors noted that the Adviser from time to time reviews the Fund’s investment strategies and may from time to time propose changes intended to improve the Fund’s relative or absolute performance for the directors’ consideration. They also noted the professional experience and qualifications of the Fund’s portfolio management team and other senior personnel of the Adviser. The directors also considered that the Advisory Agreement provides that the Fund will reimburse the Adviser for the cost to it of providing certain clerical, accounting, administrative and other services to the Fund by employees of the Adviser or its affiliates. Requests for these reimbursements will be subject to the directors’ approval on a quarterly basis. The directors noted that the Adviser does not expect to request such reimbursements. The quality of administrative and other services, including the Adviser’s role in coordinating the activities of the Fund’s other service providers, also was considered. The directors concluded that, overall, they were satisfied with the nature, extent and quality of services provided to the Fund under the Advisory Agreement.
Costs of Services Provided and Profitability
The directors reviewed a schedule of the revenues and expenses and related notes indicating the profitability of the Fund to the Adviser for the period ended December 31, 2022 and calendar year 2023 that had been prepared with an expense allocation methodology arrived at in consultation with an independent consultant at the request of the directors. The directors noted that the assumptions and methods of allocation used by the Adviser in preparing profitability data for ETFs and understood that there are a number of potentially acceptable allocation methodologies for information of this type. The directors noted that the profitability information reflected all revenues and expenses of the Adviser’s relationship with the Fund. The directors recognized that it is difficult to make comparisons of the profitability of the Advisory Agreement with the profitability of ETF advisory contracts for unaffiliated ETFs because comparative information is not generally publicly available and is affected by numerous factors. The directors focused on the profitability of the Adviser’s relationship with the Fund before taxes and distribution expenses. The directors noted that the Fund was not profitable to the Adviser in the periods reviewed.
Fall-Out Benefits
The directors considered the other benefits to the Adviser from its relationship with the Fund and the money market fund advised by the Adviser in
| | |
| |
| abfunds.com | | AB ULTRA SHORT INCOME ETF | 37 |
which the Fund invests. The directors recognized that the Fund’s unprofitability to the Adviser would be exacerbated without these benefits. The directors understood that the Adviser also might derive reputational and other benefits from its association with the Fund.
Investment Results
In addition to the information reviewed by the directors in connection with the Meeting, the directors have received detailed performance information for the Fund at each regular Board meeting since the Fund’s inception.
At the Meeting, the directors reviewed information prepared by an independent service provider (the “15(c) service provider”), showing the Fund’s performance against a group of similar ETFs (“peer group”) and a larger group of similar ETFs (“peer universe”), each selected by the 15(c) service provider, and information prepared by the Adviser showing the Fund’s performance against a broad-based securities market index, in each case for the 1-year period ended May 31, 2024 and (in the case of comparisons with the broad-based securities market index) for the period from inception. The directors discussed with the Adviser the reasons for the Fund’s underperformance in the period reviewed.
Advisory Fees and Other Expenses
The directors considered the advisory fee rate payable by the Fund to the Adviser and information prepared by the 15(c) service provider concerning advisory fee rates payable by other ETFs in the same category as the Fund. The directors noted that the advisory fee is a unitary fee and that the Adviser pays all expenses of the Fund except for certain expenses payable by the Fund such as interest expense, taxes, extraordinary expenses, and brokerage commissions and other transaction costs. The directors recognized that it is difficult to make comparisons of advisory fees because there are variations in the services that are included in the fees payable by other ETFs. The directors compared the Fund’s contractual advisory fee rate against a peer group median and noted that it was equal to the median.
The directors also considered the Adviser’s fee schedule for other clients utilizing investment strategies similar to those of the Fund. For this purpose, they reviewed the relevant advisory fee information from the Adviser’s Form ADV and in a report from the Fund’s Senior Vice President and noted the differences between the Fund’s fee schedule, on the one hand, and the Adviser’s institutional fee schedule, on the other. The directors noted that the Adviser may, in some cases, agree to fee rates with large institutional clients that are lower than those reviewed by the directors and that they had previously discussed with the Adviser its policies in respect of such arrangements. The directors also compared the advisory fee rate for the Fund with those for other funds advised by the Adviser utilizing similar investment strategies.
| | |
| |
38 | AB ULTRA SHORT INCOME ETF | | abfunds.com |
The Adviser reviewed with the directors the significantly greater scope of the services it provides to the Fund relative to institutional clients. In this regard, the Adviser noted, among other things, that, compared to institutional accounts, the Fund (i) demands considerably more managerial and administrative resources due to the potential for frequent creations and redemptions of shares; (ii) has more tax and regulatory restrictions and compliance obligations; (iii) must prepare and file or distribute regulatory and other communications about fund operations; and (iv) must provide shareholder servicing to retail investors. The Adviser also reviewed the greater legal risks presented by the large and changing population of Fund shareholders who may assert claims against the Adviser in individual or class actions, and the greater entrepreneurial risk in offering new fund products, which require substantial investment to launch, may not succeed, and generally must be priced to compete with larger, more established funds resulting in lack of profitability to the Adviser until a new fund achieves scale. In light of the substantial differences in services rendered by the Adviser to institutional clients as compared to the Fund, and the different risk profile, the directors considered these fee comparisons inapt and did not place significant weight on them in their deliberations. The directors noted that the unitary fee for the Fund covers additional services provided by third parties and thus is not directly comparable to the Adviser’s institutional fee schedule and the schedule of fees for most other funds advised by the Adviser.
In connection with their review of the Fund’s advisory fee, the directors also considered the Fund’s total expense ratio in comparison to the medians for a peer group and a peer universe selected by the 15(c) service provider. The Fund’s expense ratio was based on the Fund’s latest fiscal year. The directors view expense ratio information as relevant to their evaluation of the Adviser’s services because the Adviser is responsible for coordinating services provided to the Fund by others, and in most cases, the Adviser is responsible for paying for such services under its unitary fee arrangement with the Fund. The directors noted that the Fund’s expense ratio was equal to the median of a peer group and higher than the median of a peer universe. Based on their review, the directors concluded that the Fund’s expense ratio was acceptable.
Economies of Scale
The directors noted that the advisory fee schedule for the Fund does not contain breakpoints and that they had discussed their strong preference for breakpoints in advisory contracts with the Adviser. The directors took into consideration prior presentations by an independent consultant on economies of scale in the mutual fund industry and for the AB Funds, and presentations from time to time by the Adviser concerning certain of its views on economies of scale. The directors also had requested and received from the Adviser certain updates on economies of scale in advance of the Meeting. The directors believe that economies of scale may
| | |
| |
| abfunds.com | | AB ULTRA SHORT INCOME ETF | 39 |
be realized (if at all) by the Adviser across a variety of products and services, and not only in respect of a single fund. The directors noted that there is no established methodology for setting breakpoints that give effect to the fund-specific services provided by a fund’s adviser and to the economies of scale that an adviser may realize in its overall mutual fund business or those components of it which directly or indirectly affect a fund’s operations. The directors observed that in the mutual fund industry as a whole, as well as among ETFs similar to the Fund, there is no uniformity or pattern in the fees and asset levels at which breakpoints (if any) apply. The directors also noted that the advisory agreements for many ETFs do not have breakpoints at all. The directors informed the Adviser that they would monitor the Fund’s asset level and its profitability to the Adviser and anticipated revisiting the question of breakpoints in the future if circumstances warranted doing so.
| | |
| |
40 | AB ULTRA SHORT INCOME ETF | | abfunds.com |
AB ULTRA SHORT INCOME ETF
66 Hudson Boulevard East
New York, NY 10001
800 221 5672
ETF01-USI-0151-1124 
NOV 11.30.24

ANNUAL FINANCIAL STATEMENTS AND ADDITIONAL INFORMATION
AB CONSERVATIVE BUFFER ETF
(NASDAQ: BUFC)

| | |
| |
| Investment Products Offered | | • Are Not FDIC Insured • May Lose Value • Are Not Bank Guaranteed |
Investors should consider the investment objectives, risks, charges and expenses of the Fund carefully before investing. For copies of our prospectus or summary prospectus, which contain this and other information, visit us online at www.abfunds.com or contact your AB representative. Please read the prospectus and/or summary prospectus carefully before investing.
This shareholder report must be preceded or accompanied by the Fund’s prospectus for individuals who are not current shareholders of the Fund.
You may obtain a description of the Fund’s proxy voting policies and procedures, and information regarding how the Fund voted proxies relating to portfolio securities during the most recent 12-month period ended June 30, without charge. Simply visit AB’s website at www.abfunds.com, or go to the Securities and Exchange Commission’s (the “Commission”) website at www.sec.gov, or call AB at (800) 227 4618.
The Fund files its complete schedule of portfolio holdings with the Commission for the first and third quarters of each fiscal year as an exhibit to its reports on Form N-PORT. The Fund’s Form N-PORT reports are available on the Commission’s website at www.sec.gov. AB publishes full portfolio holdings for the Fund daily at www.abfunds.com.
Foreside Fund Services, LLC (“Foreside”) is the distributor of the fund. Foreside is a member of FINRA.
The [A/B] logo and AllianceBernstein® are registered trademarks used by permission of the owner, AllianceBernstein L.P.
PORTFOLIO OF INVESTMENTS
November 30, 2024
| | | | | | | | | | | | |
| | | | | | Notional
Amount | | | U.S. $ Value | |
| |
PURCHASED OPTIONS - CALLS – 99.8% | | | | | | | | | | | | |
Options on Equity Indices – 99.8% | | | | | | | | | | | | |
SPDR S&P 500 ETF Trust
Expiration: Feb 2025; Contracts: 11,605; Exercise Price: USD 2.98;
Counterparty: SG Americas Securities LLC(a)
(premium paid $688,071,930) | | | USD | | | | 3,458,290 | | | $ | 695,113,389 | |
| | | | | | | | | | | | |
| | | | | | | | | | | | |
PURCHASED OPTIONS - PUTS – 1.6% | | | | | | | | | | | | |
Options on Equity Indices – 1.6% | | | | | | | | | | | | |
SPDR S&P 500 ETF Trust
Expiration: Feb 2025; Contracts: 11,605; Exercise Price: USD 596.90;
Counterparty: SG Americas Securities LLC(a)
(premium paid $15,501,762) | | | USD | | | | 692,702,450 | | | | 11,233,872 | |
| | | | | | | | | | | | |
| | | |
| | | | | | Shares | | | | |
SHORT-TERM INVESTMENTS – 0.5% | | | | | | | | | | | | |
Investment Companies – 0.5% | | | | | | | | | | | | |
AB Fixed Income Shares, Inc. – Government Money Market Portfolio – Class AB,
4.54%(b)(c)(d)
(cost $3,851,274) | | | | | | | 3,851,274 | | | | 3,851,274 | |
| | | | | | | | | | | | |
| | | |
Total Investments – 101.9%
(cost $707,424,966) | | | | | | | | | | | 710,198,535 | |
Other assets less liabilities – (1.9)% | | | | | | | | | | | (13,459,844 | ) |
| | | | | | | | | | | | |
| | | |
Net Assets – 100.0% | | | | | | | | | | $ | 696,738,691 | |
| | | | | | | | | | | | |
CALL OPTIONS WRITTEN (see Note D)
| | | | | | | | | | | | | | | | | | | | | | | | | | | | | | | | | | |
| Description | | Counterparty | | Contracts | | | Exercise
Price | | | Expiration
Month | | | Notional
(000) | | | Premiums
Received | | | U.S. $ Value | |
SPDR S&P 500 ETF Trust(e) | | SG
Americas
Securities
LLC | | | 11,605 | | | | USD | | | | 617.55 | | | | February 2025 | | | | USD | | | | 716,667 | | | $ | 11,481,490 | | | $ | (11,088,113 | ) |
PUT OPTIONS WRITTEN (see Note D)
| | | | | | | | | | | | | | | | | | | | | | | | | | | | | | | | | | |
| Description | | Counterparty | | Contracts | | | Exercise
Price | | | Expiration
Month | | | Notional
(000) | | | Premiums
Received | | | U.S. $ Value | |
SPDR S&P 500 ETF Trust(e) | | SG
Americas
Securities
LLC | | | 11,605 | | | | USD | | | | 507.37 | | | | February 2025 | | | | USD | | | | 588,803 | | | $ | 2,740,887 | | | $ | (1,978,189 | ) |
| (a) | Non-income producing security. |
| (b) | Affiliated investments. |
| (c) | To obtain a copy of the fund’s shareholder report, please go to the Securities and Exchange Commission’s website at www.sec.gov, or call AB at (800) 227-4618. |
| | |
| |
| abfunds.com | | AB CONSERVATIVE BUFFER ETF | 1 |
PORTFOLIO OF INVESTMENTS (continued)
| (d) | The rate shown represents the 7-day yield as of period end. |
| (e) | One contract relates to 100 shares. |
Glossary:
ETF – Exchange Traded Fund
SPDR – Standard & Poor’s Depository Receipt
See notes to financial statements.
| | |
| |
2 | AB CONSERVATIVE BUFFER ETF | | abfunds.com |
STATEMENT OF ASSETS & LIABILITIES
November 30, 2024
| | | | |
| Assets | | | | |
Investments in securities, at value | | | | |
Unaffiliated issuers (cost $703,573,692) | | $ | 706,347,261 | |
Affiliated issuers (cost $3,851,274) | | | 3,851,274 | |
Cash | | | 2,801,237 | |
Cash collateral due from broker | | | 2,000 | |
Receivable for investment securities sold | | | 47,911 | |
Affiliated dividends receivable | | | 13,928 | |
Receivable due from Adviser | | | 635 | |
| | | | |
Total assets | | | 713,064,246 | |
| | | | |
| Liabilities | | | | |
Options written, at value (premiums received $14,222,377) | | | 13,066,302 | |
Payable for investment securities purchased | | | 2,848,792 | |
Advisory fee payable | | | 410,461 | |
| | | | |
Total liabilities | | | 16,325,555 | |
| | | | |
Net Assets | | $ | 696,738,691 | |
| | | | |
| Composition of Net Assets | | | | |
Capital stock, at par | | $ | 1,773 | |
Additional paid-in capital | | | 747,748,837 | |
Accumulated loss | | | (51,011,919 | ) |
| | | | |
Net Assets | | $ | 696,738,691 | |
| | | | |
Net Asset Value Per Share—500 million shares of capital stock authorized, $.0001 par value
(based on 17,725,028 common shares outstanding) | | $ | 39.31 | |
| | | | |
See notes to financial statements.
| | |
| |
| abfunds.com | | AB CONSERVATIVE BUFFER ETF | 3 |
STATEMENT OF OPERATIONS
For the Period from December 13, 2023(a) to November 30, 2024
| | | | | | | | |
| Investment Income | | | | | | | | |
Dividends—Affiliated issuers | | $ | 134,400 | | | $ | 134,400 | |
| | | | | | | | |
| Expenses | | | | | | | | |
Advisory fee (see Note B) | | | 3,422,205 | | | | | |
| | | | | | | | |
Total expenses | | | 3,422,205 | | | | | |
Less: expenses waived and reimbursed by the Adviser (see Note B) | | | (4,554 | ) | | | | |
| | | | | | | | |
Net expenses | | | | | | | 3,417,651 | |
| | | | | | | | |
Net investment loss | | | | | | | (3,283,251 | ) |
| | | | | | | | |
| Realized and Unrealized Gain (Loss) on Investment Transactions | | | | | | | | |
Net realized gain (loss) on: | | | | | | | | |
Investment transactions | | | | | | | (18,615,532 | ) |
In-kind redemptions | | | | | | | 113,149,475 | |
Options written | | | | | | | (36,375,868 | ) |
Net change in unrealized appreciation (depreciation) of: | | | | | | | | |
Investments | | | | | | | 2,773,569 | |
Options written | | | | | | | 1,156,075 | |
| | | | | | | | |
Net gain on investment transactions | | | | | | | 62,087,719 | |
| | | | | | | | |
Net Increase in Net Assets from Operations | | | | | | $ | 58,804,468 | |
| | | | | | | | |
| (a) | Commencement of operations. |
See notes to financial statements.
| | |
| |
4 | AB CONSERVATIVE BUFFER ETF | | abfunds.com |
STATEMENT OF CHANGES IN NET ASSETS
| | | | |
| | | December 13,
2023(a)
November 30,
2024 | |
| Increase (Decrease) in Net Assets from Operations | | | | |
Net investment loss | | $ | (3,283,251 | ) |
Net realized gain on investment transactions | | | 58,158,075 | |
Net change in unrealized appreciation (depreciation) of investments | | | 3,929,644 | |
| | | | |
Net increase in net assets from operations | | | 58,804,468 | |
| Transactions in Shares of the Fund | | | | |
Net increase | | | 637,933,635 | |
Other capital | | | 588 | |
| | | | |
Total increase | | | 696,738,691 | |
| Net Assets | | | | |
Beginning of period | | | – 0 | – |
| | | | |
End of period | | $ | 696,738,691 | |
| | | | |
| (a) | Commencement of operations. |
See notes to financial statements.
| | |
| |
| abfunds.com | | AB CONSERVATIVE BUFFER ETF | 5 |
NOTES TO FINANCIAL STATEMENTS
November 30, 2024
NOTE A
Significant Accounting Policies
AB Active ETFs, Inc. (the “Corporation”) is registered under the Investment Company Act of 1940 (the “1940 Act”) as an open-end management investment company. The Corporation, which is a Maryland corporation, operates as a series company comprised of 15 funds currently in operation. Each fund is considered to be a separate entity for financial reporting and tax purposes. This report relates only to the AB Conservative Buffer ETF (the “Fund”), a non-diversified portfolio. The Fund commenced investment operations on December 13, 2023. The Fund is an actively managed exchange-traded fund (“ETF”). The Fund seeks to achieve its investment objective by investing, under normal conditions, substantially all of its assets in a combination of exchange-traded options contracts on an underlying ETF (“Underlying ETF”). The Underlying ETF (initially expected to be the SPDR® S&P 500® ETF Trust) is an ETF that seeks to track the investment results of the S&P 500 Index (the “Underlying ETF’s Index”), which measures the performance of the large capitalization sector of the U.S. equity market, as determined by S&P Dow Jones Indices LLC. The Fund uses an options strategy that seeks to produce investment outcomes based on the performance of the Underlying ETF, subject to an approximate upside limit typically between 2 and 4% (“Hedge Period Cap”), while also seeking to provide protection against Underlying ETF share price declines of up to a 15% limit (“Hedge Period Buffer”), over a designated period (typically 90 days, but may be up to 120 days, after portfolio rebalance) (each, a “Hedge Period”). Periodically, the Fund may bear a “first loss” of 1% when doing so permits the Fund to maintain a higher Hedge Period Cap. AllianceBernstein (the “Adviser”) seeks to monitor the performance of this Options Portfolio (“Options Portfolio”) and may rebalance the portfolio (by liquidating all or a portion of the options portfolio) at any time to protect capital or lock-in some portfolio gains of the Fund (“Upside Ratchet”) depending on its evaluation of market conditions. If there is an Upside Ratchet, the Hedge Period may be shorter. The Fund typically utilizes customized call and put equity or index exchange-traded options contracts that reference the Underlying ETF, referred to as Flexible Exchange Options (“FLEX Options”), as well as other listed options that reference the price performance of the Underlying ETF, the Underlying ETF’s Index, or ETFs that replicate the Underlying ETF’s Index. FLEX Options provide investors with the ability to customize key option contract terms such as strike price, style and expiration date and are typically centrally cleared. The financial statements have been prepared in conformity with U.S. generally accepted accounting principles (“U.S. GAAP”), which require management to make certain estimates and assumptions that affect the reported amounts of assets and liabilities in the financial statements and amounts of income and expenses during the reporting period. Actual results could differ from those estimates. The Fund is an investment
| | |
| |
6 | AB CONSERVATIVE BUFFER ETF | | abfunds.com |
NOTES TO FINANCIAL STATEMENTS (continued)
company under U.S. GAAP and follows the accounting and reporting guidance applicable to investment companies. The following is a summary of significant accounting policies followed by the Fund.
1. Security Valuation
Portfolio securities are valued at market value determined on the basis of market quotations or, if market quotations are not readily available or are unreliable, at “fair value” as determined in accordance with procedures approved by and under the oversight of the Fund’s Board of Directors (the “Board”). Pursuant to these procedures, the Adviser serves as the Fund’s valuation designee pursuant to Rule 2a-5 of the 1940 Act. In this capacity, the Adviser is responsible, among other things, for making all fair value determinations relating to the Fund’s portfolio investments, subject to the Board’s oversight.
In general, the market values of securities which are readily available and deemed reliable are determined as follows: securities listed on a national securities exchange (other than securities listed on the NASDAQ Stock Market, Inc. (“NASDAQ”)) or on a foreign securities exchange are valued at the last sale price at the close of the exchange or foreign securities exchange. If there has been no sale on such day, the securities are valued at the last traded price from the previous day. Securities listed on more than one exchange are valued by reference to the principal exchange on which the securities are traded; securities listed only on NASDAQ are valued in accordance with the NASDAQ Official Closing Price; listed or over the counter (“OTC”) market put or call options are valued at the mid level between the current bid and ask prices. If either a current bid or current ask price is unavailable, the Adviser will have discretion to determine the best valuation (e.g., last trade price in the case of listed options); open futures are valued using the closing settlement price or, in the absence of such a price, the most recent quoted bid price. If there are no quotations available for the day of valuation, the last available closing settlement price is used; U.S. Government securities and any other debt instruments having 60 days or less remaining until maturity are generally valued at fair value by an independent pricing service. If an independent fair value price is not available, the securities are valued at amortized cost. This methodology is commonly used for short term securities that have an original maturity of 60 days or less, as well as short term securities that had an original term to maturity that exceeded 60 days. In instances when amortized cost is utilized, the Valuation Committee (the “Committee”) must reasonably conclude that the utilization of amortized cost is approximately the same as the fair value of the security. Factors the Committee will consider include, but are not limited to, an impairment of the creditworthiness of the issuer or material changes in interest rates. Fixed-income securities, including mortgage-backed and asset-backed securities, may be valued on the basis of prices provided by a pricing service or at a price obtained from one or more of the major broker-dealers. In cases where broker-dealer quotes are obtained, the Adviser may establish procedures whereby
| | |
| |
| abfunds.com | | AB CONSERVATIVE BUFFER ETF | 7 |
NOTES TO FINANCIAL STATEMENTS (continued)
changes in market yields or spreads are used to adjust, on a daily basis, a recently obtained quoted price on a security. Swaps and other derivatives are valued daily, primarily using independent pricing services, independent pricing models using market inputs, as well as third party broker-dealers or counterparties. Open-end mutual funds are valued at the closing net asset value (“NAV”) per share, while exchange-traded funds are valued at the closing market price per share.
Securities for which market quotations are not readily available (including restricted securities) or are deemed unreliable are valued at fair value as deemed appropriate by the Adviser. Factors considered in making this determination may include, but are not limited to, information obtained by contacting the issuer, analysts, analysis of the issuer’s financial statements or other available documents. In addition, the Fund may use fair value pricing for securities primarily traded in non-U.S. markets because most foreign markets close well before the Fund values its securities at 4:00 p.m., Eastern Time. The earlier close of these foreign markets gives rise to the possibility that significant events may have occurred in the interim and may materially affect the value of those securities. To account for this, the Fund may value foreign equity securities using fair value prices at the discretion of the Adviser.
2. Fair Value Measurements
In accordance with U.S. GAAP regarding fair value measurements, fair value is defined as the price that the Fund would receive to sell an asset or pay to transfer a liability in an orderly transaction between market participants at the measurement date. U.S. GAAP establishes a framework for measuring fair value, and a three-level hierarchy for fair value measurements based upon the transparency of inputs to the valuation of an asset or liability (including those valued based on their market values as described in Note A.1 above). Inputs may be observable or unobservable and refer broadly to the assumptions that market participants would use in pricing the asset or liability. Observable inputs reflect the assumptions market participants would use in pricing the asset or liability based on market data obtained from sources independent of the Fund. Unobservable inputs reflect the Fund’s own assumptions about the assumptions that market participants would use in pricing the asset or liability based on the best information available in the circumstances. Each investment is assigned a level based upon the observability of the inputs which are significant to the overall valuation. The three-tier hierarchy of inputs is summarized below.
| | • | | Level 1—quoted prices in active markets for identical investments |
| | • | | Level 2—other significant observable inputs (including quoted prices for similar investments, interest rates, prepayment speeds, credit risk, etc.) |
| | • | | Level 3—significant unobservable inputs (including the Fund’s own assumptions in determining the fair value of investments) |
| | |
| |
8 | AB CONSERVATIVE BUFFER ETF | | abfunds.com |
NOTES TO FINANCIAL STATEMENTS (continued)
Where readily available market prices or relevant bid prices are not available for certain equity investments, such investments may be valued based on similar publicly traded investments, movements in relevant indices since last available prices or based upon underlying company fundamentals and comparable company data (such as multiples to earnings or other multiples to equity). Where an investment is valued using an observable input, such as another publicly traded security, the investment will be classified as Level 2. If management determines that an adjustment is appropriate based on restrictions on resale, illiquidity or uncertainty, and such adjustment is a significant component of the valuation, the investment will be classified as Level 3. An investment will also be classified as Level 3 where management uses company fundamentals and other significant inputs to determine the valuation.
Options are valued using market-based inputs to models, broker or dealer quotations, or alternative pricing sources with reasonable levels of price transparency, where such inputs and models are available. Alternatively, the values may be obtained through unobservable management determined inputs and/or management’s proprietary models. Where models are used, the selection of a particular model to value an option depends upon the contractual terms of, and specific risks inherent in, the option as well as the availability of pricing information in the market. Valuation models require a variety of inputs, including contractual terms, market prices, measures of volatility and correlations of such inputs. Exchange traded options generally will be classified as Level 2. For options that do not trade on an exchange but trade in liquid markets, inputs can generally be verified and model selection does not involve significant management judgment. Options are classified within Level 2 on the fair value hierarchy when all of the significant inputs can be corroborated to market evidence. Otherwise such instruments are classified as Level 3.
The following table summarizes the valuation of the Fund’s investments by the above fair value hierarchy levels as of November 30, 2024:
| | | | | | | | | | | | | | | | |
Investments in
Securities: | | Level 1 | | | Level 2 | | | Level 3 | | | Total | |
Assets: | |
Purchased Options – Calls | | $ | – 0 | – | | $ | 695,113,389 | | | $ | – 0 | – | | $ | 695,113,389 | |
Purchased Options – Puts | | | – 0 | – | | | 11,233,872 | | | | – 0 | – | | | 11,233,872 | |
Short-Term Investments | | | 3,851,274 | | | | – 0 | – | | | – 0 | – | | | 3,851,274 | |
| | | | | | | | | | | | | | | | |
Total Investments in Securities | | | 3,851,274 | | | | 706,347,261 | | | | – 0 | – | | | 710,198,535 | |
Other Financial Instruments(a): | | | | | | | | | | | | | | | | |
Assets | | | – 0 | – | | | – 0 | – | | | – 0 | – | | | – 0 | – |
Liabilities: | |
Call Written Options | | | – 0 | – | | | (11,088,113 | ) | | | – 0 | – | | | (11,088,113 | ) |
Put Written Options | | | – 0 | – | | | (1,978,189 | ) | | | – 0 | – | | | (1,978,189 | ) |
| | | | | | | | | | | | | | | | |
Total | | $ | 3,851,274 | | | $ | 693,280,959 | | | $ | – 0 | – | | $ | 697,132,233 | |
| | | | | | | | | | | | | | | | |
| (a) | Other financial instruments include derivative instruments, such as futures, forwards and swaps. Derivative instruments are valued at the unrealized appreciation (depreciation) on the instrument. Other financial instruments may also include swaps with upfront premiums, written options and written swaptions which are valued at market value. |
| | |
| |
| abfunds.com | | AB CONSERVATIVE BUFFER ETF | 9 |
NOTES TO FINANCIAL STATEMENTS (continued)
3. Currency Translation
Assets and liabilities denominated in foreign currencies and commitments under forward currency exchange contracts are translated into U.S. dollars at the mean of the quoted bid and ask prices of such currencies against the U.S. dollar. Purchases and sales of portfolio securities are translated into U.S. dollars at the rates of exchange prevailing when such securities were acquired or sold. Income and expenses are translated into U.S. dollars at rates of exchange prevailing when accrued.
Net realized gain or loss on foreign currency transactions represents foreign exchange gains and losses from sales and maturities of foreign fixed income investments, holding of foreign currencies, currency gains or losses realized between the trade and settlement dates on foreign investment transactions, and the difference between the amounts of dividends, interest and foreign withholding taxes recorded on the Fund’s books and the U.S. dollar equivalent amounts actually received or paid. Net unrealized currency gains and losses from valuing foreign currency denominated assets and liabilities at period end exchange rates are reflected as a component of net unrealized appreciation or depreciation of foreign currency denominated assets and liabilities.
4. Taxes
It is the Fund’s policy to meet the requirements of the Internal Revenue Code applicable to regulated investment companies and to distribute all of its investment company taxable income and net realized gains, if any, to shareholders. Therefore, no provisions for federal income or excise taxes are required. The Fund may be subject to taxes imposed by countries in which it invests. Such taxes are generally based on income and/or capital gains earned or repatriated. Taxes are accrued and applied to net investment income, net realized gains and net unrealized appreciation/depreciation as such income and/or gains are earned.
In accordance with U.S. GAAP requirements regarding accounting for uncertainties in income taxes, management has analyzed the Fund’s tax positions taken or expected to be taken on federal and state income tax returns for all open tax years (the current and prior tax years) and has concluded that no provision for income tax is required in the Fund’s financial statements.
5. Investment Income and Investment Transactions
Dividend income is recorded on the ex-dividend date or as soon as the Fund is informed of the dividend. Interest income is accrued daily. Investment gains or losses are determined on the identified cost basis. Non-cash dividends, if any, are recorded on the ex-dividend date at the fair value of the securities received. The Fund amortizes premiums and accretes discounts as adjustments to interest income. Investment transactions are
| | |
| |
10 | AB CONSERVATIVE BUFFER ETF | | abfunds.com |
NOTES TO FINANCIAL STATEMENTS (continued)
accounted for on the date the securities are purchased or sold. The Fund accounts for distributions received from real estate investment trust (“REIT”) investments or from regulated investment companies as dividend income, realized gain, or return of capital based on information provided by the REIT or the investment company.
6. Dividends and Distributions
Dividends and distributions to shareholders, if any, are recorded on the ex-dividend date. Income dividends and capital gains distributions are determined in accordance with federal tax regulations and may differ from those determined in accordance with U.S. GAAP. To the extent these differences are permanent, such amounts are reclassified within the capital accounts based on their federal tax basis treatment; temporary differences do not require such reclassification.
7. Offering Expenses
The Adviser has agreed to pay all of the Fund’s organization and offering costs. The Fund is not obligated to repay any such organizational expenses or offering costs paid by the Adviser.
8. Cash and Short-Term Investments
Cash and short-term investments include cash on hand and short-term investments with maturities of less than one year when purchased.
NOTE B
Advisory Fee and Other Transactions with Affiliates
Under the terms of the investment advisory agreement, the Fund pays the Adviser a unitary advisory fee at an annual rate of .69% of the Fund’s average daily net assets. The fees are accrued daily and paid monthly.
Under the investment advisory agreement, in accordance with the unitary fee structure, the Adviser bears the cost of various third-party services required by the Fund, including audit, custodial, accounting, legal, transfer agency and printing costs and the fees and expenses of the Corporation’s directors and their counsel. Also under the investment advisory agreement, the Adviser will reimburse the Fund for the Fund’s share of the acquired funds fees and expenses (advisory fees and other expenses) of any pooled investment vehicle for which the Adviser serves as investment adviser. For the period ended November 30, 2024, such waiver/reimbursements relating to the Fund’s investment in AB Government Money Market Portfolio amounted to $4,554.
| | |
| |
| abfunds.com | | AB CONSERVATIVE BUFFER ETF | 11 |
NOTES TO FINANCIAL STATEMENTS (continued)
A summary of the Fund’s transactions in AB mutual funds for the period ended November 30, 2024 is as follows:
| | | | | | | | | | | | | | | | | | | | |
Fund | | Market Value
11/30/23
(000) | | | Purchases
at Cost
(000) | | | Sales
Proceeds
(000) | | | Market Value
11/30/24
(000) | | | Dividend
Income
(000) | |
AB Government Money Market Portfolio | | $ | – 0 | – | | $ | 21,110 | | | $ | 17,259 | | | $ | 3,851 | | | $ | 134 | |
NOTE C
Distribution Plan
The Fund has adopted a Distribution and Service Plan pursuant to Rule 12b-1 of the Act which permits the Fund to pay distribution and servicing fees not to exceed .25% per year of the Fund’s average daily net assets. No such fees are currently paid, and the Board has not approved the commencement of payments under the Rule 12b-1 Distribution Plan.
NOTE D
Investment Transactions
Purchases and sales of investment securities (excluding short-term investments and in-kind purchases and sales) for the period ended November 30, 2024 were as follows:
| | | | | | | | |
| | | Purchases | | | Sales | |
Investment securities (excluding U.S. government securities) | | $ | – 0 | – | | $ | – 0 | – |
U.S. government securities | | | – 0 | – | | | – 0 | – |
During the year ended November 30, 2024, the Fund delivered portfolio securities for the redemption of Fund shares (in-kind redemptions). Cash and portfolio securities were transferred for redemptions at fair value. For financial reporting purposes, the Fund recorded net realized gains and losses in connection with each in-kind redemption transaction. For the year ended November 30, 2024, the Fund had in-kind purchases and in-kind sales as follows:
| | | | | | | | |
| | | Purchases | | | Sales | |
In-kind transactions | | | | | | | | |
Investment securities (excluding U.S. government securities) | | $ | 52,127,988 | | | $ | 1,878,898,953 | |
The cost of investments for federal income tax purposes, gross unrealized appreciation and unrealized depreciation are as follows:
| | | | |
Cost | | $ | 707,427,662 | |
| | | | |
Gross unrealized appreciation | | $ | 7,041,459 | |
Gross unrealized depreciation | | | (3,114,511 | ) |
| | | | |
Net unrealized appreciation | | $ | 3 ,926,948 | |
| | | | |
| | |
| |
12 | AB CONSERVATIVE BUFFER ETF | | abfunds.com |
NOTES TO FINANCIAL STATEMENTS (continued)
1. Derivative Financial Instruments
The Fund may use derivatives in an effort to earn income and enhance returns, to replace more traditional direct investments, to obtain exposure to otherwise inaccessible markets (collectively, “investment purposes”), or to hedge or adjust the risk profile of its portfolio.
The principal types of derivatives utilized by the Fund, as well as the methods in which they may be used are:
For hedging and investment purposes, the Fund may purchase and write (sell) put and call options on U.S. and foreign securities, including government securities, and foreign currencies that are traded on U.S. and foreign securities exchanges and over-the-counter markets. Among other things, the Fund may use options transactions for non-hedging purposes as a means of making direct investments in foreign currencies, as described below under “Currency Transactions” and may use options strategies involving the purchase and/or writing of various combinations of call and/or put options, for hedging and investment purposes.
The risk associated with purchasing an option is that the Fund pays a premium whether or not the option is exercised. Additionally, the Fund bears the risk of loss of the premium and change in market value should the counterparty not perform under the contract. If a put or call purchased option by the Fund were permitted to expire without being sold or exercised, its premium would represent a loss to the Fund. Put and call purchased options are accounted for in the same manner as portfolio securities. The cost of securities acquired through the exercise of call options is increased by premiums paid. The proceeds from securities sold through the exercise of put options are decreased by the premiums paid.
When the Fund writes an option, the premium received by the Fund is recorded as a liability and is subsequently adjusted to the current market value of the written option. The Fund’s maximum payment for written put options equates to the number of shares multiplied by the strike price. In certain circumstances maximum payout amounts may be partially offset by recovery values of the respective referenced assets and upfront premium received upon entering into the contract. Premiums received from written options which expire unexercised are recorded by the Fund on the expiration date as realized gains from written options. The difference between the premium received and the amount paid on effecting a closing purchase transaction, including brokerage commissions, is also treated as a realized gain, or if the premium received is less than the amount paid for the closing purchase transaction, as a realized loss. If a call option is exercised,
| | |
| |
| abfunds.com | | AB CONSERVATIVE BUFFER ETF | 13 |
NOTES TO FINANCIAL STATEMENTS (continued)
the premium received is added to the proceeds from the sale of the underlying security or currency in determining whether the Fund has realized a gain or loss. If a put option is exercised, the premium received reduces the cost basis of the security or currency purchased by the Fund. In writing an option, the Fund bears the market risk of an unfavorable change in the price of the security or currency underlying the written option. Exercise of the written option by the Fund could result in the Fund selling or buying a security or currency at a price different from the current market value.
During the period ended November 30, 2024, the Fund held purchased options for non-hedging purposes. During the period ended November 30, 2024, the Fund held written options for non-hedging purposes.
During the period ended November 30, 2024, the Fund had entered into the following derivatives:
| | | | | | | | | | | | | | |
| | | Asset Derivatives | | | Liability Derivatives | |
Derivative Type | | Statement of
Assets and
Liabilities
Location | | Fair Value | | | Statement of
Assets and
Liabilities
Location | | | Fair Value | |
Equity contracts | | Investments
in securities,
at value | | $ | 706,347,261 | | | | | | | | | |
| | | | |
Equity contracts | | | | | | | |
| Options
written,
at value |
| | $ | 13,066,302 | |
| | | | | | | | | | | | | | |
Total | | | | $ | 706,347,261 | | | | | | | $ | 13,066,302 | |
| | | | | | | | | | | | | | |
| | | | | | | | | | | | |
Derivative Type | | Location of Gain or (Loss) on
Derivatives Within Statement
of Operations | | Realized Gain
or (Loss) on
Derivatives | | | Change in
Unrealized
Appreciation or
(Depreciation) | |
Equity contracts | | Net realized gain (loss) on investment transactions; Net change in unrealized appreciation (depreciation) of investments | | $ | (18,615,532 | ) | | $ | 2,773,569 | |
| | | |
Equity contracts | | Net realized gain (loss) on options written; Net change in unrealized appreciation (depreciation) of options written | | | (36,375,868 | ) | | | 1,156,075 | |
| | | | | | | | | | |
Total | | | | $ | (54,991,400 | ) | | $ | 3,929,644 | |
| | | | | | | | | | |
| | |
| |
14 | AB CONSERVATIVE BUFFER ETF | | abfunds.com |
NOTES TO FINANCIAL STATEMENTS (continued)
The following table represents the average monthly volume of the Fund’s derivative transactions during the period ended November 30, 2024:
| | | | |
Purchased Options: | | | | |
Average notional amount | | $ | 523,025,088 | |
Options Written: | | | | |
Average notional amount | | $ | 980,776,698 | |
2. Currency Transactions
The Fund may invest in non-U.S. Dollar-denominated securities on a currency hedged or unhedged basis. The Fund may seek investment opportunities by taking long or short positions in currencies through the use of currency-related derivatives, including forward currency exchange contracts, futures and options on futures, swaps, and other options. The Fund may enter into transactions for investment opportunities when it anticipates that a foreign currency will appreciate or depreciate in value but securities denominated in that currency are not held by the Fund and do not present attractive investment opportunities. Such transactions may also be used when the Adviser believes that it may be more efficient than a direct investment in a foreign currency-denominated security. The Fund may also conduct currency exchange contracts on a spot basis (i.e., for cash at the spot rate prevailing in the currency exchange market for buying or selling currencies).
NOTE E
Shares of the Fund
The Fund’s shares may only be bought and sold in a secondary market through a broker-dealer at a market price. Because ETF shares trade at market prices rather than NAV, shares may trade at a price greater than NAV (a premium) or less than NAV (a discount). The Fund issues and redeems shares at its NAV only in aggregations of a specified number of shares (a creation unit) generally in exchange for a designated portfolio of securities and/or cash (including any portion of such securities for which cash may be substituted). A fixed transaction fee is imposed on authorized participants in connection with creation unit redemption and creation transactions. Authorized participants may be required to pay an additional variable charge to cover certain costs and expenses related to the execution of trades resulting from creation unit transactions. Such variable charges, if any, are included in other capital within the Statement of Changes in Net Assets.
| | |
| |
| abfunds.com | | AB CONSERVATIVE BUFFER ETF | 15 |
NOTES TO FINANCIAL STATEMENTS (continued)
Transactions in shares of the Fund were as follows:
| | | | | | | | | | | | | | | | |
| | | | | | | | | | | | | | | | |
| | | Shares | | | | | | Amount | | | | |
| | | December 13, 2023(a)
November 30,
2024 | | | | | | December 13,
2023(a)
November 30,
2024 | | | | |
| | | | | | | | |
Shares sold | | | 65,900,028 | | | | | | | $ | 2,473,663,303 | | | | | |
| | | | | |
Shares redeemed | | | (48,175,000 | ) | | | | | | | (1,835,729,668 | ) | | | | |
| | | | | |
Net increase | | | 17,725,028 | | | | | | | $ | 637,933,635 | | | | | |
| | | | | |
| (a) | Commencement of operations. |
NOTE F
Risks Involved in Investing in the Fund
Market Risk—The value of the Fund’s assets will fluctuate as the markets for securities in which the Fund invests fluctuate. The value of its investments may decline, sometimes rapidly and unpredictably, simply because of economic changes or other events, including public health crises (including the occurrence of a contagious disease or illness), interest rate levels, and regional and global conflicts, that affect large portions of the market. The Fund is exposed to market risk indirectly through its targeted exposure to the Underlying ETF.
Buffered Loss Risk—There can be no guarantee that the Hedge Period Buffer will be successful in protecting the Fund from the impact of Underlying ETF price declines. Despite the intended Hedge Period Buffer, a shareholder may lose money by investing in the Fund. If, during a Hedge Period, an investor purchases shares of the Fund after the date on which the Fund has entered into FLEX Options or sells shares of the Fund prior to the expiration of the FLEX Options, the Hedge Period Buffer that the Fund seeks to provide may not be available and the investor may not receive the full, or any, benefit of the Hedge Period Buffer. The Fund does not provide principal protection, and an investor may experience significant losses on an investment in the Fund.
A blended portfolio of expiring options and new options could impact the Fund’s ability to realize the full, or any, benefit of the Hedge Period Buffer and may subject the Fund’s return to an upside limit that is slightly lower or higher than the Hedge Period Cap for the applicable Hedge Period. Accordingly, an investor may bear losses against which the Hedge Period Buffer is anticipated to protect and may be subject to an upside limit that is lower than the Hedge Period Cap.
Buffer/Cap Change Risk—A new Hedge Period Buffer and a new Hedge Period Cap are established each time the Options Portfolio is implemented,
| | |
| |
16 | AB CONSERVATIVE BUFFER ETF | | abfunds.com |
NOTES TO FINANCIAL STATEMENTS (continued)
including after an Upside Ratchet event. The duration of a Hedge Period Cap or Hedge Period Buffer may vary.
Capped Upside Risk—If an investor purchases shares of the Fund after the first day of a Hedge Period and the value of the Underlying ETF shares is at or near to the Hedge Period Cap for that Hedge Period, there may be little or no ability for that investor to experience an investment gain on their Fund shares unless the Fund engages in an Upside Ratchet of the Fund’s Options Portfolio. If an investor does not hold its shares of the Fund for an entire Hedge Period, the returns realized by that investor may not replicate those the Fund seeks to achieve. If the Underlying ETF experiences gains during a Hedge Period in excess of the Hedge Period Cap, unless the Fund has engaged in an Upside Ratchet, the Fund will not participate in those gains beyond the Hedge Period Cap.
FLEX Options Liquidity Risk—The FLEX Options are listed on an exchange; however, there is no guarantee that a liquid secondary trading market will exist for the FLEX Options. In the event that trading in the FLEX Options is limited or absent, the value of the Fund’s FLEX Options may decrease. In a less liquid market for the FLEX Options, liquidating the FLEX Options may require the payment of a premium (for written FLEX Options) or acceptance of a discounted price (for purchased FLEX Options) and may take longer to complete. A less liquid trading market may adversely impact the value of the FLEX Options and Fund shares and result in the Fund being unable to achieve its investment objective. The trading market for FLEX Options may lack depth and liquidity when compared to the trading market for certain other securities. FLEX Options may be less liquid than certain non-customized options. In a less liquid market for the FLEX Options, the liquidation of a large number of options may significantly impact the price. A less liquid trading market may adversely impact the value of the FLEX Options and the value of an investment in the Fund.
FLEX Options Valuation Risk—FLEX Options held by the Fund will be exercisable at the strike price only on their expiration date. The value of the FLEX Options will be determined based upon market quotations or using other recognized pricing methods. The value of a FLEX Option prior to its expiration date may vary because of related factors other than the value of the Underlying ETF. Factors that may influence the value of a FLEX Option, other than changes in the value of the Underlying ETF, may include interest rate changes, changing supply and demand, decreased liquidity of the FLEX Options and changing volatility levels of the Underlying ETF. During periods of reduced market liquidity or in the absence of readily available market quotations for the holdings of the Fund, FLEX Options may become more difficult to value and the judgment of the Adviser, as the
| | |
| |
| abfunds.com | | AB CONSERVATIVE BUFFER ETF | 17 |
NOTES TO FINANCIAL STATEMENTS (continued)
Fund’s valuation designee, may play a greater role in the valuation of the Fund’s holdings due to reduced availability of reliable objective pricing data.
Hedge Period Risk—The Fund’s investment strategy is designed to deliver returns that reference an Underlying ETF and are based on options contracts that are designed to be in place for 90-day periods, although in some cases, the Fund will hold options contracts of longer duration. The Fund may not hold its Options Portfolio for the full duration of the options contracts, and the Adviser may change the Options Portfolio at any time, which would begin a new Hedge Period. Investors acquiring shares of the Fund at different time periods will likely have different investment results based on the price of shares of the Underlying ETF and how the Hedge Period Buffer and Hedge Period Cap are applied. Engaging in Upside Ratchets may potentially cause the Fund to have a higher portfolio turnover rate, and higher cost, than a fund that does not actively adjust its Options Portfolio prior to expiration. There is no guarantee that any Upside Ratchet will be successfully implemented, or that it will deliver the desired investment result. The Fund’s Hedge Period Cap and Hedge Period Buffer are designed to work over a particular time frame, the Hedge Period. Investors that acquire Fund shares after the Hedge Period has commenced, or sell Fund shares before the Hedge Period ends or an Upside Ratchet is performed, may have a different investment result than investors who held Fund shares during the entire Hedge Period. The degree to which an investor may benefit from the Hedge Period Buffer or Hedge Period Cap will depend on the point in time when the investor purchases Fund shares and whether the Adviser effectuates an Upside Ratchet. At the time of purchasing Fund shares, an investor may be unable to determine the Fund’s position relative to the Hedge Period Cap and Hedge Period Buffer. If the price of the Underlying ETF is near or has exceeded the strike price of the Fund’s Options Portfolio, there may be little remaining upside potential during a particular Hedge Period, until the Options Portfolio expires or the Adviser effectuates an Upside Ratchet. Investors purchasing Fund shares during this period would still remain subject to significant downside risk before the sought-after protection from the Hedge Period Buffer began. Similarly, if the Underlying ETF has decreased in price significantly to equal or exceed the Fund’s anticipated Hedge Period Buffer, investors would also remain subject to significant downside risk and would receive no benefit from the Hedge Period Buffer. The Fund is continuously offered and a new Hedge Period begins after the end of the prior Hedge Period, with a new Hedge Period Cap and a new Hedge Period Buffer. An investor that holds Fund shares over multiple continuous Hedge Periods may have a different investment result than an investor holding Fund shares for one Hedge Period. The Fund’s return is measured, with respect to the Hedge Period Cap and Hedge Period Buffer,
| | |
| |
18 | AB CONSERVATIVE BUFFER ETF | | abfunds.com |
NOTES TO FINANCIAL STATEMENTS (continued)
over a single Hedge Period. The Fund’s return over a period longer than a single Hedge Period could differ in amount and direction from the return of the Underlying ETF.
Active Trading Risk—The Fund expects to engage in active and frequent trading of its portfolio securities and its portfolio turnover rate may exceed 100%. A higher rate of portfolio turnover increases transaction costs, which may negatively affect the Fund’s return. In addition, a high rate of portfolio turnover may result in substantial short-term gains, which may have adverse tax consequences for Fund shareholders. The Fund’s higher portfolio turnover could also result in deferral of losses, acceleration of gains or treatment of short-term capital gains as ordinary income, all of which could adversely impact Fund shareholders.
Non-Diversification Risk—The Fund may have more risk because it is “non-diversified”, meaning that it can invest more of its assets in a smaller number of issuers. Accordingly, changes in the value of a single security, such as the Underlying ETF, may have a more significant effect, either negative or positive, on the Fund’s NAV.
Underlying ETF Risk—The Fund invests in FLEX Options that reference an ETF, which subjects the Fund to certain of the risks of owning shares of an ETF, as well as the types of instruments in which the Underlying ETF invests. The Underlying ETF is an exchange-traded unit investment trust that uses a full replication strategy, meaning it invests entirely in the S&P 500 Index. The investment objective of the Underlying ETF is to seek to provide investment results that, before expenses, correspond generally to the price and yield performance of the S&P 500 Index, which includes five hundred (500) selected companies, all of which are listed on national stock exchanges and spans over 24 separate industry groups. The value of an ETF will fluctuate over time based on fluctuations in the values of the securities held by the ETF, which may be affected by changes in general economic conditions, expectations for future growth and profits, interest rates and the supply and demand for those securities. In addition, ETFs are subject to authorized participant concentration risk, market maker risk, premium/discount risk, tracking error risk and trading issues risk. Brokerage, tax and other expenses may negatively impact the performance of the Underlying ETF and, in turn, the value of the Fund’s shares. An ETF that tracks an index may not exactly match the performance of the index due to differences between the portfolio of the ETF and the components of the index, expenses, and other factors.
Cash Transactions Risk—The Fund intends to effectuate all or a portion of the issuance and redemption of Creation Units for cash, rather than in-kind securities. As a result, an investment in the Fund may be less
| | |
| |
| abfunds.com | | AB CONSERVATIVE BUFFER ETF | 19 |
NOTES TO FINANCIAL STATEMENTS (continued)
tax-efficient than an investment in an ETF that effectuates its Creation Units only on an in-kind basis. A fund that effects redemptions for cash may be required to sell portfolio securities in order to obtain the cash needed to distribute redemption proceeds. Any recognized gain on these sales by the Fund will generally cause the Fund to recognize a gain it might not otherwise have recognized, or to recognize such gain sooner than would otherwise be required as compared to an ETF that distributes portfolio securities in-kind in redemption of Creation Units. The Fund intends to distribute gains that arise by virtue of the issuance and redemption of Creation Units being effectuated in cash to shareholders to avoid being taxed on this gain at the fund level and otherwise comply with applicable tax requirements. This may cause shareholders to be subject to tax on gains to which they would not otherwise be subject, or at an earlier date than if they had made an investment in another ETF. Moreover, cash transactions may have to be carried out over several days if the securities market is relatively illiquid and may involve considerable brokerage fees and taxes. Brokerage fees, which will be higher than if the Fund sold and redeemed its shares principally in-kind, will be passed on to those purchasing and redeeming Creation Units in the form of creation and redemption transaction fees. In addition, these factors may result in wider spreads between the bid and ask prices of Fund shares than for ETFs that receive and distribute portfolio securities in-kind. The Fund’s use of cash for creations and redemptions could also result in dilution to the Fund and increased transaction costs, which could negatively impact the Fund’s ability to achieve its investment objective.
Derivatives Risk—Derivatives may be difficult to price or unwind and may be leveraged so that small changes may produce disproportionate losses for the Fund. A short position in a derivative instrument involves the risk of a theoretically unlimited increase in the value of the underlying asset, reference rate or index, which could cause the Fund to suffer a potentially unlimited loss. Derivatives, especially over-the-counter derivatives, are also subject to counterparty risk, which is the risk that the counterparty (the party on the other side of the transaction) on a derivative transaction will be unable or unwilling to honor its contractual obligations to the Fund.
Leverage Risk—When the Fund borrows money or otherwise leverages its investments, its performance may be volatile because leverage tends to exaggerate the effect of any increase or decrease in the value of the Fund’s investments. The Fund may create leverage through the use of reverse repurchase arrangements, forward currency exchange contracts, forward commitments, dollar rolls or futures or by borrowing money. The use of other types of derivative instruments by the Fund, such as options and swaps, may also result in a form of leverage. Leverage may result in higher returns to the Fund than if the Fund were not leveraged, but may also adversely affect returns, particularly if the market is declining.
| | |
| |
20 | AB CONSERVATIVE BUFFER ETF | | abfunds.com |
NOTES TO FINANCIAL STATEMENTS (continued)
Illiquid Investments Risk—Illiquid investments risk exists when certain investments are or become difficult to purchase or sell. Difficulty in selling such investments may result in sales at disadvantageous prices affecting the value of your investment in the Fund. Causes of illiquid investments risk may include low trading volumes and large positions. Foreign fixed-income securities may have more illiquid investments risk because secondary trading markets for these securities may be smaller and less well developed and the securities may trade less frequently than domestic securities. Illiquid investments risk may be higher in a rising interest rate environment, when the value and liquidity of fixed-income securities generally go down.
ETF Share Price and Net Asset Value Risk—The Fund’s shares are listed for trading on the NASDAQ. The Fund’s shares are generally bought and sold in the secondary market at market prices. The NAV per share of the Fund will fluctuate with changes in the market value of the Fund’s holdings. The Fund’s NAV is calculated once per day, at the end of the day. The market price of a share on the Exchange could be higher than the NAV (premium), or lower than the NAV (discount) and may fluctuate during the trading day. When all or a portion of the Fund’s underlying securities trade in a market that is closed when the market for the Fund’s shares is open, there may be differences between the current value of a security and the last quoted price for that security in the closed local market, which could lead to a deviation between the market value of the Fund’s shares and the Fund’s NAV. Disruptions in the creations and redemptions process or the existence of extreme market volatility could result in the Fund’s shares trading above or below NAV. As the Fund may invest in securities traded on foreign exchanges, Fund shares may trade at a larger premium or discount to the Fund’s NAV than shares of other ETFs. In addition, in stressed market conditions, the market for Fund shares may become less liquid in response to deteriorating liquidity in the markets for the Fund’s underlying portfolio holdings.
Authorized Participant Risk—Only a limited number of financial institutions that enter into an authorized participant relationship with the Fund (“Authorized Participants”) may engage in creation or redemption transactions. If the Fund’s Authorized Participants decide not to create or redeem shares, Fund shares may trade at a larger premium or discount to the Fund’s NAV, or the Fund could face trading halts or de-listing.
Active Trading Market Risk—There is no guarantee that an active trading market for Fund shares will exist at all times. In times of market stress, markets can suffer erratic or unpredictable trading activity, extraordinary volatility or wide bid/ask spreads, which could cause some market makers and Authorized Participants to reduce their market activity or “step away” from making a market in ETF shares. Market makers and Authorized Participants are not obligated to place or execute purchase and redemption
| | |
| |
| abfunds.com | | AB CONSERVATIVE BUFFER ETF | 21 |
NOTES TO FINANCIAL STATEMENTS (continued)
orders. This could cause the Fund’s market price to deviate, materially, from the NAV, and reduce the effectiveness of the ETF arbitrage process. Any absence of an active trading market for Fund shares could lead to a heightened risk that there will be a difference between the market price of a Fund share and the underlying value of the Fund share.
Indemnification Risk—In the ordinary course of business, the Fund enters into contracts that contain a variety of indemnifications. The Fund’s maximum exposure under these arrangements is unknown. However, the Fund has not had prior claims or losses pursuant to these indemnification provisions and expects the risk of loss thereunder to be remote. Therefore, the Fund has not accrued any liability in connection with these indemnification provisions.
Management Risk—The Fund is subject to management risk because it is an actively-managed ETF. The Adviser will apply its investment techniques and risk analyses in making investment decisions, but there is no guarantee that its techniques will produce the intended results. Some of these techniques may incorporate, or rely upon, quantitative models, but there is no guarantee that these models will generate accurate forecasts, reduce risk or otherwise perform as expected.
NOTE G
Joint Credit Facility
A number of ETFs managed by the Adviser, including the Fund, participate in a $325 million revolving credit facility (the “Facility”) intended to provide short-term financing related to redemptions and other short term liquidity requirements, subject to certain restrictions. Commitment fees related to the Facility are paid by the participating funds and are included in miscellaneous expenses in the statement of operations. The Fund did not utilize the Facility during the period ended November 30, 2024.
NOTE H
Distributions to Shareholders
The tax character of distributions paid during the fiscal period ended November 30, 2024 was as follows:
| | | | |
| | | 2024 | |
Distributions paid from: | | | | |
Ordinary income | | $ | – 0 | – |
| | | | |
Total taxable distributions | | $ | – 0 | – |
| | | | |
| | |
| |
22 | AB CONSERVATIVE BUFFER ETF | | abfunds.com |
NOTES TO FINANCIAL STATEMENTS (continued)
As of November 30, 2024, the components of accumulated earnings (deficit) on a tax basis were as follows:
| | | | |
Accumulated capital and other losses | | $ | (54,938,867 | )(a) |
Unrealized appreciation (depreciation) | | | 3,926,948 | (b) |
| | | | |
Total accumulated earnings (deficit) | | $ | (51,011,919 | ) |
| | | | |
| (a) | As of November 30, 2024, the Fund had a net capital loss carryforward of $54,938,867. |
| (b) | The difference between book-basis and tax-basis unrealized appreciation (depreciation) is attributable primarily to the tax deferral of losses on wash sales. |
For tax purposes, net realized capital losses may be carried over to offset future capital gains, if any. Funds are permitted to carry forward capital losses for an indefinite period, and such losses will retain their character as either short-term or long-term capital losses. As of November 30, 2024, the Fund had a net short-term capital loss carryforward of $54,938,867, which may be carried forward for an indefinite period.
During the current fiscal period, permanent differences primarily due to the tax treatment of gains from a redemption-in-kind and the disallowance of a net operating loss resulted in a net decrease in distributable earnings and a net increase in additional paid-in capital. These reclassifications had no effect on net assets.
NOTE I
Recent Accounting Pronouncements
In December 2022, the Financial Accounting Standards Board issued an Accounting Standards Update, ASU 2022-06, “Reference Rate Reform (Topic 848) – Deferral of the Sunset Date of Topic 848”. ASU 2022-06 is an amendment to ASU 2020-04, which provided optional guidance to ease the potential accounting burden due to the discontinuation of the LIBOR and other interbank-offered based reference rates and which was effective as of March 12, 2020 through December 31, 2022. ASU 2022-06 extends the effective period through December 31, 2024. Management is currently evaluating the impact, if any, of applying ASU 2022-06.
In November 2023, the Financial Accounting Standards Board issued Accounting Standards Update, ASU 2023-07, “Segment Reporting (Topic 280)”. ASU 2023-07 requires public entities to provide disclosure of significant segment expenses that are regularly provided to the chief operating decision maker (“CODM”). ASU 2023-07, among other things, (i) requires a single segment public entity to provide all necessary disclosures required by Topic 280 it, (ii) requires a public entity to disclose the title and position of the CODM and an explanation of how the CODM uses the reported measure(s) of segment profit and loss in assessing segment performance and deciding how to allocate resources and (iii) provides the ability for a
| | |
| |
| abfunds.com | | AB CONSERVATIVE BUFFER ETF | 23 |
NOTES TO FINANCIAL STATEMENTS (continued)
public entity to elect more than one performance measure. ASU 2023-07 is effective for fiscal years beginning after December 15, 2023, and interim periods within fiscal years beginning after December 15, 2024. Early adoption of ASU 2023-07 is permitted. Management is currently evaluating the impact, if any, of applying ASU 2023-07.
NOTE J
Subsequent Events
Management has evaluated subsequent events for possible recognition or disclosure in the financial statements through the date the financial statements are issued. Management has determined that there are no material events that would require disclosure in the Fund’s financial statements through this date.
| | |
| |
24 | AB CONSERVATIVE BUFFER ETF | | abfunds.com |
FINANCIAL HIGHLIGHTS
Selected Data For A Share of Capital Stock Throughout Each Period
| | | | |
| | | December 13,
2023(a)
November 30, 2024 | |
| | | | |
Net asset value, beginning of period | | | $ 35.00 | |
| | | | |
Income From Investment Operations | | | | |
| |
Net investment loss(b)(c) | | | (.24 | ) |
| |
Net realized and unrealized gain on investment transactions | | | 4.55 | |
| | | | |
Net increase in net asset value from operations | | | 4.31 | |
| | | | |
Net asset value, end of period | | | $ 39.31 | |
| | | | |
| |
Total Return | | | | |
| |
Total investment return based on net asset value(d) | | | 12.31 | % |
| |
Ratios/Supplemental Data | | | | |
| |
Net assets, end of period (000’s omitted) | | | $696,739 | |
| |
Ratio to average net assets of: | | | | |
| |
Expenses, net of waivers/reimbursements | | | .69 | %^ |
| |
Expenses, before waivers/reimbursements | | | .69 | %^ |
| |
Net investment loss(c) | | | (.66 | )%^ |
| |
Portfolio turnover rate(e) | | | 0 | % |
| (a) | Commencement of operations. |
| (b) | Based on average shares outstanding. |
| (c) | Net of expenses waived/reimbursed by the Adviser. |
| (d) | Total investment return is calculated assuming an initial investment made at the net asset value at the beginning of the period, reinvestment of all dividends and distributions at net asset value during the period, and redemption on the last day of the period. Total investment return does not reflect the deduction of taxes that a shareholder would pay on fund distributions or the redemption of fund shares. Total investment return calculated for a period of less than one year is not annualized. |
| (e) | Excludes the value of portfolio securities received or delivered as a result of in-kind purchases or redemptions of the Fund’s capital shares, including ETF Creation Units. |
See notes to financial statements.
| | |
| |
| abfunds.com | | AB CONSERVATIVE BUFFER ETF | 25 |
REPORT OF INDEPENDENT REGISTERED
PUBLIC ACCOUNTING FIRM
To the Shareholders and the Board of Directors of
AB Conservative Buffer ETF
Opinion on the Financial Statements
We have audited the accompanying statement of assets and liabilities of AB Conservative Buffer ETF (the “Fund”) (one of the funds constituting AB Active ETFs, Inc. (the “Corporation”)), including the portfolio of investments, as of November 30, 2024, and the related statements of operations and changes in net assets and the financial highlights for the period from December 13, 2023 (commencement of operations) to November 30, 2024, and the related notes (collectively referred to as the “financial statements”). In our opinion, the financial statements present fairly, in all material respects, the financial position of the Fund (one of the funds constituting AB Active ETFs, Inc.) at November 30, 2024, the results of its operations, the changes in its net assets and its financial highlights for the period from December 13, 2023 (commencement of operations) to November 30, 2024, in conformity with U.S. generally accepted accounting principles.
Basis for Opinion
These financial statements are the responsibility of the Corporation’s management. Our responsibility is to express an opinion on the Fund’s financial statements based on our audit. We are a public accounting firm registered with the Public Company Accounting Oversight Board (United States) (“PCAOB”) and are required to be independent with respect to the Corporation in accordance with the U.S. federal securities laws and the applicable rules and regulations of the Securities and Exchange Commission and the PCAOB.
We conducted our audit in accordance with the standards of the PCAOB. Those standards require that we plan and perform the audit to obtain reasonable assurance about whether the financial statements are free of material misstatement, whether due to error or fraud. The Corporation is not required to have, nor were we engaged to perform, an audit of the Corporation’s internal control over financial reporting. As part of our audit, we are required to obtain an understanding of internal control over financial reporting but not for the purpose of expressing an opinion on the effectiveness of the Corporation’s internal control over financial reporting. Accordingly, we express no such opinion.
Our audit included performing procedures to assess the risks of material misstatement of the financial statements, whether due to error or fraud, and performing procedures that respond to those risks. Such procedures included examining, on a test basis, evidence regarding the amounts and
| | |
| |
26 | AB CONSERVATIVE BUFFER ETF | | abfunds.com |
REPORT OF INDEPENDENT REGISTERED
PUBLIC ACCOUNTING FIRM (continued)
disclosures in the financial statements. Our procedures included confirmation of securities owned as of November 30, 2024, by correspondence with the custodian, brokers and others; when replies were not received from brokers or others, we performed other auditing procedures. Our audit also included evaluating the accounting principles used and significant estimates made by management, as well as evaluating the overall presentation of the financial statements. We believe that our audit provides a reasonable basis for our opinion.

We have served as the auditor of one or more of the AB investment companies since 1968.
New York, New York
January 28, 2025
| | |
| |
| abfunds.com | | AB CONSERVATIVE BUFFER ETF | 27 |
Information Regarding the Review and Approval of the Fund’s Advisory Agreement
The disinterested directors (the “directors”) of AB Active ETFs, Inc. (the “Company”) unanimously approved the Company’s Advisory Agreement with the Adviser in respect of AB Conservative Buffer ETF (the “Fund”) for an initial two-year period at a meeting held in-person on August 1-2, 2023 (the “Meeting”).
Prior to approval of the Advisory Agreement, the directors had requested from the Adviser, and received and evaluated, extensive materials. They reviewed the proposed Advisory Agreement with the Adviser and with experienced counsel who are independent of the Adviser, who advised on the relevant legal standards. The directors also reviewed additional materials, including comparative analytical data prepared by the Senior Vice President of the Fund. The directors also discussed the proposed approval in private sessions with counsel.
The directors considered their knowledge of the nature and quality of the services to be provided by the Adviser to the Fund gained from their experience as directors or trustees of most of the registered investment companies advised by the Adviser, including the other series of the Company that are organized as exchange-traded funds (“ETFs), their overall confidence in the Adviser’s integrity and competence they have gained from that experience, the Adviser’s initiative in identifying and raising potential issues with the directors and its responsiveness, frankness and attention to concerns raised by the directors in the past, including the Adviser’s willingness to consider and implement organizational and operational changes designed to improve investment results and the services provided to the AB Funds. The directors noted that they have four regular meetings each year, at each of which they review extensive materials and information from the Adviser, including information on the investment performance of the AB Funds.
The directors also considered all factors they believed relevant, including the specific matters discussed below. During the course of their deliberations, the directors evaluated, among other things, the reasonableness of the proposed advisory fee. The directors did not identify any particular information that was all-important or controlling, and different directors may have attributed different weights to the various factors. The directors determined that the selection of the Adviser to manage the Fund and the overall arrangements between the Fund and the Adviser, as provided in the Advisory Agreement, including the proposed advisory fee, were fair and reasonable in light of the services to be performed, expenses to be incurred and such other matters as the directors considered relevant in the exercise
| | |
| |
28 | AB CONSERVATIVE BUFFER ETF | | abfunds.com |
of their business judgment. The material factors and conclusions that formed the basis for the directors’ determinations included the following:
Nature, Extent and Quality of Services to be Provided
The directors considered the scope and quality of services to be provided by the Adviser under the Advisory Agreement, including the quality of the investment research capabilities of the Adviser and the other resources it has dedicated to performing services for the AB Funds. They also noted the professional experience and qualifications of the Fund’s portfolio management team and other senior personnel of the Adviser. The directors also considered that the Advisory Agreement provides that the Fund will reimburse the Adviser for the cost to it of providing certain clerical, accounting, administrative and other services to the Fund by employees of the Adviser or its affiliates. Requests for these reimbursements will be subject to the directors’ approval on a quarterly basis. The directors noted that the Adviser does not expect to request such reimbursements. The quality of administrative and other services, including the Adviser’s role in coordinating the activities of the Fund’s other service providers, also was considered. The directors concluded that, overall, they were satisfied with the nature, extent and quality of services to be provided to the Fund under the Advisory Agreement.
Costs of Services to be Provided and Profitability
Because the Fund had not yet commenced operations, the directors were unable to consider historical information about the profitability of the Fund. However, the Adviser agreed to provide the directors with profitability information in connection with future proposed continuances of the Advisory Agreement. They also considered the costs to be borne by the Adviser in providing services to the Fund and that the Fund was unlikely to be profitable to the Adviser unless it achieves a material level of net assets.
Fall-Out Benefits
The directors considered the other benefits to the Adviser from its proposed relationship with the Fund. The directors recognized that the Adviser’s future profitability would be somewhat lower without these benefits. The directors understood that the Adviser also might derive reputational and other benefits from its association with the Fund.
Investment Results
Since the Fund had not yet commenced operations, no performance or other historical information for the Fund was available. Based on the Adviser’s written and oral presentations regarding the proposed management of the Fund and their general knowledge and confidence in the Adviser’s expertise in managing mutual funds and ETFs, the directors concluded that they were satisfied that the Adviser was capable of providing high quality Fund management services to the Fund.
| | |
| |
| abfunds.com | | AB CONSERVATIVE BUFFER ETF | 29 |
Advisory Fees and Other Expenses
The directors considered the proposed advisory fee rate payable by the Fund to the Adviser and information prepared by an independent service provider (the “15(c) service provider”), concerning advisory fee rates payable by other ETFs in the same category as the Fund, based on the Fund’s projected net assets of $250 million. The directors noted that the proposed advisory fee is a unitary fee and that the Adviser will pay all expenses of the Fund except for certain expenses payable by the Fund such as interest expense, taxes, extraordinary expenses, and brokerage commissions and other transaction costs. The directors recognized that it is difficult to make comparisons of advisory fees because there are variations in the services that are included in the fees payable by other ETFs. The directors considered the Fund’s proposed contractual advisory fee rate against a peer group median and noted that it was lower than the median.
The Adviser informed the directors that there were no institutional accounts managed by the Adviser that utilize investment strategies similar to those proposed for the Fund.
In connection with their review of the Fund’s proposed advisory fee, the directors also considered the projected total expense ratio of the shares of the Fund in comparison to the medians for a group of similar ETFs (“peer group”) and a larger group of similar ETFs (“peer universe”) selected by the 15(c) service provider. The directors view the projected expense ratio information as relevant to their evaluation of the Adviser’s services because the Adviser is responsible for coordinating services provided to the Fund by others and, in most cases, the Adviser will be responsible for paying for such services under its unitary fee arrangements with the Fund. Based on their review, the directors concluded that the Fund’s projected expense ratio was acceptable.
Economies of Scale
The directors noted that the proposed advisory fee schedule for the Fund does not contain breakpoints and that they had discussed their strong preference for breakpoints in advisory contracts with the Adviser. The directors took into consideration prior presentations by an independent consultant on economies of scale in the mutual fund industry and for the AB Funds, and presentations from time to time by the Adviser concerning certain of its views on economies of scale. The directors also had requested and received from the Adviser certain updates on economies of scale in advance of the Meeting. The directors believe that economies of scale may be realized (if at all) by the Adviser across a variety of products and services, and not only in respect of a single fund. The directors noted that there is no established methodology for setting breakpoints that give effect to the fund-specific services provided by a fund’s adviser and to the economies of scale that an adviser may realize in its overall mutual fund business or those components of it which directly or indirectly affect a
| | |
| |
30 | AB CONSERVATIVE BUFFER ETF | | abfunds.com |
fund’s operations. The directors observed that in the mutual fund industry as a whole, as well as among ETFs similar to the Fund, there is no uniformity or pattern in the fees and asset levels at which breakpoints (if any) apply. The directors also noted that the advisory agreements for many ETFs do not have breakpoints at all. The directors informed the Adviser that they would monitor the Fund’s asset level and its profitability to the Adviser and anticipated revisiting the question of breakpoints in the future if circumstances warranted doing so.
| | |
| |
| abfunds.com | | AB CONSERVATIVE BUFFER ETF | 31 |
NOTES
| | |
| |
32 | AB CONSERVATIVE BUFFER ETF | | abfunds.com |
AB CONSERVATIVE BUFFER ETF
66 Hudson Boulevard East
New York, NY 10001
800 221 5672
ETF-CB-0151-1124 
NOV 11.30.24

ANNUAL FINANCIAL STATEMENTS AND ADDITIONAL INFORMATION
AB CORPORATE BOND ETF
(NASDAQ: EYEG)

| | |
| |
| Investment Products Offered | | • Are Not FDIC Insured • May Lose Value • Are Not Bank Guaranteed |
Investors should consider the investment objectives, risks, charges and expenses of the Fund carefully before investing. For copies of our prospectus or summary prospectus, which contain this and other information, visit us online at www.abfunds.com or contact your AB representative. Please read the prospectus and/or summary prospectus carefully before investing.
This shareholder report must be preceded or accompanied by the Fund’s prospectus for individuals who are not current shareholders of the Fund.
You may obtain a description of the Fund’s proxy voting policies and procedures, and information regarding how the Fund voted proxies relating to portfolio securities during the most recent 12-month period ended June 30, without charge. Simply visit AB’s website at www.abfunds.com, or go to the Securities and Exchange Commission’s (the “Commission”) website at www.sec.gov, or call AB at (800) 227 4618.
The Fund files its complete schedule of portfolio holdings with the Commission for the first and third quarters of each fiscal year as an exhibit to its reports on Form N-PORT. The Fund’s Form N-PORT reports are available on the Commission’s website at www.sec.gov. AB publishes full portfolio holdings for the Fund daily at www.abfunds.com.
Foreside Fund Services, LLC (“Foreside”) is the distributor of the fund. Foreside is a member of FINRA.
The [A/B] logo and AllianceBernstein® are registered trademarks used by permission of the owner, AllianceBernstein L.P.
PORTFOLIO OF INVESTMENTS
November 30, 2024
| | | | | | | | |
| | | Principal
Amount
(000) | | | U.S. $ Value | |
| |
CORPORATES - INVESTMENT
GRADE – 96.8% | | | | | | | | |
Industrial – 52.3% | | | | | | | | |
Basic – 0.7% | |
Amcor Group Finance PLC
5.45%, 05/23/2029 | | $ | 22 | | | $ | 22,411 | |
Huntsman International LLC
4.50%, 05/01/2029 | | | 130 | | | | 125,356 | |
Sonoco Products Co.
4.45%, 09/01/2026 | | | 25 | | | | 24,869 | |
| | | | | | | | |
| | | | | | | 172,636 | |
| | | | | | | | |
Capital Goods – 3.1% | |
3M Co.
3.375%, 03/01/2029 | | | 130 | | | | 123,986 | |
BAE Systems Holdings, Inc.
3.85%, 12/15/2025(a) | | | 94 | | | | 93,045 | |
Caterpillar Financial Services Corp.
4.60%, 11/15/2027 | | | 25 | | | | 25,123 | |
4.70%, 11/15/2029 | | | 25 | | | | 25,201 | |
L3Harris Technologies, Inc.
5.05%, 06/01/2029 | | | 25 | | | | 25,314 | |
Lockheed Martin Corp.
5.20%, 02/15/2064 | | | 126 | | | | 123,852 | |
5.90%, 11/15/2063 | | | 120 | | | | 131,807 | |
Otis Worldwide Corp.
5.125%, 11/19/2031 | | | 25 | | | | 25,399 | |
Regal Rexnord Corp.
6.05%, 04/15/2028 | | | 120 | | | | 123,319 | |
Vulcan Materials Co.
4.95%, 12/01/2029 | | | 25 | | | | 25,237 | |
Waste Management, Inc.
4.50%, 03/15/2028 | | | 25 | | | | 24,987 | |
4.65%, 03/15/2030 | | | 25 | | | | 25,013 | |
4.80%, 03/15/2032 | | | 25 | | | | 25,047 | |
| | | | | | | | |
| | | | | | | 797,330 | |
| | | | | | | | |
Communications - Media – 6.5% | |
Charter Communications Operating LLC/Charter Communications Operating Capital
6.484%, 10/23/2045 | | | 130 | | | | 128,059 | |
Comcast Corp.
5.50%, 05/15/2064 | | | 130 | | | | 129,753 | |
Fox Corp.
5.476%, 01/25/2039 | | | 130 | | | | 127,872 | |
Meta Platforms, Inc.
4.65%, 08/15/2062 | | | 90 | | | | 81,270 | |
5.40%, 08/15/2054 | | | 25 | | | | 25,557 | |
| | |
| |
| abfunds.com | | AB CORPORATE BOND ETF | 1 |
PORTFOLIO OF INVESTMENTS (continued)
| | | | | | | | |
| | | Principal
Amount
(000) | | | U.S. $ Value | |
| |
5.55%, 08/15/2064 | | $ | 125 | | | $ | 129,485 | |
5.75%, 05/15/2063 | | | 119 | | | | 126,763 | |
Paramount Global
4.375%, 03/15/2043 | | | 51 | | | | 39,229 | |
4.95%, 01/15/2031 | | | 22 | | | | 20,961 | |
6.875%, 04/30/2036 | | | 85 | | | | 88,435 | |
7.875%, 07/30/2030 | | | 104 | | | | 114,553 | |
Time Warner Cable LLC
6.55%, 05/01/2037 | | | 126 | | | | 125,245 | |
6.75%, 06/15/2039 | | | 33 | | | | 33,472 | |
7.30%, 07/01/2038 | | | 113 | | | | 119,226 | |
Warnermedia Holdings, Inc.
3.755%, 03/15/2027 | | | 93 | | | | 90,103 | |
4.279%, 03/15/2032 | | | 142 | | | | 128,301 | |
5.05%, 03/15/2042 | | | 26 | | | | 21,995 | |
5.141%, 03/15/2052 | | | 155 | | | | 124,750 | |
| | | | | | | | |
| | | | | | | 1,655,029 | |
| | | | | | | | |
Communications - Telecommunications – 0.5% | |
Corning, Inc.
5.45%, 11/15/2079 | | | 134 | | | | 128,883 | |
| | | | | | | | |
|
Consumer Cyclical - Automotive – 3.4% | |
American Honda Finance Corp.
Series G
4.45%, 10/22/2027 | | | 25 | | | | 24,925 | |
4.85%, 10/23/2031 | | | 25 | | | | 24,949 | |
BMW US Capital LLC
4.60%, 08/13/2027(a) | | | 25 | | | | 24,983 | |
4.90%, 04/02/2029(a) | | | 25 | | | | 25,112 | |
Cummins, Inc.
5.45%, 02/20/2054 | | | 123 | | | | 126,439 | |
General Motors Financial Co., Inc.
1.25%, 01/08/2026 | | | 130 | | | | 125,046 | |
1.50%, 06/10/2026 | | | 52 | | | | 49,502 | |
5.35%, 07/15/2027 | | | 25 | | | | 25,335 | |
5.40%, 04/06/2026 | | | 122 | | | | 122,910 | |
5.55%, 07/15/2029 | | | 14 | | | | 14,331 | |
Hyundai Capital America
4.55%, 09/26/2029(a) | | | 17 | | | | 16,717 | |
4.875%, 11/01/2027(a) | | | 25 | | | | 25,038 | |
Nissan Motor Acceptance Co., LLC
1.85%, 09/16/2026(a) | | | 133 | | | | 122,974 | |
2.00%, 03/09/2026(a) | | | 131 | | | | 124,419 | |
| | | | | | | | |
| | | | | | | 852,680 | |
| | | | | | | | |
Consumer Cyclical - Entertainment – 0.1% | |
Hasbro, Inc.
6.05%, 05/14/2034 | | | 34 | | | | 35,073 | |
| | | | | | | | |
| | |
| |
2 | AB CORPORATE BOND ETF | | abfunds.com |
PORTFOLIO OF INVESTMENTS (continued)
| | | | | | | | |
| | | Principal
Amount
(000) | | | U.S. $ Value | |
| |
Consumer Cyclical - Other – 0.7% | | | | | | | | |
Las Vegas Sands Corp.
3.90%, 08/08/2029 | | $ | 135 | | | $ | 126,593 | |
Marriott International, Inc./MD
4.80%, 03/15/2030 | | | 25 | | | | 25,019 | |
5.35%, 03/15/2035 | | | 25 | | | | 25,242 | |
| | | | | | | | |
| | | | | | | 176,854 | |
| | | | | | | | |
Consumer Cyclical - Restaurants – 0.2% | |
McDonald’s Corp.
3.50%, 03/01/2027 | | | 40 | | | | 39,128 | |
| | | | | | | | |
|
Consumer Cyclical - Retailers – 2.2% | |
7-Eleven, Inc.
1.80%, 02/10/2031(a) | | | 155 | | | | 127,044 | |
2.80%, 02/10/2051(a) | | | 210 | | | | 128,549 | |
Dick’s Sporting Goods, Inc.
4.10%, 01/15/2052 | | | 175 | | | | 131,842 | |
Genuine Parts Co.
4.95%, 08/15/2029 | | | 25 | | | | 25,013 | |
Home Depot, Inc. (The)
4.95%, 09/15/2052 | | | 77 | | | | 74,004 | |
5.30%, 06/25/2054 | | | 25 | | | | 25,307 | |
Lowe’s Cos., Inc.
5.80%, 09/15/2062 | | | 35 | | | | 35,868 | |
| | | | | | | | |
| | | | | | | 547,627 | |
| | | | | | | | |
Consumer Non-Cyclical – 13.9% | |
AbbVie, Inc.
4.45%, 05/14/2046 | | | 75 | | | | 67,075 | |
4.875%, 11/14/2048 | | | 130 | | | | 122,795 | |
5.40%, 03/15/2054 | | | 125 | | | | 127,040 | |
5.50%, 03/15/2064 | | | 125 | | | | 127,516 | |
Altria Group, Inc.
3.40%, 02/04/2041 | | | 165 | | | | 125,542 | |
4.25%, 08/09/2042 | | | 155 | | | | 129,971 | |
4.80%, 02/14/2029 | | | 23 | | | | 22,983 | |
Archer-Daniels-Midland Co.
2.50%, 08/11/2026 | | | 93 | | | | 89,901 | |
Bristol-Myers Squibb Co.
4.35%, 11/15/2047 | | | 34 | | | | 29,629 | |
5.55%, 02/22/2054 | | | 25 | | | | 25,741 | |
5.65%, 02/22/2064 | | | 125 | | | | 127,891 | |
6.40%, 11/15/2063 | | | 115 | | | | 131,159 | |
Cardinal Health, Inc.
3.41%, 06/15/2027 | | | 94 | | | | 91,365 | |
5.125%, 02/15/2029 | | | 51 | | | | 51,754 | |
5.35%, 11/15/2034 | | | 25 | | | | 25,318 | |
Coca-Cola Co. (The)
4.65%, 08/14/2034 | | | 25 | | | | 24,947 | |
| | |
| |
| abfunds.com | | AB CORPORATE BOND ETF | 3 |
PORTFOLIO OF INVESTMENTS (continued)
| | | | | | | | |
| | | Principal
Amount
(000) | | | U.S. $ Value | |
| |
5.20%, 01/14/2055 | | $ | 25 | | | $ | 25,144 | |
CommonSpirit Health
3.817%, 10/01/2049 | | | 127 | | | | 100,701 | |
4.35%, 11/01/2042 | | | 43 | | | | 36,411 | |
CVS Health Corp.
3.00%, 08/15/2026 | | | 127 | | | | 123,220 | |
5.40%, 06/01/2029 | | | 106 | | | | 107,866 | |
5.55%, 06/01/2031 | | | 17 | | | | 17,290 | |
5.70%, 06/01/2034 | | | 17 | | | | 17,358 | |
6.00%, 06/01/2044 | | | 25 | | | | 25,149 | |
Eli Lilly & Co.
4.20%, 08/14/2029 | | | 25 | | | | 24,810 | |
5.20%, 08/14/2064 | | | 13 | | | | 12,850 | |
General Mills, Inc.
4.875%, 01/30/2030 | | | 25 | | | | 25,130 | |
5.25%, 01/30/2035 | | | 25 | | | | 25,269 | |
Gilead Sciences, Inc.
4.80%, 11/15/2029 | | | 25 | | | | 25,154 | |
5.10%, 06/15/2035 | | | 25 | | | | 25,346 | |
HCA, Inc.
5.375%, 09/01/2026 | | | 126 | | | | 126,674 | |
5.95%, 09/15/2054 | | | 25 | | | | 25,202 | |
Illumina, Inc.
4.65%, 09/09/2026 | | | 25 | | | | 24,919 | |
Kraft Heinz Foods Co.
7.125%, 08/01/2039(a) | | | 110 | | | | 127,114 | |
Kroger Co. (The)
2.65%, 10/15/2026 | | | 128 | | | | 123,452 | |
4.60%, 08/15/2027 | | | 7 | | | | 7,032 | |
4.70%, 08/15/2026 | | | 11 | | | | 11,036 | |
5.00%, 09/15/2034 | | | 23 | | | | 22,897 | |
Mars, Inc.
3.95%, 04/01/2049(a) | | | 12 | | | | 9,745 | |
Mylan, Inc.
5.20%, 04/15/2048 | | | 12 | | | | 10,373 | |
Northwell Healthcare, Inc.
3.809%, 11/01/2049 | | | 131 | | | | 102,413 | |
PepsiCo, Inc.
4.80%, 07/17/2034 | | | 15 | | | | 15,098 | |
5.25%, 07/17/2054 | | | 25 | | | | 25,474 | |
Philip Morris International, Inc.
0.875%, 05/01/2026 | | | 132 | | | | 125,405 | |
2.10%, 05/01/2030 | | | 96 | | | | 84,228 | |
4.375%, 11/01/2027 | | | 25 | | | | 24,903 | |
4.625%, 11/01/2029 | | | 25 | | | | 24,969 | |
4.75%, 02/12/2027 | | | 15 | | | | 15,077 | |
4.75%, 11/01/2031 | | | 25 | | | | 24,896 | |
| | |
| |
4 | AB CORPORATE BOND ETF | | abfunds.com |
PORTFOLIO OF INVESTMENTS (continued)
| | | | | | | | |
| | | Principal
Amount
(000) | | | U.S. $ Value | |
| |
4.875%, 02/13/2029 | | $ | 25 | | | $ | 25,250 | |
4.90%, 11/01/2034 | | | 25 | | | | 24,768 | |
5.25%, 02/13/2034 | | | 25 | | | | 25,408 | |
Pilgrim’s Pride Corp.
4.25%, 04/15/2031 | | | 135 | | | | 126,125 | |
Smithfield Foods, Inc.
2.625%, 09/13/2031(a) | | | 108 | | | | 90,035 | |
Sysco Corp.
3.30%, 07/15/2026 | | | 126 | | | | 123,403 | |
Tyson Foods, Inc.
5.40%, 03/15/2029 | | | 25 | | | | 25,578 | |
Universal Health Services, Inc.
2.65%, 10/15/2030 | | | 145 | | | | 126,192 | |
Utah Acquisition Sub, Inc.
3.95%, 06/15/2026 | | | 124 | | | | 122,187 | |
| | | | | | | | |
| | | | | | | 3,532,178 | |
| | | | | | | | |
Energy – 3.2% | |
ConocoPhillips Co.
5.50%, 01/15/2055 | | | 25 | | | | 25,201 | |
5.65%, 01/15/2065 | | | 25 | | | | 25,249 | |
Continental Resources, Inc./OK
5.75%, 01/15/2031(a) | | | 125 | | | | 126,076 | |
Enterprise Products Operating LLC
Series E
5.25%, 08/16/2077 | | | 127 | | | | 123,980 | |
Flex Intermediate Holdco LLC
3.363%, 06/30/2031(a) | | | 51 | | | | 44,411 | |
FLNG Liquefaction 2 LLC
4.125%, 03/31/2038(a) | | | 114 | | | | 102,715 | |
Kinder Morgan Energy Partners LP
6.95%, 01/15/2038 | | | 54 | | | | 60,764 | |
Kinder Morgan, Inc.
5.10%, 08/01/2029 | | | 25 | | | | 25,332 | |
MPLX LP
1.75%, 03/01/2026 | | | 129 | | | | 124,212 | |
5.50%, 06/01/2034 | | | 25 | | | | 25,326 | |
Northern Natural Gas Co.
5.625%, 02/01/2054(a) | | | 12 | | | | 12,211 | |
ONEOK, Inc.
4.40%, 10/15/2029 | | | 8 | | | | 7,865 | |
5.05%, 11/01/2034 | | | 6 | | | | 5,917 | |
5.70%, 11/01/2054 | | | 25 | | | | 24,926 | |
Woodside Finance Ltd.
3.70%, 09/15/2026(a) | | | 90 | | | | 88,065 | |
| | | | | | | | |
| | | | | | | 822,250 | |
| | | | | | | | |
| | |
| |
| abfunds.com | | AB CORPORATE BOND ETF | 5 |
PORTFOLIO OF INVESTMENTS (continued)
| | | | | | | | |
| | | Principal
Amount
(000) | | | U.S. $ Value | |
| |
Other Industrial – 0.1% | | | | | | | | |
Huntington Ingalls Industries, Inc.
5.353%, 01/15/2030 | | $ | 25 | | | $ | 25,237 | |
| | | | | | | | |
|
Services – 0.9% | |
Amazon.com, Inc.
2.70%, 06/03/2060 | | | 210 | | | | 128,354 | |
3.875%, 08/22/2037 | | | 60 | | | | 54,506 | |
4.10%, 04/13/2062 | | | 12 | | | | 9,978 | |
PayPal Holdings, Inc.
5.50%, 06/01/2054 | | | 25 | | | | 25,838 | |
| | | | | | | | |
| | | | | | | 218,676 | |
| | | | | | | | |
Technology – 13.8% | |
Allegion US Holding Co., Inc.
5.60%, 05/29/2034 | | | 109 | | | | 112,239 | |
Alphabet, Inc.
2.25%, 08/15/2060 | | | 55 | | | | 32,011 | |
Analog Devices, Inc.
2.95%, 10/01/2051 | | | 37 | | | | 25,069 | |
Apple, Inc.
2.55%, 08/20/2060 | | | 205 | | | | 127,934 | |
2.80%, 02/08/2061 | | | 190 | | | | 120,534 | |
2.85%, 08/05/2061 | | | 200 | | | | 128,664 | |
4.10%, 08/08/2062 | | | 150 | | | | 126,285 | |
Applied Materials, Inc.
4.80%, 06/15/2029 | | | 13 | | | | 13,188 | |
Concentrix Corp.
6.60%, 08/02/2028 | | | 120 | | | | 122,777 | |
6.65%, 08/02/2026 | | | 119 | | | | 121,354 | |
Dell International LLC/EMC Corp.
4.90%, 10/01/2026 | | | 123 | | | | 123,306 | |
6.02%, 06/15/2026 | | | 125 | | | | 126,971 | |
Fidelity National Information Services, Inc.
1.15%, 03/01/2026 | | | 132 | | | | 126,302 | |
Fiserv, Inc.
3.20%, 07/01/2026 | | | 130 | | | | 127,061 | |
Flex Ltd.
5.25%, 01/15/2032 | | | 25 | | | | 25,082 | |
Fortive Corp.
3.15%, 06/15/2026 | | | 125 | | | | 122,090 | |
Hewlett Packard Enterprise Co.
1.75%, 04/01/2026 | | | 130 | | | | 124,930 | |
4.40%, 09/25/2027 | | | 10 | | | | 9,950 | |
4.45%, 09/25/2026 | | | 70 | | | | 69,745 | |
HP, Inc.
3.00%, 06/17/2027 | | | 119 | | | | 114,328 | |
Intel Corp.
2.60%, 05/19/2026 | | | 131 | | | | 127,107 | |
| | |
| |
6 | AB CORPORATE BOND ETF | | abfunds.com |
PORTFOLIO OF INVESTMENTS (continued)
| | | | | | | | |
| | | Principal
Amount
(000) | | | U.S. $ Value | |
| |
3.75%, 03/25/2027 | | $ | 10 | | | $ | 9,779 | |
International Business Machines Corp.
1.95%, 05/15/2030 | | | 145 | | | | 125,811 | |
2.95%, 05/15/2050 | | | 195 | | | | 130,098 | |
Lam Research Corp.
4.875%, 03/15/2049 | | | 130 | | | | 122,369 | |
Leidos, Inc.
4.375%, 05/15/2030 | | | 130 | | | | 125,570 | |
Motorola Solutions, Inc.
5.00%, 04/15/2029 | | | 5 | | | | 5,050 | |
Open Text Corp.
6.90%, 12/01/2027(a) | | | 118 | | | | 122,594 | |
Oracle Corp.
1.65%, 03/25/2026 | | | 114 | | | | 109,661 | |
2.65%, 07/15/2026 | | | 115 | | | | 111,603 | |
3.85%, 04/01/2060 | | | 173 | | | | 126,385 | |
Qorvo, Inc.
4.375%, 10/15/2029 | | | 135 | | | | 127,506 | |
QUALCOMM, Inc.
6.00%, 05/20/2053 | | | 120 | | | | 131,114 | |
Texas Instruments, Inc.
5.05%, 05/18/2063 | | | 24 | | | | 23,060 | |
5.15%, 02/08/2054 | | | 86 | | | | 85,518 | |
Tyco Electronics Group SA
4.625%, 02/01/2030 | | | 125 | | | | 124,660 | |
| | | | | | | | |
| | | | | | | 3,507,705 | |
| | | | | | | | |
Transportation - Airlines – 0.5% | |
Delta Air Lines, Inc./SkyMiles IP Ltd.
4.75%, 10/20/2028(a) | | | 125 | | | | 124,101 | |
| | | | | | | | |
|
Transportation - Services – 2.5% | |
Element Fleet Management Corp.
5.643%, 03/13/2027(a) | | | 32 | | | | 32,568 | |
6.271%, 06/26/2026(a) | | | 119 | | | | 121,235 | |
6.319%, 12/04/2028(a) | | | 86 | | | | 90,624 | |
Penske Truck Leasing Co. LP/PTL Finance Corp.
1.70%, 06/15/2026(a) | | | 130 | | | | 123,916 | |
Ryder System, Inc.
4.90%, 12/01/2029 | | | 85 | | | | 85,246 | |
Series G
4.95%, 09/01/2029 | | | 125 | | | | 125,837 | |
Transurban Finance Co. Pty Ltd.
2.45%, 03/16/2031(a) | | | 62 | | | | 53,314 | |
| | | | | | | | |
| | | | | | | 632,740 | |
| | | | | | | | |
| | | | | | | 13,268,127 | |
| | | | | | | | |
| | |
| |
| abfunds.com | | AB CORPORATE BOND ETF | 7 |
PORTFOLIO OF INVESTMENTS (continued)
| | | | | | | | |
| | | Principal
Amount
(000) | | | U.S. $ Value | |
| |
Financial Institutions – 39.7% | | | | | | | | |
Banking – 24.2% | |
American Express Co.
5.098%, 02/16/2028 | | $ | 124 | | | $ | 124,963 | |
5.284%, 07/26/2035 | | | 25 | | | | 25,371 | |
5.389%, 07/28/2027 | | | 119 | | | | 120,255 | |
5.532%, 04/25/2030 | | | 24 | | | | 24,679 | |
5.645%, 04/23/2027 | | | 24 | | | | 24,287 | |
5.915%, 04/25/2035 | | | 24 | | | | 25,119 | |
Bank of America Corp.
1.734%, 07/22/2027 | | | 130 | | | | 123,807 | |
3.419%, 12/20/2028 | | | 129 | | | | 124,031 | |
3.559%, 04/23/2027 | | | 125 | | | | 122,899 | |
3.705%, 04/24/2028 | | | 45 | | | | 43,922 | |
5.518%, 10/25/2035 | | | 25 | | | | 25,042 | |
Series G
3.593%, 07/21/2028 | | | 126 | | | | 122,364 | |
Series N
1.658%, 03/11/2027 | | | 131 | | | | 125,917 | |
Bank of New York Mellon Corp. (The)
4.89%, 07/21/2028 | | | 25 | | | | 25,185 | |
4.947%, 04/26/2027 | | | 124 | | | | 124,497 | |
5.188%, 03/14/2035 | | | 25 | | | | 25,463 | |
5.225%, 11/20/2035 | | | 25 | | | | 25,542 | |
Canadian Imperial Bank of Commerce
4.508%, 09/11/2027 | | | 25 | | | | 24,914 | |
5.237%, 06/28/2027 | | | 24 | | | | 24,364 | |
Capital One Financial Corp.
2.359%, 07/29/2032 | | | 156 | | | | 128,123 | |
3.75%, 07/28/2026 | | | 125 | | | | 122,601 | |
5.463%, 07/26/2030 | | | 25 | | | | 25,373 | |
Citigroup, Inc.
3.668%, 07/24/2028 | | | 61 | | | | 59,258 | |
3.887%, 01/10/2028 | | | 125 | | | | 122,722 | |
4.542%, 09/19/2030 | | | 25 | | | | 24,649 | |
6.174%, 05/25/2034 | | | 118 | | | | 123,506 | |
Citizens Financial Group, Inc.
5.718%, 07/23/2032 | | | 25 | | | | 25,509 | |
Comerica, Inc.
5.982%, 01/30/2030 | | | 121 | | | | 123,537 | |
Discover Financial Services
7.964%, 11/02/2034 | | | 107 | | | | 124,771 | |
Fifth Third Bancorp
8.25%, 03/01/2038 | | | 101 | | | | 123,756 | |
Goldman Sachs Bank USA/New York NY
5.414%, 05/21/2027 | | | 25 | | | | 25,228 | |
Series B
5.283%, 03/18/2027 | | | 25 | | | | 25,167 | |
| | |
| |
8 | AB CORPORATE BOND ETF | | abfunds.com |
PORTFOLIO OF INVESTMENTS (continued)
| | | | | | | | |
| | | Principal
Amount
(000) | | | U.S. $ Value | |
| |
Goldman Sachs Group, Inc. (The)
1.431%, 03/09/2027 | | $ | 131 | | | $ | 125,550 | |
3.615%, 03/15/2028 | | | 127 | | | | 123,678 | |
4.692%, 10/23/2030 | | | 25 | | | | 24,833 | |
5.049%, 07/23/2030 | | | 25 | | | | 25,173 | |
5.33%, 07/23/2035 | | | 25 | | | | 25,299 | |
5.561%, 11/19/2045 | | | 25 | | | | 25,466 | |
5.727%, 04/25/2030 | | | 13 | | | | 13,431 | |
5.851%, 04/25/2035 | | | 24 | | | | 25,196 | |
Series VAR
1.093%, 12/09/2026 | | | 130 | | | | 125,190 | |
HSBC Holdings PLC
6.50%, 09/15/2037 | | | 238 | | | | 254,633 | |
Huntington Bancshares, Inc.
5.272%, 01/15/2031 | | | 25 | | | | 25,316 | |
JPMorgan Chase & Co.
1.04%, 02/04/2027 | | | 131 | | | | 125,391 | |
1.045%, 11/19/2026 | | | 73 | | | | 70,473 | |
1.578%, 04/22/2027 | | | 71 | | | | 67,973 | |
2.956%, 05/13/2031 | | | 138 | | | | 124,879 | |
3.96%, 01/29/2027 | | | 89 | | | | 88,222 | |
4.505%, 10/22/2028 | | | 25 | | | | 24,874 | |
4.603%, 10/22/2030 | | | 25 | | | | 24,823 | |
5.04%, 01/23/2028 | | | 25 | | | | 25,149 | |
5.534%, 11/29/2045 | | | 25 | | | | 25,686 | |
5.571%, 04/22/2028 | | | 24 | | | | 24,453 | |
5.581%, 04/22/2030 | | | 24 | | | | 24,742 | |
5.766%, 04/22/2035 | | | 24 | | | | 25,196 | |
6.07%, 10/22/2027 | | | 46 | | | | 47,103 | |
M&T Bank Corp.
7.413%, 10/30/2029 | | | 114 | | | | 123,088 | |
Macquarie Group Ltd.
1.34%, 01/12/2027(a) | | | 129 | | | | 123,910 | |
Morgan Stanley
1.593%, 05/04/2027 | | | 131 | | | | 125,203 | |
3.125%, 07/27/2026 | | | 127 | | | | 124,051 | |
4.654%, 10/18/2030 | | | 25 | | | | 24,822 | |
5.173%, 01/16/2030 | | | 25 | | | | 25,328 | |
5.32%, 07/19/2035 | | | 25 | | | | 25,429 | |
5.466%, 01/18/2035 | | | 25 | | | | 25,603 | |
5.656%, 04/18/2030 | | | 14 | | | | 14,428 | |
5.831%, 04/19/2035 | | | 24 | | | | 25,208 | |
Series G
1.512%, 07/20/2027 | | | 95 | | | | 90,071 | |
PNC Financial Services Group, Inc. (The)
5.068%, 01/24/2034 | | | 104 | | | | 103,645 | |
5.30%, 01/21/2028 | | | 5 | | | | 5,059 | |
| | |
| |
| abfunds.com | | AB CORPORATE BOND ETF | 9 |
PORTFOLIO OF INVESTMENTS (continued)
| | | | | | | | |
| | | Principal
Amount
(000) | | | U.S. $ Value | |
| |
5.401%, 07/23/2035 | | $ | 25 | | | $ | 25,482 | |
5.492%, 05/14/2030 | | | 8 | | | | 8,211 | |
5.676%, 01/22/2035 | | | 12 | | | | 12,444 | |
6.615%, 10/20/2027 | | | 123 | | | | 126,995 | |
Regions Financial Corp.
5.722%, 06/06/2030 | | | 25 | | | | 25,613 | |
Royal Bank of Canada
Series G
4.65%, 01/27/2026 | | | 29 | | | | 28,952 | |
Santander Holdings USA, Inc.
2.49%, 01/06/2028 | | | 132 | | | | 125,239 | |
6.124%, 05/31/2027 | | | 32 | | | | 32,487 | |
6.499%, 03/09/2029 | | | 117 | | | | 121,504 | |
State Street Corp.
4.33%, 10/22/2027 | | | 25 | | | | 24,916 | |
4.675%, 10/22/2032 | | | 15 | | | | 14,876 | |
Sumitomo Mitsui Financial Group, Inc.
2.632%, 07/14/2026 | | | 103 | | | | 99,804 | |
Synchrony Financial
2.875%, 10/28/2031 | | | 138 | | | | 116,820 | |
3.95%, 12/01/2027 | | | 125 | | | | 120,771 | |
5.935%, 08/02/2030 | | | 28 | | | | 28,623 | |
Synovus Financial Corp.
6.168%, 11/01/2030 | | | 25 | | | | 25,472 | |
Toronto-Dominion Bank (The)
1.20%, 06/03/2026 | | | 130 | | | | 123,620 | |
Truist Financial Corp.
5.435%, 01/24/2030 | | | 25 | | | | 25,449 | |
5.711%, 01/24/2035 | | | 25 | | | | 25,807 | |
6.047%, 06/08/2027 | | | 119 | | | | 121,112 | |
US Bancorp
5.10%, 07/23/2030 | | | 25 | | | | 25,257 | |
Wells Fargo & Co.
3.196%, 06/17/2027 | | | 40 | | | | 39,039 | |
4.10%, 06/03/2026 | | | 125 | | | | 123,752 | |
5.211%, 12/03/2035 | | | 25 | | | | 25,167 | |
5.707%, 04/22/2028 | | | 16 | | | | 16,331 | |
| | | | | | | | |
| | | | | | | 6,129,138 | |
| | | | | | | | |
Brokerage – 0.8% | |
BGC Group, Inc.
6.60%, 06/10/2029 | | | 25 | | | | 25,609 | |
BlackRock Funding, Inc.
5.35%, 01/08/2055 | | | 25 | | | | 25,466 | |
Blue Owl Finance LLC
6.25%, 04/18/2034 | | | 24 | | | | 25,250 | |
| | |
| |
10 | AB CORPORATE BOND ETF | | abfunds.com |
PORTFOLIO OF INVESTMENTS (continued)
| | | | | | | | |
| | | Principal
Amount
(000) | | | U.S. $ Value | |
| |
Cantor Fitzgerald LP
7.20%, 12/12/2028(a) | | $ | 116 | | | $ | 122,062 | |
| | | | | | | | |
| | | | | | | 198,387 | |
| | | | | | | | |
Finance – 3.1% | | | | | | | | |
Apollo Debt Solutions BDC
6.70%, 07/29/2031(a) | | | 123 | | | | 127,749 | |
6.90%, 04/13/2029(a) | | | 93 | | | | 96,875 | |
Ares Strategic Income Fund
5.70%, 03/15/2028(a) | | | 25 | | | | 25,098 | |
Blackstone Secured Lending Fund
5.875%, 11/15/2027 | | | 24 | | | | 24,524 | |
Blue Owl Credit Income Corp.
5.80%, 03/15/2030(a) | | | 25 | | | | 24,812 | |
6.60%, 09/15/2029(a) | | | 23 | | | | 23,636 | |
FS KKR Capital Corp.
3.125%, 10/12/2028 | | | 129 | | | | 117,595 | |
6.125%, 01/15/2030 | | | 25 | | | | 25,132 | |
6.875%, 08/15/2029 | | | 24 | | | | 25,037 | |
HAT Holdings I LLC/HAT Holdings II LLC
3.375%, 06/15/2026(a) | | | 128 | | | | 123,756 | |
Main Street Capital Corp.
6.50%, 06/04/2027 | | | 25 | | | | 25,442 | |
Oaktree Strategic Credit Fund
6.50%, 07/23/2029 | | | 123 | | | | 125,422 | |
Sixth Street Lending Partners
5.75%, 01/15/2030(a) | | | 25 | | | | 24,726 | |
6.50%, 03/11/2029(a) | | | 10 | | | | 10,185 | |
| | | | | | | | |
| | | | | | | 799,989 | |
| | | | | | | | |
Insurance – 7.8% | |
Athene Global Funding
5.322%, 11/13/2031(a) | | | 25 | | | | 25,026 | |
5.349%, 07/09/2027(a) | | | 25 | | | | 25,237 | |
Athene Holding Ltd.
6.25%, 04/01/2054 | | | 25 | | | | 26,365 | |
Brighthouse Financial Global Funding
5.55%, 04/09/2027(a) | | | 25 | | | | 25,286 | |
Cigna Group (The)
1.25%, 03/15/2026 | | | 26 | | | | 24,884 | |
5.60%, 02/15/2054 | | | 125 | | | | 125,405 | |
CNO Global Funding
4.95%, 09/09/2029(a) | | | 25 | | | | 25,029 | |
5.875%, 06/04/2027(a) | | | 24 | | | | 24,523 | |
Elevance Health, Inc.
4.95%, 11/01/2031 | | | 25 | | | | 25,069 | |
5.20%, 02/15/2035 | | | 25 | | | | 25,186 | |
5.375%, 06/15/2034 | | | 25 | | | | 25,487 | |
| | |
| |
| abfunds.com | | AB CORPORATE BOND ETF | 11 |
PORTFOLIO OF INVESTMENTS (continued)
| | | | | | | | |
| | | Principal
Amount
(000) | | | U.S. $ Value | |
| |
5.65%, 06/15/2054 | | $ | 25 | | | $ | 25,387 | |
5.70%, 02/15/2055 | | | 25 | | | | 25,699 | |
Health Care Service Corp. A Mutual Legal Reserve Co.
5.875%, 06/15/2054(a) | | | 125 | | | | 127,250 | |
Marsh & McLennan Cos., Inc.
4.55%, 11/08/2027 | | | 25 | | | | 25,094 | |
4.65%, 03/15/2030 | | | 25 | | | | 25,054 | |
4.85%, 11/15/2031 | | | 25 | | | | 25,091 | |
5.40%, 03/15/2055 | | | 25 | | | | 25,383 | |
Massachusetts Mutual Life Insurance Co.
3.729%, 10/15/2070(a) | | | 190 | | | | 131,510 | |
MetLife, Inc.
9.25%, 04/08/2038(a) | | | 102 | | | | 121,119 | |
Nationwide Financial Services, Inc.
3.90%, 11/30/2049(a) | | | 165 | | | | 127,375 | |
Nationwide Mutual Insurance Co.
4.35%, 04/30/2050(a) | | | 165 | | | | 130,154 | |
New York Life Insurance Co.
4.45%, 05/15/2069(a) | | | 155 | | | | 128,851 | |
Prudential Financial, Inc.
4.50%, 09/15/2047 | | | 129 | | | | 124,922 | |
5.70%, 09/15/2048 | | | 124 | | | | 123,639 | |
Reinsurance Group of America, Inc.
5.75%, 09/15/2034 | | | 25 | | | | 25,762 | |
RGA Global Funding
5.448%, 05/24/2029(a) | | | 25 | | | | 25,657 | |
Sammons Financial Group, Inc.
6.875%, 04/15/2034(a) | | | 115 | | | | 122,314 | |
UnitedHealth Group, Inc.
5.375%, 04/15/2054 | | | 25 | | | | 25,034 | |
5.625%, 07/15/2054 | | | 71 | | | | 73,749 | |
5.75%, 07/15/2064 | | | 119 | | | | 124,512 | |
Unum Group
6.00%, 06/15/2054 | | | 25 | | | | 26,160 | |
| | | | | | | | |
| | | | | | | 1,967,213 | |
| | | | | | | | |
REITs – 3.8% | |
American Tower Corp.
5.00%, 01/31/2030 | | | 25 | | | | 25,185 | |
Boston Properties LP
2.75%, 10/01/2026 | | | 130 | | | | 124,883 | |
3.65%, 02/01/2026 | | | 127 | | | | 125,104 | |
5.75%, 01/15/2035 | | | 25 | | | | 25,094 | |
CBRE Services, Inc.
5.50%, 04/01/2029 | | | 121 | | | | 124,435 | |
5.95%, 08/15/2034 | | | 116 | | | | 122,292 | |
| | |
| |
12 | AB CORPORATE BOND ETF | | abfunds.com |
PORTFOLIO OF INVESTMENTS (continued)
| | | | | | | | |
| | | Principal
Amount
(000) | | | U.S. $ Value | |
| |
Piedmont Operating Partnership LP
6.875%, 07/15/2029 | | $ | 25 | | | $ | 25,816 | |
Safehold GL Holdings LLC
5.65%, 01/15/2035 | | | 25 | | | | 25,062 | |
VICI Properties LP/VICI Note Co., Inc.
4.25%, 12/01/2026(a) | | | 130 | | | | 127,724 | |
WEA Finance LLC
2.875%, 01/15/2027(a) | | | 130 | | | | 123,789 | |
3.50%, 06/15/2029(a) | | | 136 | | | | 125,863 | |
| | | | | | | | |
| | | | | | | 975,247 | |
| | | | | | | | |
| | | | | | | 10,069,974 | |
| | | | | | | | |
Utility – 4.8% | |
Electric – 4.8% | |
AEP Texas, Inc.
5.70%, 05/15/2034 | | | 25 | | | | 25,775 | |
Consolidated Edison Co. of New York, Inc.
5.125%, 03/15/2035 | | | 25 | | | | 25,396 | |
5.50%, 03/15/2055 | | | 25 | | | | 25,567 | |
Constellation Energy Generation LLC
6.50%, 10/01/2053 | | | 115 | | | | 128,870 | |
DTE Energy Co.
4.95%, 07/01/2027 | | | 25 | | | | 25,184 | |
Edison International
5.25%, 03/15/2032 | | | 25 | | | | 25,299 | |
Enel Finance International NV
6.00%, 10/07/2039(a) | | | 124 | | | | 128,532 | |
Entergy Arkansas LLC
5.75%, 06/01/2054 | | | 25 | | | | 26,315 | |
Entergy Corp.
2.95%, 09/01/2026 | | | 130 | | | | 126,184 | |
Entergy Louisiana LLC
5.15%, 09/15/2034 | | | 25 | | | | 25,240 | |
5.70%, 03/15/2054 | | | 25 | | | | 26,101 | |
Entergy Texas, Inc.
5.55%, 09/15/2054 | | | 9 | | | | 9,163 | |
Evergy Missouri West, Inc.
5.65%, 06/01/2034(a) | | | 22 | | | | 22,833 | |
Massachusetts Electric Co.
5.90%, 11/15/2039(a) | | | 120 | | | | 122,828 | |
MidAmerican Energy Co.
5.85%, 09/15/2054 | | | 57 | | | | 61,531 | |
New York State Electric & Gas Corp.
5.30%, 08/15/2034(a) | | | 25 | | | | 25,233 | |
NextEra Energy Capital Holdings, Inc.
5.65%, 05/01/2079 | | | 126 | | | | 124,417 | |
NRG Energy, Inc.
2.45%, 12/02/2027(a) | | | 135 | | | | 125,472 | |
| | |
| |
| abfunds.com | | AB CORPORATE BOND ETF | 13 |
PORTFOLIO OF INVESTMENTS (continued)
| | | | | | | | |
| | | Principal
Amount
(000) | | | U.S. $ Value | |
| |
Oncor Electric Delivery Co. LLC
4.65%, 11/01/2029(a) | | $ | 25 | | | $ | 25,103 | |
Oncor Electric Delivery Co., LLC
5.55%, 06/15/2054(a) | | | 25 | | | | 25,816 | |
Public Service Electric and Gas Co.
4.85%, 08/01/2034 | | | 25 | | | | 25,022 | |
Southwestern Public Service Co.
6.00%, 06/01/2054 | | | 25 | | | | 26,713 | |
Vistra Operations Co. LLC
5.05%, 12/30/2026(a) | | | 5 | | | | 5,013 | |
5.70%, 12/30/2034(a) | | | 25 | | | | 25,508 | |
| | | | | | | | |
| | | | | | | 1,213,115 | |
| | | | | | | | |
| | |
Total Corporates - Investment Grade
(cost $24,112,879) | | | | | | | 24,551,216 | |
| | | | | | | | |
| | |
| | | Shares | | | | |
SHORT-TERM INVESTMENTS – 2.0% | |
Investment Companies – 2.0% | |
AB Fixed Income Shares, Inc. – Government Money Market Portfolio – Class AB,
4.54%(b)(c)(d)
(cost $510,902) | | | 510,902 | | | | 510,902 | |
| | | | | | | | |
| | |
Total Investments – 98.8%
(cost $24,623,781) | | | | | | | 25,062,118 | |
Other assets less liabilities – 1.2% | | | | | | | 296,324 | |
| | | | | | | | |
| | |
Net Assets – 100.0% | | | | | | $ | 25,358,442 | |
| | | | | | | | |
FUTURES (see Note D)
| | | | | | | | | | | | | | | | |
| Description | | Number of
Contracts | | | Expiration
Month | | | Current
Notional | | | Value and
Unrealized
Appreciation
(Depreciation) | |
Purchased Contracts | |
U.S. Long Bond (CBT) Futures | | | 40 | | | | March 2025 | | | $ | 4,780,000 | | | $ | 41,875 | |
U.S. T-Note 5 Yr (CBT) Futures | | | 32 | | | | March 2025 | | | | 3,443,250 | | | | 24,711 | |
|
Sold Contracts | |
U.S. 10 Yr Ultra Futures | | | 12 | | | | March 2025 | | | | 1,377,563 | | | | (10,367 | ) |
U.S. T-Note 10 Yr (CBT) Futures | | | 5 | | | | March 2025 | | | | 555,938 | | | | (6,836 | ) |
U.S. T-Note 2 Yr (CBT) Futures | | | 16 | | | | March 2025 | | | | 3,297,750 | | | | (9,594 | ) |
U.S. Ultra Bond (CBT) Futures | | | 14 | | | | March 2025 | | | | 1,780,625 | | | | (19,344 | ) |
| | | | | | | | | | | | | | | | |
| | | $ | 20,445 | |
| | | | | | | | | | | | | | | | |
| (a) | Security is exempt from registration under Rule 144A or Regulation S of the Securities Act of 1933. These securities are considered restricted, but liquid and may be resold in transactions exempt from registration. At November 30, 2024, the aggregate market value of these securities amounted to $4,582,459 or 18.1% of net assets. |
| | |
| |
14 | AB CORPORATE BOND ETF | | abfunds.com |
PORTFOLIO OF INVESTMENTS (continued)
| (b) | Affiliated investments. |
| (c) | To obtain a copy of the fund’s shareholder report, please go to the Securities and Exchange Commission’s website at www.sec.gov, or call AB at (800) 227-4618. |
| (d) | The rate shown represents the 7-day yield as of period end. |
Glossary:
CBT – Chicago Board of Trade
REIT – Real Estate Investment Trust
See notes to financial statements.
| | |
| |
| abfunds.com | | AB CORPORATE BOND ETF | 15 |
STATEMENT OF ASSETS & LIABILITIES
November 30, 2024
| | | | |
| Assets | |
Investments in securities, at value | |
Unaffiliated issuers (cost $24,112,879) | | $ | 24,551,216 | |
Affiliated issuers (cost $510,902) | | | 510,902 | |
Cash | | | 61,244 | |
Cash collateral due from broker | | | 112,810 | |
Interest receivable | | | 276,367 | |
Receivable for variation margin on futures | | | 9,738 | |
Affiliated dividends receivable | | | 1,135 | |
Receivable due from Adviser | | | 53 | |
| | | | |
Total assets | | | 25,523,465 | |
| | | | |
| Liabilities | |
Payable for investment securities purchased | | | 158,838 | |
Advisory fee payable | | | 6,185 | |
| | | | |
Total liabilities | | | 165,023 | |
| | | | |
Net Assets | | $ | 25,358,442 | |
| | | | |
| Composition of Net Assets | |
Capital stock, at par | | $ | 70 | |
Additional paid-in capital | | | 24,616,140 | |
Distributable earnings | | | 742,232 | |
| | | | |
Net Assets | | $ | 25,358,442 | |
| | | | |
Net Asset Value Per Share—500 million shares of capital stock authorized, $.0001 par value (based on 700,028 common shares outstanding) | | $ | 36.22 | |
| | | | |
See notes to financial statements.
| | |
| |
16 | AB CORPORATE BOND ETF | | abfunds.com |
STATEMENT OF OPERATIONS
For the Period from December 13, 2023(a) to November 30, 2024
| | | | | | | | |
| Investment Income | |
Interest | | $ | 1,293,492 | | | | | |
Dividends—Affiliated issuers | | | 16,673 | | | $ | 1,310,165 | |
| | | | | | | | |
| Expenses | | | | | | | | |
Advisory fee (see Note B) | | | 72,423 | | | | | |
| | | | | | | | |
Total expenses | | | 72,423 | | | | | |
Less: expenses waived and reimbursed by the Adviser (see Note B) | | | (549 | ) | | | | |
| | | | | | | | |
Net expenses | | | | | | | 71,874 | |
| | | | | | | | |
Net investment income | | | | | | | 1,238,291 | |
| | | | | | | | |
| Realized and Unrealized Gain (Loss) on Investment Transactions | | | | | | | | |
Net realized gain (loss) on: | | | | | | | | |
Investment transactions | | | | | | | 203,207 | |
In-kind redemptions | | | | | | | 64,950 | |
Futures | | | | | | | (9,213 | ) |
Net change in unrealized appreciation (depreciation) of: | | | | | | | | |
Investments | | | | | | | 438,337 | |
Futures | | | | | | | 20,445 | |
| | | | | | | | |
Net gain on investment transactions | | | | | | | 717,726 | |
| | | | | | | | |
Contributions from Affiliates (see Note B) | | | | | | | 69 | |
| | | | | | | | |
Net Increase in Net Assets from Operations | | | | | | $ | 1,956,086 | |
| | | | | | | | |
| (a) | Commencement of operations. |
See notes to financial statements.
| | |
| |
| abfunds.com | | AB CORPORATE BOND ETF | 17 |
STATEMENT OF CHANGES IN NET ASSETS
| | | | |
| | | December 13,
2023(a) to
November 30,
2024 | |
| Increase in Net Assets from Operations | |
Net investment income | | $ | 1,238,291 | |
Net realized gain on investment transactions | | | 258,944 | |
Net change in unrealized appreciation (depreciation) of investments | | | 458,782 | |
Contributions from Affiliates (see Note B) | | | 69 | |
| | | | |
Net increase in net assets from operations | | | 1,956,086 | |
Distribution to Shareholders | | | (1,119,835 | ) |
| Transactions in Shares of the Fund | | | | |
Net increase | | | 24,514,930 | |
Other capital | | | 7,261 | |
| | | | |
Total increase | | | 25,358,442 | |
| Net Assets | | | | |
Beginning of period | | | – 0 | – |
| | | | |
End of period | | $ | 25,358,442 | |
| | | | |
| (a) | Commencement of operations. |
See notes to financial statements.
| | |
| |
18 | AB CORPORATE BOND ETF | | abfunds.com |
NOTES TO FINANCIAL STATEMENTS
November 30, 2024
NOTE A
Significant Accounting Policies
AB Active ETFs, Inc. (the “Corporation”) is registered under the Investment Company Act of 1940 (the “1940 Act”) as an open-end management investment company. The Corporation, which is a Maryland corporation, operates as a series company comprised of 15 funds currently in operation. Each fund is considered to be a separate entity for financial reporting and tax purposes. This report relates only to the AB Corporate Bond ETF (the “Fund”), a diversified portfolio. The Fund commenced investment operations on December 13, 2023. The financial statements have been prepared in conformity with U.S. generally accepted accounting principles (“U.S. GAAP”), which require management to make certain estimates and assumptions that affect the reported amounts of assets and liabilities in the financial statements and amounts of income and expenses during the reporting period. Actual results could differ from those estimates. The Fund is an investment company under U.S. GAAP and follows the accounting and reporting guidance applicable to investment companies. The following is a summary of significant accounting policies followed by the Fund.
1. Security Valuation
Portfolio securities are valued at market value determined on the basis of market quotations or, if market quotations are not readily available or are unreliable, at “fair value” as determined in accordance with procedures approved by and under the oversight of the Fund’s Board of Directors (the “Board”). Pursuant to these procedures, AllianceBernstein L.P. (the “Adviser”) serves as the Fund’s valuation designee pursuant to Rule 2a-5 of the 1940 Act. In this capacity, the Adviser is responsible, among other things, for making all fair value determinations relating to the Fund’s portfolio investments, subject to the Board’s oversight.
In general, the market values of securities which are readily available and deemed reliable are determined as follows: securities listed on a national securities exchange (other than securities listed on the NASDAQ Stock Market, Inc. (“NASDAQ”)) or on a foreign securities exchange are valued at the last sale price at the close of the exchange or foreign securities exchange. If there has been no sale on such day, the securities are valued at the last traded price from the previous day. Securities listed on more than one exchange are valued by reference to the principal exchange on which the securities are traded; securities listed only on NASDAQ are valued in accordance with the NASDAQ Official Closing Price; listed or over the counter (“OTC”) market put or call options are valued at the mid level between the current bid and ask prices. If either a current bid or current ask price is unavailable, the Adviser will have discretion to determine the best valuation (e.g., last trade price in the case of listed options); open
| | |
| |
| abfunds.com | | AB CORPORATE BOND ETF | 19 |
NOTES TO FINANCIAL STATEMENTS (continued)
futures are valued using the closing settlement price or, in the absence of such a price, the most recent quoted bid price. If there are no quotations available for the day of valuation, the last available closing settlement price is used; U.S. Government securities and any other debt instruments having 60 days or less remaining until maturity are generally valued at fair value by an independent pricing service. If an independent fair value is not available, the securities are valued at amortized cost. This methodology is commonly used for short term securities that have an original maturity of 60 days or less, as well as short term securities that had an original term to maturity that exceeded 60 days. In instances when amortized cost is utilized, the Valuation Committee (the “Committee”) must reasonably conclude that the utilization of amortized cost is approximately the same as the fair value of the security. Factors the Committee will consider include, but are not limited to, an impairment of the creditworthiness of the issuer or material changes in interest rates. Fixed-income securities, including mortgage-backed and asset-backed securities, may be valued on the basis of prices provided by a pricing service or at a price obtained from one or more of the major broker-dealers. In cases where broker-dealer quotes are obtained, the Adviser may establish procedures whereby changes in market yields or spreads are used to adjust, on a daily basis, a recently obtained quoted price on a security. Swaps and other derivatives are valued daily, primarily using independent pricing services, independent pricing models using market inputs, as well as third party broker-dealers or counterparties. Open-end mutual funds are valued at the closing net asset value (“NAV”) per share, while exchange-traded funds are valued at the closing market price per share.
Securities for which market quotations are not readily available (including restricted securities) or are deemed unreliable are valued at fair value as deemed appropriate by the Adviser. Factors considered in making this determination may include, but are not limited to, information obtained by contacting the issuer, analysts, analysis of the issuer’s financial statements or other available documents. In addition, the Fund may use fair value pricing for securities primarily traded in non-U.S. markets because most foreign markets close well before the Fund values its securities at 4:00 p.m., Eastern Time. The earlier close of these foreign markets gives rise to the possibility that significant events may have occurred in the interim and may materially affect the value of those securities. To account for this, the Fund may value its foreign equity securities using fair value prices at the discretion of the Adviser.
2. Fair Value Measurements
In accordance with U.S. GAAP regarding fair value measurements, fair value is defined as the price that the Fund would receive to sell an asset or pay to transfer a liability in an orderly transaction between market
| | |
| |
20 | AB CORPORATE BOND ETF | | abfunds.com |
NOTES TO FINANCIAL STATEMENTS (continued)
participants at the measurement date. U.S. GAAP establishes a framework for measuring fair value, and a three-level hierarchy for fair value measurements based upon the transparency of inputs to the valuation of an asset or liability (including those valued based on their market values as described in Note A.1 above). Inputs may be observable or unobservable and refer broadly to the assumptions that market participants would use in pricing the asset or liability. Observable inputs reflect the assumptions market participants would use in pricing the asset or liability based on market data obtained from sources independent of the Fund. Unobservable inputs reflect the Fund’s own assumptions about the assumptions that market participants would use in pricing the asset or liability based on the best information available in the circumstances. Each investment is assigned a level based upon the observability of the inputs which are significant to the overall valuation. The three-tier hierarchy of inputs is summarized below.
| | • | | Level 1—quoted prices in active markets for identical investments |
| | • | | Level 2—other significant observable inputs (including quoted prices for similar investments, interest rates, prepayment speeds, credit risk, etc.) |
| | • | | Level 3—significant unobservable inputs (including the Fund’s own assumptions in determining the fair value of investments) |
The fair value of debt instruments, such as bonds, and over-the-counter derivatives is generally based on market price quotations, recently executed market transactions (where observable) or industry recognized modeling techniques and are generally classified as Level 2. Pricing vendor inputs to Level 2 valuations may include quoted prices for similar investments in active markets, interest rate curves, coupon rates, currency rates, yield curves, option adjusted spreads, default rates, credit spreads and other unique security features in order to estimate the relevant cash flows which are then discounted to calculate fair values. If these inputs are unobservable and significant to the fair value, these investments will be classified as Level 3.
Other fixed income investments, including non-U.S. government and corporate debt, are generally valued using quoted market prices, if available, which are typically impacted by current interest rates, maturity dates and any perceived credit risk of the issuer. Additionally, in the absence of quoted market prices, these inputs are used by pricing vendors to derive a valuation based upon industry or proprietary models which incorporate issuer specific data with relevant yield/spread comparisons with more widely quoted bonds with similar key characteristics. Those investments for which there are observable inputs are classified as Level 2. Where the inputs are not observable, the investments are classified as Level 3.
| | |
| |
| abfunds.com | | AB CORPORATE BOND ETF | 21 |
NOTES TO FINANCIAL STATEMENTS (continued)
The following table summarizes the valuation of the Fund’s investments by the above fair value hierarchy levels as of November 30, 2024:
| | | | | | | | | | | | | | | | |
Investments in Securities: | | Level 1 | | | Level 2 | | | Level 3 | | | Total | |
Assets: | | | | | | | | | | | | | | | | |
Corporates—Investment Grade | | $ | – 0 | – | | $ | 24,551,216 | | | $ | –0 | – | | $ | 24,551,216 | |
Short-Term Investments | | | 510,902 | | | | – 0 | – | | | – 0 | – | | | 510,902 | |
| | | | | | | | | | | | | | | | |
Total Investments in Securities | | | 510,902 | | | | 24,551,216 | | | | – 0 | – | | | 25,062,118 | |
Other Financial Instruments(a): | | | | | | | | | | | | | | | | |
Assets: | | | | | | | | | | | | | | | | |
Futures | | | 66,586 | | | | – 0 | – | | | – 0 | – | | | 66,586 | (b) |
Liabilities: | | | | | | | | | | | | | | | | |
Futures | | | (46,141 | ) | | | – 0 | – | | | – 0 | – | | | (46,141 | )(b) |
| | | | | | | | | | | | | | | | |
Total | | $ | 531,347 | | | $ | 24,551,216 | | | $ | – 0 | – | | $ | 25,082,563 | |
| | | | | | | | | | | | | | | | |
| (a) | Other financial instruments include derivative instruments, such as futures, forwards and swaps. Derivative instruments are valued at the unrealized appreciation (depreciation) on the instrument. Other financial instruments may also include swaps with upfront premiums, written options and written swaptions which are valued at market value. |
| (b) | Only variation margin receivable (payable) at period end is reported within the statement of assets and liabilities. This amount reflects cumulative unrealized appreciation (depreciation) on futures and centrally cleared swaps as reported in the portfolio of investments. Where applicable, centrally cleared swaps with upfront premiums are presented here at market value. |
3. Currency Translation
Assets and liabilities denominated in foreign currencies and commitments under forward currency exchange contracts are translated into U.S. dollars at the mean of the quoted bid and ask prices of such currencies against the U.S. dollar. Purchases and sales of portfolio securities are translated into U.S. dollars at the rates of exchange prevailing when such securities were acquired or sold. Income and expenses are translated into U.S. dollars at rates of exchange prevailing when accrued.
Net realized gain or loss on foreign currency transactions represents foreign exchange gains and losses from sales and maturities of foreign fixed income investments, holding of foreign currencies, currency gains or losses realized between the trade and settlement dates on foreign investment transactions, and the difference between the amounts of dividends, interest and foreign withholding taxes recorded on the Fund’s books and the U.S. dollar equivalent amounts actually received or paid. Net unrealized currency gains and losses from valuing foreign currency denominated assets and liabilities at period end exchange rates are reflected as a component of net unrealized appreciation or depreciation of foreign currency denominated assets and liabilities.
| | |
| |
22 | AB CORPORATE BOND ETF | | abfunds.com |
NOTES TO FINANCIAL STATEMENTS (continued)
4. Taxes
It is the Fund’s policy to meet the requirements of the Internal Revenue Code applicable to regulated investment companies and to distribute all of its investment company taxable income and net realized gains, if any, to shareholders. Therefore, no provisions for federal income or excise taxes are required. The Fund may be subject to taxes imposed by countries in which it invests. Such taxes are generally based on income and/or capital gains earned or repatriated. Taxes are accrued and applied to net investment income, net realized gains and net unrealized appreciation/depreciation as such income and/or gains are earned.
In accordance with U.S. GAAP requirements regarding accounting for uncertainties in income taxes, management has analyzed the Fund’s tax positions taken or expected to be taken on federal and state income tax returns for all open tax years (the current tax year) and has concluded that no provision for income tax is required in the Fund’s financial statements.
5. Investment Income and Investment Transactions
Dividend income is recorded on the ex-dividend date or as soon as the Fund is informed of the dividend. Interest income is accrued daily. Investment transactions are accounted for on the date the securities are purchased or sold. Investment gains or losses are determined on the identified cost basis. Non-cash dividends, if any, are recorded on the ex-dividend date at the fair value of the securities received. The Fund amortizes premiums and accretes discounts as adjustments to interest income.
The Fund accounts for distributions received from real estate investment trust (“REIT”) investments or from regulated investment companies as dividend income, realized gain, or return of capital based on information provided by the REIT or the investment company.
6. Dividends and Distributions
Dividends and distributions to shareholders, if any, are recorded on the ex-dividend date. Income dividends and capital gains distributions are determined in accordance with federal tax regulations and may differ from those determined in accordance with U.S. GAAP. To the extent these differences are permanent, such amounts are reclassified within the capital accounts based on their federal tax basis treatment; temporary differences do not require such reclassification.
7. Offering Expenses
The Adviser has agreed to pay all of the Fund’s organization and offering costs. The Fund is not obligated to repay any such organizational expenses or offering costs paid by the Adviser.
| | |
| |
| abfunds.com | | AB CORPORATE BOND ETF | 23 |
NOTES TO FINANCIAL STATEMENTS (continued)
8. Cash and Short-Term Investments
Cash and short-term investments include cash on hand and short-term investments with maturities of less than one year when purchased.
NOTE B
Advisory Fee and Other Transactions with Affiliates
Under the terms of the investment advisory agreement, the Fund pays the Adviser a unitary advisory fee at an annual rate of .30% of the Fund’s average daily net assets. The fees are accrued daily and paid monthly.
Under the investment advisory agreement, in accordance with the unitary fee structure, the Adviser bears the cost of various third-party services required by the Fund, including audit, custodial, accounting, legal, transfer agency and printing costs and the fees and expenses of the Corporation’s directors and their counsel. Also under the investment advisory agreement, the Adviser will reimburse the Fund for the Fund’s share of the acquired funds fees and expenses (advisory fees and other expenses) of any pooled investment vehicle for which the Adviser serves as investment adviser. For the period ended November 30, 2024, such waiver/reimbursements relating to the Fund’s investment in AB Government Money Market Portfolio amounted to $549.
A summary of the Fund’s transactions in AB mutual funds for the period ended November 30, 2024 is as follows:
| | | | | | | | | | | | | | | | | | | | |
Fund | | Market Value
11/30/23
(000) | | | Purchases
at Cost
(000) | | | Sales
Proceeds
(000) | | | Market Value
11/30/24
(000) | | | Dividend
Income
(000) | |
AB Government Money Market Portfolio | | $ | – 0 – | | | $ | 13,067 | | | $ | 12,556 | | | $ | 511 | | | $ | 17 | |
During the period ended November 30, 2024, the Adviser reimbursed the Fund $69 for trading losses incurred due to NAV error.
NOTE C
Distribution Plan
The Fund has adopted a Distribution and Service Plan pursuant to Rule 12b-1 of the Act which permits the Fund to pay distribution and servicing fees not to exceed .25% per year of the Fund’s average daily net assets. No such fees are currently paid, and the Board has not approved the commencement of payments under the Rule 12b-1 Distribution Plan.
| | |
| |
24 | AB CORPORATE BOND ETF | | abfunds.com |
NOTES TO FINANCIAL STATEMENTS (continued)
NOTE D
Investment Transactions
Purchases and sales of investment securities (excluding short-term investments and in-kind purchases and sales) for the period ended November 30, 2024 were as follows:
| | | | | | | | |
| | | Purchases | | | Sales | |
Investment securities (excluding U.S. government securities) | | $ | 68,519,553 | | | $ | 41,374,448 | |
U.S. government securities | | | 1,350,550 | | | | 1,357,584 | |
During the period ended November 30, 2024, the Fund delivered portfolio securities for the redemption of Fund shares (in-kind redemptions). Cash and portfolio securities were transferred for redemptions at fair value. For financial reporting purposes, the Fund recorded net realized gains and losses in connection with each in-kind redemption transaction. For the period ended November 30, 2024, the Fund had in-kind purchases and in-kind sales as follows:
| | | | | | | | |
| | | Purchases | | | Sales | |
In-kind transactions (excluding U.S. government securities) | | $ | 1,091,728 | | | $ | 4,501,944 | |
U.S. government securities | | | – 0 | – | | | – 0 | – |
The cost of investments for federal income tax purposes, gross unrealized appreciation and unrealized depreciation are as follows:
| | | | |
Cost | | $ | 24,627,659 | |
| | | | |
Gross unrealized appreciation | | $ | 509,305 | |
Gross unrealized depreciation | | | (74,846 | ) |
| | | | |
Net unrealized appreciation | | $ | 434,459 | |
| | | | |
1. Derivative Financial Instruments
The Fund may use derivatives in an effort to earn income and enhance returns, to replace more traditional direct investments, to obtain exposure to otherwise inaccessible markets (collectively, “investment purposes”), or to hedge or adjust the risk profile of its portfolio.
The principal type of derivative utilized by the Fund, as well as the methods in which they may be used are:
The Fund may buy or sell futures for investment purposes or for the purpose of hedging its portfolio against adverse effects of potential movements in the market. The Fund bears the market risk that arises
| | |
| |
| abfunds.com | | AB CORPORATE BOND ETF | 25 |
NOTES TO FINANCIAL STATEMENTS (continued)
from changes in the value of these instruments and the imperfect correlation between movements in the price of the futures and movements in the price of the assets, reference rates or indices which they are designed to track. Among other things, the Fund may purchase or sell futures for foreign currencies or options thereon for non-hedging purposes as a means of making direct investment in foreign currencies, as described below under “Currency Transactions”.
At the time the Fund enters into futures, the Fund deposits with the broker or segregates at its custodian cash or securities as collateral to satisfy initial margin requirements set by the exchange on which the transaction is effected. Pursuant to the contract, with respect to cash collateral, the Fund agrees to receive from or pay to the broker an amount of cash equal to the daily fluctuation in the value of the contract; in the case of securities collateral, the Fund agrees to adjust the securities position held in the segregated account accordingly. Such receipts, payments or adjustments are known as variation margin and are recorded by the Fund as unrealized gains or losses. Risks may arise from the potential inability of a counterparty to meet the terms of the contract. The credit/counterparty risk for exchange-traded futures is generally less than privately negotiated futures, since the clearinghouse, which is the issuer or counterparty to each exchange-traded future, has robust risk mitigation standards, including the requirement to provide initial and variation margin. When the contract is closed, the Fund records a realized gain or loss equal to the difference between the value of the contract at the time it was opened and the time it was closed.
Use of long futures subjects the Fund to risk of loss in excess of the amounts shown on the statement of assets and liabilities, up to the notional value of the futures. Use of short futures subjects the Fund to unlimited risk of loss. Under some circumstances, futures exchanges may establish daily limits on the amount that the price of futures can vary from the previous day’s settlement price, which could effectively prevent liquidation of unfavorable positions.
During the period ended November 30, 2024, the Fund held futures for hedging purposes.
| | |
| |
26 | AB CORPORATE BOND ETF | | abfunds.com |
NOTES TO FINANCIAL STATEMENTS (continued)
During the period ended November 30, 2024, the Fund had entered into the following derivatives:
| | | | | | | | | | | | |
| | | Asset Derivatives | | | Liability Derivatives | |
Derivative Type | | Statement of
Assets and
Liabilities
Location | | Fair Value | | | Statement of
Assets and
Liabilities
Location | | Fair Value | |
Interest rate contracts | | Receivable for variation margin on futures | | $ | 66,586 | * | | Payable for variation margin on futures | | $ | 46,141 | * |
| | | | | | | | | | | | |
Total | | | | $ | 66,586 | | | | | $ | 46,141 | |
| | | | | | | | | | | | |
| * | Only variation margin receivable/payable at period end is reported within the statement of assets and liabilities. This amount reflects cumulative unrealized appreciation (depreciation) on futures and centrally cleared swaps as reported in the portfolio of investments. |
| | | | | | | | | | |
Derivative Type | | Location of Gain or (Loss) on Derivatives Within Statement of Operations | | Realized Gain
or (Loss) on
Derivatives | | | Change in
Unrealized
Appreciation or
(Depreciation) | |
Interest rate contracts | | Net realized gain (loss) on futures; Net change in unrealized appreciation (depreciation) of futures | | $ | (9,213 | ) | | $ | 20,445 | |
| | | | | | | | | | |
Total | | | | $ | (9,213 | ) | | $ | 20,445 | |
| | | | | | | | | | |
The following table represents the average monthly volume of the Fund’s derivative transactions during the period ended November 30, 2024:
| | | | |
Futures: | | | | |
Average notional amount of buy contracts | | $ | 8,922,870 | |
Average notional amount of sale contracts | | $ | 8,603,432 | |
2. Currency Transactions
The Fund may invest in non-U.S. Dollar-denominated securities on a currency hedged or unhedged basis. The Fund may seek investment opportunities by taking long or short positions in currencies through the use of currency-related derivatives, including forward currency exchange contracts, futures and options on futures, swaps, and other options. The Fund may enter into transactions for investment opportunities when it anticipates that a foreign currency will appreciate or depreciate in value but securities denominated in that currency are not held by the Fund and do not present attractive investment opportunities. Such transactions may also be used when the Adviser believes that it may be more efficient than a direct investment in a foreign currency-denominated security. The Fund may also
| | |
| |
| abfunds.com | | AB CORPORATE BOND ETF | 27 |
NOTES TO FINANCIAL STATEMENTS (continued)
conduct currency exchange contracts on a spot basis (i.e., for cash at the spot rate prevailing in the currency exchange market for buying or selling currencies).
NOTE E
Shares of the Fund
The Fund’s shares may only be bought and sold in a secondary market through a broker-dealer at a market price. Because ETF shares trade at market prices rather than NAV, shares may trade at a price greater than NAV (a premium) or less than NAV (a discount). The Fund issues and redeems shares at its NAV only in aggregations of a specified number of shares (a creation unit) generally in exchange for a designated portfolio of securities and/or cash (including any portion of such securities for which cash may be substituted). A fixed transaction fee is imposed on authorized participants in connection with creation unit redemption and creation transactions. Authorized participants may be required to pay an additional variable charge to cover certain costs and expenses related to the execution of trades resulting from creation unit transactions. Such variable charges, if any, are included in other capital within the Statement of Changes in Net Assets.
Transactions in shares of the Fund were as follows:
| | | | | | | | | | | | | | | | |
| | | | | | | | | | | | | | | | |
| | | Shares | | | | | | Amount | | | | |
| | | December 13,
2023(a) to
November 30, 2024 | | | | | | December 13,
2023(a) to
November 30, 2024 | | | | |
| | | | | | | | |
Shares sold | | | 900,028 | | | | | | | $ | 31,674,325 | | | | | |
| | | | | |
Shares redeemed | | | (200,000 | ) | | | | | | | (7,159,395 | ) | | | | |
| | | | | |
Net increase | | | 700,028 | | | | | | | $ | 24,514,930 | | | | | |
| | | | | |
| (a) | Commencement of operations. |
NOTE F
Risks Involved in Investing in the Fund
Market Risk—The value of the Fund’s assets will fluctuate as the bond market fluctuates. The value of its investments may decline, sometimes rapidly and unpredictably, simply because of economic changes or other events, including public health crises (including the occurrence of a contagious disease or illness), interest rate levels, and regional and global conflicts, that affect large portions of the market.
Credit Risk—An issuer or guarantor of a fixed-income security, or the counterparty to a derivatives or other contract, may be unable or unwilling to make timely payments of interest or principal, or to otherwise honor its
| | |
| |
28 | AB CORPORATE BOND ETF | | abfunds.com |
NOTES TO FINANCIAL STATEMENTS (continued)
obligations. The issuer or guarantor may default, causing a loss of the full principal amount of a security and accrued interest. The degree of risk for a particular security may be reflected in its credit rating. There is the possibility that the credit rating of a fixed-income security may be downgraded after purchase, which may adversely affect the value of the security.
Interest-Rate Risk—Changes in interest rates will affect the value of investments in fixed-income securities. When interest rates rise, the value of existing investments in fixed-income securities tends to fall and this decrease in value may not be offset by higher income from new investments. Interest-rate risk is generally greater for fixed-income securities with longer maturities or durations. The Fund may be subject to a greater risk of rising interest rates than would normally be the case due to the recent end of a period of historically low rates and the effects of potential central bank monetary policy, and government fiscal policy, initiatives and market reactions to those initiatives.
Duration Risk—Duration is a measure that relates the expected price volatility of a fixed-income security to changes in interest rates. The duration of a fixed-income security may be shorter than or equal to full maturity of a fixed-income security. Fixed-income securities with longer durations have more risk and will decrease in price as interest rates rise. For example, a fixed-income security with a duration of three years will likely decrease in value by approximately 3% if interest rates increase by 1%.
Inflation Risk—This is the risk that the value of assets or income from investments will be less in the future as inflation decreases the value of money. As inflation increases, the value of the Fund’s assets can decline as can the value of the Fund’s distributions. This risk is significantly greater for fixed-income securities with longer maturities.
Foreign (Non-U.S.) Investments Risk—Investments in securities of non-U.S. issuers may involve more risk than those of U.S. issuers. These securities may fluctuate more widely in price and may be more difficult to trade than domestic securities due to adverse market, economic, political, regulatory or other factors.
Leverage Risk—When the Fund borrows money or otherwise leverages its investments, its performance may be volatile because leverage tends to exaggerate the effect of any increase or decrease in the value of the Fund’s investments. The Fund may create leverage through the use of reverse repurchase arrangements, forward currency exchange contracts, forward commitments, dollar rolls or futures or by borrowing money. The use of other types of derivative instruments by the Fund, such as options and swaps, may also result in a form of leverage. Leverage may result in
| | |
| |
| abfunds.com | | AB CORPORATE BOND ETF | 29 |
NOTES TO FINANCIAL STATEMENTS (continued)
higher returns to the Fund than if the Fund were not leveraged, but may also adversely affect returns, particularly if the market is declining.
Derivatives Risk—Derivatives may be difficult to price or unwind and may be leveraged so that small changes may produce disproportionate losses for the Fund. A short position in a derivative instrument involves the risk of a theoretically unlimited increase in the value of the underlying asset, reference rate or index, which could cause the Fund to suffer a potentially unlimited loss. Derivatives, especially over-the-counter derivatives, are also subject to counterparty risk, which is the risk that the counterparty (the party on the other side of the transaction) on a derivative transaction will be unable or unwilling to honor its contractual obligations to the Fund.
Illiquid Investments Risk—Illiquid investments risk exists when certain investments are or become difficult to purchase or sell. Difficulty in selling such investments may result in sales at disadvantageous prices affecting the value of your investment in the Fund. Causes of illiquid investments risk may include low trading volumes and large positions. Foreign fixed-income securities may have more illiquid investments risk because secondary trading markets for these securities may be smaller and less well-developed and the securities may trade less frequently than domestic securities. Illiquid investments risk may be higher in a rising interest rate environment, when the value and liquidity of fixed-income securities generally go down.
Below Investment Grade Securities Risk—Investments in fixed-income securities with lower ratings (commonly known as “junk bonds”) are subject to a higher probability that an issuer will default or fail to meet its payment obligations. These securities may be subject to greater price volatility due to such factors as specific municipal or corporate developments and negative performance of the junk bond market generally and may be more difficult to trade than other types of securities.
Cash Transactions Risk—The Fund intends to effectuate all or a portion of the issuance and redemption of Creation Units for cash, rather than in-kind securities. As a result, an investment in the Fund may be less tax-efficient than an investment in an ETF that effectuates its Creation Units only on an in-kind basis. A fund that effects redemptions for cash may be required to sell portfolio securities in order to obtain the cash needed to distribute redemption proceeds. Any recognized gain on these sales by the Fund will generally cause the Fund to recognize a gain it might not otherwise have recognized, or to recognize such gain sooner than would otherwise be required as compared to an ETF that distributes portfolio securities in-kind in redemption of Creation Units. The Fund intends to distribute gains that arise by virtue of the issuance and redemption of Creation Units being effectuated in cash to shareholders to
| | |
| |
30 | AB CORPORATE BOND ETF | | abfunds.com |
NOTES TO FINANCIAL STATEMENTS (continued)
avoid being taxed on this gain at the fund level and otherwise comply with applicable tax requirements. This may cause shareholders to be subject to tax on gains to which they would not otherwise be subject, or at an earlier date than if they had made an investment in another ETF. Moreover, cash transactions may have to be carried out over several days if the securities market is relatively illiquid and may involve considerable brokerage fees and taxes. Brokerage fees, which will be higher than if the Fund sold and redeemed its shares principally in-kind, will be passed on to those purchasing and redeeming Creation Units in the form of creation and redemption transaction fees. In addition, these factors may result in wider spreads between the bid and ask prices of Fund shares than for ETFs that receive and distribute portfolio securities in-kind. The Fund’s use of cash for creations and redemptions could also result in dilution to the Fund and increased transaction costs, which could negatively impact the Fund’s ability to achieve its investment objective.
ETF Share Price and Net Asset Value Risk—The Fund’s shares are listed for trading on the Nasdaq Stock Market LLC (the “Exchange”). Shares are generally bought and sold in the secondary market at market prices. The NAV per share of the Fund will fluctuate with changes in the market value of the Fund’s holdings. The Fund’s NAV is calculated once per day, at the end of the day. The market price of a share on the Exchange could be higher than the NAV (premium), or lower than the NAV (discount) and may fluctuate during the trading day. When all or a portion of the Fund’s underlying securities trade in a market that is closed when the market for the Fund’s shares is open, there may be differences between the current value of a security and the last quoted price for that security in the closed local market, which could lead to a deviation between the market value of the Fund’s shares and the Fund’s NAV. Disruptions in the creations and redemptions process or the existence of extreme market volatility could result in the Fund’s shares trading above or below NAV. As the Fund may invest in securities traded on foreign exchanges, Fund shares may trade at a larger premium or discount to the Fund’s NAV than shares of other ETFs. In addition, in stressed market conditions, the market for Fund shares may become less liquid in response to deteriorating liquidity in the markets for the Fund’s underlying portfolio holdings.
Authorized Participant Risk—Only a limited number of financial institutions that enter into an authorized participant relationship with the Fund (“Authorized Participants”) may engage in creation or redemption transactions. If the Fund’s Authorized Participants decide not to create or redeem shares, Fund shares may trade at a larger premium or discount to the Fund’s NAV, or the Fund could face trading halts or de-listing.
Active Trading Market Risk—There is no guarantee that an active trading market for Fund shares will exist at all times. In times of market stress,
| | |
| |
| abfunds.com | | AB CORPORATE BOND ETF | 31 |
NOTES TO FINANCIAL STATEMENTS (continued)
markets can suffer erratic or unpredictable trading activity, extraordinary volatility or wide bid/ask spreads, which could cause some market makers and Authorized Participants to reduce their market activity or “step away” from making a market in ETF shares. Market makers and Authorized Participants are not obligated to place or execute purchase and redemption orders. This could cause the Fund’s market price to deviate, materially, from the NAV, and reduce the effectiveness of the ETF arbitrage process. Any absence of an active trading market for Fund shares could lead to a heightened risk that there will be a difference between the market price of a Fund share and the underlying value of the Fund share.
Indemnification Risk—In the ordinary course of business, the Fund enters into contracts that contain a variety of indemnifications. The Fund’s maximum exposure under these arrangements is unknown. However, the Fund has not had prior claims or losses pursuant to these indemnification provisions and expects the risk of loss thereunder to be remote. Therefore, the Fund has not accrued any liability in connection with these indemnification provisions.
Management Risk—The Fund is subject to management risk because it is an actively-managed ETF. The Adviser will apply its investment techniques and risk analyses in making investment decisions, but there is no guarantee that its techniques will produce the intended results. Many of these techniques incorporate, or rely upon, quantitative models, but there is no guarantee that these models will generate accurate forecasts, reduce risk or otherwise perform as expected.
NOTE G
Joint Credit Facility
A number of ETFs managed by the Adviser, including the Fund, participate in a $325 million revolving credit facility (the “Facility”) intended to provide short-term financing related to redemptions and other short term liquidity requirements, subject to certain restrictions. Commitment fees related to the Facility are paid by the participating funds and are included in miscellaneous expenses in the statement of operations. The Fund did not utilize the Facility during the period ended November 30, 2024.
NOTE H
Distributions to Shareholders
The tax character of distributions paid during the fiscal year ended November 30, 2024 was as follows:
| | | | |
| | | 2024 | |
Distributions paid from: | | | | |
Ordinary income | | $ | 1,119,835 | |
| | | | |
Total taxable distributions paid | | $ | 1,119,835 | |
| | | | |
| | |
| |
32 | AB CORPORATE BOND ETF | | abfunds.com |
NOTES TO FINANCIAL STATEMENTS (continued)
As of November 30, 2024, the components of accumulated earnings (deficit) on a tax basis were as follows:
| | | | |
Undistributed ordinary income | | $ | 307,773 | |
Unrealized appreciation (depreciation) | | | 434,459 | (a) |
| | | | |
Total accumulated earnings (deficit) | | $ | 742,232 | |
| | | | |
| (a) | The differences between book-basis and tax-basis unrealized appreciation (depreciation) are attributable primarily to the recognition for tax purposes of unrealized gains (losses) on certain derivative instruments, the tax treatment of callable bonds, and the tax deferral of losses on wash sales. |
For tax purposes, net realized capital losses may be carried over to offset future capital gains, if any. Funds are permitted to carry forward capital losses for an indefinite period, and such losses will retain their character as either short-term or long-term capital losses. As of November 30, 2024, the Fund did not have any capital loss carryforwards.
During the current fiscal year, permanent differences primarily due to the utilization of earnings and profits distributed to shareholders on redemption of shares, the tax treatment of gains from a redemption-in-kind, and contributions from the Adviser resulted in a net decrease in distributable earnings and a net increase in additional paid-in capital. These reclassifications had no effect on net assets.
NOTE I
Recent Accounting Pronouncements
In December 2022, the Financial Accounting Standards Board issued an Accounting Standards Update, ASU 2022-06, “Reference Rate Reform (Topic 848) – Deferral of the Sunset Date of Topic 848”. ASU 2022-06 is an amendment to ASU 2020-04, which provided optional guidance to ease the potential accounting burden due to the discontinuation of the LIBOR and other interbank-offered based reference rates and which was effective as of March 12, 2020 through December 31, 2022. ASU 2022-06 extends the effective period through December 31, 2024. Management is currently evaluating the impact, if any, of applying ASU 2022-06.
In November 2023, the Financial Accounting Standards Board issued Accounting Standards Update, ASU 2023-07, “Segment Reporting (Topic 280)”. ASU 2023-07 requires public entities to provide disclosure of significant segment expenses that are regularly provided to the chief operating decision maker (“CODM”). ASU 2023-07, among other things, (i) requires a single segment public entity to provide all necessary disclosures required by Topic 280 it, (ii) requires a public entity to disclose the title and position of the CODM and an explanation of how the CODM uses the reported measure(s) of segment profit and loss in assessing segment performance and deciding how to allocate resources and (iii) provides the ability for a public entity to elect more than one performance measure. ASU 2023-07 is effective for fiscal years beginning after December 15,
| | |
| |
| abfunds.com | | AB CORPORATE BOND ETF | 33 |
NOTES TO FINANCIAL STATEMENTS (continued)
2023, and interim periods within fiscal years beginning after December 15, 2024. Early adoption of ASU 2023-07 is permitted. Management is currently evaluating the impact, if any, of applying ASU 2023-07.
NOTE J
Subsequent Events
Management has evaluated subsequent events for possible recognition or disclosure in the financial statements through the date the financial statements are issued. Management has determined that there are no material events that would require disclosure in the Fund’s financial statements through this date.
| | |
| |
34 | AB CORPORATE BOND ETF | | abfunds.com |
FINANCIAL HIGHLIGHTS
Selected Data For A Share of Capital Stock Outstanding Throughout Each Period
| | | | |
| | | December 13, 2023(a) to
November 30,
2024 | |
| | | | |
Net asset value, beginning of period | | | $ 35.00 | |
| | | | |
Income From Investment Operations | |
| |
Net investment income(b)(c) | | | 1.77 | |
| |
Net realized and unrealized gain on investment transactions | | | 1.05 | |
| |
Contributions from Affiliates | | | .00 | (d) |
| | | | |
Net increase in net asset value from operations | | | 2.82 | |
| | | | |
Less: Dividends | | | | |
| |
Dividends from net investment income | | | (1.60 | ) |
| | | | |
Net asset value, end of period | | | $ 36.22 | |
| | | | |
| |
Total Return | | | | |
| |
Total investment return based on net asset value(e) | | | 8.24 | % |
Ratios/Supplemental Data | |
| |
Net assets, end of period (000’s omitted) | | | $25,358 | |
|
Ratio to average net assets of: | |
| |
Expenses, net of waivers/reimbursements | | | .30 | %^ |
| |
Expenses, before waivers/reimbursements | | | .30 | %^ |
| |
Net investment income(c) | | | 5.13 | %^ |
| |
Portfolio turnover rate(f) | | | 175 | % |
| (a) | Commencement of operations. |
| (b) | Based on average shares outstanding. |
| (c) | Net of expenses waived/reimbursed by the Adviser. |
| (d) | Amount is less than $.005. |
| (e) | Total investment return is calculated assuming an initial investment made at the net asset value at the beginning of the period, reinvestment of all dividends and distributions at net asset value during the period, and redemption on the last day of the period. Total investment return does not reflect the deduction of taxes that a shareholder would pay on fund distributions or the redemption of fund shares. Total investment return calculated for a period of less than one year is not annualized. |
| (f) | Excludes the value of portfolio securities received or delivered as a result of in-kind purchases or redemptions of the Fund’s capital shares, including ETF Creation Units. |
See notes to financial statements.
| | |
| |
| abfunds.com | | AB CORPORATE BOND ETF | 35 |
REPORT OF INDEPENDENT REGISTERED
PUBLIC ACCOUNTING FIRM
To the Shareholders and the Board of Directors of
AB Corporate Bond ETF
Opinion on the Financial Statements
We have audited the accompanying statement of assets and liabilities of AB Corporate Bond ETF (the “Fund”) (one of the funds constituting AB Active ETFs, Inc. (the “Corporation”)), including the portfolio of investments, as of November 30, 2024, and the related statements of operations and changes in net assets and the financial highlights for the period from December 13, 2023 (commencement of operations) to November 30, 2024, and the related notes (collectively referred to as the “financial statements”). In our opinion, the financial statements present fairly, in all material respects, the financial position of the Fund (one of the funds constituting AB Active ETFs, Inc.) at November 30, 2024, the results of its operations, the changes in its net assets and its financial highlights for the period from December 13, 2023 (commencement of operations) to November 30, 2024, in conformity with U.S. generally accepted accounting principles.
Basis for Opinion
These financial statements are the responsibility of the Corporation’s management. Our responsibility is to express an opinion on the Fund’s financial statements based on our audit. We are a public accounting firm registered with the Public Company Accounting Oversight Board (United States) (“PCAOB”) and are required to be independent with respect to the Corporation in accordance with the U.S. federal securities laws and the applicable rules and regulations of the Securities and Exchange Commission and the PCAOB.
We conducted our audit in accordance with the standards of the PCAOB. Those standards require that we plan and perform the audit to obtain reasonable assurance about whether the financial statements are free of material misstatement, whether due to error or fraud. The Corporation is not required to have, nor were we engaged to perform, an audit of the Corporation’s internal control over financial reporting. As part of our audit, we are required to obtain an understanding of internal control over financial reporting but not for the purpose of expressing an opinion on the effectiveness of the Corporation’s internal control over financial reporting. Accordingly, we express no such opinion.
Our audit included performing procedures to assess the risks of material misstatement of the financial statements, whether due to error or fraud, and performing procedures that respond to those risks. Such procedures included examining, on a test basis, evidence regarding the amounts
| | |
| |
36 | AB CORPORATE BOND ETF | | abfunds.com |
REPORT OF INDEPENDENT REGISTERED
PUBLIC ACCOUNTING FIRM (continued)
and disclosures in the financial statements. Our procedures included confirmation of securities owned as of November 30, 2024, by correspondence with the custodian, brokers and others; when replies were not received from brokers or others, we performed other auditing procedures. Our audit also included evaluating the accounting principles used and significant estimates made by management, as well as evaluating the overall presentation of the financial statements. We believe that our audit provides a reasonable basis for our opinion.

We have served as the auditor of one or more of the AB investment companies since 1968.
New York, New York
January 28, 2025
| | |
| |
| abfunds.com | | AB CORPORATE BOND ETF | 37 |
2024 FEDERAL TAX INFORMATION
(unaudited)
For Federal income tax purposes, the following information is furnished with respect to the distributions paid by the Fund during the taxable year ended November 30, 2024. For foreign shareholders, 89.31% of ordinary income dividends paid may be considered to be qualifying to be taxed as interest-related dividends.
Shareholders should not use the above information to prepare their income tax returns. The information necessary to complete your income tax returns will be included with your Form 1099-DIV which will be sent to you separately in January 2025.
| | |
| |
38 | AB CORPORATE BOND ETF | | abfunds.com |
Information Regarding the Review and Approval of the Fund’s Advisory Agreement
The disinterested directors (the “directors”) of AB Active ETFs, Inc. (the “Company”) unanimously approved the Company’s Advisory Agreement with the Adviser in respect of AB Corporate Bond ETF (the “Fund”) for an initial two-year period at a meeting held in-person on August 1-2, 2023 (the “Meeting”)
Prior to approval of the Advisory Agreement, the directors had requested from the Adviser, and received and evaluated, extensive materials. They reviewed the proposed Advisory Agreement with the Adviser and with experienced counsel who are independent of the Adviser, who advised on the relevant legal standards. The directors also reviewed additional materials, including comparative analytical data prepared by the Senior Vice President of the Fund. The directors also discussed the proposed approval in private sessions with counsel.
The directors considered their knowledge of the nature and quality of the services to be provided by the Adviser to the Fund gained from their experience as directors or trustees of most of the registered investment companies advised by the Adviser, including the other series of the Company that are organized as exchange-traded funds (“ETFs”), their overall confidence in the Adviser’s integrity and competence they have gained from that experience, the Adviser’s initiative in identifying and raising potential issues with the directors and its responsiveness, frankness and attention to concerns raised by the directors in the past, including the Adviser’s willingness to consider and implement organizational and operational changes designed to improve investment results and the services provided to the AB Funds. The directors noted that they have four regular meetings each year, at each of which they review extensive materials and information from the Adviser, including information on the investment performance of the AB Funds.
The directors also considered all factors they believed relevant, including the specific matters discussed below. During the course of their deliberations, the directors evaluated, among other things, the reasonableness of the proposed advisory fee. The directors did not identify any particular information that was all-important or controlling, and different directors may have attributed different weights to the various factors. The directors determined that the selection of the Adviser to manage the Fund and the overall arrangements between the Fund and the Adviser, as provided in the Advisory Agreement, including the proposed advisory fee, were fair and reasonable in light of the services to be performed, expenses to be incurred and such other matters as the directors considered relevant in the exercise
| | |
| |
| abfunds.com | | AB CORPORATE BOND ETF | 39 |
of their business judgment. The material factors and conclusions that formed the basis for the directors’ determinations included the following:
Nature, Extent and Quality of Services to be Provided
The directors considered the scope and quality of services to be provided by the Adviser under the Advisory Agreement, including the quality of the investment research capabilities of the Adviser and the other resources it has dedicated to performing services for the AB Funds. They also noted the professional experience and qualifications of the Fund’s portfolio management team and other senior personnel of the Adviser. The directors also considered that the Advisory Agreement provides that the Fund will reimburse the Adviser for the cost to it of providing certain clerical, accounting, administrative and other services to the Fund by employees of the Adviser or its affiliates. Requests for these reimbursements will be subject to the directors’ approval on a quarterly basis. The directors noted that the Adviser does not expect to request such reimbursements. The quality of administrative and other services, including the Adviser’s role in coordinating the activities of the Fund’s other service providers, also was considered. The directors concluded that, overall, they were satisfied with the nature, extent and quality of services to be provided to the Fund under the Advisory Agreement.
Costs of Services to be Provided and Profitability
Because the Fund had not yet commenced operations, the directors were unable to consider historical information about the profitability of the Fund. However, the Adviser agreed to provide the directors with profitability information in connection with future proposed continuances of the Advisory Agreement. They also considered the costs to be borne by the Adviser in providing services to the Fund and that the Fund was unlikely to be profitable to the Adviser unless it achieves a material level of net assets.
Fall-Out Benefits
The directors considered the other benefits to the Adviser from its proposed relationship with the Fund. The directors recognized that the Adviser’s future profitability would be somewhat lower without these benefits. The directors understood that the Adviser also might derive reputational and other benefits from its association with the Fund.
Investment Results
Since the Fund had not yet commenced operations, no performance or other historical information for the Fund was available. Based on the Adviser’s written and oral presentations regarding the proposed management of the Fund and their general knowledge and confidence in the Adviser’s expertise in managing mutual funds and ETFs, the directors concluded that they were satisfied that the Adviser was capable of providing high quality Fund management services to the Fund.
| | |
| |
40 | AB CORPORATE BOND ETF | | abfunds.com |
Advisory Fees and Other Expenses
The directors considered the proposed advisory fee rate payable by the Fund to the Adviser and information prepared by an independent service provider (the “15(c) service provider”), concerning advisory fee rates payable by other ETFs in the same category as the Fund, based on the Fund’s projected net assets of $250 million. The directors noted that the proposed advisory fee is a unitary fee and that the Adviser will pay all expenses of the Fund except for certain expenses payable by the Fund such as interest expense, taxes, extraordinary expenses, and brokerage commissions and other transaction costs. The directors recognized that it is difficult to make comparisons of advisory fees because there are variations in the services that are included in the fees payable by other ETFs. The directors considered the Fund’s proposed contractual advisory fee rate against a peer group median and noted that it was equal to the median.
The directors also considered the Adviser’s fee schedule for other clients utilizing investment strategies similar to those of the Fund. For this purpose, they reviewed the relevant advisory fee information from the Adviser’s Form ADV and in a report from the Fund’s Senior Vice President and noted the differences between the Fund’s proposed fee schedule, on the one hand, and the Adviser’s institutional fee schedule, on the other. The directors noted that the Adviser may, in some cases, agree to fee rates with large institutional clients that are lower than those reviewed by the directors and that they had previously discussed with the Adviser its policies in respect of such arrangements. The directors also compared the proposed advisory fee rate for the Fund with those for other funds advised by the Adviser utilizing similar investment strategies.
The Adviser reviewed with the directors the significantly greater scope of the services it will provide to the Fund relative to institutional clients. In this regard, the Adviser noted, among other things, that, compared to institutional accounts, the Fund (i) demands considerably more managerial and administrative resources due to the potential for frequent creations and redemptions of shares; (ii) has more tax and regulatory restrictions and compliance obligations; (iii) must prepare and file or distribute regulatory and other communications about fund operations; and (iv) must provide shareholder servicing to retail investors. The Adviser also reviewed the greater legal risks presented by the large and changing population of Fund shareholders who may assert claims against the Adviser in individual or class actions, and the greater entrepreneurial risk in offering new fund products, which require substantial investment to launch, may not succeed, and generally must be priced to compete with larger, more established funds resulting in lack of to the Adviser until a new fund achieves scale. In light of the substantial differences in services rendered by the Adviser to institutional clients as compared to the Fund, and the different risk profile, the directors considered these fee comparisons inapt and did
| | |
| |
| abfunds.com | | AB CORPORATE BOND ETF | 41 |
not place significant weight on them in their deliberations. The directors noted that the proposed unitary fee for the Fund covers additional services provided by third parties and thus is not directly comparable to the Adviser’s institutional fee schedule and the schedule of fees for most other funds advised by the Adviser.
In connection with their review of the Fund’s proposed advisory fee, the directors also considered the projected total expense ratio of the shares of the Fund in comparison to the medians for a group of similar ETFs (“peer group”) and a larger group of similar ETFs (“peer universe”) selected by the 15(c) service provider. The directors view the projected expense ratio information as relevant to their evaluation of the Adviser’s services because the Adviser is responsible for coordinating services provided to the Fund by others and, in most cases, the Adviser will be responsible for paying for such services under its unitary fee arrangement with the Fund. The directors noted that the Fund’s projected expense ratio was equal to a median. Based on their review, the directors concluded that the Fund’s projected expense ratio was acceptable.
Economies of Scale
The directors noted that the proposed advisory fee schedule for the Fund does not contain breakpoints and that they had discussed their strong preference for breakpoints in advisory contracts with the Adviser. The directors took into consideration prior presentations by an independent consultant on economies of scale in the mutual fund industry and for the AB Funds, and presentations from time to time by the Adviser concerning certain of its views on economies of scale. The directors also had requested and received from the Adviser certain updates on economies of scale in advance of the Meeting. The directors believe that economies of scale may be realized (if at all) by the Adviser across a variety of products and services, and not only in respect of a single fund. The directors noted that there is no established methodology for setting breakpoints that give effect to the fund-specific services provided by a fund’s adviser and to the economies of scale that an adviser may realize in its overall mutual fund business or those components of it which directly or indirectly affect a fund’s operations. The directors observed that in the mutual fund industry as a whole, as well as among ETFs similar to the Fund, there is no uniformity or pattern in the fees and asset levels at which breakpoints (if any) apply. The directors also noted that the advisory agreements for many ETFs do not have breakpoints at all. The directors informed the Adviser that they would monitor the Fund’s asset level and its profitability to the Adviser and anticipated revisiting the question of breakpoints in the future if circumstances warranted doing so.
| | |
| |
42 | AB CORPORATE BOND ETF | | abfunds.com |
NOTES
| | |
| |
| abfunds.com | | AB CORPORATE BOND ETF | 43 |
NOTES
| | |
| |
44 | AB CORPORATE BOND ETF | | abfunds.com |
AB CORPORATE BOND ETF
66 Hudson Boulevard East
New York, NY 10001
800 221 5672
ETF-COB-0151-1124 
NOV 11.30.24

ANNUAL FINANCIAL STATEMENTS AND ADDITIONAL INFORMATION
AB CORE PLUS BOND ETF
(NASDAQ: CPLS)

| | |
| |
| Investment Products Offered | | • Are Not FDIC Insured • May Lose Value • Are Not Bank Guaranteed |
Investors should consider the investment objectives, risks, charges and expenses of the Fund carefully before investing. For copies of our prospectus or summary prospectus, which contain this and other information, visit us online at www.abfunds.com or contact your AB representative. Please read the prospectus and/or summary prospectus carefully before investing.
This shareholder report must be preceded or accompanied by the Fund’s prospectus for individuals who are not current shareholders of the Fund.
You may obtain a description of the Fund’s proxy voting policies and procedures, and information regarding how the Fund voted proxies relating to portfolio securities during the most recent 12-month period ended June 30, without charge. Simply visit AB’s website at www.abfunds.com, or go to the Securities and Exchange Commission’s (the “Commission”) website at www.sec.gov, or call AB at (800) 227 4618.
The Fund files its complete schedule of portfolio holdings with the Commission for the first and third quarters of each fiscal year as an exhibit to its reports on Form N-PORT. The Fund’s Form N-PORT reports are available on the Commission’s website at www.sec.gov. AB publishes full portfolio holdings for the Fund daily at www.abfunds.com.
Foreside Fund Services, LLC (“Foreside”) is the distributor of the fund. Foreside is a member of FINRA.
The [A/B] logo and AllianceBernstein® are registered trademarks used by permission of the owner, AllianceBernstein L.P.
PORTFOLIO OF INVESTMENTS
November 30, 2024
| | | | | | | | |
| | | Principal
Amount
(000) | | | U.S. $ Value | |
| |
GOVERNMENTS - TREASURIES – 46.2% | | | | | | | | |
United States – 46.2% | | | | | | | | |
U.S. Treasury Bonds
1.375%, 11/15/2040 | | $ | 792 | | | $ | 516,532 | |
1.75%, 08/15/2041 | | | 42 | | | | 28,652 | |
1.875%, 11/15/2051 | | | 2,330 | | | | 1,386,350 | |
2.75%, 11/15/2047 | | | 39 | | | | 29,018 | |
2.875%, 05/15/2043 | | | 2,413 | | | | 1,920,974 | |
2.875%, 05/15/2049 | | | 65 | | | | 49,075 | |
2.875%, 05/15/2052 | | | 7 | | | | 5,252 | |
3.00%, 11/15/2044 | | | 357 | | | | 285,098 | |
3.375%, 11/15/2048 | | | 110 | | | | 91,231 | |
3.625%, 05/15/2053 | | | 58 | | | | 50,569 | |
4.25%, 08/15/2054 | | | 12 | | | | 11,738 | |
4.625%, 05/15/2054 | | | 589 | | | | 612,100 | |
U.S. Treasury Notes
0.625%, 05/15/2030 | | | 330 | | | | 274,158 | |
0.625%, 08/15/2030 | | | 874 | | | | 719,957 | |
1.125%, 02/29/2028 | | | 1,213 | | | | 1,103,072 | |
1.25%, 04/30/2028 | | | 2,863 | | | | 2,602,646 | |
1.25%, 05/31/2028 | | | 640 | | | | 580,500 | |
1.25%, 06/30/2028 | | | 487 | | | | 440,811 | |
1.25%, 09/30/2028 | | | 361 | | | | 324,562 | |
1.375%, 12/31/2028 | | | 531 | | | | 476,821 | |
1.50%, 02/15/2025 | | | 58 | | | | 57,638 | |
2.625%, 02/15/2029 | | | 1,180 | | | | 1,112,703 | |
2.75%, 02/15/2028 | | | 641 | | | | 614,659 | |
2.75%, 08/15/2032 | | | 2,839 | | | | 2,576,392 | |
2.875%, 05/15/2028 | | | 830 | | | | 796,800 | |
2.875%, 08/15/2028 | | | 401 | | | | 383,895 | |
2.875%, 04/30/2029 | | | 148 | | | | 140,646 | |
3.125%, 08/31/2027 | | | 920 | | | | 895,994 | |
3.25%, 06/30/2029 | | | 140 | | | | 135,012 | |
3.50%, 01/31/2028 | | | 183 | | | | 179,626 | |
3.875%, 08/15/2034 | | | 255 | | | | 248,466 | |
4.125%, 10/31/2026 | | | 1,212 | | | | 1,210,296 | |
4.125%, 08/31/2030 | | | 1,521 | | | | 1,521,000 | |
4.25%, 05/31/2025 | | | 219 | | | | 218,795 | |
4.25%, 01/31/2026 | | | 2,076 | | | | 2,074,054 | |
4.25%, 11/15/2034 | | | 402 | | | | 403,822 | |
4.375%, 05/15/2034 | | | 187 | | | | 189,571 | |
4.50%, 11/15/2033 | | | 26 | | | | 26,597 | |
4.875%, 11/30/2025 | | | 471 | | | | 473,281 | |
5.00%, 09/30/2025 | | | 540 | | | | 542,447 | |
5.00%, 10/31/2025 | | | 264 | | | | 265,361 | |
| | | | | | | | |
| | |
Total Governments - Treasuries
(cost $25,297,341) | | | | | | | 25,576,171 | |
| | | | | |
| | |
| |
| abfunds.com | | AB CORE PLUS BOND ETF | 1 |
PORTFOLIO OF INVESTMENTS (continued)
| | | | | | | | |
| | | Principal
Amount
(000) | | | U.S. $ Value | |
| |
CORPORATES - INVESTMENT GRADE – 40.7% | | | | | | | | |
Industrial – 21.3% | | | | | | | | |
Basic – 0.1% | | | | | | | | |
Amcor Group Finance PLC
5.45%, 05/23/2029 | | $ | 22 | | | $ | 22,411 | |
Glencore Funding LLC
5.893%, 04/04/2054(a) | | | 15 | | | | 15,391 | |
Sonoco Products Co.
4.45%, 09/01/2026 | | | 25 | | | | 24,869 | |
| | | | | | | | |
| | | | | | | 62,671 | |
| | | | | | | | |
Capital Goods – 2.0% | |
Boeing Co. (The)
2.196%, 02/04/2026 | | | 113 | | | | 109,224 | |
2.75%, 02/01/2026 | | | 127 | | | | 123,591 | |
Caterpillar Financial Services Corp.
4.60%, 11/15/2027 | | | 25 | | | | 25,123 | |
4.70%, 11/15/2029 | | | 25 | | | | 25,201 | |
General Dynamics Corp.
4.25%, 04/01/2050 | | | 7 | | | | 6,076 | |
IDEX Corp.
4.95%, 09/01/2029 | | | 26 | | | | 26,225 | |
Lockheed Martin Corp.
5.20%, 02/15/2064 | | | 135 | | | | 132,698 | |
5.90%, 11/15/2063 | | | 120 | | | | 131,807 | |
Otis Worldwide Corp.
5.125%, 11/19/2031 | | | 25 | | | | 25,400 | |
Parker-Hannifin Corp.
4.25%, 09/15/2027 | | | 125 | | | | 124,280 | |
RTX Corp.
3.125%, 05/04/2027 | | | 136 | | | | 131,396 | |
3.50%, 03/15/2027 | | | 134 | | | | 130,839 | |
Vulcan Materials Co.
4.95%, 12/01/2029 | | | 25 | | | | 25,237 | |
Waste Management, Inc.
4.50%, 03/15/2028 | | | 25 | | | | 24,987 | |
4.65%, 03/15/2030 | | | 25 | | | | 25,013 | |
4.80%, 03/15/2032 | | | 25 | | | | 25,047 | |
5.35%, 10/15/2054 | | | 25 | | | | 25,423 | |
| | | | | | | | |
| | | | | | | 1,117,567 | |
| | | | | | | | |
Communications - Media – 2.4% | |
DirecTV Financing LLC
8.875%, 02/01/2030(a) | | | 120 | | | | 120,989 | |
DirecTV Financing LLC/DirecTV Financing Co-Obligor, Inc.
5.875%, 08/15/2027(a) | | | 127 | | | | 124,681 | |
| | |
| |
2 | AB CORE PLUS BOND ETF | | abfunds.com |
PORTFOLIO OF INVESTMENTS (continued)
| | | | | | | | |
| | | Principal
Amount
(000) | | | U.S. $ Value | |
| |
Meta Platforms, Inc.
4.65%, 08/15/2062 | | $ | 14 | | | $ | 12,642 | |
5.40%, 08/15/2054 | | | 26 | | | | 26,579 | |
5.55%, 08/15/2064 | | | 84 | | | | 87,014 | |
5.60%, 05/15/2053 | | | 120 | | | | 126,746 | |
5.75%, 05/15/2063 | | | 104 | | | | 110,784 | |
Paramount Global
4.375%, 03/15/2043 | | | 171 | | | | 131,533 | |
Time Warner Cable LLC
6.55%, 05/01/2037 | | | 59 | | | | 58,647 | |
6.75%, 06/15/2039 | | | 123 | | | | 124,760 | |
7.30%, 07/01/2038 | | | 44 | | | | 46,424 | |
Warnermedia Holdings, Inc.
3.755%, 03/15/2027 | | | 127 | | | | 123,044 | |
5.05%, 03/15/2042 | | | 137 | | | | 115,894 | |
5.141%, 03/15/2052 | | | 123 | | | | 98,995 | |
| | | | | | | | |
| | | | | | | 1,308,732 | |
| | | | | | | | |
Communications - Telecommunications – 0.9% | | | | | | | | |
Corning, Inc.
5.45%, 11/15/2079 | | | 9 | | | | 8,656 | |
Sprint LLC
7.625%, 03/01/2026 | | | 119 | | | | 122,104 | |
T-Mobile USA, Inc.
1.50%, 02/15/2026 | | | 76 | | | | 73,144 | |
2.05%, 02/15/2028 | | | 44 | | | | 40,644 | |
2.25%, 02/15/2026 | | | 121 | | | | 117,485 | |
2.625%, 04/15/2026 | | | 126 | | | | 122,574 | |
5.50%, 01/15/2055 | | | 12 | | | | 11,995 | |
| | | | | | | | |
| | | | | | | 496,602 | |
| | | | | | | | |
Consumer Cyclical - Automotive – 1.4% | | | | | | | | |
BMW US Capital LLC
4.60%, 08/13/2027(a) | | | 26 | | | | 25,982 | |
4.90%, 04/02/2029(a) | | | 16 | | | | 16,071 | |
Cummins, Inc.
5.45%, 02/20/2054 | | | 119 | | | | 122,327 | |
General Motors Co.
5.15%, 04/01/2038 | | | 129 | | | | 122,751 | |
5.40%, 10/15/2029 | | | 46 | | | | 46,809 | |
General Motors Financial Co., Inc.
5.35%, 07/15/2027 | | | 24 | | | | 24,322 | |
5.40%, 04/06/2026 | | | 58 | | | | 58,433 | |
5.60%, 06/18/2031 | | | 24 | | | | 24,505 | |
Hyundai Capital America
4.30%, 09/24/2027(a) | | | 25 | | | | 24,709 | |
4.55%, 09/26/2029(a) | | | 17 | | | | 16,717 | |
| | |
| |
| abfunds.com | | AB CORE PLUS BOND ETF | 3 |
PORTFOLIO OF INVESTMENTS (continued)
| | | | | | | | |
| | | Principal
Amount
(000) | | | U.S. $ Value | |
| |
4.875%, 11/01/2027(a) | | $ | 25 | | | $ | 25,038 | |
5.275%, 06/24/2027(a) | | | 25 | | | | 25,296 | |
5.30%, 03/19/2027(a) | | | 67 | | | | 67,732 | |
5.30%, 06/24/2029(a) | | | 25 | | | | 25,387 | |
5.35%, 03/19/2029(a) | | | 9 | | | | 9,144 | |
5.45%, 06/24/2026(a) | | | 25 | | | | 25,212 | |
Nissan Motor Acceptance Co., LLC
1.85%, 09/16/2026(a) | | | 134 | | | | 123,899 | |
5.30%, 09/13/2027(a) | | | 9 | | | | 8,777 | |
| | | | | | | | |
| | | | | | | 793,111 | |
| | | | | | | | |
Consumer Cyclical - Entertainment – 0.2% | | | | | | | | |
Brunswick Corp./DE
5.85%, 03/18/2029 | | | 77 | | | | 79,088 | |
Hasbro, Inc.
6.05%, 05/14/2034 | | | 34 | | | | 35,073 | |
| | | | | | | | |
| | | | | | | 114,161 | |
| | | | | | | | |
Consumer Cyclical - Other – 0.2% | | | | | | | | |
Marriott International, Inc./MD
4.80%, 03/15/2030 | | | 25 | | | | 25,019 | |
5.35%, 03/15/2035 | | | 25 | | | | 25,242 | |
Series R
3.125%, 06/15/2026 | | | 78 | | | | 76,228 | |
| | | | | | | | |
| | | | | | | 126,489 | |
| | | | | | | | |
Consumer Cyclical - Restaurants – 0.1% | | | | | | | | |
McDonald’s Corp.
3.50%, 03/01/2027 | | | 25 | | | | 24,455 | |
| | | | | | | | |
| | |
Consumer Cyclical - Retailers – 0.6% | | | | | | | | |
7-Eleven, Inc.
1.30%, 02/10/2028(a) | | | 145 | | | | 129,243 | |
2.80%, 02/10/2051(a) | | | 215 | | | | 131,610 | |
Home Depot, Inc. (The)
2.75%, 09/15/2051 | | | 21 | | | | 13,623 | |
4.50%, 12/06/2048 | | | 31 | | | | 27,982 | |
5.30%, 06/25/2054 | | | 25 | | | | 25,306 | |
| | | | | | | | |
| | | | | | | 327,764 | |
| | | | | | | | |
Consumer Non-Cyclical – 5.0% | | | | | | | | |
AbbVie, Inc.
4.45%, 05/14/2046 | | | 145 | | | | 129,679 | |
4.875%, 11/14/2048 | | | 65 | | | | 61,398 | |
5.40%, 03/15/2054 | | | 126 | | | | 128,056 | |
5.50%, 03/15/2064 | | | 130 | | | | 132,617 | |
Altria Group, Inc.
4.25%, 08/09/2042 | | | 155 | | | | 129,971 | |
5.95%, 02/14/2049 | | | 120 | | | | 123,577 | |
Bristol-Myers Squibb Co.
5.65%, 02/22/2064 | | | 130 | | | | 133,007 | |
| | |
| |
4 | AB CORE PLUS BOND ETF | | abfunds.com |
PORTFOLIO OF INVESTMENTS (continued)
| | | | | | | | |
| | | Principal
Amount
(000) | | | U.S. $ Value | |
| |
Cardinal Health, Inc.
3.41%, 06/15/2027 | | $ | 127 | | | $ | 123,440 | |
5.35%, 11/15/2034 | | | 25 | | | | 25,318 | |
Cencora, Inc.
2.70%, 03/15/2031 | | | 140 | | | | 123,430 | |
Coca-Cola Co. (The)
4.65%, 08/14/2034 | | | 26 | | | | 25,945 | |
5.20%, 01/14/2055 | | | 26 | | | | 26,150 | |
5.40%, 05/13/2064 | | | 130 | | | | 132,990 | |
CVS Health Corp.
2.875%, 06/01/2026 | | | 68 | | | | 66,078 | |
5.40%, 06/01/2029 | | | 7 | | | | 7,123 | |
5.55%, 06/01/2031 | | | 17 | | | | 17,290 | |
5.70%, 06/01/2034 | | | 86 | | | | 87,811 | |
6.00%, 06/01/2044 | | | 24 | | | | 24,143 | |
Eli Lilly & Co.
2.50%, 09/15/2060 | | | 127 | | | | 73,284 | |
4.15%, 08/14/2027 | | | 25 | | | | 24,935 | |
4.20%, 08/14/2029 | | | 25 | | | | 24,810 | |
5.10%, 02/09/2064 | | | 37 | | | | 36,020 | |
5.20%, 08/14/2064 | | | 13 | | | | 12,850 | |
General Mills, Inc.
4.875%, 01/30/2030 | | | 25 | | | | 25,130 | |
5.25%, 01/30/2035 | | | 25 | | | | 25,268 | |
Gilead Sciences, Inc.
5.10%, 06/15/2035 | | | 25 | | | | 25,346 | |
HCA, Inc.
5.95%, 09/15/2054 | | | 26 | | | | 26,210 | |
Merck & Co., Inc. | | | | | | | | |
2.90%, 12/10/2061 | | | 210 | | | | 129,677 | |
3.90%, 03/07/2039 | | | 6 | | | | 5,306 | |
PepsiCo, Inc.
4.80%, 07/17/2034 | | | 24 | | | | 24,157 | |
5.25%, 07/17/2054 | | | 24 | | | | 24,455 | |
Pfizer Investment Enterprises Pte Ltd.
5.34%, 05/19/2063 | | | 135 | | | | 131,244 | |
Philip Morris International, Inc.
0.875%, 05/01/2026 | | | 86 | | | | 81,703 | |
2.10%, 05/01/2030 | | | 151 | | | | 132,483 | |
2.75%, 02/25/2026 | | | 90 | | | | 88,042 | |
4.375%, 11/01/2027 | | | 25 | | | | 24,903 | |
4.625%, 11/01/2029 | | | 25 | | | | 24,969 | |
4.75%, 11/01/2031 | | | 25 | | | | 24,896 | |
Tyson Foods, Inc.
4.00%, 03/01/2026 | | | 122 | | | | 120,959 | |
Utah Acquisition Sub, Inc.
3.95%, 06/15/2026 | | | 76 | | | | 74,889 | |
| | |
| |
| abfunds.com | | AB CORE PLUS BOND ETF | 5 |
PORTFOLIO OF INVESTMENTS (continued)
| | | | | | | | |
| | | Principal
Amount
(000) | | | U.S. $ Value | |
| |
Viatris, Inc.
4.00%, 06/22/2050 | | $ | 173 | | | $ | 124,430 | |
| | | | | | | | |
| | | | | | | 2,783,989 | |
| | | | | | | | |
Energy – 1.2% | | | | | | | | |
Columbia Pipelines Operating Co., LLC
6.544%, 11/15/2053(a) | | | 52 | | | | 57,559 | |
ConocoPhillips Co.
5.50%, 01/15/2055 | | | 25 | | | | 25,201 | |
5.65%, 01/15/2065 | | | 25 | | | | 25,249 | |
Continental Resources, Inc./OK
2.268%, 11/15/2026(a) | | | 126 | | | | 119,404 | |
Energy Transfer LP
5.25%, 07/01/2029 | | | 25 | | | | 25,434 | |
6.05%, 09/01/2054 | | | 25 | | | | 25,850 | |
Enterprise Products Operating LLC
5.55%, 02/16/2055 | | | 25 | | | | 25,535 | |
Series E
5.25%, 08/16/2077 | | | 124 | | | | 121,051 | |
Kinder Morgan, Inc.
5.10%, 08/01/2029 | | | 25 | | | | 25,332 | |
MPLX LP
1.75%, 03/01/2026 | | | 128 | | | | 123,249 | |
5.50%, 06/01/2034 | | | 24 | | | | 24,313 | |
Northern Natural Gas Co.
5.625%, 02/01/2054(a) | | | 7 | | | | 7,123 | |
ONEOK, Inc.
4.40%, 10/15/2029 | | | 8 | | | | 7,865 | |
TotalEnergies Capital SA
5.488%, 04/05/2054 | | | 5 | | | | 5,053 | |
5.638%, 04/05/2064 | | | 15 | | | | 15,207 | |
| | | | | | | | |
| | | | | | | 633,425 | |
| | | | | | | | |
Other Industrial – 0.3% | | | | | | | | |
George Washington University (The)
Series 2018
4.126%, 09/15/2048 | | | 150 | | | | 131,100 | |
Huntington Ingalls Industries, Inc.
5.353%, 01/15/2030 | | | 25 | | | | 25,237 | |
| | | | | | | | |
| | | | | | | 156,337 | |
| | | | | | | | |
Services – 0.1% | | | | | | | | |
Amazon.com, Inc.
4.10%, 04/13/2062 | | | 9 | | | | 7,483 | |
eBay, Inc.
3.65%, 05/10/2051 | | | 20 | | | | 14,973 | |
Equifax, Inc.
4.80%, 09/15/2029 | | | 25 | | | | 24,908 | |
| | |
| |
6 | AB CORE PLUS BOND ETF | | abfunds.com |
PORTFOLIO OF INVESTMENTS (continued)
| | | | | | | | |
| | | Principal
Amount
(000) | | | U.S. $ Value | |
| |
Mastercard, Inc.
3.65%, 06/01/2049 | | $ | 9 | | | $ | 7,171 | |
PayPal Holdings, Inc.
5.50%, 06/01/2054 | | | 24 | | | | 24,805 | |
| | | | | | | | |
| | | | | | | 79,340 | |
| | | | | | | | |
Technology – 5.8% | | | | | | | | |
Allegion US Holding Co., Inc.
5.60%, 05/29/2034 | | | 22 | | | | 22,654 | |
Alphabet, Inc.
2.25%, 08/15/2060 | | | 225 | | | | 130,952 | |
Amphenol Corp.
2.80%, 02/15/2030 | | | 101 | | | | 92,335 | |
Apple, Inc.
2.55%, 08/20/2060 | | | 209 | | | | 130,431 | |
2.80%, 02/08/2061 | | | 207 | | | | 131,319 | |
2.85%, 08/05/2061 | | | 203 | | | | 130,594 | |
3.95%, 08/08/2052 | | | 55 | | | | 46,278 | |
4.10%, 08/08/2062 | | | 90 | | | | 75,771 | |
Applied Materials, Inc.
4.80%, 06/15/2029 | | | 14 | | | | 14,202 | |
Broadcom, Inc.
4.15%, 02/15/2028 | | | 7 | | | | 6,905 | |
Concentrix Corp.
6.60%, 08/02/2028 | | | 127 | | | | 129,939 | |
6.65%, 08/02/2026 | | | 123 | | | | 125,433 | |
Dell International LLC/EMC Corp.
4.90%, 10/01/2026 | | | 66 | | | | 66,164 | |
6.02%, 06/15/2026 | | | 125 | | | | 126,971 | |
Fiserv, Inc.
3.20%, 07/01/2026 | | | 60 | | | | 58,643 | |
Fortive Corp.
3.15%, 06/15/2026 | | | 126 | | | | 123,067 | |
Hewlett Packard Enterprise Co.
1.75%, 04/01/2026 | | | 129 | | | | 123,969 | |
4.40%, 09/25/2027 | | | 45 | | | | 44,776 | |
4.45%, 09/25/2026 | | | 112 | | | | 111,592 | |
5.00%, 10/15/2034 | | | 11 | | | | 10,862 | |
Intel Corp.
2.60%, 05/19/2026 | | | 121 | | | | 117,404 | |
3.75%, 03/25/2027 | | | 128 | | | | 125,170 | |
3.75%, 08/05/2027 | | | 25 | | | | 24,380 | |
Intuit, Inc.
5.50%, 09/15/2053 | | | 127 | | | | 130,509 | |
Microsoft Corp.
2.675%, 06/01/2060 | | | 208 | | | | 129,698 | |
3.041%, 03/17/2062 | | | 40 | | | | 27,177 | |
4.50%, 02/06/2057 | | | 140 | | | | 133,522 | |
| | |
| |
| abfunds.com | | AB CORE PLUS BOND ETF | 7 |
PORTFOLIO OF INVESTMENTS (continued)
| | | | | | | | |
| | | Principal
Amount
(000) | | | U.S. $ Value | |
| |
Oracle Corp.
1.65%, 03/25/2026 | | $ | 81 | | | $ | 77,917 | |
2.65%, 07/15/2026 | | | 80 | | | | 77,637 | |
3.85%, 04/01/2060 | | | 176 | | | | 128,577 | |
4.10%, 03/25/2061 | | | 172 | | | | 131,047 | |
QUALCOMM, Inc.
4.30%, 05/20/2047 | | | 150 | | | | 129,936 | |
Texas Instruments, Inc.
5.05%, 05/18/2063 | | | 135 | | | | 129,715 | |
5.15%, 02/08/2054 | | | 15 | | | | 14,916 | |
Tyco Electronics Group SA
4.625%, 02/01/2030 | | | 123 | | | | 122,665 | |
| | | | | | | | |
| | | | | | | 3,203,127 | |
| | | | | | | | |
Transportation - Airlines – 0.2% | | | | | | | | |
Delta Air Lines, Inc./SkyMiles IP Ltd.
4.75%, 10/20/2028(a) | | | 109 | | | | 108,216 | |
| | | | | | | | |
| | |
Transportation - Railroads – 0.2% | | | | | | | | |
Canadian Pacific Railway Co.
6.125%, 09/15/2115 | | | 117 | | | | 125,740 | |
| | | | | | | | |
| | |
Transportation - Services – 0.6% | | | | | | | | |
Element Fleet Management Corp.
6.271%, 06/26/2026(a) | | | 77 | | | | 78,446 | |
Penske Truck Leasing Co. LP/PTL Finance Corp.
1.20%, 11/15/2025(a) | | | 58 | | | | 56,023 | |
1.70%, 06/15/2026(a) | | | 107 | | | | 101,992 | |
5.25%, 07/01/2029(a) | | | 9 | | | | 9,149 | |
5.35%, 03/30/2029(a) | | | 76 | | | | 77,331 | |
5.55%, 05/01/2028(a) | | | 8 | | | | 8,184 | |
Ryder System, Inc.
4.90%, 12/01/2029 | | | 25 | | | | 25,072 | |
| | | | | | | | |
| | | | | | | 356,197 | |
| | | | | | | | |
| | | | | | | 11,817,923 | |
| | | | | | | | |
Financial Institutions – 17.1% | | | | | | | | |
Banking – 12.2% | | | | | | | | |
American Express Co.
5.098%, 02/16/2028 | | | 70 | | | | 70,544 | |
5.284%, 07/26/2035 | | | 25 | | | | 25,371 | |
5.389%, 07/28/2027 | | | 123 | | | | 124,298 | |
5.645%, 04/23/2027 | | | 100 | | | | 101,196 | |
5.915%, 04/25/2035 | | | 24 | | | | 25,119 | |
Bank of America Corp.
1.734%, 07/22/2027 | | | 137 | | | | 130,473 | |
3.419%, 12/20/2028 | | | 83 | | | | 79,803 | |
3.559%, 04/23/2027 | | | 125 | | | | 122,899 | |
3.705%, 04/24/2028 | | | 134 | | | | 130,791 | |
4.25%, 10/22/2026 | | | 76 | | | | 75,371 | |
| | |
| |
8 | AB CORE PLUS BOND ETF | | abfunds.com |
PORTFOLIO OF INVESTMENTS (continued)
| | | | | | | | |
| | | Principal
Amount
(000) | | | U.S. $ Value | |
| |
5.08%, 01/20/2027 | | $ | 118 | | | $ | 118,379 | |
Series N
1.658%, 03/11/2027 | | | 129 | | | | 123,995 | |
Bank of Montreal
0.949%, 01/22/2027 | | | 126 | | | | 120,669 | |
Bank of New York Mellon Corp. (The)
3.442%, 02/07/2028 | | | 130 | | | | 126,743 | |
4.89%, 07/21/2028 | | | 24 | | | | 24,178 | |
5.06%, 07/22/2032 | | | 8 | | | | 8,120 | |
5.188%, 03/14/2035 | | | 16 | | | | 16,296 | |
5.225%, 11/20/2035 | | | 25 | | | | 25,542 | |
Canadian Imperial Bank of Commerce
4.508%, 09/11/2027 | | | 25 | | | | 24,914 | |
Capital One Financial Corp.
2.359%, 07/29/2032 | | | 152 | | | | 124,838 | |
5.463%, 07/26/2030 | | | 24 | | | | 24,358 | |
5.884%, 07/26/2035 | | | 24 | | | | 24,795 | |
Citigroup, Inc.
1.122%, 01/28/2027 | | | 128 | | | | 122,630 | |
1.462%, 06/09/2027 | | | 135 | | | | 128,357 | |
2.976%, 11/05/2030 | | | 39 | | | | 35,723 | |
3.52%, 10/27/2028 | | | 127 | | | | 122,709 | |
3.887%, 01/10/2028 | | | 121 | | | | 118,795 | |
4.542%, 09/19/2030 | | | 25 | | | | 24,649 | |
5.827%, 02/13/2035 | | | 35 | | | | 35,659 | |
Citizens Financial Group, Inc.
5.718%, 07/23/2032 | | | 25 | | | | 25,509 | |
5.841%, 01/23/2030 | | | 118 | | | | 121,335 | |
Comerica, Inc.
5.982%, 01/30/2030 | | | 120 | | | | 122,516 | |
Fifth Third Bancorp
6.361%, 10/27/2028 | | | 35 | | | | 36,373 | |
8.25%, 03/01/2038 | | | 102 | | | | 124,982 | |
Goldman Sachs Bank USA/New York NY
5.414%, 05/21/2027 | | | 24 | | | | 24,219 | |
Series B
5.283%, 03/18/2027 | | | 16 | | | | 16,107 | |
Goldman Sachs Group, Inc. (The)
1.431%, 03/09/2027 | | | 87 | | | | 83,381 | |
3.615%, 03/15/2028 | | | 134 | | | | 130,495 | |
4.017%, 10/31/2038 | | | 136 | | | | 120,141 | |
4.411%, 04/23/2039 | | | 48 | | | | 43,892 | |
4.692%, 10/23/2030 | | | 25 | | | | 24,833 | |
5.049%, 07/23/2030 | | | 24 | | | | 24,166 | |
5.33%, 07/23/2035 | | | 24 | | | | 24,287 | |
5.851%, 04/25/2035 | | | 24 | | | | 25,196 | |
Series VAR
1.093%, 12/09/2026 | | | 128 | | | | 123,264 | |
| | |
| |
| abfunds.com | | AB CORE PLUS BOND ETF | 9 |
PORTFOLIO OF INVESTMENTS (continued)
| | | | | | | | |
| | | Principal
Amount
(000) | | | U.S. $ Value | |
| |
Huntington Bancshares, Inc.
5.272%, 01/15/2031 | | $ | 25 | | | $ | 25,316 | |
JPMorgan Chase & Co.
1.04%, 02/04/2027 | | | 129 | | | | 123,476 | |
1.045%, 11/19/2026 | | | 57 | | | | 55,027 | |
1.47%, 09/22/2027 | | | 56 | | | | 52,854 | |
2.956%, 05/13/2031 | | | 135 | | | | 122,164 | |
3.782%, 02/01/2028 | | | 66 | | | | 64,733 | |
3.96%, 01/29/2027 | | | 113 | | | | 112,012 | |
3.964%, 11/15/2048 | | | 20 | | | | 16,540 | |
4.452%, 12/05/2029 | | | 25 | | | | 24,704 | |
5.04%, 01/23/2028 | | | 46 | | | | 46,274 | |
5.534%, 11/29/2045 | | | 25 | | | | 25,686 | |
5.571%, 04/22/2028 | | | 22 | | | | 22,415 | |
5.581%, 04/22/2030 | | | 68 | | | | 70,102 | |
5.766%, 04/22/2035 | | | 20 | | | | 20,997 | |
M&T Bank Corp.
6.082%, 03/13/2032 | | | 24 | | | | 24,954 | |
7.413%, 10/30/2029 | | | 111 | | | | 119,849 | |
Morgan Stanley
0.985%, 12/10/2026 | | | 128 | | | | 123,059 | |
1.593%, 05/04/2027 | | | 128 | | | | 122,336 | |
4.654%, 10/18/2030 | | | 25 | | | | 24,822 | |
5.042%, 07/19/2030 | | | 25 | | | | 25,203 | |
5.05%, 01/28/2027 | | | 119 | | | | 119,363 | |
5.297%, 04/20/2037 | | | 122 | | | | 120,747 | |
5.32%, 07/19/2035 | | | 25 | | | | 25,428 | |
5.652%, 04/13/2028 | | | 76 | | | | 77,515 | |
5.656%, 04/18/2030 | | | 14 | | | | 14,428 | |
5.831%, 04/19/2035 | | | 24 | | | | 25,208 | |
Series G
1.512%, 07/20/2027 | | | 103 | | | | 97,656 | |
PNC Financial Services Group, Inc. (The)
4.758%, 01/26/2027 | | | 62 | | | | 61,994 | |
5.30%, 01/21/2028 | | | 16 | | | | 16,190 | |
5.401%, 07/23/2035 | | | 25 | | | | 25,482 | |
5.676%, 01/22/2035 | | | 30 | | | | 31,109 | |
6.615%, 10/20/2027 | | | 125 | | | | 129,060 | |
Santander Holdings USA, Inc.
2.49%, 01/06/2028 | | | 124 | | | | 117,649 | |
6.124%, 05/31/2027 | | | 76 | | | | 77,156 | |
6.499%, 03/09/2029 | | | 75 | | | | 77,887 | |
State Street Corp.
4.33%, 10/22/2027 | | | 25 | | | | 24,916 | |
4.53%, 02/20/2029 | | | 25 | | | | 24,929 | |
Sumitomo Mitsui Financial Group, Inc.
2.632%, 07/14/2026 | | | 126 | | | | 122,090 | |
| | |
| |
10 | AB CORE PLUS BOND ETF | | abfunds.com |
PORTFOLIO OF INVESTMENTS (continued)
| | | | | | | | |
| | | Principal
Amount
(000) | | | U.S. $ Value | |
| |
Synchrony Financial
5.935%, 08/02/2030 | | $ | 10 | | | $ | 10,222 | |
Synovus Financial Corp.
6.168%, 11/01/2030 | | | 25 | | | | 25,472 | |
Toronto-Dominion Bank (The)
1.20%, 06/03/2026 | | | 127 | | | | 120,767 | |
Truist Financial Corp.
5.153%, 08/05/2032 | | | 25 | | | | 25,101 | |
5.435%, 01/24/2030 | | | 14 | | | | 14,252 | |
5.711%, 01/24/2035 | | | 14 | | | | 14,452 | |
6.047%, 06/08/2027 | | | 103 | | | | 104,828 | |
US Bancorp
5.10%, 07/23/2030 | | | 25 | | | | 25,257 | |
Wells Fargo & Co.
3.00%, 10/23/2026 | | | 124 | | | | 120,302 | |
3.196%, 06/17/2027 | | | 126 | | | | 122,972 | |
3.526%, 03/24/2028 | | | 69 | | | | 67,100 | |
3.584%, 05/22/2028 | | | 5 | | | | 4,857 | |
4.10%, 06/03/2026 | | | 88 | | | | 87,122 | |
4.75%, 12/07/2046 | | | 34 | | | | 30,222 | |
4.808%, 07/25/2028 | | | 51 | | | | 50,988 | |
5.211%, 12/03/2035 | | | 25 | | | | 25,167 | |
5.499%, 01/23/2035 | | | 8 | | | | 8,191 | |
5.574%, 07/25/2029 | | | 98 | | | | 100,514 | |
5.707%, 04/22/2028 | | | 76 | | | | 77,571 | |
| | | | | | | | |
| | | | | | | 6,754,597 | |
| | | | | | | | |
Brokerage – 0.4% | | | | | | | | |
BlackRock Funding, Inc.
5.35%, 01/08/2055 | | | 25 | | | | 25,466 | |
Blue Owl Finance LLC
6.25%, 04/18/2034 | | | 117 | | | | 123,093 | |
CI Financial Corp.
3.20%, 12/17/2030 | | | 85 | | | | 74,441 | |
Jefferies Financial Group, Inc.
6.20%, 04/14/2034 | | | 24 | | | | 25,310 | |
| | | | | | | | |
| | | | | | | 248,310 | |
| | | | | | | | |
Finance – 1.5% | | | | | | | | |
Apollo Debt Solutions BDC
6.70%, 07/29/2031(a) | | | 121 | | | | 125,672 | |
Ares Strategic Income Fund
5.70%, 03/15/2028(a) | | | 25 | | | | 25,098 | |
Blackstone Private Credit Fund
5.25%, 04/01/2030(a) | | | 25 | | | | 24,539 | |
Blackstone Secured Lending Fund
5.875%, 11/15/2027 | | | 24 | | | | 24,524 | |
| | |
| |
| abfunds.com | | AB CORE PLUS BOND ETF | 11 |
PORTFOLIO OF INVESTMENTS (continued)
| | | | | | | | |
| | | Principal
Amount
(000) | | | U.S. $ Value | |
| |
Blue Owl Credit Income Corp.
5.80%, 03/15/2030(a) | | $ | 25 | | | $ | 24,812 | |
6.60%, 09/15/2029(a) | | | 23 | | | | 23,636 | |
6.65%, 03/15/2031 | | | 122 | | | | 125,401 | |
Brookfield Finance, Inc.
3.50%, 03/30/2051 | | | 180 | | | | 131,341 | |
5.675%, 01/15/2035 | | | 25 | | | | 25,842 | |
FS KKR Capital Corp.
6.125%, 01/15/2030 | | | 25 | | | | 25,132 | |
6.875%, 08/15/2029 | | | 24 | | | | 25,037 | |
HAT Holdings I LLC/HAT Holdings II LLC
8.00%, 06/15/2027(a) | | | 120 | | | | 125,348 | |
HPS Corporate Lending Fund
6.25%, 09/30/2029(a) | | | 24 | | | | 24,175 | |
Main Street Capital Corp.
6.50%, 06/04/2027 | | | 24 | | | | 24,424 | |
Oaktree Strategic Credit Fund
6.50%, 07/23/2029 | | | 24 | | | | 24,473 | |
Sixth Street Lending Partners
5.75%, 01/15/2030(a) | | | 25 | | | | 24,725 | |
| | | | | | | | |
| | | | | | | 804,179 | |
| | | | | | | | |
Insurance – 2.4% | | | | | | | | |
American International Group, Inc.
Series A-9
5.75%, 04/01/2048 | | | 37 | | | | 36,772 | |
Athene Global Funding
5.322%, 11/13/2031(a) | | | 25 | | | | 25,026 | |
5.349%, 07/09/2027(a) | | | 24 | | | | 24,228 | |
5.62%, 05/08/2026(a) | | | 75 | | | | 75,726 | |
5.684%, 02/23/2026(a) | | | 43 | | | | 43,378 | |
Athene Holding Ltd.
6.25%, 04/01/2054 | | | 77 | | | | 81,203 | |
Brighthouse Financial Global Funding
5.55%, 04/09/2027(a) | | | 78 | | | | 78,892 | |
Cigna Group (The)
1.25%, 03/15/2026 | | | 35 | | | | 33,498 | |
3.40%, 03/01/2027 | | | 52 | | | | 50,653 | |
4.90%, 12/15/2048 | | | 85 | | | | 77,368 | |
5.60%, 02/15/2054 | | | 15 | | | | 15,049 | |
CNO Global Funding
4.95%, 09/09/2029(a) | | | 25 | | | | 25,029 | |
5.875%, 06/04/2027(a) | | | 24 | | | | 24,523 | |
Elevance Health, Inc.
5.65%, 06/15/2054 | | | 24 | | | | 24,372 | |
F&G Global Funding
5.875%, 06/10/2027(a) | | | 24 | | | | 24,404 | |
| | |
| |
12 | AB CORE PLUS BOND ETF | | abfunds.com |
PORTFOLIO OF INVESTMENTS (continued)
| | | | | | | | |
| | | Principal
Amount
(000) | | | U.S. $ Value | |
| |
Health Care Service Corp. A Mutual Legal Reserve Co.
5.875%, 06/15/2054(a) | | $ | 24 | | | $ | 24,432 | |
Markel Group, Inc.
6.00%, 05/16/2054 | | | 24 | | | | 25,056 | |
Marsh & McLennan Cos., Inc.
4.55%, 11/08/2027 | | | 25 | | | | 25,094 | |
4.65%, 03/15/2030 | | | 25 | | | | 25,054 | |
4.85%, 11/15/2031 | | | 25 | | | | 25,091 | |
5.35%, 11/15/2044 | | | 25 | | | | 25,396 | |
5.40%, 03/15/2055 | | | 25 | | | | 25,383 | |
Massachusetts Mutual Life Insurance Co.
3.729%, 10/15/2070(a) | | | 188 | | | | 130,126 | |
Mutual of Omaha Cos. Global Funding
5.35%, 04/09/2027(a) | | | 15 | | | | 15,215 | |
New York Life Insurance Co.
4.45%, 05/15/2069(a) | | | 155 | | | | 128,851 | |
Reinsurance Group of America, Inc.
5.75%, 09/15/2034 | | | 25 | | | | 25,762 | |
RGA Global Funding
5.448%, 05/24/2029(a) | | | 24 | | | | 24,631 | |
Sammons Financial Group, Inc.
6.875%, 04/15/2034(a) | | | 57 | | | | 60,625 | |
UnitedHealth Group, Inc.
5.375%, 04/15/2054 | | | 15 | | | | 15,020 | |
5.50%, 04/15/2064 | | | 15 | | | | 15,105 | |
5.625%, 07/15/2054 | | | 24 | | | | 24,929 | |
5.75%, 07/15/2064 | | | 24 | | | | 25,112 | |
Unum Group
6.00%, 06/15/2054 | | | 24 | | | | 25,113 | |
| | | | | | | | |
| | | | | | | 1,306,116 | |
| | | | | | | | |
REITs – 0.6% | | | | | | | | |
American Homes 4 Rent LP
5.50%, 07/15/2034 | | | 25 | | | | 25,401 | |
American Tower Corp.
5.00%, 01/31/2030 | | | 25 | | | | 25,186 | |
Boston Properties LP
3.65%, 02/01/2026 | | | 124 | | | | 122,149 | |
5.75%, 01/15/2035 | | | 25 | | | | 25,095 | |
Safehold GL Holdings LLC
5.65%, 01/15/2035 | | | 25 | | | | 25,062 | |
WEA Finance LLC
2.875%, 01/15/2027(a) | | | 133 | | | | 126,645 | |
| | | | | | | | |
| | | | | | | 349,538 | |
| | | | | | | | |
| | | | | | | 9,462,740 | |
| | | | | | | | |
| | |
| |
| abfunds.com | | AB CORE PLUS BOND ETF | 13 |
PORTFOLIO OF INVESTMENTS (continued)
| | | | | | | | |
| | | Principal
Amount
(000) | | | U.S. $ Value | |
| |
Utility – 2.3% | | | | | | | | |
Electric – 2.2% | | | | | | | | |
AEP Texas, Inc.
5.70%, 05/15/2034 | | $ | 24 | | | $ | 24,744 | |
Berkshire Hathaway Energy Co.
3.80%, 07/15/2048 | | | 157 | | | | 123,140 | |
CenterPoint Energy, Inc.
5.40%, 06/01/2029 | | | 118 | | | | 120,605 | |
Consolidated Edison Co. of New York, Inc.
5.50%, 03/15/2055 | | | 25 | | | | 25,567 | |
Constellation Energy Generation LLC
6.50%, 10/01/2053 | | | 115 | | | | 128,870 | |
DTE Energy Co.
4.95%, 07/01/2027 | | | 25 | | | | 25,184 | |
Duke Energy Corp.
5.80%, 06/15/2054 | | | 24 | | | | 24,644 | |
Edison International
5.25%, 03/15/2032 | | | 25 | | | | 25,299 | |
Entergy Arkansas LLC
5.75%, 06/01/2054 | | | 24 | | | | 25,262 | |
Entergy Corp.
2.95%, 09/01/2026 | | | 130 | | | | 126,185 | |
Entergy Louisiana LLC
5.15%, 09/15/2034 | | | 26 | | | | 26,249 | |
5.70%, 03/15/2054 | | | 16 | | | | 16,705 | |
Entergy Mississippi LLC
5.85%, 06/01/2054 | | | 24 | | | | 25,498 | |
Entergy Texas, Inc.
5.55%, 09/15/2054 | | | 9 | | | | 9,163 | |
Evergy Missouri West, Inc.
5.65%, 06/01/2034(a) | | | 22 | | | | 22,833 | |
Florida Power & Light Co.
5.60%, 06/15/2054 | | | 24 | | | | 25,375 | |
MidAmerican Energy Co.
5.85%, 09/15/2054 | | | 53 | | | | 57,213 | |
New York State Electric & Gas Corp.
5.30%, 08/15/2034(a) | | | 25 | | | | 25,233 | |
NRG Energy, Inc.
2.45%, 12/02/2027(a) | | | 8 | | | | 7,435 | |
Oncor Electric Delivery Co. LLC
4.65%, 11/01/2029(a) | | | 25 | | | | 25,103 | |
Oncor Electric Delivery Co., LLC
5.55%, 06/15/2054(a) | | | 25 | | | | 25,816 | |
PacifiCorp
2.90%, 06/15/2052 | | | 158 | | | | 100,343 | |
Public Service Electric & Gas Co.
5.45%, 03/01/2054 | | | 2 | | | | 2,067 | |
| | |
| |
14 | AB CORE PLUS BOND ETF | | abfunds.com |
PORTFOLIO OF INVESTMENTS (continued)
| | | | | | | | |
| | | Principal
Amount
(000) | | | U.S. $ Value | |
| |
Public Service Electric and Gas Co.
4.85%, 08/01/2034 | | $ | 25 | | | $ | 25,022 | |
5.30%, 08/01/2054 | | | 25 | | | | 25,345 | |
Southern California Edison Co.
5.75%, 04/15/2054 | | | 40 | | | | 41,663 | |
Southern Co. (The)
5.113%, 08/01/2027(b) | | | 66 | | | | 66,943 | |
Virginia Electric and Power Co.
5.55%, 08/15/2054 | | | 26 | | | | 26,719 | |
Vistra Operations Co. LLC
5.05%, 12/30/2026(a) | | | 5 | | | | 5,013 | |
5.70%, 12/30/2034(a) | | | 25 | | | | 25,508 | |
| | | | | | | | |
| | | | | | | 1,234,746 | |
| | | | | | | | |
Natural Gas – 0.1% | | | | | | | | |
Southern California Gas Co.
5.05%, 09/01/2034 | | | 25 | | | | 25,328 | |
| | | | | | | | |
| | | | | | | 1,260,074 | |
| | | | | | | | |
Total Corporates - Investment Grade
(cost $22,135,663) | | | | | | | 22,540,737 | |
| | | | | |
| | | | | | | | |
MORTGAGE PASS-THROUGHS – 6.7% | | | | | | | | |
Agency Fixed Rate 30-Year – 6.5% | | | | | | | | |
Government National Mortgage Association
Series 2019
3.00%, 12/19/2054, TBA | | | 220 | | | | 195,044 | |
Series 2020
2.50%, 12/19/2054, TBA | | | 278 | | | | 237,690 | |
Series 2022
4.00%, 12/19/2054, TBA | | | 149 | | | | 140,153 | |
4.50%, 12/19/2054, TBA | | | 138 | | | | 133,170 | |
Series 2024
2.00%, 12/19/2054, TBA | | | 273 | | | | 224,457 | |
3.50%, 12/19/2054, TBA | | | 186 | | | | 170,030 | |
5.00%, 12/15/2054, TBA | | | 146 | | | | 143,947 | |
5.50%, 12/15/2054, TBA | | | 154 | | | | 154,205 | |
6.00%, 12/15/2054, TBA | | | 144 | | | | 145,507 | |
Uniform Mortgage-Backed Security
Series 2018
5.00%, 12/12/2054, TBA | | | 209 | | | | 205,065 | |
Series 2020
2.00%, 12/13/2053, TBA | | | 165 | | | | 132,284 | |
Series 2022
3.00%, 12/12/2054, TBA | | | 404 | | | | 352,017 | |
3.50%, 12/12/2054, TBA | | | 285 | | | | 258,259 | |
4.00%, 12/12/2054, TBA | | | 242 | | | | 226,421 | |
4.50%, 12/12/2054, TBA | | | 200 | | | | 192,094 | |
| | |
| |
| abfunds.com | | AB CORE PLUS BOND ETF | 15 |
PORTFOLIO OF INVESTMENTS (continued)
| | | | | | | | |
| | | Principal
Amount
(000) | | | U.S. $ Value | |
| |
Series 2024
5.50%, 12/15/2054, TBA | | $ | 249 | | | $ | 248,650 | |
6.00%, 12/15/2054, TBA | | | 240 | | | | 242,887 | |
6.50%, 12/15/2054, TBA | | | 198 | | | | 202,733 | |
| | | | | | | | |
| | | | | | | 3,604,613 | |
| | | | | | | | |
Agency Fixed Rate 15-Year – 0.2% | | | | | | | | |
Uniform Mortgage-Backed Security
Series 2024
3.00%, 12/17/2039, TBA | | | 125 | | | | 117,666 | |
| | | | | | | | |
| | |
Total Mortgage Pass-Throughs
(cost $3,684,138) | | | | | | | 3,722,279 | |
| | | | | |
| | | | | | | | |
CORPORATES - NON-INVESTMENT GRADE – 4.6% | | | | | | | | |
Industrial – 4.1% | | | | | | | | |
Basic – 0.5% | | | | | | | | |
Cleveland-Cliffs, Inc.
6.75%, 04/15/2030(a) | | | 119 | | | | 119,677 | |
7.00%, 03/15/2032(a) | | | 123 | | | | 123,802 | |
Mineral Resources Ltd.
9.25%, 10/01/2028(a) | | | 15 | | | | 15,726 | |
| | | | | | | | |
| | | | | | | 259,205 | |
| | | | | | | | |
Communications - Media – 0.8% | | | | | | | | |
AMC Networks, Inc.
10.25%, 01/15/2029(a) | | | 102 | | | | 108,566 | |
CCO Holdings LLC/CCO Holdings Capital Corp.
4.50%, 05/01/2032 | | | 21 | | | | 18,543 | |
4.50%, 06/01/2033(a) | | | 69 | | | | 59,843 | |
4.75%, 03/01/2030(a) | | | 134 | | | | 124,717 | |
Gray Television, Inc.
10.50%, 07/15/2029(a) | | | 10 | | | | 10,158 | |
TEGNA, Inc.
4.625%, 03/15/2028 | | | 127 | | | | 121,488 | |
| | | | | | | | |
| | | | | | | 443,315 | |
| | | | | | | | |
Consumer Non-Cyclical – 0.6% | | | | | | | | |
Albertsons Cos., Inc./Safeway, Inc./New Albertsons LP/Albertsons LLC
4.625%, 01/15/2027(a) | | | 122 | | | | 119,565 | |
Tempur Sealy International, Inc.
3.875%, 10/15/2031(a) | | | 139 | | | | 123,174 | |
4.00%, 04/15/2029(a) | | | 91 | | | | 84,677 | |
| | | | | | | | |
| | | | | | | 327,416 | |
| | | | | | | | |
Energy – 1.2% | | | | | | | | |
Civitas Resources, Inc.
8.375%, 07/01/2028(a) | | | 50 | | | | 52,179 | |
| | |
| |
16 | AB CORE PLUS BOND ETF | | abfunds.com |
PORTFOLIO OF INVESTMENTS (continued)
| | | | | | | | |
| | | Principal
Amount
(000) | | | U.S. $ Value | |
| |
Delek Logistics Partners LP/Delek Logistics Finance Corp.
8.625%, 03/15/2029(a) | | $ | 120 | | | $ | 125,075 | |
Hilcorp Energy I LP/Hilcorp Finance Co.
7.25%, 02/15/2035(a) | | | 125 | | | | 122,680 | |
PBF Holding Co., LLC/PBF Finance Corp.
6.00%, 02/15/2028 | | | 119 | | | | 117,716 | |
Venture Global LNG, Inc.
9.50%, 02/01/2029(a) | | | 110 | | | | 122,896 | |
9.875%, 02/01/2032(a) | | | 111 | | | | 123,375 | |
| | | | | | | | |
| | | | | | | 663,921 | |
| | | | | | | | |
Other Industrial – 0.2% | | | | | | | | |
AECOM
5.125%, 03/15/2027 | | | 125 | | | | 124,400 | |
| | | | | | | | |
| | |
Services – 0.5% | | | | | | | | |
Prime Security Services Borrower LLC/Prime Finance, Inc.
3.375%, 08/31/2027(a) | | | 135 | | | | 126,939 | |
5.75%, 04/15/2026(a) | | | 125 | | | | 125,033 | |
| | | | | | | | |
| | | | | | | 251,972 | |
| | | | | | | | |
Transportation - Services – 0.3% | | | | | | | | |
Hertz Corp. (The)
12.625%, 07/15/2029(a) | | | 111 | | | | 120,288 | |
Rand Parent LLC
8.50%, 02/15/2030(a) | | | 73 | | | | 73,798 | |
| | | | | | | | |
| | | | | | | 194,086 | |
| | | | | | | | |
| | | | | | | 2,264,315 | |
| | | | | | | | |
Financial Institutions – 0.4% | | | | | | | | |
Banking – 0.2% | | | | | | | | |
Synchrony Financial
7.25%, 02/02/2033 | | | 118 | | | | 124,413 | |
| | | | | | | | |
| | |
Finance – 0.2% | | | | | | | | |
Blackstone Private Credit Fund
5.95%, 07/16/2029 | | | 22 | | | | 22,359 | |
OneMain Finance Corp.
6.625%, 05/15/2029 | | | 25 | | | | 25,506 | |
7.125%, 11/15/2031 | | | 25 | | | | 25,749 | |
| | | | | | | | |
| | | | | | | 73,614 | |
| | | | | | | | |
| | | | | | | 198,027 | |
| | | | | | | | |
| | |
| |
| abfunds.com | | AB CORE PLUS BOND ETF | 17 |
PORTFOLIO OF INVESTMENTS (continued)
| | | | | | | | |
| | | Principal
Amount
(000) | | | U.S. $ Value | |
| |
Utility – 0.1% | | | | | | | | |
Electric – 0.1% | | | | | | | | |
Vistra Operations Co., LLC
5.625%, 02/15/2027(a) | | $ | 68 | | | $ | 67,969 | |
| | | | | | | | |
| | |
Total Corporates - Non-Investment Grade
(cost $2,465,614) | | | | | | | 2,530,311 | |
| | | | | |
| | |
| | | Shares | | | | |
SHORT-TERM INVESTMENTS – 7.6% | | | | | | | | |
Investment Companies – 7.6% | | | | | | | | |
AB Fixed Income Shares, Inc. - Government Money Market Portfolio - Class AB,
4.54%(c)(d)(e)
(cost $4,233,824) | | | 4,233,824 | | | | 4,233,824 | |
| | |
Total Investments – 105.8%
(cost $57,816,580) | | | | | | | 58,603,322 | |
Other assets less liabilities – (5.8)% | | | | | | | (3,220,334 | ) |
| | | | | | | | |
| | |
Net Assets – 100.0% | | | | | | $ | 55,382,988 | |
| | | | | | | | |
FUTURES (see Note D)
| | | | | | | | | | | | | | | | |
| Description | | Number of
Contracts | | | Expiration
Month | | | Current
Notional | | | Value and
Unrealized
Appreciation
(Depreciation) | |
Purchased Contracts | |
U.S. Long Bond (CBT) Futures | | | 39 | | | | March 2025 | | | $ | 4,660,500 | | | $ | 40,828 | |
U.S. T-Note 5 Yr (CBT) Futures | | | 16 | | | | March 2025 | | | | 1,721,625 | | | | 10,664 | |
U.S. T-Note 10 Yr (CBT) Futures | | | 17 | | | | March 2025 | | | | 1,890,188 | | | | 20,023 | |
| | | | |
Sold Contracts | | | | | | | | | | | | | | | | |
U.S. 10 Yr Ultra Futures | | | 1 | | | | March 2025 | | | | 114,797 | | | | (875 | ) |
U.S. T-Note 2 Yr (CBT) Futures | | | 17 | | | | March 2025 | | | | 3,503,859 | | | | (10,195 | ) |
U.S. Ultra Bond (CBT) Futures | | | 28 | | | | March 2025 | | | | 3,561,250 | | | | (38,703 | ) |
| | | | | | | | | | | | | | | | |
| | | $ | 21,742 | |
| | | | | |
| (a) | Security is exempt from registration under Rule 144A or Regulation S of the Securities Act of 1933. These securities are considered restricted, but liquid and may be resold in transactions exempt from registration. At November 30, 2024, the aggregate market value of these securities amounted to $4,856,119 or 8.8% of net assets. |
| (b) | Coupon rate adjusts periodically based upon a predetermined schedule. Stated interest rate in effect at November 30, 2024. |
| (c) | Affiliated investments. |
| (d) | To obtain a copy of the fund’s shareholder report, please go to the Securities and Exchange Commission’s website at www.sec.gov, or call AB at (800) 227-4618. |
| (e) | The rate shown represents the 7-day yield as of period end. |
| | |
| |
18 | AB CORE PLUS BOND ETF | | abfunds.com |
PORTFOLIO OF INVESTMENTS (continued)
Glossary:
CBT – Chicago Board of Trade
REIT – Real Estate Investment Trust
TBA – To Be Announced
See notes to financial statements.
| | |
| |
| abfunds.com | | AB CORE PLUS BOND ETF | 19 |
STATEMENT OF ASSETS & LIABILITIES
November 30, 2024
| | | | |
| Assets | | | | |
Investments in securities, at value | | | | |
Unaffiliated issuers (cost $53,582,756) | | $ | 54,369,498 | |
Affiliated issuers (cost $4,233,824) | | | 4,233,824 | |
Cash | | | 5,626 | |
Cash collateral due from broker | | | 98,880 | |
Unaffiliated interest and dividends receivable | | | 458,245 | |
Affiliated dividends receivable | | | 15,241 | |
Receivable for variation margin on futures | | | 4,750 | |
Receivable due from Adviser | | | 698 | |
| | | | |
Total assets | | | 59,186,762 | |
| | | | |
| Liabilities | |
Payable for investment securities purchased | | | 3,789,043 | |
Advisory fee payable | | | 14,731 | |
| | | | |
Total liabilities | | | 3,803,774 | |
| | | | |
Net Assets | | $ | 55,382,988 | |
| | | | |
| Composition of Net Assets | | | | |
Capital stock, at par | | $ | 155 | |
Additional paid-in capital | | | 54,596,121 | |
Distributable earnings | | | 786,712 | |
| | | | |
Net Assets | | $ | 55,382,988 | |
| | | | |
Net Asset Value Per Share—500 million shares of capital stock authorized, $.0001 par value (based on 1,550,028 common shares outstanding) | | $ | 35.73 | |
| | | | |
See notes to financial statements.
| | |
| |
20 | AB CORE PLUS BOND ETF | | abfunds.com |
STATEMENT OF OPERATIONS
For the Period from December 13, 2023(a) to November 30, 2024
| | | | | | | | |
| Investment Income | | | | | | | | |
Interest | | $ | 2,022,342 | | | | | |
Dividends—Affiliated issuers | | | 169,085 | | | $ | 2,191,427 | |
| | | | | | | | |
| Expenses | | | | | | | | |
Advisory fee (see Note B) | | | 146,367 | | | | | |
| | | | | | | | |
Total expenses | | | 146,367 | | | | | |
Less: expenses waived and reimbursed by the Adviser (see Note B) | | | (5,625 | ) | | | | |
| | | | | | | | |
Net expenses | | | | | | | 140,742 | |
| | | | | | | | |
Net investment income | | | | | | | 2,050,685 | |
| | | | | | | | |
| Realized and Unrealized Gain (Loss) on Investment Transactions | | | | | | | | |
Net realized gain (loss) on: | | | | | | | | |
Investment transactions | | | | | | | (88,496 | ) |
In-kind redemptions | | | | | | | 98,554 | |
Futures | | | | | | | 6,718 | |
Net change in unrealized appreciation (depreciation) of: | | | | | | | | |
Investments | | | | | | | 786,742 | |
Futures | | | | | | | 21,742 | |
| | | | | | | | |
Net gain on investment transactions | | | | | | | 825,260 | |
| | | | | | | | |
Net Increase in Net Assets from Operations | | | | | | $ | 2,875,945 | |
| | | | | | | | |
| (a) | Commencement of operations. |
See notes to financial statements.
| | |
| |
| abfunds.com | | AB CORE PLUS BOND ETF | 21 |
STATEMENT OF CHANGES IN NET ASSETS
| | | | |
| | | December 13,
2023(a) to
November 30,
2024 | |
| Increase in Net Assets from Operations | | | | |
Net investment income | | $ | 2,050,685 | |
Net realized gain on investment transactions | | | 16,776 | |
Net change in unrealized appreciation (depreciation) of investments | | | 808,484 | |
| | | | |
Net increase in net assets from operations | | | 2,875,945 | |
Distribution to Shareholders | | | (1,814,999 | ) |
| Transactions in Shares of the Fund | | | | |
Net increase | | | 54,310,250 | |
Other capital | | | 11,792 | |
| | | | |
Total increase | | | 55,382,988 | |
| Net Assets | | | | |
Beginning of period | | | – 0 | – |
| | | | |
End of period | | $ | 55,382,988 | |
| | | | |
| (a) | Commencement of operations. |
See notes to financial statements.
| | |
| |
22 | AB CORE PLUS BOND ETF | | abfunds.com |
NOTES TO FINANCIAL STATEMENTS
November 30, 2024
NOTE A
Significant Accounting Policies
AB Active ETFs, Inc. (the “Corporation”) is registered under the Investment Company Act of 1940 (the “1940 Act”) as an open-end management investment company. The Corporation, which is a Maryland corporation, operates as a series company comprised of 15 funds currently in operation. Each fund is considered to be a separate entity for financial reporting and tax purposes. This report relates only to the AB Core Plus Bond ETF (the “Fund”), a diversified portfolio. The Fund commenced investment operations on December 13, 2023. The financial statements have been prepared in conformity with U.S. generally accepted accounting principles (“U.S. GAAP”), which require management to make certain estimates and assumptions that affect the reported amounts of assets and liabilities in the financial statements and amounts of income and expenses during the reporting period. Actual results could differ from those estimates. The Fund is an investment company under U.S. GAAP and follows the accounting and reporting guidance applicable to investment companies. The following is a summary of significant accounting policies followed by the Fund.
1. Security Valuation
Portfolio securities are valued at market value determined on the basis of market quotations or, if market quotations are not readily available or are unreliable, at “fair value” as determined in accordance with procedures approved by and under the oversight of the Fund’s Board of Directors (the “Board”). Pursuant to these procedures, AllianceBernstein L.P. (the “Adviser”) serves as the Fund’s valuation designee pursuant to Rule 2a-5 of the 1940 Act. In this capacity, the Adviser is responsible, among other things, for making all fair value determinations relating to the Fund’s portfolio investments, subject to the Board’s oversight.
In general, the market values of securities which are readily available and deemed reliable are determined as follows: securities listed on a national securities exchange (other than securities listed on the NASDAQ Stock Market, Inc. (“NASDAQ”)) or on a foreign securities exchange are valued at the last sale price at the close of the exchange or foreign securities exchange. If there has been no sale on such day, the securities are valued at the last traded price from the previous day. Securities listed on more than one exchange are valued by reference to the principal exchange on which the securities are traded; securities listed only on NASDAQ are valued in accordance with the NASDAQ Official Closing Price; listed or over the counter (“OTC”) market put or call options are valued at the mid level between the current bid and ask prices. If either a current bid or current ask price is unavailable, the Adviser will have discretion to determine the best valuation (e.g., last trade price in the case of listed options); open
| | |
| |
| abfunds.com | | AB CORE PLUS BOND ETF | 23 |
NOTES TO FINANCIAL STATEMENTS (continued)
futures are valued using the closing settlement price or, in the absence of such a price, the most recent quoted bid price. If there are no quotations available for the day of valuation, the last available closing settlement price is used; U.S. Government securities and any other debt instruments having 60 days or less remaining until maturity are generally valued at fair value by an independent pricing service. If an independent fair value is not available, the securities are valued at amortized cost. This methodology is commonly used for short term securities that have an original maturity of 60 days or less, as well as short term securities that had an original term to maturity that exceeded 60 days. In instances when amortized cost is utilized, the Valuation Committee (the “Committee”) must reasonably conclude that the utilization of amortized cost is approximately the same as the fair value of the security. Factors the Committee will consider include, but are not limited to, an impairment of the creditworthiness of the issuer or material changes in interest rates. Fixed-income securities, including mortgage-backed and asset-backed securities, may be valued on the basis of prices provided by a pricing service or at a price obtained from one or more of the major broker-dealers. In cases where broker-dealer quotes are obtained, the Adviser may establish procedures whereby changes in market yields or spreads are used to adjust, on a daily basis, a recently obtained quoted price on a security. Swaps and other derivatives are valued daily, primarily using independent pricing services, independent pricing models using market inputs, as well as third party broker-dealers or counterparties. Open-end mutual funds are valued at the closing net asset value “NAV” per share, while exchange-traded funds are valued at the closing market price per share.
Securities for which market quotations are not readily available (including restricted securities) or are deemed unreliable are valued at fair value as deemed appropriate by the Adviser. Factors considered in making this determination may include, but are not limited to, information obtained by contacting the issuer, analysts, analysis of the issuer’s financial statements or other available documents. In addition, the Fund may use fair value pricing for securities primarily traded in non-U.S. markets because most foreign markets close well before the Fund values its securities at 4:00 p.m., Eastern Time. The earlier close of these foreign markets gives rise to the possibility that significant events may have occurred in the interim and may materially affect the value of those securities. To account for this, the Fund generally values many of its foreign equity securities using fair value prices at the discretion of the Adviser.
2. Fair Value Measurements
In accordance with U.S. GAAP regarding fair value measurements, fair value is defined as the price that the Fund would receive to sell an asset or
| | |
| |
24 | AB CORE PLUS BOND ETF | | abfunds.com |
NOTES TO FINANCIAL STATEMENTS (continued)
pay to transfer a liability in an orderly transaction between market participants at the measurement date. U.S. GAAP establishes a framework for measuring fair value, and a three-level hierarchy for fair value measurements based upon the transparency of inputs to the valuation of an asset or liability (including those valued based on their market values as described in Note A.1 above). Inputs may be observable or unobservable and refer broadly to the assumptions that market participants would use in pricing the asset or liability. Observable inputs reflect the assumptions market participants would use in pricing the asset or liability based on market data obtained from sources independent of the Fund. Unobservable inputs reflect the Fund’s own assumptions about the assumptions that market participants would use in pricing the asset or liability based on the best information available in the circumstances. Each investment is assigned a level based upon the observability of the inputs which are significant to the overall valuation. The three-tier hierarchy of inputs is summarized below.
| | • | | Level 1—quoted prices in active markets for identical investments |
| | • | | Level 2—other significant observable inputs (including quoted prices for similar investments, interest rates, prepayment speeds, credit risk, etc.) |
| | • | | Level 3—significant unobservable inputs (including the Fund’s own assumptions in determining the fair value of investments) |
The fair value of debt instruments, such as bonds, and over-the-counter derivatives is generally based on market price quotations, recently executed market transactions (where observable) or industry recognized modeling techniques and are generally classified as Level 2. Pricing vendor inputs to Level 2 valuations may include quoted prices for similar investments in active markets, interest rate curves, coupon rates, currency rates, yield curves, option adjusted spreads, default rates, credit spreads and other unique security features in order to estimate the relevant cash flows which are then discounted to calculate fair values. If these inputs are unobservable and significant to the fair value, these investments will be classified as Level 3.
Valuations of mortgage-backed or other asset-backed securities, by pricing vendors, are based on both proprietary and industry recognized models and discounted cash flow techniques. Significant inputs to the valuation of these instruments are value of the collateral, the rates and timing of delinquencies, the rates and timing of prepayments, and default and loss expectations, which are driven in part by housing prices for residential mortgages. Significant inputs are determined based on relative value analyses, which incorporate comparisons to instruments with similar collateral and risk profiles, including relevant indices. Mortgage and asset-backed securities for which management has collected current observable
| | |
| |
| abfunds.com | | AB CORE PLUS BOND ETF | 25 |
NOTES TO FINANCIAL STATEMENTS (continued)
data through pricing services are generally categorized within Level 2. Those investments for which current observable data has not been provided are classified as Level 3.
Other fixed income investments, including non-U.S. government and corporate debt, are generally valued using quoted market prices, if available, which are typically impacted by current interest rates, maturity dates and any perceived credit risk of the issuer. Additionally, in the absence of quoted market prices, these inputs are used by pricing vendors to derive a valuation based upon industry or proprietary models which incorporate issuer specific data with relevant yield/spread comparisons with more widely quoted bonds with similar key characteristics. Those investments for which there are observable inputs are classified as Level 2. Where the inputs are not observable, the investments are classified as Level 3.
The following table summarizes the valuation of the Fund’s investments by the above fair value hierarchy levels as of November 30, 2024:
| | | | | | | | | | | | | | | | |
Investments in
Securities: | | Level 1 | | | Level 2 | | | Level 3 | | | Total | |
Assets: | |
Governments – Treasuries | | $ | – 0 | – | | $ | 25,576,171 | | | $ | – 0 | – | | $ | 25,576,171 | |
Corporates – Investment Grade | | | – 0 | – | | | 22,540,737 | | | | – 0 | – | | | 22,540,737 | |
Mortgage Pass-Throughs | | | – 0 | – | | | 3,722,279 | | | | – 0 | – | | | 3,722,279 | |
Corporates – Non-Investment Grade | | | – 0 | – | | | 2,530,311 | | | | – 0 | – | | | 2,530,311 | |
Short-Term Investments | | | 4,233,824 | | | | – 0 | – | | | – 0 | – | | | 4,233,824 | |
| | | | | | | | | | | | | | | | |
Total Investments in Securities | | | 4,233,824 | | | | 54,369,498 | | | | – 0 | – | | | 58,603,322 | |
Other Financial Instruments(a): | | | | | | | | | | | | | | | | |
Assets: | | | | | | | | | | | | | | | | |
Futures | | | 71,515 | | | | – 0 | – | | | – 0 | – | | | 71,515 | (b) |
Liabilities: | | | | | | | | | | | | | | | | |
Futures | | | (49,773 | ) | | | – 0 | – | | | – 0 | – | | | (49,773 | )(b) |
| | | | | | | | | | | | | | | | |
Total | | $ | 4,255,566 | | | $ | 54,369,498 | | | $ | – 0 | – | | $ | 58,625,064 | |
| | | | | | | | | | | | | | | | |
| (a) | Other financial instruments include derivative instruments, such as futures, forwards and swaps. Derivative instruments are valued at the unrealized appreciation (depreciation) on the instrument. Other financial instruments may also include swaps with upfront premiums, written options and written swaptions which are valued at market value. |
| (b) | Only variation margin receivable (payable) at period end is reported within the statement of assets and liabilities. This amount reflects cumulative unrealized appreciation (depreciation) on futures and centrally cleared swaps as reported in the portfolio of investments. Where applicable, centrally cleared swaps with upfront premiums are presented here at market value. |
3. Currency Translation
Assets and liabilities denominated in foreign currencies and commitments under forward currency exchange contracts are translated into U.S. dollars at the mean of the quoted bid and ask prices of such currencies against the U.S. dollar. Purchases and sales of portfolio securities are translated
| | |
| |
26 | AB CORE PLUS BOND ETF | | abfunds.com |
NOTES TO FINANCIAL STATEMENTS (continued)
into U.S. dollars at the rates of exchange prevailing when such securities were acquired or sold. Income and expenses are translated into U.S. dollars at rates of exchange prevailing when accrued.
Net realized gain or loss on foreign currency transactions represents foreign exchange gains and losses from sales and maturities of foreign fixed income investments, holding of foreign currencies, currency gains or losses realized between the trade and settlement dates on foreign investment transactions, and the difference between the amounts of dividends, interest and foreign withholding taxes recorded on the Fund’s books and the U.S. dollar equivalent amounts actually received or paid. Net unrealized currency gains and losses from valuing foreign currency denominated assets and liabilities at period end exchange rates are reflected as a component of net unrealized appreciation or depreciation of foreign currency denominated assets and liabilities.
4. Taxes
It is the Fund’s policy to meet the requirements of the Internal Revenue Code applicable to regulated investment companies and to distribute all of its investment company taxable income and net realized gains, if any, to shareholders. Therefore, no provisions for federal income or excise taxes are required. The Fund may be subject to taxes imposed by countries in which it invests. Such taxes are generally based on income and/or capital gains earned or repatriated. Taxes are accrued and applied to net investment income, net realized gains and net unrealized appreciation/depreciation as such income and/or gains are earned.
In accordance with U.S. GAAP requirements regarding accounting for uncertainties in income taxes, management has analyzed the Fund’s tax positions taken or expected to be taken on federal and state income tax returns for all open tax years (the current tax year) and has concluded that no provision for income tax is required in the Fund’s financial statements.
5. Investment Income and Investment Transactions
Dividend income is recorded on the ex-dividend date or as soon as the Fund is informed of the dividend. Interest income is accrued daily. Investment transactions are accounted for on the date the securities are purchased or sold. Investment gains or losses are determined on the identified cost basis. Non-cash dividends, if any, are recorded on the ex-dividend date at the fair value of the securities received. The Fund amortizes premiums and accretes discounts as adjustments to interest income.
The Fund accounts for distributions received from real estate investment trust (“REIT”) investments or from regulated investment companies as dividend income, realized gain, or return of capital based on information provided by the REIT or the investment company.
| | |
| |
| abfunds.com | | AB CORE PLUS BOND ETF | 27 |
NOTES TO FINANCIAL STATEMENTS (continued)
6. Dividends and Distributions
Dividends and distributions to shareholders, if any, are recorded on the ex-dividend date. Income dividends and capital gains distributions are determined in accordance with federal tax regulations and may differ from those determined in accordance with U.S. GAAP. To the extent these differences are permanent, such amounts are reclassified within the capital accounts based on their federal tax basis treatment; temporary differences do not require such reclassification.
7. Offering Expenses
The Adviser has agreed to pay all of the Fund’s organization and offering costs. The Fund is not obligated to repay any such organizational expenses or offering costs paid by the Adviser.
8. Cash and Short-Term Investments
Cash and short-term investments include cash on hand and short-term investments with maturities of less than one year when purchased.
NOTE B
Advisory Fee and Other Transactions with Affiliates
Under the terms of the investment advisory agreement, the Fund pays the Adviser a unitary advisory fee at an annual rate of .33% of the Fund’s average daily net assets. The fees are accrued daily and paid monthly.
Under the investment advisory agreement, in accordance with the unitary fee structure, the Adviser bears the cost of various third-party services required by the Fund, including audit, custodial, accounting, legal, transfer agency and printing costs and the fees and expenses of the Corporation’s directors and their counsel. Also under the investment advisory agreement, the Adviser will reimburse the Fund for the Fund’s share of the acquired funds fees and expenses (advisory fees and other expenses) of any pooled investment vehicle for which the Adviser serves as investment adviser. For the period ended November 30, 2024, such waiver/reimbursements relating to the Fund’s investment in AB Government Money Market Portfolio amounted to $5,625.
A summary of the Fund’s transactions in AB mutual funds for the period ended November 30, 2024 is as follows:
| | | | | | | | | | | | | | | | | | | | |
Fund | | Market Value
11/30/23
(000) | | | Purchases
at Cost
(000) | | | Sales
Proceeds
(000) | | | Market Value
11/30/24
(000) | | | Dividend
Income
(000) | |
AB Government Money Market Portfolio | | $ | – 0 – | | | $ | 21,326 | | | $ | 17,092 | | | $ | 4,234 | | | $ | 169 | |
| | |
| |
28 | AB CORE PLUS BOND ETF | | abfunds.com |
NOTES TO FINANCIAL STATEMENTS (continued)
NOTE C
Distribution Plan
The Fund has adopted a Distribution and Service Plan pursuant to Rule 12b-1 of the Act which permits the Fund to pay distribution and servicing fees not to exceed .25% per year of the Fund’s average daily net assets. No such fees are currently paid, and the Board has not approved the commencement of payments under the Rule 12b-1 Distribution Plan.
NOTE D
Investment Transactions
Purchases and sales of investment securities (excluding short-term investments and in-kind purchases and sales) for the period ended November 30, 2024 were as follows:
| | | | | | | | |
| | | Purchases | | | Sales | |
Investment securities (excluding U.S. government securities) | | $ | 55,754,385 | | | $ | 35,178,802 | |
U.S. government securities | | | 89,913,582 | | | | 70,194,049 | |
During the period ended November 30, 2024, the Fund delivered portfolio securities for the redemption of Fund shares (in-kind redemptions). Cash and portfolio securities were transferred for redemptions at fair value. For financial reporting purposes, the Fund recorded net realized gains and losses in connection with each in-kind redemption transaction. For the period ended November 30, 2024, the Fund had in-kind purchases and in-kind sales as follows:
| | | | | | | | |
| | | Purchases | | | Sales | |
In-kind transactions (excluding U.S. government securities) | | $ | 8,374,610 | | | $ | 4,711,979 | |
U.S. government securities | | | 11,673,284 | | | | 2,500,423 | |
The cost of investments for federal income tax purposes, gross unrealized appreciation and unrealized depreciation are as follows:
| | | | |
Cost | | $ | 57,819,065 | |
| | | | |
Gross unrealized appreciation | | $ | 863,705 | |
Gross unrealized depreciation | | | (79,448 | ) |
| | | | |
Net unrealized appreciation | | $ | 784,257 | |
| | | | |
1. Derivative Financial Instruments
The Fund may use derivatives in an effort to earn income and enhance returns, to replace more traditional direct investments, to obtain exposure to otherwise inaccessible markets (collectively, “investment purposes”), or to hedge or adjust the risk profile of its portfolio.
| | |
| |
| abfunds.com | | AB CORE PLUS BOND ETF | 29 |
NOTES TO FINANCIAL STATEMENTS (continued)
The principal type of derivative utilized by the Fund, as well as the methods in which they may be used are:
The Fund may buy or sell futures for investment purposes or for the purpose of hedging its portfolio against adverse effects of potential movements in the market. The Fund bears the market risk that arises from changes in the value of these instruments and the imperfect correlation between movements in the price of the futures and movements in the price of the assets, reference rates or indices which they are designed to track. Among other things, the Fund may purchase or sell futures for foreign currencies or options thereon for non-hedging purposes as a means of making direct investment in foreign currencies, as described below under “Currency Transactions”.
At the time the Fund enters into futures, the Fund deposits with the broker or segregates at its custodian cash or securities as collateral to satisfy initial margin requirements set by the exchange on which the transaction is effected. Pursuant to the contract, with respect to cash collateral, the Fund agrees to receive from or pay to the broker an amount of cash equal to the daily fluctuation in the value of the contract; in the case of securities collateral, the Fund agrees to adjust the securities position held in the segregated account accordingly. Such receipts, payments or adjustments are known as variation margin and are recorded by the Fund as unrealized gains or losses. Risks may arise from the potential inability of a counterparty to meet the terms of the contract. The credit/counterparty risk for exchange-traded futures is generally less than privately negotiated futures, since the clearinghouse, which is the issuer or counterparty to each exchange-traded future, has robust risk mitigation standards, including the requirement to provide initial and variation margin. When the contract is closed, the Fund records a realized gain or loss equal to the difference between the value of the contract at the time it was opened and the time it was closed.
Use of long futures subjects the Fund to risk of loss in excess of the amounts shown on the statement of assets and liabilities, up to the notional value of the futures. Use of short futures subjects the Fund to unlimited risk of loss. Under some circumstances, futures exchanges may establish daily limits on the amount that the price of futures can vary from the previous day’s settlement price, which could effectively prevent liquidation of unfavorable positions.
During the period ended November 30, 2024, the Fund held futures for hedging purposes.
| | |
| |
30 | AB CORE PLUS BOND ETF | | abfunds.com |
NOTES TO FINANCIAL STATEMENTS (continued)
During the period ended November 30, 2024, the Fund had entered into the following derivatives:
| | | | | | | | | | | | | | |
| | | Asset Derivatives | | | Liability Derivatives | |
Derivative Type | | Statement of
Assets and
Liabilities
Location | | Fair Value | | | Statement of
Assets and
Liabilities
Location | | | Fair Value | |
Interest rate contracts | | Receivable for
variation margin on
futures | | $ | 71,515 | * | |
| Payable for
variation margin on
futures |
| | $ | 49,773 | * |
| | | | | | | | | | | | | | |
Total | | | | $ | 71,515 | | | | | | | $ | 49,773 | |
| | | | | | | | | | | | | | |
| * | Only variation margin receivable/payable at period end is reported within the statement of assets and liabilities. This amount reflects cumulative unrealized appreciation (depreciation) on futures and centrally cleared swaps as reported in the portfolio of investments. |
| | | | | | | | | | |
Derivative Type | | Location of
Gain or (Loss)
on Derivatives
Within Statement of
Operations | | Realized Gain
or (Loss) on
Derivatives | | | Change in
Unrealized
Appreciation or
(Depreciation) | |
Interest rate contracts | | Net realized gain (loss) on futures; Net change in unrealized appreciation (depreciation) of futures | | $ | 6,718 | | | $ | 21,742 | |
| | | | | | | | | | |
Total | | | | $ | 6,718 | | | $ | 21,742 | |
| | | | | | | | | | |
The following table represents the average monthly volume of the Fund’s derivative transactions during the period ended November 30, 2024:
| | | | |
Futures: | | | | |
Average notional amount of buy contracts | | $ | 5,497,389 | |
Average notional amount of sale contracts | | $ | 5,711,014 | |
2. Currency Transactions
The Fund may invest in non-U.S. Dollar-denominated securities on a currency hedged or unhedged basis. The Fund may seek investment opportunities by taking long or short positions in currencies through the use of currency-related derivatives, including forward currency exchange contracts, futures and options on futures, swaps, and other options. The Fund may enter into transactions for investment opportunities when it anticipates that a foreign currency will appreciate or depreciate in value but securities denominated in that currency are not held by the Fund and do not present attractive investment opportunities. Such transactions may also be used when the Adviser believes that it may be more efficient than a direct investment in a foreign currency-denominated security. The Fund may also conduct currency exchange contracts on a spot basis (i.e., for cash at the spot rate prevailing in the currency exchange market for buying or selling currencies).
| | |
| |
| abfunds.com | | AB CORE PLUS BOND ETF | 31 |
NOTES TO FINANCIAL STATEMENTS (continued)
NOTE E
Shares of the Fund
The Fund’s shares may only be bought and sold in a secondary market through a broker-dealer at a market price. Because ETF shares trade at market prices rather than NAV, shares may trade at a price greater than NAV (a premium) or less than NAV (a discount). The Fund issues and redeems shares at its NAV only in aggregations of a specified number of shares (a creation unit) generally in exchange for a designated portfolio of securities and/or cash (including any portion of such securities for which cash may be substituted). A fixed transaction fee is imposed on authorized participants in connection with creation unit redemption and creation transactions. Authorized participants may be required to pay an additional variable charge to cover certain costs and expenses related to the execution of trades resulting from creation unit transactions. Such variable charges, if any, are included in other capital within the Statement of Changes in Net Assets.
Transactions in shares of the Fund were as follows:
| | | | | | | | | | | | | | | | |
| | | | | | | | | | | | | | | | |
| | | Shares | | | | | | Amount | | | | |
| | | December 13,
2023(a) to
November 30,
2024 | | | | | | December 13,
2023(a) to
November 30,
2024 | | | | |
| | | | | | | | |
Shares sold | | | 1,800,028 | | | | | | | $ | 63,219,245 | | | | | |
| | | | | |
Shares redeemed | | | (250,000 | ) | | | | | | | (8,908,995 | ) | | | | |
| | | | | |
Net increase | | | 1,550,028 | | | | | | | $ | 54,310,250 | | | | | |
| | | | | |
| (a) | Commencement of operations. |
NOTE F
Risks Involved in Investing in the Fund
Market Risk—The value of the Fund’s assets will fluctuate as the bond market fluctuates. The value of its investments may decline, sometimes rapidly and unpredictably, simply because of economic changes or other events, including public health crises (including the occurrence of a contagious disease or illness), interest rate levels, and regional and global conflicts, that affect large portions of the market.
Credit Risk—An issuer or guarantor of a fixed-income security, or the counterparty to a derivatives or other contract, may be unable or unwilling to make timely payments of interest or principal, or to otherwise honor its obligations. The issuer or guarantor may default, causing a loss of the full principal amount of a security and accrued interest. The degree of risk for a particular security may be reflected in its credit rating. There is the
| | |
| |
32 | AB CORE PLUS BOND ETF | | abfunds.com |
NOTES TO FINANCIAL STATEMENTS (continued)
possibility that the credit rating of a fixed-income security may be downgraded after purchase, which may adversely affect the value of the security.
Interest-Rate Risk—Changes in interest rates will affect the value of investments in fixed-income securities. When interest rates rise, the value of existing investments in fixed-income securities tends to fall and this decrease in value may not be offset by higher income from new investments. Interest rate risk is generally greater for fixed-income securities with longer maturities or durations. The Fund may be subject to a greater risk of rising interest rates than would normally be the case due to the recent end of a period of historically low rates and the effect of potential central bank monetary policy, and government fiscal policy, initiatives and market reactions to those initiatives.
Below Investment Grade Securities Risk—Investments in fixed-income securities with lower ratings (commonly known as “junk bonds”) are subject to a higher probability that an issuer will default or fail to meet its payment obligations. These securities may be subject to greater price volatility due to such factors as specific municipal or corporate developments and negative performance of the junk bond market generally and may be more difficult to trade than other types of securities.
Tax Risk—From time to time, the U.S. Government and the U.S. Congress consider changes in federal tax law that could limit or eliminate the federal tax exemption for municipal bond income, which would in effect reduce the income received by shareholders from the Fund by increasing taxes on that income. In such event, the Fund’s net asset value (“NAV”) could also decline as yields on municipal bonds, which are typically lower than those on taxable bonds, would be expected to increase to approximately the yield of comparable taxable bonds. Actions or anticipated actions affecting the tax-exempt status of municipal bonds could also result in significant shareholder redemptions of Fund shares as investors anticipate adverse effects on the Fund or seek higher yields to offset the potential loss of the tax deduction. As a result, the Fund would be required to maintain higher levels of cash to meet the redemptions, which would negatively affect the Fund’s yield.
Duration Risk—Duration is a measure that relates the expected price volatility of a fixed-income security to changes in interest rates. The duration of a fixed-income security may be shorter than or equal to full maturity of a fixed-income security. Fixed-income securities with longer durations have more risk and will decrease in price as interest rates rise. For example, a fixed-income security with a duration of three years will likely decrease in value by approximately 3% if interest rates increase by 1%.
| | |
| |
| abfunds.com | | AB CORE PLUS BOND ETF | 33 |
NOTES TO FINANCIAL STATEMENTS (continued)
Inflation Risk—This is the risk that the value of assets or income from investments will be less in the future as inflation decreases the value of money. As inflation increases, the value of the Fund’s assets can decline as can the value of the Fund’s distributions. This risk is significantly greater for fixed-income securities with longer maturities.
Mortgage-Related and Other Asset-Backed Securities Risk—Investments in mortgage-related and other asset-backed securities are subject to certain additional risks. The value of these securities may be particularly sensitive to changes in interest rates. These risks include “extension risk”, which is the risk that, in periods of rising interest rates, issuers may delay the payment of principal, and “prepayment risk”, which is the risk that in periods of falling interest rates, issuers may pay principal sooner than expected, exposing the Fund to a lower rate of return upon reinvestment of principal. Mortgage-backed securities offered by nongovernmental issuers and other asset-backed securities may be subject to other risks, such as higher rates of default in the mortgages or assets backing the securities or risks associated with the nature and servicing of mortgages or assets backing the securities. Some mortgage-backed securities are “TBA” securities, which have additional risks.
Foreign (Non-U.S.) Investments Risk—Investments in securities of non-U.S. issuers may involve more risk than those of U.S. issuers. These securities may fluctuate more widely in price and may be more difficult to trade than domestic securities due to adverse market, economic, political, regulatory or other factors.
Emerging-Market Risk—Investments in emerging market countries may have more risk because the markets are less developed and less liquid and are subject to increased economic, political, regulatory or other uncertainties.
Currency Risk—Fluctuations in currency exchange rates may negatively affect the value of the Fund’s investments or reduce its returns.
Illiquid Investments Risk—Illiquid investments risk exists when certain investments are or become difficult to purchase or sell. Difficulty in selling such investments may result in sales at disadvantageous prices affecting the value of your investment in the Fund. Causes of illiquid investments risk may include low trading volumes and large positions. Foreign fixed-income securities may have more illiquid investments risk because secondary trading markets for these securities may be smaller and less well-developed and the securities may trade less frequently than domestic securities. Illiquid investments risk may be higher in a rising interest rate environment, when the value and liquidity of fixed-income securities generally go down.
| | |
| |
34 | AB CORE PLUS BOND ETF | | abfunds.com |
NOTES TO FINANCIAL STATEMENTS (continued)
Leverage Risk—When the Fund borrows money or otherwise leverages its investments, its performance may be volatile because leverage tends to exaggerate the effect of any increase or decrease in the value of the Fund’s investments. The Fund may create leverage through the use of reverse repurchase arrangements, forward currency exchange contracts, forward commitments, dollar rolls or futures or by borrowing money. The use of other types of derivative instruments by the Fund, such as options and swaps, may also result in a form of leverage. Leverage may result in higher returns to the Fund than if the Fund were not leveraged, but may also adversely affect returns, particularly if the market is declining.
Derivatives Risk—Derivatives may be difficult to price or unwind and may be leveraged so that small changes may produce disproportionate losses for the Fund. A short position in a derivative instrument involves the risk of a theoretically unlimited increase in the value of the underlying asset, reference rate or index, which could cause the Fund to suffer a potentially unlimited loss. Derivatives, especially over-the-counter derivatives, are also subject to counterparty risk, which is the risk that the counterparty (the party on the other side of the transaction) on a derivative transaction will be unable or unwilling to honor its contractual obligations to the Fund.
Variable and Floating-Rate Securities Risk—Variable and floating-rate securities pay interest at rates that are adjusted periodically, according to a specific formula. Because the interest rate is reset only periodically, changes in the interest rate on these securities may lag behind changes in the prevailing market interest rates. The value of the security may rise or fall depending on changes in interest rates between periodic resets.
Cash Transactions Risk—The Fund intends to effectuate all or a portion of the issuance and redemption of Creation Units for cash, rather than in-kind securities. As a result, an investment in the Fund may be less tax-efficient than an investment in an ETF that effectuates its Creation Units only on an in-kind basis. A fund that effects redemptions for cash may be required to sell portfolio securities in order to obtain the cash needed to distribute redemption proceeds. Any recognized gain on these sales by the Fund will generally cause the Fund to recognize a gain it might not otherwise have recognized, or to recognize such gain sooner than would otherwise be required as compared to an ETF that distributes portfolio securities in-kind in redemption of Creation Units. The Fund intends to distribute gains that arise by virtue of the issuance and redemption of Creation Units being effectuated in cash to shareholders to avoid being taxed on this gain at the fund level and otherwise comply with applicable tax requirements. This may cause shareholders to be subject to tax on gains to which they would not otherwise be subject, or at an earlier date than if they had made an investment in another ETF. Moreover, cash
| | |
| |
| abfunds.com | | AB CORE PLUS BOND ETF | 35 |
NOTES TO FINANCIAL STATEMENTS (continued)
transactions may have to be carried out over several days if the securities market is relatively illiquid and may involve considerable brokerage fees and taxes. Brokerage fees, which will be higher than if the Fund sold and redeemed its shares principally in-kind, will be passed on to those purchasing and redeeming Creation Units in the form of creation and redemption transaction fees. In addition, these factors may result in wider spreads between the bid and ask prices of Fund shares than for ETFs that receive and distribute portfolio securities in-kind. The Fund’s use of cash for creations and redemptions could also result in dilution to the Fund and increased transaction costs, which could negatively impact the Fund’s ability to achieve its investment objective.
ETF Share Price and Net Asset Value Risk—The Fund’s shares are listed for trading on the Nasdaq Stock Market LLC (“NYSE Acra” or an “Exchange”). Shares are generally bought and sold in the secondary market at market prices. The NAV per share of the Fund will fluctuate with changes in the market value of the Fund’s holdings. The Fund’s NAV is calculated once per day, at the end of the day. The market price of a share on the Exchange could be higher than the NAV (premium), or lower than the NAV (discount) and may fluctuate during the trading day. When all or a portion of the Fund’s underlying securities trade in a market that is closed when the market for the Fund’s shares is open, there may be differences between the current value of a security and the last quoted price for that security in the closed local market, which could lead to a deviation between the market value of the Fund’s shares and the Fund’s NAV. Disruptions in the creations and redemptions process or the existence of extreme market volatility could result in the Fund’s shares trading above or below NAV. As the Fund may invest in securities traded on foreign exchanges, Fund shares may trade at a larger premium or discount to the Fund’s NAV than shares of other ETFs. In addition, in stressed market conditions, the market for Fund shares may become less liquid in response to deteriorating liquidity in the markets for the Fund’s underlying portfolio holdings.
Authorized Participant Risk—Only a limited number of financial institutions that enter into an authorized participant relationship with the Fund (“Authorized Participants”) may engage in creation or redemption transactions. If the Fund’s Authorized Participants decide not to create or redeem shares, Fund shares may trade at a larger premium or discount to the Fund’s NAV, or the Fund could face trading halts or de-listing.
Active Trading Market Risk—There is no guarantee that an active trading market for Fund shares will exist at all times. In times of market stress, markets can suffer erratic or unpredictable trading activity, extraordinary volatility or wide bid/ask spreads, which could cause some market makers
| | |
| |
36 | AB CORE PLUS BOND ETF | | abfunds.com |
NOTES TO FINANCIAL STATEMENTS (continued)
and Authorized Participants to reduce their market activity or “step away” from making a market in ETF shares. Market makers and Authorized Participants are not obligated to place or execute purchase and redemption orders. This could cause the Fund’s market price to deviate, materially, from the NAV, and reduce the effectiveness of the ETF arbitrage process. Any absence of an active trading market for Fund shares could lead to a heightened risk that there will be a difference between the market price of a Fund share and the underlying value of the Fund share.
Indemnification Risk—In the ordinary course of business, the Fund enters into contracts that contain a variety of indemnifications. The Fund’s maximum exposure under these arrangements is unknown. However, the Fund has not had prior claims or losses pursuant to these indemnification provisions and expects the risk of loss thereunder to be remote. Therefore, the Fund has not accrued any liability in connection with these indemnification provisions.
Management Risk—The Fund is subject to management risk because it is an actively-managed ETF. The Adviser will apply its investment techniques and risk analyses in making investment decisions, but there is no guarantee that its techniques will produce the intended results. Many of these techniques incorporate, or rely upon, quantitative models, but there is no guarantee that these models will generate accurate forecasts, reduce risk or otherwise perform as expected.
NOTE G
Joint Credit Facility
A number of ETFs managed by the Adviser, including the Fund, participate in a $325 million revolving credit facility (the “Facility”) intended to provide short-term financing related to redemptions and other short term liquidity requirements, subject to certain restrictions. Commitment fees related to the Facility are paid by the participating funds and are included in miscellaneous expenses in the statement of operations. The Fund did not utilize the Facility during the period ended November 30, 2024.
NOTE H
Distributions to Shareholders
The tax character of distributions paid during the fiscal period ended November 30, 2024 was as follows:
| | | | |
| | | 2024 | |
Distributions paid from: | | | | |
Ordinary income | | $ | 1,814,999 | |
| | | | |
Total taxable distributions | | $ | 1,814,999 | |
| | | | |
| | |
| |
| abfunds.com | | AB CORE PLUS BOND ETF | 37 |
NOTES TO FINANCIAL STATEMENTS (continued)
As of November 30, 2024, the components of accumulated earnings (deficit) on a tax basis were as follows:
| | | | |
Undistributed ordinary income | | $ | 271,315 | |
Accumulated capital and other losses | | | (268,860 | )(a) |
Unrealized appreciation (depreciation) | | | 784,257 | (b) |
| | | | |
Total accumulated earnings (deficit) | | $ | 786,712 | |
| | | | |
| (a) | As of November 30, 2024, the cumulative deferred loss on straddles was $268,860. |
| (b) | The differences between book-basis and tax-basis unrealized appreciation (depreciation) are attributable primarily to the recognition for tax purposes of unrealized gains/losses on certain derivative instruments, the tax treatment of callable bonds, and the tax deferral of losses on wash sales. |
For tax purposes, net realized capital losses may be carried over to offset future capital gains, if any. Funds are permitted to carry forward capital losses for an indefinite period, and such losses will retain their character as either short-term or long-term capital losses. As of November 30, 2024, the Fund did not have any capital loss carryforwards.
During the current fiscal period, permanent differences primarily due to the utilization of earnings and profits distributed to shareholders on redemption of shares and the tax treatment of gains from a redemption-in-kind resulted in a net decrease in distributable earnings and a net increase in additional paid-in capital. These reclassifications had no effect on net assets.
NOTE I
Recent Accounting Pronouncements
In December 2022, the Financial Accounting Standards Board issued an Accounting Standards Update, ASU 2022-06, “Reference Rate Reform (Topic 848) – Deferral of the Sunset Date of Topic 848”. ASU 2022-06 is an amendment to ASU 2020-04, which provided optional guidance to ease the potential accounting burden due to the discontinuation of the LIBOR and other interbank-offered based reference rates and which was effective as of March 12, 2020 through December 31, 2022. ASU 2022-06 extends the effective period through December 31, 2024. Management is currently evaluating the impact, if any, of applying ASU 2022-06.
In November 2023, the Financial Accounting Standards Board issued Accounting Standards Update, ASU 2023-07, “Segment Reporting (Topic 280)”. ASU 2023-07 requires public entities to provide disclosure of significant segment expenses that are regularly provided to the chief operating decision maker (“CODM”). ASU 2023-07, among other things, (i) requires a single segment public entity to provide all necessary disclosures required by Topic 280 it, (ii) requires a public entity to disclose the title and position of the CODM and an explanation of how the CODM uses the reported measure(s) of segment profit and loss in assessing segment
| | |
| |
38 | AB CORE PLUS BOND ETF | | abfunds.com |
NOTES TO FINANCIAL STATEMENTS (continued)
performance and deciding how to allocate resources and (iii) provides the ability for a public entity to elect more than one performance measure. ASU 2023-07 is effective for fiscal years beginning after December 15, 2023, and interim periods within fiscal years beginning after December 15, 2024. Early adoption of ASU 2023-07 is permitted. Management is currently evaluating the impact, if any, of applying ASU 2023-07.
NOTE J
Subsequent Events
At meetings held on November 5-7 2024, the Board approved the reorganization of AB Total Return Bond Portfolio (the “Predecessor Portfolio”) into the Fund (the “Acquiring Portfolio”) (the “Acquisition”). Pursuant to an Agreement and Plan of Acquisition and Termination, the Predecessor Portfolio will be converted into the Acquiring Portfolio. The closing date of the Acquisition is expected to occur on or about February 7, 2025. The Acquisition does not require stockholder approval and stockholders are not being asked to vote. An Information Statement/Prospectus addressing the Acquisition dated December 18, 2024 has been filed with the Securities and Exchange Commission.
Effective February 7, 2025, the Fund’s unitary advisory fee will be reduced to an annual rate of .30% of the Fund’s average daily net assets.
Management has evaluated subsequent events for possible recognition or disclosure in the financial statements through the date the financial statements are issued. Management has determined that there are no other material events that would require disclosure in the Fund’s financial statements through this date.
| | |
| |
| abfunds.com | | AB CORE PLUS BOND ETF | 39 |
FINANCIAL HIGHLIGHTS
Selected Data For A Share of Capital Stock Throughout Each Period
| | | | |
| | | December 13,
2023(a) to
November 30,
2024 | |
| | | | |
| | | | |
Net asset value, beginning of period | | | $ 35.00 | |
| | | | |
Income From Investment Operations | | | | |
| |
Net investment income(b)(c) | | | 1.58 | |
| |
Net realized and unrealized gain on investment transactions | | | .55 | |
| | | | |
Net increase in net asset value from operations | | | 2.13 | |
| | | | |
Less: Dividends | | | | |
| |
Dividends from net investment income | | | (1.40 | ) |
| | | | |
Net asset value, end of period | | | $ 35.73 | |
| | | | |
| |
Total Return | | | | |
| |
Total investment return based on net asset value(d) | | | 6.19 | % |
| |
Ratios/Supplemental Data | | | | |
| |
Net assets, end of period (000’s omitted) | | | $55,383 | |
| |
Ratio to average net assets of: | | | | |
| |
Expenses, net of waivers/reimbursements(e)‡ | | | .32 | %^ |
| |
Expenses, before waivers/reimbursements(e)‡ | | | .33 | %^ |
| |
Net investment income(c) | | | 4.62 | %^ |
| |
Portfolio turnover rate(f) | | | 232 | % |
| | | | |
| |
‡ Expense ratios exclude the estimated acquired fund fees of affiliated/unaffiliated underlying | |
portfolio | | | .00 | %^ |
| (a) | Commencement of operations. |
| (b) | Based on average shares outstanding. |
| (c) | Net of expenses waived/reimbursed by the Adviser. |
| (d) | Total investment return is calculated assuming an initial investment made at the net asset value at the beginning of the period, reinvestment of all dividends and distributions at net asset value during the period, and redemption on the last day of the period. Total investment return does not reflect the deduction of taxes that a shareholder would pay on fund distributions or the redemption of fund shares. Total investment return calculated for a period of less than one year is not annualized. |
| (e) | In connection with the Fund’s investments in affiliated underlying portfolios, the Fund incurs no direct expenses, but bears proportionate shares of the fees and expenses (i.e., operating, administrative and investment advisory fees) of the affiliated underlying portfolios. The Adviser has contractually agreed to waive its fees from the Fund in an amount equal to the Fund’s pro rata share of certain acquired fund fees and expenses, and for the period ended November 30, 2024 such waiver amounted to .01%. |
| (f) | Excludes the value of portfolio securities received or delivered as a result of in-kind purchases or redemptions of the Fund’s capital shares, including ETF Creation Units. |
See notes to financial statements.
| | |
| |
40 | AB CORE PLUS BOND ETF | | abfunds.com |
REPORT OF INDEPENDENT REGISTERED
PUBLIC ACCOUNTING FIRM
To the Shareholders and the Board of Directors of
AB Core Plus Bond ETF
Opinion on the Financial Statements
We have audited the accompanying statement of assets and liabilities of AB Core Plus Bond ETF (the “Fund”) (one of the funds constituting AB Active ETFs, Inc. (the “Corporation”)), including the portfolio of investments, as of November 30, 2024, and the related statements of operations and changes in net assets and the financial highlights for the period from December 13, 2023 (commencement of operations) to November 30, 2024, and the related notes (collectively referred to as the “financial statements”). In our opinion, the financial statements present fairly, in all material respects, the financial position of the Fund (one of the funds constituting AB Active ETFs, Inc.) at November 30, 2024, the results of its operations, the changes in its net assets and its financial highlights for the period from December 13, 2023 (commencement of operations) to November 30, 2024, in conformity with U.S. generally accepted accounting principles.
Basis for Opinion
These financial statements are the responsibility of the Corporation’s management. Our responsibility is to express an opinion on the Fund’s financial statements based on our audit. We are a public accounting firm registered with the Public Company Accounting Oversight Board (United States) (“PCAOB”) and are required to be independent with respect to the Corporation in accordance with the U.S. federal securities laws and the applicable rules and regulations of the Securities and Exchange Commission and the PCAOB.
We conducted our audit in accordance with the standards of the PCAOB. Those standards require that we plan and perform the audit to obtain reasonable assurance about whether the financial statements are free of material misstatement, whether due to error or fraud. The Corporation is not required to have, nor were we engaged to perform, an audit of the Corporation’s internal control over financial reporting. As part of our audit, we are required to obtain an understanding of internal control over financial reporting but not for the purpose of expressing an opinion on the effectiveness of the Corporation’s internal control over financial reporting. Accordingly, we express no such opinion.
Our audit included performing procedures to assess the risks of material misstatement of the financial statements, whether due to error or fraud, and performing procedures that respond to those risks. Such procedures included examining, on a test basis, evidence regarding the amounts and
| | |
| |
| abfunds.com | | AB CORE PLUS BOND ETF | 41 |
REPORT OF INDEPENDENT REGISTERED
PUBLIC ACCOUNTING FIRM (continued)
disclosures in the financial statements. Our procedures included confirmation of securities owned as of November 30, 2024, by correspondence with the custodian, brokers and others; when replies were not received from brokers or others, we performed other auditing procedures. Our audit also included evaluating the accounting principles used and significant estimates made by management, as well as evaluating the overall presentation of the financial statements. We believe that our audit provides a reasonable basis for our opinion.

We have served as the auditor of one or more of the AB investment companies since 1968.
New York, New York
January 28, 2025
| | |
| |
42 | AB CORE PLUS BOND ETF | | abfunds.com |
2024 FEDERAL TAX INFORMATION
(unaudited)
For Federal income tax purposes, the following information is furnished with respect to the distributions paid by the Fund during the taxable year ended November 30, 2024. For foreign shareholders, 96.58% of ordinary income dividends paid may be considered to be qualifying to be taxed as interest-related dividends.
Shareholders should not use the above information to prepare their income tax returns. The information necessary to complete your income tax returns will be included with your Form 1099-DIV which will be sent to you separately in January 2025.
| | |
| |
| abfunds.com | | AB CORE PLUS BOND ETF | 43 |
Information Regarding the Review and Approval of Amendment to the Fund’s Advisory Agreement
At a meeting of the Board of Directors of AB Active ETFs, Inc. (the “Company”) held in-person on November 5-7, 2024 (the “Meeting”), the Adviser recommended an amendment to the Company’s then-current Advisory Agreement with the Adviser (the “Amended Advisory Agreement”) to effect a fee reduction in the advisory fee paid by AB Core Plus Bond ETF (the “Fund”). The amendment would reduce the Fund’s advisory fee from 0.33% to 0.30%, effective February 10, 2025. The disinterested directors (the “directors”) of the Company unanimously approved the Amended Advisory Agreement with the Adviser in respect of the Fund. At the Meeting the Adviser also proposed that the Fund would receive the assets of AB Total Return Bond Portfolio (the “Acquired Portfolio”), a series of AB Bond Fund, Inc. (a mutual fund), in exchange for shares of the Fund (an exchange-traded fund) and the assumption by the Fund of all the liabilities of the Acquired Portfolio. Shareholders of the Acquired Portfolio would receive shares of the Fund in a liquidating distribution of the Acquired Portfolio (the “Conversion”). The Conversion is expected to be consummated on or about February 10, 2025.
Prior to approval of the Amended Advisory Agreement, the directors had requested from the Adviser, and received and evaluated, extensive materials. They reviewed the proposed Amended Advisory Agreement with the Adviser and with experienced counsel who are independent of the Adviser, who advised on the relevant legal standards. The directors also reviewed additional materials, including comparative analytical data prepared by the Senior Vice President of the Fund. The directors also discussed the proposed approval in private sessions with counsel.
The directors considered their knowledge of the nature and quality of the services provided by the Adviser to the Fund gained from their experience as directors or trustees of most of the registered investment companies advised by the Adviser, including the other series of the Company that are organized as exchange-traded funds (“ETFs”), their overall confidence in the Adviser’s integrity and competence they have gained from that experience, the Adviser’s initiative in identifying and raising potential issues with the directors and its responsiveness, frankness and attention to concerns raised by the directors in the past, including the Adviser’s willingness to consider and implement organizational and operational changes designed to improve investment results and the services provided to the AB Funds. The directors noted that they have four regular meetings each year, at each of which they review extensive materials and information from the Adviser, including information on the investment performance of the Fund and the money market fund advised by the Adviser in which the Fund invests a portion of its assets.
| | |
| |
44 | AB CORE PLUS BOND ETF | | abfunds.com |
The directors also considered all factors they believed relevant, including the specific matters discussed below. During the course of their deliberations, the directors evaluated, among other things, the reasonableness of the proposed advisory fee. The directors did not identify any particular information that was all-important or controlling, and different directors may have attributed different weights to the various factors. The directors determined that the selection of the Adviser to manage the Fund and the overall arrangements between the Fund and the Adviser, as provided in the Amended Advisory Agreement, including the proposed advisory fee, were fair and reasonable in light of the services to be performed, expenses to be incurred and such other matters as the directors considered relevant in the exercise of their business judgment. The material factors and conclusions that formed the basis for the directors’ determinations included the following:
Nature, Extent and Quality of Services Provided
The directors considered the scope and quality of services to be provided by the Adviser under the Amended Advisory Agreement, including the quality of the investment research capabilities of the Adviser and the other resources it has dedicated to performing services for the Fund. The directors noted that the Adviser from time to time reviews the Fund’s investment strategies and may from time to time propose changes intended to improve the Fund’s relative or absolute performance for the directors’ consideration. They also noted the professional experience and qualifications of the Fund’s portfolio management team and other senior personnel of the Adviser. The directors also considered that the Amended Advisory Agreement (like the Fund’s then-current Advisory Agreement) provides that the Fund will reimburse the Adviser for the cost to it of providing certain clerical, accounting, administrative and other services to the Fund by employees of the Adviser or its affiliates. Requests for these reimbursements will be subject to the directors’ approval on a quarterly basis. The directors noted that the Adviser does not expect to request such reimbursements. The quality of administrative and other services, including the Adviser’s role in coordinating the activities of the Fund’s other service providers, also was considered. The directors noted that the proposed lowering of the advisory fee would benefit the Fund and its shareholders. They also noted that the Adviser was reducing fees for business reasons, and had assured them that there would be no diminution in the nature or quality of services to the Fund. The directors concluded that, overall, they were satisfied with the nature, extent and quality of services to be provided to the Fund under the Amended Advisory Agreement.
Costs of Services to be Provided and Profitability
Because the Fund commenced operations in December 2023, the directors were unable to consider information about the profitability of the Fund to the Adviser for the fiscal period ended December 31, 2023 under the Fund’s then-current Advisory Agreement. However, the Adviser agreed to
| | |
| |
| abfunds.com | | AB CORE PLUS BOND ETF | 45 |
provide the directors with profitability information in connection with future proposed continuances of the Amended Advisory Agreement. They also considered the costs to be borne by the Adviser in providing services to the Fund and that the Fund was unlikely to be profitable to the Adviser unless it achieves a material level of net assets.
Fall-Out Benefits
The directors considered the other benefits to the Adviser from its relationship with the Fund and the money market fund advised by the Adviser in which the Fund invests. The directors recognized that the Adviser’s future profitability would be somewhat lower without these benefits. The directors understood that the Adviser also might derive reputational and other benefits from its association with the Fund.
Investment Results
In addition to the information reviewed by the directors in connection with the Meeting, the directors have received detailed performance information for the Fund at each regular Board meeting since the Fund’s inception.
At the Meeting, the directors reviewed information prepared by an independent service provider (the “15(c) service provider”), showing the Fund’s performance against a group of similar ETFs (“peer group”) and a larger group of similar ETFs (“peer universe”), each selected by the 15(c) service provider for the year to date period ended July 31, 2024, and information prepared by the Adviser showing the Fund’s performance against a broad-based securities market index, for the period from inception. The directors discussed with the Adviser the reasons for the Fund’s underperformance in the period reviewed.
Advisory Fees and Other Expenses
The directors considered the proposed advisory fee rate payable by the Fund to the Adviser and information prepared by the 15(c) service provider, concerning advisory fee rates payable by other ETFs in the same category as the Fund. The directors noted that the proposed advisory fee (like the Fund’s then-current advisory fee) is a unitary fee and that the Adviser pays all expenses of the Fund except for certain expenses payable by the Fund such as interest expense, taxes, extraordinary expenses, and brokerage commissions and other transaction costs. The directors recognized that it is difficult to make comparisons of advisory fees because there are variations in the services that are included in the fees payable by other ETFs. The directors considered the Fund’s proposed contractual advisory fee rate against a peer group median and noted that it was lower than the median.
The directors also considered the Adviser’s fee schedule for other clients utilizing investment strategies similar to those of the Fund. For this purpose, they reviewed the relevant advisory fee information from the
| | |
| |
46 | AB CORE PLUS BOND ETF | | abfunds.com |
Adviser’s Form ADV and in a report from the Fund’s Senior Vice President and noted the differences between the Fund’s proposed fee schedule, on the one hand, and the Adviser’s institutional fee schedule, on the other. The directors noted that the Adviser may, in some cases, agree to fee rates with large institutional clients that are lower than those reviewed by the directors and that they had previously discussed with the Adviser its policies in respect of such arrangements. The directors also compared the proposed advisory fee rate for the Fund with those for other funds advised by the Adviser utilizing similar investment strategies.
The Adviser reviewed with the directors the significantly greater scope of the services it provides to the Fund relative to institutional clients. In this regard, the Adviser noted, among other things, that, compared to institutional accounts, the Fund (i) demands considerably more managerial and administrative resources due to the potential for frequent creations and redemptions of shares; (ii) has more tax and regulatory restrictions and compliance obligations; (iii) must prepare and file or distribute regulatory and other communications about fund operations; and (iv) must provide shareholder servicing to retail investors. The Adviser also reviewed the greater legal risks presented by the large and changing population of Fund shareholders who may assert claims against the Adviser in individual or class actions, and the greater entrepreneurial risk in offering new fund products, which require substantial investment to launch, may not succeed, and generally must be priced to compete with larger, more established funds resulting in lack of to the Adviser until a new fund achieves scale. In light of the substantial differences in services rendered by the Adviser to institutional clients as compared to the Fund, and the different risk profile, the directors considered these fee comparisons inapt and did not place significant weight on them in their deliberations. The directors noted that the proposed unitary fee for the Fund (like the Fund’s then-current unitary fee) covers additional services provided by third parties and thus is not directly comparable to the Adviser’s institutional fee schedule and the schedule of fees for most other funds advised by the Adviser.
In connection with their review of the Fund’s proposed advisory fee, the directors also considered a pro forma total expense ratio for the Fund (reflecting the proposed reduction in the advisory fee effective February 10, 2025) in comparison to the medians for a peer group and a peer universe selected by the 15(c) service provider. The directors view expense ratio information as relevant to their evaluation of the Adviser’s services because the Adviser is responsible for coordinating services provided to the Fund by others and, in most cases, the Adviser will be responsible for paying for such services under its unitary fee arrangement with the Fund. The directors noted that the Fund’s pro forma expense ratio was lower than the medians. Based on their review, the directors concluded that the Fund’s pro forma expense ratio was acceptable.
| | |
| |
| abfunds.com | | AB CORE PLUS BOND ETF | 47 |
Economies of Scale
The directors noted that the proposed advisory fee schedule for the Fund (like the Fund’s then-current advisory fee schedule) does not contain breakpoints and that they had discussed their strong preference for breakpoints in advisory contracts with the Adviser. The directors took into consideration prior presentations by an independent consultant on economies of scale in the mutual fund industry and for the AB Funds, and presentations from time to time by the Adviser concerning certain of its views on economies of scale. The directors also had requested and received from the Adviser certain updates on economies of scale in advance of the Meeting. The directors believe that economies of scale may be realized (if at all) by the Adviser across a variety of products and services, and not only in respect of a single fund. The directors noted that there is no established methodology for setting breakpoints that give effect to the fund-specific services provided by a fund’s adviser and to the economies of scale that an adviser may realize in its overall mutual fund business or those components of it which directly or indirectly affect a fund’s operations. The directors observed that in the mutual fund industry as a whole, as well as among ETFs similar to the Fund, there is no uniformity or pattern in the fees and asset levels at which breakpoints (if any) apply. The directors also noted that the advisory agreements for many ETFs do not have breakpoints at all. The directors informed the Adviser that they would monitor the Fund’s asset level and its profitability to the Adviser and anticipated revisiting the question of breakpoints in the future if circumstances warranted doing so.
| | |
| |
48 | AB CORE PLUS BOND ETF | | abfunds.com |
AB CORE PLUS BOND ETF
66 Hudson Boulevard East
New York, NY 10001
800 221 5672
ETF-CPB-0151-1124 
NOV 11.30.24

ANNUAL FINANCIAL STATEMENTS AND ADDITIONAL INFORMATION
AB DISRUPTORS ETF
(NYSE: FWD)

| | |
| |
| Investment Products Offered | | • Are Not FDIC Insured • May Lose Value • Are Not Bank Guaranteed |
Investors should consider the investment objectives, risks, charges and expenses of the Fund carefully before investing. For copies of our prospectus or summary prospectus, which contain this and other information, visit us online at www.abfunds.com or contact your AB representative. Please read the prospectus and/or summary prospectus carefully before investing.
This shareholder report must be preceded or accompanied by the Fund’s prospectus for individuals who are not current shareholders of the Fund.
You may obtain a description of the Fund’s proxy voting policies and procedures, and information regarding how the Fund voted proxies relating to portfolio securities during the most recent 12-month period ended June 30, without charge. Simply visit AB’s website at www.abfunds.com, or go to the Securities and Exchange Commission’s (the “Commission”) website at www.sec.gov, or call AB at (800) 227 4618.
The Fund files its complete schedule of portfolio holdings with the Commission for the first and third quarters of each fiscal year as an exhibit to its reports on Form N-PORT. The Fund’s Form N-PORT reports are available on the Commission’s website at www.sec.gov. AB publishes full portfolio holdings for the Fund daily at www.abfunds.com.
Foreside Fund Services, LLC (“Foreside”) is the distributor of the fund. Foreside is a member of FINRA.
The [A/B] logo and AllianceBernstein® are registered trademarks used by permission of the owner, AllianceBernstein L.P.
PORTFOLIO OF INVESTMENTS
November 30, 2024
| | | | | | | | |
| Company | | Shares | | | U.S. $ Value | |
| |
COMMON STOCKS – 98.4% | | | | | | | | |
Information Technology – 46.8% | | | | | | | | |
Communications Equipment – 3.3% | | | | | | | | |
Arista Networks, Inc.(a) | | | 19,573 | | | $ | 7,943,115 | |
Ciena Corp.(a) | | | 52,296 | | | | 3,646,077 | |
Lumentum Holdings, Inc.(a) | | | 54,818 | | | | 4,767,522 | |
| | | | | | | | |
| | | | 16,356,714 | |
| | | | | |
Electronic Equipment, Instruments & Components – 2.0% | | | | | | | | |
Coherent Corp.(a) | | | 52,461 | | | | 5,254,494 | |
Hon Hai Precision Industry Co., Ltd. | | | 381,000 | | | | 2,293,061 | |
IPG Photonics Corp.(a) | | | 28,248 | | | | 2,204,474 | |
| | | | | | | | |
| | | | 9,752,029 | |
| | | | | |
IT Services – 4.7% | |
EPAM Systems, Inc.(a) | | | 23,142 | | | | 5,644,797 | |
MongoDB, Inc.(a) | | | 15,202 | | | | 4,902,493 | |
Shopify, Inc. – Class A(a) | | | 62,067 | | | | 7,174,945 | |
Snowflake, Inc. – Class A(a) | | | 30,174 | | | | 5,274,415 | |
| | | | | | | | |
| | | | 22,996,650 | |
| | | | | |
Semiconductors & Semiconductor Equipment – 17.7% | | | | | | | | |
Advanced Micro Devices, Inc.(a) | | | 23,695 | | | | 3,250,362 | |
Advantest Corp. | | | 96,300 | | | | 5,283,564 | |
Applied Materials, Inc. | | | 20,050 | | | | 3,502,935 | |
ARM Holdings PLC (ADR)(a) | | | 33,500 | | | | 4,498,715 | |
Broadcom, Inc. | | | 36,815 | | | | 5,966,975 | |
Disco Corp. | | | 8,017 | | | | 2,167,262 | |
Infineon Technologies AG | | | 62,859 | | | | 2,045,860 | |
Lam Research Corp. | | | 63,357 | | | | 4,680,815 | |
Lattice Semiconductor Corp.(a) | | | 88,675 | | | | 5,032,306 | |
Marvell Technology, Inc. | | | 26,937 | | | | 2,496,791 | |
Micron Technology, Inc. | | | 29,510 | | | | 2,890,504 | |
NVIDIA Corp. | | | 145,639 | | | | 20,134,592 | |
ON Semiconductor Corp.(a) | | | 55,694 | | | | 3,960,957 | |
Silicon Laboratories, Inc.(a) | | | 30,344 | | | | 3,357,564 | |
SK Hynix, Inc. | | | 99 | | | | 11,347 | |
Taiwan Semiconductor Manufacturing Co., Ltd. | | | 233,607 | | | | 7,162,903 | |
Teradyne, Inc. | | | 35,537 | | | | 3,909,070 | |
Texas Instruments, Inc. | | | 29,567 | | | | 5,943,854 | |
| | | | | | | | |
| | | | 86,296,376 | |
| | | | | |
Software – 18.6% | |
Adobe, Inc.(a) | | | 4,806 | | | | 2,479,560 | |
Atlassian Corp., Ltd. – Class A(a) | | | 18,794 | | | | 4,953,723 | |
Bentley Systems, Inc. – Class B | | | 48,711 | | | | 2,411,195 | |
Confluent, Inc. – Class A(a) | | | 124,057 | | | | 3,825,918 | |
Crowdstrike Holdings, Inc. – Class A(a) | | | 15,211 | | | | 5,262,550 | |
| | |
| |
| abfunds.com | | AB DISRUPTORS ETF | 1 |
PORTFOLIO OF INVESTMENTS (continued)
| | | | | | | | |
| Company | | Shares | | | U.S. $ Value | |
| |
Datadog, Inc. – Class A(a) | | | 37,403 | | | $ | 5,713,308 | |
Fortinet, Inc.(a) | | | 59,142 | | | | 5,621,447 | |
Gitlab, Inc. – Class A(a) | | | 56,070 | | | | 3,574,462 | |
Guidewire Software, Inc.(a) | | | 19,401 | | | | 3,936,269 | |
HubSpot, Inc.(a) | | | 4,612 | | | | 3,325,483 | |
JFrog Ltd.(a) | | | 115,854 | | | | 3,608,852 | |
Microsoft Corp. | | | 7,975 | | | | 3,377,093 | |
Monday.com Ltd.(a) | | | 16,989 | | | | 4,847,981 | |
Oracle Corp. | | | 46,216 | | | | 8,542,565 | |
Palantir Technologies, Inc. – Class A(a) | | | 102,642 | | | | 6,885,225 | |
Palo Alto Networks, Inc.(a) | | | 6,142 | | | | 2,381,990 | |
Procore Technologies, Inc.(a) | | | 34,440 | | | | 2,796,528 | |
Samsara, Inc. – Class A(a) | | | 94,153 | | | | 5,036,244 | |
SentinelOne, Inc. – Class A(a) | | | 87,694 | | | | 2,451,047 | |
ServiceNow, Inc.(a) | | | 2,608 | | | | 2,736,940 | |
Synopsys, Inc.(a) | | | 6,469 | | | | 3,612,872 | |
Unity Software, Inc.(a) | | | 153,892 | | | | 3,710,336 | |
| | | | | | | | |
| | | | 91,091,588 | |
| | | | | |
Technology Hardware, Storage & Peripherals – 0.5% | | | | | | | | |
Quanta Computer, Inc. | | | 267,000 | | | | 2,391,928 | |
| | | | | | | | |
| | | | | | | 228,885,285 | |
| | | | | | | | |
Industrials – 16.0% | |
Aerospace & Defense – 3.4% | |
Axon Enterprise, Inc.(a) | | | 5,885 | | | | 3,807,360 | |
BAE Systems PLC | | | 291,533 | | | | 4,546,686 | |
Howmet Aerospace, Inc. | | | 50,614 | | | | 5,991,685 | |
Rolls-Royce Holdings PLC(a) | | | 361,307 | | | | 2,565,311 | |
| | | | | | | | |
| | | | | | | 16,911,042 | |
| | | | | | | | |
Building Products – 0.8% | |
Trane Technologies PLC | | | 9,278 | | | | 3,861,689 | |
| | | | | | | | |
|
Electrical Equipment – 8.2% | |
ABB Ltd. (REG) | | | 61,898 | | | | 3,512,458 | |
Contemporary Amperex Technology Co., Ltd. –Class A | | | 64,600 | | | | 2,333,193 | |
Eaton Corp. PLC | | | 14,377 | | | | 5,397,413 | |
GE Vernova, Inc.(a) | | | 27,587 | | | | 9,217,369 | |
Legrand SA | | | 40,739 | | | | 4,082,549 | |
Prysmian SpA | | | 78,523 | | | | 5,176,867 | |
Schneider Electric SE | | | 17,848 | | | | 4,590,234 | |
Vertiv Holdings Co. – Class A | | | 45,460 | | | | 5,800,696 | |
| | | | | | | | |
| | | | | | | 40,110,779 | |
| | | | | | | | |
Industrial Conglomerates – 0.7% | |
Hitachi Ltd. | | | 130,700 | | | | 3,264,346 | |
| | | | | | | | |
|
Machinery – 2.9% | |
Caterpillar, Inc. | | | 12,010 | | | | 4,877,381 | |
| | |
| |
2 | AB DISRUPTORS ETF | | abfunds.com |
PORTFOLIO OF INVESTMENTS (continued)
| | | | | | | | |
| Company | | Shares | | | U.S. $ Value | |
| |
Mitsubishi Heavy Industries Ltd. | | | 343,700 | | | $ | 5,029,002 | |
Westinghouse Air Brake Technologies Corp. | | | 20,722 | | | | 4,157,248 | |
| | | | | | | | |
| | | | | | | 14,063,631 | |
| | | | | | | | |
| | | | | | | 78,211,487 | |
| | | | | | | | |
Health Care – 13.1% | | | | | | | | |
Health Care Equipment & Supplies – 5.9% | | | | | | | | |
Abbott Laboratories | | | 20,993 | | | | 2,493,339 | |
Boston Scientific Corp.(a) | | | 68,205 | | | | 6,183,465 | |
Dexcom, Inc.(a) | | | 32,984 | | | | 2,572,422 | |
Hoya Corp. | | | 36,000 | | | | 4,616,706 | |
Intuitive Surgical, Inc.(a) | | | 14,422 | | | | 7,816,724 | |
Stryker Corp. | | | 12,873 | | | | 5,048,147 | |
| | | | | | | | |
| | | | | | | 28,730,803 | |
| | | | | | | | |
Life Sciences Tools & Services – 5.9% | |
Bruker Corp. | | | 64,011 | | | | 3,709,437 | |
Charles River Laboratories International, Inc.(a) | | | 12,531 | | | | 2,494,421 | |
Illumina, Inc.(a) | | | 28,816 | | | | 4,153,826 | |
IQVIA Holdings, Inc.(a) | | | 10,670 | | | | 2,142,963 | |
Lonza Group AG (REG)(a) | | | 10,401 | | | | 6,214,627 | |
Repligen Corp.(a) | | | 15,909 | | | | 2,394,941 | |
Thermo Fisher Scientific, Inc. | | | 7,763 | | | | 4,111,518 | |
Waters Corp.(a) | | | 9,175 | | | | 3,529,806 | |
| | | | | | | | |
| | | | | | | 28,751,539 | |
| | | | | | | | |
Pharmaceuticals – 1.3% | |
Eli Lilly & Co. | | | 3,686 | | | | 2,931,660 | |
Novo Nordisk A/S – Class B | | | 34,505 | | | | 3,700,699 | |
| | | | | | | | |
| | | | | | | 6,632,359 | |
| | | | | | | | |
| | | | | | | 64,114,701 | |
| | | | | | | | |
Communication Services – 7.5% | |
Entertainment – 2.8% | |
Netflix, Inc.(a) | | | 8,618 | | | | 7,642,529 | |
Spotify Technology SA(a) | | | 12,112 | | | | 5,776,939 | |
| | | | | | | | |
| | | | | | | 13,419,468 | |
| | | | | | | | |
Interactive Media & Services – 3.6% | |
Alphabet, Inc. – Class A | | | 35,073 | | | | 5,925,583 | |
Meta Platforms, Inc. – Class A | | | 12,024 | | | | 6,905,624 | |
Reddit, Inc. – Class A(a) | | | 33,937 | | | | 4,774,596 | |
| | | | | | | | |
| | | | | | | 17,605,803 | |
| | | | | | | | |
Media – 1.1% | |
Trade Desk, Inc. (The) – Class A(a) | | | 42,396 | | | | 5,450,006 | |
| | | | | | | | |
| | | | | | | 36,475,277 | |
| | | | | | | | |
Consumer Discretionary – 6.9% | |
Automobiles – 3.0% | |
Tesla, Inc.(a) | | | 43,047 | | | | 14,858,103 | |
| | | | | | | | |
| | |
| |
| abfunds.com | | AB DISRUPTORS ETF | 3 |
PORTFOLIO OF INVESTMENTS (continued)
| | | | | | | | |
| Company | | Shares | | | U.S. $ Value | |
| |
Broadline Retail – 1.7% | |
Amazon.com, Inc.(a) | | | 40,524 | | | $ | 8,424,534 | |
| | | | | | | | |
|
Hotels, Restaurants & Leisure – 2.2% | |
Airbnb, Inc. – Class A(a) | | | 16,615 | | | | 2,261,468 | |
Booking Holdings, Inc. | | | 591 | | | | 3,074,370 | |
DoorDash, Inc. – Class A(a) | | | 28,977 | | | | 5,229,769 | |
| | | | | | | | |
| | | | | | | 10,565,607 | |
| | | | | | | | |
| | | | | | | 33,848,244 | |
| | | | | | | | |
Utilities – 3.3% | |
Electric Utilities – 0.8% | |
NextEra Energy, Inc. | | | 48,762 | | | | 3,836,106 | |
| | | | | | | | |
| | |
Independent Power and Renewable Electricity Producers – 2.5% | | | | | | | | |
Vistra Corp. | | | 75,784 | | | | 12,113,315 | |
| | | | | | | | |
| | | | | | | 15,949,421 | |
| | | | | | | | |
Financials – 2.8% | |
Capital Markets – 1.0% | |
Robinhood Markets, Inc. – Class A(a) | | | 126,578 | | | | 4,751,738 | |
| | | | | | | | |
|
Financial Services – 1.8% | |
Affirm Holdings, Inc.(a) | | | 50,053 | | | | 3,504,210 | |
Apollo Global Management, Inc. | | | 31,321 | | | | 5,482,115 | |
| | | | | | | | |
| | | | | | | 8,986,325 | |
| | | | | | | | |
| | | | | | | 13,738,063 | |
| | | | | | | | |
Energy – 0.9% | |
Energy Equipment & Services – 0.9% | | | | | | | | |
Baker Hughes Co. | | | 93,852 | | | | 4,124,795 | |
| | | | | | | | |
|
Real Estate – 0.7% | |
Real Estate Management & Development – 0.7% | | | | | | | | |
Zillow Group, Inc. – Class C(a) | | | 41,087 | | | | 3,480,480 | |
| | | | | | | | |
|
Materials – 0.4% | |
Metals & Mining – 0.4% | |
Freeport-McMoRan, Inc. | | | 45,515 | | | | 2,011,763 | |
| | | | | | | | |
| | |
Total Common Stocks
(cost $381,427,114) | | | | | | | 480,839,516 | |
| | | | | | | | |
| | |
| |
4 | AB DISRUPTORS ETF | | abfunds.com |
PORTFOLIO OF INVESTMENTS (continued)
| | | | | | | | |
| Company | | Shares | | | U.S. $ Value | |
| |
SHORT-TERM INVESTMENTS – 1.3% | | | | | | | | |
Investment Companies – 1.3% | | | | | | | | |
AB Fixed Income Shares, Inc. – Government Money Market Portfolio – Class AB, 4.54%(b)(c)(d)
(cost $6,654,945) | | | 6,654,945 | | | $ | 6,654,945 | |
| | | | | | | | |
| | |
Total Investments – 99.7%
(cost $388,082,059) | | | | | | | 487,494,461 | |
Other assets less liabilities – 0.3% | | | | | | | 1,295,336 | |
| | | | | | | | |
| | |
Net Assets – 100.0% | | | | | | $ | 488,789,797 | |
| | | | | | | | |
| (a) | Non-income producing security. |
| (b) | Affiliated investments. |
| (c) | The rate shown represents the 7-day yield as of period end. |
| (d) | To obtain a copy of the fund’s shareholder report, please go to the Securities and Exchange Commission’s website at www.sec.gov, or call AB at (800) 227-4618. |
Glossary:
ADR – American Depositary Receipt
REG – Registered Shares
See notes to financial statements.
| | |
| |
| abfunds.com | | AB DISRUPTORS ETF | 5 |
STATEMENT OF ASSETS & LIABILITIES
November 30, 2024
| | | | |
| Assets | |
Investments in securities, at value | | | | |
Unaffiliated issuers (cost $381,427,114) | | $ | 480,839,516 | |
Affiliated issuers (cost $6,654,945) | | | 6,654,945 | |
Cash | | | 1,548,515 | |
Foreign currencies, at value (cost $311,436) | | | 306,352 | |
Receivable for investment securities sold and foreign currency transactions | | | 6,761,784 | |
Unaffiliated dividends receivable | | | 184,775 | |
Affiliated dividends receivable | | | 36,767 | |
Receivable due from Adviser | | | 1,854 | |
| | | | |
Total assets | | | 496,334,508 | |
| | | | |
| Liabilities | |
Payable for capital stock redeemed | | | 4,987,548 | |
Payable for investment securities purchased | | | 2,308,499 | |
Advisory fee payable | | | 248,664 | |
| | | | |
Total liabilities | | | 7,544,711 | |
| | | | |
Net Assets | | $ | 488,789,797 | |
| | | | |
| Composition of Net Assets | |
Capital stock, at par | | $ | 588 | |
Additional paid-in capital | | | 381,891,625 | |
Distributable earnings | | | 106,897,584 | |
| | | | |
Net Assets | | $ | 488,789,797 | |
| | | | |
Net Asset Value Per Share—500 million shares of capital stock authorized, $.0001 par value (based on 5,880,020 shares outstanding) | | $ | 83.13 | |
| | | | |
See notes to financial statements.
| | |
| |
6 | AB DISRUPTORS ETF | | abfunds.com |
STATEMENT OF OPERATIONS
Year Ended November 30, 2024
| | | | | | | | |
| Investment Income | | | | | | | | |
Dividends | | | | | | | | |
Unaffiliated issuers (net of foreign taxes withheld of $120,003) | | $ | 1,840,015 | | | | | |
Affiliated issuers | | | 320,551 | | | | | |
Interest | | | 7,049 | | | $ | 2,167,615 | |
| | | | | | | | |
| Expenses | | | | | | | | |
Advisory fee (see Note B) | | | 2,122,556 | | | | | |
| | | | | | | | |
Total expenses | | | 2,122,556 | | | | | |
Less: expenses waived and reimbursed by the Adviser (see Note B) | | | (10,413 | ) | | | | |
| | | | | | | | |
Net expenses | | | | | | | 2,112,143 | |
| | | | | | | | |
Net investment income | | | | | | | 55,472 | |
| | | | | | | | |
| Realized and Unrealized Gain (Loss) on Investment and Foreign Currency Transactions | | | | | | | | |
Net realized gain (loss) on: | | | | | | | | |
Investment transactions | | | | | | | 13,997,770 | |
In-kind redemptions | | | | | | | 13,141,621 | |
Foreign currency transactions | | | | | | | (135,197 | ) |
Net change in unrealized appreciation (depreciation) of: | | | | | | | | |
Investments | | | | | | | 80,401,765 | |
Foreign currency denominated assets and liabilities | | | | | | | (9,578 | ) |
| | | | | | | | |
Net gain on investment and foreign currency transactions | | | | | | | 107,396,381 | |
| | | | | | | | |
Net Increase in Net Assets from Operations | | | | | | $ | 107,451,853 | |
| | | | | | | | |
See notes to financial statements.
| | |
| |
| abfunds.com | | AB DISRUPTORS ETF | 7 |
STATEMENT OF CHANGES IN NET ASSETS
| | | | | | | | |
| | | Year Ended
November 30,
2024 | | | March 22,
2023(a) to
November 30,
2023 | |
Increase (Decrease) in Net Assets
from Operations | | | | | | | | |
Net investment income (loss) | | $ | 55,472 | | | $ | (24,288 | ) |
Net realized gain (loss) on investment transactions | | | 27,004,194 | | | | (5,443,437 | ) |
Net change in unrealized appreciation (depreciation) of investments and foreign currency denominated assets and liabilities | | | 80,392,187 | | | | 19,012,666 | |
| | | | | | | | |
Net increase in net assets from
operations | | | 107,451,853 | | | | 13,544,941 | |
| Capital Stock Transactions | |
Net increase | | | 202,927,861 | | | | 164,842,104 | |
Other capital | | | 17,646 | | | | 5,392 | |
| | | | | | | | |
Total increase | | | 310,397,360 | | | | 178,392,437 | |
| Net Assets | |
Beginning of period | | | 178,392,437 | | | | – 0 | – |
| | | | | | | | |
End of period | | $ | 488,789,797 | | | $ | 178,392,437 | |
| | | | | | | | |
| (a) | Commencement of operations. |
See notes to financial statements.
| | |
| |
8 | AB DISRUPTORS ETF | | abfunds.com |
NOTES TO FINANCIAL STATEMENTS
November 30, 2024
NOTE A
Significant Accounting Policies
AB Active ETFs, Inc. (the “Corporation”) is registered under the Investment Company Act of 1940 (the “1940 Act”) as an open-end management investment company. The Corporation, which is a Maryland corporation, operates as a series company comprised of 15 funds currently in operation. Each fund is considered to be a separate entity for financial reporting and tax purposes. This report relates only to the AB Disruptors ETF (the “Fund”), a non-diversified portfolio. The Fund commenced investment operations on March 22, 2023. The financial statements have been prepared in conformity with U.S. generally accepted accounting principles (“U.S. GAAP”), which require management to make certain estimates and assumptions that affect the reported amounts of assets and liabilities in the financial statements and amounts of income and expenses during the reporting period. Actual results could differ from those estimates. The Fund is an investment company under U.S. GAAP and follows the accounting and reporting guidance applicable to investment companies. The following is a summary of significant accounting policies followed by the Fund.
1. Security Valuation
Portfolio securities are valued at market value determined on the basis of market quotations or, if market quotations are not readily available or are unreliable, at “fair value” as determined in accordance with procedures approved by and under the oversight of the Fund’s Board of Directors (the “Board”). Pursuant to these procedures, AllianceBernstein L.P. (the “Adviser”) serves as the Fund’s valuation designee pursuant to Rule 2a-5 of the 1940 Act. In this capacity, the Adviser is responsible, among other things, for making all fair value determinations relating to the Fund’s portfolio investments, subject to the Board’s oversight.
In general, the market values of securities which are readily available and deemed reliable are determined as follows: securities listed on a national securities exchange (other than securities listed on the NASDAQ Stock Market, Inc. (“NASDAQ”)) or on a foreign securities exchange are valued at the last sale price at the close of the exchange or foreign securities exchange. If there has been no sale on such day, the securities are valued at the last traded price from the previous day. Securities listed on more than one exchange are valued by reference to the principal exchange on which the securities are traded; securities listed only on NASDAQ are valued in accordance with the NASDAQ Official Closing Price; listed or over the counter (“OTC”) market put or call options are valued at the mid level between the current bid and ask prices. If either a current bid or current ask price is unavailable, the Adviser will have discretion to determine the best valuation (e.g., last trade price in the case of listed options); open
| | |
| |
| abfunds.com | | AB DISRUPTORS ETF | 9 |
NOTES TO FINANCIAL STATEMENTS (continued)
futures are valued using the closing settlement price or, in the absence of such a price, the most recent quoted bid price. If there are no quotations available for the day of valuation, the last available closing settlement price is used; U.S. Government securities and any other debt instruments having 60 days or less remaining until maturity are generally valued at fair value by an independent pricing service. If an independent fair value is not available, the securities are valued at amortized cost. This methodology is commonly used for short term securities that have an original maturity of 60 days or less, as well as short term securities that had an original term to maturity that exceeded 60 days. In instances when amortized cost is utilized, the Valuation Committee (the “Committee”) must reasonably conclude that the utilization of amortized cost is approximately the same as the fair value of the security. Factors the Committee will consider include, but are not limited to, an impairment of the creditworthiness of the issuer or material changes in interest rates. Fixed-income securities, including mortgage-backed and asset-backed securities, may be valued on the basis of prices provided by a pricing service or at a price obtained from one or more of the major broker-dealers. In cases where broker-dealer quotes are obtained, the Adviser may establish procedures whereby changes in market yields or spreads are used to adjust, on a daily basis, a recently obtained quoted price on a security. Swaps and other derivatives are valued daily, primarily using independent pricing services, independent pricing models using market inputs, as well as third party broker-dealers or counterparties. Open-end mutual funds are valued at the closing net asset value (“NAV”) per share, while exchange-traded funds are valued at the closing market price per share.
Securities for which market quotations are not readily available (including restricted securities) or are deemed unreliable are valued at fair value as deemed appropriate by the Adviser. Factors considered in making this determination may include, but are not limited to, information obtained by contacting the issuer, analysts, analysis of the issuer’s financial statements or other available documents. In addition, the Fund may use fair value pricing for securities primarily traded in non-U.S. markets because most foreign markets close well before the Fund values its securities at 4:00 p.m., Eastern Time. The earlier close of these foreign markets gives rise to the possibility that significant events may have occurred in the interim and may materially affect the value of those securities. To account for this, the Fund generally values many of its foreign equity securities using fair value prices at the discretion of the Adviser.
2. Fair Value Measurements
In accordance with U.S. GAAP regarding fair value measurements, fair value is defined as the price that the Fund would receive to sell an asset or
| | |
| |
10 | AB DISRUPTORS ETF | | abfunds.com |
NOTES TO FINANCIAL STATEMENTS (continued)
pay to transfer a liability in an orderly transaction between market participants at the measurement date. U.S. GAAP establishes a framework for measuring fair value, and a three-level hierarchy for fair value measurements based upon the transparency of inputs to the valuation of an asset or liability (including those valued based on their market values as described in Note A.1 above). Inputs may be observable or unobservable and refer broadly to the assumptions that market participants would use in pricing the asset or liability. Observable inputs reflect the assumptions market participants would use in pricing the asset or liability based on market data obtained from sources independent of the Fund. Unobservable inputs reflect the Fund’s own assumptions about the assumptions that market participants would use in pricing the asset or liability based on the best information available in the circumstances. Each investment is assigned a level based upon the observability of the inputs which are significant to the overall valuation. The three-tier hierarchy of inputs is summarized below.
| | • | | Level 1—quoted prices in active markets for identical investments |
| | • | | Level 2—other significant observable inputs (including quoted prices for similar investments, interest rates, prepayment speeds, credit risk, etc.) |
| | • | | Level 3—significant unobservable inputs (including the Fund’s own assumptions in determining the fair value of investments) |
Where readily available market prices or relevant bid prices are not available for certain equity investments, such investments may be valued based on similar publicly traded investments, movements in relevant indices since last available prices or based upon underlying company fundamentals and comparable company data (such as multiples to earnings or other multiples to equity). Where an investment is valued using an observable input, such as another publicly traded security, the investment will be classified as Level 2. If management determines that an adjustment is appropriate based on restrictions on resale, illiquidity or uncertainty, and such adjustment is a significant component of the valuation, the investment will be classified as Level 3. An investment will also be classified as Level 3 where management uses company fundamentals and other significant inputs to determine the valuation.
| | |
| |
| abfunds.com | | AB DISRUPTORS ETF | 11 |
NOTES TO FINANCIAL STATEMENTS (continued)
The following table summarizes the valuation of the Fund’s investments by the above fair value hierarchy levels as of November 30, 2024:
| | | | | | | | | | | | | | | | |
Investments in Securities: | | Level 1 | | | Level 2 | | | Level 3 | | | Total | |
Assets: | |
Common Stocks(a) | | $ | 480,839,516 | | | $ | – 0 | – | | $ | – 0 | – | | $ | 480,839,516 | |
Short-Term Investments | | | 6,654,945 | | | | – 0 | – | | | – 0 | – | | | 6,654,945 | |
| | | | | | | | | | | | | | | | |
Total Investments in Securities | | | 487,494,461 | | | | – 0 | – | | | – 0 | – | | | 487,494,461 | |
Other Financial Instruments(b) | | | – 0 | – | | | – 0 | – | | | – 0 | – | | | – 0 | – |
| | | | | | | | | | | | | | | | |
Total | | $ | 487,494,461 | | | $ | – 0 | – | | $ | – 0 | – | | $ | 487,494,461 | |
| | | | | | | | | | | | | | | | |
| (a) | See Portfolio of Investments for sector classifications. |
| (b) | Other financial instruments include derivative instruments, such as futures, forwards and swaps. Derivative instruments are valued at the unrealized appreciation (depreciation) on the instrument. Other financial instruments may also include swaps with upfront premiums, written options and written swaptions which are valued at market value. |
3. Currency Translation
Assets and liabilities denominated in foreign currencies and commitments under forward currency exchange contracts are translated into U.S. dollars at the mean of the quoted bid and ask prices of such currencies against the U.S. dollar. Purchases and sales of portfolio securities are translated into U.S. dollars at the rates of exchange prevailing when such securities were acquired or sold. Income and expenses are translated into U.S. dollars at rates of exchange prevailing when accrued.
Net realized gain or loss on foreign currency transactions represents foreign exchange gains and losses from sales and maturities of foreign fixed income investments, holding of foreign currencies, currency gains or losses realized between the trade and settlement dates on foreign investment transactions, and the difference between the amounts of dividends, interest and foreign withholding taxes recorded on the Fund’s books and the U.S. dollar equivalent amounts actually received or paid. Net unrealized currency gains and losses from valuing foreign currency denominated assets and liabilities at period end exchange rates are reflected as a component of net unrealized appreciation or depreciation of foreign currency denominated assets and liabilities.
4. Taxes
It is the Fund’s policy to meet the requirements of the Internal Revenue Code applicable to regulated investment companies and to distribute all of its investment company taxable income and net realized gains, if any, to shareholders. Therefore, no provisions for federal income or excise taxes are required. The Fund may be subject to taxes imposed by countries in which it invests. Such taxes are generally based on income and/or capital
| | |
| |
12 | AB DISRUPTORS ETF | | abfunds.com |
NOTES TO FINANCIAL STATEMENTS (continued)
gains earned or repatriated. Taxes are accrued and applied to net investment income, net realized gains and net unrealized appreciation/depreciation as such income and/or gains are earned.
In accordance with U.S. GAAP requirements regarding accounting for uncertainties in income taxes, management has analyzed the Fund’s tax positions taken or expected to be taken on federal and state income tax returns for all open tax years (the current and prior tax years) and has concluded that no provision for income tax is required in the Fund’s financial statements.
5. Investment Income and Investment Transactions
Dividend income is recorded on the ex-dividend date or as soon as the Fund is informed of the dividend. Interest income is accrued daily. Investment transactions are accounted for on the date the securities are purchased or sold. Investment gains or losses are determined on the identified cost basis. Non-cash dividends, if any, are recorded on the ex-dividend date at the fair value of the securities received. The Fund amortizes premiums and accretes discounts as adjustments to interest income. The Fund accounts for distributions received from real estate investment trust (“REIT”) investments or from regulated investment companies as dividend income, realized gain, or return of capital based on information provided by the REIT or the investment company.
6. Dividends and Distributions
Dividends and distributions to shareholders, if any, are recorded on the ex-dividend date. Income dividends and capital gains distributions are determined in accordance with federal tax regulations and may differ from those determined in accordance with U.S. GAAP. To the extent these differences are permanent, such amounts are reclassified within the capital accounts based on their federal tax basis treatment; temporary differences do not require such reclassification.
7. Offering Expenses
The Adviser has agreed to pay all of the Fund’s organization and offering costs. The Fund is not obligated to repay any such organizational expenses or offering costs paid by the Adviser.
8. Cash and Short-Term Investments
Cash and short-term investments include cash on hand and short-term investments with maturities of less than one year when purchased.
NOTE B
Advisory Fee and Other Transactions with Affiliates
Under the terms of the investment advisory agreement, the Fund pays the Adviser a unitary advisory fee at an annual rate of .65% of the Fund’s average daily net assets. The fees are accrued daily and paid monthly.
| | |
| |
| abfunds.com | | AB DISRUPTORS ETF | 13 |
NOTES TO FINANCIAL STATEMENTS (continued)
Under the investment advisory agreement, in accordance with the unitary fee structure, the Adviser bears the cost of various third-party services required by the Fund, including audit, custodial, accounting, legal, transfer agency and printing costs and the fees and expenses of the Corporation’s directors and their counsel. Also under the investment advisory agreement, the Adviser will reimburse the Fund for the Fund’s share of the acquired funds fees and expenses (advisory fees and other expenses) of any pooled investment vehicle for which the Adviser serves as investment adviser. For the year ended November 30, 2024, such waiver/reimbursements relating to the Fund’s investment in AB Government Money Market Portfolio amounted to $10,413.
A summary of the Fund’s transactions in AB mutual funds for the year ended November 30, 2024 is as follows:
| | | | | | | | | | | | | | | | | | | | |
Fund | | Market Value
11/30/23
(000) | | | Purchases
at Cost
(000) | | | Sales
Proceeds
(000) | | | Market Value
11/30/24
(000) | | | Dividend
Income
(000) | |
AB Government Money Market Portfolio | | $ | 1,545 | | | $ | 211,541 | | | $ | 206,431 | | | $ | 6,655 | | | $ | 321 | |
NOTE C
Distribution Plan
The Fund has adopted a Distribution and Service Plan pursuant to Rule 12b-1 of the Act which permits the Fund to pay distribution and servicing fees not to exceed .25% per year of the Fund’s average daily net assets. No such fees are currently paid, and the Board has not approved the commencement of payments under the Rule 12b-1 Distribution Plan.
NOTE D
Investment Transactions
Purchases and sales of investment securities (excluding short-term investments and in-kind purchases and sales) for the year ended November 30, 2024 were as follows:
| | | | | | | | |
| | | Purchases | | | Sales | |
Investment securities (excluding U.S. government securities) | | $ | 565,322,647 | | | $ | 524,798,318 | |
U.S. government securities | | | – 0 | – | | | – 0 | – |
During the year ended November 30, 2024, the Fund delivered portfolio securities for the redemption of Fund shares (in-kind redemptions). Cash and portfolio securities were transferred for redemptions at fair value. For financial reporting purposes, the Fund recorded net realized gains and
| | |
| |
14 | AB DISRUPTORS ETF | | abfunds.com |
NOTES TO FINANCIAL STATEMENTS (continued)
losses in connection with each in-kind redemption transaction. For the year ended November 30, 2024, the Fund had in-kind purchases and in-kind sales as follows:
| | | | | | | | |
| | | Purchases | | | Sales | |
In-kind transactions (excluding U.S. government securities) | | $ | 195,068,273 | | | $ | 38,583,750 | |
U.S. government securities | | | – 0 | – | | | – 0 | – |
The cost of investments for federal income tax purposes, gross unrealized appreciation and unrealized depreciation are as follows:
| | | | |
Cost | | $ | 389,909,875 | |
| | | | |
Gross unrealized appreciation | | $ | 102,477,082 | |
Gross unrealized depreciation | | | (4,892,496 | ) |
| | | | |
Net unrealized appreciation | | $ | 97,584,586 | |
| | | | |
1. Derivative Financial Instruments
The Fund may use derivatives in an effort to earn income and enhance returns, to replace more traditional direct investments, to obtain exposure to otherwise inaccessible markets (collectively, “investment purposes”), or to hedge or adjust the risk profile of its portfolio.
The Fund did not engage in derivatives transactions for the year ended November 30, 2024.
2. Currency Transactions
The Fund may invest in non-U.S. Dollar-denominated securities on a currency hedged or unhedged basis. The Fund may seek investment opportunities by taking long or short positions in currencies through the use of currency-related derivatives, including forward currency exchange contracts, futures and options on futures, swaps, and other options. The Fund may enter into transactions for investment opportunities when it anticipates that a foreign currency will appreciate or depreciate in value but securities denominated in that currency are not held by the Fund and do not present attractive investment opportunities. Such transactions may also be used when the Adviser believes that it may be more efficient than a direct investment in a foreign currency-denominated security. The Fund may also conduct currency exchange contracts on a spot basis (i.e., for cash at the spot rate prevailing in the currency exchange market for buying or selling currencies).
NOTE E
Shares of the Fund
The Fund’s shares may only be bought and sold in a secondary market through a broker-dealer at a market price. Because ETF shares trade at
| | |
| |
| abfunds.com | | AB DISRUPTORS ETF | 15 |
NOTES TO FINANCIAL STATEMENTS (continued)
market prices rather than NAV, shares may trade at a price greater than NAV (a premium) or less than NAV (a discount). The Fund issues and redeems shares at its NAV only in aggregations of a specified number of shares (a creation unit) generally in exchange for a designated portfolio of securities and/or cash (including any portion of such securities for which cash may be substituted). A fixed transaction fee is imposed on authorized participants in connection with creation unit redemption and creation transactions. Authorized participants may be required to pay an additional variable charge to cover certain costs and expenses related to the execution of trades resulting from creation unit transactions. Such variable charges, if any, are included in other capital within the Statement of Changes in Net Assets.
Transactions in shares of the Fund were as follows:
| | | | | | | | | | | | | | | | | | | | | | | | |
| | | | | | | | | | | | | | | | | | | | | | | | |
| | | Shares | | | | | | Amount | | | | |
| | | Year Ended
November 30,
2024 | | | March 22, 2023(a) to
November 30,
2023 | | | | | | Year Ended
November 30,
2024 | | | March 22, 2023(a) to
November 30,
2023 | | | | |
| | | | | | | | |
Shares sold | | | 3,370,000 | | | | 3,190,020 | | | | | | | $ | 248,296,848 | | | $ | 170,414,033 | | | | | |
| | | | | |
Shares redeemed | | | (580,000 | ) | | | (100,000 | ) | | | | | | | (45,368,987 | ) | | | (5,571,929 | ) | | | | |
| | | | | |
Net increase | | | 2,790,000 | | | | 3,090,020 | | | | | | | $ | 202,927,861 | | | $ | 164,842,104 | | | | | |
| | | | | |
| (a) | Commencement of operations. |
NOTE F
Risks Involved in Investing in the Fund
Market Risk—The value of the Fund’s assets will fluctuate as the market or markets in which the Fund invests fluctuate. The value of the Fund’s investments may decline, sometimes rapidly and unpredictably, simply because of economic changes or other events, including public health crises (including the occurrence of a contagious disease or illness), interest rate levels, and regional and global conflicts, that affect large portions of the market.
Equity Securities Risk—The Fund invests in publicly-traded equity securities, and their value may fluctuate, sometimes rapidly and unpredictably, which means a security may be worth more or less than when it was purchased. These fluctuations can be based on a variety of factors including a company’s financial condition as well as macro-economic factors such as interest rates, inflation rates, global market conditions, and non-economic factors such as market perceptions and social or political events.
Foreign (Non-U.S.) Investments Risk—Investments in securities of non-U.S. issuers may involve more risk than those of U.S. issuers. These
| | |
| |
16 | AB DISRUPTORS ETF | | abfunds.com |
NOTES TO FINANCIAL STATEMENTS (continued)
securities may fluctuate more widely in price and may be more difficult to trade than domestic securities due to adverse market, economic, political, regulatory or other factors.
Global Risk—The Fund invests in companies in multiple countries, and companies in which the Fund invests may experience differing outcomes with respect to safety and security, economic uncertainties, natural and environmental conditions, health conditions (including pandemics such as Covid-19) and/or systemic market dislocations (including market dislocations due to events outside a company’s country or region, including supply chain events). The global interconnectivity of industries and companies, especially with respect to goods, can be negatively impacted by events occurring beyond a company’s principal geographic location. These events can contribute to volatility, valuation and liquidity issues, and can affect specific companies, countries, regions and global markets.
Emerging Market Risk—Investments in emerging market countries may have more risk because the markets are less developed and less liquid as well as being subject to increased economic, political, regulatory or other uncertainties.
Currency Risk—Fluctuations in currency exchange rates may negatively affect the value of the Fund’s investments or reduce its returns.
Capitalization Risk—Investments in small- and mid-capitalization companies may be more volatile than investments in large-capitalization companies. Investments in small-capitalization companies may have additional risks because these companies have limited product lines, markets or financial resources.
Sector Risk—The Fund may have more risk because it may invest to a significant extent in one or more particular market sectors, such as the information technology sector. To the extent it does so, market or economic factors affecting the relevant sector(s) could have a major effect on the value of the Fund’s investments. Because the Fund may invest to a significant extent in the information technology sector, the Fund’s performance largely depends on the general condition of that sector. Companies in the information technology sector could be affected by, among other things, changes in interest rates, overall economic conditions, short product cycles, rapid obsolescence of products, competition, and government regulation. Companies in the software industry may be adversely affected by, among other things, the decline or fluctuation of subscription renewal rates for their products and services and actual or perceived vulnerabilities in their products or services.
Depositary Receipts Risk—Investing in depositary receipts involves risks that are similar to the risks of direct investments in foreign securities. For
| | |
| |
| abfunds.com | | AB DISRUPTORS ETF | 17 |
NOTES TO FINANCIAL STATEMENTS (continued)
example, investing in depositary receipts may involve risks relating to political, economic or regulatory conditions in foreign countries. In addition, the issuers of the securities underlying certain depositary receipts are under no obligation to distribute shareholder communications or pass through any voting rights with respect to the deposited securities to the holders of such receipts.
Non-Diversification Risk—The Fund may have more risk because it is “non-diversified”, meaning that it can invest more of its assets in a smaller number of issuers. Accordingly, changes in the value of a single security may have a more significant effect, either negative or positive, on the Fund’s net asset value (“NAV”) than on the NAV of a diversified fund.
ETF Share Price and Net Asset Value Risk—The Fund’s shares are listed for trading on the NYSE Arca, Inc. (the “Exchange”). The Fund’s shares are generally bought and sold in the secondary market at market prices. The NAV of the Fund will fluctuate with changes in the market value of the Fund’s holdings. The Fund’s NAV is calculated once per day, at the end of the day. The market price of a share on the Exchange could be higher than the NAV (premium), or lower than the NAV (discount) and may fluctuate during the trading day. When all or a portion of the Fund’s underlying securities trade in a market that is closed when the market for the Fund’s shares is open, there may be differences between the current value of a security and the last quoted price for that security in the closed local market, which could lead to a deviation between the market value of the Fund’s shares and the Fund’s NAV. Disruptions in the creations and redemptions process or the existence of extreme market volatility could result in the Fund’s shares trading above or below NAV. As the Fund may invest in securities traded on foreign exchanges, Fund shares may trade at a larger premium or discount to the Fund’s NAV per share than shares of other ETFs. In addition, in stressed market conditions, the market for Fund shares may become less liquid in response to deteriorating liquidity in the markets for the Fund’s underlying portfolio holdings.
Authorized Participant Risk—Only a limited number of financial institutions that enter into an authorized participant relationship with the Fund (“Authorized Participants”) may engage in creation or redemption transactions. If the Fund’s Authorized Participants decide not to create or redeem shares, Fund shares may trade at a larger premium or discount to the Fund’s NAV per share, or the Fund could face trading halts or de-listing.
Active Trading Market Risk—There is no guarantee that an active trading market for Fund shares will exist at all times. In times of market stress, markets can suffer erratic or unpredictable trading activity, extraordinary volatility or wide bid/ask spreads, which could cause some market makers and Authorized Participants to reduce their market activity or “step
| | |
| |
18 | AB DISRUPTORS ETF | | abfunds.com |
NOTES TO FINANCIAL STATEMENTS (continued)
away” from making a market in ETF shares. Market makers and Authorized Participants are not obligated to place or execute purchase and redemption orders. This could cause the Fund’s market price to deviate, materially, from the NAV, and reduce the effectiveness of the ETF arbitrage process. Any absence of an active trading market for Fund shares could lead to a heightened risk that there will be a difference between the market price of a Fund share and the underlying value of the Fund share.
Indemnification Risk—In the ordinary course of business, the Fund enters into contracts that contain a variety of indemnifications. The Fund’s maximum exposure under these arrangements is unknown. However, the Fund has not had prior claims or losses pursuant to these indemnification provisions and expects the risk of loss thereunder to be remote. Therefore, the Fund has not accrued any liability in connection with these indemnification provisions.
Management Risk—The Fund is subject to management risk because it is an actively-managed investment fund. The Adviser will apply its investment techniques and risk analyses in making investment decisions, but there is no guarantee that its techniques will produce the intended results. Some of these techniques may incorporate, or rely upon, quantitative models, but there is no guarantee that these models will generate accurate forecasts, reduce risk or otherwise perform as expected.
NOTE G
Joint Credit Facility
A number of open-end mutual funds managed by the Adviser, including the Fund, participate in a $325 million revolving credit facility (the “Facility”) intended to provide short-term financing related to redemptions and other short term liquidity requirements, subject to certain restrictions. Commitment fees related to the Facility are paid by the participating funds and are included in miscellaneous expenses in the statement of operations. The Fund did not utilize the Facility during the year ended November 30, 2024.
NOTE H
Distributions to Shareholders
There were no distributions paid during the fiscal year ended November 30, 2024 and fiscal period ended November 30, 2023.
| | |
| |
| abfunds.com | | AB DISRUPTORS ETF | 19 |
NOTES TO FINANCIAL STATEMENTS (continued)
As of November 30, 2024, the components of accumulated earnings (deficit) on a tax basis were as follows:
| | | | |
Undistributed ordinary income | | $ | 5,293,668 | |
Undistributed capital gains | | | 4,026,879 | (a) |
Unrealized appreciation (depreciation) | | | 97,577,037 | (b) |
| | | | |
Total accumulated earnings (deficit) | | $ | 106,897,584 | |
| | | | |
| (a) | During the fiscal year, the Fund utilized $5,095,970 of capital loss carry forwards to offset current year net realized gains. |
| (b) | The difference between book-basis and tax-basis unrealized appreciation (depreciation) is attributable primarily to the tax deferral of losses on wash sales. |
For tax purposes, net realized capital losses may be carried over to offset future capital gains, if any. Funds are permitted to carry forward capital losses for an indefinite period, and such losses will retain their character as either short-term or long-term capital losses. As of November 30, 2024, the Fund did not have any capital loss carryforwards.
During the current fiscal year, permanent differences primarily due to the utilization of earnings and profits distributed to shareholders on redemption of shares and the tax treatment of gains from a redemption-in-kind resulted in a net decrease in distributable earnings and a net increase in additional paid-in capital. These reclassifications had no effect on net assets.
NOTE I
Recent Accounting Pronouncements
In December 2022, the Financial Accounting Standards Board issued an Accounting Standards Update, ASU 2022-06, “Reference Rate Reform (Topic 848) – Deferral of the Sunset Date of Topic 848”. ASU 2022-06 is an amendment to ASU 2020-04, which provided optional guidance to ease the potential accounting burden due to the discontinuation of the LIBOR and other interbank-offered based reference rates and which was effective as of March 12, 2020 through December 31, 2022. ASU 2022-06 extends the effective period through December 31, 2024. Management is currently evaluating the impact, if any, of applying ASU 2022-06.
In November 2023, the Financial Accounting Standards Board issued Accounting Standards Update, ASU 2023-07, “Segment Reporting (Topic 280)”. ASU 2023-07 requires public entities to provide disclosure of significant segment expenses that are regularly provided to the chief operating decision maker (“CODM”). ASU 2023-07, among other things, (i) requires a single segment public entity to provide all necessary disclosures required by Topic 280 it, (ii) requires a public entity to disclose the title and position of the CODM and an explanation of how the CODM uses the reported measure(s) of segment profit and loss in assessing segment
| | |
| |
20 | AB DISRUPTORS ETF | | abfunds.com |
NOTES TO FINANCIAL STATEMENTS (continued)
performance and deciding how to allocate resources and (iii) provides the ability for a public entity to elect more than one performance measure. ASU 2023-07 is effective for fiscal years beginning after December 15, 2023, and interim periods within fiscal years beginning after December 15, 2024. Early adoption of ASU 2023-07 is permitted. Management is currently evaluating the impact, if any, of applying ASU 2023-07.
NOTE J
Subsequent Events
Management has evaluated subsequent events for possible recognition or disclosure in the financial statements through the date the financial statements are issued. Management has determined that there are no material events that would require disclosure in the Fund’s financial statements through this date.
| | |
| |
| abfunds.com | | AB DISRUPTORS ETF | 21 |
FINANCIAL HIGHLIGHTS
Selected Data For A Share of Capital Stock Outstanding Throughout Each Period
| | | | | | | | |
| | | Year Ended
November 30,
2024 | | | March 22, 2023(a) to
November 30,
2023 | |
| | | | | | | | |
| | | | | | | | |
Net asset value, beginning of period | | | $ 57.73 | | | | $ 50.00 | |
| | | | | | | | |
Income From Investment Operations | | | | | |
| | |
Net investment income (loss)(b)(c) | | | .01 | | | | (.01 | ) |
| | |
Net realized and unrealized gain on investment transactions | | | 25.39 | | | | 7.74 | |
| | | | | | | | |
Net increase in net asset value from operations | | | 25.40 | | | | 7.73 | |
| | | | | | | | |
Net asset value, end of period | | | $ 83.13 | | | | $ 57.73 | |
| | | | | | | | |
| |
Total Return | | | | | |
| | |
Total investment return based on net asset value(d) | | | 43.99 | % | | | 15.46 | % |
| |
Ratios/Supplemental Data | | | | | |
| | |
Net assets, end of period (000’s omitted) | | | $488,790 | | | | $178,392 | |
| |
Ratio to average net assets of: | | | | | |
| | |
Expenses, net of waivers/reimbursements | | | .65 | % | | | .65 | %^ |
| | |
Expenses, before waivers/reimbursements | | | .65 | % | | | .65 | %^ |
| | |
Net investment income (loss)(c) | | | .02 | % | | | (.04 | )%^ |
| | |
Portfolio turnover rate(e) | | | 163 | % | | | 90 | % |
| (a) | Commencement of operations. |
| (b) | Based on average shares outstanding. |
| (c) | Net of expenses waived/reimbursed by the Adviser. |
| (d) | Total investment return is calculated assuming an initial investment made at the net asset value at the beginning of the period, reinvestment of all dividends and distributions at net asset value during the period, and redemption on the last day of the period. Total investment return does not reflect the deduction of taxes that a shareholder would pay on fund distributions or the redemption of fund shares. Total investment return calculated for a period of less than one year is not annualized. |
| (e) | Excludes the value of portfolio securities received or delivered as a result of in-kind purchases or redemptions of the Fund’s capital shares, including ETF Creation Units. |
See notes to financial statements.
| | |
| |
22 | AB DISRUPTORS ETF | | abfunds.com |
REPORT OF INDEPENDENT REGISTERED
PUBLIC ACCOUNTING FIRM
To the Shareholders and the Board of Directors of
AB Disruptors ETF
Opinion on the Financial Statements
We have audited the accompanying statement of assets and liabilities of AB Disruptors ETF (the “Fund”) (one of the funds constituting AB Active ETFs, Inc. (the “Corporation”)), including the portfolio of investments, as of November 30, 2024, and the related statement of operations for the year then ended, the statements of changes in net assets for the year then ended and the period from March 22, 2023 (commencement of operations) to November 30, 2023 and the financial highlights for the year then ended and for the period from March 22, 2023 (commencement of operations) to November 30, 2023 and the related notes (collectively referred to as the “financial statements”). In our opinion, the financial statements present fairly, in all material respects, the financial position of the Fund (one of the funds constituting AB Active ETFs, Inc.) at November 30, 2024, the results of its operations for the year then ended and the changes in its net assets for the year then ended and the period from March 22, 2023 (commencement of operations) to November 30, 2023 and its financial highlights for the year then ended and for the period from March 22, 2023 (commencement of operations) to November 30, 2023, in conformity with U.S. generally accepted accounting principles.
Basis for Opinion
These financial statements are the responsibility of the Corporation’s management. Our responsibility is to express an opinion on the Fund’s financial statements based on our audits. We are a public accounting firm registered with the Public Company Accounting Oversight Board (United States) (“PCAOB”) and are required to be independent with respect to the Corporation in accordance with the U.S. federal securities laws and the applicable rules and regulations of the Securities and Exchange Commission and the PCAOB.
We conducted our audits in accordance with the standards of the PCAOB. Those standards require that we plan and perform the audit to obtain reasonable assurance about whether the financial statements are free of material misstatement, whether due to error or fraud. The Corporation is not required to have, nor were we engaged to perform, an audit of the Corporation’s internal control over financial reporting. As part of our audits, we are required to obtain an understanding of internal control over financial reporting but not for the purpose of expressing an opinion on the effectiveness of the Corporation’s internal control over financial reporting. Accordingly, we express no such opinion.
| | |
| |
| abfunds.com | | AB DISRUPTORS ETF | 23 |
REPORT OF INDEPENDENT REGISTERED
PUBLIC ACCOUNTING FIRM (continued)
Our audits included performing procedures to assess the risks of material misstatement of the financial statements, whether due to error or fraud, and performing procedures that respond to those risks. Such procedures included examining, on a test basis, evidence regarding the amounts and disclosures in the financial statements. Our procedures included confirmation of securities owned as of November 30, 2024, by correspondence with the custodian, brokers and others; when replies were not received from brokers or others, we performed other auditing procedures. Our audits also included evaluating the accounting principles used and significant estimates made by management, as well as evaluating the overall presentation of the financial statements. We believe that our audits provide a reasonable basis for our opinion.

We have served as the auditor of one or more of the AB investment companies since 1968.
New York, New York
January 28, 2025
| | |
| |
24 | AB DISRUPTORS ETF | | abfunds.com |
Information Regarding the Review and Approval of the Fund’s Advisory Agreement
The disinterested directors (the “directors”) of AB Active ETFs, Inc. (the “Company”) unanimously approved the continuance of the Company’s Advisory Agreement with the Adviser in respect of AB Disruptors ETF (the “Fund”) at a meeting held by video conference on May 7-9, 2024 (the “Meeting”).
Prior to approval of the continuance of the Advisory Agreement, the directors had requested from the Adviser, and received and evaluated, extensive materials. They reviewed the proposed continuance of the Advisory Agreement with the Adviser and with experienced counsel who are independent of the Adviser, who advised on the relevant legal standards. The directors also reviewed additional materials, including comparative analytical data prepared by the Senior Vice President of the Fund. The directors also discussed the proposed continuance in private sessions with counsel.
The directors considered their knowledge of the nature and quality of the services provided by the Adviser to the Fund gained from their experience as directors or trustees of most of the registered investment companies advised by the Adviser, including the other series of the Company that are organized as exchange-traded funds (“ETFs”), their overall confidence in the Adviser’s integrity and competence they have gained from that experience, the Adviser’s initiative in identifying and raising potential issues with the directors and its responsiveness, frankness and attention to concerns raised by the directors in the past, including the Adviser’s willingness to consider and implement organizational and operational changes designed to improve investment results and the services provided to the AB Funds. The directors noted that they have four regular meetings each year, at each of which they review extensive materials and information from the Adviser, including information on the investment performance of the Fund and the money market fund advised by the Adviser in which the Fund invests a portion of its assets.
The directors also considered all factors they believed relevant, including the specific matters discussed below. During the course of their deliberations, the directors evaluated, among other things, the reasonableness of the advisory fee. The directors did not identify any particular information that was all-important or controlling, and different directors may have attributed different weights to the various factors. The directors determined that the selection of the Adviser to manage the Fund and the overall arrangements between the Fund and the Adviser, as provided in the Advisory Agreement, including the advisory fee, were fair and reasonable in light of the services performed, expenses incurred and such other matters as the directors considered relevant in the exercise of their business
| | |
| |
| abfunds.com | | AB DISRUPTORS ETF | 25 |
judgment. The material factors and conclusions that formed the basis for the directors’ determinations included the following:
Nature, Extent and Quality of Services Provided
The directors considered the scope and quality of services provided by the Adviser under the Advisory Agreement, including the quality of the investment research capabilities of the Adviser and the other resources it has dedicated to performing services for the Fund. The directors noted that the Adviser from time to time reviews the Fund’s investment strategies and may from time to time propose changes intended to improve the Fund’s relative or absolute performance for the directors’ consideration. They also noted the professional experience and qualifications of the Fund’s portfolio management team and other senior personnel of the Adviser. The directors also considered that the Advisory Agreement provides that the Fund will reimburse the Adviser for the cost to it of providing certain clerical, accounting, administrative and other services to the Fund by employees of the Adviser or its affiliates. Requests for these reimbursements will be subject to the directors’ approval on a quarterly basis. The directors noted that the Adviser does not expect to request such reimbursements. The quality of administrative and other services, including the Adviser’s role in coordinating the activities of the Fund’s other service providers, also was considered. The directors concluded that, overall, they were satisfied with the nature, extent and quality of services provided to the Fund under the Advisory Agreement.
Costs of Services Provided and Profitability
The directors reviewed a schedule of the revenues and expenses and related notes indicating the profitability of the Fund to the Adviser for the period ended December 31, 2023 that had been prepared with an expense allocation methodology arrived at in consultation with an independent consultant at the request of the directors. The directors noted that the assumptions and methods of allocation used by the Adviser in preparing profitability data for ETFs and understood that there are a number of potentially acceptable allocation methodologies for information of this type. The directors noted that the profitability information reflected all revenues and expenses of the Adviser’s relationship with the Fund. The directors recognized that it is difficult to make comparisons of the profitability of the Advisory Agreement with the profitability of ETF advisory contracts for unaffiliated ETFs because comparative information is not generally publicly available and is affected by numerous factors. The directors focused on the profitability of the Adviser’s relationship with the Fund before taxes and distribution expenses. The directors noted that the Fund was not profitable to the Adviser in the period reviewed.
Fall-Out Benefits
The directors considered the other benefits to the Adviser from its relationship with the Fund and the money market fund advised by the Adviser in
| | |
| |
26 | AB DISRUPTORS ETF | | abfunds.com |
which the Fund invests. The directors recognized that the Fund’s unprofitability to the Adviser would be exacerbated without these benefits. The directors understood that the Adviser also might derive reputational and other benefits from its association with the Fund.
Investment Results
In addition to the information reviewed by the directors in connection with the Meeting, the directors receive detailed performance information for the Fund at each regular Board meeting since the Fund’s inception.
At the Meeting, the directors reviewed performance information prepared by the Adviser showing performance of the Fund against a broad-based securities market index for the period from inception. Based on their review, the directors concluded that the Fund’s investment performance was acceptable.
Advisory Fees and Other Expenses
The directors considered the advisory fee rate payable by the Fund to the Adviser and information prepared by an independent service provider (the “15(c) service provider”), concerning advisory fee rates payable by other ETFs in the same category as the Fund. The directors noted that the advisory fee is a unitary fee and that the Adviser pays all expenses of the Fund except for certain expenses payable by the Fund such as interest expense, taxes, extraordinary expenses, and brokerage commissions and other transaction costs. The directors recognized that it is difficult to make comparisons of advisory fees because there are variations in the services that are included in the fees payable by other ETFs. The directors compared the Fund’s contractual advisory fee rate against a peer group median and noted that it was lower than the median.
The directors also considered the Adviser’s fee schedule for other clients utilizing investment strategies similar to those of the Fund. For this purpose, they reviewed the relevant advisory fee information from the Adviser’s Form ADV and in a report from the Fund’s Senior Vice President and noted the differences between the Fund’s fee schedule, on the one hand, and the Adviser’s institutional fee schedule, on the other. The directors noted that the Adviser may, in some cases, agree to fee rates with large institutional clients that are lower than those reviewed by the directors and that they had previously discussed with the Adviser its policies in respect of such arrangements. The directors also compared the advisory fee rate for the Fund with that for another fund advised by the Adviser utilizing similar investment strategies.
The Adviser reviewed with the directors the significantly greater scope of the services it provides to the Fund relative to institutional clients. In this regard, the Adviser noted, among other things, that, compared to institutional accounts, the Fund (i) demands considerably more managerial and
| | |
| |
| abfunds.com | | AB DISRUPTORS ETF | 27 |
administrative resources due to the potential for frequent creations and redemptions of shares; (ii) has more tax and regulatory restrictions and compliance obligations; (iii) must prepare and file or distribute regulatory and other communications about fund operations; and (iv) must provide shareholder servicing to retail investors. The Adviser also reviewed the greater legal risks presented by the large and changing population of Fund shareholders who may assert claims against the Adviser in individual or class actions, and the greater entrepreneurial risk in offering new fund products, which require substantial investment to launch, may not succeed, and generally must be priced to compete with larger, more established funds resulting in lack of profitability to the Adviser until a new fund achieves scale. In light of the substantial differences in services rendered by the Adviser to institutional clients as compared to the Fund, and the different risk profile, the directors considered these fee comparisons inapt and did not place significant weight on them in their deliberations. The directors noted that the unitary fee for the Fund covers additional services provided by third parties and thus is not directly comparable to the Adviser’s institutional fee schedule and the schedule of fees for most other funds advised by the Adviser.
In connection with their review of the Fund’s advisory fee, the directors also considered the total expense ratio of the shares of the Fund in comparison to the medians for a group of similar ETFs (“peer group”) and a larger group of similar ETFs (“peer universe”) selected by the 15(c) service provider. The Fund’s expense ratio was based on the Fund’s latest fiscal year. The directors view expense ratio information as relevant to their evaluation of the Adviser’s services because the Adviser is responsible for coordinating services provided to the Fund by others and, in most cases, the Adviser is responsible for paying for such services under its unitary fee arrangement with the Fund. The directors noted that the Fund’s expense ratio was lower than the median of a peer group and above the median of a peer universe. Based on their review, the directors concluded that the Fund’s expense ratio was acceptable.
Economies of Scale
The directors noted that the advisory fee schedule for the Fund does not contain breakpoints and that they had discussed their strong preference for breakpoints in advisory contracts with the Adviser. The directors took into consideration prior presentations by an independent consultant on economies of scale in the mutual fund industry and for the AB Funds, and presentations from time to time by the Adviser concerning certain of its views on economies of scale. The directors also had requested and received from the Adviser certain updates on economies of scale in advance of the Meeting. The directors believe that economies of scale may be realized (if at all) by the Adviser across a variety of products and services, and not only in respect of a single fund. The directors noted that there is no established methodology for setting breakpoints that give effect
| | |
| |
28 | AB DISRUPTORS ETF | | abfunds.com |
to the fund-specific services provided by a fund’s adviser and to the economies of scale that an adviser may realize in its overall mutual fund business or those components of it which directly or indirectly affect a fund’s operations. The directors observed that in the mutual fund industry as a whole, as well as among ETFs similar to the Fund, there is no uniformity or pattern in the fees and asset levels at which breakpoints (if any) apply. The directors also noted that the advisory agreements for many ETFs do not have breakpoints at all. The directors informed the Adviser that they would monitor the Fund’s asset level and its profitability to the Adviser and anticipated revisiting the question of breakpoints in the future if circumstances warranted doing so.
| | |
| |
| abfunds.com | | AB DISRUPTORS ETF | 29 |
NOTES
| | |
| |
30 | AB DISRUPTORS ETF | | abfunds.com |
NOTES
| | |
| |
| abfunds.com | | AB DISRUPTORS ETF | 31 |
NOTES
| | |
| |
32 | AB DISRUPTORS ETF | | abfunds.com |
AB DISRUPTORS ETF
66 Hudson Boulevard East
New York, NY 10001
800 221 5672
ETF-DR-0151-1124 
NOV 11.30.24

ANNUAL FINANCIAL STATEMENTS AND ADDITIONAL INFORMATION
AB HIGH YIELD ETF
(NYSE: HYFI)

| | |
| |
| Investment Products Offered | | • Are Not FDIC Insured • May Lose Value • Are Not Bank Guaranteed |
Investors should consider the investment objectives, risks, charges and expenses of the Fund carefully before investing. For copies of our prospectus or summary prospectus, which contain this and other information, visit us online at www.abfunds.com or contact your AB representative. Please read the prospectus and/or summary prospectus carefully before investing.
This shareholder report must be preceded or accompanied by the Fund’s prospectus for individuals who are not current shareholders of the Fund.
You may obtain a description of the Fund’s proxy voting policies and procedures, and information regarding how the Fund voted proxies relating to portfolio securities during the most recent 12-month period ended June 30, without charge. Simply visit AB’s website at www.abfunds.com, or go to the Securities and Exchange Commission’s (the “Commission”) website at www.sec.gov, or call AB at (800) 227 4618.
The Fund files its complete schedule of portfolio holdings with the Commission for the first and third quarters of each fiscal year as an exhibit to its reports on Form N-PORT. The Fund’s Form N-PORT reports are available on the Commission’s website at www.sec.gov. AB publishes full portfolio holdings for the Fund daily at www.abfunds.com.
Foreside Fund Services, LLC (“Foreside”) is the distributor of the fund. Foreside is a member of FINRA.
The [A/B] logo and AllianceBernstein® are registered trademarks used by permission of the owner, AllianceBernstein L.P.
PORTFOLIO OF INVESTMENTS
November 30, 2024
| | | | | | | | | | | | |
| | | | | | Principal
Amount
(000) | | | U.S. $ Value | |
| |
CORPORATES - NON-INVESTMENT GRADE – 78.0% | | | | | | | | | | | | |
Industrial – 69.9% | | | | | | | | | | | | |
Basic – 5.3% | | | | | | | | | | | | |
Alcoa Nederland Holding BV
4.125%, 03/31/2029(a) | | | U.S.$ | | | | 685 | | | $ | 648,428 | |
ASP Unifrax Holdings, Inc.
7.10% (5.85% Cash and 1.25% PIK), 09/30/2029(a)(b) | | | | | | | 277 | | | | 160,560 | |
10.425% (10.425% Cash or 11.175% PIK), 09/30/2029(a)(b) | | | | | | | 618 | | | | 623,348 | |
Axalta Coating Systems LLC
3.375%, 02/15/2029(a) | | | | | | | 408 | | | | 375,042 | |
Axalta Coating Systems LLC/Axalta Coating Systems Dutch Holding B BV
4.75%, 06/15/2027(a) | | | | | | | 367 | | | | 360,086 | |
Cleveland-Cliffs, Inc.
4.625%, 03/01/2029(a) | | | | | | | 6 | | | | 5,658 | |
6.75%, 04/15/2030(a) | | | | | | | 175 | | | | 175,996 | |
Clydesdale Acquisition Holdings, Inc.
6.625%, 04/15/2029(a) | | | | | | | 234 | | | | 235,210 | |
Crown Americas LLC/Crown Americas Capital Corp. VI
4.75%, 02/01/2026 | | | | | | | 807 | | | | 801,052 | |
CVR Partners LP/CVR Nitrogen Finance Corp.
6.125%, 06/15/2028(a) | | | | | | | 623 | | | | 606,447 | |
Domtar Corp.
6.75%, 10/01/2028(a) | | | | | | | 52 | | | | 48,124 | |
ERP Iron Ore LLC
9.039%, 12/31/2019(c)(d)(e)(f) | | | | | | | 5 | | | | – 0 | – |
FMG Resources (August 2006) Pty Ltd.
4.375%, 04/01/2031(a) | | | | | | | 372 | | | | 340,540 | |
4.50%, 09/15/2027(a) | | | | | | | 31 | | | | 30,143 | |
5.875%, 04/15/2030(a) | | | | | | | 8 | | | | 7,942 | |
Graham Packaging Co., Inc.
7.125%, 08/15/2028(a) | | | | | | | 257 | | | | 253,600 | |
Graphic Packaging International LLC
3.50%, 03/15/2028(a) | | | | | | | 390 | | | | 366,436 | |
3.75%, 02/01/2030(a) | | | | | | | 23 | | | | 21,156 | |
4.75%, 07/15/2027(a) | | | | | | | 28 | | | | 27,437 | |
Hudbay Minerals, Inc.
4.50%, 04/01/2026(a) | | | | | | | 140 | | | | 137,942 | |
INEOS Quattro Finance 2 PLC
6.75%, 04/15/2030(a) | | | EUR | | | | 141 | | | | 152,543 | |
Intelligent Packaging Ltd. Finco, Inc./Intelligent Packaging Ltd. Co-Issuer LLC
6.00%, 09/15/2028(a) | | | U.S.$ | | | | 125 | | | | 123,927 | |
| | |
| |
| abfunds.com | | AB HIGH YIELD ETF | 1 |
PORTFOLIO OF INVESTMENTS (continued)
| | | | | | | | | | | | |
| | | | | | Principal
Amount
(000) | | | U.S. $ Value | |
| |
LABL, Inc.
5.875%, 11/01/2028(a) | | | U.S.$ | | | | 449 | | | $ | 402,124 | |
Magnetation LLC/Mag Finance Corp.
11.00%, 05/15/2018(c)(d)(e)(f)(g) | | | | | | | 60 | | | | – 0 | – |
Mineral Resources Ltd.
8.00%, 11/01/2027(a) | | | | | | | 117 | | | | 119,190 | |
8.50%, 05/01/2030(a) | | | | | | | 471 | | | | 481,550 | |
9.25%, 10/01/2028(a) | | | | | | | 299 | | | | 313,478 | |
Novelis Corp.
3.25%, 11/15/2026(a) | | | | | | | 128 | | | | 123,295 | |
Olympus Water US Holding Corp.
9.75%, 11/15/2028(a) | | | | | | | 266 | | | | 283,043 | |
Roller Bearing Co. of America, Inc.
4.375%, 10/15/2029(a) | | | | | | | 12 | | | | 11,322 | |
SCIH Salt Holdings, Inc.
4.875%, 05/01/2028(a) | | | | | | | 480 | | | | 457,790 | |
SCIL IV LLC/SCIL USA Holdings LLC
5.375%, 11/01/2026(a) | | | | | | | 431 | | | | 426,052 | |
Sealed Air Corp./Sealed Air Corp. US
6.125%, 02/01/2028(a) | | | | | | | 236 | | | | 238,249 | |
SunCoke Energy, Inc.
4.875%, 06/30/2029(a) | | | | | | | 37 | | | | 34,168 | |
Vibrantz Technologies, Inc.
9.00%, 02/15/2030(a) | | | | | | | 354 | | | | 334,983 | |
WR Grace Holdings LLC
4.875%, 06/15/2027(a) | | | | | | | 166 | | | | 163,273 | |
5.625%, 08/15/2029(a) | | | | | | | 372 | | | | 347,935 | |
| | | | | | | | | | | | |
| | | | | | | | | | | 9,238,069 | |
| | | | | | | | | | | | |
Capital Goods – 8.1% | | | | | | | | | | | | |
Arcosa, Inc.
6.875%, 08/15/2032(a) | | | | | | | 84 | | | | 86,602 | |
ARD Finance SA
5.00% (5.00% Cash or 5.75% PIK), 06/30/2027(a)(b) | | | EUR | | | | 120 | | | | 20,472 | |
Ardagh Metal Packaging Finance USA LLC/Ardagh Metal Packaging Finance PLC
3.25%, 09/01/2028(a) | | | U.S.$ | | | | 368 | | | | 331,410 | |
6.00%, 06/15/2027(a) | | | | | | | 238 | | | | 236,760 | |
Ardagh Packaging Finance PLC/Ardagh Holdings USA, Inc.
4.125%, 08/15/2026(a) | | | | | | | 205 | | | | 177,132 | |
Artera Services LLC
8.50%, 02/15/2031(a) | | | | | | | 220 | | | | 218,559 | |
Ball Corp.
2.875%, 08/15/2030 | | | | | | | 740 | | | | 649,779 | |
Bombardier, Inc.
7.25%, 07/01/2031(a) | | | | | | | 328 | | | | 339,204 | |
7.50%, 02/01/2029(a) | | | | | | | 197 | | | | 205,305 | |
| | |
| |
2 | AB HIGH YIELD ETF | | abfunds.com |
PORTFOLIO OF INVESTMENTS (continued)
| | | | | | | | | | |
| | | | | Principal
Amount
(000) | | | U.S. $ Value | |
| |
7.875%, 04/15/2027(a) | | U.S.$ | | | 65 | | | $ | 65,149 | |
8.75%, 11/15/2030(a) | | | | | 567 | | | | 613,114 | |
Brand Industrial Services, Inc.
10.375%, 08/01/2030(a) | | | | | 146 | | | | 154,772 | |
Calderys Financing LLC
11.25%, 06/01/2028(a) | | | | | 307 | | | | 329,654 | |
Camelot Return Merger Sub, Inc.
8.75%, 08/01/2028(a) | | | | | 696 | | | | 684,439 | |
Clean Harbors, Inc.
4.875%, 07/15/2027(a) | | | | | 301 | | | | 295,889 | |
5.125%, 07/15/2029(a) | | | | | 11 | | | | 10,743 | |
6.375%, 02/01/2031(a) | | | | | 309 | | | | 314,550 | |
Crown Cork & Seal Co., Inc.
7.375%, 12/15/2026 | | | | | 20 | | | | 20,833 | |
Eco Material Technologies, Inc.
7.875%, 01/31/2027(a) | | | | | 568 | | | | 575,588 | |
EnerSys
4.375%, 12/15/2027(a) | | | | | 80 | | | | 76,419 | |
6.625%, 01/15/2032(a) | | | | | 175 | | | | 178,292 | |
Enviri Corp.
5.75%, 07/31/2027(a) | | | | | 151 | | | | 145,007 | |
Esab Corp.
6.25%, 04/15/2029(a) | | | | | 287 | | | | 292,528 | |
GFL Environmental, Inc.
5.125%, 12/15/2026(a) | | | | | 627 | | | | 625,138 | |
Griffon Corp.
5.75%, 03/01/2028 | | | | | 305 | | | | 301,215 | |
Husky Injection Molding Systems Ltd./Titan Co-Borrower LLC
9.00%, 02/15/2029(a) | | | | | 46 | | | | 47,808 | |
LSB Industries, Inc.
6.25%, 10/15/2028(a)(h) | | | | | 337 | | | | 327,466 | |
Madison IAQ LLC
5.875%, 06/30/2029(a) | | | | | 740 | | | | 706,730 | |
Maxim Crane Works Holdings Capital LLC
11.50%, 09/01/2028(a) | | | | | 50 | | | | 53,696 | |
MIWD Holdco II LLC/MIWD Finance Corp.
5.50%, 02/01/2030(a) | | | | | 677 | | | | 649,419 | |
Moog, Inc.
4.25%, 12/15/2027(a) | | | | | 550 | | | | 528,979 | |
Mueller Water Products, Inc.
4.00%, 06/15/2029(a) | | | | | 591 | | | | 551,255 | |
Oscar AcquisitionCo LLC/Oscar Finance, Inc.
9.50%, 04/15/2030(a) | | | | | 60 | | | | 57,138 | |
Silgan Holdings, Inc.
4.125%, 02/01/2028 | | | | | 529 | | | | 508,940 | |
| | |
| |
| abfunds.com | | AB HIGH YIELD ETF | 3 |
PORTFOLIO OF INVESTMENTS (continued)
| | | | | | | | | | | | |
| | | | | | Principal
Amount
(000) | | | U.S. $ Value | |
| |
Spirit AeroSystems, Inc.
9.375%, 11/30/2029(a) | | | U.S.$ | | | | 197 | | | $ | 212,067 | |
TransDigm, Inc.
4.625%, 01/15/2029 | | | | | | | 923 | | | | 875,927 | |
4.875%, 05/01/2029 | | | | | | | 355 | | | | 338,304 | |
6.00%, 01/15/2033(a) | | | | | | | 449 | | | | 448,937 | |
6.375%, 03/01/2029(a) | | | | | | | 275 | | | | 279,282 | |
6.75%, 08/15/2028(a) | | | | | | | 564 | | | | 575,534 | |
6.875%, 12/15/2030(a) | | | | | | | 150 | | | | 154,488 | |
Trinity Industries, Inc.
7.75%, 07/15/2028(a) | | | | | | | 486 | | | | 506,879 | |
Triumph Group, Inc.
9.00%, 03/15/2028(a) | | | | | | | 356 | | | | 373,586 | |
WESCO Distribution, Inc.
6.375%, 03/15/2029(a) | | | | | | | 106 | | | | 108,666 | |
| | | | | | | | | | | | |
| | | | | | | | | | | 14,253,654 | |
| | | | | | | | | | | | |
Communications - Media – 8.5% | | | | | | | | | | | | |
Advantage Sales & Marketing, Inc.
6.50%, 11/15/2028(a) | | | | | | | 96 | | | | 91,936 | |
AMC Networks, Inc.
4.25%, 02/15/2029 | | | | | | | 180 | | | | 136,800 | |
10.25%, 01/15/2029(a) | | | | | | | 247 | | | | 262,899 | |
Arches Buyer, Inc.
6.125%, 12/01/2028(a) | | | | | | | 181 | | | | 163,899 | |
Banijay Entertainment SAS
8.125%, 05/01/2029(a) | | | | | | | 246 | | | | 256,519 | |
CCO Holdings LLC/CCO Holdings Capital Corp.
4.25%, 02/01/2031(a) | | | | | | | 451 | | | | 404,055 | |
4.25%, 01/15/2034(a) | | | | | | | 642 | | | | 535,710 | |
4.50%, 08/15/2030(a) | | | | | | | 426 | | | | 390,915 | |
4.50%, 05/01/2032 | | | | | | | 691 | | | | 610,167 | |
4.50%, 06/01/2033(a) | | | | | | | 299 | | | | 259,320 | |
4.75%, 03/01/2030(a) | | | | | | | 40 | | | | 37,229 | |
4.75%, 02/01/2032(a) | | | | | | | 390 | | | | 350,926 | |
Clear Channel Outdoor Holdings, Inc.
9.00%, 09/15/2028(a) | | | | | | | 238 | | | | 252,418 | |
CSC Holdings LLC
4.50%, 11/15/2031(a) | | | | | | | 150 | | | | 112,335 | |
4.625%, 12/01/2030(a) | | | | | | | 729 | | | | 412,556 | |
5.375%, 02/01/2028(a) | | | | | | | 204 | | | | 176,754 | |
5.50%, 04/15/2027(a) | | | | | | | 356 | | | | 321,553 | |
6.50%, 02/01/2029(a) | | | | | | | 252 | | | | 216,244 | |
7.50%, 04/01/2028(a) | | | | | | | 200 | | | | 145,194 | |
11.25%, 05/15/2028(a) | | | | | | | 449 | | | | 443,670 | |
11.75%, 01/31/2029(a) | | | | | | | 536 | | | | 531,364 | |
| | |
| |
4 | AB HIGH YIELD ETF | | abfunds.com |
PORTFOLIO OF INVESTMENTS (continued)
| | | | | | | | | | |
| | | | | Principal
Amount
(000) | | | U.S. $ Value | |
| |
DISH DBS Corp.
5.125%, 06/01/2029 | | U.S.$ | | | 829 | | | $ | 548,292 | |
5.25%, 12/01/2026(a) | | | | | 743 | | | | 684,325 | |
5.75%, 12/01/2028(a) | | | | | 451 | | | | 394,111 | |
7.375%, 07/01/2028 | | | | | 71 | | | | 53,623 | |
Gray Television, Inc.
4.75%, 10/15/2030(a) | | | | | 125 | | | | 73,860 | |
5.375%, 11/15/2031(a) | | | | | 17 | | | | 10,042 | |
7.00%, 05/15/2027(a) | | | | | 173 | | | | 169,488 | |
iHeartCommunications, Inc.
5.25%, 08/15/2027(a) | | | | | 10 | | | | 6,961 | |
6.375%, 05/01/2026 | | | | | 322 | | | | 280,323 | |
Lamar Media Corp.
4.875%, 01/15/2029 | | | | | 8 | | | | 7,779 | |
LCPR Senior Secured Financing DAC
5.125%, 07/15/2029(a) | | | | | 654 | | | | 536,411 | |
6.75%, 10/15/2027(a) | | | | | 200 | | | | 182,090 | |
National CineMedia LLC
5.75%, 08/15/2026(c)(e)(f)(i) | | | | | 21 | | | | – 0 | – |
Neptune Bidco US, Inc.
9.29%, 04/15/2029(a) | | | | | 926 | | | | 858,828 | |
Nexstar Media, Inc.
4.75%, 11/01/2028(a) | | | | | 655 | | | | 618,261 | |
Paramount Global
6.375%, 03/30/2062 | | | | | 193 | | | | 185,956 | |
Radiate Holdco LLC/Radiate Finance, Inc.
4.50%, 09/15/2026(a) | | | | | 214 | | | | 184,614 | |
Sinclair Television Group, Inc.
5.50%, 03/01/2030(a) | | | | | 96 | | | | 64,884 | |
Sirius XM Radio, Inc.
4.125%, 07/01/2030(a) | | | | | 163 | | | | 147,059 | |
TEGNA, Inc.
4.625%, 03/15/2028 | | | | | 966 | | | | 924,076 | |
Townsquare Media, Inc.
6.875%, 02/01/2026(a) | | | | | 43 | | | | 42,942 | |
Univision Communications, Inc.
4.50%, 05/01/2029(a) | | | | | 254 | | | | 228,102 | |
6.625%, 06/01/2027(a) | | | | | 577 | | | | 574,888 | |
7.375%, 06/30/2030(a) | | | | | 332 | | | | 320,121 | |
8.00%, 08/15/2028(a) | | | | | 78 | | | | 79,661 | |
8.50%, 07/31/2031(a) | | | | | 75 | | | | 74,500 | |
Urban One, Inc.
7.375%, 02/01/2028(a) | | | | | 105 | | | | 68,441 | |
Virgin Media Finance PLC
5.00%, 07/15/2030(a) | | | | | 400 | | | | 341,624 | |
Virgin Media Secured Finance PLC
4.50%, 08/15/2030(a) | | | | | 236 | | | | 207,512 | |
| | |
| |
| abfunds.com | | AB HIGH YIELD ETF | 5 |
PORTFOLIO OF INVESTMENTS (continued)
| | | | | | | | | | | | |
| | | | | | Principal
Amount
(000) | | | U.S. $ Value | |
| |
VZ Secured Financing BV
5.00%, 01/15/2032(a) | | | U.S.$ | | | | 318 | | | $ | 284,257 | |
Ziggo Bond Co. BV
5.125%, 02/28/2030(a) | | | | | | | 574 | | | | 519,062 | |
| | | | | | | | | | | | |
| | | | | | | | | | | 14,784,556 | |
| | | | | | | | | | | | |
Communications - Telecommunications – 4.2% | | | | | | | | | | | | |
Altice Financing SA
5.75%, 08/15/2029(a) | | | | | | | 544 | | | | 415,159 | |
Altice France Holding SA
10.50%, 05/15/2027(a) | | | | | | | 252 | | | | 71,991 | |
Altice France SA
3.375%, 01/15/2028(a) | | | EUR | | | | 245 | | | | 197,446 | |
5.125%, 07/15/2029(a) | | | U.S.$ | | | | 428 | | | | 326,145 | |
5.50%, 01/15/2028(a) | | | | | | | 456 | | | | 347,983 | |
5.50%, 10/15/2029(a) | | | | | | | 524 | | | | 402,830 | |
8.125%, 02/01/2027(a) | | | | | | | 354 | | | | 297,342 | |
Cogent Communications Group LLC
3.50%, 05/01/2026(a) | | | | | | | 153 | | | | 148,424 | |
EchoStar Corp.
3.875% (3.875% Cash or 3.875% PIK), 11/30/2030(b)(h)(j) | | | | | | | 11 | | | | 12,021 | |
6.75%, 11/30/2030 | | | | | | | 13 | | | | 11,367 | |
10.75%, 11/30/2029 | | | | | | | 822 | | | | 889,314 | |
Frontier Communications Holdings LLC
6.00%, 01/15/2030(a) | | | | | | | 498 | | | | 499,728 | |
6.75%, 05/01/2029(a) | | | | | | | 683 | | | | 691,688 | |
Intelsat Jackson Holdings SA
6.50%, 03/15/2030(a) | | | | | | | 233 | | | | 217,946 | |
Level 3 Financing, Inc.
10.75%, 12/15/2030(a) | | | | | | | 373 | | | | 421,181 | |
11.00%, 11/15/2029(a) | | | | | | | 314 | | | | 356,797 | |
Lorca Telecom Bondco SA
4.00%, 09/18/2027(a) | | | EUR | | | | 142 | | | | 149,647 | |
Nexstar Media, Inc.
5.625%, 07/15/2027(a) | | | U.S.$ | | | | 33 | | | | 32,530 | |
Optics Bidco SpA
7.20%, 07/18/2036(a) | | | | | | | 564 | | | | 579,741 | |
7.721%, 06/04/2038(a) | | | | | | | 205 | | | | 217,017 | |
Vmed O2 UK Financing I PLC
4.25%, 01/31/2031(a) | | | | | | | 385 | | | | 332,675 | |
4.75%, 07/15/2031(a) | | | | | | | 397 | | | | 349,916 | |
7.75%, 04/15/2032(a) | | | | | | | 200 | | | | 203,088 | |
Windstream Escrow LLC/Windstream Escrow Finance Corp.
8.25%, 10/01/2031(a) | | | | | | | 155 | | | | 161,834 | |
| | | | | | | | | | | | |
| | | | | | | | | | | 7,333,810 | |
| | | | | | | | | | | | |
| | |
| |
6 | AB HIGH YIELD ETF | | abfunds.com |
PORTFOLIO OF INVESTMENTS (continued)
| | | | | | | | | | | | |
| | | | | | Principal
Amount
(000) | | | U.S. $ Value | |
| |
Consumer Cyclical - Automotive – 2.5% | | | | | | | | | | | | |
Adient Global Holdings Ltd.
8.25%, 04/15/2031(a) | | | U.S.$ | | | | 178 | | | $ | 186,031 | |
Allison Transmission, Inc.
3.75%, 01/30/2031(a) | | | | | | | 328 | | | | 294,403 | |
5.875%, 06/01/2029(a) | | | | | | | 376 | | | | 378,327 | |
American Axle & Manufacturing, Inc.
6.875%, 07/01/2028 | | | | | | | 86 | | | | 85,912 | |
Aston Martin Capital Holdings Ltd.
10.00%, 03/31/2029(a) | | | | | | | 537 | | | | 527,130 | |
Dana, Inc.
4.25%, 09/01/2030 | | | | | | | 20 | | | | 17,867 | |
Exide Technologies
(Exchange Priority)
11.00%, 10/31/2024(c)(d)(e)(f)(g)(i) | | | | | | | 32 | | | | – 0 | – |
Exide Technologies
(First Lien)
11.00%, 10/31/2024(c)(d)(e)(f)(g)(i) | | | | | | | 13 | | | | – 0 | – |
Garrett Motion Holdings, Inc./Garrett LX I SARL
7.75%, 05/31/2032(a) | | | | | | | 488 | | | | 491,845 | |
IHO Verwaltungs GmbH
6.75% (6.75% Cash or 7.5% PIK), 11/15/2029(a)(b) | | | EUR | | | | 144 | | | | 155,209 | |
7.00% (7.00% Cash or 7.75% PIK), 11/15/2031(a)(b) | | | | | | | 144 | | | | 155,369 | |
7.75% (7.75% Cash or 8.5% PIK), 11/15/2030(a)(b) | | | U.S.$ | | | | 200 | | | | 200,458 | |
Mclaren Finance PLC
7.50%, 08/01/2026(a) | | | | | | | 200 | | | | 194,580 | |
PM General Purchaser LLC
9.50%, 10/01/2028(a) | | | | | | | 494 | | | | 493,600 | |
Real Hero Merger Sub 2, Inc.
6.25%, 02/01/2029(a) | | | | | | | 130 | | | | 117,309 | |
Tenneco, Inc.
8.00%, 11/17/2028(a) | | | | | | | 442 | | | | 419,595 | |
Titan International, Inc.
7.00%, 04/30/2028 | | | | | | | 19 | | | | 18,661 | |
ZF North America Capital, Inc.
6.75%, 04/23/2030(a) | | | | | | | 303 | | | | 296,089 | |
6.875%, 04/14/2028(a) | | | | | | | 214 | | | | 215,498 | |
7.125%, 04/14/2030(a) | | | | | | | 158 | | | | 157,171 | |
| | | | | | | | | | | | |
| | | | | | | | | | | 4,405,054 | |
| | | | | | | | | | | | |
Consumer Cyclical - Entertainment – 3.6% | | | | | | | | | | | | |
Boyne USA, Inc.
4.75%, 05/15/2029(a) | | | | | | | 379 | | | | 362,195 | |
Carnival Corp.
5.75%, 03/01/2027(a) | | | | | | | 395 | | | | 396,260 | |
10.50%, 06/01/2030(a) | | | | | | | 135 | | | | 144,847 | |
| | |
| |
| abfunds.com | | AB HIGH YIELD ETF | 7 |
PORTFOLIO OF INVESTMENTS (continued)
| | | | | | | | | | | | |
| | | | | | Principal
Amount
(000) | | | U.S. $ Value | |
| |
Cedar Fair LP/Canada’s Wonderland Co./Magnum Management Corp./Millennium Op
5.25%, 07/15/2029 | | | U.S.$ | | | | 25 | | | $ | 24,262 | |
5.375%, 04/15/2027 | | | | | | | 377 | | | | 374,761 | |
Lindblad Expeditions LLC
6.75%, 02/15/2027(a) | | | | | | | 41 | | | | 41,116 | |
Live Nation Entertainment, Inc.
3.75%, 01/15/2028(a) | | | | | | | 232 | | | | 220,792 | |
6.50%, 05/15/2027(a) | | | | | | | 262 | | | | 266,116 | |
Merlin Entertainments Group US Holdings, Inc.
7.375%, 02/15/2031(a) | | | | | | | 601 | | | | 587,616 | |
Motion Finco SARL
7.375%, 06/15/2030(a) | | | EUR | | | | 219 | | | | 237,394 | |
NCL Corp., Ltd.
3.625%, 12/15/2024(a) | | | U.S.$ | | | | 48 | | | | 47,926 | |
5.875%, 03/15/2026(a) | | | | | | | 832 | | | | 832,291 | |
5.875%, 02/15/2027(a) | | | | | | | 13 | | | | 13,033 | |
Royal Caribbean Cruises Ltd.
4.25%, 07/01/2026(a) | | | | | | | 633 | | | | 623,600 | |
5.375%, 07/15/2027(a) | | | | | | | 513 | | | | 512,348 | |
5.50%, 08/31/2026(a) | | | | | | | 272 | | | | 272,403 | |
5.50%, 04/01/2028(a) | | | | | | | 443 | | | | 443,022 | |
SeaWorld Parks & Entertainment, Inc.
5.25%, 08/15/2029(a) | | | | | | | 368 | | | | 355,230 | |
Viking Cruises Ltd.
5.875%, 09/15/2027(a) | | | | | | | 24 | | | | 23,882 | |
7.00%, 02/15/2029(a) | | | | | | | 50 | | | | 50,492 | |
Viking Ocean Cruises Ship VII Ltd.
5.625%, 02/15/2029(a) | | | | | | | 29 | | | | 28,667 | |
VOC Escrow Ltd.
5.00%, 02/15/2028(a) | | | | | | | 431 | | | | 421,018 | |
| | | | | | | | | | | | |
| | | | | | | | | | | 6,279,271 | |
| | | | | | | | | | | | |
Consumer Cyclical - Other – 4.7% | | | | | | | | | | | | |
Affinity Interactive
6.875%, 12/15/2027(a) | | | | | | | 54 | | | | 43,219 | |
AmeriTex HoldCo Intermediate LLC
10.25%, 10/15/2028(a) | | | | | | | 63 | | | | 67,029 | |
Brookfield Residential Properties, Inc./Brookfield Residential US LLC
6.25%, 09/15/2027(a) | | | | | | | 149 | | | | 148,660 | |
Builders FirstSource, Inc. | | | | | | | | | | | | |
4.25%, 02/01/2032(a) | | | | | | | 641 | | | | 584,573 | |
5.00%, 03/01/2030(a) | | | | | | | 262 | | | | 253,092 | |
6.375%, 06/15/2032(a) | | | | | | | 115 | | | | 117,544 | |
CD&R Smokey Buyer, Inc./Radio Systems Corp.
9.50%, 10/15/2029(a) | | | | | | | 199 | | | | 201,271 | |
| | |
| |
8 | AB HIGH YIELD ETF | | abfunds.com |
PORTFOLIO OF INVESTMENTS (continued)
| | | | | | | | | | |
| | | | | Principal
Amount
(000) | | | U.S. $ Value | |
| |
Century Communities, Inc.
3.875%, 08/15/2029(a) | | U.S.$ | | | 100 | | | $ | 91,074 | |
Churchill Downs, Inc.
4.75%, 01/15/2028(a) | | | | | 544 | | | | 531,145 | |
5.50%, 04/01/2027(a) | | | | | 398 | | | | 396,695 | |
Cirsa Finance International SARL
6.50%, 03/15/2029(a) | | EUR | | | 220 | | | | 244,782 | |
Forestar Group, Inc.
3.85%, 05/15/2026(a) | | U.S.$ | | | 41 | | | | 40,171 | |
Great Canadian Gaming Corp.
8.75%, 11/15/2029(a) | | | | | 147 | | | | 152,777 | |
Hilton Domestic Operating Co., Inc.
3.625%, 02/15/2032(a) | | | | | 736 | | | | 650,175 | |
3.75%, 05/01/2029(a) | | | | | 259 | | | | 241,833 | |
4.00%, 05/01/2031(a) | | | | | 150 | | | | 137,420 | |
4.875%, 01/15/2030 | | | | | 17 | | | | 16,564 | |
5.75%, 05/01/2028(a) | | | | | 11 | | | | 11,016 | |
5.875%, 04/01/2029(a) | | | | | 419 | | | | 422,926 | |
6.125%, 04/01/2032(a) | | | | | 31 | | | | 31,357 | |
Hilton Grand Vacations Borrower Escrow LLC/Hilton Grand Vacations Borrower Esc
4.875%, 07/01/2031(a) | | | | | 549 | | | | 495,983 | |
Installed Building Products, Inc.
5.75%, 02/01/2028(a) | | | | | 70 | | | | 69,324 | |
LGI Homes, Inc.
7.00%, 11/15/2032(a) | | | | | 191 | | | | 192,841 | |
Light & Wonder International, Inc.
7.00%, 05/15/2028(a) | | | | | 9 | | | | 9,054 | |
Marriott Ownership Resorts, Inc.
4.50%, 06/15/2029(a) | | | | | 644 | | | | 607,079 | |
MGM Resorts International
5.50%, 04/15/2027 | | | | | 249 | | | | 248,953 | |
Mohegan Tribal Gaming Authority
8.00%, 02/01/2026(a) | | | | | 155 | | | | 154,086 | |
Premier Entertainment Sub LLC/Premier Entertainment Finance Corp.
5.625%, 09/01/2029(a) | | | | | 20 | | | | 14,724 | |
Shea Homes LP/Shea Homes Funding Corp.
4.75%, 04/01/2029 | | | | | 20 | | | | 19,161 | |
Standard Industries, Inc./NY
4.75%, 01/15/2028(a) | | | | | 115 | | | | 111,599 | |
Sugarhouse HSP Gaming Prop Mezz LP/Sugarhouse HSP Gaming Finance Corp.
5.875%, 05/15/2025(a) | | | | | 16 | | | | 15,980 | |
Taylor Morrison Communities, Inc.
5.75%, 01/15/2028(a) | | | | | 8 | | | | 8,048 | |
5.875%, 06/15/2027(a) | | | | | 588 | | | | 594,462 | |
| | |
| |
| abfunds.com | | AB HIGH YIELD ETF | 9 |
PORTFOLIO OF INVESTMENTS (continued)
| | | | | | | | | | | | |
| | | | | | Principal
Amount
(000) | | | U.S. $ Value | |
| |
Thor Industries, Inc.
4.00%, 10/15/2029(a) | | | U.S.$ | | | | 607 | | | $ | 557,056 | |
Travel + Leisure Co.
4.50%, 12/01/2029(a) | | | | | | | 86 | | | | 81,159 | |
4.625%, 03/01/2030(a) | | | | | | | 12 | | | | 11,250 | |
6.00%, 04/01/2027(h) | | | | | | | 325 | | | | 327,896 | |
6.625%, 07/31/2026(a) | | | | | | | 359 | | | | 363,301 | |
| | | | | | | | | | | | |
| | | | | | | | | | | 8,265,279 | |
| | | | | | | | | | | | |
Consumer Cyclical - Restaurants – 0.6% | | | | | | | | | | | | |
1011778 BC ULC/New Red Finance, Inc.
3.50%, 02/15/2029(a) | | | | | | | 171 | | | | 158,175 | |
4.00%, 10/15/2030(a) | | | | | | | 87 | | | | 78,958 | |
4.375%, 01/15/2028(a) | | | | | | | 884 | | | | 850,664 | |
Papa John’s International, Inc.
3.875%, 09/15/2029(a) | | | | | | | 22 | | | | 19,977 | |
| | | | | | | | | | | | |
| | | | | | | | | | | 1,107,774 | |
| | | | | | | | | | | | |
Consumer Cyclical - Retailers – 3.6% | | | | | | | | | | | | |
Asbury Automotive Group, Inc.
4.50%, 03/01/2028 | | | | | | | 230 | | | | 223,112 | |
4.625%, 11/15/2029(a) | | | | | | | 248 | | | | 235,615 | |
BCPE Ulysses Intermediate, Inc.
7.75% (7.75% Cash or 8.50% PIK), 04/01/2027(a)(b) | | | | | | | 28 | | | | 27,399 | |
Beacon Roofing Supply, Inc.
6.50%, 08/01/2030(a) | | | | | | | 398 | | | | 408,193 | |
Carvana Co.
5.50%, 04/15/2027(a) | | | | | | | 39 | | | | 35,934 | |
12.00% (9.00% Cash or 12.00% PIK), 12/01/2028(a)(b)(h) | | | | | | | 118 | | | | 125,678 | |
13.00% (11.00% Cash or 13.00% PIK), 06/01/2030(a)(b)(h) | | | | | | | 824 | | | | 904,489 | |
14.00%, 06/01/2031(a)(h) | | | | | | | 50 | | | | 59,837 | |
eG Global Finance PLC
12.00%, 11/30/2028(a) | | | | | | | 204 | | | | 227,680 | |
Foundation Building Materials, Inc.
6.00%, 03/01/2029(a) | | | | | | | 29 | | | | 25,936 | |
Global Auto Holdings Ltd./AAG FH UK Ltd.
8.375%, 01/15/2029(a) | | | | | | | 288 | | | | 266,057 | |
8.75%, 01/15/2032(a) | | | | | | | 263 | | | | 232,313 | |
11.50%, 08/15/2029(a) | | | | | | | 255 | | | | 259,098 | |
Group 1 Automotive, Inc.
4.00%, 08/15/2028(a) | | | | | | | 376 | | | | 355,425 | |
Hanesbrands, Inc.
4.875%, 05/15/2026(a) | | | | | | | 764 | | | | 754,695 | |
Kontoor Brands, Inc.
4.125%, 11/15/2029(a) | | | | | | | 72 | | | | 66,717 | |
| | |
| |
10 | AB HIGH YIELD ETF | | abfunds.com |
PORTFOLIO OF INVESTMENTS (continued)
| | | | | | | | | | | | |
| | | | | | Principal
Amount
(000) | | | U.S. $ Value | |
| |
LBM Acquisition LLC
6.25%, 01/15/2029(a) | | | U.S.$ | | | | 143 | | | $ | 133,316 | |
LCM Investments Holdings II LLC
4.875%, 05/01/2029(a) | | | | | | | 335 | | | | 316,387 | |
Levi Strauss & Co.
3.50%, 03/01/2031(a) | | | | | | | 351 | | | | 310,796 | |
Michaels Cos., Inc. (The)
7.875%, 05/01/2029(a) | | | | | | | 40 | | | | 21,576 | |
Sonic Automotive, Inc.
4.625%, 11/15/2029(a) | | | | | | | 8 | | | | 7,514 | |
4.875%, 11/15/2031(a) | | | | | | | 311 | | | | 285,514 | |
Staples, Inc.
10.75%, 09/01/2029(a) | | | | | | | 258 | | | | 254,016 | |
12.75%, 01/15/2030(a) | | | | | | | 192 | | | | 158,871 | |
Under Armour, Inc.
3.25%, 06/15/2026 | | | | | | | 59 | | | | 57,120 | |
VF Corp.
2.95%, 04/23/2030 | | | | | | | 90 | | | | 77,745 | |
White Cap Buyer LLC
6.875%, 10/15/2028(a) | | | | | | | 537 | | | | 540,174 | |
| | | | | | | | | | | | |
| | | | | | | | | | | 6,371,207 | |
| | | | | | | | | | | | |
Consumer Non-Cyclical – 9.5% | | | | | | | | | | | | |
Albertsons Cos., Inc./Safeway, Inc./New Albertsons LP/Albertsons LLC
3.50%, 03/15/2029(a) | | | | | | | 184 | | | | 169,874 | |
4.625%, 01/15/2027(a) | | | | | | | 269 | | | | 263,631 | |
6.50%, 02/15/2028(a) | | | | | | | 470 | | | | 477,971 | |
Bausch + Lomb Corp.
8.375%, 10/01/2028(a) | | | | | | | 645 | | | | 675,747 | |
Bausch Health Americas, Inc.
8.50%, 01/31/2027(a) | | | | | | | 59 | | | | 48,818 | |
Bausch Health Cos., Inc.
4.875%, 06/01/2028(a) | | | | | | | 823 | | | | 683,411 | |
5.75%, 08/15/2027(a) | | | | | | | 22 | | | | 19,577 | |
7.25%, 05/30/2029(a) | | | | | | | 19 | | | | 12,511 | |
11.00%, 09/30/2028(a) | | | | | | | 479 | | | | 470,593 | |
Cheplapharm Arzneimittel GmbH
5.50%, 01/15/2028(a) | | | | | | | 415 | | | | 398,935 | |
CHS/Community Health Systems, Inc.
4.75%, 02/15/2031(a) | | | | | | | 117 | | | | 95,022 | |
5.25%, 05/15/2030(a) | | | | | | | 974 | | | | 831,806 | |
5.625%, 03/15/2027(a) | | | | | | | 266 | | | | 257,092 | |
6.00%, 01/15/2029(a) | | | | | | | 14 | | | | 13,055 | |
6.875%, 04/01/2028(a) | | | | | | | 51 | | | | 39,922 | |
6.875%, 04/15/2029(a) | | | | | | | 321 | | | | 256,826 | |
DaVita, Inc.
3.75%, 02/15/2031(a) | | | | | | | 246 | | | | 217,570 | |
4.625%, 06/01/2030(a) | | | | | | | 867 | | | | 812,292 | |
| | |
| |
| abfunds.com | | AB HIGH YIELD ETF | 11 |
PORTFOLIO OF INVESTMENTS (continued)
| | | | | | | | | | |
| | | | | Principal
Amount
(000) | | | U.S. $ Value | |
| |
Elanco Animal Health, Inc.
6.65%, 08/28/2028(h) | | U.S.$ | | | 332 | | | $ | 343,537 | |
Embecta Corp.
5.00%, 02/15/2030(a) | | | | | 245 | | | | 227,652 | |
Emergent BioSolutions, Inc.
3.875%, 08/15/2028(a) | | | | | 707 | | | | 568,718 | |
Encompass Health Corp.
4.50%, 02/01/2028 | | | | | 235 | | | | 229,174 | |
Fortrea Holdings, Inc.
7.50%, 07/01/2030(a) | | | | | 61 | | | | 61,798 | |
Grifols SA
3.875%, 10/15/2028(a) | | EUR | | | 200 | | | | 184,206 | |
Hologic, Inc.
3.25%, 02/15/2029(a) | | U.S.$ | | | 723 | | | | 664,618 | |
Kedrion SpA
6.50%, 09/01/2029(a) | | | | | 150 | | | | 142,866 | |
KeHE Distributors LLC/KeHE Finance Corp./NextWave Distribution, Inc.
9.00%, 02/15/2029(a) | | | | | 80 | | | | 83,784 | |
LifePoint Health, Inc.
5.375%, 01/15/2029(a) | | | | | 212 | | | | 190,266 | |
11.00%, 10/15/2030(a) | | | | | 212 | | | | 234,097 | |
Medline Borrower LP
3.875%, 04/01/2029(a) | | | | | 398 | | | | 373,248 | |
Medline Borrower LP/Medline Co-Issuer, Inc.
6.25%, 04/01/2029(a) | | | | | 74 | | | | 75,363 | |
ModivCare, Inc.
5.00%, 10/01/2029(a) | | | | | 450 | | | | 307,917 | |
MPH Acquisition Holdings LLC
5.50%, 09/01/2028(a) | | | | | 318 | | | | 220,670 | |
5.75%, 11/01/2028(a) | | | | | 346 | | | | 160,893 | |
Neogen Food Safety Corp.
8.625%, 07/20/2030(a) | | | | | 82 | | | | 88,286 | |
Newell Brands, Inc.
5.70%, 04/01/2026(h) | | | | | 106 | | | | 106,506 | |
7.00%, 04/01/2046(h) | | | | | 27 | | | | 25,833 | |
Organon & Co./Organon Foreign Debt Co-Issuer BV
4.125%, 04/30/2028(a) | | | | | 400 | | | | 380,016 | |
5.125%, 04/30/2031(a) | | | | | 449 | | | | 410,408 | |
7.875%, 05/15/2034(a) | | | | | 379 | | | | 391,374 | |
Owens & Minor, Inc.
6.625%, 04/01/2030(a) | | | | | 395 | | | | 382,336 | |
Performance Food Group, Inc.
4.25%, 08/01/2029(a) | | | | | 84 | | | | 79,002 | |
5.50%, 10/15/2027(a) | | | | | 239 | | | | 237,860 | |
| | |
| |
12 | AB HIGH YIELD ETF | | abfunds.com |
PORTFOLIO OF INVESTMENTS (continued)
| | | | | | | | | | | | |
| | | | | | Principal
Amount
(000) | | | U.S. $ Value | |
| |
Post Holdings, Inc.
4.50%, 09/15/2031(a) | | | U.S.$ | | | | 341 | | | $ | 310,890 | |
5.50%, 12/15/2029(a) | | | | | | | 230 | | | | 224,917 | |
6.25%, 02/15/2032(a) | | | | | | | 900 | | | | 911,835 | |
Prestige Brands, Inc.
3.75%, 04/01/2031(a) | | | | | | | 117 | | | | 105,054 | |
Primo Water Holdings, Inc.
4.375%, 04/30/2029(a) | | | | | | | 633 | | | | 595,761 | |
Star Parent, Inc.
9.00%, 10/01/2030(a) | | | | | | | 84 | | | | 86,740 | |
Tenet Healthcare Corp.
4.625%, 06/15/2028 | | | | | | | 1,502 | | | | 1,458,367 | |
TreeHouse Foods, Inc.
4.00%, 09/01/2028 | | | | | | | 57 | | | | 51,514 | |
Triton Water Holdings, Inc.
6.25%, 04/01/2029(a) | | | | | | | 459 | | | | 457,302 | |
US Acute Care Solutions LLC
9.75%, 05/15/2029(a) | | | | | | | 10 | | | | 10,394 | |
US Foods, Inc.
4.75%, 02/15/2029(a) | | | | | | | 232 | | | | 224,077 | |
5.75%, 04/15/2033(a) | | | | | | | 64 | | | | 63,315 | |
6.875%, 09/15/2028(a) | | | | | | | 208 | | | | 214,997 | |
Viking Baked Goods Acquisition Corp.
8.625%, 11/01/2031(a) | | | | | | | 52 | | | | 51,146 | |
| | | | | | | | | | | | |
| | | | | | | | | | | 16,681,390 | |
| | | | | | | | | | | | |
Energy – 9.0% | | | | | | | | | | | | |
Antero Midstream Partners LP/Antero Midstream Finance Corp.
5.375%, 06/15/2029(a) | | | | | | | 9 | | | | 8,822 | |
5.75%, 01/15/2028(a) | | | | | | | 239 | | | | 238,278 | |
Berry Petroleum Co., LLC
7.00%, 02/15/2026(a) | | | | | | | 63 | | | | 62,918 | |
Blue Racer Midstream LLC/Blue Racer Finance Corp.
7.00%, 07/15/2029(a) | | | | | | | 303 | | | | 311,772 | |
Buckeye Partners LP
3.95%, 12/01/2026 | | | | | | | 385 | | | | 375,633 | |
4.125%, 03/01/2025(a) | | | | | | | 7 | | | | 6,965 | |
4.125%, 12/01/2027 | | | | | | | 279 | | | | 268,325 | |
4.50%, 03/01/2028(a) | | | | | | | 206 | | | | 198,652 | |
5.85%, 11/15/2043 | | | | | | | 85 | | | | 75,002 | |
California Resources Corp.
8.25%, 06/15/2029(a) | | | | | | | 126 | | | | 129,352 | |
CITGO Petroleum Corp.
6.375%, 06/15/2026(a) | | | | | | | 16 | | | | 16,069 | |
7.00%, 06/15/2025(a) | | | | | | | 50 | | | | 50,066 | |
8.375%, 01/15/2029(a) | | | | | | | 227 | | | | 236,134 | |
| | |
| |
| abfunds.com | | AB HIGH YIELD ETF | 13 |
PORTFOLIO OF INVESTMENTS (continued)
| | | | | | | | | | |
| | | | | Principal
Amount
(000) | | | U.S. $ Value | |
| |
Civitas Resources, Inc.
5.00%, 10/15/2026(a) | | U.S.$ | | | 58 | | | $ | 57,149 | |
8.375%, 07/01/2028(a) | | | | | 456 | | | | 475,868 | |
8.75%, 07/01/2031(a) | | | | | 93 | | | | 98,614 | |
CNX Resources Corp.
6.00%, 01/15/2029(a) | | | | | 47 | | | | 47,023 | |
Comstock Resources, Inc.
6.75%, 03/01/2029(a) | | | | | 58 | | | | 57,176 | |
Crescent Energy Finance LLC
9.25%, 02/15/2028(a) | | | | | 150 | | | | 157,815 | |
Delek Logistics Partners LP/Delek Logistics Finance Corp.
8.625%, 03/15/2029(a) | | | | | 123 | | | | 128,202 | |
Ferrellgas LP/Ferrellgas Finance Corp.
5.875%, 04/01/2029(a) | | | | | 409 | | | | 383,515 | |
Genesis Energy LP/Genesis Energy Finance Corp.
7.875%, 05/15/2032 | | | | | 150 | | | | 151,138 | |
8.25%, 01/15/2029 | | | | | 138 | | | | 141,206 | |
Global Partners LP/GLP Finance Corp.
6.875%, 01/15/2029 | | | | | 208 | | | | 208,518 | |
7.00%, 08/01/2027 | | | | | 21 | | | | 21,152 | |
Harvest Midstream I LP
7.50%, 09/01/2028(a) | | | | | 233 | | | | 238,245 | |
7.50%, 05/15/2032(a) | | | | | 200 | | | | 205,562 | |
Hess Midstream Operations LP
5.125%, 06/15/2028(a) | | | | | 699 | | | | 687,138 | |
5.625%, 02/15/2026(a) | | | | | 200 | | | | 199,766 | |
Hilcorp Energy I LP/Hilcorp Finance Co.
5.75%, 02/01/2029(a) | | | | | 131 | | | | 127,229 | |
6.00%, 04/15/2030(a) | | | | | 81 | | | | 78,171 | |
6.00%, 02/01/2031(a) | | | | | 98 | | | | 93,618 | |
6.25%, 11/01/2028(a) | | | | | 50 | | | | 49,625 | |
6.25%, 04/15/2032(a) | | | | | 43 | | | | 40,890 | |
6.875%, 05/15/2034(a) | | | | | 267 | | | | 258,664 | |
7.25%, 02/15/2035(a) | | | | | 414 | | | | 406,316 | |
8.375%, 11/01/2033(a) | | | | | 74 | | | | 78,171 | |
Howard Midstream Energy Partners LLC
7.375%, 07/15/2032(a) | | | | | 141 | | | | 145,226 | |
8.875%, 07/15/2028(a) | | | | | 444 | | | | 471,306 | |
ITT Holdings LLC
6.50%, 08/01/2029(a) | | | | | 421 | | | | 394,687 | |
Kodiak Gas Services LLC
7.25%, 02/15/2029(a) | | | | | 136 | | | | 140,590 | |
Moss Creek Resources Holdings, Inc.
8.25%, 09/01/2031(a) | | | | | 94 | | | | 92,369 | |
| | |
| |
14 | AB HIGH YIELD ETF | | abfunds.com |
PORTFOLIO OF INVESTMENTS (continued)
| | | | | | | | | | |
| | | | | Principal
Amount
(000) | | | U.S. $ Value | |
| |
Murphy Oil Corp.
5.875%, 12/01/2042(h) | | U.S.$ | | | 20 | | | $ | 17,930 | |
Nabors Industries, Inc.
7.375%, 05/15/2027(a) | | | | | 55 | | | | 55,107 | |
9.125%, 01/31/2030(a) | | | | | 78 | | | | 81,190 | |
New Fortress Energy, Inc.
6.50%, 09/30/2026(a) | | | | | 204 | | | | 190,740 | |
8.75%, 03/15/2029(a) | | | | | 313 | | | | 255,702 | |
NFE Financing LLC
12.00%, 11/15/2029(a) | | | | | 421 | | | | 421,457 | |
NGL Energy Operating LLC/NGL Energy Finance Corp.
8.125%, 02/15/2029(a) | | | | | 546 | | | | 557,619 | |
8.375%, 02/15/2032(a) | | | | | 185 | | | | 189,520 | |
NuStar Logistics LP
5.625%, 04/28/2027 | | | | | 283 | | | | 283,674 | |
5.75%, 10/01/2025 | | | | | 208 | | | | 207,796 | |
6.00%, 06/01/2026 | | | | | 222 | | | | 223,532 | |
Parkland Corp.
4.625%, 05/01/2030(a) | | | | | 237 | | | | 221,097 | |
PBF Holding Co., LLC/PBF Finance Corp.
6.00%, 02/15/2028 | | | | | 170 | | | | 168,166 | |
7.875%, 09/15/2030(a) | | | | | 495 | | | | 507,989 | |
Permian Resources Operating LLC
5.875%, 07/01/2029(a) | | | | | 40 | | | | 39,812 | |
Rockies Express Pipeline LLC
6.875%, 04/15/2040(a) | | | | | 465 | | | | 450,636 | |
Saturn Oil & Gas, Inc.
9.625%, 06/15/2029(a) | | | | | 237 | | | | 238,128 | |
Summit Midstream Holdings LLC
8.625%, 10/31/2029(a) | | | | | 75 | | | | 78,493 | |
Sunoco LP
7.00%, 05/01/2029(a) | | | | | 7 | | | | 7,248 | |
7.25%, 05/01/2032(a) | | | | | 9 | | | | 9,424 | |
Sunoco LP/Sunoco Finance Corp.
4.50%, 05/15/2029 | | | | | 365 | | | | 348,557 | |
5.875%, 03/15/2028 | | | | | 16 | | | | 16,008 | |
6.00%, 04/15/2027 | | | | | 237 | | | | 237,638 | |
7.00%, 09/15/2028(a) | | | | | 21 | | | | 21,646 | |
Tallgrass Energy Partners LP/Tallgrass Energy Finance Corp.
5.50%, 01/15/2028(a) | | | | | 61 | | | | 59,404 | |
6.00%, 12/31/2030(a) | | | | | 319 | | | | 302,782 | |
6.00%, 09/01/2031(a) | | | | | 7 | | | | 6,623 | |
Talos Production, Inc.
9.00%, 02/01/2029(a) | | | | | 55 | | | | 57,530 | |
9.375%, 02/01/2031(a) | | | | | 66 | | | | 69,316 | |
| | |
| |
| abfunds.com | | AB HIGH YIELD ETF | 15 |
PORTFOLIO OF INVESTMENTS (continued)
| | | | | | | | | | | | |
| | | | | | Principal
Amount
(000) | | | U.S. $ Value | |
| |
TerraForm Power Operating LLC
4.75%, 01/15/2030(a) | | | U.S.$ | | | | 26 | | | $ | 24,363 | |
Transocean Aquila Ltd.
8.00%, 09/30/2028(a) | | | | | | | 102 | | | | 104,315 | |
Transocean, Inc.
8.75%, 02/15/2030(a) | | | | | | | 227 | | | | 236,579 | |
Venture Global Calcasieu Pass LLC
3.875%, 08/15/2029(a) | | | | | | | 427 | | | | 396,546 | |
4.125%, 08/15/2031(a) | | | | | | | 180 | | | | 164,313 | |
6.25%, 01/15/2030(a) | | | | | | | 60 | | | | 61,445 | |
Venture Global LNG, Inc.
7.00%, 01/15/2030(a) | | | | | | | 57 | | | | 58,331 | |
8.125%, 06/01/2028(a) | | | | | | | 215 | | | | 224,709 | |
8.375%, 06/01/2031(a) | | | | | | | 175 | | | | 184,602 | |
9.00%, 09/30/2029(a)(k) | | | | | | | 398 | | | | 412,698 | |
9.50%, 02/01/2029(a) | | | | | | | 412 | | | | 460,303 | |
9.875%, 02/01/2032(a) | | | | | | | 490 | | | | 544,630 | |
| | | | | | | | | | | | |
| | | | | | | | | | | 15,810,535 | |
| | | | | | | | | | | | |
Other Industrial – 1.4% | | | | | | | | | | | | |
AECOM
5.125%, 03/15/2027 | | | | | | | 590 | | | | 587,168 | |
Belden, Inc.
3.375%, 07/15/2031(a) | | | EUR | | | | 153 | | | | 155,660 | |
Benteler International AG
10.50%, 05/15/2028(a) | | | U.S.$ | | | | 200 | | | | 209,138 | |
Dealer Tire LLC/DT Issuer LLC
8.00%, 02/01/2028(a) | | | | | | | 255 | | | | 252,958 | |
Fluor Corp.
4.25%, 09/15/2028 | | | | | | | 61 | | | | 58,872 | |
Pachelbel Bidco SpA
7.125%, 05/17/2031(a) | | | EUR | | | | 125 | | | | 141,045 | |
7.302% (EURIBOR 3 Month + 4.25%), 05/17/2031(a)(l) | | | | | | | 100 | | | | 106,451 | |
Ritchie Bros Holdings, Inc.
7.75%, 03/15/2031(a) | | | U.S.$ | | | | 337 | | | | 356,354 | |
Velocity Vehicle Group LLC
8.00%, 06/01/2029(a) | | | | | | | 482 | | | | 502,784 | |
Verde Purchaser LLC
10.50%, 11/30/2030(a) | | | | | | | 79 | | | | 84,594 | |
| | | | | | | | | | | | |
| | | | | | | | | | | 2,455,024 | |
| | | | | | | | | | | | |
Services – 3.7% | | | | | | | | | | | | |
ADT Security Corp. (The)
4.125%, 08/01/2029(a) | | | | | | | 115 | | | | 107,628 | |
Allied Universal Holdco LLC
7.875%, 02/15/2031(a) | | | | | | | 236 | | | | 241,631 | |
| | |
| |
16 | AB HIGH YIELD ETF | | abfunds.com |
PORTFOLIO OF INVESTMENTS (continued)
| | | | | | | | | | | | |
| | | | | | Principal
Amount
(000) | | | U.S. $ Value | |
| |
Allied Universal Holdco LLC/Allied Universal Finance Corp.
9.75%, 07/15/2027(a) | | | U.S.$ | | | | 51 | | | $ | 51,176 | |
Allied Universal Holdco LLC/Allied Universal Finance Corp./Atlas Luxco 4 SARL
4.625%, 06/01/2028(a) | | | | | | | 1,348 | | | | 1,267,903 | |
4.875%, 06/01/2028(a) | | | GBP | | | | 100 | | | | 116,264 | |
ANGI Group LLC
3.875%, 08/15/2028(a) | | | U.S.$ | | | | 172 | | | | 156,179 | |
Aramark Services, Inc.
5.00%, 02/01/2028(a) | | | | | | | 620 | | | | 607,786 | |
Block, Inc.
2.75%, 06/01/2026 | | | | | | | 447 | | | | 431,583 | |
Champions Financing, Inc.
8.75%, 02/15/2029(a) | | | | | | | 218 | | | | 219,849 | |
Garda World Security Corp.
4.625%, 02/15/2027(a) | | | | | | | 372 | | | | 361,949 | |
6.00%, 06/01/2029(a) | | | | | | | 419 | | | | 397,543 | |
8.25%, 08/01/2032(a) | | | | | | | 138 | | | | 140,828 | |
8.375%, 11/15/2032(a) | | | | | | | 124 | | | | 127,226 | |
GrubHub Holdings, Inc.
5.50%, 07/01/2027(a) | | | | | | | 54 | | | | 49,613 | |
ION Trading Technologies SARL
9.50%, 05/30/2029(a) | | | | | | | 4 | | | | 4,140 | |
Matthews International Corp.
8.625%, 10/01/2027(a) | | | | | | | 104 | | | | 108,855 | |
Millennium Escrow Corp.
6.625%, 08/01/2026(a) | | | | | | | 134 | | | | 97,291 | |
Monitronics International, Inc.
9.125%, 04/01/2020(c)(d)(e)(f)(i) | | | | | | | 14 | | | | – 0 | – |
Prime Security Services Borrower LLC/Prime Finance, Inc.
3.375%, 08/31/2027(a) | | | | | | | 32 | | | | 30,089 | |
5.75%, 04/15/2026(a) | | | | | | | 820 | | | | 820,213 | |
Raven Acquisition Holdings LLC
6.875%, 11/15/2031(a) | | | | | | | 252 | | | | 251,934 | |
Service Corp. International/US
4.625%, 12/15/2027 | | | | | | | 223 | | | | 219,084 | |
5.125%, 06/01/2029 | | | | | | | 242 | | | | 238,588 | |
Sotheby’s
7.375%, 10/15/2027(a) | | | | | | | 186 | | | | 184,359 | |
Techem Verwaltungsgesellschaft 675 mbH
5.375%, 07/15/2029(a) | | | EUR | | | | 178 | | | | 192,939 | |
| | | | | | | | | | | | |
| | | | | | | | | | | 6,424,650 | |
| | | | | | | | | | | | |
Technology – 3.2% | | | | | | | | | | | | |
Ahead DB Holdings LLC
6.625%, 05/01/2028(a) | | | U.S.$ | | | | 37 | | | | 36,666 | |
Almaviva-The Italian Innovation Co. SpA
5.00%, 10/30/2030(a) | | | EUR | | | | 206 | | | | 218,052 | |
| | |
| |
| abfunds.com | | AB HIGH YIELD ETF | 17 |
PORTFOLIO OF INVESTMENTS (continued)
| | | | | | | | | | |
| | | | | Principal
Amount
(000) | | | U.S. $ Value | |
| |
Amentum Holdings, Inc.
7.25%, 08/01/2032(a) | | U.S.$ | | | 311 | | | $ | 319,350 | |
ASGN, Inc.
4.625%, 05/15/2028(a) | | | | | 43 | | | | 41,204 | |
AthenaHealth Group, Inc.
6.50%, 02/15/2030(a) | | | | | 42 | | | | 40,270 | |
Camelot Finance SA
4.50%, 11/01/2026(a) | | | | | 50 | | | | 48,873 | |
Central Parent, Inc./CDK Global, Inc.
7.25%, 06/15/2029(a) | | | | | 50 | | | | 50,278 | |
Clarivate Science Holdings Corp.
4.875%, 07/01/2029(a) | | | | | 254 | | | | 237,630 | |
Cloud Software Group, Inc.
6.50%, 03/31/2029(a) | | | | | 623 | | | | 613,007 | |
8.25%, 06/30/2032(a) | | | | | 388 | | | | 404,894 | |
Consensus Cloud Solutions, Inc.
6.50%, 10/15/2028(a) | | | | | 72 | | | | 71,273 | |
Ellucian Holdings, Inc.
6.50%, 12/01/2029(a) | | | | | 120 | | | | 122,124 | |
Fair Isaac Corp.
4.00%, 06/15/2028(a) | | | | | 169 | | | | 161,106 | |
Gen Digital, Inc.
6.75%, 09/30/2027(a) | | | | | 684 | | | | 697,290 | |
GoTo Group, Inc.
5.50%, 05/01/2028(a) | | | | | 218 | | | | 151,938 | |
Helios Software Holdings, Inc./ION Corporate Solutions Finance SARL
8.75%, 05/01/2029(a) | | | | | 200 | | | | 204,338 | |
Open Text Corp.
3.875%, 02/15/2028(a) | | | | | 350 | | | | 329,983 | |
Playtika Holding Corp.
4.25%, 03/15/2029(a) | | | | | 402 | | | | 369,579 | |
PTC, Inc.
4.00%, 02/15/2028(a) | | | | | 60 | | | | 57,377 | |
Rackspace Finance LLC
3.50%, 05/15/2028(a) | | | | | 266 | | | | 165,897 | |
Rackspace Technology Global, Inc.
5.375%, 12/01/2028(a) | | | | | 109 | | | | 36,938 | |
Rocket Software, Inc.
9.00%, 11/28/2028(a) | | | | | 217 | | | | 225,498 | |
Science Applications International Corp.
4.875%, 04/01/2028(a) | | | | | 15 | | | | 14,436 | |
TTM Technologies, Inc.
4.00%, 03/01/2029(a) | | | | | 50 | | | | 46,709 | |
Veritas US, Inc./Veritas Bermuda Ltd.
7.50%, 09/01/2025(a) | | | | | 96 | | | | 92,911 | |
| | |
| |
18 | AB HIGH YIELD ETF | | abfunds.com |
PORTFOLIO OF INVESTMENTS (continued)
| | | | | | | | | | | | |
| | | | | | Principal
Amount
(000) | | | U.S. $ Value | |
| |
Virtusa Corp.
7.125%, 12/15/2028(a) | | | U.S.$ | | | | 37 | | | $ | 35,746 | |
Western Digital Corp.
4.75%, 02/15/2026 | | | | | | | 751 | | | | 744,399 | |
| | | | | | | | | | | | |
| | | | | | | | | | | 5,537,766 | |
| | | | | | | | | | | | |
Transportation - Airlines – 0.8% | | | | | | | | | | | | |
Allegiant Travel Co.
7.25%, 08/15/2027(a) | | | | | | | 340 | | | | 338,487 | |
American Airlines, Inc./AAdvantage Loyalty IP Ltd.
5.50%, 04/20/2026(a) | | | | | | | 142 | | | | 142,247 | |
5.75%, 04/20/2029(a) | | | | | | | 727 | | | | 724,808 | |
Avianca Midco 2 PLC
9.00%, 12/01/2028(a) | | | | | | | 192 | | | | 189,264 | |
| | | | | | | | | | | | |
| | | | | | | | | | | 1,394,806 | |
| | | | | | | | | | | | |
Transportation - Services – 1.2% | | | | | | | | | | | | |
Avis Budget Car Rental LLC/Avis Budget Finance, Inc.
4.75%, 04/01/2028(a) | | | | | | | 151 | | | | 143,012 | |
5.375%, 03/01/2029(a) | | | | | | | 109 | | | | 103,621 | |
5.75%, 07/15/2027(a) | | | | | | | 22 | | | | 21,757 | |
Dcli Bidco LLC
7.75%, 11/15/2029(a) | | | | | | | 99 | | | | 102,532 | |
Edge Finco PLC
8.125%, 08/15/2031(a) | | | GBP | | | | 134 | | | | 172,513 | |
EquipmentShare.com, Inc.
8.625%, 05/15/2032(a) | | | U.S.$ | | | | 57 | | | | 59,829 | |
9.00%, 05/15/2028(a) | | | | | | | 137 | | | | 143,012 | |
Hertz Corp. (The)
4.625%, 12/01/2026(a) | | | | | | | 304 | | | | 260,367 | |
5.00%, 12/01/2029(a) | | | | | | | 412 | | | | 285,063 | |
12.625%, 07/15/2029(a) | | | | | | | 240 | | | | 260,083 | |
Mundys SpA
1.875%, 02/12/2028(a) | | | EUR | | | | 153 | | | | 153,885 | |
PROG Holdings, Inc.
6.00%, 11/15/2029(a) | | | U.S.$ | | | | 311 | | | | 303,813 | |
Rand Parent LLC
8.50%, 02/15/2030(a) | | | | | | | 109 | | | | 110,191 | |
| | | | | | | | | | | | |
| | | | | | | | | | | 2,119,678 | |
| | | | | | | | | | | | |
| | | | | | | | | | | 122,462,523 | |
| | | | | | | | | | | | |
Financial Institutions – 5.4% | | | | | | | | | | | | |
Banking – 0.9% | | | | | | | | | | | | |
Ally Financial, Inc.
Series C
4.70%, 05/15/2028(k) | | | | | | | 28 | | | | 24,211 | |
| | |
| |
| abfunds.com | | AB HIGH YIELD ETF | 19 |
PORTFOLIO OF INVESTMENTS (continued)
| | | | | | | | | | | | |
| | | | | | Principal
Amount
(000) | | | U.S. $ Value | |
| |
Bread Financial Holdings, Inc.
7.00%, 01/15/2026(a) | | | U.S.$ | | | | 15 | | | $ | 14,975 | |
9.75%, 03/15/2029(a) | | | | | | | 537 | | | | 576,319 | |
Freedom Mortgage Corp.
12.00%, 10/01/2028(a) | | | | | | | 267 | | | | 290,176 | |
12.25%, 10/01/2030(a) | | | | | | | 29 | | | | 32,168 | |
Societe Generale SA
8.00%, 09/29/2025(a)(k) | | | | | | | 3 | | | | 3,029 | |
Synchrony Financial
7.25%, 02/02/2033 | | | | | | | 534 | | | | 563,023 | |
| | | | | | | | | | | | |
| | | | | | | | | | | 1,503,901 | |
| | | | | | | | | | | | |
Brokerage – 1.1% | | | | | | | | | | | | |
AG Issuer LLC
6.25%, 03/01/2028(a) | | | | | | | 204 | | | | 202,317 | |
AG TTMT Escrow Issuer LLC
8.625%, 09/30/2027(a) | | | | | | | 414 | | | | 429,736 | |
Aretec Group, Inc.
7.50%, 04/01/2029(a) | | | | | | | 101 | | | | 100,973 | |
10.00%, 08/15/2030(a) | | | | | | | 433 | | | | 479,210 | |
Hightower Holding LLC
6.75%, 04/15/2029(a) | | | | | | | 11 | | | | 11,002 | |
9.125%, 01/31/2030(a) | | | | | | | 322 | | | | 341,072 | |
Osaic Holdings, Inc.
10.75%, 08/01/2027(a) | | | | | | | 87 | | | | 89,995 | |
VFH Parent LLC/Valor Co-Issuer, Inc.
7.50%, 06/15/2031(a) | | | | | | | 314 | | | | 324,418 | |
| | | | | | | | | | | | |
| | | | | | | | | | | 1,978,723 | |
| | | | | | | | | | | | |
Finance – 2.0% | | | | | | | | | | | | |
Castlelake Aviation Finance DAC
5.00%, 04/15/2027(a) | | | | | | | 98 | | | | 98,486 | |
CNG Holdings, Inc.
14.50%, 06/30/2026(a) | | | | | | | 29 | | | | 24,215 | |
Enova International, Inc.
9.125%, 08/01/2029(a) | | | | | | | 475 | | | | 498,494 | |
11.25%, 12/15/2028(a) | | | | | | | 119 | | | | 129,090 | |
Freedom Mortgage Holdings LLC
9.25%, 02/01/2029(a) | | | | | | | 62 | | | | 64,275 | |
GGAM Finance Ltd.
8.00%, 02/15/2027(a) | | | | | | | 153 | | | | 158,474 | |
8.00%, 06/15/2028(a) | | | | | | | 153 | | | | 161,657 | |
goeasy Ltd.
9.25%, 12/01/2028(a) | | | | | | | 98 | | | | 104,854 | |
Jefferies Finance LLC/JFIN Co-Issuer Corp.
5.00%, 08/15/2028(a) | | | | | | | 650 | | | | 608,153 | |
Midcap Financial Issuer Trust
6.50%, 05/01/2028(a) | | | | | | | 202 | | | | 197,518 | |
| | |
| |
20 | AB HIGH YIELD ETF | | abfunds.com |
PORTFOLIO OF INVESTMENTS (continued)
| | | | | | | | | | | | |
| | | | | | Principal
Amount
(000) | | | U.S. $ Value | |
| |
Navient Corp.
5.625%, 08/01/2033 | | | U.S.$ | | | | 793 | | | $ | 707,792 | |
9.375%, 07/25/2030 | | | | | | | 87 | | | | 95,833 | |
11.50%, 03/15/2031 | | | | | | | 118 | | | | 134,286 | |
PennyMac Financial Services, Inc.
5.375%, 10/15/2025(a) | | | | | | | 159 | | | | 158,618 | |
SLM Corp.
4.20%, 10/29/2025 | | | | | | | 418 | | | | 412,332 | |
| | | | | | | | | | | | |
| | | | | | | | | | | 3,554,077 | |
| | | | | | | | | | | | |
Insurance – 0.4% | | | | | | | | | | | | |
Acrisure LLC/Acrisure Finance, Inc.
6.00%, 08/01/2029(a) | | | | | | | 162 | | | | 155,032 | |
7.50%, 11/06/2030(a) | | | | | | | 129 | | | | 131,739 | |
8.25%, 02/01/2029(a) | | | | | | | 109 | | | | 112,067 | |
Alliant Holdings Intermediate LLC/Alliant Holdings Co-Issuer
6.75%, 04/15/2028(a) | | | | | | | 60 | | | | 60,594 | |
Howden UK Refinance PLC/Howden UK Refinance 2 PLC/Howden US Refinance LLC
8.125%, 02/15/2032(a) | | | | | | | 190 | | | | 191,566 | |
| | | | | | | | | | | | |
| | | | | | | | | | | 650,998 | |
| | | | | | | | | | | | |
Other Finance – 0.2% | | | | | | | | | | | | |
Armor Holdco, Inc.
8.50%, 11/15/2029(a) | | | | | | | 151 | | | | 150,968 | |
Encore Capital Group, Inc.
8.50%, 05/15/2030(a) | | | | | | | 200 | | | | 211,846 | |
Titanium 2l Bondco SARL
6.25%, 01/14/2031 | | | EUR | | | | 109 | | | | 39,270 | |
| | | | | | | | | | | | |
| | | | | | | | | | | 402,084 | |
| | | | | | | | | | | | |
REITs – 0.8% | | | | | | | | | | | | |
Aedas Homes Opco SL
4.00%, 08/15/2026(a) | | | | | | | 111 | | | | 116,852 | |
Brookfield Property REIT, Inc./BPR Cumulus LLC/BPR Nimbus LLC/GGSI Sellco LL
5.75%, 05/15/2026(a) | | | U.S.$ | | | | 2 | | | | 1,987 | |
Five Point Operating Co. LP/Five Point Capital Corp.
10.50%, 01/15/2028(a)(h) | | | | | | | 435 | | | | 444,338 | |
Hunt Cos., Inc.
5.25%, 04/15/2029(a) | | | | | | | 64 | | | | 60,694 | |
Iron Mountain, Inc.
4.875%, 09/15/2029(a) | | | | | | | 247 | | | | 237,772 | |
5.00%, 07/15/2028(a) | | | | | | | 192 | | | | 187,263 | |
Service Properties Trust
8.375%, 06/15/2029 | | | | | | | 223 | | | | 221,479 | |
8.625%, 11/15/2031(a) | | | | | | | 94 | | | | 99,331 | |
| | | | | | | | | | | | |
| | | | | | | | | | | 1,369,716 | |
| | | | | | | | | | | | |
| | | | | | | | | | | 9,459,499 | |
| | | | | | | | | | | | |
| | |
| |
| abfunds.com | | AB HIGH YIELD ETF | 21 |
PORTFOLIO OF INVESTMENTS (continued)
| | | | | | | | | | | | |
| | | | | | Principal
Amount
(000) | | | U.S. $ Value | |
| |
Utility – 2.7% | | | | | | | | | | | | |
Electric – 2.7% | | | | | | | | | | | | |
Calpine Corp.
4.50%, 02/15/2028(a) | | | U.S.$ | | | | 1,182 | | | $ | 1,143,644 | |
Clearway Energy Operating LLC
3.75%, 02/15/2031(a) | | | | | | | 150 | | | | 132,892 | |
4.75%, 03/15/2028(a) | | | | | | | 106 | | | | 102,767 | |
NextEra Energy Operating Partners LP
3.875%, 10/15/2026(a) | | | | | | | 29 | | | | 27,702 | |
4.50%, 09/15/2027(a) | | | | | | | 130 | | | | 123,630 | |
7.25%, 01/15/2029(a) | | | | | | | 51 | | | | 52,080 | |
NRG Energy, Inc.
3.375%, 02/15/2029(a) | | | | | | | 973 | | | | 891,317 | |
3.625%, 02/15/2031(a) | | | | | | | 10 | | | | 8,913 | |
5.25%, 06/15/2029(a) | | | | | | | 8 | | | | 7,855 | |
5.75%, 07/15/2029(a) | | | | | | | 5 | | | | 4,945 | |
6.00%, 02/01/2033(a) | | | | | | | 110 | | | | 109,613 | |
6.25%, 11/01/2034(a) | | | | | | | 111 | | | | 111,031 | |
10.25%, 03/15/2028(a)(k) | | | | | | | 47 | | | | 52,077 | |
PG&E Corp.
5.00%, 07/01/2028 | | | | | | | 960 | | | | 944,755 | |
Vistra Corp.
7.00%, 12/15/2026(a)(k) | | | | | | | 28 | | | | 28,279 | |
8.00%, 10/15/2026(a)(k) | | | | | | | 29 | | | | 29,851 | |
Vistra Operations Co., LLC
4.375%, 05/01/2029(a) | | | | | | | 251 | | | | 239,660 | |
5.00%, 07/31/2027(a) | | | | | | | 102 | | | | 101,057 | |
5.50%, 09/01/2026(a) | | | | | | | 117 | | | | 116,887 | |
5.625%, 02/15/2027(a) | | | | | | | 413 | | | | 412,810 | |
| | | | | | | | | | | | |
| | | | | | | | | | | 4,641,765 | |
| | | | | | | | | | | | |
Total Corporates - Non-Investment Grade
(cost $135,979,125) | | | | | | | | | | | 136,563,787 | |
| | | | | | | | | | | | |
| | | | | | | | | | | | |
CORPORATES - INVESTMENT GRADE – 16.5% | | | | | | | | | | | | |
Industrial – 9.6% | | | | | | | | | | | | |
Basic – 0.2% | | | | | | | | | | | | |
Glencore Funding LLC
5.634%, 04/04/2034(a) | | | | | | | 246 | | | | 252,071 | |
5.70%, 05/08/2033(a) | | | | | | | 139 | | | | 143,899 | |
| | | | | | | | | | | | |
| | | | | | | | | | | 395,970 | |
| | | | | | | | | | | | |
Capital Goods – 0.3% | | | | | | | | | | | | |
Boeing Co. (The)
3.25%, 02/01/2028 | | | | | | | 86 | | | | 81,330 | |
3.625%, 02/01/2031 | | | | | | | 21 | | | | 19,163 | |
5.15%, 05/01/2030 | | | | | | | 161 | | | | 160,409 | |
6.298%, 05/01/2029(a) | | | | | | | 19 | | | | 19,815 | |
6.528%, 05/01/2034(a) | | | | | | | 243 | | | | 258,195 | |
| | |
| |
22 | AB HIGH YIELD ETF | | abfunds.com |
PORTFOLIO OF INVESTMENTS (continued)
| | | | | | | | | | | | |
| | | | | | Principal
Amount
(000) | | | U.S. $ Value | |
| |
Howmet Aerospace, Inc.
5.90%, 02/01/2027 | | | U.S.$ | | | | 4 | | | $ | 4,107 | |
Regal Rexnord Corp.
6.05%, 04/15/2028 | | | | | | | 4 | | | | 4,111 | |
| | | | | | | | | | | | |
| | | | | | | | | | | 547,130 | |
| | | | | | | | | | | | |
Communications - Media – 1.5% | | | | | | | | | | | | |
Charter Communications Operating LLC/Charter Communications Operating Capital
5.375%, 04/01/2038 | | | | | | | 97 | | | | 89,488 | |
DirecTV Financing LLC/DirecTV Financing Co-Obligor, Inc.
5.875%, 08/15/2027(a) | | | | | | | 1,118 | | | | 1,097,585 | |
Paramount Global
4.20%, 06/01/2029 | | | | | | | 20 | | | | 19,066 | |
4.95%, 01/15/2031 | | | | | | | 214 | | | | 203,895 | |
5.50%, 05/15/2033 | | | | | | | 71 | | | | 68,310 | |
6.875%, 04/30/2036 | | | | | | | 252 | | | | 262,183 | |
Time Warner Cable LLC
7.30%, 07/01/2038 | | | | | | | 104 | | | | 109,731 | |
Warnermedia Holdings, Inc.
4.279%, 03/15/2032 | | | | | | | 651 | | | | 588,198 | |
5.141%, 03/15/2052 | | | | | | | 205 | | | | 164,992 | |
| | | | | | | | | | | | |
| | | | | | | | | | | 2,603,448 | |
| | | | | | | | | | | | |
Communications - Telecommunications – 0.2% | | | | | | | | | | | | |
Sprint Capital Corp.
8.75%, 03/15/2032 | | | | | | | 357 | | | | 434,819 | |
| | | | | | | | | | | | |
| | | |
Consumer Cyclical - Automotive – 2.0% | | | | | | | | | | | | |
Adient Global Holdings Ltd.
7.00%, 04/15/2028(a) | | | | | | | 532 | | | | 543,747 | |
Ford Motor Co.
3.25%, 02/12/2032 | | | | | | | 136 | | | | 116,095 | |
Ford Motor Credit Co., LLC
2.70%, 08/10/2026 | | | | | | | 200 | | | | 191,852 | |
4.95%, 05/28/2027 | | | | | | | 200 | | | | 198,738 | |
6.054%, 11/05/2031 | | | | | | | 430 | | | | 437,615 | |
General Motors Financial Co., Inc.
2.35%, 01/08/2031 | | | | | | | 44 | | | | 37,515 | |
2.70%, 06/10/2031 | | | | | | | 147 | | | | 127,049 | |
3.60%, 06/21/2030 | | | | | | | 21 | | | | 19,477 | |
5.75%, 02/08/2031 | | | | | | | 194 | | | | 199,733 | |
5.95%, 04/04/2034 | | | | | | | 100 | | | | 103,251 | |
6.10%, 01/07/2034 | | | | | | | 61 | | | | 63,592 | |
6.40%, 01/09/2033 | | | | | | | 70 | | | | 74,345 | |
Harley-Davidson Financial Services, Inc.
5.95%, 06/11/2029(a) | | | | | | | 82 | | | | 83,129 | |
6.50%, 03/10/2028(a) | | | | | | | 275 | | | | 283,808 | |
| | |
| |
| abfunds.com | | AB HIGH YIELD ETF | 23 |
PORTFOLIO OF INVESTMENTS (continued)
| | | | | | | | | | | | |
| | | | | | Principal
Amount
(000) | | | U.S. $ Value | |
| |
Jaguar Land Rover Automotive PLC
5.875%, 01/15/2028(a) | | | U.S.$ | | | | 400 | | | $ | 397,608 | |
Nissan Motor Acceptance Co., LLC
1.85%, 09/16/2026(a) | | | | | | | 14 | | | | 12,945 | |
2.75%, 03/09/2028(a) | | | | | | | 183 | | | | 163,386 | |
5.30%, 09/13/2027(a) | | | | | | | 153 | | | | 149,212 | |
Nissan Motor Co., Ltd.
4.345%, 09/17/2027(a) | | | | | | | 402 | | | | 381,285 | |
| | | | | | | | | | | | |
| | | | | | | | | | | 3,584,382 | |
| | | | | | | | | | | | |
Consumer Cyclical - Entertainment – 0.5% | | | | | | | | | | | | |
Carnival Corp.
4.00%, 08/01/2028(a) | | | | | | | 827 | | | | 787,759 | |
| | | | | | | | | | | | |
| | | |
Consumer Cyclical - Other – 0.9% | | | | | | | | | | | | |
Flutter Treasury DAC
5.00%, 04/29/2029(a) | | | EUR | | | | 103 | | | | 113,208 | |
International Game Technology PLC
6.25%, 01/15/2027(a) | | | U.S.$ | | | | 426 | | | | 430,400 | |
MDC Holdings, Inc.
6.00%, 01/15/2043 | | | | | | | 86 | | | | 89,218 | |
Resorts World Las Vegas LLC/RWLV Capital, Inc.
4.625%, 04/16/2029(a) | | | | | | | 1,000 | | | | 892,950 | |
| | | | | | | | | | | | |
| | | | | | | | | | | 1,525,776 | |
| | | | | | | | | | | | |
Consumer Cyclical - Retailers – 0.2% | | | | | | | | | | | | |
Macy’s Retail Holdings LLC
5.875%, 03/15/2030(a) | | | | | | | 299 | | | | 287,812 | |
| | | | | | | | | | | | |
| | | |
Consumer Non-Cyclical – 0.9% | | | | | | | | | | | | |
BAT Capital Corp.
6.00%, 02/20/2034 | | | | | | | 59 | | | | 62,076 | |
7.081%, 08/02/2053 | | | | | | | 116 | | | | 132,895 | |
Charles River Laboratories International, Inc.
3.75%, 03/15/2029(a) | | | | | | | 347 | | | | 321,843 | |
4.00%, 03/15/2031(a) | | | | | | | 143 | | | | 129,090 | |
4.25%, 05/01/2028(a) | | | | | | | 58 | | | | 55,668 | |
CVS Health Corp.
5.70%, 06/01/2034 | | | | | | | 184 | | | | 187,875 | |
HCA, Inc.
3.625%, 03/15/2032 | | | | | | | 40 | | | | 36,109 | |
Imperial Brands Finance PLC
5.875%, 07/01/2034(a) | | | | | | | 202 | | | | 205,596 | |
IQVIA, Inc.
6.25%, 02/01/2029 | | | | | | | 57 | | | | 59,535 | |
JBS USA Holding Lux SARL/JBS USA Food Co./JBS Lux Co. SARL
6.75%, 03/15/2034(a) | | | | | | | 126 | | | | 137,598 | |
| | |
| |
24 | AB HIGH YIELD ETF | | abfunds.com |
PORTFOLIO OF INVESTMENTS (continued)
| | | | | | | | | | | | |
| | | | | | Principal
Amount
(000) | | | U.S. $ Value | |
| |
Pilgrim’s Pride Corp.
3.50%, 03/01/2032 | | | U.S.$ | | | | 148 | | | $ | 130,307 | |
6.875%, 05/15/2034 | | | | | | | 72 | | | | 78,832 | |
| | | | | | | | | | | | |
| | | | | | | | | | | 1,537,424 | |
| | | | | | | | | | | | |
Energy – 1.4% | | | | | | | | | | | | |
Antero Resources Corp.
5.375%, 03/01/2030(a) | | | | | | | 180 | | | | 176,922 | |
Continental Resources, Inc./OK
2.875%, 04/01/2032(a) | | | | | | | 14 | | | | 11,785 | |
4.90%, 06/01/2044 | | | | | | | 16 | | | | 13,429 | |
5.75%, 01/15/2031(a) | | | | | | | 16 | | | | 16,138 | |
Energy Transfer LP
8.00%, 05/15/2054 | | | | | | | 65 | | | | 69,047 | |
EQM Midstream Partners LP
4.125%, 12/01/2026 | | | | | | | 192 | | | | 192,000 | |
4.50%, 01/15/2029(a) | | | | | | | 74 | | | | 71,779 | |
4.75%, 01/15/2031(a) | | | | | | | 87 | | | | 83,585 | |
5.50%, 07/15/2028 | | | | | | | 26 | | | | 26,485 | |
6.50%, 07/01/2027(a) | | | | | | | 216 | | | | 221,394 | |
7.50%, 06/01/2027(a) | | | | | | | 464 | | | | 476,723 | |
7.50%, 06/01/2030(a) | | | | | | | 130 | | | | 140,774 | |
Expand Energy Corp.
5.70%, 01/23/2025(h) | | | | | | | 32 | | | | 31,983 | |
8.375%, 09/15/2028 | | | | | | | 10 | | | | 10,279 | |
Marathon Oil Corp.
6.80%, 03/15/2032 | | | | | | | 17 | | | | 19,180 | |
Occidental Petroleum Corp.
5.20%, 08/01/2029 | | | | | | | 103 | | | | 103,689 | |
5.375%, 01/01/2032 | | | | | | | 107 | | | | 106,921 | |
ONEOK, Inc.
5.70%, 11/01/2054 | | | | | | | 225 | | | | 224,336 | |
Var Energi ASA
7.50%, 01/15/2028(a) | | | | | | | 200 | | | | 213,110 | |
8.00%, 11/15/2032(a) | | | | | | | 200 | | | | 229,962 | |
| | | | | | | | | | | | |
| | | | | | | | | | | 2,439,521 | |
| | | | | | | | | | | | |
Other Industrial – 0.5% | | | | | | | | | | | | |
American Builders & Contractors Supply Co., Inc.
4.00%, 01/15/2028(a) | | | | | | | 662 | | | | 635,692 | |
Ritchie Bros Holdings, Inc.
6.75%, 03/15/2028(a) | | | | | | | 218 | | | | 224,165 | |
| | | | | | | | | | | | |
| | | | | | | | | | | 859,857 | |
| | | | | | | | | | | | |
Transportation - Airlines – 0.7% | | | | | | | | | | | | |
Air Canada
3.875%, 08/15/2026(a) | | | | | | | 743 | | | | 722,590 | |
| | |
| |
| abfunds.com | | AB HIGH YIELD ETF | 25 |
PORTFOLIO OF INVESTMENTS (continued)
| | | | | | | | | | | | |
| | | | | | Principal
Amount
(000) | | | U.S. $ Value | |
| |
AS Mileage Plan IP Ltd.
5.021%, 10/20/2029(a) | | | U.S.$ | | | | 46 | | | $ | 45,006 | |
5.308%, 10/20/2031(a) | | | | | | | 85 | | | | 83,333 | |
Delta Air Lines, Inc./SkyMiles IP Ltd.
4.75%, 10/20/2028(a) | | | | | | | 45 | | | | 44,677 | |
United Airlines, Inc.
4.375%, 04/15/2026(a) | | | | | | | 419 | | | | 413,054 | |
| | | | | | | | | | | | |
| | | | | | | | | | | 1,308,660 | |
| | | | | | | | | | | | |
Transportation - Services – 0.3% | | | | | | | | | | | | |
AerCap Global Aviation Trust
6.50%, 06/15/2045(a) | | | | | | | 200 | | | | 199,778 | |
United Rentals North America, Inc.
3.875%, 11/15/2027 | | | | | | | 247 | | | | 238,442 | |
| | | | | | | | | | | | |
| | | | | | | | | | | 438,220 | |
| | | | | | | | | | | | |
| | | | | | | | | | | 16,750,778 | |
| | | | | | | | | | | | |
Financial Institutions – 6.7% | |
Banking – 5.6% | |
AIB Group PLC
6.608%, 09/13/2029(a) | | | | | | | 102 | | | | 107,638 | |
Ally Financial, Inc.
6.70%, 02/14/2033 | | | | | | | 93 | | | | 95,853 | |
6.848%, 01/03/2030 | | | | | | | 83 | | | | 87,130 | |
Series B
4.70%, 05/15/2026(k) | | | | | | | 164 | | | | 154,445 | |
Banco Bilbao Vizcaya Argentaria SA
6.033%, 03/13/2035 | | | | | | | 200 | | | | 203,838 | |
Banco Santander SA
6.35%, 03/14/2034 | | | | | | | 200 | | | | 208,786 | |
6.921%, 08/08/2033 | | | | | | | 400 | | | | 432,452 | |
Bank of Ireland Group PLC
5.601%, 03/20/2030(a) | | | | | | | 239 | | | | 244,141 | |
Barclays PLC
5.69%, 03/12/2030 | | | | | | | 217 | | | | 221,650 | |
BNP Paribas SA
4.625%, 02/25/2031(a)(k) | | | | | | | 454 | | | | 383,058 | |
BPCE SA
Series E
0.75%, 03/03/2031(a) | | | EUR | | | | 100 | | | | 90,814 | |
CaixaBank SA
6.037%, 06/15/2035(a) | | | U.S.$ | | | | 200 | | | | 206,288 | |
6.84%, 09/13/2034(a) | | | | | | | 245 | | | | 266,124 | |
Capital One Financial Corp.
5.463%, 07/26/2030 | | | | | | | 174 | | | | 176,593 | |
6.051%, 02/01/2035 | | | | | | | 82 | | | | 85,578 | |
7.624%, 10/30/2031 | | | | | | | 63 | | | | 70,517 | |
| | |
| |
26 | AB HIGH YIELD ETF | | abfunds.com |
PORTFOLIO OF INVESTMENTS (continued)
| | | | | | | | | | | | |
| | | | | | Principal
Amount
(000) | | | U.S. $ Value | |
| |
Citigroup, Inc.
5.592%, 11/19/2034 | | | U.S.$ | | | | 190 | | | $ | 190,990 | |
5.827%, 02/13/2035 | | | | | | | 211 | | | | 214,971 | |
Series AA
7.625%, 11/15/2028(k) | | | | | | | 32 | | | | 33,908 | |
Series W
4.00%, 12/10/2025(k) | | | | | | | 18 | | | | 17,597 | |
Series Y
4.15%, 11/15/2026(k) | | | | | | | 46 | | | | 44,161 | |
Deutsche Bank AG/New York NY
3.729%, 01/14/2032 | | | | | | | 387 | | | | 341,698 | |
7.079%, 02/10/2034 | | | | | | | 204 | | | | 214,690 | |
HSBC Holdings PLC
5.546%, 03/04/2030 | | | | | | | 200 | | | | 203,480 | |
Intesa Sanpaolo SpA
4.198%, 06/01/2032(a) | | | | | | | 200 | | | | 176,964 | |
5.71%, 01/15/2026(a) | | | | | | | 667 | | | | 669,181 | |
JPMorgan Chase & Co.
2.963%, 01/25/2033 | | | | | | | 36 | | | | 31,683 | |
Lloyds Banking Group PLC
4.976%, 08/11/2033 | | | | | | | 200 | | | | 196,846 | |
5.59%, 11/26/2035 | | | | | | | 217 | | | | 220,722 | |
6.00%, 06/07/2032(k) | | | GBP | | | | 8 | | | | 9,380 | |
7.50%, 09/27/2025(k) | | | U.S.$ | | | | 219 | | | | 220,108 | |
Morgan Stanley
5.424%, 07/21/2034 | | | | | | | 31 | | | | 31,607 | |
NatWest Group PLC
3.032%, 11/28/2035 | | | | | | | 223 | | | | 195,054 | |
PNC Financial Services Group, Inc. (The)
Series R
8.317% (CME Term SOFR 3 Month + 3.30%), 12/02/2024(k)(l) | | | | | | | 62 | | | | 62,000 | |
Santander Holdings USA, Inc.
5.353%, 09/06/2030 | | | | | | | 221 | | | | 221,000 | |
6.174%, 01/09/2030 | | | | | | | 46 | | | | 47,422 | |
6.499%, 03/09/2029 | | | | | | | 10 | | | | 10,385 | |
6.565%, 06/12/2029 | | | | | | | 6 | | | | 6,264 | |
Santander UK Group Holdings PLC
6.833%, 11/21/2026 | | | | | | | 353 | | | | 358,577 | |
Societe Generale SA
3.625%, 03/01/2041(a) | | | | | | | 250 | | | | 175,683 | |
5.519%, 01/19/2028(a) | | | | | | | 351 | | | | 353,260 | |
7.367%, 01/10/2053(a) | | | | | | | 200 | | | | 205,960 | |
Standard Chartered PLC
6.17%, 01/09/2027(a) | | | | | | | 289 | | | | 292,208 | |
Synchrony Financial
5.935%, 08/02/2030 | | | | | | | 82 | | | | 83,824 | |
| | |
| |
| abfunds.com | | AB HIGH YIELD ETF | 27 |
PORTFOLIO OF INVESTMENTS (continued)
| | | | | | | | | | | | |
| | | | | | Principal
Amount
(000) | | | U.S. $ Value | |
| |
Toronto-Dominion Bank (The)
5.146%, 09/10/2034 | | | U.S.$ | | | | 261 | | | $ | 258,643 | |
Truist Financial Corp.
Series L
8.31% (CME Term SOFR 3 Month + 3.36%), 12/16/2024(k)(l) | | | | | | | 63 | | | | 63,054 | |
UBS Group AG
9.25%, 11/13/2028(a)(k) | | | | | | | 355 | | | | 385,842 | |
UniCredit SpA
1.982%, 06/03/2027(a) | | | | | | | 230 | | | | 219,542 | |
5.861%, 06/19/2032(a) | | | | | | | 600 | | | | 600,396 | |
7.296%, 04/02/2034(a) | | | | | | | 202 | | | | 212,142 | |
Wells Fargo & Co.
Series BB
3.90%, 03/15/2026(k) | | | | | | | 111 | | | | 107,854 | |
| | | | | | | | | | | | |
| | | | | | | | | | | 9,712,001 | |
| | | | | | | | | | | | |
Finance – 0.5% | | | | | | | | | | | | |
Air Lease Corp.
Series B
4.65%, 06/15/2026(k) | | | | | | | 50 | | | | 48,749 | |
Aircastle Ltd.
5.25%, 06/15/2026(a)(k) | | | | | | | 29 | | | | 28,476 | |
Aviation Capital Group LLC
1.95%, 01/30/2026(a) | | | | | | | 2 | | | | 1,931 | |
1.95%, 09/20/2026(a) | | | | | | | 73 | | | | 69,122 | |
3.50%, 11/01/2027(a) | | | | | | | 9 | | | | 8,638 | |
4.875%, 10/01/2025(a) | | | | | | | 3 | | | | 2,995 | |
HAT Holdings I LLC/HAT Holdings II LLC
3.375%, 06/15/2026(a) | | | | | | | 93 | | | | 89,916 | |
8.00%, 06/15/2027(a) | | | | | | | 88 | | | | 91,922 | |
Jefferies Finance LLC/JFIN Co-Issuer Corp.
6.625%, 10/15/2031(a) | | | | | | | 200 | | | | 201,348 | |
Rocket Mortgage LLC/Rocket Mortgage Co-Issuer, Inc.
2.875%, 10/15/2026(a) | | | | | | | 192 | | | | 183,195 | |
3.625%, 03/01/2029(a) | | | | | | | 237 | | | | 218,713 | |
| | | | | | | | | | | | |
| | | | | | | | | | | 945,005 | |
| | | | | | | | | | | | |
Insurance – 0.5% | | | | | | | | | | | | |
ACE Capital Trust II
9.70%, 04/01/2030 | | | | | | | 20 | | | | 24,234 | |
Athene Global Funding
1.985%, 08/19/2028(a) | | | | | | | 108 | | | | 97,248 | |
2.55%, 11/19/2030(a) | | | | | | | 28 | | | | 24,349 | |
2.717%, 01/07/2029(a) | | | | | | | 43 | | | | 39,350 | |
5.526%, 07/11/2031(a) | | | | | | | 294 | | | | 301,382 | |
5.583%, 01/09/2029(a) | | | | | | | 14 | | | | 14,304 | |
| | |
| |
28 | AB HIGH YIELD ETF | | abfunds.com |
PORTFOLIO OF INVESTMENTS (continued)
| | | | | | | | | | | | |
| | | | | | Principal
Amount
(000) | | | U.S. $ Value | |
| |
Global Atlantic Fin Co.
4.70%, 10/15/2051(a) | | | U.S.$ | | | | 59 | | | $ | 57,020 | |
6.75%, 03/15/2054(a) | | | | | | | 86 | | | | 90,712 | |
Liberty Mutual Group, Inc.
7.80%, 03/15/2037(a) | | | | | | | 55 | | | | 61,617 | |
Swiss Re Subordinated Finance PLC
5.698%, 04/05/2035(a) | | | | | | | 200 | | | | 203,034 | |
| | | | | | | | | | | | |
| | | | | | | | | | | 913,250 | |
| | | | | | | | | | | | |
REITs – 0.1% | | | | | | | | | | | | |
Newmark Group, Inc.
7.50%, 01/12/2029 | | | | | | | 204 | | | | 216,279 | |
| | | | | | | | | | | | |
| | | | | | | | | | | 11,786,535 | |
| | | | | | | | | | | | |
Utility – 0.2% | | | | | | | | | | | | |
Electric – 0.2% | | | | | | | | | | | | |
American Electric Power Co., Inc.
6.95%, 12/15/2054 | | | | | | | 80 | | | | 83,822 | |
NextEra Energy Capital Holdings, Inc.
6.70%, 09/01/2054 | | | | | | | 43 | | | | 43,890 | |
Niagara Mohawk Power Corp.
5.29%, 01/17/2034(a) | | | | | | | 80 | | | | 80,222 | |
NRG Energy, Inc.
7.00%, 03/15/2033(a) | | | | | | | 55 | | | | 60,331 | |
Pacific Gas and Electric Co.
5.55%, 05/15/2029 | | | | | | | 35 | | | | 35,896 | |
Vistra Operations Co., LLC
6.95%, 10/15/2033(a) | | | | | | | 71 | | | | 78,444 | |
| | | | | | | | | | | | |
| | | | | | | | | | | 382,605 | |
| | | | | |
Total Corporates - Investment Grade
(cost $28,254,423) | | | | | | | | | | | 28,919,918 | |
| | | | | |
| | | | | | | | | | | | |
BANK LOANS – 1.9% | | | | | | | | | | | | |
Industrial – 1.7% | | | | | | | | | | | | |
Capital Goods – 0.0% | | | | | | | | | | | | |
ACProducts Holdings, Inc.
9.115% (SOFR 3 Month + 4.25%), 05/17/2028(m) | | | | | | | 96 | | | | 76,387 | |
| | | | | |
| | | |
Communications - Media – 0.6% | | | | | | | | | | | | |
Advantage Sales & Marketing, Inc.
9.121% (SOFR 3 Month + 4.25%), 10/28/2027(m) | | | | | | | 37 | | | | 36,504 | |
DirecTV Financing LLC
10.097% (SOFR 3 Month + 5.25%), 08/02/2029(m) | | | | | | | 440 | | | | 432,978 | |
Gray Television, Inc.
7.786% (SOFR 1 Month + 3.00%), 12/01/2028(m) | | | | | | | 353 | | | | 324,760 | |
| | |
| |
| abfunds.com | | AB HIGH YIELD ETF | 29 |
PORTFOLIO OF INVESTMENTS (continued)
| | | | | | | | | | | | |
| | | | | | Principal
Amount
(000) | | | U.S. $ Value | |
| |
iHeartCommunications, Inc. (fka Clear Channel Communications, Inc.)
05/01/2026(n) | | | U.S.$ | | | | 260 | | | $ | 225,550 | |
| | | | | | | | | | | | |
| | | | | | | | | | | 1,019,792 | |
| | | | | | | | | | | | |
Communications - Telecommunications – 0.1% | | | | | | | | | | | | |
Crown Subsea Communications Holding, Inc.
8.573% (SOFR 1 Month + 4.00%), 01/30/2031(m) | | | | | | | 50 | | | | 50,467 | |
Lumen Technologies, Inc.
04/15/2029(n) | | | | | | | 64 | | | | 59,459 | |
| | | | | | | | | | | | |
| | | | | | | | | | | 109,926 | |
| | | | | | | | | | | | |
Consumer Non-Cyclical – 0.4% | | | | | | | | | | | | |
Gainwell Acquisition Corp.
8.704% (SOFR 3 Month + 4.00%), 10/01/2027(m) | | | | | | | 39 | | | | 36,810 | |
Neptune BidCo US, Inc.
9.758% (SOFR 3 Month + 5.00%), 04/11/2029(m) | | | | | | | 576 | | | | 523,384 | |
US Radiology Specialists, Inc. (US Outpatient Imaging Services, Inc.)
9.354% (SOFR 3 Month + 4.75%), 12/15/2027(m) | | | | | | | 87 | | | | 87,832 | |
| | | | | | | | | | | | |
| | | | | | | | | | | 648,026 | |
| | | | | | | | | | | | |
Other Industrial – 0.0% | | | | | | | | | | | | |
American Tire Distributors, Inc.
13.159% (SOFR 3 Month + 8.25%), 10/20/2028(m) | | | | | | | 80 | | | | 17,730 | |
| | | | | | | | | | | | |
| | | |
Technology – 0.4% | | | | | | | | | | | | |
Ascend Learning LLC
10.423% (SOFR 1 Month + 5.75%), 12/10/2029(m) | | | | | | | 50 | | | | 49,875 | |
Clover Holding 2 LLC
11/01/2031(c)(n) | | | | | | | 402 | | | | 399,990 | |
Loyalty Ventures, Inc.
14.000% (PRIME 3 Month + 5.50%), 11/03/2027(c)(e)(m)(o) | | | | | | | 115 | | | | 864 | |
MedAssets Software Intermediate Holdings, Inc.
7.750% (SOFR + 4.00%), 12/17/2029(c)(m) | | | | | | | 28 | | | | 17,737 | |
8.725% (SOFR + 4.00%), 12/17/2028(c)(m) | | | | | | | 5 | | | | 4,362 | |
Project Alpha Intermediate Holding, Inc.
11/22/2032(c)(n) | | | | | | | 260 | | | | 260,975 | |
Veritas US, Inc.
11.75% (PRIME 3 Month + 4.00%), 09/01/2025(m) | | | | | | | 81 | | | | 79,159 | |
| | | | | | | | | | | | |
| | | | | | | | | | | 812,962 | |
| | | | | | | | | | | | |
| | |
| |
30 | AB HIGH YIELD ETF | | abfunds.com |
PORTFOLIO OF INVESTMENTS (continued)
| | | | | | | | | | | | |
| | | | | | Principal
Amount
(000) | | | U.S. $ Value | |
| |
Transportation - Airlines – 0.2% | | | | | | | | | | | | |
AS Mileage Plan IP Ltd.
6.656% (SOFR 3 Month + 2.00%), 10/15/2031(m) | | | U.S.$ | | | | 130 | | | $ | 130,542 | |
Jetblue Airways Corp.
10.274% (SOFR 6 Month + 5.50%), 08/27/2029(m) | | | | | | | 200 | | | | 202,126 | |
| | | | | | | | | | | | |
| | | | | | | | | | | 332,668 | |
| | | | | | | | | | | | |
| | | | | | | | | | | 3,017,491 | |
| | | | | | | | | | | | |
Financial Institutions – 0.2% | | | | | | | | | | | | |
Insurance – 0.1% | | | | | | | | | | | | |
Asurion LLC
8.923% (SOFR 1 Month + 4.25%), 08/19/2028(m) | | | | | | | 158 | | | | 158,163 | |
| | | | | | | | | | | | |
| | | |
Other Finance – 0.1% | | | | | | | | | | | | |
Rackspace Finance LLC
7.497% (SOFR 1 Month + 2.75%), 05/15/2028(m) | | | | | | | 276 | | | | 167,220 | |
| | | | | | | | | | | | |
| | | | | | | | | | | 325,383 | |
| | | | | | | | | | | | |
Total Bank Loans
(cost $3,564,989) | | | | | | | | | | | 3,342,874 | |
| | | | | | | | | | | | |
| | | | | | | | | | | | |
EMERGING MARKETS - CORPORATE BONDS – 1.1% | | | | | | | | | | | | |
Industrial – 1.1% | | | | | | | | | | | | |
Basic – 0.2% | | | | | | | | | | | | |
First Quantum Minerals Ltd.
6.875%, 10/15/2027(a) | | | | | | | 200 | | | | 199,088 | |
9.375%, 03/01/2029(a) | | | | | | | 201 | | | | 214,507 | |
| | | | | | | | | | | | |
| | | | | | | | | | | 413,595 | |
| | | | | | | | | | | | |
Consumer Cyclical - Other – 0.8% | | | | | | | | | | | | |
Melco Resorts Finance Ltd.
5.375%, 12/04/2029(a) | | | | | | | 236 | | | | 216,603 | |
MGM China Holdings Ltd.
4.75%, 02/01/2027(a) | | | | | | | 221 | | | | 213,610 | |
7.125%, 06/26/2031(a) | | | | | | | 331 | | | | 335,758 | |
Studio City Co., Ltd.
7.00%, 02/15/2027(a) | | | | | | | 200 | | | | 200,750 | |
Wynn Macau Ltd.
5.125%, 12/15/2029(a) | | | | | | | 390 | | | | 360,263 | |
| | | | | | | | | | | | |
| | | | | | | | | | | 1,326,984 | |
| | | | | | | | | | | | |
Consumer Cyclical - Retailers – 0.0% | | | | | | | | | | | | |
K2016470219 South Africa Ltd.
Zero Coupon, 06/25/2023(c)(d)(e)(f) | | | ZAR | | | | 1 | | | | – 0 | – |
3.00%, 12/31/2022(c)(d)(e)(f)(g) | | | U.S.$ | | | | 15 | | | | – 0 | – |
| | |
| |
| abfunds.com | | AB HIGH YIELD ETF | 31 |
PORTFOLIO OF INVESTMENTS (continued)
| | | | | | | | | | | | |
| | | | | | Principal
Amount
(000) | | | U.S. $ Value | |
| |
K2016470260 South Africa Ltd.
25.00%, 12/31/2022(c)(d)(e)(f)(g) | | | U.S.$ | | | | 3 | | | $ | – 0 | – |
| | | | | | | | | | | | |
| | | | | | | | | | | – 0 | – |
| | | | | | | | | | | | |
Consumer Non-Cyclical – 0.1% | | | | | | | | | | | | |
Teva Pharmaceutical Finance Netherlands III BV
7.875%, 09/15/2029 | | | | | | | 200 | | | | 215,870 | |
Virgolino de Oliveira Finance SA
10.50%, 01/28/2018(c)(d)(e)(f)(g) | | | | | | | 95 | | | | 10 | |
| | | | | | | | | | | | |
| | | | | | | | | | | 215,880 | |
| | | | | | | | | | | | |
| | | | | | | | | | | 1,956,459 | |
| | | | | | | | | | | | |
Utility – 0.0% | | | | | | | | | | | | |
Electric – 0.0% | | | | | | | | | | | | |
Terraform Global Operating LP
6.125%, 03/01/2026(a) | | | | | | | 28 | | | | 27,989 | |
| | | | | | | | | | | | |
| | | |
Total Emerging Markets - Corporate Bonds
(cost $2,027,104) | | | | | | | | | | | 1,984,448 | |
| | | | | | | | | | | | |
| | | |
| | | | | | Shares | | | | |
PREFERRED STOCKS – 0.1% | | | | | | | | | | | | |
Industrial – 0.1% | | | | | | | | | | | | |
Consumer Cyclical - Automotive – 0.0% | | | | | | | | | | | | |
Exide Technologies
0.00%(c)(e)(f)(g) | | | | | | | 39 | | | | 36,582 | |
| | | | | | | | | | | | |
| | | |
Consumer Cyclical - Other – 0.0% | | | | | | | | | | | | |
Hovnanian Enterprises, Inc.
7.625% | | | | | | | 490 | | | | 8,747 | |
| | | | | | | | | | | | |
| | | |
Other Industrial – 0.1% | | | | | | | | | | | | |
WESCO International, Inc.
Series A
10.625% | | | | | | | 1,425 | | | | 37,150 | |
| | | | | | | | | | | | |
| | | | | | | | | | | 82,479 | |
| | | | | | | | | | | | |
Financial Institutions – 0.0% | | | | | | | | | | | | |
Brokerage – 0.0% | | | | | | | | | | | | |
Osaic Financial Services, Inc.
Series A
8.00% | | | | | | | 2,175 | | | | 39,041 | |
| | | | | | | | | | | | |
| | | |
Total Preferred Stocks
(cost $90,545) | | | | | | | | | | | 121,520 | |
| | | | | | | | | | | | |
| | | | | | | | | | | | |
COMMON STOCKS – 0.0% | | | | | | | | | | | | |
Financials – 0.0% | | | | | | | | | | | | |
Financial Services – 0.0% | | | | | | | | | | | | |
Curo Group Holdings Corp.(c)(e)(f) | | | | | | | 9,491 | | | | 42,709 | |
| | | | | | | | | | | | |
| | |
| |
32 | AB HIGH YIELD ETF | | abfunds.com |
PORTFOLIO OF INVESTMENTS (continued)
| | | | | | | | | | | | |
| Company | | | | | Shares | | | U.S. $ Value | |
| |
Consumer Staples – 0.0% | | | | | | | | | | | | |
Household Products – 0.0% | | | | | | | | | | | | |
Southeastern Grocers, Inc.(c)(e)(f)(i) | | | | | | | 3,584 | | | $ | 3,584 | |
| | | | | | | | | | | | |
| | | |
Industrials – 0.0% | | | | | | | | | | | | |
Electrical Equipment – 0.0% | | | | | | | | | | | | |
Exide Industries Ltd.(c)(e)(f) | | | | | | | 7 | | | | 1,666 | |
| | | | | | | | | | | | |
| | | |
Consumer Discretionary – 0.0% | | | | | | | | | | | | |
Broadline Retail – 0.0% | | | | | | | | | | | | |
ATD New Holdings, Inc.(c)(f) | | | | | | | 1,009 | | | | 373 | |
Edcon Ltd.(f)(o) | | | | | | | 8,218 | | | | – 0 | – |
Edcon Ltd. Series A(c)(e)(f)(o) | | | | | | | 191,574 | | | | – 0 | – |
Edcon Ltd. Series B(c)(e)(f)(o) | | | | | | | 30,276 | | | | – 0 | – |
| | | | | | | | | | | | |
| | | | | | | | | | | 373 | |
| | | | | | | | | | | | |
Energy – 0.0% | | | | | | | | | | | | |
Energy Equipment & Services – 0.0% | | | | | | | | | | | | |
BIS Industries Ltd.(c)(e)(f) | | | | | | | 21,027 | | | | – 0 | – |
CHC Group LLC(c)(e)(f) | | | | | | | 468 | | | | – 0 | – |
| | | | | | | | | | | | |
| | | | | | | | | | | – 0 | – |
| | | | | | | | | | | | |
Total Common Stocks
(cost $276,224) | | | | | | | | | | | 48,332 | |
| | | | | | | | | | | | |
| | | | | | | | | | | | |
RIGHTS – 0.0% | | | | | | | | | | | | |
Utilities – 0.0% | | | | | | | | | | | | |
Independent Power and Renewable Electricity Producers – 0.0% | | | | | | | | | | | | |
Vistra Energy Corp., expiring 12/31/2046(c)(f)(k)
(cost $0) | | | | | | | 3,442 | | | | 4,216 | |
| | | | | | | | | | | | |
| | | | | | | | | | | | |
SHORT-TERM INVESTMENTS – 1.2% | | | | | | | | | | | | |
Investment Companies – 1.2% | | | | | | | | | | | | |
AB Fixed Income Shares, Inc. – Government Money Market Portfolio – Class AB,
4.54%(p)(q)(r)
(cost $2,001,793) | | | | | | | 2,001,793 | | | | 2,001,793 | |
| | | | | | | | | | | | |
| | | |
Total Investments – 98.8%
(cost $172,194,203) | | | | | | | | | | | 172,986,888 | |
Other assets less liabilities – 1.2% | | | | | | | | | | | 2,119,799 | |
| | | | | | | | | | | | |
| | | |
Net Assets – 100.0% | | | | | | | | | | $ | 175,106,687 | |
| | | | | | | | | | | | |
| | |
| |
| abfunds.com | | AB HIGH YIELD ETF | 33 |
PORTFOLIO OF INVESTMENTS (continued)
FUTURES (see Note D)
| | | | | | | | | | | | | | | | |
| Description | | Number of Contracts | | | Expiration
Month | | | Current
Notional | | | Value and
Unrealized
Appreciation
(Depreciation) | |
Sold Contracts | |
U.S. Long Bond (CBT) Futures | | | 9 | | | | March 2025 | | | $ | 1,075,500 | | | $ | (9,461 | ) |
U.S. T-Note 10 Yr (CBT) Futures | | | 30 | | | | March 2025 | | | | 3,335,625 | | | | (41,016 | ) |
| | | | | | | | | | | | | | | | |
| | | $ | (50,477 | ) |
| | | | | |
FORWARD CURRENCY EXCHANGE CONTRACTS (see Note D)
| | | | | | | | | | | | | | | | | | | | | | | | |
| Counterparty | | Contracts to
Deliver
(000) | | | In Exchange
For
(000) | | | Settlement
Date | | | Unrealized
Appreciation
(Depreciation) | |
Bank of America, NA | | | EUR | | | | 2,637 | | | | USD | | | | 2,849 | | | | 12/20/2024 | | | $ | 62,538 | |
State Street Bank & Trust Co. | | | EUR | | | | 206 | | | | USD | | | | 222 | | | | 12/20/2024 | | | | 4,974 | |
State Street Bank & Trust Co. | | | USD | | | | 142 | | | | EUR | | | | 135 | | | | 12/20/2024 | | | | 938 | |
State Street Bank & Trust Co. | | | GBP | | | | 214 | | | | USD | | | | 275 | | | | 01/16/2025 | | | | 3,436 | |
| | | | | | | | | | | | | | | | | | | | | | | | |
| | | $ | 71,886 | |
| | | | | |
CENTRALLY CLEARED CREDIT DEFAULT SWAPS (see Note D)
| | | | | | | | | | | | | | | | | | | | | | | | | | | | |
| Description | | Fixed
Rate
(Pay)
Receive | | | Payment
Frequency | | | Implied
Credit
Spread at
November 30,
2024 | | | Notional
Amount
(000) | | | Market
Value | | | Upfront
Premiums
Paid
(Received) | | | Unrealized
Appreciation
(Depreciation) | |
Sale Contracts | |
Hertz Corp. (The),
06/20/2029* | | | 5.00 | % | | | Quarterly | | | | 16.85 | % | | | USD 80 | | | $ | (25,405 | ) | | $ | (11,263 | ) | | $ | (14,142 | ) |
| (a) | Security is exempt from registration under Rule 144A or Regulation S of the Securities Act of 1933. These securities are considered restricted, but liquid and may be resold in transactions exempt from registration. At November 30, 2024, the aggregate market value of these securities amounted to $137,055,278 or 78.3% of net assets. |
| (b) | Pay-In-Kind Payments (PIK). The issuer may pay cash interest and/or interest in additional debt securities. Rates shown are the rates in effect at November 30, 2024. |
| (c) | Security in which significant unobservable inputs (Level 3) were used in determining fair value. |
| (d) | Defaulted matured security. |
| (e) | Fair valued by the Adviser. |
| (f) | Non-income producing security. |
| | |
| |
34 | AB HIGH YIELD ETF | | abfunds.com |
PORTFOLIO OF INVESTMENTS (continued)
| (g) | Security is exempt from registration under Rule 144A or Regulation S of the Securities Act of 1933. These securities, which represent 0.02% of net assets as of November 30, 2024, are considered illiquid and restricted. Additional information regarding such securities follows: |
| | | | | | | | | | | | | | | | |
144A/Restricted & Illiquid
Securities | | Acquisition
Date | | | Cost | | | Market
Value | | | Percentage of
Net Assets | |
Exide Technologies
0.00% | | | 11/05/2020 | | | $ | 29,328 | | | $ | 36,582 | | | | 0.02 | % |
Exide Technologies (Exchange Priority)
11.00%, 10/31/2024 | | | 10/29/2020 | | | | – 0 | – | | | – 0 | – | | | 0.00 | % |
Exide Technologies (First Lien)
11.00%, 10/31/2024 | | | 10/29/2020 | | | | – 0 | – | | | – 0 | – | | | 0.00 | % |
K2016470219 South Africa Ltd.
3.00%, 12/31/2022 | |
| 02/05/2020-
05/12/2023 |
| | | 14,181 | | | | – 0 | – | | | 0.00 | % |
K2016470260 South Africa Ltd.
25.00%, 12/31/2022 | | | 08/16/2023 | | | | – 0 | – | | | – 0 | – | | | 0.00 | % |
Magnetation LLC/Mag Finance Corp.
11.00%, 05/15/2018 | | | 02/19/2015 | | | | 36,767 | | | | – 0 | – | | | 0.00 | % |
Virgolino de Oliveira Finance SA
10.50%, 01/28/2018 | | | 02/13/2013 | | | | 95,493 | | | | 10 | | | | 0.00 | % |
| (h) | Coupon rate adjusts periodically based upon a predetermined schedule. Stated interest rate in effect at November 30, 2024. |
| (k) | Securities are perpetual and, thus, do not have a predetermined maturity date. The date shown, if applicable, reflects the next call date. |
| (l) | Floating Rate Security. Stated interest/floor/ceiling rate was in effect at November 30, 2024. |
| (m) | The stated coupon rate represents the greater of the SOFR or an alternate base rate such as the PRIME or the SOFR/PRIME floor rate plus a spread at November 30, 2024. |
| (n) | This position or a portion of this position represents an unsettled loan purchase. The coupon rate will be determined at the time of settlement and will be based upon the Secured Overnight Financing Rate (“SOFR”) plus a premium which was determined at the time of purchase. |
| (p) | Affiliated investments. |
| (q) | To obtain a copy of the fund’s shareholder report, please go to the Securities and Exchange Commission’s website at www.sec.gov, or call AB at (800) 227-4618. |
| (r) | The rate shown represents the 7-day yield as of period end. |
|
| Currency Abbreviations: |
|
| EUR – Euro |
| GBP – Great British Pound |
| USD – United States Dollar |
| ZAR – South African Rand |
Glossary:
CBT – Chicago Board of Trade
CME – Chicago Mercantile Exchange
EURIBOR – Euro Interbank Offered Rate
REIT – Real Estate Investment Trust
SOFR – Secured Overnight Financing Rate
See notes to financial statements.
| | |
| |
| abfunds.com | | AB HIGH YIELD ETF | 35 |
STATEMENT OF ASSETS & LIABILITIES
November 30, 2024
| | | | |
| Assets | |
Investments in securities, at value | |
Unaffiliated issuers (cost $170,192,410) | | $ | 170,985,095 | |
Affiliated issuers (cost $2,001,793) | | | 2,001,793 | |
Cash | | | 196,111 | |
Cash collateral due from broker | | | 143,594 | |
Foreign currencies, at value (cost $214,298) | | | 212,912 | |
Unaffiliated interest and dividends receivable | | | 2,848,424 | |
Receivable for investment securities sold | | | 189,775 | |
Unrealized appreciation on forward currency exchange contracts | | | 71,886 | |
Affiliated dividends receivable | | | 8,822 | |
Receivable for variation margin on centrally cleared swaps | | | 578 | |
Receivable due from Adviser | | | 399 | |
Other assets | | | 15 | |
| | | | |
Total assets | | | 176,659,404 | |
| | | | |
| Liabilities | |
Payable for investment securities purchased | | | 1,473,155 | |
Advisory fee payable | | | 55,203 | |
Payable for variation margin on futures | | | 14,596 | |
Foreign capital gains tax payable | | | 4,843 | |
Other liabilities | | | 4,920 | |
| | | | |
Total liabilities | | | 1,552,717 | |
| | | | |
Net Assets | | $ | 175,106,687 | |
| | | | |
| Composition of Net Assets | |
Shares of beneficial interest, at par | | $ | 469 | |
Additional paid-in capital | | | 187,538,887 | |
Accumulated loss | | | (12,432,669 | ) |
| | | | |
Net Assets | | $ | 175,106,687 | |
| | | | |
Net Asset Value Per Share—500 million shares of capital stock authorized, $.0001 par value (based on 4,689,045 shares outstanding) | | $ | 37.34 | |
| | | | |
See notes to financial statements.
| | |
| |
36 | AB HIGH YIELD ETF | | abfunds.com |
STATEMENT OF OPERATIONS
Year Ended November 30, 2024
| | | | | | | | |
| Investment Income | | | | | | | | |
Interest | | $ | 9,297,230 | | | | | |
Dividends | | | | | | | | |
Affiliated issuers | | | 96,325 | | | | | |
Unaffiliated issuers | | | 12,216 | | | | | |
Other income | | | 910 | | | $ | 9,406,681 | |
| | | | | | | | |
| Expenses | |
Advisory fee (see Note B) | | | 513,902 | | | | | |
| | | | | | | | |
Total expenses | | | 513,902 | | | | | |
Less: expenses waived and reimbursed by the Adviser (see Note B) | | | (3,355 | ) | | | | |
| | | | | | | | |
Net expenses | | | | | | | 510,547 | |
| | | | | | | | |
Net investment income | | | | | | | 8,896,134 | |
| | | | | | | | |
| Realized and Unrealized Gain (Loss) on Investment and Foreign Currency Transactions | | | | | | | | |
Net realized gain on: | | | | | | | | |
Investment transactions(a) | | | | | | | 600,685 | |
In-kind redemptions | | | | | | | 84,204 | |
Forward currency exchange contracts | | | | | | | 1,488 | |
Futures | | | | | | | 105,798 | |
Swaps | | | | | | | 82,755 | |
Foreign currency transactions | | | | | | | 21,462 | |
Net change in unrealized appreciation (depreciation) of: | | | | | | | | |
Investments(b) | | | | | | | 4,260,279 | |
Forward currency exchange contracts | | | | | | | 115,458 | |
Futures | | | | | | | (50,477 | ) |
Swaps | | | | | | | (50,902 | ) |
Foreign currency denominated assets and liabilities | | | | | | | (2,768 | ) |
| | | | | | | | |
Net gain on investment and foreign currency transactions | | | | | | | 5,167,982 | |
| | | | | | | | |
Net Increase in Net Assets from Operations | | | | | | $ | 14,064,116 | |
| | | | | | | | |
| (a) | Net of foreign realized capital gains taxes of $895. |
| (b) | Net of increase in accrued foreign capital gains taxes on unrealized gains of $1,361. |
See notes to financial statements.
| | |
| |
| abfunds.com | | AB HIGH YIELD ETF | 37 |
STATEMENT OF CHANGES IN NET ASSETS
| | | | | | | | | | | | |
| | | Year Ended
November 30,
2024 | | | November 1, 2023
November 30,
2023(a) | | | Year Ended
October 31,
2023(b) | |
| Increase (Decrease) in Net Assets from Operations | | | | | | | | | | | | |
Net investment income | | $ | 8,896,134 | | | $ | 449,125 | | | $ | 4,647,646 | |
Net realized gain (loss) on investment transactions | | | 896,392 | | | | (518,776 | ) | | | (3,984,265 | ) |
Net change in unrealized appreciation (depreciation) of investments and foreign currency denominated assets and liabilities | | | 4,271,590 | | | | 3,621,750 | | | | 2,838,773 | |
Contributions from Affiliates (see Note B) | | | – 0 | – | | | – 0 | – | | | 4,505 | |
| | | | | | | | | | | | |
Net increase in net assets from operations | | | 14,064,116 | | | | 3,552,099 | | | | 3,506,659 | |
Distribution to Shareholders | | | | | | | | | | | | |
Class A | | | – 0 | – | | | – 0 | – | | | (40,418 | ) |
Advisor Class | | | (8,311,593 | ) | | | (336,075 | ) | | | (4,868,448 | ) |
Class Z | | | – 0 | – | | | – 0 | – | | | (2,010 | ) |
Return of Capital | | | | | | | | | | | | |
Class A | | | – 0 | – | | | – 0 | – | | | – 0 | – |
Advisor Class | | | – 0 | – | | | (131,359 | ) | | | – 0 | – |
Class Z | | | – 0 | – | | | – 0 | – | | | – 0 | – |
| Transactions in Shares of the Fund | | | | | | | | | | | | |
Net increase | | | 89,695,258 | | | | 2,668,573 | | | | 6,997,017 | |
Other capital | | | 4,362 | | | | 1,830 | | | | 8,846 | |
| | | | | | | | | | | | |
Total increase | | | 95,452,143 | | | | 5,755,068 | | | | 5,601,646 | |
| Net Assets | | | | | | | | | | | | |
Beginning of period | | | 79,654,544 | | | | 73,899,476 | | | | 68,297,830 | |
| | | | | | | | | | | | |
End of period | | $ | 175,106,687 | | | $ | 79,654,544 | | | $ | 73,899,476 | |
| | | | | | | | | | | | |
| (a) | The Acquired Portfolio had a fiscal year end of October 31. The Fund has a fiscal year end of November 30. |
| (b) | After the close of business on May 12, 2023, AB High Yield Portfolio (the “Acquired Portfolio”) was reorganized into AB High Yield ETF. The amounts disclosed include those of the Acquired Portfolio. See Note A for additional information on the reorganization. |
See notes to financial statements.
| | |
| |
38 | AB HIGH YIELD ETF | | abfunds.com |
NOTES TO FINANCIAL STATEMENTS
November 30, 2024
NOTE A
Significant Accounting Policies
AB Active ETFs, Inc. (the “Corporation”) is registered under the Investment Company Act of 1940 (the “1940 Act”) as an open-end management investment company. The Corporation, which is a Maryland corporation, operates as a series company comprised of 15 funds currently in operation. Each fund is considered to be a separate entity for financial reporting and tax purposes. This report relates only to the AB High Yield ETF (the “Fund”), a diversified portfolio. The Fund commenced investment operations on May 15, 2023. At meetings held on January 31—February 1, 2023, the Fund’s Board of Directors (the “Board”) approved the reorganization of AB High Yield Portfolio, a portfolio of AB Bond Fund, Inc (the “Acquired Portfolio) into the Fund (the “Conversion”), to be managed by AllianceBernstein L.P. (the “Adviser”). Pursuant to an Agreement and Plan of Acquisition and Termination, (“The Plan”) the Acquired Portfolio was converted into an ETF, the Fund (the “Acquiring Portfolio”) with the same investment objective, and the same investment policies and investment strategies as the Acquired Portfolio on the closing date of the Conversion, May 12, 2023. In connection with the Conversion, the assets and liabilities of the Acquired Portfolio were transferred to the Acquiring Portfolio, and stockholders of the Acquired Portfolio received shares of the Acquiring Portfolio equal in aggregate net asset value (“NAV”) to the NAV of their shares of the Acquired Portfolio (less cash corresponding to any fractional share amount). The Acquired Portfolio had a fiscal year end of October 31, however the Fund has a fiscal year end of November 30. See Note H for additional information regarding the Conversion. The Acquired Portfolio was the accounting survivor in the Conversion and as such, the financial statements and the financial highlights reflect the financial information of the Acquired Portfolio through May 12, 2023. The financial statements have been prepared in conformity with U.S. generally accepted accounting principles (“U.S. GAAP”), which require management to make certain estimates and assumptions that affect the reported amounts of assets and liabilities in the financial statements and amounts of income and expenses during the reporting period. Actual results could differ from those estimates. The Fund is an investment company under U.S. GAAP and follows the accounting and reporting guidance applicable to investment companies. The following is a summary of significant accounting policies followed by the Fund.
1. Security Valuation
Portfolio securities are valued at market value determined on the basis of market quotations or, if market quotations are not readily available or are unreliable, at “fair value” as determined in accordance with procedures approved by and under the oversight of the Board. Pursuant to these procedures, the Adviser serves as the Fund’s valuation designee pursuant
| | |
| |
| abfunds.com | | AB HIGH YIELD ETF | 39 |
NOTES TO FINANCIAL STATEMENTS (continued)
to Rule 2a-5 of the 1940 Act. In this capacity, the Adviser is responsible, among other things, for making all fair value determinations relating to the Fund’s portfolio investments, subject to the Board’s oversight.
In general, the market values of securities which are readily available and deemed reliable are determined as follows: securities listed on a national securities exchange (other than securities listed on the NASDAQ Stock Market, Inc. (“NASDAQ”)) or on a foreign securities exchange are valued at the last sale price at the close of the exchange or foreign securities exchange. If there has been no sale on such day, the securities are valued at the last traded price from the previous day. Securities listed on more than one exchange are valued by reference to the principal exchange on which the securities are traded; securities listed only on NASDAQ are valued in accordance with the NASDAQ Official Closing Price; listed or over the counter (“OTC”) market put or call options are valued at the mid level between the current bid and ask prices. If either a current bid or current ask price is unavailable, the Adviser will have discretion to determine the best valuation (e.g., last trade price in the case of listed options); open futures are valued using the closing settlement price or, in the absence of such a price, the most recent quoted bid price. If there are no quotations available for the day of valuation, the last available closing settlement price is used; U.S. Government securities and any other debt instruments having 60 days or less remaining until maturity are generally valued at fair value by an independent pricing service. If an independent fair value price is not available, the securities are valued at amortized cost. This methodology is commonly used for short term securities that have an original maturity of 60 days or less, as well as short term securities that had an original term to maturity that exceeded 60 days. In instances when amortized cost is utilized, the Valuation Committee (the “Committee”) must reasonably conclude that the utilization of amortized cost is approximately the same as the fair value of the security. Factors the Committee will consider include, but are not limited to, an impairment of the creditworthiness of the issuer or material changes in interest rates. Fixed-income securities, including mortgage-backed and asset-backed securities, may be valued on the basis of prices provided by a pricing service or at a price obtained from one or more of the major broker-dealers. In cases where broker-dealer quotes are obtained, the Adviser may establish procedures whereby changes in market yields or spreads are used to adjust, on a daily basis, a recently obtained quoted price on a security. Swaps and other derivatives are valued daily, primarily using independent pricing services, independent pricing models using market inputs, as well as third party broker-dealers or counterparties. Open-end mutual funds are valued at the closing net asset value per share, while exchange-traded funds are valued at the closing market price per share.
| | |
| |
40 | AB HIGH YIELD ETF | | abfunds.com |
NOTES TO FINANCIAL STATEMENTS (continued)
Securities for which market quotations are not readily available (including restricted securities) or are deemed unreliable are valued at fair value as deemed appropriate by the Adviser. Factors considered in making this determination may include, but are not limited to, information obtained by contacting the issuer, analysts, analysis of the issuer’s financial statements or other available documents. In addition, the Fund may use fair value pricing for securities primarily traded in non-U.S. markets because most foreign markets close well before the Fund values its securities at 4:00 p.m., Eastern Time. The earlier close of these foreign markets gives rise to the possibility that significant events may have occurred in the interim and may materially affect the value of those securities. To account for this, the Fund generally values many of its foreign equity securities using fair value prices at the discretion of the Adviser.
2. Fair Value Measurements
In accordance with U.S. GAAP regarding fair value measurements, fair value is defined as the price that the Fund would receive to sell an asset or pay to transfer a liability in an orderly transaction between market participants at the measurement date. U.S. GAAP establishes a framework for measuring fair value, and a three-level hierarchy for fair value measurements based upon the transparency of inputs to the valuation of an asset or liability (including those valued based on their market values as described in Note A.1 above). Inputs may be observable or unobservable and refer broadly to the assumptions that market participants would use in pricing the asset or liability. Observable inputs reflect the assumptions market participants would use in pricing the asset or liability based on market data obtained from sources independent of the Fund. Unobservable inputs reflect the Fund’s own assumptions about the assumptions that market participants would use in pricing the asset or liability based on the best information available in the circumstances. Each investment is assigned a level based upon the observability of the inputs which are significant to the overall valuation. The three-tier hierarchy of inputs is summarized below.
| | • | | Level 1—quoted prices in active markets for identical investments |
| | • | | Level 2—other significant observable inputs (including quoted prices for similar investments, interest rates, prepayment speeds, credit risk, etc.) |
| | • | | Level 3—significant unobservable inputs (including the Fund’s own assumptions in determining the fair value of investments) |
The fair value of debt instruments, such as bonds, and over-the-counter derivatives is generally based on market price quotations, recently executed market transactions (where observable) or industry recognized modeling techniques and are generally classified as Level 2. Pricing vendor
| | |
| |
| abfunds.com | | AB HIGH YIELD ETF | 41 |
NOTES TO FINANCIAL STATEMENTS (continued)
inputs to Level 2 valuations may include quoted prices for similar investments in active markets, interest rate curves, coupon rates, currency rates, yield curves, option adjusted spreads, default rates, credit spreads and other unique security features in order to estimate the relevant cash flows which are then discounted to calculate fair values. If these inputs are unobservable and significant to the fair value, these investments will be classified as Level 3.
Where readily available market prices or relevant bid prices are not available for certain equity investments, such investments may be valued based on similar publicly traded investments, movements in relevant indices since last available prices or based upon underlying company fundamentals and comparable company data (such as multiples to earnings or other multiples to equity). Where an investment is valued using an observable input, such as another publicly traded security, the investment will be classified as Level 2. If management determines that an adjustment is appropriate based on restrictions on resale, illiquidity or uncertainty, and such adjustment is a significant component of the valuation, the investment will be classified as Level 3. An investment will also be classified as Level 3 where management uses company fundamentals and other significant inputs to determine the valuation.
Valuations of mortgage-backed or other asset-backed securities, by pricing vendors, are based on both proprietary and industry recognized models and discounted cash flow techniques. Significant inputs to the valuation of these instruments are value of the collateral, the rates and timing of delinquencies, the rates and timing of prepayments, and default and loss expectations, which are driven in part by housing prices for residential mortgages. Significant inputs are determined based on relative value analyses, which incorporate comparisons to instruments with similar collateral and risk profiles, including relevant indices. Mortgage and asset-backed securities for which management has collected current observable data through pricing services are generally categorized within Level 2. Those investments for which current observable data has not been provided are classified as Level 3.
Bank loan prices are provided by third party pricing services and consist of a composite of the quotes received by the vendor into a consensus price. Certain bank loans are classified as Level 3, as a significant input used in the fair value measurement of these instruments is the market quotes that are received by the vendor and these inputs are not observable.
Other fixed income investments, including non-U.S. government and corporate debt, are generally valued using quoted market prices, if available, which are typically impacted by current interest rates, maturity dates and
| | |
| |
42 | AB HIGH YIELD ETF | | abfunds.com |
NOTES TO FINANCIAL STATEMENTS (continued)
any perceived credit risk of the issuer. Additionally, in the absence of quoted market prices, these inputs are used by pricing vendors to derive a valuation based upon industry or proprietary models which incorporate issuer specific data with relevant yield/spread comparisons with more widely quoted bonds with similar key characteristics. Those investments for which there are observable inputs are classified as Level 2. Where the inputs are not observable, the investments are classified as Level 3.
The following table summarizes the valuation of the Fund’s investments by the above fair value hierarchy levels as of November 30, 2024:
| | | | | | | | | | | | | | | | |
Investments in
Securities: | | Level 1 | | | Level 2 | | | Level 3 | | | Total | |
Assets: | |
Corporates – Non-Investment Grade | | $ | – 0 | – | | $ | 136,563,787 | | | $ | 0 | (a) | | $ | 136,563,787 | |
Corporates – Investment Grade | | | – 0 | – | | | 28,919,918 | | | | – 0 | – | | | 28,919,918 | |
Bank Loans | | | – 0 | – | | | 2,658,946 | | | | 683,928 | | | | 3,342,874 | |
Emerging Markets – Corporate Bonds | | | – 0 | – | | | 1,984,438 | | | | 10 | (a) | | | 1,984,448 | |
Preferred Stocks | | | 45,897 | | | | 39,041 | | | | 36,582 | | | | 121,520 | |
Common Stocks | | | – 0 | – | | | – 0 | – | | | 48,332 | (a) | | | 48,332 | |
Rights | | | – 0 | – | | | – 0 | – | | | 4,216 | | | | 4,216 | |
Short-Term Investments | | | 2,001,793 | | | | – 0 | – | | | – 0 | – | | | 2,001,793 | |
| | | | | | | | | | | | | | | | |
Total Investments in Securities | | | 2,047,690 | | | | 170,166,130 | | | | 773,068 | (a) | | | 172,986,888 | |
Other Financial Instruments(b): | | | | | | | | | | | | | | | | |
Assets: | | | | | | | | | | | | | | | | |
Forward Currency Exchange Contracts | | | – 0 | – | | | 71,886 | | | | – 0 | – | | | 71,886 | |
Liabilities: | | | | | | | | | | | | | | | | |
Futures | | | (50,477 | ) | | | – 0 | – | | | – 0 | – | | | (50,477 | )(c) |
Centrally Cleared Credit Default Swaps | | | – 0 | – | | | (25,405 | ) | | | – 0 | – | | | (25,405 | )(c) |
| | | | | | | | | | | | | | | | |
Total | | $ | 1,997,213 | | | $ | 170,212,611 | | | $ | 773,068 | (a) | | $ | 172,982,892 | |
| | | | | | | | | | | | | | | | |
| (a) | The Fund held securities with zero market value at period end. |
| (b) | Other financial instruments include derivative instruments, such as futures, forwards and swaps. Derivative instruments are valued at the unrealized appreciation (depreciation) on the instrument. Other financial instruments may also include swaps with upfront premiums, written options and written swaptions which are valued at market value. |
| (c) | Only variation margin receivable (payable) at period end is reported within the statement of assets and liabilities. This amount reflects cumulative unrealized appreciation (depreciation) on futures and centrally cleared swaps as reported in the portfolio of investments. Where applicable, centrally cleared swaps with upfront premiums are presented here at market value. |
| | |
| |
| abfunds.com | | AB HIGH YIELD ETF | 43 |
NOTES TO FINANCIAL STATEMENTS (continued)
3. Currency Translation
Assets and liabilities denominated in foreign currencies and commitments under forward currency exchange contracts are translated into U.S. dollars at the mean of the quoted bid and ask prices of such currencies against the U.S. dollar. Purchases and sales of portfolio securities are translated into U.S. dollars at the rates of exchange prevailing when such securities were acquired or sold. Income and expenses are translated into U.S. dollars at rates of exchange prevailing when accrued.
Net realized gain or loss on foreign currency transactions represents foreign exchange gains and losses from sales and maturities of foreign fixed income investments, holding of foreign currencies, currency gains or losses realized between the trade and settlement dates on foreign investment transactions, and the difference between the amounts of dividends, interest and foreign withholding taxes recorded on the Fund’s books and the U.S. dollar equivalent amounts actually received or paid. Net unrealized currency gains and losses from valuing foreign currency denominated assets and liabilities at period end exchange rates are reflected as a component of net unrealized appreciation or depreciation of foreign currency denominated assets and liabilities.
4. Taxes
It is the Fund’s policy to meet the requirements of the Internal Revenue Code applicable to regulated investment companies and to distribute all of its investment company taxable income and net realized gains, if any, to shareholders. Therefore, no provisions for federal income or excise taxes are required. The Fund may be subject to taxes imposed by countries in which it invests. Such taxes are generally based on income and/or capital gains earned or repatriated. Taxes are accrued and applied to net investment income, net realized gains and net unrealized appreciation/depreciation as such income and/or gains are earned.
In accordance with U.S. GAAP requirements regarding accounting for uncertainties in income taxes, management has analyzed the Fund’s tax positions taken or expected to be taken on federal and state income tax returns for all open tax years (the current and the prior three tax years) and has concluded that no provision for income tax is required in the Fund’s financial statements.
5. Investment Income and Investment Transactions
Dividend income is recorded on the ex-dividend date or as soon as the Fund is informed of the dividend. Interest income is accrued daily. Investment transactions are accounted for on the date the securities are purchased or sold. Investment gains or losses are determined on the identified cost basis. Non-cash dividends, if any, are recorded on the ex-dividend
| | |
| |
44 | AB HIGH YIELD ETF | | abfunds.com |
NOTES TO FINANCIAL STATEMENTS (continued)
date at the fair value of the securities received. The Fund amortizes premiums and accretes discounts as adjustments to interest income.
The Fund accounts for distributions received from real estate investment trust (“REIT”) investments or from regulated investment companies as dividend income, realized gain, or return of capital based on information provided by the REIT or the investment company.
6. Class Allocations
Prior to the Conversion, all income earned and expenses incurred by the Acquired Portfolio were borne on a pro-rata basis by each settled class of shares, based on the proportionate interest in the Acquired Portfolio represented by the net assets of such class, except for class specific expenses which are allocated to the respective class. Expenses of AB Bond Fund, Inc. were charged proportionately to each portfolio or based on other appropriate methods. Realized and unrealized gains and losses were allocated among the various share classes based on respective net assets.
7. Dividends and Distributions
Dividends and distributions to shareholders, if any, are recorded on the ex-dividend date. Income dividends and capital gains distributions are determined in accordance with federal tax regulations and may differ from those determined in accordance with U.S. GAAP. To the extent these differences are permanent, such amounts are reclassified within the capital accounts based on their federal tax basis treatment; temporary differences do not require such reclassification.
8. Offering Expenses
The Adviser has agreed to pay all of the Fund’s organization and offering costs. The Fund is not obligated to repay any such organizational expenses or offering costs paid by the Adviser.
9. Cash and Short-Term Investments
Cash and short-term investments include cash on hand and short-term investments with maturities of less than one year when purchased.
NOTE B
Advisory Fee and Other Transactions with Affiliates
Under the terms of the investment advisory agreement, the Fund pays the Adviser a unitary advisory fee at an annual rate of .40% of the Fund’s average daily net assets. The fees are accrued daily and paid monthly. Prior to May 12, 2023, the Acquired Portfolio paid the Adviser an advisory fee at an annual rate of .45% of the first $2.5 billion, .425% of the next $2.5 billion and .40% in excess of $5 billion of the Fund’s average daily net assets. The Adviser has agreed to waive its fees and bear certain
| | |
| |
| abfunds.com | | AB HIGH YIELD ETF | 45 |
NOTES TO FINANCIAL STATEMENTS (continued)
expenses to the extent necessary to limit total expenses (other than acquired fund fees and expenses other than the advisory fees of any AB mutual funds in which the Fund may invest, interest expense, taxes, extraordinary expenses, and brokerage commissions and other transaction costs) on an annual basis (the “Expense Cap”) to .60% of daily average net assets.
Under the investment advisory agreement, in accordance with the unitary fee structure, the Adviser bears the cost of various third-party services required by the Fund, including audit, custodial, accounting, legal, transfer agency and printing costs and the fees and expenses of the Corporation’s directors and their counsel. Also under the investment advisory agreement, the Adviser will reimburse each Fund for the Fund’s share of the acquired funds fees and expenses (advisory fees and other expenses) of any pooled investment vehicle for which the Adviser serves as investment adviser. For the year ended November 30, 2024, such waiver/ reimbursements relating to the Fund’s investment in AB Government Money Market Portfolio amounted to $3,355.
A summary of the Fund’s transactions in AB mutual funds for the year ended November 30, 2024 is as follows:
| | | | | | | | | | | | | | | | | | | | |
Fund | | Market Value
11/30/23
(000) | | | Purchases
at Cost
(000) | | | Sales
Proceeds
(000) | | | Market Value
11/30/24
(000) | | | Dividend
Income
(000) | |
AB Government Money Market Portfolio | | $ | 1,834 | | | $ | 40,135 | | | $ | 39,967 | | | $ | 2,002 | | | $ | 96 | |
During the year ended October 31, 2023, the Adviser reimbursed the Fund $4,505 for trading losses incurred due to a trade entry error.
NOTE C
Distribution Plan
Effective May 12, 2023, the Fund has adopted a Distribution and Service Plan (the “Plan”) pursuant to Rule 12b-1 of the Act which permits the Fund to pay distribution and servicing fees not to exceed .25% per year of the Fund’s average daily net assets, provided that the Fund will not make any 12b-1 payments under the Plan without prior Board and stockholder approval. No such fees are currently paid. Prior to the Conversion, the Acquired Portfolio paid distribution and servicing fees to the Distributor at an annual rate of up to .25% of the Acquired Portfolio’s average daily net assets attributable to Class A shares. There were no distribution and servicing fees on Advisor Class and Class Z shares. The fees were accrued daily and paid monthly.
| | |
| |
46 | AB HIGH YIELD ETF | | abfunds.com |
NOTES TO FINANCIAL STATEMENTS (continued)
NOTE D
Investment Transactions
Purchases and sales of investment securities (excluding short-term investments and in-kind purchases and sales) for the year ended November 30, 2024 were as follows:
| | | | | | | | |
| | | Purchases | | | Sales | |
Investment securities (excluding
U.S. government securities) | | $ | 96,991,045 | | | $ | 90,257,779 | |
U.S. government securities | | | – 0 | – | | | – 0 | – |
During the year ended November 30, 2024, the Fund delivered portfolio securities for the redemption of Fund shares (in-kind redemptions). Cash and portfolio securities were transferred for redemptions at fair value. For financial reporting purposes, the Fund recorded net realized gains and losses in connection with each in-kind redemption transaction. For the year ended November 30, 2024, the Fund had in-kind purchases and in-kind sales as follows:
| | | | | | | | |
| | | Purchases | | | Sales | |
In-kind transactions (excluding
U.S. government securities) | | $ | 86,372,565 | | | $ | 4,574,415 | |
U.S. government securities | | | – 0 | – | | | – 0 | – |
The cost of investments for federal income tax purposes, gross unrealized appreciation and unrealized depreciation are as follows:
| | | | |
Cost | | $ | 172,303,115 | |
| | | | |
Gross unrealized appreciation | | $ | 3,378,172 | |
Gross unrealized depreciation | | | (2,709,341 | ) |
| | | | |
Net unrealized appreciation | | $ | 668,831 | |
| | | | |
1. Derivative Financial Instruments
The Fund may use derivatives in an effort to earn income and enhance returns, to replace more traditional direct investments, to obtain exposure to otherwise inaccessible markets (collectively, “investment purposes”), or to hedge or adjust the risk profile of its portfolio.
The principal types of derivatives utilized by the Fund, as well as the methods in which they may be used are:
The Fund may buy or sell futures for investment purposes or for the purpose of hedging its portfolio against adverse effects of potential movements in the market. The Fund bears the market risk that arises from changes in the value of these instruments and the imperfect
| | |
| |
| abfunds.com | | AB HIGH YIELD ETF | 47 |
NOTES TO FINANCIAL STATEMENTS (continued)
correlation between movements in the price of the futures and movements in the price of the assets, reference rates or indices which they are designed to track. Among other things, the Fund may purchase or sell futures for foreign currencies or options thereon for non-hedging purposes as a means of making direct investment in foreign currencies, as described below under “Currency Transactions”.
At the time the Fund enters into futures, the Fund deposits with the broker or segregates at its custodian cash or securities as collateral to satisfy initial margin requirements set by the exchange on which the transaction is effected. Pursuant to the contract, with respect to cash collateral, the Fund agrees to receive from or pay to the broker an amount of cash equal to the daily fluctuation in the value of the contract; in the case of securities collateral, the Fund agrees to adjust the securities position held in the segregated account accordingly. Such receipts, payments or adjustments are known as variation margin and are recorded by the Fund as unrealized gains or losses. Risks may arise from the potential inability of a counterparty to meet the terms of the contract. The credit/counterparty risk for exchange-traded futures is generally less than privately negotiated futures, since the clearinghouse, which is the issuer or counterparty to each exchange-traded future, has robust risk mitigation standards, including the requirement to provide initial and variation margin. When the contract is closed, the Fund records a realized gain or loss equal to the difference between the value of the contract at the time it was opened and the time it was closed. Use of long futures subjects the Fund to risk of loss in excess of the amounts shown on the statement of assets and liabilities, up to the notional value of the futures. Use of short futures subjects the Fund to unlimited risk of loss. Under some circumstances, futures exchanges may establish daily limits on the amount that the price of futures can vary from the previous day’s settlement price, which could effectively prevent liquidation of unfavorable positions.
During the year ended November 30, 2024, the Fund held futures for hedging purposes.
| | • | | Forward Currency Exchange Contracts |
The Fund may enter into forward currency exchange contracts in order to hedge its exposure to changes in foreign currency exchange rates on its foreign portfolio holdings, to hedge certain firm purchase and sale commitments denominated in foreign currencies and for non-hedging purposes as a means of making direct investments in foreign currencies, as described below under “Currency Transactions”.
A forward currency exchange contract is a commitment to purchase or sell a foreign currency at a future date at a negotiated forward rate.
| | |
| |
48 | AB HIGH YIELD ETF | | abfunds.com |
NOTES TO FINANCIAL STATEMENTS (continued)
The gain or loss arising from the difference between the original contract and the closing of such contract would be included in net realized gain or loss on forward currency exchange contracts. Fluctuations in the value of open forward currency exchange contracts are recorded for financial reporting purposes as unrealized appreciation and/or depreciation by the Fund. Risks may arise from the potential inability of a counterparty to meet the terms of a contract and from unanticipated movements in the value of a foreign currency relative to the U.S. dollar.
During the year ended November 30, 2024, the Fund held forward currency exchange contracts for hedging purposes.
The Fund may enter into swaps for investment purposes or to hedge its exposure to interest rates, credit risk, equity markets or currencies. The Fund may also enter into swaps for non-hedging purposes as a means of gaining market exposures, making direct investments in foreign currencies, as described below under “Currency Transactions” or in order to take a “long” or “short” position with respect to an underlying referenced asset described below under “Total Return Swaps”. A swap is an agreement that obligates two parties to exchange a series of cash flows at specified intervals based upon or calculated by reference to changes in specified prices, rates or indexes for a specified amount of an underlying asset or inflation. The payment flows are usually netted against each other, with the difference being paid by one party to the other. In addition, collateral may be pledged or received by the Fund in accordance with the terms of the respective swaps to provide value and recourse to the Fund or its counterparties in the event of default, bankruptcy or insolvency by one of the parties to the swap.
Risks may arise as a result of the failure of the counterparty to the swap to comply with the terms of the swap. The loss incurred by the failure of a counterparty is generally limited to the net interim payment to be received by the Fund, and/or the termination value at the end of the contract. Therefore, the Fund considers the creditworthiness of each counterparty to a swap in evaluating potential counterparty risk. This risk is mitigated by having a netting arrangement between the Fund and the counterparty and by the posting of collateral by the counterparty to the Fund to cover the Fund’s exposure to the counterparty. Additionally, risks may arise from unanticipated movements in interest rates, inflation or in the value of the underlying securities. The Fund accrues for the interim payments on swaps on a daily basis, with the net amount recorded within unrealized appreciation/ depreciation of swaps on the statement of assets and
| | |
| |
| abfunds.com | | AB HIGH YIELD ETF | 49 |
NOTES TO FINANCIAL STATEMENTS (continued)
liabilities, where applicable. Once the interim payments are settled in cash, the net amount is recorded as realized gain/(loss) on swaps on the statement of operations, in addition to any realized gain/(loss) recorded upon the termination of swaps. Upfront premiums paid or received for swaps are recognized as cost or proceeds on the statement of assets and liabilities and are amortized on a straight line basis over the life of the contract. Amortized upfront premiums are included in net realized gain/(loss) from swaps on the statement of operations. Fluctuations in the value of swaps are recorded as a component of net change in unrealized appreciation/ depreciation of swaps on the statement of operations.
Certain standardized swaps, including certain interest rate swaps and credit default swaps, are subject to mandatory central clearing. Cleared swaps are transacted through futures commission merchants (“FCMs”) that are members of central clearinghouses, with the clearinghouse serving as central counterparty, similar to transactions in futures contracts. Centralized clearing will be required for additional categories of swaps on a phased-in basis based on requirements published by the Securities and Exchange Commission and Commodity Futures Trading Commission.
At the time the Fund enters into a centrally cleared swap, the Fund deposits with the broker or segregates at its custodian cash or securities as collateral to satisfy initial margin requirements set by the clearinghouse on which the transaction is effected. Pursuant to the contract, with respect to cash collateral, the Fund agrees to receive from or pay to the broker an amount of cash equal to the daily fluctuation in the value of the contract; in the case of securities collateral, the Fund agrees to adjust the securities position held in the segregated account accordingly. Such receipts, payments or adjustments are known as variation margin and are recorded by the Fund as unrealized gains or losses. Risks may arise from the potential inability of a counterparty to meet the terms of the contract. The credit/counterparty risk for centrally cleared swaps is generally less than non-centrally cleared swaps, since the clearinghouse, which is the issuer or counterparty to each centrally cleared swap, has robust risk mitigation standards, including the requirement to provide initial and variation margin. When the contract is closed, the Fund records a realized gain or loss equal to the difference between the value of the contract at the time it was opened and the time it was closed.
Credit Default Swaps:
The Fund may enter into credit default swaps, including to manage its exposure to the market or certain sectors of the market, to reduce its risk exposure to defaults by corporate and sovereign issuers held by the
| | |
| |
50 | AB HIGH YIELD ETF | | abfunds.com |
NOTES TO FINANCIAL STATEMENTS (continued)
Fund, or to create exposure to corporate or sovereign issuers to which it is not otherwise exposed. The Fund may purchase credit protection (“Buy Contract”) or provide credit protection (“Sale Contract”) on the referenced obligation of the credit default swap. During the term of the swap, the Fund receives/(pays) fixed payments from/(to) the respective counterparty, calculated at the agreed upon rate applied to the notional amount. If the Fund is a buyer/(seller) of protection and a credit event occurs, as defined under the terms of the swap, the Fund will either (i) receive from the seller/(pay to the buyer) of protection an amount equal to the notional amount of the swap (the “Maximum Payout Amount”) and deliver/(take delivery of) the referenced obligation or (ii) receive/(pay) a net settlement amount in the form of cash or securities equal to the notional amount of the swap less the recovery value of the referenced obligation. In certain circumstances Maximum Payout Amounts may be partially offset by recovery values of the respective referenced obligations, upfront premium received upon entering into the agreement, or net amounts received from settlement of buy protection credit default swaps entered into by the Fund for the same referenced obligations with the same counterparty.
Credit default swaps may involve greater risks than if the Fund had invested in the referenced obligation directly. Credit default swaps are subject to general market risk, liquidity risk, counterparty risk and credit risk. If the Fund is a buyer of protection and no credit event occurs, it will lose the payments it made to its counterparty. If the Fund is a seller of protection and a credit event occurs, the value of the referenced obligation received by the Fund coupled with the periodic payments previously received, may be less than the Maximum Payout Amount it pays to the buyer, resulting in a net loss to the Fund.
Implied credit spreads over U.S. Treasuries of comparable maturity utilized in determining the market value of credit default swaps on issuers as of period end are disclosed in the portfolio of investments. The implied spreads serve as an indicator of the current status of the payment/performance risk and typically reflect the likelihood of default by the issuer of the referenced obligation. The implied credit spread of a particular reference obligation also reflects the cost of buying/selling protection and may reflect upfront payments required to be made to enter into the agreement. Widening credit spreads typically represent a deterioration of the referenced obligation’s credit soundness and greater likelihood of default or other credit event occurring as defined under the terms of the agreement. A credit spread identified as “Defaulted” indicates a credit event has occurred for the referenced obligation.
During the year ended November 30, 2024, the Fund held credit default swaps for hedging and non-hedging purposes.
| | |
| |
| abfunds.com | | AB HIGH YIELD ETF | 51 |
NOTES TO FINANCIAL STATEMENTS (continued)
The Fund typically enters into International Swaps and Derivatives Association, Inc. Master Agreements (“ISDA Master Agreement”) with its OTC derivative contract counterparties in order to, among other things, reduce its credit risk to OTC counterparties. ISDA Master Agreements include provisions for general obligations, representations, collateral and events of default or termination. Under an ISDA Master Agreement, the Fund typically may offset with the OTC counterparty certain derivative financial instruments’ payables and/or receivables with collateral held and/or posted and create one single net payment (close-out netting) in the event of default or termination. In the event of a default by an OTC counterparty, the return of collateral with market value in excess of the Fund’s net liability, held by the defaulting party, may be delayed or denied.
The Fund’s ISDA Master Agreements may contain provisions for early termination of OTC derivative transactions in the event the net assets of the Fund decline below specific levels (“net asset contingent features”). If these levels are triggered, the Fund’s OTC counterparty has the right to terminate such transaction and require the Fund to pay or receive a settlement amount in connection with the terminated transaction. If OTC derivatives were held at period end, please refer to netting arrangements by the OTC counterparty table below for additional details.
During the year ended November 30, 2024, the Fund had entered into the following derivatives:
| | | | | | | | | | | | |
| | | Asset Derivatives | | | Liability Derivatives | |
Derivative Type | | Statement of
Assets and
Liabilities
Location | | Fair Value | | | Statement of
Assets and
Liabilities
Location | | Fair Value | |
Interest rate contracts | | | | | | | | Payable for
variation margin
on futures | | $ | 50,477 | * |
| | | | |
Credit contracts | | | | | | | | Payable for
variation margin
on centrally
cleared swaps | | | 14,142 | * |
| | | | |
Foreign currency contracts | | Unrealized
appreciation on
forward currency
exchange contracts | | $ | 71,886 | | | | | | | |
| | | | | | | | | | | | |
Total | | | | $ | 71,886 | | | | | $ | 64,619 | |
| | | | | | | | | | | | |
| * | Only variation margin receivable/payable at period end is reported within the statement of assets and liabilities. This amount reflects cumulative unrealized appreciation (depreciation) on futures and centrally cleared swaps as reported in the portfolio of investments. |
| | |
| |
52 | AB HIGH YIELD ETF | | abfunds.com |
NOTES TO FINANCIAL STATEMENTS (continued)
| | | | | | | | | | |
Derivative Type | | Location of Gain or (Loss) on
Derivatives Within
Statement of
Operations | | Realized Gain
or (Loss) on
Derivatives | | | Change in
Unrealized
Appreciation or
(Depreciation) | |
Interest rate contracts | | Net realized gain (loss) on futures; Net change in unrealized appreciation (depreciation) of futures | | $ | 105,798 | | | $ | (50,477 | ) |
| | | |
Foreign currency contracts | | Net realized gain (loss) on forward currency exchange contracts; Net change in unrealized appreciation (depreciation) of forward currency exchange contracts | | | 1,488 | | | | 115,458 | |
| | | |
Credit contracts | | Net realized gain (loss) on swaps; Net change in unrealized appreciation (depreciation) of swaps | | | 82,755 | | | | (50,902 | ) |
| | | | | | | | | | |
Total | | | | $ | 190,041 | | | $ | 14,079 | |
| | | | | | | | | | |
The following table represents the average monthly volume of the Fund’s derivative transactions during the year ended November 30, 2024:
| | | | |
Futures: | | | | |
Average notional amount of sale contracts | | $ | 4,308,165 | (a) |
Forward Currency Exchange Contracts: | | | | |
Average principal amount of buy contracts | | $ | 141,845 | (b) |
Average principal amount of sale contracts | | $ | 2,343,616 | |
Credit Default Swaps: | | | | |
Average notional amount of buy contracts | | $ | 87,122 | (c) |
Centrally Cleared Credit Default Swaps: | | | | |
Average notional amount of buy contracts | | $ | 336,600 | (d) |
Average notional amount of sale contracts | | $ | 498,488 | |
| (a) | Positions were open for ten months during the year. |
| (b) | Positions were open for three months during the year. |
| (c) | Positions were open for eight months during the year. |
| (d) | Positions were open for one month during the year. |
For financial reporting purposes, the Fund does not offset derivative assets and derivative liabilities that are subject to netting arrangements in the statement of assets and liabilities.
| | |
| |
| abfunds.com | | AB HIGH YIELD ETF | 53 |
NOTES TO FINANCIAL STATEMENTS (continued)
All OTC derivatives held at period end were subject to netting arrangements. The following table presents the Fund’s derivative assets and liabilities by OTC counterparty net of amounts available for offset under ISDA Master Agreements (“MA”) and net of the related collateral received/pledged by the Fund as of November 30, 2024. Exchange-traded derivatives and centrally cleared swaps are not subject to netting arrangements and as such are excluded from the table.
| | | | | | | | | | | | | | | | | | | | |
Counterparty | | Derivative
Assets
Subject to a
MA | | | Derivatives
Available
for Offset | | | Cash
Collateral
Received* | | | Security
Collateral
Received* | | | Net Amount
of Derivative
Assets | |
Bank of America, NA | | $ | 62,538 | | | $ | – 0 | – | | $ | – 0 | – | | $ | – 0 | – | | $ | 62,538 | |
State Street Bank & Trust Co. | | | 9,348 | | | | – 0 | – | | | – 0 | – | | | – 0 | – | | | 9,348 | |
| | | | | | | | | | | | | | | | | | | | |
Total | | $ | 71,886 | | | $ | – 0 | – | | $ | – 0 | – | | $ | – 0 | – | | $ | 71,886 | ^ |
| | | | | | | | | | | | | | | | | | | | |
| * | The actual collateral received/pledged may be more than the amount reported due to over-collateralization. |
| ^ | Net amount represents the net receivable/payable that would be due from/to the counterparty in the event of default or termination. The net amount from OTC financial derivative instruments can only be netted across transactions governed under the same master agreement with the same counterparty. |
2. Currency Transactions
The Fund may invest in non-U.S. Dollar-denominated securities on a currency hedged or unhedged basis. The Fund may seek investment opportunities by taking long or short positions in currencies through the use of currency-related derivatives, including forward currency exchange contracts, futures and options on futures, swaps, and other options. The Fund may enter into transactions for investment opportunities when it anticipates that a foreign currency will appreciate or depreciate in value but securities denominated in that currency are not held by the Fund and do not present attractive investment opportunities. Such transactions may also be used when the Adviser believes that it may be more efficient than a direct investment in a foreign currency-denominated security. The Fund may also conduct currency exchange contracts on a spot basis (i.e., for cash at the spot rate prevailing in the currency exchange market for buying or selling currencies).
NOTE E
Shares of the Fund
The Fund’s shares may only be bought and sold in a secondary market through a broker-dealer at a market price. Because ETF shares trade at market prices rather than NAV, shares may trade at a price greater than NAV (a premium) or less than NAV (a discount). The Fund issues and redeems shares at its NAV only in aggregations of a specified number of shares (a creation unit) generally in exchange for a designated portfolio of securities and/or cash (including any portion of such securities for which cash may be substituted). A fixed transaction fee is imposed on authorized
| | |
| |
54 | AB HIGH YIELD ETF | | abfunds.com |
NOTES TO FINANCIAL STATEMENTS (continued)
participants in connection with creation unit redemption and creation transactions. Authorized participants may be required to pay an additional variable charge to cover certain costs and expenses related to the execution of trades resulting from creation unit transactions. Such variable charges, if any, are included in other capital within the Statement of Changes in Net Assets.
Transactions in shares of the Fund were as follows:
| | | | | | | | | | | | | | | | | | | | | | | | | | | | | | | | |
| | | | | | | | | | | | | | | | | | | | | | | | | | | | | | | | |
| | | Shares | | | | | | Amount | | | | |
| | | Year Ended
November 30,
2024 | | | Period Ended
November 30,
2023(a) | | | Year Ended
October 31,
2023(b) | | | | | | Year Ended
November 30,
2024 | | | Period Ended
November 30,
2023(a) | | | Year Ended
October 31,
2023(b) | | | | |
| | | | | | | | |
| Class A* | | | | | | | | | | | | | | | | | | | | | | | | | | | | | | | | |
Shares sold | | | – 0 | – | | | – 0 | – | | | 53,995 | | | | | | | $ | – 0 | – | | $ | – 0 | – | | $ | 451,271 | | | | | |
| | | | | |
Shares issued in reinvestment of dividends | | | – 0 | – | | | – 0 | – | | | 1,559 | | | | | | | | – 0 | – | | | – 0 | – | | | 13,026 | | | | | |
| | | | | |
Shares converted to Advisor Class | | | – 0 | – | | | – 0 | – | | | (142,504 | ) | | | | | | | – 0 | – | | | – 0 | – | | | (1,192,228 | ) | | | | |
| | | | | |
Shares redeemed | | | – 0 | – | | | – 0 | – | | | (34,844 | ) | | | | | | | – 0 | – | | | – 0 | – | | | (287,168 | ) | | | | |
| | | | | |
Net decrease | | | – 0 | – | | | – 0 | – | | | (121,794 | ) | | | | | | $ | – 0 | – | | $ | – 0 | – | | $ | (1,015,099 | ) | | | | |
| | | | | |
| | | | | | | | | | | | | | | | | | | | | | | | | | | | | | | | |
| Advisor Class | | | | | | | | | | | | | | | | | | | | | | | | | | | | | | | | |
Shares sold | | | 2,575,000 | | | | 125,000 | | | | 947,632 | | | | | | | $ | 94,326,820 | | | $ | 4,418,958 | | | $ | 33,391,949 | | | | | |
| | | | | |
Shares issued in reinvestment of dividends | | | – 0 | – | | | – 0 | – | | | 48,945 | | | | | | | | – 0 | – | | | – 0 | – | | | 1,723,579 | | | | | |
| | | | | |
Shares converted from: | | | | | | | | | | | | | | | | | | | | | | | | | | | | | | | | |
| | | | | |
Class A | | | – 0 | – | | | – 0 | – | | | 33,808 | | | | | | | | – 0 | – | | | – 0 | – | | | 1,192,228 | | | | | |
| | | | | |
Class Z | | | – 0 | – | | | – 0 | – | | | 1,394 | | | | | | | | – 0 | – | | | – 0 | – | | | 49,157 | | | | | |
| | | | | |
Shares redeemed | | | (125,000 | ) | | | (50,000 | ) | | | (809,774 | ) | | | | | | | (4,631,562 | ) | | | (1,750,385 | ) | | | (28,295,615 | ) | | | | |
| | | | | |
Net increase | | | 2,450,000 | | | | 75,000 | | | | 222,005 | | | | | | | $ | 89,695,258 | | | $ | 2,668,573 | | | $ | 8,061,298 | | | | | |
| | | | | |
Class Z* | | | | | | | | | | | | | | | | | | | | | | | | | | | | | | | | |
Shares sold | | | – 0 | – | | | – 0 | – | | | – 0 | – | | | | | | $ | – 0 | – | | $ | – 0 | – | | $ | – 0 | – | | | | |
| | | | | |
Shares issued in reinvestment of dividends | | | – 0 | – | | | – 0 | – | | | 0 | (c) | | | | | | | – 0 | – | | | – 0 | – | | | 1 | | | | | |
| | | | | |
Shares converted to Advisor Class | | | – 0 | – | | | – 0 | – | | | (5,877 | ) | | | | | | | – 0 | – | | | – 0 | – | | | (49,157 | ) | | | | |
| | | | | |
Shares redeemed | | | – 0 | – | | | – 0 | – | | | (3 | ) | | | | | | | – 0 | – | | | – 0 | – | | | (26 | ) | | | | |
| | | | | |
Net decrease | | | – 0 | – | | | – 0 | – | | | (5,880 | ) | | | | | | $ | – 0 | – | | $ | – 0 | – | | $ | (49,182 | ) | | | | |
| | | | | |
| (a) | The Acquired Portfolio had a fiscal year end of October 31. The Fund has a fiscal year end of November 30. |
| (b) | After the close of business on May 12, 2023, AB High Yield Portfolio (the “Acquired Portfolio”) was reorganized into AB High Yield ETF. The amounts disclosed include those of the Acquired Portfolio. See Note A and Note H for additional information on the reorganization. |
| (c) | Amount is less than 0.50 shares. |
| * | Converted to Advisor Class on April 14, 2023. |
| | |
| |
| abfunds.com | | AB HIGH YIELD ETF | 55 |
NOTES TO FINANCIAL STATEMENTS (continued)
NOTE F
Risks Involved in Investing in the Fund
Market Risk—The value of the Fund’s assets will fluctuate as the markets for securities in which the Fund invests fluctuate. The value of the Fund’s investments may decline, sometimes rapidly and unpredictably, simply because of economic changes or other events, including public health crises (including the occurrence of a contagious disease or illness), interest rate levels, and regional and global conflicts, that affect large portions of the market.
Interest-Rate Risk—Changes in interest rates will affect the value of investments in fixed-income securities. When interest rates rise, the value of existing investments in fixed-income securities tends to fall and this decrease in value may not be offset by higher income from new investments. Interest-rate risk is generally greater for fixed-income securities with longer maturities or durations. The Fund may be subject to a greater risk of rising interest rates than would normally be the case due to the recent end of a period of historically low rates and the effect of potential central bank monetary policy, and government fiscal policy, initiatives and market reactions to those initiatives.
Credit Risk—An issuer or guarantor of a fixed-income security may be unable or unwilling to make timely payments of interest or principal, or to otherwise honor its obligations. The issuer or guarantor may default, causing a loss of the full principal amount of a security and accrued interest. The degree of risk for a particular security may be reflected in its credit rating. There is the possibility that the credit rating of a fixed-income security may be downgraded after purchase, which may adversely affect the value of the security.
Below Investment-Grade Securities Risk—Investments in fixed-income securities with lower ratings (commonly known as “junk bonds”) are subject to a higher probability that an issuer will default or fail to meet its payment obligations. These securities may be subject to greater price volatility due to such factors as specific corporate developments and negative perceptions of the junk bond market generally and may be more difficult to trade than other types of securities.
Duration Risk—Duration is a measure that relates the expected price volatility of a fixed-income security to changes in interest rates. The duration of a fixed-income security may be shorter than or equal to the full maturity of a fixed-income security. Fixed-income securities with longer durations have more risk and will decrease in price as interest rates rise. For example, a fixed-income security with a duration of three years will likely decrease in value by approximately 3% if interest rates increase by 1%.
| | |
| |
56 | AB HIGH YIELD ETF | | abfunds.com |
NOTES TO FINANCIAL STATEMENTS (continued)
Inflation Risk—This is the risk that the value of assets or income from investments will be less in the future as inflation decreases the value of money. As inflation increases, the value of the Fund’s assets can decline as can the value of the Fund’s distributions. This risk is significantly greater for fixed-income securities with longer maturities.
Derivatives Risk—Derivatives may be difficult to price or unwind and may be leveraged so that small changes may produce disproportionate losses for the Fund. A short position in a derivative instrument involves the risk of a theoretically unlimited increase in the value of the underlying asset, reference rate or index, which could cause the Fund to suffer a potentially unlimited loss. Derivatives, especially over-the-counter derivatives, are also subject to counterparty risk, which is the risk that the counterparty (the party on the other side of the transaction) on a derivative transaction will be unable or unwilling to honor its contractual obligations to the Fund.
Leverage Risk—When the Fund borrows money or otherwise leverages its investments, its performance may be volatile because leverage tends to exaggerate the effect of any increase or decrease in the value of the Fund’s investments. The Fund may create leverage through the use of reverse repurchase arrangements, forward currency exchange contracts, forward commitments, dollar rolls or futures or by borrowing money. The use of other types of derivative instruments by the Fund, such as options and swaps, may also result in a form of leverage. Leverage may result in higher returns to the Fund than if the Fund were not leveraged, but may also adversely affect returns, particularly if the market is declining.
Foreign (Non-U.S.) Investments Risk—Investments in securities of non-U.S. issuers may involve more risk than those of U.S. issuers. These securities may fluctuate more widely in price and may be more difficult to trade than domestic securities due to adverse market, economic, political, regulatory or other factors.
Emerging Market Risk—Investments in emerging market countries may have more risk because the markets are less developed and less liquid and are subject to increased economic, political, regulatory or other uncertainties.
Currency Risk—Fluctuations in currency exchange rates may negatively affect the value of the Fund’s investments in fixed-income securities denominated in foreign currencies or reduce the Fund’s returns.
Illiquid Investments Risk—Illiquid investments risk exists when certain investments are or become difficult to purchase or sell. Difficulty in selling such investments may result in sales at disadvantageous prices affecting
| | |
| |
| abfunds.com | | AB HIGH YIELD ETF | 57 |
NOTES TO FINANCIAL STATEMENTS (continued)
the value of your investment in the Fund. Causes of illiquid investments risk may include low trading volumes and large positions. Foreign fixed-income securities may have more illiquid investments risk because secondary trading markets for these securities may be smaller and less well-developed and the securities may trade less frequently than domestic securities. Illiquid investments risk may be higher in a rising interest rate environment, when the value and liquidity of fixed-income securities generally go down.
ETF Share Price and Net Asset Value Risk—The Fund’s shares are listed for trading on the NYSE Arca, Inc. (the “Exchange”). The Fund’s shares are generally bought and sold in the secondary market at market prices. The NAV per share of the Fund will fluctuate with changes in the market value of the Fund’s holdings. The Fund’s NAV is calculated once per day, at the end of the day. The market price of a share on the Exchange could be higher than the NAV (premium), or lower than the NAV (discount) and may fluctuate during the trading day. When all or a portion of the Fund’s underlying securities trade in a market that is closed when the market for the Fund’s shares is open, there may be differences between the current value of a security and the last quoted price for that security in the closed local market, which could lead to a deviation between the market value of the Fund’s shares and the Fund’s NAV. Disruptions in the creations and redemptions process or the existence of extreme market volatility could result in the Fund’s shares trading above or below NAV. As the Fund may invest in securities traded on foreign exchanges, Fund shares may trade at a larger premium or discount to the Fund’s NAV per share than shares of other ETFs. In addition, in stressed market conditions, the market for Fund shares may become less liquid in response to deteriorating liquidity in the markets for the Fund’s underlying portfolio holdings.
Authorized Participant Risk—Only a limited number of financial institutions that enter into an authorized participant agreement with the Fund (“Authorized Participants”) may engage in creation or redemption transactions. If the Fund’s Authorized Participants decide not to create or redeem shares, Fund shares may trade at a larger premium or discount to the Fund’s NAV per share, or the Fund could face trading halts or de-listing.
Active Trading Market Risk—There is no guarantee that an active trading market for Fund shares will exist at all times. In times of market stress, markets can suffer erratic or unpredictable trading activity, extraordinary volatility or wide bid/ask spreads, which could cause some market makers and Authorized Participants to reduce their market activity or “step away” from making a market in ETF shares. Market makers and Authorized Participants are not obligated to place or execute purchase and redemption orders. This could cause the Fund’s market price to deviate, materially, from the NAV, and reduce the effectiveness of the ETF arbitrage
| | |
| |
58 | AB HIGH YIELD ETF | | abfunds.com |
NOTES TO FINANCIAL STATEMENTS (continued)
process. Any absence of an active trading market for Fund shares could lead to a heightened risk that there will be a difference between the market price of a Fund share and the underlying value of the Fund share.
Indemnification Risk—In the ordinary course of business, the Fund enters into contracts that contain a variety of indemnifications. The Fund’s maximum exposure under these arrangements is unknown. However, the Fund has not had prior claims or losses pursuant to these indemnification provisions and expects the risk of loss thereunder to be remote. Therefore, the Fund has not accrued any liability in connection with these indemnification provisions.
Management Risk—The Fund is subject to management risk because it is an actively-managed ETF. The Adviser will apply its investment techniques and risk analyses in making investment decisions, but there is no guarantee that its techniques will produce the intended results. Some of these techniques may incorporate, or rely upon, quantitative models, but there is no guarantee that these models will generate accurate forecasts, reduce risk or otherwise perform as expected.
NOTE G
Joint Credit Facility
A number of open-end mutual funds managed by the Adviser, including the Fund, participate in a $325 million revolving credit facility (the “Facility”) intended to provide short-term financing related to redemptions and other short term liquidity requirements, subject to certain restrictions. Commitment fees related to the Facility are paid by the participating funds and are included in miscellaneous expenses in the statement of operations. The Fund did not utilize the Facility during the year ended November 30, 2024.
NOTE H
Distributions to Shareholders
The tax character of distributions paid during the fiscal year ended November 30, 2024 and the fiscal years ended November 30, 2023 and October 31, 2023 were as follows:
| | | | | | | | | | | | |
| | | Year Ended
November 30,
2024 | | | November 1,
2023 to
November 30,
2023 | | | Year Ended
October 31,
2023 | |
Distributions paid from: | | | | | | | | | | | | |
Ordinary income | | $ | 8,311,593 | | | $ | 336,075 | | | $ | 4,910,876 | |
| | | | | | | | | | | | |
Total taxable distributions paid | | | 8,311,593 | | | | 336,075 | | | | 4,910,876 | |
Return of Capital | | | – 0 | – | | | 131,359 | | | | – 0 | – |
| | | | | | | | | | | | |
Total distributions paid | | $ | 8,311,593 | | | $ | 467,434 | | | $ | 4,910,876 | |
| | | | | | | | | | | | |
| | |
| |
| abfunds.com | | AB HIGH YIELD ETF | 59 |
NOTES TO FINANCIAL STATEMENTS (continued)
As of November 30, 2024, the components of accumulated earnings (deficit) on a tax basis were as follows:
| | | | |
Undistributed ordinary income | | $ | 763,269 | |
Accumulated capital and other losses | | | (13,805,916 | )(a) |
Unrealized appreciation (depreciation) | | | 665,015 | (b) |
| | | | |
Total accumulated earnings (deficit) | | $ | (12,377,632 | )(c) |
| | | | |
| (a) | As of November 30, 2024, the Fund had a net capital loss carryforward of $13,805,916. During the fiscal year, the Fund utilized $708,492 of capital loss carry forwards to offset current year net realized gains. |
| (b) | The differences between book-basis and tax-basis unrealized appreciation (depreciation) are attributable primarily to the recognition for tax purposes of unrealized gains/losses on certain derivative instruments, the tax treatment of callable bonds, the tax treatment of swaps, the tax deferral of losses on wash sales, and the tax treatment of partnership investments. |
| (c) | The differences between book-basis and tax-basis components of accumulated earnings (deficit) are attributable primarily to the accrual of foreign capital gains tax and the tax treatment of defaulted securities. |
For tax purposes, net realized capital losses may be carried over to offset future capital gains, if any. Funds are permitted to carry forward capital losses for an indefinite period, and such losses will retain their character as either short-term or long-term capital losses. As of November 30, 2024, the Fund had a net short-term capital loss carryforward of $6,560,050 and a net long-term capital loss carryforward of $7,245,866, which may be carried forward for an indefinite period.
During the current fiscal year, permanent differences primarily due to the tax treatment of gains from a redemption-in-kind resulted in a net increase in accumulated loss and a net increase in additional paid-in capital. These reclassifications had no effect on net assets.
NOTE I
Reorganization
At meetings held on January 31 – February 1, 2023, the Board, on behalf of the Fund, and the Board of Directors of the Acquired Portfolio approved the Conversion providing for the tax-free acquisition by the Fund of the assets and liabilities of the Acquired Portfolio. The acquisition was completed at the close of business May 12, 2023. Pursuant to the Plan, the assets and liabilities of the Acquired Portfolio’s shares were transferred in exchange for Fund shares, in a tax-free exchange as follows:
| | | | | | | | | | | | | | | | |
Portfolio | | Shares
outstanding
before the
Conversion | | | Shares
outstanding
immediately
after the
Conversion | | | Aggregate
net assets
before the
Conversion | | | Aggregate
net assets
immediately
after the
Conversion | |
Acquired Portfolio* | | | 8,071,417 | | | | – 0 | – | | $ | 66,991,486 | + | | $ | – 0 | – |
The Fund | | | – 0 | – | | | 1,914,045 | | | $ | – 0 | – | | $ | 66,991,486 | |
| * | Represents the accounting survivor. |
| + | Includes distributions in excess of net investment income of $1,522,177 and unrealized depreciation on investments of $5,609,148, with a fair value of $63,671,262 and identified cost of $69,280,410. |
| | |
| |
60 | AB HIGH YIELD ETF | | abfunds.com |
NOTES TO FINANCIAL STATEMENTS (continued)
For financial reporting purposes, assets received and shares issued by the Fund were recorded at fair value; however, the cost basis of the investments received from the Acquired Portfolio were carried forward to align ongoing reporting of the Fund’s realized and unrealized gains and losses with amounts distributable to shareholders for tax purposes.
NOTE J
Recent Accounting Pronouncements
In December 2022, the Financial Accounting Standards Board issued an Accounting Standards Update, ASU 2022-06, “Reference Rate Reform (Topic 848) – Deferral of the Sunset Date of Topic 848”. ASU 2022-06 is an amendment to ASU 2020-04, which provided optional guidance to ease the potential accounting burden due to the discontinuation of the LIBOR and other interbank-offered based reference rates and which was effective as of March 12, 2020 through December 31, 2022. ASU 2022-06 extends the effective period through December 31, 2024. Management is currently evaluating the impact, if any, of applying ASU 2022-06.
In November 2023, the Financial Accounting Standards Board issued Accounting Standards Update, ASU 2023-07, “Segment Reporting (Topic 280)”. ASU 2023-07 requires public entities to provide disclosure of significant segment expenses that are regularly provided to the chief operating decision maker (“CODM”). ASU 2023-07, among other things, (i) requires a single segment public entity to provide all necessary disclosures required by Topic 280 it, (ii) requires a public entity to disclose the title and position of the CODM and an explanation of how the CODM uses the reported measure(s) of segment profit and loss in assessing segment performance and deciding how to allocate resources and (iii) provides the ability for a public entity to elect more than one performance measure. ASU 2023-07 is effective for fiscal years beginning after December 15, 2023, and interim periods within fiscal years beginning after December 15, 2024. Early adoption of ASU 2023-07 is permitted. Management is currently evaluating the impact, if any, of applying ASU 2023-07.
NOTE K
Subsequent Events
Management has evaluated subsequent events for possible recognition or disclosure in the financial statements through the date the financial statements are issued. Management has determined that there are no material events that would require disclosure in the Fund’s financial statements through this date.
| | |
| |
| abfunds.com | | AB HIGH YIELD ETF | 61 |
FINANCIAL HIGHLIGHTS
Selected Data For A Share of Capital Stock Outstanding Throughout Each Period(a)
| | | | | | | | | | | | | | | | | | | | | | | | | | | | |
| | | Year Ended November 30, 2024 | | | November 1, 2023 to November 30, 2023(b) | | | Year Ended October 31, | | | January 1, 2021 to October 31, | | | Year Ended
December 31, | |
| |
| | | 2023 | | | 2022 | | | 2021(c) | | | 2020 | | | 2019 | |
| | | | |
Net asset value, beginning of period | | | $ 35.58 | | | | $ 34.15 | | | | $ 34.62 | | | | $ 42.09 | | | | $ 41.58 | | | | $ 40.61 | | | | $ 37.53 | |
| | | | |
Income From Investment Operations | | | | | | | | | | | | | | | | | | | | | | | | | | | | |
| | | | | | | |
Net investment income(d)(e) | | | 2.53 | | | | .21 | | | | 2.34 | | | | 1.90 | | | | 1.60 | | | | 2.11 | | | | 2.19 | |
| | | | | | | |
Net realized and unrealized gain (loss) on investment transactions | | | 1.67 | | | | 1.44 | | | | (.32 | ) | | | (7.09 | ) | | | .68 | | | | 1.26 | | | | 3.25 | |
| | | | | | | |
Contributions from Affiliates | | | – 0 | – | | | – 0 | – | | | .00 | (f) | | | – 0 | – | | | – 0 | – | | | – 0 | – | | | – 0 | – |
| | | | |
Net increase (decrease) in net asset value from operations | | | 4.20 | | | | 1.65 | | | | 2.02 | | | | (5.19 | ) | | | 2.28 | | | | 3.37 | | | | 5.44 | |
| | | | |
Less: Dividends and Distributions | | | | | | | | | | | | | | | | | | | | | | | | | | | | |
| | | | | | | |
Dividends from net investment income | | | (2.44 | ) | | | (.16 | ) | | | (2.49 | ) | | | (2.28 | ) | | | (1.77 | ) | | | (2.40 | ) | | | (2.36 | ) |
| | | | | | | |
Return of capital | | | – 0 | – | | | (.06 | ) | | | – 0 | – | | | – 0 | – | | | – 0 | – | | | – 0 | – | | | – 0 | – |
| | | | |
Total dividends and distributions | | | (2.44 | ) | | | (.22 | ) | | | (2.49 | ) | | | (2.28 | ) | | | (1.77 | ) | | | (2.40 | ) | | | (2.36 | ) |
| | | | |
Net asset value, end of period | | | $ 37.34 | | | | $ 35.58 | | | | $ 34.15 | | | | $ 34.62 | | | | $ 42.09 | | | | $ 41.58 | | | | $ 40.61 | |
| | | | |
| | | | | | | |
Total Return | | | | | | | | | | | | | | | | | | | | | | | | | | | | |
| | | | | | | |
Total investment return based on net asset value(g)* | | | 12.21 | % | | | 4.84 | % | | | 5.86 | % | | | (12.68 | )% | | | 5.56 | % | | | 8.95 | %+ | | | 14.77 | %+ |
| | | | | | | |
Ratios/Supplemental Data | | | | | | | | | | | | | | | | | | | | | | | | | | | | |
| | | | | | | |
Net assets, end of period (000’s omitted) | | | $175,107 | | | | $79,655 | | | | $73,899 | | | | $67,249 | | | | $63,608 | | | | $38,751 | | | | $40,218 | |
| | | | | | | |
Ratio to average net assets of: | | | | | | | | | | | | | | | | | | | | | | | | | | | | |
| | | | | | | |
Expenses, net of waivers/reimbursements(h)(i)+ | | | .40 | % | | | .40 | %^ | | | .50 | % | | | .60 | % | | | .51 | %^ | | | .70 | % | | | .29 | %++ |
| | | | | | | |
Expenses, before waivers/reimbursements(h)(i)+ | | | .40 | % | | | .40 | %^ | | | .86 | % | | | 1.35 | % | | | 1.74 | %^ | | | 2.17 | % | | | 1.84 | %++ |
| | | | | | | |
Net investment income(e) | | | 6.92 | % | | | 7.21 | %^ | | | 6.68 | % | | | 5.00 | % | | | 4.60 | %^ | | | 5.41 | % | | | 5.45 | % |
| | | | | | | |
Portfolio turnover rate(j)+++ | | | 75 | % | | | 4 | % | | | 57 | % | | | 48 | % | | | 36 | % | | | 75 | % | | | 40 | % |
| | | | | | | | | | | | | | | | | | | | | | | | | | | | |
| |
† Expense ratios exclude the estimated acquired fund fees of affiliated/unaffiliated underlying portfolios | |
| | | .00 | % | | | .00 | %^ | | | .00 | % | | | .00 | %^ | | | .00 | % | | | .00 | % | | | .01 | % |
See footnote summary on page 63.
| | |
| |
62 | AB HIGH YIELD ETF | | abfunds.com |
FINANCIAL HIGHLIGHTS (continued)
Selected Data For A Share of Capital Stock Outstanding Throughout Each Period(a)
| (a) | After the close of business on May 12, 2023, AB High Yield Portfolio (the “Acquired Portfolio”) was converted into AB High Yield ETF. The performance and financial history of the Acquired Portfolio’s Advisor Class Shares have been adopted by the Fund and will be used going forward. As a result, the Financial Highlight information includes that of the Acquired Portfolio’s Advisor Class Shares and has been adjusted retroactively for the periods from November 1, 2018 through the Reorganization. |
| (b) | The Acquired Portfolio had a fiscal year end of October 31. The Fund has a fiscal year end of November 30. |
| (c) | The Acquired Portfolio changed its fiscal year end from December 31 to October 31. |
| (d) | Based on average shares outstanding. |
| (e) | Net of expenses waived/reimbursed by the Adviser. |
| (f) | Amount is less than $.005. |
| (g) | Total investment return is calculated assuming an initial investment made at the net asset value at the beginning of the period, reinvestment of all dividends and distributions at net asset value during the period, and redemption on the last day of the period. Total investment return does not reflect the deduction of taxes that a shareholder would pay on fund distributions or the redemption of fund shares. Total investment return calculated for a period of less than one year is not annualized. |
| (h) | In connection with the Fund’s investments in affiliated underlying portfolios, the Fund incurs no direct expenses, but bears proportionate shares of the fees and expenses (i.e., operating, administrative and investment advisory fees) of the affiliated underlying portfolios. The Adviser has contractually agreed to waive its fees from the Fund in an amount equal to the Fund’s pro rata share of certain acquired fund fees and expenses, and for the year ended October 31, 2023 and the year ended December 31, 2019, such waiver amounted to .01% and .01%, respectively. |
| (i) | The expense ratios presented below exclude interest expense: |
| | | | | | | | | | | | | | | | | | | | | | | | | | | | |
| | | Year Ended November 30, | | | November 1,
2023 to
November 30, | | | Year Ended
October 31, | | | January 1,
2021 to
October 31,
2021(c) | | | Year Ended
December 31, | |
| |
| | | 2024 | | | 2023(b) | | | 2023 | | | 2022 | | | 2020 | | | 2019 | |
Net of waivers/reimbursements | | | .40 | % | | | .40 | %^ | | | .50 | % | | | .60 | % | | | .51 | %^ | | | .70 | % | | | .29 | % |
Before waivers/reimbursements | | | .40 | % | | | .40 | %^ | | | .86 | % | | | 1.35 | % | | | 1.74 | %^ | | | 2.17 | % | | | 1.84 | % |
| (j) | Excludes the value of portfolio securities received or delivered as a result of in-kind purchases or redemptions of the Fund’s capital shares, including ETF Creation Units. |
| * | Includes the impact of proceeds received and credited to the Fund resulting from class action settlements, which enhanced the Fund’s performance for the year ended December 31, 2019 by .01%. |
| + | The net asset value and total return include adjustments in accordance with accounting principles generally accepted in the United States of America for financial reporting purposes. As such, the net asset value and total return for shareholder transactions may differ from financial statements. |
| ++ | The advisory fee reflected in the Fund’s expense ratio may be higher or lower than the Base Fee plus Performance Adjustment due to the different time periods over which the fee is calculated (i.e., the financial reporting vs. the Performance Period). |
| +++ | Portfolio turnover is calculated for the Fund as a whole for the full fiscal year or period, as applicable, and is not annualized. |
See notes to financial statements
| | |
| |
| abfunds.com | | AB HIGH YIELD ETF | 63 |
REPORT OF INDEPENDENT REGISTERED
PUBLIC ACCOUNTING FIRM
To the Shareholders and the Board of Directors of
AB High Yield ETF
Opinion on the Financial Statements
We have audited the accompanying statement of assets and liabilities of AB High Yield ETF (the “Fund”) (one of the funds constituting AB Active ETFs, Inc. (the “Corporation”)), including the portfolio of investments, as of November 30, 2024, and the related statement of operations for the year then ended, the statements of changes in net assets for the year then ended and for the period from November 1, 2023 to November 30, 2023 and for the year ended October 31, 2023 and the financial highlights for each of the periods indicated therein through November 30, 2024, and the related notes (collectively referred to as the “financial statements”). In our opinion, the financial statements present fairly, in all material respects, the financial position of the Fund (one of the funds constituting AB Active ETFs, Inc.) at November 30, 2024, the results of its operations for the year then ended, and the changes in its net assets for the year then ended and for the period from November 1, 2023 to November 30, 2023 and for the year ended October 31, 2023 and its financial highlights for each of the periods indicated therein through November 30, 2024, in conformity with U.S. generally accepted accounting principles.
Basis for Opinion
These financial statements are the responsibility of the Corporation’s management. Our responsibility is to express an opinion on the Fund’s financial statements based on our audits. We are a public accounting firm registered with the Public Company Accounting Oversight Board (United States) (“PCAOB”) and are required to be independent with respect to the Corporation in accordance with the U.S. federal securities laws and the applicable rules and regulations of the Securities and Exchange Commission and the PCAOB.
We conducted our audits in accordance with the standards of the PCAOB. Those standards require that we plan and perform the audit to obtain reasonable assurance about whether the financial statements are free of material misstatement, whether due to error or fraud. The Corporation is not required to have, nor were we engaged to perform, an audit of the Corporation’s internal control over financial reporting. As part of our audits, we are required to obtain an understanding of internal control over financial reporting but not for the purpose of expressing an opinion on the effectiveness of the Corporation’s internal control over financial reporting. Accordingly, we express no such opinion.
Our audits included performing procedures to assess the risks of material misstatement of the financial statements, whether due to error or fraud,
| | |
| |
64 | AB HIGH YIELD ETF | | abfunds.com |
REPORT OF INDEPENDENT REGISTERED
PUBLIC ACCOUNTING FIRM (continued)
and performing procedures that respond to those risks. Such procedures included examining, on a test basis, evidence regarding the amounts and disclosures in the financial statements. Our procedures included confirmation of securities owned as of November 30, 2024, by correspondence with the custodian, brokers and others; when replies were not received from brokers or others, we performed other auditing procedures. Our audits also included evaluating the accounting principles used and significant estimates made by management, as well as evaluating the overall presentation of the financial statements. We believe that our audits provide a reasonable basis for our opinion.

We have served as the auditor of one or more of the AB investment companies since 1968.
New York, New York
January 28, 2025
| | |
| |
| abfunds.com | | AB HIGH YIELD ETF | 65 |
2024 FEDERAL TAX INFORMATION
(unaudited)
For Federal income tax purposes, the following information is furnished with respect to the distributions paid by the Fund during the taxable period ended November 30, 2024. For foreign shareholders, 69.47% of ordinary income dividends paid may be considered to be qualifying to be taxed as interest-related dividends.
Shareholders should not use the above information to prepare their income tax returns. The information necessary to complete your income tax returns will be included with your Form 1099-DIV which will be sent to you separately in January 2025.
| | |
| |
66 | AB HIGH YIELD ETF | | abfunds.com |
Information Regarding the Review and Approval of the Fund’s Advisory Agreement
The disinterested directors (the “directors”) of AB Active ETFs, Inc. (the “Company”) unanimously approved the continuance of the Company’s Advisory Agreement with the Adviser in respect of AB High Yield ETF (the “Fund”) at a meeting held in-person on July 30-31, 2024 (the “Meeting”).
Prior to approval of the continuance of the Advisory Agreement, the directors had requested from the Adviser, and received and evaluated, extensive materials. They reviewed the proposed continuance of the Advisory Agreement with the Adviser and with experienced counsel who are independent of the Adviser, who advised on the relevant legal standards. The directors also reviewed additional materials, including comparative analytical data prepared by the Senior Vice President of the Fund. The directors also discussed the proposed continuance in private sessions with counsel.
The directors considered their knowledge of the nature and quality of the services provided by the Adviser to the Fund gained from their experience as directors or trustees of most of the registered investment companies advised by the Adviser, including the other series of the Company that are organized as exchange-traded funds (“ETFs”), their overall confidence in the Adviser’s integrity and competence they have gained from that experience, the Adviser’s initiative in identifying and raising potential issues with the directors and its responsiveness, frankness and attention to concerns raised by the directors in the past, including the Adviser’s willingness to consider and implement organizational and operational changes designed to improve investment results and the services provided to the AB Funds. The directors noted that they have four regular meetings each year, at each of which they review extensive materials and information from the Adviser, including information on the investment performance of the Fund and the money market fund advised by the Adviser in which the Fund invests a portion of its assets.
The directors also considered all factors they believed relevant, including the specific matters discussed below. During the course of their deliberations, the directors evaluated, among other things, the reasonableness of the advisory fee. The directors did not identify any particular information that was all-important or controlling, and different directors may have attributed different weights to the various factors. The directors determined that the selection of the Adviser to manage the Fund and the overall arrangements between the Fund and the Adviser, as provided in the Advisory Agreement, including the advisory fee, were fair and reasonable in light of the services performed, expenses incurred and such other matters as the directors considered relevant in the exercise of their business
| | |
| |
| abfunds.com | | AB HIGH YIELD ETF | 67 |
judgment. The material factors and conclusions that formed the basis for the directors’ determinations included the following:
Nature, Extent and Quality of Services Provided
The directors considered the scope and quality of services provided by the Adviser under the Advisory Agreement, including the quality of the investment research capabilities of the Adviser and the other resources it has dedicated to performing services for the Fund. The directors noted that the Adviser from time to time reviews the Fund’s investment strategies and may from time to time propose changes intended to improve the Fund’s relative or absolute performance for the directors’ consideration. They also noted the professional experience and qualifications of the Fund’s portfolio management team and other senior personnel of the Adviser. The directors also considered that the Advisory Agreement provides that the Fund will reimburse the Adviser for the cost to it of providing certain clerical, accounting, administrative and other services to the Fund by employees of the Adviser or its affiliates. Requests for these reimbursements will be subject to the directors’ approval on a quarterly basis. The directors noted that the Adviser does not expect to request such reimbursements. The quality of administrative and other services, including the Adviser’s role in coordinating the activities of the Fund’s other service providers, also was considered. The directors concluded that, overall, they were satisfied with the nature, extent and quality of services provided to the Fund under the Advisory Agreement.
Costs of Services Provided and Profitability
The directors reviewed a schedule of the revenues and expenses and related notes indicating the profitability of the Fund to the Adviser for the period ended December 31, 2023 that had been prepared with an expense allocation methodology arrived at in consultation with an independent consultant at the request of the directors. The directors noted that the assumptions and methods of allocation used by the Adviser in preparing profitability data for ETFs and understood that there are a number of potentially acceptable allocation methodologies for information of this type. The directors noted that the profitability information reflected all revenues and expenses of the Adviser’s relationship with the Fund. The directors recognized that it is difficult to make comparisons of the profitability of the Advisory Agreement with the profitability of ETF advisory contracts for unaffiliated ETFs because comparative information is not generally publicly available and is affected by numerous factors. The directors focused on the profitability of the Adviser’s relationship with the Fund before taxes and distribution expenses. The directors noted that the Fund was not profitable to the Adviser in the period reviewed.
| | |
| |
68 | AB HIGH YIELD ETF | | abfunds.com |
Fall-Out Benefits
The directors considered the other benefits to the Adviser from its relationship with the Fund and the money market fund advised by the Adviser in which the Fund invests. The directors recognized that the Fund’s unprofitability to the Adviser would be exacerbated without these benefits. The directors understood that the Adviser also might derive reputational and other benefits from its association with the Fund.
Investment Results
In addition to the information reviewed by the directors in connection with the Meeting, the directors have received detailed performance information for the Fund at each regular Board meeting during the year.
At the Meeting, the directors reviewed performance information prepared by an independent service provider (the “15(c) service provider”), showing the performance of the Fund (including its predecessor mutual fund) against a group of similar ETFs (“peer group”) and a larger group of similar ETFs (“peer universe”), each selected by the 15(c) service provider, and information prepared by the Adviser showing the performance of the Fund (including its predecessor mutual fund) against a broad-based securities market index, in each case for the 1-, 3- and 5- year periods ended May 31, 2024 and (in the case of comparisons with the broad-based securities market index) for the 10- year period ended May 31, 2024. Based on their review, the directors concluded that the Fund’s investment performance was acceptable.
Advisory Fees and Other Expenses
The directors considered the advisory fee rate payable by the Fund to the Adviser and information prepared by the 15(c) service provider, concerning advisory fee rates payable by other ETFs in the same category as the Fund. The directors noted that the advisory fee is a unitary fee and that the Adviser pays all expenses of the Fund except for certain expenses payable by the Fund such as interest expense, taxes, extraordinary expenses, and brokerage commissions and other transaction costs. The directors recognized that it is difficult to make comparisons of advisory fees because there are variations in the services that are included in the fees payable by other ETFs. The directors compared the Fund’s contractual advisory fee rate against a peer group median and noted that it was equal to the median.
The directors also considered the Adviser’s fee schedule for other clients utilizing investment strategies similar to those of the Fund. For this purpose, they reviewed the relevant advisory fee information from the Adviser’s Form ADV and in a report from the Fund’s Senior Vice President and noted the differences between the Fund’s fee schedule, on the one hand, and the Adviser’s institutional fee schedule and the schedule of fees charged by the Adviser to any offshore funds and for services to any sub-advised funds utilizing investment strategies similar to those of the Fund,
| | |
| |
| abfunds.com | | AB HIGH YIELD ETF | 69 |
on the other. The directors noted that the Adviser may, in some cases, agree to fee rates with large institutional clients that are lower than those reviewed by the directors and that they had previously discussed with the Adviser its policies in respect of such arrangements.
The Adviser reviewed with the directors the significantly greater scope of the services it provides to the Fund relative to institutional, offshore fund and sub-advised fund clients. In this regard, the Adviser noted, among other things, that, compared to institutional and offshore or sub-advisory accounts, the Fund (i) demands considerably more managerial and administrative resources due to the potential for frequent creations and redemptions of shares; (ii) has more tax and regulatory restrictions and compliance obligations; (iii) must prepare and file or distribute regulatory and other communications about fund operations; and (iv) must provide shareholder servicing to retail investors. The Adviser also reviewed the greater legal risks presented by the large and changing population of Fund shareholders who may assert claims against the Adviser in individual or class actions, and the greater entrepreneurial risk in offering new fund products, which require substantial investment to launch, may not succeed, and generally must be priced to compete with larger, more established funds resulting in lack of profitability to the Adviser until a new fund achieves scale. In light of the substantial differences in services rendered by the Adviser to institutional, offshore fund and sub-advised fund clients as compared to the Fund, and the different risk profile, the directors considered these fee comparisons inapt and did not place significant weight on them in their deliberations. The directors noted that the unitary fee for the Fund covers additional services provided by third parties and thus is not directly comparable to the Adviser’s institutional fee schedule and the schedule of fees for most other funds advised by the Adviser.
In connection with their review of the Fund’s advisory fee, the directors also considered the Fund’s total expense ratio in comparison to the medians for a peer group and a peer universe selected by the 15(c) service provider. The Fund’s expense ratio was based on the Fund’s latest fiscal year. The directors view expense ratio information as relevant to their evaluation of the Adviser’s services because the Adviser is responsible for coordinating services provided to the Fund by others, and in most cases, the Adviser is responsible for paying for such services under its unitary fee arrangement with the Fund. The directors noted that the Fund’s expense ratio was equal to the median of a peer group and lower than the median of a peer universe. Based on their review, the directors concluded that the Fund’s expense ratio was acceptable.
Economies of Scale
The directors noted that the advisory fee schedule for the Fund does not contain breakpoints and that they had discussed their strong preference for breakpoints in advisory contracts with the Adviser. The directors took
| | |
| |
70 | AB HIGH YIELD ETF | | abfunds.com |
into consideration prior presentations by an independent consultant on economies of scale in the mutual fund industry and for the AB Funds, and presentations from time to time by the Adviser concerning certain of its views on economies of scale. The directors also had requested and received from the Adviser certain updates on economies of scale in advance of the Meeting. The directors believe that economies of scale may be realized (if at all) by the Adviser across a variety of products and services, and not only in respect of a single fund. The directors noted that there is no established methodology for setting breakpoints that give effect to the fund-specific services provided by a fund’s adviser and to the economies of scale that an adviser may realize in its overall mutual fund business or those components of it which directly or indirectly affect a fund’s operations. The directors observed that in the mutual fund industry as a whole, as well as among ETFs similar to the Fund, there is no uniformity or pattern in the fees and asset levels at which breakpoints (if any) apply. The directors also noted that the advisory agreements for many ETFs do not have breakpoints at all. The directors informed the Adviser that they would monitor the Fund’s asset level and its profitability to the Adviser and anticipated revisiting the question of breakpoints in the future if circumstances warranted doing so.
| | |
| |
| abfunds.com | | AB HIGH YIELD ETF | 71 |
NOTES
| | |
| |
72 | AB HIGH YIELD ETF | | abfunds.com |
AB HIGH YIELD ETF
66 Hudson Boulevard East
New York, NY 10001
800 221 5672
ETF-HY-0151-1124 
NOV 11.30.24

ANNUAL FINANCIAL STATEMENTS AND ADDITIONAL INFORMATION
AB INTERNATIONAL LOW VOLATILITY EQUITY ETF
(NYSE: ILOW)

| | |
| |
| Investment Products Offered | | • Are Not FDIC Insured • May Lose Value • Are Not Bank Guaranteed |
Investors should consider the investment objectives, risks, charges and expenses of the Fund carefully before investing. For copies of our prospectus or summary prospectus, which contain this and other information, visit us online at www.abfunds.com or contact your AB representative. Please read the prospectus and/or summary prospectus carefully before investing.
This shareholder report must be preceded or accompanied by the Fund’s prospectus for individuals who are not current shareholders of the Fund.
You may obtain a description of the Fund’s proxy voting policies and procedures, and information regarding how the Fund voted proxies relating to portfolio securities during the most recent 12-month period ended June 30, without charge. Simply visit AB’s website at www.abfunds.com, or go to the Securities and Exchange Commission’s (the “Commission”) website at www.sec.gov, or call AB at (800) 227 4618.
The Fund files its complete schedule of portfolio holdings with the Commission for the first and third quarters of each fiscal year as an exhibit to its reports on Form N-PORT. The Fund’s Form N-PORT reports are available on the Commission’s website at www.sec.gov. AB publishes full portfolio holdings for the Fund daily at www.abfunds.com.
Foreside Fund Services, LLC (“Foreside”) is the distributor of the fund. Foreside is a member of FINRA.
The [A/B] logo and AllianceBernstein® are registered trademarks used by permission of the owner, AllianceBernstein L.P.
PORTFOLIO OF INVESTMENTS
November 30, 2024
| | | | | | | | |
| Company | | Shares | | | U.S. $ Value | |
| |
COMMON STOCKS – 97.6% | | | | | | | | |
Financials – 26.0% | | | | | | | | |
Banks – 13.6% | | | | | | | | |
Bank Leumi Le-Israel BM | | | 492,059 | | | $ | 5,589,657 | |
DBS Group Holdings Ltd. | | | 296,960 | | | | 9,398,436 | |
KBC Group NV | | | 112,572 | | | | 8,113,640 | |
Mitsubishi UFJ Financial Group, Inc. | | | 1,151,900 | | | | 13,744,414 | |
NatWest Group PLC | | | 3,240,212 | | | | 16,585,087 | |
Nordea Bank Abp (Stockholm) | | | 915,140 | | | | 10,338,316 | |
Oversea-Chinese Banking Corp., Ltd. | | | 1,555,980 | | | | 18,894,830 | |
Royal Bank of Canada | | | 35,906 | | | | 4,517,517 | |
Sumitomo Mitsui Financial Group, Inc. | | | 580,400 | | | | 14,244,794 | |
UniCredit SpA | | | 276,283 | | | | 10,617,515 | |
| | | | | | | | |
| | | | 112,044,206 | |
| | | | | |
Capital Markets – 5.3% | | | | | | | | |
Euronext NV | | | 129,505 | | | | 14,457,988 | |
IG Group Holdings PLC | | | 512,135 | | | | 6,232,839 | |
London Stock Exchange Group PLC | | | 113,520 | | | | 16,261,440 | |
Singapore Exchange Ltd. | | | 689,600 | | | | 6,542,880 | |
| | | | | | | | |
| | | | 43,495,147 | |
| | | | | |
Insurance – 7.1% | | | | | | | | |
AIA Group Ltd. | | | 730,600 | | | | 5,459,631 | |
Allianz SE (REG) | | | 16,859 | | | | 5,203,054 | |
AXA SA | | | 320,735 | | | | 11,172,320 | |
Medibank Pvt Ltd. | | | 2,529,428 | | | | 6,294,581 | |
Muenchener Rueckversicherungs-Gesellschaft AG in Muenchen (REG) | | | 20,871 | | | | 10,896,329 | |
NN Group NV | | | 219,667 | | | | 10,201,584 | |
Sampo Oyj – Class A | | | 229,917 | | | | 9,844,670 | |
| | | | | | | | |
| | | | | | | 59,072,169 | |
| | | | | |
| | | | | | | 214,611,522 | |
| | | | | |
Industrials – 18.8% | | | | | | | | |
Aerospace & Defense – 2.6% | | | | | | | | |
BAE Systems PLC | | | 816,644 | | | | 12,736,205 | |
Safran SA | | | 38,605 | | | | 8,990,803 | |
| | | | | | | | |
| | | | | | | 21,727,008 | |
| | | | | |
Commercial Services & Supplies – 0.5% | | | | | | | | |
Secom Co., Ltd. | | | 117,700 | | | | 4,093,266 | |
| | | | | | | | |
| | |
Construction & Engineering – 2.1% | | | | | | | | |
INFRONEER Holdings, Inc. | | | 790,100 | | | | 6,386,666 | |
Stantec, Inc. | | | 123,602 | | | | 10,705,435 | |
| | | | | | | | |
| | | | | | | 17,092,101 | |
| | | | | |
Electrical Equipment – 4.2% | | | | | | | | |
ABB Ltd. (REG) | | | 136,728 | | | | 7,803,273 | |
Prysmian SpA | | | 236,022 | | | | 15,560,466 | |
| | |
| |
| abfunds.com | | AB INTERNATIONAL LOW VOLATILITY EQUITY ETF | 1 |
PORTFOLIO OF INVESTMENTS (continued)
| | | | | | | | |
| Company | | Shares | | | U.S. $ Value | |
| |
Schneider Electric SE | | | 45,512 | | | $ | 11,704,995 | |
| | | | | | | | |
| | | | | | | 35,068,734 | |
| | | | | |
Ground Transportation – 0.9% | | | | | | | | |
Canadian National Railway Co. | | | 64,959 | | | | 7,253,287 | |
| | | | | | | | |
| | |
Industrial Conglomerates – 1.6% | | | | | | | | |
Hitachi Ltd. | | | 522,100 | | | | 13,039,898 | |
| | | | | | | | |
| | |
Professional Services – 5.5% | | | | | | | | |
Experian PLC | | | 124,309 | | | | 5,926,692 | |
MEITEC Group Holdings, Inc. | | | 311,200 | | | | 5,857,858 | |
RELX PLC (London) | | | 379,233 | | | | 17,858,995 | |
Wolters Kluwer NV | | | 92,358 | | | | 15,407,795 | |
| | | | | | | | |
| | | | | | | 45,051,340 | |
| | | | | | | | |
Trading Companies & Distributors – 1.4% | | | | | | | | |
BOC Aviation Ltd.(a) | | | 1,030,900 | | | | 7,968,674 | |
Brenntag SE | | | 62,603 | | | | 4,033,400 | |
| | | | | | | | |
| | | | | | | 12,002,074 | |
| | | | | | | | |
| | | | | | | 155,327,708 | |
| | | | | | | | |
Information Technology – 10.7% | | | | | | | | |
IT Services – 2.9% | | | | | | | | |
Amdocs Ltd. | | | 78,862 | | | | 6,838,913 | |
BIPROGY, Inc. | | | 340,200 | | | | 10,555,861 | |
Nomura Research Institute Ltd. | | | 219,500 | | | | 6,695,272 | |
| | | | | | | | |
| | | | | | | 24,090,046 | |
| | | | | | | | |
Semiconductors & Semiconductor Equipment – 2.4% | | | | | | | | |
ASML Holding NV | | | 9,455 | | | | 6,575,030 | |
Taiwan Semiconductor Manufacturing Co., Ltd. | | | 437,000 | | | | 13,399,378 | |
| | | | | | | | |
| | | | | | | 19,974,408 | |
| | | | | | | | |
Software – 4.9% | | | | | | | | |
Constellation Software, Inc./Canada | | | 6,146 | | | | 20,780,736 | |
Nice Ltd.(b) | | | 16,825 | | | | 3,024,719 | |
SAP SE | | | 70,698 | | | | 16,793,566 | |
| | | | | | | | |
| | | | | | | 40,599,021 | |
| | | | | | | | |
Technology Hardware, Storage & Peripherals – 0.5% | | | | | | | | |
Logitech International SA (REG) | | | 47,963 | | | | 3,892,570 | |
| | | | | | | | |
| | | | | | | 88,556,045 | |
| | | | | | | | |
Health Care – 10.2% | | | | | | | | |
Health Care Providers & Services – 2.0% | | | | | | | | |
Fresenius SE & Co. KGaA(b) | | | 292,358 | | | | 10,273,398 | |
Galenica AG(a)(b) | | | 66,630 | | | | 5,797,037 | |
| | | | | | | | |
| | | | | | | 16,070,435 | |
| | | | | | | | |
| | |
| |
2 | AB INTERNATIONAL LOW VOLATILITY EQUITY ETF | | abfunds.com |
PORTFOLIO OF INVESTMENTS (continued)
| | | | | | | | |
| Company | | Shares | | | U.S. $ Value | |
| |
Pharmaceuticals – 8.2% | | | | | | | | |
AstraZeneca PLC | | | 62,644 | | | $ | 8,449,663 | |
Chugai Pharmaceutical Co., Ltd. | | | 206,000 | | | | 9,050,091 | |
Hikma Pharmaceuticals PLC | | | 157,330 | | | | 3,847,506 | |
Novartis AG (REG) | | | 72,837 | | | | 7,711,132 | |
Novo Nordisk A/S – Class B | | | 232,916 | | | | 24,980,497 | |
Recordati Industria Chimica e Farmaceutica SpA | | | 87,932 | | | | 4,787,645 | |
Sanofi SA | | | 92,561 | | | | 9,002,992 | |
| | | | | | | | |
| | | | | | | 67,829,526 | |
| | | | | | | | |
| | | | | | | 83,899,961 | |
| | | | | | | | |
Consumer Staples – 9.3% | | | | | | | | |
Beverages – 0.9% | | | | | | | | |
Asahi Group Holdings Ltd. | | | 720,600 | | | | 7,818,475 | |
| | | | | | | | |
| | |
Consumer Staples Distribution & Retail – 4.2% | | | | | | | | |
Jeronimo Martins SGPS SA | | | 106,813 | | | | 2,080,326 | |
Koninklijke Ahold Delhaize NV | | | 270,747 | | | | 9,336,695 | |
Loblaw Cos., Ltd. | | | 57,128 | | | | 7,413,604 | |
Tesco PLC | | | 3,389,296 | | | | 15,784,385 | |
| | | | | | | | |
| | | | | | | 34,615,010 | |
| | | | | | | | |
Food Products – 1.6% | | | | | | | | |
Glanbia PLC | | | 551,134 | | | | 8,510,418 | |
Nestle SA (REG) | | | 52,592 | | | | 4,565,535 | |
| | | | | | | | |
| | | | | | | 13,075,953 | |
| | | | | | | | |
Personal Care Products – 1.0% | | | | | | | | |
Haleon PLC | | | 1,658,429 | | | | 7,890,044 | |
| | | | | | | | |
| | |
Tobacco – 1.6% | | | | | | | | |
Philip Morris International, Inc. | | | 100,936 | | | | 13,430,544 | |
| | | | | | | | |
| | | | | | | 76,830,026 | |
| | | | | | | | |
Consumer Discretionary – 8.6% | | | | | | | | |
Automobiles – 1.2% | | | | | | | | |
Honda Motor Co., Ltd. | | | 1,153,000 | | | | 9,915,101 | |
| | | | | | | | |
| | |
Diversified Consumer Services – 1.6% | | | | | | | | |
Pearson PLC | | | 850,954 | | | | 13,336,193 | |
| | | | | | | | |
| | |
Hotels, Restaurants & Leisure – 3.5% | | | | | | | | |
Amadeus IT Group SA | | | 142,002 | | | | 9,961,842 | |
Booking Holdings, Inc. | | | 1,164 | | | | 6,055,105 | |
Compass Group PLC | | | 365,498 | | | | 12,501,479 | |
| | | | | | | | |
| | | | | | | 28,518,426 | |
| | | | | | | | |
Household Durables – 0.7% | | | | | | | | |
Open House Group Co., Ltd. | | | 167,100 | | | | 6,159,507 | |
| | | | | | | | |
| | |
| |
| abfunds.com | | AB INTERNATIONAL LOW VOLATILITY EQUITY ETF | 3 |
PORTFOLIO OF INVESTMENTS (continued)
| | | | | | | | |
| Company | | Shares | | | U.S. $ Value | |
| |
Specialty Retail – 1.6% | | | | | | | | |
Industria de Diseno Textil SA | | | 244,467 | | | $ | 13,473,197 | |
| | | | | | | | |
| | | | | | | 71,402,424 | |
| | | | | | | | |
Communication Services – 5.1% | | | | | | | | |
Diversified Telecommunication Services – 2.4% | | | | | | | | |
Deutsche Telekom AG (REG) | | | 191,899 | | | | 6,137,266 | |
HKT Trust & HKT Ltd. – Class SS | | | 3,300,000 | | | | 4,100,854 | |
Koninklijke KPN NV | | | 1,534,071 | | | | 5,948,071 | |
Telstra Group Ltd. | | | 1,369,610 | | | | 3,515,396 | |
| | | | | | | | |
| | | | | | | 19,701,587 | |
| | | | | | | | |
Entertainment – 0.5% | | | | | | | | |
GungHo Online Entertainment, Inc. | | | 190,000 | | | | 3,799,115 | |
| | | | | | | | |
| | |
Interactive Media & Services – 1.3% | | | | | | | | |
Auto Trader Group PLC | | | 641,862 | | | | 6,844,888 | |
Kakaku.com, Inc. | | | 256,200 | | | | 4,274,122 | |
| | | | | | | | |
| | | | | | | 11,119,010 | |
| | | | | | | | |
Media – 0.9% | | | | | | | | |
Informa PLC | | | 703,576 | | | | 7,660,406 | |
| | | | | | | | |
| | | | | | | 42,280,118 | |
| | | | | | | | |
Energy – 4.5% | | | | | | | | |
Oil, Gas & Consumable Fuels – 4.5% | | | | | | | | |
ENEOS Holdings, Inc. | | | 1,550,500 | | | | 8,349,998 | |
Equinor ASA | | | 76,764 | | | | 1,855,432 | |
Shell PLC | | | 673,393 | | | | 21,667,521 | |
TotalEnergies SE | | | 93,175 | | | | 5,409,679 | |
| | | | | | | | |
| | | | | | | 37,282,630 | |
| | | | | | | | |
Utilities – 3.0% | | | | | | | | |
Electric Utilities – 1.3% | | | | | | | | |
Enel SpA | | | 1,443,425 | | | | 10,382,159 | |
| | | | | | | | |
| | |
Multi-Utilities – 1.7% | | | | | | | | |
National Grid PLC | | | 1,123,390 | | | | 14,173,187 | |
| | | | | | | | |
| | | | | | | 24,555,346 | |
| | | | | | | | |
Real Estate – 0.8% | | | | | | | | |
Real Estate Management & Development – 0.8% | | | | | | | | |
Mitsui Fudosan Co., Ltd. | | | 747,800 | | | | 6,243,907 | |
| | | | | | | | |
| | |
Materials – 0.6% | | | | | | | | |
Metals & Mining – 0.6% | | | | | | | | |
Rio Tinto Ltd. | | | 62,944 | | | | 4,848,416 | |
| | | | | | | | |
| | |
Total Common Stocks
(cost $627,960,088) | | | | | | | 805,838,103 | |
| | | | | | | | |
| | | | | | | | |
| | |
| |
4 | AB INTERNATIONAL LOW VOLATILITY EQUITY ETF | | abfunds.com |
PORTFOLIO OF INVESTMENTS (continued)
| | | | | | | | |
| Company | | Shares | | | U.S. $ Value | |
| |
WARRANTS – 0.0% | | | | | | | | |
Information Technology – 0.0% | | | | | | | | |
Software – 0.0% | | | | | | | | |
Constellation Software, Inc., expiring 03/31/2040(b)(c)(d)
(cost $0) | | | 9,807 | | | $ | – 0 | – |
| | | | | | | | |
| | | | | | | | |
SHORT-TERM INVESTMENTS – 1.5% | | | | | | | | |
Investment Companies – 1.5% | | | | | | | | |
AB Fixed Income Shares, Inc. – Government Money Market Portfolio – Class AB,
4.54%(e)(f)(g)
(cost $12,904,331) | | | 12,904,331 | | | | 12,904,331 | |
| | | | | | | | |
| | |
Total Investments – 99.1%
(cost $640,864,419) | | | | | | | 818,742,434 | |
Other assets less liabilities – 0.9% | | | | | | | 7,210,749 | |
| | | | | | | | |
| | |
Net Assets – 100.0% | | | | | | $ | 825,953,183 | |
| | | | | | | | |
FORWARD CURRENCY EXCHANGE CONTRACTS (see Note D)
| | | | | | | | | | | | | | | | | | | | | | | | |
| Counterparty | | Contracts to
Deliver
(000) | | | In Exchange
For
(000) | | | Settlement
Date | | | Unrealized
Appreciation
(Depreciation) | |
Bank of America, NA | | | GBP | | | | 4,233 | | | | USD | | | | 5,359 | | | | 01/16/2025 | | | $ | (21,275 | ) |
Bank of America, NA | | | USD | | | | 50,204 | | | | AUD | | | | 77,252 | | | | 02/05/2025 | | | | 141,798 | |
Bank of America, NA | | | TWD | | | | 348,893 | | | | USD | | | | 10,807 | | | | 02/27/2025 | | | | (22,114 | ) |
Deutsche Bank AG | | | USD | | | | 2,538 | | | | NZD | | | | 4,305 | | | | 12/06/2024 | | | | 8,450 | |
Deutsche Bank AG | | | JPY | | | | 896,655 | | | | USD | | | | 5,937 | | | | 12/19/2024 | | | | (45,707 | ) |
Deutsche Bank AG | | | USD | | | | 4,453 | | | | JPY | | | | 677,327 | | | | 12/19/2024 | | | | 66,348 | |
Deutsche Bank AG | | | USD | | | | 880 | | | | EUR | | | | 807 | | | | 12/20/2024 | | | | (27,060 | ) |
Deutsche Bank AG | | | USD | | | | 3,569 | | | | GBP | | | | 2,808 | | | | 01/16/2025 | | | | (50 | ) |
Morgan Stanley Capital Services, Inc. | | | SGD | | | | 39,600 | | | | USD | | | | 30,263 | | | | 12/17/2024 | | | | 706,616 | |
Morgan Stanley Capital Services, Inc. | | | USD | | | | 2,451 | | | | JPY | | | | 379,570 | | | | 12/19/2024 | | | | 81,413 | |
Morgan Stanley Capital Services, Inc. | | | USD | | | | 50,898 | | | | JPY | | | | 7,546,221 | | | | 12/19/2024 | | | | (544,671 | ) |
Morgan Stanley Capital Services, Inc. | | | USD | | | | 1,080 | | | | CHF | | | | 931 | | | | 12/20/2024 | | | | (21,123 | ) |
Morgan Stanley Capital Services, Inc. | | | USD | | | | 2,671 | | | | EUR | | | | 2,562 | | | | 12/20/2024 | | | | 36,733 | |
Morgan Stanley Capital Services, Inc. | | | USD | | | | 15,996 | | | | SEK | | | | 175,976 | | | | 02/05/2025 | | | | 182,224 | |
NatWest Markets PLC | | | JPY | | | | 374,104 | | | | USD | | | | 2,409 | | | | 12/19/2024 | | | | (87,479 | ) |
NatWest Markets PLC | | | USD | | | | 49,051 | | | | CHF | | | | 42,235 | | | | 12/20/2024 | | | | (1,015,861 | ) |
NatWest Markets PLC | | | USD | | | | 6,190 | | | | EUR | | | | 5,730 | | | | 12/20/2024 | | | | (133,539 | ) |
NatWest Markets PLC | | | USD | | | | 2,586 | | | | AUD | | | | 3,971 | | | | 02/05/2025 | | | | 2,063 | |
NatWest Markets PLC | | | USD | | | | 2,450 | | | | NOK | | | | 27,094 | | | | 02/05/2025 | | | | 1,538 | |
State Street Bank & Trust Co. | | | SGD | | | | 3,464 | | | | USD | | | | 2,600 | | | | 12/17/2024 | | | | 14,375 | |
| | |
| |
| abfunds.com | | AB INTERNATIONAL LOW VOLATILITY EQUITY ETF | 5 |
PORTFOLIO OF INVESTMENTS (continued)
| | | | | | | | | | | | | | | | | | | | | | | | |
| Counterparty | | Contracts to
Deliver
(000) | | | In Exchange
For
(000) | | | Settlement
Date | | | Unrealized
Appreciation
(Depreciation) | |
State Street Bank & Trust Co. | | | USD | | | | 9,181 | | | | JPY | | | | 1,393,806 | | | | 12/19/2024 | | | $ | 119,014 | |
State Street Bank & Trust Co. | | | CHF | | | | 2,148 | | | | USD | | | | 2,440 | | | | 12/20/2024 | | | | (2,699 | ) |
State Street Bank & Trust Co. | | | USD | | | | 1,698 | | | | CHF | | | | 1,462 | | | | 12/20/2024 | | | | (35,083 | ) |
State Street Bank & Trust Co. | | | USD | | | | 5,453 | | | | EUR | | | | 5,001 | | | | 12/20/2024 | | | | (167,412 | ) |
State Street Bank & Trust Co. | | | GBP | | | | 54,703 | | | | USD | | | | 70,427 | | | | 01/16/2025 | | | | 903,012 | |
State Street Bank & Trust Co. | | | CAD | | | | 65,426 | | | | USD | | | | 47,348 | | | | 02/05/2025 | | | | 508,272 | |
| | | | | | | | | | | | | | | | | | | | | | | | |
| | | $ | 647,783 | |
| | | | | |
| (a) | Security is exempt from registration under Rule 144A or Regulation S of the Securities Act of 1933. These securities are considered restricted, but liquid and may be resold in transactions exempt from registration. At November 30, 2024, the aggregate market value of these securities amounted to $13,765,711 or 1.7% of net assets. |
| (b) | Non-income producing security. |
| (c) | Security in which significant unobservable inputs (Level 3) were used in determining fair value. |
| (d) | Fair valued by the Adviser. |
| (e) | Affiliated investments. |
| (f) | The rate shown represents the 7-day yield as of period end. |
| (g) | To obtain a copy of the fund’s shareholder report, please go to the Securities and Exchange Commission’s website at www.sec.gov, or call AB at (800) 227-4618. |
| | |
Currency Abbreviations: AUD – Australian Dollar CAD – Canadian Dollar CHF – Swiss Franc EUR – Euro GBP – Great British Pound JPY – Japanese Yen | | NOK – Norwegian Krone NZD – New Zealand Dollar SEK – Swedish Krona SGD – Singapore Dollar TWD – New Taiwan Dollar USD – United States Dollar |
Glossary:
REG – Registered Shares
See notes to financial statements.
| | |
| |
6 | AB INTERNATIONAL LOW VOLATILITY EQUITY ETF | | abfunds.com |
STATEMENT OF ASSETS & LIABILITIES
November 30, 2024
| | | | |
| Assets | |
Investments in securities, at value | |
Unaffiliated issuers (cost $627,960,088) | | $ | 805,838,103 | |
Affiliated issuers (cost $12,904,331) | | | 12,904,331 | |
Foreign currencies, at value (cost $1,337,184) | | | 1,321,120 | |
Unaffiliated dividends receivable | | | 5,568,104 | |
Unrealized appreciation on forward currency exchange contracts | | | 2,771,856 | |
Affiliated dividends receivable | | | 53,320 | |
Receivable due from Adviser | | | 2,440 | |
Other assets | | | 101,113 | |
| | | | |
Total assets | | | 828,560,387 | |
| | | | |
| Liabilities | |
Unrealized depreciation on forward currency exchange contracts | | | 2,124,073 | |
Advisory fee payable | | | 335,199 | |
Payable for investment securities purchased and foreign currency transactions | | | 164 | |
Other liabilities | | | 147,768 | |
| | | | |
Total liabilities | | | 2,607,204 | |
| | | | |
Net Assets | | $ | 825,953,183 | |
| | | | |
| Composition of Net Assets | |
Capital stock, at par | | $ | 2,335 | |
Additional paid-in capital | | | 646,260,869 | |
Distributable earnings | | | 179,689,979 | |
| | | | |
Net Assets | | $ | 825,953,183 | |
| | | | |
Net Asset Value Per Share—500 million shares of capital stock authorized, $.0001 par value (based on 23,351,020 common shares outstanding) | | $ | 35.37 | |
| | | | |
See notes to financial statements.
| | |
| |
| abfunds.com | | AB INTERNATIONAL LOW VOLATILITY EQUITY ETF | 7 |
STATEMENT OF OPERATIONS
| | | | | | | | |
| | | July 1,
2024 to
November 30,
2024(a) | | | Year Ended
June 30,
2024(b) | |
| Investment Income | |
Dividends | |
Unaffiliated issuers (net of foreign taxes withheld of $568,223 and $2,204,891, respectively) | | $ | 7,368,096 | | | $ | 21,643,535 | |
Affiliated issuers | | | 123,819 | | | | 547,142 | |
Securities lending income | | | 152 | | | | 140,182 | |
Other income | | | – 0 | – | | | 4,375 | |
| | | | | | | | |
Total Income | | | 7,492,067 | | | | 22,335,234 | |
| Expenses | |
Advisory fee (see Note B) | | | 1,777,373 | | | | 4,642,887 | |
Distribution fee—Class A | | | – 0 | – | | | 10,132 | |
Distribution fee—Class C | | | – 0 | – | | | 1,664 | |
Transfer agency—Class A | | | – 0 | – | | | 699 | |
Transfer agency—Class C | | | – 0 | – | | | 56 | |
Transfer agency—Advisor Class | | | 8,943 | | | | 131,387 | |
Transfer agency—Class Z | | | – 0 | – | | | 10 | |
Custody and accounting | | | 17,182 | | | | 182,072 | |
Legal | | | 1,176 | | | | 107,646 | |
Administrative | | | 1,495 | | | | 91,630 | |
Registration fees | | | 871 | | | | 79,679 | |
Audit and tax | | | 806 | | | | 73,721 | |
Printing | | | 553 | | | | 50,606 | |
Directors’ fees | | | 305 | | | | 27,859 | |
Miscellaneous | | | 3,737 | | | | 42,028 | |
| | | | | | | | |
Total expenses | | | 1,812,441 | | | | 5,442,076 | |
Less: expenses waived and reimbursed by the Adviser (see Note B) | | | (6,664 | ) | | | (69,812 | ) |
Less: expenses waived and reimbursed by the Distributor (see Note C) | | | – 0 | – | | | (419 | ) |
| | | | | | | | |
Net expenses | | | 1,805,777 | | | | 5,371,845 | |
| | | | | | | | |
Net investment income | | | 5,686,290 | | | | 16,963,389 | |
| | | | | | | | |
| Realized and Unrealized Gain (Loss) on Investment and Foreign Currency Transactions | | | | | | | | |
Net realized gain (loss) on: | |
Investment transactions | | | 15,935,379 | | | | 13,118,090 | |
In-kind redemptions | | | 1,838,700 | | | | – 0 | – |
Forward currency exchange contracts | | | (4,049,781 | ) | | | (8,366,837 | ) |
Foreign currency transactions | | | 2,887,142 | | | | (46,953 | ) |
Net change in unrealized appreciation (depreciation) of: | | | | | | | | |
Investments | | | 16,835,506 | | | | 76,799,559 | |
Forward currency exchange contracts | | | 1,887,125 | | | | 2,060,773 | |
Foreign currency denominated assets and liabilities | | | (56,698 | ) | | | (90,292 | ) |
| | | | | | | | |
Net gain on investment and foreign currency transactions | | | 35,277,373 | | | | 83,474,340 | |
Contributions from Affiliates (see Note B) | | | 58,457 | | | | – 0 | – |
| | | | | | | | |
Net Increase in Net Assets from Operations | | $ | 41,022,120 | | | $ | 100,437,729 | |
| | | | | | | | |
| (a) | The Acquired Portfolio had a fiscal year end of June 30. The Fund has a fiscal year end of November 30. |
| (b) | After the close of business on July 12, 2024, AB International Low Volatility Equity Portfolio (the “Acquired Portfolio”) was reorganized into AB International Low Volatility Equity ETF. The amounts disclosed include those of the Acquired Portfolio. See Note A for additional information on the reorganization. |
See notes to financial statements.
| | |
| |
8 | AB INTERNATIONAL LOW VOLATILITY EQUITY ETF | | abfunds.com |
STATEMENT OF CHANGES IN NET ASSETS
| | | | | | | | | | | | |
| | | July 1,
2024 to
November 30
2024(a) | | | Year Ended
June 30,
2024(b) | | | Year Ended
June 30,
2023 | |
| Increase in Net Assets from Operations | | | | | | | | | | | | |
Net investment income | | $ | 5,686,290 | | | $ | 16,963,389 | | | $ | 15,707,147 | |
Net realized gain (loss) on investment and foreign currency transactions | | | 16,611,440 | | | | 4,704,300 | | | | (12,582,047 | ) |
Net change in unrealized appreciation (depreciation) of investments and foreign currency denominated assets and liabilities | | | 18,665,933 | | | | 78,770,040 | | | | 68,432,393 | |
Contributions from Affiliates (see Note B) | | | 58,457 | | | | | | | | | |
| | | | | | | | | | | | |
Net increase in net assets from operations | | | 41,022,120 | | | | 100,437,729 | | | | 71,557,493 | |
| | | | | | | | | | | | |
| Distribution to Shareholders | | | | | | | | | | | | |
Class A | | | – 0 | – | | | (118,126 | ) | | | – 0 | – |
Class C | | | – 0 | – | | | (3,388 | ) | | | – 0 | – |
Advisor Class | | | (7,514,658 | ) | | | (15,606,346 | ) | | | – 0 | – |
Class Z | | | – 0 | – | | | (1,296 | ) | | | – 0 | – |
| Capital Stock Transactions | | | | | | | | | | | | |
Net increase | | | 2,989,526 | | | | 23,177,768 | | | | 19,439,174 | |
| | | | | | | | | | | | |
Total increase | | | 36,496,988 | | | | 107,886,341 | | | | 90,996,667 | |
| Net Assets | |
Beginning of period | | | 789,456,195 | | | | 681,569,854 | | | | 590,573,187 | |
| | | | | | | | | | | | |
End of period | | $ | 825,953,183 | | | $ | 789,456,195 | | | $ | 681,569,854 | |
| | | | | | | | | | | | |
| (a) | The Acquired Portfolio had a fiscal year end of June 30. The Fund has a fiscal year end of November 30. |
| (b) | After the close of business on July 12, 2024, AB International Low Volatility Equity Portfolio (the “Acquired Portfolio”) was reorganized into AB International Low Volatility Equity ETF. The amounts disclosed include those of the Acquired Portfolio. See Note A for additional information on the reorganization. |
See notes to financial statements.
| | |
| |
| abfunds.com | | AB INTERNATIONAL LOW VOLATILITY EQUITY ETF | 9 |
NOTES TO FINANCIAL STATEMENTS
November 30, 2024
NOTE A
Significant Accounting Policies
AB Active ETFs, Inc. (the “Corporation”) is registered under the Investment Company Act of 1940 (the “1940 Act”) as an open-end management investment company. The Corporation, which is a Maryland corporation, operates as a series company comprised of 15 funds currently in operation. Each fund is considered to be a separate entity for financial reporting and tax purposes. This report relates only to the AB International Low Volatility Equity ETF (the “Fund”), a diversified portfolio. The Fund commenced investment operations on July 12, 2024. At meetings held on October 31—November 2, 2023, the Fund’s Board of Directors (the “Board”) approved the reorganization of AB International Low Volatility Equity Portfolio, a portfolio of AB Cap Fund, Inc. (the “Acquired Portfolio) into the Fund (the “Conversion”), to be managed by AllianceBernstein L.P. (the “Adviser”). Pursuant to an Agreement and Plan of Acquisition and Termination (“The Plan”) the Acquired Portfolio was converted into an ETF, the Fund (the “Acquiring Portfolio”) with the same investment objective, and the same investment policies and investment strategies as the Acquired Portfolio on the closing date of the Conversion, July 12, 2024. In connection with the Conversion, the assets and liabilities of the Acquired Portfolio were transferred to the Acquiring Portfolio, and stockholders of the Acquired Portfolio received shares of the Acquiring Portfolio equal in aggregate net asset value (“NAV”) to the NAV of their shares of the Acquired Portfolio (less cash corresponding to any fractional share amount). The Acquired Portfolio had a fiscal year end of June 30, however the Fund has a fiscal year end of November 30. See Note J for additional information regarding the Conversion. The Acquired Portfolio was the accounting survivor in the Conversion and as such, the financial statements and the financial highlights reflect the financial information of the Acquired Portfolio through July 12, 2024. The financial statements have been prepared in conformity with U.S. generally accepted accounting principles (“U.S. GAAP”), which require management to make certain estimates and assumptions that affect the reported amounts of assets and liabilities in the financial statements and amounts of income and expenses during the reporting period. Actual results could differ from those estimates. The Fund is an investment company under U.S. GAAP and follows the accounting and reporting guidance applicable to investment companies. The following is a summary of significant accounting policies followed by the Fund.
1. Security Valuation
Portfolio securities are valued at market value determined on the basis of market quotations or, if market quotations are not readily available or are unreliable, at “fair value” as determined in accordance with procedures approved by and under the oversight of the Board. Pursuant to these
| | |
| |
10 | AB INTERNATIONAL LOW VOLATILITY EQUITY ETF | | abfunds.com |
NOTES TO FINANCIAL STATEMENTS (continued)
procedures, the Adviser serves as the Fund’s valuation designee pursuant to Rule 2a-5 of the 1940 Act. In this capacity, the Adviser is responsible, among other things, for making all fair value determinations relating to the Fund’s portfolio investments, subject to the Board’s oversight.
In general, the market values of securities which are readily available and deemed reliable are determined as follows: securities listed on a national securities exchange (other than securities listed on the NASDAQ Stock Market, Inc. (“NASDAQ”)) or on a foreign securities exchange are valued at the last sale price at the close of the exchange or foreign securities exchange. If there has been no sale on such day, the securities are valued at the last traded price from the previous day. Securities listed on more than one exchange are valued by reference to the principal exchange on which the securities are traded; securities listed only on NASDAQ are valued in accordance with the NASDAQ Official Closing Price; listed or over the counter (“OTC”) market put or call options are valued at the mid level between the current bid and ask prices. If either a current bid or current ask price is unavailable, the Adviser will have discretion to determine the best valuation (e.g., last trade price in the case of listed options); open futures are valued using the closing settlement price or, in the absence of such a price, the most recent quoted bid price. If there are no quotations available for the day of valuation, the last available closing settlement price is used; U.S. Government securities and any other debt instruments having 60 days or less remaining until maturity are generally valued at fair value by an independent pricing service. If an independent fair value price is not available, the securities are valued at amortized cost. This methodology is commonly used for short term securities that have an original maturity of 60 days or less, as well as short term securities that had an original term to maturity that exceeded 60 days. In instances when amortized cost is utilized, the Valuation Committee (the “Committee”) must reasonably conclude that the utilization of amortized cost is approximately the same as the fair value of the security. Factors the Committee will consider include, but are not limited to, an impairment of the creditworthiness of the issuer or material changes in interest rates. Fixed-income securities, including mortgage-backed and asset-backed securities, may be valued on the basis of prices provided by a pricing service or at a price obtained from one or more of the major broker-dealers. In cases where broker-dealer quotes are obtained, the Adviser may establish procedures whereby changes in market yields or spreads are used to adjust, on a daily basis, a recently obtained quoted price on a security. Swaps and other derivatives are valued daily, primarily using independent pricing services, independent pricing models using market inputs, as well as third party broker-dealers or counterparties. Open-end mutual funds are valued at the closing NAV per share, while exchange-traded funds are valued at the closing market price per share.
| | |
| |
| abfunds.com | | AB INTERNATIONAL LOW VOLATILITY EQUITY ETF | 11 |
NOTES TO FINANCIAL STATEMENTS (continued)
Securities for which market quotations are not readily available (including restricted securities) or are deemed unreliable are valued at fair value as deemed appropriate by the Adviser. Factors considered in making this determination may include, but are not limited to, information obtained by contacting the issuer, analysts, analysis of the issuer’s financial statements or other available documents. In addition, the Fund may use fair value pricing for securities primarily traded in non-U.S. markets because most foreign markets close well before the Fund values its securities at 4:00 p.m., Eastern Time. The earlier close of these foreign markets gives rise to the possibility that significant events may have occurred in the interim and may materially affect the value of those securities. To account for this, the Fund may value foreign equity securities using fair value prices at the discretion of the Adviser.
2. Fair Value Measurements
In accordance with U.S. GAAP regarding fair value measurements, fair value is defined as the price that the Fund would receive to sell an asset or pay to transfer a liability in an orderly transaction between market participants at the measurement date. U.S. GAAP establishes a framework for measuring fair value, and a three-level hierarchy for fair value measurements based upon the transparency of inputs to the valuation of an asset or liability (including those valued based on their market values as described in Note A.1 above). Inputs may be observable or unobservable and refer broadly to the assumptions that market participants would use in pricing the asset or liability. Observable inputs reflect the assumptions market participants would use in pricing the asset or liability based on market data obtained from sources independent of the Fund. Unobservable inputs reflect the Fund’s own assumptions about the assumptions that market participants would use in pricing the asset or liability based on the best information available in the circumstances. Each investment is assigned a level based upon the observability of the inputs which are significant to the overall valuation. The three-tier hierarchy of inputs is summarized below.
| | • | | Level 1—quoted prices in active markets for identical investments |
| | • | | Level 2—other significant observable inputs (including quoted prices for similar investments, interest rates, prepayment speeds, credit risk, etc.) |
| | • | | Level 3—significant unobservable inputs (including the Fund’s own assumptions in determining the fair value of investments) |
The fair value of debt instruments, such as bonds, and over-the-counter derivatives is generally based on market price quotations, recently executed market transactions (where observable) or industry recognized modeling techniques and are generally classified as Level 2. Pricing vendor inputs to Level 2 valuations may include quoted prices for similar invest-
| | |
| |
12 | AB INTERNATIONAL LOW VOLATILITY EQUITY ETF | | abfunds.com |
NOTES TO FINANCIAL STATEMENTS (continued)
ments in active markets, interest rate curves, coupon rates, currency rates, yield curves, option adjusted spreads, default rates, credit spreads and other unique security features in order to estimate the relevant cash flows which are then discounted to calculate fair values. If these inputs are unobservable and significant to the fair value, these investments will be classified as Level 3.
Where readily available market prices or relevant bid prices are not available for certain equity investments, such investments may be valued based on similar publicly traded investments, movements in relevant indices since last available prices or based upon underlying company fundamentals and comparable company data (such as multiples to earnings or other multiples to equity). Where an investment is valued using an observable input, such as another publicly traded security, the investment will be classified as Level 2. If management determines that an adjustment is appropriate based on restrictions on resale, illiquidity or uncertainty, and such adjustment is a significant component of the valuation, the investment will be classified as Level 3. An investment will also be classified as Level 3 where management uses company fundamentals and other significant inputs to determine the valuation.
The following table summarizes the valuation of the Fund’s investments by the above fair value hierarchy levels as of November 30, 2024:
| | | | | | | | | | | | | | | | |
Investments in
Securities: | | Level 1 | | | Level 2 | | | Level 3 | | | Total | |
Assets: | | | | | | | | | | | | | | | | |
Common Stocks(a) | | $ | 805,838,103 | | | $ | – 0 | – | | $ | – 0 | – | | $ | 805,838,103 | |
Warrants | | | – 0 | – | | | – 0 | – | | | 0 | (b) | | | – 0 | – |
Short-Term Investments | | | 12,904,331 | | | | – 0 | – | | | – 0 | – | | | 12,904,331 | |
| | | | | | | | | | | | | | | | |
Total Investments in Securities | | | 818,742,434 | | | | – 0 | – | | | 0 | (b) | | | 818,742,434 | |
Other Financial Instruments(c): | | | | | | | | | | | | | | | | |
Assets: | | | | | | | | | | | | | | | | |
Forward Currency Exchange Contracts | | | – 0 | – | | | 2,771,856 | | | | – 0 | – | | | 2,771,856 | |
Liabilities: | | | | | | | | | | | | | | | | |
Forward Currency Exchange Contracts | | | – 0 | – | | | (2,124,073 | ) | | | – 0 | – | | | (2,124,073 | ) |
| | | | | | | | | | | | | | | | |
Total | | $ | 818,742,434 | | | $ | 647,783 | | | $ | 0 | (b) | | $ | 819,390,217 | |
| | | | | | | | | | | | | | | | |
| (a) | See Portfolio of Investments for sector classifications. |
| (b) | The Portfolio held securities with zero market value at period end. |
| (c) | Other financial instruments include derivative instruments, such as futures, forwards and swaps. Derivative instruments are valued at the unrealized appreciation (depreciation) on the instrument. Other financial instruments may also include swaps with upfront premiums, written options and written swaptions which are valued at market value. |
| | |
| |
| abfunds.com | | AB INTERNATIONAL LOW VOLATILITY EQUITY ETF | 13 |
NOTES TO FINANCIAL STATEMENTS (continued)
3. Currency Translation
Assets and liabilities denominated in foreign currencies and commitments under forward currency exchange contracts are translated into U.S. dollars at the mean of the quoted bid and ask prices of such currencies against the U.S. dollar. Purchases and sales of portfolio securities are translated into U.S. dollars at the rates of exchange prevailing when such securities were acquired or sold. Income and expenses are translated into U.S. dollars at rates of exchange prevailing when accrued.
Net realized gain or loss on foreign currency transactions represents foreign exchange gains and losses from sales and maturities of foreign fixed income investments, holding of foreign currencies, currency gains or losses realized between the trade and settlement dates on foreign investment transactions, and the difference between the amounts of dividends, interest and foreign withholding taxes recorded on the Fund’s books and the U.S. dollar equivalent amounts actually received or paid. Net unrealized currency gains and losses from valuing foreign currency denominated assets and liabilities at period end exchange rates are reflected as a component of net unrealized appreciation or depreciation of foreign currency denominated assets and liabilities.
4. Taxes
It is the Fund’s policy to meet the requirements of the Internal Revenue Code applicable to regulated investment companies and to distribute all of its investment company taxable income and net realized gains, if any, to shareholders. Therefore, no provisions for federal income or excise taxes are required. The Fund may be subject to taxes imposed by countries in which it invests. Such taxes are generally based on income and/or capital gains earned or repatriated. Taxes are accrued and applied to net investment income, net realized gains and net unrealized appreciation/depreciation as such income and/or gains are earned.
In accordance with U.S. GAAP requirements regarding accounting for uncertainties in income taxes, management has analyzed the Fund’s tax positions taken or expected to be taken on federal and state income tax returns for all open tax years (the current and the prior three tax years) and has concluded that no provision for income tax is required in the Fund’s financial statements.
5. Investment Income and Investment Transactions
Dividend income is recorded on the ex-dividend date or as soon as the Fund is informed of the dividend. Interest income is accrued daily. Investment gains or losses are determined on the identified cost basis. Non-cash dividends, if any, are recorded on the ex-dividend date at the fair value of the securities received. The Fund amortizes premiums and accretes discounts as adjustments to interest income. Investment transactions are
| | |
| |
14 | AB INTERNATIONAL LOW VOLATILITY EQUITY ETF | | abfunds.com |
NOTES TO FINANCIAL STATEMENTS (continued)
accounted for on the date the securities are purchased or sold. The Fund accounts for distributions received from real estate investment trust (“REIT”) investments or from regulated investment companies as dividend income, realized gain, or return of capital based on information provided by the REIT or the investment company.
6. Class Allocations
Prior to the Conversion, all income earned and expenses incurred by the Acquired Portfolio were borne on a pro-rata basis by each settled class of shares, based on the proportionate interest in the Acquired Portfolio represented by the net assets of such class, except for class specific expenses which are allocated to the respective class. Expenses of AB Cap Fund, Inc. were charged proportionately to each portfolio or based on other appropriate methods. Realized and unrealized gains and losses were allocated among the various share classes based on respective net assets.
7. Dividends and Distributions
Dividends and distributions to shareholders, if any, are recorded on the ex-dividend date. Income dividends and capital gains distributions are determined in accordance with federal tax regulations and may differ from those determined in accordance with U.S. GAAP. To the extent these differences are permanent, such amounts are reclassified within the capital accounts based on their federal tax basis treatment; temporary differences do not require such reclassification.
8. Offering Expenses
The Adviser has agreed to pay all of the Fund’s organization and offering costs. The Fund is not obligated to repay any such organizational expenses or offering costs paid by the Adviser.
9. Cash and Short-Term Investments
Cash and short-term investments include cash on hand and short-term investments with maturities of less than one year when purchased.
NOTE B
Management Fee and Other Transactions with Affiliates
Under the terms of the investment advisory agreement, the Fund pays the Adviser a unitary advisory fee at an annual rate of .50% of the Fund’s daily net assets. The fees are accrued daily and paid monthly. Prior to July 12, 2024, the Acquired Portfolio paid the Adviser an advisory fee at an annual rate .65% of the first $2.5 billion, .55% of the excess of $2.5 billion up to $5 billion and .50% of the excess over $5 billion of the Fund’s average daily net assets. The Adviser had agreed to waive its fees and bear certain expenses to the extent necessary to limit total operating expenses (excluding acquired fund fees and expenses other than the advisory fees of
| | |
| |
| abfunds.com | | AB INTERNATIONAL LOW VOLATILITY EQUITY ETF | 15 |
NOTES TO FINANCIAL STATEMENTS (continued)
any AB mutual funds in which the Fund may invest, interest expense, taxes, extraordinary expenses, and brokerage commissions and other transaction costs) on an annual basis (the “Expense Caps”) to 1.00%, 1.75%, .75% and .75% of the daily average net assets for Class A, Class C, Advisor Class and Class Z shares, respectively. For the period ended November 30, 2024 and for the year ended June 30, 2024, such reimbursements/waivers amounted to $1,646 and $53,397, respectively.
Prior to July 12, 2024, pursuant to the investment advisory agreement, the Fund may reimburse the Adviser for certain legal and accounting services provided to the Acquired Portfolio by the Adviser. For the period ended November 30, 2024 and the year ended June 30, 2024, the reimbursement for such services amounted to $1,495 and $91,630, respectively.
Prior to July 12, 2024, the Acquired Portfolio compensated AllianceBernstein Investor Services, Inc. (“ABIS”), a wholly-owned subsidiary of the Adviser, under a Transfer Agency Agreement for providing personnel and facilities to perform transfer agency services for the Fund. ABIS may make payments to intermediaries that provide omnibus account services, sub-accounting services and/or networking services. Such compensation retained by ABIS amounted to $73,044 for the year ended June 30, 2024. Effective July 12, 2024, State Street Bank and Trust Company serves as Transfer Agent for the Fund.
Prior to July 12, 2024, AllianceBernstein Investments, Inc. (the “Distributor”), a wholly-owned subsidiary of the Adviser, serves as the distributor of the Fund’s shares. The Distributor has advised the Fund that it has retained front-end sales charges of $25 from the sale of Class A shares and received $4 and $0 in contingent deferred sales charges imposed upon redemptions by shareholders of Class A and Class C shares, respectively, for the year ended June 30, 2024.
Under the investment advisory agreement, in accordance with the unitary fee structure, the Adviser bears the cost of various third-party services required by the Fund, including audit, custodial, accounting, legal, transfer agency and printing costs and the fees and expenses of the Corporation’s directors and their counsel. Prior to July 12, 2024, these costs were borne by the Fund but subject to the Expense Cap. Also under the investment advisory agreement, the Adviser will reimburse the Fund for the Fund’s share of the acquired funds fees and expenses (advisory fees and other expenses) of any pooled investment vehicle for which the Adviser serves as investment adviser. For the period ended November 30, 2024 and the year ended June 30, 2024, such waiver/reimbursements relating to the Fund’s investment in AB Government Money Market Portfolio amounted to $5,018 and $14,361, respectively.
| | |
| |
16 | AB INTERNATIONAL LOW VOLATILITY EQUITY ETF | | abfunds.com |
NOTES TO FINANCIAL STATEMENTS (continued)
A summary of the Fund’s transactions in AB mutual funds for the period ended November 30, 2024 is as follows:
| | | | | | | | | | | | | | | | | | | | |
Fund | | Market Value
06/30/24
(000) | | | Purchases
at Cost
(000) | | | Sales
Proceeds
(000) | | | Market Value
11/30/24
(000) | | | Dividend
Income
(000) | |
AB Government Money Market Portfolio | | $ | 2,020 | | | $ | 74,513 | | | $ | 63,629 | | | $ | 12,904 | | | $ | 124 | |
A summary of the Fund’s transactions in AB mutual funds for the year ended June 30, 2024 is as follows:
| | | | | | | | | | | | | | | | | | | | |
Fund | | Market Value
06/30/23
(000) | | | Purchases
at Cost
(000) | | | Sales
Proceeds
(000) | | | Market Value
06/30/24
(000) | | | Dividend
Income
(000) | |
AB Government Money Market Portfolio | | $ | 16,958 | | | $ | 170,644 | | | $ | 185,582 | | | $ | 2,020 | | | $ | 547 | |
AB Government Money Market Portfolio* | | | 8,781 | | | | 124,631 | | | | 133,412 | | | | – 0 | – | | | 26 | |
| | | | | | | | | | | | | | | | | | | | |
| | | | | | | | | | | | | | $ | 2,020 | | | $ | 573 | |
| | | | | | | | | | | | | | | | | | | | |
| * | Investment of cash collateral for securities lending transactions (see Note E). |
During the period ended November 30, 2024 the Adviser reimbursed the Fund $58,457 for trading losses incurred due to trade entry error.
NOTE C
Distribution Services Agreement
Effective July 12, 2024, the Fund has adopted a Distribution and Service Plan (the “Plan”) pursuant to Rule 12b-1 of the Act which permits the Fund to pay distribution and servicing fees not to exceed .25% per year of the Fund’s average daily net assets, provided that the Fund will not make any 12b-1 payments under the Plan without prior Board and stockholder approval. No such fees are currently paid. Prior to the Conversion, the Acquired Portfolio paid distribution and servicing fees to the Distributor at an annual rate of up to .25% of the Fund’s average daily net assets attributable to Class A shares and 1% of the Fund’s average daily net assets attributable to Class C shares. There are no distribution and servicing fees on the Advisor Class and Class Z shares. As of May 1, 2023, with respect to Class C, payments to the Distributor are voluntarily being limited to .75% of the average net assets attributable to Class C. For the year ended June 30, 2024, such waiver amounted to $419. The fees are accrued daily and paid monthly. The provides that the Distributor will use such payments in their entirety for distribution assistance and promotional activities. Since the commencement of the Fund’s operations, the Distrib-
| | |
| |
| abfunds.com | | AB INTERNATIONAL LOW VOLATILITY EQUITY ETF | 17 |
NOTES TO FINANCIAL STATEMENTS (continued)
utor has incurred expenses in excess of the distribution costs reimbursed by the Fund in the amount of $611 for Class C shares. While such costs may be recovered from the Fund in future periods so long as the Agreement is in effect, the rate of the distribution and servicing fees payable under the Agreement may not be increased without a shareholder vote. In accordance with the Agreement, there is no provision for recovery of unreimbursed distribution costs incurred by the Distributor beyond the current fiscal year for Class A shares. The Agreement also provides that the Adviser may use its own resources to finance the distribution of the Fund’s shares.
NOTE D
Investment Transactions
Purchases and sales of investment securities (excluding short-term investments and in-kind purchases and sales) for the period ended November 30, 2024 were as follows:
| | | | | | | | |
| | | Purchases | | | Sales | |
Investment securities (excluding U.S. government securities) | | $ | 115,115,248 | | | $ | 126,325,103 | |
U.S. government securities | | | – 0 | – | | | – 0 | – |
Purchases and sales of investment securities (excluding short-term investments) for the year ended June 30, 2024, were as follows:
| | | | | | | | |
| | | Purchases | | | Sales | |
Investment securities (excluding U.S. government securities) | | $ | 329,709,287 | | | $ | 302,324,242 | |
U.S. government securities | | | – 0 | – | | | – 0 | – |
During the period ended November 30, 2024, the Fund delivered portfolio securities for the redemption of Fund shares (in-kind redemptions). Cash and portfolio securities were transferred for redemptions at fair value. For financial reporting purposes, the Fund recorded net realized gains and losses in connection with each in-kind redemption transaction. For the period ended November 30, 2024, the Fund had in-kind purchases and in-kind sales as follows:
| | | | | | | | |
| | | Purchases | | | Sales | |
In-kind transactions | | | | | | | | |
(excluding U.S. government securities) | | $ | 6,515,655 | | | $ | 5,162,833 | |
U.S. government securities | | | – 0 | – | | | – 0 | – |
| | |
| |
18 | AB INTERNATIONAL LOW VOLATILITY EQUITY ETF | | abfunds.com |
NOTES TO FINANCIAL STATEMENTS (continued)
The cost of investments for federal income tax purposes, gross unrealized appreciation and unrealized depreciation are as follows:
| | | | |
Cost | | $ | 644,270,743 | |
| | | | |
Gross unrealized appreciation | | $ | 197,643,058 | |
Gross unrealized depreciation | | | (22,472,489 | ) |
| | | | |
Net unrealized appreciation | | $ | 175,170,569 | |
| | | | |
1. Derivative Financial Instruments
The Fund may use derivatives in an effort to earn income and enhance returns, to replace more traditional direct investments, to obtain exposure to otherwise inaccessible markets (collectively, “investment purposes”), or to hedge or adjust the risk profile of its portfolio.
The principal type of derivative utilized by the Fund, as well as the methods in which they may be used are:
| | • | | Forward Currency Exchange Contracts |
The Fund may enter into forward currency exchange contracts in order to hedge its exposure to changes in foreign currency exchange rates on its foreign portfolio holdings, to hedge certain firm purchase and sale commitments denominated in foreign currencies and for non-hedging purposes as a means of making direct investments in foreign currencies, as described below under “Currency Transactions”.
A forward currency exchange contract is a commitment to purchase or sell a foreign currency at a future date at a negotiated forward rate. The gain or loss arising from the difference between the original contract and the closing of such contract would be included in net realized gain or loss on forward currency exchange contracts. Fluctuations in the value of open forward currency exchange contracts are recorded for financial reporting purposes as unrealized appreciation and/or depreciation by the Fund. Risks may arise from the potential inability of a counterparty to meet the terms of a contract and from unanticipated movements in the value of a foreign currency relative to the U.S. dollar.
During the period ended November 30, 2024 and the year ended June 30, 2024, the Fund held forward currency exchange contracts for hedging purposes.
The Fund typically enters into International Swaps and Derivatives Association, Inc. Master Agreements (“ISDA Master Agreement”) with its OTC derivative contract counterparties in order to, among other things, reduce its credit risk to OTC counterparties. ISDA Master Agreements include provisions for general obligations, representations, collateral and events of default or termination. Under an ISDA Master Agreement, the Fund
| | |
| |
| abfunds.com | | AB INTERNATIONAL LOW VOLATILITY EQUITY ETF | 19 |
NOTES TO FINANCIAL STATEMENTS (continued)
typically may offset with the OTC counterparty certain derivative financial instruments’ payables and/or receivables with collateral held and/or posted and create one single net payment (close-out netting) in the event of default or termination. In the event of a default by an OTC counterparty, the return of collateral with market value in excess of the Fund’s net liability, held by the defaulting party, may be delayed or denied.
The Fund’s ISDA Master Agreements may contain provisions for early termination of OTC derivative transactions in the event the net assets of the Fund decline below specific levels (“net asset contingent features”). If these levels are triggered, the Fund’s OTC counterparty has the right to terminate such transaction and require the Fund to pay or receive a settlement amount in connection with the terminated transaction. If OTC derivatives were held at period end, please refer to netting arrangements by the OTC counterparty table below for additional details.
During the period ended November 30, 2024, the Fund had entered into the following derivatives:
| | | | | | | | | | | | |
| | | Asset Derivatives | | | Liability Derivatives | |
Derivative
Type | | Statement of
Assets and
Liabilities
Location | | Fair Value | | | Statement of
Assets and
Liabilities
Location | | Fair Value | |
Foreign currency contracts | |
Unrealized appreciation on forward currency exchange contracts | |
$ |
2,771,856 |
| |
Unrealized depreciation on forward currency exchange contracts | |
$ |
2,124,073 |
|
| | | | | | | | | | | | |
Total | | | | $ | 2,771,856 | | | | | $ | 2,124,073 | |
| | | | | | | | | | | | |
| | | | | | | | | | |
Derivative Type | | Location of
Gain or (Loss)
on Derivatives
Within
Statement of
Operations
for the Period
July 1, 2024 to November 30, 2024 | | Realized Gain
or (Loss) on
Derivatives | | | Change in
Unrealized
Appreciation or
(Depreciation) | |
Foreign currency contracts | | Net realized gain (loss) on forward currency exchange contracts; Net change in unrealized appreciation (depreciation) of forward currency exchange contracts | | $ | (4,049,781 | ) | | $ | 1,887,125 | |
| | | | | | | | | | |
Total | | | | $ | (4,049,781 | ) | | $ | 1,887,125 | |
| | | | | | | | | | |
| | |
| |
20 | AB INTERNATIONAL LOW VOLATILITY EQUITY ETF | | abfunds.com |
NOTES TO FINANCIAL STATEMENTS (continued)
| | | | | | | | | | |
Derivative Type | | Location of
Gain or (Loss)
on Derivatives
Within
Statement of
Operations
for the Year Ended
June 30, 2024 | | Realized Gain
or (Loss) on
Derivatives | | | Change in
Unrealized
Appreciation or
(Depreciation) | |
Foreign currency contracts | | Net realized gain (loss) on forward currency exchange contracts; Net change in unrealized appreciation (depreciation) of forward currency exchange contracts | | $ | (8,366,837 | ) | | $ | 2,060,773 | |
| | | | | | | | | | |
Total | | | | $ | (8,366,837 | ) | | $ | 2,060,773 | |
| | | | | | | | | | |
The following table represents the average monthly volume of the Fund’s derivative transactions during the period ended November 30, 2024:
| | | | |
Forward Currency Exchange Contracts: | | | | |
Average principal amount of buy contracts | | $ | 219,330,391 | |
Average principal amount of sale contracts | | $ | 194,149,892 | |
The following table represents the average monthly volume of the Fund’s derivative transactions during the year ended June 30, 2024:
| | | | |
Forward Currency Exchange Contracts: | | | | |
Average principal amount of buy contracts | | $ | 174,125,668 | |
Average principal amount of sale contracts | | $ | 149,299,493 | |
For financial reporting purposes, the Fund does not offset derivative assets and derivative liabilities that are subject to netting arrangements in the statement of assets and liabilities.
| | |
| |
| abfunds.com | | AB INTERNATIONAL LOW VOLATILITY EQUITY ETF | 21 |
NOTES TO FINANCIAL STATEMENTS (continued)
All OTC derivatives held at period end were subject to netting arrangements. The following table presents the Fund’s derivative assets and liabilities by OTC counterparty net of amounts available for offset under ISDA Master Agreements (“MA”) and net of the related collateral received/pledged by the Fund as of November 30, 2024. Exchange-traded derivatives and centrally cleared swaps are not subject to netting arrangements and as such are excluded from the table.
| | | | | | | | | | | | | | | | | | | | |
Counterparty | | Derivative
Assets
Subject to
a MA | | | Derivatives
Available
for Offset | | | Cash
Collateral
Received* | | | Security
Collateral
Received* | | | Net Amount
of Derivative
Assets | |
Bank of America, NA | | $ | 141,798 | | | $ | (43,389 | ) | | $ | – 0 | – | | $ | – 0 | – | | $ | 98,409 | |
Deutsche Bank AG | | | 74,798 | | | | (72,817 | ) | | | – 0 | – | | | – 0 | – | | | 1,981 | |
Morgan Stanley Capital Services, Inc. | | | 1,006,986 | | | | (565,794 | ) | | | – 0 | – | | | – 0 | – | | | 441,192 | |
NatWest Markets PLC | | | 3,601 | | | | (3,601 | ) | | | – 0 | – | | | – 0 | – | | | – 0 | – |
State Street Bank & Trust Co. | | | 1,544,673 | | | | (205,194 | ) | | | – 0 | – | | | – 0 | – | | | 1,339,479 | |
| | | | | | | | | | | | | | | | | | | | |
Total | | $ | 2,771,856 | | | $ | (890,795 | ) | | $ | – 0 | – | | $ | – 0 | – | | $ | 1,881,061 | ^ |
| | | | | | | | | | | | | | | | | | | | |
| | | | | |
Counterparty | | Derivative
Liabilities
Subject to
a MA | | | Derivatives
Available
for Offset | | | Cash
Collateral
Pledged* | | | Security
Collateral
Pledged* | | | Net
Amount of
Derivative
Liabilities | |
Bank of America, NA | | $ | 43,389 | | | $ | (43,389 | ) | | $ | – 0 | – | | $ | – 0 | – | | $ | – 0 | – |
Deutsche Bank AG | | | 72,817 | | | | (72,817 | ) | | | – 0 | – | | | – 0 | – | | | – 0 | – |
Morgan Stanley Capital Services, Inc. | | | 565,794 | | | | (565,794 | ) | | | – 0 | – | | | – 0 | – | | | – 0 | – |
NatWest Markets PLC | | | 1,236,879 | | | | (3,601 | ) | | | – 0 | – | | | – 0 | – | | | 1,233,278 | |
State Street Bank & Trust Co. | | | 205,194 | | | | (205,194 | ) | | | – 0 | – | | | – 0 | – | | | – 0 | – |
| | | | | | | | | | | | | | | | | | | | |
Total | | $ | 2,124,073 | | | $ | (890,795 | ) | | $ | – 0 | – | | $ | – 0 | – | | $ | 1,233,278 | ^ |
| | | | | | | | | | | | | | | | | | | | |
| * | The actual collateral received/pledged may be more than the amount reported due to over-collateralization. |
| ^ | Net amount represents the net receivable/payable that would be due from/to the counterparty in the event of default or termination. The net amount from OTC financial derivative instruments can only be netted across transactions governed under the same master agreement with the same counterparty. |
2. Currency Transactions
The Fund may invest in non-U.S. Dollar-denominated securities on a currency hedged or unhedged basis. The Fund may seek investment opportunities by taking long or short positions in currencies through the use of currency-related derivatives, including forward currency exchange contracts, futures and options on futures, swaps, and other options. The Fund may enter into transactions for investment opportunities when it anticipates that a foreign currency will appreciate or depreciate in value but securities denominated in that currency are not held by the Fund and do not present attractive investment opportunities. Such transactions may also be used
| | |
| |
22 | AB INTERNATIONAL LOW VOLATILITY EQUITY ETF | | abfunds.com |
NOTES TO FINANCIAL STATEMENTS (continued)
when the Adviser believes that it may be more efficient than a direct investment in a foreign currency-denominated security. The Fund may also conduct currency exchange contracts on a spot basis (i.e., for cash at the spot rate prevailing in the currency exchange market for buying or selling currencies).
NOTE E
Securities Lending
The Fund may enter into securities lending transactions. Under the Fund’s securities lending program, all loans of securities will be collateralized continually by cash collateral and/or non-cash collateral. Non-cash collateral will include only securities issued or guaranteed by the U.S. government or its agencies or instrumentalities. If the Fund cannot sell or repledge any non-cash collateral, such collateral will not be reflected in the portfolio of investments. If a loan is collateralized by cash, the Fund will be compensated for the loan from a portion of the net return from the income earned on cash collateral after a rebate is paid to the borrower (in some cases, this rebate may be a “negative rebate” or fee paid by the borrower to the Fund in connection with the loan), and payments are made for fees of the securities lending agent and for certain other administrative expenses. If the Fund receives non-cash collateral, the Fund will receive a fee from the borrower generally equal to a negotiated percentage of the market value of the loaned securities. The Fund will have the right to call a loan and obtain the securities loaned at any time on notice to the borrower within the normal and customary settlement time for the securities. While the securities are on loan, the borrower is obligated to pay the Fund amounts equal to any dividend income or other distributions from the securities; however, these distributions will not be afforded the same preferential tax treatment as qualified dividends. The Fund will not be able to exercise voting rights with respect to any securities during the existence of a loan, but will have the right to regain ownership of loaned securities in order to exercise voting or other ownership rights. Collateral received and securities loaned are marked to market daily to ensure that the securities loaned are secured by collateral. The lending agent currently invests the cash collateral received in Government Money Market Portfolio, an eligible money market vehicle, in accordance with the investment restrictions of the Fund, and as approved by the Board. The collateral received on securities loaned is recorded as an asset as well as a corresponding liability in the statement of assets and liabilities. The collateral will be adjusted the next business day to maintain the required collateral amount. The amounts of securities lending income from the borrowers and Government Money Market Portfolio are reflected in the statement of operations. When the Fund earns net securities lending income from Government Money Market Portfolio, the income is inclusive of a rebate expense paid to the borrower. In connection with the cash collateral investment by the Fund in Government
| | |
| |
| abfunds.com | | AB INTERNATIONAL LOW VOLATILITY EQUITY ETF | 23 |
NOTES TO FINANCIAL STATEMENTS (continued)
Money Market Portfolio, the Adviser has agreed to waive a portion of the Fund’s share of the advisory fees of Government Money Market Portfolio, as borne indirectly by the Fund as an acquired fund fee and expense. When the Fund lends securities, its investment performance will continue to reflect changes in the value of the securities loaned. A principal risk of lending portfolio securities is that the borrower may fail to return the loaned securities upon termination of the loan and that the collateral will not be sufficient to replace the loaned securities. The lending agent has agreed to indemnify the Fund in the case of default of any securities borrower.
A summary of the Fund’s transactions surrounding securities lending for the period ended November 30, 2024 is as follows:
| | | | | | | | | | | | | | | | | | | | | | |
| | | | | | | | | | | | | Government Money
Market Portfolio | |
Market
Value of
Securities on Loan* | | | Cash
Collateral* | | | Market
Value of
Non-Cash
Collateral* | | | Income from
Borrowers | | | Income
Earned | | | Advisory Fee
Waived | |
| $ | – 0 | – | | $ | – 0 | – | | $ | – 0 | – | | $ | 152 | | | $ | – 0 | – | | $ | – 0 | – |
| * | As of November 30, 2024. |
A summary of the Fund’s transactions surrounding securities lending for the year ended June 30, 2024 is as follows:
| | | | | | | | | | | | | | | | | | | | | | |
| | | | | | | | | | | | | Government Money
Market Portfolio | |
Market
Value of
Securities
on Loan* | | | Cash
Collateral* | | | Market
Value of
Non-Cash
Collateral* | | | Income from
Borrowers | | | Income
Earned | | | Advisory Fee
Waived | |
| $ | 2,283,436 | | | $ | – 0 | – | | $ | 2,412,039 | | | $ | 114,379 | | | $ | 25,803 | | | $ | 2,054 | |
| | |
| |
24 | AB INTERNATIONAL LOW VOLATILITY EQUITY ETF | | abfunds.com |
NOTES TO FINANCIAL STATEMENTS (continued)
NOTE F
Capital Stock
The Fund’s shares may only be bought and sold in a secondary market through a broker-dealer at a market price. Because ETF shares trade at market prices rather than NAV, shares may trade at a price greater than NAV (a premium) or less than NAV (a discount). The Fund issues and redeems shares at its NAV only in aggregations of a specified number of shares (a creation unit) generally in exchange for a designated portfolio of securities and/or cash (including any portion of such securities for which cash may be substituted). A fixed transaction fee is imposed on authorized participants in connection with creation unit redemption and creation transactions. Authorized participants may be required to pay an additional variable charge to cover certain costs and expenses related to the execution of trades resulting from creation unit transactions. Such variable charges, if any, are included in other capital within the Statement of Changes in Net Assets. Transactions in shares of the Fund were as follows:
| | | | | | | | | | | | | | | | | | | | | | | | | | | | | | | | |
| | | | | | | | | | | | | | | | | | | | | | | | | | | | | | | | |
| | | Shares | | | | | | Amount | | | | |
| | | Period Ended
November 30,
2024(a) | | | Year Ended
June 30, 2024(b) | | | Year Ended
June 30,
2023 | | | | | | Period Ended
November 30,
2024(a) | | | Year Ended
June 30, 2024(b) | | | Year Ended
June 30, 2023 | | | | |
| | | | | | | | |
| Class A | | | | | | | | | | | | | | | | | | | | | | | | | | | | | | | | |
Shares sold | | | – 0 | – | | | 22,737 | | | | 160,426 | | | | | | | $ | – 0 | – | | $ | 291,465 | | | $ | 1,852,793 | | | | | |
| | | | | |
Shares issued in reinvestment of dividends | | | – 0 | – | | | 3,303 | | | | – 0 | – | | | | | | | – 0 | – | | | 42,140 | | | | – 0 | – | | | | |
| | | | | |
Shares converted from Class C | | | – 0 | – | | | 241 | | | | 436 | | | | | | | | – 0 | – | | | 2,977 | | | | 5,539 | | | | | |
| | | | | |
Shares converted to Advisor Class | | | – 0 | – | | | (398,869 | ) | | | – 0 | – | | | | | | | – 0 | – | | | (5,532,794 | ) | | | – 0 | – | | | | |
| | | | | |
Shares redeemed | | | – 0 | – | | | (80,607 | ) | | | (241,254 | ) | | | | | | | – 0 | – | | | (1,082,025 | ) | | | (2,683,208 | ) | | | | |
| | | | | |
Net decrease | | | – 0 | – | | | (453,195 | ) | | | (80,392 | ) | | | | | | $ | – 0 | – | | $ | (6,278,237 | ) | | $ | (824,876 | ) | | | | |
| | | | | |
| | | | | | | | | | | | | | | | | | | | | | | | | | | | | | | | |
| Class C | | | | | | | | | | | | | | | | | | | | | | | | | | | | | | | | |
Shares sold | | | – 0 | – | | | – 0 | – | | | 4,521 | | | | | | | $ | – 0 | – | | $ | – 0 | – | | $ | 50,199 | | | | | |
| | | | | |
Shares issued in reinvestment of dividends | | | – 0 | – | | | 271 | | | | – 0 | – | | | | | | | – 0 | – | | | 3,387 | | | | – 0 | – | | | | |
| | | | | |
Shares converted to Class A | | | – 0 | – | | | (248 | ) | | | (447 | ) | | | | | | | – 0 | – | | | (2,977 | ) | | | (5,539 | ) | | | | |
| | | | | |
Shares converted to Advisor Class | | | – 0 | – | | | (18,496 | ) | | | – 0 | – | | | | | | | – 0 | – | | | (250,743 | ) | | | – 0 | – | | | | |
| | | | | |
Shares redeemed | | | – 0 | – | | | (400 | ) | | | (7,239 | ) | | | | | | | – 0 | – | | | (5,023 | ) | | | (84,062 | ) | | | | |
| | | | | |
Net decrease | | | – 0 | – | | | (18,873 | ) | | | (3,165 | ) | | | | | | $ | – 0 | – | | $ | (255,356 | ) | | $ | (39,402 | ) | | | | |
| | | | | |
| | | | | | | | | | | | | | | | | | | | | | | | | | | | | | | | |
| Advisor Class | | | | | | | | | | | | | | | | | | | | | | | | | | | | | | | | |
Shares sold | | | 384,694 | | | | 4,099,852 | | | | 5,103,024 | | | | | | | $ | 13,267,240 | | | $ | 128,904,731 | | | $ | 141,898,529 | | | | | |
| | | | | |
Shares issued in reinvestment of dividends | | | 173,444 | | | | 402,830 | | | | – 0 | – | | | | | | | 5,868,612 | | | | 12,266,118 | | | | – 0 | – | | | | |
| | | | | |
Shares converted from Class A | | | – 0 | – | | | 167,053 | | | | – 0 | – | | | | | | | – 0 | – | | | 5,532,794 | | | | – 0 | – | | | | |
| | | | | |
| | |
| |
| abfunds.com | | AB INTERNATIONAL LOW VOLATILITY EQUITY ETF | 25 |
NOTES TO FINANCIAL STATEMENTS (continued)
| | | | | | | | | | | | | | | | | | | | | | | | | | | | | | | | |
| | | Shares | | | | | | Amount | | | | |
| | | Period Ended
November 30,
2024(a) | | | Year Ended
June 30, 2024(b) | | | Year Ended
June 30,
2023 | | | | | | Period Ended
November 30,
2024(a) | | | Year Ended
June 30, 2024(b) | | | Year Ended
June 30, 2023 | | | | |
Shares converted from Class C | | | – 0 | – | | | 7,571 | | | | – 0 | – | | | | | | | – 0 | – | | | 250,743 | | | | – 0 | – | | | | |
| | | | | |
Shares converted from Class Z | | | – 0 | – | | | 1,731 | | | | – 0 | – | | | | | | | – 0 | – | | | 57,319 | | | | – 0 | – | | | | |
| | | | | |
Shares redeemed | | | (463,216 | ) | | | (3,746,529 | ) | | | (4,361,193 | ) | | | | | | | (16,146,326 | ) | | | (117,241,564 | ) | | | (121,633,519 | ) | | | | |
| | | | | |
Net increase (decrease) | | | 94,922 | | | | 932,508 | | | | 741,831 | | | | | | | $ | 2,989,526 | | | $ | 29,770,141 | | | $ | 20,265,010 | | | | | |
| | | | | |
| | | | | | | | | | | | | | | | | | | | | | | | | | | | | | | | |
| Class Z | | | | | | | | | | | | | | | | | | | | | | | | | | | | | | | | |
Shares sold | | | – 0 | – | | | 383 | | | | 3,060 | | | | | | | $ | – 0 | – | | $ | 4,933 | | | $ | 38,930 | | | | | |
| | | | | |
Shares issued in reinvestment of dividends | | | – 0 | – | | | 82 | | | | – 0 | – | | | | | | | – 0 | – | | | 1,049 | | | | – 0 | – | | | | |
| | | | | |
Shares converted to Advisor Class | | | – 0 | – | | | (4,099 | ) | | | – 0 | – | | | | | | | – 0 | – | | | (57,319 | ) | | | – 0 | – | | | | |
| | | | | |
Shares redeemed | | | – 0 | – | | | (551 | ) | | | (40 | ) | | | | | | | – 0 | – | | | (7,443 | ) | | | (488 | ) | | | | |
| | | | | |
Net decrease | | | – 0 | – | | | (4,185 | ) | | | 3,020 | | | | | | | $ | – 0 | – | | $ | (58,780 | ) | | $ | 38,442 | | | | | |
| | | | | |
| (a) | The Acquired Portfolio had a fiscal year end of June 30. The Fund has a fiscal year end of November 30. |
| (b) | After the close of business on July 12, 2024, AB International Low Volatility Equity Portfolio (the “Acquired Portfolio”) was reorganized into AB International Low Volatility Equity ETF. The amounts disclosed include those of the Acquired Portfolio. The Advisor class shares have been adjusted retroactively for the periods presented. |
| | See Note A and Note I for additional information on the reorganization. |
NOTE G
Risks Involved in Investing in the Fund
Market Risk—The value of the Fund’s assets will fluctuate as the market or markets in which the Fund invests fluctuate. The value of the Fund’s investments may decline, sometimes rapidly and unpredictably, simply because of economic changes or other events, including public health crises (including the occurrence of a contagious disease or illness), interest rate levels, and regional and global conflicts, that affect large portions of the market. It includes the risk that a particular style of investing may be underperforming the market generally.
Foreign (Non-U.S.) Investments Risk—Investments in securities of non-U.S. issuers may involve more risk than those of U.S. issuers. These securities may fluctuate more widely in price and may be more difficult to trade than domestic securities due to adverse market, economic, political, regulatory or other factors.
Currency Risk—Fluctuations in currency exchange rates may negatively affect the value of the Fund’s investments or reduce its returns.
Capitalization Risk—Investments in mid-capitalization companies may be more volatile than investments in large-capitalization companies. Investments in mid-capitalization companies may have additional risks
| | |
| |
26 | AB INTERNATIONAL LOW VOLATILITY EQUITY ETF | | abfunds.com |
NOTES TO FINANCIAL STATEMENTS (continued)
because these companies may have limited product lines, markets or financial resources.
Derivatives Risk—Derivatives may be difficult to price or unwind and may be leveraged so that small changes may produce disproportionate losses for the Fund. A short position in a derivative instrument involves the risk of a theoretically unlimited increase in the value of the underlying asset, reference rate or index, which could cause the Fund to suffer a potentially unlimited loss. Derivatives, especially over-the-counter derivatives, are also subject to counterparty risk, which is the risk that the counterparty (the party on the other side of the transaction) on a derivative transaction will be unable or unwilling to honor its contractual obligations to the Fund.
ETF Share Price and Net Asset Value Risk—The Fund’s shares are listed for trading on the NYSE Arca, Inc. (the “Exchange”). Shares are generally bought and sold in the secondary market at market prices. The NAV of the Fund will fluctuate with changes in the market value of the Fund’s holdings. The Fund’s NAV is calculated once per day, at the end of the day. The market price of a share on the Exchange could be higher than the NAV (premium), or lower than the NAV (discount) and may fluctuate during the trading day. When all or a portion of the Fund’s underlying securities trade in a market that is closed when the market for the Fund’s shares is open, there may be differences between the current value of a security and the last quoted price for that security in the closed local market, which could lead to a deviation between the market value of the Fund’s shares and the Fund’s NAV. Disruptions in the creations and redemptions process or the existence of extreme market volatility could result in the Fund’s shares trading above or below NAV. As the Fund may invest in securities traded on foreign exchanges, Fund shares may trade at a larger premium or discount to the Fund’s NAV per share than shares of other ETFs. In addition, in stressed market conditions, the market for Fund shares may become less liquid in response to deteriorating liquidity in the markets for the Fund’s underlying portfolio holdings.
Focused Portfolio Risk—Investments in a limited number of companies may have more risk because changes in the value of a single security may have a more significant effect, either negative or positive, on the Fund’s net asset value, or NAV.
Authorized Participant Risk—Only a limited number of financial institutions that enter into an authorized participant relationship with the Fund (“Authorized Participants”) may engage in creation or redemption transactions. If the Fund’s Authorized Participants decide not to create or redeem shares, Fund shares may trade at a larger premium or discount to the Fund’s NAV per share, or the Fund could face trading halts or de-listing.
| | |
| |
| abfunds.com | | AB INTERNATIONAL LOW VOLATILITY EQUITY ETF | 27 |
NOTES TO FINANCIAL STATEMENTS (continued)
Active Trading Market Risk—There is no guarantee that an active trading market for Fund shares will exist at all times. In times of market stress, markets can suffer erratic or unpredictable trading activity, extraordinary volatility or wide bid/ask spreads, which could cause some market makers and Authorized Participants to reduce their market activity or “step away” from making a market in ETF shares. Market makers and Authorized Participants are not obligated to place or execute purchase and redemption orders. This could cause the Fund’s market price to deviate, materially, from the NAV, and reduce the effectiveness of the ETF arbitrage process. Any absence of an active trading market for Fund shares could lead to a heightened risk that there will be a difference between the market price of a Fund share and the underlying value of the Fund share.
Indemnification Risk—In the ordinary course of business, the Fund enters into contracts that contain a variety of indemnifications. The Fund’s maximum exposure under these arrangements is unknown. However, the Fund has not had prior claims or losses pursuant to these indemnification provisions and expects the risk of loss thereunder to be remote. Therefore, the Fund has not accrued any liability in connection with these indemnification provisions.
Management Risk—The Fund is subject to management risk because it is an actively-managed ETF. The Adviser will apply its investment techniques and risk analyses in making investment decisions, but there is no guarantee that its techniques will produce the intended results. Some of these techniques may incorporate, or rely upon, quantitative models, but there is no guarantee that these models will generate accurate forecasts, reduce risk or otherwise perform as expected.
NOTE H
Joint Credit Facility
A number of open-end mutual funds managed by the Adviser, including the Fund, participate in a $325 million revolving credit facility (the “Facility”) intended to provide short-term financing related to redemptions and other short term liquidity requirements, subject to certain restrictions. Commitment fees related to the Facility are paid by the participating funds and are included in miscellaneous expenses in the statement of operations. The Fund did not utilize the Facility during the period ended November 30, 2024.
| | |
| |
28 | AB INTERNATIONAL LOW VOLATILITY EQUITY ETF | | abfunds.com |
NOTES TO FINANCIAL STATEMENTS (continued)
NOTE I
Distributions to Shareholders
The tax character of distributions paid during the fiscal period ended November 30, 2024 and the fiscal years ended June 30, 2024 and June 30, 2023 were as follows:
| | | | | | | | | | | | |
| | | July 1, 2024 to
November 30, 2024 | | | Year Ended
June 30, 2024 | | | Year Ended
June 30, 2023 | |
Distributions paid from: | | | | | | | | | | | | |
Ordinary income | | $ | 7,514,658 | | | $ | 15,729,156 | | | $ | – 0 | – |
| | | | | | | | | | | | |
Total taxable distributions paid | | $ | 7,514,658 | | | $ | 15,729,156 | | | $ | – 0 | – |
| | | | | | | | | | | | |
As of November 30, 2024, the components of accumulated earnings (deficit) on a tax basis were as follows:
| | | | |
Undistributed ordinary income | | $ | 4,824,948 | |
Accumulated capital and other losses | | | (192,332 | )(a) |
Unrealized appreciation (depreciation) | | | 175,057,363 | (b) |
| | | | |
Total accumulated earnings (deficit) | | $ | 179,689,979 | |
| | | | |
| (a) | As of November 30, 2024, the Fund had a net capital loss carryforward of $192,332. During the fiscal period, the Fund utilized $15,649,168 of capital loss carry forwards to offset current period net realized gains. |
| (b) | The differences between book-basis and tax-basis unrealized appreciation (depreciation) are attributable primarily to the recognition for tax purposes of unrealized gains/losses on certain derivative instruments, the tax treatment of passive foreign investment companies (PFICs), and the tax deferral of losses on wash sales. |
For tax purposes, net realized capital losses may be carried over to offset future capital gains, if any. Funds are permitted to carry forward capital losses for an indefinite period, and such losses will retain their character as either short-term or long-term capital losses. As of November 30, 2024, the Fund had a net short-term capital loss carryforward of $192,332, which may be carried forward for an indefinite period.
During the current fiscal period, permanent differences primarily due to the utilization of earnings and profits distributed to shareholders on redemption of shares, the tax treatment of gains from a redemption-in-kind, and contributions from the Adviser resulted in a net decrease in distributable earnings and a net increase in additional paid-in capital. These reclassifications had no effect on net assets.
| | |
| |
| abfunds.com | | AB INTERNATIONAL LOW VOLATILITY EQUITY ETF | 29 |
NOTES TO FINANCIAL STATEMENTS (continued)
NOTE J
Reorganization
At meetings held October 31—November 2, 2023, the Board, on behalf of the Fund, and the Board of Directors of the Acquired Portfolio approved the Conversion providing for the tax-free acquisition by the Fund of the assets and liabilities of the Acquired Portfolio. The acquisition was completed at the close of business July 12, 2024. Pursuant to the Plan, the assets and liabilities of the Acquired Portfolio’s shares were transferred in exchange for Fund shares, in a tax-free exchange as follows:
| | | | | | | | | | | | | | | | |
Portfolio | | Shares
outstanding
before the
Conversion | | | Shares
outstanding
immediately
after the
Conversion | | | Aggregate
net assets
before the
Conversion | | | Aggregate
net assets
immediately
after the
Conversion | |
Acquired Portfolio* | | | 54,816,748 | | | | – 0 | – | | $ | 810,284,720+ | | | $ | – 0 | – |
The Fund | | | – 0 | – | | | 23,150,992 | | | $ | – 0 | – | | $ | 810,284,720 | |
| * | Represents the accounting survivor. |
| + | Includes undistributed net investment income of $8,189,662 and unrealized appreciation on investments of $186,338,704 with a fair value of $794,318,619 and identified cost of $607,979,915. |
For financial reporting purposes, assets received and shares issued by the Fund were recorded at fair value; however, the cost basis of the investments received from the Acquired Portfolio were carried forward to align ongoing reporting of the Fund’s realized and unrealized gains and losses with amounts distributable to shareholders for tax purposes.
NOTE K
Recent Accounting Pronouncements
In December 2022, the Financial Accounting Standards Board issued an Accounting Standards Update, ASU 2022-06, “Reference Rate Reform (Topic 848) – Deferral of the Sunset Date of Topic 848”. ASU 2022-06 is an amendment to ASU 2020-04, which provided optional guidance to ease the potential accounting burden due to the discontinuation of the LIBOR and other interbank-offered based reference rates and which was effective as of March 12, 2020 through December 31, 2022. ASU 2022-06 extends the effective period through December 31, 2024. Management is currently evaluating the impact, if any, of applying ASU 2022-06.
In November 2023, the Financial Accounting Standards Board issued Accounting Standards Update, ASU 2023-07, “Segment Reporting (Topic 280)”. ASU 2023-07 requires public entities to provide disclosure of significant segment expenses that are regularly provided to the chief operating decision maker (“CODM”). ASU 2023-07, among other things, (i) requires a single segment public entity to provide all necessary disclosures required by Topic 280, (ii) requires a public entity to disclose the title and position of the CODM and an explanation of how the CODM uses
| | |
| |
30 | AB INTERNATIONAL LOW VOLATILITY EQUITY ETF | | abfunds.com |
NOTES TO FINANCIAL STATEMENTS (continued)
the reported measure(s) of segment profit and loss in assessing segment performance and deciding how to allocate resources and (iii) provides the ability for a public entity to elect more than one performance measure. ASU 2023-07 is effective for fiscal years beginning after December 15, 2023, and interim periods within fiscal years beginning after December 15, 2024. Early adoption of ASU 2023-07 is permitted. Management is currently evaluating the impact, if any, of applying ASU 2023-07.
NOTE L
Subsequent Events
Management has evaluated subsequent events for possible recognition or disclosure in the financial statements through the date the financial statements are issued. Management has determined that there are no material events that would require disclosure in the Fund’s financial statements through this date.
| | |
| |
| abfunds.com | | AB INTERNATIONAL LOW VOLATILITY EQUITY ETF | 31 |
FINANCIAL HIGHLIGHTS
Selected Data For A Share Of Capital Stock Outstanding Throughout Each Period(a)
| | | | | | | | | | | | | | | | | | | | | | | | |
| | | July 1, 2024 to November 30, 2024(b) | | | Year Ended June 30, | |
| | | 2024 | | | 2023 | | | 2022 | | | 2021 | | | 2020 | |
| | | | |
Net asset value, beginning of period | | | $ 33.95 | | | | $ 30.26 | | | | $ 27.06 | | | | $ 31.87 | | | | $ 26.28 | | | | $ 27.80 | |
| | | | |
Income From Investment Operations | | | | |
| | | | | | |
Net investment income(c)(d) | | | 0.24 | | | | 0.76 | | | | 0.71 | | | | 0.62 | | | | 0.50 | | | | 0.47 | |
| | | | | | |
Net realized and unrealized gain (loss) on investment transactions | | | 1.50 | | | | 3.64 | | | | 2.49 | | | | (5.26 | ) | | | 5.56 | | | | (1.59 | ) |
| | | | | | |
Contributions from Affiliates | | | .00 | (e) | | | – 0 | – | | | – 0 | – | | | – 0 | – | | | – 0 | – | | | – 0 | – |
| | | | |
Net increase (decrease) in net asset value from operations | | | 1.74 | | | | 4.40 | | | | 3.20 | | | | (4.64 | ) | | | 6.06 | | | | (1.12 | ) |
| | | | |
Less: Dividends | | | | |
| | | | | | |
Dividends from net investment income | | | (.32 | ) | | | (0.71 | ) | | | – 0 | – | | | (0.17 | ) | | | (0.47 | ) | | | (0.40 | ) |
| | | | |
Net asset value, end of period | | | $ 35.37 | | | | $ 33.95 | | | | $ 30.26 | | | | $ 27.06 | | | | $ 31.87 | | | | $ 26.28 | |
| | | | |
| |
Total Return | | | | |
| | | | | | |
Total investment return based on net asset value(f) | | | 5.17 | % | | | 14.80 | % | | | 11.81 | % | | | (14.66 | )% | | | 23.26 | % | | | (4.14 | )% |
| |
Ratios/Supplemental Data | | | | |
| | | | | | |
Net assets, end of period (000’s omitted) | | | $825,953 | | | | $789,456 | | | | $675,542 | | | | $584,252 | | | | $656,592 | | | | $436,143 | |
| | | | | | |
Ratio to average net assets of: | | | | | | | | | | | | | | | | | | | | | | | | |
| | | | | | |
Expenses, net of waivers/reimbursements | | | .52 | %^ | | | .75 | % | | | .75 | % | | | .74 | % | | | .78 | % | | | .95 | % |
| | | | | | |
Expenses, before waivers/reimbursements | | | .52 | %^ | | | .76 | % | | | .76 | % | | | .75 | % | | | .79 | % | | | .99 | % |
| | | | | | |
Net investment income(d) | | | 1.64 | %^ | | | 2.38 | % | | | 2.51 | % | | | 1.96 | % | | | 1.70 | % | | | 1.74 | % |
| | | | | | |
Portfolio turnover rate(g) | | | 14 | % | | | 43 | % | | | 42 | % | | | 35 | % | | | 35 | % | | | 39 | % |
| (a) | After the close of business on July 12, 2024, AB International Low Volatility Equity Portfolio (the “Acquired Portfolio”) was converted into AB International Low Volatility Equity ETF. The performance and financial history of the Acquired Portfolio’s Advisor Class Shares have been adopted by the Fund and will be used going forward. As a result, the Financial Highlight information includes that of the Acquired Portfolio’s Advisor Class Shares and has been adjusted retroactively for the periods from June 30, 2020 through the Reorganization. |
| (b) | The Acquired Portfolio had a fiscal year end of June 30. The Fund has a fiscal year end of November 30. |
| (c) | Based on average shares outstanding. |
| (d) | Net of expenses waived/reimbursed by the Adviser. |
| (e) | Amount is less than $.005. |
| (f) | Total investment return is calculated assuming an initial investment made at the net asset value at the beginning of the period, reinvestment of all dividends and distributions at net asset value during the period, and redemption on the last day of the period. Initial sales charges or contingent deferred sales charges are not reflected in the calculation of total investment return. Total investment return does not reflect the deduction of taxes that a shareholder would pay on fund distributions or the redemption of fund shares. Total investment return calculated for a period of less than one year is not annualized. |
| | |
| |
32 | AB INTERNATIONAL LOW VOLATILITY EQUITY ETF | | abfunds.com |
FINANCIAL HIGHLIGHTS (continued)
Selected Data For A Share Of Capital Stock Outstanding Throughout Each Period(a)
| (g) | Excludes the value of portfolio securities received or delivered as a result of in-kind purchases or redemptions of the Fund’s capital shares, including ETF Creation Units. |
See notes to financial statements.
| | |
| |
| abfunds.com | | AB INTERNATIONAL LOW VOLATILITY EQUITY ETF | 33 |
REPORT OF INDEPENDENT REGISTERED
PUBLIC ACCOUNTING FIRM
To the Shareholders and the Board of Directors of
AB International Low Volatility Equity ETF
Opinion on the Financial Statements
We have audited the accompanying statement of assets and liabilities of AB International Low Volatility Equity ETF (the “Fund”) (one of the funds constituting AB Active ETFs, Inc. (the “Corporation”)), including the portfolio of investments, as of November 30, 2024, and the related statements of operations for the period from July 1, 2024 to November 30, 2024 and for the year ended June 30, 2024, and the statements of changes in net assets for the period from July 1, 2024 to November 30, 2024 and for each of the two years in the period ended June 30, 2024, the financial highlights for the period from July 1, 2024 to November 30, 2024 and for each of the five years in the period ended June 30, 2024, and the related notes (collectively referred to as the “financial statements”). In our opinion, the financial statements present fairly, in all material respects, the financial position of the Fund (one of the funds constituting AB Active ETFs, Inc.) at November 30, 2024, the results of its operations for the period from July 1, 2024 to November 30, 2024 and for the year ended June 30, 2024, the changes in its net assets for the period from July 1, 2024 to November 30, 2024 and for each of the two years in the period ended June 30, 2024 and its financial highlights for the period from July 1, 2024 to November 30, 2024 and for each of the five years in the period ended June 30, 2024, in conformity with U.S. generally accepted accounting principles.
Basis for Opinion
These financial statements are the responsibility of the Corporation’s management. Our responsibility is to express an opinion on the Fund’s financial statements based on our audits. We are a public accounting firm registered with the Public Company Accounting Oversight Board (United States) (“PCAOB”) and are required to be independent with respect to the Corporation in accordance with the U.S. federal securities laws and the applicable rules and regulations of the Securities and Exchange Commission and the PCAOB.
We conducted our audits in accordance with the standards of the PCAOB. Those standards require that we plan and perform the audit to obtain reasonable assurance about whether the financial statements are free of material misstatement, whether due to error or fraud. The Corporation is not required to have, nor were we engaged to perform, an audit of the Corporation’s internal control over financial reporting. As part of our audits, we are required to obtain an understanding of internal control over financial reporting but not for the purpose of expressing an opinion on the effectiveness of the Corporation’s internal control over financial reporting. Accordingly, we express no such opinion.
| | |
| |
34 | AB INTERNATIONAL LOW VOLATILITY EQUITY ETF | | abfunds.com |
REPORT OF INDEPENDENT REGISTERED
PUBLIC ACCOUNTING FIRM (continued)
Our audits included performing procedures to assess the risks of material misstatement of the financial statements, whether due to error or fraud, and performing procedures that respond to those risks. Such procedures included examining, on a test basis, evidence regarding the amounts and disclosures in the financial statements. Our procedures included confirmation of securities owned as of November 30, 2024, by correspondence with the custodian, brokers and others; when replies were not received from brokers or others, we performed other auditing procedures. Our audits also included evaluating the accounting principles used and significant estimates made by management, as well as evaluating the overall presentation of the financial statements. We believe that our audits provide a reasonable basis for our opinion.

We have served as the auditor of one or more of the AB investment companies since 1968.
New York, New York
January 28, 2025
| | |
| |
| abfunds.com | | AB INTERNATIONAL LOW VOLATILITY EQUITY ETF | 35 |
2024 FEDERAL TAX INFORMATION
(unaudited)
For Federal income tax purposes, the following information is furnished with respect to the distributions paid by the Fund during the taxable year ended November 30, 2024. For Individual shareholders, the Fund designates 100% of dividends paid as qualified dividend income. For corporate shareholders, 3.57% of dividends paid qualify for the dividends received deduction.
The Fund intends to make an election to pass through foreign taxes to its shareholders. For the taxable period ended November 30, 2024, $555,188 of foreign taxes may be passed through and the associated foreign source income for information reporting purposes is $8,474,603.
Shareholders should not use the above information to prepare their income tax returns. The information necessary to complete your income tax returns will be included with your Form 1099-DIV which will be sent to you separately in January 2025.
| | |
| |
36 | AB INTERNATIONAL LOW VOLATILITY EQUITY ETF | | abfunds.com |
Information Regarding the Review and Approval of the Fund’s Advisory Agreement
The disinterested directors (the “directors”) of AB Active ETFs, Inc. (the “Company”) unanimously approved the Company’s Advisory Agreement with the Adviser in respect of AB International Low Volatility Equity ETF (the “Fund”) for an initial two-year period at a meeting held in-person on October 31-November 2, 2023 (the “Meeting”).
Prior to approval of the Advisory Agreement, the directors had requested from the Adviser, and received and evaluated, extensive materials. They reviewed the proposed Advisory Agreement with the Adviser and with experienced counsel who are independent of the Adviser, who advised on the relevant legal standards. The directors also reviewed additional materials, including comparative analytical data prepared by the Senior Vice President of the Fund. The directors also discussed the proposed approval in private sessions with counsel.
The directors considered their knowledge of the nature and quality of the services to be provided by the Adviser to the Fund gained from their experience as directors or trustees of most of the registered investment companies advised by the Adviser, including the other series of the Company that are organized as exchange-traded funds (“ETFs”), their overall confidence in the Adviser’s integrity and competence they have gained from that experience, the Adviser’s initiative in identifying and raising potential issues with the directors and its responsiveness, frankness and attention to concerns raised by the directors in the past, including the Adviser’s willingness to consider and implement organizational and operational changes designed to improve investment results and the services provided to the AB Funds. The directors noted that they have four regular meetings each year, at each of which they review extensive materials and information from the Adviser, including information on the investment performance of the AB Funds.
The directors also considered all factors they believed relevant, including the specific matters discussed below. During the course of their deliberations, the directors evaluated, among other things, the reasonableness of the proposed advisory fee. The directors did not identify any particular information that was all-important or controlling, and different directors may have attributed different weights to the various factors. The directors determined that the selection of the Adviser to manage the Fund and the overall arrangements between the Fund and the Adviser, as provided in the Advisory Agreement, including the proposed advisory fee, were fair and reasonable in light of the services to be performed, expenses to be incurred and such other matters as the directors considered relevant in the exercise of their business judgment. The material factors and conclusions that formed the basis for the directors’ determinations included the following:
| | |
| |
| abfunds.com | | AB INTERNATIONAL LOW VOLATILITY EQUITY ETF | 37 |
Nature, Extent and Quality of Services to be Provided
The directors considered the scope and quality of services to be provided by the Adviser under the Advisory Agreement, including the quality of the investment research capabilities of the Adviser and the other resources it has dedicated to performing services for the AB Funds. They also noted the professional experience and qualifications of the Fund’s portfolio management team and other senior personnel of the Adviser. The directors also considered that the Advisory Agreement provides that the Fund will reimburse the Adviser for the cost to it of providing certain clerical, accounting, administrative and other services to the Fund by employees of the Adviser or its affiliates. Requests for these reimbursements will be subject to the directors’ approval on a quarterly basis. The directors noted that the Adviser does not expect to request such reimbursements. The quality of administrative and other services, including the Adviser’s role in coordinating the activities of the Fund’s other service providers, also was considered. The directors concluded that, overall, they were satisfied with the nature, extent and quality of services to be provided to the Fund under the Advisory Agreement.
Costs of Services to be Provided and Profitability
Because the Fund had not yet commenced operations, the directors were unable to consider historical information about the profitability of the Fund. However, the Adviser agreed to provide the directors with profitability information in connection with future proposed continuances of the Advisory Agreement. They also considered the costs to be borne by the Adviser in providing services to the Fund and that the Fund was unlikely to be profitable to the Adviser unless it achieves a material level of net assets.
Fall-Out Benefits
The directors considered the other benefits to the Adviser from its proposed relationship with the Fund. The directors recognized that the Adviser’s future profitability would be somewhat lower without these benefits. The directors understood that the Adviser also might derive reputational and other benefits from its association with the Fund.
Investment Results
Since the Fund was newly formed and had not yet commenced operations, no performance or other historical information for the Fund was available. However, it was proposed that the Fund would receive the assets of AB International Low Volatility Equity Portfolio (the “Acquired Portfolio”), a series of AB Cap Fund, Inc. (a mutual fund), in exchange for shares of the Fund (an exchange traded fund) and the assumption by the Fund of all the liabilities of the Acquired Portfolio. Shareholders of the Acquired Portfolio would receive shares of the Fund in a liquidating distribution of the Acquired Portfolio (the “Conversion”). The Conversion is expected to be consummated on or about July 2024. Based on the Adviser’s written and oral presentations regarding the proposed
| | |
| |
38 | AB INTERNATIONAL LOW VOLATILITY EQUITY ETF | | abfunds.com |
management of the Fund and their general knowledge and confidence in the Adviser’s expertise in managing mutual funds and ETFs, the directors concluded that they were satisfied that the Adviser was capable of providing high quality Fund management services to the Fund.
Advisory Fees and Other Expenses
The directors considered the proposed advisory fee rate payable by the Fund to the Adviser and information prepared by an independent service provider (the “15(c) service provider”), concerning advisory fee rates payable by other ETFs in the same category as the Fund, based on the Fund’s projected net assets of $600 million. The directors noted that the proposed advisory fee is a unitary fee and that the Adviser will pay all expenses of the Fund except for certain expenses payable by the Fund such as interest expense, taxes, extraordinary expenses, and brokerage commissions and other transaction costs. The directors recognized that it is difficult to make comparisons of advisory fees because there are variations in the services that are included in the fees payable by other ETFs. The directors considered the Fund’s proposed contractual advisory fee rate against a peer group median and noted that it was lower than the median.
The directors also considered the Adviser’s fee schedule for other clients utilizing investment strategies similar to those of the Fund. For this purpose, they reviewed the relevant advisory fee information from the Adviser’s Form ADV and in a report from the Fund’s Senior Vice President and noted the differences between the Fund’s proposed fee schedule, on the one hand, and the Adviser’s institutional fee schedule and the schedule of fees charged by the Adviser to any offshore funds and for services to any sub-advised funds utilizing investment strategies similar to those of the Fund, on the other. The directors noted that the Adviser may, in some cases, agree to fee rates with large institutional clients that are lower than those reviewed by the directors and that they had previously discussed with the Adviser its policies in respect of such arrangements. The directors also compared the proposed advisory fee rate for the Fund with that for another fund advised by the Adviser utilizing similar investment strategies.
The Adviser reviewed with the directors the significantly greater scope of the services it will provide to the Fund relative to institutional, offshore fund and sub-advised fund clients. In this regard, the Adviser noted, among other things, that, compared to institutional and offshore or sub-advisory accounts, the Fund (i) demands considerably more managerial and administrative resources due to the potential for frequent creations and redemptions of shares; (ii) has more tax and regulatory restrictions and compliance obligations; (iii) must prepare and file or distribute regulatory and other communications about fund operations; and (iv) must provide shareholder servicing to retail investors. The Adviser also reviewed the greater legal risks presented by the large and changing population of Fund
| | |
| |
| abfunds.com | | AB INTERNATIONAL LOW VOLATILITY EQUITY ETF | 39 |
shareholders who may assert claims against the Adviser in individual or class actions, and the greater entrepreneurial risk in offering new fund products, which require substantial investment to launch, may not succeed, and generally must be priced to compete with larger, more established funds resulting in lack of profitability to the Adviser until a new fund achieves scale. In light of the substantial differences in services rendered by the Adviser to institutional, offshore fund and sub-advisory fund clients as compared to the Fund, and the different risk profile, the directors considered these fee comparisons inapt and did not place significant weight on them in their deliberations. The directors noted that the proposed unitary fee for the Fund covers additional services provided by third parties and thus is not directly comparable to the Adviser’s institutional fee schedule and the schedule of fees for most other funds advised by the Adviser.
In connection with their review of the Fund’s proposed advisory fee, the directors also considered the projected total expense ratio of the shares of the Fund in comparison to a group of similar ETFs (“peer group”) and a larger group of similar ETFs (“peer universe”) selected by the 15(c) service provider. The directors view the projected expense ratio information as relevant to their evaluation of the Adviser’s services because the Adviser is responsible for coordinating services provided to the Fund by others and, in most cases, the Adviser will be responsible for paying for such services under its unitary fee arrangement with the Fund. The directors noted that the Fund’s projected expense ratio was higher than a median. Based on their review, the directors concluded that the Fund’s projected expense ratio was acceptable.
Economies of Scale
The directors noted that the proposed advisory fee schedule for the Fund does not contain breakpoints and that they had discussed their strong preference for breakpoints in advisory contracts with the Adviser. The directors took into consideration prior presentations by an independent consultant on economies of scale in the mutual fund industry and for the AB Funds, and presentations from time to time by the Adviser concerning certain of its views on economies of scale. The directors also had requested and received from the Adviser certain updates on economies of scale in advance of the Meeting. The directors believe that economies of scale may be realized (if at all) by the Adviser across a variety of products and services, and not only in respect of a single fund. The directors noted that there is no established methodology for setting breakpoints that give effect to the fund-specific services provided by a fund’s adviser and to the economies of scale that an adviser may realize in its overall mutual fund business or those components of it which directly or indirectly affect a fund’s operations. The directors observed that in the mutual fund industry as a whole, as well as among ETFs similar to the Fund, there is no uniformity or pattern in the fees and asset levels at which breakpoints (if any)
| | |
| |
40 | AB INTERNATIONAL LOW VOLATILITY EQUITY ETF | | abfunds.com |
apply. The directors also noted that the advisory agreements for many ETFs do not have breakpoints at all. The directors informed the Adviser that they would monitor the Fund’s asset level and its profitability to the Adviser and anticipated revisiting the question of breakpoints in the future if circumstances warranted doing so.
| | |
| |
| abfunds.com | | AB INTERNATIONAL LOW VOLATILITY EQUITY ETF | 41 |
NOTES
| | |
| |
42 | AB INTERNATIONAL LOW VOLATILITY EQUITY ETF | | abfunds.com |
NOTES
| | |
| |
| abfunds.com | | AB INTERNATIONAL LOW VOLATILITY EQUITY ETF | 43 |
NOTES
| | |
| |
44 | AB INTERNATIONAL LOW VOLATILITY EQUITY ETF | | abfunds.com |
AB International Low Volatility Equity ETF
66 Hudson Boulevard East
New York, NY 10001
800 221 5672
ETF-ILVE-0151-1124 
NOV 11.30.24

ANNUAL FINANCIAL STATEMENTS AND ADDITIONAL INFORMATION
AB SHORT DURATION HIGH YIELD ETF
(NYSE Arca: SYFI)

| | |
| |
| Investment Products Offered | | • Are Not FDIC Insured • May Lose Value • Are Not Bank Guaranteed |
Investors should consider the investment objectives, risks, charges and expenses of the Fund carefully before investing. For copies of our prospectus or summary prospectus, which contain this and other information, visit us online at www.abfunds.com or contact your AB representative. Please read the prospectus and/or summary prospectus carefully before investing.
This shareholder report must be preceded or accompanied by the Fund’s prospectus for individuals who are not current shareholders of the Fund.
You may obtain a description of the Fund’s proxy voting policies and procedures, and information regarding how the Fund voted proxies relating to portfolio securities during the most recent 12-month period ended June 30, without charge. Simply visit AB’s website at www.abfunds.com, or go to the Securities and Exchange Commission’s (the “Commission”) website at www.sec.gov, or call AB at (800) 227 4618.
The Fund files its complete schedule of portfolio holdings with the Commission for the first and third quarters of each fiscal year as an exhibit to its reports on Form N-PORT. The Fund’s Form N-PORT reports are available on the Commission’s website at www.sec.gov. AB publishes full portfolio holdings for the Fund monthly at www.abfunds.com.
AllianceBernstein Investments, Inc. (ABI) is the distributor of the AB family of mutual funds. ABI is a member of FINRA and is an affiliate of AllianceBernstein L.P., the Adviser of the funds.
The [A/B] logo and AllianceBernstein® are registered trademarks used by permission of the owner, AllianceBernstein L.P.
PORTFOLIO OF INVESTMENTS
November 30, 2024
| | | | | | | | | | | | |
| | | | | | Principal
Amount
(000) | | | U.S. $ Value | |
| |
CORPORATES - NON-INVESTMENT GRADE – 74.0% | | | | | | | | | | | | |
Industrial – 64.0% | | | | | | | | | | | | |
Basic – 5.8% | | | | | | | | | | | | |
Alcoa Nederland Holding BV
4.125%, 03/31/2029(a) | | | U.S.$ | | | | 1,286 | | | $ | 1,217,340 | |
ASP Unifrax Holdings, Inc.
7.10% (5.85% Cash and 1.25% PIK), 09/30/2029(a)(b) | | | | | | | 2,427 | | | | 1,406,548 | |
10.425% (10.425% Cash or 11.175% PIK), 09/30/2029(a)(b) | | | | | | | 916 | | | | 923,567 | |
Axalta Coating Systems LLC
3.375%, 02/15/2029(a) | | | | | | | 400 | | | | 367,688 | |
Axalta Coating Systems LLC/Axalta Coating Systems Dutch Holding B BV
4.75%, 06/15/2027(a) | | | | | | | 950 | | | | 932,102 | |
Cerdia Finanz GmbH
9.375%, 10/03/2031(a) | | | | | | | 365 | | | | 381,626 | |
Constellium SE
3.125%, 07/15/2029(a) | | | EUR | | | | 617 | | | | 615,834 | |
Crown Americas LLC/Crown Americas Capital Corp. VI
4.75%, 02/01/2026 | | | U.S.$ | | | | 1,485 | | | | 1,474,056 | |
CVR Partners LP/CVR Nitrogen Finance Corp.
6.125%, 06/15/2028(a) | | | | | | | 4,115 | | | | 4,005,664 | |
Domtar Corp.
6.75%, 10/01/2028(a) | | | | | | | 1,252 | | | | 1,158,688 | |
Element Solutions, Inc.
3.875%, 09/01/2028(a) | | | | | | | 4,329 | | | | 4,160,169 | |
FMG Resources (August 2006) Pty Ltd.
4.50%, 09/15/2027(a) | | | | | | | 2,915 | | | | 2,834,371 | |
5.875%, 04/15/2030(a) | | | | | | | 571 | | | | 566,849 | |
6.125%, 04/15/2032(a) | | | | | | | 134 | | | | 134,610 | |
Graphic Packaging International LLC
3.50%, 03/15/2028(a) | | | | | | | 3,789 | | | | 3,560,069 | |
6.375%, 07/15/2032(a) | | | | | | | 875 | | | | 891,817 | |
Guala Closures SpA
7.481% (EURIBOR 3 Month + 4.00%), 06/29/2029(a)(c) | | | EUR | | | | 600 | | | | 637,459 | |
INEOS Finance PLC
7.50%, 04/15/2029(a) | | | U.S.$ | | | | 1,471 | | | | 1,522,191 | |
INEOS Quattro Finance 2 PLC
2.50%, 01/15/2026(a) | | | EUR | | | | 257 | | | | 269,177 | |
6.75%, 04/15/2030(a) | | | | | | | 1,103 | | | | 1,193,298 | |
9.625%, 03/15/2029(a) | | | U.S.$ | | | | 241 | | | | 256,135 | |
Ingevity Corp.
3.875%, 11/01/2028(a) | | | | | | | 2,245 | | | | 2,090,566 | |
| | |
| |
| abfunds.com | | AB SHORT DURATION HIGH YIELD ETF | 1 |
PORTFOLIO OF INVESTMENTS (continued)
| | | | | | | | | | | | |
| | | | | | Principal
Amount
(000) | | | U.S. $ Value | |
| |
Mineral Resources Ltd.
8.50%, 05/01/2030(a) | | | U.S.$ | | | | 2,379 | | | $ | 2,432,290 | |
Olympus Water US Holding Corp.
3.875%, 10/01/2028(a) | | | EUR | | | | 100 | | | | 102,420 | |
SCIL IV LLC/SCIL USA Holdings LLC
4.375%, 11/01/2026(a) | | | | | | | 187 | | | | 196,571 | |
5.375%, 11/01/2026(a) | | | U.S.$ | | | | 3,089 | | | | 3,053,538 | |
7.431% (EURIBOR 3 Month + 4.38%), 11/01/2026(a)(c) | | | EUR | | | | 318 | | | | 337,118 | |
Sealed Air Corp./Sealed Air Corp. US
6.125%, 02/01/2028(a) | | | U.S.$ | | | | 250 | | | | 252,383 | |
SNF Group SACA
3.125%, 03/15/2027(a) | | | | | | | 1,989 | | | | 1,895,696 | |
WR Grace Holdings LLC
4.875%, 06/15/2027(a) | | | | | | | 4,537 | | | | 4,462,457 | |
| | | | | | | | | | | | |
| | | | | | | | | | | 43,332,297 | |
| | | | | | | | | | | | |
Capital Goods – 7.4% | |
Ardagh Metal Packaging Finance USA LLC/Ardagh Metal Packaging Finance PLC
3.25%, 09/01/2028(a) | | | | | | | 1,871 | | | | 1,684,966 | |
6.00%, 06/15/2027(a) | | | | | | | 100 | | | | 99,479 | |
Ardagh Packaging Finance PLC/Ardagh Holdings USA, Inc.
2.125%, 08/15/2026(a) | | | EUR | | | | 200 | | | | 185,277 | |
4.125%, 08/15/2026(a) | | | U.S.$ | | | | 2,220 | | | | 1,918,213 | |
Ball Corp.
2.875%, 08/15/2030 | | | | | | | 2,037 | | | | 1,788,649 | |
6.00%, 06/15/2029 | | | | | | | 1,032 | | | | 1,053,528 | |
Bombardier, Inc.
6.00%, 02/15/2028(a) | | | | | | | 1,397 | | | | 1,397,028 | |
7.25%, 07/01/2031(a) | | | | | | | 884 | | | | 914,197 | |
7.50%, 02/01/2029(a) | | | | | | | 1,046 | | | | 1,090,099 | |
7.875%, 04/15/2027(a) | | | | | | | 390 | | | | 390,897 | |
8.75%, 11/15/2030(a) | | | | | | | 406 | | | | 439,020 | |
Clean Harbors, Inc.
4.875%, 07/15/2027(a) | | | | | | | 3,621 | | | | 3,559,515 | |
6.375%, 02/01/2031(a) | | | | | | | 864 | | | | 879,517 | |
Crown Americas LLC
5.25%, 04/01/2030 | | | | | | | 564 | | | | 557,080 | |
Eco Material Technologies, Inc.
7.875%, 01/31/2027(a) | | | | | | | 2,606 | | | | 2,640,816 | |
EnerSys
4.375%, 12/15/2027(a) | | | | | | | 1,214 | | | | 1,159,661 | |
Enviri Corp.
5.75%, 07/31/2027(a) | | | | | | | 2,140 | | | | 2,055,063 | |
Esab Corp.
6.25%, 04/15/2029(a) | | | | | | | 869 | | | | 885,737 | |
| | |
| |
2 | AB SHORT DURATION HIGH YIELD ETF | | abfunds.com |
PORTFOLIO OF INVESTMENTS (continued)
| | | | | | | | | | | | |
| | | | | | Principal
Amount
(000) | | | U.S. $ Value | |
| |
GFL Environmental, Inc.
3.50%, 09/01/2028(a) | | | U.S.$ | | | | 19 | | | $ | 17,933 | |
3.75%, 08/01/2025(a) | | | | | | | 2,161 | | | | 2,140,384 | |
5.125%, 12/15/2026(a) | | | | | | | 100 | | | | 99,703 | |
6.75%, 01/15/2031(a) | | | | | | | 967 | | | | 1,002,943 | |
Griffon Corp.
5.75%, 03/01/2028 | | | | | | | 3,106 | | | | 3,067,455 | |
IMA Industria Macchine Automatiche SpA
3.75%, 01/15/2028(a) | | | EUR | | | | 650 | | | | 665,557 | |
LSB Industries, Inc.
6.25%, 10/15/2028(a)(d) | | | U.S.$ | | | | 3,749 | | | | 3,642,941 | |
Madison IAQ LLC
5.875%, 06/30/2029(a) | | | | | | | 1,337 | | | | 1,276,888 | |
MIWD Holdco II LLC/MIWD Finance Corp.
5.50%, 02/01/2030(a) | | | | | | | 2,175 | | | | 2,086,391 | |
Moog, Inc.
4.25%, 12/15/2027(a) | | | | | | | 4,160 | | | | 4,001,005 | |
Mueller Water Products, Inc.
4.00%, 06/15/2029(a) | | | | | | | 250 | | | | 233,188 | |
Paprec Holding SA
6.50%, 11/17/2027(a) | | | EUR | | | | 400 | | | | 446,295 | |
7.25%, 11/17/2029(a) | | | | | | | 260 | | | | 290,831 | |
Silgan Holdings, Inc.
2.25%, 06/01/2028 | | | | | | | 412 | | | | 411,487 | |
Spirit AeroSystems, Inc.
9.375%, 11/30/2029(a) | | | U.S.$ | | | | 2,105 | | | | 2,265,990 | |
TK Elevator Midco GmbH
4.375%, 07/15/2027(a) | | | EUR | | | | 180 | | | | 189,148 | |
TK Elevator US Newco, Inc.
5.25%, 07/15/2027(a) | | | U.S.$ | | | | 1,577 | | | | 1,552,809 | |
TransDigm, Inc.
4.625%, 01/15/2029 | | | | | | | 500 | | | | 474,500 | |
5.50%, 11/15/2027 | | | | | | | 1,844 | | | | 1,828,142 | |
6.375%, 03/01/2029(a) | | | | | | | 2,556 | | | | 2,595,797 | |
6.75%, 08/15/2028(a) | | | | | | | 2,333 | | | | 2,380,710 | |
6.875%, 12/15/2030(a) | | | | | | | 235 | | | | 242,031 | |
Trinity Industries, Inc.
7.75%, 07/15/2028(a) | | | | | | | 200 | | | | 208,592 | |
Triumph Group, Inc.
9.00%, 03/15/2028(a) | | | | | | | 1,756 | | | | 1,842,746 | |
Trivium Packaging Finance BV
3.75%, 08/15/2026(a) | | | EUR | | | | 440 | | | | 459,979 | |
| | | | | | | | | | | | |
| | | | | | | | | | | 56,122,187 | |
| | | | | | | | | | | | |
Communications - Media – 5.1% | | | | | | | | | | | | |
AMC Networks, Inc.
10.25%, 01/15/2029(a) | | | U.S.$ | | | | 1,705 | | | | 1,814,751 | |
| | |
| |
| abfunds.com | | AB SHORT DURATION HIGH YIELD ETF | 3 |
PORTFOLIO OF INVESTMENTS (continued)
| | | | | | | | | | |
| | | | | Principal
Amount
(000) | | | U.S. $ Value | |
| |
Banijay Entertainment SAS
7.00%, 05/01/2029(a) | | EUR | | | 442 | | | $ | 489,622 | |
8.125%, 05/01/2029(a) | | U.S.$ | | | 734 | | | | 765,386 | |
CCO Holdings LLC/CCO Holdings Capital Corp.
4.50%, 05/01/2032 | | | | | 1,059 | | | | 935,118 | |
4.75%, 02/01/2032(a) | | | | | 1,038 | | | | 934,003 | |
5.00%, 02/01/2028(a) | | | | | 1,300 | | | | 1,267,994 | |
6.375%, 09/01/2029(a) | | | | | 519 | | | | 521,195 | |
CSC Holdings LLC
5.375%, 02/01/2028(a) | | | | | 2,712 | | | | 2,349,785 | |
5.50%, 04/15/2027(a) | | | | | 491 | | | | 443,491 | |
6.50%, 02/01/2029(a) | | | | | 233 | | | | 199,940 | |
DISH DBS Corp.
5.25%, 12/01/2026(a) | | | | | 2,160 | | | | 1,989,425 | |
5.75%, 12/01/2028(a) | | | | | 754 | | | | 658,890 | |
Gray Television, Inc.
7.00%, 05/15/2027(a) | | | | | 806 | | | | 789,638 | |
LCPR Senior Secured Financing DAC
5.125%, 07/15/2029(a) | | | | | 1,424 | | | | 1,167,965 | |
6.75%, 10/15/2027(a) | | | | | 2,212 | | | | 2,013,915 | |
McGraw-Hill Education, Inc.
5.75%, 08/01/2028(a) | | | | | 1,225 | | | | 1,200,782 | |
Nexstar Media, Inc.
4.75%, 11/01/2028(a) | | | | | 1,060 | | | | 1,000,545 | |
Radiate Holdco LLC/Radiate Finance, Inc.
4.50%, 09/15/2026(a) | | | | | 787 | | | | 678,929 | |
Sinclair Television Group, Inc.
5.50%, 03/01/2030(a) | | | | | 67 | | | | 45,284 | |
Sunrise FinCo I BV
4.875%, 07/15/2031(a) | | | | | 202 | | | | 185,285 | |
TEGNA, Inc.
4.625%, 03/15/2028 | | | | | 401 | | | | 383,597 | |
4.75%, 03/15/2026(a) | | | | | 1,000 | | | | 991,200 | |
Telenet Finance Luxembourg Notes SARL
5.50%, 03/01/2028(a) | | | | | 800 | | | | 777,328 | |
Townsquare Media, Inc.
6.875%, 02/01/2026(a) | | | | | 221 | | | | 220,699 | |
Univision Communications, Inc.
4.50%, 05/01/2029(a) | | | | | 2,457 | | | | 2,206,484 | |
6.625%, 06/01/2027(a) | | | | | 1,934 | | | | 1,926,922 | |
7.375%, 06/30/2030(a) | | | | | 2,600 | | | | 2,506,972 | |
8.50%, 07/31/2031(a) | | | | | 840 | | | | 834,397 | |
Virgin Media Finance PLC
3.75%, 07/15/2030(a) | | EUR | | | 210 | | | | 199,930 | |
5.00%, 07/15/2030(a) | | U.S.$ | | | 1,153 | | | | 984,731 | |
Virgin Media Secured Finance PLC
4.50%, 08/15/2030(a) | | | | | 201 | | | | 176,737 | |
| | |
| |
4 | AB SHORT DURATION HIGH YIELD ETF | | abfunds.com |
PORTFOLIO OF INVESTMENTS (continued)
| | | | | | | | | | | | |
| | | | | | Principal
Amount
(000) | | | U.S. $ Value | |
| |
Virgin Media Vendor Financing Notes IV DAC
5.00%, 07/15/2028(a) | | | U.S.$ | | | | 2,417 | | | $ | 2,309,782 | |
Ziggo Bond Co. BV
5.125%, 02/28/2030(a) | | | | | | | 2,878 | | | | 2,602,547 | |
Ziggo BV
4.875%, 01/15/2030(a) | | | | | | | 3,288 | | | | 3,043,570 | |
| | | | | | | | | | | | |
| | | | | | | | | | | 38,616,839 | |
| | | | | | | | | | | | |
Communications - Telecommunications – 2.1% | | | | | | | | | | | | |
Altice Financing SA
2.25%, 01/15/2025(a) | | | EUR | | | | 106 | | | | 110,548 | |
5.00%, 01/15/2028(a) | | | U.S.$ | | | | 1,198 | | | | 955,956 | |
Altice France SA
5.125%, 07/15/2029(a) | | | | | | | 967 | | | | 736,873 | |
5.50%, 01/15/2028(a) | | | | | | | 489 | | | | 373,166 | |
5.50%, 10/15/2029(a) | | | | | | | 1,902 | | | | 1,462,182 | |
8.125%, 02/01/2027(a) | | | | | | | 588 | | | | 493,891 | |
EchoStar Corp.
10.75%, 11/30/2029 | | | | | | | 3,232 | | | | 3,496,668 | |
Level 3 Financing, Inc.
10.75%, 12/15/2030(a) | | | | | | | 668 | | | | 753,920 | |
11.00%, 11/15/2029(a) | | | | | | | 564 | | | | 639,670 | |
Lorca Telecom Bondco SA
4.00%, 09/18/2027(a) | | | EUR | | | | 1,164 | | | | 1,226,688 | |
Nexstar Media, Inc.
5.625%, 07/15/2027(a) | | | U.S.$ | | | | 1,308 | | | | 1,289,374 | |
United Group BV
7.273% (EURIBOR 3 Month + 4.25%), 02/01/2029(a)(c) | | | EUR | | | | 210 | | | | 221,432 | |
Vmed O2 UK Financing I PLC
4.25%, 01/31/2031(a) | | | U.S.$ | | | | 200 | | | | 172,818 | |
4.75%, 07/15/2031(a) | | | | | | | 1,858 | | | | 1,637,641 | |
7.75%, 04/15/2032(a) | | | | | | | 1,953 | | | | 1,983,154 | |
| | | | | | | | | | | | |
| | | | | | | | | | | 15,553,981 | |
| | | | | | | | | | | | |
Consumer Cyclical - Automotive – 3.2% | | | | | | | | | | | | |
Allison Transmission, Inc.
4.75%, 10/01/2027(a) | | | | | | | 197 | | | | 192,780 | |
5.875%, 06/01/2029(a) | | | | | | | 1,587 | | | | 1,596,823 | |
American Axle & Manufacturing, Inc.
6.875%, 07/01/2028 | | | | | | | 525 | | | | 524,464 | |
Aston Martin Capital Holdings Ltd.
10.00%, 03/31/2029(a) | | | | | | | 2,141 | | | | 2,101,648 | |
Clarios Global LP/Clarios US Finance Co.
4.375%, 05/15/2026(a) | | | EUR | | | | 430 | | | | 453,453 | |
Dana, Inc.
4.25%, 09/01/2030 | | | U.S.$ | | | | 578 | | | | 516,345 | |
5.625%, 06/15/2028 | | | | | | | 165 | | | | 163,860 | |
| | |
| |
| abfunds.com | | AB SHORT DURATION HIGH YIELD ETF | 5 |
PORTFOLIO OF INVESTMENTS (continued)
| | | | | | | | | | | | |
| | | | | | Principal
Amount
(000) | | | U.S. $ Value | |
| |
Garrett Motion Holdings, Inc./Garrett LX I SARL
7.75%, 05/31/2032(a) | | | U.S.$ | | | | 870 | | | $ | 876,856 | |
Goodyear Tire & Rubber Co. (The)
5.00%, 07/15/2029 | | | | | | | 2,936 | | | | 2,745,982 | |
5.25%, 07/15/2031 | | | | | | | 741 | | | | 681,409 | |
IHO Verwaltungs GmbH
6.375% (6.375% Cash or 7.125% PIK), 05/15/2029(a)(b) | | | | | | | 662 | | | | 638,115 | |
6.75% (6.75% Cash or 7.5% PIK), 11/15/2029(a)(b) | | | EUR | | | | 520 | | | | 560,478 | |
7.00% (7.00% Cash or 7.75% PIK), 11/15/2031(a)(b) | | | | | | | 539 | | | | 581,555 | |
7.75% (7.75% Cash or 8.5% PIK), 11/15/2030(a)(b) | | | U.S.$ | | | | 1,427 | | | | 1,430,268 | |
PM General Purchaser LLC
9.50%, 10/01/2028(a) | | | | | | | 5,026 | | | | 5,021,929 | |
Tenneco, Inc.
8.00%, 11/17/2028(a) | | | | | | | 1,422 | | | | 1,349,919 | |
ZF Europe Finance BV
2.00%, 02/23/2026(a)(d) | | | EUR | | | | 300 | | | | 309,186 | |
ZF Finance GmbH
Series E
3.00%, 09/21/2025(a) | | | | | | | 200 | | | | 209,550 | |
ZF North America Capital, Inc.
4.75%, 04/29/2025(a) | | | U.S.$ | | | | 1,568 | | | | 1,556,459 | |
6.75%, 04/23/2030(a) | | | | | | | 1,240 | | | | 1,211,716 | |
6.875%, 04/14/2028(a) | | | | | | | 234 | | | | 235,638 | |
6.875%, 04/23/2032(a) | | | | | | | 550 | | | | 528,847 | |
7.125%, 04/14/2030(a) | | | | | | | 447 | | | | 444,653 | |
| | | | | | | | | | | | |
| | | | | | | | | | | 23,931,933 | |
| | | | | | | | | | | | |
Consumer Cyclical - Entertainment – 3.5% | | | | | | | | | | | | |
Boyne USA, Inc.
4.75%, 05/15/2029(a) | | | | | | | 1,505 | | | | 1,438,268 | |
Carnival Corp.
5.75%, 03/01/2027(a) | | | | | | | 992 | | | | 995,165 | |
5.75%, 01/15/2030(a) | | | EUR | | | | 189 | | | | 213,412 | |
Cedar Fair LP/Canada’s Wonderland Co./Magnum Management Corp./Millennium Op
5.375%, 04/15/2027 | | | U.S.$ | | | | 821 | | | | 816,123 | |
CPUK Finance Ltd.
4.50%, 08/28/2027(a) | | | GBP | | | | 400 | | | | 482,013 | |
Lindblad Expeditions LLC
6.75%, 02/15/2027(a) | | | U.S.$ | | | | 396 | | | | 397,125 | |
| | |
| |
6 | AB SHORT DURATION HIGH YIELD ETF | | abfunds.com |
PORTFOLIO OF INVESTMENTS (continued)
| | | | | | | | | | | | |
| | | | | | Principal
Amount
(000) | | | U.S. $ Value | |
| |
Live Nation Entertainment, Inc.
3.75%, 01/15/2028(a) | | | U.S.$ | | | | 300 | | | $ | 285,507 | |
6.50%, 05/15/2027(a) | | | | | | | 1,021 | | | | 1,037,040 | |
Merlin Entertainments Group US Holdings, Inc.
7.375%, 02/15/2031(a) | | | | | | | 3,725 | | | | 3,642,044 | |
Motion Bondco DAC
4.50%, 11/15/2027(a) | | | EUR | | | | 239 | | | | 236,887 | |
Motion Finco SARL
7.375%, 06/15/2030(a) | | | | | | | 329 | | | | 356,633 | |
NCL Corp., Ltd.
3.625%, 12/15/2024(a) | | | U.S.$ | | | | 394 | | | | 393,389 | |
5.875%, 03/15/2026(a) | | | | | | | 1,788 | | | | 1,788,626 | |
8.375%, 02/01/2028(a) | | | | | | | 270 | | | | 282,174 | |
Royal Caribbean Cruises Ltd.
3.70%, 03/15/2028 | | | | | | | 1,122 | | | | 1,071,577 | |
4.25%, 07/01/2026(a) | | | | | | | 300 | | | | 295,545 | |
5.375%, 07/15/2027(a) | | | | | | | 647 | | | | 646,178 | |
5.50%, 08/31/2026(a) | | | | | | | 244 | | | | 244,361 | |
5.50%, 04/01/2028(a) | | | | | | | 3,687 | | | | 3,687,184 | |
SeaWorld Parks & Entertainment, Inc.
5.25%, 08/15/2029(a) | | | | | | | 2,827 | | | | 2,728,903 | |
Viking Cruises Ltd.
5.875%, 09/15/2027(a) | | | | | | | 832 | | | | 827,915 | |
Viking Ocean Cruises Ship VII Ltd.
5.625%, 02/15/2029(a) | | | | | | | 227 | | | | 224,390 | |
VOC Escrow Ltd.
5.00%, 02/15/2028(a) | | | | | | | 4,423 | | | | 4,320,563 | |
| | | | | | | | | | | | |
| | | | | | | | | | | 26,411,022 | |
| | | | | | | | | | | | |
Consumer Cyclical - Other – 5.7% | | | | | | | | | | | | |
Brookfield Residential Properties, Inc./Brookfield Residential US LLC
4.875%, 02/15/2030(a) | | | | | | | 362 | | | | 340,012 | |
Builders FirstSource, Inc.
4.25%, 02/01/2032(a) | | | | | | | 1,000 | | | | 911,970 | |
5.00%, 03/01/2030(a) | | | | | | | 1,634 | | | | 1,578,444 | |
6.375%, 06/15/2032(a) | | | | | | | 400 | | | | 408,848 | |
CD&R Smokey Buyer, Inc./Radio Systems Corp.
9.50%, 10/15/2029(a) | | | | | | | 1,316 | | | | 1,331,016 | |
Churchill Downs, Inc.
4.75%, 01/15/2028(a) | | | | | | | 3,024 | | | | 2,952,543 | |
5.50%, 04/01/2027(a) | | | | | | | 282 | | | | 281,075 | |
Cirsa Finance International SARL
6.50%, 03/15/2029(a) | | | EUR | | | | 668 | | | | 743,246 | |
Forestar Group, Inc.
3.85%, 05/15/2026(a) | | | U.S.$ | | | | 2,278 | | | | 2,231,962 | |
| | |
| |
| abfunds.com | | AB SHORT DURATION HIGH YIELD ETF | 7 |
PORTFOLIO OF INVESTMENTS (continued)
| | | | | | | | | | | | |
| | | | | | Principal
Amount
(000) | | | U.S. $ Value | |
| |
Great Canadian Gaming Corp.
8.75%, 11/15/2029(a) | | | U.S.$ | | | | 662 | | | $ | 688,017 | |
Hilton Domestic Operating Co., Inc.
3.625%, 02/15/2032(a) | | | | | | | 985 | | | | 870,139 | |
3.75%, 05/01/2029(a) | | | | | | | 2,077 | | | | 1,939,336 | |
4.875%, 01/15/2030 | | | | | | | 641 | | | | 624,571 | |
5.375%, 05/01/2025(a) | | | | | | | 105 | | | | 104,909 | |
5.875%, 04/01/2029(a) | | | | | | | 2,483 | | | | 2,506,266 | |
Hilton Grand Vacations Borrower Escrow LLC/Hilton Grand Vacations Borrower Esc
4.875%, 07/01/2031(a) | | | | | | | 1,024 | | | | 925,112 | |
5.00%, 06/01/2029(a) | | | | | | | 2,690 | | | | 2,558,244 | |
Marriott Ownership Resorts, Inc.
4.50%, 06/15/2029(a) | | | | | | | 4,681 | | | | 4,412,638 | |
MGM Resorts International
4.75%, 10/15/2028 | | | | | | | 3,541 | | | | 3,444,614 | |
5.50%, 04/15/2027 | | | | | | | 115 | | | | 114,978 | |
Miller Homes Group Finco PLC
7.00%, 05/15/2029(a) | | | GBP | | | | 276 | | | | 339,033 | |
8.273% (EURIBOR 3 Month + 5.25%), 05/15/2028(a)(c) | | | EUR | | | | 194 | | | | 206,993 | |
Playtech PLC
4.25%, 03/07/2026(a) | | | | | | | 130 | | | | 137,141 | |
5.875%, 06/28/2028(a) | | | | | | | 620 | | | | 679,290 | |
Shea Homes LP/Shea Homes Funding Corp.
4.75%, 02/15/2028 | | | U.S.$ | | | | 1,260 | | | | 1,223,800 | |
Standard Industries, Inc./NY
4.75%, 01/15/2028(a) | | | | | | | 1,512 | | | | 1,467,290 | |
Taylor Morrison Communities, Inc.
5.75%, 01/15/2028(a) | | | | | | | 22 | | | | 22,133 | |
5.875%, 06/15/2027(a) | | | | | | | 3,747 | | | | 3,788,180 | |
Thor Industries, Inc.
4.00%, 10/15/2029(a) | | | | | | | 821 | | | | 753,448 | |
Travel + Leisure Co.
4.50%, 12/01/2029(a) | | | | | | | 2,667 | | | | 2,516,875 | |
6.625%, 07/31/2026(a) | | | | | | | 2,088 | | | | 2,113,014 | |
Wyndham Hotels & Resorts, Inc.
4.375%, 08/15/2028(a) | | | | | | | 984 | | | | 941,609 | |
| | | | | | | | | | | | |
| | | | | | | | | | | 43,156,746 | |
| | | | | | | | | | | | |
Consumer Cyclical - Restaurants – 0.8% | | | | | | | | | | | | |
1011778 BC ULC/New Red Finance, Inc.
3.50%, 02/15/2029(a) | | | | | | | 1,208 | | | | 1,117,400 | |
3.875%, 01/15/2028(a) | | | | | | | 1,161 | | | | 1,107,118 | |
4.00%, 10/15/2030(a) | | | | | | | 1,583 | | | | 1,436,667 | |
4.375%, 01/15/2028(a) | | | | | | | 1,427 | | | | 1,373,188 | |
Papa John’s International, Inc.
3.875%, 09/15/2029(a) | | | | | | | 279 | | | | 253,346 | |
| | |
| |
8 | AB SHORT DURATION HIGH YIELD ETF | | abfunds.com |
PORTFOLIO OF INVESTMENTS (continued)
| | | | | | | | | | | | |
| | | | | | Principal
Amount
(000) | | | U.S. $ Value | |
| |
Yum! Brands, Inc.
4.75%, 01/15/2030(a) | | | U.S.$ | | | | 1,054 | | | $ | 1,020,146 | |
| | | | | | | | | | | | |
| | | | | | | | | | | 6,307,865 | |
| | | | | | | | | | | | |
Consumer Cyclical - Retailers – 4.0% | | | | | | | | | | | | |
Arko Corp.
5.125%, 11/15/2029(a) | | | | | | | 814 | | | | 750,215 | |
Bath & Body Works, Inc.
5.25%, 02/01/2028 | | | | | | | 650 | | | | 646,562 | |
Beacon Roofing Supply, Inc.
4.125%, 05/15/2029(a) | | | | | | | 65 | | | | 62,492 | |
Carvana Co.
12.00% (9.00% Cash or 12.00% PIK), 12/01/2028(a)(b)(d) | | | | | | | 1,263 | | | | 1,345,183 | |
13.00% (11.00% Cash or 13.00% PIK), 06/01/2030(a)(b)(d) | | | | | | | 2,076 | | | | 2,278,701 | |
FirstCash, Inc.
4.625%, 09/01/2028(a) | | | | | | | 1,823 | | | | 1,748,512 | |
Global Auto Holdings Ltd./AAG FH UK Ltd.
8.375%, 01/15/2029(a) | | | | | | | 3,946 | | | | 3,645,354 | |
Group 1 Automotive, Inc.
4.00%, 08/15/2028(a) | | | | | | | 3,008 | | | | 2,843,402 | |
Hanesbrands, Inc.
4.875%, 05/15/2026(a) | | | | | | | 3,263 | | | | 3,223,257 | |
LCM Investments Holdings II LLC
4.875%, 05/01/2029(a) | | | | | | | 1,995 | | | | 1,884,158 | |
Levi Strauss & Co.
3.50%, 03/01/2031(a) | | | | | | | 1,186 | | | | 1,050,156 | |
Murphy Oil USA, Inc.
4.75%, 09/15/2029 | | | | | | | 2,541 | | | | 2,452,090 | |
PetSmart, Inc./PetSmart Finance Corp.
4.75%, 02/15/2028(a) | | | | | | | 2,056 | | | | 1,963,521 | |
7.75%, 02/15/2029(a) | | | | | | | 1,226 | | | | 1,207,095 | |
Sonic Automotive, Inc.
4.625%, 11/15/2029(a) | | | | | | | 1,889 | | | | 1,774,338 | |
Under Armour, Inc.
3.25%, 06/15/2026 | | | | | | | 783 | | | | 758,046 | |
VF Corp.
2.95%, 04/23/2030 | | | | | | | 1,221 | | | | 1,054,736 | |
Walgreens Boots Alliance, Inc.
8.125%, 08/15/2029 | | | | | | | 1,261 | | | | 1,270,495 | |
| | | | | | | | | | | | |
| | | | | | | | | | | 29,958,313 | |
| | | | | | | | | | | | |
Consumer Non-Cyclical – 7.5% | | | | | | | | | | | | |
Albertsons Cos., Inc./Safeway, Inc./New Albertsons LP/Albertsons LLC
3.25%, 03/15/2026(a) | | | | | | | 200 | | | | 193,580 | |
4.625%, 01/15/2027(a) | | | | | | | 1,544 | | | | 1,513,182 | |
| | |
| |
| abfunds.com | | AB SHORT DURATION HIGH YIELD ETF | 9 |
PORTFOLIO OF INVESTMENTS (continued)
| | | | | | | | | | |
| | | | | Principal
Amount
(000) | | | U.S. $ Value | |
| |
6.50%, 02/15/2028(a) | | U.S.$ | | | 115 | | | $ | 116,950 | |
7.50%, 03/15/2026(a) | | | | | 185 | | | | 186,565 | |
Bausch + Lomb Corp.
8.375%, 10/01/2028(a) | | | | | 1,984 | | | | 2,078,577 | |
Bausch Health Cos., Inc.
11.00%, 09/30/2028(a) | | | | | 1,723 | | | | 1,692,761 | |
CAB SELAS
3.375%, 02/01/2028(a) | | EUR | | | 859 | | | | 835,284 | |
Cheplapharm Arzneimittel GmbH
5.50%, 01/15/2028(a) | | U.S.$ | | | 1,667 | | | | 1,602,470 | |
7.50%, 05/15/2030(a) | | EUR | | | 1,040 | | | | 1,138,948 | |
CHS/Community Health Systems, Inc.
5.625%, 03/15/2027(a) | | U.S.$ | | | 2,084 | | | | 2,014,207 | |
DaVita, Inc.
4.625%, 06/01/2030(a) | | | | | 3,315 | | | | 3,105,824 | |
Embecta Corp.
5.00%, 02/15/2030(a) | | | | | 2,992 | | | | 2,780,136 | |
6.75%, 02/15/2030(a) | | | | | 366 | | | | 339,849 | |
Emergent BioSolutions, Inc.
3.875%, 08/15/2028(a) | | | | | 1,030 | | | | 828,542 | |
Fortrea Holdings, Inc.
7.50%, 07/01/2030(a) | | | | | 2,909 | | | | 2,947,050 | |
Grifols SA
3.875%, 10/15/2028(a) | | EUR | | | 481 | | | | 443,014 | |
4.75%, 10/15/2028(a) | | U.S.$ | | | 2,915 | | | | 2,656,848 | |
Gruenenthal GmbH
4.125%, 05/15/2028(a) | | EUR | | | 907 | | | | 954,219 | |
Hologic, Inc.
3.25%, 02/15/2029(a) | | U.S.$ | | | 115 | | | | 105,714 | |
Iceland Bondco PLC
8.523% (EURIBOR 3 Month + 5.50%), 12/15/2027(a)(c) | | EUR | | | 199 | | | | 211,796 | |
10.875%, 12/15/2027(a) | | GBP | | | 118 | | | | 158,628 | |
IQVIA, Inc.
1.75%, 03/15/2026(a) | | EUR | | | 798 | | | | 827,255 | |
Lamb Weston Holdings, Inc.
4.875%, 05/15/2028(a) | | U.S.$ | | | 1,756 | | | | 1,721,600 | |
LifePoint Health, Inc.
11.00%, 10/15/2030(a) | | | | | 338 | | | | 373,230 | |
Medline Borrower LP
3.875%, 04/01/2029(a) | | | | | 2,279 | | | | 2,137,269 | |
ModivCare, Inc.
5.00%, 10/01/2029(a) | | | | | 1,596 | | | | 1,092,079 | |
MPH Acquisition Holdings LLC
5.50%, 09/01/2028(a) | | | | | 4,793 | | | | 3,326,007 | |
Newell Brands, Inc.
5.70%, 04/01/2026(d) | | | | | 763 | | | | 766,640 | |
| | |
| |
10 | AB SHORT DURATION HIGH YIELD ETF | | abfunds.com |
PORTFOLIO OF INVESTMENTS (continued)
| | | | | | | | | | | | |
| | | | | | Principal
Amount
(000) | | | U.S. $ Value | |
| |
6.375%, 09/15/2027 | | | U.S.$ | | | | 42 | | | $ | 42,754 | |
6.375%, 05/15/2030 | | | | | | | 997 | | | | 1,014,039 | |
Organon & Co./Organon Foreign Debt Co-Issuer BV
4.125%, 04/30/2028(a) | | | | | | | 4,080 | | | | 3,876,163 | |
Owens & Minor, Inc.
4.50%, 03/31/2029(a) | | | | | | | 6 | | | | 5,442 | |
6.625%, 04/01/2030(a) | | | | | | | 844 | | | | 816,941 | |
Performance Food Group, Inc.
5.50%, 10/15/2027(a) | | | | | | | 1,606 | | | | 1,598,339 | |
Post Holdings, Inc.
4.625%, 04/15/2030(a) | | | | | | | 2,361 | | | | 2,213,343 | |
5.50%, 12/15/2029(a) | | | | | | | 890 | | | | 870,331 | |
5.625%, 01/15/2028(a) | | | | | | | 100 | | | | 100,938 | |
6.25%, 02/15/2032(a) | | | | | | | 1,065 | | | | 1,079,005 | |
Premier Foods Finance PLC
3.50%, 10/15/2026(a) | | | GBP | | | | 200 | | | | 247,496 | |
Primo Water Holdings, Inc.
4.375%, 04/30/2029(a) | | | U.S.$ | | | | 3,833 | | | | 3,607,505 | |
Tenet Healthcare Corp.
4.625%, 06/15/2028 | | | | | | | 2,402 | | | | 2,332,222 | |
6.125%, 06/15/2030 | | | | | | | 750 | | | | 752,678 | |
US Foods, Inc.
4.75%, 02/15/2029(a) | | | | | | | 1,865 | | | | 1,801,310 | |
| | | | | | | | | | | | |
| | | | | | | | | | | 56,506,730 | |
| | | | | | | | | | | | |
Energy – 8.4% | | | | | | | | | | | | |
Antero Midstream Partners LP/Antero Midstream Finance Corp.
5.375%, 06/15/2029(a) | | | | | | | 150 | | | | 147,039 | |
5.75%, 01/15/2028(a) | | | | | | | 107 | | | | 106,677 | |
Buckeye Partners LP
3.95%, 12/01/2026 | | | | | | | 1,074 | | | | 1,047,870 | |
4.125%, 03/01/2025(a) | | | | | | | 852 | | | | 847,723 | |
4.50%, 03/01/2028(a) | | | | | | | 3,243 | | | | 3,127,322 | |
6.875%, 07/01/2029(a) | | | | | | | 732 | | | | 747,628 | |
California Resources Corp.
8.25%, 06/15/2029(a) | | | | | | | 396 | | | | 406,534 | |
CITGO Petroleum Corp.
6.375%, 06/15/2026(a) | | | | | | | 356 | | | | 357,545 | |
7.00%, 06/15/2025(a) | | | | | | | 1,631 | | | | 1,633,153 | |
8.375%, 01/15/2029(a) | | | | | | | 1,075 | | | | 1,118,258 | |
Civitas Resources, Inc.
5.00%, 10/15/2026(a) | | | | | | | 908 | | | | 894,680 | |
8.375%, 07/01/2028(a) | | | | | | | 2,510 | | | | 2,619,361 | |
CNX Resources Corp.
6.00%, 01/15/2029(a) | | | | | | | 4,245 | | | | 4,247,080 | |
| | |
| |
| abfunds.com | | AB SHORT DURATION HIGH YIELD ETF | 11 |
PORTFOLIO OF INVESTMENTS (continued)
| | | | | | | | | | |
| | | | | Principal
Amount
(000) | | | U.S. $ Value | |
| |
Genesis Energy LP/Genesis Energy Finance Corp.
8.25%, 01/15/2029 | | U.S.$ | | | 885 | | | $ | 905,558 | |
8.875%, 04/15/2030 | | | | | 533 | | | | 554,906 | |
Harvest Midstream I LP
7.50%, 09/01/2028(a) | | | | | 1,387 | | | | 1,418,221 | |
Hess Midstream Operations LP
4.25%, 02/15/2030(a) | | | | | 271 | | | | 254,859 | |
5.125%, 06/15/2028(a) | | | | | 2,221 | | | | 2,183,310 | |
Hilcorp Energy I LP/Hilcorp Finance Co.
5.75%, 02/01/2029(a) | | | | | 11 | | | | 10,683 | |
6.00%, 04/15/2030(a) | | | | | 2,266 | | | | 2,186,849 | |
6.25%, 11/01/2028(a) | | | | | 1,400 | | | | 1,389,486 | |
6.25%, 04/15/2032(a) | | | | | 1,357 | | | | 1,290,426 | |
Howard Midstream Energy Partners LLC
8.875%, 07/15/2028(a) | | | | | 3,631 | | | | 3,854,306 | |
ITT Holdings LLC
6.50%, 08/01/2029(a) | | | | | 1,094 | | | | 1,025,625 | |
Kodiak Gas Services LLC
7.25%, 02/15/2029(a) | | | | | 319 | | | | 329,766 | |
Kraken Oil & Gas Partners LLC
7.625%, 08/15/2029(a) | | | | | 378 | | | | 374,968 | |
Murphy Oil Corp.
6.375%, 07/15/2028 | | | | | 517 | | | | 524,621 | |
Nabors Industries, Inc.
7.375%, 05/15/2027(a) | | | | | 2,930 | | | | 2,935,684 | |
New Fortress Energy, Inc.
6.50%, 09/30/2026(a) | | | | | 2,690 | | | | 2,515,150 | |
8.75%, 03/15/2029(a) | | | | | 2,454 | | | | 2,004,771 | |
NFE Financing LLC
12.00%, 11/15/2029(a) | | | | | 1,113 | | | | 1,113,852 | |
NGL Energy Operating LLC/NGL Energy Finance Corp.
8.125%, 02/15/2029(a) | | | | | 2,878 | | | | 2,939,244 | |
NuStar Logistics LP
5.625%, 04/28/2027 | | | | | 1,061 | | | | 1,063,525 | |
5.75%, 10/01/2025 | | | | | 2,168 | | | | 2,165,875 | |
PBF Holding Co., LLC/PBF Finance Corp.
6.00%, 02/15/2028 | | | | | 4,152 | | | | 4,107,200 | |
7.875%, 09/15/2030(a) | | | | | 100 | | | | 102,624 | |
Summit Midstream Holdings LLC
8.625%, 10/31/2029(a) | | | | | 50 | | | | 52,328 | |
Sunoco LP/Sunoco Finance Corp.
4.50%, 05/15/2029 | | | | | 392 | | | | 374,340 | |
7.00%, 09/15/2028(a) | | | | | 3,607 | | | | 3,718,023 | |
Talos Production, Inc.
9.00%, 02/01/2029(a) | | | | | 610 | | | | 638,060 | |
| | |
| |
12 | AB SHORT DURATION HIGH YIELD ETF | | abfunds.com |
PORTFOLIO OF INVESTMENTS (continued)
| | | | | | | | | | | | |
| | | | | | Principal
Amount
(000) | | | U.S. $ Value | |
| |
Transocean, Inc.
8.75%, 02/15/2030(a) | | | U.S.$ | | | | 1,488 | | | $ | 1,550,615 | |
Venture Global Calcasieu Pass LLC
6.25%, 01/15/2030(a) | | | | | | | 370 | | | | 378,910 | |
Venture Global LNG, Inc.
7.00%, 01/15/2030(a) | | | | | | | 1,851 | | | | 1,894,221 | |
8.375%, 06/01/2031(a) | | | | | | | 1,064 | | | | 1,122,382 | |
9.50%, 02/01/2029(a) | | | | | | | 691 | | | | 772,013 | |
9.875%, 02/01/2032(a) | | | | | | | 250 | | | | 277,872 | |
| | | | | | | | | | | | |
| | | | | | | | | | | 63,331,143 | |
| | | | | | | | | | | | |
Other Industrial – 0.8% | |
AECOM
5.125%, 03/15/2027 | | | | | | | 1,187 | | | | 1,181,302 | |
Belden, Inc.
3.375%, 07/15/2031(a) | | | EUR | | | | 693 | | | | 705,048 | |
Benteler International AG
10.50%, 05/15/2028(a) | | | U.S.$ | | | | 563 | | | | 588,724 | |
Gates Corp./DE
6.875%, 07/01/2029(a) | | | | | | | 340 | | | | 350,166 | |
Steelcase, Inc.
5.125%, 01/18/2029 | | | | | | | 200 | | | | 194,852 | |
Velocity Vehicle Group LLC
8.00%, 06/01/2029(a) | | | | | | | 2,902 | | | | 3,027,134 | |
Verde Purchaser LLC
10.50%, 11/30/2030(a) | | | | | | | 240 | | | | 256,994 | |
| | | | | | | | | | | | |
| | | | | | | | | | | 6,304,220 | |
| | | | | | | | | | | | |
Services – 4.4% | |
Allied Universal Holdco LLC
7.875%, 02/15/2031(a) | | | | | | | 3,343 | | | | 3,422,764 | |
Allied Universal Holdco LLC/Allied Universal Finance Corp./Atlas Luxco 4 SARL
3.625%, 06/01/2028(a) | | | EUR | | | | 160 | | | | 160,693 | |
4.625%, 06/01/2028(a) | | | U.S.$ | | | | 3,974 | | | | 3,738,651 | |
ANGI Group LLC
3.875%, 08/15/2028(a) | | | | | | | 959 | | | | 870,791 | |
Aramark Services, Inc.
5.00%, 04/01/2025(a) | | | | | | | 506 | | | | 505,226 | |
5.00%, 02/01/2028(a) | | | | | | | 2,958 | | | | 2,899,727 | |
Block, Inc.
2.75%, 06/01/2026 | | | | | | | 3,551 | | | | 3,428,526 | |
Cars.com, Inc.
6.375%, 11/01/2028(a) | | | | | | | 1,545 | | | | 1,542,173 | |
Garda World Security Corp.
4.625%, 02/15/2027(a) | | | | | | | 2,945 | | | | 2,865,426 | |
6.00%, 06/01/2029(a) | | | | | | | 1,441 | | | | 1,367,206 | |
7.75%, 02/15/2028(a) | | | | | | | 493 | | | | 511,276 | |
| | |
| |
| abfunds.com | | AB SHORT DURATION HIGH YIELD ETF | 13 |
PORTFOLIO OF INVESTMENTS (continued)
| | | | | | | | | | | | |
| | | | | | Principal
Amount
(000) | | | U.S. $ Value | |
| |
Matthews International Corp.
8.625%, 10/01/2027(a) | | | U.S.$ | | | | 725 | | | $ | 758,843 | |
Millennium Escrow Corp.
6.625%, 08/01/2026(a) | | | | | | | 748 | | | | 543,085 | |
Prime Security Services Borrower LLC/Prime Finance, Inc.
3.375%, 08/31/2027(a) | | | | | | | 300 | | | | 282,087 | |
5.75%, 04/15/2026(a) | | | | | | | 5,809 | | | | 5,810,510 | |
Service Corp. International/US
4.625%, 12/15/2027 | | | | | | | 1,301 | | | | 1,278,155 | |
Techem Verwaltungsgesellschaft 675 mbH
5.375%, 07/15/2029(a) | | | EUR | | | | 777 | | | | 842,210 | |
ZipRecruiter, Inc.
5.00%, 01/15/2030(a) | | | U.S.$ | | | | 2,513 | | | | 2,312,287 | |
| | | | | | | | | | | | |
| | | | | | | | | | | 33,139,636 | |
| | | | | | | | | | | | |
Technology – 1.7% | |
Almaviva-The Italian Innovation Co. SpA
5.00%, 10/30/2030(a) | | | EUR | | | | 1,870 | | | | 1,979,401 | |
Ellucian Holdings, Inc.
6.50%, 12/01/2029(a) | | | U.S.$ | | | | 766 | | | | 779,558 | |
Gen Digital, Inc.
6.75%, 09/30/2027(a) | | | | | | | 1,307 | | | | 1,332,395 | |
GoTo Group, Inc.
5.50%, 05/01/2028(a) | | | | | | | 608 | | | | 345,661 | |
Helios Software Holdings, Inc./ION Corporate Solutions Finance SARL
8.75%, 05/01/2029(a) | | | | | | | 115 | | | | 117,494 | |
Open Text Corp.
3.875%, 02/15/2028(a) | | | | | | | 582 | | | | 548,715 | |
Playtika Holding Corp.
4.25%, 03/15/2029(a) | | | | | | | 2,957 | | | | 2,718,518 | |
Rackspace Finance LLC
3.50%, 05/15/2028(a) | | | | | | | 1,075 | | | | 670,399 | |
Seagate HDD Cayman
4.875%, 06/01/2027 | | | | | | | 400 | | | | 396,492 | |
Virtusa Corp.
7.125%, 12/15/2028(a) | | | | | | | 269 | | | | 259,884 | |
Western Digital Corp.
4.75%, 02/15/2026 | | | | | | | 3,686 | | | | 3,653,600 | |
| | | | | | | | | | | | |
| | | | | | | | | | | 12,802,117 | |
| | | | | | | | | | | | |
Transportation - Airlines – 0.9% | |
Allegiant Travel Co.
7.25%, 08/15/2027(a) | | | | | | | 1,687 | | | | 1,679,493 | |
American Airlines, Inc./AAdvantage Loyalty IP Ltd.
5.50%, 04/20/2026(a) | | | | | | | 1,304 | | | | 1,302,798 | |
5.75%, 04/20/2029(a) | | | | | | | 1,563 | | | | 1,559,296 | |
| | |
| |
14 | AB SHORT DURATION HIGH YIELD ETF | | abfunds.com |
PORTFOLIO OF INVESTMENTS (continued)
| | | | | | | | | | | | |
| | | | | | Principal
Amount
(000) | | | U.S. $ Value | |
| |
Avianca Midco 2 PLC
9.00%, 12/01/2028(a) | | | U.S.$ | | | | 507 | | | $ | 501,318 | |
JetBlue Airways Corp./JetBlue Loyalty LP
9.875%, 09/20/2031(a) | | | | | | | 860 | | | | 904,548 | |
Spirit Loyalty Cayman Ltd./Spirit IP Cayman Ltd.
8.00%, 09/20/2025(a)(e)(f) | | | | | | | 716 | | | | 529,092 | |
| | | | | | | | | | | | |
| | | | | | | | | | | 6,476,545 | |
| | | | | | | | | | | | |
Transportation - Services – 2.7% | |
Albion Financing 1 SARL/Aggreko Holdings, Inc.
5.25%, 10/15/2026(a) | | | EUR | | | | 253 | | | | 268,728 | |
6.125%, 10/15/2026(a) | | | U.S.$ | | | | 2,850 | | | | 2,853,106 | |
Avis Budget Car Rental LLC/Avis Budget Finance, Inc.
4.75%, 04/01/2028(a) | | | | | | | 2,155 | | | | 2,041,000 | |
5.375%, 03/01/2029(a) | | | | | | | 1,437 | | | | 1,366,084 | |
5.75%, 07/15/2027(a) | | | | | | | 69 | | | | 68,238 | |
8.25%, 01/15/2030(a) | | | | | | | 999 | | | | 1,038,630 | |
BCP V Modular Services Finance II PLC
4.75%, 11/30/2028(a) | | | EUR | | | | 1,295 | | | | 1,333,845 | |
Boels Topholding BV
6.25%, 02/15/2029(a) | | | | | | | 492 | | | | 542,863 | |
Dcli Bidco LLC
7.75%, 11/15/2029(a) | | | U.S.$ | | | | 656 | | | | 679,406 | |
Hertz Corp. (The)
4.625%, 12/01/2026(a) | | | | | | | 2,291 | | | | 1,962,173 | |
5.00%, 12/01/2029(a) | | | | | | | 921 | | | | 637,240 | |
12.625%, 07/15/2029(a) | | | | | | | 1,854 | | | | 2,009,143 | |
Loxam SAS
4.50%, 02/15/2027(a) | | | EUR | | | | 104 | | | | 110,637 | |
6.375%, 05/31/2029(a) | | | | | | | 205 | | | | 227,616 | |
Mundys SpA
1.875%, 02/12/2028(a) | | | | | | | 573 | | | | 576,317 | |
NAC Aviation 29 DAC
4.75%, 06/30/2026 | | | U.S.$ | | | | 285 | | | | 274,276 | |
PROG Holdings, Inc.
6.00%, 11/15/2029(a) | | | | | | | 3,129 | | | | 3,056,689 | |
United Rentals North America, Inc.
4.875%, 01/15/2028 | | | | | | | 1,582 | | | | 1,557,938 | |
| | | | | | | | | | | | |
| | | | | | | | | | | 20,603,929 | |
| | | | | | | | | | | | |
| | | | | | | | | | | 482,555,503 | |
| | | | | | | | | | | | |
Financial Institutions – 7.8% | | | | | | | | | | | | |
Banking – 0.7% | |
Bread Financial Holdings, Inc.
7.00%, 01/15/2026(a) | | | | | | | 144 | | | | 143,762 | |
9.75%, 03/15/2029(a) | | | | | | | 4,120 | | | | 4,421,667 | |
| | |
| |
| abfunds.com | | AB SHORT DURATION HIGH YIELD ETF | 15 |
PORTFOLIO OF INVESTMENTS (continued)
| | | | | | | | | | | | |
| | | | | | Principal
Amount
(000) | | | U.S. $ Value | |
| |
Freedom Mortgage Corp.
12.00%, 10/01/2028(a) | | | U.S.$ | | | | 600 | | | $ | 652,080 | |
12.25%, 10/01/2030(a) | | | | | | | 340 | | | | 377,145 | |
| | | | | | | | | | | | |
| | | | | | | | | | | 5,594,654 | |
| | | | | | | | | | | | |
Brokerage – 1.4% | |
AG Issuer LLC
6.25%, 03/01/2028(a) | | | | | | | 2,147 | | | | 2,129,287 | |
AG TTMT Escrow Issuer LLC
8.625%, 09/30/2027(a) | | | | | | | 2,036 | | | | 2,113,389 | |
Aretec Group, Inc.
10.00%, 08/15/2030(a) | | | | | | | 3,533 | | | | 3,910,042 | |
Focus Financial Partners LLC
6.75%, 09/15/2031(a) | | | | | | | 1,120 | | | | 1,129,520 | |
VFH Parent LLC/Valor Co-Issuer, Inc.
7.50%, 06/15/2031(a) | | | | | | | 1,068 | | | | 1,103,436 | |
| | | | | | | | | | | | |
| | | | | | | | | | | 10,385,674 | |
| | | | | | | | | | | | |
Finance – 3.9% | |
Castlelake Aviation Finance DAC
5.00%, 04/15/2027(a) | | | | | | | 2,319 | | | | 2,330,502 | |
Curo Group Holdings Corp.
13.00%, 08/01/2028(g) | | | | | | | 1,040 | | | | 1,078,526 | |
Enova International, Inc.
9.125%, 08/01/2029(a) | | | | | | | 2,270 | | | | 2,382,274 | |
11.25%, 12/15/2028(a) | | | | | | | 1,667 | | | | 1,808,345 | |
Freedom Mortgage Holdings LLC
9.25%, 02/01/2029(a) | | | | | | | 1,508 | | | | 1,563,329 | |
GGAM Finance Ltd.
7.75%, 05/15/2026(a) | | | | | | | 788 | | | | 803,413 | |
8.00%, 02/15/2027(a) | | | | | | | 674 | | | | 698,116 | |
8.00%, 06/15/2028(a) | | | | | | | 1,711 | | | | 1,807,808 | |
goeasy Ltd.
7.625%, 07/01/2029(a) | | | | | | | 1,950 | | | | 2,023,242 | |
9.25%, 12/01/2028(a) | | | | | | | 954 | | | | 1,020,723 | |
Jefferies Finance LLC/JFIN Co-Issuer Corp.
5.00%, 08/15/2028(a) | | | | | | | 4,845 | | | | 4,533,079 | |
Midcap Financial Issuer Trust
6.50%, 05/01/2028(a) | | | | | | | 4,771 | | | | 4,665,132 | |
Navient Corp.
4.875%, 03/15/2028 | | | | | | | 1,873 | | | | 1,800,852 | |
5.50%, 03/15/2029 | | | | | | | 944 | | | | 904,229 | |
6.75%, 06/25/2025 | | | | | | | 607 | | | | 610,144 | |
9.375%, 07/25/2030 | | | | | | | 929 | | | | 1,023,321 | |
SLM Corp.
4.20%, 10/29/2025 | | | | | | | 306 | | | | 301,851 | |
| | | | | | | | | | | | |
| | | | | | | | | | | 29,354,886 | |
| | | | | | | | | | | | |
| | |
| |
16 | AB SHORT DURATION HIGH YIELD ETF | | abfunds.com |
PORTFOLIO OF INVESTMENTS (continued)
| | | | | | | | | | | | |
| | | | | | Principal
Amount
(000) | | | U.S. $ Value | |
| |
Insurance – 0.5% | | | | | | | | | | | | |
Acrisure LLC/Acrisure Finance, Inc.
4.25%, 02/15/2029(a) | | | U.S.$ | | | | 1,777 | | | $ | 1,681,273 | |
7.50%, 11/06/2030(a) | | | | | | | 253 | | | | 258,371 | |
Alliant Holdings Intermediate LLC/Alliant Holdings Co-Issuer
6.50%, 10/01/2031(a) | | | | | | | 1,434 | | | | 1,434,430 | |
6.75%, 04/15/2028(a) | | | | | | | 254 | | | | 256,512 | |
AssuredPartners, Inc.
5.625%, 01/15/2029(a) | | | | | | | 569 | | | | 540,089 | |
| | | | | | | | | | | | |
| | | | | | | | | | | 4,170,675 | |
| | | | | | | | | | | | |
Other Finance – 0.4% | |
Encore Capital Group, Inc.
8.50%, 05/15/2030(a) | | | | | | | 1,681 | | | | 1,780,566 | |
9.25%, 04/01/2029(a) | | | | | | | 1,118 | | | | 1,200,441 | |
| | | | | | | | | | | | |
| | | | | | | | | | | 2,981,007 | |
| | | | | | | | | | | | |
REITs – 0.9% | |
Aedas Homes Opco SL
4.00%, 08/15/2026(a) | | | EUR | | | | 826 | | | | 869,551 | |
Brookfield Property REIT, Inc./BPR Cumulus LLC/BPR Nimbus LLC/GGSI Sellco LL
4.50%, 04/01/2027(a) | | | U.S.$ | | | | 908 | | | | 874,177 | |
Five Point Operating Co. LP/Five Point Capital Corp.
10.50%, 01/15/2028(a)(d) | | | | | | | 745 | | | | 760,546 | |
Iron Mountain, Inc.
5.25%, 03/15/2028(a) | | | | | | | 767 | | | | 754,682 | |
Service Properties Trust
8.375%, 06/15/2029 | | | | | | | 3,516 | | | | 3,492,021 | |
Vivion Investments SARL
Series E
8.00%, 02/28/2029(a)(b)(d) | | | EUR | | | | 1 | | | | 729 | |
| | | | | | | | | | | | |
| | | | | | | | | | | 6,751,706 | |
| | | | | | | | | | | | |
| | | | | | | | | | | 59,238,602 | |
| | | | | | | | | | | | |
Utility – 2.2% | | | | | | | | | | | | |
Electric – 2.2% | |
Calpine Corp.
4.50%, 02/15/2028(a) | | | U.S.$ | | | | 4,686 | | | | 4,533,939 | |
NextEra Energy Operating Partners LP
3.875%, 10/15/2026(a) | | | | | | | 3,391 | | | | 3,239,253 | |
4.50%, 09/15/2027(a) | | | | | | | 998 | | | | 949,098 | |
7.25%, 01/15/2029(a) | | | | | | | 1,024 | | | | 1,045,688 | |
NRG Energy, Inc.
3.375%, 02/15/2029(a) | | | | | | | 3,207 | | | | 2,937,773 | |
3.625%, 02/15/2031(a) | | | | | | | 2,109 | | | | 1,879,836 | |
5.25%, 06/15/2029(a) | | | | | | | 1,118 | | | | 1,097,708 | |
| | |
| |
| abfunds.com | | AB SHORT DURATION HIGH YIELD ETF | 17 |
PORTFOLIO OF INVESTMENTS (continued)
| | | | | | | | | | | | |
| | | | | | Principal
Amount
(000) | | | U.S. $ Value | |
| |
PG&E Corp.
5.00%, 07/01/2028 | | | U.S.$ | | | | 886 | | | $ | 871,930 | |
Vistra Operations Co., LLC
5.50%, 09/01/2026(a) | | | | | | | 288 | | | | 287,721 | |
5.625%, 02/15/2027(a) | | | | | | | 11 | | | | 10,995 | |
| | | | | | | | | | | | |
| | | | | | | | | | | 16,853,941 | |
| | | | | | | | | | | | |
Total Corporates - Non-Investment Grade
(cost $553,341,284) | | | | | | | | | | | 558,648,046 | |
| | | | | |
| | | | | | | | | | | | |
CORPORATES - INVESTMENT GRADE – 15.0% | | | | | | | | | | | | |
Industrial – 9.2% | | | | | | | | | | | | |
Basic – 0.1% | | | | | | | | | | | | |
Westlake Corp.
3.60%, 08/15/2026 | | | | | | | 843 | | | | 826,755 | |
| | | | | | | | | | | | |
| | | |
Capital Goods – 0.6% | | | | | | | | | | | | |
Embraer Netherlands Finance BV
5.40%, 02/01/2027 | | | | | | | 588 | | | | 592,410 | |
7.00%, 07/28/2030(a) | | | | | | | 370 | | | | 391,331 | |
Regal Rexnord Corp.
6.05%, 04/15/2028 | | | | | | | 103 | | | | 105,849 | |
6.30%, 02/15/2030 | | | | | | | 468 | | | | 487,801 | |
Rolls-Royce PLC
3.625%, 10/14/2025(a) | | | | | | | 3,277 | | | | 3,233,121 | |
| | | | | | | | | | | | |
| | | | | | | | | | | 4,810,512 | |
| | | | | | | | | | | | |
Communications - Media – 1.9% | |
DirecTV Financing LLC
8.875%, 02/01/2030(a) | | | | | | | 1,455 | | | | 1,466,989 | |
DirecTV Financing LLC/DirecTV Financing Co-Obligor, Inc.
5.875%, 08/15/2027(a) | | | | | | | 5,765 | | | | 5,659,731 | |
Paramount Global
3.70%, 06/01/2028 | | | | | | | 553 | | | | 525,107 | |
4.20%, 06/01/2029 | | | | | | | 510 | | | | 486,183 | |
Pinewood Finco PLC
3.25%, 09/30/2025(a) | | | GBP | | | | 620 | | | | 773,559 | |
Warnermedia Holdings, Inc.
4.054%, 03/15/2029 | | | U.S.$ | | | | 2,300 | | | | 2,177,801 | |
4.279%, 03/15/2032 | | | | | | | 3,442 | | | | 3,109,950 | |
| | | | | | | | | | | | |
| | | | | | | | | | | 14,199,320 | |
| | | | | | | | | | | | |
Consumer Cyclical - Automotive – 1.4% | | | | | | | | | | | | |
Adient Global Holdings Ltd.
7.00%, 04/15/2028(a) | | | | | | | 504 | | | | 515,128 | |
Ford Motor Credit Co., LLC
2.70%, 08/10/2026 | | | | | | | 254 | | | | 243,652 | |
4.95%, 05/28/2027 | | | | | | | 731 | | | | 726,387 | |
| | |
| |
18 | AB SHORT DURATION HIGH YIELD ETF | | abfunds.com |
PORTFOLIO OF INVESTMENTS (continued)
| | | | | | | | | | | | |
| | | | | | Principal
Amount
(000) | | | U.S. $ Value | |
| |
5.80%, 03/08/2029 | | | U.S.$ | | | | 846 | | | $ | 854,917 | |
7.35%, 11/04/2027 | | | | | | | 1,437 | | | | 1,515,834 | |
Harley-Davidson Financial Services, Inc.
3.05%, 02/14/2027(a) | | | | | | | 796 | | | | 756,407 | |
Jaguar Land Rover Automotive PLC
4.50%, 10/01/2027(a) | | | | | | | 1,565 | | | | 1,511,242 | |
5.50%, 07/15/2029(a) | | | | | | | 1,075 | | | | 1,050,856 | |
6.875%, 11/15/2026(a) | | | EUR | | | | 478 | | | | 532,217 | |
7.75%, 10/15/2025(a) | | | U.S.$ | | | | 293 | | | | 293,073 | |
Nissan Motor Acceptance Co., LLC
1.85%, 09/16/2026(a) | | | | | | | 23 | | | | 21,266 | |
2.75%, 03/09/2028(a) | | | | | | | 335 | | | | 299,095 | |
5.30%, 09/13/2027(a) | | | | | | | 618 | | | | 602,698 | |
Nissan Motor Co., Ltd.
4.345%, 09/17/2027(a) | | | | | | | 1,110 | | | | 1,052,802 | |
4.81%, 09/17/2030(a) | | | | | | | 405 | | | | 367,238 | |
| | | | | | | | | | | | |
| | | | | | | | | | | 10,342,812 | |
| | | | | | | | | | | | |
Consumer Cyclical - Entertainment – 0.7% | | | | | | | | | | | | |
Carnival Corp.
4.00%, 08/01/2028(a) | | | | | | | 4,226 | | | | 4,025,476 | |
Mattel, Inc.
3.375%, 04/01/2026(a) | | | | | | | 1,100 | | | | 1,074,172 | |
| | | | | | | | | | | | |
| | | | | | | | | | | 5,099,648 | |
| | | | | | | | | | | | |
Consumer Cyclical - Other – 1.1% | | | | | | | | | | | | |
Flutter Treasury DAC
5.00%, 04/29/2029(a) | | | EUR | | | | 139 | | | | 152,775 | |
6.375%, 04/29/2029(a) | | | U.S.$ | | | | 205 | | | | 208,850 | |
GENM Capital Labuan Ltd.
3.882%, 04/19/2031(a) | | | | | | | 204 | | | | 181,624 | |
International Game Technology PLC
3.50%, 06/15/2026(a) | | | EUR | | | | 300 | | | | 316,309 | |
5.25%, 01/15/2029(a) | | | U.S.$ | | | | 55 | | | | 54,052 | |
6.25%, 01/15/2027(a) | | | | | | | 202 | | | | 204,087 | |
Las Vegas Sands Corp.
2.90%, 06/25/2025 | | | | | | | 3,246 | | | | 3,204,029 | |
Resorts World Las Vegas LLC/RWLV Capital, Inc.
4.625%, 04/16/2029(a) | | | | | | | 4,500 | | | | 4,018,275 | |
| | | | | | | | | | | | |
| | | | | | | | | | | 8,340,001 | |
| | | | | | | | | | | | |
Consumer Cyclical - Retailers – 0.0% | | | | | | | | | | | | |
Macy’s Retail Holdings LLC
5.875%, 03/15/2030(a) | | | | | | | 327 | | | | 314,764 | |
| | | | | | | | | | | | |
| | | |
Consumer Non-Cyclical – 0.1% | | | | | | | | | | | | |
Avantor Funding, Inc.
2.625%, 11/01/2025(a) | | | EUR | | | | 346 | | | | 361,575 | |
| | | | | | | | | | | | |
| | |
| |
| abfunds.com | | AB SHORT DURATION HIGH YIELD ETF | 19 |
PORTFOLIO OF INVESTMENTS (continued)
| | | | | | | | | | | | |
| | | | | | Principal
Amount
(000) | | | U.S. $ Value | |
| |
Energy – 1.0% | | | | | | | | | | | | |
EnLink Midstream Partners LP
4.15%, 06/01/2025 | | | U.S.$ | | | | 306 | | | $ | 304,445 | |
4.85%, 07/15/2026 | | | | | | | 2,375 | | | | 2,371,889 | |
EQM Midstream Partners LP
4.125%, 12/01/2026 | | | | | | | 1,878 | | | | 1,878,000 | |
4.50%, 01/15/2029(a) | | | | | | | 218 | | | | 211,458 | |
5.50%, 07/15/2028 | | | | | | | 480 | | | | 488,947 | |
6.50%, 07/01/2027(a) | | | | | | | 1,101 | | | | 1,128,492 | |
Harbour Energy PLC
5.50%, 10/15/2026(a) | | | | | | | 315 | | | | 313,204 | |
Tengizchevroil Finance Co. International Ltd.
3.25%, 08/15/2030(a) | | | | | | | 242 | | | | 206,712 | |
Var Energi ASA
7.50%, 01/15/2028(a) | | | | | | | 703 | | | | 749,082 | |
| | | | | | | | | | | | |
| | | | | | | | | | | 7,652,229 | |
| | | | | | | | | | | | |
Other Industrial – 0.9% | | | | | | | | | | | | |
American Builders & Contractors Supply Co., Inc.
4.00%, 01/15/2028(a) | | | | | | | 4,463 | | | | 4,285,640 | |
Ritchie Bros Holdings, Inc.
6.75%, 03/15/2028(a) | | | | | | | 2,527 | | | | 2,598,464 | |
| | | | | | | | | | | | |
| | | | | | | | | | | 6,884,104 | |
| | | | | | | | | | | | |
Services – 0.0% | | | | | | | | | | | | |
Boost Newco Borrower LLC/GTCR W Dutch Finance Sub BV
8.50%, 01/15/2031(a) | | | GBP | | | | 132 | | | | 180,011 | |
| | | | | | | | | | | | |
| | | |
Technology – 0.1% | | | | | | | | | | | | |
Broadcom, Inc.
4.926%, 05/15/2037(a) | | | U.S.$ | | | | 200 | | | | 194,376 | |
CDW LLC/CDW Finance Corp.
3.276%, 12/01/2028 | | | | | | | 406 | | | | 380,077 | |
| | | | | | | | | | | | |
| | | | | | | | | | | 574,453 | |
| | | | | | | | | | | | |
Transportation - Airlines – 1.2% | | | | | | | | | | | | |
Air Canada
3.875%, 08/15/2026(a) | | | | | | | 2,607 | | | | 2,535,386 | |
AS Mileage Plan IP Ltd.
5.021%, 10/20/2029(a) | | | | | | | 762 | | | | 745,533 | |
United Airlines, Inc.
4.375%, 04/15/2026(a) | | | | | | | 5,202 | | | | 5,128,184 | |
4.625%, 04/15/2029(a) | | | | | | | 476 | | | | 457,602 | |
| | | | | | | | | | | | |
| | | | | | | | | | | 8,866,705 | |
| | | | | | | | | | | | |
Transportation - Railroads – 0.0% | | | | | | | | | | | | |
Lima Metro Line 2 Finance Ltd.
4.35%, 04/05/2036(a) | | | | | | | 169 | | | | 155,234 | |
5.875%, 07/05/2034(a) | | | | | | | 83 | | | | 82,162 | |
| | | | | | | | | | | | |
| | | | | | | | | | | 237,396 | |
| | | | | | | | | | | | |
| | |
| |
20 | AB SHORT DURATION HIGH YIELD ETF | | abfunds.com |
PORTFOLIO OF INVESTMENTS (continued)
| | | | | | | | | | | | |
| | | | | | Principal
Amount
(000) | | | U.S. $ Value | |
| |
Transportation - Services – 0.1% | | | | | | | | | | | | |
Adani Ports & Special Economic Zone Ltd.
4.375%, 07/03/2029(a) | | | U.S.$ | | | | 202 | | | $ | 176,245 | |
AerCap Global Aviation Trust
6.50%, 06/15/2045(a) | | | | | | | 291 | | | | 290,677 | |
| | | | | | | | | | | | |
| | | | | | | | | | | 466,922 | |
| | | | | | | | | | | | |
| | | | 69,157,207 | |
| | | | | |
Financial Institutions – 5.7% | | | | | | | | | | | | |
Banking – 5.1% | | | | | | | | | | | | |
AIB Group PLC
6.608%, 09/13/2029(a) | | | | | | | 319 | | | | 336,631 | |
Ally Financial, Inc.
5.75%, 11/20/2025 | | | | | | | 775 | | | | 778,294 | |
6.848%, 01/03/2030 | | | | | | | 1,201 | | | | 1,260,762 | |
8.00%, 11/01/2031 | | | | | | | 809 | | | | 911,258 | |
Banco Santander SA
4.175%, 03/24/2028 | | | | | | | 400 | | | | 392,688 | |
5.179%, 11/19/2025 | | | | | | | 400 | | | | 399,912 | |
9.625%, 05/21/2033(h) | | | | | | | 1,000 | | | | 1,151,590 | |
Bank of Ireland Group PLC
5.601%, 03/20/2030(a) | | | | | | | 752 | | | | 768,176 | |
Barclays PLC
5.69%, 03/12/2030 | | | | | | | 1,323 | | | | 1,351,352 | |
CaixaBank SA
5.673%, 03/15/2030(a) | | | | | | | 1,324 | | | | 1,349,633 | |
5.875%, 10/09/2027(a)(h) | | | EUR | | | | 200 | | | | 214,244 | |
6.684%, 09/13/2027(a) | | | U.S.$ | | | | 718 | | | | 738,642 | |
Capital One Financial Corp.
5.463%, 07/26/2030 | | | | | | | 1,573 | | | | 1,596,438 | |
5.70%, 02/01/2030 | | | | | | | 751 | | | | 769,384 | |
Citigroup, Inc.
Series AA
7.625%, 11/15/2028(h) | | | | | | | 205 | | | | 217,220 | |
Series V
4.70%, 01/30/2025(h) | | | | | | | 147 | | | | 146,521 | |
Series W
4.00%, 12/10/2025(h) | | | | | | | 207 | | | | 202,363 | |
Series X
3.875%, 02/18/2026(h) | | | | | | | 154 | | | | 149,349 | |
Deutsche Bank AG/New York NY
3.729%, 01/14/2032 | | | | | | | 3,517 | | | | 3,105,300 | |
7.146%, 07/13/2027 | | | | | | | 574 | | | | 592,925 | |
HSBC Holdings PLC
5.546%, 03/04/2030 | | | | | | | 3,287 | | | | 3,344,194 | |
Intesa Sanpaolo SpA
4.198%, 06/01/2032(a) | | | | | | | 2,636 | | | | 2,332,385 | |
5.71%, 01/15/2026(a) | | | | | | | 2,436 | | | | 2,443,966 | |
7.00%, 11/21/2025(a) | | | | | | | 200 | | | | 203,720 | |
| | |
| |
| abfunds.com | | AB SHORT DURATION HIGH YIELD ETF | 21 |
PORTFOLIO OF INVESTMENTS (continued)
| | | | | | | | | | | | |
| | | | | | Principal
Amount
(000) | | | U.S. $ Value | |
| |
Lloyds Banking Group PLC
4.976%, 08/11/2033 | | | U.S.$ | | | | 403 | | | $ | 396,645 | |
7.953%, 11/15/2033 | | | | | | | 243 | | | | 277,197 | |
PNC Financial Services Group, Inc. (The)
Series R
8.317% (CME Term SOFR 3 Month + 3.30%), 12/02/2024(c)(h) | | | | | | | 517 | | | | 517,000 | |
Santander Holdings USA, Inc.
5.353%, 09/06/2030 | | | | | | | 943 | | | | 943,000 | |
6.174%, 01/09/2030 | | | | | | | 145 | | | | 149,482 | |
6.499%, 03/09/2029 | | | | | | | 341 | | | | 354,128 | |
Societe Generale SA
5.519%, 01/19/2028(a) | | | | | | | 2,545 | | | | 2,561,390 | |
Synchrony Financial
5.935%, 08/02/2030 | | | | | | | 610 | | | | 623,566 | |
Truist Financial Corp.
Series L
8.31% (CME Term SOFR 3 Month + 3.36%), 12/16/2024(c)(h) | | | | | | | 842 | | | | 842,724 | |
Series N
6.669%, 03/01/2025(h) | | | | | | | 626 | | | | 623,458 | |
UBS Group AG
3.875%, 06/02/2026(a)(h) | | | | | | | 445 | | | | 424,009 | |
4.375%, 02/10/2031(a)(h) | | | | | | | 507 | | | | 430,068 | |
UniCredit SpA
1.982%, 06/03/2027(a) | | | | | | | 222 | | | | 211,906 | |
2.569%, 09/22/2026(a) | | | | | | | 482 | | | | 471,435 | |
5.861%, 06/19/2032(a) | | | | | | | 1,312 | | | | 1,312,866 | |
7.296%, 04/02/2034(a) | | | | | | | 2,175 | | | | 2,284,207 | |
Wells Fargo & Co.
Series BB
3.90%, 03/15/2026(h) | | | | | | | 878 | | | | 853,117 | |
| | | | | | | | | | | | |
| | | | | | | | | | | 38,033,145 | |
| | | | | | | | | | | | |
Finance – 0.1% | |
Aviation Capital Group LLC
4.125%, 08/01/2025(a) | | | | | | | 3 | | | | 2,979 | |
4.875%, 10/01/2025(a) | | | | | | | 31 | | | | 30,949 | |
Blackstone Private Credit Fund
3.25%, 03/15/2027 | | | | | | | 429 | | | | 410,399 | |
FS KKR Capital Corp.
3.125%, 10/12/2028 | | | | | | | 115 | | | | 104,833 | |
3.40%, 01/15/2026 | | | | | | | 115 | | | | 112,560 | |
| | | | | | | | | | | | |
| | | | | | | | | | | 661,720 | |
| | | | | | | | | | | | |
Insurance – 0.2% | |
Athene Global Funding
1.985%, 08/19/2028(a) | | | | | | | 562 | | | | 506,047 | |
| | |
| |
22 | AB SHORT DURATION HIGH YIELD ETF | | abfunds.com |
PORTFOLIO OF INVESTMENTS (continued)
| | | | | | | | | | | | |
| | | | | | Principal
Amount
(000) | | | U.S. $ Value | |
| |
2.55%, 11/19/2030(a) | | | U.S.$ | | | | 117 | | | $ | 101,744 | |
2.717%, 01/07/2029(a) | | | | | | | 212 | | | | 194,003 | |
5.583%, 01/09/2029(a) | | | | | | | 93 | | | | 95,023 | |
Centene Corp.
4.625%, 12/15/2029 | | | | | | | 20 | | | | 19,171 | |
Hartford Financial Services Group, Inc. (The)
Series ICON
6.91% (CME Term SOFR 3 Month + 2.39%), 02/12/2047(a)(c) | | | | | | | 859 | | | | 794,111 | |
| | | | | | | | | | | | |
| | | | | | | | | | | 1,710,099 | |
| | | | | | | | | | | | |
REITs – 0.3% | |
GLP Capital LP/GLP Financing II, Inc.
5.375%, 04/15/2026 | | | | | | | 79 | | | | 79,088 | |
Newmark Group, Inc.
7.50%, 01/12/2029 | | | | | | | 1,412 | | | | 1,496,988 | |
Omega Healthcare Investors, Inc.
3.375%, 02/01/2031 | | | | | | | 440 | | | | 396,858 | |
Sabra Health Care LP
3.90%, 10/15/2029 | | | | | | | 334 | | | | 314,825 | |
Trust Fibra Uno
4.869%, 01/15/2030(a) | | | | | | | 211 | | | | 190,362 | |
| | | | | | | | | | | | |
| | | | | | | | | | | 2,478,121 | |
| | | | | | | | | | | | |
| | | | | | | | | | | 42,883,085 | |
| | | | | | | | | | | | |
Utility – 0.1% | | | | | | | | | | | | |
Electric – 0.1% | | | | | | | | | | | | |
Adani Electricity Mumbai Ltd.
3.949%, 02/12/2030(a) | | | | | | | 200 | | | | 164,526 | |
Alexander Funding Trust II
7.467%, 07/31/2028(a) | | | | | | | 120 | | | | 127,856 | |
Empresa Electrica Cochrane SpA
5.50%, 05/14/2027(a) | | | | | | | 166 | | | | 159,658 | |
Empresas Publicas de Medellin ESP
4.25%, 07/18/2029(a) | | | | | | | 427 | | | | 378,749 | |
Pacific Gas and Electric Co.
5.55%, 05/15/2029 | | | | | | | 384 | | | | 393,827 | |
| | | | | | | | | | | | |
| | | | | | | | | | | 1,224,616 | |
| | | | | | | | | | | | |
Total Corporates - Investment Grade
(cost $111,490,143) | | | | | | | | | | | 113,264,908 | |
| | | | | |
| | | | | | | | | | | | |
EMERGING MARKETS - CORPORATE BONDS – 2.8% | | | | | | | | | | | | |
Industrial – 2.6% | | | | | | | | | | | | |
Basic – 0.5% | | | | | | | | | | | | |
Braskem Idesa SAPI
6.99%, 02/20/2032(a) | | | | | | | 486 | | | | 364,271 | |
| | |
| |
| abfunds.com | | AB SHORT DURATION HIGH YIELD ETF | 23 |
PORTFOLIO OF INVESTMENTS (continued)
| | | | | | | | | | | | |
| | | | | | Principal
Amount
(000) | | | U.S. $ Value | |
| |
Braskem Netherlands Finance BV
4.50%, 01/10/2028(a) | | | U.S.$ | | | | 341 | | | $ | 319,368 | |
Cia de Minas Buenaventura SAA
5.50%, 07/23/2026(a) | | | | | | | 719 | | | | 714,024 | |
CSN Resources SA
7.625%, 04/17/2026(a) | | | | | | | 274 | | | | 273,378 | |
First Quantum Minerals Ltd.
6.875%, 10/15/2027(a) | | | | | | | 1,197 | | | | 1,191,542 | |
9.375%, 03/01/2029(a) | | | | | | | 549 | | | | 585,893 | |
Volcan Cia Minera SAA
8.75%, 01/24/2030(a) | | | | | | | 128 | | | | 122,230 | |
| | | | | | | | | | | | |
| | | | | | | | | | | 3,570,706 | |
| | | | | | | | | | | | |
Communications - Media – 0.1% | | | | | | | | | | | | |
RCS & RDS SA
3.25%, 02/05/2028(a) | | | EUR | | | | 200 | | | | 203,002 | |
Telecomunicaciones Digitales SA
4.50%, 01/30/2030(a) | | | U.S.$ | | | | 205 | | | | 186,614 | |
| | | | | | | | | | | | |
| | | | | | | | | | | 389,616 | |
| | | | | | | | | | | | |
Communications - Telecommunications – 0.0% | | | | | | | | | | | | |
C&W Senior Finance Ltd.
6.875%, 09/15/2027(a) | | | | | | | 200 | | | | 198,304 | |
| | | | | | | | | | | | |
| | | |
Consumer Cyclical - Other – 1.0% | | | | | | | | | | | | |
Allwyn International AS
3.875%, 02/15/2027(a) | | | EUR | | | | 805 | | | | 847,053 | |
Melco Resorts Finance Ltd.
4.875%, 06/06/2025(a) | | | U.S.$ | | | | 815 | | | | 806,850 | |
5.375%, 12/04/2029(a) | | | | | | | 428 | | | | 392,823 | |
5.625%, 07/17/2027(a) | | | | | | | 356 | | | | 344,207 | |
5.75%, 07/21/2028(a) | | | | | | | 1,178 | | | | 1,121,677 | |
MGM China Holdings Ltd.
5.25%, 06/18/2025(a) | | | | | | | 1,482 | | | | 1,475,053 | |
5.875%, 05/15/2026(a) | | | | | | | 216 | | | | 215,123 | |
Studio City Finance Ltd.
6.00%, 07/15/2025(a) | | | | | | | 468 | | | | 466,362 | |
Wynn Macau Ltd.
5.50%, 01/15/2026(a) | | | | | | | 1,775 | | | | 1,756,695 | |
5.625%, 08/26/2028(a) | | | | | | | 345 | | | | 330,122 | |
| | | | | | | | | | | | |
| | | | | | | | | | | 7,755,965 | |
| | | | | | | | | | | | |
Consumer Non-Cyclical – 0.6% | | | | | | | | | | | | |
BRF SA
4.875%, 01/24/2030(a) | | | | | | | 784 | | | | 738,822 | |
Central American Bottling Corp./CBC Bottling Holdco SL/Beliv Holdco SL
5.25%, 04/27/2029(a) | | | | | | | 113 | | | | 106,503 | |
| | |
| |
24 | AB SHORT DURATION HIGH YIELD ETF | | abfunds.com |
PORTFOLIO OF INVESTMENTS (continued)
| | | | | | | | | | | | |
| | | | | | Principal
Amount
(000) | | | U.S. $ Value | |
| |
Teva Pharmaceutical Finance Netherlands II BV
3.75%, 05/09/2027 | | | EUR | | | | 482 | | | $ | 507,510 | |
Teva Pharmaceutical Finance Netherlands III BV
3.15%, 10/01/2026 | | | U.S.$ | | | | 490 | | | | 469,175 | |
4.75%, 05/09/2027 | | | | | | | 2,675 | | | | 2,604,701 | |
5.125%, 05/09/2029 | | | | | | | 372 | | | | 362,700 | |
Virgolino de Oliveira Finance SA
10.50%, 01/28/2018(e)(g)(i)(j)(k) | | | | | | | 422 | | | | 42 | |
| | | | | | | | | | | | |
| | | | | | | | | | | 4,789,453 | |
| | | | | | | | | | | | |
Energy – 0.4% | | | | | | | | | | | | |
Ecopetrol SA
8.625%, 01/19/2029 | | | | | | | 216 | | | | 229,463 | |
Gran Tierra Energy, Inc.
9.50%, 10/15/2029(a) | | | | | | | 216 | | | | 204,440 | |
Greenko Wind Projects Mauritius Ltd.
5.50%, 04/06/2025(a) | | | | | | | 200 | | | | 198,576 | |
Leviathan Bond Ltd.
6.125%, 06/30/2025(a) | | | | | | | 754 | | | | 749,640 | |
Medco Bell Pte Ltd.
6.375%, 01/30/2027(a) | | | | | | | 357 | | | | 355,215 | |
Oleoducto Central SA
4.00%, 07/14/2027(a) | | | | | | | 560 | | | | 530,287 | |
SierraCol Energy Andina LLC
6.00%, 06/15/2028(a) | | | | | | | 578 | | | | 533,384 | |
| | | | | | | | | | | | |
| | | | | | | | | | | 2,801,005 | |
| | | | | | | | | | | | |
| | | | | | | | | | | 19,505,049 | |
| | | | | | | | | | | | |
Financial Institutions – 0.1% | | | | | | | | | | | | |
Banking – 0.1% | |
Bank Tabungan Negara Persero TBK PT
4.20%, 01/23/2025(a) | | | | | | | 452 | | | | 449,812 | |
| | | | | | | | | | | | |
| | | |
Brokerage – 0.0% | | | | | | | | | | | | |
Banco BTG Pactual SA/Cayman Islands
4.50%, 01/10/2025(a) | | | | | | | 355 | | | | 352,693 | |
| | | | | | | | | | | | |
| | | | | | | | | | | 802,505 | |
| | | | | | | | | | | | |
Utility – 0.1% | | | | | | | | | | | | |
Electric – 0.1% | | | | | | | | | | | | |
India Clean Energy Holdings
4.50%, 04/18/2027(a) | | | | | | | 200 | | | | 187,000 | |
Investment Energy Resources Ltd.
6.25%, 04/26/2029(a) | | | | | | | 247 | | | | 238,412 | |
Terraform Global Operating LP
6.125%, 03/01/2026(a) | | | | | | | 108 | | | | 107,956 | |
| | | | | | | | | | | | |
| | | | 533,368 | |
| | | | | |
Total Emerging Markets - Corporate Bonds
(cost $21,389,321) | | | | | | | | | | | 20,840,922 | |
| | | | | |
| | | | | | | | | | | | |
| | |
| |
| abfunds.com | | AB SHORT DURATION HIGH YIELD ETF | 25 |
PORTFOLIO OF INVESTMENTS (continued)
| | | | | | | | | | | | |
| | | | | | Principal
Amount
(000) | | | U.S. $ Value | |
| |
BANK LOANS – 1.9% | | | | | | | | | | | | |
Industrial – 1.8% | | | | | | | | | | | | |
Capital Goods – 0.1% | | | | | | | | | | | | |
ACProducts Holdings, Inc.
9.115% (SOFR 3 Month + 4.25%), 05/17/2028(l) | | | U.S.$ | | | | 653 | | | $ | 520,817 | |
| | | | | | | | | | | | |
| | | |
Communications - Media – 0.6% | | | | | | | | | | | | |
Coral-US Co-Borrower LLC
7.724% (SOFR 1 Month + 3.00%), 10/15/2029(l) | | | | | | | 320 | | | | 320,627 | |
DirecTV Financing LLC
10.097% (SOFR 3 Month + 5.25%), 08/02/2029(l) | | | | | | | 2,197 | | | | 2,163,653 | |
Gray Television, Inc.
7.786% (SOFR 1 Month + 3.00%), 12/01/2028(l) | | | | | | | 1,920 | | | | 1,766,400 | |
| | | | | | | | | | | | |
| | | | | | | | | | | 4,250,680 | |
| | | | | |
Communications - Telecommunications – 0.1% | | | | | | | | | | | | |
Crown Subsea Communications Holding, Inc.
8.573% (SOFR 1 Month + 4.00%), 01/30/2031(l) | | | | | | | 478 | | | | 483,980 | |
| | | | | |
| | | |
Consumer Non-Cyclical – 0.3% | | | | | | | | | | | | |
Bausch + Lomb Corporation
7.938% (SOFR 1 Month + 3.25%), 05/10/2027(l) | | | | | | | 985 | | | | 987,782 | |
Gainwell Acquisition Corp.
8.704% (SOFR 3 Month + 4.00%), 10/01/2027(l) | | | | | | | 385 | | | | 368,102 | |
Neptune BidCo US, Inc.
9.758% (SOFR 3 Month + 5.00%), 04/11/2029(l) | | | | | | | 746 | | | | 678,313 | |
US Radiology Specialists, Inc. (US Outpatient Imaging Services, Inc.)
9.354% (SOFR 3 Month + 4.75%), 12/15/2027(l) | | | | | | | 523 | | | | 526,993 | |
| | | | | | | | | | | | |
| | | | 2,561,190 | |
| | | | | |
Other Industrial – 0.0% | | | | | | | | | | | | |
American Tire Distributors, Inc.
13.159% (SOFR 3 Month + 8.25%), 10/20/2028(l) | | | | | | | 1,110 | | | | 244,653 | |
| | | | | | | | | | | | |
| | | |
Technology – 0.4% | | | | | | | | | | | | |
Ascend Learning LLC
10.423% (SOFR 1 Month + 5.75%), 12/10/2029(l) | | | | | | | 300 | | | | 299,250 | |
| | |
| |
26 | AB SHORT DURATION HIGH YIELD ETF | | abfunds.com |
PORTFOLIO OF INVESTMENTS (continued)
| | | | | | | | | | | | |
| | | | | | Principal
Amount
(000) | | | U.S. $ Value | |
| |
Clover Holding 2 LLC
11/01/2031(g)(m) | | | U.S.$ | | | | 1,805 | | | $ | 1,795,975 | |
Loyalty Ventures, Inc.
14.00% (PRIME 3 Month + 5.50%), 11/03/2027(f)(g)(j)(l) | | | | | | | 550 | | | | 4,124 | |
MedAssets Software Intermediate Holdings, Inc.
7.750% (SOFR + 4.00%), 12/17/2029(g)(l) | | | | | | | 132 | | | | 85,140 | |
8.725% (SOFR + 4.00%), 12/17/2028(g)(l) | | | | | | | 24 | | | | 20,940 | |
Playtika Holding Corp.
7.437% (SOFR 1 Month + 2.75%), 03/13/2028(l) | | | | | | | 779 | | | | 781,597 | |
| | | | | | | | | | | | |
| | | | 2,987,026 | |
| | | | | |
Transportation - Airlines – 0.3% | | | | | | | | | | | | |
AS Mileage Plan IP Ltd.
10/15/2031(m) | | | | | | | 820 | | | | 823,420 | |
Jetblue Airways Corp.
10.274% (SOFR 6 Month + 5.50%), 08/27/2029(l) | | | | | | | 860 | | | | 869,142 | |
SkyMiles IP Ltd. (Delta Air Lines, Inc.)
8.367% (SOFR 3 Month + 3.75%), 10/20/2027(l) | | | | | | | 414 | | | | 422,020 | |
| | | | | | | | | | | | |
| | | | 2,114,582 | |
| | | | | | | | | | | | |
| | | | 13,162,928 | |
| | | | | |
Financial Institutions – 0.1% | | | | | | | | | | | | |
Finance – 0.0% | | | | | | | | | | | | |
Orbit Private Holdings I Ltd.
10.014% (SOFR 6 Month + 4.50%), 12/11/2028(g)(l) | | | | | | | 107 | | | | 108,179 | |
| | | | | | | | | | | | |
| | | |
Insurance – 0.1% | | | | | | | | | | | | |
Asurion LLC
8.923% (SOFR 1 Month + 4.25%), 08/19/2028(l) | | | | | | | 975 | | | | 978,631 | |
| | | | | | | | | | | | |
| | | | | | | | | | | 1,086,810 | |
| | | | | | | | | | | | |
Total Bank Loans
(cost $15,759,259) | | | | | | | | | | | 14,249,738 | |
| | | | | |
| | | | | | | | | | | | |
EMERGING MARKETS - SOVEREIGNS – 0.8% | | | | | | | | | | | | |
Angola – 0.2% | |
Angolan Government International Bond
9.125%, 11/26/2049(a) | | | | | | | 850 | | | | 694,875 | |
9.50%, 11/12/2025(a) | | | | | | | 710 | | | | 715,769 | |
| | | | | | | | | | | | |
| | | | | | | | | | | 1,410,644 | |
| | | | | | | | | | | | |
| | |
| |
| abfunds.com | | AB SHORT DURATION HIGH YIELD ETF | 27 |
PORTFOLIO OF INVESTMENTS (continued)
| | | | | | | | | | | | |
| | | | | | Principal
Amount
(000) | | | U.S. $ Value | |
| |
Bahrain – 0.1% | | | | | | | | | | | | |
Bahrain Government International Bond
7.00%, 10/12/2028(a) | | | U.S.$ | | | | 570 | | | $ | 589,597 | |
| | | | | | | | | | | | |
|
Brazil – 0.1% | |
Brazilian Government International Bond
2.875%, 06/06/2025 | | | | | | | 547 | | | | 538,636 | |
| | | | | | | | | | | | |
|
Egypt – 0.0% | |
Egypt Government International Bond
7.50%, 01/31/2027(a) | | | | | | | 200 | | | | 199,438 | |
| | | | | | | | | | | | |
|
Ivory Coast – 0.1% | |
Ivory Coast Government International Bond
6.375%, 03/03/2028(a) | | | | | | | 760 | | | | 756,382 | |
| | | | | | | | | | | | |
|
Lebanon – 0.0% | |
Lebanon Government International Bond
6.85%, 03/23/2027(a)(e)(f) | | | | | | | 11 | | | | 1,018 | |
Series E
6.10%, 10/04/2022(a)(e)(i) | | | | | | | 210 | | | | 19,425 | |
Series G
6.60%, 11/27/2026(a)(e)(f) | | | | | | | 51 | | | | 4,717 | |
| | | | | | | | | | | | |
| | | | | | | | | | | 25,160 | |
| | | | | | | | | | | | |
Nigeria – 0.1% | |
Nigeria Government International Bond
7.625%, 11/28/2047(a) | | | | | | | 639 | | | | 484,042 | |
| | | | | | | | | | | | |
|
Senegal – 0.1% | |
Senegal Government International Bond
4.75%, 03/13/2028(a) | | | EUR | | | | 499 | | | | 497,234 | |
6.75%, 03/13/2048(a) | | | U.S.$ | | | | 483 | | | | 348,364 | |
| | | | | | | | | | | | |
| | | | | | | | | | | 845,598 | |
| | | | | | | | | | | | |
South Africa – 0.1% | |
Republic of South Africa Government International Bond
4.30%, 10/12/2028 | | | | | | | 208 | | | | 197,080 | |
4.85%, 09/27/2027 | | | | | | | 540 | | | | 529,875 | |
| | | | | | | | | | | | |
| | | | | | | | | | | 726,955 | |
| | | | | | | | | | | | |
Ukraine – 0.0% | |
Ukraine Government International Bond
0.00%, 02/01/2030(a)(d) | | | | | | | 16 | | | | 8,242 | |
0.00%, 02/01/2034(a)(d) | | | | | | | 61 | | | | 23,972 | |
1.75%, 02/01/2035(a)(d) | | | | | | | 119 | | | | 60,889 | |
1.75%, 02/01/2036(a)(d) | | | | | | | 89 | | | | 44,864 | |
| | | | | | | | | | | | |
| | | | | | | | | | | 137,967 | |
| | | | | | | | | | | | |
Total Emerging Markets - Sovereigns
(cost $6,392,219) | | | | | | | | | | | 5,714,419 | |
| | | | | |
| | | | | | | | | | | | |
| | |
| |
28 | AB SHORT DURATION HIGH YIELD ETF | | abfunds.com |
PORTFOLIO OF INVESTMENTS (continued)
| | | | | | | | | | | | |
| | | | | | Principal
Amount
(000) | | | U.S. $ Value | |
| |
COLLATERALIZED LOAN OBLIGATIONS – 0.4% | | | | | | | | | | | | |
CLO - Floating Rate – 0.4% | | | | | | | | | | | | |
Ares XXXIV CLO Ltd.
Series 2015-2A, Class CR
6.909% (CME Term SOFR 3 Month + 2.26%), 04/17/2033(a)(c) | | | U.S.$ | | | | 644 | | | $ | 644,751 | |
Crown Point CLO 11 Ltd.
Series 2021-11A, Class D
8.509% (CME Term SOFR 3 Month + 3.86%), 01/17/2034(a)(c) | | | | | | | 250 | | | | 250,635 | |
Greywolf CLO VI Ltd.
Series 2018-1A, Class A1
5.909% (CME Term SOFR 3 Month + 1.29%), 04/26/2031(a)(c) | | | | | | | 239 | | | | 239,099 | |
Magnetite XXV Ltd.
Series 2020-25A, Class D
8.188% (CME Term SOFR 3 Month + 3.56%), 01/25/2032(a)(c) | | | | | | | 250 | | | | 250,873 | |
Palmer Square CLO Ltd.
Series 2021-3A, Class D
7.868% (CME Term SOFR 3 Month + 3.21%), 01/15/2035(a)(c) | | | | | | | 500 | | | | 502,539 | |
Regatta XIX Funding Ltd.
Series 2022-1A, Class D
7.917% (CME Term SOFR 3 Month + 3.30%), 04/20/2035(a)(c) | | | | | | | 377 | | | | 378,506 | |
Regatta XX Funding Ltd.
Series 2021-2A, Class D
8.018% (CME Term SOFR 3 Month + 3.36%), 10/15/2034(a)(c) | | | | | | | 250 | | | | 251,306 | |
Rockford Tower CLO Ltd.
Series 2021-2A, Class D
8.129% (CME Term SOFR 3 Month + 3.51%), 07/20/2034(a)(c) | | | | | | | 250 | | | | 247,534 | |
Sound Point CLO XIX Ltd.
Series 2018-1A, Class A
5.918% (CME Term SOFR 3 Month + 1.26%), 04/15/2031(a)(c) | | | | | | | 273 | | | | 273,305 | |
| | | | | | | | | | | | |
| | | |
Total Collateralized Loan Obligations
(cost $3,032,753) | | | | | | | | | | | 3,038,548 | |
| | | | | |
| | | | | | | | | | | | |
| | |
| |
| abfunds.com | | AB SHORT DURATION HIGH YIELD ETF | 29 |
PORTFOLIO OF INVESTMENTS (continued)
| | | | | | | | | | | | |
| | | | | | Principal
Amount
(000) | | | U.S. $ Value | |
| |
QUASI-SOVEREIGNS – 0.3% | | | | | | | | | | | | |
Quasi-Sovereign Bonds – 0.3% | | | | | | | | | | | | |
Mexico – 0.1% | | | | | | | | | | | | |
Petroleos Mexicanos
6.49%, 01/23/2027 | | | U.S.$ | | | | 1,127 | | | $ | 1,104,111 | |
6.75%, 09/21/2047 | | | | | | | 191 | | | | 136,546 | |
6.95%, 01/28/2060 | | | | | | | 58 | | | | 41,331 | |
| | | | | | | | | | | | |
| | | | | | | | | | | 1,281,988 | |
| | | | | | | | | | | | |
Oman – 0.1% | |
Lamar Funding Ltd.
3.958%, 05/07/2025(a) | | | | | | | 631 | | | | 625,529 | |
| | | | | | | | | | | | |
|
South Africa – 0.1% | |
Transnet SOC Ltd.
8.25%, 02/06/2028(a) | | | | | | | 370 | | | | 379,250 | |
| | | | | | | | | | | | |
| | | |
Total Quasi-Sovereigns
(cost $2,358,175) | | | | | | | | | | | 2,286,767 | |
| | | | | |
| | | | | | | | | | | | |
COMMERCIAL MORTGAGE-BACKED SECURITIES – 0.2% | | | | | | | | | | | | |
Non-Agency Fixed Rate CMBS – 0.1% | | | | | | | | | | | | |
CD Mortgage Trust
Series 2016-CD1, Class XA
1.477%, 08/10/2049(n) | | | | | | | 3,588 | | | | 45,712 | |
Citigroup Commercial Mortgage Trust
Series 2017-C4, Class XA
1.125%, 10/12/2050(n) | | | | | | | 2,441 | | | | 54,027 | |
Commercial Mortgage Trust
Series 2012-CR3, Class D
4.292%, 10/15/2045(a) | | | | | | | 100 | | | | 69,596 | |
GS Mortgage Securities Trust
Series 2011-GC5, Class C
5.297%, 08/10/2044(a) | | | | | | | 210 | | | | 163,020 | |
Series 2011-GC5, Class D
5.297%, 08/10/2044(a) | | | | | | | 236 | | | | 129,177 | |
JPMBB Commercial Mortgage Securities Trust
Series 2014-C24, Class C
4.707%, 11/15/2047 | | | | | | | 225 | | | | 185,543 | |
Wells Fargo Commercial Mortgage Trust
Series 2016-LC24, Class XA
1.748%, 10/15/2049(n) | | | | | | | 2,079 | | | | 44,283 | |
WF-RBS Commercial Mortgage Trust
Series 2011-C4, Class E
5.149%, 06/15/2044(a) | | | | | | | 25 | | | | 21,840 | |
| | | | | | | | | | | | |
| | | | | | | | | | | 713,198 | |
| | | | | | | | | | | | |
| | |
| |
30 | AB SHORT DURATION HIGH YIELD ETF | | abfunds.com |
PORTFOLIO OF INVESTMENTS (continued)
| | | | | | | | | | | | |
| | | | | | Principal
Amount
(000) | | | U.S. $ Value | |
| |
Non-Agency Floating Rate CMBS – 0.1% | | | | | | | | | | | | |
BFLD Mortgage Trust
Series 2021-FPM, Class A
6.325% (CME Term SOFR 1 Month + 1.71%), 06/15/2038(a)(c) | | | U.S.$ | | | | 690 | | | $ | 689,570 | |
| | | | | | | | | | | | |
| | | |
Total Commercial Mortgage-Backed Securities
(cost $1,643,609) | | | | | | | | | | | 1,402,768 | |
| | | | | | | | | | | | |
| | | | | | | | | | | | |
COLLATERALIZED MORTGAGE OBLIGATIONS – 0.0% | | | | | | | | | | | | |
Risk Share Floating Rate – 0.0% | | | | | | | | | | | | |
Federal National Mortgage Association Connecticut Avenue Securities
Series 2015-C04, Class 1M2
10.549% (CME Term SOFR + 5.81%), 04/25/2028(c) | | | | | | | 39 | | | | 40,253 | |
Series 2016-C01, Class 2M2
11.799% (CME Term SOFR + 7.06%), 08/25/2028(c) | | | | | | | 21 | | | | 21,588 | |
Series 2017-C07, Class 2M2
7.349% (CME Term SOFR + 2.61%), 05/25/2030(c) | | | | | | | 5 | | | | 5,194 | |
PMT Credit Risk Transfer Trust
Series 2020-1R, Class A
8.164% (CME Term SOFR + 3.46%), 02/25/2025(a)(c) | | | | | | | 90 | | | | 90,164 | |
| | | | | | | | | | | | |
| | | |
Total Collateralized Mortgage Obligations
(cost $154,773) | | | | | | | | | | | 157,199 | |
| | | | | |
| | | |
| | | | | | Shares | | | | |
COMMON STOCKS – 0.0% | | | | | | | | | | | | |
Financials – 0.0% | | | | | | | | | | | | |
Banks – 0.0% | | | | | | | | | | | | |
Nordic Aviation Capital DAC(e)(g)(j)
(cost $149,858) | | | | | | | 6,250 | | | | 112,500 | |
| | | | | | | | | |
| | | |
| | | | | | Principal
Amount
(000) | | | | |
ASSET-BACKED SECURITIES – 0.0% | | | | | | | | | | | | |
Other ABS - Fixed Rate – 0.0% | | | | | | | | | | | | |
Pagaya AI Debt Trust
Series 2022-6, Class A4
22.798%, 05/15/2030(a)(g)
(cost $28,224) | | | U.S.$ | | | | 23 | | | | 23,324 | |
| | | | | | | | | | | | |
| | |
| |
| abfunds.com | | AB SHORT DURATION HIGH YIELD ETF | 31 |
PORTFOLIO OF INVESTMENTS (continued)
| | | | | | | | | | | | |
| | | | | |
Shares | | | U.S. $ Value | |
| |
SHORT-TERM INVESTMENTS – 3.3% | | | | | | | | | | | | |
Investment Companies – 3.3% | | | | | | | | | | | | |
AB Fixed Income Shares, Inc. – Government Money Market Portfolio – Class AB, 4.54%(o)(p)(q)
(cost $24,969,785) | | | | | | | 24,969,785 | | | $ | 24,969,785 | |
| | | | | | | | | | | | |
| | | |
Total Investments – 98.7%
(cost $740,709,403) | | | | | | | | | | | 744,708,924 | |
Other assets less liabilities – 1.3% | | | | | | | | | | | 9,642,059 | |
| | | | | | | | | | | | |
| | | |
Net Assets – 100.0% | | | | | | | | | | $ | 754,350,983 | |
| | | | | | | | | | | | |
FUTURES (see Note D)
| | | | | | | | | | | | | | | | |
| Description | | Number of
Contracts | | | Expiration
Month | | | Current
Notional | | | Value and
Unrealized
Appreciation
(Depreciation) | |
Sold Contracts | |
Euro-BOBL Futures | | | 16 | | | | December 2024 | | | $ | 2,025,370 | | | $ | (14,533 | ) |
U.S. T-Note 5 Yr (CBT) Futures | | | 360 | | | | March 2025 | | | | 38,736,563 | | | | (264,172 | ) |
U.S. T-Note 10 Yr (CBT) Futures | | | 279 | | | | March 2025 | | | | 31,021,313 | | | | (381,446 | ) |
| | | | | | | | | | | | | | | | |
| | | $ | (660,151) | |
| | | | | |
FORWARD CURRENCY EXCHANGE CONTRACTS (see Note D)
| | | | | | | | | | | | | | | | |
| Counterparty | | Contracts to
Deliver
(000) | | | In Exchange
For
(000) | | | Settlement
Date | | | Unrealized
Appreciation
(Depreciation) | |
NatWest Markets PLC | | EUR | 27,703 | | | USD | 29,945 | | | | 12/20/2024 | | | $ | 663,117 | |
State Street Bank & Trust Co. | | EUR | 892 | | | USD | 964 | | | | 12/20/2024 | | | | 21,313 | |
State Street Bank & Trust Co. | | USD | 999 | | | EUR | 951 | | | | 12/20/2024 | | | | 5,892 | |
State Street Bank & Trust Co. | | GBP | 1,349 | | | USD | 1,736 | | | | 01/16/2025 | | | | 22,277 | |
| | | | | | | | | | | | | | | | |
| | | | | | | | | | | | | | $ | 712,599 | |
| | | | | | | | | | | | | | | | |
| (a) | Security is exempt from registration under Rule 144A or Regulation S of the Securities Act of 1933. These securities are considered restricted, but liquid and may be resold in transactions exempt from registration. At November 30, 2024, the aggregate market value of these securities amounted to $581,420,507 or 77.1% of net assets. |
| (b) | Pay-In-Kind Payments (PIK). The issuer may pay cash interest and/or interest in additional debt securities. Rates shown are the rates in effect at November 30, 2024. |
| (c) | Floating Rate Security. Stated interest/floor/ceiling rate was in effect at November 30, 2024. |
| (d) | Coupon rate adjusts periodically based upon a predetermined schedule. Stated interest rate in effect at November 30, 2024. |
| (e) | Non-income producing security. |
| | |
| |
32 | AB SHORT DURATION HIGH YIELD ETF | | abfunds.com |
PORTFOLIO OF INVESTMENTS (continued)
| (g) | Security in which significant unobservable inputs (Level 3) were used in determining fair value. |
| (h) | Securities are perpetual and, thus, do not have a predetermined maturity date. The date shown, if applicable, reflects the next call date. |
| (i) | Defaulted matured security. |
| (j) | Fair valued by the Adviser. |
| (k) | Security is exempt from registration under Rule 144A or Regulation S of the Securities Act of 1933. These securities, which represent 0.00% of net assets as of November 30, 2024, are considered illiquid and restricted. Additional information regarding such securities follows: |
| | | | | | | | | | | | | | | | |
144A/Restricted &
Illiquid Securities | | Acquisition
Date | | | Cost | | | Market
Value | | | Percentage of
Net Assets | |
Virgolino de Oliveira Finance SA
10.50%, 01/28/2018 | |
| 02/13/2013 –
03/15/2013 |
| | $ | 422,049 | | | $ | 42 | | | | 0.00 | % |
| (l) | The stated coupon rate represents the greater of the SOFR or an alternate base rate such as the PRIME or the SOFR/PRIME floor rate plus a spread at November 30, 2024. |
| (m) | This position or a portion of this position represents an unsettled loan purchase. The coupon rate will be determined at the time of settlement and will be based upon the Secured Overnight Financing Rate (“SOFR”) plus a premium which was determined at the time of purchase. |
| (o) | Affiliated investments. |
| (p) | To obtain a copy of the fund’s shareholder report, please go to the Securities and Exchange Commission’s website at www.sec.gov, or call AB at (800) 227-4618. |
| (q) | The rate shown represents the 7-day yield as of period end. |
Currency Abbreviations:
EUR – Euro
GBP – Great British Pound
USD – United States Dollar
Glossary:
ABS – Asset-Backed Securities
BOBL – Bundesobligationen
CBT – Chicago Board of Trade
CLO – Collateralized Loan Obligations
CMBS – Commercial Mortgage-Backed Securities
CME – Chicago Mercantile Exchange
EURIBOR – Euro Interbank Offered Rate
REIT – Real Estate Investment Trust
SOFR – Secured Overnight Financing Rate
See notes to financial statements.
| | |
| |
| abfunds.com | | AB SHORT DURATION HIGH YIELD ETF | 33 |
STATEMENT OF ASSETS & LIABILITIES
November 30, 2024
| | | | |
| Assets | |
Investments in securities, at value | | | | |
Unaffiliated issuers (cost $715,739,618) | | $ | 719,739,139 | |
Affiliated issuers (cost $24,969,785) | | | 24,969,785 | |
Cash | | | 25,908 | |
Cash collateral due from broker | | | 1,155,951 | |
Foreign currencies, at value (cost $1,079,376) | | | 1,071,806 | |
Unaffiliated interest and dividends receivable | | | 11,351,758 | |
Unrealized appreciation on forward currency exchange contracts | | | 712,599 | |
Receivable for investment securities sold | | | 263,474 | |
Affiliated dividends receivable | | | 87,196 | |
| Receivable due from Adviser | | | 3,959 | |
| | | | |
Total assets | | | 759,381,575 | |
| | | | |
| Liabilities | | | | |
Payable for investment securities purchased and foreign
currency transactions | | | 4,520,832 | |
Advisory fee payable | | | 240,214 | |
Payable for variation margin on futures | | | 133,707 | |
Foreign capital gains tax payable | | | 27,240 | |
Other liabilities | | | 108,599 | |
| | | | |
Total liabilities | | | 5,030,592 | |
| | | | |
Net Assets | | $ | 754,350,983 | |
| | | | |
| Composition of Net Assets | | | | |
Capital stock, at par | | $ | 2,105 | |
Additional paid-in capital | | | 779,938,786 | |
Accumulated loss | | | (25,589,908 | ) |
| | | | |
Net Assets | | $ | 754,350,983 | |
| | | | |
Net Asset Value Per Share—500 million shares of capital stock authorized, $.0001 par value (based on 21,045,150 common shares outstanding) | | $ | 35.84 | |
| | | | |
See notes to financial statements.
| | |
| |
34 | AB SHORT DURATION HIGH YIELD ETF | | abfunds.com |
STATEMENT OF OPERATIONS
| | | | | | | | |
| | | For the Period
October 1, 2024 to
November 30,
2024(a) | | | Year Ended
September 30,
2024(b) | |
| Investment Income | | | | | | | | |
Interest | | $ | 7,523,832 | | | $ | 45,067,286 | |
Dividends—Affiliated issuers | | | 174,331 | | | | 1,222,846 | |
Other income | | | – 0 | – | | | 59,923 | |
| | | | | | | | |
Total income | | $ | 7,698,163 | | | $ | 46,350,055 | |
| Expenses | | | | | | | | |
Advisory fee (see Note B) | | | 473,804 | | | | 3,290,341 | |
Distribution fee—Class A | | | – 0 | – | | | 31,434 | |
Distribution fee—Class C | | | – 0 | – | | | 45,777 | |
Distribution fee—Class R | | | – 0 | – | | | 8 | |
Distribution fee—Class K | | | – 0 | – | | | 4 | |
Transfer agency—Class A | | | – 0 | – | | | 7,005 | |
Transfer agency—Class C | | | – 0 | – | | | 2,552 | |
Transfer agency—Advisor Class | | | – 0 | – | | | 351,769 | |
Transfer agency—Class R | | | – 0 | – | | | 1 | |
Transfer agency—Class K | | | – 0 | – | | | 1 | |
Registration fees | | | – 0 | – | | | 98,629 | |
Audit and tax | | | – 0 | – | | | 96,715 | |
Printing | | | – 0 | – | | | 81,376 | |
Administrative | | | – 0 | – | | | 73,480 | |
Legal | | | – 0 | – | | | 69,434 | |
Custody and accounting | | | – 0 | – | | | 43,660 | |
Directors’ fees | | | – 0 | – | | | 20,770 | |
Miscellaneous | | | – 0 | – | | | 14,651 | |
| | | | | | | | |
Total expenses | | | 473,804 | | | | 4,227,607 | |
Less: expenses waived and reimbursed by the Adviser (see Note B) | | | (8,134 | ) | | | (170,937 | ) |
Less: expenses waived and reimbursed by the Adviser (see Note C) | | | – 0 | – | | | (12 | ) |
| | | | | | | | |
Net expenses | | | 465,670 | | | | 4,056,658 | |
| | | | | | | | |
Net investment income | | | 7,232,493 | | | | 42,293,397 | |
| | | | | | | | |
| | |
| |
| abfunds.com | | AB SHORT DURATION HIGH YIELD ETF | 35 |
STATEMENT OF OPERATIONS (continued)
| | | | | | | | |
| | | For the Period
October 1, 2024 to
November 30,
2024(a) | | | Year Ended
September 30,
2024(b) | |
| Realized and Unrealized Gain (Loss) on Investment and Foreign Currency Transactions | | | | | | | | |
Net realized gain (loss) on: | | | | | | | | |
Investment transactions(c) | | $ | 381,151 | | | $ | (19,873 | ) |
In-kind redemptions | | | (1,223 | ) | | | 2,392,539 | |
Forward currency exchange contracts | | | (951 | ) | | | 460,491 | |
Futures | | | 2,374,553 | | | | (1,504,490 | ) |
Options written | | | – 0 | – | | | 29,054 | |
Swaps | | | – 0 | – | | | (57,488 | ) |
Foreign currency transactions | | | 573,731 | | | | (145,983 | ) |
Net change in unrealized appreciation (depreciation) of: | | | | | | | | |
Investments(d) | | | (4,985,044 | ) | | | 34,816,698 | |
Forward currency exchange contracts | | | 1,273,483 | | | | (1,863,183 | ) |
Futures | | | (492,183 | ) | | | (744,064 | ) |
Options written | | | – 0 | – | | | (11,781 | ) |
Swaps | | | – 0 | – | | | 78,643 | |
Foreign currency denominated assets and liabilities | | | (34,649 | ) | | | 41,180 | |
| | | | | | | | |
Net gain on investment and foreign currency transactions | | | (911,132 | ) | | | 33,471,743 | |
| | | | | | | | |
Net Increase in Net Assets from Operations | | $ | 6,321,361 | | | $ | 75,765,140 | |
| | | | | | | | |
| (a) | The Acquired Portfolio had a fiscal year end of September 30. The Fund has a fiscal year end of November 30. |
| (b) | After the close of business on June 7, 2024, AB Short Duration High Yield Portfolio (the “Acquired Portfolio”) was reorganized into AB Short Duration High Yield ETF. The amounts disclosed include those of the Acquired Portfolio. See Note A for additional information on the reorganization. |
| (c) | Net of foreign realized capital gains taxes of $0 and $52, respectively. |
| (d) | Net of increase in accrued foreign capital gains taxes on unrealized gains of $0 and $330, respectively. |
See notes to financial statements.
| | |
| |
36 | AB SHORT DURATION HIGH YIELD ETF | | abfunds.com |
STATEMENT OF CHANGES IN NET ASSETS
| | | | | | | | | | | | |
| | | October 1, 2024 to
November 30,
2024(a) | | | Year Ended
September 30,
2024(b) | | | Year Ended
September 30,
2023 | |
| Increase (Decrease) in Net Assets from Operations | | | | | | | | | | | | |
Net investment income | | $ | 7,232,493 | | | $ | 42,293,397 | | | $ | 23,500,885 | |
Net realized gain (loss) on investment transactions | | | 3,327,261 | | | | 1,154,250 | | | | (16,336,126 | ) |
Net change in unrealized appreciation (depreciation) of investments and foreign currency denominated assets and liabilities | | | (4,238,393 | ) | | | 32,317,493 | | | | 27,891,853 | |
Contributions from Affiliates (see Note B) | | | – 0 | – | | | – 0 | – | | | 278 | |
| | | | | | | | | | | | |
Net increase in net assets from operations | | | 6,321,361 | | | | 75,765,140 | | | | 35,056,890 | |
Distributions to Shareholders | | | | | | | | | | | | |
Class A | | | – 0 | – | | | (780,942 | ) | | | (2,082,249 | ) |
Class C | | | – 0 | – | | | (249,857 | ) | | | (631,218 | ) |
Advisor Class | | | (6,492,042 | ) | | | (37,058,903 | ) | | | (28,535,987 | ) |
Class R | | | – 0 | – | | | (114 | ) | | | (700 | ) |
Class K | | | – 0 | – | | | (114 | ) | | | (701 | ) |
Class I | | | – 0 | – | | | (108 | ) | | | (664 | ) |
| Transactions in Shares of the Fund | | | | | | | | | | | | |
Net increase | | | 95,393,603 | | | | 102,217,126 | | | | 197,503,249 | |
Other capital | | | 5,614 | | | | 5,214 | | | | – 0 | – |
| | | | | | | | | | | | |
Total increase | | | 95,228,536 | | | | 139,897,442 | | | | 201,308,620 | |
| Net Assets | | | | | | | | | | | | |
Beginning of period | | | 659,122,447 | | | | 519,225,005 | | | | 317,916,385 | |
| | | | | | | | | | | | |
End of period | | $ | 754,350,983 | | | $ | 659,122,447 | | | $ | 519,225,005 | |
| | | | | | | | | | | | |
| (a) | The Acquired Portfolio had a fiscal year end of September 30. The Fund has a fiscal year end of November 30. |
| (b) | After the close of business on June 7, 2024, AB Short Duration High Yield Portfolio (the “Acquired Portfolio”) was reorganized into AB Short Duration High Yield ETF. The amounts disclosed include those of the Acquired Portfolio. See Note A for additional information on the reorganization. |
See notes to financial statements.
| | |
| |
| abfunds.com | | AB SHORT DURATION HIGH YIELD ETF | 37 |
NOTES TO FINANCIAL STATEMENTS
November 30, 2024
NOTE A
Significant Accounting Policies
AB Active ETFs, Inc. (the “Corporation”) is registered under the Investment Company Act of 1940 (the “1940 Act”) as an open-end management investment company. The Corporation, which is a Maryland corporation, operates as a series company comprised of 15 portfolios currently in operation. Each fund is considered to be a separate entity for financial reporting and tax purposes. This report relates only to the AB Short Duration High Yield ETF (the “Fund”), a diversified portfolio. The Fund commenced investment operations on June 7, 2024. At meetings held on October 31—November 2, 2023, the Fund’s Board of Directors of AB Bond Fund, Inc. (the “Board”) approved the reorganization of AB Short Duration High Yield Portfolio, a portfolio of AB Bond Fund, Inc. (the “Acquired Portfolio) into the Fund (the “Conversion”), to be managed by AllianceBernstein L.P. (the “Adviser”). Pursuant to an Agreement and Plan of Acquisition and Termination (the “Plan”), the Acquired Portfolio was converted into an ETF, the Fund (the “Acquiring Portfolio”) with the same investment objective, and the same investment policies and investment strategies as the Acquired Portfolio on the closing date of the Conversion, June 7, 2024. In connection with the Conversion, the assets and liabilities of the Acquired Portfolio were transferred to the Acquiring Portfolio, and stockholders of the Acquired Portfolio received shares of the Acquiring Portfolio equal in aggregate net asset value (“NAV”) to the NAV of their shares of the Acquired Portfolio (less cash corresponding to any fractional share amount). The Acquired Portfolio had a fiscal year end of September 30, however the Fund has a fiscal year end of November 30. See Note I for additional information regarding the Conversion. The Acquired Portfolio was the accounting survivor in the Conversion and as such, the financial statements and the financial highlights reflect the financial information of the Acquired Portfolio through June 7, 2024. The financial statements have been prepared in conformity with U.S. generally accepted accounting principles (“U.S. GAAP”), which require management to make certain estimates and assumptions that affect the reported amounts of assets and liabilities in the financial statements and amounts of income and expenses during the reporting period. Actual results could differ from those estimates. The Fund is an investment company under U.S. GAAP and follows the accounting and reporting guidance applicable to investment companies. The following is a summary of significant accounting policies followed by the Fund.
1. Security Valuation
Portfolio securities are valued at market value determined on the basis of market quotations or, if market quotations are not readily available or are unreliable, at “fair value” as determined in accordance with procedures approved by and under the oversight of the Fund’s Board of Directors (the “Board”). Pursuant to these procedures, the Adviser serves as the Fund’s
| | |
| |
38 | AB SHORT DURATION HIGH YIELD ETF | | abfunds.com |
NOTES TO FINANCIAL STATEMENTS (continued)
valuation designee pursuant to Rule 2a-5 of the 1940 Act. In this capacity, the Adviser is responsible, among other things, for making all fair value determinations relating to the Fund’s portfolio investments, subject to the Board’s oversight.
In general, the market values of securities which are readily available and deemed reliable are determined as follows: securities listed on a national securities exchange (other than securities listed on the NASDAQ Stock Market, Inc. (“NASDAQ”)) or on a foreign securities exchange are valued at the last sale price at the close of the exchange or foreign securities exchange. If there has been no sale on such day, the securities are valued at the last traded price from the previous day. Securities listed on more than one exchange are valued by reference to the principal exchange on which the securities are traded; securities listed only on NASDAQ are valued in accordance with the NASDAQ Official Closing Price; listed or over the counter (“OTC”) market put or call options are valued at the mid level between the current bid and ask prices. If either a current bid or current ask price is unavailable, the Adviser will have discretion to determine the best valuation (e.g., last trade price in the case of listed options); open futures are valued using the closing settlement price or, in the absence of such a price, the most recent quoted bid price. If there are no quotations available for the day of valuation, the last available closing settlement price is used; U.S. Government securities and any other debt instruments having 60 days or less remaining until maturity are generally valued at market by an independent pricing vendor, if a market price is available. If a market price is not available, the securities are valued at amortized cost. This methodology is commonly used for short term securities that have an original maturity of 60 days or less, as well as short term securities that had an original term to maturity that exceeded 60 days. In instances when amortized cost is utilized, the Valuation Committee (the “Committee”) must reasonably conclude that the utilization of amortized cost is approximately the same as the fair value of the security. Factors the Committee will consider include, but are not limited to, an impairment of the creditworthiness of the issuer or material changes in interest rates. Fixed-income securities, including mortgage-backed and asset-backed securities, may be valued on the basis of prices provided by a pricing service or at a price obtained from one or more of the major broker-dealers. In cases where broker-dealer quotes are obtained, the Adviser may establish procedures whereby changes in market yields or spreads are used to adjust, on a daily basis, a recently obtained quoted price on a security. Swaps and other derivatives are valued daily, primarily using independent pricing services, independent pricing models using market inputs, as well as third party broker-dealers or counterparties. Open-end mutual funds are valued at the closing net asset value per share, while exchange-traded funds are valued at the closing market price per share.
| | |
| |
| abfunds.com | | AB SHORT DURATION HIGH YIELD ETF | 39 |
NOTES TO FINANCIAL STATEMENTS (continued)
Securities for which market quotations are not readily available (including restricted securities) or are deemed unreliable are valued at fair value as deemed appropriate by the Adviser. Factors considered in making this determination may include, but are not limited to, information obtained by contacting the issuer, analysts, analysis of the issuer’s financial statements or other available documents. In addition, the Fund may use fair value pricing for securities primarily traded in non-U.S. markets because most foreign markets close well before the Fund values its securities at 4:00 p.m., Eastern Time. The earlier close of these foreign markets gives rise to the possibility that significant events may have occurred in the interim and may materially affect the value of those securities. To account for this, the Fund may value foreign equity securities using fair value prices at the discretion of the Adviser.
2. Fair Value Measurements
In accordance with U.S. GAAP regarding fair value measurements, fair value is defined as the price that the Fund would receive to sell an asset or pay to transfer a liability in an orderly transaction between market participants at the measurement date. U.S. GAAP establishes a framework for measuring fair value, and a three-level hierarchy for fair value measurements based upon the transparency of inputs to the valuation of an asset or liability (including those valued based on their market values as described in Note A.1 above). Inputs may be observable or unobservable and refer broadly to the assumptions that market participants would use in pricing the asset or liability. Observable inputs reflect the assumptions market participants would use in pricing the asset or liability based on market data obtained from sources independent of the Fund. Unobservable inputs reflect the Fund’s own assumptions about the assumptions that market participants would use in pricing the asset or liability based on the best information available in the circumstances. Each investment is assigned a level based upon the observability of the inputs which are significant to the overall valuation. The three-tier hierarchy of inputs is summarized below.
| | • | | Level 1—quoted prices in active markets for identical investments |
| | • | | Level 2—other significant observable inputs (including quoted prices for similar investments, interest rates, prepayment speeds, credit risk, etc.) |
| | • | | Level 3—significant unobservable inputs (including the Fund’s own assumptions in determining the fair value of investments) |
The fair value of debt instruments, such as bonds, and over-the-counter derivatives is generally based on market price quotations, recently executed market transactions (where observable) or industry recognized modeling techniques and are generally classified as Level 2. Pricing vendor inputs to
| | |
| |
40 | AB SHORT DURATION HIGH YIELD ETF | | abfunds.com |
NOTES TO FINANCIAL STATEMENTS (continued)
Level 2 valuations may include quoted prices for similar investments in active markets, interest rate curves, coupon rates, currency rates, yield curves, option adjusted spreads, default rates, credit spreads and other unique security features in order to estimate the relevant cash flows which are then discounted to calculate fair values. If these inputs are unobservable and significant to the fair value, these investments will be classified as Level 3.
Where readily available market prices or relevant bid prices are not available for certain equity investments, such investments may be valued based on similar publicly traded investments, movements in relevant indices since last available prices or based upon underlying company fundamentals and comparable company data (such as multiples to earnings or other multiples to equity). Where an investment is valued using an observable input, such as another publicly traded security, the investment will be classified as Level 2. If management determines that an adjustment is appropriate based on restrictions on resale, illiquidity or uncertainty, and such adjustment is a significant component of the valuation, the investment will be classified as Level 3. An investment will also be classified as Level 3 where management uses company fundamentals and other significant inputs to determine the valuation.
Valuations of mortgage-backed or other asset-backed securities, by pricing vendors, are based on both proprietary and industry recognized models and discounted cash flow techniques. Significant inputs to the valuation of these instruments are value of the collateral, the rates and timing of delinquencies, the rates and timing of prepayments, and default and loss expectations, which are driven in part by housing prices for residential mortgages. Significant inputs are determined based on relative value analyses, which incorporate comparisons to instruments with similar collateral and risk profiles, including relevant indices. Mortgage and asset-backed securities for which management has collected current observable data through pricing services are generally categorized within Level 2. Those investments for which current observable data has not been provided are classified as Level 3.
Bank loan prices are provided by third party pricing services and consist of a composite of the quotes received by the vendor into a consensus price. Certain bank loans are classified as Level 3, as a significant input used in the fair value measurement of these instruments is the market quotes that are received by the vendor and these inputs are not observable.
Other fixed income investments, including non-U.S. government and corporate debt, are generally valued using quoted market prices, if available, which are typically impacted by current interest rates, maturity dates and
| | |
| |
| abfunds.com | | AB SHORT DURATION HIGH YIELD ETF | 41 |
NOTES TO FINANCIAL STATEMENTS (continued)
any perceived credit risk of the issuer. Additionally, in the absence of quoted market prices, these inputs are used by pricing vendors to derive a valuation based upon industry or proprietary models which incorporate issuer specific data with relevant yield/spread comparisons with more widely quoted bonds with similar key characteristics. Those investments for which there are observable inputs are classified as Level 2. Where the inputs are not observable, the investments are classified as Level 3.
The following table summarizes the valuation of the Fund’s investments by the above fair value hierarchy levels as of November 30, 2024:
| | | | | | | | | | | | | | | | |
Investments in
Securities: | | Level 1 | | | Level 2 | | | Level 3 | | | Total | |
Assets: | | | | | | | | | | | | | | | | |
Corporates – Non-Investment Grade | | $ | – 0 | – | | $ | 557,569,520 | | | $ | 1,078,526 | | | $ | 558,648,046 | |
Corporates – Investment Grade | | | – 0 | – | | | 113,264,908 | | | | – 0 | – | | | 113,264,908 | |
Emerging Markets – Corporate Bonds | | | – 0 | – | | | 20,840,880 | | | | 42 | | | | 20,840,922 | |
Bank Loans | | | – 0 | – | | | 12,235,380 | | | | 2,014,358 | | | | 14,249,738 | |
Emerging Markets – Sovereigns | | | – 0 | – | | | 5,714,419 | | | | – 0 | – | | | 5,714,419 | |
Collateralized Loan Obligations | | | – 0 | – | | | 3,038,548 | | | | – 0 | – | | | 3,038,548 | |
Quasi-Sovereigns | | | – 0 | – | | | 2,286,767 | | | | – 0 | – | | | 2,286,767 | |
Commercial Mortgage-Backed Securities | | | – 0 | – | | | 1,402,768 | | | | – 0 | – | | | 1,402,768 | |
Collateralized Mortgage Obligations | | | – 0 | – | | | 157,199 | | | | – 0 | – | | | 157,199 | |
Common Stocks | | | – 0 | – | | | – 0 | – | | | 112,500 | | | | 112,500 | |
Asset-Backed Securities | | | – 0 | – | | | – 0 | – | | | 23,324 | | | | 23,324 | |
Short-Term Investments | | | 24,969,785 | | | | – 0 | – | | | – 0 | – | | | 24,969,785 | |
| | | | | | | | | | | | | | | | |
Total Investments in Securities | | | 24,969,785 | | | | 716,510,389 | | | | 3,228,750 | | | | 744,708,924 | |
Other Financial Instruments(a): | | | | | | | | | | | | | | | | |
Assets: | | | | | | | | | | | | | | | | |
Forward Currency Exchange Contracts | | | – 0 | – | | | 712,599 | | | | – 0 | – | | | 712,599 | |
Liabilities: | | | | | | | | | | | | | | | | |
Futures | | | (660,151 | ) | | | – 0 | – | | | – 0 | – | | | (660,151 | )(b) |
| | | | | | | | | | | | | | | | |
Total | | $ | 24,309,634 | | | $ | 717,222,988 | | | $ | 3,228,750 | | | $ | 744,761,372 | |
| | | | | | | | | | | | | | | | |
| (a) | Other financial instruments include derivative instruments, such as futures, forwards and swaps. Derivative instruments are valued at the unrealized appreciation (depreciation) on the instrument. Other financial instruments may also include swaps with upfront premiums, written options and written swaptions which are valued at market value. |
| | |
| |
42 | AB SHORT DURATION HIGH YIELD ETF | | abfunds.com |
NOTES TO FINANCIAL STATEMENTS (continued)
| (b) | Only variation margin receivable (payable) at period end is reported within the statement of assets and liabilities. This amount reflects cumulative unrealized appreciation (depreciation) on futures and centrally cleared swaps as reported in the portfolio of investments. Where applicable, centrally cleared swaps with upfront premiums are presented here at market value. |
3. Currency Translation
Assets and liabilities denominated in foreign currencies and commitments under forward currency exchange contracts are translated into U.S. dollars at the mean of the quoted bid and ask prices of such currencies against the U.S. dollar. Purchases and sales of portfolio securities are translated into U.S. dollars at the rates of exchange prevailing when such securities were acquired or sold. Income and expenses are translated into U.S. dollars at rates of exchange prevailing when accrued.
Net realized gain or loss on foreign currency transactions represents foreign exchange gains and losses from sales and maturities of foreign fixed income investments, holding of foreign currencies, currency gains or losses realized between the trade and settlement dates on foreign investment transactions, and the difference between the amounts of dividends, interest and foreign withholding taxes recorded on the Fund’s books and the U.S. dollar equivalent amounts actually received or paid. Net unrealized currency gains and losses from valuing foreign currency denominated assets and liabilities at period end exchange rates are reflected as a component of net unrealized appreciation or depreciation of foreign currency denominated assets and liabilities.
4. Taxes
It is Fund’s policy to meet the requirements of the Internal Revenue Code applicable to regulated investment companies and to distribute all of its investment company taxable income and net realized gains, if any, to shareholders. Therefore, no provisions for federal income or excise taxes are required. The Fund may be subject to taxes imposed by countries in which it invests. Such taxes are generally based on income and/or capital gains earned or repatriated. Taxes are accrued and applied to net investment income, net realized gains and net unrealized appreciation/depreciation as such income and/or gains are earned.
In accordance with U.S. GAAP requirements regarding accounting for uncertainties in income taxes, management has analyzed the Fund’s tax positions taken or expected to be taken on federal and state income tax returns for all open tax years (the current and the prior three tax years) and has concluded that no provision for income tax is required in the Fund’s financial statements.
| | |
| |
| abfunds.com | | AB SHORT DURATION HIGH YIELD ETF | 43 |
NOTES TO FINANCIAL STATEMENTS (continued)
5. Investment Income and Investment Transactions
Dividend income is recorded on the ex-dividend date or as soon as the Fund is informed of the dividend. Interest income is accrued daily. Investment transactions are accounted for on the date the securities are purchased or sold. Investment gains or losses are determined on the identified cost basis. Non-cash dividends, if any, are recorded on the ex-dividend date at the fair value of the securities received. The Fund amortizes premiums and accretes discounts as adjustments to interest income.
The Fund accounts for distributions received from real estate investment trust (“REIT”) investments or from regulated investment companies as dividend income, realized gain, or return of capital based on information provided by the REIT or the investment company.
6. Class Allocations
Prior to the Conversion, all income earned and expenses incurred by the Acquired Portfolio were borne on a pro-rata basis by each settled class of shares, based on the proportionate interest in the Acquired Portfolio represented by the net assets of such class, except for class specific expenses which are allocated to the respective class. Expenses of AB Bond Fund, Inc. were charged proportionately to each portfolio or based on other appropriate methods. Realized and unrealized gains and losses were allocated among the various share classes based on respective net assets.
7. Dividends and Distributions
Dividends and distributions to shareholders, if any, are recorded on the ex-dividend date. Income dividends and capital gains distributions are determined in accordance with federal tax regulations and may differ from those determined in accordance with U.S. GAAP. To the extent these differences are permanent, such amounts are reclassified within the capital accounts based on their federal tax basis treatment; temporary differences do not require such reclassification.
8. Cash and Short-Term Investments
Cash and short-term investments include cash on hand and short-term investments with maturities of less than one year when purchased.
NOTE B
Advisory Fee and Other Transactions with Affiliates
Under the terms of the investment advisory agreement, the Fund pays the Adviser a unitary advisory fee at an annual rate of .40% of the Fund’s average daily net assets. The fees are accrued daily and paid monthly. Prior to June 7, 2024, the Acquired Portfolio paid the Adviser an advisory fee at an annual rate of .55% of the first $2.5 billion, .50% of the next
| | |
| |
44 | AB SHORT DURATION HIGH YIELD ETF | | abfunds.com |
NOTES TO FINANCIAL STATEMENTS (continued)
$2.5 billion and .45% in excess of $5 billion, of the Fund’s average daily net assets. The fee is accrued daily and paid monthly. The Adviser had agreed to waive its fees and bear certain expenses to the extent necessary to limit total operating expenses (excluding acquired fund fees and expenses other than the advisory fees of any AB mutual funds in which the Fund may invest, interest expense, taxes, extraordinary expenses, and brokerage commissions and other transaction costs), on an annual basis (the “Expense Caps”) to .95%, 1.70%, .70%, 1.20%, .95% and .70% of the daily average net assets for the Class A, Class C, Advisor Class, Class R, Class K and Class I shares, respectively. For the period ended November 30, 2024 and the year ended September 30, 2024, such reimbursements/waivers amounted to $390 and $136,492, respectively.
Prior to June 7, 2024, pursuant to the investment advisory agreement, the Acquired Portfolio reimbursed the Adviser for certain legal and accounting services provided to the Acquired Portfolio by the Adviser. For the year ended September 30, 2024, the reimbursement for such services amounted to $73,480.
Prior to June 7, 2024, the Acquired Portfolio compensated AllianceBernstein Investor Services, Inc. (“ABIS”), a wholly-owned subsidiary of the Adviser, under a Transfer Agency Agreement for providing personnel and facilities to perform transfer agency services for the Acquired Portfolio. ABIS may make payments to intermediaries that provide omnibus account services, sub-accounting services and/or networking services. Such compensation retained by ABIS amounted to $86,885 for the year ended September 30, 2024. Effective June 7, 2024, State Street Bank and Trust Company serves as Transfer Agent for the Fund.
Under the investment advisory agreement, in accordance with the unitary fee structure, the Adviser bears the cost of various third-party services required by the Fund, including audit, custodial, accounting, legal, transfer agency and printing costs and the fees and expenses of the Corporation’s directors and their counsel. Prior to June 7, 2024, these costs were borne by the Fund but subject to the Expense Cap. Also under the investment advisory agreement, the Adviser will reimburse the Fund for the Fund’s share of the acquired funds fees and expenses (advisory fees and other expenses) of any pooled investment vehicle for which the Adviser serves as investment adviser. For the period ended November 30, 2024 and the year ended September 30, 2024, such waiver/reimbursements relating to the Fund’s investment in AB Government Money Market Portfolio amounted to $7,744 and 34,445, respectively.
| | |
| |
| abfunds.com | | AB SHORT DURATION HIGH YIELD ETF | 45 |
NOTES TO FINANCIAL STATEMENTS (continued)
A summary of the Fund’s transactions in AB mutual funds for the period ended November 30, 2024 is as follows:
| | | | | | | | | | | | | | | | | | | | |
Fund | | Market Value
9/30/24
(000) | | | Purchases
at Cost
(000) | | | Sales
Proceeds
(000) | | | Market Value
11/30/24
(000) | | | Dividend
Income
(000) | |
AB Government Money Market Portfolio | | $ | 18,445 | | | $ | 29,440 | | | $ | 22,915 | | | $ | 24,970 | | | $ | 174 | |
A summary of the Fund’s transactions in AB mutual funds for the year ended September 30, 2024 is as follows:
| | | | | | | | | | | | | | | | | | | | |
Fund | | Market Value
9/30/23
(000) | | | Purchases
at Cost
(000) | | | Sales
Proceeds
(000) | | | Market Value
9/30/24
(000) | | | Dividend
Income
(000) | |
AB Government Money Market Portfolio | | $ | 13,941 | | | $ | 329,953 | | | $ | 325,449 | | | $ | 18,445 | | | $ | 1,223 | |
During the year ended September 30, 2023, the Adviser reimbursed the Fund $278 for trading losses incurred due to a trade entry error.
NOTE C
Distribution Services Agreement
Effective June 7, 2024, the Fund has adopted a Distribution and Service Plan (the “Plan”) pursuant to Rule 12b-1 of the Act which permits the Fund to pay distribution and servicing fees not to exceed .25% per year of the Fund’s average daily net assets, provided that the Fund will not make any 12b-1 payments under the Plan without prior Board and stockholder approval. No such fees are currently paid. Prior to the Conversion, the Acquired Portfolio paid distribution and servicing fees to the Distributor at an annual rate of up to .30% of the Fund’s average daily net assets attributable to Class A shares, 1% of the Fund’s average daily net assets attributable to Class C shares, .50% of the Fund’s average daily net assets attributable to Class R shares and .25% of the Fund’s average daily net assets attributable to Class K shares. There are no distribution and servicing fees on the Advisor Class and Class I shares. Payments under the Plan in respect of Class A shares are currently limited to an annual rate of .25% of Class A shares’ average daily net assets. As of September 1, 2021, with respect to Class R and Class K shares, payments to the Distributor are voluntarily being limited to 0% and 0% of the average daily net assets attributable to Class R and Class K shares. For the year ended September 30, 2024, such waivers amounted to $8 and $4, respectively. The fees are accrued daily and paid monthly. For the year ended September 30, 2024, the Agreement provides that the Distributor will use
| | |
| |
46 | AB SHORT DURATION HIGH YIELD ETF | | abfunds.com |
NOTES TO FINANCIAL STATEMENTS (continued)
such payments in their entirety for distribution assistance and promotional activities. Since the commencement of the Fund’s operations, the Distributor has incurred expenses in excess of the distribution costs reimbursed by the Fund in the amounts of $331,629, $0 and $0 for Class C, Class R and Class K shares, respectively. While such costs may be recovered from the Fund in future periods so long as the Agreement is in effect and the share class is active, the rate of the distribution and servicing fees payable under the Agreement may not be increased without a shareholder vote. In accordance with the Agreement, there is no provision for recovery of unreimbursed distribution costs incurred by the Distributor beyond the current fiscal year for Class A shares. The Agreement also provides that the Adviser may use its own resources to finance the distribution of the Fund’s shares.
NOTE D
Investment Transactions
Purchases and sales of investment securities (excluding short-term investments and in-kind purchases and sales) for the period ended November 30, 2024 were as follows:
| | | | | | | | |
| | | Purchases | | | Sales | |
Investment securities (excluding U.S. government securities) | | $ | 35,845,438 | | | $ | 29,496,899 | |
U.S. government securities | | | – 0 | – | | | – 0 | – |
Purchases and sales of investment securities (excluding short-term investments and in-kind purchases and sales) for the year ended September 30, 2024 were as follows:
| | | | | | | | |
| | | Purchases | | | Sales | |
Investment securities (excluding U.S. government securities) | | $ | 388,870,124 | | | $ | 251,131,420 | |
U.S. government securities | | | – 0 | – | | | 51,382 | |
During the period ended November 30, 2024 and the year ended September 30, 2024, the Fund delivered portfolio securities for the redemption of Fund shares (in-kind redemptions). Cash and portfolio securities were transferred for redemptions at fair value. For financial reporting purposes, the Fund recorded net realized gains and losses in connection with each in-kind redemption transaction. For the period ended November 30, 2024, the Fund had in-kind purchases and in-kind sales as follows:
| | | | | | | | |
| | | Purchases | | | Sales | |
In-kind transactions (excluding U.S. government securities) | | $ | 84,637,286 | | | $ | – 0 | – |
U.S. government securities | | | – 0 | – | | | – 0 | – |
| | |
| |
| abfunds.com | | AB SHORT DURATION HIGH YIELD ETF | 47 |
NOTES TO FINANCIAL STATEMENTS (continued)
For the year ended September 30, 2024, the Fund had in-kind purchases and in-kind sales as follows:
| | | | | | | | |
| | | Purchases | | | Sales | |
In-kind transactions | | | | | | | | |
Investment securities (excluding U.S. government securities) | | $ | 37,928,238 | | | $ | 76,070,317 | |
U.S. government securities | | | – 0 | – | | | – 0 | – |
The cost of investments for federal income tax purposes, gross unrealized appreciation and unrealized depreciation are as follows:
| | | | |
Cost | | $ | 740,933,291 | |
| | | | |
Gross unrealized appreciation | | $ | 15,332,190 | |
Gross unrealized depreciation | | | (11,556,557 | ) |
| | | | |
Net unrealized appreciation | | $ | 3,775,633 | |
| | | | |
1. Derivative Financial Instruments
The Fund may use derivatives in an effort to earn income and enhance returns, to replace more traditional direct investments, to obtain exposure to otherwise inaccessible markets (collectively, “investment purposes”), or to hedge or adjust the risk profile of its portfolio.
The principal types of derivatives utilized by the Fund, as well as the methods in which they may be used are:
Fund may buy or sell futures for investment purposes or for the purpose of hedging its portfolio against adverse effects of potential movements in the market. Fund bears the market risk that arises from changes in the value of these instruments and the imperfect correlation between movements in the price of the futures and movements in the price of the assets, reference rates or indices which they are designed to track. Among other things, the Fund may purchase or sell futures for foreign currencies or options thereon for non-hedging purposes as a means of making direct investment in foreign currencies, as described below under “Currency Transactions”.
At the time Fund enters into futures, Fund deposits with the broker or segregates at its custodian cash or securities as collateral to satisfy initial margin requirements set by the exchange on which the transaction is effected. Pursuant to the contract, with respect to cash collateral, the Fund agrees to receive from or pay to the broker an amount of cash equal to the daily fluctuation in the value of the contract; in the case of securities collateral, the Fund agrees to adjust the securities position held in the segregated account accordingly.
| | |
| |
48 | AB SHORT DURATION HIGH YIELD ETF | | abfunds.com |
NOTES TO FINANCIAL STATEMENTS (continued)
Such receipts, payments or adjustments are known as variation margin and are recorded by the Fund as unrealized gains or losses. Risks may arise from the potential inability of a counterparty to meet the terms of the contract. The credit/counterparty risk for exchange-traded futures is generally less than privately negotiated futures, since the clearinghouse, which is the issuer or counterparty to each exchange-traded future, has robust risk mitigation standards, including the requirement to provide initial and variation margin. When the contract is closed, the Fund records a realized gain or loss equal to the difference between the value of the contract at the time it was opened and the time it was closed.
Use of long futures subjects the Fund to risk of loss in excess of the amounts shown on the statement of assets and liabilities, up to the notional value of the futures. Use of short futures subjects the Fund to unlimited risk of loss. Under some circumstances, futures exchanges may establish daily limits on the amount that the price of futures can vary from the previous day’s settlement price, which could effectively prevent liquidation of unfavorable positions.
During the period ended November 30, 2024, the Fund held futures for hedging purposes. During the year ended September 30, 2024, the Fund held futures for hedging purposes.
| | • | | Forward Currency Exchange Contracts |
The Fund may enter into forward currency exchange contracts in order to hedge its exposure to changes in foreign currency exchange rates on its foreign portfolio holdings, to hedge certain firm purchase and sale commitments denominated in foreign currencies and for non-hedging purposes as a means of making direct investments in foreign currencies, as described below under “Currency Transactions”.
A forward currency exchange contract is a commitment to purchase or sell a foreign currency at a future date at a negotiated forward rate. The gain or loss arising from the difference between the original contract and the closing of such contract would be included in net realized gain or loss on forward currency exchange contracts. Fluctuations in the value of open forward currency exchange contracts are recorded for financial reporting purposes as unrealized appreciation and/or depreciation by the Fund. Risks may arise from the potential inability of a counterparty to meet the terms of a contract and from unanticipated movements in the value of a foreign currency relative to the U.S. dollar.
During the period ended November 30, 2024, the Fund held forward currency exchange contracts for hedging purposes. During the year
| | |
| |
| abfunds.com | | AB SHORT DURATION HIGH YIELD ETF | 49 |
NOTES TO FINANCIAL STATEMENTS (continued)
ended September 30, 2024, the Fund held forward currency exchange contracts for hedging purposes.
For hedging and investment purposes, the Fund may purchase and write (sell) put and call options on U.S. and foreign securities, including government securities, and foreign currencies that are traded on U.S. and foreign securities exchanges and over-the-counter markets. Among other things, the Fund may use options transactions for non-hedging purposes as a means of making direct investments in foreign currencies, as described below under “Currency Transactions” and may use options strategies involving the purchase and/or writing of various combinations of call and/or put options, for hedging and investment purposes.
The risk associated with purchasing an option is that the Fund pays a premium whether or not the option is exercised. Additionally, the Fund bears the risk of loss of the premium and change in market value should the counterparty not perform under the contract. If a put or call purchased option by the Fund were permitted to expire without being sold or exercised, its premium would represent a loss to the Fund. Put and call purchased options are accounted for in the same manner as portfolio securities. The cost of securities acquired through the exercise of call options is increased by premiums paid. The proceeds from securities sold through the exercise of put options are decreased by the premiums paid.
When the Fund writes an option, the premium received by the Fund is recorded as a liability and is subsequently adjusted to the current market value of the written option. The Fund’s maximum payment for written put options equates to the number of shares multiplied by the strike price. In certain circumstances maximum payout amounts may be partially offset by recovery values of the respective referenced assets and upfront premium received upon entering into the contract. Premiums received from written options which expire unexercised are recorded by the Fund on the expiration date as realized gains from written options. The difference between the premium received and the amount paid on effecting a closing purchase transaction, including brokerage commissions, is also treated as a realized gain, or if the premium received is less than the amount paid for the closing purchase transaction, as a realized loss. If a call option is exercised, the premium received is added to the proceeds from the sale of the underlying security or currency in determining whether the Fund has realized a gain or loss. If a put option is exercised, the premium received reduces the cost basis of the security or currency purchased by the Fund. In writing an option, the Fund bears the market risk of an
| | |
| |
50 | AB SHORT DURATION HIGH YIELD ETF | | abfunds.com |
NOTES TO FINANCIAL STATEMENTS (continued)
unfavorable change in the price of the security or currency underlying the written option. Exercise of the written option by the Fund could result in the Fund selling or buying a security or currency at a price different from the current market value.
During the year ended September 30, 2024, the Fund held purchased options for hedging purposes.
During the year ended September 30, 2024, the Fund held written options for hedging purposes.
The Fund may enter into swaps for investment purposes or to hedge its exposure to interest rates, credit risk, equity markets or currencies. The Fund may also enter into swaps for non-hedging purposes as a means of gaining market exposures, making direct investments in foreign currencies, as described below under “Currency Transactions” or in order to take a “long” or “short” position with respect to an underlying referenced asset described below under “Total Return Swaps”. A swap is an agreement that obligates two parties to exchange a series of cash flows at specified intervals based upon or calculated by reference to changes in specified prices, rates or indexes for a specified amount of an underlying asset or inflation. The payment flows are usually netted against each other, with the difference being paid by one party to the other. In addition, collateral may be pledged or received by the Fund in accordance with the terms of the respective swaps to provide value and recourse to the Fund or its counterparties in the event of default, bankruptcy or insolvency by one of the parties to the swap.
Risks may arise as a result of the failure of the counterparty to the swap to comply with the terms of the swap. The loss incurred by the failure of a counterparty is generally limited to the net interim payment to be received by the Fund, and/or the termination value at the end of the contract. Therefore, the Fund considers the creditworthiness of each counterparty to a swap in evaluating potential counterparty risk. This risk is mitigated by having a netting arrangement between the Fund and the counterparty and by the posting of collateral by the counterparty to the Fund to cover the Fund’s exposure to the counterparty. Additionally, risks may arise from unanticipated movements in interest rates, inflation or in the value of the underlying securities. The Fund accrues for the interim payments on swaps on a daily basis, with the net amount recorded within unrealized appreciation/(depreciation) of swaps on the statement of assets and liabilities, where applicable. Once the interim payments are settled in cash, the net amount is recorded as realized gain/(loss) on swaps on the statement of operations, in addition to any realized gain/(loss)
| | |
| |
| abfunds.com | | AB SHORT DURATION HIGH YIELD ETF | 51 |
NOTES TO FINANCIAL STATEMENTS (continued)
recorded upon the termination of swaps. Upfront premiums paid or received for swaps are recognized as cost or proceeds on the statement of assets and liabilities and are amortized on a straight line basis over the life of the contract. Amortized upfront premiums are included in net realized gain/(loss) from swaps on the statement of operations. Fluctuations in the value of swaps are recorded as a component of net change in unrealized appreciation/depreciation of swaps on the statement of operations.
Certain standardized swaps, including certain interest rate swaps and credit default swaps, are subject to mandatory central clearing. Cleared swaps are transacted through futures commission merchants (“FCMs”) that are members of central clearinghouses, with the clearinghouse serving as central counterparty, similar to transactions in futures contracts. Centralized clearing will be required for additional categories of swaps on a phased-in basis based on requirements published by the Securities and Exchange Commission and Commodity Futures Trading Commission.
At the time the Fund enters into a centrally cleared swap, Fund deposits with the broker or segregates at its custodian cash or securities as collateral to satisfy initial margin requirements set by the clearinghouse on which the transaction is effected. Pursuant to the contract, with respect to cash collateral, the Fund agrees to receive from or pay to the broker an amount of cash equal to the daily fluctuation in the value of the contract; in the case of securities collateral, the Fund agrees to adjust the securities position held in the segregated account accordingly. Such receipts, payments or adjustments are known as variation margin and are recorded by the Fund as unrealized gains or losses. Risks may arise from the potential inability of a counterparty to meet the terms of the contract. The credit/counterparty risk for centrally cleared swaps is generally less than non-centrally cleared swaps, since the clearinghouse, which is the issuer or counterparty to each centrally cleared swap, has robust risk mitigation standards, including the requirement to provide initial and variation margin. When the contract is closed, the Fund records a realized gain or loss equal to the difference between the value of the contract at the time it was opened and the time it was closed.
Credit Default Swaps:
The Fund may enter into credit default swaps, including to manage its exposure to the market or certain sectors of the market, to reduce its risk exposure to defaults by corporate and sovereign issuers held by the Fund, or to create exposure to corporate or sovereign issuers to which it is not otherwise exposed. The Fund may purchase credit protection (“Buy Contract”) or provide credit protection (“Sale
| | |
| |
52 | AB SHORT DURATION HIGH YIELD ETF | | abfunds.com |
NOTES TO FINANCIAL STATEMENTS (continued)
Contract”) on the referenced obligation of the credit default swap. During the term of the swap, the Fund receives/(pays) fixed payments from/(to) the respective counterparty, calculated at the agreed upon rate applied to the notional amount. If the Fund is a buyer/(seller) of protection and a credit event occurs, as defined under the terms of the swap, the Fund will either (i) receive from the seller/(pay to the buyer) of protection an amount equal to the notional amount of the swap (the “Maximum Payout Amount”) and deliver/(take delivery of) the referenced obligation or (ii) receive/(pay) a net settlement amount in the form of cash or securities equal to the notional amount of the swap less the recovery value of the referenced obligation. In certain circumstances Maximum Payout Amounts may be partially offset by recovery values of the respective referenced obligations, upfront premium received upon entering into the agreement, or net amounts received from settlement of buy protection credit default swaps entered into by the Fund for the same referenced obligations with the same counterparty.
Credit default swaps may involve greater risks than if the Fund had invested in the referenced obligation directly. Credit default swaps are subject to general market risk, liquidity risk, counterparty risk and credit risk. If the Fund is a buyer of protection and no credit event occurs, it will lose the payments it made to its counterparty. If the Fund is a seller of protection and a credit event occurs, the value of the referenced obligation received by the Fund coupled with the periodic payments previously received, may be less than the Maximum Payout Amount it pays to the buyer, resulting in a net loss to the Fund.
Implied credit spreads over U.S. Treasuries of comparable maturity utilized in determining the market value of credit default swaps on issuers as of period end are disclosed in the portfolio of investments. The implied spreads serve as an indicator of the current status of the payment/performance risk and typically reflect the likelihood of default by the issuer of the referenced obligation. The implied credit spread of a particular reference obligation also reflects the cost of buying/selling protection and may reflect upfront payments required to be made to enter into the agreement. Widening credit spreads typically represent a deterioration of the referenced obligation’s credit soundness and greater likelihood of default or other credit event occurring as defined under the terms of the agreement. A credit spread identified as “Defaulted” indicates a credit event has occurred for the referenced obligation.
During the year ended September 30, 2024, the Fund held credit default swaps for hedging and non-hedging purposes.
| | |
| |
| abfunds.com | | AB SHORT DURATION HIGH YIELD ETF | 53 |
NOTES TO FINANCIAL STATEMENTS (continued)
The Fund typically enters into International Swaps and Derivatives Association, Inc. Master Agreements (“ISDA Master Agreement”) with its OTC derivative contract counterparties in order to, among other things, reduce its credit risk to OTC counterparties. ISDA Master Agreements include provisions for general obligations, representations, collateral and events of default or termination. Under an ISDA Master Agreement, the Fund typically may offset with the OTC counterparty certain derivative financial instruments’ payables and/or receivables with collateral held and/or posted and create one single net payment (close-out netting) in the event of default or termination. In the event of a default by an OTC counterparty, the return of collateral with market value in excess of the Fund’s net liability, held by the defaulting party, may be delayed or denied.
The Fund’s ISDA Master Agreements may contain provisions for early termination of OTC derivative transactions in the event the net assets of the Fund decline below specific levels (“net asset contingent features”). If these levels are triggered, the Fund’s OTC counterparty has the right to terminate such transaction and require the Fund to pay or receive a settlement amount in connection with the terminated transaction. If OTC derivatives were held at period end, please refer to netting arrangements by the OTC counterparty table below for additional details.
During the period ended November 30, 2024, the Fund had entered into the following derivatives:
| | | | | | | | | | | | |
| | | Asset Derivatives | | | Liability Derivatives | |
Derivative Type | | Statement of
Assets and
Liabilities
Location | | Fair Value | | | Statement of
Assets and
Liabilities
Location | | Fair Value | |
Interest rate contracts | | | | | | | | Payable for variation margin on futures | | $ | 660,151 | * |
| | | | |
Foreign currency contracts | | Unrealized appreciation on forward currency exchange contracts | | $ | 712,599 | | | | | | | |
| | | | | | | | | | | | |
Total | | | | $ | 712,599 | | | | | $ | 660,151 | |
| | | | | | | | | | | | |
| * | Only variation margin receivable/payable at period end is reported within the statement of assets and liabilities. This amount reflects cumulative unrealized appreciation (depreciation) on futures and centrally cleared swaps as reported in the portfolio of investments. |
| | |
| |
54 | AB SHORT DURATION HIGH YIELD ETF | | abfunds.com |
NOTES TO FINANCIAL STATEMENTS (continued)
| | | | | | | | | | |
Derivative Type | | Location of Gain or (Loss) on Derivatives Within Statement of Operations for the Period October 1, 2024 to November 30, 2024 | | Realized Gain
or (Loss) on
Derivatives | | | Change in
Unrealized
Appreciation or
(Depreciation) | |
Interest rate contracts | | Net realized gain (loss) on futures; Net change in unrealized appreciation (depreciation) of futures | | $ | 2,374,553 | | | $ | (492,183 | ) |
| | | |
Foreign currency contracts | | Net realized gain (loss) on forward currency exchange contracts; Net change in unrealized appreciation (depreciation) of forward currency exchange contracts | | | (951 | ) | | | 1,273,483 | |
| | | | | | | | | | |
Total | | | | $ | 2,373,602 | | | $ | 781,300 | |
| | | | | | | | | | |
| | | | | | | | | | |
Derivative Type | | Location of Gain or (Loss) on Derivatives Within Statement of Operations for the Year Ended September 30, 2024 | | Realized Gain
or (Loss) on
Derivatives | | | Change in
Unrealized
Appreciation or
(Depreciation) | |
Interest rate contracts | | Net realized gain (loss) on futures; Net change in unrealized appreciation (depreciation) of futures | | $ | (1,504,490 | ) | | $ | (744,064 | ) |
| | | |
Foreign currency contracts | | Net realized gain (loss) on forward currency exchange contracts; Net change in unrealized appreciation (depreciation) of forward currency exchange contracts | | | 460,491 | | | | (1,863,183 | ) |
| | | |
Equity contracts | | Net realized gain (loss) on investment transactions; Net change in unrealized appreciation (depreciation) of investments | | | 109,785 | | | | (89,310 | ) |
| | |
| |
| abfunds.com | | AB SHORT DURATION HIGH YIELD ETF | 55 |
NOTES TO FINANCIAL STATEMENTS (continued)
| | | | | | | | | | |
Derivative Type | | Location of Gain or (Loss) on Derivatives Within Statement of Operations for the Year Ended September 30, 2024 | | Realized Gain
or (Loss) on
Derivatives | | | Change in
Unrealized
Appreciation or
(Depreciation) | |
| | | |
Equity contracts | | Net realized gain (loss) on options written; Net change in unrealized appreciation (depreciation) of options written | | $ | 29,054 | | | $ | (11,781 | ) |
| | | |
Credit contracts | | Net realized gain (loss) on swaps; Net change in unrealized appreciation (depreciation) of swaps | | | (57,488 | ) | | | 78,643 | |
| | | | | | | | | | |
Total | | | | $ | (962,648 | ) | | $ | (2,629,695 | ) |
| | | | | | | | | | |
The following table represents the average monthly volume of the Fund’s derivative transactions during the period ended November 30, 2024:
| | | | |
Futures: | | | | |
Average notional amount of sale contracts | | $ | 74,257,098 | |
Forward Currency Exchange Contracts: | | | | |
Average principal amount of buy contracts | | $ | 830,325 | (a) |
Average principal amount of sale contracts | | $ | 32,315,179 | |
| (a) | Positions were open for one month during the period. |
The following table represents the average monthly volume of the Fund’s derivative transactions during the year ended September 30, 2024:
| | | | |
Futures: | | | | |
Average notional amount of sale contracts | | $ | 67,096,262 | |
Forward Currency Exchange Contracts: | | | | |
Average principal amount of buy contracts | | $ | 1,410,555 | |
Average principal amount of sale contracts | | $ | 33,909,603 | |
Purchased Options: | | | | |
Average notional amount | | $ | 13,504,000 | (a) |
Options Written: | | | | |
Average notional amount | | $ | 12,736,000 | (a) |
Credit Default Swaps: | | | | |
Average notional amount of sale contracts | | $ | 843,032 | (b) |
| (a) | Positions were open for one month during the period. |
| (b) | Positions were open for two months during the period. |
For financial reporting purposes, the Fund does not offset derivative assets and derivative liabilities that are subject to netting arrangements in the statement of assets and liabilities.
| | |
| |
56 | AB SHORT DURATION HIGH YIELD ETF | | abfunds.com |
NOTES TO FINANCIAL STATEMENTS (continued)
All OTC derivatives held at period end were subject to netting arrangements. The following table presents the Fund’s derivative assets and liabilities by OTC counterparty net of amounts available for offset under ISDA Master Agreements (“MA”) and net of the related collateral received/pledged by the Fund as of November 30, 2024. Exchange-traded derivatives and centrally cleared swaps are not subject to netting arrangements and as such are excluded from the table.
| | | | | | | | | | | | | | | | | | | | |
Counterparty | | Derivative
Assets
Subject to a
MA | | | Derivatives
Available
for Offset | | | Cash
Collateral
Received* | | | Security
Collateral
Received* | | | Net Amount
of Derivative
Assets | |
NatWest Markets PLC | | $ | 663,117 | | | $ | – 0 | – | | $ | – 0 | – | | $ | – 0 | – | | $ | 663,117 | |
State Street Bank & Trust Co. | | | 49,482 | | | | – 0 | – | | | – 0 | – | | | – 0 | – | | | 49,482 | |
| | | | | | | | | | | | | | | | | | | | |
Total | | $ | 712,599 | | | $ | – 0 | – | | $ | – 0 | – | | $ | – 0 | – | | $ | 712,599 | ^ |
| | | | | | | | | | | | | | | | | | | | |
| * | The actual collateral received/pledged may be more than the amount reported due to over-collateralization. |
| ^ | Net amount represents the net receivable/payable that would be due from/to the counterparty in the event of default or termination. The net amount from OTC financial derivative instruments can only be netted across transactions governed under the same master agreement with the same counterparty. |
2. Currency Transactions
The Fund may invest in non-U.S. Dollar-denominated securities on a currency hedged or unhedged basis. The Fund may seek investment opportunities by taking long or short positions in currencies through the use of currency-related derivatives, including forward currency exchange contracts, futures and options on futures, swaps, and other options. The Fund may enter into transactions for investment opportunities when it anticipates that a foreign currency will appreciate or depreciate in value but securities denominated in that currency are not held by the Fund and do not present attractive investment opportunities. Such transactions may also be used when the Adviser believes that it may be more efficient than a direct investment in a foreign currency-denominated security. The Fund may also conduct currency exchange contracts on a spot basis (i.e., for cash at the spot rate prevailing in the currency exchange market for buying or selling currencies).
NOTE E
Shares of the Fund
The Fund’s shares may only be bought and sold in a secondary market through a broker-dealer at a market price. Because ETF shares trade at market prices rather than NAV, shares may trade at a price greater than NAV (a premium) or less than NAV (a discount). The Fund issues and redeems shares at its NAV only in aggregations of a specified number of shares (a creation unit) generally in exchange for a designated portfolio of securities and/or cash (including any portion of such securities for which
| | |
| |
| abfunds.com | | AB SHORT DURATION HIGH YIELD ETF | 57 |
NOTES TO FINANCIAL STATEMENTS (continued)
cash may be substituted). A fixed transaction fee is imposed on authorized participants in connection with creation unit redemption and creation transactions. Authorized participants may be required to pay an additional variable charge to cover certain costs and expenses related to the execution of trades resulting from creation unit transactions. Such variable charges, if any, are included in other capital within the Statement of Changes in Net Assets.
Transactions in shares of the Fund were as follows:
| | | | | | | | | | | | | | | | | | | | | | | | | | | | | | | | |
| | | | | | | | | | | | | | | | | | | | | | | | | | | | | | | | |
| | | Shares | | | | | | Amount | | | | |
| | | Period Ended November 30, 2024(a) | | | Year Ended September 30, 2024(b) | | | Year Ended September 30, 2023 | | | | | | Period Ended November 30, 2024(a) | | | Year Ended September 30, 2024(b) | | | Year Ended September 30, 2023 | | | | |
| | | | | | | | |
| Class A | | | | | | | | | | | | | | | | | | | | | | | | | | | | | | | | |
Shares sold | | | – 0 | – | | | 707,532 | | | | 1,745,790 | | | | | | | $ | – 0 | – | | $ | 6,436,204 | | | $ | 15,622,103 | | | | | |
| | | | | |
Shares issued in reinvestment of dividends | | | – 0 | – | | | 38,351 | | | | 112,400 | | | | | | | | – 0 | – | | | 349,404 | | | | 1,002,920 | | | | | |
| | | | | |
Shares converted from Class C | | | – 0 | – | | | 63,732 | | | | 87,198 | | | | | | | | – 0 | – | | | 575,526 | | | | 779,196 | | | | | |
| | | | | |
Shares converted to Advisor Class | | | – 0 | – | | | (3,191,027 | ) | | | – 0 | – | | | | | | | – 0 | – | | | (29,414,571 | ) | | | – 0 | – | | | | |
| | | | | |
Shares redeemed | | | – 0 | – | | | (393,280 | ) | | | (2,280,772 | ) | | | | | | | – 0 | – | | | (3,575,126 | ) | | | (20,348,516 | ) | | | | |
| | | | | |
Net (decrease) | | | – 0 | – | | | (2,774,692 | ) | | | (335,384 | ) | | | | | | $ | – 0 | – | | $ | (25,628,563 | ) | | $ | (2,944,297 | ) | | | | |
| | | | | |
| | | | | | | | | | | | | | | | | | | | | | | | | | | | | | | | |
| Class C | | | | | | | | | | | | | | | | | | | | | | | | | | | | | | | | |
Shares sold | | | – 0 | – | | | 231,832 | | | | 530,938 | | | | | | | $ | – 0 | – | | $ | 2,102,528 | | | $ | 4,749,628 | | | | | |
| | | | | |
Shares issued in reinvestment of dividends | | | – 0 | – | | | 13,742 | | | | 42,764 | | | | | | | | – 0 | – | | | 124,955 | | | | 381,531 | | | | | |
| | | | | |
Shares converted to Class A | | | – 0 | – | | | (63,747 | ) | | | (87,272 | ) | | | | | | | – 0 | – | | | (575,526 | ) | | | (779,196 | ) | | | | |
| | | | | |
Shares converted to Advisor Class | | | – 0 | – | | | (1,107,946 | ) | | | – 0 | – | | | | | | | – 0 | – | | | (10,205,398 | ) | | | – 0 | – | | | | |
| | | | | |
Shares redeemed | | | – 0 | – | | | (160,292 | ) | | | (239,223 | ) | | | | | | | – 0 | – | | | (1,453,261 | ) | | | (2,138,135 | ) | | | | |
| | | | | |
Net increase (decrease) | | | – 0 | – | | | (1,086,411 | ) | | | 247,207 | | | | | | | $ | – 0 | – | | $ | (10,006,702 | ) | | $ | 2,213,828 | | | | | |
| | | | | |
| | | | | | | | | | | | | | | | | | | | | | | | | | | | | | | | |
| Advisor Class | | | | | | | | | | | | | | | | | | | | | | | | | | | | | | | | |
Shares sold | | | 2,675,000 | | | | 11,073,325 | | | | 10,735,415 | | | | | | | $ | 95,393,603 | | | $ | 384,220,491 | | | $ | 365,010,677 | | | | | |
| | | | | |
Shares issued in reinvestment of dividends | | | – 0 | – | | | 558,390 | | | | 573,794 | | | | | | | | – 0 | – | | | 19,431,978 | | | | 19,486,930 | | | | | |
| | | | | |
Shares converted from Class A | | | – 0 | – | | | 841,923 | | | | – 0 | – | | | | | | | – 0 | – | | | 29,414,571 | | | | – 0 | – | | | | |
| | | | | |
Shares converted from Class C | | | – 0 | – | | | 292,699 | | | | – 0 | – | | | | | | | – 0 | – | | | 10,205,398 | | | | – 0 | – | | | | |
| | | | | |
Shares redeemed | | | – 0 | – | | | (8,741,384 | ) | | | (5,486,020 | ) | | | | | | | – 0 | – | | | (305,393,211 | ) | | | (186,263,889 | ) | | | | |
| | | | | |
Net increase | | | 2,675,000 | | | | 4,024,953 | | | | 5,823,189 | | | | | | | $ | 95,393,603 | | | $ | 137,879,227 | | | $ | 198,233,718 | | | | | |
| | | | | |
| | |
| |
58 | AB SHORT DURATION HIGH YIELD ETF | | abfunds.com |
NOTES TO FINANCIAL STATEMENTS (continued)
| | | | | | | | | | | | | | | | | | | | | | | | | | | | | | | | |
| | | | | | | | | | | | | | | | | | | | | | | | | | | | | | | | |
| | | Shares | | | | | | Amount | | | | |
| | | Period Ended November 30, 2024(a) | | | Year Ended September 30, 2024(b) | | | Year Ended September 30, 2023 | | | | | | Period Ended November 30, 2024(a) | | | Year Ended September 30, 2024(b) | | | Year Ended September 30, 2023 | | | | |
| | | | | | | | |
| Class R | | | | | | | | | | | | | | | | | | | | | | | | | | | | | | | | |
Shares redeemed | | | – 0 | – | | | (1,004 | ) | | | – 0 | – | | | | | | | – 0 | – | | | (9,128 | ) | | | – 0 | – | | | | |
| | | | | |
Net increase (decrease) | | | – 0 | – | | | (1,004 | ) | | | – 0 | – | | | | | | $ | – 0 | – | | $ | (9,128 | ) | | $ | – 0 | – | | | | |
| | | | | |
| | | | | | | | | | | | | | | | | | | | | | | | | | | | | | | | |
| Class K | | | | | | | | | | | | | | | | | | | | | | | | | | | | | | | | |
Shares redeemed | | | – 0 | – | | | (1,004 | ) | | | – 0 | – | | | | | | | – 0 | – | | | (9,130 | ) | | | – 0 | – | | | | |
| | | | | |
Net increase (decrease) | | | – 0 | – | | | (1,004 | ) | | | – 0 | – | | | | | | $ | – 0 | – | | $ | (9,130 | ) | | $ | – 0 | – | | | | |
| | | | | |
| | | | | | | | | | | | | | | | | | | | | | | | | | | | | | | | |
| Class I | | | | | | | | | | | | | | | | | | | | | | | | | | | | | | | | |
Shares redeemed | | | – 0 | – | | | (943 | ) | | | – 0 | – | | | | | | | – 0 | – | | | (8,578 | ) | | | – 0 | – | | | | |
| | | | | |
Net increase (decrease) | | | – 0 | – | | | (943 | ) | | | – 0 | – | | | | | | $ | – 0 | – | | $ | (8,578 | ) | | $ | – 0 | – | | | | |
| | | | | |
| (a) | The Acquired Portfolio had a fiscal year end of September 30. The Fund has a fiscal year end of November 30. |
| (b) | After the close of business on June 7, 2024, AB Short Duration High Yield Portfolio (the “Acquired Portfolio”) was reorganized into AB Short Duration High Yield ETF. The amounts disclosed include those of the Acquired Portfolio and has been adjusted retroactively for the periods presented. See Note A and Note I for additional information on the reorganization. |
NOTE F
Risks Involved in Investing in the Fund
Market Risk—The value of the Fund’s assets will fluctuate as the market or markets in which the Fund invests fluctuate. The value of the Fund’s investments may decline, sometimes rapidly and unpredictably, simply because of economic changes or other events, including public health crises (including the occurrence of a contagious disease or illness), interest rate levels, and regional and global conflicts, that affect large portions of the market.
Interest-Rate Risk—Changes in interest rates will affect the value of investments in fixed-income securities. When interest rates rise, the value of existing investments in fixed-income securities tends to fall and this decrease in value may not be offset by higher income from new investments. Interest rate risk is generally greater for fixed-income securities with longer maturities or durations. The Fund may be subject to a greater risk of rising interest rates than would normally be the case due to the recent end of a period of historically low rates and the effects of potential central bank monetary policy, and government fiscal policy, initiatives and market reactions to those initiatives.
Credit Risk—An issuer or guarantor of a fixed-income security, or the counterparty to a derivatives or other contract, may be unable or unwilling to make timely payments of interest or principal, or to otherwise honor its
| | |
| |
| abfunds.com | | AB SHORT DURATION HIGH YIELD ETF | 59 |
NOTES TO FINANCIAL STATEMENTS (continued)
obligations. The issuer or guarantor may default, causing a loss of the full principal amount of a security and accrued interest. The degree of risk for a particular security may be reflected in its credit rating. There is the possibility that the credit rating of a fixed-income security may be downgraded after purchase, which may adversely affect the value of the security.
Below Investment Grade Securities Risk—Investments in fixed-income securities with lower ratings (commonly known as “junk bonds”) are subject to a higher probability that an issuer will default or fail to meet its payment obligations. These securities may be subject to greater price volatility due to such factors as specific corporate developments and negative perceptions of the junk bond market generally and may be more difficult to trade than other types of securities.
Duration Risk—Duration is a measure that relates the expected price volatility of a fixed-income security to changes in interest rates. The duration of a fixed-income security may be shorter than or equal to full maturity of a fixed-income security. Fixed-income securities with longer durations have more risk and will decrease in price as interest rates rise. For example, a fixed-income security with a duration of three years will likely decrease in value by approximately 3% if interest rates increase by 1%.
Inflation Risk—This is the risk that the value of assets or income from investments will be less in the future as inflation decreases the value of money. As inflation increases, the value of the Fund’s assets can decline as can the value of the Fund’s distributions. This risk is significantly greater for fixed-income securities with longer maturities.
Derivatives Risk—Derivatives may be difficult to price or unwind and may be leveraged so that small changes may produce disproportionate losses for the Fund. A short position in a derivative instrument involves the risk of a theoretically unlimited increase in the value of the underlying asset, reference rate or index, which could cause the Fund to suffer a potentially unlimited loss. Derivatives, especially over-the-counter derivatives, are also subject to counterparty risk, which is the risk that the counterparty (the party on the other side of the transaction) on a derivative transaction will be unable or unwilling to honor its contractual obligations to the Fund.
Foreign (Non-U.S.) Investments Risk—Investments in securities of non-U.S. issuers may involve more risk than those of U.S. issuers. These securities may fluctuate more widely in price and may be more difficult to trade than domestic securities due to adverse market, economic, political, regulatory or other factors.
| | |
| |
60 | AB SHORT DURATION HIGH YIELD ETF | | abfunds.com |
NOTES TO FINANCIAL STATEMENTS (continued)
Emerging-Market Risk—Investments in emerging market countries may have more risk because the markets are less developed and less liquid and are subject to increased economic, political, regulatory or other uncertainties.
Currency Risk—Fluctuations in currency exchange rates may negatively affect the value of the Fund’s investments or reduce its returns.
Loan Participations and Assignments Risk—When the Fund purchases loan participations and assignments, it is subject to the credit risk associated with the underlying corporate borrower. In addition, the lack of a liquid secondary market for loan participations and assignments may have an adverse impact on the value of such investments and the Fund’s ability to dispose of particular assignments or participations when necessary to meet the Fund’s liquidity needs or in response to a specific economic event such as a deterioration in the creditworthiness of the borrower.
Illiquid Investments Risk—Illiquid investments risk exists when certain investments are or become difficult to purchase or sell. Difficulty in selling such investments may result in sales at disadvantageous prices affecting the value of your investment in the Fund. Causes of illiquid investments risk may include low trading volumes and large positions. Foreign fixed-income securities may have more illiquid investments risk because secondary trading markets for these securities may be smaller and less well-developed and the securities may trade less frequently than domestic securities. Illiquid investments risk may be higher in a rising interest rate environment, when the value and liquidity of fixed-income securities generally go down.
Cash Transactions Risk—The Fund intends to transact many of its creation and redemption orders for cash, rather than in-kind securities. As a result, an investment in the Fund is expected to be less tax-efficient than an investment in an ETF that effectuates its transactions in Creation Units primarily on an in-kind basis. A fund that effects redemptions for cash may be required to sell portfolio securities in order to obtain the cash needed to distribute redemption proceeds. Any recognized gain on these sales by the Fund will generally cause the Fund to recognize a gain it might not otherwise have recognized, or to recognize such gain sooner than would otherwise be required as compared to an ETF that distributes portfolio securities in-kind in redemption of Creation Units. The Fund intends to distribute gains that arise by virtue of the issuance and redemption of Creation Units being effectuated in cash to shareholders to avoid being taxed on this gain at the fund level and otherwise comply with applicable tax requirements. This may cause shareholders to be subject to tax on gains to which they would not otherwise be subject, or at an earlier date than if
| | |
| |
| abfunds.com | | AB SHORT DURATION HIGH YIELD ETF | 61 |
NOTES TO FINANCIAL STATEMENTS (continued)
they had made an investment in another ETF. Moreover, cash transactions may have to be carried out over several days if the securities market is relatively illiquid and may involve considerable brokerage fees and taxes. Brokerage fees, which will be higher than if the Fund sold and redeemed its shares principally in-kind, will be passed on to those purchasing and redeeming Creation Units in the form of creation and redemption transaction fees. In addition, these factors may result in wider spreads between the bid and ask prices of Fund shares than for ETFs that receive and distribute portfolio securities in-kind. The Fund’s use of cash for creations and redemptions could also result in dilution to the Fund and increased transaction costs, which could negatively impact the Fund’s ability to achieve its
investment objective.
ETF Share Price and Net Asset Value Risk—The Fund’s shares are listed for trading on the NYSE Arca, Inc. (the “Exchange”). The Fund’s shares are generally bought and sold in the secondary market at market prices. The net asset value (“NAV”) per share of the Fund will fluctuate with changes in the market value of the Fund’s holdings. The Fund’s NAV is calculated once per day, at the end of the day. The market price of a share on the Exchange could be higher than the NAV (premium), or lower than the NAV (discount) and may fluctuate during the trading day. When all or a portion of the Fund’s underlying securities trade in a market that is closed when the market for the Fund’s shares is open, there may be differences between the current value of a security and the last quoted price for that security in the closed local market, which could lead to a deviation between the market value of the Fund’s shares and the Fund’s NAV. Disruptions in the creations and redemptions process or the existence of extreme market volatility could result in the Fund’s shares trading above or below NAV. As the Fund may invest in securities traded on foreign exchanges, Fund shares may trade at a larger premium or discount to the Fund’s NAV per share than shares of other ETFs. In addition, in stressed market conditions, the market for Fund shares may become less liquid in response to deteriorating liquidity in the markets for the Fund’s underlying portfolio holdings.
Authorized Participant Risk—Only a limited number of financial institutions that enter into an authorized participant relationship with the Fund (“Authorized Participants”) may engage in creation or redemption transactions. If the Fund’s Authorized Participants decide not to create or redeem shares, Fund shares may trade at a larger premium or discount to the Fund’s NAV per share, or the Fund could face trading halts or de-listing.
Active Trading Market Risk—There is no guarantee that an active trading market for Fund shares will exist at all times. In times of market stress, markets can suffer erratic or unpredictable trading activity, extraordinary
| | |
| |
62 | AB SHORT DURATION HIGH YIELD ETF | | abfunds.com |
NOTES TO FINANCIAL STATEMENTS (continued)
volatility or wide bid/ask spreads, which could cause some market makers and Authorized Participants to reduce their market activity or “step away” from making a market in ETF shares. Market makers and Authorized Participants are not obligated to place or execute purchase and redemption orders. This could cause the Fund’s market price to deviate, materially, from the NAV, and reduce the effectiveness of the ETF arbitrage process. Any absence of an active trading market for Fund shares could lead to a heightened risk that there will be a difference between the market price of a Fund share and the underlying value of the Fund share.
Indemnification Risk—In the ordinary course of business, the Fund enters into contracts that contain a variety of indemnifications. The Fund’s maximum exposure under these arrangements is unknown. However, the Fund has not had prior claims or losses pursuant to these indemnification provisions and expects the risk of loss thereunder to be remote. Therefore, the Fund has not accrued any liability in connection with these indemnification provisions.
Management Risk—The Fund is subject to management risk because it is an actively-managed ETF. The Adviser will apply its investment techniques and risk analyses in making investment decisions, but there is no guarantee that its techniques will produce the intended results. Some of these techniques may incorporate, or rely upon, quantitative models, but there is no guarantee that these models will generate accurate forecasts, reduce risk or otherwise perform as expected.
NOTE G
Joint Credit Facility
A number of open-end mutual funds managed by the Adviser, including the Fund, participate in a $325 million revolving credit facility (the “Facility”) intended to provide short-term financing related to redemptions and other short term liquidity requirements, subject to certain restrictions. Commitment fees related to the Facility are paid by the participating funds and are included in miscellaneous expenses in the statement of operations. The Fund did not utilize the Facility during the period ended November 30, 2024.
| | |
| |
| abfunds.com | | AB SHORT DURATION HIGH YIELD ETF | 63 |
NOTES TO FINANCIAL STATEMENTS (continued)
NOTE H
Distributions to Shareholders
The tax character of distributions paid during the fiscal period ended November 30, 2024 and the fiscal years ended September 30, 2024 and September 30, 2023 were as follows:
| | | | | | | | | | | | |
| | | October 1, 2024 to
November 30,
2024 | | | Year Ended
September 30,
2024 | | | Year Ended
September 30,
2023 | |
Distributions paid from: | | | | | | | | | | | | |
Ordinary income | | $ | 6,492,042 | | | $ | 38,090,038 | | | $ | 31,251,519 | |
| | | | | | | | | | | | |
Total taxable distributions paid | | $ | 6,492,042 | | | $ | 38,090,038 | | | $ | 31,251,519 | |
| | | | | | | | | | | | |
As of November 30, 2024, the components of accumulated earnings (deficit) on a tax basis were as follows:
| | | | |
Undistributed ordinary income | | $ | 1,972,278 | |
Accumulated capital and other losses | | $ | (31,076,254 | )(a) |
Unrealized appreciation (depreciation) | | | 3,754,742 | (b) |
| | | | |
Total accumulated earnings (deficit) | | $ | (25,349,234 | )(c) |
| | | | |
| (a) | As of November 30, 2024, the Fund had a net capital loss carryforward of $31,076,254. During the fiscal period, the Fund utilized $2,100,029 of capital loss carry forwards to offset current period net realized gains. |
| (b) | The differences between book-basis and tax-basis unrealized appreciation (depreciation) are attributable primarily to the recognition for tax purposes of unrealized gains/losses on certain derivative instruments, the tax treatment of callable bonds, and the tax deferral of losses on wash sales. |
| (c) | The differences between book-basis and tax-basis components of accumulated earnings (deficit) are attributable primarily to the accrual of foreign capital gains tax and the tax treatment of defaulted securities. |
For tax purposes, net realized capital losses may be carried over to offset future capital gains, if any. Funds are permitted to carry forward capital losses for an indefinite period, and such losses will retain their character as either short-term or long-term capital losses. As of November 30, 2024, the Fund had a net short-term capital loss carryforward of $8,740,120 and a net long-term capital loss carryforward of $22,336,134, which may be carried forward for an indefinite period.
During the current fiscal period, permanent differences primarily due to the tax treatment of gains from a redemption-in-kind resulted in a net decrease in accumulated loss and a net decrease in additional paid-in capital. These reclassifications had no effect on net assets.
| | |
| |
64 | AB SHORT DURATION HIGH YIELD ETF | | abfunds.com |
NOTES TO FINANCIAL STATEMENTS (continued)
NOTE I
Reorganization
At meetings held on October 31 – November 2, 2023, the Board, on behalf of the Fund, and the Board of Directors of the Acquired Portfolio approved the Conversion providing for the tax-free acquisition by the Fund of the assets and liabilities of the Acquired Portfolio. The acquisition was completed at the close of business June 7, 2024. Pursuant to the Plan, the assets and liabilities of the Acquired Portfolio’s shares were transferred in exchange for Fund shares, in a tax-free exchange as follows:
| | | | | | | | | | | | | | | | |
Portfolio | | Shares
outstanding
before the
Conversion | | | Shares
outstanding
immediately
after the
Conversion | | | Aggregate
net assets
before the
Conversion | | | Aggregate
net assets
immediately
after the
Conversion | |
Acquired Portfolio* | | | 73,474,038 | | | | – 0 | – | | $ | 675,330,250 | + | | $ | – 0 | – |
The Fund | | | – 0 | – | | | 19,295,122 | | | $ | – 0 | – | | $ | 675,330,250 | |
| * | Represents the accounting survivor. |
| + | Includes distributions in excess of net investment income of $3,942,798 and unrealized depreciation on investments of $3,405,132, with a fair value of $650,158,849 and identified cost of $653,563,981. |
For financial reporting purposes, assets received and shares issued by the Fund were recorded at fair value; however, the cost basis of the investments received from the Acquired Portfolio were carried forward to align ongoing reporting of the Fund’s realized and unrealized gains and losses with amounts distributable to shareholders for tax purposes.
NOTE J
Recent Accounting Pronouncements
In December 2022, the Financial Accounting Standards Board issued an Accounting Standards Update, ASU 2022-06, “Reference Rate Reform (Topic 848) – Deferral of the Sunset Date of Topic 848”. ASU 2022-06 is an amendment to ASU 2020-04, which provided optional guidance to ease the potential accounting burden due to the discontinuation of the LIBOR and other interbank-offered based reference rates and which was effective as of March 12, 2020 through December 31, 2022. ASU 2022-06 extends the effective period through December 31, 2024. Management is currently evaluating the impact, if any, of applying ASU 2022-06.
In November 2023, the Financial Accounting Standards Board issued Accounting Standards Update, ASU 2023-07, “Segment Reporting (Topic 280)”. ASU 2023-07 requires public entities to provide disclosure of significant segment expenses that are regularly provided to the chief operating decision maker (“CODM”). ASU 2023-07, among other things, (i) requires a single segment public entity to provide all necessary disclosures required by Topic 280 it, (ii) requires a public entity to disclose the
| | |
| |
| abfunds.com | | AB SHORT DURATION HIGH YIELD ETF | 65 |
NOTES TO FINANCIAL STATEMENTS (continued)
title and position of the CODM and an explanation of how the CODM uses the reported measure(s) of segment profit and loss in assessing segment performance and deciding how to allocate resources and (iii) provides the ability for a public entity to elect more than one performance measure. ASU 2023-07 is effective for fiscal years beginning after December 15, 2023, and interim periods within fiscal years beginning after December 15, 2024. Early adoption of ASU 2023-07 is permitted. Management is currently evaluating the impact, if any, of applying ASU 2023-07.
NOTE K
Subsequent Events
Management has evaluated subsequent events for possible recognition or disclosure in the financial statements through the date the financial statements are issued. Management has determined that there are no material events that would require disclosure in the Fund’s financial statements through this date.
| | |
| |
66 | AB SHORT DURATION HIGH YIELD ETF | | abfunds.com |
FINANCIAL HIGHLIGHTS
Selected Data For A Share Of Capital Stock Outstanding Throughout Each Period(a)
| | | | | | | | | | | | | | | | | | | | | | | | |
| | | October 1,
2024(b) to
November 30,
2024 | | | Year Ended September 30, | |
| | | 2024 | | | 2023 | | | 2022 | | | 2021 | | | 2020 | |
| | | | |
| | | | | | | | | | | | | | | | | | | | | | | | |
| | | | | | | | | | | | | | | | | | | | | | | | |
Net asset value, beginning of period | | | $ 35.88 | | | | $ 33.81 | | | | $ 33.24 | | | | $ 39.37 | | | | $ 37.81 | | | | $ 39.41 | |
| | | | |
Income From Investment Operations | | | | | | | | | | | | | | | | | | | | | | | | |
| | | | | | |
Net investment income(c)(d) | | | .36 | | | | 2.27 | | | | 1.94 | | | | 1.45 | | | | 1.49 | | | | 1.49 | |
Net realized and unrealized gain (loss) on investment and foreign currency transactions | | | (.06 | ) | | | 1.84 | | | | 1.30 | | | | (5.98 | ) | | | 1.71 | | | | (1.26 | ) |
Contribution from Affiliates | | | – 0 | – | | | – 0 | – | | | .00 | (e) | | | – 0 | – | | | – 0 | – | | | – 0 | – |
| | | | |
Net increase (decrease) in net asset value from operations | | | .30 | | | | 4.11 | | | | 3.24 | | | | (4.53 | ) | | | 3.20 | | | | 0.23 | |
| | | | |
Less: Dividends | | | | | | | | | | | | | | | | | | | | | | | | |
| | | | | | |
Dividends from net investment income | | | (.34 | ) | | | (2.04 | ) | | | (2.67 | ) | | | (1.60 | ) | | | (1.64 | ) | | | (1.83 | ) |
| | | | |
Net asset value, end of period | | | $ 35.84 | | | | $ 35.88 | | | | $ 33.81 | | | | $ 33.24 | | | | $ 39.37 | | | | $ 37.81 | |
| | | | |
| | | | | | |
Total Return | | | | | | | | | | | | | | | | | | | | | | | | |
| | | | | | |
Total investment return based on net asset value(f) | | | .93 | % | | | 12.50 | % | | | 10.04 | % | | | (11.78 | )% | | | 8.52 | % | | | .70 | % |
| | | | | | |
Ratios/Supplemental Data | | | | | | | | | | | | | | | | | | | | | | | | |
| | | | | | |
Net assets, end of period (000’s omitted) | | | $754,351 | | | | $659,122 | | | | $484,876 | | | | $283,354 | | | | $334,801 | | | | $256,070 | |
| | | | | | |
Ratio to average net assets of: | | | | | | | | | | | | | | | | | | | | | | | | |
| | | | | | |
Expenses, net of waivers/reimbursements(g)‡ | | | .39 | %^ | | | .58 | % | | | .70 | % | | | .70 | % | | | .70 | % | | | .70 | % |
| | | | | | |
Expenses, before waivers/reimbursements(g)‡ | | | .40 | %^ | | | .61 | % | | | .78 | % | | | .75 | % | | | .77 | % | | | .79 | % |
| | | | | | |
Net investment income(d) | | | 6.12 | %^ | | | 6.51 | % | | | 5.71 | % | | | 3.97 | % | | | 3.77 | % | | | 3.97 | % |
| | | | | | |
Portfolio turnover rate(h) | | | 4 | % | | | 41 | % | | | 67 | % | | | 62 | % | | | 57 | % | | | 60 | % |
| | | | | | | | | | | | | | | | | | | | | | | | |
| |
‡ Expense ratios exclude the estimated acquired fund fees of the affiliated/unaffiliated underlying | |
portfolios | | | .00 | %^ | | | .01 | % | | | .00 | % | | | .00 | % | | | .00 | % | | | .00 | % |
See footnote summary on page 68.
| | |
| |
| abfunds.com | | AB SHORT DURATION HIGH YIELD ETF | 67 |
FINANCIAL HIGHLIGHTS (continued)
Selected Data For A Share Of Capital Stock Outstanding Throughout Each Period(a)
| (a) | After the close of business on June 7, 2024, AB Short Duration High Yield Portfolio (the “Acquired Portfolio”) was converted into AB Short Duration High Yield ETF. The performance and financial history of the Acquired Portfolio’s Advisor Class Shares have been adopted by the Fund and will be used going forward. As a result, the Financial Highlight information includes that of the Acquired Portfolio’s Advisor Class Shares and has been adjusted retroactively for the periods from September 30, 2020 through the Reorganization. |
| (b) | The Acquired Portfolio had a fiscal year end of September 30. The Fund has a fiscal year end of November 30. |
| (c) | Based on average shares outstanding. |
| (d) | Net of expenses waived/reimbursed by the Adviser. |
| (e) | Amount is less than $.005. |
| (f) | Total investment return is calculated assuming an initial investment made at the net asset value at the beginning of the period, reinvestment of all dividends and distributions at net asset value during the period, and redemption on the last day of the period. Initial sales charges or contingent deferred sales charges are not reflected in the calculation of total investment return. Total investment return does not reflect the deduction of taxes that a shareholder would pay on fund distributions or the redemption of fund shares. Total investment return calculated for a period of less than one year is not annualized. |
| (g) | In connection with the Fund’s investments in affiliated underlying portfolios, the Fund incurs no direct expenses, but bears proportionate shares of the fees and expenses (i.e., operating, administrative and investment advisory fees) of the affiliated underlying portfolios. The Adviser has contractually agreed to waive its fees from the Fund in an amount equal to the Fund’s pro rata share of certain acquired fund fees and expenses, and for the period ended November 30, 2024 and for the year ended September 30, 2024, such waiver amounted to .01% (annualized) and .01%, respectively. |
| (h) | Excludes the value of portfolio securities received or delivered as a result of in-kind purchases or redemptions of the Fund’s capital shares, including ETF Creation Units. |
See notes to financial statements.
| | |
| |
68 | AB SHORT DURATION HIGH YIELD ETF | | abfunds.com |
REPORT OF INDEPENDENT REGISTERED
PUBLIC ACCOUNTING FIRM
To the Shareholders and the Board of Directors of AB Short Duration High Yield ETF
Opinion on the Financial Statements
We have audited the accompanying statement of assets and liabilities of AB Short Duration High Yield ETF (the “Fund”) (one of the funds constituting AB Active ETFs, Inc. (the “Corporation”)), including the portfolio of investments, as of November 30, 2024, and the related statements of operations for the period from October 1, 2024 to November 30, 2024 and for the year ended September 30, 2024, and the statements of changes in net assets for the period from October 1, 2024 to November 30, 2024 and for each of the two years in the period ended September 30, 2024, the financial highlights for the period from October 1, 2024 to November 30, 2024 and for each of the five years in the period ended September 30, 2024, and the related notes (collectively referred to as the “financial statements”). In our opinion, the financial statements present fairly, in all material respects, the financial position of the Fund (one of the funds constituting AB Active ETFs, Inc.) at November 30, 2024, the results of its operations for the period from October 1, 2024 to November 30, 2024 and for the year ended September 30, 2024, the changes in its net assets for the period from October 1, 2024 to November 30, 2024 and for each of the two years in the period ended September 30, 2024 and its financial highlights for the period from October 1, 2024 to November 30, 2024 and for each of the five years in the period ended September 30, 2024, in conformity with U.S. generally accepted accounting principles.
Basis for Opinion
These financial statements are the responsibility of the Corporation’s management. Our responsibility is to express an opinion on the Fund’s financial statements based on our audits. We are a public accounting firm registered with the Public Company Accounting Oversight Board (United States) (“PCAOB”) and are required to be independent with respect to the Corporation in accordance with the U.S. federal securities laws and the applicable rules and regulations of the Securities and Exchange Commission and the PCAOB.
We conducted our audits in accordance with the standards of the PCAOB. Those standards require that we plan and perform the audit to obtain reasonable assurance about whether the financial statements are free of material misstatement, whether due to error or fraud. The Corporation is not required to have, nor were we engaged to perform, an audit of the Corporation’s internal control over financial reporting. As part of our audits, we are required to obtain an understanding of internal control over financial
| | |
| |
| abfunds.com | | AB SHORT DURATION HIGH YIELD ETF | 69 |
REPORT OF INDEPENDENT REGISTERED
PUBLIC ACCOUNTING FIRM (continued)
reporting but not for the purpose of expressing an opinion on the effectiveness of the Corporation’s internal control over financial reporting. Accordingly, we express no such opinion.
Our audits included performing procedures to assess the risks of material misstatement of the financial statements, whether due to error or fraud, and performing procedures that respond to those risks. Such procedures included examining, on a test basis, evidence regarding the amounts and disclosures in the financial statements. Our procedures included confirmation of securities owned as of November 30, 2024, by correspondence with the custodian, brokers and others; when replies were not received from brokers or others, we performed other auditing procedures. Our audits also included evaluating the accounting principles used and significant estimates made by management, as well as evaluating the overall presentation of the financial statements. We believe that our audits provide a reasonable basis for our opinion.

We have served as the auditor of one or more of the AB investment companies since 1968.
New York, New York
January 28, 2025
| | |
| |
70 | AB SHORT DURATION HIGH YIELD ETF | | abfunds.com |
2024 FEDERAL TAX INFORMATION
(unaudited)
For Federal income tax purposes, the following information is furnished with respect to the distributions paid by the Fund during the taxable period ended November 30, 2024. For foreign shareholders, 61.26% of ordinary dividends paid may be considered to be qualifying to be taxed as interest-related dividends.
Shareholders should not use the above information to prepare their income tax returns. The information necessary to complete your income tax returns will be included with your Form 1099-DIV which will be sent to you separately in January 2025.
| | |
| |
| abfunds.com | | AB SHORT DURATION HIGH YIELD ETF | 71 |
Information Regarding the Review and Approval of the Fund’s Advisory Agreement
The disinterested directors (the “directors”) of AB Active ETFs, Inc. (the “Company”) unanimously approved the Company’s Advisory Agreement with the Adviser in respect of AB Short Duration High Yield ETF (the “Fund”) for an initial two-year period at a meeting held in-person on October 31-November 2, 2023 (the “Meeting”).
Prior to approval of the Advisory Agreement, the directors had requested from the Adviser, and received and evaluated, extensive materials. They reviewed the proposed Advisory Agreement with the Adviser and with experienced counsel who are independent of the Adviser, who advised on the relevant legal standards. The directors also reviewed additional materials, including comparative analytical data prepared by the Senior Vice President of the Fund. The directors also discussed the proposed approval in private sessions with counsel.
The directors considered their knowledge of the nature and quality of the services to be provided by the Adviser to the Fund gained from their experience as directors or trustees of most of the registered investment companies advised by the Adviser, including the other series of the Company that are organized as exchange-traded funds (“ETFs”), their overall confidence in the Adviser’s integrity and competence they have gained from that experience, the Adviser’s initiative in identifying and raising potential issues with the directors and its responsiveness, frankness and attention to concerns raised by the directors in the past, including the Adviser’s willingness to consider and implement organizational and operational changes designed to improve investment results and the services provided to the AB Funds. The directors noted that they have four regular meetings each year, at each of which they review extensive materials and information from the Adviser, including information on the investment performance of the AB Funds.
The directors also considered all factors they believed relevant, including the specific matters discussed below. During the course of their deliberations, the directors evaluated, among other things, the reasonableness of the proposed advisory fee. The directors did not identify any particular information that was all-important or controlling, and different directors may have attributed different weights to the various factors. The directors determined that the selection of the Adviser to manage the Fund and the overall arrangements between the Fund and the Adviser, as provided in the Advisory Agreement, including the proposed advisory fee, were fair and reasonable in light of the services to be performed, expenses to be incurred and such other matters as the directors considered relevant in the exercise of their business judgment. The material factors and conclusions
| | |
| |
72 | AB SHORT DURATION HIGH YIELD ETF | | abfunds.com |
that formed the basis for the directors’ determinations included the following:
Nature, Extent and Quality of Services to be Provided
The directors considered the scope and quality of services to be provided by the Adviser under the Advisory Agreement, including the quality of the investment research capabilities of the Adviser and the other resources it has dedicated to performing services for the AB Funds. They also noted the professional experience and qualifications of the Fund’s portfolio management team and other senior personnel of the Adviser. The directors also considered that the Advisory Agreement provides that the Fund will reimburse the Adviser for the cost to it of providing certain clerical, accounting, administrative and other services to the Fund by employees of the Adviser or its affiliates. Requests for these reimbursements will be subject to the directors’ approval on a quarterly basis. The directors noted that the Adviser does not expect to request such reimbursements. The quality of administrative and other services, including the Adviser’s role in coordinating the activities of the Fund’s other service providers, also was considered. The directors concluded that, overall, they were satisfied with the nature, extent and quality of services to be provided to the Fund under the Advisory Agreement.
Costs of Services to be Provided and Profitability
Because the Fund had not yet commenced operations, the directors were unable to consider historical information about the profitability of the Fund. However, the Adviser agreed to provide the directors with profitability information in connection with future proposed continuances of the Advisory Agreement. They also considered the costs to be borne by the Adviser in providing services to the Fund and that the Fund was unlikely to be profitable to the Adviser unless it achieves a material level of net assets.
Fall-Out Benefits
The directors considered the other benefits to the Adviser from its proposed relationship with the Fund. The directors recognized that the Adviser’s future profitability would be somewhat lower without these benefits. The directors understood that the Adviser also might derive reputational and other benefits from its association with the Fund.
Investment Results
Since the Fund was newly formed and had not yet commenced operations, no performance or other historical information for the Fund was available. However, it was proposed that the Fund would receive the assets of AB Short Duration High Yield Portfolio (the “Acquired Portfolio”), a series of AB Bond Fund, Inc. (a mutual fund), in exchange for shares of the Fund (an exchange traded fund) and the assumption by the Fund of all the liabilities of the Acquired Portfolio. Shareholders of the Acquired Portfolio would receive shares of the Fund in a liquidating distribution of the
| | |
| |
| abfunds.com | | AB SHORT DURATION HIGH YIELD ETF | 73 |
Acquired Portfolio (the “Conversion”). The Conversion is expected to be consummated on or about June 2024. Based on the Adviser’s written and oral presentations regarding the proposed management of the Fund and their general knowledge and confidence in the Adviser’s expertise in managing mutual funds and ETFs, the directors concluded that they were satisfied that the Adviser was capable of providing high quality Fund management services to the Fund.
Advisory Fees and Other Expenses
The directors considered the proposed advisory fee rate payable by the Fund to the Adviser and information prepared by an independent service provider (the “15(c) service provider”), concerning advisory fee rates payable by other ETFs in the same category as the Fund, based on the Fund’s projected net assets of $500 million. The directors noted that the proposed advisory fee is a unitary fee and that the Adviser will pay all expenses of the Fund except for certain expenses payable by the Fund such as interest expense, taxes, extraordinary expenses, and brokerage commissions and other transaction costs. The directors recognized that it is difficult to make comparisons of advisory fees because there are variations in the services that are included in the fees payable by other ETFs. The directors considered the Fund’s proposed contractual advisory fee rate against a peer group median and noted that it was lower than the median.
The directors also considered the Adviser’s fee schedule for other clients utilizing investment strategies similar to those of the Fund. For this purpose, they reviewed the relevant advisory fee information from the Adviser’s Form ADV and in a report from the Fund’s Senior Vice President and noted the differences between the Fund’s proposed fee schedule, on the one hand, and the Adviser’s institutional fee schedule and the schedule of fees charged by the Adviser to any offshore funds and for services to any sub-advised funds utilizing investment strategies similar to those of the Fund, on the other. The directors noted that the Adviser may, in some cases, agree to fee rates with large institutional clients that are lower than those reviewed by the directors and that they had previously discussed with the Adviser its policies in respect of such arrangements.
The Adviser reviewed with the directors the significantly greater scope of the services it will provide to the Fund relative to institutional, offshore fund and sub-advised fund clients. In this regard, the Adviser noted, among other things, that, compared to institutional and offshore fund or sub-advisory accounts, the Fund (i) demands considerably more managerial and administrative resources due to the potential for frequent creations and redemptions of shares; (ii) has more tax and regulatory restrictions and compliance obligations; (iii) must prepare and file or distribute regulatory and other communications about fund operations; and (iv) must provide shareholder servicing to retail investors. The Adviser
| | |
| |
74 | AB SHORT DURATION HIGH YIELD ETF | | abfunds.com |
also reviewed the greater legal risks presented by the large and changing population of Fund shareholders who may assert claims against the Adviser in individual or class actions, and the greater entrepreneurial risk in offering new fund products, which require substantial investment to launch, may not succeed, and generally must be priced to compete with larger, more established funds resulting in lack of profitability to the Adviser until a new fund achieves scale. In light of the substantial differences in services rendered by the Adviser to institutional, offshore fund and sub-advised fund clients as compared to the Fund, and the different risk profile, the directors considered these fee comparisons inapt and did not place significant weight on them in their deliberations. The directors noted that the proposed unitary fee for the Fund covers additional services provided by third parties and thus is not directly comparable to the Adviser’s institutional fee schedule and the schedule of fees for most other funds advised by the Adviser.
In connection with their review of the Fund’s proposed advisory fee, the directors also considered the projected total expense ratio of the shares of the Fund in comparison to a group of similar ETFs (“peer group”) and a larger group of similar ETFs (“peer universe”) selected by the 15(c) service provider. The directors view the projected expense ratio information as relevant to their evaluation of the Adviser’s services because the Adviser is responsible for coordinating services provided to the Fund by others and, in most cases, the Adviser will be responsible for paying for such services under its unitary fee arrangement with the Fund. The directors noted that the Fund’s projected expense ratio was lower than the median. Based on their review, the directors concluded that the Fund’s projected expense ratio was acceptable.
Economies of Scale
The directors noted that the proposed advisory fee schedule for the Fund does not contain breakpoints and that they had discussed their strong preference for breakpoints in advisory contracts with the Adviser. The directors took into consideration prior presentations by an independent consultant on economies of scale in the mutual fund industry and for the AB Funds, and presentations from time to time by the Adviser concerning certain of its views on economies of scale. The directors also had requested and received from the Adviser certain updates on economies of scale in advance of the Meeting. The directors believe that economies of scale may be realized (if at all) by the Adviser across a variety of products and services, and not only in respect of a single fund. The directors noted that there is no established methodology for setting breakpoints that give effect to the fund-specific services provided by a fund’s adviser and to the economies of scale that an adviser may realize in its overall mutual fund business or those components of it which directly or indirectly affect a fund’s operations. The directors observed that in the mutual fund industry as a whole, as well as among ETFs similar to the Fund, there is no
| | |
| |
| abfunds.com | | AB SHORT DURATION HIGH YIELD ETF | 75 |
uniformity or pattern in the fees and asset levels at which breakpoints (if any) apply. The directors also noted that the advisory agreements for many ETFs do not have breakpoints at all. The directors informed the Adviser that they would monitor the Fund’s asset level and its profitability to the Adviser and anticipated revisiting the question of breakpoints in the future if circumstances warranted doing so.
| | |
| |
76 | AB SHORT DURATION HIGH YIELD ETF | | abfunds.com |
AB SHORT DURATION HIGH YIELD ETF
66 Hudson Boulevard East,
New York, NY 10001
800 221 5672
ETF-SDHY-0151-1124 
NOV 11.30.24

ANNUAL FINANCIAL STATEMENTS AND ADDITIONAL INFORMATION
AB SHORT DURATION INCOME ETF
(NYSE Arca: SDFI)

| | |
| |
| Investment Products Offered | | • Are Not FDIC Insured • May Lose Value • Are Not Bank Guaranteed |
Investors should consider the investment objectives, risks, charges and expenses of the Fund carefully before investing. For copies of our prospectus or summary prospectus, which contain this and other information, visit us online at www.abfunds.com or contact your AB representative. Please read the prospectus and/or summary prospectus carefully before investing.
This shareholder report must be preceded or accompanied by the Fund’s prospectus for individuals who are not current shareholders of the Fund.
You may obtain a description of the Fund’s proxy voting policies and procedures, and information regarding how the Fund voted proxies relating to portfolio securities during the most recent 12-month period ended June 30, without charge. Simply visit AB’s website at www.abfunds.com, or go to the Securities and Exchange Commission’s (the “Commission”) website at www.sec.gov, or call AB at (800) 227 4618.
The Fund files its complete schedule of portfolio holdings with the Commission for the first and third quarters of each fiscal year as an exhibit to its reports on Form N-PORT. The Fund’s Form N-PORT reports are available on the Commission’s website at www.sec.gov. AB publishes full portfolio holdings for the Fund monthly at www.abfunds.com.
AllianceBernstein Investments, Inc. (ABI) is the distributor of the AB family of mutual funds. ABI is a member of FINRA and is an affiliate of AllianceBernstein L.P., the Adviser of the funds.
The [A/B] logo and AllianceBernstein® are registered trademarks used by permission of the owner, AllianceBernstein L.P.
PORTFOLIO OF INVESTMENTS
November 30, 2024
| | | | | | | | | | | | |
| | | | | | Principal
Amount
(000) | | | U.S. $ Value | |
| |
CORPORATES - INVESTMENT GRADE – 36.9% | | | | | | | | | | | | |
Industrial – 21.2% | | | | | | | | | | | | |
Basic – 1.0% | | | | | | | | | | | | |
Georgia-Pacific LLC
0.95%, 05/15/2026(a) | | | U.S.$ | | | | 9 | | | $ | 8,539 | |
Glencore Funding LLC
1.625%, 09/01/2025(a) | | | | | | | 32 | | | | 31,262 | |
5.338%, 04/04/2027(a) | | | | | | | 373 | | | | 377,797 | |
Newmont Corp./Newcrest Finance Pty Ltd.
5.30%, 03/15/2026 | | | | | | | 329 | | | | 331,109 | |
Sherwin-Williams Co. (The)
3.45%, 06/01/2027 | | | | | | | 161 | | | | 156,947 | |
| | | | | | | | | | | | |
| | | | | | | | | | | 905,654 | |
| | | | | | | | | | | | |
Capital Goods – 2.6% | |
Boeing Co. (The)
2.196%, 02/04/2026 | | | | | | | 426 | | | | 411,763 | |
Caterpillar Financial Services Corp.
Series D
4.35%, 05/15/2026 | | | | | | | 218 | | | | 217,919 | |
Northrop Grumman Corp.
3.20%, 02/01/2027 | | | | | | | 377 | | | | 366,949 | |
3.25%, 01/15/2028 | | | | | | | 86 | | | | 82,735 | |
Parker-Hannifin Corp.
4.25%, 09/15/2027 | | | | | | | 362 | | | | 359,915 | |
Regal Rexnord Corp.
6.05%, 02/15/2026 | | | | | | | 377 | | | | 380,887 | |
RTX Corp.
3.50%, 03/15/2027 | | | | | | | 132 | | | | 128,886 | |
5.75%, 11/08/2026 | | | | | | | 356 | | | | 363,245 | |
| | | | | | | | | | | | |
| | | | | | | | | | | 2,312,299 | |
| | | | | | | | | | | | |
Communications - Media – 0.6% | |
DirecTV Financing LLC/DirecTV Financing Co-Obligor, Inc.
5.875%, 08/15/2027(a) | | | | | | | 83 | | | | 81,484 | |
Pinewood Finco PLC
3.25%, 09/30/2025(a) | | | GBP | | | | 118 | | | | 147,226 | |
Warnermedia Holdings, Inc.
4.054%, 03/15/2029 | | | U.S.$ | | | | 303 | | | | 286,902 | |
| | | | | | | | | | | | |
| | | | | | | | | | | 515,612 | |
| | | | | | | | | | | | |
Communications - Telecommunications – 0.7% | | | | | | | | | | | | |
T-Mobile USA, Inc.
2.625%, 04/15/2026 | | | | | | | 228 | | | | 221,801 | |
3.75%, 04/15/2027 | | | | | | | 417 | | | | 408,693 | |
| | | | | | | | | | | | |
| | | | | | | | | | | 630,494 | |
| | | | | | | | | | | | |
| | |
| |
| abfunds.com | | AB SHORT DURATION INCOME ETF | 1 |
PORTFOLIO OF INVESTMENTS (continued)
| | | | | | | | | | | | |
| | | | | | Principal
Amount
(000) | | | U.S. $ Value | |
| |
Consumer Cyclical - Automotive – 2.3% | |
Ford Motor Credit Co., LLC
5.80%, 03/08/2029 | | | U.S.$ | | | | 383 | | | $ | 387,037 | |
5.85%, 05/17/2027 | | | | | | | 200 | | | | 202,850 | |
General Motors Financial Co., Inc.
1.25%, 01/08/2026 | | | | | | | 18 | | | | 17,314 | |
1.50%, 06/10/2026 | | | | | | | 40 | | | | 38,079 | |
2.75%, 06/20/2025 | | | | | | | 411 | | | | 406,121 | |
5.25%, 03/01/2026 | | | | | | | 46 | | | | 46,205 | |
6.05%, 10/10/2025 | | | | | | | 111 | | | | 112,107 | |
Hyundai Capital America
1.30%, 01/08/2026(a) | | | | | | | 61 | | | | 58,689 | |
4.55%, 09/26/2029(a) | | | | | | | 38 | | | | 37,366 | |
5.25%, 01/08/2027(a) | | | | | | | 25 | | | | 25,229 | |
5.30%, 03/19/2027(a) | | | | | | | 322 | | | | 325,516 | |
Nissan Motor Acceptance Co., LLC
5.30%, 09/13/2027(a) | | | | | | | 94 | | | | 91,673 | |
Toyota Motor Credit Corp.
5.05%, 05/16/2029 | | | | | | | 267 | | | | 272,244 | |
| | | | | | | | | | | | |
| | | | | | | | | | | 2,020,430 | |
| | | | | | | | | | | | |
Consumer Cyclical - Entertainment – 0.1% | | | | | | | | | | | | |
Carnival Corp.
4.00%, 08/01/2028(a) | | | | | | | 58 | | | | 55,248 | |
| | | | | | | | | | | | |
| | | |
Consumer Cyclical - Other – 0.7% | | | | | | | | | | | | |
Las Vegas Sands Corp.
3.50%, 08/18/2026 | | | | | | | 424 | | | | 412,827 | |
Sands China Ltd.
5.125%, 08/08/2025(b) | | | | | | | 200 | | | | 199,250 | |
| | | | | | | | | | | | |
| | | | | | | | | | | 612,077 | |
| | | | | | | | | | | | |
Consumer Cyclical - Restaurants – 1.1% | | | | | | | | | | | | |
McDonald’s Corp.
3.50%, 03/01/2027 | | | | | | | 364 | | | | 356,061 | |
Series G
5.00%, 05/17/2029 | | | | | | | 255 | | | | 259,751 | |
Starbucks Corp.
4.75%, 02/15/2026 | | | | | | | 52 | | | | 52,140 | |
4.85%, 02/08/2027 | | | | | | | 259 | | | | 261,168 | |
| | | | | | | | | | | | |
| | | | | | | | | | | 929,120 | |
| | | | | | | | | | | | |
Consumer Non-Cyclical – 6.9% | |
AbbVie, Inc.
2.95%, 11/21/2026 | | | | | | | 97 | | | | 94,228 | |
3.20%, 05/14/2026 | | | | | | | 273 | | | | 268,160 | |
3.60%, 05/14/2025 | | | | | | | 154 | | | | 153,509 | |
Archer-Daniels-Midland Co.
2.50%, 08/11/2026 | | | | | | | 377 | | | | 364,438 | |
| | |
| |
2 | AB SHORT DURATION INCOME ETF | | abfunds.com |
PORTFOLIO OF INVESTMENTS (continued)
| | | | | | | | | | | | |
| | | | | | Principal
Amount
(000) | | | U.S. $ Value | |
| |
BAT International Finance PLC
1.668%, 03/25/2026 | | | U.S.$ | | | | 431 | | | $ | 414,079 | |
Cargill, Inc.
4.875%, 10/10/2025(a) | | | | | | | 403 | | | | 403,878 | |
Coty, Inc./HFC Prestige Products, Inc./HFC Prestige International US LLC
6.625%, 07/15/2030(a) | | | | | | | 76 | | | | 77,813 | |
CVS Health Corp.
2.875%, 06/01/2026 | | | | | | | 401 | | | | 389,668 | |
3.00%, 08/15/2026 | | | | | | | 107 | | | | 103,816 | |
General Mills, Inc.
4.70%, 01/30/2027 | | | | | | | 121 | | | | 121,254 | |
HCA, Inc.
5.25%, 06/15/2026 | | | | | | | 263 | | | | 263,773 | |
5.375%, 09/01/2026 | | | | | | | 365 | | | | 366,953 | |
Imperial Brands Finance PLC
3.50%, 07/26/2026(a) | | | | | | | 376 | | | | 367,544 | |
Kraft Heinz Foods Co.
3.00%, 06/01/2026 | | | | | | | 381 | | | | 371,860 | |
3.875%, 05/15/2027 | | | | | | | 70 | | | | 68,797 | |
Molson Coors Brewing Co.
3.00%, 07/15/2026 | | | | | | | 393 | | | | 382,849 | |
Philip Morris International, Inc.
0.875%, 05/01/2026 | | | | | | | 15 | | | | 14,251 | |
2.75%, 02/25/2026 | | | | | | | 65 | | | | 63,586 | |
4.875%, 02/13/2026 | | | | | | | 131 | | | | 131,470 | |
4.875%, 02/13/2029 | | | | | | | 272 | | | | 274,717 | |
Reynolds American, Inc.
4.45%, 06/12/2025 | | | | | | | 126 | | | | 125,709 | |
Royalty Pharma PLC
1.20%, 09/02/2025 | | | | | | | 426 | | | | 413,906 | |
Stryker Corp.
1.15%, 06/15/2025 | | | | | | | 164 | | | | 160,910 | |
3.50%, 03/15/2026 | | | | | | | 320 | | | | 315,641 | |
Sysco Corp.
3.30%, 07/15/2026 | | | | | | | 49 | | | | 47,990 | |
Tyson Foods, Inc.
4.00%, 03/01/2026 | | | | | | | 374 | | | | 370,810 | |
| | | | | | | | | | | | |
| | | | | | | | | | | 6,131,609 | |
| | | | | | | | | | | | |
Energy – 0.5% | | | | | | | | | | | | |
Continental Resources, Inc./OK
2.268%, 11/15/2026(a) | | | | | | | 29 | | | | 27,482 | |
EQM Midstream Partners LP
5.50%, 07/15/2028 | | | | | | | 74 | | | | 75,379 | |
ONEOK, Inc.
5.55%, 11/01/2026 | | | | | | | 369 | | | | 374,162 | |
| | | | | | | | | | | | |
| | | | | | | | | | | 477,023 | |
| | | | | | | | | | | | |
| | |
| |
| abfunds.com | | AB SHORT DURATION INCOME ETF | 3 |
PORTFOLIO OF INVESTMENTS (continued)
| | | | | | | | | | | | |
| | | | | | Principal
Amount
(000) | | | U.S. $ Value | |
| |
Other Industrial – 0.1% | | | | | | | | | | | | |
Ritchie Bros Holdings, Inc.
6.75%, 03/15/2028(a) | | | U.S.$ | | | | 78 | | | $ | 80,206 | |
| | | | | | | | | | | | |
| | | |
Services – 1.1% | | | | | | | | | | | | |
Mastercard, Inc.
2.95%, 11/21/2026 | | | | | | | 436 | | | | 424,219 | |
PayPal Holdings, Inc.
2.65%, 10/01/2026 | | | | | | | 128 | | | | 123,895 | |
S&P Global, Inc.
2.45%, 03/01/2027 | | | | | | | 433 | | | | 414,624 | |
| | | | | | | | | | | | |
| | | | | | | | | | | 962,738 | |
| | | | | | | | | | | | |
Technology – 3.5% | | | | | | | | | | | | |
Analog Devices, Inc.
3.50%, 12/05/2026 | | | | | | | 398 | | | | 391,059 | |
Apple, Inc.
0.70%, 02/08/2026 | | | | | | | 413 | | | | 395,811 | |
2.45%, 08/04/2026 | | | | | | | 6 | | | | 5,822 | |
Fiserv, Inc.
3.20%, 07/01/2026 | | | | | | | 416 | | | | 406,594 | |
5.15%, 03/15/2027 | | | | | | | 52 | | | | 52,637 | |
Honeywell International, Inc.
2.50%, 11/01/2026 | | | | | | | 240 | | | | 231,878 | |
International Business Machines Corp.
3.30%, 05/15/2026 | | | | | | | 158 | | | | 155,240 | |
Lam Research Corp.
3.75%, 03/15/2026 | | | | | | | 393 | | | | 389,137 | |
Oracle Corp.
1.65%, 03/25/2026 | | | | | | | 166 | | | | 159,682 | |
2.65%, 07/15/2026 | | | | | | | 68 | | | | 65,991 | |
QUALCOMM, Inc.
1.30%, 05/20/2028 | | | | | | | 56 | | | | 50,467 | |
3.25%, 05/20/2027 | | | | | | | 376 | | | | 366,059 | |
VMware LLC
1.40%, 08/15/2026 | | | | | | | 442 | | | | 417,655 | |
| | | | | | | | | | | | |
| | | | | | | | | | | 3,088,032 | |
| | | | | | | | | | | | |
| | | | | | | | | | | 18,720,542 | |
| | | | | | | | | | | | |
Financial Institutions – 14.6% | |
Banking – 12.5% | |
American Express Co.
4.99%, 05/01/2026 | | | | | | | 185 | | | | 185,131 | |
5.098%, 02/16/2028 | | | | | | | 131 | | | | 132,018 | |
6.338%, 10/30/2026 | | | | | | | 398 | | | | 403,437 | |
Banco Santander SA
1.722%, 09/14/2027 | | | | | | | 200 | | | | 188,760 | |
Bank of America Corp.
1.319%, 06/19/2026 | | | | | | | 398 | | | | 390,430 | |
| | |
| |
4 | AB SHORT DURATION INCOME ETF | | abfunds.com |
PORTFOLIO OF INVESTMENTS (continued)
| | | | | | | | | | |
| | | | | Principal
Amount
(000) | | | U.S. $ Value | |
| |
Bank of New York Mellon Corp. (The)
4.414%, 07/24/2026 | | U.S.$ | | | 24 | | | $ | 23,927 | |
Barclays PLC
5.20%, 05/12/2026 | | | | | 111 | | | | 111,070 | |
5.829%, 05/09/2027 | | | | | 361 | | | | 365,101 | |
7.325%, 11/02/2026 | | | | | 234 | | | | 238,727 | |
Capital One Financial Corp.
4.20%, 10/29/2025 | | | | | 286 | | | | 284,127 | |
Citigroup, Inc.
1.122%, 01/28/2027 | | | | | 23 | | | | 22,035 | |
1.462%, 06/09/2027 | | | | | 119 | | | | 113,144 | |
3.106%, 04/08/2026 | | | | | 208 | | | | 206,700 | |
3.20%, 10/21/2026 | | | | | 402 | | | | 391,202 | |
3.887%, 01/10/2028 | | | | | 152 | | | | 149,231 | |
Deutsche Bank AG/New York NY
2.129%, 11/24/2026 | | | | | 529 | | | | 514,341 | |
7.146%, 07/13/2027 | | | | | 364 | | | | 376,001 | |
Goldman Sachs Bank USA/New York NY
Series B
5.283%, 03/18/2027 | | | | | 30 | | | | 30,200 | |
Goldman Sachs Group, Inc. (The)
1.431%, 03/09/2027 | | | | | 435 | | | | 416,904 | |
5.798%, 08/10/2026 | | | | | 196 | | | | 197,288 | |
Series VAR
1.093%, 12/09/2026 | | | | | 91 | | | | 87,633 | |
HSBC Holdings PLC
4.583%, 06/19/2029 | | | | | 214 | | | | 211,267 | |
5.597%, 05/17/2028 | | | | | 506 | | | | 513,433 | |
ING Groep NV
1.726%, 04/01/2027 | | | | | 381 | | | | 365,238 | |
JPMorgan Chase & Co.
1.04%, 02/04/2027 | | | | | 291 | | | | 278,539 | |
1.045%, 11/19/2026 | | | | | 260 | | | | 250,999 | |
1.47%, 09/22/2027 | | | | | 148 | | | | 139,687 | |
3.96%, 01/29/2027 | | | | | 59 | | | | 58,484 | |
Lloyds Banking Group PLC
1.627%, 05/11/2027 | | | | | 395 | | | | 376,881 | |
5.985%, 08/07/2027 | | | | | 175 | | | | 177,993 | |
Macquarie Group Ltd.
1.34%, 01/12/2027(a) | | | | | 432 | | | | 414,953 | |
Morgan Stanley
4.21%, 04/20/2028 | | | | | 85 | | | | 83,996 | |
4.679%, 07/17/2026 | | | | | 401 | | | | 400,419 | |
6.138%, 10/16/2026 | | | | | 235 | | | | 237,613 | |
Nationwide Building Society
6.557%, 10/18/2027(a) | | | | | 210 | | | | 215,874 | |
PNC Financial Services Group, Inc. (The)
4.758%, 01/26/2027 | | | | | 79 | | | | 78,993 | |
5.812%, 06/12/2026 | | | | | 392 | | | | 394,250 | |
| | |
| |
| abfunds.com | | AB SHORT DURATION INCOME ETF | 5 |
PORTFOLIO OF INVESTMENTS (continued)
| | | | | | | | | | | | |
| | | | | | Principal
Amount
(000) | | | U.S. $ Value | |
| |
Santander UK Group Holdings PLC
6.833%, 11/21/2026 | | | U.S.$ | | | | 369 | | | $ | 374,830 | |
Societe Generale SA
5.519%, 01/19/2028(a) | | | | | | | 443 | | | | 445,853 | |
Synchrony Financial
3.95%, 12/01/2027 | | | | | | | 65 | | | | 62,801 | |
Truist Financial Corp.
4.26%, 07/28/2026 | | | | | | | 407 | | | | 405,726 | |
5.90%, 10/28/2026 | | | | | | | 72 | | | | 72,646 | |
UBS Group AG
4.703%, 08/05/2027(a) | | | | | | | 367 | | | | 365,444 | |
Wells Fargo & Co.
2.188%, 04/30/2026 | | | | | | | 149 | | | | 147,365 | |
3.908%, 04/25/2026 | | | | | | | 140 | | | | 139,453 | |
| | | | | | | | | | | | |
| | | | | | | | | | | 11,040,144 | |
| | | | | | | | | | | | |
Finance – 0.0% | |
Air Lease Corp.
3.375%, 07/01/2025 | | | | | | | 7 | | | | 6,936 | |
| | | | | | | | | | | | |
| | | |
Insurance – 0.9% | | | | | | | | | | | | |
Athene Global Funding
1.985%, 08/19/2028(a) | | | | | | | 75 | | | | 67,533 | |
5.62%, 05/08/2026(a) | | | | | | | 402 | | | | 405,892 | |
5.684%, 02/23/2026(a) | | | | | | | 251 | | | | 253,206 | |
Cigna Group (The)
1.25%, 03/15/2026 | | | | | | | 70 | | | | 66,996 | |
| | | | | | | | | | | | |
| | | | | | | | | | | 793,627 | |
| | | | | | | | | | | | |
REITs – 1.2% | |
American Tower Corp.
4.00%, 06/01/2025 | | | | | | | 330 | | | | 328,426 | |
GLP Capital LP/GLP Financing II, Inc.
5.375%, 04/15/2026 | | | | | | | 406 | | | | 406,454 | |
Newmark Group, Inc.
7.50%, 01/12/2029 | | | | | | | 11 | | | | 11,662 | |
VICI Properties LP/VICI Note Co., Inc.
4.25%, 12/01/2026(a) | | | | | | | 371 | | | | 364,504 | |
| | | | | | | | | | | | |
| | | | | | | | | | | 1,111,046 | |
| | | | | | | | | | | | |
| | | | | | | | | | | 12,951,753 | |
| | | | | | | | | | | | |
Utility – 1.1% | | | | | | | | | | | | |
Electric – 1.1% | | | | | | | | | | | | |
DTE Energy Co.
Series F
1.05%, 06/01/2025 | | | | | | | 84 | | | | 82,416 | |
Florida Power & Light Co.
4.40%, 05/15/2028 | | | | | | | 171 | | | | 170,730 | |
5.05%, 04/01/2028 | | | | | | | 355 | | | | 361,486 | |
| | |
| |
6 | AB SHORT DURATION INCOME ETF | | abfunds.com |
PORTFOLIO OF INVESTMENTS (continued)
| | | | | | | | | | | | |
| | | | | | Principal
Amount
(000) | | | U.S. $ Value | |
| |
Vistra Operations Co. LLC
3.70%, 01/30/2027(a) | | | U.S.$ | | | | 386 | | | $ | 376,574 | |
5.05%, 12/30/2026(a) | | | | | | | 10 | | | | 10,027 | |
| | | | | | | | | | | | |
| | | | | | | | | | | 1,001,233 | |
| | | | | | | | | | | | |
Total Corporates - Investment Grade
(cost $32,425,096) | | | | | | | | | | | 32,673,528 | |
| | | | | | | | | | | | |
| | | | | | | | | | | | |
GOVERNMENTS - TREASURIES – 30.3% | | | | | | | | | | | | |
United States – 30.3% | |
U.S. Treasury Notes
3.50%, 09/30/2026 | | | | | | | 620 | | | | 612,347 | |
3.50%, 09/30/2029 | | | | | | | 560 | | | | 545,650 | |
3.75%, 08/31/2026 | | | | | | | 800 | | | | 793,500 | |
4.00%, 01/31/2029 | | | | | | | 1,300 | | | | 1,294,312 | |
4.00%, 07/31/2029 | | | | | | | 2,591 | | | | 2,580,474 | |
4.125%, 03/31/2029 | | | | | | | 1,003 | | | | 1,003,313 | |
4.25%, 02/28/2029 | | | | | | | 2,470 | | | | 2,483,122 | |
4.25%, 06/30/2029 | | | | | | | 3,013 | | | | 3,030,387 | |
4.375%, 07/31/2026 | | | | | | | 875 | | | | 876,914 | |
4.375%, 08/31/2028 | | | | | | | 1,036 | | | | 1,044,943 | |
4.375%, 11/30/2028 | | | | | | | 970 | | | | 979,094 | |
4.625%, 09/30/2028 | | | | | | | 4,330 | | | | 4,406,452 | |
4.625%, 04/30/2029 | | | | | | | 1,060 | | | | 1,082,028 | |
4.875%, 04/30/2026 | | | | | | | 2,327 | | | | 2,345,907 | |
4.875%, 05/31/2026 | | | | | | | 2,750 | | | | 2,773,633 | |
4.875%, 10/31/2028 | | | | | | | 950 | | | | 975,531 | |
| | | | | | | | | | | | |
| | | |
Total Governments - Treasuries
(cost $26,669,219) | | | | | | | | | | | 26,827,607 | |
| | | | | | | | | | | | |
| | | | | | | | | | | | |
ASSET-BACKED SECURITIES – 12.0% | | | | | | | | | | | | |
Other ABS - Fixed Rate – 7.8% | |
Affirm Asset Securitization Trust
Series 2023-A, Class A
6.61%, 01/18/2028(a) | | | | | | | 383 | | | | 383,717 | |
Series 2023-B, Class 1A
6.82%, 09/15/2028(a) | | | | | | | 350 | | | | 354,633 | |
Series 2023-B, Class A
6.82%, 09/15/2028(a) | | | | | | | 150 | | | | 151,986 | |
Series 2024-X2, Class A
5.22%, 12/17/2029(a) | | | | | | | 114 | | | | 114,037 | |
Avant Loans Funding Trust
Series 2024-REV1, Class A
5.92%, 10/15/2033(a) | | | | | | | 255 | | | | 256,307 | |
BHG Securitization Trust
Series 2023-A, Class A
5.55%, 04/17/2036(a) | | | | | | | 76 | | | | 76,269 | |
Series 2023-B, Class A
6.92%, 12/17/2036(a) | | | | | | | 194 | | | | 200,042 | |
| | |
| |
| abfunds.com | | AB SHORT DURATION INCOME ETF | 7 |
PORTFOLIO OF INVESTMENTS (continued)
| | | | | | | | | | |
| | | | | Principal
Amount
(000) | | | U.S. $ Value | |
| |
Cherry Securitization Trust
Series 2024-1A, Class A
5.70%, 04/15/2032(a) | | U.S.$ | | | 280 | | | $ | 277,726 | |
Dext ABS LLC
Series 2023-1, Class A2
5.99%, 03/15/2032(a) | | | | | 129 | | | | 129,984 | |
Equify ABS LLC
Series 2024-1A, Class A
5.43%, 04/18/2033(a) | | | | | 139 | | | | 138,793 | |
Granite Park Equipment Leasing LLC
Series 2023-1A, Class A3
6.46%, 09/20/2032(a) | | | | | 250 | | | | 259,041 | |
Lendmark Funding Trust
Series 2023-1A, Class A
5.59%, 05/20/2033(a) | | | | | 210 | | | | 210,526 | |
Series 2024-1A, Class A
5.53%, 06/21/2032(a) | | | | | 300 | | | | 302,438 | |
Mariner Finance Issuance Trust
Series 2023-AA, Class A
6.70%, 10/22/2035(a) | | | | | 500 | | | | 507,503 | |
Oportun Funding Trust
Series 2024-3, Class A
5.26%, 08/15/2029(a) | | | | | 176 | | | | 175,553 | |
Pagaya AI Debt Grantor Trust
Series 2024-10, Class A
5.183%, 06/15/2032(a) | | | | | 150 | | | | 149,939 | |
Series 2024-S1, Class ABC
7.262%, 09/15/2031(a)(c) | | | | | 235 | | | | 238,665 | |
Pagaya AI Debt Trust
Series 2023-1, Class A
7.556%, 07/15/2030(a) | | | | | 11 | | | | 10,553 | |
Series 2023-3, Class A
7.60%, 12/16/2030(a) | | | | | 22 | | | | 21,770 | |
Series 2023-5, Class A
7.179%, 04/15/2031(a) | | | | | 9 | | | | 8,558 | |
Series 2023-6, Class A
7.128%, 06/16/2031(a) | | | | | 11 | | | | 10,673 | |
Series 2023-7, Class A
7.228%, 07/15/2031(a) | | | | | 5 | | | | 4,599 | |
Series 2024-1, Class A
6.66%, 07/15/2031(a) | | | | | 98 | | | | 98,763 | |
Series 2024-2, Class A
6.319%, 08/15/2031(a) | | | | | 104 | | | | 104,829 | |
Series 2024-3, Class A
6.258%, 10/15/2031(a) | | | | | 85 | | | | 85,453 | |
Prosper Marketplace Issuance Trust
Series 2023-1A, Class A
7.06%, 07/16/2029(a) | | | | | 85 | | | | 85,014 | |
| | |
| |
8 | AB SHORT DURATION INCOME ETF | | abfunds.com |
PORTFOLIO OF INVESTMENTS (continued)
| | | | | | | | | | | | |
| | | | | | Principal
Amount
(000) | | | U.S. $ Value | |
| |
Purchasing Power Funding LLC
Series 2024-A, Class A
5.89%, 08/15/2028(a) | | | U.S.$ | | | | 550 | | | $ | 554,435 | |
Reach ABS Trust
Series 2023-1A, Class A
7.05%, 02/18/2031(a) | | | | | | | 26 | | | | 26,226 | |
Regional Management Issuance Trust
Series 2024-2, Class A
5.11%, 12/15/2033(a) | | | | | | | 220 | | | | 220,916 | |
Republic Finance Issuance Trust
Series 2024-A, Class A
5.91%, 08/20/2032(a) | | | | | | | 250 | | | | 251,759 | |
Series 2024-B, Class A
5.42%, 11/20/2037(a) | | | | | | | 150 | | | | 150,256 | |
Sotheby’s Artfi Master Trust
Series 2024-1A, Class A1
6.43%, 12/22/2031(a) | | | | | | | 550 | | | | 555,747 | |
Theorem Funding Trust
Series 2022-3A, Class A
7.60%, 04/15/2029(a) | | | | | | | 48 | | | | 48,085 | |
Series 2023-1A, Class A
7.58%, 04/15/2029(a) | | | | | | | 47 | | | | 46,935 | |
Upstart Securitization Trust
Series 2023-2, Class A
6.77%, 06/20/2033(a) | | | | | | | 68 | | | | 68,165 | |
Series 2023-3, Class A
6.90%, 10/20/2033(a) | | | | | | | 82 | | | | 82,682 | |
Series 2024-1, Class A
5.33%, 11/20/2034(a) | | | | | | | 150 | | | | 149,972 | |
Verdant Receivables LLC
Series 2023-1A, Class A2
6.24%, 01/13/2031(a) | | | | | | | 354 | | | | 358,853 | |
| | | | | | | | | | | | |
| | | | | | | | | | | 6,871,402 | |
| | | | | | | | | | | | |
Autos - Fixed Rate – 3.2% | |
ACM Auto Trust
Series 2024-1A, Class A
7.71%, 01/21/2031(a) | | | | | | | 138 | | | | 138,729 | |
FHF Trust
Series 2023-1A, Class A2
6.57%, 06/15/2028(a) | | | | | | | 105 | | | | 106,467 | |
Hertz Vehicle Financing III LLC
Series 2024-1A, Class A
5.44%, 01/25/2029(a) | | | | | | | 154 | | | | 155,300 | |
Lendbuzz Securitization Trust
Series 2023-1A, Class A2
6.92%, 08/15/2028(a) | | | | | | | 97 | | | | 98,995 | |
| | |
| |
| abfunds.com | | AB SHORT DURATION INCOME ETF | 9 |
PORTFOLIO OF INVESTMENTS (continued)
| | | | | | | | | | | | |
| | | | | | Principal
Amount
(000) | | | U.S. $ Value | |
| |
Series 2023-2A, Class A2
7.09%, 10/16/2028(a) | | | U.S.$ | | | | 124 | | | $ | 125,844 | |
Series 2023-3A, Class A2
7.50%, 12/15/2028(a) | | | | | | | 112 | | | | 114,528 | |
Series A2, Class 24-1A
6.19%, 08/15/2029(a) | | | | | | | 204 | | | | 206,427 | |
Lobel Automobile Receivables Trust
Series 2023-1, Class A
6.97%, 07/15/2026(a) | | | | | | | 12 | | | | 12,438 | |
Series 2023-2, Class A
7.59%, 04/16/2029(a) | | | | | | | 80 | | | | 80,533 | |
Merchants Fleet Funding LLC
Series 2023-1A, Class A
7.21%, 05/20/2036(a) | | | | | | | 401 | | | | 406,475 | |
Research-Driven Pagaya Motor Asset Trust
Series 2023-3A, Class A
7.13%, 01/26/2032(a) | | | | | | | 339 | | | | 341,833 | |
Series 2023-4A, Class A
7.54%, 03/25/2032(a) | | | | | | | 414 | | | | 420,035 | |
Series 2024-3A, Class A
5.281%, 03/25/2033(a) | | | | | | | 435 | | | | 435,134 | |
Research-Driven Pagaya Motor Trust
Series 2024-1A, Class A
7.09%, 06/25/2032(a) | | | | | | | 87 | | | | 88,334 | |
Tricolor Auto Securitization Trust
Series 2024-1A, Class A
6.61%, 10/15/2027(a) | | | | | | | 125 | | | | 126,222 | |
| | | | | | | | | | | | |
| | | | | | | | | | | 2,857,294 | |
| | | | | | | | | | | | |
Credit Cards - Fixed Rate – 0.9% | |
Brex Commercial Charge Card Master Trust
Series 2024-1, Class A1
6.05%, 07/15/2027(a) | | | | | | | 325 | | | | 328,320 | |
Continental Finance Credit Card ABS Master Trust
Series 2024-A, Class A
5.78%, 12/15/2032(a) | | | | | | | 250 | | | | 249,945 | |
Mission Lane Credit Card Master Trust
Series 2023-A, Class A
7.23%, 07/17/2028(a) | | | | | | | 200 | | | | 201,352 | |
| | | | | | | | | | | | |
| | | | | | | | | | | 779,617 | |
| | | | | | | | | | | | |
Other ABS - Floating Rate – 0.1% | |
Capital Street Master Trust
Series 2024-1, Class A
4.99% (CME Term SOFR + 1.35%), 10/16/2028(a)(d) | | | | | | | 62 | | | | 62,097 | |
| | | | | | | | | | | | |
| | | |
Total Asset-Backed Securities
(cost $10,476,975) | | | | | | | | | | | 10,570,410 | |
| | | | | | | | | | | | |
| | |
| |
10 | AB SHORT DURATION INCOME ETF | | abfunds.com |
PORTFOLIO OF INVESTMENTS (continued)
| | | | | | | | | | | | |
| | | | | | Principal
Amount
(000) | | | U.S. $ Value | |
| |
COLLATERALIZED LOAN OBLIGATIONS – 9.2% | | | | | | | | | | | | |
CLO - Floating Rate – 9.2% | |
AGL CLO 16 Ltd.
Series 2021-16A, Class A
6.009% (CME Term SOFR 3 Month + 1.39%), 01/20/2035(a)(d) | | | U.S.$ | | | | 500 | | | $ | 500,889 | |
AIMCO CLO
Series 2018-AA, Class A
5.929% (CME Term SOFR 3 Month + 1.28%), 04/17/2031(a)(d) | | | | | | | 114 | | | | 114,444 | |
Allegro CLO XI Ltd.
Series 2019-2A, Class A1AR
5.867% (CME Term SOFR 3 Month + 1.25%), 01/19/2033(a)(d) | | | | | | | 250 | | | | 250,250 | |
Apidos CLO XXX
Series XXXA, Class A1AR
5.712% (CME Term SOFR 3 Month + 1.08%), 10/18/2031(a) (d) | | | | | | | 207 | | | | 206,781 | |
Apidos Loan Fund Ltd.
Series 2024-1A, Class A1
5.896% (CME Term SOFR 3 Month + 1.27%), 04/25/2035(a)(d) | | | | | | | 250 | | | | 250,536 | |
Bain Capital Credit CLO
Series 2019-2A, Class AR2
5.778% (CME Term SOFR 3 Month + 1.13%), 10/17/2032(a)(d) | | | | | | | 249 | | | | 249,697 | |
Bain Capital Credit CLO Ltd.
Series 2019-1A, Class AR2
5.847% (CME Term SOFR 3 Month + 1.23%), 04/19/2034(a)(d) | | | | | | | 100 | | | | 100,026 | |
Series 2020-1A, Class A1R
5.882% (CME Term SOFR 3 Month + 1.25%), 04/18/2033(a)(d) | | | | | | | 215 | | | | 215,166 | |
Series 2021-4A, Class A1R
5.759% (CME Term SOFR 3 Month + 1.20%), 10/20/2034(a)(d) | | | | | | | 350 | | | | 350,026 | |
Ballyrock CLO 15 Ltd.
Series 2021-1A, Class C
8.018% (CME Term SOFR 3 Month + 3.36%), 04/15/2034(a)(d) | | | | | | | 250 | | | | 251,090 | |
Carbone CLO Ltd.
Series 2017-1A, Class A1
6.019% (CME Term SOFR 3 Month + 1.40%), 01/20/2031(a)(d) | | | | | | | 531 | | | | 532,026 | |
CIFC Funding Ltd.
Series 2018-1A, Class A
5.894% (CME Term SOFR 3 Month + 1.26%), 04/18/2031(a)(d) | | | | | | | 264 | | | | 263,796 | |
| | |
| |
| abfunds.com | | AB SHORT DURATION INCOME ETF | 11 |
PORTFOLIO OF INVESTMENTS (continued)
| | | | | | | | | | |
| | | | | Principal
Amount
(000) | | | U.S. $ Value | |
| |
Dryden 113 CLO Ltd.
Series 2022-113A, Class AR2
5.867% (CME Term SOFR 3 Month + 1.25%), 10/15/2037(a)(d) | | U.S.$ | | | 250 | | | $ | 250,071 | |
Galaxy 30 CLO Ltd.
Series 2022-30A, Class D
8.006% (CME Term SOFR 3 Month + 3.35%), 04/15/2035(a)(d) | | | | | 250 | | | | 250,975 | |
Goldentree Loan Management US CLO 8 Ltd.
Series 2020-8A, Class ARR
5.752% (CME Term SOFR 3 Month + 1.15%), 10/20/2034(a)(d) | | | | | 450 | | | | 451,840 | |
KKR CLO 21 Ltd.
Series 21, Class A
5.918% (CME Term SOFR 3 Month + 1.26%), 04/15/2031(a)(d) | | | | | 250 | | | | 250,815 | |
Neuberger Berman Loan Advisers CLO 42 Ltd
Series 2021-42A, Class A
6.009% (CME Term SOFR 3 Month + 1.36%), 07/16/2035(a)(d) | | | | | 500 | | | | 501,171 | |
Palmer Square CLO Ltd.
Series 2021-3A, Class D
7.868% (CME Term SOFR 3 Month + 3.21%), 01/15/2035(a)(d) | | | | | 250 | | | | 251,270 | |
PPM CLO 5 Ltd.
Series 2021-5A, Class A
6.094% (CME Term SOFR 3 Month + 1.46%), 10/18/2034(a)(d) | | | | | 500 | | | | 500,642 | |
Rad CLO 14 Ltd.
Series 2021-14A, Class A
6.088% (CME Term SOFR 3 Month + 1.43%), 01/15/2035(a)(d) | | | | | 550 | | | | 550,982 | |
Regatta XIX Funding Ltd.
Series 2022-1A, Class A1
5.937% (CME Term SOFR 3 Month + 1.32%), 04/20/2035(a)(d) | | | | | 470 | | | | 470,834 | |
Regatta XVI Funding Ltd.
Series 2019-2A, Class A1R
5.856% (CME Term SOFR 3 Month + 1.20%), 01/15/2033(a)(d) | | | | | 250 | | | | 250,059 | |
Sixth Street CLO XVII Ltd.
Series 2021-17A, Class A
6.119% (CME Term SOFR 3 Month + 1.50%), 01/20/2034(a)(d) | | | | | 470 | | | | 471,151 | |
VERDE CLO Ltd.
Series 2019-1A, Class ARR
5.766% (CME Term SOFR 3 Month + 1.11%), 04/15/2032(a)(d) | | | | | 211 | | | | 211,523 | |
| | |
| |
12 | AB SHORT DURATION INCOME ETF | | abfunds.com |
PORTFOLIO OF INVESTMENTS (continued)
| | | | | | | | | | | | |
| | | | | | Principal
Amount
(000) | | | U.S. $ Value | |
| |
Voya CLO Ltd.
Series 2018-1A, Class A1
5.829% (CME Term SOFR 3 Month + 1.21%), 04/19/2031(a)(d) | | | U.S.$ | | | | 231 | | | $ | 230,925 | |
Series 2018-3A, Class A1R2
5.856% (CME Term SOFR 3 Month + 1.20%), 10/15/2031(a)(d) | | | | | | | 156 | | | | 156,236 | |
| | | | | | | | | | | | |
| | | |
Total Collateralized Loan Obligations
(cost $8,047,654) | | | | | | | | | | | 8,083,221 | |
| | | | | | | | | | | | |
| | | | | | | | | | | | |
CORPORATES - NON-INVESTMENT GRADE – 6.7% | | | | | | | | | | | | |
Industrial – 6.2% | |
Basic – 0.3% | |
Arsenal AIC Parent LLC
8.00%, 10/01/2030(a) | | | | | | | 38 | | | | 40,026 | |
ASP Unifrax Holdings, Inc.
7.10% (5.85% Cash and 1.25% PIK), 09/30/2029(a)(e) | | | | | | | 9 | | | | 5,215 | |
Graphic Packaging International LLC
3.50%, 03/15/2028(a) | | | | | | | 125 | | | | 117,448 | |
INEOS Finance PLC
6.375%, 04/15/2029(a) | | | EUR | | | | 101 | | | | 110,761 | |
Sealed Air Corp./Sealed Air Corp. US
6.125%, 02/01/2028(a) | | | U.S.$ | | | | 27 | | | | 27,257 | |
| | | | | | | | | | | | |
| | | | | | | | | | | 300,707 | |
| | | | | | | | | | | | |
Capital Goods – 0.5% | |
Ball Corp.
6.00%, 06/15/2029 | | | | | | | 97 | | | | 99,024 | |
Eco Material Technologies, Inc.
7.875%, 01/31/2027(a) | | | | | | | 92 | | | | 93,229 | |
Esab Corp.
6.25%, 04/15/2029(a) | | | | | | | 26 | | | | 26,501 | |
GFL Environmental, Inc.
6.75%, 01/15/2031(a) | | | | | | | 19 | | | | 19,706 | |
LSB Industries, Inc.
6.25%, 10/15/2028(a)(b) | | | | | | | 147 | | | | 142,841 | |
Summit Materials LLC/Summit Materials Finance Corp.
7.25%, 01/15/2031(a) | | | | | | | 21 | | | | 22,408 | |
| | | | | | | | | | | | |
| | | | | | | | | | | 403,709 | |
| | | | | | | | | | | | |
Communications - Media – 0.7% | |
Banijay Entertainment SAS
7.00%, 05/01/2029(a) | | | EUR | | | | 170 | | | | 188,316 | |
CCO Holdings LLC/CCO Holdings Capital Corp.
4.50%, 08/15/2030(a) | | | U.S.$ | | | | 26 | | | | 23,859 | |
| | |
| |
| abfunds.com | | AB SHORT DURATION INCOME ETF | 13 |
PORTFOLIO OF INVESTMENTS (continued)
| | | | | | | | | | | | |
| | | | | | Principal
Amount
(000) | | | U.S. $ Value | |
| |
Clear Channel Outdoor Holdings, Inc.
5.125%, 08/15/2027(a) | | | U.S.$ | | | | 97 | | | $ | 94,891 | |
DISH DBS Corp.
5.25%, 12/01/2026(a) | | | | | | | 67 | | | | 61,709 | |
5.75%, 12/01/2028(a) | | | | | | | 32 | | | | 27,963 | |
McGraw-Hill Education, Inc.
5.75%, 08/01/2028(a) | | | | | | | 65 | | | | 63,715 | |
Neptune Bidco US, Inc.
9.29%, 04/15/2029(a) | | | | | | | 108 | | | | 100,166 | |
Radiate Holdco LLC/Radiate Finance, Inc.
4.50%, 09/15/2026(a) | | | | | | | 85 | | | | 73,328 | |
| | | | | | | | | | | | |
| | | | | | | | | | | 633,947 | |
| | | | | | | | | | | | |
Consumer Cyclical - Automotive – 0.3% | |
Tenneco, Inc.
8.00%, 11/17/2028(a) | | | | | | | 79 | | | | 74,996 | |
ZF North America Capital, Inc.
6.75%, 04/23/2030(a) | | | | | | | 160 | | | | 156,350 | |
| | | | | | | | | | | | |
| | | | | | | | | | | 231,346 | |
| | | | | | | | | | | | |
Consumer Cyclical - Entertainment – 0.4% | |
Carnival Corp.
5.75%, 03/01/2027(a) | | | | | | | 22 | | | | 22,070 | |
Lindblad Expeditions LLC
6.75%, 02/15/2027(a) | | | | | | | 28 | | | | 28,079 | |
Royal Caribbean Cruises Ltd.
5.375%, 07/15/2027(a) | | | | | | | 42 | | | | 41,947 | |
5.50%, 08/31/2026(a) | | | | | | | 31 | | | | 31,046 | |
Viking Ocean Cruises Ship VII Ltd.
5.625%, 02/15/2029(a) | | | | | | | 14 | | | | 13,839 | |
VOC Escrow Ltd.
5.00%, 02/15/2028(a) | | | | | | | 263 | | | | 256,909 | |
| | | | | | | | | | | | |
| | | | | | | | | | | 393,890 | |
| | | | | | | | | | | | |
Consumer Cyclical - Other – 0.7% | |
Brookfield Residential Properties, Inc./Brookfield Residential US LLC
6.25%, 09/15/2027(a) | | | | | | | 86 | | | | 85,804 | |
Churchill Downs, Inc.
4.75%, 01/15/2028(a) | | | | | | | 97 | | | | 94,708 | |
Cirsa Finance International SARL
6.50%, 03/15/2029(a) | | | EUR | | | | 100 | | | | 111,264 | |
Hilton Domestic Operating Co., Inc.
5.875%, 04/01/2029(a) | | | U.S.$ | | | | 104 | | | | 104,975 | |
6.125%, 04/01/2032(a) | | | | | | | 77 | | | | 77,886 | |
Hilton Grand Vacations Borrower Escrow LLC/Hilton Grand Vacations Borrower Esc
4.875%, 07/01/2031(a) | | | | | | | 9 | | | | 8,131 | |
5.00%, 06/01/2029(a) | | | | | | | 45 | | | | 42,796 | |
| | |
| |
14 | AB SHORT DURATION INCOME ETF | | abfunds.com |
PORTFOLIO OF INVESTMENTS (continued)
| | | | | | | | | | | | |
| | | | | | Principal
Amount
(000) | | | U.S. $ Value | |
| |
Shea Homes LP/Shea Homes Funding Corp.
4.75%, 02/15/2028 | | | U.S.$ | | | | 11 | | | $ | 10,684 | |
Taylor Morrison Communities, Inc.
5.875%, 06/15/2027(a) | | | | | | | 64 | | | | 64,703 | |
Travel + Leisure Co.
6.625%, 07/31/2026(a) | | | | | | | 20 | | | | 20,240 | |
| | | | | | | | | | | | |
| | | | | | | | | | | 621,191 | |
| | | | | | | | | | | | |
Consumer Cyclical - Restaurants – 0.1% | |
1011778 BC ULC/New Red Finance, Inc.
3.875%, 01/15/2028(a) | | | | | | | 17 | | | | 16,211 | |
4.375%, 01/15/2028(a) | | | | | | | 35 | | | | 33,680 | |
| | | | | | | | | | | | |
| | | | | | | | | | | 49,891 | |
| | | | | | | | | | | | |
Consumer Cyclical - Retailers – 0.0% | |
Bath & Body Works, Inc.
9.375%, 07/01/2025(a) | | | | | | | 6 | | | | 6,137 | |
| | | | | | | | | | | | |
| | | |
Consumer Non-Cyclical – 0.4% | | | | | | | | | | | | |
Bausch + Lomb Corp.
8.375%, 10/01/2028(a) | | | | | | | 190 | | | | 199,057 | |
Elanco Animal Health, Inc.
6.65%, 08/28/2028(b) | | | | | | | 82 | | | | 84,850 | |
Embecta Corp.
5.00%, 02/15/2030(a) | | | | | | | 29 | | | | 26,947 | |
Medline Borrower LP
3.875%, 04/01/2029(a) | | | | | | | 26 | | | | 24,383 | |
MPH Acquisition Holdings LLC
5.75%, 11/01/2028(a) | | | | | | | 56 | | | | 26,041 | |
Newell Brands, Inc.
5.70%, 04/01/2026(b) | | | | | | | 17 | | | | 17,081 | |
6.375%, 09/15/2027 | | | | | | | 15 | | | | 15,269 | |
| | | | | | | | | | | | |
| | | | | | | | | | | 393,628 | |
| | | | | | | | | | | | |
Energy – 1.9% | |
Blue Racer Midstream LLC/Blue Racer Finance Corp.
7.00%, 07/15/2029(a) | | | | | | | 73 | | | | 75,113 | |
Buckeye Partners LP
6.875%, 07/01/2029(a) | | | | | | | 58 | | | | 59,238 | |
CITGO Petroleum Corp.
7.00%, 06/15/2025(a) | | | | | | | 33 | | | | 33,044 | |
8.375%, 01/15/2029(a) | | | | | | | 186 | | | | 193,485 | |
Civitas Resources, Inc.
5.00%, 10/15/2026(a) | | | | | | | 30 | | | | 29,560 | |
8.375%, 07/01/2028(a) | | | | | | | 213 | | | | 222,280 | |
Hilcorp Energy I LP/Hilcorp Finance Co.
6.25%, 11/01/2028(a) | | | | | | | 73 | | | | 72,452 | |
Howard Midstream Energy Partners LLC
8.875%, 07/15/2028(a) | | | | | | | 141 | | | | 149,672 | |
| | |
| |
| abfunds.com | | AB SHORT DURATION INCOME ETF | 15 |
PORTFOLIO OF INVESTMENTS (continued)
| | | | | | | | | | | | |
| | | | | | Principal
Amount
(000) | | | U.S. $ Value | |
| |
Nabors Industries, Inc.
7.375%, 05/15/2027(a) | | | U.S.$ | | | | 11 | | | $ | 11,021 | |
New Fortress Energy, Inc.
6.50%, 09/30/2026(a) | | | | | | | 112 | | | | 104,720 | |
8.75%, 03/15/2029(a) | | | | | | | 93 | | | | 75,975 | |
NFE Financing LLC
12.00%, 11/15/2029(a) | | | | | | | 160 | | | | 160,555 | |
NGL Energy Operating LLC/NGL Energy Finance Corp.
8.125%, 02/15/2029(a) | | | | | | | 105 | | | | 107,234 | |
Solaris Midstream Holdings LLC
7.625%, 04/01/2026(a) | | | | | | | 25 | | | | 25,135 | |
Sunoco LP/Sunoco Finance Corp.
7.00%, 09/15/2028(a) | | | | | | | 104 | | | | 107,201 | |
Venture Global LNG, Inc.
8.125%, 06/01/2028(a) | | | | | | | 52 | | | | 54,348 | |
9.50%, 02/01/2029(a) | | | | | | | 98 | | | | 109,490 | |
9.875%, 02/01/2032(a) | | | | | | | 99 | | | | 110,038 | |
| | | | | | | | | | | | |
| | | | | | | | | | | 1,700,561 | |
| | | | | | | | | | | | |
Other Industrial – 0.0% | |
Velocity Vehicle Group LLC
8.00%, 06/01/2029(a) | | | | | | | 12 | | | | 12,518 | |
| | | | | | | | | | | | |
| | | |
Services – 0.4% | | | | | | | | | | | | |
ANGI Group LLC
3.875%, 08/15/2028(a) | | | | | | | 127 | | | | 115,318 | |
Garda World Security Corp.
7.75%, 02/15/2028(a) | | | | | | | 103 | | | | 106,818 | |
Prime Security Services Borrower LLC/Prime Finance, Inc.
3.375%, 08/31/2027(a) | | | | | | | 23 | | | | 21,627 | |
Raven Acquisition Holdings LLC
6.875%, 11/15/2031(a) | | | | | | | 32 | | | | 31,992 | |
ZipRecruiter, Inc.
5.00%, 01/15/2030(a) | | | | | | | 33 | | | | 30,364 | |
| | | | | | | | | | | | |
| | | | | | | | | | | 306,119 | |
| | | | | | | | | | | | |
Technology – 0.2% | |
Gen Digital, Inc.
6.75%, 09/30/2027(a) | | | | | | | 42 | | | | 42,816 | |
Virtusa Corp.
7.125%, 12/15/2028(a) | | | | | | | 10 | | | | 9,661 | |
Western Digital Corp.
4.75%, 02/15/2026 | | | | | | | 163 | | | | 161,567 | |
| | | | | | | | | | | | |
| | | | | | | | | | | 214,044 | |
| | | | | | | | | | | | |
Transportation - Services – 0.3% | |
Hertz Corp. (The)
12.625%, 07/15/2029(a) | | | | | | | 135 | | | | 146,297 | |
| | |
| |
16 | AB SHORT DURATION INCOME ETF | | abfunds.com |
PORTFOLIO OF INVESTMENTS (continued)
| | | | | | | | | | | | |
| | | | | | Principal
Amount
(000) | | | U.S. $ Value | |
| |
Loxam SAS
4.50%, 02/15/2027(a) | | | EUR | | | | 100 | | | $ | 106,381 | |
| | | | | | | | | | | | |
| | | | | | | | | | | 252,678 | |
| | | | | | | | | | | | |
| | | | | | | | | | | 5,520,366 | |
| | | | | | | | | | | | |
Financial Institutions – 0.5% | |
Banking – 0.0% | |
Bread Financial Holdings, Inc.
7.00%, 01/15/2026(a) | | | U.S.$ | | | | 12 | | | | 11,980 | |
| | | | | | | | | | | | |
| | | |
Brokerage – 0.1% | | | | | | | | | | | | |
Osaic Holdings, Inc.
10.75%, 08/01/2027(a) | | | | | | | 52 | | | | 53,790 | |
| | | | | | | | | | | | |
| | | |
Finance – 0.2% | | | | | | | | | | | | |
Castlelake Aviation Finance DAC
5.00%, 04/15/2027(a) | | | | | | | 62 | | | | 62,307 | |
GGAM Finance Ltd.
7.75%, 05/15/2026(a) | | | | | | | 51 | | | | 51,998 | |
8.00%, 02/15/2027(a) | | | | | | | 12 | | | | 12,429 | |
8.00%, 06/15/2028(a) | | | | | | | 77 | | | | 81,357 | |
SLM Corp.
3.125%, 11/02/2026 | | | | | | | 23 | | | | 21,905 | |
| | | | | | | | | | | | |
| | | | | | | | | | | 229,996 | |
| | | | | | | | | | | | |
Insurance – 0.1% | |
Acrisure LLC/Acrisure Finance, Inc.
7.50%, 11/06/2030(a) | | | | | | | 61 | | | | 62,295 | |
| | | | | | | | | | | | |
| | | |
REITs – 0.1% | | | | | | | | | | | | |
Iron Mountain, Inc.
5.00%, 07/15/2028(a) | | | | | | | 76 | | | | 74,125 | |
| | | | | | | | | | | | |
| | | | | | | | | | | 432,186 | |
| | | | | | | | | | | | |
Total Corporates - Non-Investment Grade
(cost 5,857,661) | | | | | | | | | | | 5,952,552 | |
| | | | | | | | | | | | |
| | | | | | | | | | | | |
COMMERCIAL MORTGAGE-BACKED SECURITIES – 1.8% | | | | | | | | | | | | |
Non-Agency Fixed Rate CMBS – 1.7% | | | | | | | | | | | | |
BAMLL Commercial Mortgage Securities Trust
Series 2013-WBRK, Class D
3.652%, 03/10/2037(a) | | | | | | | 100 | | | | 92,654 | |
BANK
Series 2020-BN28, Class XA
1.875%, 03/15/2063(f) | | | | | | | 2,015 | | | | 161,452 | |
Series 2020-BN29, Class XA
1.422%, 11/15/2053(f) | | | | | | | 965 | | | | 58,709 | |
| | |
| |
| abfunds.com | | AB SHORT DURATION INCOME ETF | 17 |
PORTFOLIO OF INVESTMENTS (continued)
| | | | | | | | | | |
| | | | | Principal
Amount
(000) | | | U.S. $ Value | |
| |
Barclays Commercial Mortgage Trust
Series 2019-C3, Class XA
1.468%, 05/15/2052(f) | | U.S.$ | | | 940 | | | $ | 42,698 | |
BBCMS Mortgage Trust
Series 2017-C1, Class XA
1.607%, 02/15/2050(f) | | | | | 1,255 | | | | 30,423 | |
CD Mortgage Trust
Series 2016-CD1, Class XA
1.477%, 08/10/2049(f) | | | | | 1,424 | | | | 18,148 | |
CFCRE Commercial Mortgage Trust
Series 2016-C4, Class XA
1.726%, 05/10/2058(f) | | | | | 69 | | | | 961 | |
Series 2017-C8, Class XA
1.635%, 06/15/2050(f) | | | | | 265 | | | | 7,318 | |
Citigroup Commercial Mortgage Trust
Series 2016-GC36, Class A5
3.616%, 02/10/2049 | | | | | 165 | | | | 160,870 | |
Series 2017-P7, Class XA
1.234%, 04/14/2050(f) | | | | | 783 | | | | 14,761 | |
Commercial Mortgage Trust
Series 2014-CR16, Class D
4.942%, 04/10/2047(a) | | | | | 100 | | | | 82,501 | |
Series 2016-DC2, Class XA
1.064%, 02/10/2049(f) | | | | | 2,260 | | | | 14,280 | |
GS Mortgage Securities Trust
Series 2013-GC13, Class D
4.00%, 07/10/2046(a) | | | | | 100 | | | | 63,574 | |
Series 2016-GS3, Class XA
1.308%, 10/10/2049(f) | | | | | 1,242 | | | | 18,268 | |
Series 2017-GS5, Class XA
0.971%, 03/10/2050(f) | | | | | 1,395 | | | | 20,416 | |
Series 2017-GS7, Class XA
1.222%, 08/10/2050(f) | | | | | 3,230 | | | | 69,634 | |
Series 2019-GC39, Class XA
1.241%, 05/10/2052(f) | | | | | 3,586 | | | | 144,713 | |
JPMBB Commercial Mortgage Securities Trust
Series 2013-C14, Class D
4.173%, 08/15/2046(a) | | | | | 75 | | | | 56,849 | |
JPMorgan Chase Commercial Mortgage Securities Trust
Series 2012-LC9, Class G
3.686%, 12/15/2047(a) | | | | | 100 | | | | 54,654 | |
Series 2013-LC11, Class B
3.499%, 04/15/2046 | | | | | 110 | | | | 92,043 | |
UBS Commercial Mortgage Trust
Series 2017-C1, Class XA
1.634%, 06/15/2050(f) | | | | | 903 | | | | 24,438 | |
| | |
| |
18 | AB SHORT DURATION INCOME ETF | | abfunds.com |
PORTFOLIO OF INVESTMENTS (continued)
| | | | | | | | | | | | |
| | | | | | Principal
Amount
(000) | | | U.S. $ Value | |
| |
Series 2017-C2, Class XA
1.209%, 08/15/2050(f) | | | U.S.$ | | | | 1,918 | | | $ | 42,359 | |
Series 2018-C14, Class XA
1.052%, 12/15/2051(f) | | | | | | | 753 | | | | 21,368 | |
Series 2018-C15, Class XA
1.049%, 12/15/2051(f) | | | | | | | 565 | | | | 16,386 | |
Series 2019-C18, Class XA
1.124%, 12/15/2052(f) | | | | | | | 1,226 | | | | 42,253 | |
UBS-Barclays Commercial Mortgage Trust
Series 2013-C6, Class D
4.061%, 04/10/2046(a) | | | | | | | 69 | | | | 59,084 | |
Wells Fargo Commercial Mortgage Trust
Series 2016-LC24, Class XA
1.748%, 10/15/2049(f) | | | | | | | 743 | | | | 15,816 | |
Series 2018-C48, Class XA
1.102%, 01/15/2052(f) | | | | | | | 736 | | | | 22,384 | |
Series 2019-C52, Class XA
1.705%, 08/15/2052(f) | | | | | | | 842 | | | | 47,327 | |
WF-RBS Commercial Mortgage Trust
Series 2011-C4, Class D
5.149%, 06/15/2044(a) | | | | | | | 44 | | | | 40,515 | |
Series 2011-C4, Class E
5.149%, 06/15/2044(a) | | | | | | | 25 | | | | 21,536 | |
| | | | | | | | | | | | |
| | | | | | | | | | | 1,558,392 | |
| | | | | | | | | | | | |
Non-Agency Floating Rate CMBS – 0.1% | |
Starwood Retail Property Trust
Series 2014-STAR, Class A
7.75% (PRIME + 0.00%), 11/15/2027(a)(d) | | | | | | | 81 | | | | 49,181 | |
| | | | | | | | | | | | |
| | | |
Total Commercial Mortgage-Backed Securities
(cost $1,774,178) | | | | | | | | | | | 1,607,573 | |
| | | | | | | | | | | | |
| | | | | | | | | | | | |
EMERGING MARKETS - SOVEREIGNS – 1.0% | |
Dominican Republic – 1.0% | |
Dominican Republic Central Bank Notes
10.50%, 01/17/2025(a)
(cost $904,303) | | | DOP | | | | 54,000 | | | | 893,465 | |
| | | | | | | | | | | | |
| | | | | | | | | | | | |
COLLATERALIZED MORTGAGE OBLIGATIONS – 0.4% | | | | | | | | | | | | |
Risk Share Floating Rate – 0.3% | |
Federal Home Loan Mortgage Corp. Structured Agency Credit Risk Debt Notes
Series 2021-DNA6, Class M2
6.234% (CME Term SOFR + 1.50%), 10/25/2041(a)(d) | | | U.S.$ | | | | 150 | | | | 150,762 | |
| | |
| |
| abfunds.com | | AB SHORT DURATION INCOME ETF | 19 |
PORTFOLIO OF INVESTMENTS (continued)
| | | | | | | | | | | | |
| | | | | | Principal
Amount
(000) | | | U.S. $ Value | |
| |
Series 2022-HQA1, Class M1B
8.234% (CME Term SOFR + 3.50%), 03/25/2042(a)(d) | | | U.S.$ | | | | 20 | | | $ | 20,786 | |
Federal National Mortgage Association Connecticut Avenue Securities
Series 2016-C04, Class 1B
15.099% (CME Term SOFR + 10.36%), 01/25/2029(d) | | | | | | | 117 | | | | 132,978 | |
| | | | | | | | | | | | |
| | | | | | | | | | | 304,526 | |
| | | | | | | | | | | | |
Agency Fixed Rate – 0.1% | |
Federal Home Loan Mortgage Corp. REMICs
Series 4913, Class IO
6.00%, 04/15/2041(f) | | | | | | | 55 | | | | 9,574 | |
Federal National Mortgage Association REMICs
Series 2012-120, Class CI
3.50%, 12/25/2031(f) | | | | | | | 20 | | | | 113 | |
Series 2016-26, Class IO
5.00%, 05/25/2046(f) | | | | | | | 117 | | | | 15,887 | |
Series 2016-31, Class IO
5.00%, 06/25/2046(f) | | | | | | | 159 | | | | 22,332 | |
Series 2016-64, Class BI
5.00%, 09/25/2046(f) | | | | | | | 18 | | | | 2,321 | |
| | | | | | | | | | | | |
| | | | | | | | | | | 50,227 | |
| | | | | | | | | | | | |
Agency Floating Rate – 0.0% | |
Federal Home Loan Mortgage Corp. REMICs
Series 4372, Class JS
1.18% (5.99% – CME Term SOFR), 08/15/2044(d)(g) | | | | | | | 71 | | | | 7,188 | |
Federal National Mortgage Association REMICs
Series 2012-17, Class ES
1.702% (6.44% – CME Term SOFR), 03/25/2041(d)(g) | | | | | | | 31 | | | | 1,115 | |
Series 2012-17, Class SE
1.102% (5.84% – CME Term SOFR), 03/25/2042(d)(g) | | | | | | | 53 | | | | 5,237 | |
Series 2019-25, Class SA
1.202% (5.94% – CME Term SOFR), 06/25/2049(d)(g) | | | | | | | 35 | | | | 3,755 | |
Series 2019-42, Class SQ
1.202% (5.94% – CME Term SOFR), 08/25/2049(d)(g) | | | | | | | 31 | | | | 3,230 | |
| | | | | | | | | | | | |
| | | | | | | | | | | 20,525 | |
| | | | | | | | | | | | |
Total Collateralized Mortgage Obligations
(cost $366,976) | | | | | | | | | | | 375,278 | |
| | | | | | | | | | | | |
| | | | | | | | | | | | |
| | |
| |
20 | AB SHORT DURATION INCOME ETF | | abfunds.com |
PORTFOLIO OF INVESTMENTS (continued)
| | | | | | | | | | | | |
| | | | | | Principal
Amount
(000) | | | U.S. $ Value | |
| |
BANK LOANS – 0.3% | | | | | | | | | | | | |
Industrial – 0.3% | | | | | | | | | | | | |
Capital Goods – 0.0% | | | | | | | | | | | | |
Chariot Buyer LLC
7.923% (SOFR 1 Month + 3.25%), 11/03/2028(h) | | | U.S.$ | | | | 10 | | | $ | 9,767 | |
| | | | | | | | | | | | |
| | | |
Communications - Media – 0.0% | | | | | | | | | | | | |
DirecTV Financing LLC
10.097% (SOFR 3 Month + 5.25%), 08/02/2029(h) | | | | | | | 22 | | | | 21,973 | |
| | | | | | | | | | | | |
| | | |
Consumer Cyclical - Entertainment – 0.2% | | | | | | | | | | | | |
Seaworld Parks & Entertainment, Inc.
7.073% (SOFR 1 Month + 2.50%), 08/25/2028(h) | | | | | | | 139 | | | | 138,604 | |
| | | | | | | | | | | | |
| | | |
Energy – 0.1% | | | | | | | | | | | | |
GIP II Blue Holding LP
8.323% (SOFR 1 Month + 3.75%), 09/29/2028(h) | | | | | | | 45 | | | | 44,826 | |
| | | | | | | | | | | | |
| | | |
Technology – 0.0% | | | | | | | | | | | | |
Ascend Learning LLC
10.423% (SOFR 1 Month + 5.75%), 12/10/2029(h) | | | | | | | 30 | | | | 29,925 | |
Loyalty Ventures, Inc.
14.000% (PRIME 3 Month + 5.50%), 11/03/2027(c)(h)(i)(j) | | | | | | | 72 | | | | 543 | |
MedAssets Software Intermediate Holdings, Inc.
7.750% (SOFR 1 Month + 4.00%), 12/17/2029(c)(h) | | | | | | | 11 | | | | 7,095 | |
8.725% (SOFR 1 Month + 4.00%), 12/17/2028(c)(h) | | | | | | | 2 | | | | 1,745 | |
| | | | | | | | | | | | |
| | | | | | | | | | | 39,308 | |
| | | | | | | | | | | | |
| | | | | | | | | | | 254,478 | |
| | | | | | | | | | | | |
Financial Institutions – 0.0% | | | | | | | | | | | | |
Finance – 0.0% | | | | | | | | | | | | |
Orbit Private Holdings I Ltd.
10.014% (SOFR 6 Month + 4.50%), 12/11/2028(c)(h) | | | | | | | 29 | | | | 29,503 | |
| | | | | | | | | | | | |
| | | |
Total Bank Loans
(cost $357,525) | | | | | | | | | | | 283,981 | |
| | | | | | | | | | | | |
| | |
| |
| abfunds.com | | AB SHORT DURATION INCOME ETF | 21 |
PORTFOLIO OF INVESTMENTS (continued)
| | | | | | | | | | | | |
| Company | | | | |
Shares | | | U.S. $ Value | |
| |
SHORT-TERM INVESTMENTS – 0.6% | |
Investment Companies – 0.6% | |
AB Fixed Income Shares, Inc. – Government Money Market Portfolio – Class AB,
4.54%(k)(l)(m)
(cost $494,459) | | | | | | | 494,459 | | | $ | 494,459 | |
| | | | | | | | | | | | |
| | | |
Total Investments – 99.2%
(cost $87,374,046) | | | | | | | | | | | 87,762,074 | |
Other assets less liabilities – 0.8% | | | | | | | | | | | 741,290 | |
| | | | | | | | | | | | |
| | | |
Net Assets – 100.0% | | | | | | | | | | $ | 88,503,364 | |
| | | | | | | | | | | | |
FUTURES (see Note D)
| | | | | | | | | | | | | | |
| Description | | Number of
Contracts | | | Expiration
Month | | Current
Notional | | | Value and
Unrealized
Appreciation
(Depreciation) | |
Purchased Contracts | |
U.S. T-Note 2 Yr (CBT) Futures | | | 40 | | | March 2025 | | $ | 8,244,375 | | | $ | 21,094 | |
U.S. T-Note 5 Yr (CBT) Futures | | | 71 | | | March 2025 | | | 7,639,711 | | | | 55,313 | |
|
Sold Contracts | |
U.S. T-Note 10 Yr (CBT) Futures | | | 3 | | | March 2025 | | | 333,563 | | | | (4,102 | ) |
| | | | | | | | | | | | | | |
| | | $ | 72,305 | |
| | | | | | | | | | | | | | |
FORWARD CURRENCY EXCHANGE CONTRACTS (see Note D)
| | | | | | | | | | | | | | | | | | | | | | | | |
| Counterparty | | Contracts to
Deliver
(000) | | | In Exchange
For
(000) | | | Settlement
Date | | | Unrealized
Appreciation
(Depreciation) | |
Bank of America, NA | | | DOP | | | | 56,835 | | | | USD | | | | 934 | | | | 01/17/2025 | | | $ | (4,007 | ) |
State Street Bank & Trust Co. | | | EUR | | | | 488 | | | | USD | | | | 528 | | | | 12/20/2024 | | | | 11,466 | |
State Street Bank & Trust Co. | | | GBP | | | | 103 | | | | USD | | | | 132 | | | | 01/16/2025 | | | | 1,630 | |
| | | | | | | | | | | | | | | | | | | | | | | | |
| | | $ | 9,089 | |
| | | | | |
| | |
| |
22 | AB SHORT DURATION INCOME ETF | | abfunds.com |
PORTFOLIO OF INVESTMENTS (continued)
CENTRALLY CLEARED CREDIT DEFAULT SWAPS (see Note D)
| | | | | | | | | | | | | | | | | | | | | | | | | | | | | | | | |
| Description | | Fixed
Rate
(Pay)
Receive | | | Payment
Frequency | | | Implied
Credit
Spread at
November 30,
2024 | | | Notional
Amount
(000) | | | Market
Value | | | Upfront
Premiums
Paid
(Received) | | | Unrealized
Appreciation
(Depreciation) | |
Buy Contracts | | | | | | | | | | | | | | | | | | | | | | | | | | | | | | | | |
iTraxx Australia Series 42, 5 Year Index, 12/20/2029* | | | (1.00 | )% | | | Quarterly | | | | 0.66 | % | | | USD | | | | 4,080 | | | $ | (70,559 | ) | | $ | (66,867 | ) | | $ | (3,692 | ) |
Kingdom of Saudi Arabia, 12/20/2029* | | | (1.00 | ) | | | Quarterly | | | | 0.60 | | | | USD | | | | 460 | | | | (9,285 | ) | | | (7,423 | ) | | | (1,862 | ) |
State of Qatar, 12/20/2029* | | | (1.00 | ) | | | Quarterly | | | | 0.41 | | | | USD | | | | 930 | | | | (27,043 | ) | | | (24,107 | ) | | | (2,936 | ) |
|
Sale Contracts | |
CDX-NAHY Series 43, 5 Year Index, 12/20/2029* | | | 5.00 | | | | Quarterly | | | | 2.95 | | | | USD | | | | 720 | | | | 68,796 | | | | 49,479 | | | | 19,317 | |
CDX-NAIG Series 43, 5 Year Index, 12/20/2029* | | | 1.00 | | | | Quarterly | | | | 0.48 | | | | USD | | | | 4,080 | | | | 105,156 | | | | 89,035 | | | | 16,121 | |
iTraxx Xover Series 42, 5 Year Index, 12/20/2029* | | | 5.00 | | | | Quarterly | | | | 2.98 | | | | EUR | | | | 640 | | | | 65,719 | | | | 55,756 | | | | 9,963 | |
| | | | | | | | | | | | | | | | | | | | | | | | | | | | | | | | |
| | | | | | | | | | | | | | | | | | | | | | $ | 132,784 | | | $ | 95,873 | | | $ | 36,911 | |
| | | | | | | | | | | | | | | | | | | | | | | | | | | | | | | | |
| (a) | Security is exempt from registration under Rule 144A or Regulation S of the Securities Act of 1933. These securities are considered restricted, but liquid and may be resold in transactions exempt from registration. At November 30, 2024, the aggregate market value of these securities amounted to $30,898,176 or 34.9% of net assets. |
| (b) | Coupon rate adjusts periodically based upon a predetermined schedule. Stated interest rate in effect at November 30, 2024. |
| (c) | Security in which significant unobservable inputs (Level 3) were used in determining fair value. |
| (d) | Floating Rate Security. Stated interest/floor/ceiling rate was in effect at November 30, 2024. |
| (e) | Pay-In-Kind Payments (PIK). The issuer may pay cash interest and/or interest in additional debt securities. Rates shown are the rates in effect at November 30, 2024. |
| (g) | Inverse interest only security. |
| (h) | The stated coupon rate represents the greater of the SOFR or an alternate base rate such as the PRIME or the SOFR/PRIME floor rate plus a spread at November 30, 2024. |
| (j) | Fair valued by the Adviser. |
| (k) | Affiliated investments. |
| | |
| |
| abfunds.com | | AB SHORT DURATION INCOME ETF | 23 |
PORTFOLIO OF INVESTMENTS (continued)
| (l) | To obtain a copy of the fund’s shareholder report, please go to the Securities and Exchange Commission’s website at www.sec.gov, or call AB at (800) 227-4618. |
| (m) | The rate shown represents the 7-day yield as of period end. |
Currency Abbreviations:
DOP – Dominican Peso
EUR – Euro
GBP – Great British Pound
USD – United States Dollar
Glossary:
ABS – Asset-Backed Securities
CBT – Chicago Board of Trade
CDX-NAHY – North American High Yield Credit Default Swap Index
CDX-NAIG – North American Investment Grade Credit Default Swap Index
CLO – Collateralized Loan Obligations
CMBS – Commercial Mortgage-Backed Securities
CME – Chicago Mercantile Exchange
REIT – Real Estate Investment Trust
REMICs – Real Estate Mortgage Investment Conduits
SOFR – Secured Overnight Financing Rate
See notes to financial statements.
| | |
| |
24 | AB SHORT DURATION INCOME ETF | | abfunds.com |
STATEMENT OF ASSETS & LIABILITIES
November 30, 2024
| | | | |
| Assets | |
Investments in securities, at value | |
Unaffiliated issuers (cost $86,879,587) | | $ | 87,267,615 | |
Affiliated issuers (cost $494,459) | | | 494,459 | |
Cash | | | 8,705 | |
Cash collateral due from broker | | | 318,975 | |
Foreign currencies, at value (cost $28,816) | | | 28,293 | |
Interest receivable | | | 881,841 | |
Receivable for variation margin on futures | | | 14,765 | |
Unrealized appreciation on forward currency exchange contracts | | | 13,096 | |
Receivable for variation margin on centrally cleared swaps | | | 4,205 | |
Affiliated dividends receivable | | | 1,212 | |
Receivable for investment securities sold | | | 538 | |
Receivable due from Adviser | | | 55 | |
| | | | |
Total assets | | | 89,033,759 | |
| | | | |
| Liabilities | |
Payable for investment securities purchased | | | 373,931 | |
Advisory fee payable | | | 21,852 | |
Unrealized depreciation on forward currency exchange contracts | | | 4,007 | |
Foreign capital gains tax payable | | | 1,804 | |
Other liabilities | | | 128,801 | |
| | | | |
Total liabilities | | | 530,395 | |
| | | | |
Net Assets | | $ | 88,503,364 | |
| | | | |
| Composition of Net Assets | |
Capital stock, at par | | $ | 249 | |
Additional paid-in capital | | | 94,104,787 | |
Accumulated loss | | | (5,601,672 | ) |
| | | | |
Net Assets | | $ | 88,503,364 | |
| | | | |
Net Asset Value Per Share—500 million shares of capital stock authorized, $.0001 par value (based on 2,488,461 common shares outstanding) | | $ | 35.57 | |
| | | | |
See notes to financial statements.
| | |
| |
| abfunds.com | | AB SHORT DURATION INCOME ETF | 25 |
STATEMENT OF OPERATIONS
| | | | | | | | |
| | | For the Period
November 1,
2024 to
November 30,
2024(a) | | | Year Ended
October 31,
2024(b) | |
| Investment Income | |
Interest (net of foreign taxes withheld of $0 and $1,634) | | $ | 394,365 | | | $ | 5,769,540 | |
Dividends—Affiliated issuers | | | 1,219 | | | | 65,067 | |
| | | | | | | | |
Total income | | $ | 395,584 | | | $ | 5,834,607 | |
| Expenses | |
Advisory fee (see Note B) | | | 21,855 | | | | 344,561 | |
Distribution fee—Class A | | | – 0 | – | | | 2,028 | |
Distribution fee—Class C | | | – 0 | – | | | 1,001 | |
Transfer agency—Class A | | | – 0 | – | | | 358 | |
Transfer agency—Class C | | | – 0 | – | | | 41 | |
Transfer agency—Advisor Class | | | – 0 | – | | | 30,718 | |
Administrative | | | – 0 | – | | | 59,346 | |
Audit and tax | | | – 0 | – | | | 90,847 | |
Legal | | | – 0 | – | | | 52,196 | |
Registration fees | | | – 0 | – | | | 47,113 | |
Custody and accounting | | | – 0 | – | | | 41,391 | |
Printing | | | – 0 | – | | | 37,494 | |
Directors’ fees | | | – 0 | – | | | 14,032 | |
Miscellaneous | | | – 0 | – | | | 10,440 | |
| | | | | | | | |
Total expenses | | | 21,855 | | | | 731,566 | |
Less: expenses waived and reimbursed by the Adviser (see Note B) | | | (55 | ) | | | (319,449 | ) |
| | | | | | | | |
Net expenses | | | 21,800 | | | | 412,117 | |
| | | | | | | | |
Net investment income | | | 373,784 | | | | 5,422,490 | |
| | | | | | | | |
| Realized and Unrealized Gain (Loss) on Investment and Foreign Currency Transactions | | | | | | | | |
Net realized gain (loss) on: | | | | | | | | |
Investment transactions(c) | | | 13,288 | | | | 377,985 | |
In-kind redemptions | | | – 0 | – | | | 121,708 | |
Forward currency exchange contracts | | | (32 | ) | | | 5,840 | |
Futures | | | (144,569 | ) | | | (72,477 | ) |
Swaps | | | (979 | ) | | | 283,420 | |
Foreign currency transactions | | | 3,835 | | | | (14,612 | ) |
Net change in unrealized appreciation (depreciation) of: | | | | | | | | |
Investments(d) | | | 69,956 | | | | 2,239,607 | |
Forward currency exchange contracts | | | 12,978 | | | | (11,026 | ) |
Futures | | | 157,735 | | | | 166,668 | |
Swaps | | | 31,836 | | | | 51,716 | |
Foreign currency denominated assets and liabilities | | | 586 | | | | (1,483 | ) |
| | | | | | | | |
Net gain on investment and foreign currency transactions | | | 144,634 | | | | 3,147,346 | |
| | | | | | | | |
Net Increase in Net Assets from Operations | | $ | 518,418 | | | $ | 8,569,836 | |
| | | | | | | | |
| (a) | The Acquired Portfolio had a fiscal year end of October 31. The Fund has a fiscal year end of November 30. |
| (b) | After the close of business on June 7, 2024, AB Short Duration Income Portfolio (the “Acquired Portfolio”) was reorganized into AB Short Duration Income ETF. The amounts disclosed include those of the Acquired Portfolio. See Note A for additional information on the reorganization. |
| (c) | Net of foreign realized capital gains taxes of $656 and $1,976, respectively. |
| (d) | Net of increase in accrued foreign capital gains taxes on unrealized gains of $11 and $1,137, respectively. |
See notes to financial statements.
| | |
| |
26 | AB SHORT DURATION INCOME ETF | | abfunds.com |
STATEMENT OF CHANGES IN NET ASSETS
| | | | | | | | | | | | |
| | | November 1,
2024 to
November 30,
2024(a) | | | Year Ended
October 31,
2024(b) | | | Year Ended
October 31,
2023 | |
| Increase in Net Assets from Operations | | | | | | | | | | | | |
Net investment income | | $ | 373,784 | | | $ | 5,422,490 | | | $ | 3,686,989 | |
Net realized gain (loss) on investment transactions | | | (128,457 | ) | | | 701,864 | | | | (5,408,383 | ) |
Net change in unrealized appreciation (depreciation) of investments and foreign currency denominated assets and liabilities | | | 273,091 | | | | 2,445,482 | | | | 5,336,754 | |
| | | | | | | | | | | | |
Net increase in net assets from operations | | | 518,418 | | | | 8,569,836 | | | | 3,615,360 | |
Distributions to Shareholders | | | | | | | | | | | | |
Class A | | | – 0 | – | | | (52,498 | ) | | | (147,440 | ) |
Class C | | | – 0 | – | | | (4,384 | ) | | | (10,939 | ) |
Advisor Class | | | (378,246 | ) | | | (4,991,883 | ) | | | (4,293,613 | ) |
| Transactions in Shares of the Fund | | | | | | | | | | | | |
Net increase (decrease) | | | – 0 | – | | | (23,813,083 | ) | | | 39,863,963 | |
Other capital | | | 5 | | | | 150 | | | | – 0 | – |
| | | | | | | | | | | | |
Total increase (decrease) | | | 140,177 | | | | (20,291,862 | ) | | | 39,027,331 | |
| Net Assets | | | | | | | | | | | | |
Beginning of period | | | 88,363,187 | | | | 108,655,049 | | | | 69,627,718 | |
| | | | | | | | | | | | |
End of period | | $ | 88,503,364 | | | $ | 88,363,187 | | | $ | 108,655,049 | |
| | | | | | | | | | | | |
| (a) | The Acquired Portfolio had a fiscal year end of October 31. The Fund has a fiscal year end of November 30. |
| (b) | After the close of business on June 7, 2024, AB Short Duration Income Portfolio (the “Acquired Portfolio”) was reorganized into AB Short Duration Income ETF. The amounts disclosed include those of the Acquired Portfolio. See Note A for additional information on the reorganization. |
See notes to financial statements.
| | |
| |
| abfunds.com | | AB SHORT DURATION INCOME ETF | 27 |
NOTES TO FINANCIAL STATEMENTS
November 30, 2024
NOTE A
Significant Accounting Policies
AB Active ETFs, Inc. (the “Corporation”) is registered under the Investment Company Act of 1940 (the “1940 Act”) as an open-end management investment company. The Corporation, which is a Maryland corporation, operates as a series company comprised of 15 portfolios currently in operation. Each fund is considered to be a separate entity for financial reporting and tax purposes. This report relates only to the AB Short Duration Income ETF (the “Fund”), a diversified portfolio. The Fund commenced investment operations on June 7, 2024. At meetings held on October 31— November 2, 2023, the Fund’s Board of Directors of AB Bond Fund, Inc. (the “Board”) approved the reorganization of AB Short Duration Income Portfolio, a portfolio of AB Bond Fund, Inc. (the “Acquired Portfolio”) into the Fund (the “Conversion”), to be managed by AllianceBernstein L.P. (the “Adviser”). Pursuant to an Agreement and Plan of Acquisition and Termination (the “Plan”), the Acquired Portfolio was converted into an ETF, the Fund (the “Acquiring Portfolio”) with the same investment objective, and the same investment policies and investment strategies as the Acquired Portfolio on the closing date of the Conversion, June 7, 2024. In connection with the Conversion, the assets and liabilities of the Acquired Portfolio were transferred to the Acquiring Portfolio, and stockholders of the Acquired Portfolio received shares of the Acquiring Portfolio equal in aggregate net asset value (“NAV”) to the NAV of their shares of the Acquired Portfolio (less cash corresponding to any fractional share amount). The Acquired Portfolio had a fiscal year end of October 31, however the Fund has a fiscal year end of November 30. See Note I for additional information regarding the Conversion. The Acquired Portfolio was the accounting survivor in the Conversion and as such, the financial statements and the financial highlights reflect the financial information of the Acquired Portfolio through June 7, 2024. The financial statements have been prepared in conformity with U.S. generally accepted accounting principles (“U.S. GAAP”), which require management to make certain estimates and assumptions that affect the reported amounts of assets and liabilities in the financial statements and amounts of income and expenses during the reporting period. Actual results could differ from those estimates. The Fund is an investment company under U.S. GAAP and follows the accounting and reporting guidance applicable to investment companies. The following is a summary of significant accounting policies followed by the Fund.
1. Security Valuation
Portfolio securities are valued at market value determined on the basis of market quotations or, if market quotations are not readily available or are unreliable, at “fair value” as determined in accordance with procedures approved by and under the oversight of the Board. Pursuant to these
| | |
| |
28 | AB SHORT DURATION INCOME ETF | | abfunds.com |
NOTES TO FINANCIAL STATEMENTS (continued)
procedures, the Adviser serves as the Fund’s valuation designee pursuant to Rule 2a-5 of the 1940 Act. In this capacity, the Adviser is responsible, among other things, for making all fair value determinations relating to the Fund’s portfolio investments, subject to the Board’s oversight.
In general, the market values of securities which are readily available and deemed reliable are determined as follows: securities listed on a national securities exchange (other than securities listed on the NASDAQ Stock Market, Inc. (“NASDAQ”)) or on a foreign securities exchange are valued at the last sale price at the close of the exchange or foreign securities exchange. If there has been no sale on such day, the securities are valued at the last traded price from the previous day. Securities listed on more than one exchange are valued by reference to the principal exchange on which the securities are traded; securities listed only on NASDAQ are valued in accordance with the NASDAQ Official Closing Price; listed or over the counter (“OTC”) market put or call options are valued at the mid level between the current bid and ask prices. If either a current bid or current ask price is unavailable, the Adviser will have discretion to determine the best valuation (e.g., last trade price in the case of listed options); open futures are valued using the closing settlement price or, in the absence of such a price, the most recent quoted bid price. If there are no quotations available for the day of valuation, the last available closing settlement price is used; U.S. Government securities and any other debt instruments having 60 days or less remaining until maturity are generally valued at fair value by an independent pricing service. If an independent fair value price is not available the securities are valued at amortized cost. This methodology is commonly used for short term securities that have an original maturity of 60 days or less, as well as short term securities that had an original term to maturity that exceeded 60 days. In instances when amortized cost is utilized, the Valuation Committee (the “Committee”) must reasonably conclude that the utilization of amortized cost is approximately the same as the fair value of the security. Factors the Committee will consider include, but are not limited to, an impairment of the creditworthiness of the issuer or material changes in interest rates. Fixed-income securities, including mortgage-backed and asset-backed securities, may be valued on the basis of prices provided by a pricing service or at a price obtained from one or more of the major broker-dealers. In cases where broker-dealer quotes are obtained, the Adviser may establish procedures whereby changes in market yields or spreads are used to adjust, on a daily basis, a recently obtained quoted price on a security. Swaps and other derivatives are valued daily, primarily using independent pricing services, independent pricing models using market inputs, as well as third party broker-dealers or counterparties. Open-end mutual funds are valued at the closing net asset value (“NAV”) per share, while exchange-traded funds are valued at the closing market price per share.
| | |
| |
| abfunds.com | | AB SHORT DURATION INCOME ETF | 29 |
NOTES TO FINANCIAL STATEMENTS (continued)
Securities for which market quotations are not readily available (including restricted securities) or are deemed unreliable are valued at fair value as deemed appropriate by the Adviser. Factors considered in making this determination may include, but are not limited to, information obtained by contacting the issuer, analysts, analysis of the issuer’s financial statements or other available documents. In addition, the Fund may use fair value pricing for securities primarily traded in non-U.S. markets because most foreign markets close well before the Fund values its securities at 4:00 p.m., Eastern Time. The earlier close of these foreign markets gives rise to the possibility that significant events may have occurred in the interim and may materially affect the value of those securities. To account for this, the Fund may value foreign equity securities using fair value prices at the discretion of the Adviser.
2. Fair Value Measurements
In accordance with U.S. GAAP regarding fair value measurements, fair value is defined as the price that the Fund would receive to sell an asset or pay to transfer a liability in an orderly transaction between market participants at the measurement date. U.S. GAAP establishes a framework for measuring fair value, and a three-level hierarchy for fair value measurements based upon the transparency of inputs to the valuation of an asset or liability (including those valued based on their market values as described in Note A.1 above). Inputs may be observable or unobservable and refer broadly to the assumptions that market participants would use in pricing the asset or liability. Observable inputs reflect the assumptions market participants would use in pricing the asset or liability based on market data obtained from sources independent of the Fund. Unobservable inputs reflect the Fund’s own assumptions about the assumptions that market participants would use in pricing the asset or liability based on the best information available in the circumstances. Each investment is assigned a level based upon the observability of the inputs which are significant to the overall valuation. The three-tier hierarchy of inputs is summarized below.
| | • | | Level 1—quoted prices in active markets for identical investments |
| | • | | Level 2—other significant observable inputs (including quoted prices for similar investments, interest rates, prepayment speeds, credit risk, etc.) |
| | • | | Level 3—significant unobservable inputs (including the Fund’s own assumptions in determining the fair value of investments) |
The fair value of debt instruments, such as bonds, and over-the-counter derivatives is generally based on market price quotations, recently executed market transactions (where observable) or industry recognized modeling techniques and are generally classified as Level 2. Pricing vendor inputs to Level 2 valuations may include quoted prices for similar investments in
| | |
| |
30 | AB SHORT DURATION INCOME ETF | | abfunds.com |
NOTES TO FINANCIAL STATEMENTS (continued)
active markets, interest rate curves, coupon rates, currency rates, yield curves, option adjusted spreads, default rates, credit spreads and other unique security features in order to estimate the relevant cash flows which are then discounted to calculate fair values. If these inputs are unobservable and significant to the fair value, these investments will be classified as Level 3.
Where readily available market prices or relevant bid prices are not available for certain equity investments, such investments may be valued based on similar publicly traded investments, movements in relevant indices since last available prices or based upon underlying company fundamentals and comparable company data (such as multiples to earnings or other multiples to equity). Where an investment is valued using an observable input, such as another publicly traded security, the investment will be classified as Level 2. If management determines that an adjustment is appropriate based on restrictions on resale, illiquidity or uncertainty, and such adjustment is a significant component of the valuation, the investment will be classified as Level 3. An investment will also be classified as Level 3 where management uses company fundamentals and other significant inputs to determine the valuation.
Valuations of mortgage-backed or other asset-backed securities, by pricing vendors, are based on both proprietary and industry recognized models and discounted cash flow techniques. Significant inputs to the valuation of these instruments are value of the collateral, the rates and timing of delinquencies, the rates and timing of prepayments, and default and loss expectations, which are driven in part by housing prices for residential mortgages. Significant inputs are determined based on relative value analyses, which incorporate comparisons to instruments with similar collateral and risk profiles, including relevant indices. Mortgage and asset-backed securities for which management has collected current observable data through pricing services are generally categorized within Level 2. Those investments for which current observable data has not been provided are classified as Level 3.
Bank loan prices are provided by third party pricing services and consist of a composite of the quotes received by the vendor into a consensus price. Certain bank loans are classified as Level 3, as a significant input used in the fair value measurement of these instruments is the market quotes that are received by the vendor and these inputs are not observable.
Other fixed income investments, including non-U.S. government and corporate debt, are generally valued using quoted market prices, if available, which are typically impacted by current interest rates, maturity dates and any perceived credit risk of the issuer. Additionally, in the absence of
| | |
| |
| abfunds.com | | AB SHORT DURATION INCOME ETF | 31 |
NOTES TO FINANCIAL STATEMENTS (continued)
quoted market prices, these inputs are used by pricing vendors to derive a valuation based upon industry or proprietary models which incorporate issuer specific data with relevant yield/spread comparisons with more widely quoted bonds with similar key characteristics. Those investments for which there are observable inputs are classified as Level 2. Where the inputs are not observable, the investments are classified as Level 3.
The following table summarizes the valuation of the Fund’s investments by the above fair value hierarchy levels as of November 30, 2024:
| | | | | | | | | | | | | | | | |
Investments in
Securities: | | Level 1 | | | Level 2 | | | Level 3 | | | Total | |
Assets: | |
Corporates – Investment Grade | | $ | – 0 | – | | $ | 32,673,528 | | | $ | – 0 | – | | $ | 32,673,528 | |
Governments – Treasuries | | | – 0 | – | | | 26,827,607 | | | | – 0 | – | | | 26,827,607 | |
Asset-Backed Securities | | | – 0 | – | | | 10,331,745 | | | | 238,665 | | | | 10,570,410 | |
Collateralized Loan Obligations | | | – 0 | – | | | 8,083,221 | | | | – 0 | – | | | 8,083,221 | |
Corporates – Non-Investment Grade | | | – 0 | – | | | 5,952,552 | | | | – 0 | – | | | 5,952,552 | |
Commercial Mortgage-Backed Securities | | | – 0 | – | | | 1,607,573 | | | | – 0 | – | | | 1,607,573 | |
Emerging Markets – Sovereigns | | | – 0 | – | | | 893,465 | | | | – 0 | – | | | 893,465 | |
Collateralized Mortgage Obligations | | | – 0 | – | | | 375,278 | | | | – 0 | – | | | 375,278 | |
Bank Loans | | | – 0 | – | | | 245,095 | | | | 38,886 | | | | 283,981 | |
Short-Term Investments | | | 494,459 | | | | – 0 | – | | | – 0 | – | | | 494,459 | |
| | | | | | | | | | | | | | | | |
Total Investments in Securities | | | 494,459 | | | | 86,990,064 | | | | 277,551 | | | | 87,762,074 | |
Other Financial Instruments(a): | | | | | | | | | | | | | | | | |
Assets: | |
Futures | | | 76,407 | | | | – 0 | – | | | – 0 | – | | | 76,407 | (b) |
Forward Currency Exchange Contracts | | | – 0 | – | | | 13,096 | | | | – 0 | – | | | 13,096 | |
Centrally Cleared Credit Default Swaps | | | – 0 | – | | | 239,671 | | | | – 0 | – | | | 239,671 | (b) |
Liabilities: | |
Futures | | | (4,102 | ) | | | – 0 | – | | | – 0 | – | | | (4,102 | )(b) |
Forward Currency Exchange Contracts | | | – 0 | – | | | (4,007 | ) | | | – 0 | – | | | (4,007 | ) |
Centrally Cleared Credit Default Swaps | | | – 0 | – | | | (106,887 | ) | | | – 0 | – | | | (106,887 | )(b) |
| | | | | | | | | | | | | | | | |
Total | | $ | 566,764 | | | $ | 87,131,937 | | | $ | 277,551 | | | $ | 87,976,252 | |
| | | | | | | | | | | | | | | | |
| (a) | Other financial instruments include derivative instruments, such as futures, forwards and swaps. Derivative instruments are valued at the unrealized appreciation (depreciation) on the instrument. Other financial instruments may also include swaps with upfront premiums, written options and written swaptions which are valued at market value. |
| (b) | Only variation margin receivable (payable) at period end is reported within the statement of assets and liabilities. This amount reflects cumulative unrealized appreciation (depreciation) on futures and centrally cleared swaps as reported in the portfolio of investments. Where applicable, centrally cleared swaps with upfront premiums are presented here at market value. |
3. Currency Translation
Assets and liabilities denominated in foreign currencies and commitments under forward currency exchange contracts are translated into U.S. dollars at the mean of the quoted bid and ask prices of such currencies against the U.S. dollar. Purchases and sales of portfolio securities are translated into U.S. dollars at the rates of exchange prevailing when such securities were acquired or sold. Income and expenses are translated into U.S. dollars at rates of exchange prevailing when accrued.
| | |
| |
32 | AB SHORT DURATION INCOME ETF | | abfunds.com |
NOTES TO FINANCIAL STATEMENTS (continued)
Net realized gain or loss on foreign currency transactions represents foreign exchange gains and losses from sales and maturities of foreign fixed income investments, holding of foreign currencies, currency gains or losses realized between the trade and settlement dates on foreign investment transactions, and the difference between the amounts of dividends, interest and foreign withholding taxes recorded on the Fund’s books and the U.S. dollar equivalent amounts actually received or paid. Net unrealized currency gains and losses from valuing foreign currency denominated assets and liabilities at period end exchange rates are reflected as a component of net unrealized appreciation or depreciation of foreign currency denominated assets and liabilities.
4. Taxes
It is the Fund’s policy to meet the requirements of the Internal Revenue Code applicable to regulated investment companies and to distribute all of its investment company taxable income and net realized gains, if any, to shareholders. Therefore, no provisions for federal income or excise taxes are required. The Fund may be subject to taxes imposed by countries in which it invests. Such taxes are generally based on income and/or capital gains earned or repatriated. Taxes are accrued and applied to net investment income, net realized gains and net unrealized appreciation/depreciation as such income and/or gains are earned.
In accordance with U.S. GAAP requirements regarding accounting for uncertainties in income taxes, management has analyzed the Fund’s tax positions taken or expected to be taken on federal and state income tax returns for all open tax years (the current and the prior three tax years) and has concluded that no provision for income tax is required in the Fund’s financial statements.
5. Investment Income and Investment Transactions
Dividend income is recorded on the ex-dividend date or as soon as the Fund is informed of the dividend. Interest income is accrued daily. Investment transactions are accounted for on the date the securities are purchased or sold. Investment gains or losses are determined on the identified cost basis. Non-cash dividends, if any, are recorded on the ex-dividend date at the fair value of the securities received. The Fund amortizes premiums and accretes discounts as adjustments to interest income.
The Fund accounts for distributions received from real estate investment trust (“REIT”) investments or from regulated investment companies as dividend income, realized gain, or return of capital based on information provided by the REIT or the investment company.
| | |
| |
| abfunds.com | | AB SHORT DURATION INCOME ETF | 33 |
NOTES TO FINANCIAL STATEMENTS (continued)
6. Class Allocations
Prior to the Conversion, all income earned and expenses incurred by the Acquired Portfolio were borne on a pro-rata basis by each settled class of shares, based on the proportionate interest in the Acquired Portfolio represented by the net assets of such class, except for class specific expenses which are allocated to the respective class. Expenses of AB Bond Fund, Inc. were charged proportionately to each portfolio or based on other appropriate methods. Realized and unrealized gains and losses were allocated among the various share classes based on respective net assets.
7. Dividends and Distributions
Dividends and distributions to shareholders, if any, are recorded on the ex-dividend date. Income dividends and capital gains distributions are determined in accordance with federal tax regulations and may differ from those determined in accordance with U.S. GAAP. To the extent these differences are permanent, such amounts are reclassified within the capital accounts based on their federal tax basis treatment; temporary differences do not require such reclassification.
8. Offering Expenses
The Adviser has agreed to pay all of the Fund’s organization and offering costs. The Fund is not obligated to repay any such organizational expenses or offering costs paid by the Adviser.
9. Cash and Short-Term Investments
Cash and short-term investments include cash on hand and short-term investments with maturities of less than one year when purchased.
NOTE B
Advisory Fee and Other Transactions with Affiliates
Under the terms of the investment advisory agreement, the Fund pays the Adviser a unitary advisory fee at an annual rate of .30% of the Fund’s average daily net assets. The fees are accrued daily and paid monthly. Prior to June 7, 2024, the Acquired Portfolio paid the Adviser an advisory fee at an annual rate of .35% of the first $2.5 billion of the Fund’s average daily net assets and .30% of the excess over $2.5 billion of the Fund’s average daily net assets. The fee is accrued daily and paid monthly. The Adviser had agreed to waive its fees and bear certain expenses to the extent necessary to limit total operating expenses (excluding acquired fund fees and expenses other than the advisory fees of any AB mutual funds in which the Fund may invest, interest expense, taxes, extraordinary expenses, and brokerage commissions and other transaction costs), on an annual basis (the “Expense Caps”) to .65%, 1.45% and .45% of daily average net assets for Class A, Class C and Advisor Class shares, respectively. For the period ended November 30, 2024 and the year ended October 31, 2024, such reimbursement/waivers amounted to $3 and 258,247, respectively.
| | |
| |
34 | AB SHORT DURATION INCOME ETF | | abfunds.com |
NOTES TO FINANCIAL STATEMENTS (continued)
Prior to June 7, 2024, pursuant to the investment advisory agreement, the Acquired Portfolio reimbursed the Adviser for certain legal and accounting services provided to the Acquired Portfolio by the Adviser. For the year ended October 31, 2024, the reimbursement for such services amounted to $59,346.
Prior to June 7, 2024, the Acquired Portfolio compensated AllianceBernstein Investor Services, Inc. (“ABIS”), a wholly-owned subsidiary of the Adviser, under a Transfer Agency Agreement for providing personnel and facilities to perform transfer agency services for the Acquired Portfolio. ABIS may make payments to intermediaries that provide omnibus account services, sub-accounting services and/or networking services. Such compensation retained by ABIS amounted to $13,787 for the year ended October 31, 2024. Effective June 7, 2024, State Street Bank and Trust Company serves as Transfer Agent for the Fund.
Under the investment advisory agreement, in accordance with the unitary fee structure, the Adviser bears the cost of various third-party services required by the Fund, including audit, custodial, accounting, legal, transfer agency and printing costs and the fees and expenses of the Corporation’s directors and their counsel. Prior to June 7, 2024, these costs were borne by the Fund but subject to the Expense Cap. Also under the investment advisory agreement, the Adviser will reimburse each Fund for the Fund’s share of the acquired funds fees and expenses (advisory fees and other expenses) of any pooled investment vehicle for which the Adviser serves as investment adviser. For the period ended November 30, 2024 and the year ended October 31, 2024, such waiver/reimbursements relating to the Fund’s investment in AB Government Money Market Portfolio amounted to $52 and $1,856, respectively.
A summary of the Fund’s transactions in AB mutual funds for the period ended November 30, 2024 is as follows:
| | | | | | | | | | | | | | | | | | | | |
Fund | | Market Value
10/31/24
(000) | | | Purchases
at Cost
(000) | | | Sales
Proceeds
(000) | | | Market Value
11/30/24
(000) | | | Dividend
Income
(000) | |
AB Government Money Market Portfolio | | $ | 985 | | | $ | 905 | | | $ | 1,396 | | | $ | 494 | | | $ | 1 | |
A summary of the Fund’s transactions in AB mutual funds for the year ended October 31, 2024 is as follows:
| | | | | | | | | | | | | | | | | | | | |
Fund | | Market Value
10/31/23
(000) | | | Purchases
at Cost
(000) | | | Sales
Proceeds
(000) | | | Market Value
10/31/24
(000) | | | Dividend
Income
(000) | |
AB Government Money Market Portfolio | | $ | 507 | | | $ | 60,696 | | | $ | 60,218 | | | $ | 985 | | | $ | 65 | |
| | |
| |
| abfunds.com | | AB SHORT DURATION INCOME ETF | 35 |
NOTES TO FINANCIAL STATEMENTS (continued)
NOTE C
Distribution Services Agreement
Effective June 7, 2024, the Fund has adopted a Distribution and Service Plan (the “Plan”) pursuant to Rule 12b-1 of the Act which permits the Fund to pay distribution and servicing fees not to exceed .25% per year of the Fund’s average daily net assets, provided that the Fund will not make any 12b-1 payments under the Plan without prior Board and stockholder approval. No such fees are currently paid. Prior to the Conversion, the Acquired Portfolio paid distribution and servicing fees to the Distributor at an annual rate of up to .25% of the Acquired Portfolio’s average daily net assets attributable to Class A shares and 1% of the Fund’s average daily net assets attributable to Class C shares. There are no distribution and servicing fees on the Advisor Class shares. Payments under the Agreement in respect of Class A shares are currently limited to an annual rate of .20% of Class A shares’ average daily net assets. The fees are accrued daily and paid monthly. The Agreement provides that the Distributor will use such payments in their entirety for distribution assistance and promotional activities. Since the commencement of the Fund’s operations, the Distributor has incurred expenses in excess of the distribution costs reimbursed by the Fund in the amount of $1,357 for Class C shares. While such costs may be recovered from the Fund in future periods so long as the Agreement is in effect, and the share class is active, the rate of the distribution and servicing fees payable under the Agreement may not be increased without a shareholder vote. In accordance with the Agreement, there is no provision for recovery of unreimbursed distribution costs incurred by the Distributor beyond the current fiscal year for Class A shares. The Agreement also provides that the Adviser may use its own resources to finance the distribution of the Fund’s shares.
NOTE D
Investment Transactions
Purchases and sales of investment securities (excluding short-term investments and in-kind purchases and sales) for the period ended November 30, 2024 were as follows:
| | | | | | | | |
| | | Purchases | | | Sales | |
Investment securities (excluding U.S. government securities) | | $ | 1,038,914 | | | $ | 349,772 | |
U.S. government securities | | | – 0 | – | | | 1,407,764 | |
| | |
| |
36 | AB SHORT DURATION INCOME ETF | | abfunds.com |
NOTES TO FINANCIAL STATEMENTS (continued)
Purchases and sales of investment securities (excluding short-term investments and in-kind purchases and sales) for the year ended October 31, 2024 were as follows:
| | | | | | | | |
| | | Purchases | | | Sales | |
Investment securities (excluding U.S. government securities) | | $ | 73,269,644 | | | $ | 66,808,430 | |
U.S. government securities | | | 44,437,087 | | | | 53,315,823 | |
For the period ended November 30, 2024, the Fund had no in-kind purchases and in-sales.
During the year ended October 31, 2024, the Fund delivered portfolio securities for the redemption of Fund shares (in-kind redemptions). Cash and portfolio securities were transferred for redemptions at fair value. For financial reporting purposes, the Fund recorded net realized gains and losses in connection with each in-kind redemption transaction. For the year ended October 31, 2024, the Fund had in-kind purchases and in-kind sales as follows:
| | | | | | | | |
| | | Purchases | | | Sales | |
In-kind transactions (excluding U.S. government securities) | | $ | 1,674,641 | | | $ | 11,050,005 | |
U.S. government securities | | | 1,576,166 | | | | 6,433,806 | |
The cost of investments for federal income tax purposes, gross unrealized appreciation and unrealized depreciation are as follows:
| | | | |
Cost | | $ | 87,381,739 | |
| | | | |
Gross unrealized appreciation | | $ | 914,431 | |
Gross unrealized depreciation | | | (512,253 | ) |
| | | | |
Net unrealized appreciation | | $ | 402,178 | |
| | | | |
1. Derivative Financial Instruments
The Fund may use derivatives in an effort to earn income and enhance returns, to replace more traditional direct investments, to obtain exposure to otherwise inaccessible markets (collectively, “investment purposes”), or to hedge or adjust the risk profile of its portfolio.
The principal types of derivatives utilized by the Fund, as well as the methods in which they may be used are:
Fund may buy or sell futures for investment purposes or for the purpose of hedging its portfolio against adverse effects of potential movements in the market. Fund bears the market risk that arises from
| | |
| |
| abfunds.com | | AB SHORT DURATION INCOME ETF | 37 |
NOTES TO FINANCIAL STATEMENTS (continued)
changes in the value of these instruments and the imperfect correlation between movements in the price of the futures and movements in the price of the assets, reference rates or indices which they are designed to track. Among other things, the Fund may purchase or sell futures for foreign currencies or options thereon for non-hedging purposes as a means of making direct investment in foreign currencies, as described below under “Currency Transactions”.
At the time Fund enters into futures, Fund deposits with the broker or segregates at its custodian cash or securities as collateral to satisfy initial margin requirements set by the exchange on which the transaction is effected. Pursuant to the contract, with respect to cash collateral, the Fund agrees to receive from or pay to the broker an amount of cash equal to the daily fluctuation in the value of the contract; in the case of securities collateral, the Fund agrees to adjust the securities position held in the segregated account accordingly. Such receipts, payments or adjustments are known as variation margin and are recorded by the Fund as unrealized gains or losses. Risks may arise from the potential inability of a counterparty to meet the terms of the contract. The credit/counterparty risk for exchange-traded futures is generally less than privately negotiated futures, since the clearinghouse, which is the issuer or counterparty to each exchange-traded future, has robust risk mitigation standards, including the requirement to provide initial and variation margin. When the contract is closed, the Fund records a realized gain or loss equal to the difference between the value of the contract at the time it was opened and the time it was closed.
Use of long futures subjects the Fund to risk of loss in excess of the amounts shown on the statement of assets and liabilities, up to the notional value of the futures. Use of short futures subjects the Fund to unlimited risk of loss. Under some circumstances, futures exchanges may establish daily limits on the amount that the price of futures can vary from the previous day’s settlement price, which could effectively prevent liquidation of unfavorable positions.
During the period ended November 30, 2024 and the year ended October 31, 2024, the Fund held futures for hedging and non-hedging purposes.
| | • | | Forward Currency Exchange Contracts |
The Fund may enter into forward currency exchange contracts in order to hedge its exposure to changes in foreign currency exchange rates on its foreign portfolio holdings, to hedge certain firm purchase and sale commitments denominated in foreign currencies and for non-hedging purposes as a means of making direct investments in foreign currencies, as described below under “Currency Transactions”.
| | |
| |
38 | AB SHORT DURATION INCOME ETF | | abfunds.com |
NOTES TO FINANCIAL STATEMENTS (continued)
A forward currency exchange contract is a commitment to purchase or sell a foreign currency at a future date at a negotiated forward rate. The gain or loss arising from the difference between the original contract and the closing of such contract would be included in net realized gain or loss on forward currency exchange contracts. Fluctuations in the value of open forward currency exchange contracts are recorded for financial reporting purposes as unrealized appreciation and/or depreciation by the Fund. Risks may arise from the potential inability of a counterparty to meet the terms of a contract and from unanticipated movements in the value of a foreign currency relative to the U.S. dollar.
During the period ended November 30, 2024 and the year ended October 31, 2024, the Fund held forward currency exchange contracts for hedging purposes.
The Fund may enter into swaps for investment purposes or to hedge its exposure to interest rates, credit risk, equity markets or currencies. The Fund may also enter into swaps for non-hedging purposes as a means of gaining market exposures, making direct investments in foreign currencies, as described below under “Currency Transactions” or in order to take a “long” or “short” position with respect to an underlying referenced asset described below under “Total Return Swaps”. A swap is an agreement that obligates two parties to exchange a series of cash flows at specified intervals based upon or calculated by reference to changes in specified prices, rates or indexes for a specified amount of an underlying asset or inflation. The payment flows are usually netted against each other, with the difference being paid by one party to the other. In addition, collateral may be pledged or received by the Fund in accordance with the terms of the respective swaps to provide value and recourse to the Fund or its counterparties in the event of default, bankruptcy or insolvency by one of the parties to the swap.
Risks may arise as a result of the failure of the counterparty to the swap to comply with the terms of the swap. The loss incurred by the failure of a counterparty is generally limited to the net interim payment to be received by the Fund, and/or the termination value at the end of the contract. Therefore, the Fund considers the creditworthiness of each counterparty to a swap in evaluating potential counterparty risk. This risk is mitigated by having a netting arrangement between the Fund and the counterparty and by the posting of collateral by the counterparty to the Fund to cover the Fund’s exposure to the counterparty. Additionally, risks may arise from unanticipated movements in interest rates, inflation or in the value of the underlying
| | |
| |
| abfunds.com | | AB SHORT DURATION INCOME ETF | 39 |
NOTES TO FINANCIAL STATEMENTS (continued)
securities. The Fund accrues for the interim payments on swaps on a daily basis, with the net amount recorded within unrealized appreciation (depreciation) of swaps on the statement of assets and liabilities, where applicable. Once the interim payments are settled in cash, the net amount is recorded as realized gain/(loss) on swaps on the statement of operations, in addition to any realized gain/(loss) recorded upon the termination of swaps. Upfront premiums paid or received for swaps are recognized as cost or proceeds on the statement of assets and liabilities and are amortized on a straight line basis over the life of the contract. Amortized upfront premiums are included in net realized gain/(loss) from swaps on the statement of operations. Fluctuations in the value of swaps are recorded as a component of net change in unrealized appreciation (depreciation) of swaps on the statement of operations.
Certain standardized swaps, including certain interest rate swaps and credit default swaps, are subject to mandatory central clearing. Cleared swaps are transacted through futures commission merchants (“FCMs”) that are members of central clearinghouses, with the clearinghouse serving as central counterparty, similar to transactions in futures contracts. Centralized clearing will be required for additional categories of swaps on a phased-in basis based on requirements published by the Securities and Exchange Commission and Commodity Futures Trading Commission.
At the time the Fund enters into a centrally cleared swap, Fund deposits with the broker or segregates at its custodian cash or securities as collateral to satisfy initial margin requirements set by the clearinghouse on which the transaction is effected. Pursuant to the contract, with respect to cash collateral, the Fund agrees to receive from or pay to the broker an amount of cash equal to the daily fluctuation in the value of the contract; in the case of securities collateral, the Fund agrees to adjust the securities position held in the segregated account accordingly. Such receipts, payments or adjustments are known as variation margin and are recorded by the Fund as unrealized gains or losses. Risks may arise from the potential inability of a counterparty to meet the terms of the contract. The credit/counterparty risk for centrally cleared swaps is generally less than non-centrally cleared swaps, since the clearinghouse, which is the issuer or counterparty to each centrally cleared swap, has robust risk mitigation standards, including the requirement to provide initial and variation margin. When the contract is closed, the Fund records a realized gain or loss equal to the difference between the value of the contract at the time it was opened and the time it was closed.
| | |
| |
40 | AB SHORT DURATION INCOME ETF | | abfunds.com |
NOTES TO FINANCIAL STATEMENTS (continued)
Credit Default Swaps:
The Fund may enter into credit default swaps, including to manage its exposure to the market or certain sectors of the market, to reduce its risk exposure to defaults by corporate and sovereign issuers held by the Fund, or to create exposure to corporate or sovereign issuers to which it is not otherwise exposed. The Fund may purchase credit protection (“Buy Contract”) or provide credit protection (“Sale Contract”) on the referenced obligation of the credit default swap. During the term of the swap, the Fund receives/(pays) fixed payments from/(to) the respective counterparty, calculated at the agreed upon rate applied to the notional amount. If the Fund is a buyer/(seller) of protection and a credit event occurs, as defined under the terms of the swap, the Fund will either (i) receive from the seller/(pay to the buyer) of protection an amount equal to the notional amount of the swap (the “Maximum Payout Amount”) and deliver/(take delivery of) the referenced obligation or (ii) receive/(pay) a net settlement amount in the form of cash or securities equal to the notional amount of the swap less the recovery value of the referenced obligation. In certain circumstances Maximum Payout Amounts may be partially offset by recovery values of the respective referenced obligations, upfront premium received upon entering into the agreement, or net amounts received from settlement of buy protection credit default swaps entered into by the Fund for the same referenced obligations with the same counterparty.
Credit default swaps may involve greater risks than if the Fund had invested in the referenced obligation directly. Credit default swaps are subject to general market risk, liquidity risk, counterparty risk and credit risk. If the Fund is a buyer of protection and no credit event occurs, it will lose the payments it made to its counterparty. If the Fund is a seller of protection and a credit event occurs, the value of the referenced obligation received by the Fund coupled with the periodic payments previously received, may be less than the Maximum Payout Amount it pays to the buyer, resulting in a net loss to the Fund.
Implied credit spreads over U.S. Treasuries of comparable maturity utilized in determining the market value of credit default swaps on issuers as of period end are disclosed in the portfolio of investments. The implied spreads serve as an indicator of the current status of the payment/performance risk and typically reflect the likelihood of default by the issuer of the referenced obligation. The implied credit spread of a particular reference obligation also reflects the cost of buying/selling protection and may reflect upfront payments required to be made to enter into the agreement. Widening credit spreads typically represent a deterioration of the referenced obligation’s credit soundness and
| | |
| |
| abfunds.com | | AB SHORT DURATION INCOME ETF | 41 |
NOTES TO FINANCIAL STATEMENTS (continued)
greater likelihood of default or other credit event occurring as defined under the terms of the agreement. A credit spread identified as “Defaulted” indicates a credit event has occurred for the referenced obligation.
During the period ended November 30, 2024 and the year ended October 31, 2024, the Fund held credit default swaps for non-hedging purposes.
The Fund typically enters into International Swaps and Derivatives Association, Inc. Master Agreements (“ISDA Master Agreement”) with its OTC derivative contract counterparties in order to, among other things, reduce its credit risk to OTC counterparties. ISDA Master Agreements include provisions for general obligations, representations, collateral and events of default or termination. Under an ISDA Master Agreement, the Fund typically may offset with the OTC counterparty certain derivative financial instruments’ payables and/or receivables with collateral held and/or posted and create one single net payment (close-out netting) in the event of default or termination. In the event of a default by an OTC counterparty, the return of collateral with market value in excess of the Fund ‘s net liability, held by the defaulting party, may be delayed or denied.
The Fund’s ISDA Master Agreements may contain provisions for early termination of OTC derivative transactions in the event the net assets of the Fund decline below specific levels (“net asset contingent features”). If these levels are triggered, the Fund’s OTC counterparty has the right to terminate such transaction and require the Fund to pay or receive a settlement amount in connection with the terminated transaction. If OTC derivatives were held at period end, please refer to netting arrangements by the OTC counterparty table below for additional details.
| | |
| |
42 | AB SHORT DURATION INCOME ETF | | abfunds.com |
NOTES TO FINANCIAL STATEMENTS (continued)
During the period ended November 30, 2024, the Fund had entered into the following derivatives:
| | | | | | | | | | | | |
| | | Asset Derivatives | | | Liability Derivatives | |
Derivative Type | | Statement of
Assets and
Liabilities
Location | | Fair Value | | | Statement of
Assets and
Liabilities
Location | | Fair Value | |
Interest rate contracts | | Receivable for variation margin on futures | | $ | 76,407 | * | | Payable for variation margin on futures | | $ | 4,102 | * |
| | | | |
Credit contracts | | Receivable for variation margin on centrally cleared swaps | | | 45,401 | * | | Payable for variation margin on centrally cleared swaps | | | 8,490 | * |
| | | | |
Foreign currency contracts | | Unrealized appreciation on forward currency exchange contracts | | | 13,096 | | | Unrealized depreciation on forward currency exchange contracts | | | 4,007 | |
| | | | | | | | | | | | |
Total | | | | $ | 134,904 | | | | | $ | 16,599 | |
| | | | | | | | | | | | |
| * | Only variation margin receivable/payable at period end is reported within the statement of assets and liabilities. This amount reflects cumulative unrealized appreciation (depreciation) on futures and centrally cleared swaps as reported in the portfolio of investments. |
| | | | | | | | | | |
Derivative Type | | Location of Gain or
(Loss) on Derivatives
Within Statement of
Operations for the
Period ended
November 1, 2024 to
November 30, 2024 | | Realized Gain
or (Loss) on
Derivatives | | | Change in
Unrealized
Appreciation or
(Depreciation) | |
Interest rate contracts | | Net realized gain (loss) on futures; Net change in unrealized appreciation (depreciation) of futures | | $ | (144,569 | ) | | $ | 157,735 | |
| | | |
Foreign currency contracts | | Net realized gain (loss) on forward currency exchange contracts; Net change in unrealized appreciation (depreciation) of forward currency exchange contracts | | | (32 | ) | | | 12,978 | |
| | | |
Credit contracts | | Net realized gain (loss) on swaps; Net change in unrealized appreciation (depreciation) of swaps | | | (979 | ) | | | 31,836 | |
| | | | | | | | | | |
Total | | | | $ | (145,580 | ) | | $ | 202,549 | |
| | | | | | | | | | |
| | |
| |
| abfunds.com | | AB SHORT DURATION INCOME ETF | 43 |
NOTES TO FINANCIAL STATEMENTS (continued)
| | | | | | | | | | |
Derivative Type | | Location of Gain or
(Loss) on Derivatives
Within Statement of
Operations for the
Year ended
October 31, 2024 | | Realized Gain
or (Loss) on
Derivatives | | | Change in
Unrealized
Appreciation or
(Depreciation) | |
Interest rate contracts | | Net realized gain (loss) on futures; Net change in unrealized appreciation (depreciation) of futures | | $ | (72,477) | | | $ | 166,668 | |
| | | |
Foreign currency contracts | | Net realized gain (loss) on forward currency exchange contracts; Net change in unrealized appreciation (depreciation) of forward currency exchange contracts | | | 5,840 | | | | (11,026 | ) |
| | | |
Credit contracts | | Net realized gain (loss) on swaps; Net change in unrealized appreciation (depreciation) of swaps | | | 283,420 | | | | 51,716 | |
| | | | | | | | | | |
Total | | | | $ | 216,783 | | | $ | 207,358 | |
| | | | | | | | | | |
The following table represents the average monthly volume of the Fund’s derivative transactions during the period ended November 30, 2024:
| | | | |
Futures: | | | | |
Average notional amount of buy contracts | | $ | 13,187,762 | |
Average notional amount of sale contracts | | $ | 335,988 | |
Forward Currency Exchange Contracts: | | | | |
Average principal amount of sale contracts | | $ | 1,597,664 | |
Centrally Cleared Credit Default Swaps: | | | | |
Average notional amount of buy contracts | | $ | 5,327,500 | |
Average notional amount of sale contracts | | $ | 5,485,392 | |
The following table represents the average monthly volume of the Fund’s derivative transactions during the year ended October 31, 2024:
| | | | |
Futures: | | | | |
Average notional amount of buy contracts | | $ | 14,231,234 | |
Average notional amount of sale contracts | | $ | 1,646,706 | |
Forward Currency Exchange Contracts: | | | | |
Average principal amount of buy contracts | | $ | 348,243 | (a) |
Average principal amount of sale contracts | | $ | 1,119,281 | |
Credit Default Swaps: | | | | |
Average notional amount of sale contracts | | $ | 217,528 | (b) |
Centrally Cleared Credit Default Swaps: | | | | |
Average notional amount of buy contracts | | $ | 4,165,000 | |
Average notional amount of sale contracts | | $ | 6,207,633 | |
| (a) | Positions were open for five months during the year. |
| (b) | Positions were open for one month during the year. |
| | |
| |
44 | AB SHORT DURATION INCOME ETF | | abfunds.com |
NOTES TO FINANCIAL STATEMENTS (continued)
For financial reporting purposes, the Fund does not offset derivative assets and derivative liabilities that are subject to netting arrangements in the statement of assets and liabilities.
All OTC derivatives held at period end were subject to netting arrangements. The following table presents the Fund’s derivative assets and liabilities by OTC counterparty net of amounts available for offset under ISDA Master Agreements (“MA”) and net of the related collateral received/pledged by the Fund as of November 30, 2024. Exchange-traded derivatives and centrally cleared swaps are not subject to netting arrangements and as such are excluded from the table.
| | | | | | | | | | | | | | | | | | | | |
Counterparty | | Derivative
Assets
Subject to a
MA | | | Derivatives
Available
for Offset | | | Cash
Collateral
Received* | | | Security
Collateral
Received* | | | Net Amount
of Derivative
Assets | |
State Street Bank & Trust Co. | | $ | 13,096 | | | $ | – 0 | – | | $ | – 0 | – | | $ | – 0 | – | | $ | 13,096 | |
| | | | | | | | | | | | | | | | | | | | |
Total | | $ | 13,096 | | | $ | – 0 | – | | $ | – 0 | – | | $ | – 0 | – | | $ | 13,096 | ^ |
| | | | | | | | | | | | | | | | | | | | |
| | | | | | | | | | | | | | | | | | | | |
Counterparty | | Derivative
Liabilities
Subject to a
MA | | | Derivatives
Available
for Offset | | | Cash
Collateral
Pledged* | | | Security
Collateral
Pledged* | | | Net Amount
of Derivative
Liabilities | |
Bank of America, NA | | $ | 4,007 | | | $ | – 0 | – | | $ | – 0 | – | | $ | – 0 | – | | $ | 4,007 | |
| | | | | | | | | | | | | | | | | | | | |
Total | | $ | 4,007 | | | $ | – 0 | – | | $ | – 0 | – | | $ | – 0 | – | | $ | 4,007 | ^ |
| | | | | | | | | | | | | | | | | | | | |
| * | The actual collateral received/pledged may be more than the amount reported due to over-collateralization. |
| ^ | Net amount represents the net receivable/payable that would be due from/to the counterparty in the event of default or termination. The net amount from OTC financial derivative instruments can only be netted across transactions governed under the same master agreement with the same counterparty. |
2. Currency Transactions
The Fund may invest in non-U.S. Dollar-denominated securities on a currency hedged or unhedged basis. The Fund may seek investment opportunities by taking long or short positions in currencies through the use of currency-related derivatives, including forward currency exchange contracts, futures and options on futures, swaps, and other options. The Fund may enter into transactions for investment opportunities when it anticipates that a foreign currency will appreciate or depreciate in value but securities denominated in that currency are not held by the Fund and do not present attractive investment opportunities. Such transactions may also be used when the Adviser believes that it may be more efficient than a direct investment in a foreign currency-denominated security. The Fund may also conduct currency exchange contracts on a spot basis (i.e., for cash at the spot rate prevailing in the currency exchange market for buying or selling currencies).
| | |
| |
| abfunds.com | | AB SHORT DURATION INCOME ETF | 45 |
NOTES TO FINANCIAL STATEMENTS (continued)
NOTE E
Shares of the Fund
The Fund’s shares may only be bought and sold in a secondary market through a broker-dealer at a market price. Because ETF shares trade at market prices rather than NAV, shares may trade at a price greater than NAV (a premium) or less than NAV (a discount). The Fund issues and redeems shares at its NAV only in aggregations of a specified number of shares (a creation unit) generally in exchange for a designated portfolio of securities and/or cash (including any portion of such securities for which cash may be substituted). A fixed transaction fee is imposed on authorized participants in connection with creation unit redemption and creation transactions. Authorized participants may be required to pay an additional variable charge to cover certain costs and expenses related to the execution of trades resulting from creation unit transactions. Such variable charges, if any, are included in other capital within the Statement of Changes in Net Assets.
Transactions in shares of the Fund were as follows:
| | | | | | | | | | | | | | | | | | | | | | | | | | | | | | | | |
| | | | | | | | | | | | | | | | | | | | | | | | | | | | | | | | |
| | | Shares | | | | | | Amount | | | | |
| | | Period Ended
November 30,
2024(a) | | | Year Ended
October 31,
2024(b) | | | Year Ended
October 31,
2023 | | | | | | Period Ended
November 30,
2024(a) | | | Year Ended
October 31,
2024(b) | | | Year Ended
October 31,
2023 | | | | |
| | | | | | | | |
| Class A | | | | | |
Shares sold | | | – 0 | – | | | 83,992 | | | | 161,357 | | | | | | | $ | – 0 | – | | $ | 745,203 | | | $ | 1,417,247 | | | | | |
| | | | | |
Shares issued in reinvestment of dividends | | | – 0 | – | | | 4,782 | | | | 12,523 | | | | | | | | – 0 | – | | | 42,536 | | | | 110,490 | | | | | |
| | | | | |
Shares converted from Class C | | | – 0 | – | | | – 0 | – | | | 135 | | | | | | | | – 0 | – | | | – 0 | – | | | 1,197 | | | | | |
| | | | | |
Shares converted to Advisor Class | | | – 0 | – | | | (250,959 | ) | | | – 0 | – | | | | | | | – 0 | – | | | (2,222,542 | ) | | | – 0 | – | | | | |
| | | | | |
Shares redeemed | | | – 0 | – | | | (137,359 | ) | | | (376,175 | ) | | | | | | | – 0 | – | | | (1,218,920 | ) | | | (3,319,598 | ) | | | | |
| | | | | |
Net decrease | | | – 0 | – | | | (299,544 | ) | | | (202,160 | ) | | | | | | $ | – 0 | – | | $ | (2,653,723 | ) | | $ | (1,790,664 | ) | | | | |
| | | | | |
| | | | | | | | | | | | | | | | | | | | | | | | | | | | | | | | |
| Class C | | | | | |
Shares sold | | | – 0 | – | | | 4,927 | | | | 29,648 | | | | | | | $ | – 0 | – | | $ | 43,888 | | | $ | 257,425 | | | | | |
| | | | | |
Shares issued in reinvestment of dividends | | | – 0 | – | | | 266 | | | | 925 | | | | | | | | – 0 | – | | | 2,363 | | | | 8,162 | | | | | |
| | | | | |
Shares converted to Class A | | | – 0 | – | | | – 0 | – | | | (136 | ) | | | | | | | – 0 | – | | | – 0 | – | | | (1,197 | ) | | | | |
| | | | | |
Shares converted to Advisor Class | | | – 0 | – | | | (23,735 | ) | | | – 0 | – | | | | | | | – 0 | – | | | (209,915 | ) | | | – 0 | – | | | | |
| | | | | |
Shares redeemed | | | – 0 | – | | | (31,981 | ) | | | (13,529 | ) | | | | | | | – 0 | – | | | (282,701 | ) | | | (120,665 | ) | | | | |
| | | | | |
Net increase (decrease) | | | – 0 | – | | | (50,523 | ) | | | 16,908 | | | | | | | $ | – 0 | – | | $ | (446,365 | ) | | $ | 143,725 | | | | | |
| | | | | |
| | | | | | | | | | | | | | | | | | | | | | | | | | | | | | | | |
| | |
| |
46 | AB SHORT DURATION INCOME ETF | | abfunds.com |
NOTES TO FINANCIAL STATEMENTS (continued)
| | | | | | | | | | | | | | | | | | | | | | | | | | | | | | | | |
| | | | | | | | | | | | | | | | | | | | | | | | | | | | | | | | |
| | | Shares | | | | | | Amount | | | | |
| | | Period Ended
November 30,
2024(a) | | | Year Ended
October 31,
2024(b) | | | Year Ended
October 31,
2023 | | | | | | Period Ended
November 30,
2024(a) | | | Year Ended
October 31,
2024(b) | | | Year Ended
October 31,
2023 | | | | |
| | | | | | | | |
Advisor Class | | | | | |
Shares sold | | | – 0 | – | | | 1,339,069 | | | | 2,386,556 | | | | | | | $ | – 0 | – | | $ | 47,194,795 | | | $ | 83,357,649 | | | | | |
| | | | | |
Shares issued in reinvestment of dividends | | | – 0 | – | | | 70,699 | | | | 88,524 | | | | | | | | – 0 | – | | | 2,482,228 | | | | 3,087,814 | | | | | |
| | | | | |
Shares converted from Class A | | | | | | | 63,345 | | | | – 0 | – | | | | | | | | | | | 2,222,542 | | | | – 0 | – | | | | |
| | | | | |
Shares converted from Class C | | | – 0 | – | | | 5,991 | | | | – 0 | – | | | | | | | – 0 | – | | | 209,915 | | | | – 0 | – | | | | |
| | | | | |
Shares redeemed | | | – 0 | – | | | (2,065,622 | ) | | | (1,286,991 | ) | | | | | | | – 0 | – | | | (72,822,475 | ) | | | (44,934,561 | ) | | | | |
| | | | | |
Net increase (decrease) | | | – 0 | – | | | (586,518 | ) | | | 1,188,089 | | | | | | | $ | – 0 | – | | $ | (20,712,995 | ) | | $ | 41,510,902 | | | | | |
| | | | | |
| (a) | The Acquired Portfolio had a fiscal year end of October 31. The Fund has a fiscal year end of November 30. |
| (b) | After the close of business on June 7, 2024, AB Short Duration Income Portfolio (the “Acquired Portfolio”) was reorganized into AB Short Duration Income ETF. The amounts disclosed include those of the Acquired Portfolio. The Advisor class shares have been adjusted retroactively for the periods presented. See Note A and Note I for additional information on the reorganization. |
NOTE F
Risks Involved in Investing in the Fund
Market Risk—The value of the Fund’s assets will fluctuate as the market or markets in which the Fund invests fluctuate. The value of the Fund’s investments may decline, sometimes rapidly and unpredictably, simply because of economic changes or other events, including public health crises (including the occurrence of a contagious disease or illness), interest rate levels, and regional and global conflicts, that affect large portions of the market.
Interest-Rate Risk—Changes in interest rates will affect the value of investments in fixed-income securities. When interest rates rise, the value of existing investments in fixed-income securities tends to fall and this decrease in value may not be offset by higher income from new investments. Interest rate risk is generally greater for fixed-income securities with longer maturities or durations. The Fund may be subject to a greater risk of rising interest rates than would normally be the case due to the recent end of a period of historically low rates and the effects of potential central bank monetary policy, and government fiscal policy, initiatives and market reactions to those initiatives.
Credit Risk—An issuer or guarantor of a fixed-income security, or the counterparty to a derivatives or other contract, may be unable or unwilling to make timely payments of interest or principal, or to otherwise honor its obligations. The issuer or guarantor may default, causing a loss of the full
| | |
| |
| abfunds.com | | AB SHORT DURATION INCOME ETF | 47 |
NOTES TO FINANCIAL STATEMENTS (continued)
principal amount of a security and accrued interest. The degree of risk for a particular security may be reflected in its credit rating. There is the possibility that the credit rating of a fixed-income security may be downgraded after purchase, which may adversely affect the value of the security.
Below Investment-Grade Securities Risk—Investments in fixed-income securities with lower ratings (commonly known as “junk bonds”) are subject to a higher probability that an issuer will default or fail to meet its payment obligations. These securities may be subject to greater price volatility due to such factors as specific corporate developments and negative perceptions of the junk bond market generally and may be more difficult to trade than other types of securities.
Duration Risk—Duration is a measure that relates the expected price volatility of a fixed-income security to changes in interest rates. The duration of a fixed-income security may be shorter than or equal to full maturity of a fixed-income security. Fixed-income securities with longer durations have more risk and will decrease in price as interest rates rise. For example, a fixed-income security with a duration of three years will likely decrease in value by approximately 3% if interest rates increase by 1%.
Inflation Risk—This is the risk that the value of assets or income from investments will be less in the future as inflation decreases the value of money. As inflation increases, the value of the Fund’s assets can decline as can the value of the Fund’s distributions. This risk is significantly greater for fixed-income securities with longer maturities.
Derivatives Risk—Derivatives may be difficult to price or unwind and leveraged so that small changes may produce disproportionate losses for the Fund. A short position in a derivative instrument involves the risk of a theoretically unlimited increase in the value of the underlying asset, reference rate or index, which could cause the Fund to suffer a potentially unlimited loss. Derivatives, especially over-the-counter derivatives, are also subject to counterparty risk, which is the risk that the counterparty (the party on the other side of the transaction) on a derivative transaction will be unable or unwilling to honor its contractual obligations to the Fund.
Mortgage-Related and/or Other Asset-Backed Securities Risk—Investments in mortgage-related and other asset-backed securities are subject to certain additional risks. The value of these securities may be particularly sensitive to changes in interest rates. These risks include “extension risk”, which is the risk that, in periods of rising interest rates, issuers may delay the payment of principal, and “prepayment risk”, which is the risk that in periods of falling interest rates, issuers may pay principal
| | |
| |
48 | AB SHORT DURATION INCOME ETF | | abfunds.com |
NOTES TO FINANCIAL STATEMENTS (continued)
sooner than expected, exposing the Fund to a lower rate of return upon reinvestment of principal. Mortgage-backed securities offered by non-governmental issuers and other asset-backed securities may be subject to other risks, such as higher rates of default in the mortgages or assets backing the securities or risks associated with the nature and servicing of mortgages or assets backing the securities. Some mortgage-backed securities are “TBA” securities, which have additional risks.
Foreign (Non-U.S.) Risk—Investments in securities of non-U.S. issuers may involve more risk than those of U.S. issuers. These securities may fluctuate more widely in price and may be more difficult to trade than domestic securities due to adverse market, economic, political, regulatory or other factors.
Emerging-Market Risk—Investments in emerging market countries may have more risk because the markets are less developed and less liquid and are subject to increased economic, political, regulatory or other uncertainties.
Currency Risk—Fluctuations in currency exchange rates may negatively affect the value of the Fund’s investments or reduce its returns.
Loan Participations and Assignments Risk—When the Fund purchases loan participations and assignments, it is subject to the credit risk associated with the underlying corporate borrower. In addition, the lack of a liquid secondary market for loan participations and assignments may have an adverse impact on the value of such investments and the Fund’s ability to dispose of particular assignments or participations when necessary to meet the Fund’s liquidity needs or in response to a specific economic event such as a deterioration in the creditworthiness of the borrower.
Illiquid Investments Risk—Illiquid investments risk exists when certain investments are or become difficult to purchase or sell. Difficulty in selling such investments may result in sales at disadvantageous prices affecting the value of your investment in the Fund. Causes of illiquid investments risk may include low trading volumes and large positions. Foreign fixed-income securities may have more illiquid investments risk because secondary trading markets for these securities may be smaller and less well-developed and the securities may trade less frequently than domestic securities. Illiquid investments risk may be higher in a rising interest rate environment, when the value and liquidity of fixed-income securities generally go down.
Cash Transactions Risk—The Fund intends to transact many of its creation and redemption orders for cash, rather than in-kind securities. As a result, an investment in the Fund is expected to be less tax-efficient than an investment in an ETF that effectuates its transactions in Creation Units
| | |
| |
| abfunds.com | | AB SHORT DURATION INCOME ETF | 49 |
NOTES TO FINANCIAL STATEMENTS (continued)
primarily on an in-kind basis. A fund that effects redemptions for cash may be required to sell portfolio securities in order to obtain the cash needed to distribute redemption proceeds. Any recognized gain on these sales by the Fund will generally cause the Fund to recognize a gain it might not otherwise have recognized, or to recognize such gain sooner than would otherwise be required as compared to an ETF that distributes portfolio securities in-kind in redemption of Creation Units. The Fund intends to distribute gains that arise by virtue of the issuance and redemption of Creation Units being effectuated in cash to shareholders to avoid being taxed on this gain at the fund level and otherwise comply with applicable tax requirements. This may cause shareholders to be subject to tax on gains to which they would not otherwise be subject, or at an earlier date than if they had made an investment in another ETF. Moreover, cash transactions may have to be carried out over several days if the securities market is relatively illiquid and may involve considerable brokerage fees and taxes. Brokerage fees, which will be higher than if the Fund sold and redeemed its shares principally in-kind, will be passed on to those purchasing and redeeming Creation Units in the form of creation and redemption transaction fees. In addition, these factors may result in wider spreads between the bid and ask prices of Fund shares than for ETFs that receive and distribute portfolio securities in-kind. The Fund’s use of cash for creations and redemptions could also result in dilution to the Fund and increased transaction costs, which could negatively impact the Fund’s ability to achieve its investment objective.
ETF Share Price and Net Asset Value Risk—The Fund’s shares are listed for trading on the NYSE Arca, Inc. (the “Exchange”). The Fund’s shares are generally bought and sold in the secondary market at market prices. The NAV of the Fund will fluctuate with changes in the market value of the Fund’s holdings. The Fund’s NAV is calculated once per day, at the end of the day. The market price of a share on the Exchange could be higher than the NAV (premium), or lower than the NAV (discount) and may fluctuate during the trading day. When all or a portion of the Fund’s underlying securities trade in a market that is closed when the market for the Fund’s shares is open, there may be differences between the current value of a security and the last quoted price for that security in the closed local market, which could lead to a deviation between the market value of the Fund’s shares and the Fund’s NAV. Disruptions in the creations and redemptions process or the existence of extreme market volatility could result in the Fund’s shares trading above or below NAV. As the Fund may invest in securities traded on foreign exchanges, Fund shares may trade at a larger premium or discount to the Fund’s NAV per share than shares of other ETFs. In addition, in stressed market conditions, the market for Fund shares may become less liquid in response to deteriorating liquidity in the markets for the Fund’s underlying portfolio holdings.
| | |
| |
50 | AB SHORT DURATION INCOME ETF | | abfunds.com |
NOTES TO FINANCIAL STATEMENTS (continued)
Authorized Participant Risk—Only a limited number of financial institutions that enter into an authorized participant relationship with the Fund (“Authorized Participants”) may engage in creation or redemption transactions. If the Fund’s Authorized Participants decide not to create or redeem shares, Fund shares may trade at a larger premium or discount to the Fund’s NAV per share, or the Fund could face trading halts or de-listing.
Active Trading Market Risk—There is no guarantee that an active trading market for Fund shares will exist at all times. In times of market stress, markets can suffer erratic or unpredictable trading activity, extraordinary volatility or wide bid/ask spreads, which could cause some market makers and Authorized Participants to reduce their market activity or “step away” from making a market in ETF shares, and market makers and Authorized Participants are not obligated to place or execute purchase andredemption orders. This could cause the Fund’s market price to deviate, materially, from the NAV, and reduce the effectiveness of the ETF arbitrage process. Any absence of an active trading market for Fund shares could lead to a heightened risk that there will be a difference between the market price of a Fund share and the underlying value of the Fund share.
Indemnification Risk—In the ordinary course of business, the Fund enters into contracts that contain a variety of indemnifications. The Fund’s maximum exposure under these arrangements is unknown. However, the Fund has not had prior claims or losses pursuant to these indemnification provisions and expects the risk of loss thereunder to be remote. Therefore, the Fund has not accrued any liability in connection with these indemnification provisions.
Management Risk—The Fund is subject to management risk because it is an actively-managed investment fund. The Adviser will apply its investment techniques and risk analyses in making investment decisions, but there is no guarantee that its techniques will produce the intended results. Some of these techniques may incorporate, or rely upon, quantitative models, but there is no guarantee that these models will generate accurate forecasts, reduce risk or otherwise perform as expected.
NOTE G
Joint Credit Facility
A number of open-end mutual funds managed by the Adviser, including the Fund, participate in a $325 million revolving credit facility (the “Facility”) intended to provide short-term financing related to redemptions and other short term liquidity requirements, subject to certain restrictions. Commitment fees related to the Facility are paid by the participating funds and are
| | |
| |
| abfunds.com | | AB SHORT DURATION INCOME ETF | 51 |
NOTES TO FINANCIAL STATEMENTS (continued)
included in miscellaneous expenses in the statement of operations. The Fund did not utilize the Facility during the period ended November 30, 2024.
NOTE H
Distributions to Shareholders
The tax character of distributions paid during the fiscal period ended November 30, 2024 and the fiscal years ended October 31, 2024 and October 31, 2023 were as follows:
| | | | | | | | | | | | |
| | | November 1,
2024 to
November 30,
2024 | | | Year Ended
October 31,
2024 | | | Year Ended
October 31,
2023 | |
Distributions paid from: | | | | | | | | | | | | |
Ordinary income | | $ | 378,246 | | | $ | 5,048,765 | | | $ | 4,451,992 | |
| | | | | | | | | | | | |
Total taxable distributions paid | | $ | 378,246 | | | $ | 5,048,765 | | | $ | 4,451,992 | |
| | | | | | | | | | | | |
As of November 30, 2024, the components of accumulated earnings (deficit) on a tax basis were as follows:
| | | | |
Undistributed ordinary income | | $ | 479,700 | |
Accumulated capital and other losses | | | (6,482,270 | )(a) |
Unrealized appreciation (depreciation) | | | 402,848 | (b) |
| | | | |
Total accumulated earnings (deficit) | | $ | (5,599,722 | )(c) |
| | | | |
| (a) | As of November 30, 2024, the Fund had a net capital loss carryforward of $6,471,038. During the fiscal period, the Fund utilized $23,658 of capital loss carry forwards to offset current year net realized gains. As of November 30, 2024, the cumulative deferred loss on straddles was $11,232. |
| (b) | The differences between book-basis and tax-basis unrealized appreciation (depreciation) are attributable primarily to the recognition for tax purposes of unrealized gains/losses on certain derivative instruments, the tax treatment of callable bonds, the tax treatment of swaps, and the tax deferral of losses on wash sales. |
| (c) | The differences between book-basis and tax-basis components of accumulated earnings (deficit) are attributable primarily to the accrual of foreign capital gains tax and the tax treatment of defaulted securities. |
For tax purposes, net realized capital losses may be carried over to offset future capital gains, if any. Funds are permitted to carry forward capital losses for an indefinite period, and such losses will retain their character as either short-term or long-term capital losses. As of November 30, 2024, the Fund had a net short-term capital loss carryforward of $2,115,132 and a net long-term capital loss carryforward of $4,355,906, which may be carried forward for an indefinite period.
During the current fiscal period, there were no permanent differences that resulted in adjustments to accumulated loss or additional paid-in capital.
| | |
| |
52 | AB SHORT DURATION INCOME ETF | | abfunds.com |
NOTES TO FINANCIAL STATEMENTS (continued)
NOTE I
Reorganization
At meetings held on October 31 – November 2, 2023, the Board, on behalf of the Fund, and the Board of Directors of the Acquired Portfolio approved the Conversion providing for the tax-free acquisition by the Fund of the assets and liabilities of the Acquired Portfolio. The acquisition was completed at the close of business June 7, 2024. Pursuant to the Plan, the assets and liabilities of the Acquired Portfolio’s shares were transferred in exchange for Fund shares, in a tax-free exchange as follows:
| | | | | | | | | | | | | | | | |
Portfolio | | Shares
outstanding
before the
Conversion | | | Shares
outstanding
immediately
after the
Conversion | | | Aggregate
net assets
before the
Conversion | | | Aggregate
net assets
immediately
after the
Conversion | |
Acquired Portfolio* | | | 11,443,352 | | | | – 0 | – | | $ | 101,095,155 | + | | $ | – 0 | – |
The Fund | | | – 0 | – | | | 2,888,433 | | | $ | – 0 | – | | $ | 101,095,155 | |
| * | Represents the accounting survivor. |
| + | Includes distributions in excess of net investment income of $331,428 and unrealized depreciation on investments of $209,880, with a fair value of $99,296,404 and identified cost of $99,506,284. |
For financial reporting purposes, assets received and shares issued by the Fund were recorded at fair value; however, the cost basis of the investments received from the Acquired Portfolio were carried forward to align ongoing reporting of the Fund’s realized and unrealized gains and losses with amounts distributable to shareholders for tax purposes.
NOTE J
Recent Accounting Pronouncements
In December 2022, the Financial Accounting Standards Board issued an Accounting Standards Update, ASU 2022-06, “Reference Rate Reform (Topic 848) – Deferral of the Sunset Date of Topic 848”. ASU 2022-06 is an amendment to ASU 2020-04, which provided optional guidance to ease the potential accounting burden due to the discontinuation of the LIBOR and other interbank-offered based reference rates and which was effective as of March 12, 2020 through December 31, 2022. ASU 2022-06 extends the effective period through December 31, 2024. Management is currently evaluating the impact, if any, of applying ASU 2022-06.
In November 2023, the Financial Accounting Standards Board issued Accounting Standards Update, ASU 2023-07, “Segment Reporting (Topic 280)”. ASU 2023-07 requires public entities to provide disclosure of significant segment expenses that are regularly provided to the chief operating decision maker (“CODM”). ASU 2023-07, among other things, (i) requires a single segment public entity to provide all necessary disclosures required by Topic 280 it, (ii) requires a public entity to disclose the
| | |
| |
| abfunds.com | | AB SHORT DURATION INCOME ETF | 53 |
NOTES TO FINANCIAL STATEMENTS (continued)
title and position of the CODM and an explanation of how the CODM uses the reported measure(s) of segment profit and loss in assessing segment performance and deciding how to allocate resources and (iii) provides the ability for a public entity to elect more than one performance measure. ASU 2023-07 is effective for fiscal years beginning after December 15, 2023, and interim periods within fiscal years beginning after December 15, 2024. Early adoption of ASU 2023-07 is permitted. Management is currently evaluating the impact, if any, of applying ASU 2023-07.
NOTE K
Subsequent Events
Management has evaluated subsequent events for possible recognition or disclosure in the financial statements through the date the financial statements are issued. Management has determined that there are no material events that would require disclosure in the Fund’s financial statements through this date.
| | |
| |
54 | AB SHORT DURATION INCOME ETF | | abfunds.com |
FINANCIAL HIGHLIGHTS
Selected Data For A Share Of Capital Stock Outstanding Throughout Each Period(a)
| | | | | | | | | | | | | | | | | | | | | | | | |
| | | November 1,
2024 to
November 30, 2024(b) | | | Year Ended October 31, | |
| | | 2024 | | | 2023 | | | 2022 | | | 2021 | | | 2020 | |
| | | | |
| | | | | | | | | | | | | | | | | | | | | | | | |
Net asset value, beginning of period | | | $ 35.51 | | | | $ 34.35 | | | | $ 34.43 | | | | $ 39.18 | | | | $ 39.42 | | | | $ 41.00 | |
| | | | |
Income From Investment Operations | | | | | | | | | | | | | | | | | | | | | | | | |
| | | | | | |
Net investment income(c)(d) | | | 0.15 | | | | 1.84 | | | | 1.51 | | | | 0.79 | | | | 0.99 | | | | 0.83 | |
| | | | | | |
Net realized and unrealized gain (loss) on investment and foreign currency transactions | | | 0.06 | | | | 1.04 | | | | 0.27 | (e) | | | (4.15 | ) | | | .00 | (e)(f) | | | (.31 | )(e) |
| | | | | | |
Contribution from Affiliates | | | – 0 | – | | | – 0 | – | | | – 0 | – | | | .00 | (f) | | | – 0 | – | | | – 0 | – |
| | | | |
| | | | | | |
Net increase (decrease) in net asset value from operations | | | 0.21 | | | | 2.88 | | | | 1.78 | | | | (3.36 | ) | | | 0.99 | | | | 0.52 | |
| | | | |
Less: Dividends and Distributions | | | | | | | | | | | | | | | | | | | | | | | | |
| | | | | | |
Dividends from net investment income | | | (.15 | ) | | | (1.72 | ) | | | (1.86 | ) | | | (.95 | ) | | | (1.23 | ) | | | (1.58 | ) |
| | | | | | |
Distributions from net realized gain on investment transactions | | | – 0 | – | | | – 0 | – | | | – 0 | – | | | (.44 | ) | | | – 0 | – | | | (.52 | ) |
| | | | |
Total dividends and distributions | | | (.15 | ) | | | (1.72 | ) | | | (1.86 | ) | | | (1.39 | ) | | | (1.23 | ) | | | (2.10 | ) |
| | | | |
Net asset value, end of period | | | $ 35.57 | | | | $ 35.51 | | | | $ 34.35 | | | | $ 34.43 | | | | $ 39.18 | | | | $ 39.42 | |
| | | | |
Total Return | | | | | | | | | | | | | | | | | | | | | | | | |
| | | | | | |
Total investment return based on net asset value(g) | | | .59 | % | | | 8.52 | % | | | 5.22 | % | | | (8.76 | )% | | | 2.48 | % | | | 1.34 | % |
| | | | | | |
Ratios/Supplemental Data | | | | | | | | | | | | | | | | | | | | | | | | |
| | | | | | |
Net assets, end of period (000’s omitted) | | | $88,503 | | | | $88,363 | | | | $105,618 | | | | $64,972 | | | | $56,593 | | | | $41,681 | |
| | | | | | |
Ratio to average net assets of: | | | | | | | | | | | | | | | | | | | | | | | | |
| | | | | | |
Expenses, net of waivers/reimbursements(h) | | | .30 | %^ | | | .39 | % | | | .71 | % | | | .77 | % | | | .47 | % | | | .48 | % |
| | | | | | |
Expenses, before waivers/reimbursements(h) | | | .30 | %^ | | | .70 | % | | | 1.26 | % | | | 1.48 | % | | | 1.18 | % | | | 1.68 | % |
| | | | | | |
Net investment income(d) | | | 5.14 | %^ | | | 5.23 | % | | | 4.29 | % | | | 2.17 | % | | | 2.52 | % | | | 2.13 | % |
| | | | | | |
Portfolio turnover rate(i)* | | | 1 | % | | | 116 | % | | | 185 | % | | | 60 | % | | | 163 | % | | | 336 | % |
| | | | | | |
Portfolio turnover rate (including securities sold short)* | | | N/A | | | | N/A | | | | N/A | | | | N/A | | | | N/A | | | | 336 | % |
See footnote summary on page 56.
| | |
| |
| abfunds.com | | AB SHORT DURATION INCOME ETF | 55 |
FINANCIAL HIGHLIGHTS (continued)
Selected Data For A Share Of Capital Stock Outstanding Throughout Each Period(a)
| (a) | After the close of business on June 7, 2024, AB Short Duration Income Portfolio (the “Acquired Portfolio”) was converted into AB Short Duration Income ETF. The performance and financial history of the Acquired Portfolio’s Advisor Class Shares have been adopted by the Fund and will be used going forward. As a result, the Financial Highlight information includes that of the Acquired Portfolio’s Advisor Class Shares and has been adjusted retroactively for the periods from October 31, 2020 through the Reorganization. |
| (b) | The Acquired Portfolio had a fiscal year end of October 31. The Fund has a fiscal year end of November 30. |
| (c) | Based on average shares outstanding. |
| (d) | Net of expenses waived/reimbursed by the Adviser. |
| (e) | Due to timing of sales and repurchase of capital shares, the net realized and unrealized gain (loss) per share is not in accordance with the Fund’s change in net realized and unrealized gain (loss) on investment transactions for the period. |
| (f) | Amount is less than $.005. |
| (g) | Total investment return is calculated assuming an initial investment made at the net asset value at the beginning of the period, reinvestment of all dividends and distributions at net asset value during the period, and redemption on the last day of the period. Initial sales charges or contingent deferred sales charges are not reflected in the calculation of total investment return. Total investment return does not reflect the deduction of taxes that a shareholder would pay on fund distributions or the redemption of fund shares. Total investment return calculated for a period of less than one year is not annualized. |
| (h) | The expense ratios presented below exclude interest/bank overdraft expense: |
| | | | | | | | | | | | | | | | | | | | | | | | |
| | | November 1, 2024 to
November 30,
2024(b) | | | Year Ended October 31, | |
| | | 2024 | | | 2023 | | | 2022 | | | 2021 | | | 2020 | |
| | | | |
| | | | | | | | | | | | | | | | | | | | | | | | |
| | | | | | |
Net of waivers/reimbursements | | | .30 | %^ | | | .39 | % | | | .45 | % | | | .45 | % | | | .45 | % | | | .45 | % |
| | | | | | |
Before waivers/reimbursements | | | .30 | %^ | | | .70 | % | | | 1.00 | % | | | 1.16 | % | | | 1.16 | % | | | 1.64 | % |
| (i) | Excludes the value of portfolio securities received or delivered as a result of in-kind purchases or redemptions of the Fund’s capital shares, including ETF Creation Units. |
| * | The Fund accounts for dollar roll transactions as purchases and sales. |
See notes to financial statements.
| | |
| |
56 | AB SHORT DURATION INCOME ETF | | abfunds.com |
REPORT OF INDEPENDENT REGISTERED
PUBLIC ACCOUNTING FIRM
To the Shareholders and the Board of Directors of AB Short Duration Income ETF
Opinion on the Financial Statements
We have audited the accompanying statement of assets and liabilities of AB Short Duration Income ETF (the “Fund”) (one of the funds constituting AB Active ETFs, Inc. (the “Corporation”)), including the portfolio of investments, as of November 30, 2024, and the related statements of operations for the period from November 1, 2024 to November 30, 2024 and for the year ended October 31, 2024, and the statements of changes in net assets for the period from November 1, 2024 to November 30, 2024 and for each of the two years in the period ended October 31, 2024, the financial highlights for the period from November 1, 2024 to November 30, 2024 and for each of the five years in the period ended October 31, 2024, and the related notes (collectively referred to as the “financial statements”). In our opinion, the financial statements present fairly, in all material respects, the financial position of the Fund (one of the funds constituting AB Active ETFs, Inc.) at November 30, 2024, the results of its operations for the period from November 1, 2024 to November 30, 2024 and for the year ended October 31, 2024, the changes in its net assets for the period from November 1, 2024 to November 30, 2024 and for each of the two years in the period ended October 31, 2024 and its financial highlights for the period from November 1, 2024 to November 30, 2024 and for each of the five years in the period ended October 31, 2024, in conformity with U.S. generally accepted accounting principles.
Basis for Opinion
These financial statements are the responsibility of the Corporation’s management. Our responsibility is to express an opinion on the Fund’s financial statements based on our audits. We are a public accounting firm registered with the Public Company Accounting Oversight Board (United States) (“PCAOB”) and are required to be independent with respect to the Corporation in accordance with the U.S. federal securities laws and the applicable rules and regulations of the Securities and Exchange Commission and the PCAOB.
We conducted our audits in accordance with the standards of the PCAOB. Those standards require that we plan and perform the audit to obtain reasonable assurance about whether the financial statements are free of material misstatement, whether due to error or fraud. The Corporation is not required to have, nor were we engaged to perform, an audit of the Corporation’s internal control over financial reporting. As part of our audits, we are required to obtain an understanding of internal control over financial reporting but not for the purpose of expressing an opinion on the
| | |
| |
| abfunds.com | | AB SHORT DURATION INCOME ETF | 57 |
REPORT OF INDEPENDENT REGISTERED
PUBLIC ACCOUNTING FIRM (continued)
effectiveness of the Corporation’s internal control over financial reporting. Accordingly, we express no such opinion.
Our audits included performing procedures to assess the risks of material misstatement of the financial statements, whether due to error or fraud, and performing procedures that respond to those risks. Such procedures included examining, on a test basis, evidence regarding the amounts and disclosures in the financial statements. Our procedures included confirmation of securities owned as of November 30, 2024, by correspondence with the custodian, brokers and others; when replies were not received from brokers or others, we performed other auditing procedures. Our audits also included evaluating the accounting principles used and significant estimates made by management, as well as evaluating the overall presentation of the financial statements. We believe that our audits provide a reasonable basis for our opinion.

We have served as the auditor of one or more of the AB investment companies since 1968.
New York, New York
January 28, 2025
| | |
| |
58 | AB SHORT DURATION INCOME ETF | | abfunds.com |
Information Regarding the Review and Approval of the Fund’s Advisory Agreement
The disinterested directors (the “directors”) of AB Active ETFs, Inc. (the “Company”) unanimously approved the Company’s Advisory Agreement with the Adviser in respect of AB Short Duration Income ETF (the “Fund”) for an initial two-year period at a meeting held in-person on October 31-November 2, 2023 (the “Meeting”).
Prior to approval of the Advisory Agreement, the directors had requested from the Adviser, and received and evaluated, extensive materials. They reviewed the proposed Advisory Agreement with the Adviser and with experienced counsel who are independent of the Adviser, who advised on the relevant legal standards. The directors also reviewed additional materials, including comparative analytical data prepared by the Senior Vice President of the Fund. The directors also discussed the proposed approval in private sessions with counsel.
The directors considered their knowledge of the nature and quality of the services to be provided by the Adviser to the Fund gained from their experience as directors or trustees of most of the registered investment companies advised by the Adviser, including the other series of the Company that are organized as exchange-traded funds (“ETFs”), their overall confidence in the Adviser’s integrity and competence they have gained from that experience, the Adviser’s initiative in identifying and raising potential issues with the directors and its responsiveness, frankness and attention to concerns raised by the directors in the past, including the Adviser’s willingness to consider and implement organizational and operational changes designed to improve investment results and the services provided to the AB Funds. The directors noted that they have four regular meetings each year, at each of which they review extensive materials and information from the Adviser, including information on the investment performance of the AB Funds.
The directors also considered all factors they believed relevant, including the specific matters discussed below. During the course of their deliberations, the directors evaluated, among other things, the reasonableness of the proposed advisory fee. The directors did not identify any particular information that was all-important or controlling, and different directors may have attributed different weights to the various factors. The directors determined that the selection of the Adviser to manage the Fund and the overall arrangements between the Fund and the Adviser, as provided in the Advisory Agreement, including the proposed advisory fee, were fair and reasonable in light of the services to be performed, expenses to be incurred and such other matters as the directors considered relevant in the exercise of their business judgment. The material factors and conclusions
| | |
| |
| abfunds.com | | AB SHORT DURATION INCOME ETF | 59 |
that formed the basis for the directors’ determinations included the following:
Nature, Extent and Quality of Services to be Provided
The directors considered the scope and quality of services to be provided by the Adviser under the Advisory Agreement, including the quality of the investment research capabilities of the Adviser and the other resources it has dedicated to performing services for the AB Funds. They also noted the professional experience and qualifications of the Fund’s portfolio management team and other senior personnel of the Adviser. The directors also considered that the Advisory Agreement provides that the Fund will reimburse the Adviser for the cost to it of providing certain clerical, accounting, administrative and other services to the Fund by employees of the Adviser or its affiliates. Requests for these reimbursements will be subject to the directors’ approval on a quarterly basis. The directors noted that the Adviser does not expect to request such reimbursements. The quality of administrative and other services, including the Adviser’s role in coordinating the activities of the Fund’s other service providers, also was considered. The directors concluded that, overall, they were satisfied with the nature, extent and quality of services to be provided to the Fund under the Advisory Agreement.
Costs of Services to be Provided and Profitability
Because the Fund had not yet commenced operations, the directors were unable to consider historical information about the profitability of the Fund. However, the Adviser agreed to provide the directors with profitability information in connection with future proposed continuances of the Advisory Agreement. They also considered the costs to be borne by the Adviser in providing services to the Fund and that the Fund was unlikely to be profitable to the Adviser unless it achieves a material level of net assets.
Fall-Out Benefits
The directors considered the other benefits to the Adviser from its proposed relationship with the Fund. The directors recognized that the Adviser’s future profitability would be somewhat lower without these benefits. The directors understood that the Adviser also might derive reputational and other benefits from its association with the Fund.
Investment Results
Since the Fund was newly formed and had not yet commenced operations, no performance or other historical information for the Fund was available. However, it was proposed that the Fund would receive the assets of AB Short Duration Income Portfolio (the “Acquired Portfolio”), a series of AB Bond Fund, Inc. (a mutual fund), in exchange for shares of the Fund (an exchange traded fund) and the assumption by the Fund of all the liabilities of the Acquired Portfolio. Shareholders of the Acquired Portfolio would receive shares of the Fund in a liquidating distribution of the
| | |
| |
60 | AB SHORT DURATION INCOME ETF | | abfunds.com |
Acquired Portfolio (the “Conversion”). The Conversion is expected to be consummated on or about June 2024. Based on the Adviser’s written and oral presentations regarding the proposed management of the Fund and their general knowledge and confidence in the Adviser’s expertise in managing mutual funds and ETFs, the directors concluded that they were satisfied that the Adviser was capable of providing high quality Fund management services to the Fund.
Advisory Fees and Other Expenses
The directors considered the proposed advisory fee rate payable by the Fund to the Adviser and information prepared by an independent service provider (the “15(c) service provider”), concerning advisory fee rates payable by other ETFs in the same category as the Fund, based on the Fund’s projected net assets of $250 million. The directors noted that the proposed advisory fee is a unitary fee and that the Adviser will pay all expenses of the Fund except for certain expenses payable by the Fund such as interest expense, taxes, extraordinary expenses, and brokerage commissions and other transaction costs. The directors recognized that it is difficult to make comparisons of advisory fees because there are variations in the services that are included in the fees payable by other ETFs. The directors considered the Fund’s proposed contractual advisory fee rate against a peer group median and noted that it was lower than the median.
The directors also considered the Adviser’s fee schedule for other clients utilizing investment strategies similar to those of the Fund. For this purpose, they reviewed the relevant advisory fee information from the Adviser’s Form ADV and in a report from the Fund’s Senior Vice President and noted the differences between the Fund’s proposed fee schedule, on the one hand, and the Adviser’s institutional fee schedule and the schedule of fees charged by the Adviser to any offshore funds and for services to any sub-advised funds utilizing investment strategies similar to those of the Fund, on the other. The directors noted that the Adviser may, in some cases, agree to fee rates with large institutional clients that are lower than those reviewed by the directors and that they had previously discussed with the Adviser its policies in respect of such arrangements. The directors also compared the proposed advisory fee rate for the Fund with that for another fund advised by the Adviser utilizing similar investment strategies.
The Adviser reviewed with the directors the significantly greater scope of the services it will provide to the Fund relative to institutional, offshore fund and sub-advised fund clients. In this regard, the Adviser noted, among other things, that, compared to institutional and offshore or sub-advisory accounts, the Fund (i) demands considerably more managerial and administrative resources due to the potential for frequent creations and redemptions of shares; (ii) has more tax and regulatory restrictions and compliance obligations; (iii) must prepare and file or distribute regulatory
| | |
| |
| abfunds.com | | AB SHORT DURATION INCOME ETF | 61 |
and other communications about fund operations; and (iv) must provide shareholder servicing to retail investors. The Adviser also reviewed the greater legal risks presented by the large and changing population of Fund shareholders who may assert claims against the Adviser in individual or class actions, and the greater entrepreneurial risk in offering new fund products, which require substantial investment to launch, may not succeed, and generally must be priced to compete with larger, more established funds resulting in lack of profitability to the Adviser until a new fund achieves scale. In light of the substantial differences in services rendered by the Adviser to institutional, offshore fund and sub-advised fund clients as compared to the Fund, and the different risk profile, the directors considered these fee comparisons inapt and did not place significant weight on them in their deliberations. The directors noted that the proposed unitary fee for the Fund covers additional services provided by third parties and thus is not directly comparable to the Adviser’s institutional fee schedule and the schedule of fees for most other funds advised by the Adviser.
In connection with their review of the Fund’s proposed advisory fee, the directors also considered the projected total expense ratio of the shares of the Fund in comparison to a group of similar ETFs (“peer group”) and a larger group of similar ETFs (“peer universe”) selected by the 15(c) service provider. The directors view the projected expense ratio information as relevant to their evaluation of the Adviser’s services because the Adviser is responsible for coordinating services provided to the Fund by others and, in most cases, the Adviser will be responsible for paying for such services under its unitary fee arrangement with the Fund. The directors noted that the Fund’s projected expense ratio was lower than the median. Based on their review, the directors concluded that the Fund’s projected expense ratio was acceptable.
Economies of Scale
The directors noted that the proposed advisory fee schedule for the Fund does not contain breakpoints and that they had discussed their strong preference for breakpoints in advisory contracts with the Adviser. The directors took into consideration prior presentations by an independent consultant on economies of scale in the mutual fund industry and for the AB Funds, and presentations from time to time by the Adviser concerning certain of its views on economies of scale. The directors also had requested and received from the Adviser certain updates on economies of scale in advance of the Meeting. The directors believe that economies of scale may be realized (if at all) by the Adviser across a variety of products and services, and not only in respect of a single fund. The directors noted that there is no established methodology for setting breakpoints that give effect to the fund-specific services provided by a fund’s adviser and to the economies of scale that an adviser may realize in its overall mutual fund business or those components of it which directly or indirectly affect a
| | |
| |
62 | AB SHORT DURATION INCOME ETF | | abfunds.com |
fund’s operations. The directors observed that in the mutual fund industry as a whole, as well as among ETFs similar to the Fund, there is no uniformity or pattern in the fees and asset levels at which breakpoints (if any) apply. The directors also noted that the advisory agreements for many ETFs do not have breakpoints at all. The directors informed the Adviser that they would monitor the Fund’s asset level and its profitability to the Adviser and anticipated revisiting the question of breakpoints in the future if circumstances warranted doing so.
| | |
| |
| abfunds.com | | AB SHORT DURATION INCOME ETF | 63 |
NOTES
| | |
| |
64 | AB SHORT DURATION INCOME ETF | | abfunds.com |
AB SHORT DURATION INCOME ETF
66 Hudson Boulevard East
New York, NY 10001
800 221 5672
ETF-SDI-0151-1124 
NOV 11.30.24

ANNUAL FINANCIAL STATEMENTS AND ADDITIONAL INFORMATION
AB TAX-AWARE INTERMEDIATE MUNICIPAL ETF
(NYSE: TAFM)

| | |
| |
| Investment Products Offered | | • Are Not FDIC Insured • May Lose Value • Are Not Bank Guaranteed |
Investors should consider the investment objectives, risks, charges and expenses of the Fund carefully before investing. For copies of our prospectus or summary prospectus, which contain this and other information, visit us online at www.abfunds.com or contact your AB representative. Please read the prospectus and/or summary prospectus carefully before investing.
This shareholder report must be preceded or accompanied by the Fund’s prospectus for individuals who are not current shareholders of the Fund.
You may obtain a description of the Fund’s proxy voting policies and procedures, and information regarding how the Fund voted proxies relating to portfolio securities during the most recent 12-month period ended June 30, without charge. Simply visit AB’s website at www.abfunds.com, or go to the Securities and Exchange Commission’s (the “Commission”) website at www.sec.gov, or call AB at (800) 227 4618.
The Fund files its complete schedule of portfolio holdings with the Commission for the first and third quarters of each fiscal year as an exhibit to its reports on Form N-PORT. The Fund’s Form N-PORT reports are available on the Commission’s website at www.sec.gov. AB publishes full portfolio holdings for the Fund daily at www.abfunds.com.
Foreside Fund Services, LLC (“Foreside”) is the distributor of the fund. Foreside is a member of FINRA.
The [A/B] logo and AllianceBernstein® are registered trademarks used by permission of the owner, AllianceBernstein L.P.
PORTFOLIO OF INVESTMENTS
November 30, 2024
| | | | | | | | |
| | | Principal
Amount
(000) | | | U.S. $ Value | |
| |
MUNICIPAL OBLIGATIONS – 98.2% | | | | | | | | |
Long-Term Municipal Bonds – 88.6% | | | | | | | | |
Alabama – 5.6% | | | | | | | | |
Black Belt Energy Gas District
(BP PLC)
Series 2024-D
5.00%, 03/01/2055(a) | | $ | 750 | | | $ | 816,090 | |
Black Belt Energy Gas District
(Goldman Sachs Group, Inc. (The))
Series 2024-B
5.00%, 10/01/2055 | | | 600 | | | | 642,421 | |
Black Belt Energy Gas District
(Nomura Holdings, Inc.)
Series 2022-A
4.00%, 12/01/2052 | | | 150 | | | | 150,814 | |
County of Jefferson AL Sewer Revenue
Series 2024
5.25%, 10/01/2040 | | | 250 | | | | 280,662 | |
5.25%, 10/01/2044 | | | 100 | | | | 110,620 | |
Energy Southeast A Cooperative District
(Morgan Stanley)
Series 2024-B
5.25%, 07/01/2054 | | | 1,050 | | | | 1,144,220 | |
Lauderdale County Agriculture Center Authority
(Lauderdale County Agriculture Center Authority Spl Tax)
Series 2024
5.00%, 07/01/2041 | | | 1,000 | | | | 1,087,526 | |
Southeast Alabama Gas Supply District (The)
(Morgan Stanley)
Series 2024
5.00%, 06/01/2049 | | | 200 | | | | 214,051 | |
Southeast Energy Authority A Cooperative District
(Deutsche Bank AG)
Series 2024-A
5.00%, 11/01/2035 | | | 400 | | | | 420,707 | |
Southeast Energy Authority A Cooperative District
(Pacific Mutual Holding Co.)
Series 2024-C
5.00%, 11/01/2055 | | | 250 | | | | 270,125 | |
| | | | | | | | |
| | | | | | | 5,137,236 | |
| | | | | | | | |
Arizona – 2.2% | | | | | | | | |
Arizona Industrial Development Authority
(Equitable School Revolving Fund LLC Obligated Group)
Series 2024
5.00%, 11/01/2044 | | | 150 | | | | 164,372 | |
5.00%, 11/01/2049 | | | 500 | | | | 541,345 | |
| | |
| |
| abfunds.com | | AB TAX-AWARE INTERMEDIATE MUNICIPAL ETF | 1 |
PORTFOLIO OF INVESTMENTS (continued)
| | | | | | | | |
| | | Principal
Amount
(000) | | | U.S. $ Value | |
| |
Chandler Industrial Development Authority
(Intel Corp.)
Series 2022
5.00%, 09/01/2042 | | $ | 300 | | | $ | 308,136 | |
Maricopa County Industrial Development Authority
(HonorHealth Obligated Group)
Series 2019-A
4.125%, 09/01/2042 | | | 250 | | | | 250,727 | |
Salt Verde Financial Corp.
(Citigroup, Inc.)
Series 2007
5.00%, 12/01/2037 | | | 500 | | | | 552,839 | |
Sierra Vista Industrial Development Authority
(American Leadership Academy, Inc.)
Series 2024
5.00%, 06/15/2044(b) | | | 200 | | | | 202,596 | |
| | | | | | | | |
| | | | | | | 2,020,015 | |
| | | | | | | | |
California – 4.9% | | | | | | | | |
California Community Choice Financing Authority
(American General Life Insurance Co.)
Series 2024
5.00%, 08/01/2055 | | | 200 | | | | 216,653 | |
California Community Choice Financing Authority
(American International Group, Inc.)
Series 2023-D
5.50%, 05/01/2054 | | | 250 | | | | 267,377 | |
California Community Choice Financing Authority
(Apollo Global Management, Inc.)
Series 2024
5.00%, 11/01/2055 | | | 200 | | | | 216,200 | |
California Community Choice Financing Authority
(Deutsche Bank AG)
Series 2023
5.25%, 01/01/2054 | | | 200 | | | | 215,288 | |
California Community Choice Financing Authority
(Pacific Mutual Holding Co.)
Series 2024-F
5.00%, 02/01/2055 | | | 750 | | | | 818,482 | |
California Community Housing Agency
(California Community Housing Agency Brio Apartments & Next on Lex Apartments)
Series 2021
4.00%, 02/01/2056(b) | | | 100 | | | | 84,662 | |
CMFA Special Finance Agency VII
(CMFA Special Finance Agency VII The Breakwater Apartments)
Series 2021
3.00%, 08/01/2056(b) | | | 100 | | | | 71,413 | |
| | |
| |
2 | AB TAX-AWARE INTERMEDIATE MUNICIPAL ETF | | abfunds.com |
PORTFOLIO OF INVESTMENTS (continued)
| | | | | | | | |
| | | Principal
Amount
(000) | | | U.S. $ Value | |
| |
Golden State Tobacco Securitization Corp.
Series 2021-B
Zero Coupon, 06/01/2066 | | $ | 455 | | | $ | 50,877 | |
Series 2022
5.00%, 06/01/2051 | | | 460 | | | | 484,940 | |
San Francisco Bay Area Rapid Transit District
Series 2017
4.00%, 08/01/2037 | | | 300 | | | | 304,744 | |
San Francisco Intl Airport
Series 2024
5.00%, 05/01/2034 | | | 500 | | | | 556,797 | |
San Francisco Intl Airport
(SFO Fuel Co. LLC)
Series 2019
5.00%, 01/01/2047 | | | 1,000 | | | | 1,031,070 | |
State of California
Series 2024 | | | | | | | | |
5.00%, 08/01/2044 | | | 200 | | | | 227,887 | |
| | | | | | | | |
| | | | | | | 4,546,390 | |
| | | | | | | | |
Colorado – 1.2% | | | | | | | | |
City & County of Denver CO Airport System Revenue
(Denver Intl Airport)
Series 2018-A
5.00%, 12/01/2031 | | | 300 | | | | 316,051 | |
5.00%, 12/01/2034 | | | 400 | | | | 439,133 | |
Colorado Educational & Cultural Facilities Authority
(Ascent Classical Academy Charter Schools, Inc.)
Series 2024
5.50%, 04/01/2044(b) | | | 100 | | | | 104,601 | |
Colorado Health Facilities Authority
(Christian Living Neighborhoods Obligated Group)
Series 2021
4.00%, 01/01/2042 | | | 250 | | | | 230,594 | |
| | | | | | | | |
| | | | | | | 1,090,379 | |
| | | | | | | | |
Connecticut – 1.6% | | | | | | | | |
State of Connecticut
Series 2019-B
5.00%, 02/15/2025 | | | 500 | | | | 501,886 | |
State of Connecticut Special Tax Revenue
Series 2018-B
5.00%, 10/01/2025 | | | 1,000 | | | | 1,016,711 | |
| | | | | | | | |
| | | | | | | 1,518,597 | |
| | | | | | | | |
| | |
| |
| abfunds.com | | AB TAX-AWARE INTERMEDIATE MUNICIPAL ETF | 3 |
PORTFOLIO OF INVESTMENTS (continued)
| | | | | | | | |
| | | Principal
Amount
(000) | | | U.S. $ Value | |
| |
District of Columbia – 2.7% | | | | | | | | |
District of Columbia
(District of Columbia Union Market TIF Area)
Series 2024-A
5.125%, 06/01/2034(b) | | $ | 100 | | | $ | 101,931 | |
District of Columbia
(KIPP DC Obligated Group)
Series 2017-B
5.00%, 07/01/2037 | | | 200 | | | | 206,584 | |
Metropolitan Washington Airports Authority Aviation Revenue
Series 2020-A
5.00%, 10/01/2033 | | | 250 | | | | 267,642 | |
Series 2022-A
5.00%, 10/01/2031 | | | 345 | | | | 376,745 | |
Series 2023-A
5.00%, 10/01/2035 | | | 1,000 | | | | 1,082,767 | |
Washington Metropolitan Area Transit Authority
(Washington Metropolitan Area Transit Authority State Lease)
Series 2020-A
5.00%, 07/15/2045 | | | 400 | | | | 426,086 | |
| | | | | | | | |
| | | | | | | 2,461,755 | |
| | | | | | | | |
Florida – 9.6% | | | | | | | | |
Capital Projects Finance Authority/FL
(Navigator Academy of Leadership Inc Obligated Group)
Series 2024
5.00%, 06/15/2034(b) | | | 150 | | | | 154,260 | |
Capital Trust Authority
(Mason Classical Academy, Inc.)
Series 2024
5.00%, 06/01/2054(b) | | | 150 | | | | 151,584 | |
Central Florida Tourism Oversight District
Series 2024-A
5.00%, 06/01/2044 | | | 600 | | | | 658,888 | |
City of Tampa FL
(H Lee Moffitt Cancer Center & Research Institute Obligated Group)
Series 2020
4.00%, 07/01/2038 | | | 375 | | | | 375,976 | |
City of Venice FL
(Southwest Florida Retirement Center, Inc. Obligated Group)
Series 2024
5.625%, 01/01/2060(a)(b) | | | 100 | | | | 103,339 | |
| | |
| |
4 | AB TAX-AWARE INTERMEDIATE MUNICIPAL ETF | | abfunds.com |
PORTFOLIO OF INVESTMENTS (continued)
| | | | | | | | |
| | | Principal
Amount
(000) | | | U.S. $ Value | |
| |
County of Lee FL Airport Revenue
Series 2024
5.25%, 10/01/2044 | | $ | 1,000 | | | $ | 1,094,641 | |
County of Miami-Dade FL
Series 2024
5.00%, 04/01/2046 | | | 1,000 | | | | 1,090,500 | |
County of Miami-Dade FL Aviation Revenue
Series 2024-A
5.00%, 10/01/2034 | | | 1,000 | | | | 1,097,065 | |
County of Palm Beach FL Airport System Revenue
Series 2024-B
5.25%, 10/01/2042 | | | 300 | | | | 331,306 | |
Florida Development Finance Corp.
(Brightline Trains Florida LLC)
AGM Series 2024
5.00%, 07/01/2044 | | | 350 | | | | 366,595 | |
Florida Development Finance Corp.
(GFL Solid Waste Southeast LLC)
Series 2024
4.375%, 10/01/2054(b) | | | 250 | | | | 252,709 | |
Florida Development Finance Corp.
(SFP - Tampa I LLC)
Series 2024
5.00%, 06/01/2044(b) | | | 100 | | | | 101,809 | |
Florida Higher Educational Facilities Financial Authority
(Florida Institute of Technology, Inc.)
Series 2019
5.00%, 10/01/2036 | | | 155 | | | | 159,849 | |
Hillsborough County Aviation Authority
Series 2024
5.25%, 10/01/2044 | | | 300 | | | | 332,238 | |
Lee Memorial Health System
(Lee Health System, Inc. Obligated Group)
Series 2024
5.00%, 04/01/2025 | | | 1,000 | | | | 1,004,705 | |
Mid-Bay Bridge Authority
Series 2015-A | | | | | | | | |
5.00%, 10/01/2035 | | | 300 | | | | 302,703 | |
Palm Beach County Educational Facilities Authority
(Palm Beach Atlantic University Obligated Group)
Series 2024
5.25%, 10/01/2048 | | | 255 | | | | 265,212 | |
Palm Beach County Health Facilities Authority
(Jupiter Medical Center Obligated Group)
Series 2022
5.00%, 11/01/2036 | | | 700 | | | | 753,845 | |
| | |
| |
| abfunds.com | | AB TAX-AWARE INTERMEDIATE MUNICIPAL ETF | 5 |
PORTFOLIO OF INVESTMENTS (continued)
| | | | | | | | |
| | | Principal
Amount
(000) | | | U.S. $ Value | |
| |
Village Community Development District No. 15
(Village Community Development District No 15 Series 2024 Special Assessment)
Series 2024
4.20%, 05/01/2039(b) | | $ | 250 | | | $ | 251,211 | |
| | | | | | | | |
| | | | | | | 8,848,435 | |
| | | | | | | | |
Georgia – 5.7% | | | | | | | | |
City of Atlanta GA Department of Aviation
Series 2022-A
5.00%, 07/01/2047 | | | 810 | | | | 874,956 | |
Fayette County Development Authority
(United States Soccer Federation, Inc.)
Series 2024
5.00%, 10/01/2043 | | | 200 | | | | 215,439 | |
5.25%, 10/01/2049 | | | 250 | | | | 272,109 | |
Main Street Natural Gas, Inc.
(Citigroup, Inc.)
Series 2022-B
5.00%, 12/01/2052 | | | 555 | | | | 588,472 | |
Main Street Natural Gas, Inc.
(Macquarie Group Ltd.)
Series 2019-A
5.00%, 05/15/2043 | | | 1,000 | | | | 1,038,235 | |
Main Street Natural Gas, Inc.
(Royal Bank of Canada)
Series 2024-B
5.00%, 12/01/2054 | | | 1,000 | | | | 1,086,373 | |
Municipal Electric Authority of Georgia
Series 2019
5.00%, 01/01/2063 | | | 700 | | | | 715,380 | |
Savannah Hospital Authority
(St Joseph’s/Candler Health System Obligated Group)
Series 2019
4.00%, 07/01/2039 | | | 500 | | | | 500,870 | |
| | | | | | | | |
| | | | | | | 5,291,834 | |
| | | | | | | | |
Guam – 0.8% | | | | | | | | |
Antonio B Won Pat International Airport Authority
Series 2024-A
5.25%, 10/01/2040 | | | 385 | | | | 416,462 | |
Guam Government Waterworks Authority
(Guam Waterworks Authority Water and Wastewater System)
Series 2024-A
5.00%, 07/01/2039 | | | 270 | | | | 294,883 | |
| | | | | | | | |
| | | | | | | 711,345 | |
| | | | | | | | |
| | |
| |
6 | AB TAX-AWARE INTERMEDIATE MUNICIPAL ETF | | abfunds.com |
PORTFOLIO OF INVESTMENTS (continued)
| | | | | | | | |
| | | Principal
Amount
(000) | | | U.S. $ Value | |
| |
Illinois – 3.5% | | | | | | | | |
Chicago Board of Education
Series 2021-A
5.00%, 12/01/2036 | | $ | 120 | | | $ | 123,281 | |
Series 2023-A
5.00%, 12/01/2034 | | | 100 | | | | 105,159 | |
6.00%, 12/01/2049 | | | 300 | | | | 326,352 | |
Chicago O’Hare International Airport
Series 2024-A
5.00%, 01/01/2036 | | | 500 | | | | 539,653 | |
Series 2024-C
5.25%, 01/01/2042 | | | 250 | | | | 276,636 | |
Illinois Finance Authority
Series 2024
4.125%, 12/01/2043(a)(b) | | | 100 | | | | 101,107 | |
Metropolitan Pier & Exposition Authority
Series 2017
0.00%, 12/15/2042(c) | | | 100 | | | | 74,336 | |
Series 2020
5.00%, 06/15/2050 | | | 1,000 | | | | 1,036,290 | |
NATL Series 2002
Zero Coupon, 06/15/2035 | | | 150 | | | | 101,707 | |
State of Illinois
Series 2020-B
4.00%, 10/01/2033 | | | 100 | | | | 101,479 | |
Series 2023-B
5.50%, 05/01/2047 | | | 250 | | | | 272,544 | |
Series 2024
5.00%, 02/01/2039 | | | 200 | | | | 222,105 | |
| | | | | | | | |
| | | | | | | 3,280,649 | |
| | | | | | | | |
Indiana – 1.0% | | | | | | | | |
City of Valparaiso IN
(Pratt Paper IN LLC)
Series 2024
4.875%, 01/01/2044(b) | | | 100 | | | | 103,092 | |
Indiana Finance Authority
(Parkview Health System Obligated Group)
Series 2024-A
5.00%, 11/01/2054(b) | | | 100 | | | | 107,439 | |
Indiana Finance Authority
(SFP-PUFW I LLC)
Series 2024
4.25%, 07/01/2044 | | | 300 | | | | 287,979 | |
Indianapolis Local Public Improvement Bond Bank
(Pan Am Plaza Hotel)
Series 2023
6.00%, 03/01/2053 | | | 150 | | | | 163,201 | |
| | |
| |
| abfunds.com | | AB TAX-AWARE INTERMEDIATE MUNICIPAL ETF | 7 |
PORTFOLIO OF INVESTMENTS (continued)
| | | | | | | | |
| | | Principal
Amount
(000) | | | U.S. $ Value | |
| |
Series 2023-F
7.75%, 03/01/2067 | | $ | 100 | | | $ | 114,525 | |
BAM Series 2023
5.25%, 03/01/2067 | | | 100 | | | | 108,118 | |
| | | | | | | | |
| | | | | | | 884,354 | |
| | | | | | | | |
Kentucky – 2.0% | | | | | | | | |
Kenton County Airport Board
Series 2024-A
5.25%, 01/01/2044 | | | 350 | | | | 382,151 | |
Kentucky Public Energy Authority
(BP PLC)
Series 2024-B
5.00%, 01/01/2055 | | | 655 | | | | 704,581 | |
Kentucky Public Energy Authority
(Goldman Sachs Group, Inc. (The))
Series 2024-A
5.00%, 05/01/2055 | | | 500 | | | | 531,090 | |
Kentucky Public Energy Authority
(Morgan Stanley)
Series 2023-A
5.25%, 04/01/2054 | | | 200 | | | | 217,229 | |
| | | | | | | | |
| | | | | | | 1,835,051 | |
| | | | | | | | |
Louisiana – 1.6% | | | | | | | | |
Louisiana Public Facilities Authority
(Calcasieu Bridge Partners LLC)
Series 2024
5.50%, 09/01/2054 | | | 100 | | | | 108,636 | |
New Orleans Aviation Board
Series 2024
5.25%, 01/01/2040 | | | 1,000 | | | | 1,100,376 | |
State of Louisiana Gasoline & Fuels Tax Revenue
Series 2024-A
5.00%, 05/01/2039 | | | 200 | | | | 229,412 | |
| | | | | | | | |
| | | | | | | 1,438,424 | |
| | | | | | | | |
Maryland – 3.2% | | | | | | | | |
Maryland Economic Development Corp.
(Purple Line Transit Partners LLC)
Series 2022
5.25%, 06/30/2047 | | | 370 | | | | 390,719 | |
Maryland Stadium Authority
(Baltimore City Public Schools Construction & Revitalization Program)
Series 2018
5.00%, 05/01/2036 | | | 445 | | | | 469,248 | |
| | |
| |
8 | AB TAX-AWARE INTERMEDIATE MUNICIPAL ETF | | abfunds.com |
PORTFOLIO OF INVESTMENTS (continued)
| | | | | | | | |
| | | Principal
Amount
(000) | | | U.S. $ Value | |
| |
State of Maryland
Series 2017-B
5.00%, 08/01/2025 | | $ | 1,000 | | | $ | 1,013,755 | |
State of Maryland Department of Transportation
(Maryland Aviation Administration)
AGC Series 2024
5.25%, 08/01/2043 | | | 1,000 | | | | 1,103,502 | |
| | | | | | | | |
| | | | | | | 2,977,224 | |
| | | | | | | | |
Massachusetts – 0.5% | | | | | | | | |
Massachusetts Development Finance Agency
(Boston Medical Center Corp. Obligated Group)
Series 2015-D
5.00%, 07/01/2044 | | | 500 | | | | 500,273 | |
| | | | | | | | |
| | |
Michigan – 0.3% | | | | | | | | |
City of Detroit MI
Series 2023-C
6.00%, 05/01/2043 | | | 250 | | | | 285,069 | |
| | | | | | | | |
| | |
Minnesota – 1.4% | | | | | | | | |
City of St. Cloud MN
(CentraCare Health System Obligated Group)
Series 2024
5.00%, 05/01/2042 | | | 500 | | | | 554,050 | |
Metropolitan Council
Series 2016-A
5.00%, 03/01/2025 | | | 705 | | | | 708,095 | |
| | | | | | | | |
| | | | | | | 1,262,145 | |
| | | | | | | | |
Nevada – 0.8% | | | | | | | | |
Reno-Tahoe Airport Authority
Series 2024
5.25%, 07/01/2044 | | | 300 | | | | 324,099 | |
State of Nevada Department of Business & Industry
(DesertXpress Enterprises LLC)
Series 2024
8.125%, 01/01/2050 | | | 200 | | | | 206,093 | |
Tahoe-Douglas Visitors Authority
Series 2020
5.00%, 07/01/2035 | | | 235 | | | | 247,040 | |
| | | | | | | | |
| | | | | | | 777,232 | |
| | | | | | | | |
New Hampshire – 1.3% | | | | | | | | |
New Hampshire Business Finance Authority
Series 2024-2, Class A
3.625%, 08/20/2039 | | | 100 | | | | 95,094 | |
| | |
| |
| abfunds.com | | AB TAX-AWARE INTERMEDIATE MUNICIPAL ETF | 9 |
PORTFOLIO OF INVESTMENTS (continued)
| | | | | | | | |
| | | Principal
Amount
(000) | | | U.S. $ Value | |
| |
New Hampshire Business Finance Authority
(Bridgeland Water & Utility Districts 490, 491 & 158)
Series 2024
5.375%, 12/15/2035(b) | | $ | 100 | | | $ | 100,551 | |
New Hampshire Business Finance Authority
(University of Nevada Reno)
BAM Series 2023
4.50%, 06/01/2053 | | | 960 | | | | 979,503 | |
| | | | | | | | |
| | | | | | | 1,175,148 | |
| | | | | | | | |
New Jersey – 4.5% | | | | | | | | |
New Jersey Transportation Trust Fund Authority
(New Jersey Transportation Trust Fund Authority State Lease)
AGM Series 2006-C
Zero Coupon, 12/15/2033 | | | 100 | | | | 73,602 | |
New Jersey Transportation Trust Fund Authority
(State of New Jersey Lease)
Series 2023-B
5.25%, 06/15/2050 | | | 775 | | | | 855,212 | |
New Jersey Transportation Trust Fund Authority
(State of New Jersey)
Series 2024-A
4.00%, 06/15/2042 | | | 1,200 | | | | 1,206,902 | |
New Jersey Turnpike Authority
(Pre-refunded – US Treasuries)
Series 2015-E
5.00%, 01/01/2034 (Pre-refunded/ETM) | | | 1,500 | | | | 1,502,107 | |
Tobacco Settlement Financing Corp./NJ
Series 2018-B
5.00%, 06/01/2046 | | | 500 | | | | 502,344 | |
| | | | | | | | |
| | | | | | | 4,140,167 | |
| | | | | | | | |
New York – 13.4% | | | | | | | | |
Build NYC Resource Corp.
(Kipp NYC Public Charter Schools)
Series 2023
5.00%, 07/01/2032 | | | 550 | | | | 599,257 | |
Empire State Development Corp.
(State of New York Sales Tax Revenue)
Series 2024-A
5.00%, 03/15/2047 | | | 1,000 | | | | 1,104,718 | |
Federal Home Loan Mortgage Corp.
Freddie Mac Multifamily ML Certificates
Series 2024-ML21, Class AUS
4.616%, 08/25/2041 | | | 100 | | | | 102,474 | |
| | |
| |
10 | AB TAX-AWARE INTERMEDIATE MUNICIPAL ETF | | abfunds.com |
PORTFOLIO OF INVESTMENTS (continued)
| | | | | | | | |
| | | Principal
Amount
(000) | | | U.S. $ Value | |
| |
Long Island Power Authority
Series 2024-A
5.00%, 09/01/2049 | | $ | 1,000 | | | $ | 1,097,968 | |
Metropolitan Transportation Authority
Series 2017
Zero Coupon, 11/15/2033 | | | 425 | | | | 304,539 | |
Series 2020-C
4.75%, 11/15/2045 | | | 400 | | | | 413,684 | |
Series 2024-B
5.00%, 11/15/2039 | | | 300 | | | | 336,608 | |
Monroe County Industrial Development Corp./NY
(Eugenio Maria de Hostos Charter School)
Series 2024
5.00%, 07/01/2044(b) | | | 150 | | | | 155,538 | |
New York City Municipal Water Finance Authority
Series 2021-B
4.00%, 06/15/2045 | | | 1,000 | | | | 1,005,369 | |
New York City Transitional Finance Authority
(New York City Transitional Finance Authority Future Tax Secured Revenue)
Series 2024
5.00%, 11/01/2037 | | | 1,000 | | | | 1,155,102 | |
New York City Transitional Finance Authority Future Tax Secured Revenue
Series 2015-C
5.00%, 11/01/2025 | | | 1,250 | | | | 1,260,042 | |
New York State Dormitory Authority
(Pre-refunded – Others)
Series 2012-C
4.25%, 05/01/2039 (Pre-refunded/ETM) | | | 955 | | | | 955,710 | |
New York Transportation Development Corp.
(Delta Air Lines, Inc.)
Series 2023
5.625%, 04/01/2040 | | | 500 | | | | 540,930 | |
New York Transportation Development Corp.
(JFK International Air Terminal LLC)
Series 2022
5.00%, 12/01/2041 | | | 1,000 | | | | 1,052,842 | |
New York Transportation Development Corp.
(JFK Millennium Partners LLC)
Series 2024
5.50%, 12/31/2054 | | | 500 | | | | 541,836 | |
New York Transportation Development Corp.
(JFK NTO LLC)
Series 2023
6.00%, 06/30/2054 | | | 120 | | | | 130,931 | |
| | |
| |
| abfunds.com | | AB TAX-AWARE INTERMEDIATE MUNICIPAL ETF | 11 |
PORTFOLIO OF INVESTMENTS (continued)
| | | | | | | | |
| | | Principal
Amount
(000) | | | U.S. $ Value | |
| |
New York Transportation Development Corp.
(Laguardia Gateway Partners LLC)
Series 2016-A
5.00%, 07/01/2046 | | $ | 250 | | | $ | 250,003 | |
5.25%, 01/01/2050 | | | 100 | | | | 100,007 | |
Port Authority of New York & New Jersey
Series 2020-2
4.00%, 07/15/2037 | | | 900 | | | | 906,353 | |
Suffolk Regional Off-Track Betting Co.
Series 2024
5.75%, 12/01/2044 | | | 100 | | | | 104,451 | |
Triborough Bridge & Tunnel Authority Sales Tax Revenue
Series 2024-A
5.00%, 05/15/2054 | | | 250 | | | | 271,978 | |
| | | | | | | | |
| | | | | | | 12,390,340 | |
| | | | | | | | |
Ohio – 0.8% | | | | | | | | |
Buckeye Tobacco Settlement Financing Authority
Series 2020-B
5.00%, 06/01/2055 | | | 100 | | | | 91,558 | |
Jefferson County Port Authority/OH
(JSW Steel USA Ohio, Inc.)
Series 2021
3.50%, 12/01/2051(b) | | | 100 | | | | 80,484 | |
Lancaster Port Authority
(Royal Bank of Canada)
Series 2024-A
5.00%, 02/01/2055 | | | 100 | | | | 107,208 | |
Ohio Higher Educational Facility Commission
(Xavier University)
Series 2024
5.00%, 05/01/2042 | | | 400 | | | | 431,168 | |
| | | | | | | | |
| | | | | | | 710,418 | |
| | | | | | | | |
Oregon – 0.5% | | | | | | | | |
Port of Portland OR Airport Revenue
Series 2022-2
4.00%, 07/01/2047 | | | 500 | | | | 488,828 | |
| | | | | | | | |
| | |
Pennsylvania – 4.3% | | | | | | | | |
Bucks County Industrial Development Authority
(Grand View Hospital/Sellersville PA Obligated Group)
Series 2021
4.00%, 07/01/2046 | | | 100 | | | | 90,790 | |
5.00%, 07/01/2030 | | | 100 | | | | 106,378 | |
| | |
| |
12 | AB TAX-AWARE INTERMEDIATE MUNICIPAL ETF | | abfunds.com |
PORTFOLIO OF INVESTMENTS (continued)
| | | | | | | | |
| | | Principal
Amount
(000) | | | U.S. $ Value | |
| |
Commonwealth of Pennsylvania
Series 2023
5.00%, 09/01/2025 | | $ | 1,000 | | | $ | 1,015,619 | |
Series 2024
4.00%, 08/15/2043 | | | 200 | | | | 202,139 | |
Pennsylvania Economic Development Financing Authority
(Commonwealth of Pennsylvania Department of Transportation)
Series 2022
5.50%, 06/30/2039 | | | 300 | | | | 329,732 | |
Pittsburgh Water & Sewer Authority
AGM Series 2019-A
5.00%, 09/01/2044 | | | 1,000 | | | | 1,059,198 | |
Pocono Mountains Industrial Park Authority
(St Luke’s Hospital Obligated Group)
Series 2015
5.00%, 08/15/2040 | | | 1,140 | | | | 1,142,218 | |
| | | | | | | | |
| | | | | | | 3,946,074 | |
| | | | | | | | |
Puerto Rico – 0.3% | | | | | | | | |
Commonwealth of Puerto Rico
Series 2022-C
Zero Coupon, 11/01/2043 | | | 166 | | | | 102,329 | |
Puerto Rico Industrial Tourist Educational Medical & Environmental Control Facilities Financing Auth
(San Juan Cruise Port LLC)
Series 2024
6.75%, 01/01/2046 | | | 100 | | | | 120,590 | |
Puerto Rico Sales Tax Financing Corp. Sales Tax Revenue
Series 2019-A
5.00%, 07/01/2058 | | | 100 | | | | 100,399 | |
| | | | | | | | |
| | | | | | | 323,318 | |
| | | | | | | | |
South Carolina – 3.4% | | | | | | | | |
South Carolina Jobs-Economic Development Authority
(Beaufort Memorial Hospital Obligated Group)
Series 2024
5.50%, 11/15/2044 | | | 395 | | | | 424,987 | |
South Carolina Jobs-Economic Development Authority
(Bon Secours Mercy Health, Inc.)
Series 2020
5.00%, 12/01/2046 | | | 1,000 | | | | 1,056,614 | |
| | |
| |
| abfunds.com | | AB TAX-AWARE INTERMEDIATE MUNICIPAL ETF | 13 |
PORTFOLIO OF INVESTMENTS (continued)
| | | | | | | | |
| | | Principal
Amount
(000) | | | U.S. $ Value | |
| |
South Carolina Jobs-Economic Development Authority
(Novant Health Obligated Group)
Series 2024
5.25%, 11/01/2044 | | $ | 595 | | | $ | 666,559 | |
South Carolina Public Service Authority
Series 2021-A
4.00%, 12/01/2035 | | | 1,000 | | | | 1,018,452 | |
| | | | | | | | |
| | | | | | | 3,166,612 | |
| | | | | | | | |
Tennessee – 1.8% | | | | | | | | |
Bristol Industrial Development Board
(Bristol Industrial Development Board Sales Tax)
Series 2016-B
Zero Coupon, 12/01/2031(b) | | | 100 | | | | 69,348 | |
Metropolitan Government of Nashville & Davidson County TN
Series 2024-C
4.00%, 01/01/2044 | | | 1,500 | | | | 1,516,794 | |
Shelby County Health & Educational Facilities Board
(Madrone Memphis Student Housing I LLC)
Series 2024
5.25%, 06/01/2056(b) | | | 100 | | | | 102,472 | |
| | | | | | | | |
| | | | | | | 1,688,614 | |
| | | | | | | | |
Texas – 3.5% | | | | | | | | |
Central Texas Turnpike System
Series 2024-C
5.00%, 08/15/2038 | | | 100 | | | | 112,121 | |
City of Georgetown TX Utility System Revenue
BAM Series 2024
5.00%, 08/15/2044 | | | 1,535 | | | | 1,674,963 | |
City of Houston TX Airport System Revenue
AGM Series 2023
5.00%, 07/01/2038 | | | 500 | | | | 540,179 | |
City of Houston TX Airport System Revenue
(United Airlines, Inc.)
Series 2024-B
5.50%, 07/15/2038(a) | | | 200 | | | | 216,306 | |
Hidalgo County Regional Mobility Authority
Series 2022-B
5.00%, 12/01/2036 | | | 300 | | | | 312,716 | |
Port of Beaumont Navigation District
(Jefferson 2020 Bond Lessee & Borrower LLC Obligated Group)
Series 2024
5.125%, 01/01/2044(b) | | | 100 | | | | 103,743 | |
| | |
| |
14 | AB TAX-AWARE INTERMEDIATE MUNICIPAL ETF | | abfunds.com |
PORTFOLIO OF INVESTMENTS (continued)
| | | | | | | | |
| | | Principal
Amount
(000) | | | U.S. $ Value | |
| |
Texas Municipal Gas Acquisition & Supply Corp. IV
(BP PLC)
Series 2023-B
5.50%, 01/01/2054 | | $ | 200 | | | $ | 225,133 | |
Texas Private Activity Bond Surface Transportation Corp.
(NTE Mobility Partners Segments 3 LLC)
Series 2019
5.00%, 06/30/2058 | | | 100 | | | | 102,297 | |
| | | | | | | | |
| | | | | | | 3,287,458 | |
| | | | | | | | |
Utah – 0.6% | | | | | | | | |
Utah Infrastructure Agency
Series 2024
5.50%, 10/15/2044 | | | 500 | | | | 546,008 | |
| | | | | | | | |
| | |
Virginia – 2.3% | | | | | | | | |
Fairfax County Industrial Development Authority
(Inova Health System Obligated Group)
Series 2022
4.00%, 05/15/2042 | | | 1,000 | | | | 1,010,830 | |
Virginia Beach Development Authority
(Westminster-Canterbury on Chesapeake Bay Obligated Group)
Series 2023
7.00%, 09/01/2059 | | | 100 | | | | 114,060 | |
Virginia Small Business Financing Authority
(LifeSpire of Virginia Obligated Group)
Series 2024-A
4.50%, 12/01/2044 | | | 1,000 | | | | 1,001,907 | |
| | | | | | | | |
| | | | | | | 2,126,797 | |
| | | | | | | | |
Washington – 2.4% | | | | | | | | |
City of Federal Way WA
Series 2024
5.00%, 12/01/2049 | | | 1,000 | | | | 1,087,040 | |
King & Snohomish Counties School District No. 417 Northshore
Series 2024
5.00%, 12/01/2040 | | | 100 | | | | 113,460 | |
State of Washington
Series 2020
5.00%, 07/01/2025 | | | 750 | | | | 758,925 | |
Washington State Housing Finance Commission
Series 2024-2
4.221%, 03/20/2040 | | | 300 | | | | 293,450 | |
| | | | | | | | |
| | | | | | | 2,252,875 | |
| | | | | | | | |
| | |
| |
| abfunds.com | | AB TAX-AWARE INTERMEDIATE MUNICIPAL ETF | 15 |
PORTFOLIO OF INVESTMENTS (continued)
| | | | | | | | |
| | | Principal
Amount
(000) | | | U.S. $ Value | |
| |
Wisconsin – 0.9% | | | | | | | | |
Wisconsin Health & Educational Facilities Authority
(Forensic Science & Protective Medicine Collaboration, Inc.)
Series 2024
5.00%, 08/01/2027(b) | | $ | 150 | | | $ | 153,215 | |
Wisconsin Public Finance Authority
(Alpha Ranch Water Control & Improvement District of Denton & Wise Counties)
Series 2024
Zero Coupon, 12/15/2038(a)(b) | | | 100 | | | | 43,506 | |
Wisconsin Public Finance Authority
(Puerto Rico Tollroads LLC)
Series 2024
5.50%, 07/01/2044 | | | 500 | | | | 534,451 | |
Wisconsin Public Finance Authority
(Southeast Overtown Park West Community Redevelopment Agency)
Series 2024
5.00%, 06/01/2041(b) | | | 100 | | | | 103,375 | |
| | | | | | | | |
| | | | | | | 834,547 | |
| | | | | | | | |
Total Long-Term Municipal Bonds
(cost $81,058,891) | | | | | | | 81,943,611 | |
| | | | | |
| | | | | | | | |
Short-Term Municipal Notes – 9.6% | | | | | | | | |
Arizona – 0.4% | | | | | | | | |
Arizona Health Facilities Authority
(Banner Health Obligated Group)
Series 2017-C
3.25%, 01/01/2046(d) | | | 335 | | | | 335,000 | |
| | | | | | | | |
| | |
Colorado – 1.6% | | | | | | | | |
Colorado Educational & Cultural Facilities Authority
(Jewish Federation of South Palm Beach County, Inc.)
Series 2008
3.25%, 02/01/2038(d) | | | 1,160 | | | | 1,160,000 | |
Colorado Educational & Cultural Facilities Authority
(Michael Ann Russell Jewish Community Center, Inc.)
Series 2012
3.25%, 01/01/2039(d) | | | 350 | | | | 350,000 | |
| | | | | | | | |
| | | | | | | 1,510,000 | |
| | | | | | | | |
| | |
| |
16 | AB TAX-AWARE INTERMEDIATE MUNICIPAL ETF | | abfunds.com |
PORTFOLIO OF INVESTMENTS (continued)
| | | | | | | | |
| | | Principal
Amount
(000) | | | U.S. $ Value | |
| |
District of Columbia – 0.7% | | | | | | | | |
District of Columbia
(MedStar Health Obligated Group)
Series 2017-A
3.25%, 08/15/2038(d) | | $ | 600 | | | $ | 600,000 | |
| | | | | | | | |
| | |
Florida – 0.3% | | | | | | | | |
Hillsborough County Industrial Development Authority
(BayCare Obligated Group)
Series 2020
3.20%, 11/15/2042(d) | | | 275 | | | | 275,000 | |
| | | | | | | | |
| | |
Massachusetts – 0.6% | | | | | | | | |
Massachusetts Development Finance Agency
(Trustees of Boston University)
Series 2013-U
3.15%, 10/01/2042(d) | | | 325 | | | | 325,000 | |
Series 2018-U
3.10%, 10/01/2042(d) | | | 200 | | | | 200,000 | |
| | | | | | | | |
| | | | | | | 525,000 | |
| | | | | | | | |
Michigan – 0.4% | | | | | | | | |
Green Lake Township Economic Development Corp.
(Interlochen Center for the Arts)
Series 2023
3.25%, 06/01/2034(d) | | | 400 | | | | 400,000 | |
| | | | | | | | |
| | |
New York – 2.4% | | | | | | | | |
City of New York NY
Series 2008-L
2.70%, 04/01/2038(d) | | | 1,230 | | | | 1,230,000 | |
Metropolitan Transportation Authority Dedicated Tax Fund
Series 2017-A
3.15%, 11/01/2031(d) | | | 570 | | | | 570,000 | |
Triborough Bridge & Tunnel Authority
Series 2022-B
2.70%, 01/01/2033(d) | | | 400 | | | | 400,000 | |
| | | | | | | | |
| | | | | | | 2,200,000 | |
| | | | | | | | |
North Carolina – 0.6% | | | | | | | | |
Charlotte-Mecklenburg Hospital Authority (The)
(Atrium Health Obligated Group)
AGM Series 2017-E
3.15%, 01/15/2044(d) | | | 570 | | | | 570,000 | |
| | | | | | | | |
| | |
| |
| abfunds.com | | AB TAX-AWARE INTERMEDIATE MUNICIPAL ETF | 17 |
PORTFOLIO OF INVESTMENTS (continued)
| | | | | | | | |
| | | Principal
Amount
(000) | | | U.S. $ Value | |
| |
Ohio – 1.1% | | | | | | | | |
County of Montgomery OH
(Premier Health Partners Obligated Group)
Series 2019
3.15%, 11/15/2045(d) | | $ | 280 | | | $ | 280,000 | |
State of Ohio
(University Hospitals Health System, Inc. Obligated Group)
Series 2018
3.10%, 01/15/2046(d) | | | 700 | | | | 700,000 | |
| | | | | | | | |
| | | | | | | 980,000 | |
| | | | | | | | |
Pennsylvania – 0.5% | | | | | | | | |
Delaware Valley Regional Finance Authority
Series 2024-B
3.15%, 09/01/2059(d) | | | 500 | | | | 500,000 | |
| | | | | | | | |
| | |
Vermont – 0.5% | | | | | | | | |
Vermont Educational & Health Buildings Financing Agency
(Landmark College, Inc.)
Series 2009
3.21%, 07/01/2039(d) | | | 500 | | | | 500,000 | |
| | | | | | | | |
| | |
Wisconsin – 0.5% | | | | | | | | |
Wisconsin Health & Educational Facilities Authority
(Medical College of Wisconsin, Inc.)
Series 2023-B
3.15%, 12/01/2033(d) | | | 500 | | | | 500,000 | |
| | | | | | | | |
| | |
Total Short-Term Municipal Notes
(cost $8,895,000) | | | | | | | 8,895,000 | |
| | | | | |
Total Municipal Obligations
(cost $89,953,891) | | | | | | | 90,838,611 | |
| | | | | |
| | | | | | | | |
SHORT-TERM INVESTMENTS – 1.8% | | | | | | | | |
U.S. Treasury Bills – 1.6% | | | | | | | | |
United States – 1.6% | | | | | | | | |
U.S. Treasury Bill
Zero Coupon, 01/30/2025
(cost $1,488,937) | | | 1,500 | | | | 1,489,048 | |
| | | | | | | | |
| | |
| |
18 | AB TAX-AWARE INTERMEDIATE MUNICIPAL ETF | | abfunds.com |
PORTFOLIO OF INVESTMENTS (continued)
| | | | | | | | |
| | | Shares | | | U.S. $ Value | |
| |
Investment Companies – 0.2% | |
AB Fixed Income Shares, Inc. – Government Money Market Portfolio – Class AB, 4.54%(e)(f)(g)
(cost $136,670) | | | 136,670 | | | $ | 136,670 | |
| | | | | | | | |
| | |
Total Short-Term Investments
(cost $1,625,607) | | | | | | | 1,625,718 | |
| | | | | |
| | |
Total Investments – 100.0%
(cost $91,579,498) | | | | | | | 92,464,329 | |
Other assets less liabilities – 0.0% | | | | | | | 11,693 | |
| | | | | |
| | |
Net Assets – 100.0% | | | | | | $ | 92,476,022 | |
| | | | | | | | |
CENTRALLY CLEARED CREDIT DEFAULT SWAPS (see Note D)
| | | | | | | | | | | | | | | | | | | | | | | | | | | | | | | | |
| Description | | Fixed
Rate
(Pay)
Receive | | | Payment
Frequency | | | Implied
Credit
Spread at
November 30,
2024 | | | Notional
Amount
(000) | | | Market
Value | | | Upfront
Premiums
Paid
(Received) | | | Unrealized
Appreciation
(Depreciation) | |
Sale Contracts | |
CDX-NAHY Series 43, 5 Year Index, 12/20/2029* | | | 5.00 | % | | | Quarterly | | | | 2.95 | % | | | USD | | | | 700 | | | $ | 66,892 | | | $ | 48,150 | | | $ | 18,742 | |
CENTRALLY CLEARED INFLATION (CPI) SWAPS (see Note D)
| | | | | | | | | | | | | | | | | | | | | | | | | | |
| | | | Rate Type | | | |
Notional
Amount
(000) | | | Termination
Date | | | Payments
made
by the
Fund | | Payments
received
by the
Fund | | Payment
Frequency
Paid/
Received | | Market
Value | | | Upfront
Premiums
Paid
(Received) | | | Unrealized
Appreciation
(Depreciation) | |
| USD | | | 2,290 | | | | 10/15/2028 | | | CPI# | | 2.565% | | Maturity | | $ | 10,289 | | | $ | – 0 | – | | $ | 10,289 | |
| USD | | | 1,568 | | | | 10/15/2029 | | | 2.516% | | CPI# | | Maturity | | | (5,486 | ) | | | – 0 | – | | | (5,486 | ) |
| USD | | | 1,566 | | | | 10/15/2029 | | | 2.451% | | CPI# | | Maturity | | | (812 | ) | | | – 0 | – | | | (812 | ) |
| USD | | | 1,566 | | | | 10/15/2029 | | | 2.499% | | CPI# | | Maturity | | | (4,252 | ) | | | – 0 | – | | | (4,252 | ) |
| USD | | | 2,410 | | | | 10/15/2030 | | | CPI# | | 2.531% | | Maturity | | | 12,806 | | | | – 0 | – | | | 12,806 | |
| | | | | | | | | | | | | | | | | | | | | | | | | | |
| | $ | 12,545 | | | $ | – 0 | – | | $ | 12,545 | |
| | | | | | | | | | | | |
| # | Variable interest rate based on the rate of inflation as determined by the Consumer Price Index (CPI). |
| | |
| |
| abfunds.com | | AB TAX-AWARE INTERMEDIATE MUNICIPAL ETF | 19 |
PORTFOLIO OF INVESTMENTS (continued)
CENTRALLY CLEARED INTEREST RATE SWAPS (see Note D)
| | | | | | | | | | | | | | | | | | | | | | | | | | |
| | | | Rate Type | | | |
Notional
Amount
(000) | | | Termination
Date | | | Payments
made
by the
Fund | | Payments
received
by the
Fund | | Payment
Frequency
Paid/
Received | | Market
Value | | | Upfront
Premiums
Paid
(Received) | | | Unrealized
Appreciation
(Depreciation) | |
| USD | | | 880 | | | | 10/15/2029 | | | 1 Day
SOFR | | 3.800% | | Annual | | $ | 1,798 | | | $ | – 0 | – | | $ | 1,798 | |
| USD | | | 800 | | | | 10/15/2029 | | | 1 Day
SOFR | | 3.785% | | Annual | | | 1,042 | | | | – 0 | – | | | 1,042 | |
| USD | | | 650 | | | | 12/13/2030 | | | 1 Day
SOFR | | 4.273% | | Annual | | | 15,865 | | | | – 0 | – | | | 15,865 | |
| USD | | | 400 | | | | 12/13/2030 | | | 1 Day
SOFR | | 4.299% | | Annual | | | 10,364 | | | | – 0 | – | | | 10,364 | |
| USD | | | 1,480 | | | | 08/15/2031 | | | 1 Day
SOFR | | 3.325% | | Annual | | | (40,688 | ) | | | – 0 | – | | | (40,688 | ) |
| USD | | | 2,270 | | | | 09/15/2031 | | | 1 Day
SOFR | | 3.525% | | Annual | | | (27,699 | ) | | | – 0 | – | | | (27,699 | ) |
| USD | | | 1,050 | | | | 09/15/2031 | | | 1 Day
SOFR | | 3.786% | | Annual | | | 4,568 | | | | – 0 | – | | | 4,568 | |
| USD | | | 580 | | | | 09/15/2031 | | | 1 Day
SOFR | | 3.514% | | Annual | | | (7,443 | ) | | | – 0 | – | | | (7,443 | ) |
| USD | | | 1,700 | | | | 12/03/2031 | | | 1 Day
SOFR | | 3.732% | | Annual | | | 3,374 | | | | – 0 | – | | | 3,374 | |
| USD | | | 1,950 | | | | 12/15/2031 | | | 1 Day
SOFR | | 4.150% | | Annual | | | 43,164 | | | | – 0 | – | | | 43,164 | |
| USD | | | 500 | | | | 12/15/2031 | | | 1 Day
SOFR | | 3.789% | | Annual | | | 578 | | | | 31 | | | | 547 | |
| USD | | | 960 | | | | 08/15/2034 | | | 3.747% | | 1 Day
SOFR | | Annual | | | (3,066 | ) | | | (140 | ) | | | (2,926 | ) |
| USD | | | 900 | | | | 08/15/2034 | | | 3.719% | | 1 Day
SOFR | | Annual | | | (777 | ) | | | (427 | ) | | | (350 | ) |
| USD | | | 700 | | | | 08/15/2034 | | | 3.314% | | 1 Day
SOFR | | Annual | | | 23,515 | | | | – 0 | – | | | 23,515 | |
| USD | | | 684 | | | | 08/15/2034 | | | 3.844% | | 1 Day
SOFR | | Annual | | | (7,900 | ) | | | – 0 | – | | | (7,900 | ) |
| USD | | | 670 | | | | 08/15/2034 | | | 3.907% | | 1 Day
SOFR | | Annual | | | (11,109 | ) | | | – 0 | – | | | (11,109 | ) |
| USD | | | 400 | | | | 08/15/2034 | | | 3.231% | | 1 Day
SOFR | | Annual | | | 16,673 | | | | – 0 | – | | | 16,673 | |
| USD | | | 266 | | | | 08/15/2034 | | | 3.856% | | 1 Day
SOFR | | Annual | | | (3,333 | ) | | | – 0 | – | | | (3,333 | ) |
| USD | | | 200 | | | | 08/15/2034 | | | 3.304% | | 1 Day
SOFR | | Annual | | | 7,429 | | | | – 0 | – | | | 7,429 | |
| USD | | | 540 | | | | 09/15/2044 | | | 1 Day
SOFR | | 3.454% | | Annual | | | (22,574 | ) | | | – 0 | – | | | (22,574 | ) |
| | | | | | | | | | | | | | | | | | | | | | | | | | |
| | $ | 3,781 | | | $ | (536 | ) | | $ | 4,317 | |
| | | | | | | | | | | | |
| (a) | When-Issued or delayed delivery security. |
| (b) | Security is exempt from registration under Rule 144A or Regulation S of the Securities Act of 1933. These securities are considered restricted, but liquid and may be resold in transactions exempt from registration. At November 30, 2024, the aggregate market value of these securities amounted to $2,803,985 or 3.0% of net assets. |
| | |
| |
20 | AB TAX-AWARE INTERMEDIATE MUNICIPAL ETF | | abfunds.com |
PORTFOLIO OF INVESTMENTS (continued)
| (c) | Coupon rate adjusts periodically based upon a predetermined schedule. Stated interest rate in effect at November 30, 2024. |
| (d) | Variable Rate Demand Notes are instruments whose interest rates change on a specific date (such as coupon date or interest payment date) or whose interest rates vary with changes in a designated base rate (such as the prime interest rate). This instrument is payable on demand and is secured by letters of credit or other credit support agreements from major banks. |
| (e) | Affiliated investments. |
| (f) | The rate shown represents the 7-day yield as of period end. |
| (g) | To obtain a copy of the fund’s shareholder report, please go to the Securities and Exchange Commission’s website at www.sec.gov, or call AB at (800) 227-4618. |
As of November 30, 2024, the Fund’s percentages of investments in municipal bonds that are insured and in insured municipal bonds that have been pre-refunded or escrowed to maturity are 7.2% and 0.0%, respectively.
Glossary:
AGC – Assured Guaranty Corporation
AGM – Assured Guaranty Municipal
BAM – Build American Mutual
ETM – Escrowed to Maturity
NATL – National Interstate Corporation
SOFR – Secured Overnight Financing Rate
See notes to financial statements.
| | |
| |
| abfunds.com | | AB TAX-AWARE INTERMEDIATE MUNICIPAL ETF | 21 |
STATEMENT OF ASSETS & LIABILITIES
November 30, 2024
| | | | |
| Assets | |
Investments in securities, at value | |
Unaffiliated issuers (cost $91,442,828) | | $ | 92,327,659 | |
Affiliated issuers (cost $136,670) | | | 136,670 | |
Cash | | | 1,013,504 | |
Cash collateral due from broker | | | 238,316 | |
Interest receivable | | | 1,022,797 | |
Receivable for variation margin on centrally cleared swaps | | | 21,596 | |
Affiliated dividends receivable | | | 7,981 | |
Receivable due from Adviser | | | 377 | |
| | | | |
Total assets | | | 94,768,900 | |
| | | | |
| Liabilities | |
Payable for investment securities purchased | | | 2,274,128 | |
Advisory fee payable | | | 18,750 | |
| | | | |
Total liabilities | | | 2,292,878 | |
| | | | |
Net Assets | | $ | 92,476,022 | |
| | | | |
| Composition of Net Assets | |
Capital stock, at par | | $ | 360 | |
Additional paid-in capital | | | 91,326,246 | |
Distributable earnings | | | 1,149,416 | |
| | | | |
| Net Assets | | $ | 92,476,022 | |
| | | | |
Net Asset Value Per Share—500 million shares of capital stock authorized, $.0001 par value (based on 3,600,040 common shares outstanding) | | $ | 25.69 | |
| | | | |
See notes to financial statements.
| | |
| |
22 | AB TAX-AWARE INTERMEDIATE MUNICIPAL ETF | | abfunds.com |
STATEMENT OF OPERATIONS
For the Period from December 13, 2023(a) to November 30, 2024
| | | | | | | | |
| Investment Income | |
Interest | | $ | 1,417,807 | | | | | |
Dividends—Affiliated issuers | | | 25,592 | | | $ | 1,443,399 | |
| | | | | | | | |
| Expenses | |
Advisory fee (see Note B) | | | 100,617 | | | | | |
| | | | | | | | |
Total expenses | | | 100,617 | | | | | |
Less: expenses waived and reimbursed by the Adviser (see Note B) | | | (1,007 | ) | | | | |
| | | | | | | | |
Net expenses | | | | | | | 99,610 | |
| | | | | |
Net investment income | | | | | | | 1,343,789 | |
| | | | | |
| Realized and Unrealized Gain (Loss) on Investment Transactions | | | | | | | | |
Net realized gain (loss) on: | | | | | | | | |
Investment transactions | | | | | | | 19,788 | |
Swaps | | | | | | | (105,501 | ) |
Net change in unrealized appreciation (depreciation) of: | | | | | | | | |
Investments | | | | | | | 884,831 | |
Swaps | | | | | | | 35,604 | |
| | | | | |
Net gain on investment transactions | | | | | | | 834,722 | |
| | | | | |
Net Increase in Net Assets from Operations | | | | | | $ | 2,178,511 | |
| | | | | |
| (a) | Commencement of operations. |
See notes to financial statements.
| | |
| |
| abfunds.com | | AB TAX-AWARE INTERMEDIATE MUNICIPAL ETF | 23 |
STATEMENT OF CHANGES IN NET ASSETS
| | | | |
| | | December 13,
2023(a) to
November 30,
2024 | |
| Increase (Decrease) in Net Assets from Operations | |
Net investment income | | $ | 1,343,789 | |
Net realized loss on investment transactions | | | (85,713 | ) |
Net change in unrealized appreciation (depreciation) of investments | | | 920,435 | |
| | | | |
Net increase in net assets from operations | | | 2,178,511 | |
Distribution to Shareholders | | | (1,029,095 | ) |
| Transactions in Shares of the Fund | |
Net increase | | | 91,257,835 | |
Other capital | | | 68,771 | |
| | | | |
Total increase | | | 92,476,022 | |
| Net Assets | |
Beginning of period | | | – 0 | – |
| | | | |
End of period | | $ | 92,476,022 | |
| | | | |
| (a) | Commencement of operations. |
See notes to financial statements.
| | |
| |
24 | AB TAX-AWARE INTERMEDIATE MUNICIPAL ETF | | abfunds.com |
NOTES TO FINANCIAL STATEMENTS
November 30, 2024
NOTE A
Significant Accounting Policies
AB Active ETFs, Inc. (the “Corporation”) is registered under the Investment Company Act of 1940 (the “1940 Act”) as an open-end management investment company. The Corporation, which is a Maryland corporation, operates as a series company comprised of 15 funds currently in operation. Each fund is considered to be a separate entity for financial reporting and tax purposes. This report relates only to the AB Tax-Aware Intermediate Municipal ETF (the “Fund”), a diversified portfolio. The Fund commenced investment operations on December 13, 2023. The financial statements have been prepared in conformity with U.S. generally accepted accounting principles (“U.S. GAAP”), which require management to make certain estimates and assumptions that affect the reported amounts of assets and liabilities in the financial statements and amounts of income and expenses during the reporting period. Actual results could differ from those estimates. The Fund is an investment company under U.S. GAAP and follows the accounting and reporting guidance applicable to investment companies. The following is a summary of significant accounting policies followed by the Fund.
1. Security Valuation
Portfolio securities are valued at market value determined on the basis of market quotations or, if market quotations are not readily available or are unreliable, at “fair value” as determined in accordance with procedures approved by and under the oversight of the Fund’s Board of Directors (the “Board”). Pursuant to these procedures, AllianceBernstein L.P. (the “Adviser”) serves as the Fund’s valuation designee pursuant to Rule 2a-5 of the 1940 Act. In this capacity, the Adviser is responsible, among other things, for making all fair value determinations relating to the Fund’s portfolio investments, subject to the Board’s oversight.
In general, the market values of securities which are readily available and deemed reliable are determined as follows: securities listed on a national securities exchange (other than securities listed on the NASDAQ Stock Market, Inc. (“NASDAQ”)) or on a foreign securities exchange are valued at the last sale price at the close of the exchange or foreign securities exchange. If there has been no sale on such day, the securities are valued at the last traded price from the previous day. Securities listed on more than one exchange are valued by reference to the principal exchange on which the securities are traded; securities listed only on NASDAQ are valued in accordance with the NASDAQ Official Closing Price; listed or over the counter (“OTC”) market put or call options are valued at the mid level between the current bid and ask prices. If either a current bid or current ask price is unavailable, the Adviser will have discretion to determine the
| | |
| |
| abfunds.com | | AB TAX-AWARE INTERMEDIATE MUNICIPAL ETF | 25 |
NOTES TO FINANCIAL STATEMENTS (continued)
best valuation (e.g., last trade price in the case of listed options); open futures are valued using the closing settlement price or, in the absence of such a price, the most recent quoted bid price. If there are no quotations available for the day of valuation, the last available closing settlement price is used; U.S. Government securities and any other debt instruments having 60 days or less remaining until maturity are generally valued at fair value by an independent pricing service. If an independent fair value is not available, the securities are valued at amortized cost. This methodology is commonly used for short term securities that have an original maturity of 60 days or less, as well as short term securities that had an original term to maturity that exceeded 60 days. In instances when amortized cost is utilized, the Valuation Committee (the “Committee”) must reasonably conclude that the utilization of amortized cost is approximately the same as the fair value of the security. Factors the Committee will consider include, but are not limited to, an impairment of the creditworthiness of the issuer or material changes in interest rates. Fixed-income securities, including mortgage-backed and asset-backed securities, may be valued on the basis of prices provided by a pricing service or at a price obtained from one or more of the major broker-dealers. In cases where broker-dealer quotes are obtained, the Adviser may establish procedures whereby changes in market yields or spreads are used to adjust, on a daily basis, a recently obtained quoted price on a security. Swaps and other derivatives are valued daily, primarily using independent pricing services, independent pricing models using market inputs, as well as third party broker-dealers or counterparties. Open-end mutual funds are valued at the closing net asset value (“NAV”) per share, while exchange-traded funds are valued at the closing market price per share.
Securities for which market quotations are not readily available (including restricted securities) or are deemed unreliable are valued at fair value as deemed appropriate by the Adviser. Factors considered in making this determination may include, but are not limited to, information obtained by contacting the issuer, analysts, analysis of the issuer’s financial statements or other available documents. In addition, the Fund may use fair value pricing for securities primarily traded in non-U.S. markets because most foreign markets close well before the Fund values its securities at 4:00 p.m., Eastern Time. The earlier close of these foreign markets gives rise to the possibility that significant events may have occurred in the interim and may materially affect the value of those securities. To account for this, the Fund generally values many of its foreign equity securities using fair value prices at the discretion of the Adviser.
| | |
| |
26 | AB TAX-AWARE INTERMEDIATE MUNICIPAL ETF | | abfunds.com |
NOTES TO FINANCIAL STATEMENTS (continued)
2. Fair Value Measurements
In accordance with U.S. GAAP regarding fair value measurements, fair value is defined as the price that the Fund would receive to sell an asset or pay to transfer a liability in an orderly transaction between market participants at the measurement date. U.S. GAAP establishes a framework for measuring fair value, and a three-level hierarchy for fair value measurements based upon the transparency of inputs to the valuation of an asset or liability (including those valued based on their market values as described in Note A.1 above). Inputs may be observable or unobservable and refer broadly to the assumptions that market participants would use in pricing the asset or liability. Observable inputs reflect the assumptions market participants would use in pricing the asset or liability based on market data obtained from sources independent of the Fund. Unobservable inputs reflect the Fund’s own assumptions about the assumptions that market participants would use in pricing the asset or liability based on the best information available in the circumstances. Each investment is assigned a level based upon the observability of the inputs which are significant to the overall valuation. The three-tier hierarchy of inputs is summarized below.
| | • | | Level 1—quoted prices in active markets for identical investments |
| | • | | Level 2—other significant observable inputs (including quoted prices for similar investments, interest rates, prepayment speeds, credit risk, etc.) |
| | • | | Level 3—significant unobservable inputs (including the Fund’s own assumptions in determining the fair value of investments) |
The fair value of debt instruments, such as bonds, and over-the-counter derivatives is generally based on market price quotations, recently executed market transactions (where observable) or industry recognized modeling techniques and are generally classified as Level 2. Pricing vendor inputs to Level 2 valuations may include quoted prices for similar investments in active markets, interest rate curves, coupon rates, currency rates, yield curves, option adjusted spreads, default rates, credit spreads and other unique security features in order to estimate the relevant cash flows which are then discounted to calculate fair values. If these inputs are unobservable and significant to the fair value, these investments will be classified as Level 3.
Other fixed income investments, including non-U.S. government and corporate debt, are generally valued using quoted market prices, if available, which are typically impacted by current interest rates, maturity dates and any perceived credit risk of the issuer. Additionally, in the absence of quoted market prices, these inputs are used by pricing vendors to derive a valuation based upon industry or proprietary models which incorporate
| | |
| |
| abfunds.com | | AB TAX-AWARE INTERMEDIATE MUNICIPAL ETF | 27 |
NOTES TO FINANCIAL STATEMENTS (continued)
issuer specific data with relevant yield/spread comparisons with more widely quoted bonds with similar key characteristics. Those investments for which there are observable inputs are classified as Level 2. Where the inputs are not observable, the investments are classified as Level 3.
The following table summarizes the valuation of the Fund’s investments by the above fair value hierarchy levels as of November 30, 2024:
| | | | | | | | | | | | | | | | |
Investments in
Securities: | | Level 1 | | | Level 2 | | | Level 3 | | | Total | |
Assets: | | | | | | | | | | | | | | | | |
Long-Term Municipal Bonds | | $ | – 0 | – | | $ | 81,943,611 | | | $ | – 0 | – | | $ | 81,943,611 | |
Short-Term Municipal Notes | | | – 0 | – | | | 8,895,000 | | | | – 0 | – | | | 8,895,000 | |
Short-Term Investments: | | | | | | | | | | | | | | | | |
U.S. Treasury Bills | | | – 0 | – | | | 1,489,048 | | | | – 0 | – | | | 1,489,048 | |
Investment Companies | | | 136,670 | | | | – 0 | – | | | – 0 | – | | | 136,670 | |
| | | | | | | | | | | | | | | | |
Total Investments in Securities | | | 136,670 | | | | 92,327,659 | | | | – 0 | – | | | 92,464,329 | |
Other Financial Instruments(a): | | | | | | | | | | | | | | | | |
Assets: | | | | | | | | | | | | | | | | |
Centrally Cleared Credit Default Swaps | | | – 0 | – | | | 66,892 | | | | – 0 | – | | | 66,892 | (b) |
Centrally Cleared Inflation (CPI) Swaps | | | – 0 | – | | | 23,095 | | | | – 0 | – | | | 23,095 | (b) |
Centrally Cleared Interest Rate Swaps | | | – 0 | – | | | 128,370 | | | | – 0 | – | | | 128,370 | (b) |
Liabilities: | | | | | | | | | | | | | | | | |
Centrally Cleared Inflation (CPI) Swaps | | | – 0 | – | | | (10,550 | ) | | | – 0 | – | | | (10,550 | )(b) |
Centrally Cleared Interest Rate Swaps | | | – 0 | – | | | (124,589 | ) | | | – 0 | – | | | (124,589 | )(b) |
| | | | | | | | | | | | | | | | |
Total | | $ | 136,670 | | | $ | 92,410,877 | | | $ | – 0 | – | | $ | 92,547,547 | |
| | | | | | | | | | | | | | | | |
| (a) | Other financial instruments include derivative instruments, such as futures, forwards and swaps. Derivative instruments are valued at the unrealized appreciation (depreciation) on the instrument. Other financial instruments may also include swaps with upfront premiums, written options and written swaptions which are valued at market value. |
| (b) | Only variation margin receivable (payable) at period end is reported within the statement of assets and liabilities. This amount reflects cumulative unrealized appreciation (depreciation) on futures and centrally cleared swaps as reported in the portfolio of investments. Where applicable, centrally cleared swaps with upfront premiums are presented here at market value. |
3. Currency Translation
Assets and liabilities denominated in foreign currencies and commitments under forward currency exchange contracts are translated into U.S. dollars at the mean of the quoted bid and ask prices of such currencies against the U.S. dollar. Purchases and sales of portfolio securities are translated into U.S. dollars at the rates of exchange prevailing when such securities were acquired or sold. Income and expenses are translated into U.S. dollars at rates of exchange prevailing when accrued.
| | |
| |
28 | AB TAX-AWARE INTERMEDIATE MUNICIPAL ETF | | abfunds.com |
NOTES TO FINANCIAL STATEMENTS (continued)
Net realized gain or loss on foreign currency transactions represents foreign exchange gains and losses from sales and maturities of foreign fixed income investments, holding of foreign currencies, currency gains or losses realized between the trade and settlement dates on foreign investment transactions, and the difference between the amounts of dividends, interest and foreign withholding taxes recorded on the Fund’s books and the U.S. dollar equivalent amounts actually received or paid. Net unrealized currency gains and losses from valuing foreign currency denominated assets and liabilities at period end exchange rates are reflected as a component of net unrealized appreciation or depreciation of foreign currency denominated assets and liabilities.
4. Taxes
It is the Fund’s policy to meet the requirements of the Internal Revenue Code applicable to regulated investment companies and to distribute all of its investment company taxable income and net realized gains, if any, to shareholders. Therefore, no provisions for federal income or excise taxes are required. The Fund may be subject to taxes imposed by countries in which it invests. Such taxes are generally based on income and/or capital gains earned or repatriated. Taxes are accrued and applied to net investment income, net realized gains and net unrealized appreciation/depreciation as such income and/or gains are earned.
In accordance with U.S. GAAP requirements regarding accounting for uncertainties in income taxes, management has analyzed the Fund’s tax positions taken or expected to be taken on federal and state income tax returns for all open tax years (the current tax year) and has concluded that no provision for income tax is required in the Fund’s financial statements.
5. Investment Income and Investment Transactions
Dividend income is recorded on the ex-dividend date or as soon as the Fund is informed of the dividend. Interest income is accrued daily. Investment transactions are accounted for on the date the securities are purchased or sold. Investment gains or losses are determined on the identified cost basis. Non-cash dividends, if any, are recorded on the ex-dividend date at the fair value of the securities received. The Fund amortizes premiums and accretes discounts as adjustments to interest income.
The Fund accounts for distributions received from real estate investment trust (“REIT”) investments or from regulated investment companies as dividend income, realized gain, or return of capital based on information provided by the REIT or the investment company.
6. Dividends and Distributions
Dividends and distributions to shareholders, if any, are recorded on the ex-dividend date. Income dividends and capital gains distributions are
| | |
| |
| abfunds.com | | AB TAX-AWARE INTERMEDIATE MUNICIPAL ETF | 29 |
NOTES TO FINANCIAL STATEMENTS (continued)
determined in accordance with federal tax regulations and may differ from those determined in accordance with U.S. GAAP. To the extent these differences are permanent, such amounts are reclassified within the capital accounts based on their federal tax basis treatment; temporary differences do not require such reclassification.
7. Offering Expenses
The Adviser has agreed to pay all of the Fund’s organization and offering costs. The Fund is not obligated to repay any such organizational expenses or offering costs paid by the Adviser.
8. Cash and Short-Term Investments
Cash and short-term investments include cash on hand and short-term investments with maturities of less than one year when purchased.
NOTE B
Advisory Fee and Other Transactions with Affiliates
Under the terms of the investment advisory agreement, the Fund pays the Adviser a unitary advisory fee at an annual rate of .28% of the Fund’s average daily net assets. The fees are accrued daily and paid monthly.
Under the investment advisory agreement, in accordance with the unitary fee structure, the Adviser bears the cost of various third-party services required by the Fund, including audit, custodial, accounting, legal, transfer agency and printing costs and the fees and expenses of the Corporation’s directors and their counsel. Also under the investment advisory agreement, the Adviser will reimburse the Fund for the Fund’s share of the acquired funds fees and expenses (advisory fees and other expenses) of any pooled investment vehicle for which the Adviser serves as investment adviser. For the period ended November 30, 2024, such waiver/reimbursements relating to the Fund’s investment in AB Government Money Market Portfolio amounted to $1,007.
A summary of the Fund’s transactions in AB mutual funds for the period ended November 30, 2024 is as follows:
| | | | | | | | | | | | | | | | | | | | |
Fund | | Market Value
11/30/23
(000) | | | Purchases
at Cost
(000) | | | Sales
Proceeds
(000) | | | Market Value
11/30/24
(000) | | | Dividend
Income
(000) | |
AB Government Money Market Portfolio | | $ | – 0 | – | | $ | 33,593 | | | $ | 33,456 | | | $ | 137 | | | $ | 26 | |
| | |
| |
30 | AB TAX-AWARE INTERMEDIATE MUNICIPAL ETF | | abfunds.com |
NOTES TO FINANCIAL STATEMENTS (continued)
NOTE C
Distribution Plan
The Fund has adopted a Distribution and Service Plan pursuant to Rule 12b-1 of the Act which permits the Fund to pay distribution and servicing fees not to exceed .25% per year of the Fund’s average daily net assets. No such fees are currently paid, and the Board has not approved the commencement of payments under the Rule 12b-1 Distribution Plan.
NOTE D
Investment Transactions
Purchases and sales of investment securities (excluding short-term investments and in-kind purchases and sales) for the period ended November 30, 2024 were as follows:
| | | | | | | | |
| | | Purchases | | | Sales | |
Investment securities (excluding U.S. government securities) | | $ | 82,150,038 | | | $ | 3,328,959 | |
U.S. government securities | | | 100,819 | | | | – 0 | – |
For the period ended November 30, 2024, the Fund had no in-kind purchases and in-sales.
The cost of investments for federal income tax purposes, gross unrealized appreciation and unrealized depreciation are as follows:
| | | | |
Cost | | $ | 91,571,143 | |
| | | | |
Gross unrealized appreciation | | $ | 1,163,629 | |
Gross unrealized depreciation | | | (214,744 | ) |
| | | | |
Net unrealized appreciation | | $ | 948,885 | |
| | | | |
1. Derivative Financial Instruments
The Fund may use derivatives in an effort to earn income and enhance returns, to replace more traditional direct investments, to obtain exposure to otherwise inaccessible markets (collectively, “investment purposes”), or to hedge or adjust the risk profile of its portfolio.
The principal types of derivatives utilized by the Fund, as well as the methods in which they may be used are:
The Fund may enter into swaps for investment purposes or to hedge its exposure to interest rates, credit risk, equity markets or currencies. A swap is an agreement that obligates two parties to exchange a series of cash flows at specified intervals based upon or calculated by reference to changes in specified prices, rates or indexes for a specified amount of an underlying asset or inflation. The payment flows are usually netted against each other, with the difference being
| | |
| |
| abfunds.com | | AB TAX-AWARE INTERMEDIATE MUNICIPAL ETF | 31 |
NOTES TO FINANCIAL STATEMENTS (continued)
paid by one party to the other. In addition, collateral may be pledged or received by the Fund in accordance with the terms of the respective swaps to provide value and recourse to the Fund or its counterparties in the event of default, bankruptcy or insolvency by one of the parties to the swap.
Risks may arise as a result of the failure of the counterparty to the swap to comply with the terms of the swap. The loss incurred by the failure of a counterparty is generally limited to the net interim payment to be received by the Fund, and/or the termination value at the end of the contract. Therefore, the Fund considers the creditworthiness of each counterparty to a swap in evaluating potential counterparty risk. This risk is mitigated by having a netting arrangement between the Fund and the counterparty and by the posting of collateral by the counterparty to the Fund to cover the Fund’s exposure to the counterparty. Additionally, risks may arise from unanticipated movements in interest rates, inflation or in the value of the underlying securities. The Fund accrues for the interim payments on swaps on a daily basis, with the net amount recorded within unrealized appreciation (depreciation) of swaps on the statement of assets and liabilities, where applicable. Once the interim payments are settled in cash, the net amount is recorded as realized gain/(loss) on swaps on the statement of operations, in addition to any realized gain/(loss) recorded upon the termination of swaps. Upfront premiums paid or received for swaps are recognized as cost or proceeds on the statement of assets and liabilities and are amortized on a straight line basis over the life of the contract. Amortized upfront premiums are included in net realized gain/(loss) from swaps on the statement of operations. Fluctuations in the value of swaps are recorded as a component of net change in unrealized appreciation (depreciation) of swaps on the statement of operations.
Certain standardized swaps, including certain interest rate swaps and credit default swaps, are subject to mandatory central clearing. Cleared swaps are transacted through futures commission merchants (“FCMs”) that are members of central clearinghouses, with the clearinghouse serving as central counterparty, similar to transactions in futures contracts. Centralized clearing will be required for additional categories of swaps on a phased-in basis based on requirements published by the Securities and Exchange Commission and Commodity Futures Trading Commission.
At the time the Fund enters into a centrally cleared swap, the Fund deposits with the broker or segregates at its custodian cash or securities as collateral to satisfy initial margin requirements set by the clearinghouse on which the transaction is effected. Pursuant to the
| | |
| |
32 | AB TAX-AWARE INTERMEDIATE MUNICIPAL ETF | | abfunds.com |
NOTES TO FINANCIAL STATEMENTS (continued)
contract, with respect to cash collateral, the Fund agrees to receive from or pay to the broker an amount of cash equal to the daily fluctuation in the value of the contract; in the case of securities collateral, the Fund agrees to adjust the securities position held in the segregated account accordingly. Such receipts, payments or adjustments are known as variation margin and are recorded by the Fund as unrealized gains or losses. Risks may arise from the potential inability of a counterparty to meet the terms of the contract. The credit/counterparty risk for centrally cleared swaps is generally less than non-centrally cleared swaps, since the clearinghouse, which is the issuer or counterparty to each centrally cleared swap, has robust risk mitigation standards, including the requirement to provide initial and variation margin. When the contract is closed, the Fund records a realized gain or loss equal to the difference between the value of the contract at the time it was opened and the time it was closed.
Interest Rate Swaps:
The Fund is subject to interest rate risk exposure in the normal course of pursuing its investment objectives. Because the Fund holds fixed rate bonds, the value of these bonds may decrease if interest rates rise. To help hedge against this risk and to maintain its ability to generate income at prevailing market rates, the Fund may enter into interest rate swaps. Interest rate swaps are agreements between two parties to exchange cash flows based on a notional amount. The Fund may elect to pay a fixed rate and receive a floating rate, or, receive a fixed rate and pay a floating rate on a notional amount.
In addition, the Fund may also enter into interest rate swap transactions to preserve a return or spread on a particular investment or portion of its portfolio, or protecting against an increase in the price of securities the Fund anticipates purchasing at a later date. Interest rate swaps involve the exchange by the Fund with another party of their respective commitments to pay or receive interest (e.g., an exchange of floating rate payments for fixed rate payments) computed based on a contractually-based principal (or “notional”) amount. Interest rate swaps are entered into on a net basis (i.e., the two payment streams are netted out, with the Fund receiving or paying, as the case may be, only the net amount of the two payments).
During the period ended November 30, 2024, the Fund held interest rate swaps for hedging purposes.
Inflation (CPI) Swaps:
Inflation swap agreements are contracts in which one party agrees to pay the cumulative percentage increase in a price index (the Consumer Price Index with respect to CPI swaps) over the term of the swap (with some lag on the inflation index), and the other pays a
| | |
| |
| abfunds.com | | AB TAX-AWARE INTERMEDIATE MUNICIPAL ETF | 33 |
NOTES TO FINANCIAL STATEMENTS (continued)
compounded fixed rate. Inflation swaps may be used to protect the net asset value, or NAV, of a Fund against an unexpected change in the rate of inflation measured by an inflation index since the value of these agreements is expected to increase if there are unexpected inflation increases.
During the period ended November 30, 2024, the Fund held inflation (CPI) swaps for hedging purposes.
Credit Default Swaps:
The Fund may enter into credit default swaps, including to manage its exposure to the market or certain sectors of the market, to reduce its risk exposure to defaults by corporate and sovereign issuers held by the Fund, or to create exposure to corporate or sovereign issuers to which it is not otherwise exposed. The Fund may purchase credit protection (“Buy Contract”) or provide credit protection (“Sale Contract”) on the referenced obligation of the credit default swap. During the term of the swap, the Fund receives/(pays) fixed payments from/(to) the respective counterparty, calculated at the agreed upon rate applied to the notional amount. If the Fund is a buyer/(seller) of protection and a credit event occurs, as defined under the terms of the swap, the Fund will either (i) receive from the seller/(pay to the buyer) of protection an amount equal to the notional amount of the swap (the “Maximum Payout Amount”) and deliver/(take delivery of) the referenced obligation or (ii) receive/(pay) a net settlement amount in the form of cash or securities equal to the notional amount of the swap less the recovery value of the referenced obligation. In certain circumstances Maximum Payout Amounts may be partially offset by recovery values of the respective referenced obligations, upfront premium received upon entering into the agreement, or net amounts received from settlement of buy protection credit default swaps entered into by the Fund for the same referenced obligations with the same counterparty.
Credit default swaps may involve greater risks than if the Fund had invested in the referenced obligation directly. Credit default swaps are subject to general market risk, liquidity risk, counterparty risk and credit risk. If the Fund is a buyer of protection and no credit event occurs, it will lose the payments it made to its counterparty. If the Fund is a seller of protection and a credit event occurs, the value of the referenced obligation received by the Fund coupled with the periodic payments previously received, may be less than the Maximum Payout Amount it pays to the buyer, resulting in a net loss to the Fund.
Implied credit spreads over U.S. Treasuries of comparable maturity utilized in determining the market value of credit default swaps on
| | |
| |
34 | AB TAX-AWARE INTERMEDIATE MUNICIPAL ETF | | abfunds.com |
NOTES TO FINANCIAL STATEMENTS (continued)
issuers as of period end are disclosed in the portfolio of investments. The implied spreads serve as an indicator of the current status of the payment/performance risk and typically reflect the likelihood of default by the issuer of the referenced obligation. The implied credit spread of a particular reference obligation also reflects the cost of buying/selling protection and may reflect upfront payments required to be made to enter into the agreement. Widening credit spreads typically represent a deterioration of the referenced obligation’s credit soundness and greater likelihood of default or other credit event occurring as defined under the terms of the agreement. A credit spread identified as “Defaulted” indicates a credit event has occurred for the referenced obligation.
During the period ended November 30, 2024, the Fund held credit default swaps for hedging purposes.
During the period ended November 30, 2024, the Fund had entered into the following derivatives:
| | | | | | | | | | | | |
| | | Asset Derivatives | | | Liability Derivatives | |
Derivative Type | | Statement of
Assets and
Liabilities
Location | | Fair Value | | | Statement of Assets and
Liabilities
Location | | Fair Value | |
Credit contracts | | Receivable for variation margin on centrally cleared swaps | | $ | 18,742 | * | | | | | | |
Interest rate contracts | |
Receivable for variation margin on centrally cleared swaps | | | 151,434 | * | | Payable for variation margin on centrally cleared swaps | | $ | 134,572 | * |
| | | | | | | | | | | | |
Total | | | | $ | 170,176 | | | | | $ | 134,572 | |
| | | | | | | | | | | | |
| * | Only variation margin receivable/payable at period end is reported within the statement of assets and liabilities. This amount reflects cumulative unrealized appreciation (depreciation) on futures and centrally cleared swaps as reported in the portfolio of investments. |
| | |
| |
| abfunds.com | | AB TAX-AWARE INTERMEDIATE MUNICIPAL ETF | 35 |
NOTES TO FINANCIAL STATEMENTS (continued)
| | | | | | | | | | |
Derivative Type | | Location of Gain or (Loss) on Derivatives Within Statement of
Operations | | Realized Gain
or (Loss) on
Derivatives | | | Change in
Unrealized
Appreciation or
(Depreciation) | |
Interest rate contracts | | Net realized gain (loss) on swaps; Net change in unrealized appreciation (depreciation) of swaps | | | (134,742 | ) | | | 16,862 | |
Credit contracts | | Net realized gain (loss) on swaps; Net change in unrealized appreciation (depreciation) of swaps | | | 29,241 | | | | 18,742 | |
| | | | | | | | | | |
Total | | | | $ | (105,501 | ) | | $ | 35,604 | |
| | | | | | | | | | |
The following table represents the average monthly volume of the Fund’s derivative transactions during the period ended November 30, 2024:
| | | | |
Centrally Cleared Interest Rate Swaps: | | | | |
Average notional amount | | $ | 5,800,833 | |
Centrally Cleared Inflation Swaps: | | | | |
Average notional amount | | $ | 7,050,000 | (a) |
Centrally Cleared Credit Default Swaps: | | | | |
Average notional amount of sale contracts | | $ | 700,000 | (b) |
| (a) | Positions were open for two months during the period. |
| (b) | Positions were open for eight months during the period. |
2. Currency Transactions
The Fund may invest in non-U.S. Dollar-denominated securities on a currency hedged or unhedged basis. The Fund may seek investment opportunities by taking long or short positions in currencies through the use of currency-related derivatives, including forward currency exchange contracts, futures and options on futures, swaps, and other options. The Fund may enter into transactions for investment opportunities when it anticipates that a foreign currency will appreciate or depreciate in value but securities denominated in that currency are not held by the Fund and do not present attractive investment opportunities. Such transactions may also be used when the Adviser believes that it may be more efficient than a direct investment in a foreign currency-denominated security. The Fund may also conduct currency exchange contracts on a spot basis (i.e., for cash at the spot rate prevailing in the currency exchange market for buying or selling currencies).
| | |
| |
36 | AB TAX-AWARE INTERMEDIATE MUNICIPAL ETF | | abfunds.com |
NOTES TO FINANCIAL STATEMENTS (continued)
NOTE E
Shares of the Fund
The Fund’s shares may only be bought and sold in a secondary market through a broker-dealer at a market price. Because ETF shares trade at market prices rather than NAV, shares may trade at a price greater than NAV (a premium) or less than NAV (a discount). The Fund issues and redeems shares at its NAV only in aggregations of a specified number of shares (a creation unit) generally in exchange for a designated portfolio of securities and/or cash (including any portion of such securities for which cash may be substituted). A fixed transaction fee is imposed on authorized participants in connection with creation unit redemption and creation transactions. Authorized participants may be required to pay an additional variable charge to cover certain costs and expenses related to the execution of trades resulting from creation unit transactions. Such variable charges, if any, are included in other capital within the Statement of Changes in Net Assets.
Transactions in shares of the Fund were as follows:
| | | | | | | | | | | | | | | | |
| | | | | | | | | | | | | | | | |
| | | Shares | | | | | | Amount | | | | |
| | | December 13,
2023(a) to November 30,
2024 | | | | | | December 13,
2023(a) to November 30,
2024 | | | | |
| | | | | | | | |
Shares sold | | | 3,650,040 | | | | | | | $ | 92,515,240 | | | | | |
| | | | | |
Shares redeemed | | | (50,000 | ) | | | | | | | (1,257,405 | ) | | | | |
| | | | | |
Net increase | | | 3,600,040 | | | | | | | $ | 91,257,835 | | | | | |
| | | | | |
| (a) | Commencement of operations. |
NOTE F
Risks Involved in Investing in the Fund
Market Risk—The value of the Fund’s assets will fluctuate as the bond market fluctuates. The value of its investments may decline, sometimes rapidly and unpredictably, simply because of economic changes or other events, including public health crises (including the occurrence of a contagious disease or illness), interest rate levels, and regional and global conflicts, that affect large portions of the market.
Credit Risk—An issuer or guarantor of a fixed-income security, or the counterparty to a derivatives or other contract, may be unable or unwilling to make timely payments of interest or principal, or to otherwise honor its obligations. The issuer or guarantor may default, causing a loss of the full principal amount of a security and accrued interest. The degree of risk for a particular security may be reflected in its credit rating. There is the
| | |
| |
| abfunds.com | | AB TAX-AWARE INTERMEDIATE MUNICIPAL ETF | 37 |
NOTES TO FINANCIAL STATEMENTS (continued)
possibility that the credit rating of a fixed-income security may be downgraded after purchase, which may adversely affect the value of the security.
Interest-Rate Risk—Changes in interest rates will affect the value of investments in fixed-income securities. When interest rates rise, the value of investments in fixed-income securities tends to fall and this decrease in value may not be offset by higher income from new investments. Interest-rate risk is generally greater for fixed-income securities with longer maturities or durations. The Fund may be subject to a greater risk of rising interest rates than would normally be the case due to the recent end of a period of historically low rates and the effects of potential central bank monetary policy, and government fiscal policy, initiatives and market reactions to those initiatives.
Municipal Market Risk—This is the risk that special factors may adversely affect the value of municipal securities and have a significant effect on the yield or value of the Fund’s investments in municipal securities. These factors include economic conditions, political or legislative changes, public health crises, uncertainties related to the tax status of municipal securities, and the rights of investors in these securities. To the extent that the Fund invests more of its assets in a particular state’s municipal securities, the Fund may be vulnerable to events adversely affecting that state, including economic, political and regulatory occurrences, court decisions, terrorism, public health crises (including the occurrence of a contagious disease or illness) and catastrophic natural disasters, such as hurricanes, fires or earthquakes. The Fund’s investments in certain municipal securities with principal and interest payments that are made from the revenues of a specific project or facility, and not general tax revenues, may have increased risks. Factors affecting the project or facility, such as local business or economic conditions, could have a significant effect on the project’s ability to make payments of principal and interest on these securities.
In addition, changes in tax rates or the treatment of income from certain types of municipal securities, among other things, could negatively affect the municipal securities markets.
The municipal securities issued by Puerto Rico and its government agencies and municipalities may have more risks than those of other U.S. issuers of municipal securities. Puerto Rico continues to face a challenging economic and fiscal environment. If the general economic situation in Puerto Rico continues to persist or worsens, the volatility and credit quality of Puerto Rican municipal securities could continue to be adversely affected, and the market for such securities may deteriorate further.
| | |
| |
38 | AB TAX-AWARE INTERMEDIATE MUNICIPAL ETF | | abfunds.com |
NOTES TO FINANCIAL STATEMENTS (continued)
Tax Risk—From time to time, the U.S. Government and the U.S. Congress consider changes in federal tax law that could limit or eliminate the federal tax exemption for municipal bond income, which would in effect reduce the income received by shareholders from the Fund by increasing taxes on that income. In such event, the Fund’s net asset value (“NAV”) could also decline as yields on municipal bonds, which are typically lower than those on taxable bonds, would be expected to increase to approximately the yield of comparable taxable bonds. Actions or anticipated actions affecting the tax-exempt status of municipal bonds could also result in significant shareholder redemptions of Fund shares as investors anticipate adverse effects on the Fund or seek higher yields to offset the potential loss of the tax deduction. As a result, the Fund would be required to maintain higher levels of cash to meet the redemptions, which would negatively affect the Fund’s yield.
Duration Risk—Duration is a measure that relates the expected price volatility of a fixed-income security to changes in interest rates. The duration of a fixed-income security may be shorter than or equal to full maturity of a fixed-income security. Fixed-income securities with longer durations have more risk and will decrease in price as interest rates rise. For example, a fixed-income security with a duration of three years will likely decrease in value by approximately 3% if interest rates increase by 1%.
Below Investment-Grade Securities Risk—Investments in fixed-income securities with lower ratings (commonly known as “junk bonds”) are subject to a higher probability that an issuer will default or fail to meet its payment obligations. These securities may be subject to greater price volatility due to such factors as specific municipal or corporate developments and negative performance of the junk bond market generally and may be more difficult to trade than other types of securities.
Inflation Risk—This is the risk that the value of assets or income from investments will be less in the future as inflation decreases the value of money. As inflation increases, the value of the Fund’s assets can decline as can the value of the Fund’s distributions. This risk is significantly greater for fixed-income securities with longer maturities.
Leverage Risk—When the Fund borrows money or otherwise leverages its investments, its performance may be volatile because leverage tends to exaggerate the effect of any increase or decrease in the value of the Fund’s investments. The Fund may create leverage through the use of reverse repurchase arrangements, forward currency exchange contracts, forward commitments, dollar rolls or futures or by borrowing money. The use of other types of derivative instruments by the Fund, such as options and swaps, may also result in a form of leverage. Leverage may result in
| | |
| |
| abfunds.com | | AB TAX-AWARE INTERMEDIATE MUNICIPAL ETF | 39 |
NOTES TO FINANCIAL STATEMENTS (continued)
higher returns to the Fund than if the Fund were not leveraged, but may also adversely affect returns, particularly if the market is declining.
Derivatives Risk—Derivatives may be difficult to price or unwind and leveraged so that small changes may produce disproportionate losses for the Fund. A short position in a derivative instrument involves the risk of a theoretically unlimited increase in the value of the underlying asset, reference rate or index, which could cause the Fund to suffer a potentially unlimited loss. Derivatives, especially over-the-counter derivatives, are also subject to counterparty risk, which is the risk that the counterparty (the party on the other side of the transaction) on a derivative transaction will be unable or unwilling to honor its contractual obligations to the Fund.
Illiquid Investments Risk—Illiquid investments risk exists when certain investments are or become difficult to purchase or sell. Difficulty in selling such investments may result in sales at disadvantageous prices affecting the value of your investment in the Fund. Causes of illiquid investments risk may include low trading volumes and large positions. Municipal securities may have more illiquid investments risk than other fixed-income securities because they trade less frequently and the market for municipal securities is generally smaller than many other markets.
Variable and Floating-Rate Securities Risk—Variable and floating-rate securities pay interest at rates that are adjusted periodically, according to a specific formula. Because the interest rate is reset only periodically, changes in the interest rate on these securities may lag behind changes in the prevailing market interest rates. The value of the security may rise or fall depending on changes in interest rates between periodic resets.
When-Issued and Forward Commitment Risks—These securities are purchased before the securities are actually issued or delivered. These securities are subject to the risk that, when delivered, they will be worth less than the agreed-upon purchase price.
Cash Transactions Risk—The Fund intends to effectuate all or a portion of the issuance and redemption of Creation Units for cash, rather than in-kind securities. As a result, an investment in the Fund may be less tax-efficient than an investment in an ETF that effectuates its Creation Units only on an in-kind basis. A fund that effects redemptions for cash may be required to sell portfolio securities in order to obtain the cash needed to distribute redemption proceeds. Any recognized gain on these sales by the Fund will generally cause the Fund to recognize a gain it might not otherwise have recognized, or to recognize such gain sooner than would otherwise be required as compared to an ETF that distributes portfolio securities in-kind in redemption of Creation Units. The Fund
| | |
| |
40 | AB TAX-AWARE INTERMEDIATE MUNICIPAL ETF | | abfunds.com |
NOTES TO FINANCIAL STATEMENTS (continued)
intends to distribute gains that arise by virtue of the issuance and redemption of Creation Units being effectuated in cash to shareholders to avoid being taxed on this gain at the fund level and otherwise comply with applicable tax requirements. This may cause shareholders to be subject to tax on gains to which they would not otherwise be subject, or at an earlier date than if they had made an investment in another ETF. Moreover, cash transactions may have to be carried out over several days if the securities market is relatively illiquid and may involve considerable brokerage fees and taxes. Brokerage fees, which will be higher than if the Fund sold and redeemed its shares principally in-kind, will be passed on to those purchasing and redeeming Creation Units in the form of creation and redemption transaction fees. In addition, these factors may result in wider spreads between the bid and ask prices of Fund shares than for ETFs that receive and distribute portfolio securities in-kind. The Fund’s use of cash for creations and redemptions could also result in dilution to the Fund and increased transaction costs, which could negatively impact the Fund’s ability to achieve its investment objective.
ETF Share Price and Net Asset Value Risk—The Fund’s shares are listed for trading on the NYSE Arca, Inc. (the “Exchange”). Shares are generally bought and sold in the secondary market at market prices. The NAV per share of the Fund will fluctuate with changes in the market value of the Fund’s holdings. The Fund’s NAV is calculated once per day, at the end of the day. The market price of a share on the Exchange could be higher than the NAV (premium), or lower than the NAV (discount) and may fluctuate during the trading day. When all or a portion of the Fund’s underlying securities trade in a market that is closed when the market for the Fund’s shares is open, there may be differences between the current value of a security and the last quoted price for that security in the closed local market, which could lead to a deviation between the market value of the Fund’s shares and the Fund’s NAV. Disruptions in the creations and redemptions process or the existence of extreme market volatility could result in the Fund’s shares trading above or below NAV. As the Fund may invest in securities traded on foreign exchanges, Fund shares may trade at a larger premium or discount to the Fund’s NAV than shares of other ETFs. In addition, in stressed market conditions, the market for Fund shares may become less liquid in response to deteriorating liquidity in the markets for the Fund’s underlying portfolio holdings.
Authorized Participant Risk—Only a limited number of financial institutions that enter into an authorized participant relationship with the Fund (“Authorized Participants”) may engage in creation or redemption transactions. If the Fund’s
| | |
| |
| abfunds.com | | AB TAX-AWARE INTERMEDIATE MUNICIPAL ETF | 41 |
NOTES TO FINANCIAL STATEMENTS (continued)
Authorized Participants decide not to create or redeem shares, Fund shares may trade at a larger premium or discount to the Fund’s NAV, or the Fund could face trading halts or de-listing.
Active Trading Market Risk—There is no guarantee that an active trading market for Fund shares will exist at all times. In times of market stress, markets can suffer erratic or unpredictable trading activity, extraordinary volatility or wide bid/ask spreads, which could cause some market makers and Authorized Participants to reduce their market activity or “step away” from making a market in ETF shares. Market makers and Authorized Participants are not obligated to place or execute purchase and redemption orders. This could cause the Fund’s market price to deviate, materially, from the NAV, and reduce the effectiveness of the ETF arbitrage process. Any absence of an active trading market for Fund shares could lead to a heightened risk that there will be a difference between the market price of a Fund share and the underlying value of the Fund share.
Indemnification Risk—In the ordinary course of business, the Fund enters into contracts that contain a variety of indemnifications. The Fund’s maximum exposure under these arrangements is unknown. However, the Fund has not had prior claims or losses pursuant to these indemnification provisions and expects the risk of loss thereunder to be remote. Therefore, the Fund has not accrued any liability in connection with these indemnification provisions.
Management Risk—The Fund is subject to management risk because it is an actively-managed ETF. The Adviser will apply its investment techniques and risk analyses in making investment decisions, but there is no guarantee that its techniques will produce the intended results. Some of these techniques may incorporate, or rely upon, quantitative models, but there is no guarantee that these models will generate accurate forecasts, reduce risk or otherwise perform as expected.
NOTE G
Joint Credit Facility
A number of ETFs managed by the Adviser, including the Fund, participate in a $325 million revolving credit facility (the “Facility”) intended to provide short-term financing related to redemptions and other short term liquidity requirements, subject to certain restrictions. Commitment fees related to the Facility are paid by the participating funds and are included in miscellaneous expenses in the statement of operations. The Fund did not utilize the Facility during the period ended November 30, 2024.
| | |
| |
42 | AB TAX-AWARE INTERMEDIATE MUNICIPAL ETF | | abfunds.com |
NOTES TO FINANCIAL STATEMENTS (continued)
NOTE H
Distributions to Shareholders
The tax character of distributions paid during the fiscal period ended November 30, 2024 was as follows:
| | | | |
| | | 2024 | |
Distributions paid from: | | | | |
Ordinary income | | $ | 118,072 | |
| | | | |
Total taxable distributions | | $ | 118,072 | |
Tax-exempt income | | | 911,023 | |
| | | | |
Total distributions paid | | $ | 1,029,095 | |
| | | | |
As of November 30, 2024, the components of accumulated earnings (deficit) on a tax basis were as follows:
| | | | |
Undistributed ordinary income | | $ | 275,283 | |
Accumulated capital and other losses | | | (74,752 | )(a) |
Unrealized appreciation (depreciation) | | | 948,885 | (b) |
| | | | |
Total accumulated earnings (deficit) | | $ | 1,149,416 | |
| | | | |
| (a) | As of November 30, 2024, the Fund had a net capital loss carryforward of $74,752. |
| (b) | The differences between book-basis and tax-basis unrealized appreciation (depreciation) are attributable primarily to the tax treatment of swaps and the tax treatment of bond restructuring. |
For tax purposes, net realized capital losses may be carried over to offset future capital gains, if any. Funds are permitted to carry forward capital losses for an indefinite period, and such losses will retain their character as either short-term or long-term capital losses. As of November 30, 2024, the Fund had a net short-term capital loss carryforward of $74,752, which may be carried forward for an indefinite period.
During the current fiscal period, there were no permanent differences that resulted in adjustments to distributable earnings or additional paid-in capital.
NOTE I
Recent Accounting Pronouncements
In December 2022, the Financial Accounting Standards Board issued an Accounting Standards Update, ASU 2022-06, “Reference Rate Reform (Topic 848) – Deferral of the Sunset Date of Topic 848”. ASU 2022-06 is an amendment to ASU 2020-04, which provided optional guidance to ease the potential accounting burden due to the discontinuation of the LIBOR and other interbank-offered based reference rates and which was effective as of March 12, 2020 through December 31, 2022. ASU 2022-06 extends the effective period through December 31, 2024. Management is currently evaluating the impact, if any, of applying ASU 2022-06.
| | |
| |
| abfunds.com | | AB TAX-AWARE INTERMEDIATE MUNICIPAL ETF | 43 |
NOTES TO FINANCIAL STATEMENTS (continued)
In November 2023, the Financial Accounting Standards Board issued Accounting Standards Update, ASU 2023-07, “Segment Reporting (Topic 280)”. ASU 2023-07 requires public entities to provide disclosure of significant segment expenses that are regularly provided to the chief operating decision maker (“CODM”). ASU 2023-07, among other things, (i) requires a single segment public entity to provide all necessary disclosures required by Topic 280 it, (ii) requires a public entity to disclose the title and position of the CODM and an explanation of how the CODM uses the reported measure(s) of segment profit and loss in assessing segment performance and deciding how to allocate resources and (iii) provides the ability for a public entity to elect more than one performance measure. ASU 2023-07 is effective for fiscal years beginning after December 15, 2023, and interim periods within fiscal years beginning after December 15, 2024. Early adoption of ASU 2023-07 is permitted. Management is currently evaluating the impact, if any, of applying ASU 2023-07.
NOTE J
Subsequent Events
Management has evaluated subsequent events for possible recognition or disclosure in the financial statements through the date the financial statements are issued. Management has determined that there are no material events that would require disclosure in the Fund’s financial statements through this date.
| | |
| |
44 | AB TAX-AWARE INTERMEDIATE MUNICIPAL ETF | | abfunds.com |
FINANCIAL HIGHLIGHTS
Selected Data For A Share of Capital Stock Outstanding Throughout Each Period
| | | | |
| | | December 13,
2023(a) to
November 30,
2024. | |
| | | | |
| | | | |
Net asset value, beginning of period | | | $ 25.00 | |
| | | | |
Income From Investment Operations | | | | |
| |
Net investment income(b)(c) | | | .91 | |
| |
Net realized and unrealized gain on investment transactions | | | .52 | |
| | | | |
Net increase in net asset value from operations | | | 1.43 | |
| | | | |
Less: Dividends | | | | |
| |
Dividends from net investment income | | | (.74 | ) |
| | | | |
Net asset value, end of period | | | $ 25.69 | |
| | | | |
| |
Total Return | | | | |
| |
Total investment return based on net asset value(d) | | | 5.81 | % |
| |
Ratios/Supplemental Data | | | | |
| |
Net assets, end of period (000’s omitted) | | | $92,476 | |
| |
Ratio to average net assets of: | | | | |
| |
Expenses, net of waivers/reimbursements | | | .28 | %^ |
| |
Expenses, before waivers/reimbursements | | | .28 | %^ |
| |
Net investment income(c) | | | 3.74 | %^ |
| |
Portfolio turnover rate(e) | | | 9 | % |
| (a) | Commencement of operations. |
| (b) | Based on average shares outstanding. |
| (c) | Net of expenses waived/reimbursed by the Adviser. |
| (d) | Total investment return is calculated assuming an initial investment made at the net asset value at the beginning of the period, reinvestment of all dividends and distributions at net asset value during the period, and redemption on the last day of the period. Total investment return does not reflect the deduction of taxes that a shareholder would pay on fund distributions or the redemption of fund shares. Total investment return calculated for a period of less than one year is not annualized. |
| (e) | Excludes the value of portfolio securities received or delivered as a result of in-kind purchases or redemptions of the Fund’s capital shares, including ETF Creation Units. |
See notes to financial statements.
| | |
| |
| abfunds.com | | AB TAX-AWARE INTERMEDIATE MUNICIPAL ETF | 45 |
REPORT OF INDEPENDENT REGISTERED
PUBLIC ACCOUNTING FIRM
To the Shareholders and the Board of Directors of
AB Tax-Aware Intermediate Municipal ETF
Opinion on the Financial Statements
We have audited the accompanying statement of assets and liabilities of AB Tax-Aware Intermediate Municipal ETF (the “Fund”) (one of the funds constituting AB Active ETFs, Inc. (the “Corporation”)), including the portfolio of investments, as of November 30, 2024, and the related statements of operations and changes in net assets and the financial highlights for the period from December 13, 2023 (commencement of operations) to November 30, 2024, and the related notes (collectively referred to as the “financial statements”). In our opinion, the financial statements present fairly, in all material respects, the financial position of the Fund (one of the funds constituting AB Active ETFs, Inc.) at November 30, 2024, the results of its operations, the changes in its net assets and its financial highlights for the period from December 13, 2023 (commencement of operations) to November 30, 2024, in conformity with U.S. generally accepted accounting principles.
Basis for Opinion
These financial statements are the responsibility of the Corporation’s management. Our responsibility is to express an opinion on the Fund’s financial statements based on our audit. We are a public accounting firm registered with the Public Company Accounting Oversight Board (United States) (“PCAOB”) and are required to be independent with respect to the Corporation in accordance with the U.S. federal securities laws and the applicable rules and regulations of the Securities and Exchange Commission and the PCAOB.
We conducted our audit in accordance with the standards of the PCAOB. Those standards require that we plan and perform the audit to obtain reasonable assurance about whether the financial statements are free of material misstatement, whether due to error or fraud. The Corporation is not required to have, nor were we engaged to perform, an audit of the Corporation’s internal control over financial reporting. As part of our audit, we are required to obtain an understanding of internal control over financial reporting but not for the purpose of expressing an opinion on the effectiveness of the Corporation’s internal control over financial reporting. Accordingly, we express no such opinion.
Our audit included performing procedures to assess the risks of material misstatement of the financial statements, whether due to error or fraud, and performing procedures that respond to those risks. Such procedures included examining, on a test basis, evidence regarding the amounts and
| | |
| |
46 | AB TAX-AWARE INTERMEDIATE MUNICIPAL ETF | | abfunds.com |
REPORT OF INDEPENDENT REGISTERED
PUBLIC ACCOUNTING FIRM (continued)
disclosures in the financial statements. Our procedures included confirmation of securities owned as of November 30, 2024, by correspondence with the custodian, brokers and others; when replies were not received from brokers or others, we performed other auditing procedures. Our audit also included evaluating the accounting principles used and significant estimates made by management, as well as evaluating the overall presentation of the financial statements. We believe that our audit provides a reasonable basis for our opinion.

We have served as the auditor of one or more of the AB investment companies since 1968.
New York, New York
January 28, 2025
| | |
| |
| abfunds.com | | AB TAX-AWARE INTERMEDIATE MUNICIPAL ETF | 47 |
2024 FEDERAL TAX INFORMATION
(unaudited)
For Federal income tax purposes, the following information is furnished with respect to the distributions paid by the Fund during the taxable period ended November 30, 2024. For foreign shareholders, 76.68% of ordinary income dividends paid may be considered to be qualifying to be taxed as interest-related dividends.
Shareholders should not use the above information to prepare their income tax returns. The information necessary to complete your income tax returns will be included with your Form 1099-DIV which will be sent to you separately in January 2025.
| | |
| |
48 | AB TAX-AWARE INTERMEDIATE MUNICIPAL ETF | | abfunds.com |
Information Regarding the Review and Approval of the Fund’s Advisory Agreement
The disinterested directors (the “directors”) of AB Active ETFs, Inc. (the “Company”) unanimously approved the Company’s Advisory Agreement with the Adviser in respect of AB Tax-Aware Intermediate Municipal ETF (the “Fund”) for an initial two-year period at a meeting held in-person on August 1-2, 2023 (the “Meeting”).
Prior to approval of the Advisory Agreement, the directors had requested from the Adviser, and received and evaluated, extensive materials. They reviewed the proposed Advisory Agreement with the Adviser and with experienced counsel who are independent of the Adviser, who advised on the relevant legal standards. The directors also reviewed additional materials, including comparative analytical data prepared by the Senior Vice President of the Fund. The directors also discussed the proposed approval in private sessions with counsel.
The directors considered their knowledge of the nature and quality of the services to be provided by the Adviser to the Fund gained from their experience as directors or trustees of most of the registered investment companies advised by the Adviser, including the other series of the Company that are organized as exchange-traded funds (“ETFs”), their overall confidence in the Adviser’s integrity and competence they have gained from that experience, the Adviser’s initiative in identifying and raising potential issues with the directors and its responsiveness, frankness and attention to concerns raised by the directors in the past, including the Adviser’s willingness to consider and implement organizational and operational changes designed to improve investment results and the services provided to the AB Funds. The directors noted that they have four regular meetings each year, at each of which they review extensive materials and information from the Adviser, including information on the investment performance of the AB Funds.
The directors also considered all factors they believed relevant, including the specific matters discussed below. During the course of their deliberations, the directors evaluated, among other things, the reasonableness of the proposed advisory fee. The directors did not identify any particular information that was all-important or controlling, and different directors may have attributed different weights to the various factors. The directors determined that the selection of the Adviser to manage the Fund and the overall arrangements between the Fund and the Adviser, as provided in the Advisory Agreement, including the proposed advisory fee, were fair and reasonable in light of the services to be performed, expenses to be incurred and such other matters as the directors considered relevant in the exercise of their business judgment. The material factors and conclusions that formed the basis for the directors’ determinations included the following:
Nature, Extent and Quality of Services to be Provided
The directors considered the scope and quality of services to be provided by the Adviser under the Advisory Agreement, including the quality of the investment research capabilities of the Adviser and the other resources it has
| | |
| |
| abfunds.com | | AB TAX-AWARE INTERMEDIATE MUNICIPAL ETF | 49 |
dedicated to performing services for the AB Funds. They also noted the professional experience and qualifications of the Fund’s portfolio management team and other senior personnel of the Adviser. The directors also considered that the Advisory Agreement provides that the Fund will reimburse the Adviser for the cost to it of providing certain clerical, accounting, administrative and other services to the Fund by employees of the Adviser or its affiliates. Requests for these reimbursements will be subject to the directors’ approval on a quarterly basis. The directors noted that the Adviser does not expect to request such reimbursements. The quality of administrative and other services, including the Adviser’s role in coordinating the activities of the Fund’s other service providers, also was considered. The directors concluded that, overall, they were satisfied with the nature, extent and quality of services to be provided to the Fund under the Advisory Agreement.
Costs of Services to be Provided and Profitability
Because the Fund had not yet commenced operations, the directors were unable to consider historical information about the profitability of the Fund. However, the Adviser agreed to provide the directors with profitability information in connection with future proposed continuances of the Advisory Agreement. They also considered the costs to be borne by the Adviser in providing services to the Fund and that the Fund was unlikely to be profitable to the Adviser unless it achieves a material level of net assets.
Fall-Out Benefits
The directors considered the other benefits to the Adviser from its proposed relationship with the Fund. The directors recognized that the Adviser’s future profitability would be somewhat lower without these benefits. The directors understood that the Adviser also might derive reputational and other benefits from its association with the Fund.
Investment Results
Since the Fund had not yet commenced operations, no performance or other historical information for the Fund was available. Based on the Adviser’s written and oral presentations regarding the proposed management of the Fund and their general knowledge and confidence in the Adviser’s expertise in managing mutual funds and ETFS, the directors concluded that they were satisfied that the Adviser was capable of providing high quality Fund management services to the Fund.
Advisory Fees and Other Expenses
The directors considered the proposed advisory fee rate payable by the Fund to the Adviser and information prepared by an independent service provider (the “15(c) service provider”), concerning advisory fee rates payable by other ETFs in the same category as the Fund, based on the Fund’s projected net assets of $250 million. The directors noted that the proposed advisory fee is a unitary fee and that the Adviser will pay all expenses of the Fund except for certain expenses payable by the Fund such as interest expense, taxes, extraordinary expenses, and brokerage
| | |
| |
50 | AB TAX-AWARE INTERMEDIATE MUNICIPAL ETF | | abfunds.com |
commissions and other transaction costs. The directors recognized that it is difficult to make comparisons of advisory fees because there are variations in the services that are included in the fees payable by other ETFs. The directors considered the Fund’s proposed contractual advisory fee rate against a peer group median and noted that it was lower than the median.
The directors also considered the Adviser’s fee schedule for other clients utilizing investment strategies similar to those of the Fund. For this purpose, they reviewed the relevant advisory fee information from the Adviser’s Form ADV and in a report from the Fund’s Senior Vice President and noted the differences between the Fund’s proposed fee schedule, on the one hand, and the Adviser’s institutional fee schedule, on the other. The directors noted that the Adviser may, in some cases, agree to fee rates with large institutional clients that are lower than those reviewed by the directors and that they had previously discussed with the Adviser its policies in respect of such arrangements. The directors also compared the proposed advisory fee rate for the Fund with those for other funds advised by the Adviser utilizing similar investment strategies.
The Adviser reviewed with the directors the significantly greater scope of the services it will provide to the Fund relative to institutional clients. In this regard, the Adviser noted, among other things, that, compared to institutional accounts, the Fund (i) demands considerably more managerial and administrative resources due to the potential for frequent creations and redemptions of shares; (ii) has more tax and regulatory restrictions and compliance obligations; (iii) must prepare and file or distribute regulatory and other communications about fund operations; and (iv) must provide shareholder servicing to retail investors. The Adviser also reviewed the greater legal risks presented by the large and changing population of Fund shareholders who may assert claims against the Adviser in individual or class actions, and the greater entrepreneurial risk in offering new fund products, which require substantial investment to launch, may not succeed, and generally must be priced to compete with larger, more established funds resulting in lack of to the Adviser until a new fund achieves scale. In light of the substantial differences in services rendered by the Adviser to institutional clients as compared to the Fund, and the different risk profile, the directors considered these fee comparisons inapt and did not place significant weight on them in their deliberations. The directors noted that the proposed unitary fee for the Fund covers additional services provided by third parties and thus is not directly comparable to the Adviser’s institutional fee schedule and the schedule of fees for most other funds advised by the Adviser.
In connection with their review of the Fund’s proposed advisory fee, the directors also considered the projected total expense ratio of the shares of the Fund in comparison to a group of similar funds (“peer group”) and a larger group of similar funds (“peer universe”) selected by the 15(c) service
| | |
| |
| abfunds.com | | AB TAX-AWARE INTERMEDIATE MUNICIPAL ETF | 51 |
provider. The directors view the projected expense ratio information as relevant to their evaluation of the Adviser’s services because the Adviser is responsible for coordinating services provided to the Fund by others and, in most cases, the Adviser will be responsible for paying for such services under its unitary fee arrangement with the Fund. Based on their review, the directors concluded that the Fund’s projected expense ratio was acceptable.
Economies of Scale
The directors noted that the proposed advisory fee schedule for the Fund does not contain breakpoints and that they had discussed their strong preference for breakpoints in advisory contracts with the Adviser. The directors took into consideration prior presentations by an independent consultant on economies of scale in the mutual fund industry and for the AB Funds, and presentations from time to time by the Adviser concerning certain of its views on economies of scale. The directors also had requested and received from the Adviser certain updates on economies of scale in advance of the Meeting. The directors believe that economies of scale may be realized (if at all) by the Adviser across a variety of products and services, and not only in respect of a single fund. The directors noted that there is no established methodology for setting breakpoints that give effect to the fund-specific services provided by a fund’s adviser and to the economies of scale that an adviser may realize in its overall mutual fund business or those components of it which directly or indirectly affect a fund’s operations. The directors observed that in the mutual fund industry as a whole, as well as among ETFs similar to the Fund, there is no uniformity or pattern in the fees and asset levels at which breakpoints (if any) apply. The directors also noted that the advisory agreements for many ETFs do not have breakpoints at all. The directors informed the Adviser that they would monitor the Fund’s asset level and its profitability to the Adviser and anticipated revisiting the question of breakpoints in the future if circumstances warranted doing so.
| | |
| |
52 | AB TAX-AWARE INTERMEDIATE MUNICIPAL ETF | | abfunds.com |
AB TAX-AWARE INTERMEDIATE MUNICIPAL ETF
66 Hudson Boulevard East
New York, NY 10001
800 221 5672
ETF-TAIM-0151-1124 
NOV 11.30.24

ANNUAL FINANCIAL STATEMENTS AND ADDITIONAL INFORMATION
AB TAX-AWARE LONG MUNICIPAL ETF
(NYSE: TAFL)

| | |
| |
| Investment Products Offered | | • Are Not FDIC Insured • May Lose Value • Are Not Bank Guaranteed |
Investors should consider the investment objectives, risks, charges and expenses of the Fund carefully before investing. For copies of our prospectus or summary prospectus, which contain this and other information, visit us online at www.abfunds.com or contact your AB representative. Please read the prospectus and/or summary prospectus carefully before investing.
This shareholder report must be preceded or accompanied by the Fund’s prospectus for individuals who are not current shareholders of the Fund.
You may obtain a description of the Fund’s proxy voting policies and procedures, and information regarding how the Fund voted proxies relating to portfolio securities during the most recent 12-month period ended June 30, without charge. Simply visit AB’s website at www.abfunds.com, or go to the Securities and Exchange Commission’s (the “Commission”) website at www.sec.gov, or call AB at (800) 227 4618.
The Fund files its complete schedule of portfolio holdings with the Commission for the first and third quarters of each fiscal year as an exhibit to its reports on Form N-PORT. The Fund’s Form N-PORT reports are available on the Commission’s website at www.sec.gov. AB publishes full portfolio holdings for the Fund daily at www.abfunds.com.
Foreside Fund Services, LLC (“Foreside”) is the distributor of the fund. Foreside is a member of FINRA.
The [A/B] logo and AllianceBernstein® are registered trademarks used by permission of the owner, AllianceBernstein L.P.
PORTFOLIO OF INVESTMENTS
November 30, 2024
| | | | | | | | |
| | | Principal
Amount
(000) | | | U.S. $ Value | |
| |
MUNICIPAL OBLIGATIONS – 98.5% | | | | | | | | |
Long-Term Municipal Bonds – 97.5% | | | | | | | | |
Alabama – 1.8% | | | | | | | | |
Black Belt Energy Gas District
(BP PLC)
Series 2024-D
5.00%, 03/01/2055(a) | | $ | 150 | | | $ | 163,218 | |
County of Jefferson AL Sewer Revenue
Series 2024
5.50%, 10/01/2053 | | | 100 | | | | 110,293 | |
Mobile County Industrial Development Authority
(ArcelorMittal SA)
Series 2024
5.00%, 06/01/2054 | | | 100 | | | | 101,782 | |
Southeast Energy Authority A Cooperative District
(Deutsche Bank AG)
Series 2024-A
5.00%, 11/01/2035 | | | 150 | | | | 157,765 | |
| | | | | | | | |
| | | | | | | 533,058 | |
| | | | | | | | |
Arizona – 10.6% | | | | | | | | |
Arizona Industrial Development Authority
(Pinecrest Academy of Nevada)
Series 2020-A
4.00%, 07/15/2040(b) | | | 125 | | | | 115,636 | |
Chandler Industrial Development Authority
(Intel Corp.)
Series 2022
5.00%, 09/01/2042 | | | 300 | | | | 308,136 | |
Maricopa County Industrial Development Authority
(HonorHealth Obligated Group)
Series 2019-A
4.125%, 09/01/2042 | | | 500 | | | | 501,454 | |
Salt River Project Agricultural Improvement & Power District
Series 2023-A
5.00%, 01/01/2050 | | | 1,000 | | | | 1,091,049 | |
Salt Verde Financial Corp.
(Citigroup, Inc.)
Series 2007
5.00%, 12/01/2037 | | | 1,000 | | | | 1,105,678 | |
| | | | | | | | |
| | | | | | | 3,121,953 | |
| | | | | | | | |
California – 4.2% | | | | | | | | |
California Community Choice Financing Authority
(Apollo Global Management, Inc.)
Series 2024
5.00%, 11/01/2055 | | | 100 | | | | 108,100 | |
| | |
| |
| abfunds.com | | AB TAX-AWARE LONG MUNICIPAL ETF | 1 |
PORTFOLIO OF INVESTMENTS (continued)
| | | | | | | | |
| | | Principal
Amount
(000) | | | U.S. $ Value | |
| |
California Community Housing Agency
(California Community Housing Agency Brio Apartments & Next on Lex Apartments)
Series 2021
4.00%, 02/01/2056(b) | | $ | 100 | | | $ | 84,662 | |
CMFA Special Finance Agency VII
(CMFA Special Finance Agency VII The Breakwater Apartments)
Series 2021
3.00%, 08/01/2056(b) | | | 100 | | | | 71,413 | |
Golden State Tobacco Securitization Corp.
Series 2021-B
Zero Coupon, 06/01/2066 | | | 415 | | | | 46,404 | |
Series 2022
5.00%, 06/01/2051 | | | 360 | | | | 379,518 | |
San Francisco Intl Airport
Series 2024
5.25%, 05/01/2044 | | | 500 | | | | 549,787 | |
| | | | | | | | |
| | | | | | | 1,239,884 | |
| | | | | | | | |
Colorado – 0.3% | | | | | | | | |
Colorado Educational & Cultural Facilities Authority
(Ascent Classical Academy Charter Schools, Inc.)
Series 2024
5.80%, 04/01/2054(b) | | | 100 | | | | 104,735 | |
| | | | | | | | |
| | |
District of Columbia – 5.5% | | | | | | | | |
District of Columbia
(District of Columbia Union Market TIF Area)
Series 2024-A
5.125%, 06/01/2034(b) | | | 100 | | | | 101,931 | |
Metropolitan Washington Airports Authority Aviation Revenue
Series 2023-A
5.25%, 10/01/2040 | | | 1,000 | | | | 1,097,730 | |
Washington Metropolitan Area Transit Authority
(Washington Metropolitan Area Transit Authority State Lease)
Series 2020-A
5.00%, 07/15/2045 | | | 400 | | | | 426,086 | |
| | | | | | | | |
| | | | | | | 1,625,747 | |
| | | | | | | | |
Florida – 1.4% | | | | | | | | |
Capital Projects Finance Authority/FL
(Navigator Academy of Leadership Inc Obligated Group)
Series 2024
5.00%, 06/15/2034(b) | | | 100 | | | | 102,840 | |
| | |
| |
2 | AB TAX-AWARE LONG MUNICIPAL ETF | | abfunds.com |
PORTFOLIO OF INVESTMENTS (continued)
| | | | | | | | |
| | | Principal
Amount
(000) | | | U.S. $ Value | |
| |
City of Venice FL
(Southwest Florida Retirement Center, Inc. Obligated Group)
Series 2024
5.625%, 01/01/2060(a)(b) | | $ | 100 | | | $ | 103,339 | |
Florida Development Finance Corp.
(Brightline Trains Florida LLC)
AGM Series 2024
5.25%, 07/01/2053 | | | 100 | | | | 105,108 | |
Florida Development Finance Corp.
(SFP – Tampa I LLC)
Series 2024
5.25%, 06/01/2059(b) | | | 100 | | | | 101,485 | |
| | | | | | | | |
| | | | | | | 412,772 | |
| | | | | | | | |
Georgia – 7.7% | | | | | | | | |
Fayette County Development Authority
(United States Soccer Federation, Inc.)
Series 2024
5.00%, 10/01/2044 | | | 100 | | | | 107,375 | |
5.25%, 10/01/2054 | | | 100 | | | | 107,796 | |
Main Street Natural Gas, Inc.
(Macquarie Group Ltd.)
Series 2019-A
5.00%, 05/15/2043 | | | 1,000 | | | | 1,038,235 | |
Municipal Electric Authority of Georgia
Series 2019
5.00%, 01/01/2063 | | | 1,000 | | | | 1,021,971 | |
| | | | | | | | |
| | | | | | | 2,275,377 | |
| | | | | | | | |
Illinois – 5.3% | | | | | | | | |
Chicago Board of Education
Series 2023-A
5.00%, 12/01/2034 | | | 150 | | | | 157,738 | |
6.00%, 12/01/2049 | | | 140 | | | | 152,298 | |
Illinois Finance Authority
(Southern Illinois Healthcare Obligated Group)
Series 2017
5.00%, 03/01/2047 | | | 400 | | | | 404,228 | |
Metropolitan Pier & Exposition Authority
Series 2017
0.00%, 12/15/2042(c) | | | 350 | | | | 260,177 | |
Series 2020
5.00%, 06/15/2050 | | | 310 | | | | 321,250 | |
State of Illinois
Series 2023-B
5.50%, 05/01/2047 | | | 250 | | | | 272,543 | |
| | | | | | | | |
| | | | | | | 1,568,234 | |
| | | | | | | | |
| | |
| |
| abfunds.com | | AB TAX-AWARE LONG MUNICIPAL ETF | 3 |
PORTFOLIO OF INVESTMENTS (continued)
| | | | | | | | |
| | | Principal
Amount
(000) | | | U.S. $ Value | |
| |
Indiana – 2.4% | | | | | | | | |
City of Valparaiso IN
(Pratt Paper IN LLC)
Series 2024
4.875%, 01/01/2044(b) | | $ | 100 | | | $ | 103,092 | |
Indiana Finance Authority
(Parkview Health System Obligated Group)
Series 2024-A
5.00%, 11/01/2054(b) | | | 100 | | | | 107,439 | |
Indiana Finance Authority
(University of Evansville)
Series 2022
5.25%, 09/01/2057 | | | 100 | | | | 101,537 | |
Indianapolis Local Public Improvement Bond Bank
(Pan Am Plaza Hotel)
Series 2023
6.00%, 03/01/2053 | | | 150 | | | | 163,201 | |
Series 2023-F
7.75%, 03/01/2067 | | | 100 | | | | 114,525 | |
BAM Series 2023
5.25%, 03/01/2067 | | | 100 | | | | 108,118 | |
| | | | | | | | |
| | | | | | | 697,912 | |
| | | | | | | | |
Kentucky – 0.7% | | | | | | | | |
Kentucky Public Energy Authority
(BP PLC)
Series 2024-B
5.00%, 01/01/2055 | | | 200 | | | | 215,139 | |
| | | | | | | | |
| | |
Louisiana – 0.4% | | | | | | | | |
New Orleans Aviation Board
Series 2024
5.25%, 01/01/2045 | | | 100 | | | | 107,851 | |
| | | | | | | | |
| | |
Maryland – 1.9% | | | | | | | | |
Maryland Economic Development Corp.
(Purple Line Transit Partners LLC)
Series 2022
5.25%, 06/30/2047 | | | 370 | | | | 390,719 | |
Maryland Stadium Authority
(Baltimore City Public School Construction Financing Fund)
Series 2020
5.00%, 05/01/2050 | | | 150 | | | | 172,647 | |
| | | | | | | | |
| | | | | | | 563,366 | |
| | | | | | | | |
| | |
| |
4 | AB TAX-AWARE LONG MUNICIPAL ETF | | abfunds.com |
PORTFOLIO OF INVESTMENTS (continued)
| | | | | | | | |
| | | Principal
Amount
(000) | | | U.S. $ Value | |
| |
Nevada – 0.3% | | | | | | | | |
State of Nevada Department of Business & Industry
(DesertXpress Enterprises LLC)
Series 2024
8.125%, 01/01/2050 | | $ | 100 | | | $ | 103,047 | |
| | | | | | | | |
| | |
New Hampshire – 3.5% | | | | | | | | |
New Hampshire Business Finance Authority
(University of Nevada Reno)
BAM Series 2023
4.50%, 06/01/2053 | | | 1,000 | | | | 1,020,315 | |
| | | | | | | | |
| | |
New Jersey – 2.1% | | | | | | | | |
New Jersey Transportation Trust Fund Authority
(State of New Jersey Lease)
Series 2023-B
5.25%, 06/15/2050 | | | 575 | | | | 634,512 | |
| | | | | | | | |
| | |
New York – 7.3% | | | | | | | | |
Metropolitan Transportation Authority
Series 2017
Zero Coupon, 11/15/2033 | | | 575 | | | | 412,023 | |
New York City Transitional Finance Authority
(New York City Transitional Finance Authority Future Tax Secured Revenue)
Series 2024-D
5.25%, 05/01/2045 | | | 200 | | | | 227,829 | |
New York State Urban Development Corp.
(State of New York Sales Tax Revenue)
Series 2023-A
5.00%, 03/15/2051 | | | 1,000 | | | | 1,085,705 | |
New York Transportation Development Corp.
(JFK NTO LLC)
Series 2023
5.375%, 06/30/2060 | | | 100 | | | | 104,584 | |
AGM Series 2024
5.00%, 06/30/2049 | | | 200 | | | | 209,293 | |
Suffolk Regional Off-Track Betting Co.
Series 2024
6.00%, 12/01/2053 | | | 100 | | | | 104,929 | |
| | | | | | | | |
| | | | | | | 2,144,363 | |
| | | | | | | | |
North Carolina – 3.9% | | | | | | | | |
Greater Asheville Regional Airport Authority
AGM Series 2023
5.00%, 07/01/2036 | | | 1,000 | | | | 1,082,177 | |
| | |
| |
| abfunds.com | | AB TAX-AWARE LONG MUNICIPAL ETF | 5 |
PORTFOLIO OF INVESTMENTS (continued)
| | | | | | | | |
| | | Principal
Amount
(000) | | | U.S. $ Value | |
| |
North Carolina Turnpike Authority
AGM Series 2024
Zero Coupon, 01/01/2052 | | $ | 250 | | | $ | 68,920 | |
| | | | | | | | |
| | | | | | | 1,151,097 | |
| | | | | | | | |
Ohio – 4.3% | | | | | | | | |
Buckeye Tobacco Settlement Financing Authority
Series 2020-B
5.00%, 06/01/2055 | | | 100 | | | | 91,558 | |
Port of Greater Cincinnati Development Authority
(Duke Energy Convention Center Project)
Series 2024
5.00%, 12/01/2053 | | | 100 | | | | 106,704 | |
State of Ohio
(University Hospitals Health System, Inc. Obligated Group)
Series 2016
4.00%, 01/15/2046 | | | 1,100 | | | | 1,070,014 | |
| | | | | | | | |
| | | | | | | 1,268,276 | |
| | | | | | | | |
Oregon – 1.6% | | | | | | | | |
Port of Portland OR Airport Revenue
Series 2022-2
4.00%, 07/01/2047 | | | 500 | | | | 488,828 | |
| | | | | | | | |
| | |
Pennsylvania – 8.4% | | | | | | | | |
Pennsylvania Economic Development Financing Authority
(Commonwealth of Pennsylvania Department of Transportation)
Series 2022
5.50%, 06/30/2039 | | | 300 | | | | 329,732 | |
Pennsylvania State University (The)
Series 2023
5.25%, 09/01/2053 | | | 1,000 | | | | 1,103,221 | |
Pittsburgh Water & Sewer Authority
AGM Series 2019-A
5.00%, 09/01/2044 | | | 1,000 | | | | 1,059,198 | |
| | | | | | | | |
| | | | | | | 2,492,151 | |
| | | | | | | | |
Puerto Rico – 0.4% | | | | | | | | |
Commonwealth of Puerto Rico
Series 2022-C
Zero Coupon, 11/01/2043 | | | 166 | | | | 102,329 | |
Puerto Rico Sales Tax Financing Corp. Sales Tax Revenue
Series 2018-A
Zero Coupon, 07/01/2051 | | | 100 | | | | 24,703 | |
| | | | | | | | |
| | | | | | | 127,032 | |
| | | | | | | | |
| | |
| |
6 | AB TAX-AWARE LONG MUNICIPAL ETF | | abfunds.com |
PORTFOLIO OF INVESTMENTS (continued)
| | | | | | | | |
| | | Principal
Amount
(000) | | | U.S. $ Value | |
| |
South Carolina – 5.5% | | | | | | | | |
South Carolina Jobs-Economic Development Authority
(Bon Secours Mercy Health, Inc.)
Series 2020
5.00%, 12/01/2046 | | $ | 1,000 | | | $ | 1,056,614 | |
South Carolina Jobs-Economic Development Authority
(Novant Health Obligated Group)
Series 2024
5.50%, 11/01/2054 | | | 500 | | | | 559,102 | |
| | | | | | | | |
| | | | | | | 1,615,716 | |
| | | | | | | | |
Tennessee – 2.2% | | | | | | | | |
Bristol Industrial Development Board
(Bristol Industrial Development Board Sales Tax)
Series 2016-A
5.125%, 12/01/2042(b) | | | 280 | | | | 274,361 | |
Series 2016-B
Zero Coupon, 12/01/2031(b) | | | 100 | | | | 69,348 | |
Metropolitan Government of Nashville & Davidson County TN
Series 2024-C
4.00%, 01/01/2044 | | | 200 | | | | 202,239 | |
Shelby County Health & Educational Facilities Board
(Madrone Memphis Student Housing I LLC)
Series 2024
5.25%, 06/01/2056(b) | | | 100 | | | | 102,472 | |
| | | | | | | | |
| | | | | | | 648,420 | |
| | | | | | | | |
Texas – 10.7% | | | | | | | | |
City of Georgetown TX Utility System Revenue
BAM Series 2024
5.00%, 08/15/2044 | | | 200 | | | | 218,236 | |
City of Houston TX Airport System Revenue
(United Airlines, Inc.)
Series 2024-B
5.50%, 07/15/2038(a) | | | 100 | | | | 108,153 | |
Port of Beaumont Navigation District
(Jefferson 2020 Bond Lessee & Borrower LLC Obligated Group)
Series 2024
5.25%, 01/01/2054(b) | | | 100 | | | | 103,909 | |
Sherman Independent School District/TX
Series 2023-B
5.00%, 02/15/2053 | | | 1,000 | | | | 1,078,493 | |
| | |
| |
| abfunds.com | | AB TAX-AWARE LONG MUNICIPAL ETF | 7 |
PORTFOLIO OF INVESTMENTS (continued)
| | | | | | | | |
| | | Principal
Amount
(000) | | | U.S. $ Value | |
| |
Texas Municipal Gas Acquisition & Supply Corp. IV
(BP PLC)
Series 2023-B
5.50%, 01/01/2054 | | $ | 500 | | | $ | 562,834 | |
Texas Water Development Board
(State Water Implementation Revenue Fund for Texas)
Series 2023-A
5.00%, 10/15/2058 | | | 1,000 | | | | 1,084,899 | |
| | | | | | | | |
| | | | | | | 3,156,524 | |
| | | | | | | | |
Utah – 0.4% | | | | | | | | |
Utah Infrastructure Agency
Series 2024
5.50%, 10/15/2044 | | | 100 | | | | 109,202 | |
| | | | | | | | |
| | |
Virginia – 3.8% | | | | | | | | |
Fairfax County Industrial Development Authority
(Inova Health System Obligated Group)
Series 2022
4.00%, 05/15/2042 | | | 1,000 | | | | 1,010,830 | |
James City County Economic Development Authority
(Williamsburg Landing, Inc. Obligated Group)
Series 2024-A
6.875%, 12/01/2058 | | | 100 | | | | 111,268 | |
| | | | | | | | |
| | | | | | | 1,122,098 | |
| | | | | | | | |
Wisconsin – 0.9% | | | | | | | | |
Wisconsin Health & Educational Facilities Authority
(Forensic Science & Protective Medicine Collaboration, Inc.)
Series 2024
5.00%, 08/01/2027(b) | | | 150 | | | | 153,215 | |
Wisconsin Public Finance Authority
(Puerto Rico Tollroads LLC)
Series 2024
5.50%, 07/01/2044 | | | 100 | | | | 106,890 | |
| | | | | | | | |
| | | | | | | 260,105 | |
| | | | | | | | |
Total Long-Term Municipal Bonds
(cost $28,216,718) | | | | | | | 28,807,714 | |
| | | | | | | | |
| | |
| |
8 | AB TAX-AWARE LONG MUNICIPAL ETF | | abfunds.com |
PORTFOLIO OF INVESTMENTS (continued)
| | | | | | | | |
| | | Principal
Amount
(000) | | | U.S. $ Value | |
| |
Short-Term Municipal Notes – 1.0% | | | | | | | | |
Massachusetts – 1.0% | | | | | | | | |
Massachusetts Development Finance Agency (Trustees of Boston University)
Series 2018-U
3.10%, 10/01/2042(d)
(cost $300,000) | | $ | 300 | | | $ | 300,000 | |
| | | | | | | | |
| | |
Total Municipal Obligations
(cost $28,516,718) | | | | | | | 29,107,714 | |
| | | | | | | | |
| | |
| | | Shares | | | | |
SHORT-TERM INVESTMENTS – 0.9% | | | | | | | | |
Investment Companies – 0.9% | | | | | | | | |
AB Fixed Income Shares, Inc. – Government Money Market Portfolio – Class AB, 4.54%(e)(f)(g)
(cost $256,051) | | | 256,051 | | | | 256,051 | |
| | | | | | | | |
| | |
Total Investments – 99.4%
(cost $28,772,769) | | | | | | | 29,363,765 | |
Other assets less liabilities – 0.6% | | | | | | | 162,997 | |
| | | | | | | | |
| | |
Net Assets – 100.0% | | | | | | $ | 29,526,762 | |
| | | | | | | | |
CENTRALLY CLEARED CREDIT DEFAULT SWAPS (see Note D)
| | | | | | | | | | | | | | | | | | | | | | | | | | | | |
| Description | | Fixed
Rate
(Pay)
Receive | | | Payment
Frequency | | | Implied
Credit
Spread at
November 30,
2024 | | | Notional
Amount
(000) | | | Market
Value | | | Upfront
Premiums
Paid (Received) | | | Unrealized
Appreciation
(Depreciation) | |
Sale Contracts | | | | | | | | | | | | | | | | | | | | | | | | | |
CDX-NAHY Series 43, 5 Year Index, 12/20/2029* | | | 5.00 | % | | | Quarterly | | | | 2.95 | % | | | USD 720 | | | $ | 68,803 | | | $ | 49,526 | | | $ | 19,277 | |
CENTRALLY CLEARED INFLATION (CPI) SWAPS (see Note D)
| | | | | | | | | | | | | | | | | | | | | | | | | | |
| | | | | | | | | Rate Type | | | | | | | | | | | |
Notional
Amount
(000) | | | Termination
Date | | | Payments
made
by the
Fund | | Payments
received
by the
Fund | | Payment
Frequency
Paid/
Received | | Market
Value | | | Upfront
Premiums
Paid
(Received) | | | Unrealized
Appreciation
(Depreciation) | |
| USD | | | 1,270 | | | | 10/15/2028 | | | CPI# | | 2.565% | | Maturity | | $ | 5,706 | | | $ | – 0 | – | | $ | 5,706 | |
| USD | | | 867 | | | | 10/15/2029 | | | 2.499% | | CPI# | | Maturity | | | (2,354 | ) | | | – 0 | – | | | (2,354 | ) |
| USD | | | 867 | | | | 10/15/2029 | | | 2.516% | | CPI# | | Maturity | | | (3,033 | ) | | | – 0 | – | | | (3,033 | ) |
| | |
| |
| abfunds.com | | AB TAX-AWARE LONG MUNICIPAL ETF | 9 |
PORTFOLIO OF INVESTMENTS (continued)
| | | | | | | | | | | | | | | | | | | | | | | | | | | | | | |
| | | | | | | | | Rate Type | | | | | | | | | | | | |
Notional
Amount
(000) | | | Termination
Date | | | Payments
made
by the
Fund | | | Payments
received
by the
Fund | | | Payment
Frequency
Paid/
Received | | Market
Value | | | Upfront
Premiums
Paid
(Received) | | | Unrealized
Appreciation
(Depreciation) | |
| USD | | | 866 | | | | 10/15/2029 | | | | 2.451% | | | | CPI# | | | Maturity | | $ | (449 | ) | | $ | – 0 | – | | $ | (449 | ) |
| USD | | | 1,330 | | | | 10/15/2030 | | | | CPI# | | | | 2.531% | | | Maturity | | | 7,067 | | | | – 0 | – | | | 7,067 | |
| | | | | | | | | | | | | | | | | | | | | | | | | | | | | | |
| | | | | | | | | | | | | | | | | | | | $ | 6,937 | | | $ | – 0 | – | | $ | 6,937 | |
| | | | | | | | | | | | | | | | | | | | | | | | | | | | | | |
| # | Variable interest rate based on the rate of inflation as determined by the Consumer Price Index (CPI). |
CENTRALLY CLEARED INTEREST RATE SWAPS (see Note D)
| | | | | | | | | | | | | | | | | | | | | | | | | | |
| | | | | | | | | Rate Type | | | | | | | | | | | |
Notional
Amount
(000) | | | Termination
Date | | | Payments
made
by the
Fund | | Payments
received
by the
Fund | | Payment
Frequency
Paid/
Received | | Market
Value | | | Upfront
Premiums
Paid
(Received) | | | Unrealized
Appreciation
(Depreciation) | |
| USD | | | 100 | | | | 10/15/2029 | | | 1 Day SOFR | | 3.740% | | Annual | | $ | (84 | ) | | $ | – 0 | – | | $ | (84 | ) |
| USD | | | 100 | | | | 10/15/2029 | | | 1 Day SOFR | | 3.761% | | Annual | | | 8 | | | | – 0 | – | | | 8 | |
| USD | | | 100 | | | | 10/15/2029 | | | 1 Day SOFR | | 3.814% | | Annual | | | 259 | | | | – 0 | – | | | 259 | |
| USD | | | 400 | | | | 06/15/2034 | | | 3.543% | | 1 Day SOFR | | Annual | | | 6,917 | | | | 49 | | | | 6,868 | |
| USD | | | 600 | | | | 08/15/2034 | | | 3.304% | | 1 Day SOFR | | Annual | | | 22,288 | | | | – 0 | – | | | 22,288 | |
| USD | | | 390 | | | | 08/15/2034 | | | 3.907% | | 1 Day SOFR | | Annual | | | (6,467 | ) | | | – 0 | – | | | (6,467 | ) |
| USD | | | 339 | | | | 08/15/2034 | | | 3.844% | | 1 Day SOFR | | Annual | | | (3,916 | ) | | | – 0 | – | | | (3,916 | ) |
| USD | | | 300 | | | | 08/15/2034 | | | 3.231% | | 1 Day SOFR | | Annual | | | 12,505 | | | | – 0 | – | | | 12,505 | |
| USD | | | 240 | | | | 08/15/2034 | | | 3.450% | | 1 Day SOFR | | Annual | | | 5,977 | | | | – 0 | – | | | 5,977 | |
| USD | | | 210 | | | | 08/15/2034 | | | 3.183% | | 1 Day SOFR | | Annual | | | 9,484 | | | | – 0 | – | | | 9,484 | |
| USD | | | 131 | | | | 08/15/2034 | | | 3.856% | | 1 Day SOFR | | Annual | | | (1,641 | ) | | | – 0 | – | | | (1,641 | ) |
| USD | | | 1,700 | | | | 01/13/2045 | | | 1 Day SOFR | | 4.057% | | Annual | | | 68,278 | | | | – 0 | – | | | 68,278 | |
| USD | | | 330 | | | | 01/13/2045 | | | 1 Day SOFR | | 3.794% | | Annual | | | 2,771 | | | | – 0 | – | | | 2,771 | |
| USD | | | 200 | | | | 12/09/2053 | | | 3.381% | | 1 Day SOFR | | Annual | | | 10,721 | | | | – 0 | – | | | 10,721 | |
| | | | | | | | | | | | | | | | | | | | | | | | | | |
| | | | | | | | | | | | | | | | $ | 127,100 | | | $ | 49 | | | $ | 127,051 | |
| | | | | | | | | | | | | | | | | | | | | | | | | | |
| (a) | When-Issued or delayed delivery security. |
| (b) | Security is exempt from registration under Rule 144A or Regulation S of the Securities Act of 1933. These securities are considered restricted, but liquid and may be resold in transactions exempt from registration. At November 30, 2024, the aggregate market value of these securities amounted to $1,699,877 or 5.8% of net assets. |
| (c) | Coupon rate adjusts periodically based upon a predetermined schedule. Stated interest rate in effect at November 30, 2024. |
| (d) | Variable Rate Demand Notes are instruments whose interest rates change on a specific date (such as coupon date or interest payment date) or whose interest rates vary with changes in a designated base rate (such as the prime interest rate). This instrument is payable on demand and is secured by letters of credit or other credit support agreements from major banks. |
| (e) | Affiliated investments. |
| (f) | The rate shown represents the 7-day yield as of period end. |
| (g) | To obtain a copy of the fund’s shareholder report, please go to the Securities and Exchange Commission’s website at www.sec.gov, or call AB at (800) 227-4618. |
As of November 30, 2024, the Fund’s percentages of investments in municipal bonds that are insured and in insured municipal bonds that have been pre-refunded or escrowed to maturity are 13.3% and 0.0%, respectively.
| | |
| |
10 | AB TAX-AWARE LONG MUNICIPAL ETF | | abfunds.com |
PORTFOLIO OF INVESTMENTS (continued)
Glossary:
AGM – Assured Guaranty Municipal
BAM – Build American Mutual
CDX-NAHY – North American High Yield Credit Default Swap Index
SOFR – Secured Overnight Financing Rate
See notes to financial statements.
| | |
| |
| abfunds.com | | AB TAX-AWARE LONG MUNICIPAL ETF | 11 |
STATEMENT OF ASSETS & LIABILITIES
November 30, 2024
| | | | |
| Assets | | | | |
Investments in securities, at value | | | | |
Unaffiliated issuers (cost $28,516,718) | | $ | 29,107,714 | |
Affiliated issuers (cost $256,051) | | | 256,051 | |
Cash | | | 19 | |
Cash collateral due from broker | | | 131,796 | |
Interest receivable | | | 399,587 | |
Receivable for variation margin on centrally cleared swaps | | | 3,815 | |
Affiliated dividends receivable | | | 1,894 | |
Receivable due from Adviser | | | 85 | |
| | | | |
Total assets | | | 29,900,961 | |
| | | | |
| Liabilities | | | | |
Payable for investment securities purchased | | | 367,513 | |
Advisory fee payable | | | 6,686 | |
| | | | |
Total liabilities | | | 374,199 | |
| | | | |
Net Assets | | $ | 29,526,762 | |
| | | | |
| Composition of Net Assets | | | | |
Capital stock, at par | | $ | 115 | |
Additional paid-in capital | | | 28,807,995 | |
Distributable earnings | | | 718,652 | |
| | | | |
Net Assets | | $ | 29,526,762 | |
| | | | |
Net Asset Value Per Share—500 million shares of capital stock authorized, $.0001 par value (based on 1,150,040 common shares outstanding) | | $ | 25.67 | |
| | | | |
See notes to financial statements.
| | |
| |
12 | AB TAX-AWARE LONG MUNICIPAL ETF | | abfunds.com |
STATEMENT OF OPERATIONS
For the Period from December 13, 2023(a) to November 30, 2024
| | | | | | | | |
| Investment Income | | | | | | | | |
Interest | | $ | 1,115,264 | | | | | |
Dividends—Affiliated issuers | | | 10,150 | | | $ | 1,125,414 | |
| | | | | | | | |
| Expenses | | | | | | | | |
Advisory fee (see Note B) | | | 75,394 | | | | | |
| | | | | | | | |
Total expenses | | | 75,394 | | | | | |
Less: expenses waived and reimbursed by the Adviser (see Note B) | | | (343 | ) | | | | |
| | | | | | | | |
Net expenses | | | | | | | 75,051 | |
| | | | | | | | |
Net investment income | | | | | | | 1,050,363 | |
| | | | | | | | |
| Realized and Unrealized Gain (Loss) on Investment Transactions | | | | | | | | |
Net realized gain (loss) on: | | | | | | | | |
Investment transactions | | | | | | | 4,775 | |
Swaps | | | | | | | (140,950 | ) |
Net change in unrealized appreciation (depreciation) of: | | | | | | | | |
Investments | | | | | | | 590,996 | |
Swaps | | | | | | | 153,265 | |
| | | | | | | | |
Net gain on investment transactions | | | | | | | 608,086 | |
| | | | | | | | |
Contributions from Affiliates (see Note B) | | | | | | | 1,147 | |
| | | | | | | | |
Net Increase in Net Assets from Operations | | | | | | $ | 1,659,596 | |
| | | | | | | | |
| (a) | Commencement of operations. |
See notes to financial statements.
| | |
| |
| abfunds.com | | AB TAX-AWARE LONG MUNICIPAL ETF | 13 |
STATEMENT OF CHANGES IN NET ASSETS
| | | | |
| | | December 13,
2023(a) to
November 30,
2024 | |
| Increase (Decrease) in Net Assets from Operations | | | | |
Net investment income | | $ | 1,050,363 | |
Net realized loss on investment transactions | | | (136,175 | ) |
Net change in unrealized appreciation (depreciation) of investments | | | 744,261 | |
Contributions from Affiliates (see Note B) | | | 1,147 | |
| | | | |
Net increase in net assets from operations | | | 1,659,596 | |
Distribution to Shareholders | | | (940,944 | ) |
| Transactions in Shares of the Fund | | | | |
Net increase | | | 28,803,830 | |
Other capital | | | 4,280 | |
| | | | |
Total increase | | | 29,526,762 | |
| Net Assets | | | | |
Beginning of period | | | – 0 | – |
| | | | |
End of period | | $ | 29,526,762 | |
| | | | |
| (a) | Commencement of operations. |
See notes to financial statements.
| | |
| |
14 | AB TAX-AWARE LONG MUNICIPAL ETF | | abfunds.com |
NOTES TO FINANCIAL STATEMENTS
November 30, 2024
NOTE A
Significant Accounting Policies
AB Active ETFs, Inc. (the “Corporation”) is registered under the Investment Company Act of 1940 (the “1940 Act”) as an open-end management investment company. The Corporation, which is a Maryland corporation, operates as a series company comprised of 15 funds currently in operation. Each fund is considered to be a separate entity for financial reporting and tax purposes. This report relates only to the AB Tax-Aware Long Municipal ETF (the “Fund”), a diversified portfolio. The Fund commenced investment operations on December 13, 2023. The financial statements have been prepared in conformity with U.S. generally accepted accounting principles (“U.S. GAAP”), which require management to make certain estimates and assumptions that affect the reported amounts of assets and liabilities in the financial statements and amounts of income and expenses during the reporting period. Actual results could differ from those estimates. The Fund is an investment company under U.S. GAAP and follows the accounting and reporting guidance applicable to investment companies. The following is a summary of significant accounting policies followed by the Fund.
1. Security Valuation
Portfolio securities are valued at market value determined on the basis of market quotations or, if market quotations are not readily available or are unreliable, at “fair value” as determined in accordance with procedures approved by and under the oversight of the Fund’s Board of Directors (the “Board”). Pursuant to these procedures, AllianceBernstein L.P. (the “Adviser”) serves as the Fund’s valuation designee pursuant to Rule 2a-5 of the 1940 Act. In this capacity, the Adviser is responsible, among other things, for making all fair value determinations relating to the Fund’s portfolio investments, subject to the Board’s oversight.
In general, the market values of securities which are readily available and deemed reliable are determined as follows: securities listed on a national securities exchange (other than securities listed on the NASDAQ Stock Market, Inc. (“NASDAQ”)) or on a foreign securities exchange are valued at the last sale price at the close of the exchange or foreign securities exchange. If there has been no sale on such day, the securities are valued at the last traded price from the previous day. Securities listed on more than one exchange are valued by reference to the principal exchange on which the securities are traded; securities listed only on NASDAQ are valued in accordance with the NASDAQ Official Closing Price; listed or over the counter (“OTC”) market put or call options are valued at the mid level between the current bid and ask prices. If either a current bid or current ask price is unavailable, the Adviser will have discretion to determine the
| | |
| |
| abfunds.com | | AB TAX-AWARE LONG MUNICIPAL ETF | 15 |
NOTES TO FINANCIAL STATEMENTS (continued)
best valuation (e.g., last trade price in the case of listed options); open futures are valued using the closing settlement price or, in the absence of such a price, the most recent quoted bid price. If there are no quotations available for the day of valuation, the last available closing settlement price is used; U.S. Government securities and any other debt instruments having 60 days or less remaining until maturity are generally valued at fair value by an independent pricing service. If an independent fair value is not available, the securities are valued at amortized cost. This methodology is commonly used for short term securities that have an original maturity of 60 days or less, as well as short term securities that had an original term to maturity that exceeded 60 days. In instances when amortized cost is utilized, the Valuation Committee (the “Committee”) must reasonably conclude that the utilization of amortized cost is approximately the same as the fair value of the security. Factors the Committee will consider include, but are not limited to, an impairment of the creditworthiness of the issuer or material changes in interest rates. Fixed-income securities, including mortgage-backed and asset-backed securities, may be valued on the basis of prices provided by a pricing service or at a price obtained from one or more of the major broker-dealers. In cases where broker-dealer quotes are obtained, the Adviser may establish procedures whereby changes in market yields or spreads are used to adjust, on a daily basis, a recently obtained quoted price on a security. Swaps and other derivatives are valued daily, primarily using independent pricing services, independent pricing models using market inputs, as well as third party broker-dealers or counterparties. Open-end mutual funds are valued at the closing net asset value (“NAV”) per share, while exchange-traded funds are valued at the closing market price per share.
Securities for which market quotations are not readily available (including restricted securities) or are deemed unreliable are valued at fair value as deemed appropriate by the Adviser. Factors considered in making this determination may include, but are not limited to, information obtained by contacting the issuer, analysts, analysis of the issuer’s financial statements or other available documents. In addition, the Fund may use fair value pricing for securities primarily traded in non-U.S. markets because most foreign markets close well before the Fund values its securities at 4:00 p.m., Eastern Time. The earlier close of these foreign markets gives rise to the possibility that significant events may have occurred in the interim and may materially affect the value of those securities. To account for this, the Fund generally values many of its foreign equity securities using fair value prices at the discretion of the Adviser.
2. Fair Value Measurements
In accordance with U.S. GAAP regarding fair value measurements, fair value is defined as the price that the Fund would receive to sell an asset or
| | |
| |
16 | AB TAX-AWARE LONG MUNICIPAL ETF | | abfunds.com |
NOTES TO FINANCIAL STATEMENTS (continued)
pay to transfer a liability in an orderly transaction between market participants at the measurement date. U.S. GAAP establishes a framework for measuring fair value, and a three-level hierarchy for fair value measurements based upon the transparency of inputs to the valuation of an asset or liability (including those valued based on their market values as described in Note A.1 above). Inputs may be observable or unobservable and refer broadly to the assumptions that market participants would use in pricing the asset or liability. Observable inputs reflect the assumptions market participants would use in pricing the asset or liability based on market data obtained from sources independent of the Fund. Unobservable inputs reflect the Fund’s own assumptions about the assumptions that market participants would use in pricing the asset or liability based on the best information available in the circumstances. Each investment is assigned a level based upon the observability of the inputs which are significant to the overall valuation. The three-tier hierarchy of inputs is summarized below.
| | • | | Level 1—quoted prices in active markets for identical investments |
| | • | | Level 2—other significant observable inputs (including quoted prices for similar investments, interest rates, prepayment speeds, credit risk, etc.) |
| | • | | Level 3—significant unobservable inputs (including the Fund’s own assumptions in determining the fair value of investments) |
The fair value of debt instruments, such as bonds, and over-the-counter derivatives is generally based on market price quotations, recently executed market transactions (where observable) or industry recognized modeling techniques and are generally classified as Level 2. Pricing vendor inputs to Level 2 valuations may include quoted prices for similar investments in active markets, interest rate curves, coupon rates, currency rates, yield curves, option adjusted spreads, default rates, credit spreads and other unique security features in order to estimate the relevant cash flows which are then discounted to calculate fair values. If these inputs are unobservable and significant to the fair value, these investments will be classified as Level 3.
Other fixed income investments, including non-U.S. government and corporate debt, are generally valued using quoted market prices, if available, which are typically impacted by current interest rates, maturity dates and any perceived credit risk of the issuer. Additionally, in the absence of quoted market prices, these inputs are used by pricing vendors to derive a valuation based upon industry or proprietary models which incorporate issuer specific data with relevant yield/spread comparisons with more widely quoted bonds with similar key characteristics. Those investments for which there are observable inputs are classified as Level 2. Where the inputs are not observable, the investments are classified as Level 3.
| | |
| |
| abfunds.com | | AB TAX-AWARE LONG MUNICIPAL ETF | 17 |
NOTES TO FINANCIAL STATEMENTS (continued)
The following table summarizes the valuation of the Fund’s investments by the above fair value hierarchy levels as of November 30, 2024:
| | | | | | | | | | | | | | | | |
Investments in
Securities: | | Level 1 | | | Level 2 | | | Level 3 | | | Total | |
Assets: | | | | | | | | | | | | | | | | |
Long-Term Municipal Bonds | | $ | – 0 | – | | $ | 28,807,714 | | | $ | – 0 | – | | $ | 28,807,714 | |
Short-Term Municipal Notes | | | – 0 | – | | | 300,000 | | | | – 0 | – | | | 300,000 | |
Investment Companies | | | 256,051 | | | | – 0 | – | | | – 0 | – | | | 256,051 | |
| | | | | | | | | | | | | | | | |
Total Investments in Securities | | | 256,051 | | | | 29,107,714 | | | | – 0 | – | | | 29,363,765 | |
Other Financial Instruments(a): | | | | | | | | | | | | | | | | |
Assets: | | | | | | | | | | | | | | | | |
Centrally Cleared Credit Default Swaps | | | – 0 | – | | | 68,803 | | | | – 0 | – | | | 68,803 | (b) |
Centrally Cleared Inflation (CPI) Swaps | | | – 0 | – | | | 12,773 | | | | – 0 | – | | | 12,773 | (b) |
Centrally Cleared Interest Rate Swaps | | | – 0 | – | | | 139,208 | | | | – 0 | – | | | 139,208 | (b) |
Liabilities: | | | | | | | | | | | | | | | | |
Centrally Cleared Inflation (CPI) Swaps | | | – 0 | – | | | (5,836 | ) | | | – 0 | – | | | (5,836 | )(b) |
Centrally Cleared Interest Rate Swaps | | | – 0 | – | | | (12,108 | ) | | | – 0 | – | | | (12,108 | )(b) |
| | | | | | | | | | | | | | | | |
Total | | $ | 256,051 | | | $ | 29,310,554 | | | $ | – 0 | – | | $ | 29,566,605 | |
| | | | | | | | | | | | | | | | |
| (a) | Other financial instruments include derivative instruments, such as futures, forwards and swaps. Derivative instruments are valued at the unrealized appreciation (depreciation) on the instrument. Other financial instruments may also include swaps with upfront premiums, written options and written swaptions which are valued at market value. |
| (b) | Only variation margin receivable (payable) at period end is reported within the statement of assets and liabilities. This amount reflects cumulative unrealized appreciation (depreciation) on futures and centrally cleared swaps as reported in the portfolio of investments. Where applicable, centrally cleared swaps with upfront premiums are presented here at market value. |
3. Currency Translation
Assets and liabilities denominated in foreign currencies and commitments under forward currency exchange contracts are translated into U.S. dollars at the mean of the quoted bid and ask prices of such currencies against the U.S. dollar. Purchases and sales of portfolio securities are translated into U.S. dollars at the rates of exchange prevailing when such securities were acquired or sold. Income and expenses are translated into U.S. dollars at rates of exchange prevailing when accrued.
Net realized gain or loss on foreign currency transactions represents foreign exchange gains and losses from sales and maturities of foreign fixed income investments, holding of foreign currencies, currency gains or losses realized between the trade and settlement dates on foreign investment transactions, and the difference between the amounts of dividends, interest and foreign withholding taxes recorded on the Fund’s books and
| | |
| |
18 | AB TAX-AWARE LONG MUNICIPAL ETF | | abfunds.com |
NOTES TO FINANCIAL STATEMENTS (continued)
the U.S. dollar equivalent amounts actually received or paid. Net unrealized currency gains and losses from valuing foreign currency denominated assets and liabilities at period end exchange rates are reflected as a component of net unrealized appreciation or depreciation of foreign currency denominated assets and liabilities.
4. Taxes
It is the Fund’s policy to meet the requirements of the Internal Revenue Code applicable to regulated investment companies and to distribute all of its investment company taxable income and net realized gains, if any, to shareholders. Therefore, no provisions for federal income or excise taxes are required. The Fund may be subject to taxes imposed by countries in which it invests. Such taxes are generally based on income and/or capital gains earned or repatriated. Taxes are accrued and applied to net investment income, net realized gains and net unrealized appreciation/depreciation as such income and/or gains are earned.
In accordance with U.S. GAAP requirements regarding accounting for uncertainties in income taxes, management has analyzed the Fund’s tax positions taken or expected to be taken on federal and state income tax returns for all open tax years (the current tax year) and has concluded that no provision for income tax is required in the Fund’s financial statements.
5. Investment Income and Investment Transactions
Dividend income is recorded on the ex-dividend date or as soon as the Fund is informed of the dividend. Interest income is accrued daily. Investment transactions are accounted for on the date the securities are purchased or sold. Investment gains or losses are determined on the identified cost basis. Non-cash dividends, if any, are recorded on the ex-dividend date at the fair value of the securities received. The Fund amortizes premiums and accretes discounts as adjustments to interest income.
The Fund accounts for distributions received from real estate investment trust (“REIT”) investments or from regulated investment companies as dividend income, realized gain, or return of capital based on information provided by the REIT or the investment company.
6. Dividends and Distributions
Dividends and distributions to shareholders, if any, are recorded on the ex-dividend date. Income dividends and capital gains distributions are determined in accordance with federal tax regulations and may differ from those determined in accordance with U.S. GAAP. To the extent these differences are permanent, such amounts are reclassified within the capital accounts based on their federal tax basis treatment; temporary differences do not require such reclassification.
| | |
| |
| abfunds.com | | AB TAX-AWARE LONG MUNICIPAL ETF | 19 |
NOTES TO FINANCIAL STATEMENTS (continued)
7. Offering Expenses
The Adviser has agreed to pay all of the Fund’s organization and offering costs. The Fund is not obligated to repay any such organizational expenses or offering costs paid by the Adviser.
8. Cash and Short-Term Investments
Cash and short-term investments include cash on hand and short-term investments with maturities of less than one year when purchased.
NOTE B
Advisory Fee and Other Transactions with Affiliates
Under the terms of the investment advisory agreement, the Fund pays the Adviser a unitary advisory fee at an annual rate of .28% of the Fund’s average daily net assets. The fees are accrued daily and paid monthly.
Under the investment advisory agreement, in accordance with the unitary fee structure, the Adviser bears the cost of various third-party services required by the Fund, including audit, custodial, accounting, legal, transfer agency and printing costs and the fees and expenses of the Corporation’s directors and their counsel. Also under the investment advisory agreement, the Adviser will reimburse the Fund for the Fund’s share of the acquired funds fees and expenses (advisory fees and other expenses) of any pooled investment vehicle for which the Adviser serves as investment adviser. For the period ended November 30, 2024, such waiver/reimbursements relating to the Fund’s investment in AB Government Money Market Portfolio amounted to $343.
A summary of the Fund’s transactions in AB mutual funds for the period ended November 30, 2024 is as follows:
| | | | | | | | | | | | | | | | | | | | |
Fund | | Market Value
11/30/23
(000) | | | Purchases
at Cost
(000) | | | Sales
Proceeds
(000) | | | Market Value
11/30/24
(000) | | | Dividend
Income
(000) | |
AB Government Money Market Portfolio | | $ | – 0 | – | | $ | 8,824 | | | $ | 8,568 | | | $ | 256 | | | $ | 10 | |
During the period ended November 30, 2024, the Adviser reimbursed the Fund $1,147 for trading losses incurred due to NAV error.
NOTE C
Distribution Plan
The Fund has adopted a Distribution and Service Plan pursuant to Rule 12b-1 of the Act which permits the Fund to pay distribution and servicing fees not to exceed .25% per year of the Fund’s average daily net assets. No such fees are currently paid, and the Board has not approved the commencement of payments under the Rule 12b-1 Distribution Plan.
| | |
| |
20 | AB TAX-AWARE LONG MUNICIPAL ETF | | abfunds.com |
NOTES TO FINANCIAL STATEMENTS (continued)
NOTE D
Investment Transactions
Purchases and sales of investment securities (excluding short-term investments and in-kind purchases and sales) for the period ended November 30, 2024 were as follows:
| | | | | | | | |
| | | Purchases | | | Sales | |
Investment securities (excluding U.S. government securities) | | $ | 30,515,247 | | | $ | 3,166,723 | |
U.S. government securities | | | – 0 | – | | | – 0 | – |
During the period ended November 30, 2024, the Fund delivered portfolio securities for the redemption of Fund shares (in-kind redemptions). Cash and portfolio securities were transferred for redemptions at fair value. For financial reporting purposes, the Fund recorded net realized gains and losses in connection with each in-kind redemption transaction. For the period ended November 30, 2024, the Fund had in-kind purchases and in-kind sales as follows:
| | | | | | | | |
| | | Purchases | | | Sales | |
In-kind transactions (excluding U.S. government securities) | | $ | 942,871 | | | $ | – 0 | – |
U.S. government securities | | | – 0 | – | | | – 0 | – |
The cost of investments for federal income tax purposes, gross unrealized appreciation and unrealized depreciation are as follows:
| | | | |
Cost | | $ | 28,764,467 | |
| | | | |
Gross unrealized appreciation | | $ | 792,719 | |
Gross unrealized depreciation | | | (48,302 | ) |
| | | | |
Net unrealized appreciation | | $ | 744,417 | |
| | | | |
1. Derivative Financial Instruments
The Fund may use derivatives in an effort to earn income and enhance returns, to replace more traditional direct investments, to obtain exposure to otherwise inaccessible markets (collectively, “investment purposes”), or to hedge or adjust the risk profile of its portfolio.
The principal types of derivatives utilized by the Fund, as well as the methods in which they may be used are:
The Fund may enter into swaps for investment purposes or to hedge its exposure to interest rates, credit risk or inflation, equity markets or currencies. A swap is an agreement that obligates two parties to exchange a series of cash flows at specified intervals based upon or
| | |
| |
| abfunds.com | | AB TAX-AWARE LONG MUNICIPAL ETF | 21 |
NOTES TO FINANCIAL STATEMENTS (continued)
calculated by reference to changes in specified prices, rates or indexes for a specified amount of an underlying asset or inflation. The payment flows are usually netted against each other, with the difference being paid by one party to the other. In addition, collateral may be pledged or received by the Fund in accordance with the terms of the respective swaps to provide value and recourse to the Fund or its counterparties in the event of default, bankruptcy or insolvency by one of the parties to the swap.
Risks may arise as a result of the failure of the counterparty to the swap to comply with the terms of the swap. The loss incurred by the failure of a counterparty is generally limited to the net interim payment to be received by the Fund, and/or the termination value at the end of the contract. Therefore, the Fund considers the creditworthiness of each counterparty to a swap in evaluating potential counterparty risk. This risk is mitigated by having a netting arrangement between the Fund and the counterparty and by the posting of collateral by the counterparty to the Fund to cover the Fund’s exposure to the counterparty. Additionally, risks may arise from unanticipated movements in interest rates, inflation or in the value of the underlying securities. The Fund accrues for the interim payments on swaps on a daily basis, with the net amount recorded within unrealized appreciation (depreciation) of swaps on the statement of assets and liabilities, where applicable. Once the interim payments are settled in cash, the net amount is recorded as realized gain/(loss) on swaps on the statement of operations, in addition to any realized gain/(loss) recorded upon the termination of swaps. Upfront premiums paid or received for swaps are recognized as cost or proceeds on the statement of assets and liabilities and are amortized on a straight line basis over the life of the contract. Amortized upfront premiums are included in net realized gain/(loss) from swaps on the statement of operations. Fluctuations in the value of swaps are recorded as a component of net change in unrealized appreciation (depreciation) of swaps on the statement of operations.
Certain standardized swaps, including certain interest rate swaps and credit default swaps, are subject to mandatory central clearing. Cleared swaps are transacted through futures commission merchants (“FCMs”) that are members of central clearinghouses, with the clearinghouse serving as central counterparty, similar to transactions in futures contracts. Centralized clearing will be required for additional categories of swaps on a phased-in basis based on requirements published by the Securities and Exchange Commission and Commodity Futures Trading Commission.
| | |
| |
22 | AB TAX-AWARE LONG MUNICIPAL ETF | | abfunds.com |
NOTES TO FINANCIAL STATEMENTS (continued)
At the time the Fund enters into a centrally cleared swap, the Fund deposits with the broker or segregates at its custodian cash or securities as collateral to satisfy initial margin requirements set by the clearinghouse on which the transaction is effected. Pursuant to the contract, with respect to cash collateral, the Fund agrees to receive from or pay to the broker an amount of cash equal to the daily fluctuation in the value of the contract; in the case of securities collateral, the Fund agrees to adjust the securities position held in the segregated account accordingly. Such receipts, payments or adjustments are known as variation margin and are recorded by the Fund as unrealized gains or losses. Risks may arise from the potential inability of a counterparty to meet the terms of the contract. The credit/counterparty risk for centrally cleared swaps is generally less than non-centrally cleared swaps, since the clearinghouse, which is the issuer or counterparty to each centrally cleared swap, has robust risk mitigation standards, including the requirement to provide initial and variation margin. When the contract is closed, the Fund records a realized gain or loss equal to the difference between the value of the contract at the time it was opened and the time it was closed.
Interest Rate Swaps:
The Fund is subject to interest rate risk exposure in the normal course of pursuing its investment objectives. Because the Fund holds fixed rate bonds, the value of these bonds may decrease if interest rates rise. To help hedge against this risk and to maintain its ability to generate income at prevailing market rates, the Fund may enter into interest rate swaps. Interest rate swaps are agreements between two parties to exchange cash flows based on a notional amount. The Fund may elect to pay a fixed rate and receive a floating rate, or, receive a fixed rate and pay a floating rate on a notional amount.
In addition, the Fund may also enter into interest rate swap transactions to preserve a return or spread on a particular investment or portion of its portfolio, or protecting against an increase in the price of securities the Fund anticipates purchasing at a later date. Interest rate swaps involve the exchange by the Fund with another party of their respective commitments to pay or receive interest (e.g., an exchange of floating rate payments for fixed rate payments) computed based on a contractually-based principal (or “notional”) amount. Interest rate swaps are entered into on a net basis (i.e., the two payment streams are netted out, with the Fund receiving or paying, as the case may be, only the net amount of the two payments).
During the period ended November 30, 2024, the Fund held interest rate swaps for hedging purposes.
| | |
| |
| abfunds.com | | AB TAX-AWARE LONG MUNICIPAL ETF | 23 |
NOTES TO FINANCIAL STATEMENTS (continued)
Inflation (CPI) Swaps:
Inflation swap agreements are contracts in which one party agrees to pay the cumulative percentage increase in a price index (the Consumer Price Index with respect to CPI swaps) over the term of the swap (with some lag on the inflation index), and the other pays a compounded fixed rate. Inflation swaps may be used to protect the net asset value, or NAV, of a Fund against an unexpected change in the rate of inflation measured by an inflation index since the value of these agreements is expected to increase if there are unexpected inflation increases.
During the period ended November 30, 2024, the Fund held inflation (CPI) swaps for hedging purposes.
Credit Default Swaps:
The Fund may enter into credit default swaps, including to manage its exposure to the market or certain sectors of the market, to reduce its risk exposure to defaults by corporate and sovereign issuers held by the Fund, or to create exposure to corporate or sovereign issuers to which it is not otherwise exposed. The Fund may purchase credit protection (“Buy Contract”) or provide credit protection (“Sale Contract”) on the referenced obligation of the credit default swap. During the term of the swap, the Fund receives/(pays) fixed payments from/(to) the respective counterparty, calculated at the agreed upon rate applied to the notional amount. If the Fund is a buyer/(seller) of protection and a credit event occurs, as defined under the terms of the swap, the Fund will either (i) receive from the seller/(pay to the buyer) of protection an amount equal to the notional amount of the swap (the “Maximum Payout Amount”) and deliver/(take delivery of) the referenced obligation or (ii) receive/(pay) a net settlement amount in the form of cash or securities equal to the notional amount of the swap less the recovery value of the referenced obligation. In certain circumstances Maximum Payout Amounts may be partially offset by recovery values of the respective referenced obligations, upfront premium received upon entering into the agreement, or net amounts received from settlement of buy protection credit default swaps entered into by the Fund for the same referenced obligations with the same counterparty.
Credit default swaps may involve greater risks than if the Fund had invested in the referenced obligation directly. Credit default swaps are subject to general market risk, liquidity risk, counterparty risk and credit risk. If the Fund is a buyer of protection and no credit event occurs, it will lose the payments it made to its counterparty. If the Fund is a seller of protection and a credit event occurs, the value of the referenced obligation received by the Fund coupled with the
| | |
| |
24 | AB TAX-AWARE LONG MUNICIPAL ETF | | abfunds.com |
NOTES TO FINANCIAL STATEMENTS (continued)
periodic payments previously received, may be less than the Maximum Payout Amount it pays to the buyer, resulting in a net loss to the Fund.
Implied credit spreads over U.S. Treasuries of comparable maturity utilized in determining the market value of credit default swaps on issuers as of period end are disclosed in the portfolio of investments. The implied spreads serve as an indicator of the current status of the payment/performance risk and typically reflect the likelihood of default by the issuer of the referenced obligation. The implied credit spread of a particular reference obligation also reflects the cost of buying/selling protection and may reflect upfront payments required to be made to enter into the agreement. Widening credit spreads typically represent a deterioration of the referenced obligation’s credit soundness and greater likelihood of default or other credit event occurring as defined under the terms of the agreement. A credit spread identified as “Defaulted” indicates a credit event has occurred for the referenced obligation.
During the period ended November 30, 2024, the Fund held credit default swaps for hedging purposes.
During the period ended November 30, 2024, the Fund had entered into the following derivatives:
| | | | | | | | | | | | |
| | | Asset Derivatives | | | Liability Derivatives | |
Derivative Type | | Statement of Assets and Liabilities Location | | Fair Value | | | Statement of Assets and
Liabilities Location | | Fair Value | |
Credit contracts | | Receivable for variation margin on centrally cleared swaps | | $ | 19,277 | * | | | | | | |
| | | | |
Interest rate contracts | | Receivable for variation margin on centrally cleared swaps | | | 151,932 | * | | Payable for variation margin on centrally cleared swaps | | $ | 17,944 | * |
| | | | | | | | | | | | |
Total | | | | $ | 171,209 | | | | | $ | 17,944 | |
| | | | | | | | | | | | |
| * | Only variation margin receivable/payable at period end is reported within the statement of assets and liabilities. This amount reflects cumulative unrealized appreciation (depreciation) on futures and centrally cleared swaps as reported in the portfolio of investments. |
| | |
| |
| abfunds.com | | AB TAX-AWARE LONG MUNICIPAL ETF | 25 |
NOTES TO FINANCIAL STATEMENTS (continued)
| | | | | | | | | | |
Derivative Type | | Location of
Gain or (Loss)
on Derivatives
Within Statement
of Operations | | Realized Gain
or (Loss) on
Derivatives | | | Change in
Unrealized
Appreciation or
(Depreciation) | |
Interest rate contracts | | Net realized gain (loss) on swaps; Net change in unrealized appreciation (depreciation) of swaps | | $ | (189,855 | ) | | $ | 133,988 | |
| | | |
Credit contracts | | Net realized gain (loss) on swaps; Net change in unrealized appreciation (depreciation) of swaps | | | 48,905 | | | | 19,277 | |
| | | | | | | | | | |
Total | | | | $ | (140,950 | ) | | $ | 153,265 | |
| | | | | | | | | | |
The following table represents the average monthly volume of the Fund’s derivative transactions during the period ended November 30, 2024:
| | | | |
Centrally Cleared Interest Rate Swaps: | | | | |
Average notional amount | | $ | 3,948,333 | |
Centrally Cleared Inflation Swaps: | | | | |
Average notional amount | | $ | 3,900,000 | (a) |
Centrally Cleared Credit Default Swaps: | | | | |
Average notional amount of sale contracts | | $ | 914,273 | (b) |
| (a) | Positions were open for two months during the period. |
| (b) | Positions were open for eleven months during the period. |
2. Currency Transactions
The Fund may invest in non-U.S. Dollar-denominated securities on a currency hedged or unhedged basis. The Fund may seek investment opportunities by taking long or short positions in currencies through the use of currency-related derivatives, including forward currency exchange contracts, futures and options on futures, swaps, and other options. The Fund may enter into transactions for investment opportunities when it anticipates that a foreign currency will appreciate or depreciate in value but securities denominated in that currency are not held by the Fund and do not present attractive investment opportunities. Such transactions may also be used when the Adviser believes that it may be more efficient than a direct investment in a foreign currency-denominated security. The Fund may also conduct currency exchange contracts on a spot basis (i.e., for cash at the spot rate prevailing in the currency exchange market for buying or selling currencies).
| | |
| |
26 | AB TAX-AWARE LONG MUNICIPAL ETF | | abfunds.com |
NOTES TO FINANCIAL STATEMENTS (continued)
NOTE E
Shares of the Fund
The Fund’s shares may only be bought and sold in a secondary market through a broker-dealer at a market price. Because ETF shares trade at market prices rather than NAV, shares may trade at a price greater than NAV (a premium) or less than NAV (a discount). The Fund issues and redeems shares at its NAV only in aggregations of a specified number of shares (a creation unit) generally in exchange for a designated portfolio of securities and/or cash (including any portion of such securities for which cash may be substituted). A fixed transaction fee is imposed on authorized participants in connection with creation unit redemption and creation transactions. Authorized participants may be required to pay an additional variable charge to cover certain costs and expenses related to the execution of trades resulting from creation unit transactions. Such variable charges, if any, are included in other capital within the Statement of Changes in Net Assets.
Transactions in shares of the Fund were as follows:
| | | | | | | | | | | | |
| | | | | | | | | | | | |
| | | Shares | | | Amount | | | | |
| | | December 13, 2023(a) to
November 30,
2024 | | | December 13, 2023(a) to
November 30,
2024 | | | | |
| | | | |
Shares sold | | | 1,150,040 | | | $ | 28,803,830 | | | | | |
| |
Net increase | | | 1,150,040 | | | $ | 28,803,830 | | | | | |
| |
| (a) | Commencement of operations. |
NOTE F
Risks Involved in Investing in the Fund
Market Risk—The value of the Fund’s assets will fluctuate as the bond market fluctuates. The value of its investments may decline, sometimes rapidly and unpredictably, simply because of economic changes or other events, including public health crises (including the occurrence of a contagious disease or illness), interest rate levels, and regional and global conflicts, that affect large portions of the market.
Credit Risk—An issuer or guarantor of a fixed-income security, or the counterparty to a derivatives or other contract, may be unable or unwilling to make timely payments of interest or principal, or to otherwise honor its obligations. The issuer or guarantor may default, causing a loss of the full principal amount of a security and accrued interest. The degree of risk for a particular security may be reflected in its credit rating. There is the possibility that the credit rating of a fixed-income security may be downgraded after purchase, which may adversely affect the value of the security.
| | |
| |
| abfunds.com | | AB TAX-AWARE LONG MUNICIPAL ETF | 27 |
NOTES TO FINANCIAL STATEMENTS (continued)
Interest Rate Risk—Changes in interest rates will affect the value of investments in fixed-income securities. When interest rates rise, the value of investments in fixed-income securities tends to fall and this decrease in value may not be offset by higher income from new investments. Interest rate risk is generally greater for fixed-income securities with longer maturities or durations. The Fund may be subject to a greater risk of rising interest rates than would normally be the case due to the recent end of a period of historically low rates and the effects of potential central bank monetary policy, and government fiscal policy, initiatives and market reactions to those initiatives.
Municipal Market Risk—This is the risk that special factors may adversely affect the value of municipal securities and have a significant effect on the yield or value of the Fund’s investments in municipal securities. These factors include economic conditions, political or legislative changes, public health crises, uncertainties related to the tax status of municipal securities, and the rights of investors in these securities. To the extent that the Fund invests more of its assets in a particular state’s municipal securities, the Fund may be vulnerable to events adversely affecting that state, including economic, political and regulatory occurrences, court decisions, terrorism, public health crises (including the occurrence of a contagious disease or illness) and catastrophic natural disasters, such as hurricanes, fires or earthquakes. The Fund’s investments in certain municipal securities with principal and interest payments that are made from the revenues of a specific project or facility, and not general tax revenues, may have increased risks. Factors affecting the project or facility, such as local business or economic conditions, could have a significant effect on the project’s ability to make payments of principal and interest on these securities.
In addition, changes in tax rates or the treatment of income from certain types of municipal securities, among other things, could negatively affect the municipal securities markets.
The municipal securities issued by Puerto Rico and its government agencies and municipalities may have more risks than those of other U.S. issuers of municipal securities. Puerto Rico continues to face a challenging economic and fiscal environment. If the general economic situation in Puerto Rico continues to persist or worsens, the volatility and credit quality of Puerto Rican municipal securities could continue to be adversely affected, and the market for such securities may deteriorate further.
Tax Risk—From time to time, the U.S. Government and the U.S. Congress consider changes in federal tax law that could limit or eliminate the federal tax exemption for municipal bond income, which would in effect
| | |
| |
28 | AB TAX-AWARE LONG MUNICIPAL ETF | | abfunds.com |
NOTES TO FINANCIAL STATEMENTS (continued)
reduce the income received by shareholders from the Fund by increasing taxes on that income. In such event, the Fund’s net asset value (“NAV”) could also decline as yields on municipal bonds, which are typically lower than those on taxable bonds, would be expected to increase to approximately the yield of comparable taxable bonds. Actions or anticipated actions affecting the tax-exempt status of municipal bonds could also result in significant shareholder redemptions of Fund shares as investors anticipate adverse effects on the Fund or seek higher yields to offset the potential loss of the tax deduction. As a result, the Fund would be required to maintain higher levels of cash to meet the redemptions, which would negatively affect the Fund’s yield.
Duration Risk—Duration is a measure that relates the expected price volatility of a fixed-income security to changes in interest rates. The duration of a fixed-income security may be shorter than or equal to full maturity of a fixed-income security. Fixed-income securities with longer durations have more risk and will decrease in price as interest rates rise. For example, a fixed-income security with a duration of three years will likely decrease in value by approximately 3% if interest rates increase by 1%.
Below Investment Grade Securities Risk—Investments in fixed-income securities with lower ratings (commonly known as “junk bonds”) are subject to a higher probability that an issuer will default or fail to meet its payment obligations. These securities may be subject to greater price volatility due to such factors as specific municipal or corporate developments and negative performance of the junk bond market generally and may be more difficult to trade than other types of securities.
Inflation Risk—This is the risk that the value of assets or income from investments will be less in the future as inflation decreases the value of money. As inflation increases, the value of the Fund’s assets can decline as can the value of the Fund’s distributions. This risk is significantly greater for fixed-income securities with longer maturities.
Leverage Risk—When the Fund borrows money or otherwise leverages its investments, its performance may be volatile because leverage tends to exaggerate the effect of any increase or decrease in the value of the Fund’s investments. The Fund may create leverage through the use of reverse repurchase arrangements, forward currency exchange contracts, forward commitments, dollar rolls or futures or by borrowing money. The use of other types of derivative instruments by the Fund, such as options and swaps, may also result in a form of leverage. Leverage may result in higher returns to the Fund than if the Fund were not leveraged, but may also adversely affect returns, particularly if the market is declining.
| | |
| |
| abfunds.com | | AB TAX-AWARE LONG MUNICIPAL ETF | 29 |
NOTES TO FINANCIAL STATEMENTS (continued)
Derivatives Risk—Derivatives may be difficult to price or unwind and may be leveraged so that small changes may produce disproportionate losses for the Fund. A short position in a derivative instrument involves the risk of a theoretically unlimited increase in the value of the underlying asset, reference rate or index, which could cause the Fund to suffer a potentially unlimited loss. Derivatives, especially over-the-counter derivatives, are also subject to counterparty risk, which is the risk that the counterparty (the party on the other side of the transaction) on a derivative transaction will be unable or unwilling to honor its contractual obligations to the Fund.
Illiquid Investments Risk—Illiquid investments risk exists when certain investments are or become difficult to purchase or sell. Difficulty in selling such investments may result in sales at disadvantageous prices affecting the value of your investment in the Fund. Causes of illiquid investments risk may include low trading volumes and large positions. Municipal securities may have more illiquid investments risk than other fixed-income securities because they trade less frequently and the market for municipal securities is generally smaller than many other markets.
Variable and Floating Rate-Securities Risk—Variable and floating-rate securities pay interest at rates that are adjusted periodically, according to a specific formula. Because the interest rate is reset only periodically, changes in the interest rate on these securities may lag behind changes in the prevailing market interest rates. The value of the security may rise or fall depending on changes in interest rates between periodic resets.
When-Issued and Forward Commitment Risks—These securities are purchased before the securities are actually issued or delivered. These securities are subject to the risk that, when delivered, they will be worth less than the agreed-upon purchase price.
Cash Transactions Risk—The Fund intends to effectuate all or a portion of the issuance and redemption of Creation Units for cash, rather than in-kind securities. As a result, an investment in the Fund may be less tax-efficient than an investment in an ETF that effectuates its Creation Units only on an in-kind basis. A fund that effects redemptions for cash may be required to sell portfolio securities in order to obtain the cash needed to distribute redemption proceeds. Any recognized gain on these sales by the Fund will generally cause the Fund to recognize a gain it might not otherwise have recognized, or to recognize such gain sooner than would otherwise be required as compared to an ETF that distributes portfolio securities in-kind in redemption of Creation Units. The Fund intends to distribute gains that arise by virtue of the issuance and redemption of Creation Units being effectuated in cash to shareholders to avoid being taxed on this gain at the fund level and otherwise comply with
| | |
| |
30 | AB TAX-AWARE LONG MUNICIPAL ETF | | abfunds.com |
NOTES TO FINANCIAL STATEMENTS (continued)
applicable tax requirements. This may cause shareholders to be subject to tax on gains to which they would not otherwise be subject, or at an earlier date than if they had made an investment in another ETF. Moreover, cash transactions may have to be carried out over several days if the securities market is relatively illiquid and may involve considerable brokerage fees and taxes. Brokerage fees, which will be higher than if the Fund sold and redeemed its shares principally in-kind, will be passed on to those purchasing and redeeming Creation Units in the form of creation and redemption transaction fees. In addition, these factors may result in wider spreads between the bid and ask prices of Fund shares than for ETFs that receive and distribute portfolio securities in-kind. The Fund’s use of cash for creations and redemptions could also result in dilution to the Fund and increased transaction costs, which could negatively impact the Fund’s ability to achieve its investment objective.
ETF Share Price and Net Asset Value Risk—The Fund’s shares are listed for trading on the NYSE Arca, Inc. (“NYSE Arca” or an “Exchange”). Shares are generally bought and sold in the secondary market at market prices. The NAV per share of the Fund will fluctuate with changes in the market value of the Fund’s holdings. The Fund’s NAV is calculated once per day, at the end of the day. The market price of a share on the Exchange could be higher than the NAV (premium), or lower than the NAV (discount) and may fluctuate during the trading day. When all or a portion of the Fund’s underlying securities trade in a market that is closed when the market for the Fund’s shares is open, there may be differences between the current value of a security and the last quoted price for that security in the closed local market, which could lead to a deviation between the market value of the Fund’s shares and the Fund’s NAV. Disruptions in the creations and redemptions process or the existence of extreme market volatility could result in the Fund’s shares trading above or below NAV. As the Fund may invest in securities traded on foreign exchanges, Fund shares may trade at a larger premium or discount to the Fund’s NAV than shares of other ETFs. In addition, in stressed market conditions, the market for Fund shares may become less liquid in response to deteriorating liquidity in the markets for the Fund’s underlying portfolio holdings.
Authorized Participant Risk—Only a limited number of financial institutions that enter into an authorized participant relationship with the Fund (“Authorized Participants”) may engage in creation or redemption transactions. If the Fund’s Authorized Participants decide not to create or redeem shares, Fund shares may trade at a larger premium or discount to the Fund’s NAV, or the Fund could face trading halts or de-listing.
| | |
| |
| abfunds.com | | AB TAX-AWARE LONG MUNICIPAL ETF | 31 |
NOTES TO FINANCIAL STATEMENTS (continued)
Active Trading Market Risk—There is no guarantee that an active trading market for Fund shares will exist at all times. In times of market stress, markets can suffer erratic or unpredictable trading activity, extraordinary volatility or wide bid/ask spreads, which could cause some market makers and Authorized Participants to reduce their market activity or “step away” from making a market in ETF shares. Market makers and Authorized Participants are not obligated to place or execute purchase and redemption orders. This could cause the Fund’s market price to deviate, materially, from the NAV, and reduce the effectiveness of the ETF arbitrage process. Any absence of an active trading market for Fund shares could lead to a heightened risk that there will be a difference between the market price of a Fund share and the underlying value of the Fund share.
Indemnification Risk—In the ordinary course of business, the Fund enters into contracts that contain a variety of indemnifications. The Fund’s maximum exposure under these arrangements is unknown. However, the Fund has not had prior claims or losses pursuant to these indemnification provisions and expects the risk of loss thereunder to be remote. Therefore, the Fund has not accrued any liability in connection with these indemnification provisions.
Management Risk—The Fund is subject to management risk because it is an actively-managed ETF. The Adviser will apply its investment techniques and risk analyses in making investment decisions, but there is no guarantee that its techniques will produce the intended results. Some of these techniques may incorporate, or rely upon, quantitative models, but there is no guarantee that these models will generate accurate forecasts, reduce risk or otherwise perform as expected.
NOTE G
Joint Credit Facility
A number of ETFs managed by the Adviser, including the Fund, participate in a $325 million revolving credit facility (the “Facility”) intended to provide short-term financing related to redemptions and other short term liquidity requirements, subject to certain restrictions. Commitment fees related to the Facility are paid by the participating funds and are included in miscellaneous expenses in the statement of operations. The Fund did not utilize the Facility during the period ended November 30, 2024.
| | |
| |
32 | AB TAX-AWARE LONG MUNICIPAL ETF | | abfunds.com |
NOTES TO FINANCIAL STATEMENTS (continued)
NOTE H
Distributions to Shareholders
The tax character of distributions paid during the fiscal period ended November 30, 2024 was as follows:
| | | | |
| | | 2024 | |
Distributions paid from: | | | | |
Ordinary income | | $ | 85,262 | |
| | | | |
Total taxable distributions | | | 85,262 | |
Tax-exempt income | | | 855,682 | |
| | | | |
Total distributions paid | | $ | 940,944 | |
| | | | |
As of November 30, 2024, the components of accumulated earnings (deficit) on a tax basis were as follows:
| | | | |
Undistributed ordinary income | | $ | 108,358 | |
Accumulated capital and other losses | | | (134,123 | )(a) |
Unrealized appreciation (depreciation) | | | 744,417 | (b) |
| | | | |
Total accumulated earnings (deficit) | | $ | 718,652 | |
| | | | |
| (a) | As of November 30, 2024, the Fund had a net capital loss carryforward of $134,123. |
| (b) | The differences between book-basis and tax-basis unrealized appreciation (depreciation) are attributable primarily to the tax treatment of swaps and the tax treatment of bond restructuring. |
For tax purposes, net realized capital losses may be carried over to offset future capital gains, if any. Funds are permitted to carry forward capital losses for an indefinite period, and such losses will retain their character as either short-term or long-term capital losses. As of November 30, 2024, the Fund had a net short-term capital loss carryforward of $134,123, which may be carried forward for an indefinite period.
During the current fiscal period, permanent differences primarily due to contributions from the Adviser resulted in a net increase in distributable earnings and a net decrease in additional paid-in capital. These reclassifications had no effect on net assets.
NOTE I
Recent Accounting Pronouncements
In December 2022, the Financial Accounting Standards Board issued an Accounting Standards Update, ASU 2022-06, “Reference Rate Reform (Topic 848) – Deferral of the Sunset Date of Topic 848”. ASU 2022-06 is an amendment to ASU 2020-04, which provided optional guidance to ease the potential accounting burden due to the discontinuation of the LIBOR and other interbank-offered based reference rates and which was effective as of March 12, 2020 through December 31, 2022. ASU 2022-06 extends the effective period through December 31, 2024. Management is currently evaluating the impact, if any, of applying ASU 2022-06.
| | |
| |
| abfunds.com | | AB TAX-AWARE LONG MUNICIPAL ETF | 33 |
NOTES TO FINANCIAL STATEMENTS (continued)
In November 2023, the Financial Accounting Standards Board issued Accounting Standards Update, ASU 2023-07, “Segment Reporting (Topic 280)”. ASU 2023-07 requires public entities to provide disclosure of significant segment expenses that are regularly provided to the chief operating decision maker (“CODM”). ASU 2023-07, among other things, (i) requires a single segment public entity to provide all necessary disclosures required by Topic 280 it, (ii) requires a public entity to disclose the title and position of the CODM and an explanation of how the CODM uses the reported measure(s) of segment profit and loss in assessing segment performance and deciding how to allocate resources and (iii) provides the ability for a public entity to elect more than one performance measure. ASU 2023-07 is effective for fiscal years beginning after December 15, 2023, and interim periods within fiscal years beginning after December 15, 2024. Early adoption of ASU 2023-07 is permitted. Management is currently evaluating the impact, if any, of applying ASU 2023-07.
NOTE J
Subsequent Events
Management has evaluated subsequent events for possible recognition or disclosure in the financial statements through the date the financial statements are issued. Management has determined that there are no material events that would require disclosure in the Fund’s financial statements through this date.
| | |
| |
34 | AB TAX-AWARE LONG MUNICIPAL ETF | | abfunds.com |
FINANCIAL HIGHLIGHTS
Selected Data For A Share of Capital Stock Outstanding Throughout Each Period
| | | | |
| | | December 13, 2023(a) to
November 30,
2024(a) | |
| | | | |
Net asset value, beginning of period | | | $ 25.00 | |
| | | | |
Income From Investment Operations | |
| |
Net investment income(b)(c) | | | .95 | |
| |
Net realized and unrealized loss on investment transactions | | | .57 | |
| |
Contributions from Affiliates | | | .00 | (d) |
| | | | |
Net increase in net asset value from operations | | | 1.52 | |
| | | | |
Less: Dividends | |
| |
Dividends from net investment income | | | (.85 | ) |
| | | | |
Net asset value, end of period | | | $ 25.67 | |
| | | | |
Total Return | |
| |
Total investment return based on net asset value(e) | | | 6.19 | % |
Ratios/Supplemental Data | |
| |
Net assets, end of period (000’s omitted) | | | $29,527 | |
|
Ratio to average net assets of: | |
| |
Expenses, net of waivers/reimbursements | | | .28 | %^ |
| |
Expenses, before waivers/reimbursements | | | .28 | %^ |
| |
Net investment income(c) | | | 3.90 | %^ |
| |
Portfolio turnover rate(f) | | | 12 | % |
| (a) | Commencement of operations. |
| (b) | Based on average shares outstanding. |
| (c) | Net of expenses waived/reimbursed by the Adviser. |
| (d) | Amount is less than $.005. |
| (e) | Total investment return is calculated assuming an initial investment made at the net asset value at the beginning of the period, reinvestment of all dividends and distributions at net asset value during the period, and redemption on the last day of the period. Total investment return does not reflect the deduction of taxes that a shareholder would pay on fund distributions or the redemption of fund shares. Total investment return calculated for a period of less than one year is not annualized. |
| (f) | Excludes the value of portfolio securities received or delivered as a result of in-kind purchases or redemptions of the fund’s capital shares, including ETF Creation Units. |
See notes to financial statements.
| | |
| |
| abfunds.com | | AB TAX-AWARE LONG MUNICIPAL ETF | 35 |
REPORT OF INDEPENDENT REGISTERED
PUBLIC ACCOUNTING FIRM
To the Shareholders and the Board of Directors of
AB Tax-Aware Long Municipal ETF
Opinion on the Financial Statements
We have audited the accompanying statement of assets and liabilities of AB Tax-Aware Long Municipal ETF (the “Fund”) (one of the funds constituting AB Active ETFs, Inc. (the “Corporation”)), including the portfolio of investments, as of November 30, 2024, and the related statements of operations and changes in net assets and the financial highlights for the period from December 13, 2023 (commencement of operations) to November 30, 2024, and the related notes (collectively referred to as the “financial statements”). In our opinion, the financial statements present fairly, in all material respects, the financial position of the Fund (one of the funds constituting AB Active ETFs, Inc.) at November 30, 2024, the results of its operations, the changes in its net assets and its financial highlights for the period from December 13, 2023 (commencement of operations) to November 30, 2024, in conformity with U.S. generally accepted accounting principles.
Basis for Opinion
These financial statements are the responsibility of the Corporation’s management. Our responsibility is to express an opinion on the Fund’s financial statements based on our audit. We are a public accounting firm registered with the Public Company Accounting Oversight Board (United States) (“PCAOB”) and are required to be independent with respect to the Corporation in accordance with the U.S. federal securities laws and the applicable rules and regulations of the Securities and Exchange Commission and the PCAOB.
We conducted our audit in accordance with the standards of the PCAOB. Those standards require that we plan and perform the audit to obtain reasonable assurance about whether the financial statements are free of material misstatement, whether due to error or fraud. The Corporation is not required to have, nor were we engaged to perform, an audit of the Corporation’s internal control over financial reporting. As part of our audit, we are required to obtain an understanding of internal control over financial reporting but not for the purpose of expressing an opinion on the effectiveness of the Corporation’s internal control over financial reporting. Accordingly, we express no such opinion.
Our audit included performing procedures to assess the risks of material misstatement of the financial statements, whether due to error or fraud, and performing procedures that respond to those risks. Such procedures included examining, on a test basis, evidence regarding the amounts and
| | |
| |
36 | AB TAX-AWARE LONG MUNICIPAL ETF | | abfunds.com |
REPORT OF INDEPENDENT REGISTERED
PUBLIC ACCOUNTING FIRM (continued)
disclosures in the financial statements. Our procedures included confirmation of securities owned as of November 30, 2024, by correspondence with the custodian, brokers and others; when replies were not received from brokers or others, we performed other auditing procedures. Our audit also included evaluating the accounting principles used and significant estimates made by management, as well as evaluating the overall presentation of the financial statements. We believe that our audit provides a reasonable basis for our opinion.

We have served as the auditor of one or more of the AB investment companies since 1968.
New York, New York
January 28, 2025
| | |
| |
| abfunds.com | | AB TAX-AWARE LONG MUNICIPAL ETF | 37 |
Information Regarding the Review and Approval of the Fund’s Advisory Agreement
The disinterested directors (the “directors”) of AB Active ETFs, Inc. (the “Company”) unanimously approved the Company’s Advisory Agreement with the Adviser in respect of AB Tax-Aware Long Municipal ETF (the “Fund”) for an initial two-year period at a meeting held in-person on August 1-2, 2023 (the “Meeting”)
Prior to approval of the Advisory Agreement, the directors had requested from the Adviser, and received and evaluated, extensive materials. They reviewed the proposed Advisory Agreement with the Adviser and with experienced counsel who are independent of the Adviser, who advised on the relevant legal standards. The directors also reviewed additional materials, including comparative analytical data prepared by the Senior Vice President of the Fund. The directors also discussed the proposed approval in private sessions with counsel.
The directors considered their knowledge of the nature and quality of the services to be provided by the Adviser to the Fund gained from their experience as directors or trustees of most of the registered investment companies advised by the Adviser, including the other series of the Company that are organized as exchange-traded funds (“ETFs”), their overall confidence in the Adviser’s integrity and competence they have gained from that experience, the Adviser’s initiative in identifying and raising potential issues with the directors and its responsiveness, frankness and attention to concerns raised by the directors in the past, including the Adviser’s willingness to consider and implement organizational and operational changes designed to improve investment results and the services provided to the AB Funds. The directors noted that they have four regular meetings each year, at each of which they review extensive materials and information from the Adviser, including information on the investment performance of the AB Funds.
The directors also considered all factors they believed relevant, including the specific matters discussed below. During the course of their deliberations, the directors evaluated, among other things, the reasonableness of the proposed advisory fee. The directors did not identify any particular information that was all-important or controlling, and different directors may have attributed different weights to the various factors. The directors determined that the selection of the Adviser to manage the Fund and the overall arrangements between the Fund and the Adviser, as provided in the Advisory Agreement, including the proposed advisory fee, were fair and reasonable in light of the services to be performed, expenses to be incurred and such other matters as the directors considered relevant in the exercise of their business judgment. The material factors and conclusions
| | |
| |
38 | AB TAX-AWARE LONG MUNICIPAL ETF | | abfunds.com |
that formed the basis for the directors’ determinations included the following:
Nature, Extent and Quality of Services to be Provided
The directors considered the scope and quality of services to be provided by the Adviser under the Advisory Agreement, including the quality of the investment research capabilities of the Adviser and the other resources it has dedicated to performing services for the AB Funds. They also noted the professional experience and qualifications of the Fund’s portfolio management team and other senior personnel of the Adviser. The directors also considered that the Advisory Agreement provides that the Fund will reimburse the Adviser for the cost to it of providing certain clerical, accounting, administrative and other services to the Fund by employees of the Adviser or its affiliates. Requests for these reimbursements will be subject to the directors’ approval on a quarterly basis. The directors noted that the Adviser does not expect to request such reimbursements. The quality of administrative and other services, including the Adviser’s role in coordinating the activities of the Fund’s other service providers, also was considered. The directors concluded that, overall, they were satisfied with the nature, extent and quality of services to be provided to the Fund under the Advisory Agreement.
Costs of Services to be Provided and Profitability
Because the Fund had not yet commenced operations, the directors were unable to consider historical information about the profitability of the Fund. However, the Adviser agreed to provide the directors with profitability information in connection with future proposed continuances of the Advisory Agreement. They also considered the costs to be borne by the Adviser in providing services to the Fund and that the Fund was unlikely to be profitable to the Adviser unless it achieves a material level of net assets.
Fall-Out Benefits
The directors considered the other benefits to the Adviser from its proposed relationship with the Fund. The directors recognized that the Adviser’s future profitability would be somewhat lower without these benefits. The directors understood that the Adviser also might derive reputational and other benefits from its association with the Fund.
Investment Results
Since the Fund had not yet commenced operations, no performance or other historical information for the Fund was available. Based on the Adviser’s written and oral presentations regarding the proposed management of the Fund and their general knowledge and confidence in the Adviser’s expertise in managing mutual funds and ETFs, the directors concluded that they were satisfied that the Adviser was capable of providing high quality Fund management services to the Fund.
| | |
| |
| abfunds.com | | AB TAX-AWARE LONG MUNICIPAL ETF | 39 |
Advisory Fees and Other Expenses
The directors considered the proposed advisory fee rate payable by the Fund to the Adviser and information prepared by an independent service provider (the “15(c) service provider”), concerning advisory fee rates payable by other ETFs in the same category as the Fund, based on the Fund’s projected net assets of $250 million. The directors noted that the proposed advisory fee is a unitary fee and that the Adviser will pay all expenses of the Fund except for certain expenses payable by the Fund such as interest expense, taxes, extraordinary expenses, and brokerage commissions and other transaction costs. The directors recognized that it is difficult to make comparisons of advisory fees because there are variations in the services that are included in the fees payable by other ETFs. The directors considered the Fund’s proposed contractual advisory fee rate against a peer group median and noted that it was lower than the median.
The directors also considered the Adviser’s fee schedule for other clients utilizing investment strategies similar to those of the Fund. For this purpose, they reviewed the relevant advisory fee information from the Adviser’s Form ADV and in a report from the Fund’s Senior Vice President and noted the differences between the Fund’s proposed fee schedule, on the one hand, and the Adviser’s institutional fee schedule, on the other. The directors noted that the Adviser may, in some cases, agree to fee rates with large institutional clients that are lower than those reviewed by the directors and that they had previously discussed with the Adviser its policies in respect of such arrangements. The directors also compared the proposed advisory fee rate for the Fund with those for other funds advised by the Adviser utilizing similar investment strategies.
The Adviser reviewed with the directors the significantly greater scope of the services it will provide to the Fund relative to institutional clients. In this regard, the Adviser noted, among other things, that, compared to institutional accounts, the Fund (i) demands considerably more managerial and administrative resources due to the potential for frequent creations and redemptions of shares; (ii) has more tax and regulatory restrictions and compliance obligations; (iii) must prepare and file or distribute regulatory and other communications about fund operations; and (iv) must provide shareholder servicing to retail investors. The Adviser also reviewed the greater legal risks presented by the large and changing population of Fund shareholders who may assert claims against the Adviser in individual or class actions, and the greater entrepreneurial risk in offering new fund products, which require substantial investment to launch, may not succeed, and generally must be priced to compete with larger, more established funds resulting in lack of to the Adviser until a new fund achieves scale. In light of the substantial differences in services rendered by the Adviser to institutional clients as compared to the Fund, and the different risk profile, the directors considered these fee comparisons inapt and did
| | |
| |
40 | AB TAX-AWARE LONG MUNICIPAL ETF | | abfunds.com |
not place significant weight on them in their deliberations. The directors noted that the proposed unitary fee for the Fund covers additional services provided by third parties and thus is not directly comparable to the Adviser’s institutional fee schedule and the schedule of fees for most other funds advised by the Adviser.
In connection with their review of the Fund’s proposed advisory fee, the directors also considered the projected total expense ratio of the shares of the Fund in comparison to the medians for a group of similar ETFs (“peer group”) and a larger group of similar ETFs (“peer universe”) selected by the 15(c) service provider. The directors view the projected expense ratio information as relevant to their evaluation of the Adviser’s services because the Adviser is responsible for coordinating services provided to the Fund by others and, in most cases, the Adviser will be responsible for paying for such services under its unitary fee arrangement with the Fund. Based on their review, the directors concluded that the Fund’s projected expense ratio was acceptable.
Economies of Scale
The directors noted that the proposed advisory fee schedule for the Fund does not contain breakpoints and that they had discussed their strong preference for breakpoints in advisory contracts with the Adviser. The directors took into consideration prior presentations by an independent consultant on economies of scale in the mutual fund industry and for the AB Funds, and presentations from time to time by the Adviser concerning certain of its views on economies of scale. The directors also had requested and received from the Adviser certain updates on economies of scale in advance of the Meeting. The directors believe that economies of scale may be realized (if at all) by the Adviser across a variety of products and services, and not only in respect of a single fund. The directors noted that there is no established methodology for setting breakpoints that give effect to the fund-specific services provided by a fund’s adviser and to the economies of scale that an adviser may realize in its overall mutual fund business or those components of it which directly or indirectly affect a fund’s operations. The directors observed that in the mutual fund industry as a whole, as well as among ETFs similar to the Fund, there is no uniformity or pattern in the fees and asset levels at which breakpoints (if any) apply. The directors also noted that the advisory agreements for many ETFs do not have breakpoints at all. The directors informed the Adviser that they would monitor the Fund’s asset level and its profitability to the Adviser and anticipated revisiting the question of breakpoints in the future if circumstances warranted doing so.
| | |
| |
| abfunds.com | | AB TAX-AWARE LONG MUNICIPAL ETF | 41 |
NOTES
| | |
| |
42 | AB TAX-AWARE LONG MUNICIPAL ETF | | abfunds.com |
NOTES
| | |
| |
| abfunds.com | | AB TAX-AWARE LONG MUNICIPAL ETF | 43 |
NOTES
| | |
| |
44 | AB TAX-AWARE LONG MUNICIPAL ETF | | abfunds.com |
AB TAX-AWARE LONG MUNICIPAL ETF
66 Hudson Boulevard East
New York, NY 10001
800 221 5672
ETF-TALM-0151-1124 
NOV 11.30.24

ANNUAL FINANCIAL STATEMENTS AND ADDITIONAL INFORMATION
AB US HIGH DIVIDEND ETF
(NYSE: HIDV)

| | |
| |
| Investment Products Offered | | • Are Not FDIC Insured • May Lose Value • Are Not Bank Guaranteed |
Investors should consider the investment objectives, risks, charges and expenses of the Fund carefully before investing. For copies of our prospectus or summary prospectus, which contain this and other information, visit us online at www.abfunds.com or contact your AB representative. Please read the prospectus and/or summary prospectus carefully before investing.
This shareholder report must be preceded or accompanied by the Fund’s prospectus for individuals who are not current shareholders of the Fund.
You may obtain a description of the Fund’s proxy voting policies and procedures, and information regarding how the Fund voted proxies relating to portfolio securities during the most recent 12-month period ended June 30, without charge. Simply visit AB’s website at www.abfunds.com, or go to the Securities and Exchange Commission’s (the “Commission”) website at www.sec.gov, or call AB at (800) 227 4618.
The Fund files its complete schedule of portfolio holdings with the Commission for the first and third quarters of each fiscal year as an exhibit to its reports on Form N-PORT. The Fund’s Form N-PORT reports are available on the Commission’s website at www.sec.gov. AB publishes full portfolio holdings for the Fund daily at www.abfunds.com.
Foreside Fund Services, LLC (“Foreside”) is the distributor of the fund. Foreside is a member of FINRA.
The [A/B] logo and AllianceBernstein® are registered trademarks used by permission of the owner, AllianceBernstein L.P.
PORTFOLIO OF INVESTMENTS
November 30, 2024
| | | | | | | | |
| Company | | Shares | | | U.S. $ Value | |
| |
COMMON STOCKS – 99.6% | | | | | | | | |
Information Technology – 27.0% | | | | | | | | |
Communications Equipment – 1.2% | | | | | | | | |
Cisco Systems, Inc. | | | 5,372 | | | $ | 318,076 | |
| | | | | | | | |
| | |
IT Services – 2.5% | | | | | | | | |
Accenture PLC – Class A | | | 862 | | | | 312,363 | |
International Business Machines Corp. | | | 1,417 | | | | 322,240 | |
| | | | | | | | |
| | | | | | | 634,603 | |
| | | | | | | | |
Semiconductors & Semiconductor Equipment – 8.5% | | | | | | | | |
Broadcom, Inc. | | | 1,803 | | | | 292,230 | |
NVIDIA Corp. | | | 12,403 | | | | 1,714,715 | |
QUALCOMM, Inc. | | | 1,025 | | | | 162,493 | |
| | | | | | | | |
| | | | | | | 2,169,438 | |
| | | | | | | | |
Software – 7.5% | | | | | | | | |
Microsoft Corp. | | | 3,320 | | | | 1,405,887 | |
Oracle Corp. | | | 1,850 | | | | 341,954 | |
ServiceNow, Inc.(a) | | | 147 | | | | 154,268 | |
| | | | | | | | |
| | | | | | | 1,902,109 | |
| | | | | | | | |
Technology Hardware, Storage & Peripherals – 7.3% | | | | | | | | |
Apple, Inc. | | | 7,805 | | | | 1,852,361 | |
| | | | | | | | |
| | | | | | | 6,876,587 | |
| | | | | | | | |
Financials – 19.2% | | | | | | | | |
Banks – 5.4% | | | | | | | | |
Citigroup, Inc. | | | 3,804 | | | | 269,590 | |
Citizens Financial Group, Inc. | | | 3,195 | | | | 153,807 | |
Columbia Banking System, Inc. | | | 4,738 | | | | 146,925 | |
First Horizon Corp. | | | 7,504 | | | | 158,560 | |
JPMorgan Chase & Co. | | | 551 | | | | 137,596 | |
Regions Financial Corp. | | | 5,630 | | | | 153,474 | |
TFS Financial Corp. | | | 10,639 | | | | 150,435 | |
Wells Fargo & Co. | | | 2,758 | | | | 210,077 | |
| | | | | | | | |
| | | | | | | 1,380,464 | |
| | | | | | | | |
Capital Markets – 5.8% | | | | | | | | |
Blackstone, Inc. | | | 241 | | | | 46,053 | |
Goldman Sachs Group, Inc. (The) | | | 490 | | | | 298,199 | |
Invesco Ltd. | | | 11,537 | | | | 208,704 | |
Janus Henderson Group PLC | | | 4,450 | | | | 201,496 | |
Morgan Stanley | | | 2,115 | | | | 278,355 | |
State Street Corp. | | | 2,221 | | | | 218,791 | |
T. Rowe Price Group, Inc. | | | 1,806 | | | | 223,655 | |
| | | | | | | | |
| | | | | | | 1,475,253 | |
| | | | | | | | |
Consumer Finance – 0.8% | | | | | | | | |
OneMain Holdings, Inc. | | | 3,716 | | | | 213,113 | |
| | | | | | | | |
| | |
| |
| abfunds.com | | AB US HIGH DIVIDEND ETF | 1 |
PORTFOLIO OF INVESTMENTS (continued)
| | | | | | | | |
| Company | | Shares | | | U.S. $ Value | |
| |
Financial Services – 3.6% | | | | | | | | |
Berkshire Hathaway, Inc. – Class B(a) | | | 469 | | | $ | 226,536 | |
Mastercard, Inc. – Class A | | | 21 | | | | 11,192 | |
MGIC Investment Corp. | | | 7,543 | | | | 198,079 | |
UWM Holdings Corp. | | | 32,763 | | | | 213,287 | |
Visa, Inc. – Class A | | | 155 | | | | 48,837 | |
Western Union Co. (The) | | | 18,845 | | | | 207,484 | |
| | | | | | | | |
| | | | | | | 905,415 | |
| | | | | | | | |
Insurance – 1.6% | | | | | | | | |
Lincoln National Corp. | | | 5,506 | | | | 195,683 | |
Unum Group | | | 2,816 | | | | 216,551 | |
| | | | | | | | |
| | | | | | | 412,234 | |
| | | | | | | | |
Mortgage Real Estate Investment Trusts (REITs) – 2.0% | | | | | | | | |
AGNC Investment Corp. | | | 20,978 | | | | 202,647 | |
Annaly Capital Management, Inc. | | | 10,261 | | | | 204,502 | |
Rithm Capital Corp. | | | 8,893 | | | | 100,046 | |
| | | | | | | | |
| | | | | | | 507,195 | |
| | | | | | | | |
| | | | | | | 4,893,674 | |
| | | | | | | | |
Health Care – 8.9% | | | | | | | | |
Biotechnology – 2.4% | | | | | | | | |
AbbVie, Inc. | | | 1,546 | | | | 282,810 | |
Amgen, Inc. | | | 586 | | | | 165,762 | |
Gilead Sciences, Inc. | | | 1,656 | | | | 153,312 | |
| | | | | | | | |
| | | | | | | 601,884 | |
| | | | | | | | |
Health Care Providers & Services – 1.4% | | | | | | | | |
CVS Health Corp. | | | 4,359 | | | | 260,886 | |
UnitedHealth Group, Inc. | | | 135 | | | | 82,377 | |
| | | | | | | | |
| | | | | | | 343,263 | |
| | | | | | | | |
Pharmaceuticals – 5.1% | | | | | | | | |
Bristol-Myers Squibb Co. | | | 4,301 | | | | 254,705 | |
Eli Lilly & Co. | | | 152 | | | | 120,893 | |
Johnson & Johnson | | | 351 | | | | 54,409 | |
Merck & Co., Inc. | | | 3,298 | | | | 335,209 | |
Organon & Co. | | | 13,020 | | | | 206,627 | |
Perrigo Co. PLC | | | 1,992 | | | | 56,852 | |
Pfizer, Inc. | | | 10,570 | | | | 277,040 | |
| | | | | | | | |
| | | | | | | 1,305,735 | |
| | | | | | | | |
| | | | | | | 2,250,882 | |
| | | | | | | | |
Communication Services – 8.5% | | | | | | | | |
Diversified Telecommunication Services – 2.4% | | | | | | | | |
AT&T, Inc. | | | 12,760 | | | | 295,522 | |
Verizon Communications, Inc. | | | 7,057 | | | | 312,907 | |
| | | | | | | | |
| | | | | | | 608,429 | |
| | | | | | | | |
| | |
| |
2 | AB US HIGH DIVIDEND ETF | | abfunds.com |
PORTFOLIO OF INVESTMENTS (continued)
| | | | | | | | |
| Company | | Shares | | | U.S. $ Value | |
| |
Entertainment – 1.6% | | | | | | | | |
Netflix, Inc.(a) | | | 454 | | | $ | 402,612 | |
Playtika Holding Corp. | | | 1,333 | | | | 11,224 | |
| | | | | | | | |
| | | | | | | 413,836 | |
| | | | | | | | |
Interactive Media & Services – 4.5% | | | | | | | | |
Alphabet, Inc. – Class A | | | 2,844 | | | | 480,494 | |
Alphabet, Inc. – Class C | | | 1,262 | | | | 215,158 | |
Meta Platforms, Inc. – Class A | | | 766 | | | | 439,929 | |
| | | | | | | | |
| | | | | | | 1,135,581 | |
| | | | | | | | |
| | | | | | | 2,157,846 | |
| | | | | | | | |
Consumer Discretionary – 8.4% | | | | | | | | |
Automobiles – 1.3% | | | | | | | | |
Tesla, Inc.(a) | | | 946 | | | | 326,521 | |
| | | | | | | | |
| | |
Broadline Retail – 3.4% | | | | | | | | |
Amazon.com, Inc.(a) | | | 3,651 | | | | 759,006 | |
Kohl’s Corp. | | | 5,405 | | | | 80,913 | |
Macy’s, Inc. | | | 2,055 | | | | 33,373 | |
| | | | | | | | |
| | | | | | | 873,292 | |
| | | | | | | | |
Hotels, Restaurants & Leisure – 1.2% | | | | | | | | |
McDonald’s Corp. | | | 54 | | | | 15,985 | |
Texas Roadhouse, Inc. | | | 427 | | | | 87,650 | |
Wendy’s Co. (The) | | | 10,905 | | | | 200,216 | |
| | | | | | | | |
| | | | | | | 303,851 | |
| | | | | | | | |
Household Durables – 0.4% | | | | | | | | |
Whirlpool Corp. | | | 967 | | | | 107,743 | |
| | | | | | | | |
| | |
Specialty Retail – 1.7% | | | | | | | | |
Best Buy Co., Inc. | | | 2,262 | | | | 203,580 | |
Gap, Inc. (The) | | | 9,017 | | | | 218,662 | |
| | | | | | | | |
| | | | | | | 422,242 | |
| | | | | | | | |
Textiles, Apparel & Luxury Goods – 0.4% | | | | | | | | |
Carter’s, Inc. | | | 1,880 | | | | 102,592 | |
| | | | | | | | |
| | | | | | | 2,136,241 | |
| | | | | | | | |
Consumer Staples – 6.6% | | | | | | | | |
Beverages – 1.2% | | | | | | | | |
Coca-Cola Co. (The) | | | 4,942 | | | | 316,683 | |
| | | | | | | | |
| | |
Consumer Staples Distribution & Retail – 0.8% | | | | | | | | |
Walgreens Boots Alliance, Inc. | | | 22,407 | | | | 202,111 | |
| | | | | | | | |
| | |
Food Products – 1.9% | | | | | | | | |
Flowers Foods, Inc. | | | 9,312 | | | | 210,638 | |
Ingredion, Inc. | | | 1,338 | | | | 197,141 | |
Tyson Foods, Inc. – Class A | | | 1,134 | | | | 73,143 | |
| | | | | | | | |
| | | | | | | 480,922 | |
| | | | | | | | |
| | |
| |
| abfunds.com | | AB US HIGH DIVIDEND ETF | 3 |
PORTFOLIO OF INVESTMENTS (continued)
| | | | | | | | |
| Company | | Shares | | | U.S. $ Value | |
| |
Household Products – 0.4% | | | | | | | | |
Clorox Co. (The) | | | 617 | | | $ | 103,144 | |
| | | | | | | | |
| | |
Tobacco – 2.3% | | | | | | | | |
Altria Group, Inc. | | | 4,540 | | | | 262,140 | |
Philip Morris International, Inc. | | | 2,385 | | | | 317,348 | |
| | | | | | | | |
| | | | | | | 579,488 | |
| | | | | | | | |
| | | | | | | 1,682,348 | |
| | | | | | | | |
Real Estate – 6.2% | | | | | | | | |
Diversified REITs – 0.8% | | | | | | | | |
WP Carey, Inc. | | | 3,607 | | | | 205,815 | |
| | | | | | | | |
| | |
Health Care REITs – 0.8% | | | | | | | | |
Omega Healthcare Investors, Inc. | | | 4,781 | | | | 194,156 | |
| | | | | | | | |
| | |
Hotel & Resort REITs – 0.4% | | | | | | | | |
Park Hotels & Resorts, Inc. | | | 6,636 | | | | 103,190 | |
| | | | | | | | |
| | |
Office REITs – 0.8% | | | | | | | | |
Highwoods Properties, Inc. | | | 3,095 | | | | 100,464 | |
Kilroy Realty Corp. | | | 2,596 | | | | 107,812 | |
| | | | | | | | |
| | | | | | | 208,276 | |
| | | | | | | | |
Retail REITs – 1.3% | | | | | | | | |
Brixmor Property Group, Inc. | | | 4,677 | | | | 140,638 | |
NNN REIT, Inc. | | | 4,489 | | | | 197,426 | |
| | | | | | | | |
| | | | | | | 338,064 | |
| | | | | | | | |
Specialized REITs – 2.1% | | | | | | | | |
EPR Properties | | | 2,192 | | | | 99,451 | |
Gaming and Leisure Properties, Inc. | | | 4,068 | | | | 209,950 | |
VICI Properties, Inc. | | | 6,889 | | | | 224,650 | |
| | | | | | | | |
| | | | | | | 534,051 | |
| | | | | | | | |
| | | | | | | 1,583,552 | |
| | | | | | | | |
Materials – 4.5% | | | | | | | | |
Chemicals – 2.9% | | | | | | | | |
Dow, Inc. | | | 4,787 | | | | 211,633 | |
Eastman Chemical Co. | | | 2,035 | | | | 213,105 | |
Huntsman Corp. | | | 5,085 | | | | 99,564 | |
LyondellBasell Industries NV – Class A | | | 2,514 | | | | 209,517 | |
| | | | | | | | |
| | | | | | | 733,819 | |
| | | | | | | | |
Containers & Packaging – 1.6% | | | | | | | | |
Amcor PLC | | | 20,200 | | | | 214,928 | |
Sonoco Products Co. | | | 3,945 | | | | 204,667 | |
| | | | | | | | |
| | | | | | | 419,595 | |
| | | | | | | | |
| | | | | | | 1,153,414 | |
| | | | | | | | |
Industrials – 3.6% | | | | | | | | |
Air Freight & Logistics – 1.0% | | | | | | | | |
United Parcel Service, Inc. – Class B | | | 1,900 | | | | 257,868 | |
| | | | | | | | |
| | |
| |
4 | AB US HIGH DIVIDEND ETF | | abfunds.com |
PORTFOLIO OF INVESTMENTS (continued)
| | | | | | | | |
| Company | | Shares | | | U.S. $ Value | |
| |
Machinery – 1.4% | | | | | | | | |
Snap-on, Inc. | | | 497 | | | $ | 183,736 | |
Stanley Black & Decker, Inc. | | | 1,970 | | | | 176,216 | |
| | | | | | | | |
| | | | | | | 359,952 | |
| | | | | | | | |
Professional Services – 1.2% | | | | | | | | |
ManpowerGroup, Inc. | | | 1,477 | | | | 95,075 | |
Robert Half, Inc. | | | 2,620 | | | | 195,478 | |
| | | | | | | | |
| | | | | | | 290,553 | |
| | | | | | | | |
| | | | | | | 908,373 | |
| | | | | | | | |
Utilities – 3.4% | | | | | | | | |
Gas Utilities – 1.0% | | | | | | | | |
UGI Corp. | | | 8,368 | | | | 254,136 | |
| | | | | | | | |
| | |
Independent Power and Renewable Electricity Producers – 1.2% | | | | | | | | |
AES Corp. (The) | | | 7,468 | | | | 97,383 | |
Clearway Energy, Inc. – Class A | | | 7,139 | | | | 198,535 | |
Clearway Energy, Inc. – Class C | | | 841 | | | | 24,801 | |
| | | | | | | | |
| | | | | | | 320,719 | |
| | | | | | | | |
Multi-Utilities – 1.2% | | | | | | | | |
Dominion Energy, Inc. | | | 3,924 | | | | 230,535 | |
DTE Energy Co. | | | 538 | | | | 67,670 | |
| | | | | | | | |
| | | | | | | 298,205 | |
| | | | | | | | |
| | | | | | | 873,060 | |
| | | | | | | | |
Energy – 3.3% | | | | | | | | |
Oil, Gas & Consumable Fuels – 3.3% | | | | | | | | |
Antero Midstream Corp. | | | 13,051 | | | | 208,424 | |
Chevron Corp. | | | 1,860 | | | | 301,190 | |
Exxon Mobil Corp. | | | 634 | | | | 74,787 | |
HF Sinclair Corp. | | | 4,713 | | | | 192,903 | |
ONEOK, Inc. | | | 449 | | | | 51,006 | |
| | | | | | | | |
| | | | | | | 828,310 | |
| | | | | | | | |
Total Common Stocks
(cost $22,220,959) | | | | | | | 25,344,287 | |
| | | | | | | | |
| | | | | | | | |
SHORT-TERM INVESTMENTS – 0.2% | | | | | | | | |
Investment Companies – 0.2% | | | | | | | | |
AB Fixed Income Shares, Inc. – Government Money Market Portfolio – Class AB, 4.54%(b)(c)(d)
(cost $57,416) | | | 57,416 | | | | 57,416 | |
| | | | | | | | |
| | |
Total Investments – 99.8%
(cost $22,278,375) | | | | | | | 25,401,703 | |
Other assets less liabilities – 0.2% | | | | | | | 55,651 | |
| | | | | | | | |
| | |
Net Assets – 100.0% | | | | | | $ | 25,457,354 | |
| | | | | | | | |
| | |
| |
| abfunds.com | | AB US HIGH DIVIDEND ETF | 5 |
PORTFOLIO OF INVESTMENTS (continued)
| (a) | Non-income producing security. |
| (b) | Affiliated investments. |
| (c) | The rate shown represents the 7-day yield as of period end. |
| (d) | To obtain a copy of the fund’s shareholder report, please go to the Securities and Exchange Commission’s website at www.sec.gov, or call AB at (800) 227-4618. |
Glossary:
REIT – Real Estate Investment Trust
See notes to financial statements.
| | |
| |
6 | AB US HIGH DIVIDEND ETF | | abfunds.com |
STATEMENT OF ASSETS & LIABILITIES
November 30, 2024
| | | | |
| Assets | |
Investments in securities, at value | |
Unaffiliated issuers (cost $22,220,959) | | $ | 25,344,287 | |
Affiliated issuers (cost $57,416) | | | 57,416 | |
Unaffiliated dividends receivable | | | 63,756 | |
Affiliated dividends receivable | | | 207 | |
Receivable due from Adviser | | | 9 | |
| | | | |
Total assets | | | 25,465,675 | |
| | | | |
| Liabilities | | | | |
Advisory fee payable | | | 8,321 | |
| | | | |
Total liabilities | | | 8,321 | |
| | | | |
Net Assets | | $ | 25,457,354 | |
| | | | |
| Composition of Net Assets | | | | |
Capital stock, at par | | $ | 34 | |
Additional paid-in capital | | | 22,455,816 | |
Distributable earnings | | | 3,001,504 | |
| | | | |
Net Assets | | $ | 25,457,354 | |
| | | | |
Net Asset Value Per Share—500 million shares of capital stock authorized, $.0001 par value (based on 340,020 shares outstanding) | | $ | 74.87 | |
| | | | |
See notes to financial statements.
| | |
| |
| abfunds.com | | AB US HIGH DIVIDEND ETF | 7 |
STATEMENT OF OPERATIONS
Year Ended November 30, 2024
| | | | | | | | |
| Investment Income | | | | | | | | |
Dividends | | | | | | | | |
Unaffiliated issuers (net of foreign taxes withheld of $388) | | $ | 445,000 | | | | | |
Affiliated issuers | | | 1,681 | | | | | |
Interest | | | 132 | | | $ | 446,813 | |
| | | | | | | | |
| Expenses | | | | | | | | |
Advisory fee (see Note B) | | | 61,294 | | | | | |
| | | | | | | | |
Total expenses | | | 61,294 | | | | | |
Less: expenses waived and reimbursed by the Adviser (see Note B) | | | (59 | ) | | | | |
| | | | | | | | |
Net expenses | | | | | | | 61,235 | |
| | | | | | | | |
Net investment income | | | | | | | 385,578 | |
| | | | | | | | |
| Realized and Unrealized Gain (Loss) on Investment Transactions | | | | | | | | |
Net realized gain (loss) on: | | | | | | | | |
Investment transactions | | | | | | | (125,951 | ) |
In-kind redemptions | | | | | | | 1,525,976 | |
Net change in unrealized appreciation (depreciation) of investments | | | | | | | 2,582,443 | |
| | | | | | | | |
Net gain on investment transactions | | | | | | | 3,982,468 | |
| | | | | | | | |
Net Increase in Net Assets from Operations | | | | | | $ | 4,368,046 | |
| | | | | | | | |
See notes to financial statements.
| | |
| |
8 | AB US HIGH DIVIDEND ETF | | abfunds.com |
STATEMENT OF CHANGES IN NET ASSETS
| | | | | | | | |
| | | Year Ended
November 30,
2024 | | | March 22,
2023(a) to
November 30,
2023 | |
| Increase in Net Assets from Operations | |
Net investment income | | $ | 385,578 | | | $ | 126,048 | |
Net realized gain on investment transactions | | | 1,400,025 | | | | 169,838 | |
Net change in unrealized appreciation (depreciation) of investments | | | 2,582,443 | | | | 540,885 | |
| | | | | | | | |
Net increase in net assets from operations | | | 4,368,046 | | | | 836,771 | |
Distribution to Shareholders | | | (285,495 | ) | | | (84,230 | ) |
| Transactions in Shares of the Fund | |
Net increase | | | 14,636,368 | | | | 5,985,894 | |
| | | | | | | | |
Total increase | | | 18,718,919 | | | | 6,738,435 | |
| Net Assets | |
Beginning of period | | | 6,738,435 | | | | – 0 | – |
| | | | | | | | |
End of period | | $ | 25,457,354 | | | $ | 6,738,435 | |
| | | | | | | | |
| (a) | Commencement of operations. |
See notes to financial statements.
| | |
| |
| abfunds.com | | AB US HIGH DIVIDEND ETF | 9 |
NOTES TO FINANCIAL STATEMENTS
November 30, 2024
NOTE A
Significant Accounting Policies
The AB Active ETFs, Inc. (the “Corporation”) is registered under the Investment Company Act of 1940 (the “1940 Act”), as an open-end management investment company. The Corporation, which is a Maryland corporation, operates as a series company comprised of 15 funds currently in operation. Each fund is considered to be a separate entity for financial reporting and tax purposes. This report relates only to the AB US High Dividend ETF (the “Fund”), a non-diversified portfolio. The Fund commenced investment operations on March 22, 2023. The financial statements have been prepared in conformity with U.S. generally accepted accounting principles (“U.S. GAAP”), which require management to make certain estimates and assumptions that affect the reported amounts of assets and liabilities in the financial statements and amounts of income and expenses during the reporting period. Actual results could differ from those estimates. The Fund is an investment company under U.S. GAAP and follows the accounting and reporting guidance applicable to investment companies. The following is a summary of significant accounting policies followed by the Fund.
1. Security Valuation
Portfolio securities are valued at market value determined on the basis of market quotations or, if market quotations are not readily available or are unreliable, at “fair value” as determined in accordance with procedures approved by and under the oversight of the Fund’s Board of Directors (the “Board”). Pursuant to these procedures, AllianceBernstein L.P. (the “Adviser”) serves as the Fund’s valuation designee pursuant to Rule 2a-5 of the 1940 Act. In this capacity, the Adviser is responsible, among other things, for making all fair value determinations relating to the Fund’s portfolio investments, subject to the Board’s oversight.
In general, the market values of securities which are readily available and deemed reliable are determined as follows: securities listed on a national securities exchange (other than securities listed on the NASDAQ Stock Market, Inc. (“NASDAQ”)) or on a foreign securities exchange are valued at the last sale price at the close of the exchange or foreign securities exchange. If there has been no sale on such day, the securities are valued at the last traded price from the previous day. Securities listed on more than one exchange are valued by reference to the principal exchange on which the securities are traded; securities listed only on NASDAQ are valued in accordance with the NASDAQ Official Closing Price; listed or over the counter (“OTC”) market put or call options are valued at the mid level between the current bid and ask prices. If either a current bid or current ask price is unavailable, the Adviser will have discretion to determine the
| | |
| |
10 | AB US HIGH DIVIDEND ETF | | abfunds.com |
NOTES TO FINANCIAL STATEMENTS (continued)
best valuation (e.g., last trade price in the case of listed options); open futures are valued using the closing settlement price or, in the absence of such a price, the most recent quoted bid price. If there are no quotations available for the day of valuation, the last available closing settlement price is used; U.S. Government securities and any other debt instruments having 60 days or less remaining until maturity are generally valued at fair value by an independent pricing service. If an independent fair value price is available, the securities are valued at amortized cost. This methodology is commonly used for short term securities that have an original maturity of 60 days or less, as well as short term securities that had an original term to maturity that exceeded 60 days. In instances when amortized cost is utilized, the Valuation Committee (the “Committee”) must reasonably conclude that the utilization of amortized cost is approximately the same as the fair value of the security. Factors the Committee will consider include, but are not limited to, an impairment of the creditworthiness of the issuer or material changes in interest rates. Fixed-income securities, including mortgage-backed and asset-backed securities, may be valued on the basis of prices provided by a pricing service or at a price obtained from one or more of the major broker-dealers. In cases where broker-dealer quotes are obtained, the Adviser may establish procedures whereby changes in market yields or spreads are used to adjust, on a daily basis, a recently obtained quoted price on a security. Swaps and other derivatives are valued daily, primarily using independent pricing services, independent pricing models using market inputs, as well as third party broker-dealers or counterparties. Open-end mutual funds are valued at the closing net asset value (“NAV”) per share, while exchange-traded funds are valued at the closing market price per share.
Securities for which market quotations are not readily available (including restricted securities) or are deemed unreliable are valued at fair value as deemed appropriate by the Adviser. Factors considered in making this determination may include, but are not limited to, information obtained by contacting the issuer, analysts, analysis of the issuer’s financial statements or other available documents. In addition, the Fund may use fair value pricing for securities primarily traded in non-U.S. markets because most foreign markets close well before the Fund values its securities at 4:00 p.m., Eastern Time. The earlier close of these foreign markets gives rise to the possibility that significant events may have occurred in the interim and may materially affect the vailue of those securities. To account for this, the Fund may value foreign equity securities using fair value prices at the discretion of the Adviser.
| | |
| |
| abfunds.com | | AB US HIGH DIVIDEND ETF | 11 |
NOTES TO FINANCIAL STATEMENTS (continued)
2. Fair Value Measurements
In accordance with U.S. GAAP regarding fair value measurements, fair value is defined as the price that the Fund would receive to sell an asset or pay to transfer a liability in an orderly transaction between market participants at the measurement date. U.S. GAAP establishes a framework for measuring fair value, and a three-level hierarchy for fair value measurements based upon the transparency of inputs to the valuation of an asset or liability (including those valued based on their market values as described in Note A.1 above). Inputs may be observable or unobservable and refer broadly to the assumptions that market participants would use in pricing the asset or liability. Observable inputs reflect the assumptions market participants would use in pricing the asset or liability based on market data obtained from sources independent of the Fund. Unobservable inputs reflect the Fund’s own assumptions about the assumptions that market participants would use in pricing the asset or liability based on the best information available in the circumstances. Each investment is assigned a level based upon the observability of the inputs which are significant to the overall valuation. The three-tier hierarchy of inputs is summarized below.
| | • | | Level 1—quoted prices in active markets for identical investments |
| | • | | Level 2—other significant observable inputs (including quoted prices for similar investments, interest rates, prepayment speeds, credit risk, etc.) |
| | • | | Level 3—significant unobservable inputs (including the Fund’s own assumptions in determining the fair value of investments) |
Where readily available market prices or relevant bid prices are not available for certain equity investments, such investments may be valued based on similar publicly traded investments, movements in relevant indices since last available prices or based upon underlying company fundamentals and comparable company data (such as multiples to earnings or other multiples to equity). Where an investment is valued using an observable input, such as another publicly traded security, the investment will be classified as Level 2. If management determines that an adjustment is appropriate based on restrictions on resale, illiquidity or uncertainty, and such adjustment is a significant component of the valuation, the investment will be classified as Level 3. An investment will also be classified as Level 3 where management uses company fundamentals and other significant inputs to determine the valuation.
| | |
| |
12 | AB US HIGH DIVIDEND ETF | | abfunds.com |
NOTES TO FINANCIAL STATEMENTS (continued)
The following table summarizes the valuation of the Fund’s investments by the above fair value hierarchy levels as of November 30, 2024:
| | | | | | | | | | | | | | | | |
Investments in
Securities: | | Level 1 | | | Level 2 | | | Level 3 | | | Total | |
Assets: | | | | | | | | | | | | | | | | |
Common Stocks(a) | | $ | 25,344,287 | | | $ | – 0 | – | | $ | – 0 | – | | $ | 25,344,287 | |
Short-Term Investments | | | 57,416 | | | | – 0 | – | | | – 0 | – | | | 57,416 | |
| | | | | | | | | | | | | | | | |
Total Investments in Securities | | | 25,401,703 | | | | – 0 | – | | | – 0 | – | | | 25,401,703 | |
Other Financial Instruments(b) | | | – 0 | – | | | – 0 | – | | | – 0 | – | | | – 0 | – |
| | | | | | | | | | | | | | | | |
Total | | $ | 25,401,703 | | | $ | – 0 | – | | $ | – 0 | – | | $ | 25,401,703 | |
| | | | | | | | | | | | | | | | |
| (a) | See Portfolio of Investments for sector classifications. |
| (b) | Other financial instruments include derivative instruments, such as futures, forwards and swaps. Derivative instruments are valued at the unrealized appreciation (depreciation) on the instrument. Other financial instruments may also include swaps with upfront premiums, written options and written swaptions which are valued at market value. |
3. Currency Translation
Assets and liabilities denominated in foreign currencies and commitments under forward currency exchange contracts are translated into U.S. dollars at the mean of the quoted bid and ask prices of such currencies against the U.S. dollar. Purchases and sales of portfolio securities are translated into U.S. dollars at the rates of exchange prevailing when such securities were acquired or sold. Income and expenses are translated into U.S. dollars at rates of exchange prevailing when accrued.
Net realized gain or loss on foreign currency transactions represents foreign exchange gains and losses from sales and maturities of foreign fixed income investments, holding of foreign currencies, currency gains or losses realized between the trade and settlement dates on foreign investment transactions, and the difference between the amounts of dividends, interest and foreign withholding taxes recorded on the Fund’s books and the U.S. dollar equivalent amounts actually received or paid. Net unrealized currency gains and losses from valuing foreign currency denominated assets and liabilities at period end exchange rates are reflected as a component of net unrealized appreciation or depreciation of foreign currency denominated assets and liabilities.
4. Taxes
It is the Fund’s policy to meet the requirements of the Internal Revenue Code applicable to regulated investment companies and to distribute all of its investment company taxable income and net realized gains, if any, to shareholders. Therefore, no provisions for federal income or excise taxes are required. The Fund may be subject to taxes imposed by countries in which it invests. Such taxes are generally based on income and/or capital gains earned or repatriated. Taxes are accrued and applied to net investment
| | |
| |
| abfunds.com | | AB US HIGH DIVIDEND ETF | 13 |
NOTES TO FINANCIAL STATEMENTS (continued)
income, net realized gains and net unrealized appreciation/depreciation as such income and/or gains are earned.
In accordance with U.S. GAAP requirements regarding accounting for uncertainties in income taxes, management has analyzed the Fund’s tax positions taken or expected to be taken on federal and state income tax returns for all open tax years (the current and prior years) and has concluded that no provision for income tax is required in the Fund’s financial statements.
5. Investment Income and Investment Transactions
Dividend income is recorded on the ex-dividend date or as soon as the Fund is informed of the dividend. Interest income is accrued daily. Investment transactions are accounted for on the date the securities are purchased or sold. Investment gains or losses are determined on the identified cost basis. Non-cash dividends, if any, are recorded on the ex-dividend date at the fair value of the securities received. The Fund amortizes premiums and accretes discounts as adjustments to interest income.
The Fund accounts for distributions received from real estate investment trust (“REIT”) investments or from regulated investment companies as dividend income, realized gain, or return of capital based on information provided by the REIT or the investment company.
6. Dividends and Distributions
Dividends and distributions to shareholders, if any, are recorded on the ex-dividend date. Income dividends and capital gains distributions are determined in accordance with federal tax regulations and may differ from those determined in accordance with U.S. GAAP. To the extent these differences are permanent, such amounts are reclassified within the capital accounts based on their federal tax basis treatment; temporary differences do not require such reclassification.
7. Offering Expenses
The Adviser has agreed to pay all of the Fund’s organization and offering costs. The Fund is not obligated to repay any such organizational expenses or offering costs paid by the Adviser.
8. Cash and Short-Term Investments
Cash and short-term investments include cash on hand and short-term investments with maturities of less than one year when purchased.
NOTE B
Advisory Fee and Other Transactions with Affiliates
Under the terms of the investment advisory agreement, the Fund pays the Adviser a unitary advisory fee at an annual rate of .45% of the Fund’s average daily net assets. The fees are accrued daily and paid monthly.
| | |
| |
14 | AB US HIGH DIVIDEND ETF | | abfunds.com |
NOTES TO FINANCIAL STATEMENTS (continued)
Under the investment advisory agreement, in accordance with the unitary fee structure, the Adviser bears the cost of various third-party services required by the Fund, including audit, custodial, accounting, legal, transfer agency and printing costs and the fees and expenses of the Corporation’s directors and their counsel. Also under the investment advisory agreement, the Adviser will reimburse the Fund for the Fund’s share of the acquired funds fees and expenses (advisory fees and other expenses) of any pooled investment vehicle for which the Adviser serves as investment adviser. For the period ended November 30, 2024, such waiver/reimbursements relatingío the Fund’s investment in AB Government Money Market Portfolio mounted to $59.
A summary of the Fund’s transactions in AB mutual funds for the year ended November 30, 2024 is as follows:
| | | | | | | | | | | | | | | | | | | | |
Fund | | Market Value
11/30/23
(000) | | | Purchases
at Cost
(000) | | | Sales
Proceeds
(000) | | | Market Value
11/30/24
(000) | | | Dividend
Income
(000) | |
AB Government Money Market Portfolio | | $ | 28 | | | $ | 525 | | | $ | 496 | | | $ | 57 | | | $ | 2 | |
NOTE C
Distribution Plan
The Fund has adopted a Distribution and Service Plan pursuant to Rule 12b-1 of the Act which permits the Fund to pay distribution and servicing fees not to exceed .25% per year of the Fund’s average daily net assets. No such fees are currently paid, and the Board has not approved the commencement of payments under the Rule 12b-1 Distribution Plan.
NOTE D
Investment Transactions
Purchases and sales of investment securities (excluding short-term investments and in-kind purchases and sales) for the year ended November 30, 2024 were as follows:
| | | | | | | | |
| | | Purchases | | | Sales | |
Investment securities (excluding U.S. government securities) | | $ | 23,897,608 | | | $ | 23,727,139 | |
U.S. government securities | | | – 0 | – | | | – 0 | – |
During the year ended November 30, 2024, the Fund delivered portfolio securities for the redemption of Fund shares (in-kind redemptions). Cash and portfolio securities were transferred for redemptions at fair value. For financial reporting purposes, the Fund recorded net realized gains and
| | |
| |
| abfunds.com | | AB US HIGH DIVIDEND ETF | 15 |
NOTES TO FINANCIAL STATEMENTS (continued)
losses in connection with each in-kind redemption transaction. For the year ended November 30, 2024, the Fund had in-kind purchases and in-kind sales as follows:
| | | | | | | | |
| | | Purchases | | | Sales | |
In-kind transactions (excluding U.S. government securities) | | $ | 25,355,196 | | | $ | 10,838,967 | |
U.S. government securities | | | – 0 | – | | | – 0 | – |
The cost of investments for federal income tax purposes, gross unrealized appreciation and unrealized depreciation are as follows:
| | | | |
Cost | | $ | 22,318,126 | |
| | | | |
Gross unrealized appreciation | | $ | 3,319,184 | |
Gross unrealized depreciation | | | (235,607 | ) |
| | | | |
Net unrealized appreciation | | $ | 3,083,577 | |
| | | | |
1. Derivative Financial Instruments
The Fund may use derivatives in an effort to earn income and enhance returns, to replace more traditional direct investments, to obtain exposure to otherwise inaccessible markets (collectively, “investment purposes”), or to hedge or adjust the risk profile of its portfolio.
The Fund did not engage in derivatives transactions for the period ended November 30, 2024.
2. Currency Transactions
The Fund may invest in non-U.S. Dollar-denominated securities on a currency hedged or unhedged basis. The Fund may seek investment opportunities by taking long or short positions in currencies through the use of currency-related derivatives, including forward currency exchange contracts, futures and options on futures, swaps, and other options. The Fund may enter into transactions for investment opportunities when it anticipates that a foreign currency will appreciate or depreciate in value but securities denominated in that currency are not held by the Fund and do not present attractive investment opportunities. Such transactions may also be used when the Adviser believes that it may be more efficient than a direct investment in a foreign currency-denominated security. The Fund may also conduct currency exchange contracts on a spot basis (i.e., for cash at the spot rate prevailing in the currency exchange market for buying or selling currencies).
NOTE E
Shares of the Fund
The Fund’s shares may only be bought and sold in a secondary market through a broker-dealer at a market price. Because ETF shares trade at
| | |
| |
16 | AB US HIGH DIVIDEND ETF | | abfunds.com |
NOTES TO FINANCIAL STATEMENTS (continued)
market prices rather than NAV, shares may trade at a price greater than NAV (a premium) or less than NAV (a discount). The Fund issues and redeems shares at its NAV only in aggregations of a specified number of shares (a creation unit) generally in exchange for a designated portfolio of securities and/or cash (including any portion of such securities for which cash may be substituted). A fixed transaction fee is imposed on authorized participants in connection with creation unit redemption and creation transactions. Authorized participants may be required to pay an additional variable charge to cover certain costs and expenses related to the execution of trades resulting from creation unit transactions. Such variable charges, if any, are included in other capital within the Statement of Changes in Net Assets.
Transactions in shares of the Fund were as follows:
| | | | | | | | | | | | | | | | | | | | | | | | |
| | | | | | | | | | | | | | | | | | | | | | | | |
| | | Shares | | | | | | Amount | | | | |
| | | Year Ended
November 30,
2024 | | | March 22,
2023(a) to
November 30,
2023 | | | | | | Year Ended
November 30,
2024 | | | March 22,
2023(a) to
November 30,
2023 | | | | |
| | | | | | | | |
Shares sold | | | 380,000 | | | | 180,020 | | | | | | | $ | 25,475,234 | | | $ | 9,210,518 | | | | | |
| | | | | |
Shares redeemed | | | (160,000 | ) | | | (60,000 | ) | | | | | | | (10,838,866 | ) | | | (3,224,624 | ) | | | | |
| | | | | |
Net increase | | | 220,000 | | | | 120,020 | | | | | | | $ | 14,636,368 | | | $ | 5,985,894 | | | | | |
| | | | | |
| (a) | Commencement of operations. |
NOTE F
Risks Involved in Investing in the Fund
Market Risk—The value of the Fund’s assets will fluctuate as the market or markets in which the Fund invests fluctuate. The value of the Fund’s investments may decline, sometimes rapidly and unpredictably, simply because of economic changes or other events, including public health crises (including the occurrence of a contagious disease or illness), interest rate levels, and regional and global conflicts, that affect large portions of the market. It includes the risk that a particular style of investing may be underperforming the market generally.
Equity Securities Risk—The Fund invests in publicly-traded equity securities, and their value may fluctuate, sometimes rapidly and unpredictably, which means a security may be worth more or less than when it was purchased. These fluctuations can be based on a variety of factors including a company’s financial condition as well as macro-economic factors such as interest rates, inflation rates, global market conditions, and non-economic factors such as market perceptions and social or political events.
| | |
| |
| abfunds.com | | AB US HIGH DIVIDEND ETF | 17 |
NOTES TO FINANCIAL STATEMENTS (continued)
Dividend Paying Securities Risk—The Fund invests in securities that pay dividends. There can be no assurance that dividends will be declared or paid on securities held by the Fund in the future, or that dividends will remain at current levels or increase.
Capitalization Risk—Investments in mid-capitalization companies may be more volatile than investments in large-capitalization companies. Investments in mid-capitalization companies may have additional risks because these companies may have limited product lines, markets or financial resources.
Active Trading Risk—The Fund expects to engage in active and frequent trading of its portfolio securities and its portfolio turnover rate may greatly exceed 100%. A higher rate of portfolio turnover increases transaction costs, which may negatively affect the Fund’s return. In addition, a high rate of portfolio turnover may result in substantial short-term gains, which may have adverse tax consequences for Fund shareholders.
Quantitative Models—The Adviser uses quantitative models to identify investment opportunities. These models are based on the assumption that price movements in most markets display very similar patterns. There is the risk that market behavior will change and that the patterns upon which the forecasts in the models are based will weaken or disappear, which would reduce the ability of the models to generate an excess return. Further, as market dynamics shift over time, a previously highly successful model may become outdated, perhaps without the Adviser recognizing that fact before substantial losses are incurred. Successful operation of a model is also reliant upon the information technology systems of the Adviser and its ability to ensure those systems remain operational and that appropriate disaster recovery procedures are in place. There can be no assurance that the Adviser will be successful in maintaining effective and operational quantitative models and the related hardware and software systems.
Foreign (Non-U.S.) Investments Risk—Investments in securities of non-U.S. issuers may involve more risk than those of U.S. issuers. These securities may fluctuate more widely in price and may be more difficult to trade than domestic securities due to adverse market, economic, political, regulatory or other factors.
Non-Diversification Risk—The Fund may have more risk because it is “non-diversified”, meaning that it can invest more of its assets in a smaller number of issuers. Accordingly, changes in the value of a single security may have a more significant effect, either negative or positive, on the Fund’s net asset value (“NAV”) than on the NAV of a diversified fund.
| | |
| |
18 | AB US HIGH DIVIDEND ETF | | abfunds.com |
NOTES TO FINANCIAL STATEMENTS (continued)
Derivatives Risk—Derivatives may be difficult to price or unwind and leveraged so that small changes may produce disproportionate losses for the Fund. A short position in a derivative instrument involves the risk of a theoretically unlimited increase in the value of the underlying asset, reference rate or index, which could cause the Fund to suffer a potentially unlimited loss. Derivatives, especially over-the-counter derivatives, are also subject to counterparty risk, which is the risk that the counterparty (the party on the other side of the transaction) on a derivative transaction will be unable or unwilling to honor its contractual obligations to the Fund.
ETF Share Price and Net Asset Value Risk—The Fund’s shares are listed for trading on the NYSE Arca, Inc. (the “Exchange”). The Fund’s shares are generally bought and sold in the secondary market at market prices. The NAV of the Fund will fluctuate with changes in the market value of the Fund’s holdings. The Fund’s NAV is calculated once per day, at the end of the day. The market price of a share on the Exchange could be higher than the NAV (premium), or lower than the NAV (discount) and may fluctuate during the trading day. When all or a portion of the Fund’s underlying securities trade in a market that is closed when the market for the Fund’s shares is open, there may be differences between the current value of a security and the last quoted price for that security in the closed local market, which could lead to a deviation between the market value of the Fund’s shares and the Fund’s NAV. Disruptions in the creations and redemptions process or the existence of extreme market volatility could result in the Fund’s shares trading above or below NAV. As the Fund may invest in securities traded on foreign exchanges, Fund shares may trade at a larger premium or discount to the Fund’s NAV per share than shares of other ETFs. In addition, in stressed market conditions, the market for Fund shares may become less liquid in response to deteriorating liquidity in the markets for the Fund’s underlying portfolio holdings.
Authorized Participant Risk—Only a limited number of financial institutions that enter into an authorized participant relationship with the Fund (“Authorized Participants”) may engage in creation or redemption transactions. If the Fund’s Authorized Participants decide not to create or redeem shares, Fund shares may trade at a larger premium or discount to the Fund’s NAV per share, or the Fund could face trading halts or de-listing.
Active Trading Market Risk—There is no guarantee that an active trading market for Fund shares will exist at all times. In times of market stress, markets can suffer erratic or unpredictable trading activity, extraordinary volatility or wide bid/ask spreads, which could cause some market makers and Authorized Participants to reduce their market activity or “step away” from making a market in ETF shares. Market makers and Authorized
| | |
| |
| abfunds.com | | AB US HIGH DIVIDEND ETF | 19 |
NOTES TO FINANCIAL STATEMENTS (continued)
Participants are not obligated to place or execute purchase and redemption orders. This could cause the Fund’s market price to deviate, materially, from the NAV, and reduce the effectiveness of the ETF arbitrage process. Any absence of an active trading market for Fund shares could lead to a heightened risk that there will be a difference between the market price of a Fund share and the underlying value of the Fund share.
Indemnification Risk—In the ordinary course of business, the Fund enters into contracts that contain a variety of indemnifications. The Fund’s maximum exposure under these arrangements is unknown. However, the Fund has not had prior claims or losses pursuant to these indemnification provisions and expects the risk of loss thereunder to be remote. Therefore, the Fund has not accrued any liability in connection with these indemnification provisions.
Management Risk—The Fund is subject to management risk because it is an actively-managed investment fund. The Adviser will apply its investment techniques and risk analyses in making investment decisions, but there is no guarantee that its techniques will produce the intended results. Some of these techniques may incorporate, or rely upon, quantitative models, but there is no guarantee that these models will generate accurate forecasts, reduce risk or otherwise perform as expected.
NOTE G
Joint Credit Facility
A number of ETFs managed by the Adviser, including the Fund, participate in a $325 million revolving credit facility (the “Facility”) intended to provide short-term financing related to redemptions and other short term liquidity requirements, subject to certain restrictions. Commitment fees related to the Facility are paid by the participating funds and are included in miscellaneous expenses in the statement of operations. The Fund did not utilize the Facility during the period ended November 30, 2024.
NOTE H
Distributions to Shareholders
The tax character of distributions paid during the fiscal years ended November 30, 2024 and November 30, 2023 were as follows:
| | | | | | | | |
| | | 2024 | | | 2023 | |
Distributions paid from: | | | | | | | | |
Ordinary income | | $ | 285,495 | | | $ | 84,230 | |
| | | | | | | | |
Total taxable distributions | | | 285,495 | | | $ | 84,230 | |
| | | | | | | | |
| | |
| |
20 | AB US HIGH DIVIDEND ETF | | abfunds.com |
NOTES TO FINANCIAL STATEMENTS (continued)
As of November 30, 2024, the components of accumulated earnings (deficit) on a tax basis were as follows:
| | | | |
Undistributed ordinary income | | $ | 141,901 | |
Accumulated capital and other losses | | | (223,974 | )(a) |
Unrealized appreciation (depreciation) | | | 3,083,577 | (b) |
| | | | |
Total accumulated earnings (deficit) | | $ | 3,001,504 | |
| | | | |
| (a) | As of November 30, 2024, the Fund had a net capital loss carryforward of $223,974. |
| (b) | The differences between book-basis and tax-basis unrealized appreciation (depreciation) are attributable primarily to the tax treatment of swaps and the tax deferral of losses on wash sales. |
For tax purposes, net realized capital losses may be carried over to offset future capital gains, if any. Funds are permitted to carry forward capital losses for an indefinite period, and such losses will retain their character as either short-term or long-term capital losses. As of November 30, 2024, the Fund had a net short-term capital loss carryforward of $208,079 and a net long-term capital loss carryforward of $15,895, which may be carried forward for an indefinite period.
During the current fiscal year, permanent differences primarily due to the tax treatment of gains from a redemption-in-kind resulted in a net decrease in distributable earnings and a net increase in additional paid-in capital. These reclassifications had no effect on net assets.
NOTE I
Recent Accounting Pronouncements
In December 2022, the Financial Accounting Standards Board issued an Accounting Standards Update, ASU 2022-06, “Reference Rate Reform (Topic 848) – Deferral of the Sunset Date of Topic 848”. ASU 2022-06 is an amendment to ASU 2020-04, which provided optional guidance to ease the potential accounting burden due to the discontinuation of the LIBOR and other interbank-offered based reference rates and which was effective as of March 12, 2020 through December 31, 2022. ASU 2022-06 extends the effective period through December 31, 2024. Management is currently evaluating the impact, if any, of applying ASU 2022-06.
In November 2023, the Financial Accounting Standards Board issued Accounting Standards Update, ASU 2023-07, “Segment Reporting (Topic 280)”. ASU 2023-07 requires public entities to provide disclosure of significant segment expenses that are regularly provided to the chief operating decision maker (“CODM”). ASU 2023-07, among other things, (i) requires a single segment public entity to provide all necessary disclosures required by Topic 280 it, (ii) requires a public entity to disclose the title and position of the CODM and an explanation of how the CODM uses the reported measure(s) of segment profit and loss in assessing segment performance and deciding how to allocate resources and (iii) provides the ability for a public entity to
| | |
| |
| abfunds.com | | AB US HIGH DIVIDEND ETF | 21 |
NOTES TO FINANCIAL STATEMENTS (continued)
elect more than one performance measure. ASU 2023-07 is effective for fiscal years beginning after December 15, 2023, and interim periods within fiscal years beginning after December 15, 2024. Early adoption of ASU 2023-07 is permitted. Management is currently evaluating the impact, if any, of applying ASU 2023-07.
NOTE J
Subsequent Events
Management has evaluated subsequent events for possible recognition or disclosure in the financial statements through the date the financial statements are issued. Management has determined that there are no material events that would require disclosure in the Fund’s financial statements through this date.
| | |
| |
22 | AB US HIGH DIVIDEND ETF | | abfunds.com |
FINANCIAL HIGHLIGHTS
Selected Data For A Share of Capital Stock Outstanding Throughout Each Period
| | | | | | | | |
| | | Year Ended
November 30,
2024 | | | March 22,
2023(a) to
November 30,
2023 | |
| | | | | | | | |
| | | | |
Net asset value, beginning of period | | | $ 56.14 | | | | $ 50.00 | |
| | | | |
Income From Investment Operations | | | | | | | | |
| | |
Net investment income(b)(c) | | | 1.87 | | | | 1.05 | |
| | |
Net realized and unrealized gain on investment transactions | | | 18.49 | | | | 5.79 | |
| | | | |
Net increase in net asset value from operations | | | 20.36 | | | | 6.84 | |
| | | | |
Less: Dividends | |
| | |
Dividends from net investment income | | | (1.63 | ) | | | (.70 | ) |
| | | | |
Net asset value, end of period | | | $ 74.87 | | | | $ 56.14 | |
| | | | |
|
Total Return | |
| | |
Total investment return based on net asset value(d) | | | 36.89 | % | | | 13.74 | % |
|
Ratios/Supplemental Data | |
| | |
Net assets, end of period (000’s omitted) | | | $25,457 | | | | $6,738 | |
|
Ratio to average net assets of: | |
| | |
Expenses, net of waivers/reimbursements | | | .45 | % | | | .45 | %^ |
| | |
Expenses, before waivers/reimbursements | | | .45 | % | | | .45 | %^ |
| | |
Net investment income(c) | | | 2.83 | % | | | 2.82 | %^ |
| | |
Portfolio turnover rate(e) | | | 175 | % | | | 100 | % |
| (a) | Commencement of operations. |
| (b) | Based on average shares outstanding. |
| (c) | Net of expenses waived/reimbursed by the Adviser. |
| (d) | Total investment return is calculated assuming an initial investment made at the net asset value at the beginning of the period, reinvestment of all dividends and distributions at net asset value during the period, and redemption on the last day of the period. Total investment return does not reflect the deduction of taxes that a shareholder would pay on fund distributions or the redemption of fund shares. Total investment return calculated for a period of less than one year is not annualized. |
| (e) | Excludes the value of portfolio securities received or delivered as a result of in-kind purchases or redemptions of the Fund’s capital shares, including ETF Creation Units. |
See notes to financial statements.
| | |
| |
| abfunds.com | | AB US HIGH DIVIDEND ETF | 23 |
REPORT OF INDEPENDENT REGISTERED
PUBLIC ACCOUNTING FIRM
To the Shareholders and the Board of Directors of
AB US High Dividend ETF
Opinion on the Financial Statements
We have audited the accompanying statement of assets and liabilities of AB US High Dividend ETF (the “Fund”) (one of the funds constituting AB Active ETFs, Inc. (the “Corporation”)), including the portfolio of investments, as of November 30, 2024, and the related statement of operations for the year then ended, the statements of changes in net assets for the year then ended and the period from March 22, 2023 (commencement of operations) to November 30, 2023 and the financial highlights for the year then ended and for the period from March 22, 2023 (commencement of operations) to November 30, 2023 and the related notes (collectively referred to as the “financial statements”). In our opinion, the financial statements present fairly, in all material respects, the financial position of the Fund (one of the funds constituting AB Active ETFs, Inc.) at November 30, 2024, the results of its operations for the year then ended and the changes in its net assets for the year then ended and the period from March 22, 2023 (commencement of operations) to November 30, 2023 and its financial highlights for the year then ended and for the period from March 22, 2023 (commencement of operations) to November 30, 2023, in conformity with U.S. generally accepted accounting principles.
Basis for Opinion
These financial statements are the responsibility of the Corporation’s management. Our responsibility is to express an opinion on the Fund’s financial statements based on our audits. We are a public accounting firm registered with the Public Company Accounting Oversight Board (United States) (“PCAOB”) and are required to be independent with respect to the Corporation in accordance with the U.S. federal securities laws and the applicable rules and regulations of the Securities and Exchange Commission and the PCAOB.
We conducted our audits in accordance with the standards of the PCAOB. Those standards require that we plan and perform the audit to obtain reasonable assurance about whether the financial statements are free of material misstatement, whether due to error or fraud. The Corporation is not required to have, nor were we engaged to perform, an audit of the Corporation’s internal control over financial reporting. As part of our audits, we are required to obtain an understanding of internal control over financial reporting but not for the purpose of expressing an opinion on the effectiveness of the Corporation’s internal control over financial reporting. Accordingly, we express no such opinion.
| | |
| |
24 | AB US HIGH DIVIDEND ETF | | abfunds.com |
REPORT OF INDEPENDENT REGISTERED
PUBLIC ACCOUNTING FIRM (continued)
Our audits included performing procedures to assess the risks of material misstatement of the financial statements, whether due to error or fraud, and performing procedures that respond to those risks. Such procedures included examining, on a test basis, evidence regarding the amounts and disclosures in the financial statements. Our procedures included confirmation of securities owned as of November 30, 2024, by correspondence with the custodian, brokers and others; when replies were not received from brokers or others, we performed other auditing procedures. Our audits also included evaluating the accounting principles used and significant estimates made by management, as well as evaluating the overall presentation of the financial statements. We believe that our audits provide a reasonable basis for our opinion.

We have served as the auditor of one or more of the AB investment companies since 1968.
New York, New York
January 28, 2025
| | |
| |
| abfunds.com | | AB US HIGH DIVIDEND ETF | 25 |
2024 FEDERAL TAX INFORMATION
(unaudited)
For Federal income tax purposes, the following information is furnished with respect to the distributions paid by the Fund during the taxable period ended November 30, 2024. For individual shareholders, the Fund designates 84.62% of dividends paid as qualified dividend income. For corporate shareholders, 83.14% of dividends paid qualify for the dividends received deduction.
Shareholders should not use the above information to prepare their income tax returns. The information necessary to complete your income tax returns will be included with your Form 1099-DIV which will be sent to you separately in January 2025.
| | |
| |
26 | AB US HIGH DIVIDEND ETF | | abfunds.com |
Information Regarding the Review and Approval of the Fund’s Advisory Agreement
The disinterested directors (the “directors”) of AB Active ETFs, Inc. (the “Company”) unanimously approved the continuance of the Company’s Advisory Agreement with the Adviser in respect of AB US High Dividend ETF (the “Fund”) at a meeting held in-person on November 5-7, 2024 (the “Meeting”).
Prior to approval of the continuance of the Advisory Agreement, the directors had requested from the Adviser, and received and evaluated, extensive materials. They reviewed the proposed continuance of the Advisory Agreement with the Adviser and with experienced counsel who are independent of the Adviser, who advised on the relevant legal standards. The directors also reviewed additional materials, including comparative analytical data prepared by the Senior Vice President of the Fund. The directors also discussed the proposed continuance in private sessions with counsel.
The directors considered their knowledge of the nature and quality of the services to be provided by the Adviser to the Fund gained from their experience as directors or trustees of most of the registered investment companies advised by the Adviser, including the other series of the Company that are organized as exchange-traded funds (“ETFs”), their overall confidence in the Adviser’s integrity and competence they have gained from that experience, the Adviser’s initiative in identifying and raising potential issues with the directors and its responsiveness, frankness and attention to concerns raised by the directors in the past, including the Adviser’s willingness to consider and implement organizational and operational changes designed to improve investment results and the services provided to the AB Funds. The directors noted that they have four regular meetings each year, at each of which they review extensive materials and information from the Adviser, including information on the investment performance of the Fund and the money market fund advised by the Adviser in which the Fund invests a portion of its assets.
The directors also considered all factors they believed relevant, including the specific matters discussed below. During the course of their deliberations, the directors evaluated, among other things, the reasonableness of the advisory fee. The directors did not identify any particular information that was all-important or controlling, and different directors may have attributed different weights to the various factors. The directors determined that the selection of the Adviser to manage the Fund and the overall arrangements between the Fund and the Adviser, as provided in the Advisory Agreement, including the advisory fee, were fair and reasonable in light of the services to be performed, expenses to be incurred and such other matters as the directors considered relevant in the exercise of their
| | |
| |
| abfunds.com | | AB US HIGH DIVIDEND ETF | 27 |
business judgment. The material factors and conclusions that formed the basis for the directors’ determinations included the following:
Nature, Extent and Quality of Services Provided
The directors considered the scope and quality of services provided by the Adviser under the Advisory Agreement, including the quality of the investment research capabilities of the Adviser and the other resources it has dedicated to performing services for the Fund. The directors noted that the Adviser from time to time reviews the Fund’s investment strategies and may from time to time propose changes intended to improve the Fund’s relative or absolute performance for the directors’ consideration. They also noted the professional experience and qualifications of the Fund’s portfolio management team and other senior personnel of the Adviser. The directors also considered that the Advisory Agreement provides that the Fund will reimburse the Adviser for the cost to it of providing certain clerical, accounting, administrative and other services to the Fund by employees of the Adviser or its affiliates. Requests for these reimbursements will be subject to the directors’ approval on a quarterly basis. The directors noted that the Adviser does not expect to request such reimbursements. The quality of administrative and other services, including the Adviser’s role in coordinating the activities of the Fund’s other service providers, also was considered. The directors concluded that, overall, they were satisfied with the nature, extent and quality of services to be provided to the Fund under the Advisory Agreement.
Costs of Services Provided and Profitability
The directors reviewed a schedule of the revenues and expenses and related notes indicating the profitability of the Fund to the Adviser for the period ended December 31, 2023 that had been prepared with an expense allocation methodology arrived at in consultation with an independent consultant at the request of the directors. The directors noted that the assumptions and methods of allocation used by the Adviser in preparing profitability data for ETFs and understood that there are a number of potentially acceptable allocation methodologies for information of this type. The directors noted that the profitability information reflected all revenues and expenses of the Adviser’s relationship with the Fund. The directors recognized that it is difficult to make comparisons of the profitability of the Advisory Agreement with the profitability of ETF advisory contracts for unaffiliated ETFs because comparative information is not generally publicly available and is affected by numerous factors. The directors focused on the profitability of the Adviser’s relationship with the Fund before taxes and distribution expenses. The directors noted that the Fund was not profitable to the Adviser in the period reviewed.
Fall-Out Benefits
The directors considered the other benefits to the Adviser from its relationship with the Fund and the money market fund advised by the Adviser in
| | |
| |
28 | AB US HIGH DIVIDEND ETF | | abfunds.com |
which the Fund invests. The directors recognized that the Fund’s unprofitability to the Adviser would be exacerbated without these benefits. The directors understood that the Adviser also might derive reputational and other benefits from its association with the Fund.
Investment Results
In addition to the information reviewed by the directors in connection with the Meeting, the directors have received detailed performance information for the Fund at each regular Board meeting since the Fund’s inception.
At the Meeting, the directors reviewed information prepared by an independent service provider (the “15(c) service provider”), showing the Fund’s performance against a group of similar ETFs (“peer group”) and a larger group of similar ETFs (“peer universe”), each selected by the 15(c) service provider, and information prepared by the Adviser showing the Fund’s performance against a broad-based securities market index, in each case for the 1-year period ended July 31, 2024 and (in the case of comparisons with the broad-based securities market index) for the period from inception. Based on their review, the directors concluded that the Fund’s investment performance was acceptable.
Advisory Fees and Other Expenses
The directors considered the advisory fee rate payable by the Fund to the Adviser and information prepared by the 15(c) service provider concerning advisory fee rates payable by other funds in the same category as the Fund. The directors noted that the advisory fee is a unitary fee and that the Adviser pays all expenses of the Fund except for certain expenses payable by the Fund such as interest expense, taxes, extraordinary expenses, and brokerage commissions and other transaction costs. The directors recognized that it is difficult to make comparisons of advisory fees because there are variations in the services that are included in the fees payable by other ETFs. The directors compared the Fund’s contractual advisory fee rate against a peer group median and noted that it was lower than the median.
The directors also considered the Adviser’s fee schedule for other clients utilizing investment strategies similar to those of the Fund. For this purpose, they reviewed the relevant advisory fee information from the Adviser’s Form ADV and in a report from the Fund’s Senior Vice President and noted the differences between the Fund’s fee schedule, on the one hand, and the Adviser’s institutional fee schedule, on the other. The directors noted that the Adviser may, in some cases, agree to fee rates with large institutional clients that are lower than those reviewed by the directors and that they had previously discussed with the Adviser its policies in respect of such arrangements. The directors also compared the advisory fee rate for the Fund with that for another fund advised by the Adviser utilizing similar investment strategies.
| | |
| |
| abfunds.com | | AB US HIGH DIVIDEND ETF | 29 |
The Adviser reviewed with the directors the significantly greater scope of the services it provides to the Fund relative to institutional clients. In this regard, the Adviser noted, among other things, that, compared to institutional accounts, the Fund (i) demands considerably more managerial and administrative resources due to the potential for frequent creations and redemptions of shares; (ii) has more tax and regulatory restrictions and compliance obligations; (iii) must prepare and file or distribute regulatory and other communications about fund operations; and (iv) must provide shareholder servicing to retail investors. The Adviser also reviewed the greater legal risks presented by the large and changing population of Fund shareholders who may assert claims against the Adviser in individual or class actions, and the greater entrepreneurial risk in offering new fund products, which require substantial investment to launch, may not succeed, and generally must be priced to compete with larger, more established funds resulting in lack of profitability to the Adviser until a new fund achieves scale. In light of the substantial differences in services rendered by the Adviser to institutional clients as compared to the Fund, and the different risk profile, the directors considered these fee comparisons inapt and did not place significant weight on them in their deliberations. The directors noted that the unitary fee for the Fund covers additional services provided by third parties and thus is not directly comparable to the Adviser’s institutional fee schedule and the schedule of fees for most other funds advised by the Adviser.
In connection with their review of the Fund’s advisory fee, the directors also considered the Fund’s total expense ratio in comparison to the medians for a peer group and a peer universe selected by the 15(c) service provider. The Fund’s expense ratio was based on the Fund’s latest fiscal year. The directors view expense ratio information as relevant to their evaluation of the Adviser’s services because the Adviser is responsible for coordinating services provided to the Fund by others, and in most cases, the Adviser is responsible for paying for such services under its unitary fee arrangement with the Fund. The directors noted that the Fund’s expense ratio was lower than the medians. Based on their review, the directors concluded that the Fund’s expense ratio was acceptable.
Economies of Scale
The directors noted that the advisory fee schedule for the Fund does not contain breakpoints and that they had discussed their strong preference for breakpoints in advisory contracts with the Adviser. The directors took into consideration prior presentations by an independent consultant on economies of scale in the mutual fund industry and for the AB Funds, and presentations from time to time by the Adviser concerning certain of its views on economies of scale. The directors also had requested and received from the Adviser certain updates on economies of scale in advance of the Meeting. The directors believe that economies of scale may be realized (if at all) by the Adviser across a variety of products and services, and not only in
| | |
| |
30 | AB US HIGH DIVIDEND ETF | | abfunds.com |
respect of a single fund. The directors noted that there is no established methodology for setting breakpoints that give effect to the fund-specific services provided by a fund’s adviser and to the economies of scale that an adviser may realize in its overall mutual fund business or those components of it which directly or indirectly affect a fund’s operations. The directors observed that in the mutual fund industry as a whole, as well as among ETFs similar to the Fund, there is no uniformity or pattern in the fees and asset levels at which breakpoints (if any) apply. The directors also noted that the advisory agreements for many ETFs do not have breakpoints at all. The directors informed the Adviser that they would monitor the Fund’s asset level and its profitability to the Adviser and anticipated revisiting the question of breakpoints in the future if circumstances warranted doing so.
| | |
| |
| abfunds.com | | AB US HIGH DIVIDEND ETF | 31 |
NOTES
| | |
| |
32 | AB US HIGH DIVIDEND ETF | | abfunds.com |
AB US HIGH DIVIDEND ETF
66 Hudson Boulevard East
New York, NY 10001
800 221 5672
ETF-UHD-0151-1124 
NOV 11.30.24

ANNUAL FINANCIAL STATEMENTS AND ADDITIONAL INFORMATION
AB US LARGE CAP STRATEGIC EQUITIES ETF
(NYSE: LRGC)

A discussion of the Fund’s investment performance is not included in this report. AllianceBernstein L.P. would like to thank you for your interest in the Fund.
| | |
| |
| Investment Products Offered | | • Are Not FDIC Insured • May Lose Value • Are Not Bank Guaranteed |
Investors should consider the investment objectives, risks, charges and expenses of the Fund carefully before investing. For copies of our prospectus or summary prospectus, which contain this and other information, visit us online at www.abfunds.com or contact your AB representative. Please read the prospectus and/or summary prospectus carefully before investing.
This shareholder report must be preceded or accompanied by the Fund’s prospectus for individuals who are not current shareholders of the Fund.
You may obtain a description of the Fund’s proxy voting policies and procedures, and information regarding how the Fund voted proxies relating to portfolio securities during the most recent 12-month period ended June 30, without charge. Simply visit AB’s website at www.abfunds.com, or go to the Securities and Exchange Commission’s (the “Commission”) website at www.sec.gov, or call AB at (800) 227 4618.
The Fund files its complete schedule of portfolio holdings with the Commission for the first and third quarters of each fiscal year as an exhibit to its reports on Form N-PORT. The Fund’s Form N-PORT reports are available on the Commission’s website at www.sec.gov. AB publishes full portfolio holdings for the Fund daily at www.abfunds.com.
Foreside Fund Services, LLC (“Foreside”) is the distributor of the fund. Foreside is a member of FINRA.
The [A/B] logo and AllianceBernstein® are registered trademarks used by permission of the owner, AllianceBernstein L.P.
PORTFOLIO OF INVESTMENTS
November 30, 2024
| | | | | | | | |
| Company | | Shares | | | U.S. $ Value | |
| |
COMMON STOCKS – 98.2% | |
Information Technology – 29.1% | |
Electronic Equipment, Instruments & Components – 0.4% | | | | | | | | |
CDW Corp./DE | | | 5,718 | | | $ | 1,005,968 | |
| | | | | | | | |
| | |
Semiconductors & Semiconductor Equipment – 11.9% | | | | | | | | |
Broadcom, Inc. | | | 32,932 | | | | 5,337,618 | |
KLA Corp. | | | 2,516 | | | | 1,627,927 | |
NVIDIA Corp. | | | 133,255 | | | | 18,422,504 | |
NXP Semiconductors NV | | | 13,432 | | | | 3,080,898 | |
QUALCOMM, Inc. | | | 5,730 | | | | 908,377 | |
Taiwan Semiconductor Manufacturing Co., Ltd. (Sponsored ADR) | | | 8,083 | | | | 1,492,607 | |
| | | | | | | | |
| | | | | | | 30,869,931 | |
| | | | | | | | |
Software – 12.0% | | | | | | | | |
Adobe, Inc.(a) | | | 6,364 | | | | 3,283,378 | |
Gen Digital, Inc. | | | 10,082 | | | | 311,030 | |
HubSpot, Inc.(a) | | | 1,881 | | | | 1,356,295 | |
Microsoft Corp. | | | 46,068 | | | | 19,507,955 | |
Oracle Corp. | | | 30,901 | | | | 5,711,741 | |
ServiceNow, Inc.(a) | | | 938 | | | | 984,375 | |
| | | | | | | | |
| | | | | | | 31,154,774 | |
| | | | | | | | |
Technology Hardware, Storage & Peripherals – 4.8% | | | | | | | | |
Apple, Inc. | | | 49,800 | | | | 11,819,034 | |
Western Digital Corp.(a) | | | 10,745 | | | | 784,278 | |
| | | | | | | | |
| | | | | | | 12,603,312 | |
| | | | | | | | |
| | | | | | | 75,633,985 | |
| | | | | | | | |
Financials – 13.6% | |
Banks – 3.3% | |
Bank of America Corp. | | | 77,132 | | | | 3,664,541 | |
Wells Fargo & Co. | | | 64,240 | | | | 4,893,161 | |
| | | | | | | | |
| | | | | | | 8,557,702 | |
| | | | | | | | |
Capital Markets – 3.7% | | | | | | | | |
Charles Schwab Corp. (The) | | | 55,270 | | | | 4,574,145 | |
Goldman Sachs Group, Inc. (The) | | | 8,136 | | | | 4,951,326 | |
| | | | | | | | |
| | | | | | | 9,525,471 | |
| | | | | | | | |
Financial Services – 4.6% | | | | | | | | |
Fiserv, Inc.(a) | | | 11,960 | | | | 2,642,682 | |
Visa, Inc. – Class A | | | 29,892 | | | | 9,418,371 | |
| | | | | | | | |
| | | | | | | 12,061,053 | |
| | | | | | | | |
Insurance – 2.0% | | | | | | | | |
Progressive Corp. (The) | | | 14,279 | | | | 3,839,337 | |
Willis Towers Watson PLC | | | 4,305 | | | | 1,386,210 | |
| | | | | | | | |
| | | | | | | 5,225,547 | |
| | | | | | | | |
| | | | | | | 35,369,773 | |
| | | | | | | | |
| | |
| |
| abfunds.com | | AB US LARGE CAP STRATEGIC EQUITIES ETF | 1 |
PORTFOLIO OF INVESTMENTS (continued)
| | | | | | | | |
| Company | | Shares | | | U.S. $ Value | |
| |
Health Care – 12.3% | |
Biotechnology – 1.6% | |
Regeneron Pharmaceuticals, Inc.(a) | | | 1,985 | | | $ | 1,489,187 | |
Vertex Pharmaceuticals, Inc.(a) | | | 5,928 | | | | 2,775,074 | |
| | | | | | | | |
| | | | | | | 4,264,261 | |
| | | | | | | | |
Health Care Equipment & Supplies – 1.8% | | | | | | | | |
Edwards Lifesciences Corp.(a) | | | 15,703 | | | | 1,120,409 | |
Medtronic PLC | | | 39,808 | | | | 3,444,984 | |
| | | | | | | | |
| | | | | | | 4,565,393 | |
| | | | | | | | |
Health Care Providers & Services – 3.7% | | | | | | | | |
Labcorp Holdings, Inc. | | | 7,366 | | | | 1,776,385 | |
UnitedHealth Group, Inc. | | | 12,947 | | | | 7,900,259 | |
| | | | | | | | |
| | | | | | | 9,676,644 | |
| | | | | | | | |
Life Sciences Tools & Services – 3.0% | | | | | | | | |
IQVIA Holdings, Inc.(a) | | | 15,912 | | | | 3,195,766 | |
Thermo Fisher Scientific, Inc. | | | 4,251 | | | | 2,251,457 | |
Waters Corp.(a) | | | 5,951 | | | | 2,289,469 | |
| | | | | | | | |
| | | | | | | 7,736,692 | |
| | | | | | | | |
Pharmaceuticals – 2.2% | | | | | | | | |
Merck & Co., Inc. | | | 19,168 | | | | 1,948,236 | |
Roche Holding AG (Sponsored ADR) | | | 56,932 | | | | 2,063,216 | |
Zoetis, Inc. | | | 9,434 | | | | 1,653,308 | |
| | | | | | | | |
| | | | | | | 5,664,760 | |
| | | | | | | | |
| | | | | | | 31,907,750 | |
| | | | | | | | |
Communication Services – 11.9% | | | | | | | | |
Diversified Telecommunication Services – 1.2% | | | | | | | | |
Comcast Corp. – Class A | | | 72,681 | | | | 3,139,092 | |
| | | | | | | | |
|
Entertainment – 1.3% | |
Walt Disney Co. (The) | | | 29,385 | | | | 3,451,856 | |
| | | | | | | | |
|
Interactive Media & Services – 8.0% | |
Alphabet, Inc. – Class C | | | 69,706 | | | | 11,884,176 | |
Meta Platforms, Inc. – Class A | | | 15,387 | | | | 8,837,062 | |
| | | | | | | | |
| | | | | | | 20,721,238 | |
| | | | | | | | |
Wireless Telecommunication Services – 1.4% | | | | | | | | |
T-Mobile US, Inc. | | | 14,716 | | | | 3,633,969 | |
| | | | | | | | |
| | | | | | | 30,946,155 | |
| | | | | | | | |
Consumer Discretionary – 8.0% | |
Broadline Retail – 4.2% | |
Amazon.com, Inc.(a) | | | 52,910 | | | | 10,999,460 | |
| | | | | | | | |
|
Hotels, Restaurants & Leisure – 1.0% | |
Hyatt Hotels Corp. – Class A | | | 6,017 | | | | 950,325 | |
Starbucks Corp. | | | 16,497 | | | | 1,690,282 | |
| | | | | | | | |
| | | | | | | 2,640,607 | |
| | | | | | | | |
| | |
| |
2 | AB US LARGE CAP STRATEGIC EQUITIES ETF | | abfunds.com |
PORTFOLIO OF INVESTMENTS (continued)
| | | | | | | | |
| Company | | Shares | | | U.S. $ Value | |
| |
Specialty Retail – 2.2% | | | | | | | | |
AutoZone, Inc.(a) | | | 506 | | | $ | 1,603,787 | |
Home Depot, Inc. (The) | | | 9,237 | | | | 3,963,874 | |
| | | | | | | | |
| | | | | | | 5,567,661 | |
| | | | | | | | |
Textiles, Apparel & Luxury Goods – 0.6% | | | | | | | | |
NIKE, Inc. – Class B | | | 19,675 | | | | 1,549,800 | |
| | | | | | | | |
| | | | | | | 20,757,528 | |
| | | | | | | | |
Industrials – 7.9% | | | | | | | | |
Building Products – 0.7% | | | | | | | | |
Otis Worldwide Corp. | | | 17,943 | | | | 1,847,770 | |
| | | | | | | | |
| | |
Electrical Equipment – 2.6% | | | | | | | | |
Eaton Corp. PLC | | | 11,063 | | | | 4,153,271 | |
GE Vernova, Inc.(a) | | | 7,492 | | | | 2,503,227 | |
| | | | | | | | |
| | | | | | | 6,656,498 | |
| | | | | | | | |
Ground Transportation – 1.5% | | | | | | | | |
CSX Corp. | | | 107,191 | | | | 3,917,831 | |
| | | | | | | | |
| | |
Industrial Conglomerates – 0.6% | | | | | | | | |
Honeywell International, Inc. | | | 6,706 | | | | 1,562,029 | |
| | | | | | | | |
| | |
Machinery – 2.2% | | | | | | | | |
Deere & Co. | | | 4,461 | | | | 2,078,380 | |
PACCAR, Inc. | | | 22,056 | | | | 2,580,552 | |
Pentair PLC | | | 10,002 | | | | 1,090,118 | |
| | | | | | | | |
| | | | | | | 5,749,050 | |
| | | | | | | | |
Professional Services – 0.3% | | | | | | | | |
Booz Allen Hamilton Holding Corp. | | | 5,220 | | | | 773,500 | |
| | | | | | | | |
| | | | | | | 20,506,678 | |
| | | | | | | | |
Consumer Staples – 5.8% | | | | | | | | |
Beverages – 1.6% | | | | | | | | |
Coca-Cola Co. (The) | | | 37,614 | | | | 2,410,305 | |
Constellation Brands, Inc. – Class A | | | 7,662 | | | | 1,846,159 | |
| | | | | | | | |
| | | | | | | 4,256,464 | |
| | | | | | | | |
Consumer Staples Distribution & Retail – 3.2% | | | | | | | | |
Costco Wholesale Corp. | | | 2,005 | | | | 1,948,619 | |
Walmart, Inc. | | | 68,055 | | | | 6,295,088 | |
| | | | | | | | |
| | | | | | | 8,243,707 | |
| | | | | | | | |
Household Products – 1.0% | | | | | | | | |
Procter & Gamble Co. (The) | | | 14,648 | | | | 2,625,801 | |
| | | | | | | | |
| | | | | | | 15,125,972 | |
| | | | | | | | |
Energy – 3.7% | | | | | | | | |
Energy Equipment & Services – 1.3% | | | | | | | | |
Baker Hughes Co. | | | 73,939 | | | | 3,249,619 | |
| | | | | | | | |
| | |
| |
| abfunds.com | | AB US LARGE CAP STRATEGIC EQUITIES ETF | 3 |
PORTFOLIO OF INVESTMENTS (continued)
| | | | | | | | |
| Company | | Shares | | | U.S. $ Value | |
| |
Oil, Gas & Consumable Fuels – 2.4% | | | | | | | | |
Cameco Corp. (New York) | | | 30,065 | | | $ | 1,787,364 | |
Chevron Corp. | | | 10,206 | | | | 1,652,658 | |
EOG Resources, Inc. | | | 21,749 | | | | 2,898,272 | |
| | | | | | | | |
| | | | 6,338,294 | |
| | | | | | | | |
| | | | 9,587,913 | |
| | | | | | | | |
Materials – 2.8% | |
Chemicals – 2.8% | |
Corteva, Inc. | | | 37,404 | | | | 2,328,025 | |
Linde PLC | | | 5,211 | | | | 2,402,219 | |
LyondellBasell Industries NV – Class A | | | 29,716 | | | | 2,476,531 | |
| | | | | | | | |
| | | | 7,206,775 | |
| | | | | | | | |
Real Estate – 1.6% | |
Industrial REITs – 1.0% | |
Prologis, Inc. | | | 22,849 | | | | 2,668,306 | |
| | | | | | | | |
| | |
Specialized REITs – 0.6% | | | | | | | | |
American Tower Corp. | | | 7,219 | | | | 1,508,771 | |
| | | | | | | | |
| | | | 4,177,077 | |
| | | | | | | | |
Utilities – 1.5% | |
Electric Utilities – 1.5% | |
American Electric Power Co., Inc. | | | 20,891 | | | | 2,086,175 | |
NextEra Energy, Inc. | | | 24,370 | | | | 1,917,188 | |
| | | | | | | | |
| | | | 4,003,363 | |
| | | | | | | | |
Total Common Stocks
(cost $219,721,108) | | | | | | | 255,222,969 | |
| | | | | | | | |
| | | | | | | | |
SHORT-TERM INVESTMENTS – 1.7% | |
Investment Companies – 1.7% | |
AB Fixed Income Shares, Inc. – Government Money Market Portfolio – Class AB,
4.54%(b)(c)(d)
(cost $4,578,396) | | | 4,578,396 | | | | 4,578,396 | |
| | | | | | | | |
| | |
Total Investments – 99.9%
(cost $224,299,504) | | | | | | | 259,801,365 | |
Other assets less liabilities – 0.1% | | | | | | | 156,059 | |
| | | | | | | | |
| | |
Net Assets – 100.0% | | | | | | $ | 259,957,424 | |
| | | | | | | | |
| (a) | Non-income producing security. |
| (b) | Affiliated investments. |
| (c) | The rate shown represents the 7-day yield as of period end. |
| (d) | To obtain a copy of the fund’s shareholder report, please go to the Securities and Exchange Commission’s website at www.sec.gov, or call AB at (800) 227-4618. |
Glossary:
ADR – American Depositary Receipt
REIT – Real Estate Investment Trust
See notes to financial statements.
| | |
| |
4 | AB US LARGE CAP STRATEGIC EQUITIES ETF | | abfunds.com |
STATEMENT OF ASSETS & LIABILITIES
November 30, 2024
| | | | |
| Assets | |
Investments in securities, at value | | | | |
Unaffiliated issuers (cost $219,721,108) | | $ | 255,222,969 | |
Affiliated issuers (cost $4,578,396) | | | 4,578,396 | |
Unaffiliated dividends receivable | | | 236,737 | |
Affiliated dividends receivable | | | 16,278 | |
Receivable due from Adviser | | | 743 | |
| | | | |
Total assets | | | 260,055,123 | |
| | | | |
| Liabilities | |
Due to custodian | | | 287 | |
Advisory fee payable | | | 97,412 | |
| | | | |
Total liabilities | | | 97,699 | |
| | | | |
Net Assets | | $ | 259,957,424 | |
| | | | |
| Composition of Net Assets | |
Capital stock, at par | | $ | 374 | |
Additional paid-in capital | | | 223,704,402 | |
Distributable earnings | | | 36,252,648 | |
| | | | |
Net Assets | | $ | 259,957,424 | |
| | | | |
Net Asset Value Per Share—500 million shares of capital stock authorized, $.0001 par value
(based on 3,735,020 shares outstanding) | | $ | 69.60 | |
| | | | |
See notes to financial statements.
| | |
| |
| abfunds.com | | AB US LARGE CAP STRATEGIC EQUITIES ETF | 5 |
STATEMENT OF OPERATIONS
Year Ended November 30, 2024
| | | | | | | | |
| Investment Income | | | | | | | | |
Dividends | | | | | | | | |
Unaffiliated issuers (net of foreign taxes withheld of $15,214) | | $ | 1,466,320 | | | | | |
Affiliated issuers | | | 110,117 | | | | | |
Interest | | | 70 | | | $ | 1,576,507 | |
| | | | | | | | |
| Expenses | | | | | | | | |
Advisory fee (see Note B) | | | 613,957 | | | | | |
| | | | | | | | |
Total expenses | | | 613,957 | | | | | |
Less: expenses waived and reimbursed by the Adviser (see Note B) | | | (3,805 | ) | | | | |
| | | | | | | | |
Net expenses | | | | | | | 610,152 | |
| | | | | | | | |
Net investment income | | | | | | | 966,355 | |
| | | | | | | | |
| Realized and Unrealized Gain (Loss) on Investment and Foreign Currency Transactions | | | | | | | | |
Net realized gain (loss) on: | | | | | | | | |
Investment transactions | | | | | | | (114,748 | ) |
In-kind redemptions | | | | | | | 778,746 | |
Net change in unrealized appreciation (depreciation) of: | | | | | | | | |
Investments | | | | | | | 33,947,174 | |
Foreign currency denominated assets and liabilities | | | | | | | 5 | |
| | | | | | | | |
Net gain on investment and foreign currency transactions | | | | | | | 34,611,177 | |
| | | | | | | | |
Net Increase in Net Assets from Operations | | | | | | $ | 35,577,532 | |
| | | | | | | | |
See notes to financial statements.
| | |
| |
6 | AB US LARGE CAP STRATEGIC EQUITIES ETF | | abfunds.com |
STATEMENT OF CHANGES IN NET ASSETS
| | | | | | | | |
| | | Year Ended
November 30,
2024 | | | September 20,
2023(a) to
November 30,
2023 | |
| Increase (Decrease) in Net Assets from Operations | | | | | | | | |
Net investment income | | $ | 966,355 | | | $ | 51,429 | |
Net realized gain (loss) on investment transactions | | | 663,998 | | | | (79,799 | ) |
Net change in unrealized appreciation (depreciation) of investments and foreign currency denominated assets and liabilities | | | 33,947,179 | | | | 1,554,687 | |
| | | | | | | | |
Net increase in net assets from operations | | | 35,577,532 | | | | 1,526,317 | |
Distribution to Shareholders | | | (74,652 | ) | | | – 0 | – |
| Transactions in Shares of the Fund | | | | | | | | |
Net increase | | | 187,042,367 | | | | 35,885,860 | |
| | | | | | | | |
Total increase | | | 222,545,247 | | | | 37,412,177 | |
| Net Assets | |
Beginning of period | | | 37,412,177 | | | | – 0 | – |
| | | | | | | | |
End of period | | $ | 259,957,424 | | | $ | 37,412,177 | |
| | | | | | | | |
| (a) | Commencement of operations. |
See notes to financial statements.
| | |
| |
| abfunds.com | | AB US LARGE CAP STRATEGIC EQUITIES ETF | 7 |
NOTES TO FINANCIAL STATEMENTS
November 30, 2024
NOTE A
Significant Accounting Policies
AB Active ETFs, Inc. (the “Corporation”) is registered under the Investment Company Act of 1940 (the “1940 Act”) as an open-end management investment company. The Corporation, which is a Maryland corporation, operates as a series company comprised of 15 funds currently in operation. Each fund is considered to be a separate entity for financial reporting and tax purposes. This report relates only to the AB US Large Cap Strategic Equities ETF (the “Fund”), a non-diversified portfolio. The Fund commenced investment operations on September 20, 2023. The financial statements have been prepared in conformity with U.S. generally accepted accounting principles (“U.S. GAAP”), which require management to make certain estimates and assumptions that affect the reported amounts of assets and liabilities in the financial statements and amounts of income and expenses during the reporting period. Actual results could differ from those estimates. The Fund is an investment company under U.S. GAAP and follows the accounting and reporting guidance applicable to investment companies. The following is a summary of significant accounting policies followed by the Fund.
1. Security Valuation
Portfolio securities are valued at market value determined on the basis of market quotations or, if market quotations are not readily available or are unreliable, at “fair value” as determined in accordance with procedures approved by and under the oversight of the Fund’s Board of Directors (the “Board”). Pursuant to these procedures, AllianceBernstein L.P. (the “Adviser”) serves as the Fund’s valuation designee pursuant to Rule 2a-5 of the 1940 Act. In this capacity, the Adviser is responsible, among other things, for making all fair value determinations relating to the Fund’s portfolio investments, subject to the Board’s oversight.
In general, the market values of securities which are readily available and deemed reliable are determined as follows: securities listed on a national securities exchange (other than securities listed on the NASDAQ Stock Market, Inc. (“NASDAQ”)) or on a foreign securities exchange are valued at the last sale price at the close of the exchange or foreign securities exchange. If there has been no sale on such day, the securities are valued at the last traded price from the previous day. Securities listed on more than one exchange are valued by reference to the principal exchange on which the securities are traded; securities listed only on NASDAQ are valued in accordance with the NASDAQ Official Closing Price; listed or over the counter (“OTC”) market put or call options are valued at the mid level between the current bid and ask prices. If either a current bid or current ask price is unavailable, the Adviser will have discretion to determine the best valuation (e.g., last trade price in the case of listed options); open
| | |
| |
8 | AB US LARGE CAP STRATEGIC EQUITIES ETF | | abfunds.com |
NOTES TO FINANCIAL STATEMENTS (continued)
futures are valued using the closing settlement price or, in the absence of such a price, the most recent quoted bid price. If there are no quotations available for the day of valuation, the last available closing settlement price is used; U.S. Government securities and any other debt instruments having 60 days or less remaining until maturity are generally valued at fair value by an independent pricing service. If an independent fair value is not available, the securities are valued at amortized cost. This methodology is commonly used for short term securities that have an original maturity of 60 days or less, as well as short term securities that had an original term to maturity that exceeded 60 days. In instances when amortized cost is utilized, the Valuation Committee (the “Committee”) must reasonably conclude that the utilization of amortized cost is approximately the same as the fair value of the security. Factors the Committee will consider include, but are not limited to, an impairment of the creditworthiness of the issuer or material changes in interest rates. Fixed-income securities, including mortgage-backed and asset-backed securities, may be valued on the basis of prices provided by a pricing service or at a price obtained from one or more of the major broker-dealers. In cases where broker-dealer quotes are obtained, the Adviser may establish procedures whereby changes in market yields or spreads are used to adjust, on a daily basis, a recently obtained quoted price on a security. Swaps and other derivatives are valued daily, primarily using independent pricing services, independent pricing models using market inputs, as well as third party broker-dealers or counterparties. Open-end mutual funds are valued at the closing net asset value (“NAV”) per share, while exchange-traded funds are valued at the closing market price per share.
Securities for which market quotations are not readily available (including restricted securities) or are deemed unreliable are valued at fair value as deemed appropriate by the Adviser. Factors considered in making this determination may include, but are not limited to, information obtained by contacting the issuer, analysts, analysis of the issuer’s financial statements or other available documents. In addition, the Fund may use fair value pricing for securities primarily traded in non-U.S. markets because most foreign markets close well before the Fund values its securities at 4:00 p.m., Eastern Time. The earlier close of these foreign markets gives rise to the possibility that significant events may have occurred in the interim and may materially affect the value of those securities. To account for this, the Fund generally values many of its foreign equity securities using fair value prices at the discretion of the Adviser.
2. Fair Value Measurements
In accordance with U.S. GAAP regarding fair value measurements, fair value is defined as the price that the Fund would receive to sell an asset or
| | |
| |
| abfunds.com | | AB US LARGE CAP STRATEGIC EQUITIES ETF | 9 |
NOTES TO FINANCIAL STATEMENTS (continued)
pay to transfer a liability in an orderly transaction between market participants at the measurement date. U.S. GAAP establishes a framework for measuring fair value, and a three-level hierarchy for fair value measurements based upon the transparency of inputs to the valuation of an asset or liability (including those valued based on their market values as described in Note A.1 above). Inputs may be observable or unobservable and refer broadly to the assumptions that market participants would use in pricing the asset or liability. Observable inputs reflect the assumptions market participants would use in pricing the asset or liability based on market data obtained from sources independent of the Fund. Unobservable inputs reflect the Fund’s own assumptions about the assumptions that market participants would use in pricing the asset or liability based on the best information available in the circumstances. Each investment is assigned a level based upon the observability of the inputs which are significant to the overall valuation. The three-tier hierarchy of inputs is summarized below.
| | • | | Level 1—quoted prices in active markets for identical investments |
| | • | | Level 2—other significant observable inputs (including quoted prices for similar investments, interest rates, prepayment speeds, credit risk, etc.) |
| | • | | Level 3—significant unobservable inputs (including the Fund’s own assumptions in determining the fair value of investments) |
Where readily available market prices or relevant bid prices are not available for certain equity investments, such investments may be valued based on similar publicly traded investments, movements in relevant indices since last available prices or based upon underlying company fundamentals and comparable company data (such as multiples to earnings or other multiples to equity). Where an investment is valued using an observable input, such as another publicly traded security, the investment will be classified as Level 2. If management determines that an adjustment is appropriate based on restrictions on resale, illiquidity or uncertainty, and such adjustment is a significant component of the valuation, the investment will be classified as Level 3. An investment will also be classified as Level 3 where management uses company fundamentals and other significant inputs to determine the valuation.
| | |
| |
10 | AB US LARGE CAP STRATEGIC EQUITIES ETF | | abfunds.com |
NOTES TO FINANCIAL STATEMENTS (continued)
The following table summarizes the valuation of the Fund’s investments by the above fair value hierarchy levels as of November 30, 2024:
| | | | | | | | | | | | | | | | |
Investments in
Securities: | | Level 1 | | | Level 2 | | | Level 3 | | | Total | |
Assets: | | | | | | | | | | | | | | | | |
Common Stocks(a) | | $ | 255,222,969 | | | $ | – 0 | – | | $ | – 0 | – | | $ | 255,222,969 | |
Short-Term Investments | | | 4,578,396 | | | | – 0 | – | | | – 0 | – | | | 4,578,396 | |
| | | | | | | | | | | | | | | | |
Total Investments in Securities | | | 259,801,365 | | | | – 0 | – | | | – 0 | – | | | 259,801,365 | |
Other Financial Instruments(b) | | | – 0 | – | | | – 0 | – | | | – 0 | – | | | – 0 | – |
| | | | | | | | | | | | | | | | |
Total | | $ | 259,801,365 | | | $ | – 0 | – | | $ | – 0 | – | | $ | 259,801,365 | |
| | | | | | | | | | | | | | | | |
| (a) | See Portfolio of Investments for sector classifications. |
| (b) | Other financial instruments include derivative instruments, such as futures, forwards and swaps. Derivative instruments are valued at the unrealized appreciation (depreciation) on the instrument. Other financial instruments may also include swaps with upfront premiums, written options and written swaptions which are valued at market value. |
3. Currency Translation
Assets and liabilities denominated in foreign currencies and commitments under forward currency exchange contracts are translated into U.S. dollars at the mean of the quoted bid and ask prices of such currencies against the U.S. dollar. Purchases and sales of portfolio securities are translated into U.S. dollars at the rates of exchange prevailing when such securities were acquired or sold. Income and expenses are translated into U.S. dollars at rates of exchange prevailing when accrued.
Net realized gain or loss on foreign currency transactions represents foreign exchange gains and losses from sales and maturities of foreign fixed income investments, holding of foreign currencies, currency gains or losses realized between the trade and settlement dates on foreign investment transactions, and the difference between the amounts of dividends, interest and foreign withholding taxes recorded on the Fund’s books and the U.S. dollar equivalent amounts actually received or paid. Net unrealized currency gains and losses from valuing foreign currency denominated assets and liabilities at period end exchange rates are reflected as a component of net unrealized appreciation or depreciation of foreign currency denominated assets and liabilities.
4. Taxes
It is the Fund’s policy to meet the requirements of the Internal Revenue Code applicable to regulated investment companies and to distribute all of its investment company taxable income and net realized gains, if any, to shareholders. Therefore, no provisions for federal income or excise taxes are required. The Fund may be subject to taxes imposed by countries in which it invests. Such taxes are generally based on income and/or capital
| | |
| |
| abfunds.com | | AB US LARGE CAP STRATEGIC EQUITIES ETF | 11 |
NOTES TO FINANCIAL STATEMENTS (continued)
gains earned or repatriated. Taxes are accrued and applied to net investment income, net realized gains and net unrealized appreciation/depreciation as such income and/or gains are earned.
In accordance with U.S. GAAP requirements regarding accounting for uncertainties in income taxes, management has analyzed the Fund’s tax positions taken or expected to be taken on federal and state income tax returns for all open tax years (the current and prior years) and has concluded that no provision for income tax is required in the Fund’s financial statements.
5. Investment Income and Investment Transactions
Dividend income is recorded on the ex-dividend date or as soon as the Fund is informed of the dividend. Interest income is accrued daily. Investment transactions are accounted for on the date the securities are purchased or sold. Investment gains or losses are determined on the identified cost basis. Non-cash dividends, if any, are recorded on the ex-dividend date at the fair value of the securities received. The Fund amortizes premiums and accretes discounts as adjustments to interest income.
The Fund accounts for distributions received from real estate investment trust (“REIT”) investments or from regulated investment companies as dividend income, realized gain, or return of capital based on information provided by the REIT or the investment company.
6. Dividends and Distributions
Dividends and distributions to shareholders, if any, are recorded on the ex-dividend date. Income dividends and capital gains distributions are determined in accordance with federal tax regulations and may differ from those determined in accordance with U.S. GAAP. To the extent these differences are permanent, such amounts are reclassified within the capital accounts based on their federal tax basis treatment; temporary differences do not require such reclassification.
7. Offering Expenses
The Adviser has agreed to pay all of the Fund’s organization and offering costs. The Fund is not obligated to repay any such organizational expenses or offering costs paid by the Adviser.
8. Cash and Short-Term Investments
Cash and short-term investments include cash on hand and short-term investments with maturities of less than one year when purchased.
| | |
| |
12 | AB US LARGE CAP STRATEGIC EQUITIES ETF | | abfunds.com |
NOTES TO FINANCIAL STATEMENTS (continued)
NOTE B
Advisory Fee and Other Transactions with Affiliates
Under the terms of the investment advisory agreement, the Fund pays the Adviser a unitary advisory fee at an annual rate of .48% of the Fund’s average daily net assets. The fees are accrued daily and paid monthly.
Under the investment advisory agreement, in accordance with the unitary fee structure, the Adviser bears the cost of various third-party services required by the Fund, including audit, custodial, accounting, legal, transfer agency and printing costs and the fees and expenses of the Corporation’s directors and their counsel. Also under the investment advisory agreement, the Adviser will reimburse the Fund for the Fund’s share of the acquired funds fees and expenses (advisory fees and other expenses) of any pooled investment vehicle for which the Adviser serves as investment adviser. For the year ended November 30, 2024, such waiver/reimbursements relating to the Fund’s investment in AB Government Money Market Portfolio amounted to $3,805.
A summary of the Fund’s transactions in AB mutual funds for the year ended November 30, 2024 is as follows:
| | | | | | | | | | | | | | | | | | | | |
Fund | | Market Value
11/30/23
(000) | | | Purchases
at Cost
(000) | | | Sales
Proceeds
(000) | | | Market Value
11/30/24
(000) | | | Dividend
Income
(000) | |
AB Government Money Market Portfolio | | $ | 594 | | | $ | 7,303 | | | $ | 3,319 | | | $ | 4,578 | | | $ | 110 | |
NOTE C
Distribution Plan
The Fund has adopted a Distribution and Service Plan pursuant to Rule 12b-1 of the Act which permits the Fund to pay distribution and servicing fees not to exceed .25% per year of the Fund’s average daily net assets. No such fees are currently paid, and the Board has not approved the commencement of payments under the Rule 12b-1 Distribution Plan.
NOTE D
Investment Transactions
Purchases and sales of investment securities (excluding short-term investments and in-kind purchases and sales) for the year ended November 30, 2024 were as follows:
| | | | | | | | |
| | | Purchases | | | Sales | |
Investment securities (excluding U.S. government securities) | | $ | 26,769,376 | | | $ | 24,430,794 | |
U.S. government securities | | | – 0 | – | | | – 0 | – |
| | |
| |
| abfunds.com | | AB US LARGE CAP STRATEGIC EQUITIES ETF | 13 |
NOTES TO FINANCIAL STATEMENTS (continued)
During the year ended November 30, 2024, the Fund delivered portfolio securities for the redemption of Fund shares (in-kind redemptions). Cash and portfolio securities were transferred for redemptions at fair value. For financial reporting purposes, the Fund recorded net realized gains and losses in connection with each in-kind redemption transaction. For the year ended November 30, 2023, the Fund had in-kind purchases and in-kind sales as follows:
| | | | | | | | |
| | | Purchases | | | Sales | |
In-kind transactions (excluding U.S. government securities) | | $ | 184,745,934 | | | $ | 3,203,058 | |
U.S. government securities | | | –0 | – | | | –0 | – |
The cost of investments for federal income tax purposes, gross unrealized appreciation and unrealized depreciation are as follows:
| | | | |
Cost | | $ | 224,330,745 | |
| | | | |
Gross unrealized appreciation | | $ | 37,867,791 | |
Gross unrealized depreciation | | | (2,397,171 | ) |
| | | | |
Net unrealized appreciation | | $ | 35,470,620 | |
| | | | |
1. Derivative Financial Instruments
The Fund may use derivatives in an effort to earn income and enhance returns, to replace more traditional direct investments, to obtain exposure to otherwise inaccessible markets (collectively, “investment purposes”), or to hedge or adjust the risk profile of its portfolio.
The Fund did not engage in derivatives transactions for the year ended November 30, 2024.
2. Currency Transactions
The Fund may invest in non-U.S. Dollar-denominated securities on a currency hedged or unhedged basis. The Fund may seek investment opportunities by taking long or short positions in currencies through the use of currency-related derivatives, including forward currency exchange contracts, futures and options on futures, swaps, and other options. The Fund may enter into transactions for investment opportunities when it anticipates that a foreign currency will appreciate or depreciate in value but securities denominated in that currency are not held by the Fund and do not present attractive investment opportunities. Such transactions may also be used when the Adviser believes that it may be more efficient than a direct investment in a foreign currency-denominated security. The Fund may also conduct currency exchange contracts on a spot basis (i.e., for cash at the spot rate prevailing in the currency exchange market for buying or selling currencies).
| | |
| |
14 | AB US LARGE CAP STRATEGIC EQUITIES ETF | | abfunds.com |
NOTES TO FINANCIAL STATEMENTS (continued)
NOTE E
Shares of the Fund
The Fund’s shares may only be bought and sold in a secondary market through a broker-dealer at a market price. Because ETF shares trade at market prices rather than NAV, shares may trade at a price greater than NAV (a premium) or less than NAV (a discount). The Fund issues and redeems shares at its NAV only in aggregations of a specified number of shares (a creation unit) generally in exchange for a designated portfolio of securities and/or cash (including any portion of such securities for which cash may be substituted). A fixed transaction fee is imposed on authorized participants in connection with creation unit redemption and creation transactions. Authorized participants may be required to pay an additional variable charge to cover certain costs and expenses related to the execution of trades resulting from creation unit transactions. Such variable charges, if any, are included in other capital within the Statement of Changes in Net Assets.
Transactions in shares of the Fund were as follows:
| | | | | | | | | | | | | | | | | | | | | | | | |
| | | | | | | | | | | | | | | | | | | | | | | | |
| | | Shares | | | | | | Amount | | | | |
| | | Year Ended
November 30,
2024 | | | September 20, 2023(a) to
November 30,
2023 | | | | | | Year Ended
November 30,
2024 | | | September 20, 2023(a) to
November 30,
2023 | | | | |
| | | | | | | | |
Shares sold | | | 3,075,000 | | | | 720,020 | | | | | | | $ | 191,117,853 | | | $ | 35,885,860 | | | | | |
| | | | | |
Shares redeemed | | | (60,000 | ) | | | – 0 | – | | | | | | | (4,075,486 | ) | | | – 0 | – | | | | |
| | | | | |
Net increase | | | 3,015,000 | | | | 720,020 | | | | | | | $ | 187,042,367 | | | $ | 35,885,860 | | | | | |
| | | | | |
| (a) | Commencement of operations. |
NOTE F
Risks Involved in Investing in the Fund
Market Risk—The value of the Fund’s assets will fluctuate as the market or markets in which the Fund invests fluctuate. The value of the Fund’s investments may decline, sometimes rapidly and unpredictably, simply because of economic changes or other events, including public health crises (including the occurrence of a contagious disease or illness), interest rate levels, and regional and global conflicts, that affect large portions of the market. It includes the risk that a particular style of investing may be underperforming the market generally.
Equity Securities Risk—The Fund invests in publicly-traded equity securities, and their value may fluctuate, sometimes rapidly and unpredictably, which means a security may be worth more or less than when it was purchased. These fluctuations can be based on a variety of factors including a company’s financial condition as well as macro-economic factors such as
| | |
| |
| abfunds.com | | AB US LARGE CAP STRATEGIC EQUITIES ETF | 15 |
NOTES TO FINANCIAL STATEMENTS (continued)
interest rates, inflation rates, global market conditions, and non-economic factors such as market perceptions and social or political events.
Capitalization Risk—Investments in small- and mid-capitalization companies may be more volatile than investments in large-capitalization companies. Investments in small-capitalization companies may have additional risks because these companies have limited product lines, markets or financial resources.
Foreign (Non-US) Investments Risk—Investments in securities of non-U.S. issuers may involve more risk than those of U.S. issuers. These securities may fluctuate more widely in price and may be more difficult to trade than domestic securities due to adverse market, economic, political, regulatory or other factors.
Non-Diversification Risk—The Fund may have more risk because it is “non-diversified”, meaning that it can invest more of its assets in a smaller number of issuers. Accordingly, changes in the value of a single security may have a more significant effect, either negative or positive, on the Fund’s net asset value (“NAV”) than on the NAV of a diversified fund.
ETF Share Price and Net Asset Value Risk—The Fund’s shares are listed for trading on the NYSE Arca, Inc. (the “Exchange”). The Fund’s shares are generally bought and sold in the secondary market at market prices. The NAV of the Fund will fluctuate with changes in the market value of the Fund’s holdings. The Fund’s NAV is calculated once per day, at the end of the day. The market price of a share on the Exchange could be higher than the NAV (premium), or lower than the NAV (discount) and may fluctuate during the trading day. When all or a portion of the Fund’s underlying securities trade in a market that is closed when the market for the Fund’s shares is open, there may be differences between the current value of a security and the last quoted price for that security in the closed local market, which could lead to a deviation between the market value of the Fund’s shares and the Fund’s NAV. Disruptions in the creations and redemptions process or the existence of extreme market volatility could result in the Fund’s shares trading above or below NAV. As the Fund may invest in securities traded on foreign exchanges, Fund shares may trade at a larger premium or discount to the Fund’s NAV per share than shares of other ETFs. In addition, in stressed market conditions, the market for Fund shares may become less liquid in response to deteriorating liquidity in the markets for the Fund’s underlying portfolio holdings.
Authorized Participant Risk—Only a limited number of financial institutions that enter into an authorized participant relationship with the Fund (“Authorized Participants”) may engage in creation or redemption
| | |
| |
16 | AB US LARGE CAP STRATEGIC EQUITIES ETF | | abfunds.com |
NOTES TO FINANCIAL STATEMENTS (continued)
transactions. If the Fund’s Authorized Participants decide not to create or redeem shares, Fund shares may trade at a larger premium or discount to the Fund’s NAV per share, or the Fund could face trading halts or de-listing.
Active Trading Market Risk—There is no guarantee that an active trading market for Fund shares will exist at all times. In times of market stress, markets can suffer erratic or unpredictable trading activity, extraordinary volatility or wide bid/ask spreads, which could cause some market makers and Authorized Participants to reduce their market activity or “step away” from making a market in ETF shares. Market makers and Authorized Participants are not obligated to place or execute purchase and redemption orders. This could cause the Fund’s market price to deviate, materially, from the NAV, and reduce the effectiveness of the ETF arbitrage process. Any absence of an active trading market for Fund shares could lead to a heightened risk that there will be a difference between the market price of a Fund share and the underlying value of the Fund share.
Indemnification Risk—In the ordinary course of business, the Fund enters into contracts that contain a variety of indemnifications. The Fund’s maximum exposure under these arrangements is unknown. However, the Fund has not had prior claims or losses pursuant to these indemnification provisions and expects the risk of loss thereunder to be remote. Therefore, the Fund has not accrued any liability in connection with these indemnification provisions.
Management Risk—The Fund is subject to management risk because it is an actively-managed ETF. The Adviser will apply its investment techniques and risk analyses in making investment decisions, but there is no guarantee that its techniques will produce the intended results. Some of these techniques may incorporate, or rely upon, quantitative models, but there is no guarantee that these models will generate accurate forecasts, reduce risk or otherwise perform as expected.
NOTE G
Joint Credit Facility
A number of open-end mutual funds managed by the Adviser, including the Fund, participate in a $325 million revolving credit facility (the “Facility”) intended to provide short-term financing related to redemptions and other short term liquidity requirements, subject to certain restrictions. Commitment fees related to the Facility are paid by the participating funds and are included in miscellaneous expenses in the statement of operations. The Fund did not utilize the Facility during the year ended November 30, 2024.
| | |
| |
| abfunds.com | | AB US LARGE CAP STRATEGIC EQUITIES ETF | 17 |
NOTES TO FINANCIAL STATEMENTS (continued)
NOTE H
Distributions to Shareholders
The tax character of distributions paid during the fiscal year ended November 30, 2024 and fiscal period ended November 30, 2023 were as follows:
| | | | | | | | |
| | | 2024 | | | 2023 | |
Distributions paid from: | | | | | | | | |
Ordinary income | | $ | 74,652 | | | $ | – 0 | – |
| | | | | | | | |
Total taxable distributions | | $ | 74,652 | | | $ | – 0 | – |
| | | | | | | | |
As of November 30, 2024, the components of accumulated earnings (deficit) on a tax basis were as follows:
| | | | |
Undistributed ordinary income | | $ | 941,686 | |
Accumulated capital and other losses | | | (159,663 | )(a) |
Unrealized appreciation (depreciation) | | | 35,470,625 | (b) |
| | | | |
Total accumulated earnings (deficit) | | $ | 36,252,648 | |
| | | | |
| (a) | As of November 30, 2024, the Fund had a net capital loss carryforward of $159,663. |
| (b) | The difference between book-basis and tax-basis unrealized appreciation (depreciation) is attributable primarily to the tax deferral of losses on wash sales. |
For tax purposes, net realized capital losses may be carried over to offset future capital gains, if any. Funds are permitted to carry forward capital losses for an indefinite period, and such losses will retain their character as either short-term or long-term capital losses. As of November 30, 2024, the Fund had a net short-term capital loss carryforward of $122,926 and a net long-term capital loss carryforward of $36,737, which may be carried forward for an indefinite period.
During the current fiscal year, permanent differences primarily due to the utilization of earnings and profits distributed to shareholders on redemption of shares and the tax treatment of gains from a redemption-in-kind resulted in a net decrease in distributable earnings and a net increase in additional paid-in capital. These reclassifications had no effect on net assets.
NOTE I
Recent Accounting Pronouncements
In December 2022, the Financial Accounting Standards Board issued an Accounting Standards Update, ASU 2022-06, “Reference Rate Reform (Topic 848) – Deferral of the Sunset Date of Topic 848”. ASU 2022-06 is an amendment to ASU 2020-04, which provided optional guidance to ease the potential accounting burden due to the discontinuation of the LIBOR and other interbank-offered based reference rates and which was effective as of March 12, 2020 through December 31, 2022. ASU 2022-06 extends the effective period through December 31, 2024. Management is currently evaluating the impact, if any, of applying ASU 2022-06.
| | |
| |
18 | AB US LARGE CAP STRATEGIC EQUITIES ETF | | abfunds.com |
NOTES TO FINANCIAL STATEMENTS (continued)
In November 2023, the Financial Accounting Standards Board issued Accounting Standards Update, ASU 2023-07, “Segment Reporting (Topic 280)”. ASU 2023-07 requires public entities to provide disclosure of significant segment expenses that are regularly provided to the chief operating decision maker (“CODM”). ASU 2023-07, among other things, (i) requires a single segment public entity to provide all necessary disclosures required by Topic 280 it, (ii) requires a public entity to disclose the title and position of the CODM and an explanation of how the CODM uses the reported measure(s) of segment profit and loss in assessing segment performance and deciding how to allocate resources and (iii) provides the ability for a public entity to elect more than one performance measure. ASU 2023-07 is effective for fiscal years beginning after December 15, 2023, and interim periods within fiscal years beginning after December 15, 2024. Early adoption of ASU 2023-07 is permitted. Management is currently evaluating the impact, if any, of applying ASU 2023-07.
NOTE J
Subsequent Events
Management has evaluated subsequent events for possible recognition or disclosure in the financial statements through the date the financial statements are issued. Management has determined that there are no material events that would require disclosure in the Fund’s financial statements through this date.
| | |
| |
| abfunds.com | | AB US LARGE CAP STRATEGIC EQUITIES ETF | 19 |
FINANCIAL HIGHLIGHTS
Selected Data For A Share of Capital Stock Outstanding Throughout Each Period
| | | | | | | | |
| | | Year Ended
November 30,
2024 | | | September 20, 2023(a) to
November 30,
2023 | |
| | | | |
| | | | | | | | |
Net asset value, beginning of period | | | $ 51.96 | | | | $ 50.00 | |
| | | | |
Income From Investment Operations | | | | | | | | |
| | |
Net investment income(b)(c) | | | .47 | | | | .12 | |
| | |
Net realized and unrealized gain on investment transactions | | | 17.26 | | | | 1.84 | |
| | | | |
Net increase in net asset value from operations | | | 17.73 | | | | 1.96 | |
| | | | |
| | |
Less: Dividends | | | | | | | | |
| | |
Dividends from net investment income | | | (.09 | ) | | | – 0 | – |
| | | | |
Net asset value, end of period | | | $ 69.60 | | | | $ 51.96 | |
| | | | |
| | |
Total Return | | | | | | | | |
| | |
Total investment return based on net asset value(d) | | | 34.20 | % | | | 3.92 | % |
| | |
Ratios/Supplemental Data | | | | | | | | |
| | |
Net assets, end of period (000’s omitted) | | | $259,957 | | | | $37,412 | |
| | |
Ratio to average net assets of: | | | | | | | | |
| | |
Expenses, net of waivers/reimbursements | | | .48 | % | | | .48 | %^ |
| | |
Expenses, before waivers/reimbursements | | | .48 | % | | | .48 | %^ |
| | |
Net investment income(c) | | | .76 | % | | | 1.24 | %^ |
| | |
Portfolio turnover rate(e) | | | 19 | % | | | 4 | % |
| (a) | Commencement of operations. |
| (b) | Based on average shares outstanding. |
| (c) | Net of expenses waived/reimbursed by the Adviser. |
| (d) | Total investment return is calculated assuming an initial investment made at the net asset value at the beginning of the period, reinvestment of all dividends and distributions at net asset value during the period, and redemption on the last day of the period. Total investment return does not reflect the deduction of taxes that a shareholder would pay on fund distributions or the redemption of fund shares. Total investment return calculated for a period of less than one year is not annualized. |
| (e) | Excludes the value of portfolio securities received or delivered as a result of in-kind purchases or redemptions of the Fund’s capital shares, including ETF Creation Units. |
See notes to financial statements.
| | |
| |
20 | AB US LARGE CAP STRATEGIC EQUITIES ETF | | abfunds.com |
REPORT OF INDEPENDENT REGISTERED
PUBLIC ACCOUNTING FIRM
To the Shareholders and the Board of Directors of
AB US Large Cap Strategic Equities ETF
Opinion on the Financial Statements
We have audited the accompanying statement of assets and liabilities of AB US Large Cap Strategic Equities ETF (the “Fund”) (one of the funds constituting AB Active ETFs, Inc. (the “Corporation”)), including the portfolio of investments, as of November 30, 2024, and the related statement of operations for the year then ended, the statements of changes in net assets and the financial highlights for the year then ended and for the period from September 20, 2023 (commencement of operations) to November 30, 2023 and the related notes (collectively referred to as the “financial statements”). In our opinion, the financial statements present fairly, in all material respects, the financial position of the Fund (one of the funds constituting AB Active ETFs, Inc.) at November 30, 2024, the results of its operations for the year then ended and the changes in its net assets and its financial highlights for the year then ended and for the period from September 20, 2023 (commencement of operations) to November 30, 2023, in conformity with U.S. generally accepted accounting principles.
Basis for Opinion
These financial statements are the responsibility of the Corporation’s management. Our responsibility is to express an opinion on the Fund’s financial statements based on our audits. We are a public accounting firm registered with the Public Company Accounting Oversight Board (United States) (“PCAOB”) and are required to be independent with respect to the Corporation in accordance with the U.S. federal securities laws and the applicable rules and regulations of the Securities and Exchange Commission and the PCAOB.
We conducted our audits in accordance with the standards of the PCAOB. Those standards require that we plan and perform the audit to obtain reasonable assurance about whether the financial statements are free of material misstatement, whether due to error or fraud. The Corporation is not required to have, nor were we engaged to perform, an audit of the Corporation’s internal control over financial reporting. As part of our audits, we are required to obtain an understanding of internal control over financial reporting but not for the purpose of expressing an opinion on the effectiveness of the Corporation’s internal control over financial reporting. Accordingly, we express no such opinion.
Our audits included performing procedures to assess the risks of material misstatement of the financial statements, whether due to error or fraud, and performing procedures that respond to those risks. Such procedures
| | |
| |
| abfunds.com | | AB US LARGE CAP STRATEGIC EQUITIES ETF | 21 |
REPORT OF INDEPENDENT REGISTERED
PUBLIC ACCOUNTING FIRM (continued)
included examining, on a test basis, evidence regarding the amounts and disclosures in the financial statements. Our procedures included confirmation of securities owned as of November 30, 2024, by correspondence with the custodian, brokers and others; when replies were not received from brokers or others, we performed other auditing procedures. Our audits also included evaluating the accounting principles used and significant estimates made by management, as well as evaluating the overall presentation of the financial statements. We believe that our audits provide a reasonable basis for our opinion.

We have served as the auditor of one or more of the AB investment companies since 1968.
New York, New York
January 28, 2025
| | |
| |
22 | AB US LARGE CAP STRATEGIC EQUITIES ETF | | abfunds.com |
2024 FEDERAL TAX INFORMATION
(unaudited)
For Federal income tax purposes, the following information is furnished with respect to the distributions paid by the Fund during the taxable year ended November 30, 2024. For foreign shareholders, 2.15% of ordinary income dividends paid may be considered to be qualifying to be taxed as interest-related dividends. For individual shareholders, the Fund designates 31.11% of dividends paid as qualified dividend income. For corporate shareholders, 31.11% of dividends paid qualify for the dividends received deduction.
Shareholders should not use the above information to prepare their income tax returns. The information necessary to complete your income tax returns will be included with your Form 1099-DIV which will be sent to you separately in January 2025.
| | |
| |
| abfunds.com | | AB US LARGE CAP STRATEGIC EQUITIES ETF | 23 |
Information Regarding the Review and Approval of the Fund’s Advisory Agreement
The disinterested directors (the “directors”) of AB Active ETFs, Inc. (the “Company”) unanimously approved the Company’s Advisory Agreement with the Adviser in respect of AB US Large Cap Strategic Equities ETF (the “Fund”) for an initial two-year period at a meeting held by video conference on January 31-February 1, 2023 (the “Meeting”).
Prior to approval of the Advisory Agreement, the directors had requested from the Adviser, and received and evaluated, extensive materials. They reviewed the proposed Advisory Agreement with the Adviser and with experienced counsel who are independent of the Adviser, who advised on the relevant legal standards. The directors also reviewed additional materials, including comparative analytical data prepared by the Senior Vice President of the Fund. The directors also discussed the proposed approval in private sessions with counsel.
The directors considered their knowledge of the nature and quality of the services to be provided by the Adviser to the Fund gained from their experience as directors or trustees of most of the registered investment companies advised by the Adviser, their overall confidence in the Adviser’s integrity and competence they have gained from that experience, the Adviser’s initiative in identifying and raising potential issues with the directors and its responsiveness, frankness and attention to concerns raised by the directors in the past, including the Adviser’s willingness to consider and implement organizational and operational changes designed to improve investment results and the services provided to the AB Funds. The directors noted that they have four regular meetings each year, at each of which they review extensive materials and information from the Adviser, including information on the investment performance of the AB Funds.
The directors also considered all factors they believed relevant, including the specific matters discussed below. During the course of their deliberations, the directors evaluated, among other things, the reasonableness of the proposed advisory fee. The directors did not identify any particular information that was all-important or controlling, and different directors may have attributed different weights to the various factors. The directors determined that the selection of the Adviser to manage the Fund and the overall arrangements between the Fund and the Adviser, as provided in the Advisory Agreement, including the proposed advisory fee, were fair and reasonable in light of the services to be performed, expenses to be incurred and such other matters as the directors considered relevant in the exercise of their business judgment. The material factors and conclusions that formed the basis for the directors’ determinations included the following:
Nature, Extent and Quality of Services to be Provided
The directors considered the scope and quality of services to be provided by the Adviser under the Advisory Agreement, including the quality of the
| | |
| |
24 | AB US LARGE CAP STRATEGIC EQUITIES ETF | | abfunds.com |
investment research capabilities of the Adviser and the other resources it has dedicated to performing services for the AB Funds. They also noted the professional experience and qualifications of the Fund’s portfolio management team and other senior personnel of the Adviser. The directors also considered that the Advisory Agreement provides that the Fund will reimburse the Adviser for the cost to it of providing certain clerical, accounting, administrative and other services to the Fund by employees of the Adviser or its affiliates. Requests for these reimbursements will be subject to the directors’ approval on a quarterly basis. The directors noted that the Adviser does not expect to request such reimbursements. The quality of administrative and other services, including the Adviser’s role in coordinating the activities of the Fund’s other service providers, also was considered. The directors concluded that, overall, they were satisfied with the nature, extent and quality of services to be provided to the Fund under the Advisory Agreement.
Costs of Services to be Provided and Profitability
Because the Fund had not yet commenced operations, the directors were unable to consider historical information about the profitability of the Fund. However, the Adviser agreed to provide the directors with profitability information in connection with future proposed continuances of the Advisory Agreement. They also considered the costs to be borne by the Adviser in providing services to the Fund and that the Fund was unlikely to be profitable to the Adviser unless it achieves a material level of net assets.
Fall-Out Benefits
The directors considered the other benefits to the Adviser from its proposed relationship with the Fund. The directors recognized that the Adviser’s future profitability would be somewhat lower without these benefits. The directors understood that the Adviser also might derive reputational and other benefits from its association with the Fund.
Investment Results
Since the Fund had not yet commenced operations, no performance or other historical information for the Fund was available. Based on the Adviser’s written and oral presentations regarding the proposed management of the Fund and their general knowledge and confidence in the Adviser’s expertise in managing mutual funds, the directors concluded that they were satisfied that the Adviser was capable of providing high quality Fund management services to the Fund.
Advisory Fees and Other Expenses
The directors considered the proposed advisory fee rate payable by the Fund to the Adviser and information prepared by an independent service provider (the “15(c) service provider”), concerning advisory fee rates payable by other funds in the same category as the Fund, based on the Fund’s projected net assets of $250 million. The directors noted that the proposed
| | |
| |
| abfunds.com | | AB US LARGE CAP STRATEGIC EQUITIES ETF | 25 |
advisory fee is a unitary fee and that the Adviser will pay all expenses of the Fund except for certain expenses payable by the Fund such as interest expense, taxes, extraordinary expenses, and brokerage commissions and other transaction costs. The directors recognized that it is difficult to make comparisons of advisory fees because there are variations in the services that are included in the fees payable by other funds. The directors considered the Fund’s proposed contractual advisory fee rate against a peer group median and noted that it was equal to the median.
The Adviser informed the directors that there were no institutional accounts managed by the Adviser that utilize investment strategies similar to those proposed for the Fund.
In connection with their review of the Fund’s proposed advisory fee, the directors also considered the projected total expense ratio of the shares of the Fund in comparison to a group of similar funds (“peer group”) and a larger group of similar funds (“peer universe”) selected by the 15(c) service provider. The directors view the projected expense ratio information as relevant to their evaluation of the Adviser’s services because the Adviser is responsible for coordinating services provided to the Fund by others. Based on their review, the directors concluded that the Fund’s projected expense ratio was acceptable.
Economies of Scale
The directors noted that the proposed advisory fee schedule for the Fund does not contain breakpoints and that they had discussed their strong preference for breakpoints in advisory contracts with the Adviser. The directors took into consideration prior presentations by an independent consultant on economies of scale in the mutual fund industry and for the AB Funds, and presentations from time to time by the Adviser concerning certain of its views on economies of scale. The directors also had requested and received from the Adviser certain updates on economies of scale in advance of the Meeting. The directors believe that economies of scale may be realized (if at all) by the Adviser across a variety of products and services, and not only in respect of a single fund. The directors noted that there is no established methodology for setting breakpoints that give effect to the fund-specific services provided by a fund’s adviser and to the economies of scale that an adviser may realize in its overall mutual fund business or those components of it which directly or indirectly affect a fund’s operations. The directors observed that in the mutual fund industry as a whole, as well as among funds similar to the Fund, there is no uniformity or pattern in the fees and asset levels at which breakpoints (if any) apply. The directors also noted that the advisory agreements for many ETFs do not have breakpoints at all. The directors informed the Adviser that they would monitor the Fund’s asset level and its profitability to the Adviser and anticipated revisiting the question of breakpoints in the future if circumstances warranted doing so.
| | |
| |
26 | AB US LARGE CAP STRATEGIC EQUITIES ETF | | abfunds.com |
NOTES
| | |
| |
| abfunds.com | | AB US LARGE CAP STRATEGIC EQUITIES ETF | 27 |
NOTES
| | |
| |
28 | AB US LARGE CAP STRATEGIC EQUITIES ETF | | abfunds.com |
AB US LARGE CAP STRATEGIC EQUITIES ETF
66 Hudson Boulevard East
New York, NY 10001
800 221 5672
ETF-ULCSE-0151-1124 
NOV 11.30.24

ANNUAL FINANCIAL STATEMENTS AND ADDITIONAL INFORMATION
AB US LOW VOLATILITY
EQUITY ETF
(NYSE: LOWV)

| | |
| |
| Investment Products Offered | | • Are Not FDIC Insured • May Lose Value • Are Not Bank Guaranteed |
Investors should consider the investment objectives, risks, charges and expenses of the Fund carefully before investing. For copies of our prospectus or summary prospectus, which contain this and other information, visit us online at www.abfunds.com or contact your AB representative. Please read the prospectus and/or summary prospectus carefully before investing.
This shareholder report must be preceded or accompanied by the Fund’s prospectus for individuals who are not current shareholders of the Fund.
You may obtain a description of the Fund’s proxy voting policies and procedures, and information regarding how the Fund voted proxies relating to portfolio securities during the most recent 12-month period ended June 30, without charge. Simply visit AB’s website at www.abfunds.com, or go to the Securities and Exchange Commission’s (the “Commission”) website at www.sec.gov, or call AB at (800) 227 4618.
The Fund files its complete schedule of portfolio holdings with the Commission for the first and third quarters of each fiscal year as an exhibit to its reports on Form N-PORT. The Fund’s Form N-PORT reports are available on the Commission’s website at www.sec.gov. AB publishes full portfolio holdings for the Fund daily at www.abfunds.com.
Foreside Fund Services, LLC (“Foreside”) is the distributor of the fund. Foreside is a member of FINRA.
The [A/B] logo and AllianceBernstein® are registered trademarks used by permission of the owner, AllianceBernstein L.P.
PORTFOLIO OF INVESTMENTS
November 30, 2024
| | | | | | | | |
| Company | | Shares | | | U.S. $ Value | |
| |
COMMON STOCKS – 99.2% | |
Information Technology – 29.4% | |
IT Services – 1.1% | |
Amdocs Ltd. | | | 10,202 | | | $ | 884,717 | |
| | | | | | | | |
| | |
Semiconductors & Semiconductor Equipment – 7.0% | | | | | | | | |
Analog Devices, Inc. | | | 2,129 | | | | 464,228 | |
Applied Materials, Inc. | | | 2,646 | | | | 462,283 | |
Broadcom, Inc. | | | 14,847 | | | | 2,406,402 | |
NVIDIA Corp. | | | 11,955 | | | | 1,652,779 | |
Taiwan Semiconductor Manufacturing Co., Ltd. (Sponsored ADR) | | | 1,905 | | | | 351,777 | |
| | | | | | | | |
| | | | 5,337,469 | |
| | | | | |
Software – 16.5% | | | | | | | | |
Adobe, Inc.(a) | | | 2,114 | | | | 1,090,676 | |
Dolby Laboratories, Inc. – Class A | | | 6,748 | | | | 528,503 | |
Gen Digital, Inc. | | | 20,747 | | | | 640,045 | |
Intuit, Inc. | | | 1,876 | | | | 1,203,886 | |
Microsoft Corp. | | | 14,675 | | | | 6,214,276 | |
Nice Ltd. (Sponsored ADR)(a) | | | 1,241 | | | | 226,408 | |
Oracle Corp. | | | 8,091 | | | | 1,495,540 | |
Salesforce, Inc. | | | 1,143 | | | | 377,179 | |
ServiceNow, Inc.(a) | | | 871 | | | | 914,062 | |
| | | | | | | | |
| | | | 12,690,575 | |
| | | | | |
Technology Hardware, Storage & Peripherals – 4.8% | | | | | | | | |
Apple, Inc. | | | 12,983 | | | | 3,081,255 | |
NetApp, Inc. | | | 4,670 | | | | 572,729 | |
| | | | | | | | |
| | | | 3,653,984 | |
| | | | | |
| | | | 22,566,745 | |
| | | | | |
Financials – 16.3% | |
Banks – 3.4% | | | | | | | | |
Bank of America Corp. | | | 19,678 | | | | 934,902 | |
JPMorgan Chase & Co. | | | 4,862 | | | | 1,214,139 | |
M&T Bank Corp. | | | 2,139 | | | | 470,558 | |
| | | | | | | | |
| | | | 2,619,599 | |
| | | | | |
Capital Markets – 2.2% | | | | | | | | |
Cboe Global Markets, Inc. | | | 4,025 | | | | 868,796 | |
MSCI, Inc. | | | 799 | | | | 487,095 | |
S&P Global, Inc. | | | 616 | | | | 321,866 | |
| | | | | | | | |
| | | | 1,677,757 | |
| | | | | |
Financial Services – 5.6% | | | | | | | | |
Fiserv, Inc.(a) | | | 8,692 | | | | 1,920,584 | |
Mastercard, Inc. – Class A | | | 1,701 | | | | 906,531 | |
Visa, Inc. – Class A | | | 4,697 | | | | 1,479,931 | |
| | | | | | | | |
| | | | 4,307,046 | |
| | | | | |
| | |
| |
| abfunds.com | | AB US LOW VOLATILITY EQUITY ETF | 1 |
PORTFOLIO OF INVESTMENTS (continued)
| | | | | | | | |
| Company | | Shares | | | U.S. $ Value | |
| |
Insurance – 5.1% | | | | | | | | |
American Financial Group, Inc./OH | | | 2,663 | | | $ | 391,088 | |
Everest Group Ltd. | | | 2,101 | | | | 814,264 | |
Marsh & McLennan Cos., Inc. | | | 4,489 | | | | 1,046,969 | |
Progressive Corp. (The) | | | 2,309 | | | | 620,844 | |
Reinsurance Group of America, Inc. | | | 1,931 | | | | 441,040 | |
Willis Towers Watson PLC | | | 1,889 | | | | 608,258 | |
| | | | | | | | |
| | | | | | | 3,922,463 | |
| | | | | | | | |
| | | | | | | 12,526,865 | |
| | | | | | | | |
Health Care – 13.0% | | | | | | | | |
Biotechnology – 4.3% | | | | | | | | |
AbbVie, Inc. | | | 9,220 | | | | 1,686,614 | |
Gilead Sciences, Inc. | | | 10,634 | | | | 984,496 | |
Vertex Pharmaceuticals, Inc.(a) | | | 1,384 | | | | 647,892 | |
| | | | | | | | |
| | | | | | | 3,319,002 | |
| | | | | | | | |
Health Care Equipment & Supplies – 0.8% | | | | | | | | |
Medtronic PLC | | | 7,301 | | | | 631,829 | |
| | | | | | | | |
| | |
Health Care Providers & Services – 4.9% | | | | | | | | |
Cigna Group (The) | | | 2,229 | | | | 752,956 | |
McKesson Corp. | | | 2,119 | | | | 1,331,792 | |
UnitedHealth Group, Inc. | | | 2,657 | | | | 1,621,301 | |
| | | | | | | | |
| | | | | | | 3,706,049 | |
| | | | | | | | |
Life Sciences Tools & Services – 0.3% | | | | | | | | |
Thermo Fisher Scientific, Inc. | | | 438 | | | | 231,978 | |
| | | | | | | | |
| | |
Pharmaceuticals – 2.7% | | | | | | | | |
Eli Lilly & Co. | | | 913 | | | | 726,154 | |
Merck & Co., Inc. | | | 13,392 | | | | 1,361,163 | |
| | | | | | | | |
| | | | | | | 2,087,317 | |
| | | | | | | | |
| | | | | | | 9,976,175 | |
| | | | | | | | |
Industrials – 10.0% | | | | | | | | |
Aerospace & Defense – 2.1% | | | | | | | | |
L3Harris Technologies, Inc. | | | 3,490 | | | | 859,412 | |
Lockheed Martin Corp. | | | 1,411 | | | | 746,998 | |
| | | | | | | | |
| | | | | | | 1,606,410 | |
| | | | | | | | |
Construction & Engineering – 1.6% | | | | | | | | |
AECOM | | | 6,576 | | | | 769,195 | |
Stantec, Inc. | | | 5,703 | | | | 496,275 | |
| | | | | | | | |
| | | | | | | 1,265,470 | |
| | | | | | | | |
Electrical Equipment – 0.7% | | | | | | | | |
Eaton Corp. PLC | | | 1,381 | | | | 518,455 | |
| | | | | | | | |
| | |
Professional Services – 5.6% | | | | | | | | |
Automatic Data Processing, Inc. | | | 4,363 | | | | 1,339,136 | |
Booz Allen Hamilton Holding Corp. | | | 2,550 | | | | 377,859 | |
Experian PLC (Sponsored ADR) | | | 14,020 | | | | 670,575 | |
Genpact Ltd. | | | 17,733 | | | | 818,555 | |
| | |
| |
2 | AB US LOW VOLATILITY EQUITY ETF | | abfunds.com |
PORTFOLIO OF INVESTMENTS (continued)
| | | | | | | | |
| Company | | Shares | | | U.S. $ Value | |
| |
Leidos Holdings, Inc. | | | 2,586 | | | $ | 427,725 | |
RELX PLC (Sponsored ADR) | | | 13,867 | | | | 652,858 | |
| | | | | | | | |
| | | | | | | 4,286,708 | |
| | | | | | | | |
| | | | | | | 7,677,043 | |
| | | | | | | | |
Communication Services – 9.3% | | | | | | | | |
Diversified Telecommunication Services – 1.2% | | | | | | | | |
Comcast Corp. – Class A | | | 21,938 | | | | 947,502 | |
| | | | | | | | |
| | |
Entertainment – 0.9% | | | | | | | | |
Electronic Arts, Inc. | | | 4,070 | | | | 666,137 | |
| | | | | | | | |
| | |
Interactive Media & Services – 6.3% | | | | | | | | |
Alphabet, Inc. – Class C | | | 20,803 | | | | 3,546,704 | |
Meta Platforms, Inc. – Class A | | | 2,213 | | | | 1,270,970 | |
| | | | | | | | |
| | | | | | | 4,817,674 | |
| | | | | | | | |
Media – 0.9% | | | | | | | | |
New York Times Co. (The) – Class A | | | 12,817 | | | | 695,450 | |
| | | | | | | | |
| | | | | | | 7,126,763 | |
| | | | | | | | |
Consumer Discretionary – 8.2% | | | | | | | | |
Broadline Retail – 1.9% | | | | | | | | |
Amazon.com, Inc.(a) | | | 7,112 | | | | 1,478,514 | |
| | | | | | | | |
| | |
Hotels, Restaurants & Leisure – 3.3% | | | | | | | | |
Booking Holdings, Inc. | | | 143 | | | | 743,883 | |
Compass Group PLC (Sponsored ADR) | | | 30,418 | | | | 1,049,725 | |
Yum! Brands, Inc. | | | 5,002 | | | | 694,978 | |
| | | | | | | | |
| | | | | | | 2,488,586 | |
| | | | | | | | |
Specialty Retail – 1.9% | | | | | | | | |
AutoZone, Inc.(a) | | | 352 | | | | 1,115,678 | |
O’Reilly Automotive, Inc.(a) | | | 293 | | | | 364,263 | |
| | | | | | | | |
| | | | | | | 1,479,941 | |
| | | | | | | | |
Textiles, Apparel & Luxury Goods – 1.1% | | | | | | | | |
Lululemon Athletica, Inc.(a) | | | 2,627 | | | | 842,374 | |
| | | | | | | | |
| | | | | | | 6,289,415 | |
| | | | | | | | |
Consumer Staples – 6.5% | | | | | | | | |
Beverages – 1.4% | | | | | | | | |
Coca-Cola Co. (The) | | | 16,239 | | | | 1,040,595 | |
| | | | | | | | |
| | |
Consumer Staples Distribution & Retail – 1.5% | | | | | | | | |
Koninklijke Ahold Delhaize NV (Sponsored ADR) | | | 14,971 | | | | 517,398 | |
Walmart, Inc. | | | 7,311 | | | | 676,267 | |
| | | | | | | | |
| | | | | | | 1,193,665 | |
| | | | | | | | |
Household Products – 1.7% | | | | | | | | |
Colgate-Palmolive Co. | | | 4,271 | | | | 412,707 | |
Procter & Gamble Co. (The) | | | 4,871 | | | | 873,175 | |
| | | | | | | | |
| | | | | | | 1,285,882 | |
| | | | | | | | |
| | |
| |
| abfunds.com | | AB US LOW VOLATILITY EQUITY ETF | 3 |
PORTFOLIO OF INVESTMENTS (continued)
| | | | | | | | |
| Company | | Shares | | | U.S. $ Value | |
| |
Tobacco – 1.9% | | | | | | | | |
Philip Morris International, Inc. | | | 10,846 | | | $ | 1,443,169 | |
| | | | | | | | |
| | | | | | | 4,963,311 | |
| | | | | | | | |
Energy – 2.2% | | | | | | | | |
Oil, Gas & Consumable Fuels – 2.2% | | | | | | | | |
Exxon Mobil Corp. | | | 4,125 | | | | 486,585 | |
Shell PLC (ADR) | | | 18,852 | | | | 1,220,479 | |
| | | | | | | | |
| | | | | | | 1,707,064 | |
| | | | | | | | |
Utilities – 2.1% | | | | | | | | |
Electric Utilities – 1.3% | | | | | | | | |
American Electric Power Co., Inc. | | | 10,320 | | | | 1,030,555 | |
| | | | | | | | |
| | |
Multi-Utilities – 0.8% | | | | | | | | |
Ameren Corp. | | | 6,254 | | | | 590,315 | |
| | | | | | | | |
| | | | | | | 1,620,870 | |
| | | | | | | | |
Real Estate – 1.1% | | | | | | | | |
Industrial REITs – 0.4% | | | | | | | | |
First Industrial Realty Trust, Inc. | | | 5,587 | | | | 298,625 | |
| | | | | | | | |
| | |
Specialized REITs – 0.7% | | | | | | | | |
Public Storage | | | 1,613 | | | | 561,405 | |
| | | | | | | | |
| | | | | | | 860,030 | |
| | | | | | | | |
Materials – 1.1% | | | | | | | | |
Chemicals – 1.1% | | | | | | | | |
Sherwin-Williams Co. (The) | | | 2,046 | | | | 813,081 | |
| | | | | | | | |
| | |
Total Common Stocks
(cost $65,696,617) | | | | | | | 76,127,362 | |
| | | | | | | | |
| | | | | | | | |
SHORT-TERM INVESTMENTS – 0.7% | | | | | | | | |
Investment Companies – 0.7% | | | | | | | | |
AB Fixed Income Shares, Inc. – Government Money Market Portfolio – Class AB, 4.54%(b)(c)(d)
(cost $545,763) | | | 545,763 | | | | 545,763 | |
| | | | | | | | |
| | |
Total Investments – 99.9%
(cost $66,242,380) | | | | | | | 76,673,125 | |
Other assets less liabilities – 0.1% | | | | | | | 44,730 | |
| | | | | | | | |
| | |
Net Assets – 100.0% | | | | | | $ | 76,717,855 | |
| | | | | | | | |
| (a) | Non-income producing security. |
| (b) | Affiliated investments. |
| (c) | The rate shown represents the 7-day yield as of period end. |
| (d) | To obtain a copy of the fund’s shareholder report, please go to the Securities and Exchange Commission’s website at www.sec.gov, or call AB at (800) 227-4618. |
Glossary:
ADR – American Depositary Receipt
REIT – Real Estate Investment Trust
See notes to financial statements.
| | |
| |
4 | AB US LOW VOLATILITY EQUITY ETF | | abfunds.com |
STATEMENT OF ASSETS & LIABILITIES
November 30, 2024
| | | | |
| Assets | |
Investments in securities, at value | |
Unaffiliated issuers (cost $65,696,617) | | $ | 76,127,362 | |
Affiliated issuers (cost $545,763) | | | 545,763 | |
Cash | | | 25 | |
Unaffiliated dividends receivable | | | 69,544 | |
Affiliated dividends receivable | | | 3,980 | |
Receivable due from Adviser | | | 181 | |
| | | | |
Total assets | | | 76,746,855 | |
| | | | |
| Liabilities | |
Advisory fee payable | | | 29,000 | |
| | | | |
Total liabilities | | | 29,000 | |
| | | | |
Net Assets | | $ | 76,717,855 | |
| | | | |
| Composition of Net Assets | |
Capital stock, at par | | $ | 106 | |
Additional paid-in capital | | | 66,139,347 | |
Distributable earnings | | | 10,578,402 | |
| | | | |
Net Assets | | $ | 76,717,855 | |
| | | | |
Net Asset Value Per Share—500 million shares of capital stock authorized, $.0001 par value (based on 1,060,020 shares outstanding) | | $ | 72.37 | |
| | | | |
See notes to financial statements.
| | |
| |
| abfunds.com | | AB US LOW VOLATILITY EQUITY ETF | 5 |
STATEMENT OF OPERATIONS
Year Ended November 30, 2024
| | | | | | | | |
| Investment Income | | | | | | | | |
Dividends | | | | | | | | |
Unaffiliated issuers (net of foreign taxes withheld of $1,564) | | $ | 605,275 | | | | | |
Affiliated issuers | | | 41,313 | | | | | |
Interest | | | 288 | | | $ | 646,876 | |
| | | | | | | | |
| Expenses | | | | | | | | |
Advisory fee (see Note B) | | | 204,983 | | | | | |
| | | | | | | | |
Total expenses | | | 204,983 | | | | | |
Less: expenses waived and reimbursed by the Adviser (see Note B) | | | (1,385 | ) | | | | |
| | | | | | | | |
Net expenses | | | | | | | 203,598 | |
| | | | | | | | |
Net investment income | | | | | | | 443,278 | |
| | | | | | | | |
| Realized and Unrealized Gain (Loss) on Investment and Foreign Currency Transactions | | | | | | | | |
Net realized gain (loss) on: | | | | | | | | |
Investment transactions | | | | | | | 26,128 | |
In-kind redemptions | | | | | | | 227,760 | |
Foreign currency transactions | | | | | | | (13 | ) |
Net change in unrealized appreciation (depreciation) of investments | | | | | | | 9,088,077 | |
| | | | | | | | |
Net gain on investment and foreign currency transactions | | | | | | | 9,341,952 | |
| | | | | | | | |
Net Increase in Net Assets from Operations | | | | | | $ | 9,785,230 | |
| | | | | | | | |
See notes to financial statements.
| | |
| |
6 | AB US LOW VOLATILITY EQUITY ETF | | abfunds.com |
STATEMENT OF CHANGES IN NET ASSETS
| | | | | | | | |
| | | Year Ended
November 30,
2024 | | | March 22,
2023(a) to
November 30,
2023 | |
| Increase (Decrease) in Net Assets from Operations | | | | | | | | |
Net investment income | | $ | 443,278 | | | $ | 78,842 | |
Net realized gain (loss) on investment transactions and foreign currency transactions | | | 253,875 | | | | (20,692 | ) |
Net change in unrealized appreciation (depreciation) of investments | | | 9,088,077 | | | | 1,342,668 | |
| | | | | | | | |
Net increase in net assets from operations | | | 9,785,230 | | | | 1,400,818 | |
Distribution to Shareholders | | | (317,880 | ) | | | (44,870 | ) |
| Transactions in Shares of the Fund | | | | | | | | |
Net increase | | | 52,231,037 | | | | 13,663,520 | |
| | | | | | | | |
Total increase | | | 61,698,387 | | | | 15,019,468 | |
| Net Assets | | | | | |
Beginning of period | | | 15,019,468 | | | | – 0 | – |
| | | | | | | | |
End of period | | $ | 76,717,855 | | | $ | 15,019,468 | |
| | | | | | | | |
| (a) | Commencement of operations. |
See notes to financial statements.
| | |
| |
| abfunds.com | | AB US LOW VOLATILITY EQUITY ETF | 7 |
NOTES TO FINANCIAL STATEMENTS
November 30, 2024
NOTE A
Significant Accounting Policies
AB Active ETFs, Inc. (the “Corporation”) is registered under the Investment Company Act of 1940 (the “1940 Act”) as an open-end management investment company. The Corporation, which is a Maryland corporation, operates as a series company comprised of 15 funds currently in operation. Each fund is considered to be a separate entity for financial reporting and tax purposes. This report relates only to the AB US Low Volatility Equity ETF (the “Fund”), a non-diversified portfolio. The Fund commenced investment operations on March 22, 2023. The financial statements have been prepared in conformity with U.S. generally accepted accounting principles (“U.S. GAAP”), which require management to make certain estimates and assumptions that affect the reported amounts of assets and liabilities in the financial statements and amounts of income and expenses during the reporting period. Actual results could differ from those estimates. The Fund is an investment company under U.S. GAAP and follows the accounting and reporting guidance applicable to investment companies. The following is a summary of significant accounting policies followed by the Fund.
1. Security Valuation
Portfolio securities are valued at market value determined on the basis of market quotations or, if market quotations are not readily available or are unreliable, at “fair value” as determined in accordance with procedures approved by and under the oversight Fund’s Board of Directors (the “Board”). Pursuant to these procedures, AllianceBernstein L.P. (the “Adviser”) serves as the Fund’s valuation designee pursuant to Rule 2a-5 of the 1940 Act. In this capacity, the Adviser is responsible, among other things, for making all fair value determinations relating to the Fund’s portfolio investments, subject to the Board’s oversight.
In general, the market values of securities which are readily available and deemed reliable are determined as follows: securities listed on a national securities exchange (other than securities listed on the NASDAQ Stock Market, Inc. (“NASDAQ”)) or on a foreign securities exchange are valued at the last sale price at the close of the exchange or foreign securities exchange. If there has been no sale on such day, the securities are valued at the last traded price from the previous day. Securities listed on more than one exchange are valued by reference to the principal exchange on which the securities are traded; securities listed only on NASDAQ are valued in accordance with the NASDAQ Official Closing Price; listed or over the counter (“OTC”) market put or call options are valued at the mid level between the current bid and ask prices. If either a current bid or current ask price is unavailable, the Adviser will have discretion to determine the best valuation (e.g., last trade price in the case of listed options); open
| | |
| |
8 | AB US LOW VOLATILITY EQUITY ETF | | abfunds.com |
NOTES TO FINANCIAL STATEMENTS (continued)
futures are valued using the closing settlement price or, in the absence of such a price, the most recent quoted bid price. If there are no quotations available for the day of valuation, the last available closing settlement price is used; U.S. Government securities and any other debt instruments having 60 days or less remaining until maturity are generally valued at fair value by an independent pricing service. If an independent fair value is not available, the securities are valued at amortized cost. This methodology is commonly used for short term securities that have an original maturity of 60 days or less, as well as short term securities that had an original term to maturity that exceeded 60 days. In instances when amortized cost is utilized, the Valuation Committee (the “Committee”) must reasonably conclude that the utilization of amortized cost is approximately the same as the fair value of the security. Factors the Committee will consider include, but are not limited to, an impairment of the creditworthiness of the issuer or material changes in interest rates. Fixed-income securities, including mortgage-backed and asset-backed securities, may be valued on the basis of prices provided by a pricing service or at a price obtained from one or more of the major broker-dealers. In cases where broker-dealer quotes are obtained, the Adviser may establish procedures whereby changes in market yields or spreads are used to adjust, on a daily basis, a recently obtained quoted price on a security. Swaps and other derivatives are valued daily, primarily using independent pricing services, independent pricing models using market inputs, as well as third party broker-dealers or counterparties. Open-end mutual funds are valued at the closing net asset value (“NAV”) per share, while exchange-traded funds are valued at the closing market price per share.
Securities for which market quotations are not readily available (including restricted securities) or are deemed unreliable are valued at fair value as deemed appropriate by the Adviser. Factors considered in making this determination may include, but are not limited to, information obtained by contacting the issuer, analysts, analysis of the issuer’s financial statements or other available documents. In addition, the Fund may use fair value pricing for securities primarily traded in non-U.S. markets because most foreign markets close well before the Fund values its securities at 4:00 p.m., Eastern Time. The earlier close of these foreign markets gives rise to the possibility that significant events may have occurred in the interim and may materially affect the value of those securities. To account for this, the Fund may value foreign equity securities using fair value prices at the discretion of the Adviser.
2. Fair Value Measurements
In accordance with U.S. GAAP regarding fair value measurements, fair value is defined as the price that the Fund would receive to sell an asset or pay to transfer a liability in an orderly transaction between market participants at
| | |
| |
| abfunds.com | | AB US LOW VOLATILITY EQUITY ETF | 9 |
NOTES TO FINANCIAL STATEMENTS (continued)
the measurement date. U.S. GAAP establishes a framework for measuring fair value, and a three-level hierarchy for fair value measurements based upon the transparency of inputs to the valuation of an asset or liability (including those valued based on their market values as described in Note A.1 above). Inputs may be observable or unobservable and refer broadly to the assumptions that market participants would use in pricing the asset or liability. Observable inputs reflect the assumptions market participants would use in pricing the asset or liability based on market data obtained from sources independent of the Fund. Unobservable inputs reflect the Fund’s own assumptions about the assumptions that market participants would use in pricing the asset or liability based on the best information available in the circumstances. Each investment is assigned a level based upon the observability of the inputs which are significant to the overall valuation. The three-tier hierarchy of inputs is summarized below.
| | • | | Level 1—quoted prices in active markets for identical investments |
| | • | | Level 2—other significant observable inputs (including quoted prices for similar investments, interest rates, prepayment speeds, credit risk, etc.) |
| | • | | Level 3—significant unobservable inputs (including the Fund’s own assumptions in determining the fair value of investments) |
Where readily available market prices or relevant bid prices are not available for certain equity investments, such investments may be valued based on similar publicly traded investments, movements in relevant indices since last available prices or based upon underlying company fundamentals and comparable company data (such as multiples to earnings or other multiples to equity). Where an investment is valued using an observable input, such as another publicly traded security, the investment will be classified as Level 2. If management determines that an adjustment is appropriate based on restrictions on resale, illiquidity or uncertainty, and such adjustment is a significant component of the valuation, the investment will be classified as Level 3. An investment will also be classified as Level 3 where management uses company fundamentals and other significant inputs to determine the valuation.
| | |
| |
10 | AB US LOW VOLATILITY EQUITY ETF | | abfunds.com |
NOTES TO FINANCIAL STATEMENTS (continued)
The following table summarizes the valuation of the Fund’s investments by the above fair value hierarchy levels as of November 30, 2024:
| | | | | | | | | | | | | | | | |
Investments in
Securities: | | Level 1 | | | Level 2 | | | Level 3 | | | Total | |
Assets: | |
Common Stocks(a) | | $ | 76,127,362 | | | $ | – 0 | – | | $ | – 0 | – | | $ | 76,127,362 | |
Short-Term Investments | | | 545,763 | | | | – 0 | – | | | – 0 | – | | | 545,763 | |
| | | | | | | | | | | | | | | | |
Total Investments in Securities | | | 76,673,125 | | | | – 0 | – | | | – 0 | – | | | 76,673,125 | |
Other Financial Instruments(b) | | | – 0 | – | | | – 0 | – | | | – 0 | – | | | – 0 | – |
| | | | | | | | | | | | | | | | |
Total | | $ | 76,673,125 | | | $ | – 0 | – | | $ | – 0 | – | | $ | 76,673,125 | |
| | | | | | | | | | | | | | | | |
| (a) | See Portfolio of Investments for sector classifications. |
| (b) | Other financial instruments include derivative instruments, such as futures, forwards and swaps. Derivative instruments are valued at the unrealized appreciation (depreciation) on the instrument. Other financial instruments may also include swaps with upfront premiums, written options and written swaptions which are valued at market value. |
3. Currency Translation
Assets and liabilities denominated in foreign currencies and commitments under forward currency exchange contracts are translated into U.S. dollars at the mean of the quoted bid and ask prices of such currencies against the U.S. dollar. Purchases and sales of portfolio securities are translated into U.S. dollars at the rates of exchange prevailing when such securities were acquired or sold. Income and expenses are translated into U.S. dollars at rates of exchange prevailing when accrued.
Net realized gain or loss on foreign currency transactions represents foreign exchange gains and losses from sales and maturities of foreign fixed income investments, holding of foreign currencies, currency gains or losses realized between the trade and settlement dates on foreign investment transactions, and the difference between the amounts of dividends, interest and foreign withholding taxes recorded on the Fund’s books and the U.S. dollar equivalent amounts actually received or paid. Net unrealized currency gains and losses from valuing foreign currency denominated assets and liabilities at period end exchange rates are reflected as a component of net unrealized appreciation or depreciation of foreign currency denominated assets and liabilities.
4. Taxes
It is the Fund’s policy to meet the requirements of the Internal Revenue Code applicable to regulated investment companies and to distribute all of its investment company taxable income and net realized gains, if any, to shareholders. Therefore, no provisions for federal income or excise taxes are required. The Fund may be subject to taxes imposed by countries in which it invests. Such taxes are generally based on income and/or capital gains earned or repatriated. Taxes are accrued and applied to net investment
| | |
| |
| abfunds.com | | AB US LOW VOLATILITY EQUITY ETF | 11 |
NOTES TO FINANCIAL STATEMENTS (continued)
income, net realized gains and net unrealized appreciation/depreciation as such income and/or gains are earned.
In accordance with U.S. GAAP requirements regarding accounting for uncertainties in income taxes, management has analyzed the Fund’s tax positions taken or expected to be taken on federal and state income tax returns for all open tax years (the current and prior tax years) and has concluded that no provision for income tax is required in the Fund’s financial statements.
5. Investment Income and Investment Transactions
Dividend income is recorded on the ex-dividend date or as soon as the Fund is informed of the dividend. Interest income is accrued daily. Investment transactions are accounted for on the date the securities are purchased or sold. Investment gains or losses are determined on the identified cost basis. Non-cash dividends, if any, are recorded on the ex-dividend date at the fair value of the securities received. The Fund amortizes premiums and accretes discounts as adjustments to interest income.
The Fund accounts for distributions received from real estate investment trust (“REIT”) investments or from regulated investment companies as dividend income, realized gain, or return of capital based on information provided by the REIT or the investment company.
6. Dividends and Distributions
Dividends and distributions to shareholders, if any, are recorded on the ex-dividend date. Income dividends and capital gains distributions are determined in accordance with federal tax regulations and may differ from those determined in accordance with U.S. GAAP. To the extent these differences are permanent, such amounts are reclassified within the capital accounts based on their federal tax basis treatment; temporary differences do not require such reclassification.
7. Offering Expenses
The Adviser has agreed to pay all of the Fund’s organization and offering costs. The Fund is not obligated to repay any such organizational expenses or offering costs paid by the Adviser.
8. Cash and Short-Term Investments
Cash and short-term investments include cash on hand and short-term investments with maturities of less than one year when purchased.
NOTE B
Advisory Fee and Other Transactions with Affiliates
Under the terms of the investment advisory agreement, the Fund pays the Adviser a unitary advisory fee at an annual rate of .48% of the Fund’s average daily net assets. The fees are accrued daily and paid monthly.
| | |
| |
12 | AB US LOW VOLATILITY EQUITY ETF | | abfunds.com |
NOTES TO FINANCIAL STATEMENTS (continued)
Under the investment advisory agreement, in accordance with the unitary fee structure, the Adviser bears the cost of various third-party services required by the Fund, including audit, custodial, accounting, legal, transfer agency and printing costs and the fees and expenses of the Corporation’s directors and their counsel. Also under the investment advisory agreement, the Adviser will reimburse the Fund for the Fund’s share of the acquired funds fees and expenses (advisory fees and other expenses) of any pooled investment vehicle for which the Adviser serves as investment adviser. For the year ended November 30, 2024, such waiver/reimbursements relating to the Fund’s investment in AB Government Money Market Portfolio amounted to $1,385.
A summary of the Fund’s transactions in AB mutual funds for the year ended November 30, 2024 is as follows:
| | | | | | | | | | | | | | | | | | | | |
Fund | | Market Value
11/30/23
(000) | | | Purchases
at Cost
(000) | | | Sales
Proceeds
(000) | | | Market Value
11/30/24
(000) | | | Dividend
Income
(000) | |
AB Government Money Market Portfolio | | $ | 246 | | | $ | 5,708 | | | $ | 5,408 | | | $ | 546 | | | $ | 41 | |
NOTE C
Distribution Plan
The Fund has adopted a Distribution and Service Plan pursuant to Rule 12b-1 of the Act which permits the Fund to pay distribution and servicing fees not to exceed .25% per year of the Fund’s average daily net assets. No such fees are currently paid, and the Board has not approved the commencement of payments under the Rule 12b-1 Distribution Plan.
NOTE D
Investment Transactions
Purchases and sales of investment securities (excluding short-term investments and in-kind purchases and sales) for the year ended November 30, 2024 were as follows:
| | | | | | | | |
| | | Purchases | | | Sales | |
Investment securities (excluding U.S. government securities) | | $ | 14,291,230 | | | $ | 12,403,867 | |
U.S. government securities | | | – 0 | – | | | – 0 | – |
During the year ended November 30, 2024, the Fund delivered portfolio securities for the redemption of Fund shares (in-kind redemptions). Cash and portfolio securities were transferred for redemptions at fair value. For financial reporting purposes, the Fund recorded net realized gains and
| | |
| |
| abfunds.com | | AB US LOW VOLATILITY EQUITY ETF | 13 |
NOTES TO FINANCIAL STATEMENTS (continued)
losses in connection with each in-kind redemption transaction. For the year ended November 30, 2024, the Fund had in-kind purchases and in-kind sales as follows:
| | | | | | | | |
| | | Purchases | | | Sales | |
In-kind transactions (excluding U.S. government securities) | | $ | 50,970,133 | | | $ | 778,790 | |
U.S. government securities | | | – 0 | – | | | – 0 | – |
The cost of investments for federal income tax purposes, gross unrealized appreciation and unrealized depreciation are as follows:
| | | | |
Cost | | $ | 66,271,364 | |
| | | | |
Gross unrealized appreciation | | $ | 10,860,042 | |
Gross unrealized depreciation | | | (458,281 | ) |
| | | | |
Net unrealized appreciation | | $ | 10,401,761 | |
| | | | |
1. Derivative Financial Instruments
The Fund may use derivatives in an effort to earn income and enhance returns, to replace more traditional direct investments, to obtain exposure to otherwise inaccessible markets (collectively, “investment purposes”), or to hedge or adjust the risk profile of its portfolio.
The Fund did not engage in derivatives transactions for the year ended November 30, 2024.
2. Currency Transactions
The Fund may invest in non-U.S. Dollar-denominated securities on a currency hedged or unhedged basis. The Fund may seek investment opportunities by taking long or short positions in currencies through the use of currency-related derivatives, including forward currency exchange contracts, futures and options on futures, swaps, and other options. The Fund may enter into transactions for investment opportunities when it anticipates that a foreign currency will appreciate or depreciate in value but securities denominated in that currency are not held by the Fund and do not present attractive investment opportunities. Such transactions may also be used when the Adviser believes that it may be more efficient than a direct investment in a foreign currency-denominated security. The Fund may also conduct currency exchange contracts on a spot basis (i.e., for cash at the spot rate prevailing in the currency exchange market for buying or selling currencies).
NOTE E
Shares of the Fund
The Fund’s shares may only be bought and sold in a secondary market through a broker-dealer at a market price. Because ETF shares trade at
| | |
| |
14 | AB US LOW VOLATILITY EQUITY ETF | | abfunds.com |
NOTES TO FINANCIAL STATEMENTS (continued)
market prices rather than NAV, shares may trade at a price greater than NAV (a premium) or less than NAV (a discount). The Fund issues and redeems shares at its NAV only in aggregations of a specified number of shares (a creation unit) generally in exchange for a designated portfolio of securities and/or cash (including any portion of such securities for which cash may be substituted). A fixed transaction fee is imposed on authorized participants in connection with creation unit redemption and creation transactions. Authorized participants may be required to pay an additional variable charge to cover certain costs and expenses related to the execution of trades resulting from creation unit transactions. Such variable charges, if any, are included in other capital within the Statement of Changes in Net Assets.
Transactions in shares of the Fund were as follows:
| | | | | | | | | | | | | | | | | | | | | | | | |
| | | | | | | | | | | | | | | | | | | | | | | | |
| | | Shares | | | | | | Amount | | | | |
| | | Year Ended
November 30,
2024 | | | March 22, 2023(a)
November 30, 2023 | | | | | | Year Ended
November 30,
2024 | | | March 22, 2023(a)
November 30, 2023 | | | | |
| | | | | | | | |
Shares sold | | | 820,000 | | | | 270,020 | | | | | | | $ | 53,679,497 | | | $ | 14,218,038 | | | | | |
| | | | | |
Shares redeemed | | | (20,000 | ) | | | (10,000 | ) | | | | | | | (1,448,460 | ) | | | (554,518 | ) | | | | |
| | | | | |
Net increase | | | 800,000 | | | | 260,020 | | | | | | | $ | 52,231,037 | | | $ | 13,663,520 | | | | | |
| | | | | |
| (a) | Commencement of operations. |
NOTE F
Risks Involved in Investing in the Fund
Market Risk—The value of the Fund’s assets will fluctuate as the market or markets in which the Fund invests fluctuate. The value of the Fund’s investments may decline, sometimes rapidly and unpredictably, simply because of economic changes or other events, including public health crises (including the occurrence of a contagious disease or illness), interest rate levels, and regional and global conflicts, that affect large portions of the market. It includes the risk that a particular style of investing may be underperforming the market generally.
Equity Securities Risk—The Fund invests in publicly-traded equity securities, and their value may fluctuate, sometimes rapidly and unpredictably, which means a security may be worth more or less than when it was purchased. These fluctuations can be based on a variety of factors including a company’s financial condition as well as macro-economic factors such as interest rates, inflation rates, global market conditions, and non-economic factors such as market perceptions and social or political events.
Capitalization Risk—Investments in mid-capitalization companies may be more volatile than investments in large-capitalization companies.
| | |
| |
| abfunds.com | | AB US LOW VOLATILITY EQUITY ETF | 15 |
NOTES TO FINANCIAL STATEMENTS (continued)
Investments in mid-capitalization companies may have additional risks because these companies may have limited product lines, markets or financial resources.
Foreign (Non-US) Investments Risk—Investments in securities of non-U.S. issuers may involve more risk than those of U.S. issuers. These securities may fluctuate more widely in price and may be more difficult to trade than domestic securities due to adverse market, economic, political, regulatory or other factors.
Non-Diversification Risk—The Fund may have more risk because it is “non-diversified”, meaning that it can invest more of its assets in a smaller number of issuers. Accordingly, changes in the value of a single security may have a more significant effect, either negative or positive, on the Fund’s net asset value (“NAV”) than on the NAV of a diversified fund.
ETF Share Price and Net Asset Value Risk—The Fund’s shares are listed for trading on the NYSE Arca, Inc. (the “Exchange”). The Fund’s shares are generally bought and sold in the secondary market at market prices. The NAV of the Fund will fluctuate with changes in the market value of the Fund’s holdings. The Fund’s NAV is calculated once per day, at the end of the day. The market price of a share on the Exchange could be higher than the NAV (premium), or lower than the NAV (discount) and may fluctuate during the trading day. When all or a portion of the Fund’s underlying securities trade in a market that is closed when the market for the Fund’s shares is open, there may be differences between the current value of a security and the last quoted price for that security in the closed local market, which could lead to a deviation between the market value of the Fund’s shares and the Fund’s NAV. Disruptions in the creations and redemptions process or the existence of extreme market volatility could result in the Fund’s shares trading above or below NAV. As the Fund may invest in securities traded on foreign exchanges, Fund shares may trade at a larger premium or discount to the Fund’s NAV than shares of other ETFs. In addition, in stressed market conditions, the market for Fund shares may become less liquid in response to deteriorating liquidity in the markets for the Fund’s underlying portfolio holdings.
Authorized Participant Risk—Only a limited number of financial institutions that enter into an authorized participant relationship with the Fund (“Authorized Participants”) may engage in creation or redemption transactions. If the Fund’s Authorized Participants decide not to create or redeem shares, Fund shares may trade at a larger premium or discount to the Fund’s NAV per share, or the Fund could face trading halts or de-listing.
| | |
| |
16 | AB US LOW VOLATILITY EQUITY ETF | | abfunds.com |
NOTES TO FINANCIAL STATEMENTS (continued)
Active Trading Market Risk—There is no guarantee that an active trading market for Fund shares will exist at all times. In times of market stress, markets can suffer erratic or unpredictable trading activity, extraordinary volatility or wide bid/ask spreads, which could cause some market makers and Authorized Participants to reduce their market activity or “step away” from making a market in ETF shares. Market makers and Authorized Participants are not obligated to place or execute purchase and redemption orders. This could cause the Fund’s market price to deviate, materially, from the NAV, and reduce the effectiveness of the ETF arbitrage process. Any absence of an active trading market for Fund shares could lead to a heightened risk that there will be a difference between the market price of a Fund share and the underlying value of the Fund share.
Indemnification Risk—In the ordinary course of business, the Fund enters into contracts that contain a variety of indemnifications. The Fund’s maximum exposure under these arrangements is unknown. However, the Fund has not had prior claims or losses pursuant to these indemnification provisions and expects the risk of loss thereunder to be remote. Therefore, the Fund has not accrued any liability in connection with these indemnification provisions.
Management Risk—The Fund is subject to management risk because it is an actively-managed ETF. The Adviser will apply its investment techniques and risk analyses in making investment decisions, but there is no guarantee that its techniques will produce the intended results. Some of these techniques may incorporate, or rely upon, quantitative models, but there is no guarantee that these models will generate accurate forecasts, reduce risk or otherwise perform as expected.
NOTE G
Joint Credit Facility
A number of ETFs managed by the Adviser, including the Fund, participate in a $325 million revolving credit facility (the “Facility”) intended to provide short-term financing related to redemptions and other short term liquidity requirements, subject to certain restrictions. Commitment fees related to the Facility are paid by the participating funds and are included in miscellaneous expenses in the statement of operations. The Fund did not utilize the Facility during the year ended November 30, 2024.
| | |
| |
| abfunds.com | | AB US LOW VOLATILITY EQUITY ETF | 17 |
NOTES TO FINANCIAL STATEMENTS (continued)
NOTE H
Distributions to Shareholders
The tax character of distributions paid during the fiscal year ended November 30, 2024 and the period ended November 30, 2023 were as follows:
| | | | | | | | |
| | | 2024 | | | 2023 | |
Distributions paid from: | | | | | | | | |
Ordinary income | | $ | 317,880 | | | $ | 44,870 | |
| | | | | | | | |
Total taxable distributions paid | | $ | 317,880 | | | $ | 44,870 | |
| | | | | | | | |
As of November 30, 2024, the components of accumulated earnings (deficit) on a tax basis were as follows:
| | | | |
Undistributed ordinary income | | $ | 176,641 | |
Accumulated capital and other losses | | | 0 | (a) |
Unrealized appreciation (depreciation) | | | 10,401,761 | (b) |
| | | | |
Total accumulated earnings (deficit) | | $ | 10,578,402 | |
| | | | |
| (a) | During the fiscal year, the Fund utilized $36,401 of capital loss carry forwards to offset current year net realized gains. |
| (b) | The differences between book-basis and tax-basis unrealized appreciation (depreciation) are attributable primarily to the tax deferral of losses on wash sales. |
For tax purposes, net realized capital losses may be carried over to offset future capital gains, if any. Funds are permitted to carry forward capital losses for an indefinite period, and such losses will retain their character as either short-term or long-term capital losses. As of November 30, 2024, the Fund did not have any capital loss carryforwards.
During the current fiscal year, permanent differences primarily due to the tax treatment of gains from a redemption-in-kind resulted in a net decrease in distributable earnings and a net increase in additional paid-in capital. These reclassifications had no effect on net assets.
NOTE I
Recent Accounting Pronouncements
In December 2022, the Financial Accounting Standards Board issued an Accounting Standards Update, ASU 2022-06, “Reference Rate Reform (Topic 848) – Deferral of the Sunset Date of Topic 848”. ASU 2022-06 is an amendment to ASU 2020-04, which provided optional guidance to ease the potential accounting burden due to the discontinuation of the LIBOR and other interbank-offered based reference rates and which was effective as of March 12, 2020 through December 31, 2022. ASU 2022-06 extends the effective period through December 31, 2024. Management is currently evaluating the impact, if any, of applying ASU 2022-06.
| | |
| |
18 | AB US LOW VOLATILITY EQUITY ETF | | abfunds.com |
NOTES TO FINANCIAL STATEMENTS (continued)
In November 2023, the Financial Accounting Standards Board issued Accounting Standards Update, ASU 2023-07, “Segment Reporting (Topic 280)”. ASU 2023-07 requires public entities to provide disclosure of significant segment expenses that are regularly provided to the chief operating decision maker (“CODM”). ASU 2023-07, among other things, (i) requires a single segment public entity to provide all necessary disclosures required by Topic 280 it, (ii) requires a public entity to disclose the title and position of the CODM and an explanation of how the CODM uses the reported measure(s) of segment profit and loss in assessing segment performance and deciding how to allocate resources and (iii) provides the ability for a public entity to elect more than one performance measure. ASU 2023-07 is effective for fiscal years beginning after December 15, 2023, and interim periods within fiscal years beginning after December 15, 2024. Early adoption of ASU 2023-07 is permitted. Management is currently evaluating the impact, if any, of applying ASU 2023-07.
NOTE J
Subsequent Events
Management has evaluated subsequent events for possible recognition or disclosure in the financial statements through the date the financial statements are issued. Management has determined that there are no material events that would require disclosure in the Fund’s financial statements through this date.
| | |
| |
| abfunds.com | | AB US LOW VOLATILITY EQUITY ETF | 19 |
FINANCIAL HIGHLIGHTS
Selected Data For A Share Of Capital Stock Outstanding Throughout Each Period
| | | | | | | | |
| | | Year Ended
November 30,
2024 | | | March 22, 2023(a) to
November 30,
2023 | |
| | | | |
Net asset value, beginning of period | | | $ 57.76 | | | | $ 50.00 | |
| | | | |
Income From Investment Operations | | | | | | | | |
| | |
Net investment income(b)(c) | | | .69 | | | | .47 | |
| | |
Net realized and unrealized gain on investment transactions | | | 14.51 | | | | 7.56 | |
| | | | |
Net increase in net asset value from operations | | | 15.20 | | | | 8.03 | |
| | | | |
Less: Dividends | | | | | | | | |
| | |
Dividends from net investment income | | | (.59 | ) | | | (.27 | ) |
| | | | |
Net asset value, end of period | | | $ 72.37 | | | | $ 57.76 | |
| | | | |
| | |
Total Return | | | | | | | | |
| | |
Total investment return based on net asset value(d) | | | 26.47 | % | | | 16.09 | % |
| | |
Ratios/Supplemental Data | | | | | | | | |
| | |
Net assets, end of period (000’s omitted) | | | $76,718 | | | | $15,019 | |
| | |
Ratio to average net assets of: | | | | | | | | |
| | |
Expenses, net of waivers/reimbursements | | | .48 | % | | | .48 | %^ |
| | |
Expenses, before waivers/reimbursements | | | .48 | % | | | .48 | %^ |
| | |
Net investment income(c) | | | 1.04 | % | | | 1.24 | %^ |
| | |
Portfolio turnover rate(e) | | | 30 | % | | | 22 | % |
| (a) | Commencement of operations. |
| (b) | Based on average shares outstanding. |
| (c) | Net of expenses waived/reimbursed by the Adviser. |
| (d) | Total investment return is calculated assuming an initial investment made at the net asset value at the beginning of the period, reinvestment of all dividends and distributions at net asset value during the period, and redemption on the last day of the period. Total investment return does not reflect the deduction of taxes that a shareholder would pay on fund distributions or the redemption of fund shares. Total investment return calculated for a period of less than one year is not annualized. |
| (e) | Excludes the value of portfolio securities received or delivered as a result of in-kind purchases or redemptions of the Fund’s capital shares, including ETF Creation Units. |
See notes to financial statements.
| | |
| |
20 | AB US LOW VOLATILITY EQUITY ETF | | abfunds.com |
REPORT OF INDEPENDENT REGISTERED
PUBLIC ACCOUNTING FIRM
To the Shareholders and the Board of Directors of AB US Low Volatility Equity ETF
Opinion on the Financial Statements
We have audited the accompanying statement of assets and liabilities of AB US Low Volatility Equity ETF (the “Fund”) (one of the funds constituting AB Active ETFs, Inc. (the “Corporation”)), including the portfolio of investments, as of November 30, 2024, and the related statement of operations for the year then ended, the statements of changes in net assets for the year then ended and the period from March 22, 2023 (commencement of operations) to November 30, 2023 and the financial highlights for the year then ended and for the period from March 22, 2023 (commencement of operations) to November 30, 2023 and the related notes (collectively referred to as the “financial statements”). In our opinion, the financial statements present fairly, in all material respects, the financial position of the Fund (one of the funds constituting AB Active ETFs, Inc.) at November 30, 2024, the results of its operations for the year then ended and the changes in its net assets for the year then ended and the period from March 22, 2023 (commencement of operations) to November 30, 2023 and its financial highlights for the year then ended and for the period from March 22, 2023 (commencement of operations) to November 30, 2023, in conformity with U.S. generally accepted accounting principles.
Basis for Opinion
These financial statements are the responsibility of the Corporation’s management. Our responsibility is to express an opinion on the Fund’s financial statements based on our audits. We are a public accounting firm registered with the Public Company Accounting Oversight Board (United States) (“PCAOB”) and are required to be independent with respect to the Corporation in accordance with the U.S. federal securities laws and the applicable rules and regulations of the Securities and Exchange Commission and the PCAOB.
We conducted our audits in accordance with the standards of the PCAOB. Those standards require that we plan and perform the audit to obtain reasonable assurance about whether the financial statements are free of material misstatement, whether due to error or fraud. The Corporation is not required to have, nor were we engaged to perform, an audit of the Corporation’s internal control over financial reporting. As part of our audits, we are required to obtain an understanding of internal control over financial reporting but not for the purpose of expressing an opinion on the effectiveness of the Corporation’s internal control over financial reporting. Accordingly, we express no such opinion.
| | |
| |
| abfunds.com | | AB US LOW VOLATILITY EQUITY ETF | 21 |
REPORT OF INDEPENDENT REGISTERED
PUBLIC ACCOUNTING FIRM (continued)
Our audits included performing procedures to assess the risks of material misstatement of the financial statements, whether due to error or fraud, and performing procedures that respond to those risks. Such procedures included examining, on a test basis, evidence regarding the amounts and disclosures in the financial statements. Our procedures included confirmation of securities owned as of November 30, 2024, by correspondence with the custodian, brokers and others; when replies were not received from brokers or others, we performed other auditing procedures. Our audits also included evaluating the accounting principles used and significant estimates made by management, as well as evaluating the overall presentation of the financial statements. We believe that our audits provide a reasonable basis for our opinion.

We have served as the auditor of one or more of the AB investment companies since 1968.
New York, New York
January 28, 2025
| | |
| |
22 | AB US LOW VOLATILITY EQUITY ETF | | abfunds.com |
2024 FEDERAL TAX INFORMATION
(unaudited)
For Federal income tax purposes, the following information is furnished with respect to the distributions paid by the Fund during the taxable period ended November 30, 2024. For individual shareholders, the Fund designates 89.22% of dividends paid as qualified dividend income. For corporate shareholders, 89.22% of dividends paid qualify for the dividends received deduction.
Shareholders should not use the above information to prepare their income tax returns. The information necessary to complete your income tax returns will be included with your Form 1099-DIV which will be sent to you separately in January 2025.
| | |
| |
| abfunds.com | | AB US LOW VOLATILITY EQUITY ETF | 23 |
Information Regarding the Review and Approval of the Fund’s Advisory Agreement
The disinterested directors (the “directors”) of AB Active ETFs, Inc. (the “Company”) unanimously approved the continuance of the Company’s Advisory Agreement with the Adviser in respect of AB US Low Volatility Equity ETF (the “Fund”) at a meeting held by video conference on May 7-9, 2024 (the “Meeting”).
Prior to approval of the continuance of the Advisory Agreement, the directors had requested from the Adviser, and received and evaluated, extensive materials. They reviewed the proposed continuance of the Advisory Agreement with the Adviser and with experienced counsel who are independent of the Adviser, who advised on the relevant legal standards. The directors also reviewed additional materials, including comparative analytical data prepared by the Senior Vice President of the Fund. The directors also discussed the proposed continuance in private sessions with counsel.
The directors considered their knowledge of the nature and quality of the services provided by the Adviser to the Fund gained from their experience as directors or trustees of most of the registered investment companies advised by the Adviser, including the other series of the Company that are organized as exchange-traded funds (“ETFs”), their overall confidence in the Adviser’s integrity and competence they have gained from that experience, the Adviser’s initiative in identifying and raising potential issues with the directors and its responsiveness, frankness and attention to concerns raised by the directors in the past, including the Adviser’s willingness to consider and implement organizational and operational changes designed to improve investment results and the services provided to the AB Funds. The directors noted that they have four regular meetings each year, at each of which they review extensive materials and information from the Adviser, including information on the investment performance of the Fund and the money market fund advised by the Adviser in which the Fund invests a portion of its assets.
The directors also considered all factors they believed relevant, including the specific matters discussed below. During the course of their deliberations, the directors evaluated, among other things, the reasonableness of the advisory fee. The directors did not identify any particular information that was all-important or controlling, and different directors may have attributed different weights to the various factors. The directors determined that the selection of the Adviser to manage the Fund and the overall arrangements between the Fund and the Adviser, as provided in the Advisory Agreement, including the advisory fee, were fair and reasonable in light of the services performed, expenses incurred and such other matters as the directors considered relevant in the exercise of their business
| | |
| |
24 | AB US LOW VOLATILITY EQUITY ETF | | abfunds.com |
judgment. The material factors and conclusions that formed the basis for the directors’ determinations included the following:
Nature, Extent and Quality of Services Provided
The directors considered the scope and quality of services provided by the Adviser under the Advisory Agreement, including the quality of the investment research capabilities of the Adviser and the other resources it has dedicated to performing services for the Fund. The directors noted that the Adviser from time to time reviews the Fund’s investment strategies and may from time to time propose changes intended to improve the Fund’s relative or absolute performance for the directors’ consideration. They also noted the professional experience and qualifications of the Fund’s portfolio management team and other senior personnel of the Adviser. The directors also considered that the Advisory Agreement provides that the Fund will reimburse the Adviser for the cost to it of providing certain clerical, accounting, administrative and other services to the Fund by employees of the Adviser or its affiliates. Requests for these reimbursements will be subject to the directors’ approval on a quarterly basis. The directors noted that the Adviser does not expect to request such reimbursements. The quality of administrative and other services, including the Adviser’s role in coordinating the activities of the Fund’s other service providers, also was considered. The directors concluded that, overall, they were satisfied with the nature, extent and quality of services provided to the Fund under the Advisory Agreement.
Costs of Services Provided and Profitability
The directors reviewed a schedule of the revenues and expenses and related notes indicating the profitability of the Fund to the Adviser for the period ended December 31, 2023 that had been prepared with an expense allocation methodology arrived at in consultation with an independent consultant at the request of the directors. The directors noted that the assumptions and methods of allocation used by the Adviser in preparing profitability data for ETFs and understood that there are a number of potentially acceptable allocation methodologies for information of this type. The directors noted that the profitability information reflected all revenues and expenses of the Adviser’s relationship with the Fund. The directors recognized that it is difficult to make comparisons of the profitability of the Advisory Agreement with the profitability of ETF advisory contracts for unaffiliated ETFs because comparative information is not generally publicly available and is affected by numerous factors. The directors focused on the profitability of the Adviser’s relationship with the Fund before taxes and distribution expenses. The directors noted that the Fund was not profitable to the Adviser in the period reviewed.
Fall-Out Benefits
The directors considered the other benefits to the Adviser from its relationship with the Fund and the money market fund advised by the Adviser in
| | |
| |
| abfunds.com | | AB US LOW VOLATILITY EQUITY ETF | 25 |
which the Fund invests. The directors recognized that the Fund’s unprofitability to the Adviser would be exacerbated without these benefits. The directors understood that the Adviser also might derive reputational and other benefits from its association with the Fund.
Investment Results
In addition to the information reviewed by the directors in connection with the Meeting, the directors receive detailed performance information for the Fund at each regular Board meeting since the Fund’s inception.
At the Meeting, the directors reviewed performance information prepared by the Adviser showing performance of the Fund against a broad-based securities market index for the period from inception. Based on their review, the directors concluded that the Fund’s investment performance was acceptable.
Advisory Fees and Other Expenses
The directors considered the advisory fee rate payable by the Fund to the Adviser and information prepared by an independent service provider (the “15(c) service provider”), concerning advisory fee rates payable by other ETFs in the same category as the Fund. The directors noted that the advisory fee is a unitary fee and that the Adviser pays all expenses of the Fund except for certain expenses payable by the Fund such as interest expense, taxes, extraordinary expenses, and brokerage commissions and other transaction costs. The directors recognized that it is difficult to make comparisons of advisory fees because there are variations in the services that are included in the fees payable by other ETFs. The directors compared the Fund’s contractual advisory fee rate against a peer group median and noted that it was lower than the median.
The directors also considered the Adviser’s fee schedule for other clients utilizing investment strategies similar to those of the Fund. For this purpose, they reviewed the relevant advisory fee information from the Adviser’s Form ADV and in a report from the Fund’s Senior Vice President and noted the differences between the Fund’s fee schedule, on the one hand, and the Adviser’s institutional fee schedule and the schedule of fees charged by the Adviser to any offshore funds and for services to any sub-advised funds utilizing investment strategies similar to those of the Fund, on the other. The directors noted that the Adviser may, in some cases, agree to fee rates with large institutional clients that are lower than those reviewed by the directors and that they had previously discussed with the Adviser its policies in respect of such arrangements.
The Adviser reviewed with the directors the significantly greater scope of the services it provides to the Fund relative to institutional, offshore fund and sub-advised fund clients. In this regard, the Adviser noted, among other things, that, compared to institutional and offshore or sub-advisory
| | |
| |
26 | AB US LOW VOLATILITY EQUITY ETF | | abfunds.com |
accounts, the Fund (i) demands considerably more managerial and administrative resources due to the potential for frequent creations and redemptions of shares; (ii) has more tax and regulatory restrictions and compliance obligations; (iii) must prepare and file or distribute regulatory and other communications about fund operations; and (iv) must provide shareholder servicing to retail investors. The Adviser also reviewed the greater legal risks presented by the large and changing population of Fund shareholders who may assert claims against the Adviser in individual or class actions, and the greater entrepreneurial risk in offering new fund products, which require substantial investment to launch, may not succeed, and generally must be priced to compete with larger, more established funds resulting in lack of profitability to the Adviser until a new fund achieves scale. In light of the substantial differences in services rendered by the Adviser to institutional, offshore fund and sub-advised fund clients as compared to the Fund, and the different risk profile, the directors considered these fee comparisons inapt and did not place significant weight on them in their deliberations. The directors noted that the unitary fee for the Fund covers additional services provided by third parties and thus is not directly comparable to the Adviser’s institutional fee schedule and the schedule of fees for most other funds advised by the Adviser.
In connection with their review of the Fund’s advisory fee, the directors also considered the total expense ratio of the shares of the Fund in comparison to the medians for a group of similar ETFs (“peer group”) and a larger group of similar ETFs (“peer universe”) selected by the 15(c) service provider. The Fund’s expense ratio was based on the Fund’s latest fiscal year. The directors view expense ratio information as relevant to their evaluation of the Adviser’s services because the Adviser is responsible for coordinating services provided to the Fund by others and, in most cases, the Adviser is responsible for paying for such services under its unitary fee arrangement with the Fund. The directors noted that the Fund’s expense ratio was below the medians. Based on their review, the directors concluded that the Fund’s expense ratio was acceptable.
Economies of Scale
The directors noted that the advisory fee schedule for the Fund does not contain breakpoints and that they had discussed their strong preference for breakpoints in advisory contracts with the Adviser. The directors took into consideration prior presentations by an independent consultant on economies of scale in the mutual fund industry and for the AB Funds, and presentations from time to time by the Adviser concerning certain of its views on economies of scale. The directors also had requested and received from the Adviser certain updates on economies of scale in advance of the Meeting. The directors believe that economies of scale may be realized (if at all) by the Adviser across a variety of products and services, and not only in respect of a single fund. The directors noted that there is no established methodology for setting breakpoints that give effect
| | |
| |
| abfunds.com | | AB US LOW VOLATILITY EQUITY ETF | 27 |
to the fund-specific services provided by a fund’s adviser and to the economies of scale that an adviser may realize in its overall mutual fund business or those components of it which directly or indirectly affect a fund’s operations. The directors observed that in the mutual fund industry as a whole, as well as among ETFs similar to the Fund, there is no uniformity or pattern in the fees and asset levels at which breakpoints (if any) apply. The directors also noted that the advisory agreements for many ETFs do not have breakpoints at all. The directors informed the Adviser that they would monitor the Fund’s asset level and its profitability to the Adviser and anticipated revisiting the question of breakpoints in the future if circumstances warranted doing so.
| | |
| |
28 | AB US LOW VOLATILITY EQUITY ETF | | abfunds.com |
AB US LOW VOLATILITY EQUITY ETF
66 Hudson Boulevard East
New York, NY 10001
800 221 5672
ETF-ULVE-0151-1124 
ITEM 8. CHANGES IN AND DISAGREEMENTS WITH ACCOUNTANTS FOR OPEN-END MANAGEMENT INVESTMENT COMPANIES.
There were no disagreements with accountants during the reporting period.
ITEM 9. PROXY DISCLOSURES FOR OPEN-END MANAGEMENT INVESTMENT COMPANIES
ETF - ConBuffer
At a Special Meeting held on July 18, 2024, shareholders of AB Conservative Buffer ETF (the “Fund”), a series of AB Active ETFs, Inc., elected Directors in connection with the establishment of a single, unitary board (“Unitary Board”) responsible for overseeing mutual funds, exchange-traded funds and certain closed-end investment companies sponsored and advised by the Adviser. In connection with the establishment of the Unitary Board, Ms. Jacklin and Messrs. Downey and Turner will retire as Directors effective December 31, 2024, and Mr. Erzan will resign as a Director effective December 31, 2024, but will continue to serve as President and Chief Executive Officer of the AB Funds. Shareholders of the Fund elected four individuals to serve as Directors effective January 1, 2025 (the “Directors-Elect”), who will serve on the Unitary Board with current Directors Mses. Loeb and McMullen and Messrs. Bermudez and Moody. The number of votes cast for and withheld, as well as the number of abstentions and broker non-votes with respect to the election of each nominee for office is included below.
| | | | | | | | | | | | |
Director: | | Voted For | | | Withheld
Authority | | | Abstained | | Broker Non-Votes |
Jorge A. Bermudez | | | 36,162,279.300 | | | | 163,103.320 | | | N/A | | N/A |
Alexander Chaloff | | | 36,160,056.300 | | | | 165,326.320 | | | N/A | | N/A |
R. Jay Gerken | | | 36,157,821.300 | | | | 167,561.320 | | | N/A | | N/A |
Jeffrey R. Holland | | | 36,163,004.570 | | | | 162,378.050 | | | N/A | | N/A |
Jeanette W. Loeb | | | 34,233,956.300 | | | | 2,091,426.320 | | | N/A | | N/A |
Carol C. McMullen | | | 36,160,596.570 | | | | 164,786.050 | | | N/A | | N/A |
Garry L. Moody | | | 35,991,604.570 | | | | 333,778.050 | | | N/A | | N/A |
Emilie D. Wrapp | | | 36,135,301.570 | | | | 190,081.050 | | | N/A | | N/A |
ETF - CorpBond
At a Special Meeting held on July 18, 2024, shareholders of AB Corporate Bond ETF (the “Fund”), a series of AB Active ETFs, Inc., elected Directors in connection with the establishment of a single, unitary board (“Unitary Board”) responsible for overseeing mutual funds, exchange-traded funds and certain closed-end investment companies sponsored and advised by the Adviser. In connection with the establishment of the Unitary Board, Ms. Jacklin and Messrs. Downey and Turner will retire as Directors effective December 31, 2024, and Mr. Erzan will resign as a Director effective December 31, 2024, but will continue to serve as President and Chief Executive Officer of the AB Funds. Shareholders of the Fund elected four individuals to serve as Directors effective January 1, 2025 (the “Directors-Elect”), who will serve on the Unitary Board with current Directors Mses. Loeb and McMullen and Messrs. Bermudez and Moody. The number of votes cast for and withheld, as well as the number of abstentions and broker non-votes with respect to the election of each nominee for office is included below.
| | | | | | | | | | | | |
Director: | | Voted For | | | Withheld
Authority | | | Abstained | | Broker Non-Votes |
Jorge A. Bermudez | | | 36,162,279.300 | | | | 163,103.320 | | | N/A | | N/A |
Alexander Chaloff | | | 36,160,056.300 | | | | 165,326.320 | | | N/A | | N/A |
R. Jay Gerken | | | 36,157,821.300 | | | | 167,561.320 | | | N/A | | N/A |
Jeffrey R. Holland | | | 36,163,004.570 | | | | 162,378.050 | | | N/A | | N/A |
Jeanette W. Loeb | | | 34,233,956.300 | | | | 2,091,426.320 | | | N/A | | N/A |
Carol C. McMullen | | | 36,160,596.570 | | | | 164,786.050 | | | N/A | | N/A |
Garry L. Moody | | | 35,991,604.570 | | | | 333,778.050 | | | N/A | | N/A |
Emilie D. Wrapp | | | 36,135,301.570 | | | | 190,081.050 | | | N/A | | N/A |
ETF - CPB
At a Special Meeting held on July 18, 2024, shareholders of AB Core Plus Bond ETF (the “Fund”), a series of AB Active ETFs, Inc., elected Directors in connection with the establishment of a single, unitary board (“Unitary Board”) responsible for overseeing mutual funds, exchange-traded funds and certain closed-end investment companies sponsored and advised by the Adviser. In connection with the establishment of the Unitary Board, Ms. Jacklin and Messrs. Downey and Turner will retire as Directors effective December 31, 2024, and Mr. Erzan will resign as a Director effective December 31, 2024, but will continue to serve as President and Chief Executive Officer of the AB Funds. Shareholders of the Fund elected four individuals to serve as Directors effective January 1, 2025 (the “Directors-Elect”), who will serve on the Unitary Board with current Directors Mses. Loeb and McMullen and Messrs. Bermudez and Moody. The number of votes cast for and withheld, as well as the number of abstentions and broker non-votes with respect to the election of each nominee for office is included below.
| | | | | | | | | | | | |
Director: | | Voted For | | | Withheld
Authority | | | Abstained | | Broker Non-Votes |
Jorge A. Bermudez | | | 36,162,279.300 | | | | 163,103.320 | | | N/A | | N/A |
Alexander Chaloff | | | 36,160,056.300 | | | | 165,326.320 | | | N/A | | N/A |
R. Jay Gerken | | | 36,157,821.300 | | | | 167,561.320 | | | N/A | | N/A |
Jeffrey R. Holland | | | 36,163,004.570 | | | | 162,378.050 | | | N/A | | N/A |
Jeanette W. Loeb | | | 34,233,956.300 | | | | 2,091,426.320 | | | N/A | | N/A |
Carol C. McMullen | | | 36,160,596.570 | | | | 164,786.050 | | | N/A | | N/A |
Garry L. Moody | | | 35,991,604.570 | | | | 333,778.050 | | | N/A | | N/A |
Emilie D. Wrapp | | | 36,135,301.570 | | | | 190,081.050 | | | N/A | | N/A |
ETF - DIS
At a Special Meeting held on July 18, 2024, shareholders of AB Disruptors ETF (the “Fund”), a series of AB Active ETFs, Inc., elected Directors in connection with the establishment of a single, unitary board (“Unitary Board”) responsible for overseeing mutual funds, exchange-traded funds and certain closed-end investment companies sponsored and advised by the Adviser. In connection with the establishment of the Unitary Board, Ms. Jacklin and Messrs. Downey and Turner will retire as Directors effective December 31, 2024, and Mr. Erzan will resign as a Director effective December 31, 2024, but will continue to serve as President and Chief Executive Officer of the AB Funds. Shareholders of the Fund elected four individuals to serve as Directors effective January 1, 2025 (the “Directors-Elect”), who will serve on the Unitary Board with current Directors Mses. Loeb and McMullen and Messrs. Bermudez and Moody. The number of votes cast for and withheld, as well as the number of abstentions and broker non-votes with respect to the election of each nominee for office is included below.
| | | | | | | | | | | | |
Director: | | Voted For | | | Withheld
Authority | | | Abstained | | Broker Non-Votes |
Jorge A. Bermudez | | | 36,162,279.300 | | | | 163,103.320 | | | N/A | | N/A |
Alexander Chaloff | | | 36,160,056.300 | | | | 165,326.320 | | | N/A | | N/A |
R. Jay Gerken | | | 36,157,821.300 | | | | 167,561.320 | | | N/A | | N/A |
Jeffrey R. Holland | | | 36,163,004.570 | | | | 162,378.050 | | | N/A | | N/A |
Jeanette W. Loeb | | | 34,233,956.300 | | | | 2,091,426.320 | | | N/A | | N/A |
Carol C. McMullen | | | 36,160,596.570 | | | | 164,786.050 | | | N/A | | N/A |
Garry L. Moody | | | 35,991,604.570 | | | | 333,778.050 | | | N/A | | N/A |
Emilie D. Wrapp | | | 36,135,301.570 | | | | 190,081.050 | | | N/A | | N/A |
ETF - HY
At a Special Meeting held on July 18, 2024, shareholders of AB High Yield ETF (the “Fund”), a series of AB Active ETFs, Inc., elected Directors in connection with the establishment of a single, unitary board (“Unitary Board”) responsible for overseeing mutual funds, exchange-traded funds and certain closed-end investment companies sponsored and advised by the Adviser. In connection with the establishment of the Unitary Board, Ms. Jacklin and Messrs. Downey and Turner will retire as Directors effective December 31, 2024, and Mr. Erzan will resign as a Director effective December 31, 2024, but will continue to serve as President and Chief Executive Officer of the AB Funds. Shareholders of the Fund elected four individuals to serve as Directors effective January 1, 2025 (the “Directors-Elect”), who will serve on the Unitary Board with current Directors Mses. Loeb and McMullen and Messrs. Bermudez and Moody. The number of votes cast for and withheld, as well as the number of abstentions and broker non-votes with respect to the election of each nominee for office is included below.
| | | | | | | | | | | | |
Director: | | Voted For | | | Withheld
Authority | | | Abstained | | Broker Non-Votes |
Jorge A. Bermudez | | | 36,162,279.300 | | | | 163,103.320 | | | N/A | | N/A |
Alexander Chaloff | | | 36,160,056.300 | | | | 165,326.320 | | | N/A | | N/A |
R. Jay Gerken | | | 36,157,821.300 | | | | 167,561.320 | | | N/A | | N/A |
Jeffrey R. Holland | | | 36,163,004.570 | | | | 162,378.050 | | | N/A | | N/A |
Jeanette W. Loeb | | | 34,233,956.300 | | | | 2,091,426.320 | | | N/A | | N/A |
Carol C. McMullen | | | 36,160,596.570 | | | | 164,786.050 | | | N/A | | N/A |
Garry L. Moody | | | 35,991,604.570 | | | | 333,778.050 | | | N/A | | N/A |
Emilie D. Wrapp | | | 36,135,301.570 | | | | 190,081.050 | | | N/A | | N/A |
ETF - ILVE
At a Special Meeting held on July 18, 2024, shareholders of AB International Low Volatility Equity ETF (the “Fund”), a series of AB Active ETFs, Inc., elected Directors in connection with the establishment of a single, unitary board (“Unitary Board”) responsible for overseeing mutual funds, exchange-traded funds and certain closed-end investment companies sponsored and advised by the Adviser. In connection with the establishment of the Unitary Board, Ms. Jacklin and Messrs. Downey and Turner will retire as Directors effective December 31, 2024, and Mr. Erzan will resign as a Director effective December 31, 2024, but will continue to serve as President and Chief Executive Officer of the AB Funds. Shareholders of the Fund elected four individuals to serve as Directors effective January 1, 2025 (the “Directors-Elect”), who will serve on the Unitary Board with current Directors Mses. Loeb and McMullen and Messrs. Bermudez and Moody. The number of votes cast for and withheld, as well as the number of abstentions and broker non-votes with respect to the election of each nominee for office is included below.
| | | | | | | | | | | | |
Director: | | Voted For | | | Withheld
Authority | | | Abstained | | Broker Non-Votes |
Jorge A. Bermudez | | | 36,162,279.300 | | | | 163,103.320 | | | N/A | | N/A |
Alexander Chaloff | | | 36,160,056.300 | | | | 165,326.320 | | | N/A | | N/A |
R. Jay Gerken | | | 36,157,821.300 | | | | 167,561.320 | | | N/A | | N/A |
Jeffrey R. Holland | | | 36,163,004.570 | | | | 162,378.050 | | | N/A | | N/A |
Jeanette W. Loeb | | | 34,233,956.300 | | | | 2,091,426.320 | | | N/A | | N/A |
Carol C. McMullen | | | 36,160,596.570 | | | | 164,786.050 | | | N/A | | N/A |
Garry L. Moody | | | 35,991,604.570 | | | | 333,778.050 | | | N/A | | N/A |
Emilie D. Wrapp | | | 36,135,301.570 | | | | 190,081.050 | | | N/A | | N/A |
ETF - TAIM
At a Special Meeting held on July 18, 2024, shareholders of AB Tax-Aware Intermediate Municipal ETF (the “Fund”), a series of AB Active ETFs, Inc., elected Directors in connection with the establishment of a single, unitary board (“Unitary Board”) responsible for overseeing mutual funds, exchange-traded funds and certain closed-end investment companies sponsored and advised by the Adviser. In connection with the establishment of the Unitary Board, Ms. Jacklin and Messrs. Downey and Turner will retire as Directors effective December 31, 2024, and Mr. Erzan will resign as a Director effective December 31, 2024, but will continue to serve as President and Chief Executive Officer of the AB Funds. Shareholders of the Fund elected four individuals to serve as Directors effective January 1, 2025 (the “Directors-Elect”), who will serve on the Unitary Board with current Directors Mses. Loeb and McMullen and Messrs. Bermudez and Moody. The number of votes cast for and withheld, as well as the number of abstentions and broker non-votes with respect to the election of each nominee for office is included below.
| | | | | | | | | | | | |
Director: | | Voted For | | | Withheld
Authority | | | Abstained | | Broker Non-Votes |
Jorge A. Bermudez | | | 36,162,279.300 | | | | 163,103.320 | | | N/A | | N/A |
Alexander Chaloff | | | 36,160,056.300 | | | | 165,326.320 | | | N/A | | N/A |
R. Jay Gerken | | | 36,157,821.300 | | | | 167,561.320 | | | N/A | | N/A |
Jeffrey R. Holland | | | 36,163,004.570 | | | | 162,378.050 | | | N/A | | N/A |
Jeanette W. Loeb | | | 34,233,956.300 | | | | 2,091,426.320 | | | N/A | | N/A |
Carol C. McMullen | | | 36,160,596.570 | | | | 164,786.050 | | | N/A | | N/A |
Garry L. Moody | | | 35,991,604.570 | | | | 333,778.050 | | | N/A | | N/A |
Emilie D. Wrapp | | | 36,135,301.570 | | | | 190,081.050 | | | N/A | | N/A |
ETF - TALM
At a Special Meeting held on July 18, 2024, shareholders of AB Tax-Aware Long Municipal ETF (the “Fund”), a series of AB Active ETFs, Inc., elected Directors in connection with the establishment of a single, unitary board (“Unitary Board”) responsible for overseeing mutual funds, exchange-traded funds and certain closed-end investment companies sponsored and advised by the Adviser. In connection with the establishment of the Unitary Board, Ms. Jacklin and Messrs. Downey and Turner will retire as Directors effective December 31, 2024, and Mr. Erzan will resign as a Director effective December 31, 2024, but will continue to serve as President and Chief Executive Officer of the AB Funds. Shareholders of the Fund elected four individuals to serve as Directors effective January 1, 2025 (the “Directors-Elect”), who will serve on the Unitary Board with current Directors Mses. Loeb and McMullen and Messrs. Bermudez and Moody. The number of votes cast for and withheld, as well as the number of abstentions and broker non-votes with respect to the election of each nominee for office is included below.
| | | | | | | | | | | | |
Director: | | Voted For | | | Withheld
Authority | | | Abstained | | Broker Non-Votes |
Jorge A. Bermudez | | | 36,162,279.300 | | | | 163,103.320 | | | N/A | | N/A |
Alexander Chaloff | | | 36,160,056.300 | | | | 165,326.320 | | | N/A | | N/A |
R. Jay Gerken | | | 36,157,821.300 | | | | 167,561.320 | | | N/A | | N/A |
Jeffrey R. Holland | | | 36,163,004.570 | | | | 162,378.050 | | | N/A | | N/A |
Jeanette W. Loeb | | | 34,233,956.300 | | | | 2,091,426.320 | | | N/A | | N/A |
Carol C. McMullen | | | 36,160,596.570 | | | | 164,786.050 | | | N/A | | N/A |
Garry L. Moody | | | 35,991,604.570 | | | | 333,778.050 | | | N/A | | N/A |
Emilie D. Wrapp | | | 36,135,301.570 | | | | 190,081.050 | | | N/A | | N/A |
ETF - TASD
At a Special Meeting held on July 18, 2024, shareholders of AB Tax-Aware Short Duration Municipal ETF (the “Fund”), a series of AB Active ETFs, Inc., elected Directors in connection with the establishment of a single, unitary board (“Unitary Board”) responsible for overseeing mutual funds, exchange-traded funds and certain closed-end investment companies sponsored and advised by the Adviser. In connection with the establishment of the Unitary Board, Ms. Jacklin and Messrs. Downey and Turner will retire as Directors effective December 31, 2024, and Mr. Erzan will resign as a Director effective December 31, 2024, but will continue to serve as President and Chief Executive Officer of the AB Funds. Shareholders of the Fund elected four individuals to serve as Directors effective January 1, 2025 (the “Directors-Elect”), who will serve on the Unitary Board with current Directors Mses. Loeb and McMullen and Messrs. Bermudez and Moody. The number of votes cast for and withheld, as well as the number of abstentions and broker non-votes with respect to the election of each nominee for office is included below.
| | | | | | | | | | | | |
Director: | | Voted For | | | Withheld
Authority | | | Abstained | | Broker Non-Votes |
Jorge A. Bermudez | | | 36,162,279.300 | | | | 163,103.320 | | | N/A | | N/A |
Alexander Chaloff | | | 36,160,056.300 | | | | 165,326.320 | | | N/A | | N/A |
R. Jay Gerken | | | 36,157,821.300 | | | | 167,561.320 | | | N/A | | N/A |
Jeffrey R. Holland | | | 36,163,004.570 | | | | 162,378.050 | | | N/A | | N/A |
Jeanette W. Loeb | | | 34,233,956.300 | | | | 2,091,426.320 | | | N/A | | N/A |
Carol C. McMullen | | | 36,160,596.570 | | | | 164,786.050 | | | N/A | | N/A |
Garry L. Moody | | | 35,991,604.570 | | | | 333,778.050 | | | N/A | | N/A |
Emilie D. Wrapp | | | 36,135,301.570 | | | | 190,081.050 | | | N/A | | N/A |
ETF - USHD
At a Special Meeting held on July 18, 2024, shareholders of AB US High Dividend ETF (the “Fund”), a series of AB Active ETFs, Inc., elected Directors in connection with the establishment of a single, unitary board (“Unitary Board”) responsible for overseeing mutual funds, exchange-traded funds and certain closed-end investment companies sponsored and advised by the Adviser. In connection with the establishment of the Unitary Board, Ms. Jacklin and Messrs. Downey and Turner will retire as Directors effective December 31, 2024, and Mr. Erzan will resign as a Director effective December 31, 2024, but will continue to serve as President and Chief Executive Officer of the AB Funds. Shareholders of the Fund elected four individuals to serve as Directors effective January 1, 2025 (the “Directors-Elect”), who will serve on the Unitary Board with current Directors Mses. Loeb and McMullen and Messrs. Bermudez and Moody. The number of votes cast for and withheld, as well as the number of abstentions and broker non-votes with respect to the election of each nominee for office is included below.
| | | | | | | | | | | | |
Director: | | Voted For | | | Withheld
Authority | | | Abstained | | Broker Non-Votes |
Jorge A. Bermudez | | | 36,162,279.300 | | | | 163,103.320 | | | N/A | | N/A |
Alexander Chaloff | | | 36,160,056.300 | | | | 165,326.320 | | | N/A | | N/A |
R. Jay Gerken | | | 36,157,821.300 | | | | 167,561.320 | | | N/A | | N/A |
Jeffrey R. Holland | | | 36,163,004.570 | | | | 162,378.050 | | | N/A | | N/A |
Jeanette W. Loeb | | | 34,233,956.300 | | | | 2,091,426.320 | | | N/A | | N/A |
Carol C. McMullen | | | 36,160,596.570 | | | | 164,786.050 | | | N/A | | N/A |
Garry L. Moody | | | 35,991,604.570 | | | | 333,778.050 | | | N/A | | N/A |
Emilie D. Wrapp | | | 36,135,301.570 | | | | 190,081.050 | | | N/A | | N/A |
ETF-USI
At a Special Meeting held on July 18, 2024, shareholders of AB Ultra Short Income ETF (the “Fund”), a series of AB Active ETFs, Inc., elected Directors in connection with the establishment of a single, unitary board (“Unitary Board”) responsible for overseeing mutual funds, exchange-traded funds and certain closed-end investment companies sponsored and advised by the Adviser. In connection with the establishment of the Unitary Board, Ms. Jacklin and Messrs. Downey and Turner will retire as Directors effective December 31, 2024, and Mr. Erzan will resign as a Director effective December 31, 2024, but will continue to serve as President and Chief Executive Officer of the AB Funds. Shareholders of the Fund elected four individuals to serve as Directors effective January 1, 2025 (the “Directors-Elect”), who will serve on the Unitary Board with current Directors Mses. Loeb and McMullen and Messrs. Bermudez and Moody. The number of votes cast for and withheld, as well as the number of abstentions and broker non-votes with respect to the election of each nominee for office is included below.
| | | | | | | | | | | | |
Director: | | Voted For | | | Withheld
Authority | | | Abstained | | Broker Non-Votes |
Jorge A. Bermudez | | | 36,162,279.300 | | | | 163,103.320 | | | N/A | | N/A |
Alexander Chaloff | | | 36,160,056.300 | | | | 165,326.320 | | | N/A | | N/A |
R. Jay Gerken | | | 36,157,821.300 | | | | 167,561.320 | | | N/A | | N/A |
Jeffrey R. Holland | | | 36,163,004.570 | | | | 162,378.050 | | | N/A | | N/A |
Jeanette W. Loeb | | | 34,233,956.300 | | | | 2,091,426.320 | | | N/A | | N/A |
Carol C. McMullen | | | 36,160,596.570 | | | | 164,786.050 | | | N/A | | N/A |
Garry L. Moody | | | 35,991,604.570 | | | | 333,778.050 | | | N/A | | N/A |
Emilie D. Wrapp | | | 36,135,301.570 | | | | 190,081.050 | | | N/A | | N/A |
ETF - USLCSE
At a Special Meeting held on July 18, 2024, shareholders of AB US Large Cap Strategic Equities ETF (the “Fund”), a series of AB Active ETFs, Inc., elected Directors in connection with the establishment of a single, unitary board (“Unitary Board”) responsible for overseeing mutual funds, exchange-traded funds and certain closed-end investment companies sponsored and advised by the Adviser. In connection with the establishment of the Unitary Board, Ms. Jacklin and Messrs. Downey and Turner will retire as Directors effective December 31, 2024, and Mr. Erzan will resign as a Director effective December 31, 2024, but will continue to serve as President and Chief Executive Officer of the AB Funds. Shareholders of the Fund elected four individuals to serve as Directors effective January 1, 2025 (the “Directors-Elect”), who will serve on the Unitary Board with current Directors Mses. Loeb and McMullen and Messrs. Bermudez and Moody. The number of votes cast for and withheld, as well as the number of abstentions and broker non-votes with respect to the election of each nominee for office is included below.
| | | | | | | | | | | | |
Director: | | Voted For | | | Withheld
Authority | | | Abstained | | Broker Non-Votes |
Jorge A. Bermudez | | | 36,162,279.300 | | | | 163,103.320 | | | N/A | | N/A |
Alexander Chaloff | | | 36,160,056.300 | | | | 165,326.320 | | | N/A | | N/A |
R. Jay Gerken | | | 36,157,821.300 | | | | 167,561.320 | | | N/A | | N/A |
Jeffrey R. Holland | | | 36,163,004.570 | | | | 162,378.050 | | | N/A | | N/A |
Jeanette W. Loeb | | | 34,233,956.300 | | | | 2,091,426.320 | | | N/A | | N/A |
Carol C. McMullen | | | 36,160,596.570 | | | | 164,786.050 | | | N/A | | N/A |
Garry L. Moody | | | 35,991,604.570 | | | | 333,778.050 | | | N/A | | N/A |
Emilie D. Wrapp | | | 36,135,301.570 | | | | 190,081.050 | | | N/A | | N/A |
ETF - USLV
At a Special Meeting held on July 18, 2024, shareholders of AB US Low Volatility Equity ETF (the “Fund”), a series of AB Active ETFs, Inc., elected Directors in connection with the establishment of a single, unitary board (“Unitary Board”) responsible for overseeing mutual funds, exchange-traded funds and certain closed-end investment companies sponsored and advised by the Adviser. In connection with the establishment of the Unitary Board, Ms. Jacklin and Messrs. Downey and Turner will retire as Directors effective December 31, 2024, and Mr. Erzan will resign as a Director effective December 31, 2024, but will continue to serve as President and Chief Executive Officer of the AB Funds. Shareholders of the Fund elected four individuals to serve as Directors effective January 1, 2025 (the “Directors-Elect”), who will serve on the Unitary Board with current Directors Mses. Loeb and McMullen and Messrs. Bermudez and Moody. The number of votes cast for and withheld, as well as the number of abstentions and broker non-votes with respect to the election of each nominee for office is included below.
| | | | | | | | | | | | |
Director: | | Voted For | | | Withheld
Authority | | | Abstained | | Broker Non-Votes |
Jorge A. Bermudez | | | 36,162,279.300 | | | | 163,103.320 | | | N/A | | N/A |
Alexander Chaloff | | | 36,160,056.300 | | | | 165,326.320 | | | N/A | | N/A |
R. Jay Gerken | | | 36,157,821.300 | | | | 167,561.320 | | | N/A | | N/A |
Jeffrey R. Holland | | | 36,163,004.570 | | | | 162,378.050 | | | N/A | | N/A |
Jeanette W. Loeb | | | 34,233,956.300 | | | | 2,091,426.320 | | | N/A | | N/A |
Carol C. McMullen | | | 36,160,596.570 | | | | 164,786.050 | | | N/A | | N/A |
Garry L. Moody | | | 35,991,604.570 | | | | 333,778.050 | | | N/A | | N/A |
Emilie D. Wrapp | | | 36,135,301.570 | | | | 190,081.050 | | | N/A | | N/A |
ITEM 10. REMUNERATION PAID TO DIRECTORS, OFFICERS, AND OTHERS OF OPEN-END MANAGEMENT INVESTMENT COMPANIES.
Aggregate remuneration paid to all Directors and advisory board members are included within the Financial Statements under Item 1 of this Form N-CSR.
ITEM 11. STATEMENT REGARDING BASIS FOR APPROVAL OF INVESTMENT ADVISORY CONTRACT.
Statement regarding basis for Approval of Investment Advisory Contract included within the Financial Statements under Item 7 of this Form N-CSR.
ITEM 12. DISCLOSURE OF PROXY VOTING POLICIES AND PROCEDURES FOR CLOSED-END MANAGEMENT INVESTMENT COMPANIES.
Not applicable to the registrant.
ITEM 13. PORTFOLIO MANAGERS OF CLOSED END MANAGEMENT INVESTMENT COMPANIES.
Not applicable to the registrant.
ITEM 14. PURCHASES OF EQUITY SECURITIES BY CLOSED-END MANAGEMENT INVESTMENT COMPANY OF AND AFFILIDATED PURCHASERS.
Not applicable to the registrant.
ITEM 15. SUBMISSION OF MATTERS TO A VOTE OF SECURITY HOLDERS.
There have been no material changes to the procedures by which shareholders may recommend nominees to the Fund’s Board of Directors since the Fund last provided disclosure in response to this item.
ITEM 16. CONTROLS AND PROCEDURES.
(a) The registrant’s principal executive officer and principal financial officer have concluded that the registrant’s disclosure controls and procedures (as defined in Rule 30a-2(c) under the Investment Company Act of 1940, as amended) are effective at the reasonable assurance level based on their evaluation of these controls and procedures as of a date within 90 days of the filing date of this document.
(b) There were no changes in the registrant’s internal controls over financial reporting that occurred during the period covered by this report that has materially affected, or is reasonably likely to materially affect, the registrant’s internal control over financial reporting.
ITEM 17. DISCLOSURE OF SECURITIES LENDING ACTIVITIES FOR CLOSED-END MANAGEMENT INVESTMENT COMPANIES.
Not applicable to the registrant.
ITEM 18. RECOVERY OF ERRONEOUSLY AWARDED COMPENSATION.
Not applicable to the registrant
ITEM 19. EXHIBITS.
The following exhibits are attached to this Form N-CSR:
SIGNATURES
Pursuant to the requirements of the Securities Exchange Act of 1934 and the Investment Company Act of 1940, the registrant has duly caused this report to be signed on its behalf by the undersigned, thereunto duly authorized.
| | |
| (Registrant): AB Active ETFs, Inc. |
| |
| By: | | /s/ Onur Erzan |
| | Onur Erzan |
| | President |
| |
| Date: | | January 29, 2025 |
Pursuant to the requirements of the Securities Exchange Act of 1934 and the Investment Company Act of 1940, this report has been signed below by the following persons on behalf of the registrant and in the capacities and on the dates indicated.
| | |
| By: | | /s/ Onur Erzan |
| | Onur Erzan |
| | President |
| |
| Date: | | January 29, 2025 |
| |
| By: | | /s/ Stephen M. Woetzel |
| | Stephen M. Woetzel |
| | Treasurer and Chief Financial Officer |
| |
| Date: | | January 29, 2025 |