UNITED STATES
SECURITIES AND EXCHANGE COMMISSION
Washington, D.C. 20549
FORM N-CSR
CERTIFIED SHAREHOLDER REPORT OF REGISTERED
MANAGEMENT INVESTMENT COMPANIES
Investment Company Act file number811- 22441
John Hancock Hedged Equity & Income Fund
(Exact name of registrant as specified in charter)
200 Berkeley Street, Boston, Massachusetts 02116
(Address of principal executive offices) (Zip code)
Salvatore Schiavone
Treasurer
197 Clarendon Street
Boston, Massachusetts 02116
(Name and address of agent for service)
Registrant's telephone number, including area code: | 617-663-4497 |
| | |
| Date of fiscal year end: | December 31 |
| |
| |
| | |
| Date of reporting period: | June 30, 2019 |
ITEM 1. REPORTS TO STOCKHOLDERS.
John Hancock
Hedged Equity & Income Fund
Ticker: HEQ
Semiannual report 6/30/19
Beginning on January 1, 2021, as permitted by regulations adopted by the Securities and Exchange Commission, paper copies of the fund's shareholder reports such as this one will no longer be sent by mail, unless you specifically request paper copies of the reports from the transfer agent or from your financial intermediary. Instead, the reports will be made available on our website, and you will be notified by mail each time a report is posted and be provided with a website link to access the report.
If you have already elected to receive shareholder reports electronically, you will not be affected by this change and you do not need to take any action. You may elect to receive shareholder reports and other communications electronically by calling the transfer agent, Computershare, at 800-852-0218, by going to "Communication Preferences" at computershare.com/investor, or by contacting your financial intermediary.
You may elect to receive all reports in paper, free of charge, at any time. You can inform the transfer agent or your financial intermediary that you wish to continue receiving paper copies of your shareholder reports by following the instructions listed above. Your election to receive reports in paper will apply to all funds held with John Hancock Investment Management or your financial intermediary.

Managed distribution plan
The fund has adopted a managed distribution plan (Plan). Under the Plan, the fund makes quarterly distributions of an amount equal to $0.376 per share, which will be paid quarterly until further notice. The fund may make additional distributions: (i) for purposes of not incurring federal income tax at the fund level of investment company taxable income and net capital gain, if any, not included in such regular distributions; and (ii) for purposes of not incurring federal excise tax on ordinary income and capital gain net income, if any, not included in such regular distributions.
The Plan provides that the Board of Trustees of the fund may amend the terms of the Plan or terminate the Plan at any time without prior notice to the fund's shareholders. The Plan is subject to periodic review by the fund's Board of Trustees.
You should not draw any conclusions about the fund's investment performance from the amount of the fund's distributions or from the terms of the fund's Plan. The fund's total return at NAV is presented in the Financial highlights section.
With each distribution that does not consist solely of net income, the fund will issue a notice to shareholders and an accompanying press release that will provide detailed information regarding the amount and composition of the distribution and other related information. The amounts and sources of distributions reported in the notice to shareholders are only estimates and are not provided for tax reporting purposes. The actual amounts and sources of the amounts for tax reporting purposes will depend upon the fund's investment experience during the remainder of its fiscal year and may be subject to changes based on tax regulations. The fund will send you a Form 1099-DIV for the calendar year that will tell you how to report these distributions for federal income tax purposes. The fund may, at times, distribute more than its net investment income and net realized capital gains; therefore, a portion of your distribution may result in a return of capital. A return of capital may occur, for example, when some or all of the money that you invested in the fund is paid back to you. A return of capital does not necessarily reflect the fund's investment performance and should not be confused with yield or income.
A message to shareholders
Dear shareholder,
An increasingly favorable outlook for U.S. Federal Reserve (Fed) policy drove positive returns across the equity markets for the six months ended June 30, 2019. The combination of slowing growth and low inflation prompted the Fed to adopt a more dovish tone in its communications. The world equity markets rallied in response, as the improving rate outlook led investors to look past the more immediate concerns of weak economic data and the ongoing trade dispute between the United States and China. Market volatility did increase after period end, however, as a result of the trade dispute.
As always, your best resource in unpredictable markets is your financial advisor, who can help position your portfolio so that it's sufficiently diversified to meet your long-term objectives and to withstand the inevitable turbulence along the way.
On behalf of everyone at John Hancock Investment Management, I'd like to take this opportunity to welcome new shareholders and thank existing shareholders for the continued trust you've placed in us.
Sincerely,
Andrew G. Arnott
President and CEO,
John Hancock Investment Management
Head of Wealth and Asset Management,
United States and Europe
This commentary reflects the CEO's views as of this report's period end and are subject to change at any time. Diversification does not guarantee investment returns and does not eliminate risk of loss. All investments entail risks, including the possible loss of principal. For more up-to-date information, you can visit our website at jhinvestments.com.
John Hancock
Hedged Equity & Income Fund
Table of contents
| | | |
| 2 | | Your fund at a glance |
| 3 | | Portfolio Summary |
| 6 | | Fund's investments |
| 32 | | Financial statements |
| 35 | | Financial highlights |
| 36 | | Notes to financial statements |
| 45 | | Additional information |
| 46 | | Shareholder meeting |
| 47 | | Continuation of investment advisory and subadvisory agreements |
| 54 | | More information |
SEMIANNUAL REPORT | JOHN HANCOCK HEDGED EQUITY & INCOME FUND 1
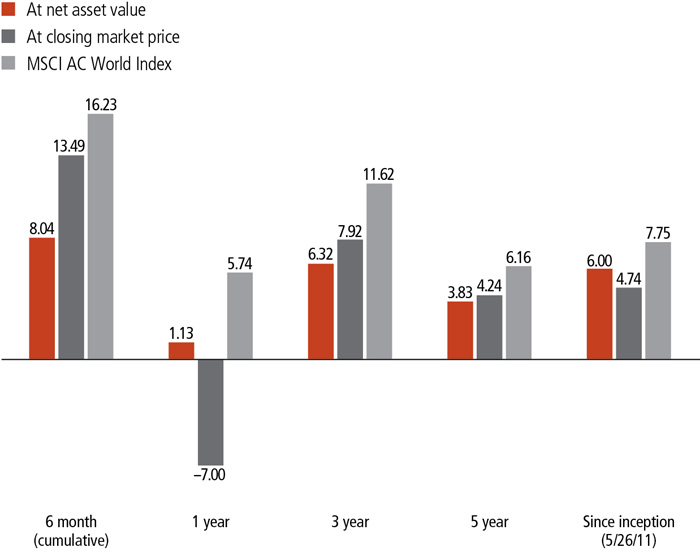
INVESTMENT OBJECTIVE
The fund seeks to provide total return with a focus on current income and gains and also consisting of long-term capital appreciation.
AVERAGE ANNUAL TOTAL RETURNS AS OF 6/30/19 (%)
The MSCI All Country World Index is a free float-adjusted market-capitalization-weighted index that is designed to measure the equity market performance of developed and emerging markets.
It is not possible to invest directly in an index. Index figures do not reflect expenses and sales charges, which would result in lower returns.
The performance data contained within this material represents past performance, which does not guarantee future results.
Investment returns and principal value will fluctuate and a shareholder may sustain losses. Further, the fund's performance at net asset value (NAV) is different from the fund's performance at closing market price because the closing market price is subject to the dynamics of secondary market trading. Market risk may be increased when shares are purchased at a premium to NAV or sold at a discount to NAV. Current month-end performance may be higher or lower than the performance cited. The fund's most recent performance can be found at jhinvestment.com or by calling 800-852-0218.
SEMIANNUAL REPORT | JOHN HANCOCK HEDGED EQUITY & INCOME FUND 2
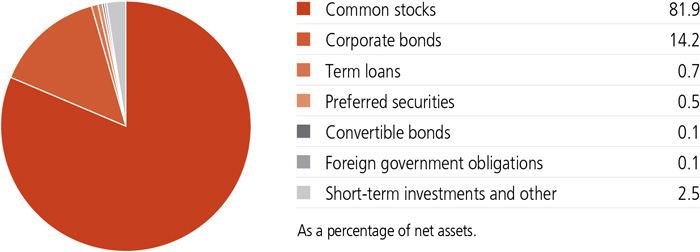
PORTFOLIO COMPOSITION AS OF 6/30/19 (%)
A note about risks
As is the case with all exchange-listed closed-end funds, shares of this fund may trade at a discount or a premium to the fund's net asset value (NAV). An investment in the fund is subject to investment and market risks, including the possible loss of the entire principal invested. There is no guarantee prior distribution levels will be maintained, and distributions may include a substantial return of capital. A return of capital is the return of all or a portion of a shareholder's investment in the fund. For the fiscal year ended December 31,2018, the fund's aggregate distributions included a return of capital of $0.25 per share, or 17% of aggregate distributions, which could impact the tax treatment of a subsequent sale of fund shares. See the financial highlights and notes to the financial statements for details of the return of capital and risks associated with distributions made by the fund. The fund's prospectus includes additional information regarding returns of capital and the risks associated with distributions made by the fund, including potential tax implications. Fixed-income investments are subject to interest-rate risk; their value will normally decline as interest rates rise. An issuer of securities held by the fund may default, have its credit rating downgraded, or otherwise perform poorly, which may affect fund performance. Derivatives transactions, including hedging and other strategic transactions, may increase a fund's volatility and could produce disproportionate losses, potentially more than the fund's principal investment. Liquidity—the extent to which a security may be sold or a derivative position closed without negatively affecting its market value—may be impaired by reduced trading volume, heightened volatility, rising interest rates, and other market conditions. Foreign investing, especially in emerging markets, has additional risks, such as currency and market volatility and political and social instability. China A shares are subject to a number of restrictions imposed by Chinese securities regulations and local exchange listing rules. Investments in higher-yielding, lower-rated securities include a higher risk of default. The primary risks associated with the use of futures contracts and options are imperfect correlation, unanticipated market movement, and counterparty risk. Cybersecurity incidents may allow an unauthorized party to gain access to fund assets, customer data, or proprietary information, or cause a fund or its service providers to suffer data corruption or lose operational functionality. Similar incidents affecting issuers of a fund's securities may negatively impact performance.
SEMIANNUAL REPORT | JOHN HANCOCK HEDGED EQUITY & INCOME FUND 3
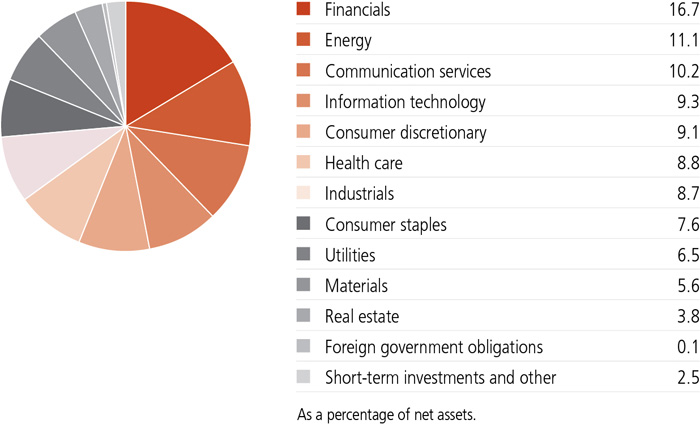
SECTOR COMPOSITION AS OF 6/30/19 (%)
TOP 10 HOLDINGS AS OF 6/30/19 (%)
| | |
| The Coca-Cola Company | 1.7 |
| Roche Holding AG | 1.6 |
| Novartis AG | 1.6 |
| Verizon Communications, Inc. | 1.3 |
| TOTAL SA | 1.2 |
| Unilever NV | 1.2 |
| Zurich Insurance Group AG | 1.1 |
| QUALCOMM, Inc. | 1.1 |
| Philip Morris International, Inc. | 1.1 |
| Pfizer, Inc. | 1.0 |
| TOTAL | 12.9 |
| As a percentage of net assets. |
| Cash and cash equivalents are not included. |
SEMIANNUAL REPORT | JOHN HANCOCK HEDGED EQUITY & INCOME FUND 4
COUNTRY COMPOSITION AS OF 6/30/19 (%)
| | |
| United States | 41.5 |
| United Kingdom | 8.2 |
| Japan | 7.9 |
| Switzerland | 6.5 |
| France | 4.0 |
| Italy | 3.4 |
| Canada | 3.3 |
| Netherlands | 3.2 |
| China | 2.0 |
| Finland | 2.0 |
| Other countries | 18.0 |
| TOTAL | 100.0 |
| As a percentage of net assets. | |
SEMIANNUAL REPORT | JOHN HANCOCK HEDGED EQUITY & INCOME FUND 5
AS OF 6-30-19 (unaudited)
| | | | | Shares | Value |
| Common stocks 81.9% | | | | | $148,397,613 |
| (Cost $157,490,735) | | | | | |
| Communication services 7.6% | | | 13,760,219 |
| Diversified telecommunication services 4.3% | | | |
| AT&T, Inc. | | | 13,354 | 447,493 |
| BCE, Inc. | | | 31,541 | 1,435,007 |
| BT Group PLC | | | 88,599 | 221,527 |
| CenturyLink, Inc. | | | 23,227 | 273,150 |
| China Telecom Corp., Ltd., H Shares | | | 355,055 | 178,787 |
| China Unicom Hong Kong, Ltd. | | | 249,210 | 272,487 |
| Hellenic Telecommunications Organization SA | | | 9,999 | 147,732 |
| Koninklijke KPN NV | | | 201,684 | 619,330 |
| KT Corp. | | | 8,549 | 209,905 |
| Magyar Telekom Telecommunications PLC | | | 64,539 | 95,690 |
| O2 Czech Republic AS | | | 31,143 | 308,459 |
| Proximus SADP | | | 3,418 | 101,018 |
| Spark New Zealand, Ltd. | | | 63,538 | 170,941 |
| Telefonica Deutschland Holding AG | | | 62,932 | 176,011 |
| Telenor ASA | | | 35,181 | 747,462 |
| Verizon Communications, Inc. (A) | | | 41,646 | 2,379,236 |
| Entertainment 0.2% | | | |
| Avex, Inc. | | | 7,310 | 92,892 |
| DeNA Company, Ltd. | | | 6,360 | 121,937 |
| Konami Holdings Corp. | | | 900 | 42,335 |
| NHN Corp. (B) | | | 607 | 40,637 |
| Nintendo Company, Ltd. | | | 273 | 100,163 |
| Interactive media and services 0.7% | | | |
| Alphabet, Inc., Class A (B) | | | 388 | 420,126 |
| Autohome, Inc., ADR (B) | | | 120 | 10,274 |
| Baidu, Inc., ADR (B) | | | 312 | 36,616 |
| Facebook, Inc., Class A (B) | | | 1,405 | 271,165 |
| Gree, Inc. | | | 31,010 | 144,653 |
| Momo, Inc., ADR | | | 709 | 25,382 |
| SINA Corp. (B) | | | 528 | 22,773 |
| Yahoo Japan Corp. | | | 102,340 | 301,038 |
| Media 1.1% | | | |
| Eutelsat Communications SA | | | 2,017 | 37,670 |
| Fuji Media Holdings, Inc. | | | 5,535 | 77,311 |
| Gendai Agency, Inc. | | | 3,360 | 13,410 |
| Metropole Television SA | | | 6,656 | 125,902 |
| Nippon Television Holdings, Inc. | | | 10,210 | 151,485 |
| ProSiebenSat.1 Media SE | | | 4,759 | 74,552 |
| SEE NOTES TO FINANCIAL STATEMENTS | SEMIANNUAL REPORT | JOHN HANCOCK HEDGED EQUITY & INCOME FUND | 6 |
| | | | | Shares | Value |
| Communication services (continued) | | | |
| Media (continued) | | | |
| Publicis Groupe SA | | | 11,296 | $596,212 |
| RTL Group SA | | | 3,394 | 173,713 |
| SES SA | | | 19,988 | 312,141 |
| Telenet Group Holding NV | | | 3,290 | 183,327 |
| Television Francaise 1 | | | 15,029 | 158,151 |
| TV Asahi Holdings Corp. | | | 5,340 | 86,296 |
| Wireless telecommunication services 1.3% | | | |
| China Mobile, Ltd. | | | 128,630 | 1,171,004 |
| Millicom International Cellular SA | | | 11,166 | 628,550 |
| MTN Group, Ltd. | | | 14,102 | 106,636 |
| NTT DOCOMO, Inc. | | | 5,862 | 136,772 |
| Orange Belgium SA | | | 4,782 | 94,874 |
| VEON, Ltd. | | | 37,994 | 106,383 |
| Vodafone Group PLC | | | 68,090 | 111,604 |
| Consumer discretionary 6.6% | | | 11,973,416 |
| Auto components 0.8% | | | |
| Aisan Industry Company, Ltd. | | | 6,780 | 43,028 |
| Bridgestone Corp. | | | 3,043 | 120,043 |
| Exedy Corp. | | | 5,005 | 105,103 |
| Fuyao Glass Industry Group Company, Ltd., H Shares (C) | | | 56,585 | 175,713 |
| Keihin Corp. | | | 7,245 | 103,958 |
| Nissin Kogyo Company, Ltd. | | | 7,584 | 104,529 |
| NOK Corp. | | | 11,375 | 170,885 |
| Sumitomo Riko Company, Ltd. | | | 7,590 | 59,411 |
| Tachi-S Company, Ltd. | | | 5,600 | 72,096 |
| Tokai Rika Company, Ltd. | | | 7,500 | 123,967 |
| Toyoda Gosei Company, Ltd. | | | 7,495 | 146,477 |
| Unipres Corp. | | | 7,500 | 123,526 |
| Automobiles 0.9% | | | |
| Daimler AG | | | 5,579 | 311,151 |
| Dongfeng Motor Group Company, Ltd., H Shares | | | 221,960 | 182,000 |
| Ford Motor Company | | | 22,901 | 234,277 |
| Honda Motor Company, Ltd. | | | 16,290 | 421,239 |
| Nissan Motor Company, Ltd. | | | 50,737 | 363,402 |
| Renault SA | | | 3,082 | 193,757 |
| Diversified consumer services 0.5% | | | |
| Allstar Co-Invest LLC (B)(D)(E) | | | 236,300 | 0 |
| Benesse Holdings, Inc. | | | 2,540 | 59,277 |
| H&R Block, Inc. | | | 23,403 | 685,708 |
| New Oriental Education & Technology Group, Inc., ADR (B) | | | 609 | 58,817 |
| 7 | JOHN HANCOCK HEDGED EQUITY & INCOME FUND | SEMIANNUAL REPORT | SEE NOTES TO FINANCIAL STATEMENTS |
| | | | | Shares | Value |
| Consumer discretionary (continued) | | | |
| Hotels, restaurants and leisure 1.2% | | | |
| Carnival Corp. | | | 2,036 | $94,776 |
| Darden Restaurants, Inc. | | | 489 | 59,526 |
| Las Vegas Sands Corp. | | | 23,931 | 1,414,083 |
| McDonald's Corp. | | | 1,585 | 329,141 |
| OPAP SA | | | 23,209 | 260,326 |
| Household durables 1.0% | | | |
| Barratt Developments PLC | | | 27,609 | 200,910 |
| Funai Electric Company, Ltd. (B) | | | 11,823 | 86,237 |
| Garmin, Ltd. | | | 2,129 | 169,894 |
| Newell Brands, Inc. | | | 32,865 | 506,778 |
| Nikon Corp. | | | 6,555 | 93,209 |
| Persimmon PLC | | | 10,827 | 275,059 |
| Taylor Wimpey PLC | | | 193,200 | 387,685 |
| The Berkeley Group Holdings PLC | | | 1,039 | 49,242 |
| Woongjin Coway Company, Ltd. | | | 696 | 46,557 |
| Internet and direct marketing retail 0.4% | | | |
| Alibaba Group Holding, Ltd., ADR (B) | | | 1,554 | 263,325 |
| Amazon.com, Inc. (B) | | | 260 | 492,344 |
| Qliro Group AB (B) | | | 32,374 | 40,736 |
| Leisure products 0.0% | | | |
| Sankyo Company, Ltd. | | | 1,600 | 58,013 |
| Multiline retail 0.2% | | | |
| Kohl's Corp. | | | 257 | 12,220 |
| Macy's, Inc. | | | 2,543 | 54,573 |
| Marks & Spencer Group PLC | | | 43,074 | 115,168 |
| Target Corp. | | | 1,435 | 124,285 |
| Wesfarmers, Ltd. | | | 5,031 | 127,889 |
| Specialty retail 1.0% | | | |
| CECONOMY AG (B) | | | 17,639 | 107,835 |
| Halfords Group PLC | | | 29,640 | 84,972 |
| Honeys Holdings Company, Ltd. | | | 2,220 | 24,438 |
| Kingfisher PLC | | | 64,104 | 174,727 |
| L Brands, Inc. (A) | | | 2,418 | 63,110 |
| Nishimatsuya Chain Company, Ltd. | | | 6,110 | 47,280 |
| Shimamura Company, Ltd. | | | 1,770 | 132,513 |
| The Foschini Group, Ltd. | | | 53,821 | 689,612 |
| The Gap, Inc. | | | 3,154 | 56,677 |
| The Home Depot, Inc. | | | 1,011 | 210,258 |
| USS Company, Ltd. | | | 3,200 | 63,216 |
| Xebio Holdings Company, Ltd. | | | 8,895 | 101,396 |
| Textiles, apparel and luxury goods 0.6% | | | |
| 361 Degrees International, Ltd. | | | 259,300 | 51,506 |
| SEE NOTES TO FINANCIAL STATEMENTS | SEMIANNUAL REPORT | JOHN HANCOCK HEDGED EQUITY & INCOME FUND | 8 |
| | | | | Shares | Value |
| Consumer discretionary (continued) | | | |
| Textiles, apparel and luxury goods (continued) | | | |
| Daphne International Holdings, Ltd. (B) | | | 330,250 | $8,575 |
| Geox SpA | | | 24,027 | 34,874 |
| Pandora A/S | | | 1,108 | 39,422 |
| Sanyo Shokai, Ltd. | | | 4,760 | 67,847 |
| Tapestry, Inc. | | | 28,201 | 894,818 |
| Consumer staples 7.0% | | | 12,626,419 |
| Beverages 1.9% | | | |
| Anadolu Efes Biracilik Ve Malt Sanayii AS | | | 18,246 | 62,670 |
| Coca-Cola Icecek AS | | | 4,810 | 24,820 |
| PepsiCo, Inc. | | | 2,422 | 317,597 |
| The Coca-Cola Company (A) | | | 60,280 | 3,069,437 |
| Food and staples retailing 0.3% | | | |
| Casino Guichard Perrachon SA | | | 1,734 | 59,051 |
| Cawachi, Ltd. | | | 2,800 | 52,018 |
| Coles Group, Ltd. (B) | | | 5,031 | 47,237 |
| J Sainsbury PLC | | | 55,880 | 138,862 |
| METRO AG | | | 8,839 | 161,513 |
| Sysco Corp. | | | 678 | 47,948 |
| Walmart, Inc. | | | 789 | 87,177 |
| Food products 0.8% | | | |
| General Mills, Inc. | | | 12,654 | 664,588 |
| Perusahaan Perkebunan London Sumatra Indonesia Tbk PT | | | 5,800 | 460 |
| The Kraft Heinz Company | | | 24,146 | 749,492 |
| Household products 0.3% | | | |
| The Procter & Gamble Company | | | 3,920 | 429,828 |
| Personal products 1.3% | | | |
| The Estee Lauder Companies, Inc., Class A | | | 499 | 91,372 |
| Unilever NV | | | 36,784 | 2,234,927 |
| Tobacco 2.4% | | | |
| Altria Group, Inc. | | | 5,471 | 259,052 |
| British American Tobacco PLC | | | 24,835 | 867,136 |
| Imperial Brands PLC | | | 50,081 | 1,175,158 |
| Japan Tobacco, Inc. | | | 6,459 | 142,380 |
| Philip Morris International, Inc. | | | 24,751 | 1,943,696 |
| Energy 9.1% | | | 16,442,827 |
| Energy equipment and services 0.6% | | | |
| Fugro NV (B) | | | 7,321 | 62,979 |
| Helmerich & Payne, Inc. | | | 1,036 | 52,442 |
| Saipem SpA (B) | | | 29,746 | 148,443 |
| Subsea 7 SA | | | 59,675 | 721,560 |
| 9 | JOHN HANCOCK HEDGED EQUITY & INCOME FUND | SEMIANNUAL REPORT | SEE NOTES TO FINANCIAL STATEMENTS |
| | | | | Shares | Value |
| Energy (continued) | | | |
| Energy equipment and services (continued) | | | |
| The Drilling Company of 1972 A/S (B) | | | 390 | $30,301 |
| Trican Well Service, Ltd. (B) | | | 35,734 | 31,926 |
| Oil, gas and consumable fuels 8.5% | | | |
| Advantage Oil & Gas, Ltd. (B) | | | 38,655 | 48,114 |
| ARC Resources, Ltd. | | | 10,596 | 51,865 |
| BP PLC | | | 91,141 | 634,958 |
| Cameco Corp. | | | 7,891 | 84,601 |
| Chevron Corp. | | | 3,562 | 443,255 |
| CNOOC, Ltd., ADR | | | 3,709 | 631,828 |
| Coal India, Ltd. | | | 96,323 | 353,343 |
| Eni SpA | | | 28,923 | 480,912 |
| Exxon Mobil Corp. | | | 18,150 | 1,390,835 |
| Galp Energia SGPS SA | | | 50,885 | 782,574 |
| Gazprom PJSC, ADR | | | 35,181 | 257,525 |
| Inpex Corp. | | | 20,430 | 185,164 |
| Inter Pipeline, Ltd. | | | 9,199 | 143,090 |
| Japan Petroleum Exploration Company, Ltd. | | | 6,835 | 158,950 |
| Kinder Morgan, Inc. | | | 76,683 | 1,601,141 |
| LUKOIL PJSC, ADR | | | 8,023 | 674,092 |
| LUKOIL PJSC, ADR (London Stock Exchange) | | | 1,486 | 125,626 |
| ONEOK, Inc. | | | 5,447 | 374,808 |
| Painted Pony Energy, Ltd. (B) | | | 26,405 | 19,357 |
| Royal Dutch Shell PLC, A Shares | | | 9,281 | 302,909 |
| Royal Dutch Shell PLC, B Shares | | | 41,822 | 1,370,368 |
| Snam SpA | | | 124,040 | 617,077 |
| Surgutneftegas PJSC, ADR | | | 40,635 | 167,361 |
| Targa Resources Corp. | | | 6,957 | 273,132 |
| TC Energy Corp. | | | 26,595 | 1,318,428 |
| The Williams Companies, Inc. | | | 10,675 | 299,327 |
| TOTAL SA | | | 40,174 | 2,253,511 |
| Tourmaline Oil Corp. | | | 4,754 | 60,553 |
| Valero Energy Corp. | | | 1,857 | 158,978 |
| YPF SA, ADR | | | 7,221 | 131,494 |
| Financials 14.9% | | | 27,020,680 |
| Banks 7.3% | | | |
| Allahabad Bank (B) | | | 39,857 | 28,732 |
| Aozora Bank, Ltd. | | | 4,963 | 119,334 |
| Bank of Ireland Group PLC | | | 31,302 | 163,760 |
| Bank Polska Kasa Opieki SA | | | 2,444 | 73,237 |
| Bank Rakyat Indonesia Persero Tbk PT | | | 2,255,971 | 696,475 |
| BNP Paribas SA | | | 7,140 | 338,474 |
| BPER Banca | | | 37,499 | 152,851 |
| SEE NOTES TO FINANCIAL STATEMENTS | SEMIANNUAL REPORT | JOHN HANCOCK HEDGED EQUITY & INCOME FUND | 10 |
| | | | | Shares | Value |
| Financials (continued) | | | |
| Banks (continued) | | | |
| CaixaBank SA | | | 76,050 | $218,112 |
| Canara Bank (B) | | | 29,948 | 123,204 |
| China Construction Bank Corp., H Shares | | | 1,123,000 | 968,030 |
| Corp. Bank (B) | | | 38,638 | 14,246 |
| Dah Sing Financial Holdings, Ltd. | | | 9,700 | 45,324 |
| Danske Bank A/S | | | 1,778 | 28,169 |
| DGB Financial Group, Inc. | | | 11,620 | 82,069 |
| DNB ASA | | | 3,758 | 70,025 |
| Grupo Financiero Banorte SAB de CV, Series O | | | 108,622 | 630,892 |
| HSBC Holdings PLC | | | 74,165 | 619,000 |
| ING Groep NV | | | 101,689 | 1,177,939 |
| JPMorgan Chase & Co. | | | 7,116 | 795,569 |
| KB Financial Group, Inc. | | | 5,098 | 202,081 |
| Krung Thai Bank PCL, Foreign Quota Shares | | | 69,500 | 44,206 |
| Lloyds Banking Group PLC | | | 263,224 | 189,052 |
| Mitsubishi UFJ Financial Group, Inc. | | | 83,079 | 395,703 |
| Mizuho Financial Group, Inc. | | | 151,495 | 220,293 |
| National Australia Bank, Ltd. | | | 13,577 | 255,031 |
| Nordea Bank ABP | | | 118,044 | 857,140 |
| People's United Financial, Inc. | | | 12,407 | 208,189 |
| Raiffeisen Bank International AG | | | 2,282 | 53,583 |
| Resona Holdings, Inc. | | | 220,700 | 920,669 |
| Sberbank of Russia PJSC, ADR | | | 13,314 | 203,438 |
| Shinhan Financial Group Company, Ltd. | | | 4,863 | 189,142 |
| Skandinaviska Enskilda Banken AB, Series A | | | 15,609 | 144,522 |
| Societe Generale SA | | | 16,691 | 421,271 |
| Standard Chartered PLC | | | 31,800 | 288,485 |
| Sumitomo Mitsui Financial Group, Inc. | | | 9,950 | 352,684 |
| Sumitomo Mitsui Trust Holdings, Inc. | | | 5,620 | 204,184 |
| The Tochigi Bank, Ltd. | | | 24,670 | 39,661 |
| Unicaja Banco SA (C) | | | 113,190 | 101,059 |
| UniCredit SpA | | | 26,157 | 321,962 |
| United Overseas Bank, Ltd. | | | 39,300 | 759,753 |
| Wells Fargo & Company (A) | | | 4,991 | 236,174 |
| Westpac Banking Corp. | | | 10,020 | 199,701 |
| Capital markets 2.1% | | | |
| Banca Generali SpA | | | 26,505 | 763,199 |
| BlackRock, Inc. | | | 1,504 | 705,827 |
| CME Group, Inc. | | | 1,256 | 243,802 |
| GAM Holding AG (B) | | | 13,992 | 64,759 |
| Ichiyoshi Securities Company, Ltd. | | | 7,520 | 50,936 |
| IGM Financial, Inc. | | | 6,245 | 178,306 |
| Julius Baer Group, Ltd. (B) | | | 4,963 | 221,122 |
| 11 | JOHN HANCOCK HEDGED EQUITY & INCOME FUND | SEMIANNUAL REPORT | SEE NOTES TO FINANCIAL STATEMENTS |
| | | | | Shares | Value |
| Financials (continued) | | | |
| Capital markets (continued) | | | |
| Natixis SA | | | 70,272 | $282,956 |
| Nomura Holdings, Inc. | | | 51,900 | 183,735 |
| UBS Group AG (B) | | | 96,169 | 1,142,991 |
| Uranium Participation Corp. (B) | | | 19,158 | 61,444 |
| Diversified financial services 0.0% | | | |
| G-Resources Group, Ltd. (B) | | | 2,670,450 | 21,550 |
| Insurance 4.2% | | | |
| Admiral Group PLC | | | 3,138 | 87,993 |
| Ageas | | | 4,278 | 222,628 |
| American Financial Group, Inc. | | | 5,967 | 611,438 |
| Assicurazioni Generali SpA | | | 75,990 | 1,430,707 |
| Dai-ichi Life Holdings, Inc. | | | 12,915 | 195,401 |
| Direct Line Insurance Group PLC | | | 63,845 | 269,124 |
| Legal & General Group PLC | | | 58,827 | 201,542 |
| Orange Life Insurance, Ltd. (C) | | | 4,080 | 111,858 |
| Poste Italiane SpA (C) | | | 71,765 | 756,238 |
| Power Corp. of Canada | | | 28,801 | 620,424 |
| Powszechny Zaklad Ubezpieczen SA | | | 9,177 | 107,396 |
| Sampo OYJ, A Shares | | | 7,729 | 364,843 |
| Shin Kong Financial Holding Company, Ltd. | | | 285,563 | 86,787 |
| Sony Financial Holdings, Inc. | | | 3,250 | 78,212 |
| T&D Holdings, Inc. | | | 26,975 | 293,583 |
| Tongyang Life Insurance Company, Ltd. | | | 14,218 | 53,808 |
| Tryg A/S | | | 3,101 | 100,908 |
| Zurich Insurance Group AG | | | 5,962 | 2,074,474 |
| Mortgage real estate investment trusts 1.2% | | | |
| AGNC Investment Corp. | | | 65,585 | 1,103,140 |
| Annaly Capital Management, Inc. | | | 109,168 | 996,704 |
| Thrifts and mortgage finance 0.1% | | | |
| New York Community Bancorp, Inc. | | | 17,978 | 179,420 |
| Health care 7.5% | | | 13,566,625 |
| Biotechnology 0.4% | | | |
| AbbVie, Inc. | | | 2,955 | 214,888 |
| Amgen, Inc. | | | 1,659 | 305,721 |
| Gilead Sciences, Inc. | | | 2,704 | 182,682 |
| Health care equipment and supplies 0.7% | | | |
| Abbott Laboratories | | | 580 | 48,778 |
| Alcon, Inc. (B) | | | 415 | 25,626 |
| Hoya Corp. | | | 466 | 35,814 |
| Koninklijke Philips NV | | | 20,051 | 871,736 |
| Medtronic PLC | | | 2,329 | 226,821 |
| SEE NOTES TO FINANCIAL STATEMENTS | SEMIANNUAL REPORT | JOHN HANCOCK HEDGED EQUITY & INCOME FUND | 12 |
| | | | | Shares | Value |
| Health care (continued) | | | |
| Health care equipment and supplies (continued) | | | |
| ResMed, Inc. | | | 113 | $13,789 |
| Health care providers and services 0.1% | | | |
| Cardinal Health, Inc. | | | 2,141 | 100,841 |
| Health care technology 0.0% | | | |
| AGFA-Gevaert NV (B) | | | 24,031 | 93,354 |
| Life sciences tools and services 0.0% | | | |
| CMIC Holdings Company, Ltd. | | | 1,390 | 26,425 |
| Pharmaceuticals 6.3% | | | |
| AstraZeneca PLC | | | 22,753 | 1,860,095 |
| Bristol-Myers Squibb Company (A) | | | 3,539 | 160,494 |
| Eisai Company, Ltd. | | | 1,360 | 77,080 |
| Eli Lilly & Company | | | 1,104 | 122,312 |
| H Lundbeck A/S | | | 590 | 23,369 |
| Johnson & Johnson | | | 4,124 | 574,391 |
| Kyowa Hakko Kirin Company, Ltd. | | | 3,000 | 54,131 |
| Merck & Company, Inc. | | | 4,325 | 362,651 |
| Novartis AG | | | 31,949 | 2,916,680 |
| Pfizer, Inc. | | | 43,921 | 1,902,658 |
| Roche Holding AG | | | 10,458 | 2,940,660 |
| Takeda Pharmaceutical Company, Ltd. | | | 11,965 | 425,629 |
| Industrials 7.0% | | | 12,780,006 |
| Aerospace and defense 0.8% | | | |
| BAE Systems PLC | | | 156,648 | 984,514 |
| L3Harris Technologies, Inc. | | | 140 | 26,478 |
| Lockheed Martin Corp. | | | 509 | 185,042 |
| The Boeing Company | | | 219 | 79,718 |
| United Technologies Corp. | | | 1,535 | 199,857 |
| Air freight and logistics 0.2% | | | |
| bpost SA | | | 9,884 | 93,792 |
| CTT-Correios de Portugal SA | | | 21,841 | 52,553 |
| PostNL NV | | | 51,418 | 89,109 |
| United Parcel Service, Inc., Class B | | | 1,137 | 117,418 |
| Airlines 0.1% | | | |
| Air France-KLM (B) | | | 3,777 | 36,290 |
| ANA Holdings, Inc. | | | 1,300 | 43,090 |
| SAS AB (B) | | | 63,668 | 84,961 |
| Building products 0.2% | | | |
| Cie de Saint-Gobain | | | 9,526 | 371,988 |
| Commercial services and supplies 0.2% | | | |
| Babcock International Group PLC | | | 24,453 | 142,346 |
| Relia, Inc. | | | 6,200 | 72,845 |
| 13 | JOHN HANCOCK HEDGED EQUITY & INCOME FUND | SEMIANNUAL REPORT | SEE NOTES TO FINANCIAL STATEMENTS |
| | | | | Shares | Value |
| Industrials (continued) | | | |
| Commercial services and supplies (continued) | | | |
| Serco Group PLC (B) | | | 50,813 | $92,860 |
| Toppan Forms Company, Ltd. | | | 10,540 | 83,047 |
| Construction and engineering 0.5% | | | |
| ACS Actividades de Construccion y Servicios SA | | | 15,218 | 608,857 |
| China Machinery Engineering Corp., H Shares | | | 169,870 | 76,506 |
| Chiyoda Corp. (B) | | | 11,435 | 30,751 |
| Implenia AG | | | 2,620 | 77,650 |
| JGC Corp. | | | 10,525 | 143,992 |
| Raubex Group, Ltd. | | | 36,950 | 50,817 |
| Toyo Engineering Corp. (B) | | | 8,300 | 39,232 |
| Electrical equipment 0.9% | | | |
| ABB, Ltd. | | | 63,636 | 1,275,785 |
| Cosel Company, Ltd. | | | 2,600 | 27,800 |
| Emerson Electric Company | | | 1,919 | 128,036 |
| Ushio, Inc. | | | 10,625 | 137,289 |
| Zumtobel Group AG (B) | | | 8,488 | 66,541 |
| Industrial conglomerates 0.1% | | | |
| 3M Company | | | 1,060 | 183,740 |
| Machinery 1.5% | | | |
| Caterpillar, Inc. | | | 616 | 83,955 |
| Hisaka Works, Ltd. | | | 5,780 | 46,750 |
| Illinois Tool Works, Inc. | | | 4,228 | 637,625 |
| Kone OYJ, B Shares | | | 24,672 | 1,456,964 |
| Mitsubishi Heavy Industries, Ltd. | | | 4,645 | 202,578 |
| The Japan Steel Works, Ltd. | | | 6,420 | 107,675 |
| THK Company, Ltd. | | | 2,900 | 69,755 |
| Toshiba Machine Company, Ltd. | | | 3,633 | 83,709 |
| Marine 0.3% | | | |
| A.P. Moller - Maersk A/S, Series B | | | 195 | 242,642 |
| D/S Norden A/S | | | 7,893 | 113,753 |
| Kuehne + Nagel International AG | | | 203 | 30,153 |
| Pacific Basin Shipping, Ltd. | | | 533,330 | 97,713 |
| Professional services 0.2% | | | |
| Adecco Group AG | | | 5,038 | 302,770 |
| Hays PLC | | | 45,847 | 91,597 |
| SThree PLC | | | 13,408 | 48,576 |
| Road and rail 0.1% | | | |
| Firstgroup PLC (B) | | | 55,299 | 68,682 |
| The Go-Ahead Group PLC | | | 2,809 | 70,480 |
| Trading companies and distributors 0.7% | | | |
| ITOCHU Corp. | | | 54,200 | 1,038,311 |
| SEE NOTES TO FINANCIAL STATEMENTS | SEMIANNUAL REPORT | JOHN HANCOCK HEDGED EQUITY & INCOME FUND | 14 |
| | | | | Shares | Value |
| Industrials (continued) | | | |
| Trading companies and distributors (continued) | | | |
| Rexel SA | | | 15,836 | $200,996 |
| SIG PLC | | | 38,599 | 63,539 |
| Transportation infrastructure 1.2% | | | |
| Atlantia SpA | | | 4,684 | 122,142 |
| Hamburger Hafen und Logistik AG | | | 2,916 | 77,160 |
| Sydney Airport | | | 218,814 | 1,236,186 |
| Transurban Group | | | 66,000 | 683,391 |
| Information technology 8.3% | | | 14,980,892 |
| Communications equipment 0.7% | | | |
| Cisco Systems, Inc. | | | 5,246 | 287,114 |
| Nokia OYJ | | | 194,782 | 970,169 |
| Electronic equipment, instruments and components 0.4% | | | |
| Citizen Watch Company, Ltd. | | | 29,625 | 152,439 |
| Enplas Corp. | | | 2,160 | 64,347 |
| Foxconn Technology Company, Ltd. | | | 58,320 | 118,587 |
| Hosiden Corp. | | | 3,010 | 33,513 |
| Ibiden Company, Ltd. | | | 6,060 | 106,474 |
| Innolux Corp. | | | 449,860 | 106,368 |
| Nichicon Corp. | | | 15,540 | 126,910 |
| Yokogawa Electric Corp. | | | 2,300 | 45,270 |
| IT services 0.9% | | | |
| Accenture PLC, Class A | | | 853 | 157,609 |
| Automatic Data Processing, Inc. | | | 808 | 133,587 |
| Fujitsu, Ltd. | | | 2,931 | 204,837 |
| IBM Corp. | | | 2,629 | 362,539 |
| Paychex, Inc. | | | 5,614 | 461,976 |
| Sopra Steria Group | | | 241 | 28,082 |
| The Western Union Company | | | 11,382 | 226,388 |
| TravelSky Technology, Ltd., H Shares | | | 18,000 | 36,201 |
| Semiconductors and semiconductor equipment 3.5% | | | |
| Broadcom, Inc. | | | 2,787 | 802,266 |
| Disco Corp. | | | 229 | 37,789 |
| Intel Corp. (A) | | | 30,669 | 1,468,125 |
| KLA-Tencor Corp. | | | 1,175 | 138,885 |
| Maxim Integrated Products, Inc. | | | 4,379 | 261,952 |
| MediaTek, Inc. | | | 10,640 | 107,770 |
| Microchip Technology, Inc. | | | 447 | 38,755 |
| Miraial Company, Ltd. | | | 2,800 | 32,707 |
| QUALCOMM, Inc. (A) | | | 26,666 | 2,028,483 |
| Taiwan Semiconductor Manufacturing Company, Ltd. | | | 104,000 | 795,431 |
| Texas Instruments, Inc. | | | 2,676 | 307,098 |
| 15 | JOHN HANCOCK HEDGED EQUITY & INCOME FUND | SEMIANNUAL REPORT | SEE NOTES TO FINANCIAL STATEMENTS |
| | | | | Shares | Value |
| Information technology (continued) | | | |
| Semiconductors and semiconductor equipment (continued) | | | |
| Tokyo Electron, Ltd. | | | 1,300 | $182,722 |
| Tokyo Seimitsu Company, Ltd. | | | 3,685 | 94,852 |
| Software 0.4% | | | |
| Microsoft Corp. | | | 4,241 | 568,124 |
| Trend Micro, Inc. | | | 2,500 | 111,710 |
| Technology hardware, storage and peripherals 2.4% | | | |
| Acer, Inc. | | | 196,770 | 122,301 |
| Apple, Inc. | | | 3,662 | 724,783 |
| Canon, Inc. | | | 17,250 | 505,133 |
| Compal Electronics, Inc. | | | 297,585 | 195,199 |
| HP, Inc. | | | 2,159 | 44,886 |
| Maxell Holdings, Ltd. | | | 5,930 | 81,335 |
| Melco Holdings, Inc. | | | 936 | 25,722 |
| Neopost SA | | | 5,121 | 109,560 |
| Samsung Electronics Company, Ltd. | | | 2,399 | 97,688 |
| Seagate Technology PLC | | | 18,910 | 891,039 |
| Western Digital Corp. | | | 18,635 | 886,094 |
| Xerox Corp. | | | 19,714 | 698,073 |
| Materials 4.4% | | | 7,945,464 |
| Chemicals 0.8% | | | |
| China BlueChemical, Ltd., H Shares | | | 312,420 | 85,225 |
| Dow, Inc. | | | 13,913 | 686,050 |
| EMS-Chemie Holding AG | | | 101 | 65,564 |
| JSR Corp. | | | 12,780 | 202,440 |
| Linde PLC | | | 473 | 94,978 |
| LyondellBasell Industries NV, Class A | | | 2,840 | 244,609 |
| Nitto Denko Corp. | | | 1,500 | 74,245 |
| Construction materials 0.3% | | | |
| Imerys SA | | | 2,323 | 123,107 |
| LafargeHolcim, Ltd. (B) | | | 5,466 | 267,268 |
| Vicat SA | | | 2,162 | 107,571 |
| Containers and packaging 0.1% | | | |
| AMVIG Holdings, Ltd. | | | 141,690 | 33,577 |
| International Paper Company (A) | | | 2,025 | 87,723 |
| Nampak, Ltd. (B) | | | 121,935 | 88,936 |
| Metals and mining 3.2% | | | |
| Acacia Mining PLC (B) | | | 29,759 | 67,278 |
| Alumina, Ltd. | | | 95,193 | 156,254 |
| Anglo American Platinum, Ltd. | | | 1,878 | 111,741 |
| Anglo American PLC | | | 10,913 | 311,767 |
| Antofagasta PLC | | | 76,130 | 899,257 |
| SEE NOTES TO FINANCIAL STATEMENTS | SEMIANNUAL REPORT | JOHN HANCOCK HEDGED EQUITY & INCOME FUND | 16 |
| | | | | Shares | Value |
| Materials (continued) | | | |
| Metals and mining (continued) | | | |
| Barrick Gold Corp. | | | 13,560 | $214,032 |
| Centerra Gold, Inc. (B) | | | 24,109 | 169,742 |
| Chubu Steel Plate Company, Ltd. | | | 5,410 | 32,426 |
| CST Group, Ltd. (B) | | | 1,440,000 | 2,946 |
| Eldorado Gold Corp. (B) | | | 9,702 | 56,466 |
| Eregli Demir ve Celik Fabrikalari TAS | | | 120,669 | 163,893 |
| Gold Fields, Ltd. | | | 34,186 | 185,811 |
| Harmony Gold Mining Company, Ltd., ADR (B) | | | 36,047 | 81,827 |
| Hitachi Metals, Ltd. | | | 17,020 | 193,001 |
| IAMGOLD Corp. (B) | | | 10,528 | 35,585 |
| Impala Platinum Holdings, Ltd. (B) | | | 26,667 | 132,151 |
| Kinross Gold Corp. (B) | | | 25,212 | 97,823 |
| Kyoei Steel, Ltd. | | | 7,310 | 129,462 |
| Magnitogorsk Iron & Steel Works PJSC, GDR | | | 26,688 | 246,161 |
| MMC Norilsk Nickel PJSC, ADR | | | 18,715 | 421,462 |
| Nakayama Steel Works, Ltd. | | | 11,290 | 48,918 |
| Neturen Company, Ltd. | | | 4,190 | 33,647 |
| Norsk Hydro ASA | | | 47,693 | 170,824 |
| Northern Dynasty Minerals, Ltd. (B) | | | 10,296 | 6,211 |
| Pacific Metals Company, Ltd. | | | 2,880 | 59,775 |
| Petra Diamonds, Ltd. (B) | | | 115,672 | 28,870 |
| Resolute Mining, Ltd. | | | 61,804 | 58,159 |
| Rio Tinto PLC | | | 11,132 | 688,993 |
| Salzgitter AG | | | 5,219 | 149,556 |
| SEMAFO, Inc. (B) | | | 18,017 | 70,992 |
| Severstal PJSC, GDR | | | 22,994 | 387,897 |
| Tokyo Steel Manufacturing Company, Ltd. | | | 16,610 | 125,767 |
| Western Areas, Ltd. | | | 59,716 | 82,667 |
| Yamato Kogyo Company, Ltd. | | | 5,565 | 162,810 |
| Real estate 3.6% | | | 6,553,671 |
| Equity real estate investment trusts 3.1% | | | |
| Crown Castle International Corp. | | | 1,314 | 171,280 |
| Fibra Uno Administracion SA de CV | | | 100,593 | 133,434 |
| Fortress REIT, Ltd., Class B | | | 119,802 | 102,718 |
| Gaming and Leisure Properties, Inc. | | | 25,055 | 976,644 |
| Growthpoint Properties, Ltd. | | | 94,610 | 163,394 |
| HCP, Inc. | | | 5,044 | 161,307 |
| Host Hotels & Resorts, Inc. | | | 8,050 | 146,671 |
| Iron Mountain, Inc. | | | 8,683 | 271,778 |
| Kimco Realty Corp. | | | 8,899 | 164,454 |
| Land Securities Group PLC | | | 9,681 | 102,548 |
| Nippon Building Fund, Inc. | | | 95 | 650,710 |
| 17 | JOHN HANCOCK HEDGED EQUITY & INCOME FUND | SEMIANNUAL REPORT | SEE NOTES TO FINANCIAL STATEMENTS |
| | | | | Shares | Value |
| Real estate (continued) | | | |
| Equity real estate investment trusts (continued) | | | |
| Park Hotels & Resorts, Inc. (A) | | | 36,687 | $1,011,094 |
| Redefine Properties, Ltd. | | | 358,084 | 230,111 |
| Resilient REIT, Ltd. | | | 7,707 | 33,973 |
| The British Land Company PLC | | | 14,321 | 98,013 |
| The Macerich Company | | | 2,733 | 91,528 |
| Ventas, Inc. | | | 1,980 | 135,333 |
| VEREIT, Inc. | | | 45,426 | 409,288 |
| Welltower, Inc. | | | 1,987 | 162,000 |
| WP Carey, Inc. | | | 4,640 | 376,675 |
| Real estate management and development 0.5% | | | |
| Mitsubishi Estate Company, Ltd. | | | 9,500 | 177,056 |
| Nexity SA | | | 18,135 | 783,662 |
| Utilities 5.9% | | | 10,747,394 |
| Electric utilities 2.7% | | | |
| Edison International (A) | | | 14,831 | 999,758 |
| EDP - Energias de Portugal SA | | | 337,341 | 1,282,044 |
| Endesa SA | | | 8,804 | 226,444 |
| Enel SpA | | | 112,809 | 786,927 |
| Iberdrola SA | | | 67,156 | 668,617 |
| PPL Corp. | | | 7,042 | 218,372 |
| SSE PLC | | | 6,488 | 92,476 |
| The Chugoku Electric Power Company, Inc. | | | 18,747 | 236,414 |
| The Southern Company | | | 6,551 | 362,139 |
| Gas utilities 0.8% | | | |
| AltaGas, Ltd. | | | 6,672 | 100,930 |
| APA Group | | | 88,625 | 672,071 |
| Naturgy Energy Group SA | | | 22,652 | 624,262 |
| Independent power and renewable electricity producers 0.6% | | | |
| China Longyuan Power Group Corp., Ltd., H Shares | | | 1,334,000 | 857,170 |
| Meridian Energy, Ltd. | | | 87,507 | 279,603 |
| NTPC, Ltd. | | | 11,366 | 23,226 |
| Multi-utilities 1.5% | | | |
| CenterPoint Energy, Inc. | | | 8,148 | 233,277 |
| Centrica PLC | | | 151,888 | 169,319 |
| Dominion Energy, Inc. (A) | | | 23,099 | 1,786,015 |
| E.ON SE | | | 10,941 | 118,711 |
| Engie SA | | | 14,135 | 214,336 |
| RWE AG | | | 6,104 | 150,620 |
| Water utilities 0.3% | | | |
|
| United Utilities Group PLC | | | 64,765 | 644,663 |
| SEE NOTES TO FINANCIAL STATEMENTS | SEMIANNUAL REPORT | JOHN HANCOCK HEDGED EQUITY & INCOME FUND | 18 |
| | | | | Shares | Value |
|
| Preferred securities 0.5% | | | | | $956,646 |
| (Cost $906,618) | | | | | |
| Communication services 0.0% | | | | | 45,491 |
| Diversified telecommunication services 0.0% | | | |
| Telefonica Brasil SA | | 3,500 | 45,491 |
| Consumer discretionary 0.4% | | | | | 722,261 |
| Automobiles 0.4% | | | |
| Volkswagen AG | | 4,288 | 722,261 |
| Information technology 0.0% | | | | | 90,174 |
| Technology hardware, storage and peripherals 0.0% | | | |
| Samsung Electronics Company, Ltd. | | 2,719 | 90,174 |
| Utilities 0.1% | | | | | 98,720 |
| Electric utilities 0.1% | | | |
|
| Cia Paranaense de Energia, B Shares | | 7,800 | 98,720 |
| Exchange-traded funds 0.0% | | | | | $58,330 |
| (Cost $58,210) | | | | | |
| iShares Core MSCI EAFE ETF | | | | 950 | 58,330 |
|
| | Rate (%) | Maturity date | | Par value^ | Value |
| Foreign government obligations 0.1% | | | | $107,790 |
| (Cost $142,065) | | | | | |
| Argentina 0.1% | | | | | 107,790 |
Provincia de Buenos Aires
| 5.375 | 01-20-23 | EUR | 125,000 | 107,790 |
|
| Corporate bonds 14.2% | | | $25,620,410 |
| (Cost $25,444,564) | | | | | |
| Communication services 2.6% | | | 4,721,710 |
| Diversified telecommunication services 0.6% | | | |
| CenturyLink, Inc. | 5.625 | 04-01-25 | | 140,000 | 142,800 |
| CenturyLink, Inc. | 7.500 | 04-01-24 | | 30,000 | 33,188 |
| Embarq Corp. | 7.995 | 06-01-36 | | 100,000 | 96,782 |
| Frontier Communications Corp. | 6.875 | 01-15-25 | | 40,000 | 22,400 |
| Frontier Communications Corp. (C) | 8.500 | 04-01-26 | | 105,000 | 101,850 |
| Intelsat Jackson Holdings SA (C) | 8.500 | 10-15-24 | | 110,000 | 108,900 |
| Telecom Argentina SA (C) | 6.500 | 06-15-21 | | 151,000 | 149,339 |
| Telecom Italia Capital SA | 7.200 | 07-18-36 | | 90,000 | 99,225 |
| Telecom Italia SpA (C) | 5.303 | 05-30-24 | | 200,000 | 207,000 |
| Ziggo BV (C) | 5.500 | 01-15-27 | | 170,000 | 172,926 |
| Media 1.7% | | | |
| Altice Financing SA (C) | 7.500 | 05-15-26 | | 210,000 | 211,071 |
| Altice France SA | 5.875 | 02-01-27 | EUR | 165,000 | 203,100 |
| Altice Luxembourg SA (C) | 7.625 | 02-15-25 | | 200,000 | 188,125 |
| 19 | JOHN HANCOCK HEDGED EQUITY & INCOME FUND | SEMIANNUAL REPORT | SEE NOTES TO FINANCIAL STATEMENTS |
| | Rate (%) | Maturity date | | Par value^ | Value |
| Communication services (continued) | | | |
| Media (continued) | | | |
| Altice Luxembourg SA | 8.000 | 05-15-27 | EUR | 100,000 | $115,679 |
| CCO Holdings LLC (C) | 5.750 | 02-15-26 | | 180,000 | 188,775 |
| Cequel Communications Holdings I LLC (C) | 5.125 | 12-15-21 | | 155,000 | 155,000 |
| CSC Holdings LLC (C) | 6.500 | 02-01-29 | | 390,000 | 425,588 |
| DISH DBS Corp. | 5.875 | 11-15-24 | | 30,000 | 28,388 |
| DISH DBS Corp. | 7.875 | 09-01-19 | | 255,000 | 255,956 |
| Gray Television, Inc. (C) | 5.125 | 10-15-24 | | 130,000 | 132,438 |
| Gray Television, Inc. (C) | 5.875 | 07-15-26 | | 50,000 | 51,875 |
| Lamar Media Corp. | 5.750 | 02-01-26 | | 85,000 | 89,356 |
| Nexstar Escrow, Inc. (C) | 5.625 | 07-15-27 | | 80,000 | 82,000 |
| Sinclair Television Group, Inc. (C) | 5.625 | 08-01-24 | | 100,000 | 102,250 |
| Sinclair Television Group, Inc. (C) | 5.875 | 03-15-26 | | 75,000 | 76,665 |
| Sirius XM Radio, Inc. (C) | 4.625 | 07-15-24 | | 50,000 | 51,164 |
| Sirius XM Radio, Inc. (C) | 5.500 | 07-01-29 | | 100,000 | 102,520 |
| TEGNA, Inc. | 5.125 | 10-15-19 | | 157,000 | 157,196 |
| Tribune Media Company | 5.875 | 07-15-22 | | 150,000 | 152,610 |
| WMG Acquisition Corp. | 3.625 | 10-15-26 | EUR | 100,000 | 119,964 |
| WMG Acquisition Corp. (C) | 5.500 | 04-15-26 | | 85,000 | 87,754 |
| Wireless telecommunication services 0.3% | | | |
| Sprint Capital Corp. | 8.750 | 03-15-32 | | 30,000 | 34,725 |
| Sprint Corp. | 7.125 | 06-15-24 | | 50,000 | 53,015 |
| Sprint Corp. | 7.250 | 09-15-21 | | 215,000 | 228,438 |
| Sprint Corp. | 7.875 | 09-15-23 | | 100,000 | 108,750 |
| Turkcell Iletisim Hizmetleri AS | 5.800 | 04-11-28 | | 200,000 | 184,898 |
| Consumer discretionary 1.9% | | | 3,385,022 |
| Auto components 0.2% | | | |
| Adient Global Holdings, Ltd. | 3.500 | 08-15-24 | EUR | 100,000 | 94,263 |
| Adient US LLC (C) | 7.000 | 05-15-26 | | 20,000 | 20,550 |
| Avis Budget Car Rental LLC | 5.500 | 04-01-23 | | 110,000 | 112,338 |
| Panther BF Aggregator 2 LP (C) | 8.500 | 05-15-27 | | 40,000 | 41,200 |
| Distributors 0.1% | | | |
| LKQ European Holdings BV | 3.625 | 04-01-26 | EUR | 100,000 | 119,931 |
| Diversified consumer services 0.0% | | | |
| Service Corp. International | 4.625 | 12-15-27 | | 35,000 | 35,744 |
| Service Corp. International | 5.125 | 06-01-29 | | 25,000 | 26,313 |
| Hotels, restaurants and leisure 1.1% | | | |
| Boyd Gaming Corp. | 6.000 | 08-15-26 | | 90,000 | 94,613 |
| Boyd Gaming Corp. | 6.375 | 04-01-26 | | 85,000 | 89,920 |
| Caesars Resort Collection LLC (C) | 5.250 | 10-15-25 | | 120,000 | 120,000 |
| Cirsa Finance International Sarl | 6.250 | 12-20-23 | EUR | 115,000 | 142,055 |
| Codere Finance 2 Luxembourg SA | 6.750 | 11-01-21 | EUR | 150,000 | 169,680 |
| SEE NOTES TO FINANCIAL STATEMENTS | SEMIANNUAL REPORT | JOHN HANCOCK HEDGED EQUITY & INCOME FUND | 20 |
| | Rate (%) | Maturity date | | Par value^ | Value |
| Consumer discretionary (continued) | | | |
| Hotels, restaurants and leisure (continued) | | | |
| Eldorado Resorts, Inc. | 6.000 | 04-01-25 | | 130,000 | $136,663 |
| Eldorado Resorts, Inc. | 6.000 | 09-15-26 | | 35,000 | 38,238 |
| Golden Entertainment, Inc. (C) | 7.625 | 04-15-26 | | 70,000 | 71,575 |
| Hilton Domestic Operating Company, Inc. | 4.250 | 09-01-24 | | 152,000 | 154,280 |
| Jacobs Entertainment, Inc. (C) | 7.875 | 02-01-24 | | 165,000 | 176,138 |
| KFC Holding Company/Pizza Hut Holdings LLC/Taco Bell of America LLC (C) | 4.750 | 06-01-27 | | 35,000 | 35,875 |
| KFC Holding Company/Pizza Hut Holdings LLC/Taco Bell of America LLC (C) | 5.250 | 06-01-26 | | 43,000 | 45,096 |
| MGM Resorts International | 5.500 | 04-15-27 | | 50,000 | 52,438 |
| New Red Finance, Inc. (C) | 5.000 | 10-15-25 | | 320,000 | 322,496 |
| Penn National Gaming, Inc. (C) | 5.625 | 01-15-27 | | 186,000 | 183,675 |
| Sugarhouse HSP Gaming Prop Mezz LP (C) | 5.875 | 05-15-25 | | 110,000 | 108,350 |
| Wynn Las Vegas LLC (C) | 5.500 | 03-01-25 | | 120,000 | 123,936 |
| Household durables 0.2% | | | |
| KB Home | 7.000 | 12-15-21 | | 140,000 | 150,255 |
| M/I Homes, Inc. | 5.625 | 08-01-25 | | 40,000 | 40,600 |
| M/I Homes, Inc. | 6.750 | 01-15-21 | | 165,000 | 167,681 |
| Internet and direct marketing retail 0.0% | | | |
| Liberty Interactive LLC | 8.250 | 02-01-30 | | 40,000 | 39,900 |
| Leisure products 0.2% | | | |
| Jack Ohio Finance LLC (C) | 6.750 | 11-15-21 | | 155,000 | 159,216 |
| Mattel, Inc. (C) | 6.750 | 12-31-25 | | 140,000 | 144,025 |
| Specialty retail 0.1% | | | |
| L Brands, Inc. | 5.250 | 02-01-28 | | 85,000 | 77,881 |
| L Brands, Inc. | 6.750 | 07-01-36 | | 15,000 | 12,900 |
| L Brands, Inc. | 6.875 | 11-01-35 | | 5,000 | 4,447 |
| PetSmart, Inc. (C) | 5.875 | 06-01-25 | | 75,000 | 72,750 |
| Consumer staples 0.6% | | | 1,120,075 |
| Food products 0.4% | | | |
| MARB BondCo PLC (C) | 7.000 | 03-15-24 | | 200,000 | 208,642 |
| Post Holdings, Inc. (C) | 5.000 | 08-15-26 | | 190,000 | 192,613 |
| Post Holdings, Inc. (C) | 5.625 | 01-15-28 | | 70,000 | 71,925 |
| Post Holdings, Inc. (C) | 5.750 | 03-01-27 | | 100,000 | 103,250 |
| TreeHouse Foods, Inc. | 4.875 | 03-15-22 | | 190,000 | 191,188 |
| Household products 0.1% | | | |
| Diamond BC BV | 5.625 | 08-15-25 | EUR | 200,000 | 188,057 |
| 21 | JOHN HANCOCK HEDGED EQUITY & INCOME FUND | SEMIANNUAL REPORT | SEE NOTES TO FINANCIAL STATEMENTS |
| | Rate (%) | Maturity date | | Par value^ | Value |
| Consumer staples (continued) | | | |
| Personal products 0.1% | | | |
| Revlon Consumer Products Corp. | 6.250 | 08-01-24 | | 240,000 | $164,400 |
| Energy 2.0% | | | 3,628,974 |
| Oil, gas and consumable fuels 2.0% | | | |
| Blue Racer Midstream LLC (C) | 6.125 | 11-15-22 | | 170,000 | 172,338 |
| California Resources Corp. (C) | 8.000 | 12-15-22 | | 15,000 | 11,306 |
| Centennial Resource Production LLC (C) | 5.375 | 01-15-26 | | 65,000 | 61,750 |
| Cheniere Corpus Christi Holdings LLC | 5.125 | 06-30-27 | | 85,000 | 92,331 |
| Cheniere Corpus Christi Holdings LLC | 5.875 | 03-31-25 | | 65,000 | 72,394 |
| Chesapeake Energy Corp. | 7.000 | 10-01-24 | | 195,000 | 175,013 |
| Chesapeake Energy Corp. | 7.500 | 10-01-26 | | 80,000 | 71,200 |
| Chesapeake Energy Corp. | 8.000 | 06-15-27 | | 40,000 | 34,975 |
| Cloud Peak Energy Resources LLC (F) | 12.000 | 11-01-21 | | 145,000 | 18,850 |
| DCP Midstream Operating LP | 5.375 | 07-15-25 | | 120,000 | 126,450 |
| Energen Corp. | 4.625 | 09-01-21 | | 105,000 | 106,050 |
| Energy Transfer Operating LP | 4.250 | 03-15-23 | | 110,000 | 114,791 |
| EP Energy LLC (C) | 7.750 | 05-15-26 | | 10,000 | 8,925 |
| Foresight Energy LLC (C) | 11.500 | 04-01-23 | | 170,000 | 95,200 |
| Jagged Peak Energy LLC | 5.875 | 05-01-26 | | 85,000 | 83,725 |
| Laredo Petroleum, Inc. | 5.625 | 01-15-22 | | 55,000 | 51,013 |
| Laredo Petroleum, Inc. | 6.250 | 03-15-23 | | 65,000 | 60,470 |
| Matador Resources Company | 5.875 | 09-15-26 | | 105,000 | 106,050 |
| MEG Energy Corp. (C) | 6.500 | 01-15-25 | | 80,000 | 80,400 |
| MEG Energy Corp. (C) | 7.000 | 03-31-24 | | 95,000 | 90,250 |
| Petrobras Global Finance BV | 5.750 | 02-01-29 | | 430,000 | 448,232 |
| Petrobras Global Finance BV | 7.375 | 01-17-27 | | 60,000 | 68,910 |
| QEP Resources, Inc. | 5.250 | 05-01-23 | | 105,000 | 101,063 |
| QEP Resources, Inc. | 5.375 | 10-01-22 | | 15,000 | 14,588 |
| QEP Resources, Inc. | 5.625 | 03-01-26 | | 87,000 | 81,780 |
| QEP Resources, Inc. | 6.800 | 03-01-20 | | 25,000 | 25,156 |
| SM Energy Company | 5.000 | 01-15-24 | | 100,000 | 91,750 |
| SM Energy Company | 5.625 | 06-01-25 | | 50,000 | 45,500 |
| SM Energy Company | 6.125 | 11-15-22 | | 5,000 | 4,963 |
| SM Energy Company | 6.625 | 01-15-27 | | 85,000 | 78,625 |
| State Oil Company of the Azerbaijan Republic | 4.750 | 03-13-23 | | 200,000 | 207,976 |
| Sunoco LP | 5.500 | 02-15-26 | | 35,000 | 36,444 |
| Sunoco LP | 5.875 | 03-15-28 | | 20,000 | 20,725 |
| Sunoco LP (C) | 6.000 | 04-15-27 | | 50,000 | 52,500 |
| Tallgrass Energy Partners LP (C) | 4.750 | 10-01-23 | | 155,000 | 157,134 |
| Targa Resources Partners LP (C) | 6.500 | 07-15-27 | | 215,000 | 234,350 |
| Vine Oil & Gas LP (C) | 8.750 | 04-15-23 | | 150,000 | 97,500 |
| WPX Energy, Inc. | 5.250 | 09-15-24 | | 125,000 | 127,813 |
| SEE NOTES TO FINANCIAL STATEMENTS | SEMIANNUAL REPORT | JOHN HANCOCK HEDGED EQUITY & INCOME FUND | 22 |
| | Rate (%) | Maturity date | | Par value^ | Value |
| Energy (continued) | | | |
| Oil, gas and consumable fuels (continued) | | | |
| WPX Energy, Inc. | 5.750 | 06-01-26 | | 30,000 | $31,050 |
| WPX Energy, Inc. | 6.000 | 01-15-22 | | 23,000 | 23,834 |
| WPX Energy, Inc. | 8.250 | 08-01-23 | | 40,000 | 45,600 |
| Financials 1.6% | | | 2,853,962 |
| Banks 0.6% | | | |
| Banco de Sabadell SA (6.500% to 5-18-22, then 5 Year Euro Swap Rate + 6.414%) (G) | 6.500 | 05-18-22 | EUR | 200,000 | 226,588 |
| Credit Agricole SA (8.125% to 12-23-25, then 5 Year U.S. Swap Rate + 6.185%) (C)(G) | 8.125 | 12-23-25 | | 250,000 | 288,928 |
| Freedom Mortgage Corp. (C) | 8.125 | 11-15-24 | | 160,000 | 136,000 |
| Intesa Sanpaolo SpA (8.375% to 10-14-19, then 3 month EURIBOR + 6.871%) (G) | 8.375 | 10-14-19 | EUR | 50,000 | 58,063 |
| Turkiye Is Bankasi AS | 6.125 | 04-25-24 | | 200,000 | 182,928 |
| UniCredit SpA (5.861% to 6-19-27, then 5 Year U.S. ISDAFIX + 3.703%) (C) | 5.861 | 06-19-32 | | 200,000 | 190,880 |
| Capital markets 0.1% | | | |
| Credit Suisse Group AG (6.250% to 12-18-24, then 5 Year U.S. Swap Rate + 3.455%) (G) | 6.250 | 12-18-24 | | 200,000 | 208,250 |
| Consumer finance 0.7% | | | |
| ACE Cash Express, Inc. (C) | 12.000 | 12-15-22 | | 36,000 | 32,040 |
| Ally Financial, Inc. | 3.875 | 05-21-24 | | 90,000 | 92,250 |
| Credit Acceptance Corp. (C) | 6.625 | 03-15-26 | | 70,000 | 73,588 |
| DAE Funding LLC (C) | 4.500 | 08-01-22 | | 35,000 | 35,525 |
| DAE Funding LLC (C) | 5.000 | 08-01-24 | | 140,000 | 145,775 |
| goeasy, Ltd. (C) | 7.875 | 11-01-22 | | 135,000 | 141,413 |
| Herc Rentals, Inc. (C) | 7.500 | 06-01-22 | | 63,000 | 65,426 |
| Navient Corp. | 5.500 | 01-25-23 | | 101,000 | 103,778 |
| Navient Corp. | 5.625 | 08-01-33 | | 20,000 | 16,650 |
| Navient Corp. | 6.500 | 06-15-22 | | 80,000 | 84,979 |
| Navient Corp. | 7.250 | 09-25-23 | | 49,000 | 52,308 |
| Springleaf Finance Corp. | 6.125 | 05-15-22 | | 120,000 | 128,700 |
| Springleaf Finance Corp. | 6.125 | 03-15-24 | | 5,000 | 5,375 |
| Springleaf Finance Corp. | 6.875 | 03-15-25 | | 75,000 | 82,124 |
| Springleaf Finance Corp. | 8.250 | 12-15-20 | | 155,000 | 166,431 |
| Insurance 0.2% | | | |
| Acrisure LLC (C) | 8.125 | 02-15-24 | | 160,000 | 165,200 |
| CNO Financial Group, Inc. | 5.250 | 05-30-29 | | 45,000 | 48,713 |
| Genworth Holdings, Inc. | 4.800 | 02-15-24 | | 5,000 | 4,250 |
| Genworth Holdings, Inc. | 4.900 | 08-15-23 | | 80,000 | 68,800 |
| 23 | JOHN HANCOCK HEDGED EQUITY & INCOME FUND | SEMIANNUAL REPORT | SEE NOTES TO FINANCIAL STATEMENTS |
| | Rate (%) | Maturity date | | Par value^ | Value |
| Financials (continued) | | | |
| Insurance (continued) | | | |
| Genworth Holdings, Inc. | 7.200 | 02-15-21 | | 30,000 | $29,400 |
| Genworth Holdings, Inc. | 7.625 | 09-24-21 | | 20,000 | 19,600 |
| Health care 1.3% | | | 2,307,220 |
| Health care equipment and supplies 0.2% | | | |
| Avantor, Inc. (C) | 6.000 | 10-01-24 | | 200,000 | 212,800 |
| Constantin Investissement 3 SASU | 5.375 | 04-15-25 | EUR | 100,000 | 114,238 |
| Health care providers and services 0.5% | | | |
| Community Health Systems, Inc. (C) | 8.125 | 06-30-24 | | 50,000 | 37,375 |
| HCA Healthcare, Inc. | 6.250 | 02-15-21 | | 240,000 | 251,400 |
| HCA, Inc. | 5.375 | 09-01-26 | | 60,000 | 64,650 |
| HCA, Inc. | 5.625 | 09-01-28 | | 10,000 | 10,825 |
| HCA, Inc. | 5.875 | 02-01-29 | | 5,000 | 5,481 |
| HCA, Inc. | 6.500 | 02-15-20 | | 135,000 | 138,104 |
| HCA, Inc. | 7.500 | 11-15-95 | | 65,000 | 68,575 |
| West Street Merger Sub, Inc. (C) | 6.375 | 09-01-25 | | 275,000 | 254,375 |
| Health care technology 0.1% | | | |
| Sotera Health Holdings LLC (C) | 6.500 | 05-15-23 | | 150,000 | 151,875 |
| Pharmaceuticals 0.5% | | | |
| Bausch Health Companies, Inc. | 4.500 | 05-15-23 | EUR | 130,000 | 149,686 |
| Bausch Health Companies, Inc. (C) | 5.500 | 03-01-23 | | 13,000 | 13,104 |
| Bausch Health Companies, Inc. (C) | 5.875 | 05-15-23 | | 116,000 | 117,348 |
| Bausch Health Companies, Inc. (C) | 6.125 | 04-15-25 | | 95,000 | 96,900 |
| Catalent Pharma Solutions, Inc. (C) | 4.875 | 01-15-26 | | 30,000 | 30,450 |
| Catalent Pharma Solutions, Inc. (C) | 5.000 | 07-15-27 | | 20,000 | 20,350 |
| Teva Pharmaceutical Finance IV LLC | 2.250 | 03-18-20 | | 90,000 | 89,145 |
| Teva Pharmaceutical Finance Netherlands II BV | 1.250 | 03-31-23 | EUR | 100,000 | 100,851 |
| Teva Pharmaceutical Finance Netherlands III BV | 2.800 | 07-21-23 | | 225,000 | 195,188 |
| Teva Pharmaceutical Finance Netherlands III BV | 6.750 | 03-01-28 | | 200,000 | 184,500 |
| Industrials 1.5% | | | 2,644,583 |
| Aerospace and defense 0.3% | | | |
| Avolon Holdings Funding, Ltd. (C) | 3.950 | 07-01-24 | | 50,000 | 51,229 |
| Avolon Holdings Funding, Ltd. (C) | 4.375 | 05-01-26 | | 20,000 | 20,584 |
| Avolon Holdings Funding, Ltd. (C) | 5.250 | 05-15-24 | | 80,000 | 85,272 |
| Bombardier, Inc. (C) | 6.125 | 01-15-23 | | 130,000 | 131,788 |
| Bombardier, Inc. (C) | 7.875 | 04-15-27 | | 75,000 | 75,094 |
| TransDigm, Inc. (C) | 6.250 | 03-15-26 | | 200,000 | 209,250 |
| Building products 0.1% | | | |
| Standard Industries, Inc. (C) | 5.375 | 11-15-24 | | 205,000 | 212,175 |
| SEE NOTES TO FINANCIAL STATEMENTS | SEMIANNUAL REPORT | JOHN HANCOCK HEDGED EQUITY & INCOME FUND | 24 |
| | Rate (%) | Maturity date | | Par value^ | Value |
| Industrials (continued) | | | |
| Commercial services and supplies 0.5% | | | |
| APX Group, Inc. | 7.625 | 09-01-23 | | 105,000 | $84,525 |
| APX Group, Inc. | 7.875 | 12-01-22 | | 85,000 | 81,494 |
| Clean Harbors, Inc. (C) | 4.875 | 07-15-27 | | 104,000 | 105,700 |
| Clean Harbors, Inc. (C) | 5.125 | 07-15-29 | | 40,000 | 40,800 |
| Garda World Security Corp. (C) | 8.750 | 05-15-25 | | 45,000 | 44,438 |
| IAA, Inc. (C) | 5.500 | 06-15-27 | | 55,000 | 57,200 |
| Pitney Bowes, Inc. | 4.625 | 03-15-24 | | 20,000 | 18,050 |
| Pitney Bowes, Inc. | 4.950 | 04-01-23 | | 90,000 | 84,994 |
| Stericycle, Inc. (C) | 5.375 | 07-15-24 | | 90,000 | 93,948 |
| Tervita Escrow Corp. (C) | 7.625 | 12-01-21 | | 229,000 | 232,941 |
| Waste Pro USA, Inc. (C) | 5.500 | 02-15-26 | | 60,000 | 61,350 |
| Construction and engineering 0.1% | | | |
| Brand Industrial Services, Inc. (C) | 8.500 | 07-15-25 | | 150,000 | 135,938 |
| Electrical equipment 0.1% | | | |
| Sensata Technologies BV (C) | 5.000 | 10-01-25 | | 100,000 | 104,250 |
| Sensata Technologies BV (C) | 5.625 | 11-01-24 | | 80,000 | 86,200 |
| Machinery 0.1% | | | |
| Cloud Crane LLC (C) | 10.125 | 08-01-24 | | 120,000 | 129,000 |
| Trading companies and distributors 0.3% | | | |
| Beacon Roofing Supply, Inc. (C) | 4.875 | 11-01-25 | | 90,000 | 89,100 |
| Herc Holdings, Inc. (C) | 5.500 | 07-15-27 | | 140,000 | 140,875 |
| United Rentals North America, Inc. | 4.625 | 10-15-25 | | 50,000 | 50,813 |
| United Rentals North America, Inc. | 4.875 | 01-15-28 | | 135,000 | 137,700 |
| United Rentals North America, Inc. | 5.875 | 09-15-26 | | 75,000 | 79,875 |
| Information technology 0.8% | | | 1,375,763 |
| IT services 0.2% | | | |
| First Data Corp. (C) | 5.750 | 01-15-24 | | 160,000 | 164,500 |
| Tempo Acquisition LLC (C) | 6.750 | 06-01-25 | | 240,000 | 247,200 |
| Semiconductors and semiconductor equipment 0.3% | | | |
| Entegris, Inc. (C) | 4.625 | 02-10-26 | | 145,000 | 146,088 |
| Micron Technology, Inc. | 4.640 | 02-06-24 | | 35,000 | 36,481 |
| Micron Technology, Inc. | 4.975 | 02-06-26 | | 90,000 | 94,925 |
| Micron Technology, Inc. | 5.500 | 02-01-25 | | 80,000 | 82,300 |
| Qorvo, Inc. | 5.500 | 07-15-26 | | 150,000 | 158,745 |
| Software 0.2% | | | |
| CDK Global, Inc. (C) | 5.250 | 05-15-29 | | 60,000 | 62,175 |
| Infor US, Inc. | 6.500 | 05-15-22 | | 50,000 | 50,880 |
| SS&C Technologies, Inc. (C) | 5.500 | 09-30-27 | | 150,000 | 155,625 |
| Technology hardware, storage and peripherals 0.1% | | | |
| Western Digital Corp. | 4.750 | 02-15-26 | | 35,000 | 34,337 |
| Xerox Corp. | 4.125 | 03-15-23 | | 140,000 | 142,507 |
| 25 | JOHN HANCOCK HEDGED EQUITY & INCOME FUND | SEMIANNUAL REPORT | SEE NOTES TO FINANCIAL STATEMENTS |
| | Rate (%) | Maturity date | | Par value^ | Value |
| Materials 1.2% | | | $2,258,143 |
| Chemicals 0.1% | | | |
| CF Industries, Inc. | 4.950 | 06-01-43 | | 10,000 | 8,950 |
| CF Industries, Inc. | 5.150 | 03-15-34 | | 70,000 | 68,250 |
| CF Industries, Inc. | 5.375 | 03-15-44 | | 20,000 | 18,756 |
| The Chemours Company | 6.625 | 05-15-23 | | 104,000 | 107,574 |
| The Chemours Company | 7.000 | 05-15-25 | | 10,000 | 10,450 |
| Containers and packaging 0.8% | | | |
| ARD Finance SA (6.625% Cash or 7.375% PIK) | 6.625 | 09-15-23 | EUR | 150,000 | 176,784 |
| Ardagh Packaging Finance PLC | 6.750 | 05-15-24 | EUR | 250,000 | 304,885 |
| Berry Global Escrow Corp. (C) | 5.625 | 07-15-27 | | 35,000 | 36,400 |
| Berry Global, Inc. | 6.000 | 10-15-22 | | 110,000 | 112,200 |
| Crown European Holdings SA | 2.875 | 02-01-26 | EUR | 225,000 | 276,222 |
| OI European Group BV (C) | 4.000 | 03-15-23 | | 10,000 | 10,050 |
| Owens-Brockway Glass Container, Inc. (C) | 5.875 | 08-15-23 | | 165,000 | 177,961 |
| Reynolds Group Issuer, Inc. (C) | 5.125 | 07-15-23 | | 155,000 | 157,906 |
| Reynolds Group Issuer, Inc. (C) | 7.000 | 07-15-24 | | 105,000 | 108,572 |
| Metals and mining 0.2% | | | |
| Constellium NV | 4.250 | 02-15-26 | EUR | 125,000 | 146,117 |
| Novelis Corp. (C) | 5.875 | 09-30-26 | | 55,000 | 55,688 |
| Novelis Corp. (C) | 6.250 | 08-15-24 | | 135,000 | 141,542 |
| Steel Dynamics, Inc. | 4.125 | 09-15-25 | | 25,000 | 24,875 |
| Steel Dynamics, Inc. | 5.125 | 10-01-21 | | 85,000 | 85,886 |
| Paper and forest products 0.1% | | | |
| Flex Acquisition Company, Inc. (C) | 6.875 | 01-15-25 | | 175,000 | 158,375 |
| Norbord, Inc. (C) | 5.750 | 07-15-27 | | 70,000 | 70,700 |
| Real estate 0.2% | | | 428,638 |
| Equity real estate investment trusts 0.1% | | | |
| FelCor Lodging LP | 6.000 | 06-01-25 | | 240,000 | 252,900 |
| Real estate management and development 0.1% | | | |
| Taylor Morrison Communities, Inc. | 6.625 | 05-15-22 | | 170,000 | 175,738 |
| Utilities 0.5% | | | 896,320 |
| Gas utilities 0.2% | | | |
| AmeriGas Partners LP | 5.500 | 05-20-25 | | 32,000 | 33,680 |
| AmeriGas Partners LP | 5.750 | 05-20-27 | | 40,000 | 42,000 |
| AmeriGas Partners LP | 5.875 | 08-20-26 | | 118,000 | 125,080 |
| Ferrellgas LP | 6.500 | 05-01-21 | | 25,000 | 22,688 |
| Ferrellgas LP | 6.750 | 01-15-22 | | 170,000 | 150,450 |
| Ferrellgas LP | 6.750 | 06-15-23 | | 68,000 | 59,670 |
| SEE NOTES TO FINANCIAL STATEMENTS | SEMIANNUAL REPORT | JOHN HANCOCK HEDGED EQUITY & INCOME FUND | 26 |
| | Rate (%) | Maturity date | | Par value^ | Value |
| Utilities (continued) | | | |
| Independent power and renewable electricity producers 0.2% | | | |
| NextEra Energy Operating Partners LP (C) | 4.250 | 07-15-24 | | 40,000 | $40,175 |
| The AES Corp. | 5.125 | 09-01-27 | | 205,000 | 216,275 |
| Water utilities 0.1% | | | |
|
| Aegea Finance Sarl (C) | 5.750 | 10-10-24 | | 200,000 | 206,302 |
| Convertible bonds 0.1% | | | | | $216,202 |
| (Cost $251,343) | | | | | |
| Consumer discretionary 0.0% | | | 51,350 |
| Hotels, restaurants and leisure 0.0% | | | |
| Caesars Entertainment Corp. | 5.000 | 10-01-24 | | 30,000 | 51,350 |
| Information technology 0.1% | | | 164,852 |
| IT services 0.0% | | | |
| Cardtronics, Inc. | 1.000 | 12-01-20 | | 70,000 | 67,865 |
| Technology hardware, storage and peripherals 0.1% | | | |
|
| Western Digital Corp. (C) | 1.500 | 02-01-24 | | 108,000 | 96,987 |
| Term loans (H) 0.7% | | | | | $1,335,919 |
| (Cost $1,343,380) | | | | | |
| Consumer discretionary 0.2% | 338,192 |
| Hotels, restaurants and leisure 0.1% |
| Golden Entertainment, Inc., 2017 1st Lien Term Loan (1 month LIBOR + 3.000%) | 5.410 | 10-21-24 | | 183,350 | 182,433 |
| Internet and direct marketing retail 0.1% |
| Lands' End, Inc., Term Loan B (1 month LIBOR + 3.250%) | 5.652 | 04-04-21 | | 82,866 | 80,933 |
| Shutterfly, Inc., Term Loan B2 (1 month LIBOR + 2.500%) | 4.910 | 08-17-24 | | 74,882 | 74,826 |
| Financials 0.2% | 369,808 |
| Diversified financial services 0.0% |
| Crown Finance US, Inc., 2018 USD Term Loan (1 month LIBOR + 2.250%) | 4.652 | 02-28-25 | | 82,209 | 80,795 |
| Insurance 0.2% |
| Asurion LLC, 2018 Term Loan B7 (1 month LIBOR + 3.000%) | 5.402 | 11-03-24 | | 193,050 | 192,567 |
| HUB International, Ltd., 2018 Term Loan B (3 month LIBOR + 3.000%) | 5.586 | 04-25-25 | | 99,000 | 96,446 |
| Health care 0.0% | 69,985 |
| Life sciences tools and services 0.0% |
| Syneos Health, Inc., 2018 Term Loan B (1 month LIBOR + 2.000%) | 4.402 | 08-01-24 | | 70,248 | 69,985 |
| 27 | JOHN HANCOCK HEDGED EQUITY & INCOME FUND | SEMIANNUAL REPORT | SEE NOTES TO FINANCIAL STATEMENTS |
| | Rate (%) | Maturity date | | Par value^ | Value |
| Industrials 0.2% | $344,450 |
| Commercial services and supplies 0.1% |
| AVSC Holding Corp., 2018 1st Lien Term Loan (1 and 3 month LIBOR + 3.250%) | 5.672 | 03-01-25 | | 98,750 | 95,818 |
| Professional services 0.1% |
| The Dun & Bradstreet Corp., Term Loan (1 month LIBOR + 5.000%) | 7.404 | 02-08-26 | | 150,000 | 149,954 |
| Trans Union LLC, 2018 Term Loan B4 (1 month LIBOR + 2.000%) | 4.402 | 06-19-25 | | 99,000 | 98,678 |
| Information technology 0.1% | 213,484 |
| IT services 0.1% |
| Blackhawk Network Holdings, Inc., 2018 1st Lien Term Loan (1 month LIBOR + 3.000%) | 5.402 | 06-15-25 | | 99,000 | 98,155 |
| Semiconductors and semiconductor equipment 0.0% |
| Microchip Technology, Inc., 2018 Term Loan B (1 month LIBOR + 2.000%) | 4.410 | 05-29-25 | | 57,489 | 57,112 |
| Software 0.0% |
| SS&C European Holdings Sarl, 2018 Term Loan B4 (1 month LIBOR + 2.250%) | 4.652 | 04-16-25 | | 23,790 | 23,683 |
| SS&C Technologies, Inc., 2018 Term Loan B3 (1 month LIBOR + 2.250%) | 4.652 | 04-16-25 | | 34,691 | 34,534 |
|
| | | | | Shares | Value |
| Rights 0.0% | | | | | $23,880 |
| (Cost $25,092) | | | | | |
| ACS Actividades de Construccion y Servicios SA (Expiration Date: 7-9-19) (B)(I) | | 15,218 | 23,880 |
|
| | Rate (%) | Maturity date | | Par value^ | Value |
| Escrow certificates 0.0% | | | | | $750 |
| (Cost $194) | | | | | |
| Texas Competitive Electric Holdings Company LLC (B)(E) | 11.500 | 10-01-20 | | 500,000 | 750 |
|
| SEE NOTES TO FINANCIAL STATEMENTS | SEMIANNUAL REPORT | JOHN HANCOCK HEDGED EQUITY & INCOME FUND | 28 |
| | | | | Par value^ | Value |
| Short-term investments 1.3% | | | | | $2,300,000 |
| (Cost $2,300,000) | | | | | |
| Repurchase agreement 1.3% | | | | | 2,300,000 |
| Goldman Sachs Tri-Party Repurchase Agreement dated 6-28-19 at 2.510% to be repurchased at $2,300,481 on 7-1-19, collateralized by $2,256,629 Government National Mortgage Association, 3.000% – 6.000% due 8-15-20 to 9-20-48 (valued at $2,346,000, including interest) | | | | 2,300,000 | 2,300,000 |
|
| Total investments (Cost $187,962,201) 98.8% | | | $179,017,540 |
| Other assets and liabilities, net 1.2% | | | | 2,196,634 |
| Total net assets 100.0% | | | | | $181,214,174 |
| The percentage shown for each investment category is the total value of the category as a percentage of the net assets of the fund unless otherwise indicated. |
| ^All par values are denominated in U.S. dollars unless otherwise indicated. |
| Currency Abbreviations |
| EUR | Euro |
| Security Abbreviations and Legend |
| ADR | American Depositary Receipt |
| EURIBOR | Euro Interbank Offered Rate |
| GDR | Global Depositary Receipt |
| ISDAFIX | International Swaps and Derivatives Association Fixed Interest Rate Swap Rate |
| LIBOR | London Interbank Offered Rate |
| PIK | Pay-in-Kind Security - Represents a payment-in-kind which may pay interest in additional par and/or cash. Rates shown are the current rate and most recent payment rate. |
| (A) | All or a portion of this security is segregated as collateral for options. Total collateral value at 6-30-19 was $10,445,720. |
| (B) | Non-income producing security. |
| (C) | These securities are exempt from registration under Rule 144A of the Securities Act of 1933. Such securities may be resold, normally to qualified institutional buyers, in transactions exempt from registration. |
| (D) | Direct placement securities are restricted as to resale, and the fund has limited rights to registration under the Securities Act of 1933. For more information on this security refer to the Notes to financial statements. |
| (E) | Security is valued using significant unobservable inputs and is classified as Level 3 in the fair value hierarchy. |
| (F) | Non-income producing - Issuer is in default. |
| (G) | Perpetual bonds have no stated maturity date. Date shown as maturity date is next call date. |
| (H) | Term loans are variable rate obligations. The coupon rate shown represents the rate at period end. |
| (I) | Strike price and/or expiration date not available. |
| 29 | JOHN HANCOCK HEDGED EQUITY & INCOME FUND | SEMIANNUAL REPORT | SEE NOTES TO FINANCIAL STATEMENTS |
DERIVATIVES
FUTURES
| Open contracts | Number of
contracts | Position | Expiration
date | Notional
basis^ | Notional
value^ | Unrealized
appreciation
(depreciation) |
| Euro STOXX 50 Index Futures | 159 | Short | Sep 2019 | $(6,171,252) | $(6,266,491) | $(95,239) |
| FTSE 100 Index Futures | 43 | Short | Sep 2019 | (4,000,499) | (4,024,050) | (23,551) |
| MSCI EAFE Index Futures | 88 | Short | Sep 2019 | (8,464,034) | (8,462,520) | 1,514 |
| | | | | | | $(117,276) |
^ Notional basis refers to the contractual amount agreed upon at inception of open contracts; notional value represents the current value of the open contract.
FORWARD FOREIGN CURRENCY CONTRACTS
| Contract to buy | Contract to sell | Counterparty (OTC) | Contractual
settlement
date | Unrealized
appreciation | Unrealized
depreciation |
| CAD | 115,000 | USD | 85,825 | SSB | 7/3/2019 | $1,993 | — |
| CAD | 115,000 | USD | 87,942 | CITI | 8/6/2019 | — | $(56) |
| EUR | 1,670,000 | USD | 1,866,192 | MSI | 7/3/2019 | 32,926 | — |
| EUR | 1,521,000 | USD | 1,734,412 | CITI | 8/6/2019 | 79 | — |
| GBP | 494,000 | USD | 623,038 | BNP | 7/3/2019 | 4,350 | — |
| GBP | 472,000 | USD | 601,200 | BNP | 8/6/2019 | — | (751) |
| USD | 87,876 | CAD | 115,000 | CITI | 7/3/2019 | 58 | — |
| USD | 1,898,982 | EUR | 1,670,000 | CITI | 7/3/2019 | — | (137) |
| USD | 13,085,555 | EUR | 11,471,000 | BNP | 9/18/2019 | — | (37,865) |
| USD | 600,211 | GBP | 472,000 | BNP | 7/3/2019 | 764 | — |
| USD | 27,910 | GBP | 22,000 | DB | 7/3/2019 | — | (30) |
| USD | 8,318,183 | GBP | 6,520,000 | GSI | 9/18/2019 | 9,395 | — |
| | | | | | | $49,565 | $(38,839) |
WRITTEN OPTIONS
| Options on index |
Counterparty (OTC)/
Exchange-
traded | Name of
issuer | | Exercise
price | Expiration
date | Number of
contracts | Notional
amount | Premium | Value |
| Calls | | | | | | | | |
| Exchange-traded | S&P 500 Index | USD | 2,935.00 | Jul 2019 | 31 | 3,100 | $99,469 | $(130,200) |
| Exchange-traded | S&P 500 Index | USD | 2,970.00 | Jul 2019 | 62 | 6,200 | 193,357 | (142,600) |
| | | | | | | | $292,826 | $(272,800) |
| Derivatives Currency Abbreviations |
| CAD | Canadian Dollar |
| EUR | Euro |
| GBP | Pound Sterling |
| USD | U.S. Dollar |
| Derivatives Abbreviations |
| BNP | BNP Paribas |
| SEE NOTES TO FINANCIAL STATEMENTS | SEMIANNUAL REPORT | JOHN HANCOCK HEDGED EQUITY & INCOME FUND | 30 |
| CITI | Citibank, N.A. |
| DB | Deutsche Bank AG |
| GSI | Goldman Sachs International |
| MSI | Morgan Stanley & Co. International PLC |
| OTC | Over-the-counter |
| SSB | State Street Bank and Trust Company |
At 6-30-19, the aggregate cost of investments for federal income tax purposes was $188,163,489. Net unrealized depreciation aggregated to $9,525,299, of which $8,570,101 related to gross unrealized appreciation and $18,095,400 related to gross unrealized depreciation.
See Notes to financial statements regarding investment transactions and other derivatives information.
| 31 | JOHN HANCOCK HEDGED EQUITY & INCOME FUND | SEMIANNUAL REPORT | SEE NOTES TO FINANCIAL STATEMENTS |
STATEMENT OF ASSETS AND LIABILITIES 6-30-19 (unaudited)
| Assets | |
| Unaffiliated investments, at value (Cost $187,962,201) | $179,017,540 |
| Unrealized appreciation on forward foreign currency contracts | 49,565 |
| Cash | 7,892 |
| Foreign currency, at value(Cost $135,116) | 134,835 |
| Collateral held at broker for futures contracts | 1,067,601 |
| Collateral segregated at custodian for OTC derivative contracts | 70,000 |
| Dividends and interest receivable | 1,472,525 |
| Receivable for investments sold | 685,102 |
| Other assets | 17,850 |
| Total assets | 182,522,910 |
| Liabilities | |
| Unrealized depreciation on forward foreign currency contracts | 38,839 |
| Written options, at value (Premiums received $292,826) | 272,800 |
| Payable for futures variation margin | 123,491 |
| Payable for investments purchased | 781,528 |
| Payable to affiliates | |
| Accounting and legal services fees | 21,913 |
| Trustees' fees | 284 |
| Other liabilities and accrued expenses | 69,881 |
| Total liabilities | 1,308,736 |
| Net assets | $181,214,174 |
| Net assets consist of | |
| Paid-in capital | $200,507,171 |
| Total distributable earnings (loss) | (19,292,997) |
| Net assets | $181,214,174 |
| |
| Net asset value per share | |
| Based on 12,213,964 shares of beneficial interest outstanding - unlimited number of shares authorized with $0.01 par value | $14.84 |
| SEE NOTES TO FINANCIAL STATEMENTS | SEMIANNUAL REPORT | JOHN HANCOCK Hedged Equity & Income Fund | 32 |
STATEMENT OF OPERATIONS For the six months ended 6-30-19 (unaudited)
| Investment income | |
| Dividends | $5,167,431 |
| Interest | 912,858 |
| Less foreign taxes withheld | (446,498) |
| Total investment income | 5,633,791 |
| Expenses | |
| Investment management fees | 865,675 |
| Accounting and legal services fees | 22,834 |
| Transfer agent fees | 10,988 |
| Trustees' fees | 22,555 |
| Custodian fees | 40,596 |
| Printing and postage | 44,347 |
| Professional fees | 28,062 |
| Stock exchange listing fees | 11,776 |
| Other | 7,776 |
| Total expenses | 1,054,609 |
| Less expense reductions | (6,669) |
| Net expenses | 1,047,940 |
| Net investment income | 4,585,851 |
| Realized and unrealized gain (loss) | |
| Net realized gain (loss) on | |
| Unaffiliated investments and foreign currency transactions | (1,155,211) |
| Futures contracts | (1,915,518) |
| Forward foreign currency contracts | 147,449 |
| Written options | (2,397,341) |
| | (5,320,621) |
| Change in net unrealized appreciation (depreciation) of | |
| Unaffiliated investments and translation of assets and liabilities in foreign currencies | 14,434,878 |
| Futures contracts | (258,592) |
| Forward foreign currency contracts | 200,098 |
| Written options | 115,977 |
| | 14,492,361 |
| Net realized and unrealized gain | 9,171,740 |
| Increase in net assets from operations | $13,757,591 |
| | |
| 33 | JOHN HANCOCK Hedged Equity & Income Fund | SEMIANNUAL REPORT | SEE NOTES TO FINANCIAL STATEMENTS |
STATEMENTS OF CHANGES IN NET ASSETS
| | Six months ended
6-30-19
(unaudited) | Year ended
12-31-18 |
| Increase (decrease) in net assets | | |
| From operations | | |
| Net investment income | $4,585,851 | $7,722,756 |
| Net realized gain (loss) | (5,320,621) | 6,567,319 |
| Change in net unrealized appreciation (depreciation) | 14,492,361 | (34,683,257) |
| Increase (decrease) in net assets resulting from operations | 13,757,591 | (20,393,182) |
| Distributions to shareholders | | |
| From net investment income and net realized gain | (9,184,901)1 | (15,279,209) |
| From tax return of capital | — | (3,083,603) |
| Total distributions | (9,184,901) | (18,362,812) |
| Fund share transactions | | |
| Issued pursuant to Dividend Reinvestment Plan | — | 151,230 |
| Total increase (decrease) | 4,572,690 | (38,604,764) |
| Net assets | | |
| Beginning of period | 176,641,484 | 215,246,248 |
| End of period | $181,214,174 | $176,641,484 |
| Share activity | | |
| Shares outstanding | | |
| Beginning of period | 12,213,964 | 12,204,669 |
| Issued pursuant to Dividend Reinvestment Plan | — | 9,295 |
| End of period | 12,213,964 | 12,213,964 |
| 1 | A portion of the distributions may be deemed a tax return of capital at the fiscal year end. |
| SEE NOTES TO FINANCIAL STATEMENTS | SEMIANNUAL REPORT | JOHN HANCOCK Hedged Equity & Income Fund | 34 |
| Period ended | 6-30-191 | 12-31-18 | 12-31-17 | 12-31-16 | 12-31-15 | 12-31-14 |
| Per share operating performance | | | | | | |
| Net asset value, beginning of period | $14.46 | $17.64 | $16.84 | $16.78 | $18.22 | $19.52 |
| Net investment income2 | 0.38 | 0.63 | 0.52 | 0.42 | 0.39 | 0.46 |
| Net realized and unrealized gain (loss) on investments | 0.75 | (2.31) | 1.94 | 1.09 | (0.51) | (0.27) |
| Total from investment operations | 1.13 | (1.68) | 2.46 | 1.51 | (0.12) | 0.19 |
| Less distributions | | | | | | |
| From net investment income | (0.75)3 | (0.86) | (0.49) | (0.41) | (0.44) | (0.45) |
| From net realized gain | — | (0.39) | (1.17) | (0.24) | (0.91) | (1.05) |
| From tax return of capital | — | (0.25) | — | (0.85) | (0.15) | — |
| Total distributions | (0.75) | (1.50) | (1.66) | (1.50) | (1.50) | (1.50) |
| Anti-dilutive impact of repurchase plan | — | — | — | 0.054 | 0.184 | 0.014 |
| Net asset value, end of period | $14.84 | $14.46 | $17.64 | $16.84 | $16.78 | $18.22 |
| Per share market value, end of period | $14.10 | $13.08 | $17.41 | $15.72 | $14.46 | $16.32 |
| Total return at net asset value (%)5,6 | 8.047 | (9.61) | 15.15 | 10.46 | 1.56 | 1.66 |
| Total return at market value (%)5 | 13.497 | (17.16) | 21.74 | 19.66 | (2.29) | 4.13 |
| Ratios and supplemental data | | | | | | |
| Net assets, end of period (in millions) | $181 | $177 | $215 | $206 | $210 | $248 |
| Ratios (as a percentage of average net assets): | | | | | | |
| Expenses before reductions | 1.168 | 1.14 | 1.13 | 1.15 | 1.16 | 1.17 |
| Expenses including reductions | 1.158 | 1.13 | 1.13 | 1.14 | 1.15 | 1.17 |
| Net investment income | 5.038,9 | 3.83 | 2.99 | 2.52 | 2.17 | 2.37 |
| Portfolio turnover (%) | 46 | 96 | 93 | 43 | 43 | 42 |
| 1 | Six months ended 6-30-19. Unaudited. |
| 2 | Based on average daily shares outstanding. |
| 3 | A portion of the distributions may be deemed a tax return of capital at the fiscal year end. |
| 4 | The repurchase plan was completed at an average repurchase price of $14.17, $15.71 and $17.38 for 312,533 shares, 1,120,307 shares and 94,866 shares for the periods ended 12-31-16, 12-31-15 and 12-31-14, respectively. |
| 5 | Total return based on net asset value reflects changes in the fund’s net asset value during each period. Total return based on market value reflects changes in market value. Each figure assumes that distributions from income, capital gains and tax return of capital, if any, were reinvested. |
| 6 | Total returns would have been lower had certain expenses not been reduced during the applicable periods. |
| 7 | Not annualized. |
| 8 | Annualized. |
| 9 | Net investment income is affected by the timing and frequency of the declaration of dividends by the securities in which the fund invests. |
| 35 | JOHN HANCOCK Hedged Equity & Income Fund | SEMIANNUAL REPORT | SEE NOTES TO FINANCIAL STATEMENTS |
| Notes to financial statements (unaudited) | |
Note 1—Organization
John Hancock Hedged Equity & Income Fund (the fund) is a closed-end management investment company organized as a Massachusetts business trust and registered under the Investment Company Act of 1940, as amended (the 1940 Act).
Note 2—Significant accounting policies
The financial statements have been prepared in conformity with accounting principles generally accepted in the United States of America (US GAAP), which require management to make certain estimates and assumptions as of the date of the financial statements. Actual results could differ from those estimates and those differences could be significant. The fund qualifies as an investment company under Topic 946 of Accounting Standards Codification of US GAAP.
Events or transactions occurring after the end of the fiscal period through the date that the financial statements were issued have been evaluated in the preparation of the financial statements. The following summarizes the significant accounting policies of the fund:
Security valuation. Investments are stated at value as of the scheduled close of regular trading on the New York Stock Exchange (NYSE), normally at 4:00 P.M., Eastern Time. In case of emergency or other disruption resulting in the NYSE not opening for trading or the NYSE closing at a time other than the regularly scheduled close, the net asset value (NAV) may be determined as of the regularly scheduled close of the NYSE pursuant to the fund's Valuation Policies and Procedures.
In order to value the securities, the fund uses the following valuation techniques: Equity securities, including exchange-traded or closed-end funds, are typically valued at the last sale price or official closing price on the exchange or principal market where the security trades. In the event there were no sales during the day or closing prices are not available, the securities are valued using the last available bid price. ETFs held by the fund are typically valued at the last sale price or official closing price on the exchange or principal market where the security trades. In the event there were no sales during the day or closing prices are not available, the securities are valued using the last available bid price. Debt obligations are typically valued based on the evaluated prices provided by an independent pricing vendor. Independent pricing vendors utilize matrix pricing which takes into account factors such as institutional-size trading in similar groups of securities, yield, quality, coupon rate, maturity, type of issue, trading characteristics and other market data, as well as broker supplied prices. Options listed on an exchange are valued at the mid-price of the last quoted bid and ask prices from the primary exchange where the option trades. Unlisted options are valued using evaluated prices obtained from an independent pricing vendor. Futures contracts are typically valued at last traded price on the exchange on which they trade. Foreign equity index futures that trade in the electronic trading market subsequent to the close of regular trading may be valued at the last traded price in the electronic trading market as of 4:00 P.M. ET, or may be fair valued based on fair value adjustment factors provided by an independent pricing vendor in order to adjust for events that may occur between the close of foreign exchanges or markets and the close of the NYSE. Forward foreign currency contracts are valued at the prevailing forward rates which are based on foreign currency exchange spot rates and forward points supplied by an independent pricing vendor. Foreign securities and currencies are valued in U.S. dollars based on foreign currency exchange rates supplied by an independent pricing vendor.
In certain instances, the Pricing Committee may determine to value equity securities using prices obtained from another exchange or market if trading on the exchange or market on which prices are typically obtained did not open for trading as scheduled, or if trading closed earlier than scheduled, and trading occurred as normal on another exchange or market.
| | SEMIANNUAL REPORT | JOHN HANCOCK Hedged Equity & Income Fund | 36 |
Other portfolio securities and assets, for which reliable market quotations are not readily available, are valued at fair value as determined in good faith by the fund's Pricing Committee following procedures established by the Board of Trustees. The frequency with which these fair valuation procedures are used cannot be predicted and fair value of securities may differ significantly from the value that would have been used had a ready market for such securities existed. Trading in foreign securities may be completed before the scheduled daily close of trading on the NYSE. Significant events at the issuer or market level may affect the values of securities between the time when the valuation of the securities is generally determined and the close of the NYSE. If a significant event occurs, these securities may be fair valued, as determined in good faith by the fund's Pricing Committee, following procedures established by the Board of Trustees. The fund uses fair value adjustment factors provided by an independent pricing vendor to value certain foreign securities in order to adjust for events that may occur between the close of foreign exchanges or markets and the close of the NYSE.
The fund uses a three-tier hierarchy to prioritize the pricing assumptions, referred to as inputs, used in valuation techniques to measure fair value. Level 1 includes securities valued using quoted prices in active markets for identical securities. Level 2 includes securities valued using other significant observable inputs. Observable inputs may include quoted prices for similar securities, interest rates, prepayment speeds and credit risk. Prices for securities valued using these inputs are received from independent pricing vendors and brokers and are based on an evaluation of the inputs described. Level 3 includes securities valued using significant unobservable inputs when market prices are not readily available or reliable, including the fund's own assumptions in determining the fair value of investments. Factors used in determining value may include market or issuer specific events or trends, changes in interest rates and credit quality. The inputs or methodology used for valuing securities are not necessarily an indication of the risks associated with investing in those securities. Changes in valuation techniques and related inputs may result in transfers into or out of an assigned level within the disclosure hierarchy.
The following is a summary of the values by input classification of the fund's investments as of June 30, 2019, by major security category or type:
| | Total
value at
6-30-19 | Level 1
quoted
price | Level 2
significant
observable
inputs | Level 3
significant
unobservable
inputs |
| Investments in securities: | | | | |
| Assets | | | | |
| Common stocks | | | | |
| Communication services | $13,760,219 | $5,427,605 | $8,332,614 | — |
| Consumer discretionary | 11,973,416 | 5,724,610 | 6,248,806 | — |
| Consumer staples | 12,626,419 | 7,660,187 | 4,966,232 | — |
| Energy | 16,442,827 | 8,046,791 | 8,396,036 | — |
| Financials | 27,020,680 | 6,774,767 | 20,245,913 | — |
| Health care | 13,566,625 | 4,216,026 | 9,350,599 | — |
| Industrials | 12,780,006 | 1,641,869 | 11,138,137 | — |
| Information technology | 14,980,892 | 10,487,776 | 4,493,116 | — |
| Materials | 7,945,464 | 2,267,500 | 5,677,964 | — |
| Real estate | 6,553,671 | 4,211,486 | 2,342,185 | — |
| Utilities | 10,747,394 | 3,700,491 | 7,046,903 | — |
| Preferred securities | | | | |
| Communication services | 45,491 | 45,491 | — | — |
| Consumer discretionary | 722,261 | — | 722,261 | — |
| 37 | JOHN HANCOCK Hedged Equity & Income Fund | SEMIANNUAL REPORT | |
| | Total
value at
6-30-19 | Level 1
quoted
price | Level 2
significant
observable
inputs | Level 3
significant
unobservable
inputs |
| Information technology | $90,174 | — | $90,174 | — |
| Utilities | 98,720 | $98,720 | — | — |
| Exchange-traded funds | 58,330 | 58,330 | — | — |
| Foreign government obligations | 107,790 | — | 107,790 | — |
| Corporate bonds | 25,620,410 | — | 25,620,410 | — |
| Convertible bonds | 216,202 | — | 216,202 | — |
| Term loans | 1,335,919 | — | 1,335,919 | — |
| Rights | 23,880 | 23,880 | — | — |
| Escrow certificates | 750 | — | — | $750 |
| Short-term investments | 2,300,000 | — | 2,300,000 | — |
| Total investments in securities | $179,017,540 | $60,385,529 | $118,631,261 | $750 |
| Derivatives: | | | | |
| Assets | | | | |
| Futures | $1,514 | $1,514 | — | — |
| Forward foreign currency contracts | 49,565 | — | $49,565 | — |
| Liabilities | | | | |
| Futures | (118,790) | (118,790) | — | — |
| Forward foreign currency contracts | (38,839) | — | (38,839) | — |
| Written options | (272,800) | (272,800) | — | — |
Repurchase agreements. The fund may enter into repurchase agreements. When the fund enters into a repurchase agreement, it receives collateral that is held in a segregated account by the fund's custodian, or for tri-party repurchase agreements, collateral is held at a third-party custodian bank in a segregated account for the benefit of the fund. The collateral amount is marked-to-market and monitored on a daily basis to ensure that the collateral held is in an amount not less than the principal amount of the repurchase agreement plus any accrued interest. Collateral received by the fund for repurchase agreements is disclosed in the Fund’s investments as part of the caption related to the repurchase agreement.
Repurchase agreements are typically governed by the terms and conditions of the Master Repurchase Agreement and/or Global Master Repurchase Agreement (collectively, MRA). Upon an event of default, the non-defaulting party may close out all transactions traded under the MRA and net amounts owed. Absent an event of default, assets and liabilities resulting from repurchase agreements are not offset in the Statement of assets and liabilities. In the event of a default by the counterparty, realization of the collateral proceeds could be delayed, during which time the collateral value may decline or the counterparty may have insufficient assets to pay back claims resulting from close-out of the transactions.
Security transactions and related investment income. Investment security transactions are accounted for on a trade date plus one basis for daily NAV calculations. However, for financial reporting purposes, investment transactions are reported on trade date. Interest income is accrued as earned. Interest income includes coupon interest and amortization/accretion of premiums/discounts on debt securities. Debt obligations may be placed in a non-accrual status and related interest income may be reduced by stopping current accruals and writing off interest receivable when the collection of all or a portion of interest has become doubtful. Dividend income is recorded on the ex-date, except for dividends of foreign securities where the dividend may not be known until
| | SEMIANNUAL REPORT | JOHN HANCOCK Hedged Equity & Income Fund | 38 |
after the ex-date. In those cases, dividend income, net of withholding taxes, is recorded when the fund becomes aware of the dividends. Non-cash dividends, if any, are recorded at the fair market value of the securities received. Gains and losses on securities sold are determined on the basis of identified cost and may include proceeds from litigation.
Real estate investment trusts. The fund may invest in real estate investment trusts (REITs). Distributions from REITs may be recorded as income and subsequently characterized by the REIT at the end of the fiscal year as a reduction of cost of investments and/or as a realized gain. As a result, the fund will estimate the components of distributions from these securities. Such estimates are revised when the actual components of the distributions are known.
Foreign investing. Assets, including investments, and liabilities denominated in foreign currencies are translated into U.S. dollar values each day at the prevailing exchange rate. Purchases and sales of securities, income and expenses are translated into U.S. dollars at the prevailing exchange rate on the date of the transaction. The effect of changes in foreign currency exchange rates on the value of securities is reflected as a component of the realized and unrealized gains (losses) on investments. Foreign investments are subject to a decline in the value of a foreign currency versus the U.S. dollar, which reduces the dollar value of securities denominated in that currency.
Funds that invest internationally generally carry more risk than funds that invest strictly in U.S. securities. Risks can result from differences in economic and political conditions, regulations, market practices (including higher transaction costs), accounting standards and other factors.
Foreign taxes. The fund may be subject to withholding tax on income, capital gains or repatriation taxes imposed by certain countries, a portion of which may be recoverable. Foreign taxes are accrued based upon the fund’s understanding of the tax rules and rates that exist in the foreign markets in which it invests. Taxes are accrued based on gains realized by the fund as a result of certain foreign security sales. In certain circumstances, estimated taxes are accrued based on unrealized appreciation of such securities. Investment income is recorded net of foreign withholding taxes.
Overdrafts. Pursuant to the custodian agreement, the fund’s custodian may, in its discretion, advance funds to the fund to make properly authorized payments. When such payments result in an overdraft, the fund is obligated to repay the custodian for any overdraft, including any costs or expenses associated with the overdraft. The custodian may have a lien, security interest or security entitlement in any fund property that is not otherwise segregated or pledged, to the maximum extent permitted by law, to the extent of any overdraft.
Expenses. Within the John Hancock group of funds complex, expenses that are directly attributable to an individual fund are allocated to such fund. Expenses that are not readily attributable to a specific fund are allocated among all funds in an equitable manner, taking into consideration, among other things, the nature and type of expense and the fund’s relative net assets. Expense estimates are accrued in the period to which they relate and adjustments are made when actual amounts are known.
Federal income taxes. The fund intends to continue to qualify as a regulated investment company by complying with the applicable provisions of the Internal Revenue Code and will not be subject to federal income tax on taxable income that is distributed to shareholders. Therefore, no federal income tax provision is required.
As of December 31, 2018, the fund had no uncertain tax positions that would require financial statement recognition, derecognition or disclosure. The fund's federal tax returns are subject to examination by the Internal Revenue Service for a period of three years.
| 39 | JOHN HANCOCK Hedged Equity & Income Fund | SEMIANNUAL REPORT | |
Managed distribution plan. The fund has adopted a managed distribution plan (Plan). Under the current Plan, the fund makes quarterly distributions of an amount equal to $0.376 per share, which will be paid quarterly until further notice.
Distributions under the Plan may consist of net investment income, net realized capital gains and, to the extent necessary, return of capital. Return of capital distributions may be necessary when the fund’s net investment income and net capital gains are insufficient to meet the minimum distribution. In addition, the fund may also make additional distributions for the purpose of not incurring federal income and excise taxes.
The Board of Trustees may terminate or reduce the amount paid under the Plan at any time. The termination or reduction may have an adverse effect on the market price of the fund’s shares.
Distribution of income and gains. Distributions to shareholders from net investment income and net realized gains, if any, are recorded on the ex-date. The fund generally declares and pays dividends quarterly pursuant to the Managed Distribution Plan described above. Capital gain distributions, if any, are typically distributed annually.
Such distributions, on a tax basis, are determined in conformity with income tax regulations, which may differ from US GAAP. Distributions in excess of tax basis earnings and profits, if any, are reported in the fund’s financial statements as a return of capital. The final determination of tax characteristics of the fund’s distribution will occur at the end of the year and will subsequently be reported to shareholders.
Capital accounts within the financial statements are adjusted for permanent book-tax differences. These adjustments have no impact on net assets or the results of operations. Temporary book-tax differences, if any, will reverse in a subsequent period. Book-tax differences are primarily attributable to foreign currency transactions, investments in passive foreign investment companies, derivative transactions,wash sale loss deferrals, and amortization and accretion on debt securities.
Note 3—Derivative instruments
The fund may invest in derivatives in order to meet its investment objective. Derivatives include a variety of different instruments that may be traded in the over-the-counter (OTC) market, on a regulated exchange or through a clearing facility. The risks in using derivatives vary depending upon the structure of the instruments, including the use of leverage, optionality, the liquidity or lack of liquidity of the contract, the creditworthiness of the counterparty or clearing organization and the volatility of the position. Some derivatives involve risks that are potentially greater than the risks associated with investing directly in the referenced securities or other referenced underlying instrument. Specifically, the fund is exposed to the risk that the counterparty to an OTC derivatives contract will be unable or unwilling to make timely settlement payments or otherwise honor its obligations. OTC derivatives transactions typically can only be closed out with the other party to the transaction.
Derivatives which are typically traded through the OTC market are regulated by the Commodity Futures Trading Commission (the CFTC) as swaps. Derivative counterparty risk is managed through an ongoing evaluation of the creditworthiness of all potential counterparties and, if applicable, designated clearing organizations. The fund attempts to reduce its exposure to counterparty risk for derivatives traded in the OTC market, whenever possible, by entering into an International Swaps and Derivatives Association (ISDA) Master Agreement with each of its OTC counterparties. The ISDA gives each party to the agreement the right to terminate all transactions traded under the agreement if there is certain deterioration in the credit quality or contractual default of the other party, as defined in the ISDA. Upon an event of default or a termination of the ISDA, the non-defaulting party has the right to close out all transactions and to net amounts owed.
| | SEMIANNUAL REPORT | JOHN HANCOCK Hedged Equity & Income Fund | 40 |
As defined by the ISDA, the fund may have collateral agreements with certain counterparties to mitigate counterparty risk on OTC derivatives. Subject to established minimum levels, collateral for OTC transactions is generally determined based on the net aggregate unrealized gain or loss on contracts with a particular counterparty. Collateral pledged to the fund, if any, is held in a segregated account by a third-party agent or held by the custodian bank for the benefit of the fund and can be in the form of cash or debt securities issued by the U.S. government or related agencies; collateral posted by the fund, if any, for OTC transactions is held in a segregated account at the fund's custodian and is noted in the accompanying Fund's investments, or if cash is posted, on the Statement of assets and liabilities. The fund's risk of loss due to counterparty risk is equal to the asset value of outstanding contracts offset by collateral received.
Certain derivatives are traded or cleared on an exchange or central clearinghouse. Exchange-traded or centrally-cleared transactions generally present less counterparty risk to a fund than OTC transactions. The exchange or clearinghouse stands between the fund and the broker to the contract and therefore, credit risk is generally limited to the failure of the exchange or clearinghouse and the clearing member.
Futures. A futures contract is a contractual agreement to buy or sell a particular currency or financial instrument at a pre-determined price in the future. Risks related to the use of futures contracts include possible illiquidity of the futures markets and contract prices that can be highly volatile and imperfectly correlated to movements in the underlying financial instrument and potential losses in excess of the amounts recognized on the Statement of assets and liabilities. Use of long futures contracts subjects the fund to the risk of loss up to the notional value of the futures contracts. Use of short futures contracts subjects the fund to unlimited risk of loss.
Upon entering into a futures contract, the fund is required to deposit initial margin with the broker in the form of cash or securities. The amount of required margin is generally based on a percentage of the contract value; this amount is the initial margin for the trade. The margin deposit must then be maintained at the established level over the life of the contract. Payable for futures margin is included on the Statement of assets and liabilities. Futures contracts are marked-to-market daily and an appropriate payable or receivable for the change in value (variation margin) and unrealized gain or loss is recorded by the fund. When the contract is closed, the fund records a realized gain or loss equal to the difference between the value of the contract at the time it was opened and the value at the time it was closed. Collateral or margin requirements are set by the broker or applicable clearinghouse. Collateral is detailed in the Statement of assets and liabilities as Collateral held at broker for futures contracts. Securities pledged by the fund, if any, are identified in the Fund's investments.
During the six months ended June 30, 2019, the fund used futures contracts to manage against anticipated changes in securities markets. The fund held futures contracts with USD notional values ranging from $9.6 million to $18.8 million, as measured at each quarter end.
Forward foreign currency contracts. A forward foreign currency contract is an agreement between two parties to buy and sell specific currencies at a price that is set on the date of the contract. The forward contract calls for delivery of the currencies on a future date that is specified in the contract. Risks related to the use of forwards include the possible failure of counterparties to meet the terms of the forward agreement, the failure of the counterparties to timely post collateral if applicable, and the risk that currency movements will not favor the fund thereby reducing the fund’s total return, and the potential for losses in excess of the amounts recognized on the Statement of assets and liabilities.
The market value of a forward foreign currency contract fluctuates with changes in foreign currency exchange rates. Forward foreign currency contracts are marked-to-market daily and the change in value is recorded by the fund as an unrealized gain or loss. Realized gains or losses, equal to the difference between the value of the contract at the time it was opened and the value at the time it was closed, are recorded upon delivery or receipt of
| 41 | JOHN HANCOCK Hedged Equity & Income Fund | SEMIANNUAL REPORT | |
the currency or settlement with the counterparty.
During the six months ended June 30, 2019, the fund used forward foreign currency contracts to manage against anticipated changes in currency exchange rates and to manage currency exposure. The fund held forward foreign currency contracts with USD notional values ranging from $24.2 million to $29.0 million, as measured at each quarter end.
Options. There are two types of options, put options and call options. Options are traded either OTC or on an exchange. A call option gives the purchaser of the option the right to buy (and the seller the obligation to sell) the underlying instrument at the exercise price. A put option gives the purchaser of the option the right to sell (and the writer the obligation to buy) the underlying instrument at the exercise price. Writing puts and buying calls may increase the fund’s exposure to changes in the value of the underlying instrument. Buying puts and writing calls may decrease the fund’s exposure to such changes. Risks related to the use of options include the loss of premiums, possible illiquidity of the options markets, trading restrictions imposed by an exchange and movements in underlying security values, and for written options, potential losses in excess of the amounts recognized on the Statement of assets and liabilities. In addition, OTC options are subject to the risks of all OTC derivatives contracts.
When the fund purchases an option, the premium paid is included in the Fund's investments and subsequently “marked-to-market” to reflect current market value. If the purchased option expires, the fund realizes a loss equal to the cost of the option. If the fund exercises a call option, the cost of the securities acquired by exercising the call is increased by the premium paid to buy the call. If the fund exercises a put option, it realizes a gain or loss from the sale of the underlying security and the proceeds from such sale are decreased by the premium paid. If the fund enters into a closing sale transaction, it realizes a gain or loss, depending on whether proceeds from the closing sale are greater or less than the original cost. When the fund writes an option, the premium received is included as a liability and subsequently “marked-to-market” to reflect the current market value of the option written. Premiums received from writing options that expire unexercised are recorded as realized gains. Premiums received from writing options which are exercised or are closed are added to or offset against the proceeds or amount paid on the transaction to determine the realized gain or loss. If a put option on a security is exercised, the premium received reduces the cost basis of the securities purchased by the fund.
During the six months ended June 30, 2019, the fund wrote option contracts to generate income. The fund held written option contracts with market values ranging from $272,800 to $642,900, as measured at each quarter end.
Fair value of derivative instruments by risk category
The table below summarizes the fair value of derivatives held by the fund at June 30, 2019 by risk category:
| Risk | Statement of
assets and
liabilities location | Financial
instruments
location | Assets
derivatives
fair value | Liabilities
derivatives
fair value |
| Equity | Receivable/payable for futures variation margin | Futures1 | $1,514 | $(118,790) |
| Foreign currency | Unrealized appreciation / depreciation on forward foreign currency | Forward foreign currency contracts | 49,565 | (38,839) |
| Equity | Written options, at value | Written options | — | (272,800) |
| | | | $51,079 | $(430,429) |
| 1 | Reflects cumulative appreciation/depreciation on futures as disclosed in Fund's investments. Only the period end variation margin is separately disclosed on the Statement of assets and liabilities. |
| | SEMIANNUAL REPORT | JOHN HANCOCK Hedged Equity & Income Fund | 42 |
Effect of derivative instruments on the Statement of operations
The table below summarizes the net realized gain (loss) included in the net increase (decrease) in net assets from operations, classified by derivative instrument and risk category, for the six months ended June 30, 2019:
| | Statement of operations location - Net realized gain (loss) on: |
| Risk | Futures contracts | Forward foreign
currency contracts | Written options | Total |
| Equity | $(1,915,518) | — | $(2,397,341) | $(4,312,859) |
| Foreign currency | — | $147,449 | — | 147,449 |
| Total | $(1,915,518) | $147,449 | $(2,397,341) | $(4,165,410) |
The table below summarizes the net change in unrealized appreciation (depreciation) included in the net increase (decrease) in net assets from operations, classified by derivative instrument and risk category, for the six months ended June 30, 2019:
| | Statement of operations location - Change in net unrealized appreciation (depreciation) of: |
| Risk | Futures contracts | Forward foreign
currency contracts | Written options | Total |
| Foreign currency | — | $200,098 | — | $200,098 |
| Equity | $(258,592) | — | $115,977 | (142,615) |
| Total | $(258,592) | $200,098 | $115,977 | $57,483 |
Note 4—Guarantees and indemnifications
Under the fund's organizational documents, its Officers and Trustees are indemnified against certain liabilities arising out of the performance of their duties to the fund. Additionally, in the normal course of business, the fund enters into contracts with service providers that contain general indemnification clauses. The fund's maximum exposure under these arrangements is unknown, as this would involve future claims that may be made against the fund that have not yet occurred. The risk of material loss from such claims is considered remote.
Note 5—Fees and transactions with affiliates
John Hancock Investment Management LLC (the Advisor) serves as investment advisor for the fund. The Advisor is an indirect, wholly owned subsidiary of Manulife Financial Corporation (MFC). Prior to June 28, 2019, the Advisor was known as John Hancock Advisers, LLC.
Management fee. The fund has an investment management agreement with the Advisor under which the fund pays a daily management fee to the Advisor equivalent on an annual basis to 0.95% of the fund’s average daily gross assets. The Advisor has a subadvisory agreement with Wellington Management Company LLP. The fund is not responsible for payment of the subadvisory fees.
The Advisor has contractually agreed to waive a portion of its management fee and/or reimburse expenses for certain funds of the John Hancock group of funds complex, including the fund (the participating portfolios). This waiver is based upon aggregate net assets of all the participating portfolios. The amount of the reimbursement is calculated daily and allocated among all the participating portfolios in proportion to the daily net assets of each fund. During the six months ended June 30, 2019, this waiver amounted to 0.01% of the fund’s average daily net assets on an annualized basis. This arrangement expires on July 31, 2021, unless renewed by mutual agreement of the fund and the Advisor based upon a determination that this is appropriate under the circumstances at that time.
| 43 | JOHN HANCOCK Hedged Equity & Income Fund | SEMIANNUAL REPORT | |
The expense reductions described above amounted to $6,669 for the six months ended June 30, 2019.
Expenses waived or reimbursed in the current fiscal period are not subject to recapture in future fiscal periods.
The investment management fees, including the impact of the waivers and reimbursements as described above, incurred for the six months ended June 30, 2019 were equivalent to a net annual effective rate of 0.94% of the fund's average daily managed net assets.
Accounting and legal services. Pursuant to a service agreement, the fund reimburses the Advisor for all expenses associated with providing the administrative, financial, legal, compliance, accounting and recordkeeping services to the fund, including the preparation of all tax returns, periodic reports to shareholders and regulatory reports, among other services. These accounting and legal services fees incurred for the six months ended June 30, 2019 amounted to an annual rate of 0.03% of the fund's average daily net assets.
Trustee expenses. The fund compensates each Trustee who is not an employee of the Advisor or its affiliates. These Trustees receive from the fund and the other John Hancock closed-end funds an annual retainer. In addition, Trustee out-of-pocket expenses are allocated to each fund based on its net assets relative to other funds within the John Hancock group of funds complex.
Note 6—Fund share transactions
On December 6, 2011, the Board of Trustees approved a share repurchase plan, which is subsequently reviewed and approved by the Board of Trustees each year in December. Under the current share repurchase plan, the fund may purchase in the open market, between January 1, 2019 and December 31, 2019, up to 10% of its outstanding common shares (based on common shares outstanding as of December 31, 2018). During the six months ended June 30, 2019 and the year ended December 31, 2018, the fund had no activities under the repurchase program.
Note 7—Purchase and sale of securities
Purchases and sales of securities, other than short-term investments amounted to $82,155,321 and $89,954,469, respectively, for the six months ended June 30, 2019.
Note 8—Direct placement securities
The fund may hold private placement securities which are restricted as to resale and the fund has limited rights to registration under the Securities Act of 1933. The following table summarizes the direct placement securities held at June 30, 2019:
Issuer,
Description | Original
acquisition date | Acquisition
cost | Beginning
share
amount | Shares
purchased | Shares
sold | Ending
share
amount | Value as a
percentage of
net assets | Ending
value |
| Allstar Co-Invest LLC | 8-1-11 | $240,553 | 236,300 | — | — | 236,300 | 0.0% | — |
| | SEMIANNUAL REPORT | JOHN HANCOCK Hedged Equity & Income Fund | 44 |
ADDITIONAL INFORMATION
Unaudited
Investment objective and policy
The fund is a closed-end, diversified management investment company, common shares of which were initially offered to the public on May 26, 2011 and are publicly traded on the New York Stock Exchange (the NYSE). The fund's investment objective is to provide total return with a focus on current income and gains and also consisting of long-term capital appreciation. The fund uses an equity strategy, as well as futures and call writing, to pursue its investment objective.
Under normal circumstances, the fund will invest at least 80% of its net assets (assets plus borrowings for investment purposes) in equity and equity-related securities, including common stock, preferred stock, depositary receipts (including American Depositary Receipts and Global Depositary Receipts), index-related securities (including exchange-traded funds), options on equity securities and equity indexes, real estate investment structures (including real estate investment trusts), convertible securities, private placements, convertible preferred stock, rights, warrants, derivatives linked to equity securities or indexes and other similar equity equivalents. The fund may invest in listed and unlisted domestic and foreign equity and equity-related securities or instruments, including China A shares listed and traded on certain Chinese stock exchanges through Stock Connect, a mutual market access program. These equity and equity-related instruments may include equity securities of, or derivatives linked to, foreign issuers and indexes (including emerging market issuers or indexes).
Dividends and distributions
During the six months ended June 30, 2019, distributions from net investment income totaling $0.7520 per share were paid to shareholders. The dates of payments and the amounts per share were as follows:
| | |
| Payment date | Distributions* |
| March 29, 2019 | $0.3760 |
| June 28, 2019 | 0.3760 |
| Total | $0.7520 |
* A portion of the distributions may be deemed a tax return of capital at the fiscal year end.
SEMIANNUAL REPORT | JOHN HANCOCK HEDGED EQUITY & INCOME FUND 45
Shareholder meeting
The fund held its Annual Meeting of Shareholders on February 7, 2019. The following proposals were considered by the shareholders:
Proposal: To elect one (1) Trustee (Marianne Harrison) to serve for a two-year term ending at the 2021 Annual Meeting of Shareholders. To elect (4) Trustees (Andrew G. Arnott, Deborah C. Jackson, James M. Oates and Steven R. Pruchansky) to serve for a three-year term ending at the 2022 Annual Meeting of Shareholders.
| | | |
| | Total votes
for the nominee | Total votes withheld
from the nominee |
| Independent Trustees | | |
| Deborah C. Jackson | 8,211,718.000 | 150,916.000 |
| James M. Oates | 8,214,028.000 | 148,606.000 |
| Steven R. Pruchansky | 8,207,070.000 | 155,564.000 |
| Non-Independent Trustee | | |
| Andrew G. Arnott | 8,215,381.000 | 147,253.000 |
| Marianne Harrison | 8,208,717.000 | 153,917.000 |
Trustees whose term of office continued after the Annual Meeting of Shareholders because they were not up for election are: James R. Boyle, William H. Cunningham, Grace K. Fey, Hassell H. McClellan, Gregory A. Russo, Charles L. Bardelis, Peter S. Burgess and Theron S. Hoffman.
SEMIANNUAL REPORT | JOHN HANCOCK HEDGED EQUITY & INCOME FUND 46
Continuation of Investment Advisory and Subadvisory Agreements
Evaluation of Advisory and Subadvisory Agreements by the Board of Trustees
This section describes the evaluation by the Board of Trustees (the Board) of John Hancock Hedged Equity & Income Fund (the fund) of the Advisory Agreement (the Advisory Agreement) with John Hancock Investment Management, LLC (the Advisor, formerly known as "John Hancock Advisors, LLC") and the Subadvisory Agreement (the Subadvisory Agreement) with Wellington Management Company LLP (the Subadvisor). The Advisory Agreement and Subadvisory Agreement are collectively referred to as the Agreements. Prior to the June23-26, 2019 in-person meeting at which the Agreements were approved, the Board also discussed and considered information regarding the proposed continuation of the Agreements at an in-person meeting held on May28-30, 2019.
Approval of Advisory and Subadvisory Agreements
At in-person meetings held on June 23-26, 2019, the Board, including the Trustees who are not parties to any Agreement or considered to be interested persons of the fund under the Investment Company Act of 1940, as amended (the 1940 Act) (the Independent Trustees), reapproved for an annual period the continuation of the Advisory Agreement between the fund and the Advisor and the Subadvisory Agreement between the Advisor and the Subadvisor with respect to the fund.
In considering the Advisory Agreement and the Subadvisory Agreement, the Board received in advance of the meetings a variety of materials relating to the fund, the Advisor and the Subadvisor, including comparative performance, fee and expense information for a peer group of similar funds prepared by an independent third-party provider of fund data, performance information for an applicable benchmark index; and other pertinent information, such as the market premium and discount information, and, with respect to the Subadvisor, comparative performance information for comparably managed accounts, as applicable, and other information provided by the Advisor and the Subadvisor regarding the nature, extent and quality of services provided by the Advisor and the Subadvisor under their respective Agreements, as well as information regarding the Advisor's revenues and costs of providing services to the fund and any compensation paid to affiliates of the Advisor. At the meetings at which the renewal of the Advisory Agreement and Subadvisory Agreement are considered, particular focus is given to information concerning fund performance, comparability of fees and total expenses, and profitability. However, the Board notes that the evaluation process with respect to the Advisor and the Subadvisor is an ongoing one. In this regard, the Board also took into account discussions with management and information provided to the Board (including its various committees) at prior meetings with respect to the services provided by the Advisor and the Subadvisor to the fund, including quarterly performance reports prepared by management containing reviews of investment results and prior presentations from the Subadvisor with respect to the fund. The information received and considered by the Board in connection with the May and June meetings and throughout the year was both written and oral. The Board considered the nature, quality, and extent of non-advisory services, if any, to be provided to the fund by the Advisor's affiliates. The Board considered the Advisory Agreement and the Subadvisory Agreement separately in the course of its review. In doing so, the Board noted the respective roles of the Advisor and Subadvisor in providing services to the fund.
Throughout the process, the Board asked questions of and requested additional information from management. The Board is assisted by counsel for the fund and the Independent Trustees are also separately assisted by independent legal counsel throughout the process. The Independent Trustees also received a memorandum from their independent legal counsel discussing the legal standards for their consideration of the proposed continuation of the Agreements and discussed the proposed continuation of the Agreements in private sessions with their independent legal counsel at which no representatives of management were present.
SEMIANNUAL REPORT | JOHN HANCOCK HEDGED EQUITY & INCOME FUND 47
Approval of Advisory Agreement
In approving the Advisory Agreement with respect to the fund, the Board, including the Independent Trustees, considered a variety of factors, including those discussed below. The Board also considered other factors (including conditions and trends prevailing generally in the economy, the securities markets, and the industry) and did not treat any single factor as determinative, and each Trustee may have attributed different weights to different factors. The Board's conclusions may be based in part on its consideration of the advisory and subadvisory arrangements in prior years and on the Board's ongoing regular review of fund performance and operations throughout the year.
Nature, extent, and quality of services. Among the information received by the Board from the Advisor relating to the nature, extent, and quality of services provided to the fund, the Board reviewed information provided by the Advisor relating to its operations and personnel, descriptions of its organizational and management structure, and information regarding the Advisor's compliance and regulatory history, including its Form ADV. The Board also noted that on a regular basis it receives and reviews information from the fund's Chief Compliance Officer (CCO) regarding the fund's compliance policies and procedures established pursuant to Rule 38a-1 under the 1940 Act. The Board observed that the scope of services provided by the Advisor, and of the undertakings required of the Advisor in connection with those services, including maintaining and monitoring its own and the fund's compliance programs, risk management programs, liquidity management programs and cybersecurity programs, had expanded over time as a result of regulatory, market and other developments. The Board considered that the Advisor is responsible for the management of the day-to-day operations of the fund, including, but not limited to, general supervision of and coordination of the services provided by the Subadvisor, and is also responsible for monitoring and reviewing the activities of the Subadvisor and other third-party service providers. The Board also considered the significant risks assumed by the Advisor in connection with the services provided to the fund including entrepreneurial risk in sponsoring new funds and ongoing risks including investment, operational, enterprise, litigation, regulatory and compliance risk with respect to all funds.
The Board also considered the differences between the Advisor's services to the fund and the services it provides to other clients that are not closed-end funds, including, for example, the differences in services related to the regulatory and legal obligations of closed-end funds.
In considering the nature, extent, and quality of the services provided by the Advisor, the Trustees also took into account their knowledge of the Advisor's management and the quality of the performance of the Advisor's duties, through Board meetings, discussions and reports during the preceding year and through each Trustee's experience as a Trustee of the fund and of the other funds in the John Hancock group of funds complex (the John Hancock Fund Complex).
In the course of their deliberations regarding the Advisory Agreement, the Board considered, among other things:
| (a) | the skills and competency with which the Advisor has in the past managed the fund's affairs and its subadvisory relationship, the Advisor's oversight and monitoring of the Subadvisor's investment performance and compliance programs, such as the Subadvisor's compliance with fund policies and objectives, review of brokerage matters, including with respect to trade allocation and best execution and the Advisor's timeliness in responding to performance issues; |
| (b) | the background, qualifications and skills of the Advisor's personnel; |
| (c) | the Advisor's compliance policies and procedures and its responsiveness to regulatory changes and fund industry developments; |
SEMIANNUAL REPORT | JOHN HANCOCK HEDGED EQUITY & INCOME FUND 48
| (d) | the Advisor's administrative capabilities, including its ability to supervise the other service providers for the fund, as well as the Advisor's oversight of any securities lending activity, its monitoring of class action litigation and collection of class action settlements on behalf of the fund, and bringing loss recovery actions on behalf of the fund; |
| (e) | the financial condition of the Advisor and whether it has the financial wherewithal to provide a high level and quality of services to the fund; |
| (f) | the Advisor's initiatives intended to improve various aspects of the fund's operations and investor experience with the fund; and |
| (g) | the Advisor's reputation and experience in serving as an investment advisor to the fund and the benefit to shareholders of investing in funds that are part of a family of funds offering a variety of investments. |
The Board concluded that the Advisor may reasonably be expected to continue to provide a high quality of services under the Advisory Agreement with respect to the fund.
Investment performance.In considering the fund's performance, the Board noted that it reviews at its regularly scheduled meetings information about the fund's performance results. In connection with the consideration of the Advisory Agreement, the Board:
| (a) | reviewed information prepared by management regarding the fund's performance; |
| (b) | considered the comparative performance of an applicable benchmark index; |
| (c) | considered the performance of comparable funds, if any, as included in the report prepared by an independent third-party provider of fund data; |
| (d) | took into account the Advisor's analysis of the fund's performance; and |
| (e) | considered the fund's share performance and premium/discount information. |
The Board noted that while it found the data provided by the independent third-party generally useful it recognized its limitations, including in particular that the data may vary depending on the end date selected and the results of the performance comparisons may vary depending on the selection of the peer group. The Board noted that, based on its net asset value, the fund underperformed its benchmark index for the one-, three-, and five-year periods ended December 31, 2018. The Board also noted that, based on its net asset value, the fund outperformed its peer group average for the one- and five-year periods and underperformed its peer group average for the three-year period ended December 31, 2018. The Board took into account management's discussion of the fund's performance, including the favorable performance relative to the peer group for the one- and five-year periods. The Board concluded that the fund's performance has generally been in line with or outperformed the historical performance of comparable funds. The Board also took into account management's discussion of the impact of current market conditions on the fund's investment strategy.
Fees and expenses. The Board reviewed comparative information prepared by an independent third-party provider of fund data, including, among other data, the fund's contractual and net management fees (and subadvisory fees, to the extent available) and total expenses as compared to similarly situated investment companies deemed to be comparable to the fund in light of the nature, extent and quality of the management and advisory and subadvisory services provided by the Advisor and the Subadvisor. The Board considered the fund's ranking within a smaller group of peer funds chosen by the independent third-party provider, as well as the fund's ranking within a broader group of
SEMIANNUAL REPORT | JOHN HANCOCK HEDGED EQUITY & INCOME FUND 49
funds. In comparing the fund's contractual and net management fees to those of comparable funds, the Board noted that such fees include both advisory and administrative costs.
The Board noted that net management fees for the fund are lower than the peer group median and that net total expenses for the fund are lower than the peer group median. The Board took into account management's discussion with respect to the overall management fee and the fees of the Subadvisor, including the amount of the advisory fee retained by the Advisor after payment of the subadvisory fee, in each case in light of the services rendered for those amounts and the risks undertaken by the Advisor. The Board also noted that the Advisor pays the subadvisory fee, and that such fees are negotiated at arm's length with respect to the Subadvisor. In addition, the Board took into account that management had agreed to implement an overall fee waiver across the complex, including the fund, which is discussed further below. The Board reviewed information provided by the Advisor concerning the investment advisory fee charged by the Advisor or one of its advisory affiliates to other clients (including other funds in the John Hancock Fund Complex) having similar investment mandates, if any. The Board considered any differences between the Advisor's and Subadvisor's services to the fund and the services they provide to other comparable clients or funds. The Board concluded that the advisory fee paid with respect to the fund is reasonable in light of the nature, extent and quality of the services provided to the fund under the Advisory Agreement.
Profitability/Fall out benefits. In considering the costs of the services to be provided and the profits to be realized by the Advisor and its affiliates from the Advisor's relationship with the fund, the Board:
| (a) | reviewed financial information of the Advisor; |
| (b) | reviewed and considered information presented by the Advisor regarding the net profitability to the Advisor and its affiliates with respect to the fund; |
| (c) | received and reviewed profitability information with respect to the John Hancock Fund Complex as a whole and with respect to the fund; |
| (d) | received information with respect to the Advisor's allocation methodologies used in preparing the profitability data and considered that the advisor hired an independent third-party consultant to provide an analysis of the Advisor's allocation methodologies; |
| (e) | considered that the Advisor also provides administrative services to the fund on a cost basis pursuant to an administrative services agreement; |
| (f) | noted that the Advisor also derives reputational and other indirect benefits from providing advisory services to the fund; |
| (g) | noted that the subadvisory fees for the fund are paid by the Advisor and is negotiated at arm's length; |
| (h) | considered the Advisor's ongoing costs and expenditures necessary to improve services, meet new regulatory and compliance requirements, and adapt to other challenges impacting the fund industry; and |
| (i) | considered that the Advisor should be entitled to earn a reasonable level of profits in exchange for the level of services it provides to the fund and the risks that it assumes as Advisor, including entrepreneurial, operational, reputational, litigation and regulatory risk. |
Based upon its review, the Board concluded that the level of profitability, if any, of the Advisor and its affiliates from their relationship with the fund was reasonable and not excessive.
Economies of scale. In considering the extent to which the fund may realize any economies of scale and whether fee levels reflect these economies of scale for the benefit of the fund shareholders, the Board noted that the fund has a
SEMIANNUAL REPORT | JOHN HANCOCK HEDGED EQUITY & INCOME FUND 50
limited ability to increase its assets as a closed-end fund. The Board took into account management's discussions of the current advisory fee structure, and, as noted above, the services the Advisor provides in performing its functions under the Advisory Agreement and in supervising the Subadvisor.
The Board also considered potential economies of scale that may be realized by the fund as part of the John Hancock Fund Complex. Among them, the Board noted that the Advisor has contractually agreed to waive a portion of its management fee and/or reimburse expenses for certain funds of the John Hancock Fund Complex, including the fund (the participating portfolios). This waiver is based upon aggregate net assets of all the participating portfolios. The amount of the reimbursement is calculated daily and allocated among all the participating portfolios in proportion to the daily net assets of each fund. The Board considered the Advisor's overall operations and its ongoing investment in its business in order to expand the scale of, and improve the quality of, its operations that benefit the fund. The Board determined that the management fee structure for the fund was reasonable.
Approval of Subadvisory Agreement
In making its determination with respect to approval of the Subadvisory Agreement, the Board reviewed:
| (1) | information relating to the Subadvisor's business, including current subadvisory services to the fund (and other funds in the John Hancock Fund Complex); |
| (2) | the historical and current performance of the fund and comparative performance information relating to an applicable benchmark index and comparable funds; and |
| (3) | the subadvisory fee for the fund, and to the extent available, comparable fee information prepared by an independent third party provider of fund data; and |
| (4) | information relating to the nature and scope of any material relationships and their significant to the fund's Advisor and Subadvisor. |
Nature, extent, and quality of services. With respect to the services provided by the Subadvisor, the Board received information provided to the Board by the Subadvisor, including the Subadvisor's Form ADV, as well as took into account information presented throughout the past year. The Board considered the Subadvisor's current level of staffing and its overall resources, as well as received information relating to the Subadvisor's compensation program. The Board reviewed the Subadvisor's history and investment experience, as well as information regarding the qualifications, background, and responsibilities of the Subadvisor's investment and compliance personnel who provide services to the fund. The Board also considered, among other things, the Subadvisor's compliance program and any disciplinary history. The Board also considered the Subadvisor's risk assessment and monitoring process. The Board reviewed the Subadvisor's regulatory history, including whether it was involved in any regulatory actions or investigations as well as material litigation, and any settlements and amelioratory actions undertaken, as appropriate. The Board noted that the Advisor conducts regular, periodic reviews of the Subadvisor and its operations, including regarding investment processes and organizational and staffing matters. The Board also noted that the fund's CCO and his staff conduct regular, periodic compliance reviews with the Subadvisor and present reports to the Independent Trustees regarding the same, which includes evaluating the regulatory compliance systems of the Subadvisor and procedures reasonably designed to assure compliance with the federal securities laws. The Board also took into account the financial condition of the Subadvisor.
The Board considered the Subadvisor's investment process and philosophy. The Board took into account that the Subadvisor's responsibilities include the development and maintenance of an investment program for the fund that is consistent with the fund's investment objective, the selection of investment securities and the placement of orders for
SEMIANNUAL REPORT | JOHN HANCOCK HEDGED EQUITY & INCOME FUND 51
the purchase and sale of such securities, as well as the implementation of compliance controls related to performance of these services. The Board also received information with respect to the Subadvisor's brokerage policies and practices, including with respect to best execution and soft dollars.
Subadvisor compensation. In considering the cost of services to be provided by the Subadvisor and the profitability to the Subadvisor of its relationship with the fund, the Board noted that the fees under the Subadvisory Agreement are paid by the Advisor and not the fund.
The Board also relied on the ability of the Advisor to negotiate the Subadvisory Agreement with the Subadvisor, which is not affiliated with the Advisor, and the fees thereunder at arm's length. As a result, the costs of the services to be provided and the profits to be realized by the Subadvisor from its relationship with the Trust were not a material factor in the Board's consideration of the Subadvisory Agreement.
The Board also received information regarding the nature and scope (including their significance to the Advisor and its affiliates and to the Subadvisor) of any material relationships with respect to the Subadvisor, which include arrangements in which the Subadvisor or its affiliates provide advisory, distribution, or management services in connection with financial products sponsored by the Advisor or its affiliates, and may include other registered investment companies, a 529 education savings plan, managed separate accounts and exempt group annuity contracts sold to qualified plans. The Board also received information and took into account any other potential conflicts of interest the Advisor might have in connection with the Subadvisory Agreement.
In addition, the Board considered other potential indirect benefits that the Subadvisor and its affiliates may receive from the Subadvisor's relationship with the fund, such as the opportunity to provide advisory services to additional funds in the John Hancock Fund Complex and reputational benefits.
Subadvisory fees. The Board considered that the fund pays an advisory fee to the Advisor and that, in turn, the Advisor pays subadvisory fees to the Subadvisor. As noted above, the Board also considered the fund's subadvisory fee as compared to similarly situated investment companies deemed to be comparable to the fund as included in the report prepared by the independent third party provider of fund data, to the extent available. The Board noted that the limited size of the Lipper peer group was not sufficient for comparative purposes. The Board also took into account the subadvisory fee paid by the Advisor to the Subadvisor with respect to the fund and compared them to fees charged by the Subadvisor to manage other subadvised portfolios and portfolios not subject to regulation under the 1940 Act, as applicable.
Subadvisor performance. As noted above, the Board considered the fund's performance as compared to the fund's peer group and the benchmark index and noted that the Board reviews information about the fund's performance results at its regularly scheduled meetings. The Board noted the Advisor's expertise and resources in monitoring the performance, investment style and risk-adjusted performance of the Subadvisor. The Board was mindful of the Advisor's focus on the Subadvisor's performance. The Board also noted the Subadvisor's long-term performance record for similar accounts, as applicable.
The Board's decision to approve the Subadvisory Agreement was based on a number of determinations, including the following:
| (1) | the Subadvisor has extensive experience and demonstrated skills as a manager; |
| (2) | the fund's performance, based on net asset value, has generally been in line with or outperformed the historical performance of comparable funds; and |
SEMIANNUAL REPORT | JOHN HANCOCK HEDGED EQUITY & INCOME FUND 52
| (3) | the subadvisory fees are reasonable in relation to the level and quality of services being provided under the Subadvisory Agreement. |
* * *
Based on the Board's evaluation of all factors that the Board deemed to be material, including those factors described above, the Board, including the Independent Trustees, concluded that renewal of the Advisory Agreement and the Subadvisory Agreement would be in the best interest of the fund and its shareholders. Accordingly, the Board, and the Independent Trustees voting separately, approved the Advisory Agreement and Subadvisory Agreement for an additional one-year period.
SEMIANNUAL REPORT | JOHN HANCOCK HEDGED EQUITY & INCOME FUND 53
| | |
Trustees
Hassell H. McClellan,Chairperson
Steven R. Pruchansky,Vice Chairperson
Andrew G. Arnott†
Charles L. Bardelis*
James R. Boyle
Peter S. Burgess*
William H. Cunningham
Grace K. Fey
Marianne Harrison†
Theron S. Hoffman*
Deborah C. Jackson
James M. Oates
Gregory A. Russo
Officers
Andrew G. Arnott
President
Francis V. Knox, Jr.
Chief Compliance Officer
Charles A. Rizzo
Chief Financial Officer
Salvatore Schiavone
Treasurer
Christopher (Kit) Sechler**
Secretary and Chief Legal Officer
| Investment advisor
John Hancock Investment Management LLC
Subadvisor
Wellington Management Company LLP
Portfolio Managers
Roberto J. Isch, CFA
Gregg R. Thomas, CFA
Custodian
State Street Bank and Trust Company
Transfer agent
Computershare Shareowner Services, LLC
Legal counsel
K&L Gates LLP
Stock symbol
Listed New York Stock Exchange: HEQ
|
* Member of the Audit Committee
† Non-Independent Trustee
** Effective 9-13-18
The fund's proxy voting policies and procedures, as well as the fund proxy voting record for the most recent twelve-month period ended June 30, are available free of charge on the Securities and Exchange Commission (SEC) website at sec.gov or on our website.
All of the fund's holdings as of the end of the third month of every fiscal quarter are filed with the SEC on Form N-PORT within 60 days of the end of the fiscal quarter. The fund's Form N-PORT filings are available on our website and the SEC's website, sec.gov.
We make this information on your fund, as well asmonthly portfolio holdings, and other fund details available on our website at jhinvestments.com or by calling 800-852-0218.
| | | | |
| | You can also contact us: |
| | 800-852-0218
jhinvestments.com | Regular mail:
Computershare
P.O. Box 505000
Louisville, KY 40233
| Express mail:
Computershare
462 South 4th Street, Suite 1600
Louisville, KY 40202
|
SEMIANNUAL REPORT | JOHN HANCOCK HEDGED EQUITY & INCOME FUND 54
John Hancock family of funds
| | | |
DOMESTIC EQUITY FUNDS
Blue Chip Growth
Classic Value
Disciplined Value
Disciplined Value Mid Cap
Equity Income
Financial Industries
Fundamental All Cap Core
Fundamental Large Cap Core
New Opportunities
Regional Bank
Small Cap Core
Small Cap Growth
Small Cap Value
U.S. Global Leaders Growth
U.S. Quality Growth
Value Equity
GLOBAL AND INTERNATIONAL EQUITY FUNDS
Disciplined Value International
Emerging Markets
Emerging Markets Equity
Fundamental Global Franchise
Global Equity
Global Shareholder Yield
Global Thematic Opportunities
International Dynamic Growth
International Growth
International Small Company
| | INCOME FUNDS
Bond
California Tax-Free Income
Emerging Markets Debt
Floating Rate Income
Government Income
High Yield
High Yield Municipal Bond
Income
Investment Grade Bond
Money Market
Short Duration Bond
Short Duration Credit Opportunities
Spectrum Income
Strategic Income Opportunities
Tax-Free Bond
ALTERNATIVE AND SPECIALTY FUNDS
Absolute Return Currency
Alternative Asset Allocation
Disciplined Alternative Yield
Diversified Macro
Global Absolute Return Strategies
Infrastructure
Seaport Long/Short
|
A fund's investment objectives, risks, charges, and expenses should be considered carefully before investing. The prospectus contains this and other important information about the fund. To obtain a prospectus, contact your financial professional, call John Hancock Investment Management at 800-225-5291, or visit our website at jhinvestments.com. Please read the prospectus carefully before investing or sending money.
| | | |
ASSET ALLOCATION
Balanced
Income Allocation
Multi-Index Lifetime Portfolios
Multi-Index Preservation Portfolios
Multimanager Lifestyle Portfolios
Multimanager Lifetime Portfolios
Retirement Income 2040
EXCHANGE-TRADED FUNDS
John Hancock Multifactor Consumer Discretionary ETF
John Hancock Multifactor Consumer Staples ETF
John Hancock Multifactor Developed International ETF
John Hancock Multifactor Emerging Markets ETF
John Hancock Multifactor Energy ETF
John Hancock Multifactor Financials ETF
John Hancock Multifactor Healthcare ETF
John Hancock Multifactor Industrials ETF
John Hancock Multifactor Large Cap ETF
John Hancock Multifactor Materials ETF
John Hancock Multifactor Media and
Communications ETF
John Hancock Multifactor Mid Cap ETF
John Hancock Multifactor Small Cap ETF
John Hancock Multifactor Technology ETF
John Hancock Multifactor Utilities ETF
| | ENVIRONMENTAL, SOCIAL, AND
GOVERNANCE FUNDS
ESG All Cap Core
ESG Core Bond
ESG International Equity
ESG Large Cap Core
CLOSED-END FUNDS
Financial Opportunities
Hedged Equity & Income
Income Securities Trust
Investors Trust
Preferred Income
Preferred Income II
Preferred Income III
Premium Dividend
Tax-Advantaged Dividend Income
Tax-Advantaged Global Shareholder Yield
|
John Hancock Multifactor ETF shares are bought and sold at market price (not NAV), and are not individually redeemed
from the fund. Brokerage commissions will reduce returns.
John Hancock ETFs are distributed by Foreside Fund Services, LLC, and are subadvised by Dimensional Fund Advisors LP.
Foreside is not affiliated with John Hancock Investment Management Distributors, LLC or Dimensional Fund Advisors LP.
Dimensional Fund Advisors LP receives compensation from John Hancock in connection with licensing rights to the
John Hancock Dimensional indexes. Dimensional Fund Advisors LP does not sponsor, endorse, or sell, and makes no
representation as to the advisability of investing in, John Hancock Multifactor ETFs.
John Hancock Investment Management
A trusted brand
John Hancock Investment Management is a premier asset manager
representing one of America's most trusted brands, with a heritage of
financial stewardship dating back to 1862. Helping our shareholders
pursue their financial goals is at the core of everything we do. It's why
we support the role of professional financial advice and operate with
the highest standards of conduct and integrity.
A better way to invest
We serve investors globally through a unique multimanager approach:
We search the world to find proven portfolio teams with specialized
expertise for every strategy we offer, then we apply robust investment
oversight to ensure they continue to meet our uncompromising
standards and serve the best interests of our shareholders.
Results for investors
Our unique approach to asset management enables us to provide
a diverse set of investments backed by some of the world's best
managers, along with strong risk-adjusted returns across asset classes.
John Hancock Investment Management, LLC
200 Berkeley Street n Boston, MA 02116-5010 n 800-852-0218 n jhinvestments.com
ITEM 2. CODE OF ETHICS.
Not applicable at this time.
ITEM 3. AUDIT COMMITTEE FINANCIAL EXPERT.
Not applicable at this time.
ITEM 4. PRINCIPAL ACCOUNTANT FEES AND SERVICES.
Not applicable at this time.
ITEM 5. AUDIT COMMITTEE OF LISTED REGISTRANTS.
Not applicable at this time.
ITEM 6. SCHEDULE OF INVESTMENTS.
(a) Not applicable.
(b) Not applicable.
ITEM 7. DISCLOSURE OF PROXY VOTING POLICIES AND PROCEDURES FOR CLOSED-END MANAGEMENT INVESTMENT COMPANIES.
Not applicable.
ITEM 8. PORTFOLIO MANAGERS OF CLOSED-END MANAGEMENT INVESTMENT COMPANIES.
(a) Not applicable.
ITEM 9. PURCHASES OF EQUITY SECURITIES BY CLOSED-END MANAGEMENT INVESTMENT COMPANY AND AFFILIATED PURCHASERS.
(a) Not applicable.
(b)
REGISTRANT PURCHASES OF EQUITY SECURITIES
| | | Total number of shares | Maximum number of |
| Total number of | Average | purchased as part of | shares that may yet be |
| shares | price per | publicly announced | purchased under the |
| Period | purchased | share | plans* | plans |
| 18-Dec | - | - | - | 1,221,396 |
| 19-Jan | - | - | - | 1,221,396 |
| 19-Feb | - | - | - | 1,221,396 |
| 19-Mar | - | - | - | 1,221,396 |
| 19-Apr | - | - | - | 1,221,396 |
| 19-May | - | - | - | 1,221,396 |
| 19-Jun | - | - | - | 1,221,396 |
| Total | - | - | - | |
| *On December 6, 2011, the Board of Trustees approved a share repurchase plan (the Repurchase Plan). Under the Repurchase Plan, the Fund was allowed to purchase, in the open market, up to 10% of its outstanding common shares between January 1, 2019 and December 31, 2019 (based on common shares outstanding as of December 31, 2018). |
ITEM 10. SUBMISSION OF MATTERS TO A VOTE OF SECURITY HOLDERS.
There were no material changes to previously disclosed John Hancock Funds – Nominating and Governance Committee Charter.
ITEM 11. CONTROLS AND PROCEDURES.
(a) Based upon their evaluation of the registrant's disclosure controls and procedures as conducted within 90 days of the filing date of this Form N-CSR, the registrant's principal executive officer and principal financial officer have concluded that those disclosure controls and procedures provide reasonable assurance that the material information required to be disclosed by the registrant on this report is recorded, processed, summarized and reported within the time periods specified in the Securities and Exchange Commission's rules and forms.
(b) There were no changes in the registrant's internal control over financial reporting that occurred during the period covered by this report that have materially affected, or are reasonably likely to materially affect, the registrant's internal control over financial reporting.
ITEM 12. DISCLOSURE OF SECURITIES LENDING ACTIVITIES FOR CLOSED-END MANAGEMENT INVESTMENT COMPANIES.
Not applicable.
ITEM 13. EXHIBITS.
(a) Separate certifications for the registrant's principal executive officer and principal financial officer, as required by Section 302 of the Sarbanes-Oxley Act of 2002 and Rule 30a-2(a) under the Investment Company Act of 1940, are attached.
(b)(1) Separate certifications for the registrant's principal executive officer and principal financial officer, as required by 18 U.S.C. Section 1350, as adopted pursuant to Section 906 of the Sarbanes-Oxley Act of 2002, and Rule 30a-2(b) under the Investment Company Act of 1940, are attached. The certifications furnished pursuant to this paragraph are not deemed to be "filed" for purposes of Section 18 of the Securities Exchange Act of 1934, or otherwise subject to the liability of that section. Such certifications are not deemed to be incorporated by reference into any filing under the Securities Act of 1933 or the Securities Exchange Act of 1934, except to the extent that the Registrant specifically incorporates them by reference.
(c)(1) Proxy Voting Policies and Procedures are attached.
(c)(2) Submission of Matters to a Vote of Security Holders is attached. See attached "John Hancock Funds - Governance Committee Charter".
(c)(3) Registrant’s notice to shareholders pursuant to Registrant’s exemptive order granting an exemption from Section 19(b) of the Investment Company Act of 1940, as amended and Rule 19b-1 thereunder regarding distributions made pursuant to the Registrant’s Managed Distribution Plan.
SIGNATURES
Pursuant to the requirements of the Securities Exchange Act of 1934 and the Investment Company Act of 1940, the registrant has duly caused this report to be signed on its behalf by the undersigned, thereunto duly authorized.
John Hancock Hedged Equity & Income Fund
| By: | /s/ Andrew Arnott |
| | Andrew Arnott |
| President |
| |
| |
| Date: | August 21, 2019 |
Pursuant to the requirements of the Securities Exchange Act of 1934 and the Investment Company Act of 1940, this report has been signed below by the following persons on behalf of the registrant and in the capacities and on the dates indicated.
| By: | /s/ Andrew Arnott |
| | Andrew Arnott |
| President |
| |
| |
| Date: | August 21, 2019 |
| By: | /s/ Charles A. Rizzo |
| | Charles A. Rizzo |
| Chief Financial Officer |
| |
| |
| Date: | August 21, 2019 |