UNITED STATES
SECURITIES AND EXCHANGE COMMISSION
Washington, D.C. 20549
FORM N-CSR
CERTIFIED SHAREHOLDER REPORT OF REGISTERED
MANAGEMENT INVESTMENT COMPANIES
Investment Company Act file number811- 22441
John Hancock Hedged Equity & Income Fund
(Exact name of registrant as specified in charter)
200 Berkeley Street, Boston, Massachusetts 02116
(Address of principal executive offices) (Zip code)
Salvatore Schiavone
Treasurer
200 Berkeley Street
Boston, Massachusetts 02116
(Name and address of agent for service)
Registrant's telephone number, including area code:617-663-4497
| Date of fiscal year end: | December 31 |
| | |
| | |
| Date of reporting period: | December 31, 2019 |
ITEM 1. REPORTS TO STOCKHOLDERS.
John Hancock
Hedged Equity & Income Fund
Ticker: HEQ
Annual report 12/31/19
Beginning on January 1, 2021, as permitted by regulations adopted by the Securities and Exchange Commission, paper copies of the fund's shareholder reports such as this one will no longer be sent by mail, unless you specifically request paper copies of the reports from the transfer agent or from your financial intermediary. Instead, the reports will be made available on our website, and you will be notified by mail each time a report is posted and be provided with a website link to access the report.
If you have already elected to receive shareholder reports electronically, you will not be affected by this change and you do not need to take any action. You may elect to receive shareholder reports and other communications electronically by calling the transfer agent, Computershare, at 800-852-0218, by going to "Communication Preferences" at computershare.com/investor, or by contacting your financial intermediary.
You may elect to receive all reports in paper, free of charge, at any time. You can inform the transfer agent or your financial intermediary that you wish to continue receiving paper copies of your shareholder reports by following the instructions listed above. Your election to receive reports in paper will apply to all funds held with John Hancock Investment Management or your financial intermediary.

Managed distribution plan
The fund has adopted a managed distribution plan (Plan). Under the Plan, the fund makes quarterly distributions of an amount equal to $0.376 per share, which will be paid quarterly until further notice. The fund may make additional distributions: (i) for purposes of not incurring federal income tax at the fund level of investment company taxable income and net capital gain, if any, not included in such regular distributions; and (ii) for purposes of not incurring federal excise tax on ordinary income and capital gain net income, if any, not included in such regular distributions.
The Plan provides that the Board of Trustees of the fund may amend the terms of the Plan or terminate the Plan at any time without prior notice to the fund's shareholders. The Plan is subject to periodic review by the fund's Board of Trustees.
You should not draw any conclusions about the fund's investment performance from the amount of the fund's distributions or from the terms of the fund's Plan. The fund's total return at NAV is presented in the Financial highlights section.
With each distribution that does not consist solely of net income, the fund will issue a notice to shareholders and an accompanying press release that will provide detailed information regarding the amount and composition of the distribution and other related information. The amounts and sources of distributions reported in the notice to shareholders are only estimates and are not provided for tax reporting purposes. The actual amounts and sources of the amounts for tax reporting purposes will depend upon the fund's investment experience during the remainder of its fiscal year and may be subject to changes based on tax regulations. The fund will send you a Form 1099-DIV for the calendar year that will tell you how to report these distributions for federal income tax purposes. The fund may, at times, distribute more than its net investment income and net realized capital gains; therefore, a portion of your distribution may result in a return of capital. A return of capital may occur, for example, when some or all of the money that you invested in the fund is paid back to you. A return of capital does not necessarily reflect the fund's investment performance and should not be confused with yield or income.
A message to shareholders
Dear shareholder,
Global financial markets delivered robust returns during the 12 months ended December 31, 2019. Stocks were particularly strong in the United States, where they delivered double-digit returns across most economic sectors. Investors benefited from a combination of low inflation, accommodative central bank policy, healthy fundamentals, and corporate buybacks of stock. Investors in non-U.S. equities also saw strong gains, fueled in part by similarly supportive monetary policy and some signs of strength in developing markets.
After such a strong year of returns—in a historically long bull market—investors are prudent to consider the risks to future gains. Growth has slowed in the United States, with some negative data in manufacturing reflecting concerns over international trade and wavering business confidence. Indeed, trade disputes and other geopolitical tensions may continue to create uncertainty among businesses and skepticism among investors. Your financial advisor can helpposition your portfolio so that it's sufficiently diversified to meet your long-term objectives and to withstand the inevitable bouts of market volatility along the way.
On behalf of everyone at John Hancock Investment Management, I'd like to take this opportunity to welcome new shareholders and thank existing shareholders for the continued trust you've placed in us.
Sincerely,
Andrew G. Arnott
President and CEO,
John Hancock Investment Management
Head of Wealth and Asset Management,
United States and Europe
This commentary reflects the CEO's views as of this report's period end and are subject to change at any time. Diversification does not guarantee investment returns and does not eliminate risk of loss. All investments entail risks, including the possible loss of principal. For more up-to-date information, you can visit our website at jhinvestments.com.
John Hancock
Hedged Equity & Income Fund
Table of contents
| | | |
| 2 | | Your fund at a glance |
| 5 | | Manager's discussion of fund performance |
| 7 | | Fund's investments |
| 34 | | Financial statements |
| 37 | | Financial highlights |
| 38 | | Notes to financial statements |
| 49 | | Report of independent registered public accounting firm |
| 50 | | Tax information |
| 51 | | Additional information |
| 54 | | Trustees and Officers |
| 58 | | More information |
ANNUAL REPORT | JOHN HANCOCK HEDGED EQUITY & INCOME FUND 1
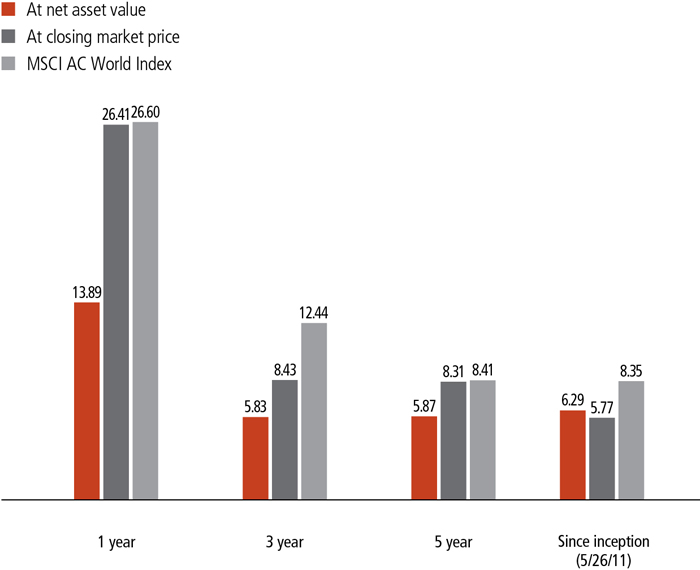
INVESTMENT OBJECTIVE
The fund seeks to provide total return with a focus on current income and gains and also consisting of long-term capital appreciation.
AVERAGE ANNUAL TOTAL RETURNS AS OF 12/31/19 (%)
The MSCI All Country (AC) World Index is a free float-adjusted market-capitalization-weighted index that is designed to measure the equity market performance of developed and emerging markets.
It is not possible to invest directly in an index. Index figures do not reflect expenses and sales charges, which would result in lower returns.
The performance data contained within this material represents past performance, which does not guarantee future results.
Investment returns and principal value will fluctuate and a shareholder may sustain losses. Further, the fund's performance at net asset value (NAV) is different from the fund's performance at closing market price because the closing market price is subject to the dynamics of secondary market trading. Market risk may be increased when shares are purchased at a premium to NAV or sold at a discount to NAV. Current month-end performance may be higher or lower than the performance cited. The fund's most recent performance can be found at jhinvestment.com or by calling 800-852-0218.
ANNUAL REPORT | JOHN HANCOCK HEDGED EQUITY & INCOME FUND 2
PERFORMANCE HIGHLIGHTS OVER THE LAST TWELVE MONTHS
Easing economic policy and trade tensions boosted equities
Global stocks delivered positive returns, spurred by accommodative economic policy from global central banks and progress in trade negotiations between the United States and China.
The fund's stock selection hurt relative results
The fund had a positive return but underperformed its comparative index, the MSCI All Country World Index, owing primarily to stock selection and sector allocation within its equity strategy.
Options and hedging strategies also detracted from performance
The fund's equity option overlay and beta hedge strategy also detracted from relative results, while its high-yield fixed-income exposure had a positive absolute contribution.
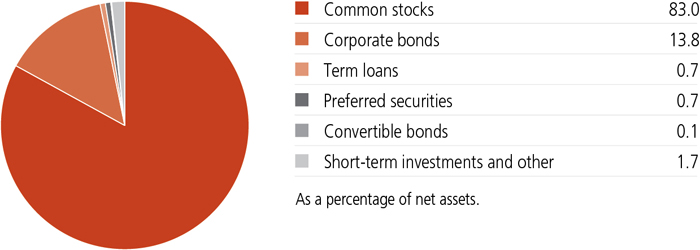
PORTFOLIO COMPOSITION AS OF 12/31/19 (%)
ANNUAL REPORT | JOHN HANCOCK HEDGED EQUITY & INCOME FUND 3
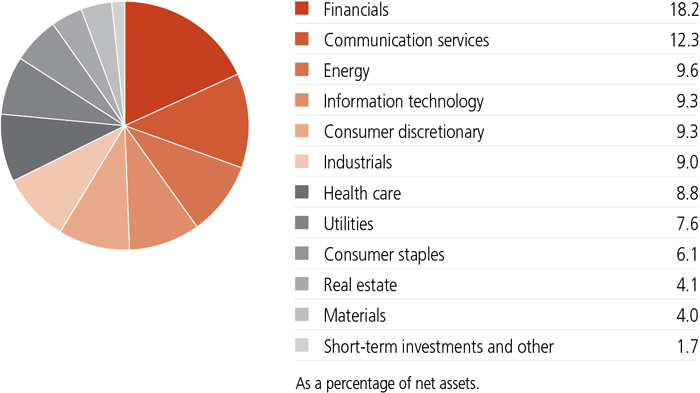
SECTOR COMPOSITION AS OF 12/31/19 (%)
A note about risks
As is the case with all exchange-listed closed-end funds, shares of this fund may trade at a discount or a premium to the fund's net asset value (NAV). An investment in the fund is subject to investment and market risks, including the possible loss of the entire principal invested. There is no guarantee prior distribution levels will be maintained, and distributions may include a substantial return of capital. A return of capital is the return of all or a portion of a shareholder's investment in the fund. For the fiscal year ended December 31,2019, the fund's aggregate distributions included a return of capital of $0.83 per share, or 55% of aggregate distributions, which could impact the tax treatment of a subsequent sale of fund shares. See the Financial highlights and notes to the financial statements for details of the return of capital and risks associated with distributions made by the fund. The fund's prospectus includes additional information regarding returns of capital and the risks associated with distributions made by the fund, including potential tax implications. Fixed-income investments are subject to interest-rate risk; their value will normally decline as interest rates rise. An issuer of securities held by the fund may default, have its credit rating downgraded, or otherwise perform poorly, which may affect fund performance. Derivatives transactions, including hedging and other strategic transactions, may increase a fund's volatility and could produce disproportionate losses, potentially more than the fund's principal investment. Liquidity—the extent to which a security may be sold or a derivative position closed without negatively affecting its market value—may be impaired by reduced trading volume, heightened volatility, rising interest rates, and other market conditions. Foreign investing, especially in emerging markets, has additional risks, such as currency and market volatility and political and social instability. Investments in higher-yielding, lower-rated securities include a higher risk of default. The primary risks associated with the use of futures contracts and options are imperfect correlation, unanticipated market movement, and counterparty risk. Cybersecurity incidents may allow an unauthorized party to gain access to fund assets, customer data, or proprietary information, or cause a fund or its service providers to suffer data corruption or lose operational functionality. Similar incidents affecting issuers of a fund's securities may negatively impact performance.
ANNUAL REPORT | JOHN HANCOCK HEDGED EQUITY & INCOME FUND 4
Manager's discussion of fund performance
What factors drove global equities' strong results during the 12 months ended December 31, 2019?
Volatility led by macro themes, accommodative economic policy, and the state of trade negotiations between the United States and China drove markets during the period. Stocks rose in the first quarter, due to productive trade talks and dovish rhetoric and policy actions by the major central banks. They continued to move higher in the second quarter, overcoming escalating trade tensions and Brexit uncertainty. Interest-rate cuts from the U.S. Federal Reserve and a sweeping stimulus package from the European Central Bank boosted equities in a volatile third quarter and set the stage for a strong finish to the year. Waning recession fears, forecasts for improving global growth in 2020, and an easing of trade tensions in the fourth quarter helped to bolster risk appetite.
What trends led to the fund's underperformance?
Weak security selection—particularly in the communication services, consumer discretionary, and financials sectors—drove the fund's underperformance of its benchmark, the MSCI All Country World Index. Sector allocation also detracted from relative performance, particularly an underweight allocation to the information technology sector and overweight allocations to the energy and utilities sectors.
| | | | | |
TOP 10 HOLDINGS
AS OF 12/31/19 (%) | | COUNTRY COMPOSITION
AS OF 12/31/19 (%) |
| TOTAL SA | 1.2 | | United States | 41.3 |
| Verizon Communications, Inc. | 1.0 | | Japan | 10.2 |
| Philip Morris International, Inc. | 1.0 | | United Kingdom | 7.0 |
| Pfizer, Inc. | 1.0 | | France | 6.2 |
| UBS Group AG | 1.0 | | Canada | 5.3 |
| Mitsubishi UFJ Financial Group, Inc. | 1.0 | | Netherlands | 4.0 |
| Bank of America Corp. | 1.0 | | Switzerland | 3.3 |
Taiwan Semiconductor
Manufacturing Company, Ltd. | 0.9 | | Germany | 2.2 |
| AXA SA | 0.9 | | Australia | 1.8 |
| TC Energy Corp. | 0.9 | | China | 1.5 |
| TOTAL | 9.9 | | Other countries | 17.2 |
| | | | TOTAL | 100.0 |
| As a percentage of net assets. | | As a percentage of net assets. |
| Cash and cash equivalents are not included. | | |
ANNUAL REPORT | JOHN HANCOCK HEDGED EQUITY & INCOME FUND 5
The fund's options and beta hedge strategies, which are designed to generate extra income and reduce equity exposure through selling the MSCI EAFE Index, FTSE Index, and STOXX 50 Index, also detracted from performance, while its global high-yield fixed-income exposure contributed to results over the year. The top relative detractors included underweight exposures to Apple, Inc. and Microsoft Corp. The top relative contributors were wireless and communications chipmaker QUALCOMM, Inc. and Zurich Insurance Group AG. We sold Zurich during the period.
How was the fund positioned at the end of the period?
The fund's largest overweights were in utilities and energy, while the largest underweights were in information technology and healthcare. From a regional perspective, the strategy ended the period most overweight in Europe and most underweight in North America. Macro challenges created a volatile backdrop for the market in 2019 and we expect this to persist into the new year. We note an unusual lack of consensus across the industry around the macroeconomic outlook, which leads to a wide range of potential outcomes. As a result, we believe that a multistrategy factor-based approach to capital allocation can help manage risk amid uncertainty and reduce excess drawdown in the event of market shocks.
Can you tell us about a manager change?
Effective February 21, 2019, Roberto J. Isch, CFA, joined the management team.
MANAGED BY
| | |
 | Gregg R. Thomas, CFA
On the fund since 2011
Investing since 1993 |
 | Roberto J. Isch, CFA
On the fund since 2019
Investing since 2006 |

The views expressed in this report are exclusively those of Gregg R. Thomas, CFA, Wellington Management Company LLP, and are subject to change. They are not meant as investment advice. Please note that the holdings discussed in this report may not have been held by the fund for the entire period. Portfolio composition is subject to review in accordance with the fund's investment strategy and may vary in the future. Current and future portfolio holdings are subject to risk.
ANNUAL REPORT | JOHN HANCOCK HEDGED EQUITY & INCOME FUND 6
AS OF 12-31-19
| | | | | Shares | Value |
| Common stocks 83.0% | | | | | $150,670,783 |
| (Cost $155,227,272) | | | | | |
| Communication services 9.8% | | | 17,741,599 |
| Diversified telecommunication services 5.0% | | | |
| AT&T, Inc. | | | 11,966 | 467,631 |
| BCE, Inc. | | | 14,303 | 662,638 |
| BT Group PLC | | | 452,313 | 1,152,579 |
| CenturyLink, Inc. | | | 23,227 | 306,829 |
| China Telecom Corp., Ltd., H Shares | | | 406,016 | 167,274 |
| China Unicom Hong Kong, Ltd. | | | 211,210 | 198,880 |
| Hellenic Telecommunications Organization SA | | | 69,772 | 1,116,815 |
| Koninklijke KPN NV | | | 386,641 | 1,144,216 |
| KT Corp. | | | 6,755 | 157,623 |
| Magyar Telekom Telecommunications PLC | | | 51,006 | 77,153 |
| O2 Czech Republic AS | | | 76,525 | 789,789 |
| Orange SA | | | 42,664 | 626,999 |
| Proximus SADP | | | 2,820 | 80,804 |
| Spark New Zealand, Ltd. | | | 31,799 | 92,726 |
| Telefonica Deutschland Holding AG | | | 62,932 | 182,560 |
| Verizon Communications, Inc. | | | 30,135 | 1,850,289 |
| Entertainment 0.3% | | | |
| Avex, Inc. | | | 5,800 | 66,809 |
| DeNA Company, Ltd. | | | 5,020 | 80,908 |
| Konami Holdings Corp. | | | 967 | 39,736 |
| NHN Corp. (A) | | | 480 | 27,635 |
| Nintendo Company, Ltd. | | | 137 | 54,795 |
| The Walt Disney Company | | | 1,665 | 240,809 |
| Interactive media and services 0.9% | | | |
| Alphabet, Inc., Class A (A) | | | 520 | 696,483 |
| Baidu, Inc., ADR (A) | | | 312 | 39,437 |
| Facebook, Inc., Class A (A) | | | 2,088 | 428,562 |
| Gree, Inc. | | | 24,510 | 110,743 |
| InterActiveCorp (A) | | | 258 | 64,270 |
| Kakaku.com, Inc. | | | 1,591 | 40,623 |
| SINA Corp. (A) | | | 528 | 21,083 |
| Z Holdings Corp. | | | 44,445 | 187,652 |
| Media 1.4% | | | |
| Comcast Corp., Class A | | | 33,408 | 1,502,358 |
| Criteo SA, ADR (A) | | | 4,152 | 71,954 |
| Eutelsat Communications SA | | | 3,861 | 62,910 |
| Fuji Media Holdings, Inc. | | | 4,275 | 60,698 |
| Gendai Agency, Inc. | | | 1,360 | 5,254 |
| 7 | JOHN HANCOCK HEDGED EQUITY & INCOME FUND | ANNUAL REPORT | SEE NOTES TO FINANCIAL STATEMENTS |
| | | | | Shares | Value |
| Communication services (continued) | | | |
| Media (continued) | | | |
| Metropole Television SA | | | 5,260 | $99,187 |
| Nippon Television Holdings, Inc. | | | 8,170 | 108,998 |
| RTL Group SA | | | 4,867 | 239,806 |
| SES SA | | | 5,030 | 70,700 |
| Telenet Group Holding NV | | | 2,803 | 126,003 |
| Television Francaise 1 | | | 13,880 | 115,694 |
| TV Asahi Holdings Corp. | | | 5,240 | 96,755 |
| Zee Entertainment Enterprises, Ltd. | | | 18,725 | 76,575 |
| Wireless telecommunication services 2.2% | | | |
| China Mobile, Ltd. | | | 83,601 | 706,416 |
| Intouch Holdings PCL | | | 30,935 | 59,065 |
| KDDI Corp. | | | 34,900 | 1,041,288 |
| Millicom International Cellular SA | | | 25,514 | 1,225,281 |
| Mobile TeleSystems PJSC, ADR | | | 22,955 | 232,993 |
| MTN Group, Ltd. | | | 11,145 | 65,701 |
| NTT DOCOMO, Inc. | | | 3,126 | 87,078 |
| Orange Belgium SA | | | 3,779 | 87,768 |
| Softbank Corp. | | | 16,427 | 220,281 |
| VEON, Ltd. | | | 45,662 | 115,525 |
| Vodafone Group PLC | | | 45,824 | 88,961 |
| Consumer discretionary 6.9% | | | 12,428,280 |
| Auto components 1.0% | | | |
| Aisan Industry Company, Ltd. | | | 2,680 | 19,309 |
| Bridgestone Corp. | | | 5,711 | 212,164 |
| Exedy Corp. | | | 4,455 | 100,779 |
| Fuyao Glass Industry Group Company, Ltd., H Shares (B) | | | 56,585 | 173,262 |
| NOK Corp. | | | 8,965 | 133,720 |
| Sumitomo Riko Company, Ltd. | | | 6,080 | 54,849 |
| Tachi-S Company, Ltd. | | | 4,340 | 56,544 |
| The Yokohama Rubber Company, Ltd. | | | 33,746 | 654,501 |
| Tokai Rika Company, Ltd. | | | 5,890 | 114,780 |
| Toyoda Gosei Company, Ltd. | | | 5,125 | 127,968 |
| Toyota Boshoku Corp. | | | 2,480 | 39,821 |
| Unipres Corp. | | | 7,000 | 98,227 |
| Automobiles 1.8% | | | |
| Daimler AG | | | 5,655 | 312,633 |
| Dongfeng Motor Group Company, Ltd., H Shares | | | 177,960 | 167,422 |
| Ford Motor Company | | | 26,073 | 242,479 |
| Honda Motor Company, Ltd. | | | 12,800 | 362,260 |
| Isuzu Motors, Ltd. | | | 78,600 | 929,112 |
| Kia Motors Corp. (A) | | | 18,498 | 706,448 |
| SEE NOTES TO FINANCIAL STATEMENTS | ANNUAL REPORT | JOHN HANCOCK HEDGED EQUITY & INCOME FUND | 8 |
| | | | | Shares | Value |
| Consumer discretionary (continued) | | | |
| Automobiles (continued) | | | |
| Mitsubishi Motors Corp. | | | 19,220 | $80,114 |
| Nissan Motor Company, Ltd. | | | 51,587 | 298,933 |
| Renault SA | | | 3,197 | 151,817 |
| Diversified consumer services 0.2% | | | |
| Allstar Co-Invest LLC (A)(C)(D) | | | 236,300 | 92,157 |
| Benesse Holdings, Inc. | | | 2,000 | 52,569 |
| H&R Block, Inc. | | | 6,366 | 149,474 |
| Hotels, restaurants and leisure 0.6% | | | |
| Carnival Corp. | | | 2,036 | 103,490 |
| Chipotle Mexican Grill, Inc. (A) | | | 81 | 67,806 |
| Las Vegas Sands Corp. | | | 4,717 | 325,662 |
| OPAP SA | | | 19,480 | 253,445 |
| Starbucks Corp. | | | 2,537 | 223,053 |
| Yum! Brands, Inc. | | | 1,193 | 120,171 |
| Household durables 1.6% | | | |
| Funai Electric Company, Ltd. (A) | | | 9,123 | 58,912 |
| Newell Brands, Inc. | | | 36,051 | 692,900 |
| Nikon Corp. | | | 8,835 | 108,049 |
| Persimmon PLC | | | 2,823 | 100,835 |
| Sekisui House, Ltd. | | | 31,769 | 678,422 |
| Taylor Wimpey PLC | | | 177,647 | 455,499 |
| Woongjin Coway Company, Ltd. | | | 9,803 | 788,110 |
| Internet and direct marketing retail 0.5% | | | |
| Alibaba Group Holding, Ltd., ADR (A) | | | 789 | 167,347 |
| Amazon.com, Inc. (A) | | | 376 | 694,788 |
| Qliro Group AB (A) | | | 22,910 | 17,099 |
| Leisure products 0.0% | | | |
| Sankyo Company, Ltd. | | | 2,060 | 68,418 |
| Multiline retail 0.2% | | | |
| Kohl's Corp. | | | 1,766 | 89,978 |
| Macy's, Inc. | | | 5,936 | 100,912 |
| Marks & Spencer Group PLC | | | 34,043 | 96,528 |
| Specialty retail 0.8% | | | |
| CECONOMY AG (A) | | | 13,941 | 84,277 |
| Halfords Group PLC | | | 23,425 | 52,700 |
| Kingfisher PLC | | | 50,663 | 145,845 |
| L Brands, Inc. | | | 2,418 | 43,814 |
| Nishimatsuya Chain Company, Ltd. | | | 7,660 | 65,772 |
| Shimamura Company, Ltd. | | | 1,650 | 125,439 |
| The Gap, Inc. | | | 4,109 | 72,647 |
| The Home Depot, Inc. | | | 3,983 | 869,808 |
| Xebio Holdings Company, Ltd. | | | 7,025 | 84,830 |
| 9 | JOHN HANCOCK HEDGED EQUITY & INCOME FUND | ANNUAL REPORT | SEE NOTES TO FINANCIAL STATEMENTS |
| | | | | Shares | Value |
| Consumer discretionary (continued) | | | |
| Textiles, apparel and luxury goods 0.2% | | | |
| 361 Degrees International, Ltd. | | | 199,300 | $36,342 |
| Daphne International Holdings, Ltd. (A) | | | 272,250 | 5,068 |
| Geox SpA | | | 18,989 | 25,183 |
| Pandora A/S | | | 1,108 | 48,185 |
| Sanyo Shokai, Ltd. | | | 3,660 | 46,334 |
| Tapestry, Inc. | | | 6,647 | 179,270 |
| Consumer staples 5.4% | | | 9,862,371 |
| Beverages 0.2% | | | |
| Anadolu Efes Biracilik Ve Malt Sanayii AS | | | 14,420 | 55,952 |
| Coca-Cola Icecek AS | | | 9,312 | 60,514 |
| PepsiCo, Inc. | | | 1,917 | 261,996 |
| Food and staples retailing 0.2% | | | |
| Cawachi, Ltd. | | | 2,270 | 45,993 |
| Costco Wholesale Corp. | | | 328 | 96,406 |
| J Sainsbury PLC | | | 60,930 | 185,791 |
| METRO AG | | | 2,917 | 46,938 |
| Food products 1.7% | | | |
| General Mills, Inc. | | | 4,133 | 221,363 |
| Kellogg Company | | | 19,844 | 1,372,411 |
| Nestle SA | | | 6,096 | 659,985 |
| Perusahaan Perkebunan London Sumatra Indonesia Tbk PT | | | 311,600 | 33,322 |
| The Hershey Company | | | 483 | 70,991 |
| The Kraft Heinz Company | | | 15,546 | 499,493 |
| Tyson Foods, Inc., Class A | | | 1,229 | 111,888 |
| Wens Foodstuffs Group Company, Ltd., Class A | | | 10,300 | 49,715 |
| Household products 0.4% | | | |
| Colgate-Palmolive Company | | | 2,039 | 140,365 |
| Kimberly-Clark Corp. | | | 1,482 | 203,849 |
| The Clorox Company | | | 654 | 100,415 |
| The Procter & Gamble Company | | | 2,744 | 342,726 |
| Personal products 0.4% | | | |
| The Estee Lauder Companies, Inc., Class A | | | 428 | 88,399 |
| Unilever NV | | | 11,575 | 664,297 |
| Tobacco 2.5% | | | |
| Altria Group, Inc. | | | 8,783 | 438,360 |
| British American Tobacco PLC | | | 22,878 | 972,362 |
| Imperial Brands PLC | | | 42,489 | 1,051,190 |
| Japan Tobacco, Inc. | | | 11,642 | 259,576 |
| Philip Morris International, Inc. | | | 21,484 | 1,828,074 |
| SEE NOTES TO FINANCIAL STATEMENTS | ANNUAL REPORT | JOHN HANCOCK HEDGED EQUITY & INCOME FUND | 10 |
| | | | | Shares | Value |
| Energy 7.6% | | | $13,814,259 |
| Energy equipment and services 0.1% | | | |
| Fugro NV (A) | | | 5,786 | 65,234 |
| Helmerich & Payne, Inc. | | | 1,205 | 54,743 |
| Saipem SpA (A) | | | 23,508 | 114,971 |
| The Drilling Company of 1972 A/S (A) | | | 308 | 20,337 |
| Trican Well Service, Ltd. (A) | | | 28,240 | 24,792 |
| Oil, gas and consumable fuels 7.5% | | | |
| Advantage Oil & Gas, Ltd. (A) | | | 30,548 | 64,693 |
| Aker BP ASA | | | 5,127 | 168,270 |
| ARC Resources, Ltd. | | | 8,373 | 52,744 |
| BP PLC | | | 55,388 | 348,435 |
| Cameco Corp. | | | 6,237 | 55,427 |
| Chevron Corp. | | | 2,234 | 269,219 |
| Coal India, Ltd. | | | 96,323 | 285,705 |
| Enbridge, Inc. | | | 40,173 | 1,597,268 |
| Encana Corp. | | | 27,227 | 127,481 |
| Eni SpA | | | 22,859 | 355,028 |
| Equinor ASA | | | 6,363 | 126,893 |
| Exxon Mobil Corp. | | | 15,502 | 1,081,730 |
| Galp Energia SGPS SA | | | 87,469 | 1,468,434 |
| Gazprom PJSC, ADR | | | 18,593 | 152,834 |
| Inpex Corp. | | | 18,740 | 194,141 |
| Inter Pipeline, Ltd. | | | 4,768 | 82,762 |
| Japan Petroleum Exploration Company, Ltd. | | | 1,865 | 50,224 |
| Kinder Morgan, Inc. | | | 16,930 | 358,408 |
| LUKOIL PJSC, ADR | | | 758 | 74,822 |
| LUKOIL PJSC, ADR (London Stock Exchange) | | | 905 | 90,144 |
| Lundin Petroleum AB | | | 22,550 | 765,673 |
| Painted Pony Energy, Ltd. (A) | | | 20,525 | 12,013 |
| Royal Dutch Shell PLC, A Shares | | | 1,190 | 35,241 |
| Royal Dutch Shell PLC, B Shares | | | 38,328 | 1,137,715 |
| Surgutneftegas PJSC, ADR (London Stock Exchange) | | | 19,435 | 157,328 |
| Targa Resources Corp. | | | 6,356 | 259,515 |
| TC Energy Corp. | | | 30,537 | 1,626,382 |
| The Williams Companies, Inc. | | | 10,675 | 253,211 |
| TOTAL SA | | | 38,922 | 2,159,803 |
| Tourmaline Oil Corp. | | | 4,826 | 56,564 |
| YPF SA, ADR | | | 5,706 | 66,075 |
| Financials 16.4% | | | 29,779,862 |
| Banks 10.0% | | | |
| ABN AMRO Bank NV (B) | | | 88,379 | 1,610,824 |
| AIB Group PLC | | | 24,563 | 85,809 |
| Allahabad Bank (A) | | | 30,492 | 8,099 |
| 11 | JOHN HANCOCK HEDGED EQUITY & INCOME FUND | ANNUAL REPORT | SEE NOTES TO FINANCIAL STATEMENTS |
| | | | | Shares | Value |
| Financials (continued) | | | |
| Banks (continued) | | | |
| Aozora Bank, Ltd. | | | 4,963 | $131,116 |
| Bank of America Corp. | | | 48,981 | 1,725,111 |
| Bank of Ireland Group PLC | | | 29,239 | 160,920 |
| Bank Polska Kasa Opieki SA | | | 3,343 | 88,467 |
| BNP Paribas SA | | | 5,298 | 314,903 |
| BPER Banca | | | 20,124 | 101,255 |
| CaixaBank SA | | | 68,889 | 216,935 |
| Canara Bank (A) | | | 23,669 | 73,425 |
| China Construction Bank Corp., H Shares | | | 1,123,000 | 973,688 |
| CIMB Group Holdings BHD | | | 66,200 | 83,380 |
| Dah Sing Financial Holdings, Ltd. | | | 16,100 | 63,464 |
| Danske Bank A/S | | | 1,778 | 28,765 |
| DGB Financial Group, Inc. (A) | | | 11,871 | 72,978 |
| DNB ASA | | | 3,758 | 70,323 |
| HSBC Holdings PLC | | | 55,892 | 437,547 |
| ING Groep NV | | | 98,784 | 1,187,621 |
| Kasikornbank PCL, NVDR | | | 21,900 | 110,248 |
| KB Financial Group, Inc. | | | 4,029 | 165,987 |
| Lloyds Banking Group PLC | | | 263,224 | 218,060 |
| Mitsubishi UFJ Financial Group, Inc. | | | 319,549 | 1,727,589 |
| Mizuho Financial Group, Inc. | | | 103,045 | 158,732 |
| Moneta Money Bank AS (B) | | | 83,746 | 314,228 |
| National Australia Bank, Ltd. | | | 5,783 | 100,070 |
| Nordea Bank ABP (Stockholm Stock Exchange) | | | 101,504 | 821,186 |
| People's United Financial, Inc. | | | 12,407 | 209,678 |
| Raiffeisen Bank International AG | | | 1,643 | 41,123 |
| Resona Holdings, Inc. | | | 167,995 | 732,211 |
| Royal Bank of Canada | | | 13,154 | 1,040,833 |
| Sberbank of Russia PJSC, ADR | | | 6,040 | 99,056 |
| Shinhan Financial Group Company, Ltd. | | | 3,843 | 144,085 |
| Skandinaviska Enskilda Banken AB, A Shares | | | 15,609 | 146,722 |
| Societe Generale SA | | | 14,717 | 513,593 |
| Standard Chartered PLC | | | 154,797 | 1,458,666 |
| Sumitomo Mitsui Financial Group, Inc. | | | 7,900 | 291,789 |
| Sumitomo Mitsui Trust Holdings, Inc. | | | 4,360 | 172,355 |
| The Bank of Nova Scotia | | | 26,193 | 1,479,540 |
| The Tochigi Bank, Ltd. | | | 14,670 | 31,515 |
| Unicaja Banco SA (B) | | | 89,456 | 97,119 |
| UniCredit SpA | | | 18,946 | 276,933 |
| Wells Fargo & Company | | | 5,679 | 305,530 |
| Westpac Banking Corp. | | | 4,334 | 74,011 |
| Capital markets 1.8% | | | |
| CME Group, Inc. | | | 1,080 | 216,778 |
| SEE NOTES TO FINANCIAL STATEMENTS | ANNUAL REPORT | JOHN HANCOCK HEDGED EQUITY & INCOME FUND | 12 |
| | | | | Shares | Value |
| Financials (continued) | | | |
| Capital markets (continued) | | | |
| GAM Holding AG (A) | | | 11,057 | $32,068 |
| Ichiyoshi Securities Company, Ltd. | | | 5,910 | 34,716 |
| IGM Financial, Inc. | | | 6,245 | 179,287 |
| Intercontinental Exchange, Inc. | | | 2,029 | 187,784 |
| Julius Baer Group, Ltd. (A) | | | 3,922 | 202,190 |
| MarketAxess Holdings, Inc. | | | 209 | 79,234 |
| Natixis SA | | | 70,272 | 313,028 |
| Nomura Holdings, Inc. | | | 30,900 | 159,005 |
| UBS Group AG (A) | | | 139,953 | 1,766,121 |
| Uranium Participation Corp. (A) | | | 12,333 | 38,750 |
| Consumer finance 0.0% | | | |
| Provident Financial PLC | | | 8,472 | 51,363 |
| Diversified financial services 0.0% | | | |
| G-Resources Group, Ltd. (A) | | | 2,076,450 | 15,451 |
| Insurance 3.2% | | | |
| Admiral Group PLC | | | 3,458 | 105,671 |
| Ageas | | | 2,872 | 169,829 |
| American Financial Group, Inc. | | | 4 | 439 |
| Assicurazioni Generali SpA | | | 13,126 | 270,984 |
| AXA SA | | | 58,058 | 1,640,501 |
| Dai-ichi Life Holdings, Inc. | | | 10,145 | 167,192 |
| Direct Line Insurance Group PLC | | | 64,748 | 267,898 |
| Fidelity National Financial, Inc. | | | 3,899 | 176,820 |
| Legal & General Group PLC | | | 22,181 | 89,102 |
| Orange Life Insurance, Ltd. (B) | | | 4,080 | 99,561 |
| Power Corp. of Canada | | | 26,927 | 693,626 |
| Powszechny Zaklad Ubezpieczen SA | | | 22,356 | 236,112 |
| Sampo OYJ, A Shares | | | 7,729 | 337,472 |
| Shin Kong Financial Holding Company, Ltd. (A) | | | 225,563 | 77,954 |
| T&D Holdings, Inc. | | | 21,365 | 270,176 |
| Tokio Marine Holdings, Inc. | | | 19,800 | 1,108,578 |
| Tongyang Life Insurance Company, Ltd. (A) | | | 10,877 | 37,547 |
| Mortgage real estate investment trusts 1.3% | | | |
| AGNC Investment Corp. | | | 78,245 | 1,383,372 |
| Annaly Capital Management, Inc. | | | 113,838 | 1,072,354 |
| Thrifts and mortgage finance 0.1% | | | |
| New York Community Bancorp, Inc. | | | 11,099 | 133,410 |
| Health care 7.4% | | | 13,468,899 |
| Biotechnology 1.0% | | | |
| AbbVie, Inc. | | | 13,368 | 1,183,603 |
| Amgen, Inc. | | | 671 | 161,758 |
| 13 | JOHN HANCOCK HEDGED EQUITY & INCOME FUND | ANNUAL REPORT | SEE NOTES TO FINANCIAL STATEMENTS |
| | | | | Shares | Value |
| Health care (continued) | | | |
| Biotechnology (continued) | | | |
| Gilead Sciences, Inc. | | | 6,343 | $412,168 |
| Health care equipment and supplies 1.0% | | | |
| Abbott Laboratories | | | 4,437 | 385,398 |
| Hoya Corp. | | | 1,237 | 118,086 |
| Koninklijke Philips NV | | | 15,319 | 748,849 |
| Medtronic PLC | | | 2,218 | 251,632 |
| ResMed, Inc. | | | 1,538 | 238,344 |
| Stryker Corp. | | | 178 | 37,369 |
| Health care providers and services 0.6% | | | |
| Anthem, Inc. | | | 150 | 45,305 |
| Cardinal Health, Inc. | | | 2,141 | 108,292 |
| CVS Health Corp. | | | 9,319 | 692,309 |
| UnitedHealth Group, Inc. | | | 933 | 274,283 |
| Health care technology 0.0% | | | |
| AGFA-Gevaert NV (A) | | | 10,540 | 54,591 |
| Life sciences tools and services 0.0% | | | |
| CMIC Holdings Company, Ltd. | | | 1,390 | 23,522 |
| Pharmaceuticals 4.8% | | | |
| AstraZeneca PLC | | | 14,138 | 1,415,100 |
| Bristol-Myers Squibb Company | | | 17,853 | 1,145,984 |
| Chugai Pharmaceutical Company, Ltd. | | | 635 | 58,480 |
| Daiichi Sankyo Company, Ltd. | | | 880 | 58,119 |
| Eisai Company, Ltd. | | | 1,090 | 81,560 |
| Eli Lilly & Company | | | 590 | 77,544 |
| Johnson & Johnson | | | 4,865 | 709,658 |
| Merck & Company, Inc. | | | 12,661 | 1,151,518 |
| Novartis AG | | | 16,403 | 1,553,193 |
| Pfizer, Inc. | | | 45,846 | 1,796,246 |
| Roche Holding AG | | | 688 | 223,602 |
| Takeda Pharmaceutical Company, Ltd. | | | 10,690 | 422,813 |
| Zoetis, Inc. | | | 299 | 39,573 |
| Industrials 7.5% | | | 13,603,110 |
| Aerospace and defense 1.0% | | | |
| L3Harris Technologies, Inc. | | | 292 | 57,778 |
| Lockheed Martin Corp. | | | 1,731 | 674,017 |
| Northrop Grumman Corp. | | | 308 | 105,943 |
| The Boeing Company | | | 2,960 | 964,250 |
| Air freight and logistics 0.2% | | | |
| bpost SA | | | 5,808 | 67,150 |
| CTT-Correios de Portugal SA | | | 11,333 | 40,679 |
| PostNL NV | | | 40,636 | 91,950 |
| SEE NOTES TO FINANCIAL STATEMENTS | ANNUAL REPORT | JOHN HANCOCK HEDGED EQUITY & INCOME FUND | 14 |
| | | | | Shares | Value |
| Industrials (continued) | | | |
| Air freight and logistics (continued) | | | |
| United Parcel Service, Inc., Class B | | | 981 | $114,836 |
| Airlines 0.2% | | | |
| ANA Holdings, Inc. | | | 2,437 | 81,356 |
| Deutsche Lufthansa AG | | | 5,993 | 110,096 |
| SAS AB (A) | | | 62,699 | 101,995 |
| Building products 0.2% | | | |
| Cie de Saint-Gobain | | | 7,529 | 308,432 |
| Commercial services and supplies 0.3% | | | |
| Babcock International Group PLC | | | 15,722 | 131,199 |
| Republic Services, Inc. | | | 2,303 | 206,418 |
| Serco Group PLC (A) | | | 9,812 | 21,065 |
| Toppan Forms Company, Ltd. | | | 6,140 | 68,747 |
| Waste Management, Inc. | | | 1,592 | 181,424 |
| Construction and engineering 1.2% | | | |
| China Machinery Engineering Corp., H Shares | | | 133,870 | 53,950 |
| Chiyoda Corp. (A) | | | 9,025 | 23,344 |
| Implenia AG | | | 2,070 | 83,965 |
| JGC Holdings Corp. | | | 9,845 | 156,693 |
| Raubex Group, Ltd. | | | 29,671 | 50,861 |
| Shanghai Construction Group Company, Ltd., Class A | | | 695,600 | 353,783 |
| Toyo Engineering Corp. (A) | | | 6,610 | 42,975 |
| Vinci SA | | | 13,094 | 1,458,325 |
| Electrical equipment 1.0% | | | |
| ABB, Ltd. | | | 24,858 | 599,653 |
| Cosel Company, Ltd. | | | 4,340 | 46,670 |
| Emerson Electric Company | | | 13,135 | 1,001,675 |
| Ushio, Inc. | | | 2,555 | 37,886 |
| Zumtobel Group AG (A) | | | 6,494 | 66,165 |
| Industrial conglomerates 0.5% | | | |
| 3M Company | | | 1,331 | 234,815 |
| Siemens AG | | | 5,313 | 693,833 |
| Machinery 0.6% | | | |
| Hisaka Works, Ltd. | | | 4,580 | 42,244 |
| Mitsubishi Heavy Industries, Ltd. | | | 3,565 | 138,239 |
| Nabtesco Corp. | | | 22,400 | 660,060 |
| The Japan Steel Works, Ltd. | | | 4,980 | 97,278 |
| THK Company, Ltd. | | | 3,310 | 88,868 |
| Toshiba Machine Company, Ltd. | | | 1,883 | 50,733 |
| Marine 0.2% | | | |
| A.P. Moller - Maersk A/S, Series B | | | 140 | 201,996 |
| D/S Norden A/S | | | 6,238 | 99,895 |
| 15 | JOHN HANCOCK HEDGED EQUITY & INCOME FUND | ANNUAL REPORT | SEE NOTES TO FINANCIAL STATEMENTS |
| | | | | Shares | Value |
| Industrials (continued) | | | |
| Marine (continued) | | | |
| Kuehne + Nagel International AG | | | 287 | $48,407 |
| Pacific Basin Shipping, Ltd. | | | 422,330 | 88,953 |
| Professional services 0.2% | | | |
| Adecco Group AG | | | 3,981 | 251,688 |
| Hays PLC | | | 36,234 | 87,144 |
| Pagegroup PLC | | | 9,785 | 67,820 |
| SThree PLC | | | 10,597 | 53,104 |
| Road and rail 0.4% | | | |
| BTS Group Holdings PCL | | | 1,545,026 | 680,088 |
| The Go-Ahead Group PLC | | | 1,404 | 41,142 |
| Trading companies and distributors 0.7% | | | |
| Rexel SA | | | 14,498 | 192,833 |
| SIG PLC | | | 30,506 | 49,742 |
| Triton International, Ltd. | | | 24,997 | 1,004,879 |
| Transportation infrastructure 0.8% | | | |
| Hamburger Hafen und Logistik AG | | | 1,500 | 41,132 |
| Sydney Airport | | | 111,892 | 679,824 |
| Transurban Group | | | 67,365 | 705,113 |
| Information technology 8.3% | | | 15,145,530 |
| Communications equipment 1.1% | | | |
| Cisco Systems, Inc. | | | 25,688 | 1,231,996 |
| Motorola Solutions, Inc. | | | 997 | 160,657 |
| Nokia OYJ (A) | | | 151,229 | 559,376 |
| Electronic equipment, instruments and components 0.3% | | | |
| Citizen Watch Company, Ltd. | | | 23,385 | 127,357 |
| Enplas Corp. | | | 1,710 | 56,065 |
| Foxconn Technology Company, Ltd. | | | 45,320 | 100,195 |
| Innolux Corp. | | | 355,860 | 99,092 |
| Nichicon Corp. | | | 11,310 | 117,443 |
| Nippon Chemi-Con Corp. | | | 4,760 | 90,709 |
| IT services 1.4% | | | |
| Broadridge Financial Solutions, Inc. | | | 1,397 | 172,585 |
| Fidelity National Information Services, Inc. | | | 1,213 | 168,716 |
| Fujitsu, Ltd. | | | 1,144 | 107,600 |
| IBM Corp. | | | 2,894 | 387,912 |
| Infosys, Ltd. | | | 5,420 | 55,880 |
| Itochu Techno-Solutions Corp. | | | 1,953 | 55,001 |
| Jack Henry & Associates, Inc. | | | 545 | 79,390 |
| Leidos Holdings, Inc. | | | 1,307 | 127,942 |
| Mastercard, Inc., Class A | | | 1,040 | 310,534 |
| Nomura Research Institute, Ltd. | | | 4,006 | 85,672 |
| SEE NOTES TO FINANCIAL STATEMENTS | ANNUAL REPORT | JOHN HANCOCK HEDGED EQUITY & INCOME FUND | 16 |
| | | | | Shares | Value |
| Information technology (continued) | | | |
| IT services (continued) | | | |
| Obic Company, Ltd. | | | 407 | $54,823 |
| Sabre Corp. | | | 6,802 | 152,637 |
| Sopra Steria Group | | | 190 | 30,687 |
| Tata Consultancy Services, Ltd. | | | 178 | 5,398 |
| The Western Union Company | | | 4,873 | 130,499 |
| TravelSky Technology, Ltd., H Shares | | | 18,000 | 43,942 |
| Visa, Inc., Class A | | | 2,934 | 551,299 |
| Semiconductors and semiconductor equipment 2.8% | | | |
| Advanced Micro Devices, Inc. (A) | | | 1,794 | 82,273 |
| Applied Materials, Inc. | | | 2,082 | 127,085 |
| ASML Holding NV | | | 334 | 98,883 |
| Broadcom, Inc. | | | 839 | 265,141 |
| Disco Corp. | | | 183 | 42,973 |
| Intel Corp. | | | 3,038 | 181,824 |
| KLA Corp. | | | 1,171 | 208,637 |
| Lam Research Corp. | | | 466 | 136,258 |
| Maxim Integrated Products, Inc. | | | 1,450 | 89,190 |
| Microchip Technology, Inc. | | | 947 | 99,170 |
| Miraial Company, Ltd. | | | 1,900 | 24,155 |
| NVIDIA Corp. | | | 941 | 221,417 |
| QUALCOMM, Inc. | | | 1,628 | 143,638 |
| Skyworks Solutions, Inc. | | | 473 | 57,176 |
| STMicroelectronics NV | | | 4,953 | 133,635 |
| Taiwan Semiconductor Manufacturing Company, Ltd. | | | 151,000 | 1,671,241 |
| Texas Instruments, Inc. | | | 9,108 | 1,168,465 |
| Tokyo Electron, Ltd. | | | 784 | 171,171 |
| Tokyo Seimitsu Company, Ltd. | | | 2,975 | 115,513 |
| Software 0.9% | | | |
| Intuit, Inc. | | | 459 | 120,226 |
| Microsoft Corp. | | | 8,304 | 1,309,541 |
| Oracle Corp. | | | 2,505 | 132,715 |
| Trend Micro, Inc. | | | 2,500 | 127,924 |
| Technology hardware, storage and peripherals 1.8% | | | |
| Acer, Inc. | | | 155,770 | 92,843 |
| Apple, Inc. | | | 4,812 | 1,413,044 |
| Canon, Inc. | | | 14,443 | 395,283 |
| Compal Electronics, Inc. | | | 235,585 | 148,385 |
| HP, Inc. | | | 8,328 | 171,140 |
| Maxell Holdings, Ltd. | | | 4,680 | 63,235 |
| Melco Holdings, Inc. | | | 736 | 20,910 |
| NetApp, Inc. | | | 861 | 53,597 |
| Quadient | | | 4,047 | 98,061 |
| 17 | JOHN HANCOCK HEDGED EQUITY & INCOME FUND | ANNUAL REPORT | SEE NOTES TO FINANCIAL STATEMENTS |
| | | | | Shares | Value |
| Information technology (continued) | | | |
| Technology hardware, storage and peripherals (continued) | | | |
| Samsung Electronics Company, Ltd. | | | 2,241 | $107,987 |
| Seagate Technology PLC | | | 13,267 | 789,387 |
| Materials 2.8% | | | 5,014,073 |
| Chemicals 0.5% | | | |
| China BlueChemical, Ltd., H Shares | | | 246,420 | 60,712 |
| Dow, Inc. | | | 3,536 | 193,525 |
| EMS-Chemie Holding AG | | | 101 | 66,401 |
| JSR Corp. | | | 10,110 | 184,938 |
| LyondellBasell Industries NV, Class A | | | 2,840 | 268,323 |
| Nitto Denko Corp. | | | 2,170 | 122,014 |
| Construction materials 0.2% | | | |
| Imerys SA | | | 1,836 | 77,934 |
| LafargeHolcim, Ltd. (A) | | | 4,320 | 239,663 |
| Vicat SA | | | 1,710 | 77,389 |
| Containers and packaging 0.2% | | | |
| Amcor PLC | | | 16,185 | 175,445 |
| AMVIG Holdings, Ltd. | | | 75,690 | 19,032 |
| International Paper Company | | | 2,450 | 112,823 |
| Nampak, Ltd. (A) | | | 93,285 | 45,519 |
| Metals and mining 1.9% | | | |
| Alumina, Ltd. | | | 68,097 | 109,991 |
| Anglo American PLC | | | 6,950 | 199,659 |
| Barrick Gold Corp. | | | 10,716 | 199,045 |
| Centerra Gold, Inc. (A) | | | 11,469 | 91,236 |
| Chubu Steel Plate Company, Ltd. | | | 2,010 | 13,403 |
| CST Group, Ltd. (A) | | | 1,440,000 | 4,430 |
| Eldorado Gold Corp. (A) | | | 7,668 | 61,574 |
| Eregli Demir ve Celik Fabrikalari TAS | | | 161,626 | 245,463 |
| Fortescue Metals Group, Ltd. | | | 15,613 | 117,696 |
| Gold Fields, Ltd. | | | 15,096 | 103,040 |
| Harmony Gold Mining Company, Ltd., ADR (A) | | | 22,634 | 82,161 |
| Hitachi Metals, Ltd. | | | 2,010 | 29,587 |
| IAMGOLD Corp. (A) | | | 8,320 | 31,034 |
| Impala Platinum Holdings, Ltd. (A) | | | 6,607 | 67,506 |
| Kinross Gold Corp. (A) | | | 19,925 | 94,445 |
| Kyoei Steel, Ltd. | | | 5,610 | 109,320 |
| Magnitogorsk Iron & Steel Works PJSC, GDR | | | 21,639 | 187,693 |
| MMC Norilsk Nickel PJSC, ADR | | | 4,470 | 136,290 |
| Nakayama Steel Works, Ltd. | | | 8,690 | 43,347 |
| Neturen Company, Ltd. | | | 2,890 | 23,614 |
| Norsk Hydro ASA | | | 44,838 | 166,735 |
| Northern Dynasty Minerals, Ltd. (A) | | | 4,162 | 1,795 |
| SEE NOTES TO FINANCIAL STATEMENTS | ANNUAL REPORT | JOHN HANCOCK HEDGED EQUITY & INCOME FUND | 18 |
| | | | | Shares | Value |
| Materials (continued) | | | |
| Metals and mining (continued) | | | |
| Pacific Metals Company, Ltd. | | | 2,350 | $54,836 |
| Petra Diamonds, Ltd. (A) | | | 88,495 | 10,420 |
| Resolute Mining, Ltd. (A) | | | 48,845 | 42,982 |
| Salzgitter AG | | | 5,037 | 111,184 |
| SEMAFO, Inc. (A) | | | 29,144 | 60,597 |
| Severstal PJSC, GDR | | | 45,494 | 688,488 |
| Tokyo Steel Manufacturing Company, Ltd. | | | 13,140 | 94,958 |
| Western Areas, Ltd. | | | 37,581 | 80,033 |
| Yamato Kogyo Company, Ltd. | | | 4,305 | 107,793 |
| Real estate 3.8% | | | 6,964,376 |
| Equity real estate investment trusts 2.9% | | | |
| American Tower Corp. | | | 341 | 78,369 |
| Crown Castle International Corp. | | | 925 | 131,489 |
| Equity Residential | | | 828 | 67,002 |
| Extra Space Storage, Inc. | | | 1,862 | 196,664 |
| Fortress REIT, Ltd., Class B | | | 721,287 | 412,235 |
| Growthpoint Properties, Ltd. | | | 94,610 | 149,456 |
| Healthpeak Properties, Inc. | | | 4,097 | 141,224 |
| Host Hotels & Resorts, Inc. | | | 8,050 | 149,328 |
| Iron Mountain, Inc. | | | 10,366 | 330,364 |
| Japan Prime Realty Investment Corp. | | | 155 | 681,516 |
| Land Securities Group PLC | | | 7,652 | 100,444 |
| Nippon Building Fund, Inc. | | | 91 | 667,053 |
| Public Storage | | | 928 | 197,627 |
| Redefine Properties, Ltd. | | | 358,084 | 193,331 |
| Simon Property Group, Inc. | | | 2,087 | 310,880 |
| Sun Communities, Inc. | | | 98 | 14,710 |
| The British Land Company PLC | | | 11,319 | 95,846 |
| The GPT Group | | | 165,648 | 652,495 |
| The Macerich Company | | | 6,561 | 176,622 |
| Ventas, Inc. | | | 1,675 | 96,715 |
| VEREIT, Inc. | | | 3,974 | 36,720 |
| Welltower, Inc. | | | 1,528 | 124,960 |
| WP Carey, Inc. | | | 4,733 | 378,829 |
| Real estate management and development 0.9% | | | |
| Mitsubishi Estate Company, Ltd. | | | 7,540 | 144,277 |
| Nexity SA | | | 28,575 | 1,436,220 |
| Utilities 7.1% | | | 12,848,424 |
| Electric utilities 2.9% | | | |
| Alliant Energy Corp. | | | 1,329 | 72,723 |
| American Electric Power Company, Inc. | | | 2,069 | 195,541 |
| 19 | JOHN HANCOCK HEDGED EQUITY & INCOME FUND | ANNUAL REPORT | SEE NOTES TO FINANCIAL STATEMENTS |
| | | | | Shares | Value |
| Utilities (continued) | | | |
| Electric utilities (continued) | | | |
| Duke Energy Corp. | | | 3,176 | $289,683 |
| Edison International | | | 16,664 | 1,256,632 |
| Enel SpA | | | 104,119 | 827,103 |
| Entergy Corp. | | | 1,221 | 146,276 |
| Evergy, Inc. | | | 1,248 | 81,232 |
| Eversource Energy | | | 1,691 | 143,853 |
| FirstEnergy Corp. | | | 1,433 | 69,644 |
| Iberdrola SA | | | 139,680 | 1,439,482 |
| NextEra Energy, Inc. | | | 1,027 | 248,698 |
| OGE Energy Corp. | | | 2,285 | 101,614 |
| Pinnacle West Capital Corp. | | | 478 | 42,987 |
| PPL Corp. | | | 7,690 | 275,917 |
| The Southern Company | | | 302 | 19,237 |
| Xcel Energy, Inc. | | | 1,483 | 94,156 |
| Gas utilities 0.4% | | | |
| AltaGas, Ltd. | | | 6,672 | 101,630 |
| APA Group | | | 90,623 | 705,449 |
| Independent power and renewable electricity producers 0.3% | | | |
| China Longyuan Power Group Corp., Ltd., H Shares | | | 755,995 | 478,084 |
| NTPC, Ltd. | | | 8,984 | 14,982 |
| Ratch Group PCL | | | 17,559 | 40,302 |
| Multi-utilities 2.6% | | | |
| CenterPoint Energy, Inc. | | | 6,016 | 164,056 |
| Centrica PLC | | | 127,676 | 150,938 |
| CMS Energy Corp. | | | 728 | 45,748 |
| Consolidated Edison, Inc. | | | 821 | 74,276 |
| Dominion Energy, Inc. | | | 14,092 | 1,167,099 |
| DTE Energy Company | | | 649 | 84,286 |
| E.ON SE | | | 110,962 | 1,185,837 |
| Engie SA | | | 11,172 | 180,968 |
| National Grid PLC | | | 93,699 | 1,170,972 |
| Public Service Enterprise Group, Inc. | | | 712 | 42,044 |
| RWE AG | | | 2,567 | 78,658 |
| Sempra Energy | | | 810 | 122,699 |
| WEC Energy Group, Inc. | | | 1,895 | 174,776 |
| Water utilities 0.9% | | | |
| Guangdong Investment, Ltd. | | | 372,000 | 778,060 |
|
| United Utilities Group PLC | | | 62,553 | 782,782 |
| SEE NOTES TO FINANCIAL STATEMENTS | ANNUAL REPORT | JOHN HANCOCK HEDGED EQUITY & INCOME FUND | 20 |
| | | | | Shares | Value |
|
| Preferred securities 0.7% | | | | | $1,225,749 |
| (Cost $1,029,136) | | | | | |
| Consumer discretionary 0.6% | | | | | 1,064,108 |
| Automobiles 0.6% | | | |
| Volkswagen AG | | 5,406 | 1,064,108 |
| Information technology 0.1% | | | | | 106,454 |
| Technology hardware, storage and peripherals 0.1% | | | |
| Samsung Electronics Company, Ltd. | | 2,719 | 106,454 |
| Utilities 0.0% | | | | | 55,187 |
| Electric utilities 0.0% | | | |
|
| Cia Paranaense de Energia, B Shares | | 3,200 | 55,187 |
| Exchange-traded funds 0.0% | | | | | $96,555 |
| (Cost $96,566) | | | | | |
| iShares Core MSCI EAFE ETF | | | | 1,480 | 96,555 |
|
| | Rate (%) | Maturity date | | Par value^ | Value |
| Corporate bonds 13.8% | | | $24,983,718 |
| (Cost $24,269,272) | | | | | |
| Communication services 2.5% | | | 4,544,325 |
| Diversified telecommunication services 0.8% | | | |
| Altice France SA (B) | 3.375 | 01-15-28 | EUR | 100,000 | 115,537 |
| Altice France SA | 5.875 | 02-01-27 | EUR | 165,000 | 208,216 |
| CenturyLink, Inc. | 5.625 | 04-01-25 | | 20,000 | 21,251 |
| CenturyLink, Inc. | 7.500 | 04-01-24 | | 30,000 | 33,825 |
| Embarq Corp. | 7.995 | 06-01-36 | | 100,000 | 105,750 |
| Frontier Communications Corp. | 6.875 | 01-15-25 | | 40,000 | 19,400 |
| Frontier Communications Corp. (B) | 8.500 | 04-01-26 | | 85,000 | 86,063 |
| Frontier Communications Corp. | 10.500 | 09-15-22 | | 40,000 | 19,500 |
| Intelsat Jackson Holdings SA | 5.500 | 08-01-23 | | 125,000 | 107,380 |
| Intelsat Jackson Holdings SA (B) | 8.500 | 10-15-24 | | 160,000 | 145,733 |
| Telecom Argentina SA (B) | 6.500 | 06-15-21 | | 151,000 | 146,470 |
| Telecom Italia Capital SA | 7.200 | 07-18-36 | | 90,000 | 106,632 |
| Telecom Italia SpA (B) | 5.303 | 05-30-24 | | 200,000 | 215,000 |
| Ziggo BV (B) | 5.500 | 01-15-27 | | 170,000 | 180,625 |
| Media 1.3% | | | |
| Altice Financing SA (B) | 7.500 | 05-15-26 | | 210,000 | 225,750 |
| Altice Luxembourg SA (B) | 7.625 | 02-15-25 | | 200,000 | 208,000 |
| Altice Luxembourg SA | 8.000 | 05-15-27 | EUR | 100,000 | 125,630 |
| CCO Holdings LLC (B) | 5.750 | 02-15-26 | | 105,000 | 110,777 |
| CSC Holdings LLC (B) | 6.500 | 02-01-29 | | 390,000 | 434,850 |
| DISH DBS Corp. | 5.000 | 03-15-23 | | 175,000 | 179,524 |
| DISH DBS Corp. | 5.875 | 07-15-22 | | 50,000 | 53,000 |
| 21 | JOHN HANCOCK HEDGED EQUITY & INCOME FUND | ANNUAL REPORT | SEE NOTES TO FINANCIAL STATEMENTS |
| | Rate (%) | Maturity date | | Par value^ | Value |
| Communication services (continued) | | | |
| Media (continued) | | | |
| DISH DBS Corp. | 5.875 | 11-15-24 | | 30,000 | $30,656 |
| DISH DBS Corp. | 7.750 | 07-01-26 | | 30,000 | 31,782 |
| Gray Television, Inc. (B) | 5.125 | 10-15-24 | | 130,000 | 134,875 |
| Gray Television, Inc. (B) | 5.875 | 07-15-26 | | 50,000 | 53,188 |
| iHeartCommunications, Inc. (B) | 5.250 | 08-15-27 | | 65,000 | 68,010 |
| Nexstar Broadcasting, Inc. (B) | 5.625 | 07-15-27 | | 180,000 | 189,684 |
| Scripps Escrow, Inc. (B) | 5.875 | 07-15-27 | | 100,000 | 104,750 |
| Sinclair Television Group, Inc. (B) | 5.625 | 08-01-24 | | 100,000 | 102,875 |
| Sirius XM Radio, Inc. (B) | 5.500 | 07-01-29 | | 100,000 | 108,124 |
| WMG Acquisition Corp. | 3.625 | 10-15-26 | EUR | 100,000 | 118,620 |
| WMG Acquisition Corp. (B) | 5.500 | 04-15-26 | | 85,000 | 89,463 |
| Wireless telecommunication services 0.4% | | | |
| Sprint Capital Corp. | 8.750 | 03-15-32 | | 60,000 | 72,825 |
| Sprint Corp. | 7.125 | 06-15-24 | | 50,000 | 53,938 |
| Sprint Corp. | 7.250 | 09-15-21 | | 215,000 | 227,363 |
| Sprint Corp. | 7.875 | 09-15-23 | | 100,000 | 110,333 |
| Turkcell Iletisim Hizmetleri AS | 5.800 | 04-11-28 | | 200,000 | 198,926 |
| Consumer discretionary 1.7% | | | 3,057,312 |
| Auto components 0.2% | | | |
| Adient Global Holdings, Ltd. | 3.500 | 08-15-24 | EUR | 100,000 | 106,000 |
| Adient US LLC (B) | 7.000 | 05-15-26 | | 20,000 | 21,800 |
| American Axle & Manufacturing, Inc. | 6.250 | 04-01-25 | | 15,000 | 15,619 |
| American Axle & Manufacturing, Inc. | 6.500 | 04-01-27 | | 35,000 | 36,313 |
| Panther BF Aggregator 2 LP (B) | 8.500 | 05-15-27 | | 115,000 | 122,188 |
| Distributors 0.1% | | | |
| LKQ European Holdings BV | 3.625 | 04-01-26 | EUR | 100,000 | 118,081 |
| Diversified consumer services 0.1% | | | |
| La Financiere Atalian SASU | 4.000 | 05-15-24 | EUR | 100,000 | 89,998 |
| La Financiere Atalian SASU (B) | 4.000 | 05-15-24 | EUR | 100,000 | 89,998 |
| Service Corp. International | 4.625 | 12-15-27 | | 35,000 | 36,488 |
| Service Corp. International | 5.125 | 06-01-29 | | 25,000 | 26,563 |
| Hotels, restaurants and leisure 0.9% | | | |
| Boyd Gaming Corp. (B) | 4.750 | 12-01-27 | | 25,000 | 25,969 |
| Boyd Gaming Corp. | 6.375 | 04-01-26 | | 85,000 | 91,455 |
| Caesars Resort Collection LLC (B) | 5.250 | 10-15-25 | | 120,000 | 124,050 |
| Eldorado Resorts, Inc. | 6.000 | 04-01-25 | | 130,000 | 136,825 |
| Golden Entertainment, Inc. (B) | 7.625 | 04-15-26 | | 70,000 | 75,425 |
| Hilton Domestic Operating Company, Inc. | 4.250 | 09-01-24 | | 152,000 | 154,850 |
| Jacobs Entertainment, Inc. (B) | 7.875 | 02-01-24 | | 165,000 | 174,900 |
| SEE NOTES TO FINANCIAL STATEMENTS | ANNUAL REPORT | JOHN HANCOCK HEDGED EQUITY & INCOME FUND | 22 |
| | Rate (%) | Maturity date | | Par value^ | Value |
| Consumer discretionary (continued) | | | |
| Hotels, restaurants and leisure (continued) | | | |
| KFC Holding Company/Pizza Hut Holdings LLC/Taco Bell of America LLC (B) | 4.750 | 06-01-27 | | 60,000 | $63,150 |
| KFC Holding Company/Pizza Hut Holdings LLC/Taco Bell of America LLC (B) | 5.250 | 06-01-26 | | 60,000 | 63,300 |
| New Red Finance, Inc. (B) | 5.000 | 10-15-25 | | 320,000 | 330,400 |
| Penn National Gaming, Inc. (B) | 5.625 | 01-15-27 | | 186,000 | 196,566 |
| Sugarhouse HSP Gaming Prop Mezz LP (B) | 5.875 | 05-15-25 | | 110,000 | 109,725 |
| Wynn Las Vegas LLC (B) | 5.500 | 03-01-25 | | 120,000 | 128,550 |
| Yum! Brands, Inc. (B) | 4.750 | 01-15-30 | | 30,000 | 31,425 |
| Household durables 0.2% | | | |
| KB Home | 4.800 | 11-15-29 | | 30,000 | 30,600 |
| M/I Homes, Inc. | 5.625 | 08-01-25 | | 40,000 | 41,900 |
| M/I Homes, Inc. | 6.750 | 01-15-21 | | 165,000 | 165,206 |
| Taylor Morrison Communities, Inc. (B) | 5.750 | 01-15-28 | | 140,000 | 152,600 |
| Leisure products 0.1% | | | |
| Jack Ohio Finance LLC (B) | 6.750 | 11-15-21 | | 13,000 | 13,260 |
| Mattel, Inc. (B) | 5.875 | 12-15-27 | | 40,000 | 42,150 |
| Mattel, Inc. (B) | 6.750 | 12-31-25 | | 140,000 | 150,472 |
| Specialty retail 0.1% | | | |
| Lithia Motors, Inc. (B) | 4.625 | 12-15-27 | | 65,000 | 66,811 |
| Party City Holdings, Inc. (B) | 6.625 | 08-01-26 | | 35,000 | 24,675 |
| Consumer staples 0.7% | | | 1,220,647 |
| Food and staples retailing 0.0% | | | |
| Performance Food Group, Inc. (B) | 5.500 | 10-15-27 | | 45,000 | 48,094 |
| Food products 0.5% | | | |
| B&G Foods, Inc. | 5.250 | 09-15-27 | | 55,000 | 55,550 |
| MARB BondCo PLC (B) | 7.000 | 03-15-24 | | 200,000 | 208,500 |
| Post Holdings, Inc. (B) | 5.000 | 08-15-26 | | 190,000 | 200,688 |
| Post Holdings, Inc. (B) | 5.625 | 01-15-28 | | 70,000 | 75,425 |
| Post Holdings, Inc. (B) | 5.750 | 03-01-27 | | 100,000 | 107,250 |
| TreeHouse Foods, Inc. | 4.875 | 03-15-22 | | 190,000 | 190,713 |
| Household products 0.1% | | | |
| Diamond BC BV | 5.625 | 08-15-25 | EUR | 200,000 | 220,302 |
| Personal products 0.1% | | | |
| Prestige Brands, Inc. (B) | 5.125 | 01-15-28 | | 50,000 | 52,375 |
| Revlon Consumer Products Corp. | 6.250 | 08-01-24 | | 130,000 | 61,750 |
| 23 | JOHN HANCOCK HEDGED EQUITY & INCOME FUND | ANNUAL REPORT | SEE NOTES TO FINANCIAL STATEMENTS |
| | Rate (%) | Maturity date | | Par value^ | Value |
| Energy 2.0% | | | $3,574,520 |
| Energy equipment and services 0.2% | | | |
| Tervita Corp. (B) | 7.625 | 12-01-21 | | 229,000 | 230,431 |
| Transocean, Inc. | 6.800 | 03-15-38 | | 110,000 | 78,100 |
| Oil, gas and consumable fuels 1.8% | | | |
| California Resources Corp. (B) | 8.000 | 12-15-22 | | 15,000 | 6,450 |
| Centennial Resource Production LLC (B) | 5.375 | 01-15-26 | | 65,000 | 63,863 |
| Cheniere Energy Partners LP (B) | 4.500 | 10-01-29 | | 71,000 | 72,960 |
| Chesapeake Energy Corp. (B) | 11.500 | 01-01-25 | | 197,000 | 186,165 |
| DCP Midstream Operating LP | 5.375 | 07-15-25 | | 120,000 | 130,500 |
| Energen Corp. | 4.625 | 09-01-21 | | 105,000 | 107,466 |
| Energy Transfer Operating LP | 4.250 | 03-15-23 | | 110,000 | 114,830 |
| Foresight Energy LLC (B) | 11.500 | 04-01-23 | | 170,000 | 5,950 |
| Jagged Peak Energy LLC | 5.875 | 05-01-26 | | 85,000 | 87,761 |
| Laredo Petroleum, Inc. | 5.625 | 01-15-22 | | 55,000 | 53,350 |
| Laredo Petroleum, Inc. | 6.250 | 03-15-23 | | 65,000 | 60,938 |
| Matador Resources Company | 5.875 | 09-15-26 | | 105,000 | 105,263 |
| MEG Energy Corp. (B) | 6.500 | 01-15-25 | | 80,000 | 83,208 |
| MEG Energy Corp. (B) | 7.000 | 03-31-24 | | 95,000 | 95,594 |
| Noble Holding International, Ltd. (B) | 7.875 | 02-01-26 | | 40,000 | 29,000 |
| Petrobras Global Finance BV | 5.093 | 01-15-30 | | 80,000 | 85,721 |
| Petrobras Global Finance BV | 5.750 | 02-01-29 | | 430,000 | 485,040 |
| Petrobras Global Finance BV | 7.375 | 01-17-27 | | 60,000 | 73,200 |
| QEP Resources, Inc. | 5.250 | 05-01-23 | | 105,000 | 103,950 |
| QEP Resources, Inc. | 5.375 | 10-01-22 | | 15,000 | 15,075 |
| QEP Resources, Inc. | 5.625 | 03-01-26 | | 87,000 | 84,847 |
| SM Energy Company | 5.000 | 01-15-24 | | 100,000 | 95,250 |
| SM Energy Company | 5.625 | 06-01-25 | | 50,000 | 47,459 |
| SM Energy Company | 6.125 | 11-15-22 | | 5,000 | 5,050 |
| SM Energy Company | 6.625 | 01-15-27 | | 85,000 | 83,543 |
| State Oil Company of the Azerbaijan Republic | 4.750 | 03-13-23 | | 200,000 | 209,894 |
| Sunoco LP | 5.500 | 02-15-26 | | 35,000 | 36,313 |
| Sunoco LP | 5.875 | 03-15-28 | | 20,000 | 21,236 |
| Sunoco LP | 6.000 | 04-15-27 | | 50,000 | 53,375 |
| Tallgrass Energy Partners LP (B) | 4.750 | 10-01-23 | | 110,000 | 109,725 |
| Targa Resources Partners LP (B) | 6.500 | 07-15-27 | | 215,000 | 235,425 |
| Vine Oil & Gas LP (B) | 8.750 | 04-15-23 | | 105,000 | 51,450 |
| WPX Energy, Inc. | 5.250 | 09-15-24 | | 125,000 | 132,813 |
| WPX Energy, Inc. | 5.750 | 06-01-26 | | 30,000 | 32,025 |
| WPX Energy, Inc. | 8.250 | 08-01-23 | | 40,000 | 46,000 |
| YPF SA | 7.000 | 12-15-47 | | 70,000 | 55,300 |
| SEE NOTES TO FINANCIAL STATEMENTS | ANNUAL REPORT | JOHN HANCOCK HEDGED EQUITY & INCOME FUND | 24 |
| | Rate (%) | Maturity date | | Par value^ | Value |
| Financials 1.6% | | | $2,907,216 |
| Banks 0.7% | | | |
| Abanca Corp. Bancaria SA (4.625% to 4-7-25, then 5 Year Euro Swap Rate + 5.014%) | 4.625 | 04-07-30 | EUR | 100,000 | 118,764 |
| Banco de Sabadell SA (6.500% to 5-18-22, then 5 Year Euro Swap Rate + 6.414%) (E) | 6.500 | 05-18-22 | EUR | 200,000 | 234,435 |
| Credit Agricole SA (8.125% to 12-23-25, then 5 Year U.S. Swap Rate + 6.185%) (B)(E) | 8.125 | 12-23-25 | | 250,000 | 303,019 |
| Freedom Mortgage Corp. (B) | 8.125 | 11-15-24 | | 160,000 | 157,203 |
| Turkiye Is Bankasi AS | 6.125 | 04-25-24 | | 200,000 | 199,491 |
| UniCredit SpA (5.861% to 6-19-27, then 5 Year U.S. ISDAFIX + 3.703%) (B) | 5.861 | 06-19-32 | | 200,000 | 208,496 |
| Capital markets 0.2% | | | |
| Credit Suisse Group AG (6.250% to 12-18-24, then 5 Year U.S. Swap Rate + 3.455%) (E) | 6.250 | 12-18-24 | | 200,000 | 217,550 |
| MSCI, Inc. (B) | 4.000 | 11-15-29 | | 145,000 | 146,994 |
| Consumer finance 0.4% | | | |
| Credit Acceptance Corp. (B) | 5.125 | 12-31-24 | | 75,000 | 77,885 |
| Credit Acceptance Corp. (B) | 6.625 | 03-15-26 | | 70,000 | 75,688 |
| DAE Funding LLC (B) | 4.500 | 08-01-22 | | 35,000 | 35,525 |
| DAE Funding LLC (B) | 5.000 | 08-01-24 | | 140,000 | 146,992 |
| goeasy, Ltd. (B) | 5.375 | 12-01-24 | | 95,000 | 96,741 |
| Navient Corp. | 5.500 | 01-25-23 | | 21,000 | 22,418 |
| Navient Corp. | 6.500 | 06-15-22 | | 80,000 | 86,700 |
| Springleaf Finance Corp. | 6.125 | 05-15-22 | | 120,000 | 128,850 |
| Springleaf Finance Corp. | 6.125 | 03-15-24 | | 5,000 | 5,475 |
| Springleaf Finance Corp. | 8.250 | 12-15-20 | | 155,000 | 162,634 |
| Insurance 0.3% | | | |
| Acrisure LLC (B) | 7.000 | 11-15-25 | | 125,000 | 120,625 |
| Acrisure LLC (B) | 8.125 | 02-15-24 | | 115,000 | 125,063 |
| Acrisure LLC (B) | 10.125 | 08-01-26 | | 75,000 | 80,813 |
| Genworth Holdings, Inc. | 4.800 | 02-15-24 | | 5,000 | 4,887 |
| Genworth Holdings, Inc. | 4.900 | 08-15-23 | | 100,000 | 99,000 |
| Genworth Holdings, Inc. | 7.200 | 02-15-21 | | 30,000 | 30,900 |
| Genworth Holdings, Inc. | 7.625 | 09-24-21 | | 20,000 | 21,068 |
| Health care 1.4% | | | 2,493,052 |
| Health care equipment and supplies 0.2% | | | |
| Constantin Investissement 3 SASU | 5.375 | 04-15-25 | EUR | 100,000 | 115,698 |
| Core & Main Holdings LP (8.625% Cash or 9.375% PIK) (B) | 8.625 | 09-15-24 | | 85,000 | 88,400 |
| Hill-Rom Holdings, Inc. (B) | 4.375 | 09-15-27 | | 80,000 | 82,300 |
| 25 | JOHN HANCOCK HEDGED EQUITY & INCOME FUND | ANNUAL REPORT | SEE NOTES TO FINANCIAL STATEMENTS |
| | Rate (%) | Maturity date | | Par value^ | Value |
| Health care (continued) | | | |
| Health care providers and services 0.4% | | | |
| Centene Corp. (B) | 4.250 | 12-15-27 | | 30,000 | $30,863 |
| Centene Corp. (B) | 4.625 | 12-15-29 | | 30,000 | 31,616 |
| Community Health Systems, Inc. (B) | 8.125 | 06-30-24 | | 50,000 | 41,000 |
| HCA Healthcare, Inc. | 6.250 | 02-15-21 | | 240,000 | 250,200 |
| HCA, Inc. | 5.375 | 09-01-26 | | 60,000 | 66,825 |
| HCA, Inc. | 5.625 | 09-01-28 | | 10,000 | 11,396 |
| HCA, Inc. | 5.875 | 02-01-29 | | 5,000 | 5,781 |
| HCA, Inc. | 7.500 | 11-15-95 | | 65,000 | 75,725 |
| West Street Merger Sub, Inc. (B) | 6.375 | 09-01-25 | | 140,000 | 139,650 |
| Life sciences tools and services 0.1% | | | |
| Avantor, Inc. (B) | 6.000 | 10-01-24 | | 200,000 | 213,246 |
| Charles River Laboratories International, Inc. (B) | 4.250 | 05-01-28 | | 25,000 | 25,469 |
| Pharmaceuticals 0.7% | | | |
| Bausch Health Companies, Inc. | 4.500 | 05-15-23 | EUR | 130,000 | 147,644 |
| Bausch Health Companies, Inc. (B) | 5.000 | 01-30-28 | | 135,000 | 138,563 |
| Bausch Health Companies, Inc. (B) | 5.500 | 03-01-23 | | 13,000 | 13,065 |
| Bausch Health Companies, Inc. (B) | 5.875 | 05-15-23 | | 108,000 | 108,945 |
| Bausch Health Companies, Inc. (B) | 6.125 | 04-15-25 | | 95,000 | 98,157 |
| Catalent Pharma Solutions, Inc. (B) | 4.875 | 01-15-26 | | 30,000 | 31,050 |
| Catalent Pharma Solutions, Inc. (B) | 5.000 | 07-15-27 | | 20,000 | 20,950 |
| Endo Finance LLC (B) | 5.375 | 01-15-23 | | 185,000 | 124,721 |
| IQVIA, Inc. (B) | 2.250 | 01-15-28 | EUR | 100,000 | 115,813 |
| Teva Pharmaceutical Finance Netherlands II BV | 1.250 | 03-31-23 | EUR | 100,000 | 104,245 |
| Teva Pharmaceutical Finance Netherlands III BV | 2.800 | 07-21-23 | | 225,000 | 208,688 |
| Teva Pharmaceutical Finance Netherlands III BV | 6.750 | 03-01-28 | | 200,000 | 203,042 |
| Industrials 1.2% | | | 2,102,252 |
| Aerospace and defense 0.4% | | | |
| Avolon Holdings Funding, Ltd. (B) | 3.950 | 07-01-24 | | 50,000 | 52,105 |
| Avolon Holdings Funding, Ltd. (B) | 5.250 | 05-15-24 | | 80,000 | 87,326 |
| Bombardier, Inc. (B) | 6.125 | 01-15-23 | | 130,000 | 133,315 |
| Bombardier, Inc. (B) | 7.875 | 04-15-27 | | 105,000 | 108,019 |
| TransDigm, Inc. (B) | 5.500 | 11-15-27 | | 100,000 | 101,123 |
| TransDigm, Inc. (B) | 6.250 | 03-15-26 | | 200,000 | 216,522 |
| Building products 0.1% | | | |
| Advanced Drainage Systems, Inc. (B) | 5.000 | 09-30-27 | | 25,000 | 25,781 |
| Standard Industries, Inc. (B) | 5.375 | 11-15-24 | | 55,000 | 56,513 |
| Commercial services and supplies 0.3% | | | |
| APX Group, Inc. | 7.625 | 09-01-23 | | 155,000 | 145,700 |
| SEE NOTES TO FINANCIAL STATEMENTS | ANNUAL REPORT | JOHN HANCOCK HEDGED EQUITY & INCOME FUND | 26 |
| | Rate (%) | Maturity date | | Par value^ | Value |
| Industrials (continued) | | | |
| Commercial services and supplies (continued) | | | |
| APX Group, Inc. | 7.875 | 12-01-22 | | 85,000 | $85,744 |
| Clean Harbors, Inc. (B) | 4.875 | 07-15-27 | | 104,000 | 109,460 |
| Clean Harbors, Inc. (B) | 5.125 | 07-15-29 | | 40,000 | 42,904 |
| IAA, Inc. (B) | 5.500 | 06-15-27 | | 55,000 | 58,438 |
| Stericycle, Inc. (B) | 5.375 | 07-15-24 | | 90,000 | 94,500 |
| Construction and engineering 0.0% | | | |
| Brand Industrial Services, Inc. (B) | 8.500 | 07-15-25 | | 60,000 | 61,500 |
| Electrical equipment 0.1% | | | |
| Sensata Technologies BV (B) | 5.000 | 10-01-25 | | 100,000 | 108,625 |
| Sensata Technologies BV (B) | 5.625 | 11-01-24 | | 80,000 | 89,000 |
| Trading companies and distributors 0.3% | | | |
| Beacon Roofing Supply, Inc. (B) | 4.500 | 11-15-26 | | 15,000 | 15,450 |
| Beacon Roofing Supply, Inc. (B) | 4.875 | 11-01-25 | | 90,000 | 90,450 |
| Herc Holdings, Inc. (B) | 5.500 | 07-15-27 | | 140,000 | 147,350 |
| United Rentals North America, Inc. | 4.625 | 10-15-25 | | 50,000 | 51,405 |
| United Rentals North America, Inc. | 4.875 | 01-15-28 | | 135,000 | 140,566 |
| United Rentals North America, Inc. | 5.875 | 09-15-26 | | 75,000 | 80,456 |
| Information technology 0.7% | | | 1,287,216 |
| IT services 0.1% | | | |
| Cardtronics, Inc. (B) | 5.500 | 05-01-25 | | 10,000 | 10,375 |
| Tempo Acquisition LLC (B) | 6.750 | 06-01-25 | | 240,000 | 247,800 |
| Semiconductors and semiconductor equipment 0.3% | | | |
| Entegris, Inc. (B) | 4.625 | 02-10-26 | | 145,000 | 150,075 |
| Micron Technology, Inc. | 4.640 | 02-06-24 | | 35,000 | 37,956 |
| Micron Technology, Inc. | 4.975 | 02-06-26 | | 90,000 | 99,833 |
| Qorvo, Inc. (B) | 4.375 | 10-15-29 | | 85,000 | 89,038 |
| Qorvo, Inc. | 5.500 | 07-15-26 | | 150,000 | 159,750 |
| Software 0.2% | | | |
| CDK Global, Inc. (B) | 5.250 | 05-15-29 | | 60,000 | 64,350 |
| Infor US, Inc. | 6.500 | 05-15-22 | | 50,000 | 50,750 |
| SS&C Technologies, Inc. (B) | 5.500 | 09-30-27 | | 150,000 | 160,125 |
| Technology hardware, storage and peripherals 0.1% | | | |
| Western Digital Corp. | 4.750 | 02-15-26 | | 35,000 | 36,488 |
| Xerox Corp. | 4.125 | 03-15-23 | | 140,000 | 145,075 |
| Xerox Corp. | 4.800 | 03-01-35 | | 10,000 | 9,226 |
| Xerox Corp. | 6.750 | 12-15-39 | | 25,000 | 26,375 |
| Materials 1.2% | | | 2,244,919 |
| Chemicals 0.1% | | | |
| CF Industries, Inc. | 4.950 | 06-01-43 | | 10,000 | 10,425 |
| CF Industries, Inc. | 5.150 | 03-15-34 | | 70,000 | 78,225 |
| 27 | JOHN HANCOCK HEDGED EQUITY & INCOME FUND | ANNUAL REPORT | SEE NOTES TO FINANCIAL STATEMENTS |
| | Rate (%) | Maturity date | | Par value^ | Value |
| Materials (continued) | | | |
| Chemicals (continued) | | | |
| CF Industries, Inc. | 5.375 | 03-15-44 | | 20,000 | $21,800 |
| Construction materials 0.0% | | | |
| American Builders & Contractors Supply Company, Inc. (B) | 4.000 | 01-15-28 | | 85,000 | 86,275 |
| Containers and packaging 0.7% | | | |
| ARD Finance SA (5.000% Cash or 5.750% PIK) (B) | 5.000 | 06-30-27 | EUR | 195,000 | 220,413 |
| Ardagh Packaging Finance PLC (B) | 2.125 | 08-15-26 | EUR | 105,000 | 121,731 |
| Ball Corp. | 1.500 | 03-15-27 | EUR | 125,000 | 141,142 |
| Berry Global, Inc. (B) | 1.500 | 01-15-27 | EUR | 106,000 | 119,792 |
| Berry Global, Inc. (B) | 5.625 | 07-15-27 | | 35,000 | 37,538 |
| Berry Global, Inc. | 6.000 | 10-15-22 | | 82,000 | 83,538 |
| Crown European Holdings SA | 2.875 | 02-01-26 | EUR | 225,000 | 273,545 |
| OI European Group BV (B) | 4.000 | 03-15-23 | | 10,000 | 10,075 |
| Owens-Brockway Glass Container, Inc. (B) | 5.875 | 08-15-23 | | 165,000 | 176,138 |
| Reynolds Group Issuer, Inc. (B) | 5.125 | 07-15-23 | | 155,000 | 158,681 |
| Metals and mining 0.3% | | | |
| Constellium SE | 4.250 | 02-15-26 | EUR | 125,000 | 145,821 |
| Novelis Corp. (B) | 5.875 | 09-30-26 | | 55,000 | 58,526 |
| Novelis Corp. (B) | 6.250 | 08-15-24 | | 135,000 | 141,581 |
| Steel Dynamics, Inc. | 4.125 | 09-15-25 | | 25,000 | 25,684 |
| Steel Dynamics, Inc. | 5.125 | 10-01-21 | | 85,000 | 85,051 |
| Paper and forest products 0.1% | | | |
| Flex Acquisition Company, Inc. (B) | 6.875 | 01-15-25 | | 175,000 | 176,313 |
| Norbord, Inc. (B) | 5.750 | 07-15-27 | | 70,000 | 72,625 |
| Real estate 0.3% | | | 568,010 |
| Equity real estate investment trusts 0.3% | | | |
| FelCor Lodging LP | 6.000 | 06-01-25 | | 240,000 | 250,800 |
| Iron Mountain, Inc. (B) | 4.875 | 09-15-29 | | 200,000 | 203,160 |
| VICI Properties LP (B) | 4.250 | 12-01-26 | | 60,000 | 61,800 |
| VICI Properties LP (B) | 4.625 | 12-01-29 | | 50,000 | 52,250 |
| Utilities 0.5% | | | 984,249 |
| Gas utilities 0.2% | | | |
| AmeriGas Partners LP | 5.500 | 05-20-25 | | 32,000 | 34,560 |
| AmeriGas Partners LP | 5.750 | 05-20-27 | | 40,000 | 43,900 |
| AmeriGas Partners LP | 5.875 | 08-20-26 | | 118,000 | 130,095 |
| Ferrellgas LP | 6.500 | 05-01-21 | | 25,000 | 21,625 |
| Ferrellgas LP | 6.750 | 01-15-22 | | 170,000 | 144,500 |
| Ferrellgas LP | 6.750 | 06-15-23 | | 68,000 | 57,460 |
| SEE NOTES TO FINANCIAL STATEMENTS | ANNUAL REPORT | JOHN HANCOCK HEDGED EQUITY & INCOME FUND | 28 |
| | Rate (%) | Maturity date | | Par value^ | Value |
| Utilities (continued) | | | |
| Independent power and renewable electricity producers 0.2% | | | |
| Clearway Energy Operating LLC (B) | 4.750 | 03-15-28 | | 65,000 | $65,894 |
| NextEra Energy Operating Partners LP (B) | 4.250 | 07-15-24 | | 70,000 | 72,888 |
| The AES Corp. | 5.125 | 09-01-27 | | 190,000 | 202,825 |
| Water utilities 0.1% | | | |
|
| Aegea Finance Sarl (B) | 5.750 | 10-10-24 | | 200,000 | 210,502 |
| Convertible bonds 0.1% | | | | | $237,921 |
| (Cost $251,343) | | | | | |
| Consumer discretionary 0.0% | | | 57,638 |
| Hotels, restaurants and leisure 0.0% | | | |
| Caesars Entertainment Corp. | 5.000 | 10-01-24 | | 30,000 | 57,638 |
| Information technology 0.1% | | | 180,283 |
| IT services 0.0% | | | |
| Cardtronics, Inc. | 1.000 | 12-01-20 | | 70,000 | 74,510 |
| Technology hardware, storage and peripherals 0.1% | | | |
|
| Western Digital Corp. | 1.500 | 02-01-24 | | 108,000 | 105,773 |
| Term loans (F) 0.7% | | | | | $1,272,275 |
| (Cost $1,262,755) | | | | | |
| Consumer discretionary 0.1% | 183,808 |
| Hotels, restaurants and leisure 0.1% |
| Golden Entertainment, Inc., 2017 1st Lien Term Loan (1 month LIBOR + 3.000%) | 4.800 | 10-21-24 | | 183,350 | 183,808 |
| Financials 0.2% | 373,037 |
| Diversified financial services 0.0% |
| Crown Finance US, Inc., 2018 USD Term Loan (1 month LIBOR + 2.250%) | 4.049 | 02-28-25 | | 81,709 | 81,597 |
| Insurance 0.2% |
| Asurion LLC, 2018 Term Loan B7 (1 month LIBOR + 3.000%) | 4.799 | 11-03-24 | | 192,075 | 193,070 |
| HUB International, Ltd., 2018 Term Loan B (3 month LIBOR + 2.750%) | 4.690 | 04-25-25 | | 98,500 | 98,370 |
| Health care 0.0% | 57,467 |
| Life sciences tools and services 0.0% |
| Syneos Health, Inc., 2018 Term Loan B (1 month LIBOR + 2.000%) | 3.799 | 08-01-24 | | 57,181 | 57,467 |
| 29 | JOHN HANCOCK HEDGED EQUITY & INCOME FUND | ANNUAL REPORT | SEE NOTES TO FINANCIAL STATEMENTS |
| | Rate (%) | Maturity date | | Par value^ | Value |
| Industrials 0.3% | $448,520 |
| Commercial services and supplies 0.1% |
| AVSC Holding Corp., 2018 1st Lien Term Loan (1 and 3 month LIBOR + 3.250%) | 5.091 | 03-03-25 | | 98,250 | 97,759 |
| Pitney Bowes, Inc., Term Loan B (G) | TBD | 12-05-26 | | 100,000 | 98,781 |
| Professional services 0.2% |
| The Dun & Bradstreet Corp., Term Loan (1 month LIBOR + 5.000%) | 6.792 | 02-06-26 | | 250,000 | 251,980 |
| Information technology 0.1% | 209,443 |
| IT services 0.1% |
| Blackhawk Network Holdings, Inc., 2018 1st Lien Term Loan (1 month LIBOR + 3.000%) | 4.799 | 06-15-25 | | 98,500 | 98,398 |
| Semiconductors and semiconductor equipment 0.0% |
| Microchip Technology, Inc., 2018 Term Loan B (1 month LIBOR + 2.000%) | 3.800 | 05-29-25 | | 57,489 | 57,777 |
| Software 0.0% |
| SS&C European Holdings Sarl, 2018 Term Loan B4 (1 month LIBOR + 2.250%) | 4.049 | 04-16-25 | | 21,671 | 21,811 |
|
| SS&C Technologies, Inc., 2018 Term Loan B3 (1 month LIBOR + 2.250%) | 4.049 | 04-16-25 | | 31,256 | 31,457 |
| Escrow certificates 0.0% | | | | | $750 |
| (Cost $194) | | | | | |
| Texas Competitive Electric Holdings Company LLC (A)(D) | 11.500 | 10-01-20 | | 500,000 | 750 |
|
| | | | | Par value^ | Value |
| Short-term investments 0.1% | | | | | $100,000 |
| (Cost $100,000) | | | | | |
| Repurchase agreement 0.1% | | | | | 100,000 |
| Goldman Sachs Tri-Party Repurchase Agreement dated 12-31-19 at 1.550% to be repurchased at $100,009 on 1-2-20, collateralized by $94,015 Government National Mortgage Association, 4.500% due 4-20-47 (valued at $102,000) | | | | 100,000 | 100,000 |
|
| Total investments (Cost $182,236,538) 98.4% | | | $178,587,751 |
| Other assets and liabilities, net 1.6% | | | | 2,933,139 |
| Total net assets 100.0% | | | | | $181,520,890 |
| The percentage shown for each investment category is the total value of the category as a percentage of the net assets of the fund unless otherwise indicated. |
| ^All par values are denominated in U.S. dollars unless otherwise indicated. |
| SEE NOTES TO FINANCIAL STATEMENTS | ANNUAL REPORT | JOHN HANCOCK HEDGED EQUITY & INCOME FUND | 30 |
| Currency Abbreviations |
| EUR | Euro |
| Security Abbreviations and Legend |
| ADR | American Depositary Receipt |
| GDR | Global Depositary Receipt |
| ISDAFIX | International Swaps and Derivatives Association Fixed Interest Rate Swap Rate |
| LIBOR | London Interbank Offered Rate |
| NVDR | Non-Voting Depositary Receipt |
| PIK | Pay-in-Kind Security - Represents a payment-in-kind which may pay interest in additional par and/or cash. Rates shown are the current rate and most recent payment rate. |
| (A) | Non-income producing security. |
| (B) | These securities are exempt from registration under Rule 144A of the Securities Act of 1933. Such securities may be resold, normally to qualified institutional buyers, in transactions exempt from registration. |
| (C) | Restricted security as to resale, excluding 144A securities. For more information on this security refer to the Notes to financial statements. |
| (D) | Security is valued using significant unobservable inputs and is classified as Level 3 in the fair value hierarchy. Refer to Note 2 to the financial statements. |
| (E) | Perpetual bonds have no stated maturity date. Date shown as maturity date is next call date. |
| (F) | Term loans are variable rate obligations. The coupon rate shown represents the rate at period end. |
| (G) | This position represents an unsettled loan commitment at period end. Certain details associated with this purchase are not known prior to the settlement date, including coupon rate, which is disclosed as TBD (To Be Determined). |
The fund had the following country composition as a percentage of net assets on 12-31-19:
| United States | 41.3% |
| Japan | 10.2% |
| United Kingdom | 7.0% |
| France | 6.2% |
| Canada | 5.3% |
| Netherlands | 4.0% |
| Switzerland | 3.3% |
| Germany | 2.2% |
| Australia | 1.8% |
| China | 1.5% |
| Other countries | 17.2% |
| TOTAL | 100.0% |
| 31 | JOHN HANCOCK HEDGED EQUITY & INCOME FUND | ANNUAL REPORT | SEE NOTES TO FINANCIAL STATEMENTS |
DERIVATIVES
FUTURES
| Open contracts | Number of
contracts | Position | Expiration
date | Notional
basis^ | Notional
value^ | Unrealized
appreciation
(depreciation) |
| Euro STOXX 50 Index Futures | 159 | Short | Mar 2020 | $(6,662,845) | $(6,650,682) | $12,163 |
| FTSE 100 Index Futures | 43 | Short | Mar 2020 | (4,240,720) | (4,271,265) | (30,545) |
| MSCI EAFE Index Futures | 124 | Short | Mar 2020 | (12,649,932) | (12,626,297) | 23,635 |
| | | | | | | $5,253 |
^ Notional basis refers to the contractual amount agreed upon at inception of open contracts; notional value represents the current value of the open contract.
FORWARD FOREIGN CURRENCY CONTRACTS
| Contract to buy | Contract to sell | Counterparty (OTC) | Contractual
settlement
date | Unrealized
appreciation | Unrealized
depreciation |
| CAD | 145,000 | USD | 109,087 | CITI | 1/10/2020 | $2,582 | — |
| EUR | 1,227,000 | USD | 1,355,955 | BNP | 1/10/2020 | 20,972 | — |
| EUR | 32,000 | USD | 35,984 | SSB | 1/31/2020 | — | $(27) |
| GBP | 438,000 | USD | 565,167 | MSI | 1/10/2020 | 15,126 | — |
| USD | 115,879 | EUR | 105,000 | BNP | 1/10/2020 | — | (1,951) |
| USD | 115,792 | EUR | 104,000 | GSI | 1/10/2020 | — | (915) |
| USD | 90,588 | EUR | 81,000 | MSI | 1/10/2020 | — | (309) |
| USD | 117,731 | EUR | 106,000 | SSB | 1/10/2020 | — | (1,222) |
| USD | 11,905,766 | EUR | 10,665,000 | CITI | 3/18/2020 | — | (113,350) |
| USD | 7,566,282 | GBP | 5,784,000 | MSI | 3/18/2020 | — | (111,006) |
| | | | | | | $38,680 | $(228,780) |
SWAPS
| Credit default swaps - Seller |
Counterparty
(OTC)/
Centrally
cleared | Reference
obligation | Implied
credit
spread | Notional
amount | Currency | USD
notional
amount | Received
fixed
rate | Fixed
payment
frequency | Maturity
date | Unamortized
upfront
payment
paid
(received) | Unrealized
appreciation
(depreciation) | Value |
| Centrally cleared | CDX.NA.HY.33 | 3.384% | 495,000 | USD | $495,000 | 5.000% | Quarterly | Dec 2024 | $35,506 | $12,955 | $48,461 |
| | | | | | $495,000 | | | | $35,506 | $12,955 | $48,461 |
| Derivatives Currency Abbreviations |
| CAD | Canadian Dollar |
| EUR | Euro |
| GBP | Pound Sterling |
| USD | U.S. Dollar |
| Derivatives Abbreviations |
| BNP | BNP Paribas |
| CITI | Citibank, N.A. |
| GSI | Goldman Sachs International |
| MSI | Morgan Stanley & Co. International PLC |
| SEE NOTES TO FINANCIAL STATEMENTS | ANNUAL REPORT | JOHN HANCOCK HEDGED EQUITY & INCOME FUND | 32 |
| OTC | Over-the-counter |
| SSB | State Street Bank and Trust Company |
At 12-31-19, the aggregate cost of investments for federal income tax purposes was $182,959,214. Net unrealized depreciation aggregated to $4,507,849, of which $8,765,401 related to gross unrealized appreciation and $13,273,250 related to gross unrealized depreciation.
See Notes to financial statements regarding investment transactions and other derivatives information.
| 33 | JOHN HANCOCK HEDGED EQUITY & INCOME FUND | ANNUAL REPORT | SEE NOTES TO FINANCIAL STATEMENTS |
STATEMENT OF ASSETS AND LIABILITIES 12-31-19
| Assets | |
| Unaffiliated investments, at value (Cost $182,236,538) | $178,587,751 |
| Receivable for centrally cleared swaps | 126,586 |
| Unrealized appreciation on forward foreign currency contracts | 38,680 |
| Cash | 86,059 |
| Foreign currency, at value (Cost $531,686) | 533,343 |
| Collateral held at broker for futures contracts | 1,288,800 |
| Collateral segregated at custodian for OTC derivative contracts | 100,000 |
| Dividends and interest receivable | 1,201,438 |
| Receivable for investments sold | 747,901 |
| Other assets | 4,576 |
| Total assets | 182,715,134 |
| Liabilities | |
| Unrealized depreciation on forward foreign currency contracts | 228,780 |
| Payable for futures variation margin | 46,773 |
| Payable for investments purchased | 863,138 |
| Payable to affiliates | |
| Accounting and legal services fees | 10,496 |
| Trustees' fees | 192 |
| Other liabilities and accrued expenses | 44,865 |
| Total liabilities | 1,194,244 |
| Net assets | $181,520,890 |
| Net assets consist of | |
| Paid-in capital | $190,546,477 |
| Total distributable earnings (loss) | (9,025,587) |
| Net assets | $181,520,890 |
| |
| Net asset value per share | |
| Based on 12,223,813 shares of beneficial interest outstanding - unlimited number of shares authorized with $0.01 par value | $14.85 |
| SEE NOTES TO FINANCIAL STATEMENTS | ANNUAL REPORT | JOHN HANCOCK Hedged Equity & Income Fund | 34 |
STATEMENT OF OPERATIONS For the year ended 12-31-19
| Investment income | |
| Dividends | $8,188,788 |
| Interest | 1,723,474 |
| Less foreign taxes withheld | (630,936) |
| Total investment income | 9,281,326 |
| Expenses | |
| Investment management fees | 1,724,840 |
| Accounting and legal services fees | 38,874 |
| Transfer agent fees | 17,851 |
| Trustees' fees | 43,277 |
| Custodian fees | 79,862 |
| Printing and postage | 62,014 |
| Professional fees | 74,173 |
| Stock exchange listing fees | 23,750 |
| Other | 16,982 |
| Total expenses | 2,081,623 |
| Less expense reductions | (13,421) |
| Net expenses | 2,068,202 |
| Net investment income | 7,213,124 |
| Realized and unrealized gain (loss) | |
| Net realized gain (loss) on | |
| Unaffiliated investments and foreign currency transactions | 1,965,266 |
| Futures contracts | (3,272,346) |
| Forward foreign currency contracts | 450,762 |
| Written options | (2,955,789) |
| Swap contracts | (6,730) |
| | (3,818,837) |
| Change in net unrealized appreciation (depreciation) of | |
| Unaffiliated investments and translation of assets and liabilities in foreign currencies | 19,736,548 |
| Futures contracts | (136,063) |
| Forward foreign currency contracts | (728) |
| Written options | 95,951 |
| Swap contracts | 12,955 |
| | 19,708,663 |
| Net realized and unrealized gain | 15,889,826 |
| Increase in net assets from operations | $23,102,950 |
| 35 | JOHN HANCOCK Hedged Equity & Income Fund | ANNUAL REPORT | SEE NOTES TO FINANCIAL STATEMENTS |
STATEMENTS OF CHANGES IN NET ASSETS
| | Year ended
12-31-19 | Year ended
12-31-18 |
| Increase (decrease) in net assets | | |
| From operations | | |
| Net investment income | $7,213,124 | $7,722,756 |
| Net realized gain (loss) | (3,818,837) | 6,567,319 |
| Change in net unrealized appreciation (depreciation) | 19,708,663 | (34,683,257) |
| Increase (decrease) in net assets resulting from operations | 23,102,950 | (20,393,182) |
| Distributions to shareholders | | |
| From earnings | (8,240,605) | (15,279,209) |
| From tax return of capital | (10,129,197) | (3,083,603) |
| Total distributions | (18,369,802) | (18,362,812) |
| Fund share transactions | | |
| Issued pursuant to Dividend Reinvestment Plan | 146,258 | 151,230 |
| Total increase (decrease) | 4,879,406 | (38,604,764) |
| Net assets | | |
| Beginning of year | 176,641,484 | 215,246,248 |
| End of year | $181,520,890 | $176,641,484 |
| Share activity | | |
| Shares outstanding | | |
| Beginning of year | 12,213,964 | 12,204,669 |
| Issued pursuant to Dividend Reinvestment Plan | 9,849 | 9,295 |
| End of year | 12,223,813 | 12,213,964 |
| SEE NOTES TO FINANCIAL STATEMENTS | ANNUAL REPORT | JOHN HANCOCK Hedged Equity & Income Fund | 36 |
| Period ended | 12-31-19 | 12-31-18 | 12-31-17 | 12-31-16 | 12-31-15 |
| Per share operating performance | | | | | |
| Net asset value, beginning of period | $14.46 | $17.64 | $16.84 | $16.78 | $18.22 |
| Net investment income1 | 0.59 | 0.63 | 0.52 | 0.42 | 0.39 |
| Net realized and unrealized gain (loss) on investments | 1.30 | (2.31) | 1.94 | 1.09 | (0.51) |
| Total from investment operations | 1.89 | (1.68) | 2.46 | 1.51 | (0.12) |
| Less distributions | | | | | |
| From net investment income | (0.67) | (0.86) | (0.49) | (0.41) | (0.44) |
| From net realized gain | — | (0.39) | (1.17) | (0.24) | (0.91) |
| From tax return of capital | (0.83) | (0.25) | — | (0.85) | (0.15) |
| Total distributions | (1.50) | (1.50) | (1.66) | (1.50) | (1.50) |
| Anti-dilutive impact of repurchase plan | — | — | — | 0.052 | 0.182 |
| Net asset value, end of period | $14.85 | $14.46 | $17.64 | $16.84 | $16.78 |
| Per share market value, end of period | $14.91 | $13.08 | $17.41 | $15.72 | $14.46 |
| Total return at net asset value (%)3,4 | 13.89 | (9.61) | 15.15 | 10.46 | 1.56 |
| Total return at market value (%)3 | 26.41 | (17.16) | 21.74 | 19.66 | (2.29) |
| Ratios and supplemental data | | | | | |
| Net assets, end of period (in millions) | $182 | $177 | $215 | $206 | $210 |
| Ratios (as a percentage of average net assets): | | | | | |
| Expenses before reductions | 1.15 | 1.14 | 1.13 | 1.15 | 1.16 |
| Expenses including reductions | 1.14 | 1.13 | 1.13 | 1.14 | 1.15 |
| Net investment income | 3.97 | 3.83 | 2.99 | 2.52 | 2.17 |
| Portfolio turnover (%) | 125 | 96 | 93 | 43 | 43 |
| 1 | Based on average daily shares outstanding. |
| 2 | The repurchase plan was completed at an average repurchase price of $14.17 and $15.71 for 312,533 shares and 1,120,307 shares shares for the periods ended 12-31-16 and 12-31-15, respectively. |
| 3 | Total return based on net asset value reflects changes in the fund’s net asset value during each period. Total return based on market value reflects changes in market value. Each figure assumes that distributions from income, capital gains and tax return of capital, if any, were reinvested. |
| 4 | Total returns would have been lower had certain expenses not been reduced during the applicable periods. |
| 37 | JOHN HANCOCK Hedged Equity & Income Fund | ANNUAL REPORT | SEE NOTES TO FINANCIAL STATEMENTS |
| Notes to financial statements | |
Note 1—Organization
John Hancock Hedged Equity & Income Fund (the fund) is a closed-end management investment company organized as a Massachusetts business trust and registered under the Investment Company Act of 1940, as amended (the 1940 Act).
Note 2—Significant accounting policies
The financial statements have been prepared in conformity with accounting principles generally accepted in the United States of America (US GAAP), which require management to make certain estimates and assumptions as of the date of the financial statements. Actual results could differ from those estimates and those differences could be significant. The fund qualifies as an investment company under Topic 946 of Accounting Standards Codification of US GAAP.
Events or transactions occurring after the end of the fiscal period through the date that the financial statements were issued have been evaluated in the preparation of the financial statements. The following summarizes the significant accounting policies of the fund:
Security valuation. Investments are stated at value as of the scheduled close of regular trading on the New York Stock Exchange (NYSE), normally at 4:00 P.M., Eastern Time. In case of emergency or other disruption resulting in the NYSE not opening for trading or the NYSE closing at a time other than the regularly scheduled close, the net asset value (NAV) may be determined as of the regularly scheduled close of the NYSE pursuant to the fund's Valuation Policies and Procedures.
In order to value the securities, the fund uses the following valuation techniques: Equity securities, including exchange-traded or closed-end funds, are typically valued at the last sale price or official closing price on the exchange or principal market where the security trades. In the event there were no sales during the day or closing prices are not available, the securities are valued using the last available bid price. Debt obligations are typically valued based on the evaluated prices provided by an independent pricing vendor. Independent pricing vendors utilize matrix pricing, which takes into account factors such as institutional-size trading in similar groups of securities, yield, quality, coupon rate, maturity, type of issue, trading characteristics and other market data, as well as broker supplied prices. Futures contracts are typically valued at last traded price on the exchange on which they trade. Swaps are generally valued using evaluated prices obtained from an independent pricing vendor. Forward foreign currency contracts are valued at the prevailing forward rates which are based on foreign currency exchange spot rates and forward points supplied by an independent pricing vendor. Foreign securities and currencies are valued in U.S. dollars based on foreign currency exchange rates supplied by an independent pricing vendor.
In certain instances, the Pricing Committee may determine to value equity securities using prices obtained from another exchange or market if trading on the exchange or market on which prices are typically obtained did not open for trading as scheduled, or if trading closed earlier than scheduled, and trading occurred as normal on another exchange or market.
Other portfolio securities and assets, for which reliable market quotations are not readily available, are valued at fair value as determined in good faith by the fund's Pricing Committee following procedures established by the Board of Trustees. The frequency with which these fair valuation procedures are used cannot be predicted and fair value of securities may differ significantly from the value that would have been used had a ready market for such securities existed. Trading in foreign securities may be completed before the scheduled daily close of trading on the NYSE. Significant events at the issuer or market level may affect the values of securities between the time when the valuation of the securities is generally determined and the close of the NYSE. If a significant event occurs,
| | ANNUAL REPORT | JOHN HANCOCK Hedged Equity & Income Fund | 38 |
these securities may be fair valued, as determined in good faith by the fund's Pricing Committee, following procedures established by the Board of Trustees. The fund uses fair value adjustment factors provided by an independent pricing vendor to value certain foreign securities in order to adjust for events that may occur between the close of foreign exchanges or markets and the close of the NYSE.
The fund uses a three-tier hierarchy to prioritize the pricing assumptions, referred to as inputs, used in valuation techniques to measure fair value. Level 1 includes securities valued using quoted prices in active markets for identical securities, including registered investment companies. Level 2 includes securities valued using other significant observable inputs. Observable inputs may include quoted prices for similar securities, interest rates, prepayment speeds and credit risk. Prices for securities valued using these inputs are received from independent pricing vendors and brokers and are based on an evaluation of the inputs described. Level 3 includes securities valued using significant unobservable inputs when market prices are not readily available or reliable, including the fund's own assumptions in determining the fair value of investments. Factors used in determining value may include market or issuer specific events or trends, changes in interest rates and credit quality. The inputs or methodology used for valuing securities are not necessarily an indication of the risks associated with investing in those securities. Changes in valuation techniques and related inputs may result in transfers into or out of an assigned level within the disclosure hierarchy.
The following is a summary of the values by input classification of the fund's investments as of December 31, 2019, by major security category or type:
| | Total
value at
12-31-19 | Level 1
quoted
price | Level 2
significant
observable
inputs | Level 3
significant
unobservable
inputs |
| Investments in securities: | | | | |
| Assets | | | | |
| Common stocks | | | | |
| Communication services | $17,741,599 | $6,700,861 | $11,040,738 | — |
| Consumer discretionary | 12,428,280 | 4,143,599 | 8,192,524 | $92,157 |
| Consumer staples | 9,862,371 | 5,776,736 | 4,085,635 | — |
| Energy | 13,814,259 | 6,270,683 | 7,543,576 | — |
| Financials | 29,779,862 | 9,021,602 | 20,758,260 | — |
| Health care | 13,468,899 | 8,710,984 | 4,757,915 | — |
| Industrials | 13,603,110 | 4,546,035 | 9,057,075 | — |
| Information technology | 15,145,530 | 10,244,091 | 4,901,439 | — |
| Materials | 5,014,073 | 1,508,293 | 3,505,780 | — |
| Real estate | 6,964,376 | 2,431,503 | 4,532,873 | — |
| Utilities | 12,848,424 | 5,014,807 | 7,833,617 | — |
| Preferred securities | 1,225,749 | — | 1,225,749 | — |
| Exchange-traded funds | 96,555 | 96,555 | — | — |
| Corporate bonds | 24,983,718 | — | 24,983,718 | — |
| Convertible bonds | 237,921 | — | 237,921 | — |
| Term loans | 1,272,275 | — | 1,272,275 | — |
| Escrow certificates | 750 | — | — | 750 |
| Short-term investments | 100,000 | — | 100,000 | — |
| Total investments in securities | $178,587,751 | $64,465,749 | $114,029,095 | $92,907 |
| 39 | JOHN HANCOCK Hedged Equity & Income Fund | ANNUAL REPORT | |
| | Total
value at
12-31-19 | Level 1
quoted
price | Level 2
significant
observable
inputs | Level 3
significant
unobservable
inputs |
| Derivatives: | | | | |
| Assets | | | | |
| Futures | $35,798 | $35,798 | — | — |
| Forward foreign currency contracts | 38,680 | — | $38,680 | — |
| Swap contracts | 48,461 | — | 48,461 | — |
| Liabilities | | | | |
| Futures | (30,545) | (30,545) | — | — |
| Forward foreign currency contracts | (228,780) | — | (228,780) | — |
Repurchase agreements. The fund may enter into repurchase agreements. When the fund enters into a repurchase agreement, it receives collateral that is held in a segregated account by the fund's custodian, or for tri-party repurchase agreements, collateral is held at a third-party custodian bank in a segregated account for the benefit of the fund. The collateral amount is marked-to-market and monitored on a daily basis to ensure that the collateral held is in an amount not less than the principal amount of the repurchase agreement plus any accrued interest. Collateral received by the fund for repurchase agreements is disclosed in the Fund's investments as part of the caption related to the repurchase agreement.
Repurchase agreements are typically governed by the terms and conditions of the Master Repurchase Agreement and/or Global Master Repurchase Agreement (collectively, MRA). Upon an event of default, the non-defaulting party may close out all transactions traded under the MRA and net amounts owed. Absent an event of default, assets and liabilities resulting from repurchase agreements are not offset in the Statement of assets and liabilities. In the event of a default by the counterparty, realization of the collateral proceeds could be delayed, during which time the collateral value may decline or the counterparty may have insufficient assets to pay claims resulting from close-out of the transactions.
Security transactions and related investment income. Investment security transactions are accounted for on a trade date plus one basis for daily NAV calculations. However, for financial reporting purposes, investment transactions are reported on trade date. Interest income is accrued as earned. Interest income includes coupon interest and amortization/accretion of premiums/discounts on debt securities. Debt obligations may be placed in a non-accrual status and related interest income may be reduced by stopping current accruals and writing off interest receivable when the collection of all or a portion of interest has become doubtful. Dividend income is recorded on the ex-date, except for dividends of certain foreign securities where the dividend may not be known until after the ex-date. In those cases, dividend income, net of withholding taxes, is recorded when the fund becomes aware of the dividends. Non-cash dividends, if any, are recorded at the fair market value of the securities received. Distributions received on securities that represent a tax return of capital and/or capital gain, if any, are recorded as a reduction of cost of investments and/or as a realized gain, if amounts are estimable. Gains and losses on securities sold are determined on the basis of identified cost and may include proceeds from litigation.
Real estate investment trusts. The fund may invest in real estate investment trusts (REITs). Distributions from REITs may be recorded as income and subsequently characterized by the REIT at the end of the fiscal year as a reduction of cost of investments and/or as a realized gain. As a result, the fund will estimate the components of distributions from these securities. Such estimates are revised when the actual components of the distributions are known.
| | ANNUAL REPORT | JOHN HANCOCK Hedged Equity & Income Fund | 40 |
Foreign investing. Assets, including investments, and liabilities denominated in foreign currencies are translated into U.S. dollar values each day at the prevailing exchange rate. Purchases and sales of securities, income and expenses are translated into U.S. dollars at the prevailing exchange rate on the date of the transaction. The effect of changes in foreign currency exchange rates on the value of securities is reflected as a component of the realized and unrealized gains (losses) on investments. Foreign investments are subject to a decline in the value of a foreign currency versus the U.S. dollar, which reduces the dollar value of securities denominated in that currency.
Funds that invest internationally generally carry more risk than funds that invest strictly in U.S. securities. Risks can result from differences in economic and political conditions, regulations, market practices (including higher transaction costs), accounting standards and other factors.
Foreign taxes. The fund may be subject to withholding tax on income, capital gains or repatriation taxes imposed by certain countries, a portion of which may be recoverable. Foreign taxes are accrued based upon the fund's understanding of the tax rules and rates that exist in the foreign markets in which it invests. Taxes are accrued based on gains realized by the fund as a result of certain foreign security sales. In certain circumstances, estimated taxes are accrued based on unrealized appreciation of such securities. Investment income is recorded net of foreign withholding taxes.
Overdrafts. Pursuant to the custodian agreement, the fund’s custodian may, in its discretion, advance funds to the fund to make properly authorized payments. When such payments result in an overdraft, the fund is obligated to repay the custodian for any overdraft, including any costs or expenses associated with the overdraft. The custodian may have a lien, security interest or security entitlement in any fund property that is not otherwise segregated or pledged, to the maximum extent permitted by law, to the extent of any overdraft.
Expenses. Within the John Hancock group of funds complex, expenses that are directly attributable to an individual fund are allocated to such fund. Expenses that are not readily attributable to a specific fund are allocated among all funds in an equitable manner, taking into consideration, among other things, the nature and type of expense and the fund’s relative net assets. Expense estimates are accrued in the period to which they relate and adjustments are made when actual amounts are known.
Change in accounting principle. Accounting Standards Update (ASU) 2017-08,Premium Amortization on Purchased Callable Debt Securities, shortens the premium amortization period for purchased non contingently callable debt securities and is effective for public companies with fiscal years beginning after December 15, 2018. Adoption of the ASU did not have a material impact to the fund.
Federal income taxes. The fund intends to continue to qualify as a regulated investment company by complying with the applicable provisions of the Internal Revenue Code and will not be subject to federal income tax on taxable income that is distributed to shareholders. Therefore, no federal income tax provision is required.
For federal income tax purposes, as of December 31, 2019, the fund has a short-term capital loss carryforward of $1,945,410 and a long-term capital loss carryforward of $2,578,488 available to offset future net realized capital gains. These carryforwards do not expire.
As of December 31, 2019, the fund had no uncertain tax positions that would require financial statement recognition, derecognition or disclosure. The fund's federal tax returns are subject to examination by the Internal Revenue Service for a period of three years.
Managed distribution plan. The fund has adopted a managed distribution plan (Plan). Under the current Plan, the fund makes quarterly distributions of an amount equal to $0.3760 per share, which will be paid quarterly until further notice.
| 41 | JOHN HANCOCK Hedged Equity & Income Fund | ANNUAL REPORT | |
Distributions under the Plan may consist of net investment income, net realized capital gains and, to the extent necessary, return of capital. Return of capital distributions may be necessary when the fund’s net investment income and net capital gains are insufficient to meet the minimum distribution. In addition, the fund may also make additional distributions for the purpose of not incurring federal income and excise taxes.
The Board of Trustees may terminate or reduce the amount paid under the Plan at any time. The termination or reduction may have an adverse effect on the market price of the fund’s shares.
Distribution of income and gains. Distributions to shareholders from net investment income and net realized gains, if any, are recorded on the ex-date. The fund generally declares and pays dividends quarterly pursuant to the Managed Distribution Plan described above. Capital gain distributions, if any, are typically distributed annually.
The tax character of distributions for the years ended December 31, 2019 and 2018 was as follows:
| | December 31, 2019 | December 31, 2018 |
| Ordinary income | $8,240,605 | $10,470,364 |
| Long-term capital gains | — | 4,808,845 |
| Return of capital | 10,129,197 | 3,083,603 |
| Total | $18,369,802 | $18,362,812 |
As of December 31, 2019, there were no distributable earnings on a tax basis.
Such distributions and distributable earnings, on a tax basis, are determined in conformity with income tax regulations, which may differ from US GAAP. Distributions in excess of tax basis earnings and profits, if any, are reported in the fund's financial statements as a return of capital.
Capital accounts within the financial statements are adjusted for permanent book-tax differences. These adjustments have no impact on net assets or the results of operations. Temporary book-tax differences, if any, will reverse in a subsequent period. Book-tax differences are primarily attributable to foreign currency transactions, investments in passive foreign investment companies, derivative transactions and wash sale loss deferrals.
Note 3—Derivative instruments
The fund may invest in derivatives in order to meet its investment objective. Derivatives include a variety of different instruments that may be traded in the over-the-counter (OTC) market, on a regulated exchange or through a clearing facility. The risks in using derivatives vary depending upon the structure of the instruments, including the use of leverage, optionality, the liquidity or lack of liquidity of the contract, the creditworthiness of the counterparty or clearing organization and the volatility of the position. Some derivatives involve risks that are potentially greater than the risks associated with investing directly in the referenced securities or other referenced underlying instrument. Specifically, the fund is exposed to the risk that the counterparty to an OTC derivatives contract will be unable or unwilling to make timely settlement payments or otherwise honor its obligations. OTC derivatives transactions typically can only be closed out with the other party to the transaction.
Derivatives which are typically traded through the OTC market are regulated by the Commodity Futures Trading Commission (the CFTC). Derivative counterparty risk is managed through an ongoing evaluation of the creditworthiness of all potential counterparties and, if applicable, designated clearing organizations. The fund attempts to reduce its exposure to counterparty risk for derivatives traded in the OTC market, whenever possible, by entering into an International Swaps and Derivatives Association (ISDA) Master Agreement with each of its OTC counterparties. The ISDA gives each party to the agreement the right to terminate all transactions traded under the
| | ANNUAL REPORT | JOHN HANCOCK Hedged Equity & Income Fund | 42 |
agreement if there is certain deterioration in the credit quality or contractual default of the other party, as defined in the ISDA. Upon an event of default or a termination of the ISDA, the non-defaulting party has the right to close out all transactions and to net amounts owed.
As defined by the ISDA, the fund may have collateral agreements with certain counterparties to mitigate counterparty risk on OTC derivatives. Subject to established minimum levels, collateral for OTC transactions is generally determined based on the net aggregate unrealized gain or loss on contracts with a particular counterparty. Collateral pledged to the fund, if any, is held in a segregated account by a third-party agent or held by the custodian bank for the benefit of the fund and can be in the form of cash or debt securities issued by the U.S. government or related agencies; collateral posted by the fund, if any, for OTC transactions is held in a segregated account at the fund's custodian and is noted in the accompanying Fund's investments, or if cash is posted, on the Statement of assets and liabilities. The fund's risk of loss due to counterparty risk is equal to the asset value of outstanding contracts offset by collateral received.
Certain derivatives are traded or cleared on an exchange or central clearinghouse. Exchange-traded or centrally-cleared transactions generally present less counterparty risk to a fund than OTC transactions. The exchange or clearinghouse stands between the fund and the broker to the contract and therefore, credit risk is generally limited to the failure of the exchange or clearinghouse and the clearing member.
Centrally-cleared swap contracts are subject to clearinghouse rules, including initial and variation margin requirements, daily settlement of obligations and the clearinghouse guarantee of payments to the broker. There is, however, still counterparty risk due to the potential insolvency of the broker with respect to any margin held in the brokers’ customer accounts. While clearing members are required to segregate customer assets from their own assets, in the event of insolvency, there may be a shortfall in the amount of margin held by the broker for its clients. Collateral or margin requirements for centrally-cleared derivatives are set by the broker or applicable clearinghouse. Margin for centrally-cleared transactions is detailed in the Statement of assets and liabilities as Receivable/Payable for centrally-cleared swaps. Securities pledged by the fund for centrally-cleared transactions, if any, are identified in the Fund's investments.
Futures. A futures contract is a contractual agreement to buy or sell a particular currency or financial instrument at a pre-determined price in the future. Risks related to the use of futures contracts include possible illiquidity of the futures markets and contract prices that can be highly volatile and imperfectly correlated to movements in the underlying financial instrument and potential losses in excess of the amounts recognized on the Statement of assets and liabilities. Use of long futures contracts subjects the fund to the risk of loss up to the notional value of the futures contracts. Use of short futures contracts subjects the fund to unlimited risk of loss.
Upon entering into a futures contract, a fund is required to deposit initial margin with the broker in the form of cash or securities. The amount of required margin is set by the broker and is generally based on a percentage of the contract value. The margin deposit must then be maintained at the established level over the life of the contract. Cash that has been pledged by the fund is detailed in the Statement of assets and liabilities as Collateral held at broker for futures contracts. Securities pledged by the fund, if any, are identified in the Fund's investments. Subsequent payments, referred to as variation margin, are made or received by the fund periodically and are based on changes in the market value of open futures contracts. Futures contracts are marked-to-market daily and unrealized gain or loss is recorded by the fund. Payable for futures variation margin is included in the Statement of assets and liabilities. When the contract is closed, the fund records a realized gain or loss equal to the difference between the value of the contract at the time it was opened and the value at the time it was closed.
| 43 | JOHN HANCOCK Hedged Equity & Income Fund | ANNUAL REPORT | |
During the year ended December 31, 2019, the fund used futures contracts to manage against anticipated changes in securities markets. The fund held futures contracts with USD notional values ranging from $9.6 million to $23.5 million, as measured at each quarter end.
Forward foreign currency contracts. A forward foreign currency contract is an agreement between two parties to buy and sell specific currencies at a price that is set on the date of the contract. The forward contract calls for delivery of the currencies on a future date that is specified in the contract. Risks related to the use of forwards include the possible failure of counterparties to meet the terms of the forward agreement, the failure of the counterparties to timely post collateral if applicable, and the risk that currency movements will not favor the fund thereby reducing the fund's total return, and the potential for losses in excess of the amounts recognized on the Statement of assets and liabilities.
The market value of a forward foreign currency contract fluctuates with changes in foreign currency exchange rates. Forward foreign currency contracts are marked-to-market daily and the change in value is recorded by the fund as an unrealized gain or loss. Realized gains or losses, equal to the difference between the value of the contract at the time it was opened and the value at the time it was closed, are recorded upon delivery or receipt of the currency or settlement with the counterparty.
During the year ended December 31, 2019, the fund used forward foreign currency contracts to manage against anticipated changes in currency exchange rates and to manage currency exposure. The fund held forward foreign currency contracts with USD notional values ranging from $22.0 million to $29.0 million, as measured at each quarter end.
Options. There are two types of options, put options and call options. Options are traded either OTC or on an exchange. A call option gives the purchaser of the option the right to buy (and the seller the obligation to sell) the underlying instrument at the exercise price. A put option gives the purchaser of the option the right to sell (and the writer the obligation to buy) the underlying instrument at the exercise price. Writing puts and buying calls may increase the fund's exposure to changes in the value of the underlying instrument. Buying puts and writing calls may decrease the fund's exposure to such changes. Risks related to the use of options include the loss of premiums, possible illiquidity of the options markets, trading restrictions imposed by an exchange and movements in underlying security values, and for written options, potential losses in excess of the amounts recognized on the Statement of assets and liabilities. In addition, OTC options are subject to the risks of all OTC derivatives contracts.
When the fund purchases an option, the premium paid is included in the Fund's investments and subsequently “marked-to-market” to reflect current market value. If the purchased option expires, the fund realizes a loss equal to the cost of the option. If the fund exercises a call option, the cost of the securities acquired by exercising the call is increased by the premium paid to buy the call. If the fund exercises a put option, it realizes a gain or loss from the sale of the underlying security and the proceeds from such sale are decreased by the premium paid. If the fund enters into a closing sale transaction, it realizes a gain or loss, depending on whether proceeds from the closing sale are greater or less than the original cost. When the fund writes an option, the premium received is included as a liability and subsequently “marked-to-market” to reflect the current market value of the option written. Premiums received from writing options that expire unexercised are recorded as realized gains. Premiums received from writing options which are exercised or are closed are added to or offset against the proceeds or amount paid on the transaction to determine the realized gain or loss. If a put option on a security is exercised, the premium received reduces the cost basis of the securities purchased by the fund.
During the year ended December 31, 2019, the fund wrote option contracts to generate income. The fund held written option contracts with market values ranging up to $643,000 as measured at each quarter end. There were no open written option contracts as of December 31, 2019.
| | ANNUAL REPORT | JOHN HANCOCK Hedged Equity & Income Fund | 44 |
Swaps. Swap agreements are agreements between the fund and a counterparty to exchange cash flows, assets, foreign currencies or market-linked returns at specified intervals. Swap agreements are privately negotiated in the OTC market (OTC swaps) or may be executed on a registered commodities exchange (centrally cleared swaps). Swaps are marked-to-market daily and the change in value is recorded as a component of unrealized appreciation/depreciation of swap contracts. The value of the swap will typically impose collateral posting obligations on the party that is considered out-of-the-money on the swap.
Upfront payments made/received by the fund, if any, are amortized/accreted for financial reporting purposes, with the unamortized/unaccreted portion included in the Statement of assets and liabilities. A termination payment by the counterparty or the fund is recorded as realized gain or loss, as well as the net periodic payments received or paid by the fund.
Entering into swap agreements involves, to varying degrees, elements of credit, market and documentation risk that may provide outcomes that are in excess of the amounts recognized on the Statement of assets and liabilities. Such risks involve the possibility that there will be no liquid market for the swap, or that a counterparty may default on its obligation or delay payment under the swap terms. The counterparty may disagree or contest the terms of the swap. In addition to interest rate risk, market risks may also impact the swap. The fund may also suffer losses if it is unable to terminate or assign outstanding swaps or reduce its exposure through offsetting transactions.
Credit default swaps. Credit default swaps (CDS) involve the exchange of a fixed rate premium (paid by the Buyer), for protection against the loss in value of an underlying debt instrument, referenced entity or index, in the event of a defined credit event (such as payment default or bankruptcy). Under the terms of the swap, one party acts as a “guarantor” (the Seller), receiving the premium and agreeing to contingent payments that are specified within the credit default agreement. The fund may enter into CDS in which it may act as either Buyer or Seller. By acting as the Seller, the fund may incur economic leverage since it would be obligated to pay the Buyer the notional amount of the contract in the event of a default. The amount of loss in such case could be significant, but would typically be reduced by any recovery value on the underlying credit.
Credit default swaps — Seller
Implied credit spreads are utilized in determining the market value of CDS agreements in which the fund is the Seller at period end. The implied credit spread generally represents the yield of the instrument above a credit-risk free rate, such as the U.S. Treasury Bond Yield, and may include upfront payments required to be made to enter into the agreement. It also serves as an indicator of the current status of the payment/performance risk and represents the likelihood or risk of default for the credit derivative. Wider credit spreads represent a deterioration of the referenced entity’s creditworthiness and an increased risk of default or other credit event occurring as defined under the terms of the agreement.
For CDS agreements where implied credit spreads are not reported or available, the average credit rating on the underlying index is shown. A deterioration of the referenced entity’s creditworthiness would indicate a greater likelihood of a credit event occurring and result in increasing market values, in absolute terms when compared to the notional amount of the swap. The maximum potential amount of future payments (undiscounted) that the fund as the Seller could be required to make under any CDS agreement equals the notional amount of the agreement.
During the year ended December 31, 2019, the fund used credit default swap contracts as a seller to manage against potential credit events. The fund held credit default swaps with total USD notional amounts ranging up to $495,000 as measured at each quarter end.
| 45 | JOHN HANCOCK Hedged Equity & Income Fund | ANNUAL REPORT | |
Fair value of derivative instruments by risk category
The table below summarizes the fair value of derivatives held by the fund at December 31, 2019 by risk category:
| Risk | Statement of
assets and
liabilities location | Financial
instruments
location | Assets
derivatives
fair value | Liabilities
derivatives
fair value |
| Equity | Receivable/payable for futures variation margin | Futures1 | $35,798 | $(30,545) |
| Currency | Unrealized appreciation / depreciation on forward foreign currency contracts | Forward foreign currency contracts | 38,680 | (228,780) |
| Credit | Swap contracts, at value | Credit default swaps2 | 48,461 | — |
| | | | $122,939 | $(259,325) |
| 1 | Reflects cumulative appreciation/depreciation on futures as disclosed in Fund's investments. Only the year end variation margin is separately disclosed on the Statement of assets and liabilities. |
| 2 | Reflects cumulative value of swap contracts. Receivable/payable for centrally cleared swaps, which includes value and margin, are shown separately on the Statement of assets and liabilities. |
Effect of derivative instruments on the Statement of operations
The table below summarizes the net realized gain (loss) included in the net increase (decrease) in net assets from operations, classified by derivative instrument and risk category, for the year ended December 31, 2019:
| | Statement of operations location - Net realized gain (loss) on: |
| Risk | Futures contracts | Forward foreign
currency contracts | Written options | Swap contracts | Total |
| Currency | — | $450,762 | — | — | $450,762 |
| Credit | — | — | — | $(6,730) | (6,730) |
| Equity | $(3,272,346) | — | $(2,955,789) | — | (6,228,135) |
| Total | $(3,272,346) | $450,762 | $(2,955,789) | $(6,730) | $(5,784,103) |
The table below summarizes the net change in unrealized appreciation (depreciation) included in the net increase (decrease) in net assets from operations, classified by derivative instrument and risk category, for the year ended December 31, 2019:
| | Statement of operations location - Change in net unrealized appreciation (depreciation) of: |
| Risk | Futures contracts | Forward foreign
currency contracts | Written options | Swap contracts | Total |
| Currency | — | $(728) | — | — | $(728) |
| Credit | — | — | — | $12,955 | 12,955 |
| Equity | $(136,063) | — | $95,951 | — | (40,112) |
| Total | $(136,063) | $(728) | $95,951 | $12,955 | $(27,885) |
Note 4—Guarantees and indemnifications
Under the fund's organizational documents, its Officers and Trustees are indemnified against certain liabilities arising out of the performance of their duties to the fund. Additionally, in the normal course of business, the fund enters into contracts with service providers that contain general indemnification clauses. The fund's maximum exposure under these arrangements is unknown, as this would involve future claims that may be made against the fund that have not yet occurred. The risk of material loss from such claims is considered remote.
| | ANNUAL REPORT | JOHN HANCOCK Hedged Equity & Income Fund | 46 |
Note 5—Fees and transactions with affiliates
John Hancock Investment Management LLC (the Advisor) serves as investment advisor for the fund. The Advisor is an indirect, wholly owned subsidiary of Manulife Financial Corporation (MFC). Prior to June 28, 2019, the Advisor was known as John Hancock Advisers, LLC.
Management fee. The fund has an investment management agreement with the Advisor under which the fund pays a daily management fee to the Advisor equivalent on an annual basis to 0.95% of the fund’s average daily gross assets. The Advisor has a subadvisory agreement with Wellington Management Company LLP. The fund is not responsible for payment of the subadvisory fees.
The Advisor has contractually agreed to waive a portion of its management fee and/or reimburse expenses for certain funds of the John Hancock group of funds complex, including the fund (the participating portfolios). This waiver is based upon aggregate net assets of all the participating portfolios. The amount of the reimbursement is calculated daily and allocated among all the participating portfolios in proportion to the daily net assets of each fund. During the year ended December 31, 2019, this waiver amounted to 0.01% of the fund’s average daily net assets. This arrangement expires on July 31, 2021, unless renewed by mutual agreement of the fund and the Advisor based upon a determination that this is appropriate under the circumstances at that time.
The expense reductions described above amounted to $13,421 for the year ended December 31, 2019.
Expenses waived or reimbursed in the current fiscal period are not subject to recapture in future fiscal periods.
The investment management fees, including the impact of the waivers and reimbursements as described above, incurred for the year ended December 31, 2019, were equivalent to a net annual effective rate rate of 0.94% of the fund's average daily managed net assets.
Accounting and legal services. Pursuant to a service agreement, the fund reimburses the Advisor for all expenses associated with providing the administrative, financial, legal, compliance, accounting and recordkeeping services to the fund, including the preparation of all tax returns, periodic reports to shareholders and regulatory reports, among other services. These accounting and legal services fees incurred for the year ended December 31, 2019 amounted to an annual rate of 0.02% of the fund's average daily managed net assets.
Trustee expenses. The fund compensates each Trustee who is not an employee of the Advisor or its affiliates. These Trustees receive from the fund and the other John Hancock closed-end funds an annual retainer. In addition, Trustee out-of-pocket expenses are allocated to each fund based on its net assets relative to other funds within the John Hancock group of funds complex.
Note 6—Fund share transactions
On December 6, 2011, the Board of Trustees approved a share repurchase plan, which is subsequently reviewed and approved by the Board of Trustees each year in December. Under the current share repurchase plan, the fund may purchase in the open market, up to 10% of its outstanding common shares as of December 31, 2019. The current share repurchase plan will remain in effect between January 1, 2020 and December 31, 2020.
During the years ended December 31, 2019 and 2018, the fund had no activities under the repurchase program. Shares repurchased and corresponding dollar amounts, if any, are included on the Statements of changes in net assets. The anti-dilutive impacts of these share repurchases are included on the Financial highlights.
Note 7—Purchase and sale of securities
Purchases and sales of securities, other than short-term investments, amounted to $220,452,408 and $234,630,951, respectively, for the year ended December 31, 2019.
| 47 | JOHN HANCOCK Hedged Equity & Income Fund | ANNUAL REPORT | |
Note 8—Restricted securities
The fund may hold restricted securities which are restricted as to resale and the fund has limited rights to registration under the Securities Act of 1933. Disposal may involve time-consuming negotiations and expenses, and prompt sale at an acceptable price may be difficult to achieve. The following table summarizes the restricted securities held at December 31, 2019:
Issuer,
Description | Original
acquisition date | Acquisition
cost | Beginning
share
amount | Shares
purchased | Shares
sold | Ending
share
amount | Value as a
percentage of
net assets | Ending
value |
| Allstar Co-Invest LLC | 8-1-11 | $240,553 | 236,300 | — | — | 236,300 | 0.1% | $92,157 |
| | ANNUAL REPORT | JOHN HANCOCK Hedged Equity & Income Fund | 48 |
Report of Independent Registered Public Accounting Firm
To the Board of Trustees and Shareholders of John Hancock Hedged Equity & Income Fund
Opinion on the Financial Statements
We have audited the accompanying statement of assets and liabilities, including the Fund’s investments, of John Hancock Hedged Equity & Income Fund (the “Fund”) as of December 31, 2019, the related statement of operations for the year ended December 31, 2019, the statements of changes in net assets for each of the two years in the period ended December 31, 2019, including the related notes, and the financial highlights for each of the five years in the period ended December 31, 2019 (collectively referred to as the “financial statements”). In our opinion, the financial statements present fairly, in all material respects, the financial position of the Fund as of December 31, 2019, the results of its operations for the year then ended, the changes in its net assets for each of the two years in the period ended December 31, 2019 and the financial highlights for each of the five years in the period ended December 31, 2019 in conformity with accounting principles generally accepted in the United States of America.
Basis for Opinion
These financial statements are the responsibility of the Fund’s management. Our responsibility is to express an opinion on the Fund’s financial statements based on our audits. We are a public accounting firm registered with the Public Company Accounting Oversight Board (United States) (PCAOB) and are required to be independent with respect to the Fund in accordance with the U.S. federal securities laws and the applicable rules and regulations of the Securities and Exchange Commission and the PCAOB.
We conducted our audits of these financial statements in accordance with the standards of the PCAOB. Those standards require that we plan and perform the audit to obtain reasonable assurance about whether the financial statements are free of material misstatement, whether due to error or fraud.
Our audits included performing procedures to assess the risks of material misstatement of the financial statements, whether due to error or fraud, and performing procedures that respond to those risks. Such procedures included examining, on a test basis, evidence regarding the amounts and disclosures in the financial statements. Our audits also included evaluating the accounting principles used and significant estimates made by management, as well as evaluating the overall presentation of the financial statements. Our procedures included confirmation of securities owned as of December 31, 2019 by correspondence with the custodian, agent banks and brokers; when replies were not received from agent banks and brokers, we performed other auditing procedures. We believe that our audits provide a reasonable basis for our opinion.
/s/ PricewaterhouseCoopers LLP
Boston, Massachusetts
February 11, 2020
We have served as the auditor of one or more investment companies in the John Hancock group of funds since 1988.
| 49 | JOHN HANCOCK HEDGED EQUITY & INCOME FUND | ANNUAL REPORT | |
| Tax information (Unaudited) | |
For federal income tax purposes, the following information is furnished with respect to the distributions of the fund, if any, paid during its taxable year ended December 31, 2019.
The fund reports the maximum amount allowable of its net taxable income as eligible for the corporate dividends-received deduction.
The fund reports the maximum amount allowable of its net taxable income as qualified dividend income as provided in the Jobs and Growth Tax Relief Reconciliation Act of 2003.
Income derived from foreign sources was $6,250,197. The fund intends to pass through foreign tax credits of $629,200.
The fund reports the maximum amount allowable of its Section 199A dividends as defined in Proposed Treasury Regulation §1.199A-3(d).
Eligible shareholders will be mailed a 2019 Form 1099-DIV in early 2020. This will reflect the tax character of all distributions paid in calendar year 2019.
Please consult a tax advisor regarding the tax consequences of your investment in the fund.
| | ANNUAL REPORT | JOHN HANCOCK HEDGED EQUITY & INCOME FUND | 50 |
Additional information (Unaudited)
Investment objective and policy
The fund is a closed-end, diversified management investment company, common shares of which were initially offered to the public on May 26, 2011 and are publicly traded on the New York Stock Exchange (the NYSE). The fund's investment objective is to provide total return with a focus on current income and gains and also consisting of long-term capital appreciation. The fund uses an equity strategy, as well as futures and call writing, to pursue its investment objective.
Under normal circumstances, the fund will invest at least 80% of its net assets (assets plus borrowings for investment purposes) in equity and equity-related securities, including common stock, preferred stock, depositary receipts (including American Depositary Receipts and Global Depositary Receipts), index-related securities (including exchange-traded funds), options on equity securities and equity indexes, real estate investment structures (including real estate investment trusts), convertible securities, private placements, convertible preferred stock, rights, warrants, derivatives linked to equity securities or indexes and other similar equity equivalents. The fund may invest in listed and unlisted domestic and foreign equity and equity-related securities or instruments. These equity and equity-related instruments may include equity securities of, or derivatives linked to, foreign issuers and indexes (including emerging market issuers or indexes).
Dividends and distributions
During the year ended December 31, 2019, distributions from net investment income totaling $0.6747 per share and tax return of capital totaling $0.8293 per share were paid to shareholders. The dates of payments and the amounts per share were as follows:
| | | | | | |
| | Payment date | | | Distributions | |
| | March 29, 2019 | | | $0.3760 | |
| | June 28, 2019 | | | 0.3760 | |
| | September 30, 2019 | | | 0.3760 | |
| | December 31, 2019 | | | 0.3760 | |
| | Total | | | $1.5040 | |
Dividend reinvestment plan
The fund's Dividend Reinvestment Plan (the Plan) provides that distributions of dividends and capital gains are automatically reinvested in common shares of the fund by Computershare Trust Company, N.A. (the Plan Agent). Every shareholder holding at least one full share of the fund is entitled to participate in the Plan. In addition, every shareholder who became a shareholder of the fund after June 30, 2011, and holds at least one full share of the fund will be automatically enrolled in the Plan. Shareholders may withdraw from the Plan at any time and shareholders who do not participate in the Plan will receive all distributions in cash.
If the fund declares a dividend or distribution payable either in cash or in common shares of the fund and the market price of shares on the payment date for the distribution or dividend equals or exceeds the fund's net asset value per share (NAV), the fund will issue common shares to participants at a value equal to the higher of NAV or 95% of the market price. The number of additional shares to be credited to each participant's account will be determined by dividing the dollar amount of the distribution or dividend by the higher of NAV or 95% of the market price. If the market price is lower than NAV, or if dividends or distributions are payable only in cash, then participants will receive shares purchased by the Plan Agent on participants' behalf on the NYSE or otherwise on the open market. If the market price exceeds NAV before the Plan Agent has completed its purchases, the average per share purchase price may exceed NAV, resulting in fewer shares being acquired than if the fund had issued new shares.
ANNUAL REPORT | JOHN HANCOCK HEDGED EQUITY & INCOME FUND 51
There are no brokerage charges with respect to common shares issued directly by the fund. However, whenever shares are purchased or sold on the NYSE or otherwise on the open market, each participant will pay a pro rata portion of brokerage trading fees, currently $0.05 per share purchased or sold. Brokerage trading fees will be deducted from amounts to be invested.
The reinvestment of dividends and net capital gains distributions does not relieve participants of any income tax that may be payable on such dividends or distributions.
Shareholders participating in the Plan may buy additional shares of the fund through the Plan at any time in amounts of at least $50 per investment, up to a maximum of $10,000, with a total calendar year limit of $100,000. Shareholders will be charged a $5 transaction fee plus $0.05 per share brokerage trading fee for each order. Purchases of additional shares of the fund will be made on the open market. Shareholders who elect to utilize monthly electronic fund transfers to buy additional shares of the fund will be charged a $2 transaction fee plus $0.05 per share brokerage trading fee for each automatic purchase. Shareholders can also sell fund shares held in the Plan account at any time by contacting the Plan Agent by telephone, in writing or by visiting the Plan Agent's website at www.computershare.com/investor. The Plan Agent will mail a check (less applicable brokerage trading fees) on settlement date (two business days after the shares have been sold). If shareholders choose to sell shares through their stockbroker, they will need to request that the Plan Agent electronically transfer those shares to their stockbroker through the Direct Registration System.
Shareholders participating in the Plan may withdraw from the Plan at any time by contacting the Plan Agent by telephone, in writing or by visiting the Plan Agent's website at www.computershare.com/investor. Such termination will be effective immediately if the notice is received by the Plan Agent prior to any dividend or distribution record date; otherwise, such termination will be effective on the first trading day after the payment date for such dividend or distribution, with respect to any subsequent dividend or distribution. If shareholders withdraw from the Plan, their shares will be credited to their account; or, if they wish, the Plan Agent will sell their full and fractional shares and send the shareholders the proceeds, less a transaction fee of $5 and less brokerage trading fees of $0.05 per share. If a shareholder does not maintain at least one whole share of common stock in the Plan account, the Plan Agent may terminate such shareholder's participation in the Plan after written notice. Upon termination, shareholders will be sent a check for the cash value of any fractional share in the Plan account, less any applicable broker commissions and taxes.
Shareholders who hold at least one full share of the fund may join the Plan by notifying the Plan Agent by telephone, in writing or by visiting the Plan Agent's website at www.computershare.com/investor. If received in proper form by the Plan Agent before the record date of a dividend, the election will be effective with respect to all dividends paid after such record date. If shareholders wish to participate in the Plan and their shares are held in the name of a brokerage firm, bank or other nominee, shareholders should contact their nominee to see if it will participate in the Plan. If shareholders wish to participate in the Plan, but their brokerage firm, bank or other nominee is unable to participate on their behalf, they will need to request that their shares be re-registered in their own name, or they will not be able to participate. The Plan Agent will administer the Plan on the basis of the number of shares certified from time to time by shareholders as representing the total amount registered in their name and held for their account by their nominee.
Experience under the Plan may indicate that changes are desirable. Accordingly, the fund and the Plan Agent reserve the right to amend or terminate the Plan. Participants generally will receive written notice at least 90 days before the effective date of any amendment. In the case of termination, participants will receive written notice at least 90 days before the record date for the payment of any dividend or distribution by the fund.
ANNUAL REPORT | JOHN HANCOCK HEDGED EQUITY & INCOME FUND 52
All correspondence or requests for additional information about the Plan should be directed to Computershare Trust Company, N.A., at the address stated below, or by calling 800-852-0218, 201-680-6578 (For International Telephone Inquiries) and 800-952-9245 (For the Hearing Impaired (TDD)).
Shareholder communication and assistance
If you have any questions concerning the fund, we will be pleased to assist you. If you hold shares in your own name and not with a brokerage firm, please address all notices, correspondence, questions or other communications regarding the fund to the transfer agent at:
Regular Mail:
Computershare
P.O. Box 505000
Louisville, KY 40233
Registered or Overnight Mail:
Computershare
462 South 4th Street, Suite 1600
Louisville, KY 40202
If your shares are held with a brokerage firm, you should contact that firm, bank or other nominee for assistance.
ANNUAL REPORT | JOHN HANCOCK HEDGED EQUITY & INCOME FUND 53
This chart provides information about the Trustees and Officers who oversee your John Hancock fund. Officers elected by the Trustees manage the day-to-day operations of the fund and execute policies formulated by the Trustees.
Independent Trustees
| | | |
Name, year of birth
Position(s) held with fund
Principal occupation(s) and other
directorships during past 5 years | Trustee
of the
Trust
since1 | Number of John
Hancock funds
overseen by
Trustee |
| Hassell H. McClellan, Born: 1945 | 2012 | 205 |
Trustee and Chairperson of the Board
Director/Trustee, Virtus Funds (since 2008); Director, The Barnes Group (since 2010); Associate Professor, The Wallace E. Carroll School of Management, Boston College (retired 2013). Trustee (since 2005) and Chairperson of the Board (since 2017) of various trusts within the John Hancock Fund Complex. |
| | | |
| Charles L. Bardelis,2 Born: 1941 | 2012 | 205 |
Trustee
Director, Island Commuter Corp. (marine transport). Trustee of various trusts within the John Hancock Fund Complex (since 1988). |
| | | |
| James R. Boyle,Born: 1959 | 2015 | 205 |
Trustee
Chief Executive Officer, Foresters Financial (since 2018); Chairman and Chief Executive Officer, Zillion Group, Inc. (formerly HealthFleet, Inc.) (healthcare) (2014-2018); Executive Vice President and Chief Executive Officer, U.S. Life Insurance Division of Genworth Financial, Inc. (insurance) (January 2014-July 2014); Senior Executive Vice President, Manulife Financial, President and Chief Executive Officer, John Hancock (1999-2012); Chairman and Director, John Hancock Investment Management LLC, John Hancock Investment Management Distributors LLC, and John Hancock Variable Trust Advisers LLC (2005-2010). Trustee of various trusts within the John Hancock Fund Complex (2005-2014 and since 2015). |
| | | |
| Peter S. Burgess,2 Born: 1942 | 2012 | 205 |
Trustee
Consultant (financial, accounting, and auditing matters) (since 1999); Certified Public Accountant; Partner, Arthur Andersen (independent public accounting firm) (prior to 1999); Director, Lincoln Educational Services Corporation (since 2004); Director, Symetra Financial Corporation (2010-2016); Director, PMA Capital Corporation (2004-2010). Trustee of various trusts within the John Hancock Fund Complex (since 2005). |
| | | |
| William H. Cunningham, Born: 1944 | 2011 | 205 |
Trustee
Professor, University of Texas, Austin, Texas (since 1971); former Chancellor, University of Texas System and former President of the University of Texas, Austin, Texas; Chairman (since 2009) and Director (since 2006), Lincoln National Corporation (insurance); Director, Southwest Airlines (since 2000); former Director, LIN Television (2009-2014). Trustee of various trusts within the John Hancock Fund Complex (since 1986). |
| | | |
| Grace K. Fey, Born: 1946 | 2012 | 205 |
Trustee
Chief Executive Officer, Grace Fey Advisors (since 2007); Director and Executive Vice President, Frontier Capital Management Company (1988-2007); Director, Fiduciary Trust (since 2009). Trustee of various trusts within the John Hancock Fund Complex (since 2008). |
ANNUAL REPORT | JOHN HANCOCK HEDGED EQUITY & INCOME FUND 54
Independent Trustees (continued)
| | | |
Name, year of birth
Position(s) held with fund
Principal occupation(s) and other
directorships during past 5 years | Trustee
of the
Trust
since1 | Number of John
Hancock funds
overseen by
Trustee |
| Deborah C. Jackson, Born: 1952 | 2011 | 205 |
Trustee
President, Cambridge College, Cambridge, Massachusetts (since 2011); Board of Directors, Massachusetts Women's Forum (since 2018); Board of Directors, National Association of Corporate Directors/New England (since 2015); Board of Directors, Association of Independent Colleges and Universities of Massachusetts (2014-2017); Chief Executive Officer, American Red Cross of Massachusetts Bay (2002-2011); Board of Directors of Eastern Bank Corporation (since 2001); Board of Directors of Eastern Bank Charitable Foundation (since 2001); Board of Directors of American Student Assistance Corporation (1996-2009); Board of Directors of Boston Stock Exchange (2002-2008); Board of Directors of Harvard Pilgrim Healthcare (health benefits company) (2007-2011). Trustee of various trusts within the John Hancock Fund Complex (since 2008). |
| | | |
| James M. Oates,2Born: 1946 | 2012 | 205 |
Trustee
Managing Director, Wydown Group (financial consulting firm) (since 1994); Chairman and Director, Emerson Investment Management, Inc. (2000-2015); Independent Chairman, Hudson Castle Group, Inc. (formerly IBEX Capital Markets, Inc.) (financial services company) (1997-2011); Director, Stifel Financial (since 1996); Director, Investor Financial Services Corporation (1995-2007); Director, Connecticut River Bancorp (1998-2014); Director/Trustee, Virtus Funds (since 1988). Trustee (since 2004) and Chairperson of the Board (2005-2016) of various trusts within the John Hancock Fund Complex. |
| | | |
| Steven R. Pruchansky, Born: 1944 | 2011 | 205 |
Trustee and Vice Chairperson of the Board
Managing Director, Pru Realty (since 2017); Chairman and Chief Executive Officer, Greenscapes of Southwest Florida, Inc. (since 2014); Director and President, Greenscapes of Southwest Florida, Inc. (until 2000); Member, Board of Advisors, First American Bank (until 2010); Managing Director, Jon James, LLC (real estate) (since 2000); Partner, Right Funding, LLC (2014-2017); Director, First Signature Bank & Trust Company (until 1991); Director, Mast Realty Trust (until 1994); President, Maxwell Building Corp. (until 1991). Trustee (since 1992), Chairperson of the Board (2011-2012), and Vice Chairperson of the Board (since 2012) of various trusts within the John Hancock Fund Complex. |
| | | |
| Gregory A. Russo, Born: 1949 | 2011 | 205 |
Trustee
Director and Audit Committee Chairman (since 2012), and Member, Audit Committee and Finance Committee (since 2011), NCH Healthcare System, Inc. (holding company for multi-entity healthcare system); Director and Member (2012-2018) and Finance Committee Chairman (2014-2018), The Moorings, Inc. (nonprofit continuing care community); Vice Chairman, Risk & Regulatory Matters, KPMG LLP (KPMG) (2002-2006); Vice Chairman, Industrial Markets, KPMG (1998-2002); Chairman and Treasurer, Westchester County, New York, Chamber of Commerce (1986-1992); Director, Treasurer, and Chairman of Audit and Finance Committees, Putnam Hospital Center (1989-1995); Director and Chairman of Fundraising Campaign, United Way of Westchester and Putnam Counties, New York (1990-1995). Trustee of various trusts within the John Hancock Fund Complex (since 2008). |
ANNUAL REPORT | JOHN HANCOCK HEDGED EQUITY & INCOME FUND 55
Non-Independent Trustees3
| | | |
Name, year of birth
Position(s) held with fund
Principal occupation(s) and other
directorships during past 5 years | Trustee
of the
Trust
since1 | Number of John
Hancock funds
overseen by
Trustee |
| Andrew G. Arnott, Born: 1971 | 2017 | 205 |
President and Non-Independent Trustee
Head of Wealth and Asset Management, United States and Europe, for John Hancock and Manulife (since 2018); Executive Vice President, John Hancock Financial Services (since 2009, including prior positions); Director and Executive Vice President, John Hancock Investment Management LLC (since 2005, including prior positions); Director and Executive Vice President, John Hancock Variable Trust Advisers LLC (since 2006, including prior positions); President, John Hancock Investment Management Distributors LLC (since 2004, including prior positions); President of various trusts within the John Hancock Fund Complex (since 2007, including prior positions). Trustee of various trusts within the John Hancock Fund Complex (since 2017). |
| | | |
| Marianne Harrison, Born: 1963 | 2018 | 205 |
Non-Independent Trustee
President and CEO, John Hancock (since 2017); President and CEO, Manulife Canadian Division (2013-2017); Member, Board of Directors, CAE Inc. (since 2019); Member, Board of Directors, MA Competitive Partnership Board (since 2018); Member, Board of Directors, American Council of Life Insurers (ACLI) (since 2018); Member, Board of Directors, Communitech, an industry-led innovation center that fosters technology companies in Canada (2017-2019); Member, Board of Directors, Manulife Assurance Canada (2015-2017); Board Member, St. Mary's General Hospital Foundation (2014-2017); Member, Board of Directors, Manulife Bank of Canada (2013-2017); Member, Standing Committee of the Canadian Life & Health Assurance Association (2013-2017); Member, Board of Directors, John Hancock USA, John Hancock Life & Health, John Hancock New York (2012-2013). Trustee of various trusts within the John Hancock Fund Complex (since 2018). |
Principal officers who are not Trustees
| | |
Name, year of birth
Position(s) held with fund
Principal occupation(s)
during past 5 years | Officer
of the
Trust
since |
| Francis V. Knox, Jr.,Born: 1947 | 2011 |
Chief Compliance Officer
Vice President, John Hancock Financial Services (since 2005); Chief Compliance Officer, various trusts within the John Hancock Fund Complex, John Hancock Investment Management LLC, and John Hancock Variable Trust Advisers LLC (since 2005). |
| | |
| Charles A. Rizzo, Born: 1957 | 2011 |
Chief Financial Officer
Vice President, John Hancock Financial Services (since 2008); Senior Vice President, John Hancock Investment Management LLC and John Hancock Variable Trust Advisers LLC (since 2008); Chief Financial Officer of various trusts within the John Hancock Fund Complex (since 2007). |
| | |
| Salvatore Schiavone, Born: 1965 | 2011 |
Treasurer
Assistant Vice President, John Hancock Financial Services (since 2007); Vice President, John Hancock Investment Management LLC and John Hancock Variable Trust Advisers LLC (since 2007); Treasurer of various trusts within the John Hancock Fund Complex (since 2007, including prior positions). |
ANNUAL REPORT | JOHN HANCOCK HEDGED EQUITY & INCOME FUND 56
Principal officers who are not Trustees (continued)
| | |
Name, year of birth
Position(s) held with fund
Principal occupation(s)
during past 5 years | Officer
of the
Trust
since |
| Christopher (Kit) Sechler,Born: 1973 | 2018 |
Chief Legal Officer and Secretary
Vice President and Deputy Chief Counsel, John Hancock Investments (since 2015); Assistant Vice President and Senior Counsel (2009-2015), John Hancock Investment Management; Chief Legal Officer and Secretary of various trusts within the John Hancock Fund Complex (since 2018); Assistant Secretary of John Hancock Investment Management LLC and John Hancock Variable Trust Advisers LLC (since 2009). |
The business address for all Trustees and Officers is 200 Berkeley Street, Boston, Massachusetts 02116-5023.
| 1 | Mr. Boyle, Mr. Cunningham, Ms. Fey, Mr. McClellan and Mr. Russo serve as Trustees for a term expiring in 2020; Mr. Bardelis, Mr. Burgess and Ms. Harrison serve as Trustees for a term expiring in 2021; Mr. Arnott, Ms. Jackson, Mr. Oates and Mr. Pruchansky serve as Trustees for a term expiring in 2022; Mr. Boyle has served as Trustee at various times prior to date listed in the table. |
| 2 | Member of the Audit Committee. |
| 3 | The Trustee is a Non-Independent Trustee due to current or former positions with the Advisor and certain of its affiliates. |
ANNUAL REPORT | JOHN HANCOCK HEDGED EQUITY & INCOME FUND 57
| | |
Trustees
Hassell H. McClellan,Chairperson
Steven R. Pruchansky,Vice Chairperson
Andrew G. Arnott†
Charles L. Bardelis*
James R. Boyle
Peter S. Burgess*
William H. Cunningham
Grace K. Fey
Marianne Harrison†
Deborah C. Jackson
James M. Oates*
Gregory A. Russo
Officers
Andrew G. Arnott
President
Francis V. Knox, Jr.
Chief Compliance Officer
Charles A. Rizzo
Chief Financial Officer
Salvatore Schiavone
Treasurer
Christopher (Kit) Sechler
Secretary and Chief Legal Officer
| Investment advisor
John Hancock Investment Management LLC
Subadvisor
Wellington Management Company LLP
Portfolio Managers
Roberto J. Isch, CFA
Gregg R. Thomas, CFA
Custodian
State Street Bank and Trust Company
Transfer agent
Computershare Shareowner Services, LLC
Legal counsel
K&L Gates LLP
Independent registered public accounting firm
PricewaterhouseCoopers LLP
Stock symbol
Listed New York Stock Exchange: HEQ
|
* Member of the Audit Committee
† Non-Independent Trustee
For shareholder assistance refer to page 6
| | | | |
| | You can also contact us: |
| | 800-852-0218
jhinvestments.com | Regular mail:
Computershare
P.O. Box 505000
Louisville, KY 40233
| Express mail:
Computershare
462 South 4th Street, Suite 1600
Louisville, KY 40202
|
The fund's proxy voting policies and procedures, as well as the fund's proxy voting record for the most recent twelve-month period ended June 30, are available free of charge on the Securities and Exchange Commission (SEC) website at sec.gov or on our website.
All of the fund's holdings as of the end of the third month of every fiscal quarter are filed with the SEC on Form N-PORT within 60 days of the end of the fiscal quarter. The fund's Form N-PORT filings are available on our website and the SEC's website, sec.gov.
We make this information on your fund, as well asmonthly portfolio holdings, and other fund details available on our website at jhinvestments.com or by calling 800-852-0218.
The report is certified under the Sarbanes-Oxley Act, which requires closed-end funds and other public companies to affirm that, to the best of their knowledge, the information in their financial reports is fairly and accurately stated in all material respects.ANNUAL REPORT | JOHN HANCOCK HEDGED EQUITY & INCOME FUND 58
John Hancock family of funds
| | | |
DOMESTIC EQUITY FUNDS
Blue Chip Growth
Classic Value
Disciplined Value
Disciplined Value Mid Cap
Equity Income
Financial Industries
Fundamental All Cap Core
Fundamental Large Cap Core
New Opportunities
Regional Bank
Small Cap Core
Small Cap Growth
Small Cap Value
U.S. Global Leaders Growth
U.S. Quality Growth
GLOBAL AND INTERNATIONAL EQUITY FUNDS
Disciplined Value International
Emerging Markets
Emerging Markets Equity
Fundamental Global Franchise
Global Equity
Global Shareholder Yield
Global Thematic Opportunities
International Dynamic Growth
International Growth
International Small Company
| | INCOME FUNDS
Bond
California Tax-Free Income
Emerging Markets Debt
Floating Rate Income
Government Income
High Yield
High Yield Municipal Bond
Income
Investment Grade Bond
Money Market
Short Duration Bond
Short Duration Credit Opportunities
Strategic Income Opportunities
Tax-Free Bond
ALTERNATIVE AND SPECIALTY FUNDS
Absolute Return Currency
Alternative Asset Allocation
Alternative Risk Premia
Disciplined Alternative Yield
Diversified Macro
Infrastructure
Multi-Asset Absolute Return
Seaport Long/Short
|
The fund's investment objectives, risks, charges, and expenses are included in the prospectus and should be considered carefully before investing. For a prospectus, contact your financial professional, call John Hancock Investment Management at 800-852-0218, or visit the fund's website at jhinvestments.com. Please read the prospectus carefully before investing or sending money.
The John Hancock funds are distributed by John Hancock Investment Management Distributors LLC. Member FINRA SIPC.
| | | |
ASSET ALLOCATION
Balanced
Income Allocation
Multi-Index Lifetime Portfolios
Multi-Index Preservation Portfolios
Multimanager Lifestyle Portfolios
Multimanager Lifetime Portfolios
Retirement Income 2040
EXCHANGE-TRADED FUNDS
John Hancock Multifactor Consumer Discretionary ETF
John Hancock Multifactor Consumer Staples ETF
John Hancock Multifactor Developed International ETF
John Hancock Multifactor Emerging Markets ETF
John Hancock Multifactor Energy ETF
John Hancock Multifactor Financials ETF
John Hancock Multifactor Healthcare ETF
John Hancock Multifactor Industrials ETF
John Hancock Multifactor Large Cap ETF
John Hancock Multifactor Materials ETF
John Hancock Multifactor Media and
Communications ETF
John Hancock Multifactor Mid Cap ETF
John Hancock Multifactor Small Cap ETF
John Hancock Multifactor Technology ETF
John Hancock Multifactor Utilities ETF
| | ENVIRONMENTAL, SOCIAL, AND
GOVERNANCE FUNDS
ESG All Cap Core
ESG Core Bond
ESG International Equity
ESG Large Cap Core
CLOSED-END FUNDS
Financial Opportunities
Hedged Equity & Income
Income Securities Trust
Investors Trust
Preferred Income
Preferred Income II
Preferred Income III
Premium Dividend
Tax-Advantaged Dividend Income
Tax-Advantaged Global Shareholder Yield
|
John Hancock Multifactor ETF shares are bought and sold at market price (not NAV), and are not individually redeemed
from the fund. Brokerage commissions will reduce returns.
John Hancock ETFs are distributed by Foreside Fund Services, LLC, and are subadvised by Dimensional Fund Advisors LP.
Foreside is not affiliated with John Hancock Investment Management Distributors LLC or Dimensional Fund Advisors LP.
Dimensional Fund Advisors LP receives compensation from John Hancock in connection with licensing rights to the
John Hancock Dimensional indexes. Dimensional Fund Advisors LP does not sponsor, endorse, or sell, and makes no
representation as to the advisability of investing in, John Hancock Multifactor ETFs.
John Hancock Investment Management
A trusted brand
John Hancock Investment Management is a premier asset manager
representing one of America's most trusted brands, with a heritage of
financial stewardship dating back to 1862. Helping our shareholders
pursue their financial goals is at the core of everything we do. It's why
we support the role of professional financial advice and operate with
the highest standards of conduct and integrity.
A better way to invest
We serve investors globally through a unique multimanager approach:
We search the world to find proven portfolio teams with specialized
expertise for every strategy we offer, then we apply robust investment
oversight to ensure they continue to meet our uncompromising
standards and serve the best interests of our shareholders.
Results for investors
Our unique approach to asset management enables us to provide
a diverse set of investments backed by some of the world's best
managers, along with strong risk-adjusted returns across asset classes.
John Hancock Investment Management LLC
200 Berkeley Street n Boston, MA 02116-5010 n 800-225-5291 n jhinvestments.com
| | |
| MF1047202 | P15A 12/19
2/2020 |
ITEM 2. CODE OF ETHICS.
As of the end of the period, December 31, 2019, the registrant has adopted a code of ethics, as defined in Item 2 of Form N-CSR, that applies to its Chief Executive Officer, Chief Financial Officer and Treasurer (respectively, the principal executive officer, the principal financial officer and the principal accounting officer, the “Senior Financial Officers”). A copy of the code of ethics is filed as an exhibit to this Form N-CSR.
ITEM 3. AUDIT COMMITTEE FINANCIAL EXPERT.
Peter S. Burgess is the audit committee financial expert and is “independent”, pursuant to general instructions on Form N-CSR Item 3.
ITEM 4. PRINCIPAL ACCOUNTANT FEES AND SERVICES.
(a) Audit Fees
The aggregate fees billed for professional services rendered by the principal accountant(s) for the audit of the registrant’s annual financial statements or services that are normally provided by the accountant(s) in connection with statutory and regulatory filings or engagements amounted to $47,279 for the year ended December 31, 2019 and $46,983 for the year ended December 31, 2018.
(b) Audit-Related Services
The audit-related fees were $5 for the year ended December 31, 2019 and $0 for the fiscal period ended December 31, 2018, billed to the registrant or to the registrant's investment adviser (not including any sub-adviser whose role is primarily portfolio management and is subcontracted with or overseen by another investment adviser), and any entity controlling, controlled by, or under common control with the adviser that provides ongoing services to the registrant ("control affiliates"). In addition, amounts billed to control affiliates for service provider internal controls reviews were $116,467 and $113,000 for the years ended December 31, 2019 and 2018, respectively.
(c) Tax Fees
The aggregate fees billed for professional services rendered by the principal accountant(s) for the tax compliance, tax advice and tax planning (“tax fees”) amounted to $3,914 for the year ended December 31, 2019 and $3,800 for the year ended December 31, 2018. The nature of the services comprising the tax fees was the review of the registrant’s tax returns and tax distribution requirements.
(d) All Other Fees
The all other fees billed to the registrant for products and services provided by the principal accountant were $84 for the year ended December 31, 2019 $239 and for the year ended December 31, 2018, billed to control affiliates for products and services provided by the principal accountant. The nature of the services comprising the all other fees consisted mainly of review of foreign tax withholding rates.
(e)(1) Audit Committee Pre-Approval Policies and Procedures:
The trust’s Audit Committee must pre-approve all audit and non-audit services provided by the independent registered public accounting firm (the “Auditor”) relating to the operations or financial reporting of the funds. Prior to the commencement of any audit or non-audit services to a fund, the Audit Committee reviews the services to determine whether they are appropriate and permissible under applicable law.
The trust’s Audit Committee has adopted policies and procedures to, among other purposes, provide a framework for the Committee’s consideration of audit-related and non-audit services by the Auditor. The policies and procedures require that any audit-related and non-audit service provided by the Auditor and any non-audit service provided by the Auditor to a fund service provider that relates directly to the operations and financial reporting of a fund are subject to approval by the Audit Committee before such service is provided. Audit-related services provided by the Auditor that are expected to exceed $25,000 per instance/per fund are subject to specific pre-approval by the Audit Committee. Tax services provided by the Auditor that are expected to exceed $30,000 per instance/per fund are subject to specific pre-approval by the Audit Committee.
All audit services, as well as the audit-related and non-audit services that are expected to exceed the amounts stated above, must be approved in advance of provision of the service by formal resolution of the Audit Committee. At the regularly scheduled Audit Committee meetings, the Committee reviews a report summarizing the services, including fees, provided by the Auditor.
(e)(2) Services approved pursuant to paragraph (c)(7)(i)(C) of Rule 2-01 of Regulation S-X:
Audit-Related Fees, Tax Fees and All Other Fees:
There were no amounts that were approved by the Audit Committee pursuant to the de minimis exception under Rule 2-01 of Regulation S-X.
(f) According to the registrant’s principal accountant, for the fiscal period ended December 31, 2019, the percentage of hours spent on the audit of the registrant's financial statements for the most recent fiscal year that were attributed to work performed by persons who were not full-time, permanent employees of principal accountant was less than 50%.
(g) The aggregate non-audit fees billed by the registrant's accountant(s) for services rendered to the registrant and rendered to the registrant's control affiliates of the registrant were $941,100 for the year ended December 31, 2019 and $736,243 for the year ended December 31, 2018.
(h) The audit committee of the registrant has considered the non-audit services provided by the registrant’s principal accountant(s) to the control affiliates and has determined that the services that were not pre-approved are compatible with maintaining the principal accountant(s)' independence.
ITEM 5. AUDIT COMMITTEE OF LISTED REGISTRANTS.
The registrant has a separately-designated standing audit committee comprised of independent trustees. The members of the audit committee are as follows:
Peter S. Burgess - Chairman
Charles L. Bardelis
Theron S. Hoffman
ITEM 6. SCHEDULE OF INVESTMENTS.
(a) Not applicable.
(b) Not applicable.
ITEM 7. DISCLOSURE OF PROXY VOTING POLICIES AND PROCEDURES FOR CLOSED-END MANAGEMENT INVESTMENT COMPANIES.
See attached exhibit “Proxy Voting Policies and Procedures”.
ITEM 8.PORTFOLIO MANAGERS OF CLOSED-END MANAGEMENT INVESTMENT COMPANIES.
Information about the Wellington Management Company LLP (“Wellington Management”) portfolio managers
Management Biographies
Below is a list of the portfolio managers who share joint responsibility for the day-to-day investment management of the Fund. It provides a brief summary of their business careers over the past five years. Information is provided as of December 31, 2019.
Gregg R. Thomas, CFA
Senior Managing Director and Director of Investment Strategy,
Wellington Management Company LLP since 2002
Joined Fund team since its inception (2011)
Roberto J. Isch, CFA
Managing Director and Research Manager,
Wellington Management Company LLP since 2012
Joined Fund team in 2019
Other Accounts the Portfolio Managers are Managing
The table below indicates for each portfolio manager information about the accounts over which the portfolio manager has day-to-day investment responsibility. All information on the number of accounts and total assets in the table is as of December 31, 2019. For purposes of the table, “Other Pooled Investment Vehicles” may include investment partnerships and group trusts, and “Other Accounts” may include separate accounts for institutions or individuals, insurance company general or separate accounts, pension funds and other similar institutional accounts.
| PORTFOLIOMANAGER | OTHERACCOUNTSMANAGED BY THEPORTFOLIOMANAGER |
| NAME | |
| Gregg R. Thomas, CFA | Other Registered Investment Companies: 9 accounts with total net assets of approximately $15,064 million Other Pooled Investment Vehicles: 14 accounts with total net assets of approximately $2,863 million, of which two accounts, with assets of approximately $1,342 million, has performance-based fees. |
| |
| | Other Accounts: 8 accounts with total net assets of approximately $4,109 million, of which two accounts, with assets of approximately $1,854 million, have performance-based fees |
| Roberto J. Isch, CFA | Other Registered Investment Companies: 3 accounts with total net assets of approximately $2,314 million Other Pooled Investment Vehicles: 3 accounts with total net assets of approximately $607 million. Other Accounts: 4 accounts with total net assets of approximately $1,428 million. |
Conflicts of Interest. Individual investment professionals at Wellington Management manage multiple accounts for multiple clients. These accounts may include mutual funds, separate accounts (assets managed on behalf of institutions, such as pension funds, insurance companies, foundations, or separately managed account programs sponsored by financial intermediaries), bank common trust accounts, and hedge funds. The Fund’s managers listed in the prospectus who are primarily responsible for the day-to-day management of the Fund (“Investment Professionals”) generally manage accounts in several different investment styles. These accounts may have investment objectives, strategies, time horizons, tax considerations and risk profiles that differ from those of the Fund. The Investment Professionals make investment decisions for each account, including the Fund, based on the investment objectives, policies, practices, benchmarks, cash flows, tax and other relevant investment considerations applicable to that account.Consequently, Investment Professionals may purchase or sell securities, including IPOs, for one account and not another account, and the performance of securities purchased for one account may vary from the performance of securities purchased for other accounts. Alternatively, these accounts may be managed in a similar fashion to the Fund and thus the accounts may have similar, and in some cases nearly identical, objectives, strategies and/or holdings to that of the Fund.
An Investment Professional or other investment professionals at Wellington Management may place transactions on behalf of other accounts that are directly or indirectly contrary to investment decisions made on behalf of the Fund, or make investment decisions that are similar to those made for the Fund, both of which have the potential to adversely impact the Fund depending on market conditions. For example, an investment professional may purchase a security in one account while appropriately selling that same security in another account. Similarly, an Investment Professional may purchase the same security for the Fund and one or more other accounts at or about the same time. In those instances the other accounts will have access to their respective holdings prior to the public disclosure of the Fund’s holdings. In addition, some of these accounts have fee structures, including performance fees, which are or have the potential to be higher, in some cases significantly higher, than the fees Wellington Management receives for managing the Fund. Mr. Thomas also manages an account which pays performance allocations to Wellington Management or its affiliates. Because incentive payments paid by Wellington Management to the Investment Professionals are tied to revenues earned by Wellington Management and, where noted, to the performance achieved by the manager in each account, the incentives associated with any given account may be significantly higher or lower than those associated with other accounts managed by an Investment Professional. Therefore, portfolio managers and other investment team members have an incentive to favor accounts that have the potential to provide a higher incentive compensation for them as individuals. Wellington Management manages the conflict created by these incentive arrangements through policies on the allocation of investment opportunities, including the allocation of equity IPOs, as well as after-the-fact monitoring the review of client accounts to assess dispersion among accounts with similar mandates. Finally, the Investment Professionals may hold shares or investments in the other pooled investment vehicles and/or other accounts identified above.
Wellington Management’s goal is to meet its fiduciary obligation to treat all clients fairly and provide high quality investment services to all of its clients. Wellington Management has adopted and implemented policies and procedures, including brokerage and trade allocation policies and procedures, which it believes address the conflicts associated with managing multiple accounts for multiple clients. In addition, Wellington Management monitors a variety of areas, including compliance with primary account guidelines, the allocation of IPOs, and compliance with the firm’s Code of Ethics, and places additional investment restrictions on investment professionals who manage hedge funds and certain other accounts. Furthermore, senior investment and business personnel at Wellington Management periodically review the performance of Wellington Management’s investment professionals. Although Wellington Management does not track the time an investment professional spends on a single account, Wellington Management does periodically assess whether an investment professional has adequate time and resources to effectively manage the investment professional’s various client mandates.
CompensationWellington Management receives a fee based on the assets under management of the Fund as set forth in the Subadvisory Agreement between Wellington Management and the Adviser on behalf of the Fund. Wellington Management pays its investment professionals out of its total revenues, including the advisory fees earned with respect to the Fund. The following information relates to the fiscal year ended December 31, 2019. Wellington Management’s compensation structure is designed to attract and retain high-caliber investment professional’s necessary to deliver high quality investment management services to its clients. Wellington Management’s compensation of the Fund’s manager listed in the Prospectus who is primarily responsible for the day-to-day management of the Fund (the “Investment Professional”) includes a base salary. The base salary for each Investment Professional who is a partner (a “Partner”) of Wellington Management Group LLP, the ultimate holding company of Wellington Management, is generally a fixed amount that is determined by the managing partners of Wellington Management Group LLP. The base salary for the other Investment Professional is determined by the Investment Professional’s experience and performance in his role as an Investment Professional. Base salaries for Wellington Management’s employees are reviewed annually and may be adjusted based on the recommendation of an Investment Professional’s manager, using guidelines established by Wellington Management’s Compensation Committee, which has final oversight responsibility for base salaries of employees of the firm. The Investment Professionals may also be eligible for bonus payments based on their overall contribution to Wellington Management’s business operations. Senior management at Wellington Management may reward individuals as it deems appropriate based on other factors. Each Partner is eligible to participate in a Partner-funded tax qualified retirement plan, the contributions to which are made pursuant to an actuarial formula. Messr. Thomas is a Partner.
Share Ownership by Portfolio Managers. The following table indicates as of December 31, 2019 the value of shares beneficially owned by the portfolio managers in the Fund.
| Range of |
| Beneficial |
| Portfolio Manager | Ownership |
| Gregg R. Thomas, CFA | $0 |
| Roberto J. Isch, CFA | $0 |
ITEM 9. PURCHASES OF EQUITY SECURITIES BY CLOSED-END MANAGEMENT INVESTMENT COMPANY AND AFFILIATED PURCHASERS.
(a) Not applicable.
(b)REGISTRANT PURCHASES OF EQUITY SECURITIES
| | | | | | Total Number of Shares | | Maximum Number |
| | Total | | | | Purchased as Part of | | of Shares that May |
| | Number of Shares | | Average Price | | Publicly Announced | | Yet Be Purchased |
| Period | | Purchased | | per Share | | Plans* | | Under the Plans |
| 19-Jan | | - | | - | | - | | 1,221,396* |
| 19-Feb | | - | | - | | - | | 1,222,381 |
| 19-Mar | | - | | - | | - | | 1,222,381 |
| 19-Apr | | - | | - | | - | | 1,222,381 |
| 19-May | | - | | - | | - | | 1,222,381 |
| 19-Jun | | - | | - | | - | | 1,222,381 |
| 19-Jul | | - | | - | | - | | 1,222,381 |
| 19-Aug | | - | | - | | - | | 1,222,381 |
| 19-Sep | | - | | - | | - | | 1,222,381 |
| 19-Oct | | - | | - | | - | | 1,222,381 |
| 19-Nov | | - | | - | | - | | 1,222,381 |
| 19-Dec | | - | | - | | - | | 1,222,381 |
| Total | | - | | - | | | | |
*On December 6, 2011, the Board of Trustees approved a share repurchase plan which was subsequently renewed and approved by the Board of Trustees each year in December. Under the current share repurchase plan the fund may purchase in the open market, between January 1, 2020 and December 31, 2020, up to an additional 10% of its outstanding common shares (based on common shares outstanding as of December 31, 2019).
ITEM 10. SUBMISSION OF MATTERS TO A VOTE OF SECURITY HOLDERS.
(a) The registrant has adopted procedures by which shareholders may recommend nominees to the registrant's Board of Trustees. A copy of the procedures is filed as an exhibit to this Form N-CSR. See attached "John Hancock Funds – Nominating and Governance Committee Charter".
ITEM 11. CONTROLS AND PROCEDURES.
(a) Based upon their evaluation of the registrant's disclosure controls and procedures as conducted within 90 days of the filing date of this Form N-CSR, the registrant's principal executive officer and principal financial officer have concluded that those disclosure controls and procedures provide reasonable assurance that the material information required to be disclosed by the registrant on this report is recorded, processed, summarized and reported within the time periods specified in the Securities and Exchange Commission's rules and forms.
(b) There were no changes in the registrant's internal control over financial reporting that occurred during the period covered by this report that have materially affected, or are reasonably likely to materially affect, the registrant's internal control over financial reporting.
ITEM 12. DISCLOSURE OF SECURITIES LENDING ACTIVITIES FOR CLOSED-END MANAGEMENT INVESTMENT COMPANIES.
Not applicable.
ITEM 13. EXHIBITS.
(a)(1) Code of Ethics for Senior Financial Officers is attached.
(a)(2) Separate certifications for the registrant's principal executive officer and principal financial officer, as required by Section 302 of the Sarbanes-Oxley Act of 2002 and Rule 30a-2(a) under the Investment Company Act of 1940, are attached.
(b)(1) Separate certifications for the registrant's principal executive officer and principal financial officer, as required by 18 U.S.C. Section 1350, as adopted pursuant to Section 906 of the Sarbanes-Oxley Act of 2002, and Rule 30a-2(b) under the Investment Company Act of 1940, are attached. The certifications furnished pursuant to this paragraph are not deemed to be "filed" for purposes of Section 18 of the Securities Exchange Act of 1934, or otherwise subject to the liability of that section. Such certifications are not deemed to be incorporated by reference into any filing under the Securities Act of 1933 or the Securities Exchange Act of 1934, except to the extent that the Registrant specifically incorporates them by reference.
(c)(1) Proxy Voting Policies and Procedures are attached.
(c)(2) Submission of Matters to a Vote of Security Holders is attached. See attached "John Hancock Funds - Governance Committee Charter".
(c)(3) Registrant’s notice to shareholders pursuant to Registrant’s exemptive order granting an exemption from Section 19(b) of the Investment Company Act of 1940, as amended and Rule 19b-1 thereunder regarding distributions made pursuant to the Registrant’s Managed Distribution Plan.
SIGNATURES
Pursuant to the requirements of the Securities Exchange Act of 1934 and the InvestmentCompany Act of 1940, the registrant has duly caused this report to be signed on its behalf by the undersigned, thereunto duly authorized.
John Hancock Hedged Equity & Income Fund
| By: | | /s/ Andrew Arnott |
| | Andrew Arnott |
| | President |
| |
| Date: | | February 14, 2020 |
Pursuant to the requirements of the Securities Exchange Act of 1934 and the Investment Company Act of 1940, this report has been signed below by the following persons on behalf of the registrant and in the capacities and on the dates indicated.
| By: | | /s/ Andrew Arnott |
| | Andrew Arnott |
| | President |
| |
| Date: | | February 14, 2020 |
| |
| By: | | /s/ Charles A. Rizzo |
| | Charles A. Rizzo |
| | Chief Financial Officer |
| |
| Date: | | February 14, 2020 |