UNITED STATES
SECURITIES AND EXCHANGE COMMISSION
Washington, D.C. 20549
FORM N-CSR
Certified Shareholder Report of
Registered Management Investment Companies
Investment Company Act File Number: 811-22449
American Funds Mortgage Fund
(Exact Name of Registrant as Specified in Charter)
P.O. Box 7650, One Market, Steuart Tower
San Francisco, California 94120
(Address of Principal Executive Offices)
Registrant's telephone number, including area code: (415) 421-9360
Date of fiscal year end: August 31
Date of reporting period: February 28, 2013
Steven I. Koszalka
American Funds Mortgage Fund
P.O. Box 7650, One Market, Steuart Tower
San Francisco, California 94120
(Name and Address of Agent for Service)
Copies to:
Michael Glazer
Bingham McCutchen LLP
355 South Grand Avenue, Suite 4400
Los Angeles, California 90071
(Counsel for the Registrant)
ITEM 1 – Reports to Stockholders
 | The right choice for the long term® |
American Funds
Mortgage Fund®

Semi-annual report for the six months ended February 28, 2013
American Funds Mortgage Fund seeks to provide current income and preserve capital.
This fund is one of more than 40 offered by American Funds, which is one of the nation’s largest mutual fund families. For more than 80 years, Capital Research and Management Company,SM the American Funds adviser, has invested with a long-term focus based on thorough research and attention to risk.
Fund results shown in this report, unless otherwise indicated, are for Class A shares at net asset value. If a sales charge (maximum 3.75%) had been deducted, the results would have been lower. Results are for past periods and are not predictive of results for future periods. Current and future results may be lower or higher than those shown. Share prices and returns will vary, so investors may lose money. Investing for short periods makes losses more likely. Investments are not FDIC-insured, nor are they deposits of or guaranteed by a bank or any other entity, so they may lose value. For current information and month-end results, visit americanfunds.com.
Here are the average annual total returns on a $1,000 investment with all distributions reinvested for the periods ended March 31, 2013 (the most recent calendar quarter-end):
| | | 1 year | | Since fund’s inception |
| Class A shares | | | | | | | (11/1/10) | |
| | | | | | | | | |
| Reflecting 3.75% maximum sales charge | | | –2.01% | | | | 1.40% |
The total annual fund operating expense ratio was 0.65% for Class A shares as of the prospectus dated November 1, 2012.
Investment results assume all distributions are reinvested and reflect applicable fees and expenses. When applicable, investment results reflect expense reimbursements, without which results would have been lower. Visit americanfunds.com for more information.
Results for other share classes can be found on page 28.
The return of principal for bond funds and for funds with significant underlying bond holdings is not guaranteed. Fund shares are subject to the same interest rate, inflation and credit risks associated with the underlying bond holdings. Investments in mortgage-related securities involve additional risks, such as prepayment risk, as more fully described in the prospectus. Bond ratings, which typically range from Aaa/AAA (highest) to D (lowest), are assigned by credit rating agencies such as Moody’s, Standard & Poor’s and/or Fitch as an indication of an issuer’s creditworthiness. Refer to the fund prospectus and the Risk Factors section of this report for more information on these and other risks associated with investing in the fund.

Fellow investors:
The first six months of American Funds Mortgage Fund’s fiscal year saw a slow but steady decline in bond prices, due in large part to an improving U.S. economy.
For the period ended February 28, 2013, the fund recorded a total return of –0.05%, with all dividends reinvested. This figure includes total accrued dividends of 3.6 cents a share, along with a one-time capital gain of just under 13 cents a share.
The dividend payments resulted in an income return of 0.35% for investors, whether they reinvested dividends or took them in cash.
By way of comparison, the unmanaged Barclays U.S. Mortgage Backed Securities Index lost 0.16% for the same six-month period, while the Lipper U.S. Mortgage Funds Average — which represents the fund’s peer group, returned 0.76%.
Results at a glance
For periods ended February 28, 2013, with all distributions reinvested
| | | | | | | | | Average annual | |
| | | Total returns | | | total returns | |
| | | | | | | | | Lifetime | |
| | | 6 months | | | 1 year | | | (since 11/1/10) | |
| American Funds Mortgage Fund (Class A shares) | | | –0.05 | % | | | 1.88 | % | | | 3.11 | % |
| Barclays U.S. Mortgage Backed Securities Index* | | | –0.16 | | | | 1.92 | | | | 3.36 | |
| Lipper U.S. Mortgage Funds Average | | | 0.76 | | | | 3.41 | | | | 3.90 | |
| Lipper GNMA Funds Average | | | –0.16 | | | | 1.99 | | | | 3.39 | |
| * | The index is unmanaged and, therefore, has no expenses. |
| American Funds Mortgage Fund | 1 |
Market overview
The nation’s economy improved to a degree during the first half of the fund’s fiscal year. Unemployment fell below 8% in late 2012, and home purchases rose steadily in most areas of the country. Strong corporate earnings, combined with many investors’ desire to earn more from their holdings, led the equity market to pre-2008 highs in early March.
The result has been a modest decline in bond prices throughout the period. U.S. Treasuries, widely considered a safe-haven investment, experienced a small but steady decline. Mortgage-backed securities (MBS) — which generally follow trends in the Treasury market — also fell to a degree.
Additional factors have weighed on the mortgage market, most notably the question of how and when the Federal Reserve will wind down its participation in the MBS market. In September, the Fed committed to ongoing purchases of agency MBS, starting at $40 billion a month, but allowing for adjustments over time. Any change in the amount purchased would depend on a variety of macroeconomic and market factors, but generally speaking, as the economy improves, the Fed is expected to invest less in mortgage bonds.
Forecasting when and how the Fed will reduce its purchases is difficult. The Fed is not yet close to conducting outright sales, and there has been little selling in the mortgage market that can be attributed to concerns about Fed policy. But concerns will grow, and a market selloff may ensue, should the economy improve rapidly.
The fund’s response
With these factors in mind, the fund’s portfolio counselors have sought to position the fund more defensively through a number of strategies. In order to mitigate a negative price return should bonds continue to weaken, some have sought to move into shorter duration holdings. While this may result in lower income, it would help stabilize the fund’s value and allow for opportunities to buy higher yielding bonds in the future.
The fund’s holdings also have been diversified. While the vast majority of the portfolio consists of agency MBS sponsored by Fannie Mae, Freddie Mac and Ginnie Mae, a small percentage has been invested in other instruments. For example, multifamily MBS —bonds issued by Fannie Mae and Freddie Mac, backed by mortgages for apartments, condominiums and the like — have held up well over the past six months. Policymakers have expressed an interest in slowing issuance in this market, which would reduce supply and potentially keep prices higher.
The fund also holds a small number of overseas mortgage securities, as well as municipal bonds issued by housing authorities based on underlying traditional mortgage securities guaranteed by Freddie, Fannie and Ginnie.
| 2 | American Funds Mortgage Fund |
Going forward
We expect the U.S. economy to improve over the remainder of the fund’s fiscal year, and with that, bond prices are likely to decline. However, it is worth noting that the ongoing economic uncertainties in Europe or adverse fiscal policy surprises in the U.S. may yet provide support to Treasury prices, and thus the mortgage market as well.
We continue to monitor the Federal Reserve and its MBS purchase program. We expect that these purchases will trail off and end some time in 2014, depending again on the state of the national economy.
Investing in the U.S. mortgage market can provide both stability and income for investors, especially in portfolios with exposure to more volatile holdings, particularly equities. With global economic risks remaining, we manage the fund so that it can provide that stability and income should other assets falter. We continue to take a long-term perspective in our investments and urge you to take a similar approach with your portfolio.
We look forward to reporting to you again in six months.
Cordially,

John H. Smet
President
April 15, 2013
For current information about the fund, visit americanfunds.com.
The fund’s 30-day yield for Class A shares as of March 31, 2013, calculated in accordance with the U.S. Securities and Exchange Commission (SEC) formula, was 0.51%. The fund’s 12-month distribution rate for Class A shares as of that date was 0.84%. Both reflect the 3.75% maximum sales charge. The SEC yield reflects the rate at which the fund is earning income on its current portfolio of securities while the distribution rate reflects the fund’s past dividends paid to shareholders. Accordingly, the fund’s SEC yield and distribution rate may differ.
| American Funds Mortgage Fund | 3 |
| Summary investment portfolio February 28, 2013 | unaudited |
The following summary investment portfolio is designed to streamline the report and help investors better focus on the fund’s principal holdings. See the inside back cover for details on how to obtain a complete schedule of portfolio holdings.
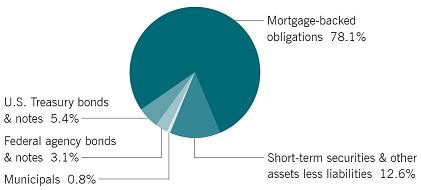
| Investment mix by security type | Percent of net assets |
| Breakdown of mortgage-backed obligations | Percent of net assets |
| 30-year pass-throughs: | | | | | | | | |
| Fannie Mae | | | 28.2 | % | | | | |
| Ginnie Mae | | | 18.7 | | | | | |
| Freddie Mac | | | 6.8 | | | | 53.7 | % |
| 15-year pass-throughs | | | | | | | 16.6 | |
| Other | | | | | | | 7.8 | |
| Total | | | | | | | 78.1 | % |
| Quality breakdown* | Percent of net assets |
| Federal agencies | | | 60.0 | % |
| U.S. government obligations† | | | 24.4 | |
| AAA | | | 2.9 | |
| AA | | | 0.1 | |
| Short-term securities & other assets less liabilities | | | 12.6 | |
| * | Bond ratings, which typically range from Aaa/AAA (highest) to D (lowest), are assigned by credit rating agencies such as Moody’s, Standard & Poor’s and/or Fitch as an indication of an issuer’s creditworthiness. If agency ratings differ, the security will be considered to have received the highest of those ratings, consistent with the fund’s investment policies. |
| † | These securities are guaranteed by the full faith and credit of the United States government. |
| 4 | American Funds Mortgage Fund |
Bonds & notes — 87.39% |
| Principal
amount
(000) |
|
|
Value
(000) |
|
| Percent
of net
assets |
|
| Mortgage-backed obligations — 78.12% | | | | | | | | | | | | |
| Federal agency mortgage-backed obligations1 — 75.93% | | | | | | | | | | | | |
| Fannie Mae: | | | | | | | | | | | | |
| 2.50% 2022 | | $ | 9,815 | | | $ | 10,245 | | | | | |
| 2.50% 2022 | | | 6,610 | | | | 6,899 | | | | | |
| 4.50% 2026 | | | 5,483 | | | | 5,924 | | | | | |
| 2.50% 2027 | | | 9,014 | | | | 9,373 | | | | | |
| 2.00% 20282 | | | 28,360 | | | | 28,660 | | | | | |
| 2.50% 20282 | | | 24,550 | | | | 25,497 | | | | | |
| 2.50% 20282 | | | 10,230 | | | | 10,583 | | | | | |
| 2.50% 2028 | | | 5,483 | | | | 5,714 | | | | | |
| 3.00% 20282 | | | 10,852 | | | | 11,390 | | | | | |
| 3.00% 20282 | | | 6,500 | | | | 6,831 | | | | | |
| 4.50% 2040 | | | 9,399 | | | | 10,152 | | | | | |
| 5.00% 2040 | | | 6,281 | | | | 6,864 | | | | | |
| 4.00% 2041 | | | 7,053 | | | | 7,532 | | | | 46.57 | % |
| 4.50% 2041 | | | 10,259 | | | | 11,081 | | | | | |
| 4.50% 2041 | | | 5,513 | | | | 5,962 | | | | | |
| 3.50% 2042 | | | 6,213 | | | | 6,585 | | | | | |
| 4.00% 2042 | | | 22,478 | | | | 24,075 | | | | | |
| 4.00% 2042 | | | 5,474 | | | | 5,863 | | | | | |
| 3.00% 20432 | | | 7,000 | | | | 7,249 | | | | | |
| 3.50% 20432 | | | 18,040 | | | | 18,987 | | | | | |
| 3.50% 20432 | | | 8,700 | | | | 9,183 | | | | | |
| 4.00% 20432 | | | 25,410 | | | | 27,093 | | | | | |
| 5.00% 20432 | | | 14,980 | | | | 16,221 | | | | | |
| 5.50% 20432 | | | 6,190 | | | | 6,745 | | | | | |
| 1.114%–6.00% 2017–20432,3 | | | 66,323 | | | | 70,675 | | | | | |
| Government National Mortgage Assn.: | | | | | | | | | | | | |
| 6.00% 2039 | | | 18,635 | | | | 21,184 | | | | | |
| 5.50% 2040 | | | 16,634 | | | | 18,624 | | | | | |
| 3.50% 2041 | | | 12,541 | | | | 13,455 | | | | | |
| 4.50% 2041 | | | 6,248 | | | | 6,806 | | | | 18.98 | |
| 5.00% 2041 | | | 11,325 | | | | 12,413 | | | | | |
| 3.50% 20432 | | | 6,600 | | | | 7,115 | | | | | |
| 2.50%–6.50% 2027–2042 | | | 60,064 | | | | 65,230 | | | | | |
| Freddie Mac: | | | | | | | | | | | | |
| 4.50% 2041 | | | 7,902 | | | | 8,451 | | | | 10.29 | |
| 1.321%–6.00% 2016–20423 | | | 65,803 | | | | 70,058 | | | | | |
| Other securities | | | | | | | 721 | | | | .09 | |
| | | | | | | | 579,440 | | | | 75.93 | |
| Other mortgage-backed obligations — 2.19% | | | | | | | | | | | | |
| Other securities | | | | | | | 16,677 | | | | 2.19 | |
| Total mortgage-backed obligations | | | | | | | 596,117 | | | | 78.12 | |
| American Funds Mortgage Fund | 5 |
| Bonds & notes | | Principal
amount
(000) | | | Value
(000) | | | Percent
of net
assets | |
| U.S. Treasury bonds & notes — 5.41% | | | | | | | | | | | | |
| U.S. Treasury — 2.90% | | | | | | | | | | | | |
| 3.125% 2013 | | $ | 6,510 | | | $ | 6,607 | | | | 2.90 | % |
| 1.875% 2014 | | | 15,230 | | | | 15,487 | | | | | |
| | | | | | | | 22,094 | | | | 2.90 | |
| | | | | | | | | | | | | |
| U.S. Treasury inflation-protected securities4 — 2.51% | | | | | | | | | | | | |
| 0.125%–1.875% 2013–2042 | | | 18,155 | | | | 19,175 | | | | 2.51 | |
| Total U.S. Treasury bonds & notes | | | | | | | 41,269 | | | | 5.41 | |
| | | | | | | | | | | | | |
| Federal agency bonds & notes — 3.03% | | | | | | | | | | | | |
| Freddie Mac: | | | | | | | | | | | | |
| 0.375% 2014 | | | 10,850 | | | | 10,866 | | | | | |
| 1.25%–1.75% 2015–2019 | | | 4,905 | | | | 4,982 | | | | 2.08 | |
| Federal Home Loan Bank 1.00%–4.125% 2017–2020 | | | 5,350 | | | | 5,638 | | | | .74 | |
| Tennessee Valley Authority 1.875% 2022 | | | 1,650 | | | | 1,638 | | | | .21 | |
| | | | | | | | 23,124 | | | | 3.03 | |
| | | | | | | | | | | | | |
| Municipals — 0.83% | | | | | | | | | | | | |
| Other securities | | | | | | | 6,334 | | | | .83 | |
| Total bonds & notes (cost: $656,988,000) | | | | | | | 666,844 | | | | 87.39 | |
| | | | | | | | | | | | | |
| | | | | | | | | | | | | |
| Short-term securities — 41.40% | | | | | | | | | | | | |
| U.S. Treasury Bills 0.08%–0.158% due 4/11–5/2/2013 | | | 55,100 | | | | 55,093 | | | | 7.22 | |
| Fannie Mae 0.11%–0.16% due 3/13–10/25/2013 | | | 55,100 | | | | 55,079 | | | | 7.22 | |
| Freddie Mac 0.07%–0.115% due 4/4–6/17/2013 | | | 26,300 | | | | 26,294 | | | | 3.45 | |
| Medtronic Inc. 0.11%–0.17% due 3/20–5/9/20135 | | | 21,300 | | | | 21,295 | | | | 2.79 | |
| NetJets Inc. 0.08% due 3/12/20135 | | | 17,000 | | | | 17,000 | | | | 2.23 | |
| Procter & Gamble Co. 0.10% due 5/7/20135 | | | 15,900 | | | | 15,897 | | | | 2.08 | |
| John Deere Credit Ltd. 0.11%–0.12% due 3/27–4/3/20135 | | | 15,700 | | | | 15,699 | | | | 2.06 | |
| Paccar Financial Corp. 0.12%–0.14% due 3/25–5/8/2013 | | | 15,000 | | | | 14,996 | | | | 1.96 | |
| General Electric Co. 0.12% due 3/1/2013 | | | 14,400 | | | | 14,400 | | | | 1.89 | |
| 6 | American Funds Mortgage Fund |
| Short-term securities | | Principal
amount
(000) | | | Value
(000) | | | Percent
of net
assets | |
| Tennessee Valley Authority 0.07% due 3/14/2013 | | $ | 13,000 | | | $ | 13,000 | | | | 1.70 | % |
| Abbott Laboratories 0.11%–0.12% due 4/16–5/7/20135 | | | 12,100 | | | | 12,098 | | | | 1.59 | |
| Federal Home Loan Bank 0.085% due 3/20/2013 | | | 10,800 | | | | 10,800 | | | | 1.41 | |
| Walt Disney Co. 0.13% due 5/10/20135 | | | 10,700 | | | | 10,696 | | | | 1.40 | |
| Google Inc. 0.15% due 3/6/20135 | | | 10,200 | | | | 10,200 | | | | 1.34 | |
| Emerson Electric Co. 0.12% due 4/22/20135 | | | 9,600 | | | | 9,598 | | | | 1.26 | |
| Jupiter Securitization Co., LLC 0.13%–0.21% due 3/12–3/13/20135 | | | 8,200 | | | | 8,200 | | | | 1.07 | |
| Other securities | | | | | | | 5,599 | | | | .73 | |
| Total short-term securities (cost: $315,943,000) | | | | | | | 315,944 | | | | 41.40 | |
| | | | | | | | | | | | | |
| Total investment securities (cost: $972,931,000) | | | | | | | 982,788 | | | | 128.79 | |
| Other assets less liabilities | | | | | | | (219,692 | ) | | | (28.79 | ) |
| | | | | | | | | | | | | |
| Net assets | | | | | | $ | 763,096 | | | | 100.00 | % |
“Other securities” includes all issues that are not disclosed separately in the summary investment portfolio.
The following footnotes apply to either the individual securities noted or one or more of the securities aggregated and listed as a single line item.
| 1 | Principal payments may be made periodically. Therefore, the effective maturity date may be earlier than the stated maturity date. |
| 2 | A portion or all of the security purchased on a TBA basis. |
| 3 | Coupon rate may change periodically. |
| 4 | Index-linked bond whose principal amount moves with a government price index. |
| 5 | Acquired in a transaction exempt from registration under Rule 144A or section 4(2) of the Securities Act of 1933. May be resold in the U.S. in transactions exempt from registration, normally to qualified institutional buyers. The total value of all such securities, including those in “Other securities,” was $142,959,000, which represented 18.73% of the net assets of the fund. |
Key to abbreviation
TBA = To be announced
See Notes to Financial Statements
| American Funds Mortgage Fund | 7 |
Financial statements
| Statement of assets and liabilities | | | | | unaudited | |
| at February 28, 2013 | | (dollars in thousands) | |
| | | | | | | |
| Assets: | | | | | | | | |
| Investment securities, at value (cost: $972,931) | | | | | | $ | 982,788 | |
| Cash | | | | | | | 110 | |
| Receivables for: | | | | | | | | |
| Sales of investments | | $ | 164,595 | | | | | |
| Sales of fund’s shares | | | 662 | | | | | |
| Interest | | | 1,603 | | | | 166,860 | |
| | | | | | | | 1,149,758 | |
| Liabilities: | | | | | | | | |
| Payables for: | | | | | | | | |
| Purchases of investments | | | 385,603 | | | | | |
| Repurchases of fund’s shares | | | 645 | | | | | |
| Dividends on fund’s shares | | | 19 | | | | | |
| Investment advisory services | | | 127 | | | | | |
| Services provided by related parties | | | 231 | | | | | |
| Trustees’ deferred compensation | | | 1 | | | | | |
| Other | | | 36 | | | | 386,662 | |
| Net assets at February 28, 2013 | | | | | | $ | 763,096 | |
| | | | | | | | | |
| Net assets consist of: | | | | | | | | |
| Capital paid in on shares of beneficial interest | | | | | | $ | 754,954 | |
| Distributions in excess of net investment income | | | | | | | (3,596 | ) |
| Undistributed net realized gain | | | | | | | 1,881 | |
| Net unrealized appreciation | | | | | | | 9,857 | |
| Net assets at February 28, 2013 | | | | | | $ | 763,096 | |
(dollars and shares in thousands, except per-share amounts)
Shares of beneficial interest issued and outstanding (no stated par value) —
unlimited shares authorized (75,305 total shares outstanding)
| | | | | | Shares | | | Net asset value | |
| | | Net assets | | | outstanding | | | per share | |
| Class A | | $ | 207,881 | | | | 20,513 | | | $ | 10.13 | |
| Class B | | | 1,342 | | | | 133 | | | | 10.13 | |
| Class C | | | 30,754 | | | | 3,037 | | | | 10.13 | |
| Class F-1 | | | 12,400 | | | | 1,224 | | | | 10.13 | |
| Class F-2 | | | 58,092 | | | | 5,732 | | | | 10.13 | |
| Class 529-A | | | 10,590 | | | | 1,045 | | | | 10.13 | |
| Class 529-B | | | 564 | | | | 56 | | | | 10.13 | |
| Class 529-C | | | 8,836 | | | | 873 | | | | 10.13 | |
| Class 529-E | | | 1,006 | | | | 99 | | | | 10.13 | |
| Class 529-F-1 | | | 3,715 | | | | 367 | | | | 10.13 | |
| Class R-1 | | | 1,419 | | | | 140 | | | | 10.13 | |
| Class R-2 | | | 2,615 | | | | 258 | | | | 10.13 | |
| Class R-3 | | | 2,550 | | | | 252 | | | | 10.13 | |
| Class R-4 | | | 1,646 | | | | 162 | | | | 10.13 | |
| Class R-5 | | | 7,753 | | | | 765 | | | | 10.13 | |
| Class R-6 | | | 411,933 | | | | 40,649 | | | | 10.13 | |
See Notes to Financial Statements
| 8 | American Funds Mortgage Fund |
| Statement of operations | | | | | unaudited | |
| for the six months ended February 28, 2013 | | (dollars in thousands) | |
| | | | | | | |
| Investment income: | | | | | | | | |
| Income: | | | | | | | | |
| Interest | | | | | | $ | 1,127 | |
| | | | | | | | | |
| Fees and expenses*: | | | | | | | | |
| Investment advisory services | | $ | 789 | | | | | |
| Distribution services | | | 490 | | | | | |
| Transfer agent services | | | 223 | | | | | |
| Administrative services | | | 131 | | | | | |
| Reports to shareholders | | | 23 | | | | | |
| Registration statement and prospectus | | | 176 | | | | | |
| Trustees’ compensation | | | 2 | | | | | |
| Auditing and legal | | | 4 | | | | | |
| Custodian | | | 1 | | | | | |
| Other | | | 26 | | | | 1,865 | |
| Net investment loss | | | | | | | (738 | ) |
| | | | | | | | | |
| Net realized gain and unrealized depreciation on investments | | | | | | | | |
| Net realized gain on investments | | | | | | | 3,628 | |
| Net unrealized depreciation on investments | | | | | | | (2,565 | ) |
| Net realized gain and unrealized depreciation on investments | | | | | | | 1,063 | |
| Net increase in net assets resulting from operations | | | | | | $ | 325 | |
* Additional information related to class-specific fees and expenses is included in the Notes to Financial Statements.
See Notes to Financial Statements
| American Funds Mortgage Fund | 9 |
| Statements of changes in net assets | |
| | (dollars in thousands) |
| | | Six months ended | | Year ended |
| | | February 28, 2013* | | August 31, 2012 |
| | | | | |
| Operations: | | | | | | | | |
| Net investment (loss) income | | $ | (738 | ) | | $ | 3,196 | |
| Net realized gain on investments | | | 3,628 | | | | 13,852 | |
| Net unrealized (depreciation) appreciation on investments | | | (2,565 | ) | | | 3,523 | |
| Net increase in net assets resulting from operations | | | 325 | | | | 20,571 | |
| | | | | | | | | |
| Dividends and distributions paid or accrued to shareholders: | | | | | | | | |
| Dividends from net investment income | | | (2,895 | ) | | | (7,201 | ) |
| Distributions from net realized gain on investments | | | (9,088 | ) | | | (5,376 | ) |
| Total dividends and distributions paid or accrued to shareholders | | | (11,983 | ) | | | (12,577 | ) |
| | | | | | | | | |
| Net capital share transactions | | | 147,137 | | | | 245,095 | |
| | | | | | | | | |
| Total increase in net assets | | | 135,479 | | | | 253,089 | |
| | | | | | | | | |
| Net assets: | | | | | | | | |
| Beginning of period | | | 627,617 | | | | 374,528 | |
| End of period (including distributions in excess of and undistributed net investment income: $(3,596) and $37, respectively) | | $ | 763,096 | | | $ | 627,617 | |
* Unaudited.
See Notes to Financial Statements
| 10 | American Funds Mortgage Fund |
| Notes to financial statements | |
| | unaudited |
1. Organization
American Funds Mortgage Fund (the “fund”) is registered under the Investment Company Act of 1940 as an open-end, diversified management investment company. The fund seeks to provide current income and preserve capital.
The fund has 16 share classes consisting of five retail share classes (Classes A, B and C, as well as two F share classes, F-1 and F-2), five 529 college savings plan share classes (Classes 529-A, 529-B, 529-C, 529-E and 529-F-1) and six retirement plan share classes (Classes R-1, R-2, R-3, R-4, R-5 and R-6). The 529 college savings plan share classes can be used to save for college education. The retirement plan share classes are generally offered only through eligible employer-sponsored retirement plans. The fund’s share classes are further described below:
| Share class | | Initial sales charge | | Contingent deferred sales
charge upon redemption | | Conversion feature | |
Classes A and
529-A | | Up to 3.75% | | None (except 1% for certain redemptions within one year of purchase without an initial sales charge) | | None | |
Classes B and
529-B* | | None | | Declines from 5% to 0% for redemptions within six years of purchase | | Classes B and 529-B convert to Classes A and 529-A, respectively, after eight years | |
| Class C | | None | | 1% for redemptions within one year of purchase | | Class C converts to Class F-1 after 10 years | |
| Class 529-C | | None | | 1% for redemptions within one year of purchase | | None | |
| Class 529-E | | None | | None | | None | |
Classes F-1, F-2
and 529-F-1 | | None | | None | | None | |
Classes R-1, R-2,
R-3, R-4, R-5
and R-6 | | None | | None | | None | |
* Class B and 529-B shares of the fund are not available for purchase.
Holders of all share classes have equal pro rata rights to assets, dividends and liquidation proceeds. Each share class has identical voting rights, except for the exclusive right to vote on matters affecting only its class. Share classes have different fees and expenses (“class-specific fees and expenses”), primarily due to different arrangements for distribution, administrative and shareholder services. Differences in class-specific fees and expenses will result in differences in net investment income and, therefore, the payment of different per-share dividends by each class.
| American Funds Mortgage Fund | 11 |
2. Significant accounting policies
The financial statements have been prepared to comply with accounting principles generally accepted in the United States of America. These principles require management to make estimates and assumptions that affect reported amounts and disclosures. Actual results could differ from those estimates. The fund follows the significant accounting policies described below, as well as the valuation policies described in the next section on valuation.
Security transactions and related investment income — Security transactions are recorded by the fund as of the date the trades are executed with brokers. Realized gains and losses from security transactions are determined based on the specific identified cost of the securities. In the event a security is purchased with a delayed payment date, the fund will segregate liquid assets sufficient to meet its payment obligations. Interest income is recognized on an accrual basis. Market discounts, premiums and original issue discounts on fixed-income securities are amortized daily over the expected life of the security.
Class allocations — Income, fees and expenses (other than class-specific fees and expenses) are allocated daily among the various share classes based on the relative value of their settled shares. Realized and unrealized gains and losses are allocated daily among the various share classes based on their relative net assets. Class-specific fees and expenses, such as distribution, administrative and shareholder services, are charged directly to the respective share class.
Dividends and distributions to shareholders — Dividends to shareholders are declared daily after the determination of the fund’s net investment income and are paid to shareholders monthly. Distributions to shareholders are recorded on the ex-dividend date.
3. Valuation
Capital Research and Management Company (“CRMC”), the fund’s investment adviser, values the fund’s investments at fair value as defined by accounting principles generally accepted in the United States of America. The net asset value of each share class of the fund is generally determined as of approximately 4:00 p.m. New York time each day the New York Stock Exchange is open.
Methods and inputs — The fund’s investment adviser uses the following methods and inputs to establish the fair value of the fund’s assets and liabilities. Use of particular methods and inputs may vary over time based on availability and relevance as market and economic conditions evolve.
Fixed-income securities, including short-term securities purchased with more than 60 days left to maturity, are generally valued at prices obtained from one or more pricing vendors. Vendors value such securities based on one or more of the inputs described in the following table. The table provides examples of inputs that are commonly relevant for valuing particular classes of fixed-income securities in which the fund is authorized to invest. However, these classifications are not exclusive, and any of the inputs may be used to value any other class of fixed-income security.
| 12 | American Funds Mortgage Fund |
| Fixed-income class | Examples of standard inputs |
| All | Benchmark yields, transactions, bids, offers, quotations from dealers and trading systems, new issues, spreads and other relationships observed in the markets among comparable securities; and proprietary pricing models such as yield measures calculated using factors such as cash flows, financial or collateral performance and other reference data (collectively referred to as “standard inputs”) |
Bonds & notes of governments
& government agencies | Standard inputs and interest rate volatilities |
Mortgage-backed;
asset-backed obligations | Standard inputs and cash flows, prepayment information, default rates, delinquency and loss assumptions, collateral characteristics, credit enhancements and specific deal information |
| Municipal securities | Standard inputs and, for certain distressed securities, cash flows or liquidation values using a net present value calculation based on inputs that include, but are not limited to, financial statements and debt contracts |
When the fund’s investment adviser deems it appropriate to do so (such as when vendor prices are unavailable or not deemed to be representative), fixed-income securities will be valued in good faith at the mean quoted bid and ask prices that are reasonably and timely available (or bid prices, if ask prices are not available) or at prices for securities of comparable maturity, quality and type.
Short-term securities purchased within 60 days to maturity are valued at amortized cost, which approximates fair value. The value of short-term securities originally purchased with maturities greater than 60 days is determined based on an amortized value to par when they reach 60 days.
Securities and other assets for which representative market quotations are not readily available or are considered unreliable by the fund’s investment adviser are fair valued as determined in good faith under fair value guidelines adopted by authority of the fund’s board of trustees as further described below. The investment adviser follows fair valuation guidelines, consistent with U.S. Securities and Exchange Commission rules and guidance, to consider relevant principles and factors when making fair value determinations. The investment adviser considers relevant indications of value that are reasonably and timely available to it in determining the fair value to be assigned to a particular security, such as the type and cost of the security; contractual or legal restrictions on resale of the security; relevant financial or business developments of the issuer; actively traded similar or related securities; conversion or exchange rights on the security; related corporate actions; significant events occurring after the close of trading in the security; and changes in overall market conditions. Fair valuations and valuations of investments that are not actively trading involve judgment and may differ materially from valuations that would have been used had greater market activity occurred.
| American Funds Mortgage Fund | 13 |
Processes and structure — The fund’s board of trustees has delegated authority to the fund’s investment adviser to make fair value determinations, subject to board oversight. The investment adviser has established a Joint Fair Valuation Committee (the “Fair Valuation Committee”) to administer, implement and oversee the fair valuation process, and to make fair value decisions. The Fair Valuation Committee regularly reviews its own fair value decisions, as well as decisions made under its standing instructions to the investment adviser’s valuation teams. The Fair Valuation Committee reviews changes in fair value measurements from period to period and may, as deemed appropriate, update the fair valuation guidelines to better reflect the results of back testing and address new or evolving issues. The Fair Valuation Committee reports any changes to the fair valuation guidelines to the board of trustees with supplemental information to support the changes. The fund’s board and audit committee also regularly review reports that describe fair value determinations and methods.
The fund’s investment adviser has also established a Fixed-Income Pricing Review Group to administer and oversee the fixed-income valuation process, including the use of fixed-income pricing vendors. This group regularly reviews pricing vendor information and market data. Pricing decisions, processes and controls over security valuation are also subject to additional internal reviews, including an annual control self-evaluation program facilitated by the investment adviser’s compliance group.
Classifications — The fund’s investment adviser classifies the fund’s assets and liabilities into three levels based on the inputs used to value the assets or liabilities. Level 1 values are based on quoted prices in active markets for identical securities. Level 2 values are based on significant observable market inputs, such as quoted prices for similar securities and quoted prices in inactive markets. Level 3 values are based on significant unobservable inputs that reflect the investment adviser’s determination of assumptions that market participants might reasonably use in valuing the securities. The valuation levels are not necessarily an indication of the risk or liquidity associated with the underlying investment. For example, U.S. government securities are reflected as Level 2 because the inputs used to determine fair value may not always be quoted prices in an active market. At February 28, 2013, all of the fund’s investment securities were classified as Level 2.
4. Risk factors
Investing in the fund may involve certain risks including, but not limited to, those described below.
Investing in mortgage-related securities — Mortgage-related securities are subject to prepayment risk as well as the risks associated with investing in debt securities in general. If interest rates fall and the loans underlying these securities are prepaid faster than expected, the fund may have to reinvest the prepaid principal in lower yielding securities, thus reducing the fund’s income. Conversely, if interest rates increase and the loans underlying the securities are prepaid more slowly than expected, the expected duration of the securities may be extended, reducing the cash flow for potential reinvestment in higher yielding securities.
| 14 | American Funds Mortgage Fund |
Market conditions — The prices of, and the income generated by, the securities held by the fund may decline due to market conditions and other factors, including those directly involving the issuers of securities held by the fund.
Investing in bonds — Rising interest rates will generally cause the prices of bonds and other debt securities to fall. Longer maturity debt securities may be subject to greater price fluctuations than shorter maturity debt securities. In addition, falling interest rates may cause an issuer to redeem, call or refinance a debt security before its stated maturity, which may result in the fund having to reinvest the proceeds in lower yielding securities.
Bonds and other debt securities are subject to credit risk, which is the possibility that the credit strength of an issuer will weaken and/or an issuer of a debt security will fail to make timely payments of principal or interest and the security will go into default. Lower quality debt securities generally have higher rates of interest and may be subject to greater price fluctuations than higher quality debt securities.
Thinly traded securities — There may be little trading in the secondary market for particular bonds or other debt securities, which may make them more difficult to value, acquire or sell.
Investing in securities backed by the U.S. government — Securities backed by the U.S. Treasury or the full faith and credit of the U.S. government are guaranteed only as to the timely payment of interest and principal when held to maturity. Accordingly, the current market values for these securities will fluctuate with changes in interest rates. Securities issued by government-sponsored entities and federal agencies and instrumentalities that are not backed by the full faith and credit of the U.S. government are neither issued nor guaranteed by the U.S. government.
Investing in future delivery contracts — Contracts for future delivery of mortgage-related securities, such as to be announced contracts and mortgage dollar rolls, involve the fund selling mortgage-related securities and simultaneously contracting to repurchase similar securities for delivery at a future date at a predetermined price. This can increase the fund’s market exposure, and the market price of the securities the fund contracts to repurchase could drop below their purchase price. While the fund can preserve and generate capital through the use of such contracts by, for example, realizing the difference between the sale price and the future purchase price, the income generated by the fund may be reduced by engaging in such transactions. In addition, these transactions may increase the turnover rate of the fund.
Management — The investment adviser to the fund actively manages the fund’s investments. Consequently, the fund is subject to the risk that the methods and analyses employed by the investment adviser in this process may not produce the desired results. This could cause the fund to lose value or its investment results to lag relevant benchmarks or other funds with similar objectives.
| American Funds Mortgage Fund | 15 |
5. Certain investment techniques
Mortgage dollar rolls — The fund has entered into mortgage dollar roll transactions in which the fund sells a mortgage-backed security to a counterparty and simultaneously enters into an agreement with the same counterparty to buy back a similar security on a specific future date at a predetermined price. Risks may arise due to the delayed payment date and the potential inability of counterparties to complete the transaction. Mortgage dollar rolls are accounted for as purchase and sale transactions, which may increase the fund’s portfolio turnover rate.
6. Taxation and distributions
Federal income taxation — The fund complies with the requirements under Subchapter M of the Internal Revenue Code applicable to mutual funds and intends to distribute substantially all of its net taxable income and net capital gains each year. The fund is not subject to income taxes to the extent such distributions are made. Therefore, no federal income tax provision is required.
As of and during the period ended February 28, 2013, the fund did not have a liability for any unrecognized tax benefits. The fund recognizes interest and penalties, if any, related to unrecognized tax benefits as income tax expense in the statement of operations. During the period, the fund did not incur any interest or penalties.
The fund is not subject to examination by U.S. federal and state tax authorities for tax years before 2010, the year the fund commenced operations.
Distributions — Distributions paid to shareholders are based on net investment income and net realized gains determined on a tax basis, which may differ from net investment income and net realized gains for financial reporting purposes. These differences are due primarily to different treatment for items such as short-term capital gains and losses; cost of investments sold; paydowns on fixed-income securities; and income on certain investments. The fiscal year in which amounts are distributed may differ from the year in which the net investment income and net realized gains are recorded by the fund for financial reporting purposes.
The components of distributable earnings on a tax basis are reported as of the fund’s most recent year-end. As of August 31, 2012, the fund had tax basis undistributed ordinary income of $4,223,000 and undistributed long-term capital gains of $3,247,000.
As of February 28, 2013, the tax basis unrealized appreciation (depreciation) and cost of investment securities were as follows (dollars in thousands):
| Gross unrealized appreciation on investment securities | | $ | 10,078 | |
| Gross unrealized depreciation on investment securities | | | (305 | ) |
| Net unrealized appreciation on investment securities | | | 9,773 | |
| Cost of investment securities | | | 973,015 | |
| 16 | American Funds Mortgage Fund |
The tax character of distributions paid or accrued to shareholders was as follows (dollars in thousands):
| | | Six months ended February 28, 2013 | | | Year ended August 31, 2012 | |
| | | | | | | | | Total | | | | | | | | | Total | |
| | | | | | | | | distributions | | | | | | | | | distributions | |
| | | Ordinary | | | Long-term | | | paid or | | | Ordinary | | | Long-term | | | paid or | |
| Share class | | income | | | capital gains | | | accrued | | | income | | | capital gains | | | accrued | |
| Class A | | $ | 2,479 | | | $ | 1,062 | | | $ | 3,541 | | | $ | 3,446 | | | $ | — | | | $ | 3,446 | |
| Class B | | | 13 | | | | 7 | | | | 20 | | | | 20 | | | | — | | | | 20 | |
| Class C | | | 261 | | | | 154 | | | | 415 | | | | 321 | | | | — | | | | 321 | |
| Class F-1 | | | 134 | | | | 58 | | | | 192 | | | | 201 | | | | — | | | | 201 | |
| Class F-2 | | | 739 | | | | 286 | | | | 1,025 | | | | 1,059 | | | | — | | | | 1,059 | |
| Class 529-A | | | 109 | | | | 49 | | | | 158 | | | | 81 | | | | — | | | | 81 | |
| Class 529-B | | | 4 | | | | 3 | | | | 7 | | | | 3 | | | | — | | | | 3 | |
| Class 529-C | | | 68 | | | | 40 | | | | 108 | | | | 24 | | | | — | | | | 24 | |
| Class 529-E | | | 7 | | | | 3 | | | | 10 | | | | 5 | | | | — | | | | 5 | |
| Class 529-F-1 | | | 17 | | | | 6 | | | | 23 | | | | 17 | | | | — | | | | 17 | |
| Class R-1 | | | 22 | | | | 12 | | | | 34 | | | | 59 | | | | — | | | | 59 | |
| Class R-2 | | | 22 | | | | 12 | | | | 34 | | | | 23 | | | | — | | | | 23 | |
| Class R-3 | | | 25 | | | | 12 | | | | 37 | | | | 25 | | | | — | | | | 25 | |
| Class R-4 | | | 18 | | | | 8 | | | | 26 | | | | 21 | | | | — | | | | 21 | |
| Class R-5 | | | 116 | | | | 44 | | | | 160 | | | | 122 | | | | — | | | | 122 | |
| Class R-6 | | | 4,497 | | | | 1,696 | | | | 6,193 | | | | 7,150 | | | | — | | | | 7,150 | |
| Total | | $ | 8,531 | | | $ | 3,452 | | | $ | 11,983 | | | $ | 12,577 | | | $ | — | | | $ | 12,577 | |
7. Fees and transactions with related parties
CRMC, the fund’s investment adviser, is the parent company of American Funds Distributors®, Inc. (“AFD”), the principal underwriter of the fund’s shares, and American Funds Service Company® (“AFS”), the fund’s transfer agent. CRMC, AFD and AFS are considered related parties to the fund.
Investment advisory services — The fund has an investment advisory and service agreement with CRMC that provides for monthly fees accrued daily. These fees are based on a series of decreasing annual rates beginning with 0.30% on the first $60 million of daily net assets and decreasing to 0.14% on such assets in excess of $10 billion. The agreement also provides for monthly fees, accrued daily, based on a series of decreasing rates beginning with 3.00% on the first $3,333,333 of the fund’s monthly gross income and decreasing to 2.00% on such income in excess of $8,333,333. For the six months ended February 28, 2013, the investment advisory services fee was $789,000, which was equivalent to an annualized rate of 0.227% of average daily net assets.
| American Funds Mortgage Fund | 17 |
Class-specific fees and expenses — Expenses that are specific to individual share classes are accrued directly to the respective share class. The principal class-specific fees and expenses are described below:
Distribution services — The fund has plans of distribution for all share classes, except Class F-2, R-5 and R-6 shares. Under the plans, the board of trustees approves certain categories of expenses that are used to finance activities primarily intended to sell fund shares and service existing accounts. The plans provide for payments, based on an annualized percentage of average daily net assets, ranging from 0.30% to 1.00% as noted below. In some cases, the board of trustees has limited the amounts that may be paid to less than the maximum allowed by the plans. All share classes with a plan may use up to 0.25% of average daily net assets to pay service fees, or to compensate AFD for paying service fees, to firms that have entered into agreements with AFD to provide certain shareholder services. The remaining amounts available to be paid under each plan are paid to dealers to compensate them for their sales activities.
For Class A and 529-A shares, distribution-related expenses include the reimbursement of dealer and wholesaler commissions paid by AFD for certain shares sold without a sales charge. These share classes reimburse AFD for amounts billed within the prior 15 months but only to the extent that the overall annual expense limit of 0.25% is not exceeded. As of February 28, 2013, there were no unreimbursed expenses subject to reimbursement for Class A or 529-A shares.
| Share class | | Currently approved limits | | Plan limits |
| Class A | | | 0.25 | % | | | 0.30 | % |
| Class 529-A | | | 0.25 | | | | 0.50 | |
| Classes B and 529-B | | | 1.00 | | | | 1.00 | |
| Classes C, 529-C and R-1 | | | 1.00 | | | | 1.00 | |
| Class R-2 | | | 0.75 | | | | 1.00 | |
| Classes 529-E and R-3 | | | 0.50 | | | | 0.75 | |
| Classes F-1, 529-F-1 and R-4 | | | 0.25 | | | | 0.50 | |
Transfer agent services — The fund has a shareholder services agreement with AFS under which the fund compensates AFS for providing transfer agent services to each of the fund’s share classes. These services include recordkeeping, shareholder communications and transaction processing. In addition, the fund reimburses AFS for amounts paid to third parties for performing transfer agent services on behalf of fund shareholders.
Administrative services — The fund has an administrative services agreement with CRMC under which the fund compensates CRMC for providing administrative services to Class A, C, F, 529 and R shares. These services include, but are not limited to, coordinating, monitoring, assisting and overseeing third parties that provide services to fund shareholders. Under the agreement, Class A shares pay an annual fee of 0.01% and Class C, F, 529 and R shares pay an annual fee of 0.05% of their respective average daily net assets.
| 18 | American Funds Mortgage Fund |
529 plan services — Each 529 share class is subject to service fees to compensate the Commonwealth of Virginia for the maintenance of the 529 college savings plan. The quarterly fee is based on a series of decreasing annual rates beginning with 0.10% on the first $30 billion of the net assets invested in Class 529 shares of the American Funds and decreasing to 0.06% on such assets between $120 billion and $150 billion. The fee for any given calendar quarter is accrued and calculated on the basis of the average net assets of Class 529 shares of the American Funds for the last month of the prior calendar quarter. The fee is included in other expenses on the accompanying financial statements. The Commonwealth of Virginia is not considered a related party.
Class-specific expenses under the agreements described above for the six months ended February 28, 2013, were as follows (dollars in thousands):
| Share class | | Distribution
services | | Transfer agent
services | | Administrative
services | | 529 plan
services | |
| Class A | | | $231 | | | | $142 | | | | $11 | | | Not applicable | |
| Class B | | | 7 | | | | 1 | | | | Not applicable | | | Not applicable | |
| Class C | | | 158 | | | | 22 | | | | 8 | | | Not applicable | |
| Class F-1 | | | 15 | | | | 7 | | | | 3 | | | Not applicable | |
| Class F-2 | | | Not applicable | | | | 31 | | | | 15 | | | Not applicable | |
| Class 529-A | | | 10 | | | | 5 | | | | 2 | | | $ 5 | |
| Class 529-B | | | 3 | | | | — | * | | | — | * | | — | * |
| Class 529-C | | | 42 | | | | 5 | | | | 2 | | | 4 | |
| Class 529-E | | | 2 | | | | — | * | | | — | * | | — | * |
| Class 529-F-1 | | | — | | | | 1 | | | | — | * | | 1 | |
| Class R-1 | | | 10 | | | | — | * | | | 1 | | | Not applicable | |
| Class R-2 | | | 7 | | | | 4 | | | | 1 | | | Not applicable | |
| Class R-3 | | | 4 | | | | 2 | | | | 1 | | | Not applicable | |
| Class R-4 | | | 1 | | | | 1 | | | | — | * | | Not applicable | |
| Class R-5 | | | Not applicable | | | | 2 | | | | 2 | | | Not applicable | |
| Class R-6 | | | Not applicable | | | | — | * | | | 85 | | | Not applicable | |
| Total class-specific expenses | | | $490 | | | | $223 | | | | $131 | | | $10 | |
| *Amount less than one thousand. | | | | | | | | | | | | |
Trustees’ deferred compensation — Trustees who are unaffiliated with CRMC may elect to defer the cash payment of part or all of their compensation. These deferred amounts, which remain as liabilities of the fund, are treated as if invested in shares of the fund or other American Funds. These amounts represent general, unsecured liabilities of the fund and vary according to the total returns of the selected funds. Trustees’ compensation of $2,000, shown on the accompanying financial statements, includes $2,000 in current fees (either paid in cash or deferred) and a net increase of less than $1,000 in the value of the deferred amounts.
Affiliated officers and trustees — Officers and certain trustees of the fund are or may be considered to be affiliated with CRMC, AFD and AFS. No affiliated officers or trustees received any compensation directly from the fund.
| American Funds Mortgage Fund | 19 |
8. Capital share transactions
Capital share transactions in the fund were as follows (dollars and shares in thousands):
| | | | | | | | | Reinvestments | | | | | | | | | | | | | |
| | | | | | | | | of dividends | | | | | | | | | Net increase | |
| | | Sales* | | | and distributions | | | Repurchases* | | | (decrease) | |
| Share class | | Amount | | | Shares | | | Amount | | | Shares | | | Amount | | | Shares | | | Amount | | | Shares | |
| | | | | | | | | | | | | | | | | | | | | | | | | | |
| Six months ended February 28, 2013 | | | | | | | | | | | | | | | | | | | | | | | | | |
| | | | | | | | | | | | | | | | | | | | | | | | | | | | | | | | | |
| Class A | | $ | 58,696 | | | | 5,721 | | | $ | 3,167 | | | | 311 | | | $ | (48,823 | ) | | | (4,785 | ) | | $ | 13,040 | | | | 1,247 | |
| Class B | | | 458 | | | | 45 | | | | 19 | | | | 2 | | | | (609 | ) | | | (60 | ) | | | (132 | ) | | | (13 | ) |
| Class C | | | 6,617 | | | | 646 | | | | 396 | | | | 39 | | | | (7,163 | ) | | | (701 | ) | | | (150 | ) | | | (16 | ) |
| Class F-1 | | | 4,983 | | | | 487 | | | | 182 | | | | 18 | | | | (4,009 | ) | | | (392 | ) | | | 1,156 | | | | 113 | |
| Class F-2 | | | 4,358 | | | | 423 | | | | 992 | | | | 98 | | | | (4,000 | ) | | | (392 | ) | | | 1,350 | | | | 129 | |
| Class 529-A | | | 4,352 | | | | 425 | | | | 158 | | | | 15 | | | | (1,513 | ) | | | (148 | ) | | | 2,997 | | | | 292 | |
| Class 529-B | | | 69 | | | | 7 | | | | 7 | | | | 1 | | | | (98 | ) | | | (10 | ) | | | (22 | ) | | | (2 | ) |
| Class 529-C | | | 1,986 | | | | 195 | | | | 108 | | | | 11 | | | | (1,154 | ) | | | (113 | ) | | | 940 | | | | 93 | |
| Class 529-E | | | 501 | | | | 49 | | | | 10 | | | | 1 | | | | (89 | ) | | | (9 | ) | | | 422 | | | | 41 | |
| Class 529-F-1 | | | 2,655 | | | | 262 | | | | 23 | | | | 2 | | | | (65 | ) | | | (6 | ) | | | 2,613 | | | | 258 | |
| Class R-1 | | | 214 | | | | 21 | | | | 26 | | | | 3 | | | | (1,411 | ) | | | (139 | ) | | | (1,171 | ) | | | (115 | ) |
| Class R-2 | | | 653 | | | | 63 | | | | 28 | | | | 3 | | | | (339 | ) | | | (33 | ) | | | 342 | | | | 33 | |
| Class R-3 | | | 762 | | | | 74 | | | | 30 | | | | 3 | | | | (299 | ) | | | (29 | ) | | | 493 | | | | 48 | |
| Class R-4 | | | 261 | | | | 25 | | | | 17 | | | | 1 | | | | (43 | ) | | | (4 | ) | | | 235 | | | | 22 | |
| Class R-5 | | | 2,076 | | | | 202 | | | | 153 | | | | 15 | | | | (3,438 | ) | | | (337 | ) | | | (1,209 | ) | | | (120 | ) |
| Class R-6 | | | 128,798 | | | | 12,600 | | | | 6,231 | | | | 612 | | | | (8,796 | ) | | | (859 | ) | | | 126,233 | | | | 12,353 | |
Total net increase
(decrease) | | $ | 217,439 | | | | 21,245 | | | $ | 11,547 | | | | 1,135 | | | $ | (81,849 | ) | | | (8,017 | ) | | $ | 147,137 | | | | 14,363 | |
| | | | | | | | | | | | | | | | | | | | | | | | | | | | | | | | | |
| Year ended August 31, 2012 | | | | | | | | | | | | | | | | | | | | | | | | | | | | | |
| | | | | | | | | | | | | | | | | | | | | | | | | | | | | | | | | |
| Class A | | $ | 148,888 | | | | 14,617 | | | $ | 2,803 | | | | 276 | | | $ | (43,317 | ) | | | (4,254 | ) | | $ | 108,374 | | | | 10,639 | |
| Class B | | | 1,753 | | | | 172 | | | | 20 | | | | 2 | | | | (1,063 | ) | | | (104 | ) | | | 710 | | | | 70 | |
| Class C | | | 23,252 | | | | 2,283 | | | | 310 | | | | 30 | | | | (7,226 | ) | | | (708 | ) | | | 16,336 | | | | 1,605 | |
| Class F-1 | | | 14,454 | | | | 1,419 | | | | 180 | | | | 18 | | | | (6,352 | ) | | | (623 | ) | | | 8,282 | | | | 814 | |
| Class F-2 | | | 62,824 | | | | 6,175 | | | | 1,010 | | | | 99 | | | | (8,565 | ) | | | (842 | ) | | | 55,269 | | | | 5,432 | |
| Class 529-A | | | 6,855 | | | | 673 | | | | 80 | | | | 8 | | | | (590 | ) | | | (58 | ) | | | 6,345 | | | | 623 | |
| Class 529-B | | | 573 | | | | 56 | | | | 3 | | | | 1 | | | | (134 | ) | | | (13 | ) | | | 442 | | | | 44 | |
| Class 529-C | | | 8,134 | | | | 796 | | | | 23 | | | | 2 | | | | (770 | ) | | | (75 | ) | | | 7,387 | | | | 723 | |
| Class 529-E | | | 517 | | | | 51 | | | | 5 | | | | 1 | | | | (60 | ) | | | (6 | ) | | | 462 | | | | 46 | |
| Class 529-F-1 | | | 864 | | | | 85 | | | | 17 | | | | 2 | | | | (109 | ) | | | (11 | ) | | | 772 | | | | 76 | |
| Class R-1 | | | 589 | | | | 57 | | | | 50 | | | | 5 | | | | (1,420 | ) | | | (139 | ) | | | (781 | ) | | | (77 | ) |
| Class R-2 | | | 1,901 | | | | 187 | | | | 14 | | | | 1 | | | | (537 | ) | | | (53 | ) | | | 1,378 | | | | 135 | |
| Class R-3 | | | 1,406 | | | | 138 | | | | 13 | | | | 2 | | | | (231 | ) | | | (23 | ) | | | 1,188 | | | | 117 | |
| Class R-4 | | | 890 | | | | 87 | | | | 9 | | | | 1 | | | | (144 | ) | | | (14 | ) | | | 755 | | | | 74 | |
| Class R-5 | | | 8,710 | | | | 853 | | | | 107 | | | | 11 | | | | (2,010 | ) | | | (198 | ) | | | 6,807 | | | | 666 | |
| Class R-6 | | | 42,545 | | | | 4,176 | | | | 7,161 | | | | 705 | | | | (18,337 | ) | | | (1,798 | ) | | | 31,369 | | | | 3,083 | |
Total net increase
(decrease) | | $ | 324,155 | | | | 31,825 | | | $ | 11,805 | | | | 1,164 | | | $ | (90,865 | ) | | | (8,919 | ) | | $ | 245,095 | | | | 24,070 | |
| * | Includes exchanges between share classes of the fund. |
| 20 | American Funds Mortgage Fund |
9. Investment transactions
The fund made purchases and sales of investment securities, excluding short-term securities and U.S. government obligations, if any, of $1,882,614,000 and $1,813,126,000, respectively, during the six months ended February 28, 2013.
10. Ownership concentration
At February 28, 2013, the fund had three shareholders, American Funds 2020 Target Date Retirement Fund, American Funds 2015 Target Date Retirement Fund and American Funds 2010 Target Date Retirement Fund, with aggregate ownership of the fund’s outstanding shares of 17%, 11% and 14%, respectively. CRMC is the investment adviser to the three target date retirement funds.
| American Funds Mortgage Fund | 21 |
Financial highlights
| | | | | | | | | (Loss) income from investment operations1 | |
| | | | | | Net asset
value,
beginning
of period | | | Net
investment
(loss) income | | | Net gains
on securities
(both realized
and
unrealized) | | | Total from
investment operations | |
| Class A: | | | Six months ended 2/28/20134,5 | | | $ | 10.30 | | | $ | (.01 | ) | | $ | .01 | | | $ | — | 6 |
| | | | Year ended 8/31/2012 | | | | 10.16 | | | | .05 | | | | .34 | | | | .39 | |
| | | | Period from 11/1/20108 to 8/31/20114 | | | | 10.00 | | | | .18 | | | | .15 | | | | .33 | |
| Class B: | | | Six months ended 2/28/20134,5 | | | | 10.30 | | | | (.06 | ) | | | .02 | | | | (.04 | ) |
| | | | Year ended 8/31/2012 | | | | 10.16 | | | | (.04 | ) | | | .34 | | | | .30 | |
| | | | Period from 11/1/20108 to 8/31/20114 | | | | 10.00 | | | | .13 | | | | .15 | | | | .28 | |
| Class C: | | | Six months ended 2/28/20134,5 | | | | 10.30 | | | | (.06 | ) | | | .02 | | | | (.04 | ) |
| | | | Year ended 8/31/2012 | | | | 10.16 | | | | (.04 | ) | | | .34 | | | | .30 | |
| | | | Period from 11/1/20108 to 8/31/20114 | | | | 10.00 | | | | .13 | | | | .15 | | | | .28 | |
| Class F-1: | | | Six months ended 2/28/20134,5 | | | | 10.30 | | | | (.02 | ) | | | .01 | | | | (.01 | ) |
| | | | Year ended 8/31/2012 | | | | 10.16 | | | | .04 | | | | .34 | | | | .38 | |
| | | | Period from 11/1/20108 to 8/31/20114 | | | | 10.00 | | | | .18 | | | | .15 | | | | .33 | |
| Class F-2: | | | Six months ended 2/28/20134,5 | | | | 10.30 | | | | — | 6 | | | .01 | | | | .01 | |
| | | | Year ended 8/31/2012 | | | | 10.16 | | | | .07 | | | | .34 | | | | .41 | |
| | | | Period from 11/1/20108 to 8/31/20114 | | | | 10.00 | | | | .20 | | | | .15 | | | | .35 | |
| Class 529-A: | | | Six months ended 2/28/20134,5 | | | | 10.30 | | | | (.02 | ) | | | .01 | | | | (.01 | ) |
| | | | Year ended 8/31/2012 | | | | 10.16 | | | | .04 | | | | .34 | | | | .38 | |
| | | | Period from 11/1/20108 to 8/31/20114 | | | | 10.00 | | | | .18 | | | | .15 | | | | .33 | |
| Class 529-B: | | | Six months ended 2/28/20134,5 | | | | 10.30 | | | | (.06 | ) | | | .02 | | | | (.04 | ) |
| | | | Year ended 8/31/2012 | | | | 10.16 | | | | (.05 | ) | | | .34 | | | | .29 | |
| | | | Period from 11/1/20108 to 8/31/20114 | | | | 10.00 | | | | .13 | | | | .15 | | | | .28 | |
| Class 529-C: | | | Six months ended 2/28/20134,5 | | | | 10.30 | | | | (.06 | ) | | | .02 | | | | (.04 | ) |
| | | | Year ended 8/31/2012 | | | | 10.16 | | | | (.05 | ) | | | .34 | | | | .29 | |
| | | | Period from 11/1/20108 to 8/31/20114 | | | | 10.00 | | | | .13 | | | | .15 | | | | .28 | |
See page 25 for footnotes.
| 22 | American Funds Mortgage Fund |
|
| Dividends and distributions | | | | | | | | | | | | | | | | | | | |
Dividends
(from net
investment
income) | | | Distributions (from capital
gains) | | | Total dividends
and
distributions | | | Net asset
value, end
of period | | | Total
return2,3 | | | Net assets,
end of period
(in thousands) | | | Ratio of
expenses to
average net
assets before
reimbursements | | | Ratio of
expenses to
average net
assets after
reimbursements3 | | | Ratio of
net (loss)
income to
average
net assets3 | |
| $ | (.04 | ) | | $ | (.13 | ) | | $ | (.17 | ) | | $ | 10.13 | | | | (.05 | )% | | $ | 207,881 | | | | .66 | %7 | | | .66 | %7 | | | (.33 | )%7 |
| | (.14 | ) | | | (.11 | ) | | | (.25 | ) | | | 10.30 | | | | 3.90 | | | | 198,417 | | | | .65 | | | | .65 | | | | .49 | |
| | (.17 | ) | | | — | | | | (.17 | ) | | | 10.16 | | | | 3.40 | | | | 87,631 | | | | .73 | 7 | | | .66 | 7 | | | 2.21 | 7 |
| | — | 6 | | | (.13 | ) | | | (.13 | ) | | | 10.13 | | | | (.36 | ) | | | 1,342 | | | | 1.44 | 7 | | | 1.44 | 7 | | | (1.11 | )7 |
| | (.05 | ) | | | (.11 | ) | | | (.16 | ) | | | 10.30 | | | | 3.07 | | | | 1,500 | | | | 1.45 | | | | 1.45 | | | | (.28 | ) |
| | (.12 | ) | | | — | | | | (.12 | ) | | | 10.16 | | | | 2.88 | | | | 773 | | | | 1.50 | 7 | | | 1.43 | 7 | | | 1.63 | 7 |
| | — | 6 | | | (.13 | ) | | | (.13 | ) | | | 10.13 | | | | (.37 | ) | | | 30,754 | | | | 1.48 | 7 | | | 1.48 | 7 | | | (1.15 | )7 |
| | (.05 | ) | | | (.11 | ) | | | (.16 | ) | | | 10.30 | | | | 3.03 | | | | 31,444 | | | | 1.48 | | | | 1.48 | | | | (.35 | ) |
| | (.12 | ) | | | — | | | | (.12 | ) | | | 10.16 | | | | 2.84 | | | | 14,706 | | | | 1.54 | 7 | | | 1.50 | 7 | | | 1.58 | 7 |
| | (.03 | ) | | | (.13 | ) | | | (.16 | ) | | | 10.13 | | | | (.07 | ) | | | 12,400 | | | | .69 | 7 | | | .69 | 7 | | | (.36 | )7 |
| | (.13 | ) | | | (.11 | ) | | | (.24 | ) | | | 10.30 | | | | 3.85 | | | | 11,439 | | | | .68 | | | | .68 | | | | .42 | |
| | (.17 | ) | | | — | | | | (.17 | ) | | | 10.16 | | | | 3.37 | | | | 3,020 | | | | .78 | 7 | | | .71 | 7 | | | 2.21 | 7 |
| | (.05 | ) | | | (.13 | ) | | | (.18 | ) | | | 10.13 | | | | .05 | | | | 58,092 | | | | .45 | 7 | | | .45 | 7 | | | (.12 | )7 |
| | (.16 | ) | | | (.11 | ) | | | (.27 | ) | | | 10.30 | | | | 4.10 | | | | 57,707 | | | | .45 | | | | .45 | | | | .66 | |
| | (.19 | ) | | | — | | | | (.19 | ) | | | 10.16 | | | | 3.57 | | | | 1,741 | | | | .54 | 7 | | | .46 | 7 | | | 2.37 | 7 |
| | (.03 | ) | | | (.13 | ) | | | (.16 | ) | | | 10.13 | | | | (.08 | ) | | | 10,590 | | | | .77 | 7 | | | .77 | 7 | | | (.44 | )7 |
| | (.13 | ) | | | (.11 | ) | | | (.24 | ) | | | 10.30 | | | | 3.80 | | | | 7,758 | | | | .74 | | | | .74 | | | | .32 | |
| | (.17 | ) | | | — | | | | (.17 | ) | | | 10.16 | | | | 3.36 | | | | 1,320 | | | | .77 | 7 | | | .71 | 7 | | | 2.37 | 7 |
| | — | 6 | | | (.13 | ) | | | (.13 | ) | | | 10.13 | | | | (.38 | ) | | | 564 | | | | 1.56 | 7 | | | 1.56 | 7 | | | (1.23 | )7 |
| | (.04 | ) | | | (.11 | ) | | | (.15 | ) | | | 10.30 | | | | 2.96 | | | | 595 | | | | 1.54 | | | | 1.54 | | | | (.51 | ) |
| | (.12 | ) | | | — | | | | (.12 | ) | | | 10.16 | | | | 2.79 | | | | 146 | | | | 1.64 | 7 | | | 1.54 | 7 | | | 1.44 | 7 |
| | — | 6 | | | (.13 | ) | | | (.13 | ) | | | 10.13 | | | | (.38 | ) | | | 8,836 | | | | 1.57 | 7 | | | 1.57 | 7 | | | (1.24 | )7 |
| | (.04 | ) | | | (.11 | ) | | | (.15 | ) | | | 10.30 | | | | 2.95 | | | | 8,038 | | | | 1.52 | | | | 1.52 | | | | (.58 | ) |
| | (.12 | ) | | | — | | | | (.12 | ) | | | 10.16 | | | | 2.78 | | | | 581 | | | | 1.63 | 7 | | | 1.57 | 7 | | | 1.53 | 7 |
| American Funds Mortgage Fund | 23 |
Financial highlights (continued)
| | | | | (Loss) income from investment operations1 | |
| | | | | Net asset
value,
beginning
of period | | | Net
investment
(loss) income | | | Net gains
on securities
(both realized and
unrealized) | | | Total from
investment
operations | |
| Class 529-E: | | Six months ended 2/28/20134,5 | | $ | 10.30 | | | $ | (.03 | ) | | $ | .01 | | | $ | (.02 | ) |
| | | Year ended 8/31/2012 | | | 10.16 | | | | .01 | | | | .34 | | | | .35 | |
| | | Period from 11/1/20108 to 8/31/20114 | | | 10.00 | | | | .16 | | | | .15 | | | | .31 | |
| Class 529-F-1: | | Six months ended 2/28/20134,5 | | | 10.30 | | | | (.02 | ) | | | .02 | | | | —6 | |
| | | Year ended 8/31/2012 | | | 10.16 | | | | .05 | | | | .34 | | | | .39 | |
| | | Period from 11/1/20108 to 8/31/20114 | | | 10.00 | | | | .19 | | | | .15 | | | | .34 | |
| Class R-1: | | Six months ended 2/28/20134,5 | | | 10.30 | | | | (.04 | ) | | | .01 | | | | (.03 | ) |
| | | Year ended 8/31/2012 | | | 10.16 | | | | (.02 | ) | | | .34 | | | | .32 | |
| | | Period from 11/1/20108 to 8/31/20114 | | | 10.00 | | | | .13 | | | | .15 | | | | .28 | |
| Class R-2: | | Six months ended 2/28/20134,5 | | | 10.30 | | | | (.05 | ) | | | .02 | | | | (.03 | ) |
| | | Year ended 8/31/2012 | | | 10.16 | | | | (.02 | ) | | | .34 | | | | .32 | |
| | | Period from 11/1/20108 to 8/31/20114 | | | 10.00 | | | | .14 | | | | .15 | | | | .29 | |
| Class R-3: | | Six months ended 2/28/20134,5 | | | 10.30 | | | | (.02 | ) | | | .01 | | | | (.01 | ) |
| | | Year ended 8/31/2012 | | | 10.16 | | | | .02 | | | | .34 | | | | .36 | |
| | | Period from 11/1/20108 to 8/31/20114 | | | 10.00 | | | | .16 | | | | .15 | | | | .31 | |
| Class R-4: | | Six months ended 2/28/20134,5 | | | 10.30 | | | | (.01 | ) | | | .01 | | | | —6 | |
| | | Year ended 8/31/2012 | | | 10.16 | | | | .05 | | | | .34 | | | | .39 | |
| | | Period from 11/1/20108 to 8/31/20114 | | | 10.00 | | | | .18 | | | | .15 | | | | .33 | |
| Class R-5: | | Six months ended 2/28/20134,5 | | | 10.30 | | | | —6 | | | | .01 | | | | .01 | |
| | | Year ended 8/31/2012 | | | 10.16 | | | | .07 | | | | .34 | | | | .41 | |
| | | Period from 11/1/20108 to 8/31/20114 | | | 10.00 | | | | .20 | | | | .15 | | | | .35 | |
| Class R-6: | | Six months ended 2/28/20134,5 | | | 10.30 | | | | —6 | | | | .01 | | | | .01 | |
| | | Year ended 8/31/2012 | | | 10.16 | | | | .07 | | | | .34 | | | | .41 | |
| | | Period from 11/1/20108 to 8/31/20114 | | | 10.00 | | | | .20 | | | | .15 | | | | .35 | |
| | | Six months
ended
February 28, 20134,5 | | | Year ended
August 31, 2012 | | | For the period
11/1/20108 to 8/31/20114 | |
| Portfolio turnover rate for all share classes | | | 298% | | | | 442% | | | | 240% | |
| 24 | American Funds Mortgage Fund |
| Dividends and distributions | | | | | | | | | | | | | | | | | | | |
Dividends
(from net
investment
income) | | | Distributions
(from capital
gains) | | | Total
dividends
and
distributions | | | Net asset
value, end
of period | | | Total
return3 | | | Net assets,
end of period
(in thousands) | | | Ratio of
expenses to
average net
assets before
reimbursements | | | Ratio of
expenses to
average net
assets after
reimbursements3 | | | Ratio of
net (loss)
income to
average
net assets3 | |
| $ | (.02 | ) | | $ | (.13 | ) | | $ | (.15 | ) | | $ | 10.13 | | | | (.23 | )% | | $ | 1,006 | | | | 1.03 | %7 | | | 1.03 | %7 | | | (.71 | )%7 |
| | (.10 | ) | | | (.11 | ) | | | (.21 | ) | | | 10.30 | | | | 3.49 | | | | 595 | | | | 1.04 | | | | 1.04 | | | | .02 | |
| | (.15 | ) | | | — | | | | (.15 | ) | | | 10.16 | | | | 3.13 | | | | 125 | | | | 1.12 | 7 | | | 1.05 | 7 | | | 2.04 | 7 |
| | (.04 | ) | | | (.13 | ) | | | (.17 | ) | | | 10.13 | | | | — | 9 | | | 3,715 | | | | .55 | 7 | | | .55 | 7 | | | (.30 | )7 |
| | (.14 | ) | | | (.11 | ) | | | (.25 | ) | | | 10.30 | | | | 3.99 | | | | 1,121 | | | | .56 | | | | .56 | | | | .53 | |
| | (.18 | ) | | | — | | | | (.18 | ) | | | 10.16 | | | | 3.49 | | | | 333 | | | | .62 | 7 | | | .57 | 7 | | | 2.43 | 7 |
| | (.01 | ) | | | (.13 | ) | | | (.14 | ) | | | 10.13 | | | | (.29 | ) | | | 1,419 | | | | 1.19 | 7 | | | 1.19 | 7 | | | (.87 | )7 |
| | (.07 | ) | | | (.11 | ) | | | (.18 | ) | | | 10.30 | | | | 3.20 | | | | 2,629 | | | | 1.33 | | | | 1.33 | | | | (.12 | ) |
| | (.12 | ) | | | — | | | | (.12 | ) | | | 10.16 | | | | 2.87 | | | | 3,371 | | | | 1.43 | 7 | | | 1.32 | 7 | | | 1.36 | 7 |
| | (.01 | ) | | | (.13 | ) | | | (.14 | ) | | | 10.13 | | | | (.30 | ) | | | 2,615 | | | | 1.27 | 7 | | | 1.27 | 7 | | | (.94 | )7 |
| | (.07 | ) | | | (.11 | ) | | | (.18 | ) | | | 10.30 | | | | 3.26 | | | | 2,316 | | | | 1.27 | | | | 1.27 | | | | (.14 | ) |
| | (.13 | ) | | | — | | | | (.13 | ) | | | 10.16 | | | | 2.95 | | | | 913 | | | | 1.32 | 7 | | | 1.18 | 7 | | | 1.48 | 7 |
| | (.03 | ) | | | (.13 | ) | | | (.16 | ) | | | 10.13 | | | | (.13 | ) | | | 2,550 | | | | .84 | 7 | | | .84 | 7 | | | (.51 | )7 |
| | (.11 | ) | | | (.11 | ) | | | (.22 | ) | | | 10.30 | | | | 3.63 | | | | 2,097 | | | | .89 | | | | .89 | | | | .23 | |
| | (.15 | ) | | | — | | | | (.15 | ) | | | 10.16 | | | | 3.18 | | | | 885 | | | | 1.03 | 7 | | | .92 | 7 | | | 1.76 | 7 |
| | (.04 | ) | | | (.13 | ) | | | (.17 | ) | | | 10.13 | | | | (.04 | ) | | | 1,646 | | | | .63 | 7 | | | .63 | 7 | | | (.30 | )7 |
| | (.14 | ) | | | (.11 | ) | | | (.25 | ) | | | 10.30 | | | | 3.91 | | | | 1,437 | | | | .62 | | | | .62 | | | | .51 | |
| | (.17 | ) | | | — | | | | (.17 | ) | | | 10.16 | | | | 3.37 | | | | 665 | | | | .77 | 7 | | | .69 | 7 | | | 1.93 | 7 |
| | (.05 | ) | | | (.13 | ) | | | (.18 | ) | | | 10.13 | | | | .08 | | | | 7,753 | | | | .39 | 7 | | | .39 | 7 | | | (.06 | )7 |
| | (.16 | ) | | | (.11 | ) | | | (.27 | ) | | | 10.30 | | | | 4.14 | | | | 9,114 | | | | .39 | | | | .39 | | | | .70 | |
| | (.19 | ) | | | — | | | | (.19 | ) | | | 10.16 | | | | 3.58 | | | | 2,220 | | | | .49 | 7 | | | .44 | 7 | | | 2.40 | 7 |
| | (.05 | ) | | | (.13 | ) | | | (.18 | ) | | | 10.13 | | | | .10 | | | | 411,933 | | | | .34 | 7 | | | .34 | 7 | | | (.02 | )7 |
| | (.16 | ) | | | (.11 | ) | | | (.27 | ) | | | 10.30 | | | | 4.19 | | | | 291,410 | | | | .37 | | | | .37 | | | | .82 | |
| | (.19 | ) | | | — | | | | (.19 | ) | | | 10.16 | | | | 3.61 | | | | 256,098 | | | | .51 | 7 | | | .41 | 7 | | | 2.55 | 7 |
| 1 | Based on average shares outstanding. |
| 2 | Total returns exclude any applicable sales charges, including contingent deferred sales charges. |
| 3 | This column reflects the impact, if any, of certain reimbursements from CRMC. During some of the periods shown, CRMC reimbursed other fees and expenses. |
| 4 | Based on operations for the period shown and, accordingly, is not representative of a full year. |
| 5 | Unaudited. |
| 6 | Amount less than $.01. |
| 7 | Annualized. |
| 8 | Commencement of operations. |
| 9 | Amount less than .01%. |
| | |
| See Notes to Financial Statements |
| American Funds Mortgage Fund | 25 |
As a shareholder of the fund, you incur two types of costs: (1) transaction costs, such as initial sales charges on purchase payments and contingent deferred sales charges on redemptions (loads), and (2) ongoing costs, including management fees, distribution and service (12b-1) fees, and other expenses. This example is intended to help you understand your ongoing costs (in dollars) of investing in the fund so you can compare these costs with the ongoing costs of investing in other mutual funds. The example is based on an investment of $1,000 invested at the beginning of the period and held for the entire six-month period (September 1, 2012, through February 28, 2013).
Actual expenses:
The first line of each share class in the table on the next page provides information about actual account values and actual expenses. You may use the information in this line, together with the amount you invested, to estimate the expenses that you paid over the period. Simply divide your account value by $1,000 (for example, an $8,600 account value divided by $1,000 = 8.6), then multiply the result by the number in the first line under the heading entitled “Expenses paid during period” to estimate the expenses you paid on your account during this period.
Hypothetical example for comparison purposes:
The second line of each share class in the table on the next page provides information about hypothetical account values and hypothetical expenses based on the actual expense ratio for the share class and an assumed rate of return of 5.00% per year before expenses, which is not the actual return of the share class. The hypothetical account values and expenses may not be used to estimate the actual ending account balance or expenses you paid for the period. You may use this information to compare the ongoing costs of investing in the fund and other funds. To do so, compare this 5.00% hypothetical example with the 5.00% hypothetical examples that appear in the shareholder reports of the other funds.
Notes:
There are some account fees that are charged to certain types of accounts, such as individual retirement accounts and 529 college savings plan accounts (generally, a $10 fee is charged to set up the account and an additional $10 fee is charged to the account annually), that would increase the amount of expenses paid on your account. In addition, retirement plan participants may be subject to certain fees charged by the plan sponsor, and Class F-1, F-2 and 529-F-1 shareholders may be subject to fees charged by financial intermediaries, typically ranging from 0.75% to 1.50% of assets annually depending on services offered. You can estimate the impact of these fees by adding the amount of the fees to the total estimated expenses you paid on your account during the period as calculated above. In addition, your ending account value would be lower by the amount of these fees.
Note that the expenses shown in the table are meant to highlight your ongoing costs only and do not reflect any transactional costs, such as sales charges (loads). Therefore, the second line of each share class in the table is useful in comparing ongoing costs only and will not help you determine the relative total costs of owning different funds. In addition, if these transactional costs were included, your costs would have been higher.
| 26 | American Funds Mortgage Fund |
| | | Beginning
account value
9/1/2012 | | Ending
account value
2/28/2013 | | Expenses
paid during
period* | | Annualized
expense
ratio | |
| Class A — actual return | | $ | 1,000.00 | | $ | 999.50 | | $ | 3.27 | | | .66 | % |
| Class A — assumed 5% return | | | 1,000.00 | | | 1,021.52 | | | 3.31 | | | .66 | |
| Class B — actual return | | | 1,000.00 | | | 996.39 | | | 7.13 | | | 1.44 | |
| Class B — assumed 5% return | | | 1,000.00 | | | 1,017.65 | | | 7.20 | | | 1.44 | |
| Class C — actual return | | | 1,000.00 | | | 996.30 | | | 7.33 | | | 1.48 | |
| Class C — assumed 5% return | | | 1,000.00 | | | 1,017.46 | | | 7.40 | | | 1.48 | |
| Class F-1 — actual return | | | 1,000.00 | | | 999.29 | | | 3.42 | | | .69 | |
| Class F-1 — assumed 5% return | | | 1,000.00 | | | 1,021.37 | | | 3.46 | | | .69 | |
| Class F-2 — actual return | | | 1,000.00 | | | 1,000.52 | | | 2.23 | | | .45 | |
| Class F-2 — assumed 5% return | | | 1,000.00 | | | 1,022.56 | | | 2.26 | | | .45 | |
| Class 529-A — actual return | | | 1,000.00 | | | 999.18 | | | 3.82 | | | .77 | |
| Class 529-A — assumed 5% return | | | 1,000.00 | | | 1,020.98 | | | 3.86 | | | .77 | |
| Class 529-B — actual return | | | 1,000.00 | | | 996.19 | | | 7.72 | | | 1.56 | |
| Class 529-B — assumed 5% return | | | 1,000.00 | | | 1,017.06 | | | 7.80 | | | 1.56 | |
| Class 529-C — actual return | | | 1,000.00 | | | 996.16 | | | 7.77 | | | 1.57 | |
| Class 529-C — assumed 5% return | | | 1,000.00 | | | 1,017.01 | | | 7.85 | | | 1.57 | |
| Class 529-E — actual return | | | 1,000.00 | | | 997.71 | | | 5.10 | | | 1.03 | |
| Class 529-E — assumed 5% return | | | 1,000.00 | | | 1,019.69 | | | 5.16 | | | 1.03 | |
| Class 529-F-1 — actual return | | | 1,000.00 | | | 1,000.00 | | | 2.73 | | | .55 | |
| Class 529-F-1 — assumed 5% return | | | 1,000.00 | | | 1,022.07 | | | 2.76 | | | .55 | |
| Class R-1 — actual return | | | 1,000.00 | | | 997.07 | | | 5.89 | | | 1.19 | |
| Class R-1 — assumed 5% return | | | 1,000.00 | | | 1,018.89 | | | 5.96 | | | 1.19 | |
| Class R-2 — actual return | | | 1,000.00 | | | 996.99 | | | 6.29 | | | 1.27 | |
| Class R-2 — assumed 5% return | | | 1,000.00 | | | 1,018.50 | | | 6.36 | | | 1.27 | |
| Class R-3 — actual return | | | 1,000.00 | | | 998.73 | | | 4.16 | | | .84 | |
| Class R-3 — assumed 5% return | | | 1,000.00 | | | 1,020.63 | | | 4.21 | | | .84 | |
| Class R-4 — actual return | | | 1,000.00 | | | 999.65 | | | 3.12 | | | .63 | |
| Class R-4 — assumed 5% return | | | 1,000.00 | | | 1,021.67 | | | 3.16 | | | .63 | |
| Class R-5 — actual return | | | 1,000.00 | | | 1,000.79 | | | 1.93 | | | .39 | |
| Class R-5 — assumed 5% return | | | 1,000.00 | | | 1,022.86 | | | 1.96 | | | .39 | |
| Class R-6 — actual return | | | 1,000.00 | | | 1,001.03 | | | 1.69 | | | .34 | |
| Class R-6 — assumed 5% return | | | 1,000.00 | | | 1,023.11 | | | 1.71 | | | .34 | |
| * | The “expenses paid during period” are equal to the “annualized expense ratio,” multiplied by the average account value over the period, multiplied by the number of days in the period, and divided by 365 (to reflect the one-half year period). |
| American Funds Mortgage Fund | 27 |
| Other share class results | unaudited |
Classes B, C, F and 529
Fund results shown are for past periods and are not predictive of results for future periods. Current and future results may be lower or higher than those shown. Share prices and returns will vary, so investors may lose money. For current information and month-end results, visit americanfunds.com.
Average annual total returns for periods ended March 31, 2013 (the most recent calendar quarter-end):
| | | 1 year | | | Life
of class | |
| Class B shares1 — first sold 11/1/10 | | | | | | | | |
| Reflecting applicable contingent deferred sales charge (CDSC), maximum of 5%, payable only if shares are sold within six years of purchase | | | –3.93 | % | | | 0.64 | % |
| Not reflecting CDSC | | | 1.05 | | | | 2.27 | |
| Class C shares — first sold 11/1/10 | | | | | | | | |
| Reflecting CDSC, maximum of 1%, payable only if shares are sold within one year of purchase | | | 0.02 | | | | 2.23 | |
| Not reflecting CDSC | | | 1.01 | | | | 2.23 | |
| Class F-1 shares2 — first sold 11/1/10 | | | | | | | | |
| Not reflecting annual asset-based fee charged by sponsoring firm | | | 1.83 | | | | 2.98 | |
| Class F-2 shares2 — first sold 11/1/10 | | | | | | | | |
| Not reflecting annual asset-based fee charged by sponsoring firm | | | 2.06 | | | | 3.22 | |
| Class 529-A shares3 — first sold 11/1/10 | | | | | | | | |
| Reflecting 3.75% maximum sales charge | | | –2.08 | | | | 1.32 | |
| Not reflecting maximum sales charge | | | 1.77 | | | | 2.94 | |
| Class 529-B shares1,3 — first sold 11/1/10 | | | | | | | | |
| Reflecting applicable CDSC, maximum of 5%, payable only if shares are sold within six years of purchase | | | –4.00 | | | | 0.55 | |
| Not reflecting CDSC | | | 0.98 | | | | 2.17 | |
| Class 529-C shares3 — first sold 11/1/10 | | | | | | | | |
| Reflecting CDSC, maximum of 1%, payable only if shares are sold within one year of purchase | | | –0.02 | | | | 2.17 | |
| Not reflecting CDSC | | | 0.98 | | | | 2.17 | |
| Class 529-E shares2,3 — first sold 11/1/10 | | | 1.48 | | | | 2.65 | |
| Class 529-F-1 shares2,3 — first sold 11/1/10 | | | | | | | | |
| Not reflecting annual asset-based fee charged by sponsoring firm | | | 1.95 | | | | 3.12 | |
| 1 | These shares are not available for purchase. |
| 2 | These shares are sold without any initial or contingent deferred sales charge. |
| 3 | Results shown do not reflect the $10 account setup fee and an annual $10 account maintenance fee. |
Investment results assume all distributions are reinvested and reflect applicable fees and expenses. When applicable, investment results reflect expense reimbursements, without which results would have been lower. Visit americanfunds.com for more information.
For information regarding the differences among the various share classes, refer to the fund prospectus.
| 28 | American Funds Mortgage Fund |
Office of the fund
One Market
Steuart Tower, Suite 2000
Mailing address: P.O. Box 7650
San Francisco, CA 94120-7650
Investment adviser
Capital Research and Management Company
333 South Hope Street
Los Angeles, CA 90071-1406
6455 Irvine Center Drive
Irvine, CA 92618
Transfer agent for shareholder accounts
American Funds Service Company
(Write to the address near you.)
P.O. Box 6007
Indianapolis, IN 46206-6007
P.O. Box 2280
Norfolk, VA 23501-2280
Custodian of assets
Bank of New York Mellon
One Wall Street
New York, NY 10286
Counsel
Bingham McCutchen LLP
355 South Grand Avenue, Suite 4400
Los Angeles, CA 90071-3106
Independent registered public accounting firm
PricewaterhouseCoopers LLP
350 South Grand Avenue
Los Angeles, CA 90071-2889
Principal underwriter
American Funds Distributors, Inc.
333 South Hope Street
Los Angeles, CA 90071-1406
Investors should carefully consider investment objectives, risks, charges and expenses. This and other important information is contained in the fund prospectus and summary prospectus, which can be obtained from your financial professional and should be read carefully before investing. You may also call American Funds Service Company (AFS) at 800/421-4225 or visit the American Funds website at americanfunds.com.
“American Funds Proxy Voting Procedures and Principles” — which describes how we vote proxies relating to portfolio securities — is available on the American Funds website or upon request by calling AFS. The fund files its proxy voting record with the U.S. Securities and Exchange Commission (SEC) for the 12 months ended June 30 by August 31. The proxy voting record is available free of charge on the SEC website at sec.gov and on the American Funds website.
A complete February 28, 2013, portfolio of American Funds Mortgage Fund’s investments is available free of charge by calling AFS or visiting the SEC website (where it is part of Form N-CSR).
American Funds Mortgage Fund files a complete list of its portfolio holdings with the SEC for the first and third quarters of each fiscal year on Form N-Q. This filing is available free of charge on the SEC website. You may also review or, for a fee, copy this filing at the SEC’s Public Reference Room in Washington, D.C. Additional information regarding the operation of the Public Reference Room may be obtained by calling the SEC’s Office of Investor Education and Advocacy at 800/SEC-0330. Additionally, the list of portfolio holdings is available by calling AFS.
This report is for the information of shareholders of American Funds Mortgage Fund, but it also may be used as sales literature when preceded or accompanied by the current prospectus or summary prospectus, which gives details about charges, expenses, investment objectives and operating policies of the fund. If used as sales material after June 30, 2013, this report must be accompanied by an American Funds statistical update for the most recently completed calendar quarter.
 | The right choice for the long term® |
The American Funds difference
Since 1931, American Funds has helped investors pursue long-term investment success. Our consistent approach — in combination with a proven system — has resulted in a superior long-term track record.
 | Consistent approach |
| We base our decisions on a long-term perspective because we believe it is the best way to achieve superior long-term investment results. Our portfolio counselors average 25 years of investment experience, including 20 years at our company, reflecting a career commitment to our long-term approach.1 |
| | |
 | Proven system |
| Our system combines individual accountability with teamwork. Each fund is divided into portions that are managed by investment professionals with varied backgrounds, ages and investment styles. An extensive global research effort is the backbone of our system. |
| | |
 | Superior long-term track record |
| Our equity funds have beaten their Lipper peer indexes in 90% of 10-year periods and 96% of 20-year periods. Our fixed-income funds have beaten their Lipper indexes in 58% of 10-year periods and 63% of 20-year periods.2 Our fund management fees have been among the lowest in the industry.3 |
| | 1 | As of 12/31/12. |
| | 2 | Based on Class A share results for rolling periods through 12/31/12. Periods covered are the shorter of the fund’s lifetime or since the comparable Lipper index inception date. |
| | 3 | Based on management fees for the 20-year period ended 12/31/12 versus comparable Lipper categories, excluding funds of funds. |
| | American Funds span a range of investment objectives |
| ¢ | Growth funds |
| | AMCAP Fund® |
| | EuroPacific Growth Fund® |
| | The Growth Fund of America® |
| | The New Economy Fund® |
| | New Perspective Fund® |
| | New World Fund® |
| | SMALLCAP World Fund® |
| ¢ | Growth-and-income funds |
| | American Mutual Fund® |
| | Capital World Growth and Income Fund® |
| | Fundamental InvestorsSM |
| | International Growth and Income FundSM |
| | The Investment Company of America® |
| | Washington Mutual Investors FundSM |
| ¢ | Equity-income funds |
| | Capital Income Builder® |
| | The Income Fund of America® |
| ¢ | Balanced funds |
| | American Balanced Fund® |
| | American Funds Global Balanced FundSM |
| ¢ | Bond funds |
| | American Funds Mortgage Fund® |
| | American High-Income Trust® |
| | The Bond Fund of America® |
| | Capital World Bond Fund® |
| | Intermediate Bond Fund of America® |
| | Short-Term Bond Fund of America® |
| | U.S. Government Securities Fund® |
| ¢ | Tax-exempt bond funds |
| | American Funds Short-Term Tax-Exempt Bond Fund® |
| | American High-Income Municipal Bond Fund® |
| | Limited Term Tax-Exempt Bond Fund of America® |
| | The Tax-Exempt Bond Fund of America® |
| | State-specific tax-exempt funds |
| | American Funds Tax-Exempt Fund of New York® |
| | The Tax-Exempt Fund of California® |
| | The Tax-Exempt Fund of Maryland® |
| | The Tax-Exempt Fund of Virginia® |
| ¢ | Money market fund |
| | American Funds Money Market Fund® |
| ¢ | American Funds Portfolio SeriesSM |
| | American Funds Global Growth PortfolioSM |
| | American Funds Growth PortfolioSM |
| | American Funds Growth and Income PortfolioSM |
| | American Funds Balanced PortfolioSM |
| | American Funds Income PortfolioSM |
| | American Funds Tax-Advantaged Income PortfolioSM |
| | American Funds Preservation PortfolioSM |
| | American Funds Tax-Exempt Preservation PortfolioSM |
| ¢ | American Funds Target Date Retirement Series® |
| ¢ | American Funds College Target Date SeriesSM |

| The Capital Group Companies | | | |
| American Funds | Capital Research and Management | Capital International | Capital Guardian | Capital Bank and Trust |
ITEM 2 – Code of Ethics
Not applicable for filing of semi-annual reports to shareholders.
ITEM 3 – Audit Committee Financial Expert
Not applicable for filing of semi-annual reports to shareholders.
ITEM 4 – Principal Accountant Fees and Services
Not applicable for filing of semi-annual reports to shareholders.
ITEM 5 – Audit Committee of Listed Registrants
Not applicable to this Registrant, insofar as the Registrant is not a listed issuer as defined in Rule 10A-3 under the Securities Exchange Act of 1934.
ITEM 6 – Schedule of Investments

American Funds Mortgage Fund®
Investment portfolio
February 28, 2013
unaudited
| Bonds & notes — 87.39% | Principal amount (000) | Value (000) |
| | | |
| MORTGAGE-BACKED OBLIGATIONS — 78.12% | | |
| FEDERAL AGENCY MORTGAGE-BACKED OBLIGATIONS1 — 75.93% | | |
| Fannie Mae 3.418% 20172 | $ 338 | $ 370 |
| Fannie Mae 2.50% 2022 | 9,815 | 10,245 |
| Fannie Mae 2.50% 2022 | 6,610 | 6,899 |
| Fannie Mae 3.50% 2025 | 975 | 1,055 |
| Fannie Mae 3.50% 2025 | 691 | 733 |
| Fannie Mae 3.00% 2026 | 1,521 | 1,602 |
| Fannie Mae 3.00% 2026 | 1,373 | 1,447 |
| Fannie Mae 3.50% 2026 | 2,387 | 2,532 |
| Fannie Mae 3.50% 2026 | 1,260 | 1,337 |
| Fannie Mae 4.50% 2026 | 5,483 | 5,924 |
| Fannie Mae 2.50% 2027 | 9,014 | 9,373 |
| Fannie Mae 2.50% 2027 | 1,996 | 2,078 |
| Fannie Mae 2.50% 2027 | 665 | 693 |
| Fannie Mae 2.50% 2027 | 319 | 333 |
| Fannie Mae 3.00% 2027 | 1,673 | 1,776 |
| Fannie Mae 3.00% 2027 | 1,187 | 1,261 |
| Fannie Mae 3.00% 2027 | 1,066 | 1,133 |
| Fannie Mae 2.00% 20283 | 28,360 | 28,660 |
| Fannie Mae 2.50% 20283 | 24,550 | 25,497 |
| Fannie Mae 2.50% 20283 | 10,230 | 10,583 |
| Fannie Mae 2.50% 2028 | 5,483 | 5,714 |
| Fannie Mae 3.00% 20283 | 10,852 | 11,390 |
| Fannie Mae 3.00% 20283 | 6,500 | 6,831 |
| Fannie Mae 3.00% 20283 | 3,010 | 3,169 |
| Fannie Mae 5.50% 2039 | 344 | 375 |
| Fannie Mae 6.00% 2039 | 756 | 831 |
| Fannie Mae 3.241% 20402 | 2,600 | 2,750 |
| Fannie Mae 3.524% 20402 | 1,197 | 1,275 |
| Fannie Mae 4.00% 2040 | 1,284 | 1,401 |
| Fannie Mae 4.188% 20402 | 1,149 | 1,226 |
| Fannie Mae 4.50% 2040 | 9,399 | 10,152 |
| Fannie Mae 4.50% 2040 | 1,508 | 1,628 |
| Fannie Mae 4.50% 2040 | 318 | 350 |
| Fannie Mae 5.00% 2040 | 6,281 | 6,864 |
| Fannie Mae 3.468% 20412 | 1,462 | 1,545 |
| Fannie Mae 3.558% 20412 | 451 | 477 |
| Fannie Mae 3.767% 20412 | 3,299 | 3,503 |
| Fannie Mae 4.00% 2041 | 7,053 | 7,532 |
| Fannie Mae 4.00% 2041 | 2,831 | 3,022 |
| Fannie Mae 4.00% 2041 | 2,231 | 2,434 |
| Fannie Mae 4.50% 2041 | 10,259 | 11,081 |
| Fannie Mae 4.50% 2041 | 5,513 | 5,962 |
| Fannie Mae 4.50% 2041 | 2,041 | 2,207 |
| Fannie Mae 4.50% 2041 | 1,961 | 2,121 |
| Fannie Mae 4.50% 2041 | 1,738 | 1,879 |
| Fannie Mae 4.50% 2041 | 945 | 1,038 |
| Fannie Mae 2.496% 20422 | 1,972 | 2,062 |
| Fannie Mae 3.50% 2042 | 6,213 | 6,585 |
| Fannie Mae 3.50% 2042 | 5,314 | 5,661 |
| Fannie Mae 3.50% 2042 | 4,837 | 5,137 |
| Fannie Mae 3.50% 2042 | 2,285 | 2,434 |
| Fannie Mae 4.00% 2042 | 22,478 | 24,075 |
| Fannie Mae 4.00% 2042 | 5,474 | 5,863 |
| Fannie Mae 2.514% 20432 | 1,089 | 1,127 |
| Fannie Mae 3.00% 20433 | 7,000 | 7,249 |
| Fannie Mae 3.50% 20433 | 18,040 | 18,987 |
| Fannie Mae 3.50% 20433 | 8,700 | 9,183 |
| Fannie Mae 4.00% 20433 | 25,410 | 27,093 |
| Fannie Mae 4.50% 20433 | 1,110 | 1,195 |
| Fannie Mae 5.00% 20433 | 14,980 | 16,221 |
| Fannie Mae 5.50% 20433 | 6,190 | 6,745 |
| Fannie Mae 6.00% 20433 | 2,760 | 3,025 |
| Fannie Mae, Series 2012-M14, multifamily 1.114% 2017 | 550 | 557 |
| Fannie Mae, Series 2012-M9, multifamily 1.513% 2017 | 525 | 535 |
| Fannie Mae, Series 2012-M5, Class A1, multifamily 1.787% 2022 | 455 | 466 |
| Fannie Mae, Series 2012-M2, Class A2, multifamily 2.717% 2022 | 425 | 442 |
| Fannie Mae, Series 2012-M3, Class 1-A2, multifamily 3.044% 2022 | 425 | 453 |
| Government National Mortgage Assn. 2.50% 2027 | 2,266 | 2,371 |
| Government National Mortgage Assn. 2.50% 2027 | 2,261 | 2,363 |
| Government National Mortgage Assn. 4.00% 2032 | 1,417 | 1,496 |
| Government National Mortgage Assn. 4.00% 2032 | 1,144 | 1,227 |
| Government National Mortgage Assn. 6.50% 2032 | 2,837 | 3,248 |
| Government National Mortgage Assn. 5.00% 2035 | 2,533 | 2,796 |
| Government National Mortgage Assn. 3.75% 2037 | 1,062 | 1,110 |
| Government National Mortgage Assn. 6.50% 2037 | 459 | 529 |
| Government National Mortgage Assn. 5.00% 2038 | 1,545 | 1,694 |
| Government National Mortgage Assn. 6.50% 2038 | 1,328 | 1,534 |
| Government National Mortgage Assn. 6.50% 2038 | 1,151 | 1,324 |
| Government National Mortgage Assn. 6.50% 2038 | 727 | 840 |
| Government National Mortgage Assn. 4.50% 2039 | 1,495 | 1,641 |
| Government National Mortgage Assn. 6.00% 2039 | 18,635 | 21,184 |
| Government National Mortgage Assn. 3.50% 2040 | 3,010 | 3,251 |
| Government National Mortgage Assn. 4.50% 2040 | 395 | 420 |
| Government National Mortgage Assn. 5.50% 2040 | 16,634 | 18,624 |
| Government National Mortgage Assn. 3.50% 2041 | 12,541 | 13,455 |
| Government National Mortgage Assn. 3.50% 2041 | 1,341 | 1,447 |
| Government National Mortgage Assn. 4.00% 2041 | 1,566 | 1,657 |
| Government National Mortgage Assn. 4.50% 2041 | 6,248 | 6,806 |
| Government National Mortgage Assn. 4.50% 2041 | 3,066 | 3,355 |
| Government National Mortgage Assn. 4.50% 2041 | 2,509 | 2,746 |
| Government National Mortgage Assn. 4.50% 2041 | 2,324 | 2,473 |
| Government National Mortgage Assn. 4.50% 2041 | 2,158 | 2,296 |
| Government National Mortgage Assn. 5.00% 2041 | 11,325 | 12,413 |
| Government National Mortgage Assn. 5.00% 2041 | 3,957 | 4,204 |
| Government National Mortgage Assn. 6.50% 2041 | 1,573 | 1,783 |
| Government National Mortgage Assn. 3.00% 2042 | 2,159 | 2,265 |
| Government National Mortgage Assn. 3.50% 2042 | 1,098 | 1,201 |
| Government National Mortgage Assn. 3.50% 2042 | 988 | 1,081 |
| Government National Mortgage Assn. 4.00% 2042 | 4,803 | 5,186 |
| Government National Mortgage Assn. 4.00% 2042 | 2,537 | 2,759 |
| Government National Mortgage Assn. 4.00% 2042 | 1,575 | 1,701 |
| Government National Mortgage Assn. 4.00% 2042 | 1,234 | 1,332 |
| Government National Mortgage Assn. 4.50% 2042 | 3,546 | 3,900 |
| Government National Mortgage Assn. 3.50% 20433 | 6,600 | 7,115 |
| Freddie Mac 3.00% 2026 | 1,326 | 1,393 |
| Freddie Mac 4.50% 2035 | 319 | 341 |
| Freddie Mac 4.50% 2035 | 64 | 69 |
| Freddie Mac 5.50% 2037 | 796 | 866 |
| Freddie Mac 5.50% 2037 | 243 | 264 |
| Freddie Mac 5.00% 2038 | 2,803 | 3,020 |
| Freddie Mac 5.50% 2038 | 5,073 | 5,506 |
| Freddie Mac 5.50% 2038 | 3,662 | 3,975 |
| Freddie Mac 5.50% 2038 | 2,147 | 2,330 |
| Freddie Mac 5.50% 2038 | 730 | 792 |
| Freddie Mac 5.50% 2038 | 644 | 699 |
| Freddie Mac 5.50% 2038 | 605 | 657 |
| Freddie Mac 6.00% 2038 | 3,760 | 4,114 |
| Freddie Mac 6.00% 2038 | 1,321 | 1,446 |
| Freddie Mac 3.808% 20392 | 1,749 | 1,860 |
| Freddie Mac 5.50% 2039 | 1,941 | 2,108 |
| Freddie Mac 5.50% 2039 | 1,173 | 1,274 |
| Freddie Mac 6.00% 2039 | 881 | 963 |
| Freddie Mac 3.107% 20402 | 247 | 257 |
| Freddie Mac 4.50% 2040 | 982 | 1,053 |
| Freddie Mac 4.50% 2040 | 165 | 177 |
| Freddie Mac 2.832% 20412 | 425 | 446 |
| Freddie Mac 3.269% 20412 | 3,172 | 3,341 |
| Freddie Mac 3.412% 20412 | 305 | 323 |
| Freddie Mac 4.00% 2041 | 1,496 | 1,591 |
| Freddie Mac 4.50% 2041 | 7,902 | 8,451 |
| Freddie Mac 4.50% 2041 | 2,632 | 2,830 |
| Freddie Mac 4.50% 2041 | 2,616 | 2,814 |
| Freddie Mac 4.50% 2041 | 209 | 225 |
| Freddie Mac 5.00% 2041 | 1,331 | 1,483 |
| Freddie Mac 2.563% 20422 | 1,005 | 1,044 |
| Freddie Mac 4.50% 2042 | 3,655 | 3,910 |
| Freddie Mac 4.50% 2042 | 773 | 827 |
| Freddie Mac, Series K501, Class A1, multifamily 1.337% 2016 | 430 | 437 |
| Freddie Mac, Series K702, Class A1, multifamily 2.084% 2017 | 205 | 212 |
| Freddie Mac, Series K711, Class A1, multifamily 1.321% 2018 | 570 | 581 |
| Freddie Mac, Series K705, Class A2, multifamily 2.303% 2018 | 199 | 209 |
| Freddie Mac, Series K706, Class A2, multifamily 2.323% 2018 | 850 | 892 |
| Freddie Mac, Series K704, Class A2, multifamily 2.412% 2018 | 350 | 369 |
| Freddie Mac, Series K702, Class A2, multifamily 3.154% 2018 | 236 | 257 |
| Freddie Mac, Series K711, Class A2, multifamily 1.73% 2019 | 575 | 585 |
| Freddie Mac, Series K709, Class A2, multifamily 2.086% 2019 | 475 | 494 |
| Freddie Mac, Series K015, Class A1, multifamily 2.257% 2020 | 304 | 319 |
| Freddie Mac, Series K014, Class A1, multifamily 2.788% 2020 | 402 | 430 |
| Freddie Mac, Series K013, Class A1, multifamily 2.902% 2020 | 2,641 | 2,817 |
| Freddie Mac, Series K010, Class A1, multifamily 3.32% 20202 | 290 | 314 |
| Freddie Mac, Series K019, Class A1, multifamily 1.459% 2021 | 488 | 495 |
| Freddie Mac, Series K017, Class A2, multifamily 2.873% 2021 | 425 | 448 |
| Freddie Mac, Series K022, Class A1, multifamily 1.583% 2022 | 598 | 605 |
| Freddie Mac, Series K025, Class A1, multifamily 1.875% 2022 | 625 | 642 |
| Freddie Mac, Series K023, Class A2, multifamily 2.307% 2022 | 2,050 | 2,054 |
| Freddie Mac, Series K022, Class A2, multifamily 2.355% 2022 | 575 | 578 |
| Freddie Mac, Series K020, Class A2, multifamily 2.373% 2022 | 2,555 | 2,573 |
| Freddie Mac, Series K021, Class A2, multifamily 2.396% 2022 | 2,005 | 2,026 |
| Freddie Mac, Series K024, Class A2, multifamily 2.573% 2022 | 705 | 723 |
| National Credit Union Administration, Series 2010-R2, Class 1A, 0.568% 20172 | 80 | 80 |
| National Credit Union Administration, Series 2011-R2, Class 1A, 0.598% 20202 | 267 | 268 |
| National Credit Union Administration, Series 2011-R3, Class 1A, 0.599% 20202 | 211 | 212 |
| National Credit Union Administration, Series 2011-R1, Class 1A, 0.648% 20202 | 160 | 161 |
| | | 579,440 |
| | | |
| | | |
| OTHER MORTGAGE-BACKED OBLIGATIONS1 — 2.19% | | |
| Bank of Nova Scotia 1.45% 20134 | 500 | 502 |
| Bank of Nova Scotia 1.25% 20144 | 400 | 406 |
| Bank of Nova Scotia 2.15% 20164 | 350 | 367 |
| Bank of Nova Scotia 1.75% 20174 | 425 | 440 |
| Westpac Banking Corp. 1.375% 20154 | 500 | 509 |
| Westpac Banking Corp. 2.45% 20164 | 375 | 396 |
| Westpac Banking Corp. 1.25% 20174 | 600 | 599 |
| Bank of Montreal 1.30% 20144 | 550 | 558 |
| Bank of Montreal 2.625% 20164 | 650 | 687 |
| Australia & New Zealand Banking Group Ltd. 1.00% 20154 | 500 | 504 |
| Australia & New Zealand Banking Group Ltd. 2.40% 20164 | 500 | 526 |
| Sparebank 1 Boligkreditt AS 2.625% 20164 | 400 | 422 |
| Sparebank 1 Boligkreditt AS 2.30% 20174 | 550 | 576 |
| Barclays Bank PLC 2.50% 20154 | 550 | 572 |
| Barclays Bank PLC 2.25% 20174 | 375 | 389 |
| Commonwealth Bank of Australia 0.75% 20164 | 500 | 500 |
| Commonwealth Bank of Australia 2.25% 20174 | 425 | 443 |
| National Australia Bank 2.00% 20174 | 500 | 518 |
| National Australia Bank 1.25% 20184 | 420 | 418 |
| UBS AG 1.875% 20154 | 400 | 410 |
| UBS AG 2.25% 20174 | 450 | 470 |
| National Bank of Canada 1.65% 20144 | 500 | 506 |
| National Bank of Canada 2.20% 20164 | 350 | 368 |
| Northern Rock PLC 5.625% 20174 | 725 | 847 |
| HSBC Bank PLC 1.625% 20144 | 700 | 711 |
| Swedbank AB 2.125% 20164 | 325 | 339 |
| Swedbank AB 2.95% 20164 | 300 | 320 |
| Credit Mutuel-CIC Home Loan SFH 1.50% 20174 | 600 | 603 |
| Credit Suisse Group AG 2.60% 20164 | 500 | 528 |
| Stadshypotek AB 1.875% 20194 | 525 | 526 |
| Nordea Eiendomskreditt AS 2.125% 20174 | 500 | 521 |
| Canadian Imperial Bank of Commerce 2.75% 20164 | 400 | 424 |
| Toronto-Dominion Bank 1.625% 20164 | 400 | 412 |
| Caisse Centrale Desjardins 1.60% 20174 | 350 | 360 |
| | | 16,677 |
| | | |
| | | |
| | | |
| Total mortgage-backed obligations | | 596,117 |
| | | |
| | | |
| U.S. TREASURY BONDS & NOTES — 5.41% | | |
| U.S. TREASURY — 2.90% | | |
| U.S. Treasury 3.125% 2013 | 6,510 | 6,607 |
| U.S. Treasury 1.875% 2014 | 15,230 | 15,487 |
| | | 22,094 |
| | | |
| | | |
| U.S. TREASURY INFLATION-PROTECTED SECURITIES5 — 2.51% | | |
| U.S. Treasury Inflation-Protected Security 0.625% 2013 | 5,513 | 5,553 |
| U.S. Treasury Inflation-Protected Security 1.875% 2013 | 364 | 373 |
| U.S. Treasury Inflation-Protected Security 0.125% 2016 | 1,534 | 1,631 |
| U.S. Treasury Inflation-Protected Security 0.125% 2017 | 4,297 | 4,636 |
| U.S. Treasury Inflation-Protected Security 0.125% 2022 | 2,267 | 2,472 |
| U.S. Treasury Inflation-Protected Security 0.125% 2023 | 3,601 | 3,892 |
| U.S. Treasury Inflation-Protected Security 0.75% 2042 | 579 | 618 |
| | | 19,175 |
| | | |
| | | |
| | | |
| Total U.S. Treasury bonds & notes | | 41,269 |
| | | |
| | | |
| FEDERAL AGENCY BONDS & NOTES — 3.03% | | |
| Freddie Mac 0.375% 2014 | 10,850 | 10,866 |
| Freddie Mac 1.75% 2015 | 2,575 | 2,664 |
| Freddie Mac 1.25% 2019 | 2,330 | 2,318 |
| Federal Home Loan Bank, Series 2816, 1.00% 2017 | 4,000 | 4,044 |
| Federal Home Loan Bank 4.125% 2020 | 1,350 | 1,594 |
| Tennessee Valley Authority 1.875% 2022 | 1,650 | 1,638 |
| | | 23,124 |
| | | |
| | | |
| MUNICIPALS — 0.83% | | |
| State of Minnesota, Housing Finance Agency, Homeownership Finance Bonds (GNMA and FNMA Pass-Through Program), | | |
| Series 2012-B, 2.25% 2042 | 1,272 | 1,269 |
| State of Minnesota, Housing Finance Agency, Homeownership Finance Bonds (GNMA and FNMA Pass-Through Program), | | |
| Series 2013-A, 2.35% 2043 | 1,300 | 1,298 |
| State of Oklahoma, Housing Finance Agency, Single-family Mortgage Revenue Bonds (Homeownership Loan Program), | | |
| Series 2012-A, 5.00% 2043 | 1,000 | 1,145 |
| State of New Mexico, Mortgage Finance Authority, Single-family Mortgage Program Revenue Refunding Bonds, | | |
| Series 2012-B-1, Class I, Alternative Minimum Tax, 3.75% 2043 | 750 | 795 |
| State of Iowa, Finance Authority, Single-family Mortgage Bonds (Mortgage-backed Securities Program), | | |
| Series 2013-1, 2.15% 2043 | 750 | 748 |
| State of Florida, Housing Finance Corp., Homeowner Mortgage Revenue Bonds, Series 2011-C, 4.50% 2030 | 345 | 375 |
| State of Georgia, Housing and Finance Authority, Single-family Mortgage Revenue Bonds, Series 2013-A, 3.00% 2043 | 290 | 306 |
| State of Missouri, Housing Development Commission, Single-family Mortgage Revenue Bonds | | |
| (Homeownership Loan Program), Series 2004-A-1, Alternative Minimum Tax, 5.15% 2034 | 220 | 228 |
| State of Washington, Housing Finance Commission, Single-family Program Bonds, Series 2013-1N, 3.00% 2043 | 160 | 170 |
| | | 6,334 |
| | | |
| | | |
| | | |
| Total bonds & notes (cost: $656,988,000) | | 666,844 |
| | | |
| | | |
| | | |
| Short-term securities — 41.40% | | |
| | | |
| U.S. Treasury Bills 0.08%–0.158% due 4/11–5/2/2013 | 55,100 | 55,093 |
| Fannie Mae 0.11%–0.16% due 3/13–10/25/2013 | 55,100 | 55,079 |
| Freddie Mac 0.07%–0.115% due 4/4–6/17/2013 | 26,300 | 26,294 |
| Medtronic Inc. 0.11%–0.17% due 3/20–5/9/20134 | 21,300 | 21,295 |
| NetJets Inc. 0.08% due 3/12/20134 | 17,000 | 17,000 |
| Procter & Gamble Co. 0.10% due 5/7/20134 | 15,900 | 15,897 |
| John Deere Credit Ltd. 0.11%–0.12% due 3/27–4/3/20134 | 15,700 | 15,699 |
| Paccar Financial Corp. 0.12%–0.14% due 3/25–5/8/2013 | 15,000 | 14,996 |
| General Electric Co. 0.12% due 3/1/2013 | 14,400 | 14,400 |
| Tennessee Valley Authority 0.07% due 3/14/2013 | 13,000 | 13,000 |
| Abbott Laboratories 0.11%–0.12% due 4/16–5/7/20134 | 12,100 | 12,098 |
| Federal Home Loan Bank 0.085% due 3/20/2013 | 10,800 | 10,800 |
| Walt Disney Co. 0.13% due 5/10/20134 | 10,700 | 10,696 |
| Google Inc. 0.15% due 3/6/20134 | 10,200 | 10,200 |
| Emerson Electric Co. 0.12% due 4/22/20134 | 9,600 | 9,598 |
| Jupiter Securitization Co., LLC 0.13%–0.21% due 3/12–3/13/20134 | 8,200 | 8,200 |
| Coca-Cola Co. 0.10% due 4/18/20134 | 3,900 | 3,899 |
| PepsiCo Inc. 0.06% due 3/18/20134 | 1,700 | 1,700 |
| | | |
| Total short-term securities (cost: $315,943,000) | | 315,944 |
| | | |
| | | |
| Total investment securities (cost: $972,931,000) | | 982,788 |
| Other assets less liabilities | | (219,692) |
| | | |
| Net assets | | $ 763,096 |
| 1 | Principal payments may be made periodically. Therefore, the effective maturity date may be earlier than the stated maturity date. |
| 2 | Coupon rate may change periodically. |
| 3 | A portion or all of the security purchased on a TBA basis. |
| 4 | Acquired in a transaction exempt from registration under Rule 144A or section 4(2) of the Securities Act of 1933. May be resold in the U.S. in transactions exempt from registration, normally to qualified institutional buyers. The total value of all such securities was $142,959,000, which represented 18.73% of the net assets of the fund. |
| 5 | Index-linked bond whose principal amount moves with a government price index. |
Key to abbreviation
TBA = To be announced
Investments are not FDIC-insured, nor are they deposits of or guaranteed by a bank or any other entity, so they may lose value.
Investors should carefully consider investment objectives, risks, charges and expenses. This and other important information is contained in the fund prospectus and summary prospectus, which can be obtained from your financial professional and should be read carefully before investing. You may also call American Funds Service Company (AFS) at 800/421-4225 or visit the American Funds website at americanfunds.com.
MFGEFPX-042-0413O-S32786
ITEM 7 – Disclosure of Proxy Voting Policies and Procedures for Closed-End Management Investment Companies
Not applicable to this Registrant, insofar as the Registrant is not a closed-end management investment company.
ITEM 8 – Portfolio Managers of Closed-End Management Investment Companies
Not applicable to this Registrant, insofar as the Registrant is not a closed-end management investment company.
ITEM 9 – Purchases of Equity Securities by Closed-End Management Investment Company and Affiliated Purchasers
Not applicable to this Registrant, insofar as the Registrant is not a closed-end management investment company.
ITEM 10 – Submission of Matters to a Vote of Security Holders
There have been no material changes to the procedures by which shareholders may recommend nominees to the Registrant’s board of trustees since the Registrant last submitted a proxy statement to its shareholders. The procedures are as follows. The Registrant has a nominating and governance committee comprised solely of persons who are not considered ‘‘interested persons’’ of the Registrant within the meaning of the Investment Company Act of 1940, as amended. The committee periodically reviews such issues as the board’s composition, responsibilities, committees, compensation and other relevant issues, and recommends any appropriate changes to the full board of trustees. While the committee normally is able to identify from its own resources an ample number of qualified candidates, it will consider shareholder suggestions of persons to be considered as nominees to fill future vacancies on the board. Such suggestions must be sent in writing to the nominating and governance committee of the Registrant, c/o the Registrant’s Secretary, and must be accompanied by complete biographical and occupational data on the prospective nominee, along with a written consent of the prospective nominee for consideration of his or her name by the nominating and governance committee.
ITEM 11 – Controls and Procedures
| (a) | The Registrant’s Principal Executive Officer and Principal Financial Officer have concluded, based on their evaluation of the Registrant’s disclosure controls and procedures (as such term is defined in Rule 30a-3 under the Investment Company Act of 1940), that such controls and procedures are adequate and reasonably designed to achieve the purposes described in paragraph (c) of such rule. |
| | |
| (b) | There were no changes in the Registrant’s internal controls over financial reporting (as defined in Rule 30a-3(d) under the Investment Company Act of 1940) that occurred during the Registrant’s second fiscal quarter of the period covered by this report that has materially affected, or is reasonably likely to materially affect, the Registrant’s internal control over financial reporting. |
ITEM 12 – Exhibits
| (a)(1) | The Code of Ethics that is the subject of the disclosure required by Item 2 is attached as an exhibit hereto. |
| | |
| (a)(2) | The certifications required by Rule 30a-2 of the Investment Company Act of 1940 and Sections 302 and 906 of the Sarbanes-Oxley Act of 2002 are attached as exhibits hereto. |
SIGNATURES
Pursuant to the requirements of the Securities Exchange Act of 1934 and the Investment Company Act of 1940, the Registrant has duly caused this report to be signed on its behalf by the undersigned, thereunto duly authorized.
| | AMERICAN FUNDS MORTGAGE FUND |
| | |
| | By /s/ John H. Smet |
| | John H. Smet, President and Principal Executive Officer |
| | |
| | Date: April 30, 2013 |
Pursuant to the requirements of the Securities Exchange Act of 1934 and the Investment Company Act of 1940, this report has been signed below by the following persons on behalf of the Registrant and in the capacities and on the dates indicated.
| By /s/ John H. Smet |
John H. Smet, President and Principal Executive Officer |
| |
| Date: April 30, 2013 |
| By /s/ Brian C. Janssen |
Brian C. Janssen, Treasurer and Principal Financial Officer |
| |
| Date: April 30, 2013 |