UNITED STATES
SECURITIES AND EXCHANGE COMMISSION
Washington, D.C. 20549
FORM N-CSR
Certified Shareholder Report of
Registered Management Investment Companies
Investment Company Act File Number: 811-22449
American Funds Mortgage Fund
(Exact Name of Registrant as Specified in Charter)
One Market, Steuart Tower
Suite 2000
San Francisco, California 94105
(Address of Principal Executive Offices)
Registrant's telephone number, including area code: (415) 421-9360
Date of fiscal year end: August 31
Date of reporting period: August 31, 2013
Courtney R. Taylor
American Funds Mortgage Fund
One Market, Steuart Tower
Suite 2000
San Francisco, California 94105
(Name and Address of Agent for Service)
Copies to:
Michael Glazer
Bingham McCutchen LLP
355 South Grand Avenue, Suite 4400
Los Angeles, California 90071
(Counsel for the Registrant)
ITEM 1 – Reports to Stockholders

Investing in high-
quality mortgages
can pay dividends.
 | American Funds
Mortgage Fund® |
Annual report
for the year ended
August 31, 2013 |
American Funds Mortgage Fund seeks to provide current income and preserve capital.
This fund is one of more than 40 offered by one of the nation’s largest mutual fund families, American Funds, from Capital Group. For more than 80 years, Capital has invested with a long-term focus based on thorough research and attention to risk.
Fund results shown in this report, unless otherwise indicated, are for Class A shares at net asset value. If a sales charge (maximum 3.75%) had been deducted, the results would have been lower. Results are for past periods and are not predictive of results for future periods. Current and future results may be lower or higher than those shown. Share prices and returns will vary, so investors may lose money. Investing for short periods makes losses more likely. Investments are not FDIC-insured, nor are they deposits of or guaranteed by a bank or any other entity, so they may lose value. For current information and month-end results, visit americanfunds.com.
Here are the average annual total returns on a $1,000 investment with all distributions reinvested for the periods ended September 30, 2013 (the most recent calendar quarter-end):
| | | Since fund’s inception |
| Class A shares | 1 year | (11/1/10) |
| | | |
| Reflecting 3.75% maximum sales charge | –5.02% | 0.79% |
For other share class results, visit americanfunds.com and americanfundsretirement.com.
The total annual fund operating expense ratio is 0.64% for Class A shares as of the prospectus dated November 1, 2013 (unaudited).
Investment results assume all distributions are reinvested and reflect applicable fees and expenses. When applicable, investment results reflect expense reimbursements, without which results would have been lower. Visit americanfunds.com for more information.
The fund’s 30-day yield for Class A shares as of September 30, 2013, calculated in accordance with the U.S. Securities and Exchange Commission (SEC) formula, was 1.05%. The fund’s 12-month distribution rate for Class A shares as of that date was 0.70%. Both reflect the 3.75% maximum sales charge. The SEC yield reflects the rate at which the fund is earning income on its current portfolio of securities while the distribution rate reflects the fund’s past dividends paid to shareholders. Accordingly, the fund’s SEC yield and distribution rate may differ.
The return of principal for bond funds and for funds with significant underlying bond holdings is not guaranteed. Fund shares are subject to the same interest rate, inflation and credit risks associated with the underlying bond holdings. Investments in mortgage-related securities involve additional risks, such as prepayment risk, as more fully described in the prospectus. Bond ratings, which typically range from Aaa/AAA (highest) to D (lowest), are assigned by credit rating agencies such as Moody’s, Standard & Poor’s and/or Fitch as an indication of an issuer’s creditworthiness. Refer to the fund prospectus and the Risk Factors section of this report for more information on these and other risks associated with investing in the fund.

Contents
Fellow investors:
In the face of several challenges to the mortgage-backed securities market, American Funds Mortgage Fund posted a negative return for its fiscal year ended August 31, 2013.
For the 12-month period, American Funds Mortgage Fund declined 2.54%, with all distributions reinvested. By way of comparison, the unmanaged Barclays U.S. Mortgage Backed Securities Index fell 2.37%. The fund’s peer group, as measured by the Lipper U.S. Mortgage Funds Average, slipped 1.55%. Yet another peer measure, the Lipper GNMA Funds Average, lost 3.54%.
The fund generated dividends totaling more than 7 cents a share during the period, resulting in an income return of 0.72% for those reinvesting their income. Those taking income in cash saw a similar income return.
Market overview
Yields in the mortgage-backed securities market — as well as the bond market in general — remained historically low for the first half of the fund’s fiscal year. However, a number of factors came into play over the most recent six-month period, resulting in a decline in bond prices and a commensurate rise in yields.
In April, the Bank of Japan announced a massive $1.4 trillion domestic asset purchasing program to stimulate that country’s economy. In the U.S., this triggered considerable volatility in Ginnie Mae (GNMA) mortgage securities. As Japanese banks have been a frequent buyer of GNMAs, prices were initially bid higher in the expectation that the Bank of Japan’s actions would stimulate further demand; when this did not materialize, these gains were more than reversed.
That was followed by heightened instability in the overall mortgage market in May. This may have been due to selling on the part of real estate investment trusts (REITs), which had purchased mortgage-backed securities over the past several years using borrowed funds. Increased market uncertainty seems to have resulted in margin calls that triggered sales of liquid securities, driving down prices.
Results at a glance
For periods ended August 31, 2013, with all distributions reinvested
| | | Cumulative total
returns | | | Average annual
total returns |
| | | 6 months | | 1 year | | | Lifetime
(since 11/1/10) |
| | | | | | | | | | |
| American Funds Mortgage Fund (Class A shares) | | | -2.50 | % | | -2.54 | % | | | | 1.64 | % |
| Barclays U.S. Mortgage Backed Securities Index* | | | -2.22 | | | -2.37 | | | | | 1.94 | |
| Lipper U.S. Mortgage Funds Average | | | -2.39 | | | -1.55 | | | | | 2.33 | |
| Lipper GNMA Funds Average | | | -3.37 | | | -3.54 | | | | | 1.54 | |
| * | The index is unmanaged and, therefore, has no expenses. |
| American Funds Mortgage Fund | 1 |
Finally, the Federal Reserve signaled in June that it would begin tapering off its monthly mortgage-backed securities purchase program, known as quantitative easing. This naturally affected demand for mortgage-backed securities, but also took the overall bond market lower, thus raising yields.
Since June, the bond markets have stabilized to a degree, though some volatility has remained. Many mortgage investors have seen their appetite for risk wane, which expanded the pool of potential investment opportunities for the fund, albeit briefly.
Inside the portfolio
American Funds Mortgage Fund has always sought to invest in high-quality mortgage-backed securities. While not a GNMA-only fund, it shares some of the characteristics of those funds. Other funds within the overall Lipper U.S. Mortgage Funds Average, the fund’s primary peer group, may have considerably lower credit quality standards, which is worth noting in any comparison.
Overall, the fund continues to invest primarily in mortgage securities issued or guaranteed by one of the three government-sponsored enterprises: Ginnie Mae, Freddie Mac or Fannie Mae. The fund’s GNMA holdings decreased to 18.8% of the portfolio, compared to 20.1% a year ago. The portfolio held 13.1% in Freddie Mac and 49.8% in Fannie Mae securities, compared to 11.2% and 54.6%, respectively, a year ago.
The fund’s overall duration – the average amount of time before bonds held by the fund are due for redemption – was reduced somewhat during the period. This was in reaction to the rise in rates. By shortening the duration of the fund’s holdings, the portfolio managers may be able to reinvest the proceeds in securities with higher yields, potentially increasing income opportunities.
The fund continues to hold a limited number of high-quality, privately issued mortgage-backed securities, along with U.S. dollar-denominated “covered bonds,” which are mortgage-backed securities issued by other nations. The fund’s portfolio also includes a small percentage of multifamily mortgage-backed securities.
Looking ahead
American Funds Mortgage Fund seeks to provide current income and preserve capital, but in very specific ways. The fund’s holdings in government or AAA-rated bonds provide high credit quality, which can reduce volatility during difficult markets. While this may curtail potential income, the fund is designed to ideally generate more income than other conservative portfolios.
With this in mind, the short-term outlook for the mortgage market appears to be relatively positive. We believe that much of the selling expected in the bond market already occurred earlier this year. Bond yields will likely continue to rise, albeit modestly, over the next six to 12 months, though there are still short-term risks – European economic stability and government budget issues here in the U.S. – that could cause volatility.
We also expect that despite the Fed’s decision not to alter its policy in September, it will, over time, reduce its mortgage-backed securities purchases. The process of normalization for Fed policy is likely to take at least three years, possibly five, but should result in a less prominent role for the agency at some point during that period. The time frame depends largely on continued strength in the U.S. and overseas economies.
Over the long term, the mortgage market will continue to evolve. The three major government-sponsored enterprises recently celebrated the fifth anniversary of direct government conservatorship. There is some movement in Washington to determine the direction of the mortgage-backed securities market in the future, with or without these enterprises, while preserving the ideal of backing by the full faith and credit of the U.S. government. The inclusion of various stakeholders, including investors, is encouraging, though any solution will be several years in the making.
As always, we thank you for investing in the fund and look forward to reporting to you again in six months.
Cordially,

John H. Smet
President
October 15, 2013
For current information about the fund, visit americanfunds.com.
| 2 | American Funds Mortgage Fund |
The value of a $10,000 investment
How a $10,000 investment has fared (for the period November 1, 2010, to August 31, 2013, with all distributions reinvested)
Fund results shown, unless otherwise indicated, reflect deduction of the maximum sales charge of 3.75% on the $10,000 investment.1 Thus, the net amount invested was $9,625.
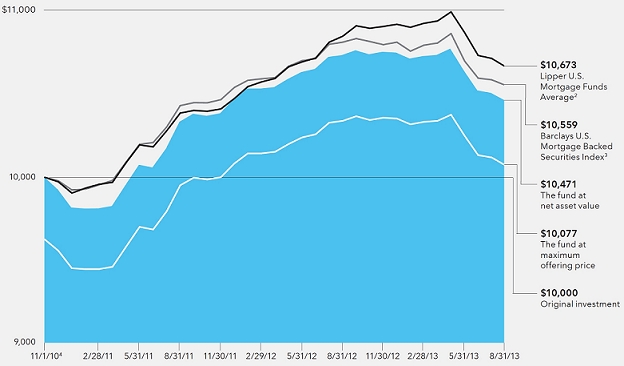
| 1 | As outlined in the prospectus, the sales charge is reduced for accounts (and aggregated investments) of $100,000 or more and is eliminated for purchases of $1 million or more. There is no sales charge on dividends or capital gain distributions that are reinvested in additional shares. |
| 2 | Results of the Lipper U.S. Mortgage Funds Average do not reflect any sales charges. |
| 3 | The index is unmanaged and, therefore, has no expenses. |
| 4 | Date the fund commenced operations. |
Past results are not predictive of results for future periods. The results shown are before taxes on fund distributions and sale of fund shares.
Average annual total returns based on a $1,000 investment (for periods ended August 31, 2013)*
| | | Lifetime |
| | 1 year | (since 11/1/10) |
| | | |
| Class A shares | –6.19% | 0.27% |
* Assumes reinvestment of all distributions and payment of the maximum 3.75% sales charge.
Investment results assume all distributions are reinvested and reflect applicable fees and expenses. When applicable, investment results reflect expense reimbursements, without which results would have been lower. Visit americanfunds.com for more information.
| American Funds Mortgage Fund | 3 |
Summary investment portfolio August 31, 2013
| Investment mix by security type | Percent of net assets |
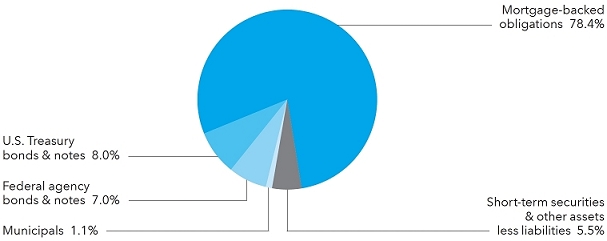
| Breakdown of mortgage-backed obligations | | | | | | Percent of
net assets | |
| 30-year pass-throughs: | | | | | | | | |
| Fannie Mae | | | 44.6 | % | | | | |
| Ginnie Mae | | | 17.8 | | | | | |
| Freddie Mac | | | 5.0 | | | | 67.4 | % |
| 15-year pass-throughs | | | | | | | 2.4 | |
| Other | | | | | | | 8.6 | |
| Total | | | | | | | 78.4 | % |
| Quality breakdown* | | Percent of
net assets | |
| U.S. Treasury and agency† | | | 15.0 | % |
| Aaa/AAA | | | 79.4 | |
| Aa/AA | | | 0.1 | |
| Short-term securities & other assets less liabilities | | | 5.5 | |
| * | Bond ratings, which typically range from Aaa/AAA (highest) to D (lowest), are assigned by credit rating agencies such as Moody’s, Standard & Poor’s and/or Fitch as an indication of an issuer’s creditworthiness. If agency ratings differ, the security will be considered to have received the highest of those ratings, consistent with the fund’s investment policies. The ratings are not covered by the Report of Independent Registered Public Accounting Firm. |
| † | These securities are guaranteed by the full faith and credit of the United States government. |
| Bonds, notes & other debt instruments 94.55% | Principal amount
(000) | | | Value
(000) | | | Percent of
net assets | |
| Mortgage-backed obligations 78.42% | | | | | | | | | | | | |
| Federal agency mortgage-backed obligations1 75.38% | | | | | | | | | | | | |
| Fannie Mae: | | | | | | | | | | | | |
| 2.50% 2028 | | $ | 5,241 | | | $ | 5,197 | | | | | |
| 3.00% 2038 | | | 6,902 | | | | 6,610 | | | | | |
| 4.50% 2040 | | | 7,605 | | | | 8,045 | | | | | |
| 5.00% 2040 | | | 5,371 | | | | 5,882 | | | | | |
| 4.00% 2041 | | | 16,160 | | | | 16,702 | | | | | |
| 4.00% 2041 | | | 7,018 | | | | 7,254 | | | | | |
| 4.50% 2041 | | | 8,710 | | | | 9,218 | | | | | |
| 3.50% 2042 | | | 5,478 | | | | 5,479 | | | | | |
| 4.00% 2042 | | | 12,321 | | | | 12,739 | | | | | |
| 3.00% 20432 | | | 39,927 | | | | 38,193 | | | | | |
| 3.50% 20432 | | | 64,844 | | | | 64,692 | | | | 49.43 | % |
| 3.50% 2043 | | | 20,188 | | | | 20,167 | | | | | |
| 3.50% 2043 | | | 13,595 | | | | 13,599 | | | | | |
| 4.00% 20432 | | | 22,650 | | | | 23,365 | | | | | |
| 4.00% 20432 | | | 19,041 | | | | 19,585 | | | | | |
| 4.00% 2043 | | | 10,000 | | | | 10,225 | | | | | |
| 4.00% 2043 | | | 8,100 | | | | 8,386 | | | | | |
| 4.50% 20432 | | | 37,820 | | | | 39,912 | | | | | |
| 5.00% 20432 | | | 14,980 | | | | 16,104 | | | | | |
| 5.50% 20432 | | | 6,190 | | | | 6,723 | | | | | |
| 2.50%–6.00% 2017–20432,3 | | | 53,214 | | | | 54,709 | | | | | |
| 4 | American Funds Mortgage Fund |
| | | Principal amount
(000) | | | Value
(000) | | | Percent of
net assets | |
| Government National Mortgage Assn.: | | | | | | | | | | | | |
| 6.00% 2039 | | $ | 15,018 | | | $ | 16,523 | | | | | |
| 5.50% 2040 | | | 13,414 | | | | 14,929 | | | | | |
| 3.50% 2041 | | | 11,420 | | | | 11,537 | | | | | |
| 5.00% 2041 | | | 8,739 | | | | 9,464 | | | | 18.76 | % |
| 3.50% 2043 | | | 6,535 | | | | 6,602 | | | | | |
| 4.00% 20432 | | | 18,350 | | | | 19,101 | | | | | |
| 4.50% 20432 | | | 7,500 | | | | 7,976 | | | | | |
| 2.50%–6.50% 2027–2042 | | | 59,902 | | | | 62,952 | | | | | |
| Freddie Mac: | | | | | | | | | | | | |
| 5.00% 2034 | | | 7,917 | | | | 8,540 | | | | | |
| 4.50% 2041 | | | 6,517 | | | | 6,856 | | | | | |
| 2.355% 20433 | | | 9,052 | | | | 8,789 | | | | 7.11 | |
| 2.563%–6.00% 2026–20433 | | | 30,573 | | | | 32,309 | | | | | |
| Other securities | | | | | | | 665 | | | | .08 | |
| | | | | | | | 599,029 | | | | 75.38 | |
| | | | | | | | | | | | | |
| Other 3.04% | | | | | | | | | | | | |
| Other securities | | | | | | | 24,183 | | | | 3.04 | |
| Total mortgage-backed obligations | | | | | | | 623,212 | | | | 78.42 | |
| | | | | | | | | | | | | |
| U.S. Treasury bonds & notes 8.00% | | | | | | | | | | | | |
| U.S. Treasury inflation-protected securities4 7.57% | | | | | | | | | | | | |
| 2.00% 2014 | | | 26,524 | | | | 26,793 | | | | | |
| 0.50% 2015 | | | 12,929 | | | | 13,240 | | | | | |
| 0.625% 2043 | | | 7,109 | | | | 5,695 | | | | 7.57 | |
| 0.125%–0.375% 2018–20235 | | | 14,750 | | | | 14,436 | | | | | |
| | | | | | | | 60,164 | | | | 7.57 | |
| | | | | | | | | | | | | |
| U.S. Treasury 0.43% | | | | | | | | | | | | |
| U.S. Treasury 2.875% 2043 | | | 4,000 | | | | 3,384 | | | | .43 | |
| Total U.S. Treasury bonds & notes | | | | | | | 63,548 | | | | 8.00 | |
| | | | | | | | | | | | | |
| Federal agency bonds & notes 7.01% | | | | | | | | | | | | |
| Freddie Mac: | | | | | | | | | | | | |
| 0.375% 2014 | | | 10,850 | | | | 10,866 | | | | | |
| Series K031, Class A2, multifamily 3.30% 20231,3 | | | 7,596 | | | | 7,490 | | | | 5.95 | |
| 1.00%–3.32% 2015–20461,3 | | | 29,689 | | | | 28,960 | | | | | |
| Fannie Mae 1.114%–3.044% 2017–20221 | | | 3,066 | | | | 2,987 | | | | .38 | |
| Other securities | | | | | | | 5,425 | | | | .68 | |
| | | | | | | | 55,728 | | | | 7.01 | |
| | | | | | | | | | | | | |
| Municipals 1.12% | | | | | | | | | | | | |
| Other securities | | | | | | | 8,898 | | | | 1.12 | |
| Total bonds, notes & other debt instruments (cost: $756,047,000) | | | | | | | 751,386 | | | | 94.55 | |
| American Funds Mortgage Fund | 5 |
| Short-term securities 34.48% | | Principal amount
(000) | | | Value
(000) | | | Percent of
net assets | |
| Freddie Mac 0.11%–0.12% due 11/6/2013–1/27/2014 | | $ | 62,900 | | | $ | 62,890 | | | | 7.91 | % |
| Fannie Mae 0.08%–0.16% due 10/25/2013–1/6/2014 | | | 26,400 | | | | 26,397 | | | | 3.32 | |
| Abbott Laboratories 0.07%–0.09% due 10/1–11/1/20136 | | | 22,500 | | | | 22,498 | | | | 2.83 | |
| Regents of the University of California 0.11% due 10/23/2013 | | | 19,800 | | | | 19,797 | | | | 2.49 | |
| Wal-Mart Stores, Inc. 0.05%–0.06% due 9/18–9/23/20136 | | | 15,300 | | | | 15,300 | | | | 1.93 | |
| Chariot Funding, LLC 0.27% due 9/18/20136 | | | 15,000 | | | | 14,999 | | | | 1.89 | |
| Federal Home Loan Bank 0.08%–0.15% due 12/19/2013–1/15/2014 | | | 14,900 | | | | 14,898 | | | | 1.87 | |
| Google Inc. 0.10% due 9/24/20136 | | | 14,400 | | | | 14,399 | | | | 1.81 | |
| National Rural Utilities Cooperative Finance Corp. 0.10% due 9/17/2013 | | | 12,500 | | | | 12,499 | | | | 1.57 | |
| NetJets Inc. 0.05% due 9/23/20136 | | | 12,400 | | | | 12,399 | | | | 1.56 | |
| Wells Fargo & Co. 0.17%–0.18% due 12/16–12/17/2013 | | | 11,300 | | | | 11,291 | | | | 1.42 | |
| Emerson Electric Co. 0.05% due 9/19/20136 | | | 8,800 | | | | 8,800 | | | | 1.11 | |
| Procter & Gamble Co. 0.10% due 10/15/20136 | | | 7,700 | | | | 7,699 | | | | .97 | |
| John Deere Financial Ltd. 0.08% due 9/25/20136 | | | 6,600 | | | | 6,600 | | | | .83 | |
| Parker-Hannifin Corp. 0.09% due 10/11/20136 | | | 6,100 | | | | 6,099 | | | | .77 | |
| Other securities | | | | | | | 17,497 | | | | 2.20 | |
| | | | | | | | | | | | | |
| Total short-term securities (cost: $274,042,000) | | | | | | | 274,062 | | | | 34.48 | |
| Total investment securities (cost: $1,030,089,000) | | | | | | | 1,025,448 | | | | 129.03 | |
| Other assets less liabilities | | | | | | | (230,736 | ) | | | (29.03 | ) |
| | | | | | | | | | | | | |
| Net assets | | | | | | $ | 794,712 | | | | 100.00 | % |
This summary investment portfolio is designed to streamline the report and help investors better focus on the fund’s principal holdings. See the inside back cover for details on how to obtain a complete schedule of portfolio holdings.
“Other securities” includes all issues that are not disclosed separately in the summary investment portfolio.
Interest rate swaps
The fund has entered into interest rate swaps as shown in the following table. The interest rate swaps shown are generally indicative of the volume of activity over the prior 12-month period.
Pay/receive
floating rate | | Floating rate
index | | Fixed
rate | | Expiration
date | | Notional
amount
(000) | | | Unrealized
appreciation
at 8/31/2013
(000) | |
| Receive | | 3-month USD-LIBOR | | | 1.5125 | % | | 7/22/2018 | | $ | 10,000 | | | $ | 112 | |
| Receive | | 3-month USD-LIBOR | | | 1.5775 | | | 8/6/2018 | | | 10,000 | | | | 89 | |
| Receive | | 3-month USD-LIBOR | | | 1.5625 | | | 8/9/2018 | | | 2,500 | | | | 24 | |
| | | | | | | | | | | | | | | $ | 225 | |
The following footnotes apply to either the individual securities noted or one or more of the securities aggregated and listed as a single line item.
| 1 | Principal payments may be made periodically. Therefore, the effective maturity date may be earlier than the stated maturity date. |
| 2 | A portion or all of the security purchased on a TBA basis. |
| 3 | Coupon rate may change periodically. |
| 4 | Index-linked bond whose principal amount moves with a government price index. |
| 5 | A portion of this security was pledged as collateral for net losses on unsettled interest rate swaps. The total value of pledged collateral was $621,000, which represented .08% of the net assets of the fund. |
| 6 | Acquired in a transaction exempt from registration under Rule 144A or section 4(2) of the Securities Act of 1933. May be resold in the U.S. in transactions exempt from registration, normally to qualified institutional buyers. The total value of all such securities, including those in “Other securities,” was $138,674,000, which represented 17.45% of the net assets of the fund. |
Key to abbreviation
TBA = To be announced
See Notes to Financial Statements
| 6 | American Funds Mortgage Fund |
Financial statements
Statement of assets and liabilities
at August 31, 2013 | | (dollars in thousands) | |
| | | | |
| Assets: | | | | | | | | |
| Investment securities, at value (cost: $1,030,089) | | | | | | $ | 1,025,448 | |
| Cash | | | | | | | 107 | |
| Receivables for: | | | | | | | | |
| Sales of investments | | $ | 154,539 | | | | | |
| Sales of fund’s shares | | | 526 | | | | | |
| Variation margin on interest rate swaps | | | 31 | | | | | |
| Interest | | | 2,096 | | | | 157,192 | |
| | | | | | | | 1,182,747 | |
| Liabilities: | | | | | | | | |
| Payables for: | | | | | | | | |
| Purchases of investments | | | 386,339 | | | | | |
| Repurchases of fund’s shares | | | 1,234 | | | | | |
| Dividends on fund’s shares | | | 58 | | | | | |
| Investment advisory services | | | 167 | | | | | |
| Services provided by related parties | | | 219 | | | | | |
| Trustees’ deferred compensation | | | 1 | | | | | |
| Other | | | 17 | | | | 388,035 | |
| Net assets at August 31, 2013 | | | | | | $ | 794,712 | |
| | | | | | | | | |
| Net assets consist of: | | | | | | | | |
| Capital paid in on shares of beneficial interest | | | | | | $ | 810,152 | |
| Undistributed net investment income | | | | | | | 13 | |
| Accumulated net realized loss | | | | | | | (11,037 | ) |
| Net unrealized depreciation | | | | | | | (4,416 | ) |
| Net assets at August 31, 2013 | | | | | | $ | 794,712 | |
(dollars and shares in thousands, except per-share amounts)
Shares of beneficial interest issued and outstanding (no stated par value) —
unlimited shares authorized (80,738 total shares outstanding)
| | | Net assets | | | Shares
outstanding | | | Net asset value
per share | |
| Class A | | $ | 173,651 | | | | 17,641 | | | $ | 9.84 | |
| Class B | | | 859 | | | | 87 | | | | 9.83 | |
| Class C | | | 24,868 | | | | 2,531 | | | | 9.83 | |
| Class F-1 | | | 7,372 | | | | 749 | | | | 9.84 | |
| Class F-2 | | | 8,839 | | | | 898 | | | | 9.85 | |
| Class 529-A | | | 11,317 | | | | 1,150 | | | | 9.84 | |
| Class 529-B | | | 474 | | | | 48 | | | | 9.82 | |
| Class 529-C | | | 8,588 | | | | 874 | | | | 9.82 | |
| Class 529-E | | | 1,581 | | | | 161 | | | | 9.84 | |
| Class 529-F-1 | | | 3,596 | | | | 365 | | | | 9.84 | |
| Class R-1 | | | 946 | | | | 96 | | | | 9.84 | |
| Class R-2 | | | 2,283 | | | | 232 | | | | 9.83 | |
| Class R-3 | | | 2,200 | | | | 224 | | | | 9.84 | |
| Class R-4 | | | 1,637 | | | | 166 | | | | 9.84 | |
| Class R-5 | | | 5,079 | | | | 516 | | | | 9.84 | |
| Class R-6 | | | 541,422 | | | | 55,000 | | | | 9.84 | |
See Notes to Financial Statements
| American Funds Mortgage Fund | 7 |
Statement of operations
for the year ended August 31, 2013 | | (dollars in thousands) | |
| | | | |
| Investment income: | | | | | | | | |
| Income: | | | | | | | | |
| Interest | | | | | | $ | 3,546 | |
| Fees and expenses*: | | | | | | | | |
| Investment advisory services | | $ | 1,733 | | | | | |
| Distribution services | | | 911 | | | | | |
| Transfer agent services | | | 443 | | | | | |
| Administrative services | | | 293 | | | | | |
| Reports to shareholders | | | 35 | | | | | |
| Registration statement and prospectus | | | 203 | | | | | |
| Trustees’ compensation | | | 5 | | | | | |
| Auditing and legal | | | 61 | | | | | |
| Custodian | | | 2 | | | | | |
| Other | | | 16 | | | | 3,702 | |
| Net investment loss | | | | | | | (156 | ) |
| | | | | | | | | |
| Net realized loss and unrealized depreciation on investments and interest rate swaps: | | | | | | | | |
| Net realized loss on: | | | | | | | | |
| Investments | | | (2,518 | ) | | | | |
| Interest rate swaps | | | (24 | ) | | | (2,542 | ) |
| Net unrealized (depreciation) appreciation on: | | | | | | | | |
| Investments | | | (17,063 | ) | | | | |
| Interest rate swaps | | | 225 | | | | (16,838 | ) |
| Net realized loss and unrealized depreciation on investments and interest rate swaps | | | | | | | (19,380 | ) |
| | | | | | | | | |
| Net decrease in net assets resulting from operations | | | | | | $ | (19,536 | ) |
*Additional information related to class-specific fees and expenses is included in the Notes to Financial Statements.
| Statements of changes in net assets | | | | | | |
| | | (dollars in thousands) | |
| | | | |
| | | Year ended August 31 | |
| | | 2013 | | | 2012 | |
| | | | | | | |
| Operations: | | | | | | | | |
| Net investment (loss) income | | $ | (156 | ) | | $ | 3,196 | |
| Net realized (loss) gain on investments and interest rate swaps | | | (2,542 | ) | | | 13,852 | |
| Net unrealized (depreciation) appreciation on investments and interest rate swaps | | | (16,838 | ) | | | 3,523 | |
| Net (decrease) increase in net assets resulting from operations | | | (19,536 | ) | | | 20,571 | |
| | | | | | | | | |
| Dividends and distributions paid or accrued to shareholders: | | | | | | | | |
| Dividends from net investment income | | | (6,534 | ) | | | (7,201 | ) |
| Distributions from net realized gain on investments | | | (9,088 | ) | | | (5,376 | ) |
| Total dividends and distributions paid or accrued to shareholders | | | (15,622 | ) | | | (12,577 | ) |
| | | | | | | | | |
| Net capital share transactions | | | 202,253 | | | | 245,095 | |
| | | | | | | | | |
| Total increase in net assets | | | 167,095 | | | | 253,089 | |
| | | | | | | | | |
| Net assets: | | | | | | | | |
| Beginning of year | | | 627,617 | | | | 374,528 | |
End of year (including undistributed net investment income:
$13 and $37, respectively) | | $ | 794,712 | | | $ | 627,617 | |
See Notes to Financial Statements
| 8 | American Funds Mortgage Fund |
Notes to financial statements
1. Organization
American Funds Mortgage Fund (the “fund”) is registered under the Investment Company Act of 1940 as an open-end, diversified management investment company. The fund seeks to provide current income and preserve capital.
The fund has 16 share classes consisting of five retail share classes (Classes A, B and C, as well as two F share classes, F-1 and F-2), five 529 college savings plan share classes (Classes 529-A, 529-B, 529-C, 529-E and 529-F-1) and six retirement plan share classes (Classes R-1, R-2, R-3, R-4, R-5 and R-6). The 529 college savings plan share classes can be used to save for college education. The retirement plan share classes are generally offered only through eligible employer-sponsored retirement plans. The fund’s share classes are further described below:
| Share class | | Initial sales charge | | Contingent deferred sales
charge upon redemption | | Conversion feature |
| Classes A and 529-A | | Up to 3.75% | | None (except 1% for certain redemptions within one year of purchase without an initial sales charge) | | None |
| Classes B and 529-B* | | None | | Declines from 5% to 0% for redemptions within six years of purchase | | Classes B and 529-B convert to Classes A and 529-A, respectively, after eight years |
| Class C | | None | | 1% for redemptions within one year of purchase | | Class C converts to Class F-1 after 10 years |
| Class 529-C | | None | | 1% for redemptions within one year of purchase | | None |
| Class 529-E | | None | | None | | None |
| Classes F-1, F-2 and 529-F-1 | | None | | None | | None |
| Classes R-1, R-2, R-3, R-4, R-5 and R-6 | | None | | None | | None |
* Class B and 529-B shares of the fund are not available for purchase.
Holders of all share classes have equal pro rata rights to assets, dividends and liquidation proceeds. Each share class has identical voting rights, except for the exclusive right to vote on matters affecting only its class. Share classes have different fees and expenses (“class-specific fees and expenses”), primarily due to different arrangements for distribution, administrative and shareholder services. Differences in class-specific fees and expenses will result in differences in net investment income and, therefore, the payment of different per-share dividends by each share class.
2. Significant accounting policies
The financial statements have been prepared to comply with accounting principles generally accepted in the United States of America. These principles require management to make estimates and assumptions that affect reported amounts and disclosures. Actual results could differ from those estimates. The fund follows the significant accounting policies described below, as well as the valuation policies described in the next section on valuation.
Security transactions and related investment income — Security transactions are recorded by the fund as of the date the trades are executed with brokers. Realized gains and losses from security transactions are determined based on the specific identified cost of the securities. In the event a security is purchased with a delayed payment date, the fund will segregate liquid assets sufficient to meet its payment obligations. Interest income is recognized on an accrual basis. Market discounts, premiums and original issue discounts on fixed-income securities are amortized daily over the expected life of the security.
Class allocations — Income, fees and expenses (other than class-specific fees and expenses) are allocated daily among the various share classes based on the relative value of their settled shares. Realized and unrealized gains and losses are allocated daily among the various share classes based on their relative net assets. Class-specific fees and expenses, such as distribution, administrative and shareholder services, are charged directly to the respective share class.
Dividends and distributions to shareholders — Dividends to shareholders are declared daily after the determination of the fund’s net investment income and are paid to shareholders monthly. Distributions to shareholders are recorded on the ex-dividend date.
| American Funds Mortgage Fund | 9 |
3. Valuation
Capital Research and Management Company (“CRMC”), the fund’s investment adviser, values the fund’s investments at fair value as defined by accounting principles generally accepted in the United States of America. The net asset value of each share class of the fund is generally determined as of approximately 4:00 p.m. New York time each day the New York Stock Exchange is open.
Methods and inputs — The fund’s investment adviser uses the following methods and inputs to establish the fair value of the fund’s assets and liabilities. Use of particular methods and inputs may vary over time based on availability and relevance as market and economic conditions evolve.
Fixed-income securities, including short-term securities purchased with more than 60 days left to maturity, are generally valued at prices obtained from one or more pricing vendors. Vendors value such securities based on one or more of the inputs described in the following table. The table provides examples of inputs that are commonly relevant for valuing particular classes of fixed-income securities in which the fund is authorized to invest. However, these classifications are not exclusive, and any of the inputs may be used to value any other class of fixed-income security.
| Fixed-income class | | Examples of standard inputs |
| All | | Benchmark yields, transactions, bids, offers, quotations from dealers and trading systems, new issues, spreads and other relationships observed in the markets among comparable securities; and proprietary pricing models such as yield measures calculated using factors such as cash flows, financial or collateral performance and other reference data (collectively referred to as “standard inputs”) |
| Bonds & notes of governments & government agencies | | Standard inputs and interest rate volatilities |
| Mortgage-backed; asset-backed obligations | | Standard inputs and cash flows, prepayment information, default rates, delinquency and loss assumptions, collateral characteristics, credit enhancements and specific deal information |
| Municipal securities | | Standard inputs and, for certain distressed securities, cash flows or liquidation values using a net present value calculation based on inputs that include, but are not limited to, financial statements and debt contracts |
When the fund’s investment adviser deems it appropriate to do so (such as when vendor prices are unavailable or not deemed to be representative), fixed-income securities will be valued in good faith at the mean quoted bid and ask prices that are reasonably and timely available (or bid prices, if ask prices are not available) or at prices for securities of comparable maturity, quality and type.
Short-term securities purchased within 60 days to maturity are valued at amortized cost, which approximates fair value. The value of short-term securities originally purchased with maturities greater than 60 days is determined based on an amortized value to par when they reach 60 days. Interest rate swaps are generally valued by pricing vendors based on market inputs that include the index and term of index, reset frequency, payer/receiver, currency and pay frequency.
Securities and other assets for which representative market quotations are not readily available or are considered unreliable by the fund’s investment adviser are fair valued as determined in good faith under fair valuation guidelines adopted by authority of the fund’s board of trustees as further described below. The investment adviser follows fair valuation guidelines, consistent with U.S. Securities and Exchange Commission rules and guidance, to consider relevant principles and factors when making fair value determinations. The investment adviser considers relevant indications of value that are reasonably and timely available to it in determining the fair value to be assigned to a particular security, such as the type and cost of the security; contractual or legal restrictions on resale of the security; relevant financial or business developments of the issuer; actively traded similar or related securities; conversion or exchange rights on the security; related corporate actions; significant events occurring after the close of trading in the security; and changes in overall market conditions. Fair valuations and valuations of investments that are not actively trading involve judgment and may differ materially from valuations that would have been used had greater market activity occurred.
Processes and structure — The fund’s board of trustees has delegated authority to the fund’s investment adviser to make fair value determinations, subject to board oversight. The investment adviser has established a Joint Fair Valuation Committee (the “Fair Valuation Committee”) to administer, implement and oversee the fair valuation process, and to make fair value decisions. The Fair Valuation Committee regularly reviews its own fair value decisions, as well as decisions made under its standing instructions to the investment adviser’s valuation teams. The Fair Valuation Committee reviews changes in fair value measurements from period to period and may, as deemed appropriate, update the fair valuation guidelines to better reflect the results of back testing and address new or evolving issues. The Fair Valuation Committee reports any changes to the fair valuation guidelines to the board of trustees with supplemental information to support the changes. The fund’s board and audit committee also regularly review reports that describe fair value determinations and methods.
| 10 | American Funds Mortgage Fund |
The fund’s investment adviser has also established a Fixed-Income Pricing Review Group to administer and oversee the fixed-income valuation process, including the use of fixed-income pricing vendors. This group regularly reviews pricing vendor information and market data. Pricing decisions, processes and controls over security valuation are also subject to additional internal reviews, including an annual control self-evaluation program facilitated by the investment adviser’s compliance group.
Classifications — The fund’s investment adviser classifies the fund’s assets and liabilities into three levels based on the inputs used to value the assets or liabilities. Level 1 values are based on quoted prices in active markets for identical securities. Level 2 values are based on significant observable market inputs, such as quoted prices for similar securities and quoted prices in inactive markets. Level 3 values are based on significant unobservable inputs that reflect the investment adviser’s determination of assumptions that market participants might reasonably use in valuing the securities. The valuation levels are not necessarily an indication of the risk or liquidity associated with the underlying investment. For example, U.S. government securities are reflected as Level 2 because the inputs used to determine fair value may not always be quoted prices in an active market. At August 31, 2013, all of the fund’s investments were classified as Level 2.
4. Risk factors
Investing in the fund may involve certain risks including, but not limited to, those described below.
Investing in mortgage-related securities — Mortgage-related securities are subject to prepayment risk as well as the risks associated with investing in debt securities in general. If interest rates fall and the loans underlying these securities are prepaid faster than expected, the fund may have to reinvest the prepaid principal in lower yielding securities, thus reducing the fund’s income. Conversely, if interest rates increase and the loans underlying the securities are prepaid more slowly than expected, the time in which the securities are expected to be paid off could be extended. This may reduce the fund’s cash for potential reinvestment in higher yielding securities.
Market conditions — The prices of, and the income generated by, the securities held by the fund may decline due to market conditions and other factors, including those directly involving the issuers of securities held by the fund.
Investing in bonds — Rising interest rates will generally cause the prices of bonds and other debt securities to fall. Longer maturity debt securities may be subject to greater price fluctuations than shorter maturity debt securities. In addition, falling interest rates may cause an issuer to redeem, call or refinance a debt security before its stated maturity, which may result in the fund having to reinvest the proceeds in lower yielding securities.
Bonds and other debt securities are subject to credit risk, which is the possibility that the credit strength of an issuer will weaken and/or an issuer of a debt security will fail to make timely payments of principal or interest and the security will go into default. Lower quality debt securities generally have higher rates of interest and may be subject to greater price fluctuations than higher quality debt securities. Credit risk is gauged, in part, by the credit ratings of the securities in which the fund invests. However, ratings are only the opinions of the rating agencies issuing them and are not guarantees as to credit quality or an evaluation of market risk. The fund’s investment adviser relies on its own credit analysts to research issuers and issues in seeking to mitigate the risks of an issuer defaulting on its obligations.
Thinly traded securities — There may be little trading in the secondary market for particular bonds or other debt securities, which may make them more difficult to value, acquire or sell.
Investing in securities backed by the U.S. government — Securities backed by the U.S. Treasury or the full faith and credit of the U.S. government are guaranteed only as to the timely payment of interest and principal when held to maturity. Accordingly, the current market values for these securities will fluctuate with changes in interest rates. Securities issued by government-sponsored entities and federal agencies and instrumentalities that are not backed by the full faith and credit of the U.S. government are neither issued nor guaranteed by the U.S. government.
Investing in future delivery contracts — Contracts for future delivery of mortgage-related securities, such as to be announced contracts and mortgage dollar rolls, involve the fund selling mortgage-related securities and simultaneously contracting to repurchase similar securities for delivery at a future date at a predetermined price. This can increase the fund’s market exposure, and the market price of the securities the fund contracts to repurchase could drop below their purchase price. While the fund can preserve and generate capital through the use of such contracts by, for example, realizing the difference between the sale price and the future purchase price, the income generated by the fund may be reduced by engaging in such transactions. In addition, these transactions may increase the turnover rate of the fund.
| American Funds Mortgage Fund | 11 |
Management — The investment adviser to the fund actively manages the fund’s investments. Consequently, the fund is subject to the risk that the methods and analyses employed by the investment adviser in this process may not produce the desired results. This could cause the fund to lose value or its investment results to lag relevant benchmarks or other funds with similar objectives.
5. Certain investment techniques
Mortgage dollar rolls — The fund has entered into mortgage dollar roll transactions in which the fund sells a mortgage-backed security to a counterparty and simultaneously enters into an agreement with the same counterparty to buy back a similar security on a specific future date at a predetermined price. Mortgage dollar rolls are accounted for as purchase and sale transactions, which may increase the fund’s portfolio turnover rate.
Interest rate swaps — The fund has entered into interest rate swaps, which are agreements to exchange one stream of future interest payments for another based on a specified notional amount. Typically, interest rate swaps exchange a fixed-interest rate for a payment that floats relative to a benchmark or vice versa. The fund’s investment adviser uses interest rate swaps to manage the interest rate sensitivity of the fund by increasing or decreasing the duration of the fund or a portion of the fund’s portfolio. Risks may arise as a result of the fund’s investment adviser incorrectly anticipating changes in interest rates, increased volatility, reduced liquidity and the potential inability of counterparties to meet the terms of their agreements.
Upon entering into an interest rate swap contract, the fund is required to deposit an amount of cash, U.S. government securities or other liquid securities, which is known as “initial margin.” Generally, the initial margin required for a particular interest rate swap is set and held as collateral by the clearinghouse on which the contract is cleared. The amount of initial margin required may be significantly modified from time to time by the clearinghouse during the term of the contract.
On a daily basis, the fund’s investment adviser records daily interest accruals related to the exchange of future payments as a receivable and payable in the fund’s statement of assets and liabilities. The fund also pays or receives a “variation margin” based on the increase or decrease in the value of the interest rate swaps, including accrued interest, and records variation margin on interest rate swaps in the statement of assets and liabilities. The fund records realized gains and losses on both the net accrued interest and any gain or loss recognized at the time the interest rate swap is closed or expires. Net realized gains or losses, as well as any net unrealized appreciation or depreciation, from interest rate swaps are recorded in the fund’s statement of operations.
6. Taxation and distributions
Federal income taxation — The fund complies with the requirements under Subchapter M of the Internal Revenue Code applicable to mutual funds and intends to distribute substantially all of its net taxable income and net capital gains each year. The fund is not subject to income taxes to the extent such distributions are made. Therefore, no federal income tax provision is required.
As of and during the period ended August 31, 2013, the fund did not have a liability for any unrecognized tax benefits. The fund recognizes interest and penalties, if any, related to unrecognized tax benefits as income tax expense in the statement of operations. During the period, the fund did not incur any interest or penalties.
The fund is not subject to examination by U.S. federal and state tax authorities for tax years before 2010, the year the fund commenced operations.
Distributions — Distributions paid to shareholders are based on net investment income and net realized gains determined on a tax basis, which may differ from net investment income and net realized gains for financial reporting purposes. These differences are due primarily to different treatment for items such as short-term capital gains and losses; capital losses related to sales of certain securities within 30 days of purchase; deferred expenses; cost of investments sold; paydowns on fixed-income securities; and income on certain investments. The fiscal year in which amounts are distributed may differ from the year in which the net investment income and net realized gains are recorded by the fund for financial reporting purposes. The fund may also designate a portion of the amount paid to redeeming shareholders as a distribution for tax purposes.
During the year ended August 31, 2013, the fund reclassified $6,668,000 from accumulated net realized loss to undistributed net investment income and $2,000 from undistributed net investment income and $80,000 from accumulated net realized loss to capital paid in on shares of beneficial interest to align financial reporting with tax reporting.
| 12 | American Funds Mortgage Fund |
As of August 31, 2013, the tax basis components of distributable earnings, unrealized appreciation (depreciation) and cost of investment securities were as follows (dollars in thousands):
| Undistributed ordinary income | | $ | 88 | |
| Post-October capital loss deferral* | | | (10,793 | ) |
| Gross unrealized appreciation on investment securities | | | 4,477 | |
| Gross unrealized depreciation on investment securities | | | (9,377 | ) |
| Net unrealized depreciation on investment securities | | | (4,900 | ) |
| Cost of investment securities | | | 1,030,348 | |
| * | This deferral is considered incurred in the subsequent year. |
The tax character of distributions paid or accrued to shareholders was as follows (dollars in thousands):
| | | Year ended August 31, 2013 | | | Year ended August 31, 2012 | |
| Share class | | Ordinary
income | | | Long-term
capital gains | | | Total distributions
paid or accrued | | | Ordinary
income | | | Long-term
capital gains | | | Total distributions
paid or accrued | |
| Class A | | $ | 3,202 | | | $ | 1,062 | | | $ | 4,264 | | | $ | 3,446 | | | $ | — | | | $ | 3,446 | |
| Class B | | | 13 | | | | 7 | | | | 20 | | | | 20 | | | | — | | | | 20 | |
| Class C | | | 267 | | | | 154 | | | | 421 | | | | 321 | | | | — | | | | 321 | |
| Class F-1 | | | 168 | | | | 58 | | | | 226 | | | | 201 | | | | — | | | | 201 | |
| Class F-2 | | | 797 | | | | 286 | | | | 1,083 | | | | 1,059 | | | | — | | | | 1,059 | |
| Class 529-A | | | 145 | | | | 49 | | | | 194 | | | | 81 | | | | — | | | | 81 | |
| Class 529-B | | | 4 | | | | 3 | | | | 7 | | | | 3 | | | | — | | | | 3 | |
| Class 529-C | | | 69 | | | | 40 | | | | 109 | | | | 24 | | | | — | | | | 24 | |
| Class 529-E | | | 10 | | | | 3 | | | | 13 | | | | 5 | | | | — | | | | 5 | |
| Class 529-F-1 | | | 33 | | | | 6 | | | | 39 | | | | 17 | | | | — | | | | 17 | |
| Class R-1 | | | 26 | | | | 12 | | | | 38 | | | | 59 | | | | — | | | | 59 | |
| Class R-2 | | | 26 | | | | 12 | | | | 38 | | | | 23 | | | | — | | | | 23 | |
| Class R-3 | | | 33 | | | | 12 | | | | 45 | | | | 25 | | | | — | | | | 25 | |
| Class R-4 | | | 24 | | | | 8 | | | | 32 | | | | 21 | | | | — | | | | 21 | |
| Class R-5 | | | 149 | | | | 44 | | | | 193 | | | | 122 | | | | — | | | | 122 | |
| Class R-6 | | | 7,204 | | | | 1,696 | | | | 8,900 | | | | 7,150 | | | | — | | | | 7,150 | |
| Total | | $ | 12,170 | | | $ | 3,452 | | | $ | 15,622 | | | $ | 12,577 | | | $ | — | | | $ | 12,577 | |
7. Fees and transactions with related parties
CRMC, the fund’s investment adviser, is the parent company of American Funds Distributors,® Inc. (“AFD”), the principal underwriter of the fund’s shares, and American Funds Service Company® (“AFS”), the fund’s transfer agent. CRMC, AFD and AFS are considered related parties to the fund.
Investment advisory services — The fund has an investment advisory and service agreement with CRMC that provides for monthly fees accrued daily. These fees are based on a series of decreasing annual rates beginning with 0.300% on the first $60 million of daily net assets and decreasing to 0.140% on such assets in excess of $10 billion. The agreement also provides for monthly fees, accrued daily, based on a series of decreasing rates beginning with 3.00% on the first $3,333,333 of the fund’s monthly gross income and decreasing to 2.00% on such income in excess of $8,333,333. For the year ended August 31, 2013, the investment advisory services fee was $1,733,000, which was equivalent to an annualized rate of 0.231% of average daily net assets.
Class-specific fees and expenses — Expenses that are specific to individual share classes are accrued directly to the respective share class. The principal class-specific fees and expenses are described below:
Distribution services — The fund has plans of distribution for all share classes, except Class F-2, R-5 and R-6 shares. Under the plans, the board of trustees approves certain categories of expenses that are used to finance activities primarily intended to sell fund shares and service existing accounts. The plans provide for payments, based on an annualized percentage of average daily net assets, ranging from 0.30% to 1.00% as noted on the following page. In some cases, the board of trustees has limited the amounts that may be paid to less than the maximum allowed by the plans. All share classes with a plan may use up to 0.25% of average daily net assets to pay service fees, or to compensate AFD for paying service fees, to firms that have entered into agreements with AFD to provide certain shareholder services. The remaining amounts available to be paid under each plan are paid to dealers to compensate them for their sales activities.
| American Funds Mortgage Fund | 13 |
For Class A and 529-A shares, distribution-related expenses include the reimbursement of dealer and wholesaler commissions paid by AFD for certain shares sold without a sales charge. These share classes reimburse AFD for amounts billed within the prior 15 months but only to the extent that the overall annual expense limit of 0.25% is not exceeded. As of August 31, 2013, there were no unreimbursed expenses subject to reimbursement for Class A or 529-A shares.
| Share class | | Currently approved limits | | Plan limits |
| Class A | | | 0.25 | % | | | 0.30 | % |
| Class 529-A | | | 0.25 | | | | 0.50 | |
| Classes B and 529-B | | | 1.00 | | | | 1.00 | |
| Classes C, 529-C and R-1 | | | 1.00 | | | | 1.00 | |
| Class R-2 | | | 0.75 | | | | 1.00 | |
| Classes 529-E and R-3 | | | 0.50 | | | | 0.75 | |
| Classes F-1, 529-F-1 and R-4 | | | 0.25 | | | | 0.50 | |
Transfer agent services — The fund has a shareholder services agreement with AFS under which the fund compensates AFS for providing transfer agent services to each of the fund’s share classes. These services include recordkeeping, shareholder communications and transaction processing. In addition, the fund reimburses AFS for amounts paid to third parties for performing transfer agent services on behalf of fund shareholders.
Administrative services — The fund has an administrative services agreement with CRMC under which the fund compensates CRMC for providing administrative services to Class A, C, F, 529 and R shares. These services include, but are not limited to, coordinating, monitoring, assisting and overseeing third parties that provide services to fund shareholders. Under the agreement, Class A shares pay an annual fee of 0.01% and Class C, F, 529 and R shares pay an annual fee of 0.05% of their respective average daily net assets.
529 plan services — Each 529 share class is subject to service fees to compensate the Commonwealth of Virginia for the maintenance of the 529 college savings plan. The quarterly fee is based on a series of decreasing annual rates beginning with 0.10% on the first $30 billion of the net assets invested in Class 529 shares of the American Funds and decreasing to 0.06% on such assets between $120 billion and $150 billion. The fee for any given calendar quarter is accrued and calculated on the basis of the average net assets of Class 529 shares of the American Funds for the last month of the prior calendar quarter. The fee is included in other expenses on the accompanying financial statements. The Commonwealth of Virginia is not considered a related party.
For the year ended August 31, 2013, class-specific expenses under the agreements were as follows (dollars in thousands):
| | | Distribution | | | Transfer agent | | | Administrative | | | 529 plan |
| Share class | | services | | | services | | | services | | | services |
| Class A | | | $417 | | | | $293 | | | | $20 | | | Not applicable |
| Class B | | | 13 | | | | 2 | | | | Not applicable | | | Not applicable |
| Class C | | | 301 | | | | 45 | | | | 15 | | | Not applicable |
| Class F-1 | | | 26 | | | | 13 | | | | 6 | | | Not applicable |
| Class F-2 | | | Not applicable | | | | 42 | | | | 18 | | | Not applicable |
| Class 529-A | | | 21 | | | | 13 | | | | 5 | | | $10 |
| Class 529-B | | | 6 | | | | 1 | | | | — | * | | 1 |
| Class 529-C | | | 87 | | | | 12 | | | | 5 | | | 8 |
| Class 529-E | | | 5 | | | | 1 | | | | 1 | | | 1 |
| Class 529-F-1 | | | — | | | | 3 | | | | 1 | | | 3 |
| Class R-1 | | | 11 | | | | 1 | | | | 1 | | | Not applicable |
| Class R-2 | | | 13 | | | | 9 | | | | 1 | | | Not applicable |
| Class R-3 | | | 8 | | | | 3 | | | | 1 | | | Not applicable |
| Class R-4 | | | 3 | | | | 1 | | | | 1 | | | Not applicable |
| Class R-5 | | | Not applicable | | | | 4 | | | | 4 | | | Not applicable |
| Class R-6 | | | Not applicable | | | | — | * | | | 214 | | | Not applicable |
| Total class-specific expenses | | | $911 | | | | $443 | | | | $293 | | | $23 |
*Amount less than one thousand.
Trustees’ deferred compensation — Trustees who are unaffiliated with CRMC may elect to defer the cash payment of part or all of their compensation. These deferred amounts, which remain as liabilities of the fund, are treated as if invested in shares of the fund or other American Funds. These amounts represent general, unsecured liabilities of the fund and vary according to the total returns of the selected funds. Trustees’ compensation, shown on the accompanying financial statements, includes the current fees (either paid in cash or deferred) and the net increase or decrease in the value of the deferred amounts.
| 14 | American Funds Mortgage Fund |
Affiliated officers and trustees — Officers and certain trustees of the fund are or may be considered to be affiliated with CRMC, AFD and AFS. No affiliated officers or trustees received any compensation directly from the fund.
8. Capital share transactions
Capital share transactions in the fund were as follows (dollars and shares in thousands):
| | | Sales* | | | Reinvestments of
dividends and distributions | | | Repurchases* | | | Net (decrease) increase | |
| Share class | | Amount | | | Shares | | | Amount | | | Shares | | | Amount | | | Shares | | | Amount | | | Shares | |
| | | | | | | | | | | | | | | | | | | | | | | | | |
| Year ended August 31, 2013 | | | | | | | | | | | | | | | | | | | | | | | | |
| | | | | | | | | | | | | | | | | | | | | | | | | |
| Class A | | $ | 78,313 | | | | 7,675 | | | $ | 3,774 | | | | 372 | | | $ | (97,643 | ) | | | (9,672 | ) | | $ | (15,556 | ) | | | (1,625 | ) |
| Class B | | | 562 | | | | 55 | | | | 20 | | | | 2 | | | | (1,166 | ) | | | (116 | ) | | | (584 | ) | | | (59 | ) |
| Class C | | | 11,256 | | | | 1,107 | | | | 401 | | | | 40 | | | | (16,844 | ) | | | (1,669 | ) | | | (5,187 | ) | | | (522 | ) |
| Class F-1 | | | 8,095 | | | | 797 | | | | 211 | | | | 21 | | | | (11,907 | ) | | | (1,180 | ) | | | (3,601 | ) | | | (362 | ) |
| Class F-2 | | | 5,197 | | | | 507 | | | | 1,024 | | | | 101 | | | | (53,663 | ) | | | (5,313 | ) | | | (47,442 | ) | | | (4,705 | ) |
| Class 529-A | | | 6,957 | | | | 684 | | | | 194 | | | | 19 | | | | (3,092 | ) | | | (306 | ) | | | 4,059 | | | | 397 | |
| Class 529-B | | | 146 | | | | 14 | | | | 7 | | | | 1 | | | | (247 | ) | | | (25 | ) | | | (94 | ) | | | (10 | ) |
| Class 529-C | | | 3,506 | | | | 346 | | | | 109 | | | | 11 | | | | (2,644 | ) | | | (263 | ) | | | 971 | | | | 94 | |
| Class 529-E | | | 1,199 | | | | 118 | | | | 13 | | | | 1 | | | | (167 | ) | | | (16 | ) | | | 1,045 | | | | 103 | |
| Class 529-F-1 | | | 2,904 | | | | 287 | | | | 39 | | | | 3 | | | | (339 | ) | | | (34 | ) | | | 2,604 | | | | 256 | |
| Class R-1 | | | 268 | | | | 26 | | | | 29 | | | | 3 | | | | (1,913 | ) | | | (188 | ) | | | (1,616 | ) | | | (159 | ) |
| Class R-2 | | | 1,124 | | | | 111 | | | | 31 | | | | 3 | | | | (1,075 | ) | | | (107 | ) | | | 80 | | | | 7 | |
| Class R-3 | | | 939 | | | | 92 | | | | 36 | | | | 3 | | | | (763 | ) | | | (75 | ) | | | 212 | | | | 20 | |
| Class R-4 | | | 491 | | | | 48 | | | | 22 | | | | 2 | | | | (238 | ) | | | (24 | ) | | | 275 | | | | 26 | |
| Class R-5 | | | 2,511 | | | | 245 | | | | 182 | | | | 18 | | | | (6,386 | ) | | | (632 | ) | | | (3,693 | ) | | | (369 | ) |
| Class R-6 | | | 284,100 | | | | 28,032 | | | | 8,890 | | | | 879 | | | | (22,210 | ) | | | (2,207 | ) | | | 270,780 | | | | 26,704 | |
| Total net increase (decrease) | | $ | 407,568 | | | | 40,144 | | | $ | 14,982 | | | | 1,479 | | | $ | (220,297 | ) | | | (21,827 | ) | | $ | 202,253 | | | | 19,796 | |
| | | | | | | | | | | | | | | | | | | | | | | | | |
| Year ended August 31, 2012 | | | | | | | | | | | | | | | | | | | | | | | | |
| | | | | | | | | | | | | | | | | | | | | | | | | |
| Class A | | $ | 148,888 | | | | 14,617 | | | $ | 2,803 | | | | 276 | | | $ | (43,317 | ) | | | (4,254 | ) | | $ | 108,374 | | | | 10,639 | |
| Class B | | | 1,753 | | | | 172 | | | | 20 | | | | 2 | | | | (1,063 | ) | | | (104 | ) | | | 710 | | | | 70 | |
| Class C | | | 23,252 | | | | 2,283 | | | | 310 | | | | 30 | | | | (7,226 | ) | | | (708 | ) | | | 16,336 | | | | 1,605 | |
| Class F-1 | | | 14,454 | | | | 1,419 | | | | 180 | | | | 18 | | | | (6,352 | ) | | | (623 | ) | | | 8,282 | | | | 814 | |
| Class F-2 | | | 62,824 | | | | 6,175 | | | | 1,010 | | | | 99 | | | | (8,565 | ) | | | (842 | ) | | | 55,269 | | | | 5,432 | |
| Class 529-A | | | 6,855 | | | | 673 | | | | 80 | | | | 8 | | | | (590 | ) | | | (58 | ) | | | 6,345 | | | | 623 | |
| Class 529-B | | | 573 | | | | 56 | | | | 3 | | | | 1 | | | | (134 | ) | | | (13 | ) | | | 442 | | | | 44 | |
| Class 529-C | | | 8,134 | | | | 796 | | | | 23 | | | | 2 | | | | (770 | ) | | | (75 | ) | | | 7,387 | | | | 723 | |
| Class 529-E | | | 517 | | | | 51 | | | | 5 | | | | 1 | | | | (60 | ) | | | (6 | ) | | | 462 | | | | 46 | |
| Class 529-F-1 | | | 864 | | | | 85 | | | | 17 | | | | 2 | | | | (109 | ) | | | (11 | ) | | | 772 | | | | 76 | |
| Class R-1 | | | 589 | | | | 57 | | | | 50 | | | | 5 | | | | (1,420 | ) | | | (139 | ) | | | (781 | ) | | | (77 | ) |
| Class R-2 | | | 1,901 | | | | 187 | | | | 14 | | | | 1 | | | | (537 | ) | | | (53 | ) | | | 1,378 | | | | 135 | |
| Class R-3 | | | 1,406 | | | | 138 | | | | 13 | | | | 2 | | | | (231 | ) | | | (23 | ) | | | 1,188 | | | | 117 | |
| Class R-4 | | | 890 | | | | 87 | | | | 9 | | | | 1 | | | | (144 | ) | | | (14 | ) | | | 755 | | | | 74 | |
| Class R-5 | | | 8,710 | | | | 853 | | | | 107 | | | | 11 | | | | (2,010 | ) | | | (198 | ) | | | 6,807 | | | | 666 | |
| Class R-6 | | | 42,545 | | | | 4,176 | | | | 7,161 | | | | 705 | | | | (18,337 | ) | | | (1,798 | ) | | | 31,369 | | | | 3,083 | |
| Total net increase (decrease) | | $ | 324,155 | | | | 31,825 | | | $ | 11,805 | | | | 1,164 | | | $ | (90,865 | ) | | | (8,919 | ) | | $ | 245,095 | | | | 24,070 | |
* Includes exchanges between share classes of the fund.
9. Investment transactions
The fund made purchases and sales of investment securities, excluding short-term securities and U.S. government obligations, if any, of $4,426,649,000 and $4,270,008,000, respectively, during the year ended August 31, 2013.
10. Ownership concentration
At August 31, 2013, the fund had three shareholders, American Funds 2020 Target Date Retirement Fund, American Funds 2015 Target Date Retirement Fund and American Funds 2010 Target Date Retirement Fund, with aggregate ownership of the fund’s outstanding shares of 18%, 11% and 13%, respectively. CRMC is the investment adviser to the three target date retirement funds.
| American Funds Mortgage Fund | 15 |
Financial highlights
| | | | | (Loss) income from
investment operations1 | | | Dividends and distributions | | | | | | | | | | | | | | | | | |
| | | Net asset
value,
beginning
of period | | Net
investment
(loss)
income | | | Net (losses)
gains on
securities
(both
realized and
unrealized) | | | Total from
investment
operations | | | Dividends
(from net
investment
income) | | | Distributions
(from capital
gains) | | | Total
dividends
and
distributions | | | Net asset
value, end
of period | | Total
return2,3 | | | Net assets,
end of period
(in thousands) | | Ratio of
expenses to
average net
assets before
reimbursements | | | Ratio of
expenses to
average net
assets after
reimbursements3 | | | Ratio of
net (loss)
income
to average
net assets3 | |
| Class A: | | | | | | | | | | | | | | | | | | | | | | | | | | | | | | | | | | | | | | | | | | | | | | | | | |
| Year ended 8/31/2013 | | $ | 10.30 | | $ | (.02 | ) | | $ | (.24 | ) | | $ | (.26 | ) | | $ | (.07 | ) | | $ | (.13 | ) | | $ | (.20 | ) | | $ | 9.84 | | | (2.54 | )% | | $ | 173,651 | | | .64 | % | | | .64 | % | | | (.18 | )% |
| Year ended 8/31/2012 | | | 10.16 | | | .05 | | | | .34 | | | | .39 | | | | (.14 | ) | | | (.11 | ) | | | (.25 | ) | | | 10.30 | | | 3.90 | | | | 198,417 | | | .65 | | | | .65 | | | | .49 | |
Period from 11/1/20104
ended 8/31/20115 | | | 10.00 | | | .18 | | | | .15 | | | | .33 | | | | (.17 | ) | | | — | | | | (.17 | ) | | | 10.16 | | | 3.40 | | | | 87,631 | | | .73 | 6 | | | .66 | 6 | | | 2.21 | 6 |
| Class B: | | | | | | | | | | | | | | | | | | | | | | | | | | | | | | | | | | | | | | | | | | | | | | | | | |
| Year ended 8/31/2013 | | | 10.30 | | | (.10 | ) | | | (.23 | ) | | | (.33 | ) | | | (.01 | ) | | | (.13 | ) | | | (.14 | ) | | | 9.83 | | | (3.28 | ) | | | 859 | | | 1.44 | | | | 1.44 | | | | (1.01 | ) |
| Year ended 8/31/2012 | | | 10.16 | | | (.04 | ) | | | .34 | | | | .30 | | | | (.05 | ) | | | (.11 | ) | | | (.16 | ) | | | 10.30 | | | 3.07 | | | | 1,500 | | | 1.45 | | | | 1.45 | | | | (.28 | ) |
Period from 11/1/20104
ended 8/31/20115 | | | 10.00 | | | .13 | | | | .15 | | | | .28 | | | | (.12 | ) | | | — | | | | (.12 | ) | | | 10.16 | | | 2.88 | | | | 773 | | | 1.50 | 6 | | | 1.43 | 6 | | | 1.63 | 6 |
| Class C: | | | | | | | | | | | | | | | | | | | | | | | | | | | | | | | | | | | | | | | | | | | | | | | | | |
| Year ended 8/31/2013 | | | 10.30 | | | (.10 | ) | | | (.23 | ) | | | (.33 | ) | | | (.01 | ) | | | (.13 | ) | | | (.14 | ) | | | 9.83 | | | (3.30 | ) | | | 24,868 | | | 1.47 | | | | 1.47 | | | | (1.03 | ) |
| Year ended 8/31/2012 | | | 10.16 | | | (.04 | ) | | | .34 | | | | .30 | | | | (.05 | ) | | | (.11 | ) | | | (.16 | ) | | | 10.30 | | | 3.03 | | | | 31,444 | | | 1.48 | | | | 1.48 | | | | (.35 | ) |
Period from 11/1/20104
ended 8/31/20115 | | | 10.00 | | | .13 | | | | .15 | | | | .28 | | | | (.12 | ) | | | — | | | | (.12 | ) | | | 10.16 | | | 2.84 | | | | 14,706 | | | 1.54 | 6 | | | 1.50 | 6 | | | 1.58 | 6 |
| Class F-1: | | | | | | | | | | | | | | | | | | | | | | | | | | | | | | | | | | | | | | | | | | | | | | | | | |
| Year ended 8/31/2013 | | | 10.30 | | | (.03 | ) | | | (.23 | ) | | | (.26 | ) | | | (.07 | ) | | | (.13 | ) | | | (.20 | ) | | | 9.84 | | | (2.59 | ) | | | 7,372 | | | .69 | | | | .69 | | | | (.25 | ) |
| Year ended 8/31/2012 | | | 10.16 | | | .04 | | | | .34 | | | | .38 | | | | (.13 | ) | | | (.11 | ) | | | (.24 | ) | | | 10.30 | | | 3.85 | | | | 11,439 | | | .68 | | | | .68 | | | | .42 | |
Period from 11/1/20104
ended 8/31/20115 | | | 10.00 | | | .18 | | | | .15 | | | | .33 | | | | (.17 | ) | | | — | | | | (.17 | ) | | | 10.16 | | | 3.37 | | | | 3,020 | | | .78 | 6 | | | .71 | 6 | | | 2.21 | 6 |
| Class F-2: | | | | | | | | | | | | | | | | | | | | | | | | | | | | | | | | | | | | | | | | | | | | | | | | | |
| Year ended 8/31/2013 | | | 10.30 | | | (.01 | ) | | | (.22 | ) | | | (.23 | ) | | | (.09 | ) | | | (.13 | ) | | | (.22 | ) | | | 9.85 | | | (2.27 | ) | | | 8,839 | | | .45 | | | | .45 | | | | (.06 | ) |
| Year ended 8/31/2012 | | | 10.16 | | | .07 | | | | .34 | | | | .41 | | | | (.16 | ) | | | (.11 | ) | | | (.27 | ) | | | 10.30 | | | 4.10 | | | | 57,707 | | | .45 | | | | .45 | | | | .66 | |
Period from 11/1/20104
ended 8/31/20115 | | | 10.00 | | | .20 | | | | .15 | | | | .35 | | | | (.19 | ) | | | — | | | | (.19 | ) | | | 10.16 | | | 3.57 | | | | 1,741 | | | .54 | 6 | | | .46 | 6 | | | 2.37 | 6 |
| Class 529-A: | | | | | | | | | | | | | | | | | | | | | | | | | | | | | | | | | | | | | | | | | | | | | | | | | |
| Year ended 8/31/2013 | | | 10.30 | | | (.03 | ) | | | (.23 | ) | | | (.26 | ) | | | (.07 | ) | | | (.13 | ) | | | (.20 | ) | | | 9.84 | | | (2.63 | ) | | | 11,317 | | | .74 | | | | .74 | | | | (.26 | ) |
| Year ended 8/31/2012 | | | 10.16 | | | .04 | | | | .34 | | | | .38 | | | | (.13 | ) | | | (.11 | ) | | | (.24 | ) | | | 10.30 | | | 3.80 | | | | 7,758 | | | .74 | | | | .74 | | | | .32 | |
Period from 11/1/20104
ended 8/31/20115 | | | 10.00 | | | .18 | | | | .15 | | | | .33 | | | | (.17 | ) | | | — | | | | (.17 | ) | | | 10.16 | | | 3.36 | | | | 1,320 | | | .77 | 6 | | | .71 | 6 | | | 2.37 | 6 |
| Class 529-B: | | | | | | | | | | | | | | | | | | | | | | | | | | | | | | | | | | | | | | | | | | | | | | | | | |
| Year ended 8/31/2013 | | | 10.30 | | | (.11 | ) | | | (.24 | ) | | | (.35 | ) | | | —7 | | | | (.13 | ) | | | (.13 | ) | | | 9.82 | | | (3.41 | ) | | | 474 | | | 1.55 | | | | 1.55 | | | | (1.10 | ) |
| Year ended 8/31/2012 | | | 10.16 | | | (.05 | ) | | | .34 | | | | .29 | | | | (.04 | ) | | | (.11 | ) | | | (.15 | ) | | | 10.30 | | | 2.96 | | | | 595 | | | 1.54 | | | | 1.54 | | | | (.51 | ) |
Period from 11/1/20104
ended 8/31/20115 | | | 10.00 | | | .13 | | | | .15 | | | | .28 | | | | (.12 | ) | | | — | | | | (.12 | ) | | | 10.16 | | | 2.79 | | | | 146 | | | 1.64 | 6 | | | 1.54 | 6 | | | 1.44 | 6 |
| Class 529-C: | | | | | | | | | | | | | | | | | | | | | | | | | | | | | | | | | | | | | | | | | | | | | | | | | |
| Year ended 8/31/2013 | | | 10.30 | | | (.11 | ) | | | (.24 | ) | | | (.35 | ) | | | —7 | | | | (.13 | ) | | | (.13 | ) | | | 9.82 | | | (3.42 | ) | | | 8,588 | | | 1.55 | | | | 1.55 | | | | (1.09 | ) |
| Year ended 8/31/2012 | | | 10.16 | | | (.05 | ) | | | .34 | | | | .29 | | | | (.04 | ) | | | (.11 | ) | | | (.15 | ) | | | 10.30 | | | 2.95 | | | | 8,038 | | | 1.52 | | | | 1.52 | | | | (.58 | ) |
Period from 11/1/20104
ended 8/31/20115 | | | 10.00 | | | .13 | | | | .15 | | | | .28 | | | | (.12 | ) | | | — | | | | (.12 | ) | | | 10.16 | | | 2.78 | | | | 581 | | | 1.63 | 6 | | | 1.57 | 6 | | | 1.53 | 6 |
| Class 529-E: | | | | | | | | | | | | | | | | | | | | | | | | | | | | | | | | | | | | | | | | | | | | | | | | | |
| Year ended 8/31/2013 | | | 10.30 | | | (.05 | ) | | | (.24 | ) | | | (.29 | ) | | | (.04 | ) | | | (.13 | ) | | | (.17 | ) | | | 9.84 | | | (2.90 | ) | | | 1,581 | | | 1.01 | | | | 1.01 | | | | (.49 | ) |
| Year ended 8/31/2012 | | | 10.16 | | | .01 | | | | .34 | | | | .35 | | | | (.10 | ) | | | (.11 | ) | | | (.21 | ) | | | 10.30 | | | 3.49 | | | | 595 | | | 1.04 | | | | 1.04 | | | | .02 | |
Period from 11/1/20104
ended 8/31/20115 | | | 10.00 | | | .16 | | | | .15 | | | | .31 | | | | (.15 | ) | | | — | | | | (.15 | ) | | | 10.16 | | | 3.13 | | | | 125 | | | 1.12 | 6 | | | 1.05 | 6 | | | 2.04 | 6 |
| 16 | American Funds Mortgage Fund |
| | | | | (Loss) income from
investment operations1 | | | Dividends and distributions | | | | | | | | | | | | | | | | | |
| | | Net asset
value,
beginning
of period | | Net
investment
(loss)
income | | | Net (losses)
gains on
securities
(both
realized and
unrealized) | | | Total from
investment
operations | | | Dividends
(from net
investment
income) | | | Distributions
(from capital
gains) | | | Total
dividends
and
distributions | | | Net asset
value, end
of period | | Total
return3 | | | Net assets,
end of period
(in thousands) | | Ratio of
expenses to
average net
assets before
reimbursements | | | Ratio of
expenses to
average net
assets after
reimbursements3 | | | Ratio of
net (loss)
income
to average
net assets3 | |
| Class 529-F-1: | | | | | | | | | | | | | | | | | | | | | | | | | | | | | | | | | | | | | | | | | | | | | | | | | |
| Year ended 8/31/2013 | | $ | 10.30 | | $ | — | 7 | | $ | (.25 | ) | | $ | (.25 | ) | | $ | (.08 | ) | | $ | (.13 | ) | | $ | (.21 | ) | | $ | 9.84 | | | (2.45 | )% | | $ | 3,596 | | | .54 | % | | | .54 | % | | | (.04 | )% |
| Year ended 8/31/2012 | | | 10.16 | | | .05 | | | | .34 | | | | .39 | | | | (.14 | ) | | | (.11 | ) | | | (.25 | ) | | | 10.30 | | | 3.99 | | | | 1,121 | | | .56 | | | | .56 | | | | .53 | |
Period from 11/1/20104
ended 8/31/20115 | | | 10.00 | | | .19 | | | | .15 | | | | .34 | | | | (.18 | ) | | | — | | | | (.18 | ) | | | 10.16 | | | 3.49 | | | | 333 | | | .62 | 6 | | | .57 | 6 | | | 2.43 | 6 |
| Class R-1: | | | | | | | | | | | | | | | | | | | | | | | | | | | | | | | | | | | | | | | | | | | | | | | | | |
| Year ended 8/31/2013 | | | 10.30 | | | (.06 | ) | | | (.22 | ) | | | (.28 | ) | | | (.05 | ) | | | (.13 | ) | | | (.18 | ) | | | 9.84 | | | (2.73 | ) | | | 946 | | | .98 | | | | .98 | | | | (.59 | ) |
| Year ended 8/31/2012 | | | 10.16 | | | (.02 | ) | | | .34 | | | | .32 | | | | (.07 | ) | | | (.11 | ) | | | (.18 | ) | | | 10.30 | | | 3.20 | | | | 2,629 | | | 1.33 | | | | 1.33 | | | | (.12 | ) |
Period from 11/1/20104
ended 8/31/20115 | | | 10.00 | | | .13 | | | | .15 | | | | .28 | | | | (.12 | ) | | | — | | | | (.12 | ) | | | 10.16 | | | 2.87 | | | | 3,371 | | | 1.43 | 6 | | | 1.32 | 6 | | | 1.36 | 6 |
| Class R-2: | | | | | | | | | | | | | | | | | | | | | | | | | | | | | | | | | | | | | | | | | | | | | | | | | |
| Year ended 8/31/2013 | | | 10.30 | | | (.08 | ) | | | (.23 | ) | | | (.31 | ) | | | (.03 | ) | | | (.13 | ) | | | (.16 | ) | | | 9.83 | | | (3.10 | ) | | | 2,283 | | | 1.21 | | | | 1.21 | | | | (.75 | ) |
| Year ended 8/31/2012 | | | 10.16 | | | (.02 | ) | | | .34 | | | | .32 | | | | (.07 | ) | | | (.11 | ) | | | (.18 | ) | | | 10.30 | | | 3.26 | | | | 2,316 | | | 1.27 | | | | 1.27 | | | | (.14 | ) |
Period from 11/1/20104
ended 8/31/20115 | | | 10.00 | | | .14 | | | | .15 | | | | .29 | | | | (.13 | ) | | | — | | | | (.13 | ) | | | 10.16 | | | 2.95 | | | | 913 | | | 1.32 | 6 | | | 1.18 | 6 | | | 1.48 | 6 |
| Class R-3: | | | | | | | | | | | | | | | | | | | | | | | | | | | | | | | | | | | | | | | | | | | | | | | | | |
| Year ended 8/31/2013 | | | 10.30 | | | (.03 | ) | | | (.24 | ) | | | (.27 | ) | | | (.06 | ) | | | (.13 | ) | | | (.19 | ) | | | 9.84 | | | (2.67 | ) | | | 2,200 | | | .80 | | | | .80 | | | | (.34 | ) |
| Year ended 8/31/2012 | | | 10.16 | | | .02 | | | | .34 | | | | .36 | | | | (.11 | ) | | | (.11 | ) | | | (.22 | ) | | | 10.30 | | | 3.63 | | | | 2,097 | | | .89 | | | | .89 | | | | .23 | |
Period from 11/1/20104
ended 8/31/20115 | | | 10.00 | | | .16 | | | | .15 | | | | .31 | | | | (.15 | ) | | | — | | | | (.15 | ) | | | 10.16 | | | 3.18 | | | | 885 | | | 1.03 | 6 | | | .92 | 6 | | | 1.76 | 6 |
| Class R-4: | | | | | | | | | | | | | | | | | | | | | | | | | | | | | | | | | | | | | | | | | | | | | | | | | |
| Year ended 8/31/2013 | | | 10.30 | | | (.01 | ) | | | (.24 | ) | | | (.25 | ) | | | (.08 | ) | | | (.13 | ) | | | (.21 | ) | | | 9.84 | | | (2.50 | ) | | | 1,637 | | | .60 | | | | .60 | | | | (.13 | ) |
| Year ended 8/31/2012 | | | 10.16 | | | .05 | | | | .34 | | | | .39 | | | | (.14 | ) | | | (.11 | ) | | | (.25 | ) | | | 10.30 | | | 3.91 | | | | 1,437 | | | .62 | | | | .62 | | | | .51 | |
Period from 11/1/20104
ended 8/31/20115 | | | 10.00 | | | .18 | | | | .15 | | | | .33 | | | | (.17 | ) | | | — | | | | (.17 | ) | | | 10.16 | | | 3.37 | | | | 665 | | | .77 | 6 | | | .69 | 6 | | | 1.93 | 6 |
| Class R-5: | | | | | | | | | | | | | | | | | | | | | | | | | | | | | | | | | | | | | | | | | | | | | | | | | |
| Year ended 8/31/2013 | | | 10.30 | | | — | 7 | | | (.23 | ) | | | (.23 | ) | | | (.10 | ) | | | (.13 | ) | | | (.23 | ) | | | 9.84 | | | (2.29 | ) | | | 5,079 | | | .38 | | | | .38 | | | | .05 | |
| Year ended 8/31/2012 | | | 10.16 | | | .07 | | | | .34 | | | | .41 | | | | (.16 | ) | | | (.11 | ) | | | (.27 | ) | | | 10.30 | | | 4.14 | | | | 9,114 | | | .39 | | | | .39 | | | | .70 | |
Period from 11/1/20104
ended 8/31/20115 | | | 10.00 | | | .20 | | | | .15 | | | | .35 | | | | (.19 | ) | | | — | | | | (.19 | ) | | | 10.16 | | | 3.58 | | | | 2,220 | | | .49 | 6 | | | .44 | 6 | | | 2.40 | 6 |
| Class R-6: | | | | | | | | | | | | | | | | | | | | | | | | | | | | | | | | | | | | | | | | | | | | | | | | | |
| Year ended 8/31/2013 | | | 10.30 | | | .02 | | | | (.25 | ) | | | (.23 | ) | | | (.10 | ) | | | (.13 | ) | | | (.23 | ) | | | 9.84 | | | (2.25 | ) | | | 541,422 | | | .32 | | | | .32 | | | | .18 | |
| Year ended 8/31/2012 | | | 10.16 | | | .07 | | | | .34 | | | | .41 | | | | (.16 | ) | | | (.11 | ) | | | (.27 | ) | | | 10.30 | | | 4.19 | | | | 291,410 | | | .37 | | | | .37 | | | | .82 | |
Period from 11/1/20104
ended 8/31/20115 | | | 10.00 | | | .20 | | | | .15 | | | | .35 | | | | (.19 | ) | | | — | | | | (.19 | ) | | | 10.16 | | | 3.61 | | | | 256,098 | | | .51 | 6 | | | .41 | 6 | | | 2.55 | 6 |
| | | Year ended August 31 | | Period ended |
| | | 2013 | | 2012 | | 11/1/20104 to 8/31/20115 |
| Portfolio turnover rate for all share classes | | | 658 | % | | | 442 | % | | | 240 | % |
| 1 | Based on average shares outstanding. |
| 2 | Total returns exclude any applicable sales charges, including contingent deferred sales charges. |
| 3 | This column reflects the impact, if any, of certain reimbursements from CRMC. During one of the periods shown, CRMC reimbursed other fees and expenses. |
| 4 | Commencement of operations. |
| 5 | Based on operations for the period shown and, accordingly, is not representative of a full year. |
| 6 | Annualized. |
| 7 | Amount less than $.01. |
See Notes to Financial Statements
| American Funds Mortgage Fund | 17 |
Report of Independent Registered Public Accounting Firm
To the Board of Trustees and Shareholders of American Funds Mortgage Fund
In our opinion, the accompanying statement of assets and liabilities, including the summary investment portfolio, and the related statements of operations and of changes in net assets and the financial highlights present fairly, in all material respects, the financial position of American Funds Mortgage Fund (the “Fund”) at August 31, 2013, the results of its operations for the year then ended, the changes in its net assets for each of the two years in the period then ended and the financial highlights for each of the periods presented, in conformity with accounting principles generally accepted in the United States of America. These financial statements and financial highlights (hereafter referred to as “financial statements”) are the responsibility of the Fund’s management. Our responsibility is to express an opinion on these financial statements based on our audits. We conducted our audits of these financial statements in accordance with the standards of the Public Company Accounting Oversight Board (United States). Those standards require that we plan and perform the audit to obtain reasonable assurance about whether the financial statements are free of material misstatement. An audit includes examining, on a test basis, evidence supporting the amounts and disclosures in the financial statements, assessing the accounting principles used and significant estimates made by management, and evaluating the overall financial statement presentation. We believe that our audits, which included confirmation of securities at August 31, 2013 by correspondence with the custodian and brokers, provide a reasonable basis for our opinion.
PricewaterhouseCoopers LLP
Los Angeles, California
October 15, 2013
| 18 | American Funds Mortgage Fund |
As a fund shareholder, you incur two types of costs: (1) transaction costs, such as initial sales charges on purchase payments and contingent deferred sales charges on redemptions (loads), and (2) ongoing costs, including management fees, distribution and service (12b-1) fees, and other expenses. This example is intended to help you understand your ongoing costs (in dollars) of investing in the fund so you can compare these costs with the ongoing costs of investing in other mutual funds. The example is based on an investment of $1,000 invested at the beginning of the period and held for the entire six-month period (March 1, 2013, through August 31, 2013).
Actual expenses:
The first line of each share class in the table on the following page provides information about actual account values and actual expenses. You may use the information in this line, together with the amount you invested, to estimate the expenses that you paid over the period. Simply divide your account value by $1,000 (for example, an $8,600 account value divided by $1,000 = 8.6), then multiply the result by the number in the first line under the heading entitled “Expenses paid during period” to estimate the expenses you paid on your account during this period.
Hypothetical example for comparison purposes:
The second line of each share class in the table on the following page provides information about hypothetical account values and hypothetical expenses based on the actual expense ratio for the share class and an assumed rate of return of 5.00% per year before expenses, which is not the actual return of the share class. The hypothetical account values and expenses may not be used to estimate the actual ending account balance or expenses you paid for the period. You may use this information to compare the ongoing costs of investing in the fund and other funds. To do so, compare this 5.00% hypothetical example with the 5.00% hypothetical examples that appear in the shareholder reports of the other funds.
Notes:
There are some account fees that are charged to certain types of accounts, such as individual retirement accounts and 529 college savings plan accounts (generally, a $10 fee is charged to set up the account and an additional $10 fee is charged to the account annually), that would increase the amount of expenses paid on your account. In addition, retirement plan participants may be subject to certain fees charged by the plan sponsor, and Class F-1, F-2 and 529-F-1 shareholders may be subject to fees charged by financial intermediaries, typically ranging from 0.75% to 1.50% of assets annually depending on services offered. You can estimate the impact of these fees by adding the amount of the fees to the total estimated expenses you paid on your account during the period as calculated above. In addition, your ending account value would be lower by the amount of these fees.
Note that the expenses shown in the table on the following page are meant to highlight your ongoing costs only and do not reflect any transactional costs, such as sales charges (loads). Therefore, the second line of each share class in the table is useful in comparing ongoing costs only and will not help you determine the relative total costs of owning different funds. In addition, if these transactional costs were included, your costs would have been higher.
| American Funds Mortgage Fund | 19 |
| | | | | | | | | | | | | |
| | | Beginning
account value
3/1/2013 | | | Ending
account value
8/31/2013 | | | Expenses paid
during period* | | | Annualized
expense ratio | |
| Class A — actual return | | $ | 1,000.00 | | | $ | 975.05 | | | $ | 3.04 | | | | .61 | % |
| Class A — assumed 5% return | | | 1,000.00 | | | | 1,022.13 | | | | 3.11 | | | | .61 | |
| Class B — actual return | | | 1,000.00 | | | | 970.68 | | | | 7.20 | | | | 1.45 | |
| Class B — assumed 5% return | | | 1,000.00 | | | | 1,017.90 | | | | 7.38 | | | | 1.45 | |
| Class C — actual return | | | 1,000.00 | | | | 970.60 | | | | 7.30 | | | | 1.47 | |
| Class C — assumed 5% return | | | 1,000.00 | | | | 1,017.80 | | | | 7.48 | | | | 1.47 | |
| Class F-1 — actual return | | | 1,000.00 | | | | 974.76 | | | | 3.38 | | | | .68 | |
| Class F-1 — assumed 5% return | | | 1,000.00 | | | | 1,021.78 | | | | 3.47 | | | | .68 | |
| Class F-2 — actual return | | | 1,000.00 | | | | 976.79 | | | | 2.34 | | | | .47 | |
| Class F-2 — assumed 5% return | | | 1,000.00 | | | | 1,022.84 | | | | 2.40 | | | | .47 | |
| Class 529-A — actual return | | | 1,000.00 | | | | 974.54 | | | | 3.58 | | | | .72 | |
| Class 529-A — assumed 5% return | | | 1,000.00 | | | | 1,021.58 | | | | 3.67 | | | | .72 | |
| Class 529-B — actual return | | | 1,000.00 | | | | 969.56 | | | | 7.65 | | | | 1.54 | |
| Class 529-B — assumed 5% return | | | 1,000.00 | | | | 1,017.44 | | | | 7.83 | | | | 1.54 | |
| Class 529-C — actual return | | | 1,000.00 | | | | 969.54 | | | | 7.65 | | | | 1.54 | |
| Class 529-C — assumed 5% return | | | 1,000.00 | | | | 1,017.44 | | | | 7.83 | | | | 1.54 | |
| Class 529-E — actual return | | | 1,000.00 | | | | 973.21 | | | | 4.97 | | | | 1.00 | |
| Class 529-E — assumed 5% return | | | 1,000.00 | | | | 1,020.16 | | | | 5.09 | | | | 1.00 | |
| Class 529-F-1 — actual return | | | 1,000.00 | | | | 975.49 | | | | 2.64 | | | | .53 | |
| Class 529-F-1 — assumed 5% return | | | 1,000.00 | | | | 1,022.53 | | | | 2.70 | | | | .53 | |
| Class R-1 — actual return | | | 1,000.00 | | | | 975.57 | | | | 2.64 | | | | .53 | |
| Class R-1 — assumed 5% return | | | 1,000.00 | | | | 1,022.53 | | | | 2.70 | | | | .53 | |
| Class R-2 — actual return | | | 1,000.00 | | | | 971.90 | | | | 5.67 | | | | 1.14 | |
| Class R-2 — assumed 5% return | | | 1,000.00 | | | | 1,019.46 | | | | 5.80 | | | | 1.14 | |
| Class R-3 — actual return | | | 1,000.00 | | | | 974.50 | | | | 3.83 | | | | .77 | |
| Class R-3 — assumed 5% return | | | 1,000.00 | | | | 1,021.32 | | | | 3.92 | | | | .77 | |
| Class R-4 — actual return | | | 1,000.00 | | | | 975.37 | | | | 2.84 | | | | .57 | |
| Class R-4 — assumed 5% return | | | 1,000.00 | | | | 1,022.33 | | | | 2.91 | | | | .57 | |
| Class R-5 — actual return | | | 1,000.00 | | | | 976.28 | | | | 1.79 | | | | .36 | |
| Class R-5 — assumed 5% return | | | 1,000.00 | | | | 1,023.39 | | | | 1.84 | | | | .36 | |
| Class R-6 — actual return | | | 1,000.00 | | | | 976.51 | | | | 1.49 | | | | .30 | |
| Class R-6 — assumed 5% return | | | 1,000.00 | | | | 1,023.69 | | | | 1.53 | | | | .30 | |
| * | The “expenses paid during period” are equal to the “annualized expense ratio,” multiplied by the average account value over the period, multiplied by the number of days in the period, and divided by 365 (to reflect the one-half year period). |
We are required to advise you of the federal tax status of certain distributions received by shareholders during the fiscal year. The fund hereby designates the following amounts for the fund’s fiscal year ended August 31, 2013:
| Long-term capital gains | | $ | 3,532,000 |
| U.S. government income that may be exempt from state taxation | | $ | 264,000 |
Individual shareholders should refer to their Form 1099 or other tax information, which will be mailed in January 2014, to determine the calendar year amounts to be included on their 2013 tax returns. Shareholders should consult their tax advisors.
| 20 | American Funds Mortgage Fund |
Approval of Investment Advisory and Service Agreement
The fund’s board has approved the fund’s Investment Advisory and Service Agreement (the “agreement”) with Capital Research and Management Company (“CRMC”) for an additional one-year term through March 31, 2014. The board approved the agreement following the recommendation of the fund’s Contracts Committee (the “committee”), which is composed of all of the fund’s independent board members. The board and the committee determined that the fund’s advisory fee structure was fair and reasonable in relation to the services provided and that approving the agreement was in the best interests of the fund and its shareholders.
In reaching this decision, the board and the committee took into account information furnished to them throughout the year, as well as information prepared specifically in connection with their review of the agreement, and were advised by their independent counsel. They considered the following factors, among others, but did not identify any single issue or particular piece of information that, in isolation, was the controlling factor, and each board and committee member did not necessarily attribute the same weight to each factor.
1. Nature, extent and quality of services
The board and the committee considered the depth and quality of CRMC’s investment management process, including its global research capabilities; the experience, capability and integrity of its senior management and other personnel; the low turnover rates of its key personnel; the overall financial strength and stability of its organization; and the ongoing evolution of CRMC’s organizational structure designed to maintain and strengthen these qualities. The board and the committee also considered the nature, extent and quality of administrative, compliance and shareholder services provided by CRMC to the fund under the agreement and other agreements, as well as the benefits to fund shareholders from investing in a fund that is part of a large family of funds. The board and the committee concluded that the nature, extent and quality of the services provided by CRMC have benefited and should continue to benefit the fund and its shareholders.
2. Investment results
The board and the committee considered the investment results of the fund in light of its objective of providing current income and preservation of capital. They compared the fund’s investment results with those of other relevant funds (including funds that form the basis of the Lipper index for the category in which the fund is included), and a relevant market index, over various periods through October 31, 2012. This report, including the letter to shareholders and related disclosures, contains certain information about the fund’s investment results. Among other things, the board and the committee reviewed the fund’s investment results measured against the Lipper U.S. Mortgage Funds Average and the Barclays U.S. Mortgage Backed Securities Index. They noted the fund’s short history and that the investment results of the fund were above the results of the Barclays index for the one-year period, but slightly below those of the Barclays index for the 10-month period. The board and the committee further noted the fund’s short lifetime results were below those of the Barclays index lifetime period and below the results of the Lipper average for the 10-month, one-year and lifetime periods. They also noted that the Lipper category included funds with a broad range of mandates including those that allowed certain funds to invest in instruments and areas that may provide more volatility than that of the fund. The board and the committee concluded that the fund’s investment results have been satisfactory and that CRMC’s record in managing the fund indicated that its continued management should benefit the fund and its shareholders.
3. Advisory fees and total expenses
The board and the committee compared the advisory fees and total expense levels of the fund to those of other relevant funds. They observed that the fund’s advisory fees and expenses were below the median fees and expenses of the other funds included in the Lipper U.S. Mortgage Funds category. The board and the committee also considered the breakpoint discounts in the fund’s advisory fee structure that reduce the level of fees charged by CRMC to the fund as fund assets increase. In addition, they reviewed information regarding the effective advisory fees charged to non–mutual fund
| American Funds Mortgage Fund | 21 |
clients by CRMC and its affiliates. They noted that, to the extent there were differences between the advisory fees paid by the fund and the advisory fees paid by those clients, the differences appropriately reflected the investment, operational and regulatory differences between advising the fund and the other clients. The board and the committee concluded that the fund’s cost structure was fair and reasonable in relation to the services provided, and that the fund’s shareholders receive reasonable value in return for the advisory fees and other amounts paid to CRMC by the fund.
4. Ancillary benefits
The board and the committee considered a variety of other benefits that CRMC and its affiliates receive as a result of CRMC’s relationship with the fund and the other American Funds, including fees for administrative services provided to certain share classes; fees paid to CRMC’s affiliated transfer agent; sales charges and distribution fees received and retained by the fund’s principal underwriter, an affiliate of CRMC; and possible ancillary benefits to CRMC and its institutional management affiliates in managing other investment vehicles. The board and the committee reviewed CRMC’s portfolio trading practices, noting that while CRMC receives the benefit of research provided by broker-dealers executing portfolio transactions on behalf of the fund, it does not obtain third-party research or other services in return for allocating brokerage to such broker-dealers. The board and the committee took these ancillary benefits into account in evaluating the reasonableness of the advisory fees and other amounts paid to CRMC by the fund.
5. Adviser financial information
The board and the committee reviewed information regarding CRMC’s costs of providing services to the American Funds, including personnel, systems and resources of investment, compliance, trading, accounting and other administrative operations. They considered CRMC’s costs and willingness to invest in technology, infrastructure and staff to maintain and expand services and capabilities, respond to industry and regulatory developments, and attract and retain qualified personnel. They noted information regarding the compensation structure for CRMC’s investment professionals. The board and the committee also compared CRMC’s profitability and compensation data to the reported results and data of several large, publicly-held investment management companies. The board and the committee noted the competitiveness and cyclicality of both the mutual fund industry and the capital markets, and the importance in that environment of CRMC’s long-term profitability for maintaining its independence, company culture and management continuity. They further considered the breakpoint discounts in the fund’s advisory fee structure. The board and the committee concluded that the fund’s advisory fee structure reflected a reasonable sharing of benefits between CRMC and the fund’s shareholders.
| 22 | American Funds Mortgage Fund |
Board of trustees and other officers
“Independent” trustees1
| Name and age | | Year first
elected
a trustee
of the fund2 | | Principal occupation(s) during past five years | | Number of
portfolios in fund
complex3 overseen
by trustee | | Other directorships4
held by trustee |
| | | | | | | | | |
| William H. Baribault, 68 | | 2010 | | Chairman of the Board and CEO, Oakwood Enterprises (private investment and consulting) | | 69 | | None |
| James G. Ellis, 66 | | 2010 | | Dean and Professor of Marketing, Marshall School of Business, University of Southern California | | 69 | | Quiksilver, Inc. |
| Leonard R. Fuller, 67 | | 2010 | | President and CEO, Fuller Consulting (financial management consulting firm) | | 69 | | None |
| W. Scott Hedrick, 68 | | 2010 | | Founding General Partner, InterWest Partners (venture capital firm) | | 65 | | Hot Topic, Inc.; Office Depot, Inc. |
R. Clark Hooper, 67
Chairman of the Board (Independent and Non-Executive) | | 2010 | | Private investor | | 71 | | JPMorgan Value Opportunities Fund, Inc.; The Swiss Helvetia Fund, Inc. |
| Merit E. Janow, 55 | | 2010 | | Dean and Professor, Columbia University, School of International and Public Affairs; former Member, World Trade Organization Appellate Body (2003–2007) | | 68 | | The NASDAQ Stock Market LLC; Trimble Navigation Limited |
| Laurel B. Mitchell, Ph.D., 58 | | 2010 | | Clinical Professor and Director, Accounting Program, University of Redlands | | 65 | | None |
| Frank M. Sanchez, 70 | | 2010 | | Principal, The Sanchez Family Corporation dba McDonald’s Restaurants (McDonald’s licensee) | | 65 | | None |
| Margaret Spellings, 55 | | 2010 | | President, George W. Bush Foundation; former President and CEO, Margaret Spellings & Company (public policy and strategic consulting); former President, U. S. Chamber Foundation and Senior Advisor to the President and CEO, U.S. Chamber of Commerce; former U. S. Secretary of Education, U. S. Department of Education | | 69 | | None |
| Steadman Upham, Ph.D., 64 | | 2010 | | President and University Professor, The University of Tulsa | | 68 | | None |
“Interested” trustee5,6
Name, age and
position with fund | | Year first
elected
a trustee
or officer
of the fund2 | | Principal occupation(s) during past five years and
positions held with affiliated entities or the principal
underwriter of the fund | | Number of
portfolios in fund
complex3 overseen
by trustee | | Other directorships4
held by trustee |
| | | | | | | | | |
John H. Smet, 57
President | | 2010 | | Director, Capital Research and Management Company; Senior Vice President — Capital Fixed Income Investors, Capital Research and Management Company; Director, The Capital Group Companies, Inc.7 | | 20 | | None |
The fund’s statement of additional information includes further details about fund trustees and is available without charge upon request by calling American Funds Service Company at (800) 421-4225 or by visiting the American Funds website at americanfunds.com. The address for all trustees and officers of the fund is 333 South Hope Street, Los Angeles, CA 90071, Attention: Secretary.
See page 24 for footnotes.
| American Funds Mortgage Fund | 23 |
Other officers6
Name, age and
position with fund | | Year first
elected
an officer
of the fund2 | | Principal occupation(s) during past five years and positions held with affiliated entities
or the principal underwriter of the fund |
| | | | | |
Fergus N. MacDonald, 43
Senior Vice President | | 2010 | | Senior Vice President — Capital Fixed Income Investors, Capital Research Company;7 Director, Capital International Research, Inc.7 |
Kristine M. Nishiyama, 43
Senior Vice President | | 2010 | | Senior Vice President and Senior Counsel — Fund Business Management Group, Capital Research and Management Company; Senior Vice President and General Counsel, Capital Bank and Trust Company7 |
Wesley K.-S. Phoa, 47
Senior Vice President | | 2010 | | Senior Vice President — Capital Fixed Income Investors, Capital Research Company;7 Senior Vice President — Capital Fixed Income Investors, Capital International Research, Inc.;7 Vice President, Capital Strategy Research, Inc.;7 Senior Vice President — Capital Fixed Income Investors, Capital Bank and Trust Company7 |
Courtney R. Taylor, 38
Secretary | | 2010 | | Assistant Vice President — Fund Business Management Group, Capital Research and Management Company |
Brian C. Janssen, 41
Treasurer | | 2012 | | Vice President — Fund Business Management Group, Capital Research and Management Company |
Steven I. Koszalka, 49
Assistant Secretary | | 2010 | | Vice President — Fund Business Management Group, Capital Research and Management Company |
Karl C. Grauman, 45
Assistant Treasurer | | 2010 | | Vice President — Fund Business Management Group, Capital Research and Management Company |
Dori Laskin, 62
Assistant Treasurer | | 2010 | | Vice President — Fund Business Management Group, Capital Research and Management Company |
| 1 | The term “independent” trustee refers to a trustee who is not an “interested person” of the fund within the meaning of the Investment Company Act of 1940. |
| 2 | Trustees and officers of the fund serve until their resignation, removal or retirement. |
| 3 | Reflects funds managed by Capital Research and Management Company, including the American Funds; American Funds Insurance Series,® which serves as the underlying investment vehicle for certain variable insurance contracts; American Funds Target Date Retirement Series,® which is available through tax-favored retirement plans and IRAs; American Funds Portfolio Series;SM and American Funds College Target Date Series.SM |
| 4 | This includes all directorships (other than those in the American Funds or other funds managed by Capital Research and Management Company) that are held by each trustee as a trustee or director of a public company or a registered investment company. |
| 5 | “Interested persons” within the meaning of the Investment Company Act of 1940, on the basis of their affiliation with the fund’s investment adviser, Capital Research and Management Company, or affiliated entities (including the fund’s principal underwriter). |
| 6 | All of the officers listed are officers and/or directors/trustees of one or more of the other funds for which Capital Research and Management Company serves as investment adviser. |
| 7 | Company affiliated with Capital Research and Management Company. |
| 24 | American Funds Mortgage Fund |
Office of the fund
One Market
Steuart Tower, Suite 2000
San Francisco, CA 94105-1409
Investment adviser
Capital Research and Management Company
333 South Hope Street
Los Angeles, CA 90071-1406
6455 Irvine Center Drive
Irvine, CA 92618
Transfer agent for shareholder accounts
American Funds Service Company
(Write to the address near you.)
P.O. Box 6007
Indianapolis, IN 46206-6007
P.O. Box 2280
Norfolk, VA 23501-2280
Custodian of assets
Bank of New York Mellon
One Wall Street
New York, NY 10286
Counsel
Bingham McCutchen LLP
355 South Grand Avenue, Suite 4400
Los Angeles, CA 90071-3106
Independent registered public accounting firm
PricewaterhouseCoopers LLP
601 South Figueroa Street
Los Angeles, CA 90017-3874
Principal underwriter
American Funds Distributors, Inc.
333 South Hope Street
Los Angeles, CA 90071-1406
Investors should carefully consider investment objectives, risks, charges and expenses. This and other important information is contained in the fund prospectus and summary prospectus, which can be obtained from your financial professional and should be read carefully before investing. You may also call American Funds Service Company (AFS) at (800) 421-4225 or visit the American Funds website at americanfunds.com.
“American Funds Proxy Voting Procedures and Principles” — which describes how we vote proxies relating to portfolio securities — is available on the American Funds website or upon request by calling AFS. The fund files its proxy voting record with the U.S. Securities and Exchange Commission (SEC) for the 12 months ended June 30 by August 31. The proxy voting record is available free of charge on the SEC website at sec.gov and on the American Funds website.
A complete August 31, 2013, portfolio of American Funds Mortgage Fund’s investments is available free of charge by calling AFS or visiting the SEC website (where it is part of Form N-CSR).
American Funds Mortgage Fund files a complete list of its portfolio holdings with the SEC for the first and third quarters of each fiscal year on Form N-Q. This filing is available free of charge on the SEC website. You may also review or, for a fee, copy this filing at the SEC’s Public Reference Room in Washington, D.C. Additional information regarding the operation of the Public Reference Room may be obtained by calling the SEC’s Office of Investor Education and Advocacy at (800) SEC-0330. Additionally, the list of portfolio holdings is available by calling AFS.
This report is for the information of shareholders of American Funds Mortgage Fund, but it also may be used as sales literature when preceded or accompanied by the current prospectus or summary prospectus, which gives details about charges, expenses, investment objectives and operating policies of the fund. If used as sales material after December 31, 2013, this report must be accompanied by an American Funds statistical update for the most recently completed calendar quarter.
The American Funds Advantage
Since 1931, American Funds, part of Capital Group, has helped investors pursue long-term investment success. Our consistent approach — in combination with The Capital SystemSM — has resulted in a superior long-term track record.
| | Aligned with investor success |
| | We base our decisions on a long-term perspective, which we believe aligns our goals with the interests of our clients. Our portfolio managers average 25 years of investment experience, including 20 years at our company, reflecting a career commitment to our long-term approach.1 |
| | |
| | The Capital SystemSM |
| | Our investment process, The Capital System, combines individual accountability with teamwork. Each fund is divided into portions that are managed independently by investment professionals with diverse backgrounds, ages and investment approaches. An extensive global research effort is the backbone of our system. |
| | |
| | Superior long-term track record |
| | Our equity funds have beaten their Lipper peer indexes in 90% of 10-year periods and 96% of 20-year periods. Our fixed-income funds have beaten their Lipper indexes in 58% of 10-year periods and 63% of 20-year periods.2 Our fund management fees have been among the lowest in the industry.3 |
| | 1 | Portfolio manager experience as of December 31, 2012. |
| | 2 | Based on Class A share results for rolling periods through December 31, 2012. Periods covered are the shorter of the fund’s lifetime or since the comparable Lipper index inception date. |
| | 3 | Based on management fees for the 20-year period ended December 31, 2012, versus comparable Lipper categories, excluding funds of funds. |

ITEM 2 – Code of Ethics
The Registrant has adopted a Code of Ethics that applies to its Principal Executive Officer and Principal Financial Officer. The Registrant undertakes to provide to any person without charge, upon request, a copy of the Code of Ethics. Such request can be made to American Funds Service Company at 800/421-9225 or to the Secretary of the Registrant, One Market, Steuart Tower, Suite 2000, San Francisco, California 94105.
ITEM 3 – Audit Committee Financial Expert
The Registrant’s board has determined that Laurel B. Mitchell, a member of the Registrant’s audit committee, is an “audit committee financial expert” and "independent," as such terms are defined in this Item. This designation will not increase the designee’s duties, obligations or liability as compared to his or her duties, obligations and liability as a member of the audit committee and of the board, nor will it reduce the responsibility of the other audit committee members. There may be other individuals who, through education or experience, would qualify as "audit committee financial experts" if the board had designated them as such. Most importantly, the board believes each member of the audit committee contributes significantly to the effective oversight of the Registrant’s financial statements and condition.
ITEM 4 – Principal Accountant Fees and Services
| | Registrant: |
| | | a) Audit Fees: |
| | | | 2012 | $36,000 |
| | | | 2013 | $48,000 |
| | | | |
| | | b) Audit-Related Fees: |
| | | | 2012 | None |
| | | | 2013 | None |
| | | | |
| | | c) Tax Fees: |
| | | | 2012 | $5,000 |
| | | | 2013 | $7,000 |
| | | | The tax fees consist of professional services relating to the preparation of the Registrant’s tax returns. |
| | | | |
| | | d) All Other Fees: |
| | | | 2012 | None |
| | | | 2013 | None |
| | | | |
| | Adviser and affiliates (includes only fees for non-audit services billed to the adviser and affiliates for engagements that relate directly to the operations and financial reporting of the Registrant and were subject to the pre-approval policies described below): |
| | | a) Audit Fees: |
| | | | Not Applicable |
| | | | |
| | | b) Audit-Related Fees: |
| | | | 2012 | None |
| | | | 2013 | None |
| | | | |
| | | c) Tax Fees: |
| | | | 2012 | $1,000 |
| | | | 2013 | $32,000 |
| | | | The tax fees consist of consulting services relating to the Registrant’s investments. |
| | | | |
| | | d) All Other Fees: |
| | | | 2012 | $2,000 |
| | | | 2013 | $2,000 |
| | | | The other fees consist of subscription services related to an accounting research tool. |
All audit and permissible non-audit services that the Registrant’s audit committee considers compatible with maintaining the independent registered public accounting firm’s independence are required to be pre-approved by the committee. The pre-approval requirement will extend to all non-audit services provided to the Registrant, the investment adviser, and any entity controlling, controlled by, or under common control with the investment adviser that provides ongoing services to the Registrant, if the engagement relates directly to the operations and financial reporting of the Registrant. The committee will not delegate its responsibility to pre-approve these services to the investment adviser. The committee may delegate to one or more committee members the authority to review and pre-approve audit and permissible non-audit services. Actions taken under any such delegation will be reported to the full committee at its next meeting. The pre-approval requirement is waived with respect to non-audit services if certain conditions are met. The pre-approval requirement was not waived for any of the non-audit services listed above provided to the Registrant, adviser and affiliates.
Aggregate non-audit fees paid to the Registrant’s auditors, including fees for all services billed to the Registrant, adviser and affiliates that provide ongoing services to the Registrant, were $8,000 for fiscal year 2012 and $40,000 for fiscal year 2013. The non-audit services represented by these amounts were brought to the attention of the committee and considered to be compatible with maintaining the auditors’ independence.
ITEM 5 – Audit Committee of Listed Registrants
Not applicable to this Registrant, insofar as the Registrant is not a listed issuer as defined in Rule 10A-3 under the Securities Exchange Act of 1934.
ITEM 6 – Schedule of Investments
 | American Funds Mortgage Fund® Investment portfolio August 31, 2013 |
| Bonds, notes & other debt instruments 94.55% | | |
| Mortgage-backed obligations 78.42% | Principal amount | Value |
| Federal agency mortgage-backed obligations1 75.38% | (000) | (000) |
| | | |
| Fannie Mae 3.417% 20172 | $ 336 | $ 355 |
| Fannie Mae 3.50% 2025 | 898 | 941 |
| Fannie Mae 3.50% 2025 | 667 | 698 |
| Fannie Mae 3.50% 2026 | 1,068 | 1,117 |
| Fannie Mae 4.50% 2026 | 4,464 | 4,733 |
| Fannie Mae 2.50% 2027 | 635 | 630 |
| Fannie Mae 2.50% 2027 | 302 | 300 |
| Fannie Mae 2.50% 2028 | 5,241 | 5,197 |
| Fannie Mae 3.00% 2038 | 6,902 | 6,610 |
| Fannie Mae 3.00% 2038 | 3,441 | 3,318 |
| Fannie Mae 5.50% 2039 | 255 | 278 |
| Fannie Mae 6.00% 2039 | 533 | 584 |
| Fannie Mae 3.246% 20402 | 2,004 | 2,115 |
| Fannie Mae 3.552% 20402 | 946 | 1,002 |
| Fannie Mae 4.195% 20402 | 893 | 940 |
| Fannie Mae 4.50% 2040 | 7,605 | 8,045 |
| Fannie Mae 4.50% 2040 | 1,199 | 1,268 |
| Fannie Mae 4.50% 2040 | 271 | 287 |
| Fannie Mae 5.00% 2040 | 5,371 | 5,882 |
| Fannie Mae 3.439% 20412 | 1,258 | 1,313 |
| Fannie Mae 3.528% 20412 | 375 | 389 |
| Fannie Mae 3.774% 20412 | 2,571 | 2,736 |
| Fannie Mae 4.00% 2041 | 16,160 | 16,702 |
| Fannie Mae 4.00% 2041 | 7,018 | 7,254 |
| Fannie Mae 4.00% 2041 | 4,184 | 4,326 |
| Fannie Mae 4.50% 2041 | 8,710 | 9,218 |
| Fannie Mae 4.50% 2041 | 1,662 | 1,759 |
| Fannie Mae 4.50% 2041 | 845 | 895 |
| Fannie Mae 3.50% 2042 | 5,478 | 5,479 |
| Fannie Mae 3.50% 2042 | 5,101 | 5,096 |
| Fannie Mae 3.50% 2042 | 4,616 | 4,610 |
| Fannie Mae 3.50% 2042 | 2,138 | 2,136 |
| Fannie Mae 3.50% 2042 | 489 | 482 |
| Fannie Mae 3.50% 2042 | 277 | 273 |
| Fannie Mae 3.50% 2042 | 73 | 72 |
| Fannie Mae 3.50% 2042 | 9 | 9 |
| Fannie Mae 4.00% 2042 | 12,321 | 12,739 |
| Fannie Mae 4.00% 2042 | 4,563 | 4,717 |
| Fannie Mae 2.515% 20432 | 1,077 | 1,054 |
| Fannie Mae 3.00% 20433 | 39,927 | 38,193 |
| Fannie Mae 3.50% 20433 | 64,844 | 64,692 |
| Fannie Mae 3.50% 2043 | 20,188 | 20,167 |
| Fannie Mae 3.50% 2043 | 13,595 | 13,599 |
| Fannie Mae 3.50% 2043 | 1,059 | 1,043 |
| Bonds, notes & other debt instruments | | |
| | Principal amount | Value |
| Mortgage-backed obligations — Federal agency mortgage-backed obligations1 (continued) | (000) | (000) |
| | | |
| Fannie Mae 3.50% 2043 | $ 794 | $ 783 |
| Fannie Mae 3.50% 2043 | 465 | 459 |
| Fannie Mae 3.50% 2043 | 258 | 254 |
| Fannie Mae 3.50% 2043 | 223 | 220 |
| Fannie Mae 3.50% 2043 | 191 | 188 |
| Fannie Mae 3.50% 2043 | 158 | 155 |
| Fannie Mae 3.50% 2043 | 115 | 113 |
| Fannie Mae 3.50% 2043 | 41 | 40 |
| Fannie Mae 4.00% 20433 | 22,650 | 23,365 |
| Fannie Mae 4.00% 20433 | 19,041 | 19,585 |
| Fannie Mae 4.00% 2043 | 10,000 | 10,225 |
| Fannie Mae 4.00% 2043 | 8,100 | 8,386 |
| Fannie Mae 4.50% 20433 | 37,820 | 39,912 |
| Fannie Mae 5.00% 20433 | 14,980 | 16,104 |
| Fannie Mae 5.50% 20433 | 6,190 | 6,723 |
| Fannie Mae 6.00% 20433 | 2,760 | 3,021 |
| Government National Mortgage Assn. 2.50% 2027 | 2,170 | 2,152 |
| Government National Mortgage Assn. 2.50% 2027 | 2,158 | 2,143 |
| Government National Mortgage Assn. 4.00% 2032 | 1,400 | 1,421 |
| Government National Mortgage Assn. 4.00% 2032 | 1,072 | 1,100 |
| Government National Mortgage Assn. 6.50% 2032 | 2,684 | 3,016 |
| Government National Mortgage Assn. 5.00% 2035 | 2,339 | 2,547 |
| Government National Mortgage Assn. 3.75% 2037 | 978 | 982 |
| Government National Mortgage Assn. 6.50% 2037 | 455 | 514 |
| Government National Mortgage Assn. 5.00% 2038 | 1,172 | 1,270 |
| Government National Mortgage Assn. 6.50% 2038 | 939 | 1,061 |
| Government National Mortgage Assn. 6.50% 2038 | 870 | 980 |
| Government National Mortgage Assn. 6.50% 2038 | 419 | 473 |
| Government National Mortgage Assn. 4.50% 2039 | 1,260 | 1,344 |
| Government National Mortgage Assn. 6.00% 2039 | 15,018 | 16,523 |
| Government National Mortgage Assn. 3.50% 2040 | 2,812 | 2,839 |
| Government National Mortgage Assn. 4.50% 2040 | 391 | 405 |
| Government National Mortgage Assn. 5.50% 2040 | 13,414 | 14,929 |
| Government National Mortgage Assn. 3.50% 2041 | 11,420 | 11,537 |
| Government National Mortgage Assn. 3.50% 2041 | 1,231 | 1,243 |
| Government National Mortgage Assn. 4.00% 2041 | 1,552 | 1,568 |
| Government National Mortgage Assn. 4.50% 2041 | 4,838 | 5,166 |
| Government National Mortgage Assn. 4.50% 2041 | 2,985 | 3,174 |
| Government National Mortgage Assn. 4.50% 2041 | 2,249 | 2,402 |
| Government National Mortgage Assn. 4.50% 2041 | 2,302 | 2,381 |
| Government National Mortgage Assn. 4.50% 2041 | 2,129 | 2,274 |
| Government National Mortgage Assn. 4.50% 2041 | 1,958 | 2,025 |
| Government National Mortgage Assn. 5.00% 2041 | 8,739 | 9,464 |
| Government National Mortgage Assn. 5.00% 2041 | 3,925 | 4,107 |
| Government National Mortgage Assn. 6.50% 2041 | 1,564 | 1,701 |
| Government National Mortgage Assn. 3.50% 2042 | 1,087 | 1,101 |
| Government National Mortgage Assn. 3.50% 2042 | 978 | 990 |
| Government National Mortgage Assn. 4.00% 2042 | 4,086 | 4,260 |
| Government National Mortgage Assn. 4.00% 2042 | 1,985 | 2,077 |
| Government National Mortgage Assn. 4.00% 2042 | 1,510 | 1,557 |
| Government National Mortgage Assn. 4.00% 2042 | 1,223 | 1,276 |
| Government National Mortgage Assn. 4.50% 2042 | 3,181 | 3,403 |
| Government National Mortgage Assn. 3.50% 2043 | 6,535 | 6,602 |
| Government National Mortgage Assn. 4.00% 20433 | 18,350 | 19,101 |
| Government National Mortgage Assn. 4.50% 20433 | 7,500 | 7,976 |
| Bonds, notes & other debt instruments | | |
| | Principal amount | Value |
| Mortgage-backed obligations — Federal agency mortgage-backed obligations1 (continued) | (000) | (000) |
| | | |
| Freddie Mac 3.00% 2026 | $1,122 | $ 1,146 |
| Freddie Mac 5.00% 2034 | 7,917 | 8,540 |
| Freddie Mac 5.00% 2034 | 1,503 | 1,614 |
| Freddie Mac 4.50% 2035 | 244 | 257 |
| Freddie Mac 4.50% 2035 | 48 | 50 |
| Freddie Mac 5.50% 2037 | 658 | 709 |
| Freddie Mac 5.50% 2037 | 188 | 202 |
| Freddie Mac 5.00% 2038 | 2,037 | 2,180 |
| Freddie Mac 5.50% 2038 | 3,475 | 3,744 |
| Freddie Mac 5.50% 2038 | 477 | 514 |
| Freddie Mac 6.00% 2038 | 850 | 924 |
| Freddie Mac 3.789% 20392 | 1,167 | 1,244 |
| Freddie Mac 5.50% 2039 | 1,360 | 1,466 |
| Freddie Mac 5.50% 2039 | 912 | 983 |
| Freddie Mac 6.00% 2039 | 753 | 819 |
| Freddie Mac 3.103% 20402 | 200 | 208 |
| Freddie Mac 4.50% 2040 | 744 | 783 |
| Freddie Mac 4.50% 2040 | 128 | 134 |
| Freddie Mac 2.82% 20412 | 343 | 357 |
| Freddie Mac 3.233% 20412 | 2,535 | 2,645 |
| Freddie Mac 3.404% 20412 | 229 | 238 |
| Freddie Mac 4.00% 2041 | 666 | 686 |
| Freddie Mac 4.50% 2041 | 6,517 | 6,856 |
| Freddie Mac 4.50% 2041 | 2,135 | 2,251 |
| Freddie Mac 4.50% 2041 | 1,911 | 2,015 |
| Freddie Mac 4.50% 2041 | 164 | 173 |
| Freddie Mac 5.00% 2041 | 1,198 | 1,298 |
| Freddie Mac 2.563% 20422 | 989 | 974 |
| Freddie Mac 3.50% 2042 | 361 | 356 |
| Freddie Mac 4.50% 2042 | 2,771 | 2,912 |
| Freddie Mac 4.50% 2042 | 606 | 638 |
| Freddie Mac 2.355% 20432 | 9,052 | 8,789 |
| Freddie Mac 3.50% 2043 | 243 | 240 |
| Freddie Mac 3.50% 2043 | 217 | 214 |
| Freddie Mac 3.50% 2043 | 175 | 173 |
| Freddie Mac 3.50% 2043 | 164 | 162 |
| National Credit Union Administration, Series 2010-R2, Class 1A, 0.556% 20172 | 71 | 72 |
| National Credit Union Administration, Series 2011-R3, Class 1A, 0.585% 20202 | 192 | 193 |
| National Credit Union Administration, Series 2011-R2, Class 1A, 0.586% 20202 | 249 | 250 |
| National Credit Union Administration, Series 2011-R1, Class 1A, 0.636% 20202 | 149 | 150 |
| | | 599,029 |
| Other mortgage-backed obligations1 2.77% | | |
| | | |
| Sparebank 1 Boligkreditt AS 2.625% 20174 | 400 | 415 |
| Sparebank 1 Boligkreditt AS 2.30% 20184 | 550 | 560 |
| Sparebank 1 Boligkreditt AS 1.25% 20194 | 1,000 | 955 |
| Sparebank 1 Boligkreditt AS 1.75% 20204 | 1,125 | 1,048 |
| Westpac Banking Corp. 1.375% 20154 | 500 | 505 |
| Westpac Banking Corp. 2.45% 20164 | 375 | 387 |
| Westpac Banking Corp. 1.25% 20184 | 600 | 582 |
| Westpac Banking Corp. 1.375% 20194 | 700 | 673 |
| UBS AG 1.875% 20154 | 400 | 407 |
| UBS AG 0.75% 20164 | 700 | 695 |
| UBS AG 2.25% 20174 | 450 | 461 |
| Bonds, notes & other debt instruments | | |
| | Principal amount | Value |
| Mortgage-backed obligations — Other mortgage-backed obligations1 (continued) | (000) | (000) |
| | | |
| Swedbank AB 2.125% 20164 | $ 325 | $ 333 |
| Swedbank AB 2.95% 20164 | 300 | 314 |
| Swedbank AB 1.375% 20184 | 700 | 676 |
| Bank of Montreal 1.30% 20144 | 550 | 556 |
| Bank of Montreal 2.625% 20164 | 650 | 677 |
| Bank of Nova Scotia 1.25% 20144 | 400 | 404 |
| Bank of Nova Scotia 2.15% 20164 | 350 | 360 |
| Bank of Nova Scotia 1.75% 20174 | 425 | 430 |
| Australia & New Zealand Banking Group Ltd. 1.00% 20154 | 500 | 502 |
| Australia & New Zealand Banking Group Ltd. 2.40% 20164 | 500 | 515 |
| Barclays Bank PLC 2.50% 20154 | 550 | 568 |
| Barclays Bank PLC 2.25% 20174 | 375 | 384 |
| Commonwealth Bank of Australia 0.75% 20164 | 500 | 497 |
| Commonwealth Bank of Australia 2.25% 20174 | 425 | 434 |
| National Australia Bank 2.00% 20174 | 500 | 505 |
| National Australia Bank 1.25% 20184 | 420 | 405 |
| National Bank of Canada 1.65% 20144 | 500 | 503 |
| National Bank of Canada 2.20% 20164 | 350 | 360 |
| Northern Rock PLC 5.625% 20174 | 725 | 824 |
| Royal Bank of Canada 1.125% 2016 | 750 | 745 |
| HSBC Bank PLC 1.625% 20154 | 700 | 706 |
| DnB NOR ASA 1.45% 20194 | 700 | 680 |
| Skandinaviska Enskilda 1.375% 20184 | 700 | 674 |
| Credit Mutuel-CIC Home Loan SFH 1.50% 20174 | 600 | 585 |
| Credit Suisse Group AG 2.60% 20164 | 500 | 519 |
| Nordea Eiendomskreditt AS 2.125% 20174 | 500 | 512 |
| Stadshypotek AB 1.875% 20194 | 525 | 498 |
| Canadian Imperial Bank of Commerce 2.75% 20164 | 400 | 418 |
| Toronto-Dominion Bank 1.625% 20164 | 400 | 405 |
| Caisse Centrale Desjardins 1.60% 20174 | 350 | 352 |
| | | 22,029 |
| Commercial mortgage-backed obligations1 0.27% | | |
| Bear Stearns Commercial Mortgage Securities Trust, Series 2007-T28, Class A-1A, 5.71% 20422 | 1,029 | 1,159 |
| Morgan Stanley Capital I Trust, Series 2007-TA27, Class A-1-A, 5.816% 20422 | 889 | 995 |
| | | 2,154 |
| Total mortgage-backed obligations | | 623,212 |
| U.S. Treasury bonds & notes 8.00% | | |
| U.S. Treasury inflation-protected securities5 7.57% | | |
| | | |
| U.S. Treasury Inflation-Protected Security 2.00% 2014 | 26,524 | 26,793 |
| U.S. Treasury Inflation-Protected Security 0.50% 2015 | 12,929 | 13,240 |
| U.S. Treasury Inflation-Protected Security 0.125% 20186 | 5,010 | 5,102 |
| U.S. Treasury Inflation-Protected Security 0.125% 2022 | 2,305 | 2,219 |
| U.S. Treasury Inflation-Protected Security 0.375% 2023 | 2,155 | 2,094 |
| U.S. Treasury Inflation-Protected Security 0.125% 2023 | 5,280 | 5,021 |
| U.S. Treasury Inflation-Protected Security 0.625% 2043 | 7,109 | 5,695 |
| | | 60,164 |
| U.S. Treasury 0.43% | | |
| | | |
| U.S. Treasury 2.875% 2043 | 4,000 | 3,384 |
| Total U.S. Treasury bonds & notes | | 63,548 |
| Bonds, notes & other debt instruments | | |
| | Principal amount | Value |
| Federal agency bonds & notes 7.01% | (000) | (000) |
| | | |
| Freddie Mac 0.375% 2014 | $10,850 | $ 10,866 |
| Freddie Mac 1.75% 2015 | 2,575 | 2,641 |
| Freddie Mac 1.00% 2017 | 575 | 568 |
| Freddie Mac 1.25% 2019 | 2,330 | 2,189 |
| Freddie Mac, Series K501, Class A1, multifamily 1.337% 20161 | 416 | 418 |
| Freddie Mac, Series K702, Class A1, multifamily 2.084% 20171 | 186 | 190 |
| Freddie Mac, Series K711, Class A1, multifamily 1.321% 20181 | 560 | 556 |
| Freddie Mac, Series K705, Class A2, multifamily 2.303% 20181 | 199 | 199 |
| Freddie Mac, Series K706, Class A2, multifamily 2.323% 20181 | 850 | 852 |
| Freddie Mac, Series K704, Class A2, multifamily 2.412% 20181 | 350 | 353 |
| Freddie Mac, Series K702, Class A2, multifamily 3.154% 20181 | 236 | 247 |
| Freddie Mac, Series K711, Class A2, multifamily 1.73% 20191 | 575 | 550 |
| Freddie Mac, Series K712, Class A2, multifamily 1.869% 20191 | 535 | 510 |
| Freddie Mac, Series K709, Class A2, multifamily 2.086% 20191 | 475 | 468 |
| Freddie Mac, Series K015, Class A1, multifamily 2.257% 20201 | 293 | 297 |
| Freddie Mac, Series K014, Class A1, multifamily 2.788% 20201 | 381 | 394 |
| Freddie Mac, Series K013, Class A1, multifamily 2.902% 20201 | 2,549 | 2,643 |
| Freddie Mac, Series K010, Class A1, multifamily 3.32% 20201 | 281 | 296 |
| Freddie Mac, Series K019, Class A1, multifamily 1.459% 20211 | 474 | 459 |
| Freddie Mac, Series K017, Class A2, multifamily 2.873% 20211 | 425 | 414 |
| Freddie Mac, Series K022, Class A1, multifamily 1.583% 20221 | 589 | 569 |
| Freddie Mac, Series KS01, Class A1, multifamily 1.693% 20221 | 292 | 286 |
| Freddie Mac, Series K025, Class A1, multifamily 1.875% 20221 | 618 | 601 |
| Freddie Mac, Series K023, Class A2, multifamily 2.307% 20221 | 2,050 | 1,883 |
| Freddie Mac, Series K022, Class A2, multifamily 2.355% 20221 | 575 | 532 |
| Freddie Mac, Series K020, Class A2, multifamily 2.373% 20221 | 2,555 | 2,380 |
| Freddie Mac, Series K021, Class A2, multifamily 2.396% 20221 | 2,005 | 1,864 |
| Freddie Mac, Series K024, Class A2, multifamily 2.573% 20221 | 705 | 661 |
| Freddie Mac, Series K030, Class A1, multifamily 2.779% 20221 | 605 | 613 |
| Freddie Mac, Series K029, Class A1, multifamily 2.839% 20221 | 748 | 760 |
| Freddie Mac, Series KS01, Class A2, multifamily 2.522% 20231 | 1,275 | 1,193 |
| Freddie Mac, Series K028, Class A2, multifamily 3.111% 20231 | 700 | 681 |
| Freddie Mac, Series K030, Class A2, multifamily 3.25% 20231,2 | 1,257 | 1,237 |
| Freddie Mac, Series K031, Class A2, multifamily 3.30% 20231,2 | 7,596 | 7,490 |
| Freddie Mac, Series K029, Class A2, multifamily 3.32% 20231,2 | 600 | 594 |
| Freddie Mac, Series K031, Class A1, multifamily 2.778% 20461 | 850 | 862 |
| Federal Home Loan Bank, Series 2816, 1.00% 2017 | 4,000 | 3,961 |
| Fannie Mae, Series 2012-M14, multifamily 1.114% 20171 | 550 | 541 |
| Fannie Mae, Series 2012-M9, multifamily 1.513% 20171 | 525 | 517 |
| Fannie Mae, Series 2012-M5, Class A1, multifamily 1.787% 20221 | 441 | 437 |
| Fannie Mae, Series 2013-M4, multifamily 2.608% 20221 | 700 | 668 |
| Fannie Mae, Series 2012-M2, Class A2, multifamily 2.717% 20221 | 425 | 406 |
| Fannie Mae, Series 2012-M3, Class 1-A2, multifamily 3.044% 20221 | 425 | 418 |
| Tennessee Valley Authority 1.875% 2022 | 1,650 | 1,464 |
| | | 55,728 |
| Municipals 1.12% | | |
| | | |
| State of Minnesota, Housing Finance Agency, Homeownership Finance Bonds | | |
| (GNMA and FNMA Pass-Through Program), Series 2012-B, 2.25% 20421 | 1,245 | 1,220 |
| State of Minnesota, Housing Finance Agency, Homeownership Finance Bonds | | |
| (GNMA and FNMA Pass-Through Program), Series 2013-A, 2.35% 20431 | 1,280 | 1,255 |
| State of Kentucky, Housing Corp., Housing Revenue Bonds, Series 2013-D, 3.50% 2033 | 1,425 | 1,493 |
| State of Oklahoma, Housing Finance Agency, Single-family Mortgage Revenue Bonds | | |
| (Homeownership Loan Program), Series 2012-A, 5.00% 2043 | 985 | 1,081 |
| Bonds, notes & other debt instruments | | |
| | Principal amount | Value |
| Municipals (continued) | (000) | (000) |
| | | |
| State of New Mexico, Mortgage Finance Authority, Single-family Mortgage Program | | |
| Revenue Refunding Bonds, Series 2012-B-1, Class I, Alternative Minimum Tax, 3.75% 2043 | $ 720 | $ 745 |
| State of Iowa, Finance Authority, Single-family Mortgage Bonds (Mortgage-backed Securities Program), | | |
| Series 2013-1, 2.15% 20431 | 738 | 706 |
| State of Illinois, Housing Development Authority, Housing Revenue Bonds, Series 2013-A, 2.45% 20431 | 641 | 587 |
| State of Georgia, Housing and Finance Authority, Single-family Mortgage Bonds, Series 2013-A, 3.00% 2043 | 540 | 563 |
| State of Mississippi, Home Corp., Single-family Mortgage Revenue Bonds, Series 2009-A-2, 5.00% 2039 | 500 | 540 |
| State of Florida, Housing Finance Corp., Homeowner Mortgage Revenue Bonds, Series 2011-C, 4.50% 2030 | 330 | 352 |
| State of Missouri, Housing Development Commission, Single-family Mortgage Revenue Bonds | | |
| (Homeownership Loan Program), Series 2004-A-1, Alternative Minimum Tax, 5.15% 2034 | 185 | 190 |
| State of Washington, Housing Finance Commission, Single-family Program Revenue Refunding Bonds, | | |
| Series 2013-1-N, 3.00% 2043 | 160 | 166 |
| | | 8,898 |
| Total bonds, notes & other debt instruments (cost: $756,047,000) | | 751,386 |
| Short-term securities 34.48% | | |
| | | |
| Freddie Mac 0.11%–0.12% due 11/6/2013–1/27/2014 | 62,900 | 62,890 |
| Fannie Mae 0.08%–0.16% due 10/25/2013–1/6/2014 | 26,400 | 26,397 |
| Abbott Laboratories 0.07%–0.09% due 10/1–11/1/20134 | 22,500 | 22,498 |
| Regents of the University of California 0.11% due 10/23/2013 | 19,800 | 19,797 |
| Wal-Mart Stores, Inc. 0.05%–0.06% due 9/18–9/23/20134 | 15,300 | 15,300 |
| Chariot Funding, LLC 0.27% due 9/18/20134 | 15,000 | 14,999 |
| Federal Home Loan Bank 0.08%–0.15% due 12/19/2013–1/15/2014 | 14,900 | 14,898 |
| Google Inc. 0.10% due 9/24/20134 | 14,400 | 14,399 |
| National Rural Utilities Cooperative Finance Corp. 0.10% due 9/17/2013 | 12,500 | 12,499 |
| NetJets Inc. 0.05% due 9/23/20134 | 12,400 | 12,399 |
| Wells Fargo & Co. 0.17%–0.18% due 12/16–12/17/2013 | 11,300 | 11,291 |
| Emerson Electric Co. 0.05% due 9/19/20134 | 8,800 | 8,800 |
| Procter & Gamble Co. 0.10% due 10/15/20134 | 7,700 | 7,699 |
| John Deere Financial Ltd. 0.08% due 9/25/20134 | 6,600 | 6,600 |
| Parker-Hannifin Corp. 0.09% due 10/11/20134 | 6,100 | 6,099 |
| Tennessee Valley Authority 0.04% due 10/17/2013 | 4,900 | 4,900 |
| Honeywell International Inc. 0.13% due 12/30/20134 | 4,500 | 4,498 |
| Paccar Financial Corp. 0.13% due 9/5/2013 | 4,000 | 4,000 |
| Army and Air Force Exchange Service 0.12% due 11/5/20134 | 2,100 | 2,099 |
| Coca-Cola Co. 0.12% due 10/4/20134 | 2,000 | 2,000 |
| Total short-term securities (cost: $274,042,000) | | 274,062 |
| Total investment securities (cost: $1,030,089,000) | | 1,025,448 |
| Other assets less liabilities | | (230,736) |
| Net assets | | $ 794,712 |
| 1 | Principal payments may be made periodically. Therefore, the effective maturity date may be earlier than the stated maturity date. |
| 2 | Coupon rate may change periodically. |
| 3 | A portion of the security purchased on a TBA basis. |
| 4 | Acquired in a transaction exempt from registration under Rule 144A or section 4(2) of the Securities Act of 1933. May be resold in the U.S. in transactions exempt from registration, normally to qualified institutional buyers. The total value of all such securities was $138,674,000, which represented 17.45% of the net assets of the fund. |
| 5 | Index-linked bond whose principal amount moves with a government price index. |
| 6 | A portion of this security was pledged as collateral for net losses on unsettled interest rate swaps. The total value of pledged collateral was $621,000, which represented .08% of the net assets of the fund. |
Key to abbreviation
TBA = To be announced
Investments are not FDIC-insured, nor are they deposits of or guaranteed by a bank or any other entity, so they may lose value.
Investors should carefully consider investment objectives, risks, charges and expenses. This and other important information is contained in the fund prospectus and summary prospectus, which can be obtained from your financial professional and should be read carefully before investing. You may also call American Funds Service Company (AFS) at (800) 421-4225 or visit the American Funds website at americanfunds.com.
MFGEFPX-042-1013O-S37755
Report of Independent Registered Public Accounting Firm
To the Board of Trustees and Shareholders of American Funds Mortgage Fund
We have audited, in accordance with standards of the Public Company Accounting Oversight Board (United States), the financial statements of American Funds Mortgage Fund (the “Fund”) as of August 31, 2013, and for the year then ended and have issued our unqualified report thereon dated October 15, 2013 (which report and financial statements are included in Item 1 of this Certified Shareholder Report on Form N-CSR). Our audit included an audit of the Fund’s investment portfolio (the “Portfolio”) as of August 31, 2013 appearing in Item 6 of this Form N-CSR. The Portfolio is the responsibility of the Fund’s management. Our responsibility is to express an opinion on the Portfolio based on our audit.
In our opinion, the Portfolio referred to above, when read in conjunction with the financial statements of the Fund referred to above, presents fairly, in all material respects, the information set forth therein.
PricewaterhouseCoopers LLP
Los Angeles, California
October 15, 2013
ITEM 7 – Disclosure of Proxy Voting Policies and Procedures for Closed-End Management Investment Companies
Not applicable to this Registrant, insofar as the Registrant is not a closed-end management investment company.
ITEM 8 – Portfolio Managers of Closed-End Management Investment Companies
Not applicable to this Registrant, insofar as the Registrant is not a closed-end management investment company.
ITEM 9 – Purchases of Equity Securities by Closed-End Management Investment Company and Affiliated Purchasers
Not applicable to this Registrant, insofar as the Registrant is not a closed-end management investment company.
ITEM 10 – Submission of Matters to a Vote of Security Holders
There have been no material changes to the procedures by which shareholders may recommend nominees to the Registrant’s board of trustees since the Registrant last submitted a proxy statement to its shareholders. The procedures are as follows. The Registrant has a nominating and governance committee comprised solely of persons who are not considered ‘‘interested persons’’ of the Registrant within the meaning of the Investment Company Act of 1940, as amended. The committee periodically reviews such issues as the board’s composition, responsibilities, committees, compensation and other relevant issues, and recommends any appropriate changes to the full board of trustees. While the committee normally is able to identify from its own resources an ample number of qualified candidates, it will consider shareholder suggestions of persons to be considered as nominees to fill future vacancies on the board. Such suggestions must be sent in writing to the nominating and governance committee of the Registrant, c/o the Registrant’s Secretary, and must be accompanied by complete biographical and occupational data on the prospective nominee, along with a written consent of the prospective nominee for consideration of his or her name by the nominating and governance committee.
ITEM 11 – Controls and Procedures
| (a) | The Registrant’s Principal Executive Officer and Principal Financial Officer have concluded, based on their evaluation of the Registrant’s disclosure controls and procedures (as such term is defined in Rule 30a-3 under the Investment Company Act of 1940), that such controls and procedures are adequate and reasonably designed to achieve the purposes described in paragraph (c) of such rule. |
| | |
| (b) | There were no changes in the Registrant’s internal controls over financial reporting (as defined in Rule 30a-3(d) under the Investment Company Act of 1940) that occurred during the Registrant’s second fiscal quarter of the period covered by this report that has materially affected, or is reasonably likely to materially affect, the Registrant’s internal control over financial reporting. |
ITEM 12 – Exhibits
| (a)(1) | The Code of Ethics that is the subject of the disclosure required by Item 2 is attached as an exhibit hereto. |
| | |
| (a)(2) | The certifications required by Rule 30a-2 of the Investment Company Act of 1940 and Sections 302 and 906 of the Sarbanes-Oxley Act of 2002 are attached as exhibits hereto. |
SIGNATURES
Pursuant to the requirements of the Securities Exchange Act of 1934 and the Investment Company Act of 1940, the Registrant has duly caused this report to be signed on its behalf by the undersigned, thereunto duly authorized.
| | AMERICAN FUNDS MORTGAGE FUND |
| | |
| | By /s/ John H. Smet |
| | John H. Smet, President and Principal Executive Officer |
| | |
| | Date: October 31, 2013 |
Pursuant to the requirements of the Securities Exchange Act of 1934 and the Investment Company Act of 1940, this report has been signed below by the following persons on behalf of the Registrant and in the capacities and on the dates indicated.
| By /s/ John H. Smet |
John H. Smet, President and Principal Executive Officer |
| |
| Date: October 31, 2013 |
| By /s/ Brian C. Janssen |
Brian C. Janssen, Treasurer and Principal Financial Officer |
| |
| Date: October 31, 2013 |