UNITED STATES
SECURITIES AND EXCHANGE COMMISSION
Washington, D.C. 20549
FORM N-CSR
Certified Shareholder Report of
Registered Management Investment Companies
Investment Company Act File Number: 811-22449
American Funds Mortgage Fund
(Exact Name of Registrant as Specified in Charter)
6455 Irvine Center Drive
Irvine, California 92618
(Address of Principal Executive Offices)
Registrant's telephone number, including area code: (949) 975-5000
Date of fiscal year end: August 31
Date of reporting period: August 31, 2020
Brian C. Janssen
American Funds Mortgage Fund
6455 Irvine Center Drive
Irvine, California 92618
(Name and Address of Agent for Service)
ITEM 1 – Reports to Stockholders
American Funds
Mortgage Fund® Annual report
for the year ended
August 31, 2020 |  |

Seeking income
and diversification
through investments
in high-quality
mortgages
Beginning January 1, 2021, as permitted by regulations adopted by the U.S. Securities and Exchange Commission, we intend to no longer mail paper copies of the fund’s shareholder reports, unless specifically requested from American Funds or your financial intermediary, such as a broker-dealer or bank. Instead, the reports will be made available on the Capital Group website (capitalgroup.com); you will be notified by mail and provided with a website link to access the report each time a report is posted. If you have already elected to receive shareholder reports electronically, you will not be affected by this change and do not need to take any action. If you prefer to receive shareholder reports and other communications electronically, you may update your mailing preferences with your financial intermediary, or enroll in e-delivery at capitalgroup.com (for accounts held directly with the fund).
You may elect to receive paper copies of all future reports free of charge. If you invest through a financial intermediary, you may contact your financial intermediary to request that you continue to receive paper copies of your shareholder reports. If you invest directly with the fund, you may inform American Funds that you wish to continue receiving paper copies of your shareholder reports by contacting us at (800) 421-4225. Your election to receive paper reports will apply to all funds held with American Funds or through your financial intermediary.
American Funds Mortgage Fund seeks to provide current income and preservation of capital.
This fund is one of more than 40 offered by Capital Group, home of American Funds, one of the nation’s largest mutual fund families. For nearly 90 years, Capital Group has invested with a long-term focus based on thorough research and attention to risk.
Fund results shown in this report, unless otherwise indicated, are for Class A shares at net asset value. If a sales charge (maximum 3.75%) had been deducted, the results would have been lower. Results are for past periods and are not predictive of results for future periods. Current and future results may be lower or higher than those shown. Prices and returns will vary, so investors may lose money. Investing for short periods makes losses more likely. For current information and month-end results, visit capitalgroup.com.
Here are the average annual total returns on a $1,000 investment with all distributions reinvested for periods ended September 30, 2020 (the most recent calendar quarter-end):
| Class A shares | | 1 year | | 5 years | | Lifetime
(since 11/1/10) |
| | | | | | | |
| Reflecting 3.75% maximum sales charge | | 2.37% | | 2.08% | | 2.31% |
For other share class results, visit capitalgroup.com and americanfundsretirement.com.
The total annual fund operating expense ratio is 0.65% for Class A shares as of the prospectus dated October 30, 2020 (unaudited).
Investment results assume all distributions are reinvested and reflect applicable fees and expenses. When applicable, investment results reflect expense reimbursements, without which results would have been lower. Visit capitalgroup.com for more information.
The fund’s 30-day yield for Class A shares as of September 30, 2020, calculated in accordance with the U.S. Securities and Exchange Commission (SEC) formula, was 0.40%. The fund’s 12-month distribution rate for Class A shares as of that date was 1.19%. Both reflect the 3.75% maximum sales charge. The SEC yield reflects the rate at which the fund is earning income on its current portfolio of securities while the distribution rate reflects the fund’s past dividends paid to shareholders. Accordingly, the fund’s SEC yield and distribution rate may differ.
The return of principal for bond funds and for funds with significant underlying bond holdings is not guaranteed. Fund shares are subject to the same interest rate, inflation and credit risks associated with the underlying bond holdings. Investments in mortgage-related securities involve additional risks, such as prepayment risk, as more fully described in the prospectus. Refer to the fund prospectus and the Risk Factors section of this report for more information on these and other risks associated with investing in the fund.
Investments are not FDIC-insured, nor are they deposits of or guaranteed by a bank or any other entity, so they may lose value.
Contents
Fellow investors:
Bond markets experienced a snapback rally after a steep decline in March, as the U.S. entered a recession due to the coronavirus pandemic and the subsequent economic shutdown. While rising optimism drove investors’ appetite for risk, the U.S. Federal Reserve’s asset purchase programs also broadly supported asset classes.
For the 12-month period ended August 31, American Funds Mortgage Fund (AFMF) posted a total return of 6.32%, with all distributions reinvested. That compares to a gain of 4.54% for the Bloomberg Barclays U.S. Mortgage Backed Securities Index, the fund’s primary benchmark, over the same period. The fund’s peer group, as measured by the Lipper Intermediate U.S. Government Funds Average, gained 5.61%. Additionally, the Lipper GNMA Funds Average climbed 3.41%.
During the 12-month period, the fund paid monthly dividends totaling nearly 15 cents a share. The fund also paid capital gains of nearly nine cents a share for the fiscal year, resulting in an income return of 1.44% for those investors opting to reinvest dividends or 1.43% for those taking dividends in cash.
Market overview
Markets have been volatile as uncertainty about the pandemic and its toll on the U.S. economy continued to weigh on investors’ outlook. The Fed’s massive bond-buying program helped boost confidence in various asset classes, including mortgage-backed securities (MBS).
Additionally, the Fed in August adopted a new “average inflation targeting” framework that allows higher periods of inflation in an effort to support the labor market. By contrast, central banks traditionally hike interest rates when unemployment rates fall to keep inflation in check.
The new policy effectively signaled that interest rates will likely remain low over the next few years even if inflation were to tick higher. The key policy rate stands at 0% to 0.25%, following reductions by the Fed earlier this year.
The Fed’s monthly purchases of $40B of lower coupon MBS has helped support agency MBS, despite risks of early mortgage prepayments. The pandemic has put homeowners at risk of delinquency
Results at a glance
For periods ended August 31, 2020, with all distributions reinvested
| | | Cumulative
total returns | | Average annual total returns |
| | | 1 year | | 3 years | | 5 years | | Lifetime
(since 11/1/10) |
| | | | | | | | | | | | | | | | | |
| American Funds Mortgage Fund (Class A shares) | | | 6.32 | % | | | 3.45 | % | | | 3.04 | % | | | 2.73 | % |
| Bloomberg Barclays U.S. Mortgage Backed Securities Index* | | | 4.54 | | | | 3.64 | | | | 3.13 | | | | 2.97 | |
| Lipper Intermediate U.S. Government Funds Average† | | | 5.61 | | | | 3.74 | | | | 2.91 | | | | 2.42 | |
| Lipper GNMA Funds Average† | | | 3.41 | | | | 2.85 | | | | 2.27 | | | | 2.30 | |
| | |
| * | Source: Bloomberg Index Services Ltd. The market index is unmanaged and, therefore, has no expenses. Investors cannot invest directly in an index. |
| † | Source: Refinitiv Lipper. Lipper averages reflect the current composition of all eligible mutual funds (all share classes) within a given category. Lipper categories are dynamic and averages may have few funds, especially over longer periods. To see the number of funds included in the Lipper category for each fund’s lifetime, please see the Quarterly Statistical Update available on our website. |
| | |
| American Funds Mortgage Fund | 1 |
and foreclosure, although Congress has allowed some forbearance to delay loan payments.
There have been some signs of economic recovery, with rebounds in unemployment rates, retail sales and other areas. However, certain states rolled back plans to reopen the economy in response to upticks in COVID-19 cases.
Home sales have started to rebound following the pandemic-related lockdowns with sales of previously owned homes up 10.5% in August, according to the National Association of Realtors. Low interest rates have increased demand for homes, though inventory remains low. Residential mortgage delinquencies have spiked to a seasonally adjusted rate of 8.22% in the second quarter, up 369 basis points from the same period a year earlier, according to the Mortgage Bankers Association. In large part, the spike in delinquencies is due to many loans currently in forbearance due to COVID-19 shutdowns.
Inside the portfolio
American Funds Mortgage Fund invested in high-quality residential and commercial mortgage-backed securities during the fiscal year.
Managers increased holdings of agency MBS as the pandemic negatively impacted markets. In particular, the fund heavily invested in lower coupon MBS, which were favored in the Fed’s monthly purchase program, and avoided higher coupon MBS that were exposed to significant prepayment risk.
The fund used several tools to manage duration and curve positioning, including money market bonds and derivatives such as interest rate swaps and futures. The fund was overweight shorter dated duration relative to the benchmark, which helped results as the Fed cut the federal funds rate by a total of 1.5% in 2020.
The fund’s positions in commercial mortgage-backed securities also helped results, as did holdings of Treasuries.
Looking ahead
The focus of the fund remains on meeting the core objectives of providing current income and preserving invested capital. Moreover, managers are mindful of the fund’s correlation to equity and the fund’s use as a building block in client portfolios.
Managers are cautious about upcoming risks tied to the ongoing pandemic and the general election. The fund is positioned with the view that yields of longer dated Treasuries could fall due to various factors such as tepid growth and bond buying by the Fed.
We rely on fundamental analysis to develop high-conviction ideas and select securities that we believe will add value to the portfolio. A mortgage fund affords investors a unique opportunity to own high-quality assets with low interest rate risk relative to longer maturity government securities and with low credit risk. These characteristics should continue to provide a low correlation to equities under most market conditions.
Thank you for choosing to invest in American Funds Mortgage Fund. We look forward to reporting to you again in six months.
Cordially,

David J. Betanzos
President
October 14, 2020
For current information about the fund, visit capitalgroup.com.
| 2 | American Funds Mortgage Fund |
The value of a $10,000 investment
How a hypothetical $10,000 investment has grown (for the period November 1, 2010, to August 31, 2020, with all distributions reinvested)
Fund results shown are for Class A shares and, unless otherwise indicated, reflect deduction of the maximum sales charge of 3.75% on the $10,000 investment.1 Thus, the net amount invested was $9,625.
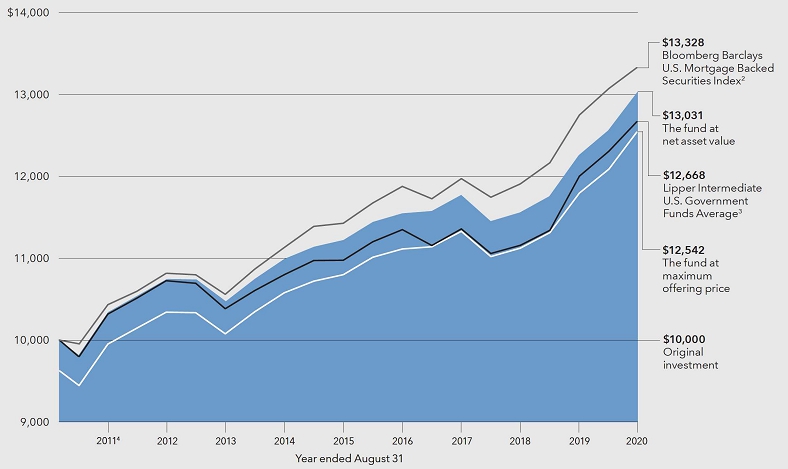
| 1 | As outlined in the prospectus, the sales charge is reduced for accounts (and aggregated investments) of $100,000 or more and is eliminated for purchases of $1 million or more. There is no sales charge on dividends or capital gain distributions that are reinvested in additional shares. |
| 2 | Source: Bloomberg Index Services Ltd. The market index is unmanaged and, therefore, has no expenses. Investors cannot invest directly in an index. |
| 3 | Source: Refinitiv Lipper. Results of the Lipper Intermediate U.S. Government Funds Average do not reflect any sales charges. Lipper averages reflect the current composition of all eligible mutual funds (all share classes) within a given category. Lipper categories are dynamic and averages may have few funds, especially over longer periods. To see the number of funds included in the Lipper category for each fund’s lifetime, please see the Quarterly Statistical Update available on our website. |
| 4 | For the period November 1, 2010, commencement of operations, through August 31, 2011. |
Past results are not predictive of results for future periods. The results shown are before taxes on fund distributions and sale of fund shares.
Average annual total returns based on a $1,000 investment (for periods ended August 31, 2020)*
| | 1 year | 5 years | Lifetime
(since 11/1/10) |
| | | | |
| Class A shares | 2.31% | 2.25% | 2.33% |
| | |
| * | Assumes reinvestment of all distributions and payment of the maximum 3.75% sales charge. |
Investment results assume all distributions are reinvested and reflect applicable fees and expenses. When applicable, investment results reflect expense reimbursements, without which results would have been lower. Visit capitalgroup.com for more information.
| American Funds Mortgage Fund | 3 |
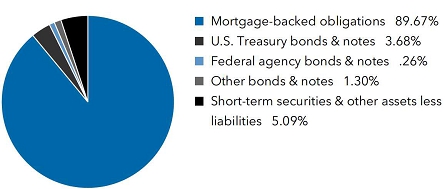
Summary investment portfolio August 31, 2020
| Portfolio by type of security | Percent of net assets |
| Portfolio quality summary* | | Percent of
net assets |
| U.S. Treasury and agency† | | | 3.94 | % |
| AAA/Aaa | | | 89.40 | |
| AA/Aa | | | .51 | |
| A/A | | | 1.06 | |
| Short-term securities & other assets less liabilities | | | 5.09 | |
| * | Bond ratings, which typically range from AAA/Aaa (highest) to D (lowest), are assigned by credit rating agencies such as Standard & Poor’s, Moody’s and/or Fitch as an indication of an issuer’s creditworthiness. In assigning a credit rating to a security, the fund looks specifically to the ratings assigned to the issuer of the security by Standard & Poor’s, Moody’s and/or Fitch. If agency ratings differ, the security will be considered to have received the highest of those ratings, consistent with the fund’s investment policies. The ratings are not covered by the Report of Independent Registered Public Accounting Firm. |
| † | These securities are guaranteed by the full faith and credit of the U.S. government. |
| Bonds, notes & other debt instruments 94.91% | Principal amount
(000) | | | Value
(000) | |
| Mortgage-backed obligations 89.67% | | | | | | | | |
| Federal agency mortgage-backed obligations 85.08% | | | | | | | | |
| Fannie Mae Pool #MA3490 4.00% 20331 | | $ | 59,725 | | | $ | 63,345 | |
| Fannie Mae Pool #AL9326 3.549% 20411,2 | | | 38,509 | | | | 40,504 | |
| Fannie Mae Pool #AL9531 3.637% 20411,2 | | | 34,486 | | | | 36,219 | |
| Fannie Mae Pool #AP7553 3.00% 20421 | | | 34,217 | | | | 36,684 | |
| Fannie Mae Pool #AL9532 3.19% 20421,2 | | | 43,131 | | | | 45,065 | |
| Fannie Mae Pool #CA4867 3.00% 20491 | | | 93,675 | | | | 101,116 | |
| Fannie Mae Pool #CA5539 3.00% 20501 | | | 127,128 | | | | 135,576 | |
| Fannie Mae Pool #CA5496 3.00% 20501 | | | 88,545 | | | | 95,920 | |
| Fannie Mae 2.00%–5.00% 2022–20531,2 | | | 482,923 | | | | 516,226 | |
| Freddie Mac Pool #RA1339 3.00% 20491 | | | 40,790 | | | | 43,473 | |
| Freddie Mac Pool #SD7503 3.50% 20491 | | | 83,040 | | | | 89,325 | |
| Freddie Mac Pool #QA5131 3.50% 20491 | | | 34,092 | | | | 36,356 | |
| Freddie Mac Pool #QA8528 3.00% 20501 | | | 67,668 | | | | 72,165 | |
| Freddie Mac Pool #SD7514 3.50% 20501 | | | 95,787 | | | | 102,879 | |
| Freddie Mac 2.50%–4.50% 2023–20501,2 | | | 160,481 | | | | 172,610 | |
| Freddie Mac Seasoned Credit Risk Transfer Trust, Series 2017-4, Class HT, 3.25% 20571,2 | | | 95,646 | | | | 104,950 | |
| Freddie Mac Seasoned Credit Risk Transfer Trust, Series 2017-4, Class MT, 3.50% 20571 | | | 60,260 | | | | 67,789 | |
| Freddie Mac Seasoned Credit Risk Transfer Trust, Series 2018-2, Class MT, 3.50% 20571 | | | 33,262 | | | | 37,474 | |
| Freddie Mac Seasoned Credit Risk Transfer Trust, Series 2019-4, Class MA, 3.00% 20591 | | | 37,761 | | | | 40,283 | |
| Freddie Mac Seasoned Loan Structured Transaction Trust, Series 2018-2, Class A1, 3.50% 20281 | | | 75,724 | | | | 82,668 | |
| Freddie Mac Seasoned Loan Structured Transaction Trust, Series 2019-3, Class A1C, 2.75% 20291 | | | 63,344 | | | | 66,912 | |
| Freddie Mac Seasoned Loan Structured Transaction Trust, Series 2019-1, Class A1, 3.50% 20291 | | | 110,635 | | | | 120,494 | |
| Freddie Mac Seasoned Loan Structured Transaction Trust, Series 2020-1, Class A1D, 2.00% 20301 | | | 35,017 | | | | 36,399 | |
| Government National Mortgage Assn. 2.00% 20501,3 | | | 189,599 | | | | 195,502 | |
| Government National Mortgage Assn. 2.50% 20501,3 | | | 107,393 | | | | 112,981 | |
| Government National Mortgage Assn. 3.50% 20501,3 | | | 136,141 | | | | 143,363 | |
| Government National Mortgage Assn. Pool #MA4511 4.00% 20471 | | | 85,495 | | | | 92,225 | |
| Government National Mortgage Assn. Pool #MA5764 4.50% 20491 | | | 39,341 | | | | 42,368 | |
| Government National Mortgage Assn. 2.50%–6.50% 2032–20661,3 | | | 92,234 | | | | 99,122 | |
| 4 | American Funds Mortgage Fund |
| | Principal amount
(000) | | | Value
(000) | |
| Uniform Mortgage-Backed Security 1.50% 20351,3 | | $ | 1,090,900 | | | $ | 1,114,593 | |
| Uniform Mortgage-Backed Security 1.50% 20351,3 | | | 207,950 | | | | 212,523 | |
| Uniform Mortgage-Backed Security 2.00% 20351,3 | | | 614,076 | | | | 638,159 | |
| Uniform Mortgage-Backed Security 2.50% 20351,3 | | | 242,320 | | | | 253,755 | |
| Uniform Mortgage-Backed Security 2.00% 20501,3 | | | 67,850 | | | | 69,660 | |
| Uniform Mortgage-Backed Security 3.50% 20501,3 | | | 430,565 | | | | 454,145 | |
| Uniform Mortgage-Backed Security 4.50% 20501,3 | | | 99,000 | | | | 106,955 | |
| Uniform Mortgage-Backed Securities 2.50%–4.50% 2035–20501,3 | | | 47,536 | | | | 50,848 | |
| Other securities | | | | | | | 365,989 | |
| | | | | | | | 6,096,620 | |
| | | | | | | | | |
| Collateralized mortgage-backed obligations (privately originated) 4.34% | | | | | | | | |
| Other securities | | | | | | | 310,768 | |
| | | | | | | | | |
| Commercial mortgage-backed securities 0.25% | | | | | | | | |
| Other securities | | | | | | | 18,076 | |
| | | | | | | | | |
| Total mortgage-backed obligations | | | | | | | 6,425,464 | |
| | | | | | | | | |
| U.S. Treasury bonds & notes 3.68% | | | | | | | | |
| U.S. Treasury 2.44% | | | | | | | | |
| U.S. Treasury 1.25% 20504 | | | 133,292 | | | | 125,886 | |
| U.S. Treasury 1.375% 2050 | | | 40,000 | | | | 39,022 | |
| U.S. Treasury 3.13%–3.38% 2048 | | | 7,406 | | | | 10,281 | |
| | | | | | | | 175,189 | |
| | | | | | | | | |
| U.S. Treasury inflation-protected securities 1.24% | | | | | | | | |
| U.S. Treasury Inflation-Protected Security 2.125% 20415 | | | 562 | | | | 885 | |
| U.S. Treasury Inflation-Protected Security 0.75% 20424,5 | | | 34,398 | | | | 43,801 | |
| U.S. Treasury Inflation-Protected Security 1.00% 20494,5 | | | 30,975 | | | | 43,866 | |
| | | | | | | | 88,552 | |
| | | | | | | | | |
| Total U.S. Treasury bonds & notes | | | | | | | 263,741 | |
| | | | | | | | | |
| Federal agency bonds & notes 0.26% | | | | | | | | |
| Fannie Mae 0.63%–0.88% 2025–2030 | | | 11,350 | | | | 11,261 | |
| Freddie Mac 0.375% 2025 | | | 7,059 | | | | 7,046 | |
| | | | | | | | 18,307 | |
| | | | | | | | | |
| Other bonds & notes 1.30% | | | | | | | | |
| Other securities | | | | | | | 93,353 | |
| | | | | | | | | |
| Total bonds, notes & other debt instruments (cost: $6,664,807,000) | | | | | | | 6,800,865 | |
| | | | | | | | | |
| Short-term securities 52.07% | | | | | | | | |
| U.S. Treasury bills 23.21% | | | | | | | | |
| U.S. Treasury 0.07%–0.17% due 9/1/2020–12/24/2020 | | | 1,663,000 | | | | 1,662,720 | |
| | | | | | | | | |
| Federal agency discount notes 16.35% | | | | | | | | |
| Federal Home Loan Bank 0.07%–0.17% due 9/2/2020–11/25/2020 | | | 1,122,000 | | | | 1,121,881 | |
| Freddie Mac 0.14% due 9/18/2020 | | | 50,000 | | | | 49,998 | |
| | | | | | | | 1,171,879 | |
| American Funds Mortgage Fund | 5 |
| Short-term securities (continued) | Principal amount
(000) | | | Value
(000) | |
| Commercial paper 12.51% | | | | | | | | |
| Apple Inc. 0.11%–0.15% due 9/8/2020–10/13/20206 | | $ | 91,700 | | | $ | 91,694 | |
| Chariot Funding LLC 0.15%–0.25% due 9/1/2020–10/19/20206 | | | 110,000 | | | | 109,993 | |
| Charta LLC 0.22% due 9/11/20206 | | | 50,000 | | | | 49,998 | |
| Chevron Corp. 0.09% due 10/14/20206 | | | 70,000 | | | | 69,993 | |
| Exxon Mobil Corp. 0.11%–0.12% due 10/21/2020–11/17/2020 | | | 125,000 | | | | 124,981 | |
| Intel Corp. 0.09% due 9/8/2020–9/25/20206 | | | 75,000 | | | | 74,998 | |
| Johnson & Johnson 0.10%–0.15% due 9/8/2020–9/21/20206 | | | 50,000 | | | | 49,999 | |
| Paccar Financial Corp. 0.10% due 9/25/2020–9/29/2020 | | | 47,400 | | | | 47,396 | |
| Pfizer Inc. 0.13%–0.16% due 9/15/2020–10/14/20206 | | | 125,000 | | | | 124,991 | |
| Procter & Gamble Co. 0.11%–0.17% due 9/22/2020–11/17/20206 | | | 113,000 | | | | 112,991 | |
| Other securities | | | | | | | 39,190 | |
| | | | | | | | 896,224 | |
| | | | | | | | | |
| Total short-term securities (cost: $3,730,763,000) | | | | | | | 3,730,823 | |
| Total investment securities 146.98% (cost: $10,395,570,000) | | | | | | | 10,531,688 | |
| Other assets less liabilities (46.98)% | | | | | | | (3,366,220 | ) |
| | | | | | | | | |
| Net assets 100.00% | | | | | | $ | 7,165,468 | |
| | | | | | | | | |
This summary investment portfolio is designed to streamline the report and help investors better focus on the fund’s principal holdings. See the inside back cover for details on how to obtain a complete schedule of portfolio holdings.
“Other securities” includes all issues that are not disclosed separately in the summary investment portfolio.
Futures contracts
| | | | | Number of | | | | | Notional
amount | 7 | | Value at
8/31/2020 | 8 | Unrealized
(depreciation)
appreciation
at 8/31/2020 | |
| Contracts | | Type | | contracts | | | Expiration | | (000) | | | (000) | | (000) | |
| 90 Day Euro Dollar Futures | | Short | | | 5,141 | | | September 2020 | | $ | (1,285,250 | ) | | $ | (1,282,262 | ) | | $ | (876 | ) |
| 90 Day Euro Dollar Futures | | Short | | | 3,199 | | | March 2021 | | | (799,750 | ) | | | (798,151 | ) | | | (146 | ) |
| 2 Year U.S. Treasury Note Futures | | Long | | | 110 | | | January 2021 | | | 22,000 | | | | 24,304 | | | | 10 | |
| 5 Year U.S. Treasury Note Futures | | Long | | | 1,921 | | | January 2021 | | | 192,100 | | | | 242,106 | | | | 313 | |
| 10 Year U.S. Treasury Note Futures | | Short | | | 108 | | | December 2020 | | | (10,800 | ) | | | (15,039 | ) | | | (16 | ) |
| 10 Year Ultra U.S. Treasury Note Futures | | Short | | | 1,550 | | | December 2020 | | | (155,000 | ) | | | (247,128 | ) | | | 109 | |
| 20 Year U.S. Treasury Bond Futures | | Long | | | 399 | | | December 2020 | | | 39,900 | | | | 70,112 | | | | (219 | ) |
| 30 Year Ultra U.S. Treasury Bond Futures | | Long | | | 481 | | | December 2020 | | | 48,100 | | | | 106,256 | | | | (454 | ) |
| | | | | | | | | | | | | | | | | | | $ | (1,279 | ) |
Swap contracts
Interest rate swaps
| | | | | | | | | | | | | | | Unrealized | |
| | | | | | | | | | | | | Upfront | | (depreciation) | |
| | | | | | | | | | | Value at | | premium | | appreciation | |
| | | | | Expiration | | | Notional | | | 8/31/2020 | | paid (received) | | at 8/31/2020 | |
| Receive | | Pay | | date | | | (000) | | | (000) | | (000) | | (000) | |
| 3-month USD-LIBOR | | 2.322% | | | 5/2/2024 | | | $ | 181,900 | | | $ | (13,787 | ) | | $ | — | | | $ | (13,787 | ) |
| 3-month USD-LIBOR | | 2.325% | | | 5/2/2024 | | | | 418,100 | | | | (31,736 | ) | | | — | | | | (31,736 | ) |
| U.S. EFFR | | 0.11% | | | 5/18/2024 | | | | 251,500 | | | | 10 | | | | — | | | | 10 | |
| 3-month USD-LIBOR | | 1.547% | | | 10/25/2024 | | | | 252,000 | | | | (13,240 | ) | | | — | | | | (13,240 | ) |
| 3-month USD-LIBOR | | 1.548% | | | 10/28/2024 | | | | 42,000 | | | | (2,212 | ) | | | — | | | | (2,212 | ) |
| U.S. EFFR | | 0.1275% | | | 6/25/2025 | | | | 107,200 | | | | (97 | ) | | | — | | | | (97 | ) |
| U.S. EFFR | | 0.0975% | | | 6/30/2025 | | | | 58,252 | | | | 35 | | | | — | | | | 35 | |
| U.S. EFFR | | 0.105% | | | 6/30/2025 | | | | 107,200 | | | | 25 | | | | — | | | | 25 | |
| U.S. EFFR | | 0.106% | | | 6/30/2025 | | | | 47,348 | | | | 9 | | | | — | | | | 9 | |
| 3-month USD-LIBOR | | 0.81% | | | 7/28/2045 | | | | 161,600 | | | | 9,368 | | | | (96 | ) | | | 9,464 | |
| 3-month USD-LIBOR | | 0.811% | | | 7/27/2050 | | | | 65,300 | | | | 4,679 | | | | — | | | | 4,679 | |
| | | | | | | | | | | | | | | | | $ | (96 | ) | | $ | (46,850 | ) |
| 6 | American Funds Mortgage Fund |
The following footnotes apply to either the individual securities noted or one or more of the securities aggregated and listed as a single line item.
| 1 | Principal payments may be made periodically. Therefore, the effective maturity date may be earlier than the stated maturity date. |
| 2 | Coupon rate may change periodically. Reference rate and spread are as of the most recent information available. Some coupon rates are determined by the issuer or agent based on current market conditions; therefore, the reference rate and spread are not available. |
| 3 | Purchased on a TBA basis. |
| 4 | All or a portion of this security was pledged as collateral. The total value of pledged collateral was $56,796,000, which represented .79% of the net assets of the fund. |
| 5 | Index-linked bond whose principal amount moves with a government price index. |
| 6 | Acquired in a transaction exempt from registration under Rule 144A or Section 4(2) of the Securities Act of 1933. May be resold in the U.S. in transactions exempt from registration, normally to qualified institutional buyers. The total value of all such securities, including those in “Other securities,” was $1,103,366,000, which represented 15.40% of the net assets of the fund. |
| 7 | Notional amount is calculated based on the number of contracts and notional contract size. |
| 8 | Value is calculated based on the notional amount and current market price. |
Key to abbreviations and symbol
EFFR = Effective Federal Funds Rate
LIBOR = London Interbank Offered Rate
TBA = To-be-announced
USD/$ = U.S. dollars
See notes to financial statements.
| American Funds Mortgage Fund | 7 |
Financial statements
| Statement of assets and liabilities | |
| at August 31, 2020 | (dollars in thousands) |
| Assets: | | | | | | | | |
| Investment securities in unaffiliated issuers, at value (cost: $10,395,570) | | | | | | $ | 10,531,688 | |
| Cash | | | | | | | 293 | |
| Receivables for: | | | | | | | | |
| Sales of investments | | $ | 6,714,540 | | | | | |
| Sales of fund’s shares | | | 7,513 | | | | | |
| Interest | | | 11,845 | | | | | |
| Variation margin on futures contracts | | | 1,729 | | | | | |
| Variation margin on swap contracts | | | 202 | | | | 6,735,829 | |
| | | | | | | | 17,267,810 | |
| Liabilities: | | | | | | | | |
| Payables for: | | | | | | | | |
| Purchases of investments | | | 10,070,223 | | | | | |
| Repurchases of fund’s shares | | | 27,037 | | | | | |
| Dividends on fund’s shares | | | 7 | | | | | |
| Investment advisory services | | | 1,148 | | | | | |
| Services provided by related parties | | | 304 | | | | | |
| Trustees’ deferred compensation | | | 45 | | | | | |
| Variation margin on futures contracts | | | 856 | | | | | |
| Variation margin on swap contracts | | | 2,715 | | | | | |
| Other | | | 7 | | | | 10,102,342 | |
| Net assets at August 31, 2020 | | | | | | $ | 7,165,468 | |
| | | | | | | | | |
| Net assets consist of: | | | | | | | | |
| Capital paid in on shares of beneficial interest | | | | | | $ | 6,819,320 | |
| Total distributable earnings | | | | | | | 346,148 | |
| Net assets at August 31, 2020 | | | | | | $ | 7,165,468 | |
See notes to financial statements.
| 8 | American Funds Mortgage Fund |
(dollars and shares in thousands, except per-share amounts)
Shares of beneficial interest issued and outstanding (no stated par value) —
unlimited shares authorized (675,660 total shares outstanding)
| | | Net assets | | | Shares
outstanding | | | Net asset value
per share | |
| Class A | | $ | 235,076 | | | | 22,167 | | | $ | 10.60 | |
| Class C | | | 14,672 | | | | 1,390 | | | | 10.56 | |
| Class T | | | 11 | | | | 1 | | | | 10.60 | |
| Class F-1 | | | 19,787 | | | | 1,866 | | | | 10.61 | |
| Class F-2 | | | 179,681 | | | | 16,936 | | | | 10.61 | |
| Class F-3 | | | 28,854 | | | | 2,720 | | | | 10.61 | |
| Class 529-A | | | 29,308 | | | | 2,764 | | | | 10.60 | |
| Class 529-C | | | 2,677 | | | | 254 | | | | 10.54 | |
| Class 529-E | | | 1,579 | | | | 149 | | | | 10.60 | |
| Class 529-T | | | 11 | | | | 1 | | | | 10.60 | |
| Class 529-F-1 | | | 8,912 | | | | 840 | | | | 10.60 | |
| Class R-1 | | | 6,836 | | | | 648 | | | | 10.55 | |
| Class R-2 | | | 3,599 | | | | 341 | | | | 10.54 | |
| Class R-2E | | | 198 | | | | 19 | | | | 10.59 | |
| Class R-3 | | | 36,866 | | | | 3,484 | | | | 10.58 | |
| Class R-4 | | | 6,018 | | | | 567 | | | | 10.61 | |
| Class R-5E | | | 414 | | | | 39 | | | | 10.60 | |
| Class R-5 | | | 1,334 | | | | 126 | | | | 10.61 | |
| Class R-6 | | | 6,589,635 | | | | 621,348 | | | | 10.61 | |
See notes to financial statements.
| American Funds Mortgage Fund | 9 |
| Statement of operations | |
| for the year ended August 31, 2020 | (dollars in thousands) |
| Investment income: | | | | | | | | |
| Income: | | | | | | | | |
| Interest | | | | | | $ | 118,305 | |
| Fees and expenses*: | | | | | | | | |
| Investment advisory services | | $ | 14,928 | | | | | |
| Distribution services | | | 1,149 | | | | | |
| Transfer agent services | | | 767 | | | | | |
| Administrative services | | | 2,157 | | | | | |
| Reports to shareholders | | | 50 | | | | | |
| Registration statement and prospectus | | | 408 | | | | | |
| Trustees’ compensation | | | 33 | | | | | |
| Auditing and legal | | | 52 | | | | | |
| Custodian | | | 22 | | | | | |
| Other | | | 58 | | | | | |
| Total fees and expenses before reimbursements | | | 19,624 | | | | | |
| Less transfer agent services reimbursements | | | — | † | | | | |
| Total fees and expenses after reimbursements | | | | | | | 19,624 | |
| Net investment income | | | | | | | 98,681 | |
| | | | | | | | | |
| Net realized gain and unrealized appreciation: | | | | | | | | |
| Net realized gain (loss) on: | | | | | | | | |
| Investments in unaffiliated issuers | | | 242,714 | | | | | |
| Futures contracts | | | 140,161 | | | | | |
| Swap contracts | | | (30,660 | ) | | | 352,215 | |
| Net unrealized appreciation (depreciation) on: | | | | | | | | |
| Investments in unaffiliated issuers | | | 17,697 | | | | | |
| Futures contracts | | | (2,432 | ) | | | | |
| Swap contracts | | | 13,864 | | | | 29,129 | |
| Net realized gain and unrealized appreciation | | | | | | | 381,344 | |
| | | | | | | | | |
| Net increase in net assets resulting from operations | | | | | | $ | 480,025 | |
| * | Additional information related to class-specific fees and expenses is included in the notes to financial statements. |
| † | Amount less than one thousand. |
See notes to financial statements.
| 10 | American Funds Mortgage Fund |
| Statements of changes in net assets | |
| | (dollars in thousands) |
| | | Year ended August 31, | |
| | | 2020 | | | 2019 | |
| Operations: | | | | | | | | |
| Net investment income | | $ | 98,681 | | | $ | 134,997 | |
| Net realized gain | | | 352,215 | | | | 163,443 | |
| Net unrealized appreciation | | | 29,129 | | | | 68,081 | |
| Net increase in net assets resulting from operations | | | 480,025 | | | | 366,521 | |
| | | | | | | | | |
| Distributions paid or accrued to shareholders | | | (190,800 | ) | | | (144,716 | ) |
| | | | | | | | | |
| Net capital share transactions | | | 316,961 | | | | 1,451,181 | |
| | | | | | | | | |
| Total increase in net assets | | | 606,186 | | | | 1,672,986 | |
| | | | | | | | | |
| Net assets: | | | | | | | | |
| Beginning of year | | | 6,559,282 | | | | 4,886,296 | |
| End of year | | $ | 7,165,468 | | | $ | 6,559,282 | |
See notes to financial statements.
| American Funds Mortgage Fund | 11 |
Notes to financial statements
1. Organization
American Funds Mortgage Fund (the “fund”) is registered under the Investment Company Act of 1940 as an open-end, diversified management investment company. The fund seeks to provide current income and preservation of capital.
The fund has 19 share classes consisting of six retail share classes (Classes A, C, T, F-1, F-2 and F-3), five 529 college savings plan share classes (Classes 529-A, 529-C, 529-E, 529-T and 529-F-1) and eight retirement plan share classes (Classes R-1, R-2, R-2E, R-3, R-4, R-5E, R-5 and R-6). The 529 college savings plan share classes can be used to save for college education. The retirement plan share classes are generally offered only through eligible employer-sponsored retirement plans. The fund’s share classes are described further in the following table:
| Share class | | Initial sales charge | | Contingent deferred sales
charge upon redemption | | Conversion feature | |
| Classes A and 529-A | | Up to 3.75%1 | | None (except 1% for certain redemptions within 18 months of purchase without an initial sales charge) | | None | |
| Class C | | None | | 1% for redemptions within one year of purchase | | Class C converts to Class F-1 after 10 years2 | |
| Class 529-C | | None | | 1% for redemptions within one year of purchase | | Class 529-C converts to Class 529-A after 10 years3 | |
| Class 529-E | | None | | None | | None | |
| Classes T and 529-T4 | | Up to 2.50% | | None | | None | |
| Classes F-1, F-2, F-3 and 529-F-1 | | None | | None | | None | |
| Classes R-1, R-2, R-2E, R-3, R-4, R-5E, R-5 and R-6 | | None | | None | | None | |
| 1 | Up to 3.50% for Class 529-A shares purchased on or after June 30, 2020. |
| 2 | Effective June 30, 2020, Class C converts to Class A after 8 years. |
| 3 | Effective June 30, 2020, Class 529-C converts to Class 529-A after 5 years. |
| 4 | Class T and 529-T shares are not available for purchase. |
Holders of all share classes have equal pro rata rights to the assets, dividends and liquidation proceeds of the fund. Each share class has identical voting rights, except for the exclusive right to vote on matters affecting only its class. Share classes have different fees and expenses (“class-specific fees and expenses”), primarily due to different arrangements for distribution, transfer agent and administrative services. Differences in class-specific fees and expenses will result in differences in net investment income and, therefore, the payment of different per-share dividends by each share class.
2. Significant accounting policies
The fund is an investment company that applies the accounting and reporting guidance issued in Topic 946 by the U.S. Financial Accounting Standards Board. The fund’s financial statements have been prepared to comply with U.S. generally accepted accounting principles (“U.S. GAAP”). These principles require the fund’s investment adviser to make estimates and assumptions that affect reported amounts and disclosures. Actual results could differ from those estimates. Subsequent events, if any, have been evaluated through the date of issuance in the preparation of the financial statements. The fund follows the significant accounting policies described in this section, as well as the valuation policies described in the next section on valuation.
Security transactions and related investment income — Security transactions are recorded by the fund as of the date the trades are executed with brokers. Realized gains and losses from security transactions are determined based on the specific identified cost of the securities. In the event a security is purchased with a delayed payment date, the fund will segregate liquid assets sufficient to meet its payment obligations. Interest income is recognized on an accrual basis. Market discounts, premiums and original issue discounts on fixed-income securities are amortized daily over the expected life of the security.
Class allocations — Income, fees and expenses (other than class-specific fees and expenses) are allocated daily among the various share classes based on the relative value of their settled shares. Realized gains and losses and unrealized appreciation and depreciation are allocated daily among the various share classes based on their relative net assets. Class-specific fees and expenses, such as distribution, transfer agent and administrative services, are charged directly to the respective share class.
| 12 | American Funds Mortgage Fund |
Distributions paid or accrued to shareholders — Income dividends are declared daily after the determination of the fund’s net investment income and are paid to shareholders monthly. Capital gain distributions are recorded on the ex-dividend date.
3. Valuation
Capital Research and Management Company (“CRMC”), the fund’s investment adviser, values the fund’s investments at fair value as defined by U.S. GAAP. The net asset value of each share class of the fund is generally determined as of approximately 4:00 p.m. New York time each day the New York Stock Exchange is open.
Methods and inputs — The fund’s investment adviser uses the following methods and inputs to establish the fair value of the fund’s assets and liabilities. Use of particular methods and inputs may vary over time based on availability and relevance as market and economic conditions evolve.
Fixed-income securities, including short-term securities, are generally valued at prices obtained from one or more pricing vendors. Vendors value such securities based on one or more of the inputs described in the following table. The table provides examples of inputs that are commonly relevant for valuing particular classes of fixed-income securities in which the fund is authorized to invest. However, these classifications are not exclusive, and any of the inputs may be used to value any other class of fixed-income security.
| Fixed-income class | | Examples of standard inputs |
| All | | Benchmark yields, transactions, bids, offers, quotations from dealers and trading systems, new issues, spreads and other relationships observed in the markets among comparable securities; and proprietary pricing models such as yield measures calculated using factors such as cash flows, financial or collateral performance and other reference data (collectively referred to as “standard inputs”) |
| Bonds & notes of governments & government agencies | | Standard inputs and interest rate volatilities |
| Mortgage-backed; asset-backed obligations | | Standard inputs and cash flows, prepayment information, default rates, delinquency and loss assumptions, collateral characteristics, credit enhancements and specific deal information |
| Municipal securities | | Standard inputs and, for certain distressed securities, cash flows or liquidation values using a net present value calculation based on inputs that include, but are not limited to, financial statements and debt contracts |
When the fund’s investment adviser deems it appropriate to do so (such as when vendor prices are unavailable or deemed to be not representative), fixed-income securities will be valued in good faith at the mean quoted bid and ask prices that are reasonably and timely available (or bid prices, if ask prices are not available) or at prices for securities of comparable maturity, quality and type.
Exchange-traded futures are generally valued at the official settlement price of the exchange or market on which such instruments are traded, as of the close of business on the day the futures are being valued. Interest rate swaps are generally valued by pricing vendors based on market inputs that include the index and term of index, reset frequency, payer/receiver, currency and pay frequency.
Securities and other assets for which representative market quotations are not readily available or are considered unreliable by the fund’s investment adviser are fair valued as determined in good faith under fair valuation guidelines adopted by authority of the fund’s board of trustees as further described. The investment adviser follows fair valuation guidelines, consistent with U.S. Securities and Exchange Commission rules and guidance, to consider relevant principles and factors when making fair value determinations. The investment adviser considers relevant indications of value that are reasonably and timely available to it in determining the fair value to be assigned to a particular security, such as the type and cost of the security; contractual or legal restrictions on resale of the security; relevant financial or business developments of the issuer; actively traded similar or related securities; conversion or exchange rights on the security; related corporate actions; significant events occurring after the close of trading in the security; and changes in overall market conditions. In addition, the closing prices of equity securities that trade in markets outside U.S. time zones may be adjusted to reflect significant events that occur after the close of local trading but before the net asset value of each share class of the fund is determined. Fair valuations and valuations of investments that are not actively trading involve judgment and may differ materially from valuations that would have been used had greater market activity occurred.
Processes and structure — The fund’s board of trustees has delegated authority to the fund’s investment adviser to make fair value determinations, subject to board oversight. The investment adviser has established a Joint Fair Valuation Committee (the “Fair Valuation Committee”) to administer, implement and oversee the fair valuation process, and to make fair value decisions. The Fair Valuation
| American Funds Mortgage Fund | 13 |
Committee regularly reviews its own fair value decisions, as well as decisions made under its standing instructions to the investment adviser’s valuation teams. The Fair Valuation Committee reviews changes in fair value measurements from period to period and may, as deemed appropriate, update the fair valuation guidelines to better reflect the results of back testing and address new or evolving issues. The Fair Valuation Committee reports any changes to the fair valuation guidelines to the board of trustees. The fund’s board and audit committee also regularly review reports that describe fair value determinations and methods.
The fund’s investment adviser has also established a Fixed-Income Pricing Review Group to administer and oversee the fixed-income valuation process, including the use of fixed-income pricing vendors. This group regularly reviews pricing vendor information and market data. Pricing decisions, processes and controls over security valuation are also subject to additional internal reviews, including an annual control self-evaluation program facilitated by the investment adviser’s compliance group.
Classifications — The fund’s investment adviser classifies the fund’s assets and liabilities into three levels based on the inputs used to value the assets or liabilities. Level 1 values are based on quoted prices in active markets for identical securities. Level 2 values are based on significant observable market inputs, such as quoted prices for similar securities and quoted prices in inactive markets. Certain securities trading outside the U.S. may transfer between Level 1 and Level 2 due to valuation adjustments resulting from significant market movements following the close of local trading. Level 3 values are based on significant unobservable inputs that reflect the investment adviser’s determination of assumptions that market participants might reasonably use in valuing the securities. The valuation levels are not necessarily an indication of the risk or liquidity associated with the underlying investment. For example, U.S. government securities are reflected as Level 2 because the inputs used to determine fair value may not always be quoted prices in an active market. The following tables present the fund’s valuation levels as of August 31, 2020 (dollars in thousands):
| | | Investment securities |
| | | Level 1 | | | Level 2 | | | Level 3 | | | Total | |
| Assets: | | | | | | | | | | | | | | | | |
| Bonds, notes & other debt instruments: | | | | | | | | | | | | | | | | |
| Mortgage-backed obligations | | $ | — | | | $ | 6,425,464 | | | $ | — | | | $ | 6,425,464 | |
| U.S. Treasury bonds & notes | | | — | | | | 263,741 | | | | — | | | | 263,741 | |
| Federal agency bonds & notes | | | — | | | | 18,307 | | | | — | | | | 18,307 | |
| Other | | | — | | | | 93,353 | | | | — | | | | 93,353 | |
| Short-term securities | | | — | | | | 3,730,823 | | | | — | | | | 3,730,823 | |
| Total | | $ | — | | | $ | 10,531,688 | | | $ | — | | | $ | 10,531,688 | |
| | | | | | | | | | | | | |
| | | Other investments* |
| | | | Level 1 | | | | Level 2 | | | | Level 3 | | | | Total | |
| Assets: | | | | | | | | | | | | | | | | |
| Unrealized appreciation on futures contracts | | $ | 432 | | | $ | — | | | $ | — | | | $ | 432 | |
| Unrealized appreciation on interest rate swaps | | | — | | | | 14,222 | | | | — | | | | 14,222 | |
| Liabilities: | | | | | | | | | | | | | | | | |
| Unrealized depreciation on futures contracts | | | (1,711 | ) | | | — | | | | — | | | | (1,711 | ) |
| Unrealized depreciation on interest rate swaps | | | — | | | | (61,072 | ) | | | — | | | | (61,072 | ) |
| Total | | $ | (1,279 | ) | | $ | (46,850 | ) | | $ | — | | | $ | (48,129 | ) |
| * | Futures contracts and interest rate swaps are not included in the investment portfolio. |
4. Risk factors
Investing in the fund may involve certain risks including, but not limited to, those described below.
Investing in mortgage-related and other asset-backed securities — Mortgage-related securities, such as mortgage-backed securities, and other asset-backed securities, include debt obligations that represent interests in pools of mortgages or other income-bearing assets, such as consumer loans or receivables. While such securities are subject to the risks associated with investments in debt instruments generally (for example, credit, extension and interest rate risks), they are also subject to other and different risks. Mortgage-backed and other asset-backed securities are subject to changes in the payment patterns of borrowers of the underlying debt, potentially increasing the volatility of the securities and the fund’s net asset value. When interest rates fall, borrowers are more likely to refinance or prepay their debt before its stated maturity. This may result in the fund having to reinvest the proceeds in lower yielding securities, effectively reducing the fund’s income. Conversely, if interest rates rise and borrowers repay their debt more slowly than expected, the time in which the mortgage-backed and other asset-backed securities are paid off could be extended, reducing the fund’s cash available for reinvestment
| 14 | American Funds Mortgage Fund |
in higher yielding securities. Mortgage-backed securities are also subject to the risk that underlying borrowers will be unable to meet their obligations and the value of property that secures the mortgages may decline in value and be insufficient, upon foreclosure, to repay the associated loans. Investments in asset-backed securities are subject to similar risks.
Market conditions — The prices of, and the income generated by, the securities held by the fund may decline – sometimes rapidly or unpredictably – due to various factors, including events or conditions affecting the general economy or particular industries; overall market changes; local, regional or global political, social or economic instability; governmental, governmental agency or central bank responses to economic conditions; and currency exchange rate, interest rate and commodity price fluctuations.
Economies and financial markets throughout the world are highly interconnected. Economic, financial or political events, trading and tariff arrangements, wars, terrorism, cybersecurity events, natural disasters, public health emergencies (such as the spread of infectious disease) and other circumstances in one country or region, including actions taken by governmental or quasi-governmental authorities in response to any of the foregoing, could have impacts on global economies or markets. As a result, whether or not the fund invests in securities of issuers located in or with significant exposure to the countries affected, the value and liquidity of the fund’s investments may be negatively affected by developments in other countries and regions.
Issuer risks — The prices of, and the income generated by, securities held by the fund may decline in response to various factors directly related to the issuers of such securities, including reduced demand for an issuer’s goods or services, poor management performance, major litigation related to the issuer, changes in government regulations affecting the issuer or its competitive environment and strategic initiatives such as mergers, acquisitions or dispositions and the market response to any such initiatives.
Investing in debt instruments — The prices of, and the income generated by, bonds and other debt securities held by the fund may be affected by changing interest rates and by changes in the effective maturities and credit ratings of these securities.
A bond’s effective maturity is the market’s trading assessment of its maturity. A portfolio’s dollar-weighted average effective maturity is the weighted average of all effective maturities in the portfolio, where more weight is given to larger holdings. Rising interest rates will generally cause the prices of bonds and other debt securities to fall. A general rise in interest rates may cause investors to sell debt securities on a large scale, which could also adversely affect the price and liquidity of debt securities and could also result in increased redemptions from the fund. Falling interest rates may cause an issuer to redeem, call or refinance a debt security before its stated maturity, which may result in the fund failing to recoup the full amount of its initial investment and having to reinvest the proceeds in lower yielding securities. Longer maturity debt securities generally have greater sensitivity to changes in interest rates and may be subject to greater price fluctuations than shorter maturity debt securities.
Bonds and other debt securities are also subject to credit risk, which is the possibility that the credit strength of an issuer or guarantor will weaken or be perceived to be weaker, and/or an issuer of a debt security will fail to make timely payments of principal or interest and the security will go into default. A downgrade or default affecting any of the fund’s securities could cause the value of the fund’s shares to decrease. Lower quality debt securities generally have higher rates of interest and may be subject to greater price fluctuations than higher quality debt securities. Credit risk is gauged, in part, by the credit ratings of the debt securities in which the fund invests. However, ratings are only the opinions of the rating agencies issuing them and are not guarantees as to credit quality or an evaluation of market risk. The fund’s investment adviser relies on its own credit analysts to research issuers and issues in seeking to assess credit and default risks.
Liquidity risk — Certain fund holdings may be or may become difficult or impossible to sell, particularly during times of market turmoil. Liquidity may be impacted by the lack of an active market for a holding, legal or contractual restrictions on resale, or the reduced number and capacity of market participants to make a market in such holding. Market prices for less liquid or illiquid holdings may be volatile, and reduced liquidity may have an adverse impact on the market price of such holdings. Additionally, the sale of less liquid or illiquid holdings may involve substantial delays (including delays in settlement) and additional costs and the fund may be unable to sell such holdings when necessary to meet its liquidity needs or may be forced to sell at a loss.
Investing in securities backed by the U.S. government — Securities backed by the U.S. Treasury or the full faith and credit of the U.S. government are guaranteed only as to the timely payment of interest and principal when held to maturity. Accordingly, the current market values for these securities will fluctuate with changes in interest rates and the credit rating of the U.S. government. Securities issued by government-sponsored entities and federal agencies and instrumentalities that are not backed by the full faith and credit of the U.S. government are neither issued nor guaranteed by the U.S. government.
Investing in future delivery contracts — The fund may enter into contracts, such as to-be-announced contracts and mortgage dollar rolls, that involve the fund selling mortgage-related securities and simultaneously contracting to repurchase similar securities for delivery at a
| American Funds Mortgage Fund | 15 |
future date at a predetermined price. This can increase the fund’s market exposure, and the market price of the securities that the fund contracts to repurchase could drop below their purchase price. While the fund can preserve and generate capital through the use of such contracts by, for example, realizing the difference between the sale price and the future purchase price, the income generated by the fund may be reduced by engaging in such transactions. In addition, these transactions increase the turnover rate of the fund.
Investing in inflation-linked bonds — The values of inflation-linked bonds generally fluctuate in response to changes in real interest rates —i.e., rates of interest after factoring in inflation. A rise in real interest rates may cause the prices of inflation-linked securities to fall, while a decline in real interest rates may cause the prices to increase. Inflation-linked bonds may experience greater losses than other debt securities with similar durations when real interest rates rise faster than nominal interest rates. There can be no assurance that the value of an inflation-linked security will be directly correlated to changes in interest rates; for example, if interest rates rise for reasons other than inflation, the increase may not be reflected in the security’s inflation measure.
Investing in inflation-linked bonds may also reduce the fund’s distributable income during periods of deflation. If prices for goods and services decline throughout the economy, the principal and income on inflation-linked securities may decline and result in losses to the fund.
Investing in derivatives — The use of derivatives involves a variety of risks, which may be different from, or greater than, the risks associated with investing in traditional securities, such as stocks and bonds. Changes in the value of a derivative may not correlate perfectly with, and may be more sensitive to market events than, the underlying asset, rate or index, and a derivative instrument may expose the fund to losses in excess of its initial investment. Derivatives may be difficult to value, difficult for the fund to buy or sell at an opportune time or price and difficult, or even impossible, to terminate or otherwise offset. The fund’s use of derivatives may result in losses to the fund, and investing in derivatives may reduce the fund’s returns and increase the fund’s price volatility. The fund’s counterparty to a derivative transaction (including, if applicable, the fund’s clearing broker, the derivatives exchange or the clearinghouse) may be unable or unwilling to honor its financial obligations in respect of the transaction. In certain cases, the fund may be hindered or delayed in exercising remedies against or closing out derivative instruments with a counterparty, which may result in additional losses.
Management — The investment adviser to the fund actively manages the fund’s investments. Consequently, the fund is subject to the risk that the methods and analyses, including models, tools and data, employed by the investment adviser in this process may be flawed or incorrect and may not produce the desired results. This could cause the fund to lose value or its investment results to lag relevant benchmarks or other funds with similar objectives.
5. Certain investment techniques
Index-linked bonds — The fund has invested in index-linked bonds, which are fixed-income securities whose principal value is periodically adjusted to a government price index. Over the life of an index-linked bond, interest is paid on the adjusted principal value. Increases or decreases in the principal value of index-linked bonds are recorded as interest income in the fund’s statement of operations.
Mortgage dollar rolls — The fund has entered into mortgage dollar roll transactions in which the fund sells a mortgage-backed security to a counterparty and simultaneously enters into an agreement with the same counterparty to buy back a similar security on a specific future date at a predetermined price. Mortgage dollar rolls are accounted for as purchase and sale transactions. Portfolio turnover rates excluding and including mortgage dollar rolls are presented at the end of the fund’s financial highlights table.
Futures contracts — The fund has entered into futures contracts, which provide for the future sale by one party and purchase by another party of a specified amount of a specific financial instrument for a specified price, date, time and place designated at the time the contract is made. Futures contracts are used to strategically manage the fund’s interest rate sensitivity by increasing or decreasing the duration of the fund or a portion of the fund’s portfolio.
Upon entering into futures contracts, and to maintain the fund’s open positions in futures contracts, the fund is required to deposit with a futures broker, known as a futures commission merchant (“FCM”), in a segregated account in the name of the FCM an amount of cash, U.S. government securities or other liquid securities, known as initial margin. The margin required for a particular futures contract is set by the exchange on which the contract is traded to serve as collateral, and may be significantly modified from time to time by the exchange during the term of the contract.
On a daily basis, the fund pays or receives variation margin based on the increase or decrease in the value of the futures contracts and records variation margin on futures contracts in the statement of assets and liabilities. In addition, the fund segregates liquid assets equivalent to the fund’s outstanding obligations under the contract in excess of the initial margin and variation margin, if any. Futures contracts may involve a risk of loss in excess of the variation margin shown on the fund’s statement of assets and liabilities. The fund
| 16 | American Funds Mortgage Fund |
records realized gains or losses at the time the futures contract is closed or expires. Net realized gains or losses and net unrealized appreciation or depreciation from futures contracts are recorded in the fund’s statement of operations. The average month-end notional amount of futures contracts while held was $2,566,942,000.
Interest rate swaps — The fund has entered into interest rate swap contracts, which are agreements to exchange one stream of future interest payments for another based on a specified notional amount. Typically, interest rate swaps exchange a fixed interest rate for a payment that floats relative to a benchmark or vice versa. The fund’s investment adviser uses interest rate swaps to seek to manage the interest rate sensitivity of the fund by increasing or decreasing the duration of the fund or a portion of the fund’s portfolio. Risks may arise as a result of the fund’s investment adviser incorrectly anticipating changes in interest rates, increased volatility, reduced liquidity and the potential inability of counterparties to meet the terms of their agreements.
Upon entering into an interest rate swap contract, the fund is required to deposit cash, U.S. government securities or other liquid securities, which is known as initial margin. Generally, the initial margin required for a particular interest rate swap is set and held as collateral by the clearinghouse on which the contract is cleared. The amount of initial margin required may be significantly modified from time to time by the clearinghouse during the term of the contract.
On a daily basis, the fund’s investment adviser records daily interest accruals related to the exchange of future payments as a receivable and payable in the fund’s statement of assets and liabilities. The fund also pays or receives a variation margin based on the increase or decrease in the value of the interest rate swaps, including accrued interest, and records variation margin on interest rate swaps in the statement of assets and liabilities. The fund records realized gains and losses on both the net accrued interest and any gain or loss recognized at the time the interest rate swap is closed or expires. Net realized gains or losses, as well as any net unrealized appreciation or depreciation, from interest rate swaps are recorded in the fund’s statement of operations. The average month-end notional amount of interest rate swaps while held was $9,820,919,000.
The following tables identify the location and fair value amounts on the fund’s statement of assets and liabilities and the effect on the fund’s statement of operations resulting from the fund’s use of futures contracts and interest rate swaps as of, or for the year ended, August 31, 2020 (dollars in thousands):
| | | | | Assets | | | Liabilities | |
| Contracts | | Risk type | | Location on statement of
assets and liabilities | | Value | | | Location on statement of
assets and liabilities | | Value | |
| Futures | | Interest | | Unrealized appreciation* | | $ | 432 | | | Unrealized depreciation* | | $ | 1,711 | |
| Swap | | Interest | | Unrealized appreciation* | | | 14,222 | | | Unrealized depreciation* | | | 61,072 | |
| | | | | | | $ | 14,654 | | | | | $ | 62,783 | |
| | | | | | | | | | | | | |
| | | | | Net realized gain (loss) | | | Net unrealized (depreciation) appreciation | |
| Contracts | | Risk type | | Location on statement of operations | | Value | | | Location on statement of operations | | Value | |
| Futures | | Interest | | Net realized gain on futures contracts | | $ | 140,161 | | | Net unrealized depreciation on futures contracts | | $ | (2,432 | ) |
| Swap | | Interest | | Net realized loss on swap contracts | | | (30,660 | ) | | Net unrealized appreciation on swap contracts | | | 13,864 | |
| | | | | | | $ | 109,501 | | | | | $ | 11,432 | |
| * | Includes cumulative appreciation/depreciation on futures contracts and interest rate swaps as reported in the applicable tables following the fund’s investment portfolio. Only current day’s variation margin is reported within the statement of assets and liabilities. |
Collateral — The fund receives or pledges highly liquid assets, such as cash or U.S. government securities, as collateral due to its use of futures contracts, interest rate swaps and future delivery contracts. For futures contracts and interest rate swaps, the fund pledges collateral for initial and variation margin by contract. For future delivery contracts, the fund either receives or pledges collateral based on the net gain or loss on unsettled contracts by certain counterparties. The purpose of the collateral is to cover potential losses that could occur in the event that either party cannot meet its contractual obligation. Non-cash collateral pledged by the fund, if any, is disclosed in the fund’s investment portfolio, and cash collateral pledged by the fund, if any, is held in a segregated account with the fund’s custodian, which is reflected as pledged cash collateral in the fund’s statement of assets and liabilities.
| American Funds Mortgage Fund | 17 |
6. Taxation and distributions
Federal income taxation — The fund complies with the requirements under Subchapter M of the Internal Revenue Code applicable to mutual funds and intends to distribute substantially all of its net taxable income and net capital gains each year. The fund is not subject to income taxes to the extent such distributions are made. Therefore, no federal income tax provision is required.
As of and during the year ended August 31, 2020, the fund did not have a liability for any unrecognized tax benefits. The fund recognizes interest and penalties, if any, related to unrecognized tax benefits as income tax expense in the statement of operations. During the period, the fund did not incur any significant interest or penalties.
The fund’s tax returns are not subject to examination by federal, state and, if applicable, non-U.S. tax authorities after the expiration of each jurisdiction’s statute of limitations, which is generally three years after the date of filing but can be extended in certain jurisdictions.
Distributions — Distributions paid to shareholders are based on net investment income and net realized gains determined on a tax basis, which may differ from net investment income and net realized gains for financial reporting purposes. These differences are due primarily to different treatment for items such as short-term capital gains and losses; capital losses related to sales of certain securities within 30 days of purchase; cost of investments sold; paydowns on fixed-income securities and income on certain investments. The fiscal year in which amounts are distributed may differ from the year in which the net investment income and net realized gains are recorded by the fund for financial reporting purposes. The fund may also designate a portion of the amount paid to redeeming shareholders as a distribution for tax purposes.
During the year ended August 31, 2020, the fund reclassified $33,432,000 from total distributable earnings to capital paid in on shares of beneficial interest to align financial reporting with tax reporting.
As of August 31, 2020, the tax basis components of distributable earnings, unrealized appreciation (depreciation) and cost of investments were as follows (dollars in thousands):
| Undistributed ordinary income | | $ | 179,751 | |
| Undistributed long-term capital gains | | | 81,831 | |
| Gross unrealized appreciation on investments | | | 150,758 | |
| Gross unrealized depreciation on investments | | | (64,684 | ) |
| Net unrealized appreciation on investments | | | 86,074 | |
| Cost of investments | | | 10,397,581 | |
| 18 | American Funds Mortgage Fund |
Distributions paid or accrued were characterized for tax purposes as follows (dollars in thousands):
| | | Year ended August 31, 2020 | | | Year ended August 31, 2019 | |
| Share class | | Ordinary
income | | | Long-term
capital gains | | | Total
distributions
paid or
accrued | | | Ordinary
income | | | Long-term
capital gains | | | Total
distributions
paid or
accrued | |
| Class A | | $ | 4,107 | | | $ | 666 | | | $ | 4,773 | | | $ | 4,156 | | | $ | — | | | $ | 4,156 | |
| Class C | | | 212 | | | | 53 | | | | 265 | | | | 216 | | | | — | | | | 216 | |
| Class T | | | — | * | | | — | * | | | — | * | | | — | * | | | — | | | | — | * |
| Class F-1 | | | 364 | | | | 58 | | | | 422 | | | | 372 | | | | — | | | | 372 | |
| Class F-2 | | | 3,090 | | | | 425 | | | | 3,515 | | | | 2,526 | | | | — | | | | 2,526 | |
| Class F-3 | | | 504 | | | | 64 | | | | 568 | | | | 404 | | | | — | | | | 404 | |
| Class 529-A | | | 493 | | | | 83 | | | | 576 | | | | 462 | | | | — | | | | 462 | |
| Class 529-C | | | 57 | | | | 14 | | | | 71 | | | | 57 | | | | — | | | | 57 | |
| Class 529-E | | | 27 | | | | 5 | | | | 32 | | | | 28 | | | | — | | | | 28 | |
| Class 529-T | | | — | * | | | — | * | | | — | * | | | — | * | | | — | | | | — | * |
| Class 529-F-1 | | | 182 | | | | 26 | | | | 208 | | | | 183 | | | | — | | | | 183 | |
| Class R-1 | | | 89 | | | | 25 | | | | 114 | | | | 62 | | | | — | | | | 62 | |
| Class R-2 | | | 44 | | | | 11 | | | | 55 | | | | 51 | | | | — | | | | 51 | |
| Class R-2E | | | 3 | | | | 1 | | | | 4 | | | | 2 | | | | — | | | | 2 | |
| Class R-3 | | | 618 | | | | 119 | | | | 737 | | | | 729 | | | | — | | | | 729 | |
| Class R-4 | | | 99 | | | | 16 | | | | 115 | | | | 111 | | | | — | | | | 111 | |
| Class R-5E | | | 7 | | | | 1 | | | | 8 | | | | 3 | | | | — | | | | 3 | |
| Class R-5 | | | 24 | | | | 3 | | | | 27 | | | | 32 | | | | — | | | | 32 | |
| Class R-6 | | | 157,459 | | | | 21,851 | | | | 179,310 | | | | 135,322 | | | | — | | | | 135,322 | |
| Total | | $ | 167,379 | | | $ | 23,421 | | | $ | 190,800 | | | $ | 144,716 | | | $ | — | | | $ | 144,716 | |
| * | Amount less than one thousand. |
7. Fees and transactions with related parties
CRMC, the fund’s investment adviser, is the parent company of American Funds Distributors®, Inc. (“AFD”), the principal underwriter of the fund’s shares, and American Funds Service Company® (“AFS”), the fund’s transfer agent. CRMC, AFD and AFS are considered related parties to the fund.
Investment advisory services — The fund has an investment advisory and service agreement with CRMC that provides for monthly fees accrued daily. These fees are based on a series of decreasing annual rates beginning with 0.300% on the first $60 million of daily net assets and decreasing to 0.140% on such assets in excess of $10 billion. The agreement also provides for monthly fees, accrued daily, based on a series of decreasing rates beginning with 3.00% on the first $3,333,333 of the fund’s monthly gross income and decreasing to 2.00% on such income in excess of $8,333,333. For the year ended August 31, 2020, the investment advisory services fee was $14,928,000, which was equivalent to an annualized rate of 0.208% of average daily net assets.
Class-specific fees and expenses — Expenses that are specific to individual share classes are accrued directly to the respective share class. The principal class-specific fees and expenses are further described below:
Distribution services — The fund has plans of distribution for all share classes, except Class F-2, F-3, R-5E, R-5 and R-6 shares. Under the plans, the board of trustees approves certain categories of expenses that are used to finance activities primarily intended to sell fund shares and service existing accounts. The plans provide for payments, based on an annualized percentage of average daily net assets, ranging from 0.30% to 1.00% as noted in this section. In some cases, the board of trustees has limited the amounts that may be paid to less than the maximum allowed by the plans. All share classes with a plan may use up to 0.25% of average daily net assets to pay service fees, or to compensate AFD for paying service fees, to firms that have entered into agreements with AFD to provide
| American Funds Mortgage Fund | 19 |
certain shareholder services. The remaining amounts available to be paid under each plan are paid to dealers to compensate them for their sales activities.
| Share class | | Currently approved limits | | Plan limits |
| Class A | | | 0.25 | % | | | 0.30 | % |
| Class 529-A | | | 0.25 | | | | 0.50 | |
| Classes C, 529-C and R-1 | | | 1.00 | | | | 1.00 | |
| Class R-2 | | | 0.75 | | | | 1.00 | |
| Class R-2E | | | 0.60 | | | | 0.85 | |
| Classes 529-E and R-3 | | | 0.50 | | | | 0.75 | |
| Classes T, F-1, 529-T, 529-F-1 and R-4 | | | 0.25 | | | | 0.50 | |
For Class A and 529-A shares, distribution-related expenses include the reimbursement of dealer and wholesaler commissions paid by AFD for certain shares sold without a sales charge. These share classes reimburse AFD for amounts billed within the prior 15 months but only to the extent that the overall annual expense limits are not exceeded. As of August 31, 2020, unreimbursed expenses subject to reimbursement totaled $112,000 for Class A shares. There were no unreimbursed expenses subject to reimbursement for Class 529-A shares.
Transfer agent services — The fund has a shareholder services agreement with AFS under which the fund compensates AFS for providing transfer agent services to each of the fund’s share classes. These services include recordkeeping, shareholder communications and transaction processing. In addition, the fund reimburses AFS for amounts paid to third parties for performing transfer agent services on behalf of fund shareholders. For the year ended August 31, 2020, CRMC reimbursed transfer agent services fees of less than $1,000 each for Class R-2E and Class R-5E shares. CRMC does not intend to recoup these reimbursements.
Administrative services — The fund has an administrative services agreement with CRMC under which the fund compensates CRMC for providing administrative services to all share classes. Administrative services are provided by CRMC and its affiliates to help assist third parties providing non-distribution services to fund shareholders. These services include providing in-depth information on the fund and market developments that impact fund investments. Administrative services also include, but are not limited to, coordinating, monitoring and overseeing third parties that provide services to fund shareholders. The agreement provides the fund the ability to charge an administrative services fee at the annual rate of 0.05% of the daily net assets attributable to each share class of the fund. Currently the fund pays CRMC an administrative services fee at the annual rate of 0.03% of daily net assets attributable to each share class of the fund for CRMC’s provision of administrative services.
529 plan services — Each 529 share class is subject to service fees to compensate the Virginia College Savings Plan (“Virginia529”) for its oversight and administration of the CollegeAmerica 529 college savings plan. The fee is based on the combined net assets invested in Class 529 and ABLE shares of the American Funds. Class ABLE shares are offered on other American Funds by Virginia529 through ABLEAmerica®, a tax-advantaged savings program for individuals with disabilities. Prior to January 1, 2020, the quarterly fee was based on a series of decreasing annual rates beginning with 0.10% on the first $20 billion of the combined net assets invested in the American Funds and decreasing to 0.03% on such assets in excess of $100 billion. Effective January 1, 2020, the quarterly fee was amended to a series of decreasing annual rates beginning with 0.09% on the first $20 billion of the combined net assets invested in the American Funds and decreasing to 0.03% on such assets in excess of $100 billion. The fee for any given calendar quarter is accrued and calculated on the basis of the average net assets of Class 529 and ABLE shares of the American Funds for the last month of the prior calendar quarter. The fee is included in other expenses in the fund’s statement of operations. Virginia529 is not considered a related party to the fund.
| 20 | American Funds Mortgage Fund |
For the year ended August 31, 2020, class-specific expenses under the agreements were as follows (dollars in thousands):
| | | Distribution | | Transfer agent | | Administrative | | 529 plan | |
| Share class | | services | | services | | services | | services | |
| Class A | | $540 | | $336 | | $65 | | Not applicable | |
| Class C | | 161 | | 26 | | 5 | | Not applicable | |
| Class T | | — | | — | * | — | * | Not applicable | |
| Class F-1 | | 47 | | 26 | | 6 | | Not applicable | |
| Class F-2 | | Not applicable | | 173 | | 44 | | Not applicable | |
| Class F-3 | | Not applicable | | 1 | | 7 | | Not applicable | |
| Class 529-A | | 63 | | 38 | | 8 | | $17 | |
| Class 529-C | | 43 | | 6 | | 1 | | 3 | |
| Class 529-E | | 8 | | 1 | | — | * | 1 | |
| Class 529-T | | — | | — | * | — | * | — | * |
| Class 529-F-1 | | — | | 12 | | 3 | | 5 | |
| Class R-1 | | 64 | | 15 | | 2 | | Not applicable | |
| Class R-2 | | 26 | | 13 | | 1 | | Not applicable | |
| Class R-2E | | 1 | | 1 | | — | * | Not applicable | |
| Class R-3 | | 183 | | 108 | | 11 | | Not applicable | |
| Class R-4 | | 13 | | 6 | | 2 | | Not applicable | |
| Class R-5E | | Not applicable | | 1 | | — | * | Not applicable | |
| Class R-5 | | Not applicable | | 1 | | — | * | Not applicable | |
| Class R-6 | | Not applicable | | 3 | | 2,002 | | Not applicable | |
| Total class-specific expenses | | $1,149 | | $767 | | $2,157 | | $26 | |
| * | Amount less than one thousand. |
Trustees’ deferred compensation — Trustees who are unaffiliated with CRMC may elect to defer the cash payment of part or all of their compensation. These deferred amounts, which remain as liabilities of the fund, are treated as if invested in shares of the fund or other American Funds. These amounts represent general, unsecured liabilities of the fund and vary according to the total returns of the selected funds. Trustees’ compensation of $33,000 in the fund’s statement of operations reflects $29,000 in current fees (either paid in cash or deferred) and a net increase of $4,000 in the value of the deferred amounts.
Affiliated officers and trustees — Officers and certain trustees of the fund are or may be considered to be affiliated with CRMC, AFD and AFS. No affiliated officers or trustees received any compensation directly from the fund.
Security transactions with related funds — The fund may purchase securities from, or sell securities to, other funds managed by CRMC (or funds managed by certain affiliates of CRMC) under procedures adopted by the fund’s board of trustees. The funds involved in such transactions are considered related by virtue of having a common investment adviser (or affiliated investment advisers), common trustees and/or common officers. When such transactions occur, each transaction is executed at the current market price of the security and no brokerage commissions or fees are paid in accordance with Rule 17a-7 of the 1940 Act. During the year ended August 31, 2020, the fund did not engage in any such purchase or sale transactions with any related funds.
Interfund lending — Pursuant to an exemptive order issued by the SEC, the fund, along with other CRMC-managed funds (or funds managed by certain affiliates of CRMC), may participate in an interfund lending program. The program provides an alternate credit facility that permits the funds to lend or borrow cash for temporary purposes directly to or from one another, subject to the conditions of the exemptive order. The fund did not lend or borrow cash through the interfund lending program at any time during the year ended August 31, 2020.
| American Funds Mortgage Fund | 21 |
8. Capital share transactions
Capital share transactions in the fund were as follows (dollars and shares in thousands):
| | | Sales* | | | Reinvestments of
distributions | | | Repurchases* | | | Net increase
(decrease) | |
| Share class | | Amount | | | Shares | | | Amount | | | Shares | | | Amount | | | Shares | | | Amount | | | Shares | |
| | | | | | | | | | | | | | | | | | | | | | | | | | | | | | | | | |
| Year ended August 31, 2020 | | | | | | | | | | | | | | | | | | | | | | | | | |
| | | | | | | | | | | | | | | | | | | | | | | | | | | | | | | | | |
| Class A | | $ | 70,495 | | | | 6,820 | | | $ | 4,710 | | | | 461 | | | $ | (46,586 | ) | | | (4,494 | ) | | $ | 28,619 | | | | 2,787 | |
| Class C | | | 7,114 | | | | 691 | | | | 262 | | | | 26 | | | | (9,353 | ) | | | (903 | ) | | | (1,977 | ) | | | (186 | ) |
| Class T | | | — | | | | — | | | | — | | | | — | | | | — | | | | — | | | | — | | | | — | |
| Class F-1 | | | 9,970 | | | | 959 | | | | 420 | | | | 41 | | | | (9,701 | ) | | | (934 | ) | | | 689 | | | | 66 | |
| Class F-2 | | | 130,990 | | | | 12,582 | | | | 3,483 | | | | 340 | | | | (82,473 | ) | | | (7,920 | ) | | | 52,000 | | | | 5,002 | |
| Class F-3 | | | 19,131 | | | | 1,838 | | | | 568 | | | | 55 | | | | (9,565 | ) | | | (912 | ) | | | 10,134 | | | | 981 | |
| Class 529-A | | | 10,810 | | | | 1,044 | | | | 574 | | | | 56 | | | | (6,827 | ) | | | (660 | ) | | | 4,557 | | | | 440 | |
| Class 529-C | | | 1,962 | | | | 192 | | | | 71 | | | | 7 | | | | (3,588 | ) | | | (344 | ) | | | (1,555 | ) | | | (145 | ) |
| Class 529-E | | | 417 | | | | 41 | | | | 32 | | | | 3 | | | | (456 | ) | | | (44 | ) | | | (7 | ) | | | — | † |
| Class 529-T | | | — | | | | — | | | | — | † | | | — | † | | | — | | | | — | | | | — | † | | | — | † |
| Class 529-F-1 | | | 2,424 | | | | 236 | | | | 208 | | | | 20 | | | | (2,069 | ) | | | (201 | ) | | | 563 | | | | 55 | |
| Class R-1 | | | 6,873 | | | | 675 | | | | 113 | | | | 11 | | | | (4,391 | ) | | | (426 | ) | | | 2,595 | | | | 260 | |
| Class R-2 | | | 1,610 | | | | 156 | | | | 55 | | | | 5 | | | | (1,657 | ) | | | (162 | ) | | | 8 | | | | (1 | ) |
| Class R-2E | | | 69 | | | | 7 | | | | 3 | | | | 1 | | | | (38 | ) | | | (4 | ) | | | 34 | | | | 4 | |
| Class R-3 | | | 12,509 | | | | 1,207 | | | | 732 | | | | 72 | | | | (18,410 | ) | | | (1,788 | ) | | | (5,169 | ) | | | (509 | ) |
| Class R-4 | | | 3,788 | | | | 363 | | | | 114 | | | | 11 | | | | (2,855 | ) | | | (277 | ) | | | 1,047 | | | | 97 | |
| Class R-5E | | | 135 | | | | 13 | | | | 8 | | | | 1 | | | | (5 | ) | | | (1 | ) | | | 138 | | | | 13 | |
| Class R-5 | | | 611 | | | | 58 | | | | 26 | | | | 3 | | | | (424 | ) | | | (41 | ) | | | 213 | | | | 20 | |
| Class R-6 | | | 1,767,076 | | | | 171,059 | | | | 179,178 | | | | 17,512 | | | | (1,721,182 | ) | | | (164,127 | ) | | | 225,072 | | | | 24,444 | |
| Total net increase (decrease) | | $ | 2,045,984 | | | | 197,941 | | | $ | 190,557 | | | | 18,625 | | | $ | (1,919,580 | ) | | | (183,238 | ) | | $ | 316,961 | | | | 33,328 | |
| | | | | | | | | | | | | | | | | | | | | | | | | | | | | | | | | |
| Year ended August 31, 2019 | | | | | | | | | | | | | | | | | | | | | | | | | |
| | | | | | | | | | | | | | | | | | | | | | | | | | | | | | | | | |
| Class A | | $ | 39,375 | | | | 3,954 | | | $ | 4,080 | | | | 409 | | | $ | (49,124 | ) | | | (4,972 | ) | | $ | (5,669 | ) | | | (609 | ) |
| Class C | | | 4,255 | | | | 429 | | | | 214 | | | | 22 | | | | (4,681 | ) | | | (475 | ) | | | (212 | ) | | | (24 | ) |
| Class T | | | — | | | | — | | | | — | | | | — | | | | — | | | | — | | | | — | | | | — | |
| Class F-1 | | | 10,846 | | | | 1,094 | | | | 370 | | | | 37 | | | | (6,987 | ) | | | (702 | ) | | | 4,229 | | | | 429 | |
| Class F-2 | | | 98,847 | | | | 9,962 | | | | 2,486 | | | | 249 | | | | (57,433 | ) | | | (5,778 | ) | | | 43,900 | | | | 4,433 | |
| Class F-3 | | | 10,676 | | | | 1,070 | | | | 335 | | | | 33 | | | | (7,192 | ) | | | (719 | ) | | | 3,819 | | | | 384 | |
| Class 529-A | | | 7,531 | | | | 754 | | | | 459 | | | | 46 | | | | (6,235 | ) | | | (627 | ) | | | 1,755 | | | | 173 | |
| Class 529-C | | | 1,319 | | | | 133 | | | | 56 | | | | 6 | | | | (1,869 | ) | | | (189 | ) | | | (494 | ) | | | (50 | ) |
| Class 529-E | | | 500 | | | | 50 | | | | 28 | | | | 3 | | | | (389 | ) | | | (39 | ) | | | 139 | | | | 14 | |
| Class 529-T | | | — | | | | — | | | | — | † | | | — | † | | | — | | | | — | | | | — | † | | | — | † |
| Class 529-F-1 | | | 2,698 | | | | 272 | | | | 182 | | | | 18 | | | | (2,615 | ) | | | (263 | ) | | | 265 | | | | 27 | |
| Class R-1 | | | 1,049 | | | | 106 | | | | 61 | | | | 6 | | | | (1,764 | ) | | | (177 | ) | | | (654 | ) | | | (65 | ) |
| Class R-2 | | | 1,195 | | | | 121 | | | | 51 | | | | 5 | | | | (1,278 | ) | | | (129 | ) | | | (32 | ) | | | (3 | ) |
| Class R-2E | | | 44 | | | | 4 | | | | 2 | | | | — | † | | | (3 | ) | | | — | † | | | 43 | | | | 4 | |
| Class R-3 | | | 20,365 | | | | 2,051 | | | | 723 | | | | 72 | | | | (15,687 | ) | | | (1,573 | ) | | | 5,401 | | | | 550 | |
| Class R-4 | | | 1,280 | | | | 129 | | | | 109 | | | | 11 | | | | (2,721 | ) | | | (276 | ) | | | (1,332 | ) | | | (136 | ) |
| Class R-5E | | | 176 | | | | 18 | | | | 3 | | | | — | † | | | (4 | ) | | | — | † | | | 175 | | | | 18 | |
| Class R-5 | | | 305 | | | | 31 | | | | 32 | | | | 3 | | | | (467 | ) | | | (46 | ) | | | (130 | ) | | | (12 | ) |
| Class R-6 | | | 1,397,146 | | | | 140,299 | | | | 135,321 | | | | 13,540 | | | | (132,489 | ) | | | (13,321 | ) | | | 1,399,978 | | | | 140,518 | |
| Total net increase (decrease) | | $ | 1,597,607 | | | | 160,477 | | | $ | 144,512 | | | | 14,460 | | | $ | (290,938 | ) | | | (29,286 | ) | | $ | 1,451,181 | | | | 145,651 | |
| * | Includes exchanges between share classes of the fund. |
| † | Amount less than one thousand. |
| 22 | American Funds Mortgage Fund |
9. Investment transactions
The fund made purchases and sales of investment securities, excluding short-term securities and U.S. government obligations, if any, of $64,845,127,000 and $64,560,950,000, respectively, during the year ended August 31, 2020.
10. Ownership concentration
At August 31, 2020, three shareholders held more than 10% of the fund’s outstanding shares. The three shareholders were American Funds 2030 Target Date Retirement Fund, American Funds 2025 Target Date Retirement Fund and American Funds 2020 Target Date Retirement Fund, with aggregate ownership of the fund’s outstanding shares of 19%, 19% and 14%, respectively. CRMC is the investment adviser to the three target date retirement funds.
| American Funds Mortgage Fund | 23 |
Financial highlights
| | | | | | Income (loss) from
investment operations1 | | | Dividends and distributions | | | | | | | | | | | | | | | | | | | |
| Period ended | | Net asset
value,
beginning
of period | | | Net
investment
income
(loss) | | | Net gains
(losses) on
securities
(both
realized and
unrealized) | | | Total from
investment
operations | | | Dividends
(from net
investment
income) | | | Distributions
(from capital
gains) | | | Total
dividends
and
distributions | | | Net asset
value,
end
of period | | | Total
return2,3 | | | Net assets,
end of period
(in millions) | | | Ratio of
expenses to
average net
assets before
reimburse-
ments | | | Ratio of
expenses to
average net
assets after
reimburse-
ments3 | | | Ratio of
net income
(loss)
to average
net assets3 | |
| Class A: | | | | | | | | | | | | | | | | | | | | | | | | | | | | | | | | | | | | | | | | | | | | | | | | | | | | |
| 8/31/2020 | | $ | 10.21 | | | $ | .10 | | | $ | .53 | | | $ | .63 | | | $ | (.15 | ) | | $ | (.09 | ) | | $ | (.24 | ) | | $ | 10.60 | | | | 6.32 | % | | $ | 235 | | | | .65 | % | | | .65 | % | | | .97 | % |
| 8/31/2019 | | | 9.84 | | | | .20 | | | | .39 | | | | .59 | | | | (.22 | ) | | | — | | | | (.22 | ) | | | 10.21 | | | | 6.05 | | | | 198 | | | | .69 | | | | .69 | | | | 2.03 | |
| 8/31/2018 | | | 10.20 | | | | .14 | | | | (.32 | ) | | | (.18 | ) | | | (.15 | ) | | | (.03 | ) | | | (.18 | ) | | | 9.84 | | | | (1.81 | ) | | | 197 | | | | .68 | | | | .68 | | | | 1.41 | |
| 8/31/2017 | | | 10.23 | | | | .10 | | | | .09 | | | | .19 | | | | (.13 | ) | | | (.09 | ) | | | (.22 | ) | | | 10.20 | | | | 1.94 | | | | 218 | | | | .69 | | | | .69 | | | | .98 | |
| 8/31/2016 | | | 10.22 | | | | .08 | | | | .22 | | | | .30 | | | | (.16 | ) | | | (.13 | ) | | | (.29 | ) | | | 10.23 | | | | 2.90 | | | | 229 | | | | .68 | | | | .68 | | | | .79 | |
| Class C: | | | | | | | | | | | | | | | | | | | | | | | | | | | | | | | | | | | | | | | | | | | | | | | | | | | | |
| 8/31/2020 | | | 10.17 | | | | .03 | | | | .53 | | | | .56 | | | | (.08 | ) | | | (.09 | ) | | | (.17 | ) | | | 10.56 | | | | 5.54 | | | | 15 | | | | 1.40 | | | | 1.40 | | | | .26 | |
| 8/31/2019 | | | 9.80 | | | | .12 | | | | .39 | | | | .51 | | | | (.14 | ) | | | — | | | | (.14 | ) | | | 10.17 | | | | 5.26 | | | | 16 | | | | 1.46 | | | | 1.46 | | | | 1.25 | |
| 8/31/2018 | | | 10.17 | | | | .06 | | | | (.33 | ) | | | (.27 | ) | | | (.07 | ) | | | (.03 | ) | | | (.10 | ) | | | 9.80 | | | | (2.68 | ) | | | 16 | | | | 1.47 | | | | 1.47 | | | | .60 | |
| 8/31/2017 | | | 10.19 | | | | .02 | | | | .11 | | | | .13 | | | | (.06 | ) | | | (.09 | ) | | | (.15 | ) | | | 10.17 | | | | 1.25 | | | | 21 | | | | 1.48 | | | | 1.48 | | | | .18 | |
| 8/31/2016 | | | 10.18 | | | | — | 4 | | | .22 | | | | .22 | | | | (.08 | ) | | | (.13 | ) | | | (.21 | ) | | | 10.19 | | | | 2.10 | | | | 26 | | | | 1.48 | | | | 1.48 | | | | (.01 | ) |
| Class T: | | | | | | | | | | | | | | | | | | | | | | | | | | | | | | | | | | | | | | | | | | | | | | | | | | | | |
| 8/31/2020 | | | 10.21 | | | | .13 | | | | .52 | | | | .65 | | | | (.17 | ) | | | (.09 | ) | | | (.26 | ) | | | 10.60 | | | | 6.45 | 5 | | | — | 6 | | | .43 | 5 | | | .43 | 5 | | | 1.22 | 5 |
| 8/31/2019 | | | 9.83 | | | | .22 | | | | .40 | | | | .62 | | | | (.24 | ) | | | — | | | | (.24 | ) | | | 10.21 | | | | 6.40 | 5 | | | — | 6 | | | .46 | 5 | | | .46 | 5 | | | 2.26 | 5 |
| 8/31/2018 | | | 10.20 | | | | .16 | | | | (.33 | ) | | | (.17 | ) | | | (.17 | ) | | | (.03 | ) | | | (.20 | ) | | | 9.83 | | | | (1.68 | )5 | | | — | 6 | | | .45 | 5 | | | .45 | 5 | | | 1.65 | 5 |
| 8/31/20177,8 | | | 10.10 | | | | .06 | | | | .10 | | | | .16 | | | | (.06 | ) | | | — | | | | (.06 | ) | | | 10.20 | | | | 1.63 | 5,9 | | | — | 6 | | | .18 | 5,9 | | | .18 | 5,9 | | | .55 | 5,9 |
| Class F-1: | | | | | | | | | | | | | | | | | | | | | | | | | | | | | | | | | | | | | | | | | | | | | | | | | | | | |
| 8/31/2020 | | | 10.21 | | | | .10 | | | | .54 | | | | .64 | | | | (.15 | ) | | | (.09 | ) | | | (.24 | ) | | | 10.61 | | | | 6.34 | | | | 20 | | | | .63 | | | | .63 | | | | 1.00 | |
| 8/31/2019 | | | 9.84 | | | | .20 | | | | .39 | | | | .59 | | | | (.22 | ) | | | — | | | | (.22 | ) | | | 10.21 | | | | 6.06 | | | | 18 | | | | .68 | | | | .68 | | | | 2.05 | |
| 8/31/2018 | | | 10.20 | | | | .14 | | | | (.32 | ) | | | (.18 | ) | | | (.15 | ) | | | (.03 | ) | | | (.18 | ) | | | 9.84 | | | | (1.83 | ) | | | 14 | | | | .70 | | | | .70 | | | | 1.39 | |
| 8/31/2017 | | | 10.23 | | | | .10 | | | | .09 | | | | .19 | | | | (.13 | ) | | | (.09 | ) | | | (.22 | ) | | | 10.20 | | | | 1.92 | | | | 14 | | | | .70 | | | | .70 | | | | .94 | |
| 8/31/2016 | | | 10.22 | | | | .08 | | | | .22 | | | | .30 | | | | (.16 | ) | | | (.13 | ) | | | (.29 | ) | | | 10.23 | | | | 2.91 | | | | 23 | | | | .67 | | | | .67 | | | | .92 | |
| Class F-2: | | | | | | | | | | | | | | | | | | | | | | | | | | | | | | | | | | | | | | | | | | | | | | | | | | | | |
| 8/31/2020 | | | 10.22 | | | | .13 | | | | .53 | | | | .66 | | | | (.18 | ) | | | (.09 | ) | | | (.27 | ) | | | 10.61 | | | | 6.52 | | | | 180 | | | | .36 | | | | .36 | | | | 1.21 | |
| 8/31/2019 | | | 9.84 | | | | .23 | | | | .40 | | | | .63 | | | | (.25 | ) | | | — | | | | (.25 | ) | | | 10.22 | | | | 6.46 | | | | 122 | | | | .39 | | | | .39 | | | | 2.33 | |
| 8/31/2018 | | | 10.21 | | | | .17 | | | | (.33 | ) | | | (.16 | ) | | | (.18 | ) | | | (.03 | ) | | | (.21 | ) | | | 9.84 | | | | (1.64 | ) | | | 74 | | | | .40 | | | | .40 | | | | 1.73 | |
| 8/31/2017 | | | 10.23 | | | | .12 | | | | .11 | | | | .23 | | | | (.16 | ) | | | (.09 | ) | | | (.25 | ) | | | 10.21 | | | | 2.30 | | | | 47 | | | | .44 | | | | .44 | | | | 1.20 | |
| 8/31/2016 | | | 10.22 | | | | .11 | | | | .22 | | | | .33 | | | | (.19 | ) | | | (.13 | ) | | | (.32 | ) | | | 10.23 | | | | 3.18 | | | | 53 | | | | .41 | | | | .41 | | | | 1.28 | |
| Class F-3: | | | | | | | | | | | | | | | | | | | | | | | | | | | | | | | | | | | | | | | | | | | | | | | | | | | | |
| 8/31/2020 | | | 10.22 | | | | .13 | | | | .54 | | | | .67 | | | | (.19 | ) | | | (.09 | ) | | | (.28 | ) | | | 10.61 | | | | 6.64 | | | | 29 | | | | .25 | | | | .25 | | | | 1.28 | |
| 8/31/2019 | | | 9.84 | | | | .24 | | | | .40 | | | | .64 | | | | (.26 | ) | | | — | | | | (.26 | ) | | | 10.22 | | | | 6.56 | | | | 18 | | | | .30 | | | | .30 | | | | 2.43 | |
| 8/31/2018 | | | 10.20 | | | | .18 | | | | (.32 | ) | | | (.14 | ) | | | (.19 | ) | | | (.03 | ) | | | (.22 | ) | | | 9.84 | | | | (1.45 | ) | | | 13 | | | | .31 | | | | .31 | | | | 1.80 | |
| 8/31/20177,10 | | | 10.07 | | | | .09 | | | | .14 | | | | .23 | | | | (.10 | ) | | | — | | | | (.10 | ) | | | 10.20 | | | | 2.33 | 9 | | | 11 | | | | .31 | 11 | | | .31 | 11 | | | 1.55 | 11 |
| Class 529-A: | | | | | | | | | | | | | | | | | | | | | | | | | | | | | | | | | | | | | | | | | | | | | | | | | | | | |
| 8/31/2020 | | | 10.21 | | | | .10 | | | | .52 | | | | .62 | | | | (.14 | ) | | | (.09 | ) | | | (.23 | ) | | | 10.60 | | | | 6.18 | | | | 29 | | | | .69 | | | | .69 | | | | .94 | |
| 8/31/2019 | | | 9.83 | | | | .20 | | | | .39 | | | | .59 | | | | (.21 | ) | | | — | | | | (.21 | ) | | | 10.21 | | | | 6.09 | | | | 24 | | | | .75 | | | | .75 | | | | 1.97 | |
| 8/31/2018 | | | 10.20 | | | | .13 | | | | (.33 | ) | | | (.20 | ) | | | (.14 | ) | | | (.03 | ) | | | (.17 | ) | | | 9.83 | | | | (1.98 | ) | | | 21 | | | | .75 | | | | .75 | | | | 1.36 | |
| 8/31/2017 | | | 10.23 | | | | .10 | | | | .09 | | | | .19 | | | | (.13 | ) | | | (.09 | ) | | | (.22 | ) | | | 10.20 | | | | 1.98 | | | | 19 | | | | .74 | | | | .74 | | | | .94 | |
| 8/31/2016 | | | 10.21 | | | | .08 | | | | .22 | | | | .30 | | | | (.15 | ) | | | (.13 | ) | | | (.28 | ) | | | 10.23 | | | | 2.81 | | | | 18 | | | | .76 | | | | .76 | | | | .71 | |
| 24 | American Funds Mortgage Fund |
| | | | | | Income (loss) from
investment operations1 | | | Dividends and distributions | | | | | | | | | | | | | | | | | | | |
| Period ended | | Net asset
value,
beginning
of period | | | Net
investment
income
(loss) | | | Net gains
(losses) on
securities
(both
realized and
unrealized) | | | Total from
investment
operations | | | Dividends
(from net
investment
income) | | | Distributions
(from capital
gains) | | | Total
dividends
and
distributions | | | Net asset
value,
end
of period | | | Total
return2,3 | | | Net assets,
end of period
(in millions) | | | Ratio of
expenses to
average net
assets before
reimburse-
ments | | | Ratio of
expenses to
average net
assets after
reimburse-
ments3 | | | Ratio of
net income
(loss)
to average
net assets3 | |
| Class 529-C: | | | | | | | | | | | | | | | | | | | | | | | | | | | | | | | | | | | | | | | | | | | | | | | | | | | | |
| 8/31/2020 | | $ | 10.16 | | | $ | .02 | | | $ | .52 | | | $ | .54 | | | $ | (.07 | ) | | $ | (.09 | ) | | $ | (.16 | ) | | $ | 10.54 | | | | 5.42 | % | | $ | 3 | | | | 1.45 | % | | | 1.45 | % | | | .23 | % |
| 8/31/2019 | | | 9.79 | | | | .12 | | | | .39 | | | | .51 | | | | (.14 | ) | | | — | | | | (.14 | ) | | | 10.16 | | | | 5.22 | | | | 4 | | | | 1.51 | | | | 1.51 | | | | 1.20 | |
| 8/31/2018 | | | 10.15 | | | | .05 | | | | (.31 | ) | | | (.26 | ) | | | (.07 | ) | | | (.03 | ) | | | (.10 | ) | | | 9.79 | | | | (2.64 | ) | | | 4 | | | | 1.52 | | | | 1.52 | | | | .54 | |
| 8/31/2017 | | | 10.18 | | | | .01 | | | | .10 | | | | .11 | | | | (.05 | ) | | | (.09 | ) | | | (.14 | ) | | | 10.15 | | | | 1.10 | | | | 6 | | | | 1.53 | | | | 1.53 | | | | .14 | |
| 8/31/2016 | | | 10.17 | | | | (.01 | ) | | | .22 | | | | .21 | | | | (.07 | ) | | | (.13 | ) | | | (.20 | ) | | | 10.18 | | | | 2.04 | | | | 7 | | | | 1.55 | | | | 1.55 | | | | (.06 | ) |
| Class 529-E: | | | | | | | | | | | | | | | | | | | | | | | | | | | | | | | | | | | | | | | | | | | | | | | | | | | | |
| 8/31/2020 | | | 10.21 | | | | .08 | | | | .52 | | | | .60 | | | | (.12 | ) | | | (.09 | ) | | | (.21 | ) | | | 10.60 | | | | 5.96 | | | | 1 | | | | .90 | | | | .90 | | | | .75 | |
| 8/31/2019 | | | 9.84 | | | | .18 | | | | .38 | | | | .56 | | | | (.19 | ) | | | — | | | | (.19 | ) | | | 10.21 | | | | 5.77 | | | | 2 | | | | .96 | | | | .96 | | | | 1.77 | |
| 8/31/2018 | | | 10.20 | | | | .11 | | | | (.32 | ) | | | (.21 | ) | | | (.12 | ) | | | (.03 | ) | | | (.15 | ) | | | 9.84 | | | | (2.09 | ) | | | 1 | | | | .96 | | | | .96 | | | | 1.14 | |
| 8/31/2017 | | | 10.23 | | | | .07 | | | | .10 | | | | .17 | | | | (.11 | ) | | | (.09 | ) | | | (.20 | ) | | | 10.20 | | | | 1.65 | | | | 2 | | | | .98 | | | | .98 | | | | .71 | |
| 8/31/2016 | | | 10.21 | | | | .05 | | | | .22 | | | | .27 | | | | (.12 | ) | | | (.13 | ) | | | (.25 | ) | | | 10.23 | | | | 2.66 | | | | 1 | | | | 1.01 | | | | 1.01 | | | | .45 | |
| Class 529-T: | | | | | | | | | | | | | | | | | | | | | | | | | | | | | | | | | | | | | | | | | | | | | | | | | | | | |
| 8/31/2020 | | | 10.21 | | | | .12 | | | | .52 | | | | .64 | | | | (.16 | ) | | | (.09 | ) | | | (.25 | ) | | | 10.60 | | | | 6.41 | 5 | | | — | 6 | | | .47 | 5 | | | .47 | 5 | | | 1.18 | 5 |
| 8/31/2019 | | | 9.83 | | | | .22 | | | | .40 | | | | .62 | | | | (.24 | ) | | | — | | | | (.24 | ) | | | 10.21 | | | | 6.34 | 5 | | | — | 6 | | | .51 | 5 | | | .51 | 5 | | | 2.21 | 5 |
| 8/31/2018 | | | 10.20 | | | | .16 | | | | (.33 | ) | | | (.17 | ) | | | (.17 | ) | | | (.03 | ) | | | (.20 | ) | | | 9.83 | | | | (1.74 | )5 | | | — | 6 | | | .52 | 5 | | | .52 | 5 | | | 1.59 | 5 |
| 8/31/20177,8 | | | 10.10 | | | | .05 | | | | .11 | | | | .16 | | | | (.06 | ) | | | — | | | | (.06 | ) | | | 10.20 | | | | 1.60 | 5,9 | | | — | 6 | | | .20 | 5,9 | | | .20 | 5,9 | | | .53 | 5,9 |
| Class 529-F-1: | | | | | | | | | | | | | | | | | | | | | | | | | | | | | | | | | | | | | | | | | | | | | | | | | | | |
| 8/31/2020 | | | 10.21 | | | | .12 | | | | .53 | | | | .65 | | | | (.17 | ) | | | (.09 | ) | | | (.26 | ) | | | 10.60 | | | | 6.43 | | | | 9 | | | | .45 | | | | .45 | | | | 1.19 | |
| 8/31/2019 | | | 9.84 | | | | .22 | | | | .39 | | | | .61 | | | | (.24 | ) | | | — | | | | (.24 | ) | | | 10.21 | | | | 6.23 | | | | 8 | | | | .52 | | | | .52 | | | | 2.20 | |
| 8/31/2018 | | | 10.20 | | | | .16 | | | | (.32 | ) | | | (.16 | ) | | | (.17 | ) | | | (.03 | ) | | | (.20 | ) | | | 9.84 | | | | (1.66 | ) | | | 8 | | | | .52 | | | | .52 | | | | 1.60 | |
| 8/31/2017 | | | 10.23 | | | | .12 | | | | .09 | | | | .21 | | | | (.15 | ) | | | (.09 | ) | | | (.24 | ) | | | 10.20 | | | | 2.11 | | | | 7 | | | | .53 | | | | .53 | | | | 1.17 | |
| 8/31/2016 | | | 10.22 | | | | .09 | | | | .22 | | | | .31 | | | | (.17 | ) | | | (.13 | ) | | | (.30 | ) | | | 10.23 | | | | 3.03 | | | | 6 | | | | .55 | | | | .55 | | | | .89 | |
| Class R-1: | | | | | | | | | | | | | | | | | | | | | | | | | | | | | | | | | | | | | | | | | | | | | | | | | | | | |
| 8/31/2020 | | | 10.18 | | | | .01 | | | | .53 | | | | .54 | | | | (.08 | ) | | | (.09 | ) | | | (.17 | ) | | | 10.55 | | | | 5.34 | | | | 7 | | | | 1.49 | | | | 1.49 | | | | .14 | |
| 8/31/2019 | | | 9.81 | | | | .12 | | | | .40 | | | | .52 | | | | (.15 | ) | | | — | | | | (.15 | ) | | | 10.18 | | | | 5.30 | | | | 4 | | | | 1.45 | | | | 1.45 | | | | 1.26 | |
| 8/31/2018 | | | 10.17 | | | | .06 | | | | (.32 | ) | | | (.26 | ) | | | (.07 | ) | | | (.03 | ) | | | (.10 | ) | | | 9.81 | | | | (2.58 | ) | | | 4 | | | | 1.47 | | | | 1.47 | | | | .65 | |
| 8/31/2017 | | | 10.20 | | | | .03 | | | | .08 | | | | .11 | | | | (.05 | ) | | | (.09 | ) | | | (.14 | ) | | | 10.17 | | | | 1.13 | | | | 4 | | | | 1.49 | | | | 1.49 | | | | .33 | |
| 8/31/2016 | | | 10.19 | | | | .01 | | | | .22 | | | | .23 | | | | (.09 | ) | | | (.13 | ) | | | (.22 | ) | | | 10.20 | | | | 2.27 | | | | — | 6 | | | 1.33 | | | | 1.33 | | | | .18 | |
| Class R-2: | | | | | | | | | | | | | | | | | | | | | | | | | | | | | | | | | | | | | | | | | | | | | | | | | | | | |
| 8/31/2020 | | | 10.16 | | | | .03 | | | | .52 | | | | .55 | | | | (.08 | ) | | | (.09 | ) | | | (.17 | ) | | | 10.54 | | | | 5.47 | | | | 3 | | | | 1.37 | | | | 1.37 | | | | .28 | |
| 8/31/2019 | | | 9.79 | | | | .13 | | | | .39 | | | | .52 | | | | (.15 | ) | | | — | | | | (.15 | ) | | | 10.16 | | | | 5.33 | | | | 3 | | | | 1.40 | | | | 1.40 | | | | 1.32 | |
| 8/31/2018 | | | 10.15 | | | | .07 | | | | (.32 | ) | | | (.25 | ) | | | (.08 | ) | | | (.03 | ) | | | (.11 | ) | | | 9.79 | | | | (2.54 | ) | | | 3 | | | | 1.42 | | | | 1.42 | | | | .69 | |
| 8/31/2017 | | | 10.18 | | | | .02 | | | | .10 | | | | .12 | | | | (.06 | ) | | | (.09 | ) | | | (.15 | ) | | | 10.15 | | | | 1.18 | | | | 3 | | | | 1.46 | | | | 1.46 | | | | .22 | |
| 8/31/2016 | | | 10.17 | | | | — | 4 | | | .22 | | | | .22 | | | | (.08 | ) | | | (.13 | ) | | | (.21 | ) | | | 10.18 | | | | 2.10 | | | | 3 | | | | 1.49 | | | | 1.49 | | | | (.01 | ) |
| Class R-2E: | | | | | | | | | | | | | | | | | | | | | | | | | | | | | | | | | | | | | | | | | | | | | | | | | | | | |
| 8/31/2020 | | | 10.20 | | | | .06 | | | | .53 | | | | .59 | | | | (.11 | ) | | | (.09 | ) | | | (.20 | ) | | | 10.59 | | | | 5.82 | | | | — | 6 | | | 1.14 | | | | 1.06 | | | | .57 | |
| 8/31/2019 | | | 9.82 | | | | .16 | | | | .40 | | | | .56 | | | | (.18 | ) | | | — | | | | (.18 | ) | | | 10.20 | | | | 5.74 | | | | — | 6 | | | 1.14 | | | | 1.09 | | | | 1.64 | |
| 8/31/2018 | | | 10.19 | | | | .10 | | | | (.33 | ) | | | (.23 | ) | | | (.11 | ) | | | (.03 | ) | | | (.14 | ) | | | 9.82 | | | | (2.30 | )5 | | | — | 6 | | | 1.17 | 5 | | | 1.07 | 5 | | | 1.04 | 5 |
| 8/31/2017 | | | 10.21 | | | | .06 | | | | .11 | | | | .17 | | | | (.10 | ) | | | (.09 | ) | | | (.19 | ) | | | 10.19 | | | | 1.69 | 5 | | | — | 6 | | | 1.12 | 5 | | | 1.11 | 5 | | | .63 | 5 |
| 8/31/2016 | | | 10.22 | | | | .08 | | | | .22 | | | | .30 | | | | (.18 | ) | | | (.13 | ) | | | (.31 | ) | | | 10.21 | | | | 2.92 | 5 | | | — | 6 | | | .70 | 5 | | | .60 | 5 | | | .84 | 5 |
See end of table for footnotes.
| American Funds Mortgage Fund | 25 |
Financial highlights (continued)
| | | | | | Income (loss) from
investment operations1 | | | Dividends and distributions | | | | | | | | | | | | | | | | | | | |
| Period ended | | Net asset
value,
beginning
of period | | | Net
investment
income
(loss) | | | Net gains
(losses) on
securities
(both
realized and
unrealized) | | | Total from
investment
operations | | | Dividends
(from net
investment
income) | | | Distributions
(from capital
gains) | | | Total
dividends
and
distributions | | | Net asset
value,
end
of period | | | Total
return2,3 | | | Net assets,
end of period
(in millions) | | | Ratio of
expenses to
average net
assets before
reimburse-
ments | | | Ratio of
expenses to
average net
assets after
reimburse-
ments3 | | | Ratio of
net income
(loss)
to average
net assets3 | |
| Class R-3: | | | | | | | | | | | | | | | | | | | | | | | | | | | | | | | | | | | | | | | | | | | | | | | | | | | | |
| 8/31/2020 | | $ | 10.20 | | | $ | .07 | | | $ | .52 | | | $ | .59 | | | $ | (.12 | ) | | $ | (.09 | ) | | $ | (.21 | ) | | $ | 10.58 | | | | 5.82 | % | | $ | 37 | | | | 1.04 | % | | | 1.04 | % | | | .64 | % |
| 8/31/2019 | | | 9.83 | | | | .17 | | | | .39 | | | | .56 | | | | (.19 | ) | | | — | | | | (.19 | ) | | | 10.20 | | | | 5.75 | | | | 41 | | | | 1.00 | | | | 1.00 | | | | 1.74 | |
| 8/31/2018 | | | 10.19 | | | | .11 | | | | (.32 | ) | | | (.21 | ) | | | (.12 | ) | | | (.03 | ) | | | (.15 | ) | | | 9.83 | | | | (2.15 | ) | | | 34 | | | | 1.02 | | | | 1.02 | | | | 1.10 | |
| 8/31/2017 | | | 10.22 | | | | .08 | | | | .08 | | | | .16 | | | | (.10 | ) | | | (.09 | ) | | | (.19 | ) | | | 10.19 | | | | 1.59 | | | | 26 | | | | 1.02 | | | | 1.02 | | | | .79 | |
| 8/31/2016 | | | 10.21 | | | | .04 | | | | .22 | | | | .26 | | | | (.12 | ) | | | (.13 | ) | | | (.25 | ) | | | 10.22 | | | | 2.57 | | | | 3 | | | | 1.00 | | | | 1.00 | | | | .52 | |
| Class R-4: | | | | | | | | | | | | | | | | | | | | | | | | | | | | | | | | | | | | | | | | | | | | | | | | | | | | |
| 8/31/2020 | | | 10.21 | | | | .10 | | | | .54 | | | | .64 | | | | (.15 | ) | | | (.09 | ) | | | (.24 | ) | | | 10.61 | | | | 6.35 | | | | 6 | | | | .62 | | | | .62 | | | | 1.01 | |
| 8/31/2019 | | | 9.84 | | | | .20 | | | | .39 | | | | .59 | | | | (.22 | ) | | | — | | | | (.22 | ) | | | 10.21 | | | | 6.08 | | | | 5 | | | | .66 | | | | .66 | | | | 2.04 | |
| 8/31/2018 | | | 10.20 | | | | .15 | | | | (.33 | ) | | | (.18 | ) | | | (.15 | ) | | | (.03 | ) | | | (.18 | ) | | | 9.84 | | | | (1.80 | ) | | | 6 | | | | .66 | | | | .66 | | | | 1.55 | |
| 8/31/2017 | | | 10.23 | | | | .10 | | | | .09 | | | | .19 | | | | (.13 | ) | | | (.09 | ) | | | (.22 | ) | | | 10.20 | | | | 1.94 | | | | 2 | | | | .69 | | | | .69 | | | | .97 | |
| 8/31/2016 | | | 10.22 | | | | .08 | | | | .22 | | | | .30 | | | | (.16 | ) | | | (.13 | ) | | | (.29 | ) | | | 10.23 | | | | 2.93 | | | | 3 | | | | .65 | | | | .65 | | | | .88 | |
| Class R-5E: | | | | | | | | | | | | | | | | | | | | | | | | | | | | | | | | | | | | | | | | | | | | | | | | | | | | |
| 8/31/2020 | | | 10.21 | | | | .12 | | | | .53 | | | | .65 | | | | (.17 | ) | | | (.09 | ) | | | (.26 | ) | | | 10.60 | | | | 6.46 | | | | — | 6 | | | .43 | | | | .42 | | | | 1.15 | |
| 8/31/2019 | | | 9.84 | | | | .23 | | | | .38 | | | | .61 | | | | (.24 | ) | | | — | | | | (.24 | ) | | | 10.21 | | | | 6.28 | | | | — | 6 | | | .48 | | | | .46 | | | | 2.28 | |
| 8/31/2018 | | | 10.20 | | | | .18 | | | | (.33 | ) | | | (.15 | ) | | | (.18 | ) | | | (.03 | ) | | | (.21 | ) | | | 9.84 | | | | (1.53 | ) | | | — | 6 | | | .48 | | | | .45 | | | | 1.79 | |
| 8/31/2017 | | | 10.23 | | | | .13 | | | | .10 | | | | .23 | | | | (.17 | ) | | | (.09 | ) | | | (.26 | ) | | | 10.20 | | | | 2.25 | | | | — | 6 | | | .56 | | | | .40 | | | | 1.28 | |
| 8/31/20167,12 | | | 10.25 | | | | .08 | | | | .17 | | | | .25 | | | | (.14 | ) | | | (.13 | ) | | | (.27 | ) | | | 10.23 | | | | 2.39 | 9 | | | — | 6 | | | .53 | 11 | | | .53 | 11 | | | 1.01 | 11 |
| Class R-5: | | | | | | | | | | | | | | | | | | | | | | | | | | | | | | | | | | | | | | | | | | | | | | | | | | | | |
| 8/31/2020 | | | 10.21 | | | | .13 | | | | .54 | | | | .67 | | | | (.18 | ) | | | (.09 | ) | | | (.27 | ) | | | 10.61 | | | | 6.67 | | | | 1 | | | | .32 | | | | .32 | | | | 1.28 | |
| 8/31/2019 | | | 9.84 | | | | .24 | | | | .38 | | | | .62 | | | | (.25 | ) | | | — | | | | (.25 | ) | | | 10.21 | | | | 6.40 | | | | 1 | | | | .36 | | | | .36 | | | | 2.36 | |
| 8/31/2018 | | | 10.20 | | | | .18 | | | | (.33 | ) | | | (.15 | ) | | | (.18 | ) | | | (.03 | ) | | | (.21 | ) | | | 9.84 | | | | (1.50 | ) | | | 1 | | | | .36 | | | | .36 | | | | 1.77 | |
| 8/31/2017 | | | 10.23 | | | | .13 | | | | .10 | | | | .23 | | | | (.17 | ) | | | (.09 | ) | | | (.26 | ) | | | 10.20 | | | | 2.25 | | | | 1 | | | | .38 | | | | .38 | | | | 1.31 | |
| 8/31/2016 | | | 10.22 | | | | .11 | | | | .22 | | | | .33 | | | | (.19 | ) | | | (.13 | ) | | | (.32 | ) | | | 10.23 | | | | 3.19 | | | | 1 | | | | .39 | | | | .39 | | | | 1.14 | |
| Class R-6: | | | | | | | | | | | | | | | | | | | | | | | | | | | | | | | | | | | | | | | | | | | | | | | | | | | | |
| 8/31/2020 | | | 10.21 | | | | .14 | | | | .54 | | | | .68 | | | | (.19 | ) | | | (.09 | ) | | | (.28 | ) | | | 10.61 | | | | 6.75 | | | | 6,590 | | | | .25 | | | | .25 | | | | 1.40 | |
| 8/31/2019 | | | 9.84 | | | | .24 | | | | .39 | | | | .63 | | | | (.26 | ) | | | — | | | | (.26 | ) | | | 10.21 | | | | 6.47 | | | | 6,095 | | | | .29 | | | | .29 | | | | 2.43 | |
| 8/31/2018 | | | 10.20 | | | | .18 | | | | (.32 | ) | | | (.14 | ) | | | (.19 | ) | | | (.03 | ) | | | (.22 | ) | | | 9.84 | | | | (1.44 | ) | | | 4,490 | | | | .30 | | | | .30 | | | | 1.83 | |
| 8/31/2017 | | | 10.23 | | | | .14 | | | | .09 | | | | .23 | | | | (.17 | ) | | | (.09 | ) | | | (.26 | ) | | | 10.20 | | | | 2.33 | | | | 3,227 | | | | .31 | | | | .31 | | | | 1.40 | |
| 8/31/2016 | | | 10.22 | | | | .11 | | | | .22 | | | | .33 | | | | (.19 | ) | | | (.13 | ) | | | (.32 | ) | | | 10.23 | | | | 3.27 | | | | 2,157 | | | | .31 | | | | .31 | | | | 1.16 | |
| | | Year ended August 31, |
| Portfolio turnover rate for all share classes13 | | 2020 | | 2019 | | 2018 | | 2017 | | 2016 |
| Excluding mortgage dollar roll transactions | | | 114 | % | | | 129 | % | | | 66 | % | | | 104 | % | | | 159 | % |
| Including mortgage dollar roll transactions | | | 1,015 | % | | | 605 | % | | | 1,009 | % | | | 635 | % | | | 1,041 | % |
| 1 | Based on average shares outstanding. |
| 2 | Total returns exclude any applicable sales charges, including contingent deferred sales charges. |
| 3 | This column reflects the impact, if any, of certain reimbursements from CRMC. During some of the years shown, CRMC reimbursed a portion of transfer agent services fees for certain share classes. |
| 4 | Amount less than $.01. |
| 5 | All or a significant portion of assets in this class consisted of seed capital invested by CRMC and/or its affiliates. Fees for distribution services are not charged or accrued on these seed capital assets. If such fees were paid by the fund on seed capital assets, fund expenses would have been higher and net income and total return would have been lower. |
| 6 | Amount less than $1 million. |
| 7 | Based on operations for a period that is less than a full year. |
| 8 | Class T and 529-T shares began investment operations on April 7, 2017. |
| 9 | Not annualized. |
| 10 | Class F-3 shares began investment operations on January 27, 2017. |
| 11 | Annualized. |
| 12 | Class R-5E shares began investment operations on November 20, 2015. |
| 13 | Refer to Note 5 for more information on mortgage dollar rolls. |
See notes to financial statements.
| 26 | American Funds Mortgage Fund |
Report of Independent Registered Public Accounting Firm
To the Board of Trustees and Shareholders of American Funds Mortgage Fund
Opinion on the Financial Statements
We have audited the accompanying statement of assets and liabilities, including the summary investment portfolio, of American Funds Mortgage Fund (the “Fund”) as of August 31, 2020, the related statement of operations for the year ended August 31, 2020, the statement of changes in net assets for each of the two years in the period ended August 31, 2020, including the related notes, and the financial highlights for each of the periods indicated therein (collectively referred to as the “financial statements”). In our opinion, the financial statements present fairly, in all material respects, the financial position of the Fund as of August 31, 2020, the results of its operations for the year then ended, the changes in its net assets for each of the two years in the period ended August 31, 2020 and the financial highlights for each of the periods indicated therein in conformity with accounting principles generally accepted in the United States of America.
Basis for Opinion
These financial statements are the responsibility of the Fund’s management. Our responsibility is to express an opinion on the Fund’s financial statements based on our audits. We are a public accounting firm registered with the Public Company Accounting Oversight Board (United States) (PCAOB) and are required to be independent with respect to the Fund in accordance with the U.S. federal securities laws and the applicable rules and regulations of the Securities and Exchange Commission and the PCAOB.
We conducted our audits of these financial statements in accordance with the standards of the PCAOB. Those standards require that we plan and perform the audit to obtain reasonable assurance about whether the financial statements are free of material misstatement, whether due to error or fraud.
Our audits included performing procedures to assess the risks of material misstatement of the financial statements, whether due to error or fraud, and performing procedures that respond to those risks. Such procedures included examining, on a test basis, evidence regarding the amounts and disclosures in the financial statements. Our audits also included evaluating the accounting principles used and significant estimates made by management, as well as evaluating the overall presentation of the financial statements. Our procedures included confirmation of securities owned as of August 31, 2020 by correspondence with the custodian and brokers; when replies were not received from brokers, we performed other auditing procedures. We believe that our audits provide a reasonable basis for our opinion.
/s/ PricewaterhouseCoopers LLP
Los Angeles, California
October 14, 2020
We have served as the auditor of one or more investment companies in The Capital Group Companies Investment Company Complex since 1934.
| American Funds Mortgage Fund | 27 |
As a fund shareholder, you incur two types of costs: (1) transaction costs, such as initial sales charges on purchase payments and contingent deferred sales charges on redemptions (loads), and (2) ongoing costs, including management fees, distribution and service (12b-1) fees, and other expenses. This example is intended to help you understand your ongoing costs (in dollars) of investing in the fund so you can compare these costs with the ongoing costs of investing in other mutual funds. The example is based on an investment of $1,000 invested at the beginning of the period and held for the entire six-month period (March 1, 2020, through August 31, 2020).
Actual expenses:
The first line of each share class in the table on the following page provides information about actual account values and actual expenses. You may use the information in this line, together with the amount you invested, to estimate the expenses that you paid over the period. Simply divide your account value by $1,000 (for example, an $8,600 account value divided by $1,000 = 8.6), then multiply the result by the number in the first line under the heading titled “Expenses paid during period” to estimate the expenses you paid on your account during this period.
Hypothetical example for comparison purposes:
The second line of each share class in the table on the following page provides information about hypothetical account values and hypothetical expenses based on the actual expense ratio for the share class and an assumed rate of return of 5.00% per year before expenses, which is not the actual return of the share class. The hypothetical account values and expenses may not be used to estimate the actual ending account balance or expenses you paid for the period. You may use this information to compare the ongoing costs of investing in the fund and other funds. To do so, compare this 5.00% hypothetical example with the 5.00% hypothetical examples that appear in the shareholder reports of the other funds.
Notes:
Retirement plan participants may be subject to certain fees charged by the plan sponsor, and Class F-1, F-2, F-3 and 529-F-1 shareholders may be subject to fees charged by financial intermediaries, typically ranging from 0.75% to 1.50% of assets annually depending on services offered. You can estimate the impact of these fees by adding the amount of the fees to the total estimated expenses you paid on your account during the period as calculated above. In addition, your ending account value would be lower by the amount of these fees.
Note that the expenses shown in the table on the following page are meant to highlight your ongoing costs only and do not reflect any transactional costs, such as sales charges (loads). Therefore, the second line of each share class in the table is useful in comparing ongoing costs only and will not help you determine the relative total costs of owning different funds. In addition, if these transactional costs were included, your costs would have been higher.
| 28 | American Funds Mortgage Fund |
| | | Beginning
account value
3/1/2020 | | | Ending
account value
8/31/2020 | | | Expenses paid
during period* | | | Annualized
expense ratio | |
| Class A – actual return | | $ | 1,000.00 | | | $ | 1,037.54 | | | $ | 3.24 | | | | .63 | % |
| Class A – assumed 5% return | | | 1,000.00 | | | | 1,022.03 | | | | 3.21 | | | | .63 | |
| Class C – actual return | | | 1,000.00 | | | | 1,033.69 | | | | 7.07 | | | | 1.38 | |
| Class C – assumed 5% return | | | 1,000.00 | | | | 1,018.25 | | | | 7.02 | | | | 1.38 | |
| Class T – actual return | | | 1,000.00 | | | | 1,037.72 | | | | 2.11 | | | | .41 | |
| Class T – assumed 5% return | | | 1,000.00 | | | | 1,023.14 | | | | 2.09 | | | | .41 | |
| Class F-1 – actual return | | | 1,000.00 | | | | 1,037.65 | | | | 3.13 | | | | .61 | |
| Class F-1 – assumed 5% return | | | 1,000.00 | | | | 1,022.13 | | | | 3.11 | | | | .61 | |
| Class F-2 – actual return | | | 1,000.00 | | | | 1,038.08 | | | | 1.70 | | | | .33 | |
| Class F-2 – assumed 5% return | | | 1,000.00 | | | | 1,023.54 | | | | 1.68 | | | | .33 | |
| Class F-3 – actual return | | | 1,000.00 | | | | 1,039.59 | | | | 1.18 | | | | .23 | |
| Class F-3 – assumed 5% return | | | 1,000.00 | | | | 1,024.05 | | | | 1.17 | | | | .23 | |
| Class 529-A – actual return | | | 1,000.00 | | | | 1,036.43 | | | | 3.39 | | | | .66 | |
| Class 529-A – assumed 5% return | | | 1,000.00 | | | | 1,021.88 | | | | 3.36 | | | | .66 | |
| Class 529-C – actual return | | | 1,000.00 | | | | 1,032.62 | | | | 7.33 | | | | 1.43 | |
| Class 529-C – assumed 5% return | | | 1,000.00 | | | | 1,018.00 | | | | 7.27 | | | | 1.43 | |
| Class 529-E – actual return | | | 1,000.00 | | | | 1,035.33 | | | | 4.46 | | | | .87 | |
| Class 529-E – assumed 5% return | | | 1,000.00 | | | | 1,020.82 | | | | 4.43 | | | | .87 | |
| Class 529-T – actual return | | | 1,000.00 | | | | 1,037.49 | | | | 2.31 | | | | .45 | |
| Class 529-T – assumed 5% return | | | 1,000.00 | | | | 1,022.94 | | | | 2.29 | | | | .45 | |
| Class 529-F-1 – actual return | | | 1,000.00 | | | | 1,037.60 | | | | 2.21 | | | | .43 | |
| Class 529-F-1 – assumed 5% return | | | 1,000.00 | | | | 1,023.04 | | | | 2.19 | | | | .43 | |
| Class R-1 – actual return | | | 1,000.00 | | | | 1,031.73 | | | | 7.53 | | | | 1.47 | |
| Class R-1 – assumed 5% return | | | 1,000.00 | | | | 1,017.80 | | | | 7.48 | | | | 1.47 | |
| Class R-2 – actual return | | | 1,000.00 | | | | 1,033.89 | | | | 6.87 | | | | 1.34 | |
| Class R-2 – assumed 5% return | | | 1,000.00 | | | | 1,018.45 | | | | 6.82 | | | | 1.34 | |
| Class R-2E – actual return | | | 1,000.00 | | | | 1,035.59 | | | | 5.34 | | | | 1.04 | |
| Class R-2E – assumed 5% return | | | 1,000.00 | | | | 1,019.96 | | | | 5.30 | | | | 1.04 | |
| Class R-3 – actual return | | | 1,000.00 | | | | 1,035.25 | | | | 5.08 | | | | .99 | |
| Class R-3 – assumed 5% return | | | 1,000.00 | | | | 1,020.21 | | | | 5.04 | | | | .99 | |
| Class R-4 – actual return | | | 1,000.00 | | | | 1,037.75 | | | | 3.03 | | | | .59 | |
| Class R-4 – assumed 5% return | | | 1,000.00 | | | | 1,022.23 | | | | 3.01 | | | | .59 | |
| Class R-5E – actual return | | | 1,000.00 | | | | 1,037.72 | | | | 2.11 | | | | .41 | |
| Class R-5E – assumed 5% return | | | 1,000.00 | | | | 1,023.14 | | | | 2.09 | | | | .41 | |
| Class R-5 – actual return | | | 1,000.00 | | | | 1,039.27 | | | | 1.54 | | | | .30 | |
| Class R-5 – assumed 5% return | | | 1,000.00 | | | | 1,023.69 | | | | 1.53 | | | | .30 | |
| Class R-6 – actual return | | | 1,000.00 | | | | 1,039.63 | | | | 1.18 | | | | .23 | |
| Class R-6 – assumed 5% return | | | 1,000.00 | | | | 1,024.05 | | | | 1.17 | | | | .23 | |
| * | The “expenses paid during period” are equal to the “annualized expense ratio,” multiplied by the average account value over the period, multiplied by the number of days in the period, and divided by 365 (to reflect the one-half year period). |
We are required to advise you of the federal tax status of certain distributions received by shareholders during the fiscal year. The fund hereby designates the following amounts for the fund’s fiscal year ended August 31, 2020:
| Long-term capital gains | $23,421,000 |
| U.S. government income that may be exempt from state taxation | $32,997,000 |
Individual shareholders should refer to their Form 1099 or other tax information, which will be mailed in January 2021, to determine the calendar year amounts to be included on their 2020 tax returns. Shareholders should consult their tax advisors.
| American Funds Mortgage Fund | 29 |
Approval of Investment Advisory and Service Agreement
The fund’s board has approved the continuation of the fund’s Investment Advisory and Service Agreement (the “agreement”) with Capital Research and Management Company (“CRMC”) for an additional one-year term through April 30, 2021. The board approved the agreement following the recommendation of the fund’s Contracts Committee (the “committee”), which is composed of all the fund’s independent board members. The board and the committee determined in the exercise of their business judgment that the fund’s advisory fee structure was fair and reasonable in relation to the services provided, and that approving the agreement was in the best interests of the fund and its shareholders.
In reaching this decision, the board and the committee took into account their interaction with CRMC as well as information furnished to them throughout the year and otherwise provided to them, as well as information prepared specifically in connection with their review of the agreement, and were advised by their independent counsel with respect to the matters considered. They considered the following factors, among others, but did not identify any single issue or particular piece of information that, in isolation, was the controlling factor, and each board and committee member did not necessarily attribute the same weight to each factor.
1. Nature, extent and quality of services
The board and the committee considered the depth and quality of CRMC’s investment management process, including its global research capabilities; the experience, capability and integrity of its senior management and other personnel; the low turnover rates of its key personnel; the overall financial strength and stability of CRMC and the Capital Group organization; the resources and systems CRMC devotes to investment management (the manner in which the fund’s assets are managed, including liquidity management), financial, investment operations, compliance, trading, proxy voting, shareholder communications, and other services; and the ongoing evolution of CRMC’s organizational structure designed to maintain and strengthen these qualities. The board and the committee also considered the nature, extent and quality of administrative and shareholder services provided by CRMC to the fund under the agreement and other agreements, as well as the benefits to fund shareholders from investing in a fund that is part of a large family of funds. The board considered the risks assumed by CRMC in providing services to the fund, including operational, business, financial, reputational, regulatory and litigation risks. The board and the committee concluded that the nature, extent and quality of the services provided by CRMC have benefited and should continue to benefit the fund and its shareholders.
2. Investment results
The board and the committee considered the investment results of the fund in light of its objective. They compared the fund’s investment results with those of other funds (including funds that currently form the basis of the Lipper index for the category in which the fund is included), and data such as relevant market and fund indexes over various periods (including the fund’s lifetime) through September 30, 2019. They generally placed greater emphasis on longer term periods. On the basis of this evaluation and the board’s and the committee’s ongoing review of investment results, and considering the relative market conditions during certain of the reporting periods, the board and the committee concluded that the fund’s investment results have been satisfactory for renewal of the agreement, and that CRMC’s record in managing the fund indicated that its continued management should benefit the fund and its shareholders.
3. Advisory fees and total expenses
The board and the committee compared the advisory fees and total expense levels of the fund to those of other relevant funds. They observed that the fund’s advisory fees and expenses are competitive with those of other similar funds included in the comparable Lipper category. The board and the committee also considered the breakpoint discounts in the fund’s advisory fee structure that reduce the level of fees charged by CRMC to the fund as fund assets increase. In addition, they reviewed information regarding the effective advisory fees charged to non-mutual fund clients by CRMC and its affiliates. They noted that, to the extent there were differences between the advisory fees paid by the fund and the advisory fees paid by those clients, the differences appropriately reflected the investment, operational, regulatory and market differences between advising the fund and the other clients. The board and the committee concluded that the fund’s cost structure was fair and reasonable in relation to the services provided, as well as the risks assumed by the adviser, and that the fund’s shareholders receive reasonable value in return for the advisory fees and other amounts paid to CRMC by the fund.
| 30 | American Funds Mortgage Fund |
4. Ancillary benefits
The board and the committee considered a variety of other benefits that CRMC and its affiliates receive as a result of CRMC’s relationship with the fund and other American Funds, including fees for administrative services provided to certain share classes; fees paid to CRMC’s affiliated transfer agent; sales charges and distribution fees received and retained by the fund’s principal underwriter, an affiliate of CRMC; and possible ancillary benefits to CRMC and its institutional management affiliates in managing other investment vehicles. The board and the committee reviewed CRMC’s portfolio trading practices, noting that through December 31, 2018, CRMC benefited from research obtained with commissions from portfolio transactions made on behalf of the fund, and since that time has undertaken to bear the cost of obtaining such research. The board and the committee took these ancillary benefits into account in evaluating the reasonableness of the advisory fees and other amounts paid to CRMC by the fund.
5. Adviser financial information
The board and the committee reviewed information regarding CRMC’s costs of providing services to the American Funds, including personnel, systems and resources of investment, compliance, trading, accounting and other administrative operations. They considered CRMC’s costs and related cost allocation methodology as well as its track record of investing in technology, infrastructure and staff to maintain and expand services and capabilities, respond to industry and regulatory developments, and attract and retain qualified personnel. They noted information regarding the compensation structure for CRMC’s investment professionals. They reviewed information on the profitability of the investment adviser and its affiliates. The board and the committee also compared CRMC’s profitability and compensation data to the reported results and data of several large, publicly held investment management companies. The board and the committee noted the competitiveness and cyclicality of both the mutual fund industry and the capital markets, and the importance in that environment of CRMC’s long-term profitability for maintaining its independence, company culture and management continuity. They further considered the breakpoint discounts in the fund’s advisory fee structure and CRMC’s sharing of potential economies of scale, or efficiencies, through breakpoints and other fee reductions and costs voluntarily absorbed. The board and the committee concluded that the fund’s advisory fee structure reflected a reasonable sharing of benefits between CRMC and the fund’s shareholders.
| American Funds Mortgage Fund | 31 |
Board of trustees and other officers
Independent trustees1
| Name and year of birth | | Year first
elected
a trustee
of the fund2 | | Principal occupation(s) during past five years | | Number of
portfolios in
fund complex
overseen by
trustee | | Other directorships3
held by trustee | |
| William H. Baribault, 1945 | | 2010 | | Chairman of the Board and CEO, Oakwood Advisors (private investment and consulting); former CEO and President, Richard Nixon Foundation | | 89 | | General Finance Corporation | |
| James G. Ellis, 1947 | | 2010 | | Professor of Marketing and former Dean, Marshall School of Business, University of Southern California | | 98 | | Mercury General Corporation | |
| Nariman Farvardin, 1956 | | 2018 | | President, Stevens Institute of Technology | | 86 | | None | |
| Mary Davis Holt, 1950 | | 2015–2016
2017 | | Principal, Mary Davis Holt Enterprises, LLC (leadership development consulting); former Partner, Flynn Heath Holt Leadership, LLC (leadership consulting); former COO, Time Life Inc. (1993 – 2003) | | 86 | | None | |
| R. Clark Hooper, 1946 | | 2010 | | Private investor | | 89 | | None | |
| Merit E. Janow, 1958 | | 2010 | | Dean and Professor, Columbia University, School of International and Public Affairs | | 88 | | Mastercard Incorporated; Trimble Inc. | |
Margaret Spellings, 1957
Chairman of the Board (Independent and Non-Executive) | | 2010 | | President and CEO, Texas 2036; former President, Margaret Spellings & Company (public policy and strategic consulting); former President, The University of North Carolina; former President, George W. Bush Foundation | | 90 | | None | |
| Alexandra Trower, 1964 | | 2018 | | Executive Vice President, Global Communications and Corporate Officer, The Estée Lauder Companies | | 85 | | None | |
| Paul S. Williams, 1959 | | 2020 | | Former Partner/Managing Director, Major, Lindsey & Africa (executive recruiting firm) | | 85 | | Compass Minerals, Inc. (producer of salt and specialty fertilizers) | |
Interested trustees4,5
Name, year of birth and
position with fund | | Year first
elected
a trustee
or officer
of the fund2 | | Principal occupation(s) during past five years
and positions held with affiliated entities or
the principal underwriter of the fund | | Number of
portfolios in
fund complex
overseen
by trustee | | Other directorships3
held by trustee | |
| Michael C. Gitlin, 1970 | | 2015 | | Vice Chairman and Director, Capital Research and Management Company; Partner — Capital Fixed Income Investors, Capital Research and Management Company; Director, The Capital Group Companies, Inc.;6 served as Head of Fixed Income at a large investment management firm prior to joining Capital Research and Management Company in 2015 | | 85 | | None | |
| Karl J. Zeile, 1966 | | 2019 | | Partner — Capital Fixed Income Investors,
Capital Research and Management Company | | 20 | | None | |
The fund’s statement of additional information includes further details about fund trustees and is available without charge upon request by calling American Funds Service Company at (800) 421-4225 or by visiting the Capital Group website at capitalgroup.com. The address for all trustees and officers of the fund is 333 South Hope Street, Los Angeles, CA 90071, Attention: Secretary.
| 32 | American Funds Mortgage Fund |
Other officers5
Name, year of birth and
position with fund | | Year first
elected
an officer
of the fund2 | | Principal occupation(s) during past five years and positions held with affiliated entities
or the principal underwriter of the fund |
David J. Betanzos, 1974
President | | 2014 | | Partner — Capital Fixed Income Investors, Capital Research and Management Company;
Director, Capital Research and Management Company |
Kristine M. Nishiyama, 1970
Executive Vice President | | 2010 | | Senior Vice President and Senior Counsel — Fund Business Management Group, Capital Research and Management Company; Chair, Senior Vice President, General Counsel and Director, Capital Bank and Trust Company6 |
Fergus N. MacDonald, 1969
Senior Vice President | | 2010 | | Partner — Capital Fixed Income Investors, Capital Research and Management Company; Director, The Capital Group Companies, Inc.6 |
Steven I. Koszalka, 1964
Secretary | | 2010 | | Vice President — Fund Business Management Group, Capital Research and Management Company |
Brian C. Janssen, 1972
Treasurer | | 2012 | | Vice President — Investment Operations, Capital Research and Management Company |
Jane Y. Chung, 1974
Assistant Secretary | | 2014 | | Associate — Fund Business Management Group, Capital Research and Management Company |
Sandra Chuon, 1972
Assistant Treasurer | | 2019 | | Assistant Vice President — Investment Operations, Capital Research and Management Company |
Gregory F. Niland, 1971
Assistant Treasurer | | 2015 | | Vice President — Investment Operations, Capital Research and Management Company |
| 1 | The term independent trustee refers to a trustee who is not an “interested person” of the fund within the meaning of the Investment Company Act of 1940. |
| 2 | Trustees and officers of the fund serve until their resignation, removal or retirement. |
| 3 | This includes all directorships/trusteeships (other than those in the American Funds or other funds managed by Capital Research and Management Company or its affiliates) that are held by each trustee as a trustee or director of a public company or a registered investment company. |
| 4 | The term interested trustee refers to a trustee who is an “interested person” within the meaning of the Investment Company Act of 1940, on the basis of their affiliation with the fund’s investment adviser, Capital Research and Management Company, or affiliated entities (including the fund’s principal underwriter). |
| 5 | All of the trustees and/or officers listed are officers and/or directors/trustees of one or more of the other funds for which Capital Research and Management Company serves as investment adviser. |
| 6 | Company affiliated with Capital Research and Management Company. |
| American Funds Mortgage Fund | 33 |
This page was intentionally left blank.
| 34 | American Funds Mortgage Fund |
This page was intentionally left blank.
| American Funds Mortgage Fund | 35 |
Office of the fund
6455 Irvine Center Drive
Irvine, CA 92618-4518
Investment adviser
Capital Research and Management Company
333 South Hope Street
Los Angeles, CA 90071-1406
Transfer agent for shareholder accounts
American Funds Service Company
(Write to the address near you.)
P.O. Box 6007
Indianapolis, IN 46206-6007
P.O. Box 2280
Norfolk, VA 23501-2280
Custodian of assets
Bank of New York Mellon
240 Greenwich Street
New York, NY 10286
Counsel
Morgan, Lewis & Bockius LLP
One Federal Street
Boston, MA 02110-1726
Independent registered public accounting firm
PricewaterhouseCoopers LLP
601 South Figueroa Street
Los Angeles, CA 90017-3874
Principal underwriter
American Funds Distributors, Inc.
333 South Hope Street
Los Angeles, CA 90071-1406
| 36 | American Funds Mortgage Fund |
Investors should carefully consider investment objectives, risks, charges and expenses. This and other important information is contained in the fund prospectus and summary prospectus, which can be obtained from your financial professional and should be read carefully before investing. You may also call American Funds Service Company (AFS) at (800) 421-4225 or visit the Capital Group website at capitalgroup.com.
“American Funds Proxy Voting Procedures and Principles” — which describes how we vote proxies relating to portfolio securities — is available on our website or upon request by calling AFS. The fund files its proxy voting record with the U.S. Securities and Exchange Commission (SEC) for the 12 months ended June 30 by August 31. The proxy voting record is available free of charge on the SEC website at sec.gov and on our website.
A complete August 31, 2020, portfolio of American Funds Mortgage Fund’s investments is available free of charge by calling AFS or visiting the SEC website (where it is part of Form N-CSR).
American Funds Mortgage Fund files a complete list of its portfolio holdings with the SEC for the first and third quarters of each fiscal year on Form NPORT-P. This filing is available free of charge on the SEC website. Additionally, the list of portfolio holdings is available by calling AFS.
This report is for the information of shareholders of American Funds Mortgage Fund, but it also may be used as sales literature when preceded or accompanied by the current prospectus or summary prospectus, which gives details about charges, expenses, investment objectives and operating policies of the fund. If used as sales material after December 31, 2020, this report must be accompanied by an American Funds statistical update for the most recently completed calendar quarter.
Bloomberg® is a trademark of Bloomberg Finance L.P. (collectively with its affiliates, “Bloomberg”). Barclays® is a trademark of Barclays Bank Plc (collectively with its affiliates, “Barclays”), used under license. Neither Bloomberg nor Barclays approves or endorses this material, guarantees the accuracy or completeness of any information herein and, to the maximum extent allowed by law, neither shall have any liability or responsibility for injury or damages arising in connection therewith.
American Funds Distributors, Inc., member FINRA.
The Capital Advantage®
Since 1931, Capital Group, home of American Funds, has helped investors pursue long-term investment success. Our consistent approach — in combination with The Capital SystemSM — has resulted in superior outcomes.
| | Aligned with investor success |
| | We base our decisions on a long-term perspective, which we believe aligns our goals with the interests of our clients. Our portfolio managers average 28 years of investment industry experience, including 22 years at our company, reflecting a career commitment to our long-term approach.1 |
| | |
| | The Capital System |
| | The Capital System combines individual accountability with teamwork. Funds using The Capital System are divided into portions that are managed independently by investment professionals with diverse backgrounds, ages and investment approaches. An extensive global research effort is the backbone of our system. |
| | |
| | American Funds’ superior outcomes |
| | Equity funds have beaten their Lipper peer indexes in 92% of 10-year periods and 99% of 20-year periods.2 Fixed income funds have helped investors achieve diversification through attention to correlation between bonds and equities.3 Fund management fees have been among the lowest in the industry.4 |
| | |
| | 1 | Investment industry experience as of December 31, 2019. |
| | 2 | Based on Class F-2 share results for rolling periods through December 31, 2019. Periods covered are the shorter of the fund’s lifetime or since the comparable Lipper index inception date (except Capital Income Builder and SMALLCAP World Fund, for which the Lipper average was used). Expenses differ for each share class, so results will vary. |
| | 3 | Based on Class F-2 share results as of December 31, 2019. Fifteen of the 17 fixed income American Funds that have been in existence for the three-year period showed a three-year correlation below 0.2. Standard & Poor’s 500 Composite Index was used as an equity market proxy. Correlation based on monthly total returns. Correlation is a statistical measure of how two securities move in relation to each other. A correlation ranges from –1 to 1. A positive correlation close to 1 implies that as one security moves, either up or down, the other security will move in “lockstep,” in the same direction. A negative correlation close to –1 indicates that the securities have moved in the opposite direction. |
| | 4 | On average, our management fees were in the lowest quintile 65% of the time, based on the 20-year period ended December 31, 2019, versus comparable Lipper categories, excluding funds of funds. |
Class F-2 shares were first offered on August 1, 2008. Class F-2 share results prior to the date of first sale are hypothetical based on the results of the original share class of the fund without a sales charge, adjusted for typical estimated expenses. Results for certain funds with an inception date after August 1, 2008, also include hypothetical returns because those funds’ Class F-2 shares sold after the funds’ date of first offering. Please see capitalgroup.com for more information on specific expense adjustments and the actual dates of first sale.
All Capital Group trademarks mentioned are owned by The Capital Group Companies, Inc., an affiliated company or fund. All other company and product names mentioned are the property of their respective companies.

ITEM 2 – Code of Ethics
The Registrant has adopted a Code of Ethics that applies to its Principal Executive Officer and Principal Financial Officer. The Registrant undertakes to provide to any person without charge, upon request, a copy of the Code of Ethics. Such request can be made by calling 800/421-4225 or to the Secretary of the Registrant, 6455 Irvine Center Drive, Irvine, California 92618.
ITEM 3 – Audit Committee Financial Expert
The Registrant’s board has determined that James G. Ellis, a member of the Registrant’s audit committee, is an “audit committee financial expert” and "independent," as such terms are defined in this Item. This designation will not increase the designee’s duties, obligations or liability as compared to his or her duties, obligations and liability as a member of the audit committee and of the board, nor will it reduce the responsibility of the other audit committee members. There may be other individuals who, through education or experience, would qualify as "audit committee financial experts" if the board had designated them as such. Most importantly, the board believes each member of the audit committee contributes significantly to the effective oversight of the Registrant’s financial statements and condition.
ITEM 4 – Principal Accountant Fees and Services
| a) Audit Fees: | | |
| Audit | 2019 | 71,000 |
| | 2020 | 37,000 |
| | | |
| b) Audit-Related Fees: | | |
| | 2019 | None |
| | 2020 | None |
| | | |
| c) Tax Fees: | | |
| | 2019 | 8,000 |
| | 2020 | 8,000 |
| | The tax fees consist of professional services relating to the preparation of the Registrant’s tax returns. | |
| | | |
| d) All Other Fees: | | |
| | 2019 | None |
| | 2020 | None |
| | | |
| | Adviser and affiliates (includes only fees for non-audit services billed to the adviser and affiliates for engagements that relate directly to the operations and financial reporting of the Registrant and were subject to the pre-approval policies described below): | |
| a) Audit Fees: | | |
| | Not Applicable | |
| | | |
| b) Audit-Related Fees: | | |
| | 2019 | None |
| | 2020 | None |
| | The audit-related fees consist of assurance and related services relating to the examination of the Registrant’s transfer agent, principal underwriter and investment adviser conducted in accordance with Statement on Standards for Attestation Engagements Number 18 issued by the American Institute of Certified Public Accountants. | |
| | | |
| c) Tax Fees: | | |
| | 2019 | 2,000 |
| | 2020 | 15,000 |
| | The tax fees consist of consulting services relating to the Registrant’s investments. | |
| | | |
| | | |
| d) All Other Fees: | | |
| | 2019 | 4,000 |
| | 2020 | 8,000 |
| | The other fees consist of subscription services related to an accounting research tool. | |
| | | |
| | | |
| | All audit and permissible non-audit services that the Registrant’s audit committee considers compatible with maintaining the independent registered public accounting firm’s independence are required to be pre-approved by the committee. The pre-approval requirement will extend to all non-audit services provided to the Registrant, the investment adviser, and any entity controlling, controlled by, or under common control with the investment adviser that provides ongoing services to the Registrant, if the engagement relates directly to the operations and financial reporting of the Registrant. The committee will not delegate its responsibility to pre-approve these services to the investment adviser. The committee may delegate to one or more committee members the authority to review and pre-approve audit and permissible non-audit services. Actions taken under any such delegation will be reported to the full committee at its next meeting. The pre-approval requirement is waived with respect to non-audit services if certain conditions are met. The pre-approval requirement was not waived for any of the non-audit services listed above provided to the Registrant, adviser and affiliates. | |
| | | |
| | Aggregate non-audit fees paid to the Registrant’s auditors, including fees for all services billed to the Registrant, adviser and affiliates that provide ongoing services to the Registrant, were $14,000 for fiscal year 2019 and $31,000 for fiscal year 2020. The non-audit services represented by these amounts were brought to the attention of the committee and considered to be compatible with maintaining the auditors’ independence. | |
ITEM 5 – Audit Committee of Listed Registrants
Not applicable to this Registrant, insofar as the Registrant is not a listed issuer as defined in Rule 10A-3 under the Securities Exchange Act of 1934.
ITEM 6 – Schedule of Investments

American Funds Mortgage Fund®
Investment portfolio
August 31, 2020
Bonds, notes & other debt instruments 94.91%
Mortgage-backed obligations 89.67%
Federal agency mortgage-backed obligations 85.08% | Principal amount
(000) | Value
(000) |
| Fannie Mae 3.00% 20331 | $377 | $394 |
| Fannie Mae 5.00% 20401 | 458 | 493 |
| Fannie Mae 4.00% 20431 | 4,784 | 5,251 |
| Fannie Mae 4.50% 20471 | 3,000 | 3,172 |
| Fannie Mae Pool #AJ3602 3.00% 20261 | 6 | 7 |
| Fannie Mae Pool #AJ0050 3.00% 20261 | 6 | 6 |
| Fannie Mae Pool #AL1444 3.00% 20271 | 6 | 6 |
| Fannie Mae Pool #AK3264 3.00% 20271 | 6 | 6 |
| Fannie Mae Pool #AL2286 3.00% 20271 | 5 | 5 |
| Fannie Mae Pool #AL7800 2.50% 20301 | 974 | 1,034 |
| Fannie Mae Pool #BM4299 3.00% 20301 | 40 | 42 |
| Fannie Mae Pool #AZ4646 3.50% 20301 | 102 | 108 |
| Fannie Mae Pool #AZ0554 3.50% 20301 | 74 | 78 |
| Fannie Mae Pool #AY1948 3.50% 20301 | 62 | 65 |
| Fannie Mae Pool #AS7323 2.50% 20311 | 894 | 957 |
| Fannie Mae Pool #AS8388 2.50% 20311 | 799 | 848 |
| Fannie Mae Pool #BD2402 3.00% 20311 | 334 | 352 |
| Fannie Mae Pool #FM1162 2.50% 20321 | 884 | 941 |
| Fannie Mae Pool #BM1036 2.50% 20321 | 103 | 110 |
| Fannie Mae Pool #BM1275 3.00% 20321 | 751 | 804 |
| Fannie Mae Pool #BJ5987 3.00% 20321 | 648 | 681 |
| Fannie Mae Pool #MA3218 3.00% 20321 | 29 | 31 |
| Fannie Mae Pool #MA1640 2.50% 20331 | 1,652 | 1,748 |
| Fannie Mae Pool #AB9299 2.50% 20331 | 304 | 320 |
| Fannie Mae Pool #BJ4876 3.00% 20331 | 542 | 579 |
| Fannie Mae Pool #BM5111 3.00% 20331 | 288 | 309 |
| Fannie Mae Pool #BJ4856 3.00% 20331 | 144 | 155 |
| Fannie Mae Pool #BJ4573 3.00% 20331 | 20 | 21 |
| Fannie Mae Pool #BM3919 3.00% 20331 | 18 | 19 |
| Fannie Mae Pool #BJ9000 3.50% 20331 | 209 | 223 |
| Fannie Mae Pool #CA2106 3.50% 20331 | 45 | 47 |
| Fannie Mae Pool #MA3490 4.00% 20331 | 59,725 | 63,345 |
| Fannie Mae Pool #MA3439 4.00% 20331 | 8,053 | 8,545 |
| Fannie Mae Pool #695412 5.00% 20331 | 4 | 4 |
| Fannie Mae Pool #BO6247 2.50% 20341 | 8,840 | 9,302 |
| Fannie Mae Pool #BP0033 2.50% 20341 | 8,416 | 8,837 |
| Fannie Mae Pool #BO7771 2.50% 20341 | 3,694 | 3,879 |
| Fannie Mae Pool #BO7207 2.50% 20341 | 998 | 1,050 |
| Fannie Mae Pool #FM1490 3.50% 20341 | 2,485 | 2,639 |
| Fannie Mae Pool #MA4042 2.00% 20351 | 7,866 | 8,190 |
| Fannie Mae Pool #AD3566 5.00% 20351 | 48 | 53 |
| Fannie Mae Pool #MA2746 4.00% 20361 | 4,525 | 4,899 |
| Fannie Mae Pool #AS7224 4.00% 20361 | 3,889 | 4,210 |
| Fannie Mae Pool #MA2717 4.00% 20361 | 2,727 | 2,959 |
| Fannie Mae Pool #MA2819 4.00% 20361 | 2,613 | 2,829 |
| Fannie Mae Pool #MA2787 4.00% 20361 | 1,303 | 1,411 |
American Funds Mortgage Fund — Page 1 of 13
Bonds, notes & other debt instruments (continued)
Mortgage-backed obligations (continued)
Federal agency mortgage-backed obligations (continued) | Principal amount
(000) | Value
(000) |
| Fannie Mae Pool #MA2630 4.00% 20361 | $535 | $579 |
| Fannie Mae Pool #MA3186 4.00% 20371 | 9,827 | 10,574 |
| Fannie Mae Pool #MA3099 4.00% 20371 | 4,656 | 5,064 |
| Fannie Mae Pool #964279 2.633% 20381,2 | 640 | 651 |
| Fannie Mae Pool #964708 2.765% 20381,2 | 84 | 84 |
| Fannie Mae Pool #889101 3.26% 20381,2 | 771 | 795 |
| Fannie Mae Pool #AC0794 5.00% 20391 | 228 | 263 |
| Fannie Mae Pool #931768 5.00% 20391 | 39 | 45 |
| Fannie Mae Pool #AL9335 3.427% 20401,2 | 30,225 | 31,726 |
| Fannie Mae Pool #AE7629 3.729% 20401,2 | 713 | 746 |
| Fannie Mae Pool #932606 5.00% 20401 | 121 | 139 |
| Fannie Mae Pool #AL9327 3.214% 20411,2 | 27,199 | 28,602 |
| Fannie Mae Pool #AL9326 3.549% 20411,2 | 38,509 | 40,504 |
| Fannie Mae Pool #AL9531 3.637% 20411,2 | 34,486 | 36,219 |
| Fannie Mae Pool #AL0073 3.769% 20411,2 | 2,975 | 3,121 |
| Fannie Mae Pool #AE0789 3.788% 20411,2 | 4,080 | 4,288 |
| Fannie Mae Pool #AE0844 3.818% 20411,2 | 3,393 | 3,557 |
| Fannie Mae Pool #AJ1873 4.00% 20411 | 261 | 289 |
| Fannie Mae Pool #AE1248 5.00% 20411 | 296 | 338 |
| Fannie Mae Pool #AE1274 5.00% 20411 | 227 | 261 |
| Fannie Mae Pool #AE1277 5.00% 20411 | 124 | 141 |
| Fannie Mae Pool #AE1283 5.00% 20411 | 77 | 86 |
| Fannie Mae Pool #AL2000 2.547% 20421,2 | 4,482 | 4,669 |
| Fannie Mae Pool #AL2184 2.618% 20421,2 | 7,329 | 7,655 |
| Fannie Mae Pool #AL1941 2.837% 20421,2 | 5,652 | 5,898 |
| Fannie Mae Pool #AP7819 2.853% 20421,2 | 3,494 | 3,639 |
| Fannie Mae Pool #AP7553 3.00% 20421 | 34,217 | 36,684 |
| Fannie Mae Pool #AL9533 3.175% 20421,2 | 18,741 | 19,616 |
| Fannie Mae Pool #AL9532 3.19% 20421,2 | 43,131 | 45,065 |
| Fannie Mae Pool #AL9530 3.594% 20421,2 | 29,397 | 30,825 |
| Fannie Mae Pool #AE1290 5.00% 20421 | 168 | 191 |
| Fannie Mae Pool #AU0626 2.275% 20431 | 179 | 184 |
| Fannie Mae Pool #AT7470 2.275% 20431 | 116 | 119 |
| Fannie Mae Pool #AU8121 2.275% 20431 | 100 | 103 |
| Fannie Mae Pool #AU8120 2.275% 20431 | 78 | 81 |
| Fannie Mae Pool #AU0627 2.525% 20431 | 201 | 212 |
| Fannie Mae Pool #AU3962 2.525% 20431 | 135 | 142 |
| Fannie Mae Pool #AU1583 2.525% 20431 | 128 | 135 |
| Fannie Mae Pool #AT4747 2.525% 20431 | 125 | 131 |
| Fannie Mae Pool #AU1575 2.525% 20431 | 123 | 130 |
| Fannie Mae Pool #AU1584 2.525% 20431 | 112 | 118 |
| Fannie Mae Pool #AU3963 2.525% 20431 | 96 | 101 |
| Fannie Mae Pool #AT7476 2.525% 20431 | 90 | 95 |
| Fannie Mae Pool #AU8122 2.525% 20431 | 91 | 95 |
| Fannie Mae Pool #AU8124 2.525% 20431 | 80 | 85 |
| Fannie Mae Pool #AU8123 2.525% 20431 | 76 | 80 |
| Fannie Mae Pool #AU6340 2.525% 20431 | 75 | 79 |
| Fannie Mae Pool #AU1585 2.525% 20431 | 64 | 67 |
| Fannie Mae Pool #AU3961 2.525% 20431 | 62 | 66 |
| Fannie Mae Pool #AU4814 2.525% 20431 | 46 | 49 |
| Fannie Mae Pool #AU1577 2.775% 20431 | 336 | 357 |
| Fannie Mae Pool #AU8126 2.775% 20431 | 334 | 355 |
| Fannie Mae Pool #AU4816 2.775% 20431 | 282 | 298 |
| Fannie Mae Pool #AT9853 2.775% 20431 | 211 | 223 |
American Funds Mortgage Fund — Page 2 of 13
Bonds, notes & other debt instruments (continued)
Mortgage-backed obligations (continued)
Federal agency mortgage-backed obligations (continued) | Principal amount
(000) | Value
(000) |
| Fannie Mae Pool #AU3964 2.775% 20431 | $197 | $208 |
| Fannie Mae Pool #AU4817 2.775% 20431 | 133 | 140 |
| Fannie Mae Pool #AU1587 2.775% 20431 | 121 | 127 |
| Fannie Mae Pool #AT9852 2.775% 20431 | 99 | 104 |
| Fannie Mae Pool #AU8125 2.775% 20431 | 91 | 96 |
| Fannie Mae Pool #AU1576 2.775% 20431 | 66 | 70 |
| Fannie Mae Pool #AU3965 2.775% 20431 | 57 | 60 |
| Fannie Mae Pool #AT8826 2.775% 20431 | 55 | 58 |
| Fannie Mae Pool #AU8127 2.775% 20431 | 52 | 55 |
| Fannie Mae Pool #AT8825 2.775% 20431 | 42 | 44 |
| Fannie Mae Pool #AT5898 3.00% 20431 | 13,838 | 14,839 |
| Fannie Mae Pool #AU3966 3.025% 20431 | 321 | 339 |
| Fannie Mae Pool #AT7457 3.025% 20431 | 195 | 206 |
| Fannie Mae Pool #AU3968 3.025% 20431 | 178 | 188 |
| Fannie Mae Pool #AU8129 3.025% 20431 | 100 | 106 |
| Fannie Mae Pool #AU4819 3.025% 20431 | 85 | 90 |
| Fannie Mae Pool #AU1588 3.025% 20431 | 82 | 86 |
| Fannie Mae Pool #AU6343 3.025% 20431 | 78 | 82 |
| Fannie Mae Pool #AU0630 3.025% 20431 | 72 | 76 |
| Fannie Mae Pool #AU6342 3.025% 20431 | 42 | 44 |
| Fannie Mae Pool #AT8820 3.275% 20431 | 68 | 71 |
| Fannie Mae Pool #AU8131 3.275% 20431 | 58 | 61 |
| Fannie Mae Pool #AU1591 3.275% 20431 | 31 | 32 |
| Fannie Mae Pool #AL3829 3.50% 20431 | 2,144 | 2,354 |
| Fannie Mae Pool #AT7161 3.50% 20431 | 985 | 1,073 |
| Fannie Mae Pool #AR1512 3.50% 20431 | 456 | 498 |
| Fannie Mae Pool #AT0412 3.50% 20431 | 248 | 272 |
| Fannie Mae Pool #AT3954 3.50% 20431 | 126 | 137 |
| Fannie Mae Pool #AT0300 3.50% 20431 | 90 | 97 |
| Fannie Mae Pool #AX8521 3.50% 20441 | 214 | 235 |
| Fannie Mae Pool #AY1829 3.50% 20441 | 159 | 174 |
| Fannie Mae Pool #AW8240 3.50% 20441 | 32 | 34 |
| Fannie Mae Pool #BE5017 3.50% 20451 | 1,233 | 1,340 |
| Fannie Mae Pool #BE5009 3.50% 20451 | 1,098 | 1,184 |
| Fannie Mae Pool #BE8740 3.50% 20471 | 1,121 | 1,218 |
| Fannie Mae Pool #BD2440 3.50% 20471 | 938 | 997 |
| Fannie Mae Pool #BE8742 3.50% 20471 | 322 | 355 |
| Fannie Mae Pool #BH2848 3.50% 20471 | 182 | 195 |
| Fannie Mae Pool #BH2846 3.50% 20471 | 155 | 171 |
| Fannie Mae Pool #BH2847 3.50% 20471 | 122 | 130 |
| Fannie Mae Pool #BH2597 4.00% 20471 | 11,372 | 12,167 |
| Fannie Mae Pool #BJ5015 4.00% 20471 | 2,778 | 3,066 |
| Fannie Mae Pool #BH3122 4.00% 20471 | 96 | 106 |
| Fannie Mae Pool #BM4488 3.406% 20481,2 | 18,826 | 19,634 |
| Fannie Mae Pool #BJ4901 3.50% 20481 | 703 | 772 |
| Fannie Mae Pool #FM2669 4.00% 20481 | 4,300 | 4,599 |
| Fannie Mae Pool #CA2850 4.00% 20481 | 3,177 | 3,584 |
| Fannie Mae Pool #BK6840 4.00% 20481 | 1,872 | 2,065 |
| Fannie Mae Pool #BK5232 4.00% 20481 | 1,288 | 1,429 |
| Fannie Mae Pool #BK9743 4.00% 20481 | 492 | 536 |
| Fannie Mae Pool #BM2006 4.00% 20481 | 57 | 61 |
| Fannie Mae Pool #CA2205 4.50% 20481 | 17,659 | 19,084 |
| Fannie Mae Pool #BK7665 4.50% 20481 | 9,453 | 10,455 |
| Fannie Mae Pool #BK0951 4.50% 20481 | 7,066 | 7,888 |
American Funds Mortgage Fund — Page 3 of 13
Bonds, notes & other debt instruments (continued)
Mortgage-backed obligations (continued)
Federal agency mortgage-backed obligations (continued) | Principal amount
(000) | Value
(000) |
| Fannie Mae Pool #BK9761 4.50% 20481 | $453 | $496 |
| Fannie Mae Pool #BN1576 4.50% 20481 | 221 | 238 |
| Fannie Mae Pool #CA1574 5.00% 20481 | 16,462 | 18,121 |
| Fannie Mae Pool #CA4867 3.00% 20491 | 93,675 | 101,116 |
| Fannie Mae Pool #BO5176 3.00% 20491 | 6,850 | 7,415 |
| Fannie Mae Pool #CA4543 3.00% 20491 | 2,141 | 2,314 |
| Fannie Mae Pool #CA4151 3.50% 20491 | 10,512 | 11,655 |
| Fannie Mae Pool #FM1062 3.50% 20491 | 9,864 | 10,883 |
| Fannie Mae Pool #BN6708 3.50% 20491 | 9,749 | 10,520 |
| Fannie Mae Pool #FM1443 3.50% 20491 | 8,114 | 8,908 |
| Fannie Mae Pool #BJ8411 3.50% 20491 | 2,365 | 2,597 |
| Fannie Mae Pool #BJ8402 3.547% 20491,2 | 3,428 | 3,591 |
| Fannie Mae Pool #MA3687 4.00% 20491 | 8,971 | 9,556 |
| Fannie Mae Pool #MA3592 4.00% 20491 | 695 | 740 |
| Fannie Mae Pool #MA3693 4.00% 20491 | 23 | 25 |
| Fannie Mae Pool #BN6006 4.50% 20491 | 824 | 890 |
| Fannie Mae Pool #CA5539 3.00% 20501 | 127,128 | 135,576 |
| Fannie Mae Pool #CA5496 3.00% 20501 | 88,545 | 95,920 |
| Fannie Mae Pool #CA5536 3.00% 20501 | 17,878 | 19,178 |
| Fannie Mae Pool #CA5540 3.00% 20501 | 9,237 | 9,822 |
| Fannie Mae Pool #CA5229 3.00% 20501 | 5,198 | 5,602 |
| Fannie Mae Pool #CA5338 3.00% 20501 | 4,954 | 5,295 |
| Fannie Mae Pool #FM2839 3.50% 20501 | 12,730 | 13,732 |
| Fannie Mae Pool #FM2664 3.50% 20501 | 9,327 | 10,224 |
| Fannie Mae Pool #MA4026 4.00% 20501 | 4,510 | 4,813 |
| Fannie Mae Pool #AS0745 3.50% 20531 | 1,531 | 1,587 |
| Fannie Mae, Series 2016-M1, Class ASQ2, Multi Family, 2.132% 20211,2 | 59 | 59 |
| Fannie Mae, Series 2011-M9, Class A2, Multi Family, 2.821% 20211 | 57 | 58 |
| Fannie Mae, Series 2018-M5, Class A2, Multi Family, 3.56% 20211,2 | 583 | 589 |
| Fannie Mae, Series 2012-M13, Class A2, Multi Family, 2.377% 20221 | 303 | 311 |
| Fannie Mae, Series 2015-M4, Class AV2, Multi Family, 2.509% 20221,2 | 467 | 476 |
| Fannie Mae, Series 2012-M2, Class A2, Multi Family, 2.717% 20221 | 162 | 166 |
| Fannie Mae, Series 2016-M2, Class AV2, Multi Family, 2.152% 20231 | 693 | 709 |
| Fannie Mae, Series 2016-M3, Class ASQ2, Multi Family, 2.263% 20231 | 193 | 196 |
| Fannie Mae, Series 2013-M12, Class APT, Multi Family, 2.49% 20231,2 | 523 | 541 |
| Fannie Mae, Series 2017-M3, Class AV2, Multi Family, 2.604% 20241,2 | 437 | 461 |
| Fannie Mae, Series 2017-M3, Class AV1, Multi Family, 2.604% 20241,2 | 12 | 12 |
| Fannie Mae, Series 2017-M10, Class AV2, Multi Family, 2.641% 20241,2 | 558 | 587 |
| Fannie Mae, Series 2017-M10, Class AV1, Multi Family, 2.641% 20241,2 | 111 | 113 |
| Fannie Mae, Series 2017-M15, Class AV2, Multi Family, 2.713% 20241,2 | 485 | 519 |
| Fannie Mae, Series 2017-M15, Class AV1, Multi Family, 2.713% 20241,2 | 5 | 5 |
| Fannie Mae, Series 2015-M12, Class A1, Multi Family, 2.331% 20251 | 105 | 107 |
| Fannie Mae, Series 2015-M8, Class A1, Multi Family, 2.344% 20251 | 273 | 282 |
| Fannie Mae, Series 2015-M13, Class A1, Multi Family, 2.353% 20251 | 49 | 50 |
| Fannie Mae, Series 2015-M15, Class A1, Multi Family, 2.623% 20251 | 493 | 512 |
| Fannie Mae, Series 2015-M16, Class A1, Multi Family, 2.70% 20251,2 | 388 | 405 |
| Fannie Mae, Series 2016-M9, Class A1, Multi Family, 2.003% 20261 | 93 | 95 |
| Fannie Mae, Series 2016-M7, Class A1, Multi Family, 2.037% 20261 | 151 | 155 |
| Fannie Mae, Series 2016-M5, Class A1, Multi Family, 2.073% 20261 | 528 | 548 |
| Fannie Mae, Series 2016-M11, Class A1, Multi Family, 2.08% 20261 | 775 | 808 |
| Fannie Mae, Series 2016-M12, Class A1, Multi Family, 2.132% 20261 | 376 | 390 |
| Fannie Mae, Series 2016-M6, Class A1, Multi Family, 2.137% 20261 | 373 | 390 |
| Fannie Mae, Series 2016-M4, Class A1, Multi Family, 2.187% 20261 | 361 | 375 |
| Fannie Mae, Series 2016-M1, Class A1, Multi Family, 2.428% 20261 | 199 | 203 |
American Funds Mortgage Fund — Page 4 of 13
Bonds, notes & other debt instruments (continued)
Mortgage-backed obligations (continued)
Federal agency mortgage-backed obligations (continued) | Principal amount
(000) | Value
(000) |
| Fannie Mae, Series 2017-M1, Class A1, Multi Family, 2.497% 20261,2 | $341 | $350 |
| Fannie Mae, Series 2017-M3, Class A1, Multi Family, 2.565% 20261,2 | 352 | 363 |
| Fannie Mae, Series 2016-M13, Class A1, Multi Family, 2.565% 20261,2 | 52 | 52 |
| Fannie Mae, Series 2017-M7, Class A1, Multi Family, 2.595% 20261 | 548 | 575 |
| Fannie Mae, Series 2017-M4, Class A1, Multi Family, 2.67% 20261,2 | 378 | 398 |
| Fannie Mae, Series 2017-M8, Class A1, Multi Family, 2.654% 20271 | 513 | 535 |
| Fannie Mae, Series 2017-M12, Class A1, Multi Family, 2.747% 20271 | 185 | 195 |
| Fannie Mae, Series 2017-M13, Class A1, Multi Family, 2.746% 20271 | 53 | 54 |
| Fannie Mae, Series 2017-M2, Class A1, Multi Family, 2.895% 20271,2 | 228 | 234 |
| Fannie Mae, Series 2017-M15, Class ATS1, Multi Family, 2.987% 20271,3 | 470 | 497 |
| Freddie Mac 2.50% 20331 | 107 | 113 |
| Freddie Mac 4.00% 20361 | 1,089 | 1,180 |
| Freddie Mac 4.00% 20361 | 1,040 | 1,125 |
| Freddie Mac 4.00% 20361 | 839 | 908 |
| Freddie Mac 3.50% 20461 | 199 | 207 |
| Freddie Mac 4.50% 20461 | 1,281 | 1,402 |
| Freddie Mac 4.00% 20471 | 2,038 | 2,121 |
| Freddie Mac 5.00% 20481 | 2,062 | 2,266 |
| Freddie Mac Pool #ZA2598 3.00% 20251 | 3 | 4 |
| Freddie Mac Pool #ZA2593 3.00% 20251 | 3 | 3 |
| Freddie Mac Pool #ZS6339 3.00% 20261 | 6 | 7 |
| Freddie Mac Pool #ZK2925 3.00% 20261 | 6 | 6 |
| Freddie Mac Pool #ZK2882 3.00% 20261 | 5 | 5 |
| Freddie Mac Pool #ZK3788 3.00% 20261 | 3 | 3 |
| Freddie Mac Pool #ZK3541 3.00% 20261 | 2 | 2 |
| Freddie Mac Pool #ZK3935 3.00% 20271 | 5 | 6 |
| Freddie Mac Pool #ZK3848 3.00% 20271 | 4 | 4 |
| Freddie Mac Pool #ZK7590 3.00% 20291 | 13 | 13 |
| Freddie Mac Pool #ZT1332 3.00% 20301 | 2,373 | 2,531 |
| Freddie Mac Pool #ZK8180 2.50% 20311 | 1,077 | 1,146 |
| Freddie Mac Pool #G16634 3.00% 20311 | 3,523 | 3,780 |
| Freddie Mac Pool #C91593 2.50% 20321 | 70 | 74 |
| Freddie Mac Pool #ZS8675 2.50% 20321 | 19 | 20 |
| Freddie Mac Pool #G18655 3.00% 20321 | 548 | 575 |
| Freddie Mac Pool #ZS8087 2.50% 20331 | 56 | 58 |
| Freddie Mac Pool #V61960 3.00% 20331 | 2,081 | 2,198 |
| Freddie Mac Pool #ZS8710 3.00% 20331 | 5 | 5 |
| Freddie Mac Pool #QN1197 2.50% 20341 | 8,338 | 8,777 |
| Freddie Mac Pool #QN1174 2.50% 20341 | 384 | 403 |
| Freddie Mac Pool #SB8041 3.00% 20351 | 2 | 2 |
| Freddie Mac Pool #G03699 6.00% 20381 | 92 | 108 |
| Freddie Mac Pool #840222 3.688% 20401,2 | 7,275 | 7,646 |
| Freddie Mac Pool #Q05343 4.00% 20411 | 344 | 368 |
| Freddie Mac Pool #Q18236 3.50% 20431 | 999 | 1,089 |
| Freddie Mac Pool #Q19133 3.50% 20431 | 624 | 680 |
| Freddie Mac Pool #Q17696 3.50% 20431 | 571 | 628 |
| Freddie Mac Pool #Q15874 4.00% 20431 | 53 | 57 |
| Freddie Mac Pool #Q28558 3.50% 20441 | 3,083 | 3,380 |
| Freddie Mac Pool #760012 3.097% 20451,2 | 1,677 | 1,753 |
| Freddie Mac Pool #760013 3.189% 20451,2 | 1,125 | 1,175 |
| Freddie Mac Pool #760014 3.346% 20451,2 | 8,241 | 8,590 |
| Freddie Mac Pool #760015 3.089% 20471,2 | 2,671 | 2,757 |
| Freddie Mac Pool #Q52069 3.50% 20471 | 1,691 | 1,840 |
| Freddie Mac Pool #Q51622 3.50% 20471 | 1,322 | 1,449 |
American Funds Mortgage Fund — Page 5 of 13
Bonds, notes & other debt instruments (continued)
Mortgage-backed obligations (continued)
Federal agency mortgage-backed obligations (continued) | Principal amount
(000) | Value
(000) |
| Freddie Mac Pool #Q47615 3.50% 20471 | $1,128 | $1,237 |
| Freddie Mac Pool #Q55056 3.50% 20481 | 2,230 | 2,407 |
| Freddie Mac Pool #Q54709 3.50% 20481 | 1,210 | 1,316 |
| Freddie Mac Pool #Q54701 3.50% 20481 | 1,120 | 1,218 |
| Freddie Mac Pool #Q54782 3.50% 20481 | 1,069 | 1,163 |
| Freddie Mac Pool #Q54781 3.50% 20481 | 996 | 1,093 |
| Freddie Mac Pool #Q54700 3.50% 20481 | 855 | 939 |
| Freddie Mac Pool #Q56591 3.50% 20481 | 819 | 881 |
| Freddie Mac Pool #Q55060 3.50% 20481 | 683 | 735 |
| Freddie Mac Pool #Q56590 3.50% 20481 | 619 | 674 |
| Freddie Mac Pool #Q56589 3.50% 20481 | 494 | 534 |
| Freddie Mac Pool #Q54698 3.50% 20481 | 444 | 492 |
| Freddie Mac Pool #Q54699 3.50% 20481 | 439 | 485 |
| Freddie Mac Pool #Q54831 3.50% 20481 | 311 | 343 |
| Freddie Mac Pool #G67711 4.00% 20481 | 15,973 | 17,733 |
| Freddie Mac Pool #Q56599 4.00% 20481 | 1,983 | 2,201 |
| Freddie Mac Pool #Q56175 4.00% 20481 | 1,400 | 1,554 |
| Freddie Mac Pool #Q55971 4.00% 20481 | 1,284 | 1,425 |
| Freddie Mac Pool #SI2002 4.00% 20481 | 947 | 1,011 |
| Freddie Mac Pool #Q55970 4.00% 20481 | 614 | 687 |
| Freddie Mac Pool #Q56576 4.00% 20481 | 617 | 658 |
| Freddie Mac Pool #Q58411 4.50% 20481 | 3,256 | 3,652 |
| Freddie Mac Pool #Q58436 4.50% 20481 | 1,321 | 1,495 |
| Freddie Mac Pool #Q58378 4.50% 20481 | 1,213 | 1,333 |
| Freddie Mac Pool #Q57242 4.50% 20481 | 850 | 924 |
| Freddie Mac Pool #RA1339 3.00% 20491 | 40,790 | 43,473 |
| Freddie Mac Pool #QA4673 3.00% 20491 | 9,567 | 10,286 |
| Freddie Mac Pool #SD7503 3.50% 20491 | 83,040 | 89,325 |
| Freddie Mac Pool #QA5131 3.50% 20491 | 34,092 | 36,356 |
| Freddie Mac Pool #RA1463 3.50% 20491 | 7,149 | 7,926 |
| Freddie Mac Pool #RA1580 3.50% 20491 | 7,117 | 7,891 |
| Freddie Mac Pool #QA0284 3.50% 20491 | 4,606 | 5,056 |
| Freddie Mac Pool #QA2748 3.50% 20491 | 954 | 1,048 |
| Freddie Mac Pool #ZT1864 4.00% 20491 | 650 | 693 |
| Freddie Mac Pool #ZT2087 4.00% 20491 | 286 | 305 |
| Freddie Mac Pool #ZT1594 4.00% 20491 | 19 | 20 |
| Freddie Mac Pool #RA2596 2.50% 20501 | 1,491 | 1,594 |
| Freddie Mac Pool #RA2597 2.50% 20501 | 989 | 1,042 |
| Freddie Mac Pool #RA2595 2.50% 20501 | 984 | 1,036 |
| Freddie Mac Pool #QA8528 3.00% 20501 | 67,668 | 72,165 |
| Freddie Mac Pool #SD7512 3.00% 20501 | 12,539 | 13,417 |
| Freddie Mac Pool #RA2319 3.00% 20501 | 8,550 | 9,030 |
| Freddie Mac Pool #SD0187 3.00% 20501 | 4,879 | 5,282 |
| Freddie Mac Pool #SD7514 3.50% 20501 | 95,787 | 102,879 |
| Freddie Mac Pool #RA1996 3.50% 20501 | 32,415 | 34,969 |
| Freddie Mac Pool #QA7760 3.50% 20501 | 99 | 106 |
| Freddie Mac Pool #SD8053 4.50% 20501 | 8,191 | 8,853 |
| Freddie Mac, Series KS01, Class A2, Multi Family, 2.522% 20231 | 454 | 469 |
| Freddie Mac, Series K027, Class A2, Multi Family, 2.637% 20231 | 10,000 | 10,464 |
| Freddie Mac, Series K032, Class A2, Multi Family, 3.31% 20231 | 11,250 | 12,063 |
| Freddie Mac, Series K029, Class A2, Multi Family, 3.32% 20231 | 2,460 | 2,624 |
| Freddie Mac, Series K035, Class A2, Multi Family, 3.458% 20231,2 | 5,281 | 5,704 |
| Freddie Mac, Series K036, Class A2, Multi Family, 3.527% 20231 | 1,592 | 1,733 |
| Freddie Mac, Series K038, Class A2, Multi Family, 3.389% 20241 | 5,000 | 5,467 |
American Funds Mortgage Fund — Page 6 of 13
Bonds, notes & other debt instruments (continued)
Mortgage-backed obligations (continued)
Federal agency mortgage-backed obligations (continued) | Principal amount
(000) | Value
(000) |
| Freddie Mac, Series K037, Class A2, Multi Family, 3.49% 20241 | $5,000 | $5,459 |
| Freddie Mac, Series K052, Class A2, Multi Family, 3.151% 20251 | 12,933 | 14,469 |
| Freddie Mac, Series K050, Class A2, Multi Family, 3.334% 20251 | 10,000 | 11,240 |
| Freddie Mac, Series K060, Class A2, Multi Family, 3.30% 20261 | 3,500 | 4,006 |
| Freddie Mac, Series K095, Class A1, Multi Family, 2.631% 20281 | 8,987 | 9,863 |
| Freddie Mac, Series K078, Class A2, Multi Family, 3.854% 20281 | 2,500 | 3,009 |
| Freddie Mac, Series K081, Class A2, Multi Family, 3.90% 20281,2 | 24,375 | 29,506 |
| Freddie Mac, Series K082, Class A2, Multi Family, 3.92% 20281,2 | 19,500 | 23,713 |
| Freddie Mac, Series K083, Class A2, Multi Family, 4.05% 20281,2 | 20,100 | 24,714 |
| Freddie Mac Seasoned Credit Risk Transfer Trust, Series 2017-2, Class HA, 2.95% 20561,2 | 13,581 | 14,422 |
| Freddie Mac Seasoned Credit Risk Transfer Trust, Series 2017-3, Class MT, 3.00% 20561 | 15,779 | 17,262 |
| Freddie Mac Seasoned Credit Risk Transfer Trust, Series 2017-2, Class MA, 3.00% 20561 | 13,380 | 14,251 |
| Freddie Mac Seasoned Credit Risk Transfer Trust, Series 2017-1, Class HA, 3.00% 20561,2 | 9,961 | 10,581 |
| Freddie Mac Seasoned Credit Risk Transfer Trust, Series 2017-3, Class HA, 3.25% 20561,2 | 18,392 | 19,713 |
| Freddie Mac Seasoned Credit Risk Transfer Trust, Series 2017-3, Class HT, 3.25% 20561 | 2,881 | 3,193 |
| Freddie Mac Seasoned Credit Risk Transfer Trust, Series 2018-1, Class HT, 3.00% 20571 | 15,237 | 16,715 |
| Freddie Mac Seasoned Credit Risk Transfer Trust, Series 2017-4, Class HT, 3.25% 20571,2 | 95,646 | 104,950 |
| Freddie Mac Seasoned Credit Risk Transfer Trust, Series 2017-4, Class MT, 3.50% 20571 | 60,260 | 67,789 |
| Freddie Mac Seasoned Credit Risk Transfer Trust, Series 2018-2, Class MT, 3.50% 20571 | 33,262 | 37,474 |
| Freddie Mac Seasoned Credit Risk Transfer Trust, Series 2018-3, Class MA, 3.50% 20571 | 3,599 | 3,879 |
| Freddie Mac Seasoned Credit Risk Transfer Trust, Series 2018-4, Class MT, 3.50% 20571 | 2,357 | 2,658 |
| Freddie Mac Seasoned Credit Risk Transfer Trust, Series 2019-2, Class MA, 3.50% 20581 | 3,416 | 3,702 |
| Freddie Mac Seasoned Credit Risk Transfer Trust, Series 2019-1, Class MT, 3.50% 20581 | 2,180 | 2,457 |
| Freddie Mac Seasoned Credit Risk Transfer Trust, Series 2019-2, Class MT, 3.50% 20581 | 1,746 | 1,967 |
| Freddie Mac Seasoned Credit Risk Transfer Trust, Series 2019-1, Class MA, 3.50% 20581 | 1,229 | 1,329 |
| Freddie Mac Seasoned Credit Risk Transfer Trust, Series 2019-3, Class MT, 3.50% 20581 | 1,185 | 1,313 |
| Freddie Mac Seasoned Credit Risk Transfer Trust, Series 2019-4, Class MA, 3.00% 20591 | 37,761 | 40,283 |
Freddie Mac Seasoned Loan Structured Transaction Trust, Series 2018-2, Class A1,
3.50% 20281 | 75,724 | 82,668 |
Freddie Mac Seasoned Loan Structured Transaction Trust, Series 2018-1, Class A1,
3.50% 20281 | 18,008 | 19,520 |
Freddie Mac Seasoned Loan Structured Transaction Trust, Series 2019-3, Class A1C,
2.75% 20291 | 63,344 | 66,912 |
Freddie Mac Seasoned Loan Structured Transaction Trust, Series 2019-1, Class A1,
3.50% 20291 | 110,635 | 120,494 |
Freddie Mac Seasoned Loan Structured Transaction Trust, Series 2020-1, Class A1D,
2.00% 20301 | 35,017 | 36,399 |
Freddie Mac Seasoned Loan Structured Transaction Trust, Series 2020-1, Class A2D,
2.00% 20301 | 5,780 | 6,075 |
| Government National Mortgage Assn. 3.75% 20341 | 988 | 1,057 |
| Government National Mortgage Assn. 4.25% 20341 | 949 | 1,031 |
| Government National Mortgage Assn. 3.25% 20351 | 2,309 | 2,452 |
| Government National Mortgage Assn. 3.25% 20351 | 1,564 | 1,661 |
| Government National Mortgage Assn. 3.25% 20351 | 1,316 | 1,398 |
| Government National Mortgage Assn. 3.25% 20351 | 1,229 | 1,306 |
| Government National Mortgage Assn. 3.25% 20401 | 1,011 | 1,076 |
| Government National Mortgage Assn. 3.25% 20401 | 777 | 825 |
| Government National Mortgage Assn. 3.25% 20401 | 591 | 627 |
| Government National Mortgage Assn. 5.00% 20401 | 56 | 61 |
| Government National Mortgage Assn. 5.00% 20411 | 2,018 | 2,212 |
| Government National Mortgage Assn. 2.75% 20421 | 496 | 523 |
| Government National Mortgage Assn. 2.75% 20421 | 370 | 389 |
| Government National Mortgage Assn. 2.75% 20421 | 234 | 246 |
| Government National Mortgage Assn. 2.75% 20421 | 222 | 233 |
American Funds Mortgage Fund — Page 7 of 13
Bonds, notes & other debt instruments (continued)
Mortgage-backed obligations (continued)
Federal agency mortgage-backed obligations (continued) | Principal amount
(000) | Value
(000) |
| Government National Mortgage Assn. 2.75% 20421 | $211 | $222 |
| Government National Mortgage Assn. 2.75% 20421 | 64 | 67 |
| Government National Mortgage Assn. 2.75% 20421 | 56 | 59 |
| Government National Mortgage Assn. 3.50% 20421 | 565 | 614 |
| Government National Mortgage Assn. 3.50% 20431 | 864 | 923 |
| Government National Mortgage Assn. 3.50% 20431 | 801 | 855 |
| Government National Mortgage Assn. 4.00% 20431 | 598 | 634 |
| Government National Mortgage Assn. 3.75% 20441 | 1,270 | 1,365 |
| Government National Mortgage Assn. 4.25% 20441 | 748 | 836 |
| Government National Mortgage Assn. 4.00% 20461 | 3,069 | 3,226 |
| Government National Mortgage Assn. 2.00% 20501,4 | 189,599 | 195,502 |
| Government National Mortgage Assn. 2.50% 20501,4 | 107,393 | 112,981 |
| Government National Mortgage Assn. 2.50% 20501,4 | 8,743 | 9,215 |
| Government National Mortgage Assn. 3.50% 20501,4 | 136,141 | 143,363 |
| Government National Mortgage Assn. 3.50% 20501,4 | 7,803 | 8,220 |
| Government National Mortgage Assn. 4.00% 20501,4 | 1,386 | 1,476 |
| Government National Mortgage Assn. Pool #778208 4.00% 20321 | 712 | 770 |
| Government National Mortgage Assn. Pool #778205 4.00% 20321 | 511 | 553 |
| Government National Mortgage Assn. Pool #796771 6.50% 20321 | 615 | 716 |
| Government National Mortgage Assn. Pool #AC2887 5.00% 20351 | 307 | 334 |
| Government National Mortgage Assn. Pool #AA7288 3.75% 20371 | 391 | 419 |
| Government National Mortgage Assn. Pool #773549 6.50% 20381 | 337 | 401 |
| Government National Mortgage Assn. Pool #AA4803 6.50% 20381 | 53 | 59 |
| Government National Mortgage Assn. Pool #783690 6.00% 20391 | 1,781 | 2,033 |
| Government National Mortgage Assn. Pool #783689 5.50% 20401 | 1,961 | 2,256 |
| Government National Mortgage Assn. Pool #MA0273 4.00% 20411 | 1,038 | 1,077 |
| Government National Mortgage Assn. Pool #783687 4.50% 20411 | 994 | 1,078 |
| Government National Mortgage Assn. Pool #AC2904 4.50% 20411 | 721 | 784 |
| Government National Mortgage Assn. Pool #MA0310 4.50% 20411 | 584 | 627 |
| Government National Mortgage Assn. Pool #AB3621 4.50% 20411 | 270 | 291 |
| Government National Mortgage Assn. Pool #MA0274 4.50% 20411 | 218 | 234 |
| Government National Mortgage Assn. Pool #783688 5.00% 20411 | 1,609 | 1,803 |
| Government National Mortgage Assn. Pool #005158 5.00% 20411 | 702 | 768 |
| Government National Mortgage Assn. Pool #005165 6.50% 20411 | 78 | 89 |
| Government National Mortgage Assn. Pool #792276 3.50% 20421 | 476 | 516 |
| Government National Mortgage Assn. Pool #770241 4.00% 20421 | 506 | 556 |
| Government National Mortgage Assn. Pool #770242 4.00% 20421 | 506 | 551 |
| Government National Mortgage Assn. Pool #AC2872 4.00% 20421 | 453 | 489 |
| Government National Mortgage Assn. Pool #AB2159 4.50% 20421 | 1,240 | 1,345 |
| Government National Mortgage Assn. Pool #MA4511 4.00% 20471 | 85,495 | 92,225 |
| Government National Mortgage Assn. Pool #MA4322 4.00% 20471 | 5,743 | 6,195 |
| Government National Mortgage Assn. Pool #MA5020 4.00% 20481 | 1,223 | 1,324 |
| Government National Mortgage Assn. Pool #MA5595 4.00% 20481 | 576 | 618 |
| Government National Mortgage Assn. Pool #MA5651 4.00% 20481 | 456 | 488 |
| Government National Mortgage Assn. Pool #MA5398 4.00% 20481 | 344 | 368 |
| Government National Mortgage Assn. Pool #MA5528 4.00% 20481 | 331 | 354 |
| Government National Mortgage Assn. Pool #MA5466 4.00% 20481 | 289 | 310 |
| Government National Mortgage Assn. Pool #MA5264 4.00% 20481 | 133 | 143 |
| Government National Mortgage Assn. Pool #MA5764 4.50% 20491 | 39,341 | 42,368 |
| Government National Mortgage Assn. Pool #MA5877 4.50% 20491 | 13,072 | 14,082 |
| Government National Mortgage Assn. Pool #MA6092 4.50% 20491 | 10,517 | 11,287 |
| Government National Mortgage Assn. Pool #MA6041 4.50% 20491 | 1,239 | 1,334 |
| Government National Mortgage Assn. Pool #MA6042 5.00% 20491 | 56 | 60 |
| Government National Mortgage Assn. Pool #MA6767 3.50% 20501 | 2,238 | 2,386 |
American Funds Mortgage Fund — Page 8 of 13
Bonds, notes & other debt instruments (continued)
Mortgage-backed obligations (continued)
Federal agency mortgage-backed obligations (continued) | Principal amount
(000) | Value
(000) |
| Government National Mortgage Assn. Pool #MA6542 3.50% 20501 | $814 | $859 |
| Government National Mortgage Assn. Pool #MA6543 4.00% 20501 | 1,439 | 1,534 |
| Government National Mortgage Assn. Pool #773441 4.90% 20621 | 6 | 6 |
| Government National Mortgage Assn. Pool #AG8235 5.229% 20641 | 2 | 2 |
| Government National Mortgage Assn. Pool #AI2366 4.579% 20651 | 59 | 61 |
| Government National Mortgage Assn. Pool #AQ8290 4.80% 20661 | 13 | 14 |
| Government National Mortgage Assn. Pool #AQ8292 5.122% 20661 | 7 | 8 |
| Government National Mortgage Assn., Series 2011-H02, Class BA, 4.45% 20611,2 | 8 | 8 |
| Government National Mortgage Assn., Series 2016-H13, Class IO, interest only, 0.615% 20661,2 | 69,747 | 1,314 |
| Uniform Mortgage-Backed Security 1.50% 20351,4 | 1,090,900 | 1,114,593 |
| Uniform Mortgage-Backed Security 1.50% 20351,4 | 207,950 | 212,523 |
| Uniform Mortgage-Backed Security 2.00% 20351,4 | 614,076 | 638,159 |
| Uniform Mortgage-Backed Security 2.50% 20351,4 | 242,320 | 253,755 |
| Uniform Mortgage-Backed Security 3.00% 20351,4 | 323 | 339 |
| Uniform Mortgage-Backed Security 2.00% 20501,4 | 67,850 | 69,660 |
| Uniform Mortgage-Backed Security 2.50% 20501,4 | 16,800 | 17,652 |
| Uniform Mortgage-Backed Security 3.00% 20501,4 | 2 | 2 |
| Uniform Mortgage-Backed Security 3.50% 20501,4 | 430,565 | 454,145 |
| Uniform Mortgage-Backed Security 4.50% 20501,4 | 99,000 | 106,955 |
| Uniform Mortgage-Backed Security 4.50% 20501,4 | 30,411 | 32,855 |
| Vendee Mortgage Trust, Series 2011-2, Class V, 3.75% 20281 | 3,402 | 3,451 |
| | | 6,096,620 |
| Collateralized mortgage-backed obligations (privately originated) 4.34% | | |
| Arroyo Mortgage Trust, Series 2018-1, Class A1, 3.763% 20481,2,3 | 2,899 | 2,989 |
| Arroyo Mortgage Trust, Series 2019-1, Class A1, 3.805% 20491,2,3 | 197 | 203 |
| Cascade Funding Mortgage Trust, Series 2019-HB1, Class A, 2.386% 20291,2,3 | 4,451 | 4,478 |
| Cascade Funding Mortgage Trust, Series 2020-HB3, Class A, 2.812% 20301,2,3 | 26,568 | 26,795 |
| Cascade Funding Mortgage Trust, Series 2020-HBA, Class A, 3.405% 20301,2,3 | 14,006 | 14,172 |
| CGRBS Commercial Mortgage Trust, Series 2013-VN05, Class A, 3.369% 20351,3 | 5,000 | 5,263 |
| Credit Suisse Mortgage Trust, Series 2019-RPL1, Class A1A, 3.65% 20581,2,3 | 3,788 | 4,096 |
| Finance of America HECM Buyout, Series 2020-HB2, Class A, 1.71% 20301,2,3 | 14,610 | 14,637 |
| Finance of America HECM Buyout, Series 2020-HB1, Class A, 2.012% 20301,2,3 | 14,437 | 14,547 |
| Finance of America HECM Buyout, Series 2019-AB1, Class A, 2.656% 20491,3 | 7,254 | 7,251 |
| Homeward Opportunities Fund Trust, Series 2018-1, Class A1, 3.766% 20481,2,3 | 4,278 | 4,290 |
| JPMorgan Mortgage Trust, Series 2019-INV3, Class A13, 3.50% 20501,2,3 | 10,649 | 11,014 |
| JPMorgan Mortgage Trust, Series 2019-INV3, Class A3, 3.50% 20501,2,3 | 9,525 | 9,851 |
Mello Warehouse Securitization Trust, Series 2019-2, Class A,
(1-month USD-LIBOR + 0.75%) 0.922% 20521,2,3 | 22,507 | 22,481 |
| Mello Warehouse Securitization Trust, Series 2019-1, Class A, 0.975% 20521,2,3 | 6,710 | 6,731 |
| Mill City Mortgage Trust, Series 2018-1, Class A1, 3.25% 20621,2,3 | 827 | 864 |
Mortgage Repurchase Agreement Financing Trust, Series 2020-2, Class A1,
(1-month USD-LIBOR + 1.75%) 1.905% 20221,2,3 | 30,304 | 30,381 |
Mortgage Repurchase Agreement Financing Trust, Series 2020-1, Class A1,
(1-month USD-LIBOR + 2.00%) 2.155% 20221,2,3 | 14,696 | 14,753 |
| Nationstar HECM Loan Trust, Series 2018-2, Class A, 3.188% 20281,2,3 | 1,146 | 1,149 |
| Nationstar HECM Loan Trust, Series 2018-3A, Class A, 3.555% 20281,2,3 | 1,901 | 1,905 |
| Nationstar HECM Loan Trust, Series 2019-2A, Class A, 2.272% 20291,2,3 | 8,406 | 8,437 |
| Nationstar HECM Loan Trust, Series 2019-1A, Class A, 2.651% 20291,2,3 | 6,885 | 6,915 |
| Onslow Bay Financial LLC, Series 2020-INV1, Class A5, 3.50% 20491,2,3 | 8,053 | 8,347 |
| Progress Residential Trust, Series 2020-SFR2, Class A, 2.078% 20371,3 | 3,605 | 3,693 |
| Reverse Mortgage Investment Trust, Series 2020-1, Class A, 2.158% 20301,2,3 | 1,396 | 1,402 |
| RMF Proprietary Issuance Trust, Series 2019-1, Class A, 2.75% 20631,2,3 | 23,651 | 23,584 |
| Starwood Mortgage Residential Trust, Series 2020-2, Class A1, 2.718% 20601,2,3 | 12,299 | 12,337 |
American Funds Mortgage Fund — Page 9 of 13
Bonds, notes & other debt instruments (continued)
Mortgage-backed obligations (continued)
Collateralized mortgage-backed obligations (privately originated) (continued) | Principal amount
(000) | Value
(000) |
Station Place Securitization Trust, Series 2020-WL1, Class A,
(1-month USD-LIBOR + 1.15%) 1.325% 20511,2,3 | $21,375 | $21,427 |
| Towd Point Mortgage Trust, Series 2016-2, Class A1A, 2.75% 20551,2,3 | 1,569 | 1,613 |
| Towd Point Mortgage Trust, Series 2016-5, Class A1, 2.50% 20561,2,3 | 2,071 | 2,116 |
| Towd Point Mortgage Trust, Series 2017-5, Class A1, 0.775% 20571,2,3 | 1,269 | 1,266 |
| Towd Point Mortgage Trust, Series 2017-6, Class A1, 2.75% 20571,2,3 | 4,380 | 4,553 |
| Towd Point Mortgage Trust, Series 2017-3, Class A1, 2.75% 20571,2,3 | 4,260 | 4,392 |
| Towd Point Mortgage Trust, Series 2017-4, Class A1, 2.75% 20571,2,3 | 2,809 | 2,933 |
| Towd Point Mortgage Trust, Series 2015-2, Class 2A11, 3.00% 20571,2,3 | 2,627 | 2,642 |
| Towd Point Mortgage Trust, Series 2018-2, Class A1, 3.25% 20581,2,3 | 5,136 | 5,468 |
| Towd Point Mortgage Trust, Series 2018-5, Class A1A, 3.25% 20581,2,3 | 1,702 | 1,793 |
| | | 310,768 |
| Commercial mortgage-backed securities 0.25% | | |
| Bank of America Merrill Lynch Large Loan Inc., Series 2012-PARK, Class A, 2.959% 20301,3 | 10,663 | 11,166 |
| DBUBS Mortgage Trust, Series 2011-LC2A, Class A1, 4.537% 20441,3 | 3,633 | 3,681 |
| Ellington Financial Mortgage Trust, Series 2020-1, Class A1, 2.006% 20651,2,3 | 3,178 | 3,229 |
| | | 18,076 |
| Total mortgage-backed obligations | | 6,425,464 |
U.S. Treasury bonds & notes 3.68%
U.S. Treasury 2.44% | | |
| U.S. Treasury 3.125% 2048 | 7,000 | 9,692 |
| U.S. Treasury 3.375% 2048 | 406 | 589 |
| U.S. Treasury 1.25% 20505 | 133,292 | 125,886 |
| U.S. Treasury 1.375% 2050 | 40,000 | 39,022 |
| | | 175,189 |
| U.S. Treasury inflation-protected securities 1.24% | | |
| U.S. Treasury Inflation-Protected Security 2.125% 20416 | 562 | 885 |
| U.S. Treasury Inflation-Protected Security 0.75% 20425,6 | 34,398 | 43,801 |
| U.S. Treasury Inflation-Protected Security 1.00% 20495,6 | 30,975 | 43,866 |
| | | 88,552 |
| Total U.S. Treasury bonds & notes | | 263,741 |
| Asset-backed obligations 1.27% | | |
| American Express Credit Account Master Trust, Series 2018-3, Class A, 0.482% 20251,2 | 4,130 | 4,136 |
| American Express Credit Account Master Trust, Series 2017-7, Class A, 2.35% 20251 | 420 | 438 |
| CF Hippolyta LLC, Series 2020-1, Class A1, 1.69% 20601,3 | 19,100 | 19,431 |
| CF Hippolyta LLC, Series 2020-1, Class A2, 1.99% 20601,3 | 2,658 | 2,715 |
| Cloud Pass-Through Trust, Series 2019-1A, Class CLOU, 3.554% 20221,2,3 | 333 | 338 |
| CPS Auto Receivables Trust, Series 2020-B, Class A, 1.15% 20231,3 | 1,469 | 1,474 |
| Credit Acceptance Auto Loan Trust, Series 2020-1A, Class A, 2.01% 20291,3 | 2,557 | 2,621 |
| Drive Auto Receivables Trust, Series 2020-2, Class A3, 0.83% 20241 | 1,562 | 1,569 |
| Drivetime Auto Owner Trust, Series 2019-3, Class A, 2.55% 20221,3 | 2,515 | 2,525 |
| Drivetime Auto Owner Trust, Series 2020-2A, Class A, 1.14% 20241,3 | 3,460 | 3,472 |
| Exeter Automobile Receivables Trust, Series 2020-2A, Class A, 1.13% 20231,3 | 6,341 | 6,361 |
| Ford Credit Auto Owner Trust, Series 2020-A, Class A3, 1.04% 20241 | 1,844 | 1,868 |
| Ford Credit Floorplan Master Owner Trust, Series 2019-3, Class A1, 2.23% 20241 | 14,000 | 14,493 |
| GM Financial Automobile Leasing Trust, Series 2020-2, Class A4, 1.01% 20241 | 343 | 348 |
| GM Financial Consumer Automobile Receivables Trust, Series 2020-2, Class A2B, 1.212% 20231,2 | 3,569 | 3,590 |
| GM Financial Consumer Automobile Receivables Trust, Series 2020-2, Class A3, 1.49% 20241 | 1,587 | 1,624 |
| Honda Auto Receivables Owner Trust, Series 2018-4, Class A4, 3.30% 20251 | 1,500 | 1,571 |
American Funds Mortgage Fund — Page 10 of 13
Bonds, notes & other debt instruments (continued)
Asset-backed obligations (continued) | Principal amount
(000) | Value
(000) |
| Mercedes-Benz Auto Lease Trust, Series 2020-A, Class A2, 1.82% 20221 | $135 | $136 |
| Nissan Auto Receivables Owner Trust, Series 2020-A, Class A2, 1.45% 20221 | 2,812 | 2,832 |
| OSW Structured Asset Trust, Series 2020-RPL1, Class A1, 3.072% 20601,2,3 | 3,521 | 3,601 |
Palmer Square Loan Funding, CLO, Series 2019-2, Class A1,
(3-month USD-LIBOR + 0.97%) 1.242% 20271,2,3 | 3,886 | 3,871 |
| Santander Consumer Auto Receivables Trust, Series 2020-A, Class A, 1.37% 20241,3 | 1,979 | 2,000 |
| Santander Drive Auto Receivables Trust, Series 2020-1, Class A2A, 2.07% 20231 | 1,954 | 1,969 |
| Symphony Ltd., CLO, Series 2013-12A, Class AR, (3-month USD-LIBOR + 1.03%) 1.305% 20251,2,3 | 1,209 | 1,207 |
| Toyota Auto Loan Extended Note Trust, Series 2020-1, Class A, 1.35% 20331,3 | 544 | 562 |
| Toyota Auto Receivables Owner Trust, Series 2019-B, Class A3, 1.36% 20241 | 1,500 | 1,530 |
| Toyota Auto Receivables Owner Trust, Series 2019-A, Class A4, 3.00% 20241 | 1,645 | 1,739 |
| Volkswagen Auto Lease Trust, Series 2019-A, Class A2A, 2.00% 20221 | 710 | 717 |
World Financial Network Credit Card Master Note Trust, Series 2019-A, Class A,
3.14% 20251 | 750 | 776 |
| World Financial Network Credit Card Master Note Trust, Series 2019-C, Class A, 2.21% 20261 | 1,500 | 1,537 |
| | | 91,051 |
| Federal agency bonds & notes 0.26% | | |
| Fannie Mae 0.625% 2025 | 3,850 | 3,891 |
| Fannie Mae 0.875% 2030 | 7,500 | 7,370 |
| Freddie Mac 0.375% 2025 | 7,059 | 7,046 |
| | | 18,307 |
| Bonds & notes of governments & government agencies outside the U.S. 0.03% | | |
| KfW 0.375% 2025 | 2,301 | 2,302 |
| Total bonds, notes & other debt instruments (cost: $6,664,807,000) | | 6,800,865 |
| Short-term securities 52.07% | | |
| Apple Inc. 0.11%-0.15% due 9/8/2020-10/13/20203 | 91,700 | 91,694 |
| Chariot Funding LLC 0.15%-0.25% due 9/1/2020-10/19/20203 | 110,000 | 109,993 |
| Charta LLC 0.22% due 9/11/20203 | 50,000 | 49,998 |
| Chevron Corp. 0.09% due 10/14/20203 | 70,000 | 69,993 |
| CRC Funding, LLC 0.22%-0.23% due 9/21/2020-10/15/20203 | 35,000 | 34,994 |
| Eli Lilly and Co. 0.11% due 11/16/20203 | 4,200 | 4,196 |
| Exxon Mobil Corp. 0.11%-0.12% due 10/21/2020-11/17/2020 | 125,000 | 124,980 |
| Federal Home Loan Bank 0.07%-0.17% due 9/2/2020-11/25/2020 | 1,122,000 | 1,121,881 |
| Freddie Mac 0.14% due 9/18/2020 | 50,000 | 49,998 |
| Intel Corp. 0.09% due 9/8/2020-9/25/20203 | 75,000 | 74,997 |
| Johnson & Johnson 0.10%-0.15% due 9/8/2020-9/21/20203 | 50,000 | 49,999 |
| Paccar Financial Corp. 0.10% due 9/25/2020-9/29/2020 | 47,400 | 47,396 |
| Pfizer Inc. 0.13%-0.16% due 9/15/2020-10/14/20203 | 125,000 | 124,991 |
| Procter & Gamble Co. 0.11%-0.17% due 9/22/2020-11/17/20203 | 113,000 | 112,991 |
| U.S. Treasury 0.07%-0.17% due 9/1/2020-12/24/2020 | 1,663,000 | 1,662,722 |
| Total short-term securities (cost: $3,730,763,000) | | 3,730,823 |
| Total investment securities 146.98% (cost: $10,395,570,000) | | 10,531,688 |
| Other assets less liabilities (46.98)% | | (3,366,220) |
| Net assets 100.00% | | $7,165,468 |
American Funds Mortgage Fund — Page 11 of 13
Futures contracts
| Contracts | Type | Number of
contracts | Expiration | Notional
amount7
(000) | Value at
8/31/20208
(000) | Unrealized
(depreciation)
appreciation
at 8/31/2020
(000) |
| 90 Day Euro Dollar Futures | Short | 5,141 | September 2020 | $(1,285,250) | $(1,282,262) | $(876) |
| 90 Day Euro Dollar Futures | Short | 3,199 | March 2021 | (799,750) | (798,151) | (146) |
| 2 Year U.S. Treasury Note Futures | Long | 110 | January 2021 | 22,000 | 24,304 | 10 |
| 5 Year U.S. Treasury Note Futures | Long | 1,921 | January 2021 | 192,100 | 242,106 | 313 |
| 10 Year U.S. Treasury Note Futures | Short | 108 | December 2020 | (10,800) | (15,039) | (16) |
| 10 Year Ultra U.S. Treasury Note Futures | Short | 1,550 | December 2020 | (155,000) | (247,128) | 109 |
| 20 Year U.S. Treasury Bond Futures | Long | 399 | December 2020 | 39,900 | 70,112 | (219) |
| 30 Year Ultra U.S. Treasury Bond Futures | Long | 481 | December 2020 | 48,100 | 106,256 | (454) |
| | | | | | | $(1,279) |
Swap contracts
Interest rate swaps
| Receive | Pay | Expiration
date | Notional
(000) | Value at
8/31/2020
(000) | Upfront
premium
paid (received)
(000) | Unrealized
(depreciation)
appreciation
at 8/31/2020
(000) |
| 3-month USD-LIBOR | 2.322% | 5/2/2024 | $181,900 | $(13,787) | $— | $(13,787) |
| 3-month USD-LIBOR | 2.325% | 5/2/2024 | 418,100 | (31,736) | — | (31,736) |
| U.S. EFFR | 0.11% | 5/18/2024 | 251,500 | 10 | — | 10 |
| 3-month USD-LIBOR | 1.547% | 10/25/2024 | 252,000 | (13,240) | — | (13,240) |
| 3-month USD-LIBOR | 1.548% | 10/28/2024 | 42,000 | (2,212) | — | (2,212) |
| U.S. EFFR | 0.1275% | 6/25/2025 | 107,200 | (97) | — | (97) |
| U.S. EFFR | 0.0975% | 6/30/2025 | 58,252 | 35 | — | 35 |
| U.S. EFFR | 0.105% | 6/30/2025 | 107,200 | 25 | — | 25 |
| U.S. EFFR | 0.106% | 6/30/2025 | 47,348 | 9 | — | 9 |
| 3-month USD-LIBOR | 0.81% | 7/28/2045 | 161,600 | 9,368 | (96) | 9,464 |
| 3-month USD-LIBOR | 0.811% | 7/27/2050 | 65,300 | 4,679 | — | 4,679 |
| | | | | | $(96) | $(46,850) |
The following footnotes apply to either the individual securities noted or one or more of the securities aggregated and listed as a single line item.
| 1 | Principal payments may be made periodically. Therefore, the effective maturity date may be earlier than the stated maturity date. |
| 2 | Coupon rate may change periodically. Reference rate and spread are as of the most recent information available. Some coupon rates are determined by the issuer or agent based on current market conditions; therefore, the reference rate and spread are not available. |
| 3 | Acquired in a transaction exempt from registration under Rule 144A or Section 4(2) of the Securities Act of 1933. May be resold in the U.S. in transactions exempt from registration, normally to qualified institutional buyers. The total value of all such securities was $1,103,366,000, which represented 15.40% of the net assets of the fund. |
| 4 | Purchased on a TBA basis. |
| 5 | All or a portion of this security was pledged as collateral. The total value of pledged collateral was $56,796,000, which represented .79% of the net assets of the fund. |
| 6 | Index-linked bond whose principal amount moves with a government price index. |
| 7 | Notional amount is calculated based on the number of contracts and notional contract size. |
| 8 | Value is calculated based on the notional amount and current market price. |
American Funds Mortgage Fund — Page 12 of 13
| Key to abbreviations and symbol | |
| CLO = Collateralized Loan Obligations | |
| EFFR = Effective Federal Funds Rate | |
| LIBOR = London Interbank Offered Rate | |
| TBA = To-be-announced | |
| USD/$ = U.S. dollars | |
Additional financial disclosures are included in the fund’s current shareholder report and should be read in conjunction with this report.
Investments are not FDIC-insured, nor are they deposits of or guaranteed by a bank or any other entity, so they may lose value.
Investors should carefully consider investment objectives, risks, charges and expenses. This and other important information is contained in the fund prospectus and summary prospectus, which can be obtained from your financial professional and should be read carefully before investing. You may also call American Funds Service Company (AFS) at (800) 421-4225 or visit the Capital Group website at capitalgroup.com.
All Capital Group trademarks mentioned are owned by The Capital Group Companies, Inc., an affiliated company or fund. All other company and product names mentioned are the property of their respective companies.
American Funds Distributors, Inc., member FINRA.
© 2020 Capital Group. All rights reserved.
| MFGEFP4-042-1020O-S78150 | American Funds Mortgage Fund — Page 13 of 13 |
Report of Independent Registered Public Accounting Firm
To the Board of Trustees and Shareholders of American Funds Mortgage Fund
Opinion on the Financial Statements
We have audited the accompanying statement of assets and liabilities, including the summary investment portfolio, of American Funds Mortgage Fund (the “Fund”) as of August 31, 2020, the related statement of operations for the year ended August 31, 2020, the statement of changes in net assets for each of the two years in the period ended August 31, 2020, including the related notes, and the financial highlights for each of the periods indicated therein (included in Item 1 of this Form N-CSR) and the investment portfolio (included in Item 6 of this Form N-CSR) as of August 31, 2020 (collectively referred to as the “financial statements”). In our opinion, the financial statements present fairly, in all material respects, the financial position of the Fund as of August 31, 2020, the results of its operations for the year then ended, the changes in its net assets for each of the two years in the period ended August 31, 2020 and the financial highlights for each of the periods indicated therein in conformity with accounting principles generally accepted in the United States of America.
Basis for Opinion
These financial statements are the responsibility of the Fund’s management. Our responsibility is to express an opinion on the Fund’s financial statements based on our audits. We are a public accounting firm registered with the Public Company Accounting Oversight Board (United States) (PCAOB) and are required to be independent with respect to the Fund in accordance with the U.S. federal securities laws and the applicable rules and regulations of the Securities and Exchange Commission and the PCAOB.
We conducted our audits of these financial statements in accordance with the standards of the PCAOB. Those standards require that we plan and perform the audit to obtain reasonable assurance about whether the financial statements are free of material misstatement, whether due to error or fraud.
Our audits included performing procedures to assess the risks of material misstatement of the financial statements, whether due to error or fraud, and performing procedures that respond to those risks. Such procedures included examining, on a test basis, evidence regarding the amounts and disclosures in the financial statements. Our audits also included evaluating the accounting principles used and significant estimates made by management, as well as evaluating the overall presentation of the financial statements. Our procedures included confirmation of securities owned as of August 31, 2020 by correspondence with the custodian and brokers; when replies were not received from brokers, we performed other auditing procedures. We believe that our audits provide a reasonable basis for our opinion.
/s/ PricewaterhouseCoopers LLP
Los Angeles, California
October 14, 2020
We have served as the auditor of one or more investment companies in The Capital Group Companies Investment Company Complex since 1934.
ITEM 7 – Disclosure of Proxy Voting Policies and Procedures for Closed-End Management Investment Companies
Not applicable to this Registrant, insofar as the Registrant is not a closed-end management investment company.
ITEM 8 – Portfolio Managers of Closed-End Management Investment Companies
Not applicable to this Registrant, insofar as the Registrant is not a closed-end management investment company.
ITEM 9 – Purchases of Equity Securities by Closed-End Management Investment Company and Affiliated Purchasers
Not applicable to this Registrant, insofar as the Registrant is not a closed-end management investment company.
ITEM 10 – Submission of Matters to a Vote of Security Holders
There have been no material changes to the procedures by which shareholders may recommend nominees to the Registrant’s board of trustees since the Registrant last submitted a proxy statement to its shareholders. The procedures are as follows. The Registrant has a nominating and governance committee comprised solely of persons who are not considered ‘‘interested persons’’ of the Registrant within the meaning of the Investment Company Act of 1940, as amended. The committee periodically reviews such issues as the board’s composition, responsibilities, committees, compensation and other relevant issues, and recommends any appropriate changes to the full board of trustees. While the committee normally is able to identify from its own resources an ample number of qualified candidates, it will consider shareholder suggestions of persons to be considered as nominees to fill future vacancies on the board. Such suggestions must be sent in writing to the nominating and governance committee of the Registrant, c/o the Registrant’s Secretary, and must be accompanied by complete biographical and occupational data on the prospective nominee, along with a written consent of the prospective nominee for consideration of his or her name by the nominating and governance committee.
ITEM 11 – Controls and Procedures
| (a) | The Registrant’s Principal Executive Officer and Principal Financial Officer have concluded, based on their evaluation of the Registrant’s disclosure controls and procedures (as such term is defined in Rule 30a-3 under the Investment Company Act of 1940), that such controls and procedures are adequate and reasonably designed to achieve the purposes described in paragraph (c) of such rule. |
| | |
| (b) | There were no changes in the Registrant’s internal controls over financial reporting (as defined in Rule 30a-3(d) under the Investment Company Act of 1940) that occurred during the Registrant’s semi-annual period covered by this report that has materially affected, or is reasonably likely to materially affect, the Registrant’s internal control over financial reporting. |
ITEM 12 – Exhibits
| (a)(1) | The Code of Ethics that is the subject of the disclosure required by Item 2 is attached as an exhibit hereto. |
| | |
| (a)(2) | The certifications required by Rule 30a-2 of the Investment Company Act of 1940 and Sections 302 and 906 of the Sarbanes-Oxley Act of 2002 are attached as exhibits hereto. |
SIGNATURES
Pursuant to the requirements of the Securities Exchange Act of 1934 and the Investment Company Act of 1940, the Registrant has duly caused this report to be signed on its behalf by the undersigned, thereunto duly authorized.
| | AMERICAN FUNDS MORTGAGE FUND |
| | |
| | By __/s/ Kristine M. Nishiyama________________ |
| | Kristine M. Nishiyama, Executive Vice President and Principal Executive Officer |
| | |
| | Date: October 30, 2020 |
Pursuant to the requirements of the Securities Exchange Act of 1934 and the Investment Company Act of 1940, this report has been signed below by the following persons on behalf of the Registrant and in the capacities and on the dates indicated.
| By _ /s/ Kristine M. Nishiyama_____________ |
Kristine M. Nishiyama, Executive Vice President and Principal Executive Officer |
| |
| Date: October 30, 2020 |
| By ___/s/ Brian C. Janssen__________________ |
Brian C. Janssen, Treasurer and Principal Financial Officer |
| |
| Date: October 30, 2020 |