Exhibit 10.2

Enterprise Valuation for:
SMC Entertainment Fyniti Global EBT
| PREPARED FOR: SMC Entertainment Fyniti Global EBT |
Date of Report: November 15, 2023
Effective Date: September 30, 2023
Stonebridge Advisory Inc.
1055 East Colorado Blvd, 5th Floor
Pasadena, CA 91106
(626) 866-3317
| Last modified at 11/15/2023 10:08AM | |
| Prepared by Stonebridge Advisors, Inc. | © 2023 Stonebridge Advisory Inc. - All Rights Reserved |
| OPINION LETTER | 1 |
OPINION LETTER
2023-11-15
Erik Blum
SMC Entertainment Fyniti Global EBT
8170 Glades Road, Suite 150, Boca Raton, FL
Dear Erik Blum,
At your request, we have been engaged to appraise SMC Entertainment Fyniti Global EBT as of 2023-09-30. The client is SMC Entertainment Fyniti Global EBT, the intended user of this report which is to be used for business planning purposes. The business was appraised using the fair market value as the standard of value for the company assuming no discount for a lack of control (DLOC) and no adjustment for lack of marketability (DLOM). SMC Entertainment Fyniti Global EBT is headquartered in the State of Florida. The Company is organized as a C Corporation.
The Fair Market Value (FMV) is defined as the value an asset or liability would exchange hands given a willing buyer and seller negotiate an “arms-length” transaction with neither party under duress and with the parties having access to all pertinent information.
There are no restrictive agreements that might impact value. We have reviewed information on SMC Entertainment Fyniti Global EBT as well as the assumptions based on client discussions that allowed us to forecast the future cash flow of the business, review the assets and liabilities to the extent possible and build out the Discount and Capitalization Rate, which is essentially an indicator of risk in the business investment.
All traditional approaches to value were considered in this valuation and the appropriate allocation of methods and calculations were weighted that best represent the Company’s value. The effective date of this appraisal is 2023-09-30. The appraisal’s estimated value for 1,121,275,825 of the company’s shares without any discounts and premiums,is $20,298,635 of enterprise value. The 1,121,275,825 shares being valued are $0.018 per share.
This conclusion is subject to the Report’s Limiting Conditions.

Daniel P. O’Connell, AM, BV, American Society of Appraisers

Ryan P. O’Connell, IRS Qualified Valuations
| Prepared by Stonebridge Advisors, Inc. | © 2023 Stonebridge Advisory Inc. - All Rights Reserved |
| TABLE OF CONTENTS | 2 |
Table of Contents
| 1. | Opinion Letter | 26. | Qualifications | |
| 2. | Table of Contents | 27. | Terminology and Concepts In Report | |
| 3. | Compliance and Practices | 28. | Terminology (continued) | |
| 4. | Valuation Assignment | 29. | Report’s Limiting Conditions | |
| 5. | Valuation Assignment (Cont.) | |||
| 6. | Economic Outlook | |||
| 7. | Company Brief | |||
| 8. | Company Shares Defined | |||
| 9. | Industry Outlook | |||
| 10. | Industry Trends 1 | |||
| 11. | Industry Trends 2 | |||
| 12. | Industry Trends 3 | |||
| 13. | The Valuation Approaches | |||
| 14. | Interim Income Statement | |||
| 15. | Interim Balance Sheet | |||
| 16. | Financial Statement (Forecast) | |||
| 17. | Cost of Capital | |||
| 18. | Discount Rate Detail | |||
| 19. | Net Cash Flow | |||
| 20. | Net Cash Flow - Five Year Detail | |||
| 21. | Discount Factor Calculations | |||
| 22. | Value Methods & Calculations | |||
| 23. | Asset Approach To Value | |||
| 24. | Value Allocations | |||
| 25. | Value Conclusions | |||
| Prepared by Stonebridge Advisors, Inc. | © 2023 Stonebridge Advisory Inc. - All Rights Reserved |
| COMPLIANCE AND PRACTICES | 3 |
COMPLIANCE AND PROCESSES
IRS REVENUE RULING 59-60 COMPLIANCE
When valuing closely held stock or ownership interest of companies, often market quotes are not available for privately-owned companies. IRS Revenue Ruling 59-60 outlines the proper procedures, approaches and qualifications for valuing these closely-held companies and in considering all relevant factors that impact the fair market value. IRS Revenue Ruling 59-60 states that certain factors need to be considered in arriving at the Fair Market Value of an asset or liability. This valuation report addresses these requirements, specifically:
| 1. | Define the nature of the business and the economic environment. |
| 2. | Research the book value and the company’s financial condition. |
| 3. | Review the earnings capability and the dividend paying capacity if relevant. |
| 4. | Review whether the company has goodwill or intangible value. |
| 5. | Research pricing of similar companies and utilize the proper capitalization rates. |
| 6. | Discover if restrictive agreements impact value and weight the valuation conclusions logically. |
UNIFORM STANDARDS OF PROFESSIONAL APPRAISAL PRACTICE
The Uniform Standards of Professional Appraisal Practice (USPAP) addresses ethical and performance obligations of appraisers. Ethics rules deal with integrity, impartiality, objectivity, independent judgement and ethical conduct. Other requirements consider the appraiser’s knowledge, experience, competency and scope of work rules in identifying key issues, research and analysis. This appraisal adheres to the USPAP guidelines.
THE VALUATION PROCESS
Business value is derived from an economic benefit stream and it’s risk factor. A valuation “normalizes” the income statement and balance sheet to represent the current status of a company. This report will review the company’s risk associated with a “proposed” investment and the historical and forecasted financial statements, key ratio reviews, the cost of capital and the future net cash flows, if available. Then we apply the cost of capital to the benefit stream (the Income Approach) and review the appropriate risk adjusted multiples to similar companies (the Market Approach) and an analysis of the assets (the Asset Approach). The appropriate weighing to specific calculations will be made that best represent the company’s enterprise value.
| Prepared by Stonebridge Advisors, Inc. | © 2023 Stonebridge Advisory Inc. - All Rights Reserved |
| VALUATION ASSIGNMENT | 4 |
THE VALUATION ASSIGNMENT
DEFINING THE VALUATION ASSIGNMENT
When defining the appraisal assignment, it is important to understand the concepts or directives that form the basis of this opinion of value and that these concepts meet your understanding of this assignment. If the appraisal assignment changes, some of the following valuation criteria might need to reflect the new intent and the appraisal assignment might need to be updated. “Company” used in this report covers any asset or liability being appraised.
DISCLAIMER
Stonebridge relies on the client, the Company and the management team for its financial reporting and projections of the company’s financials. While this information is deemed reasonable for the purposes of this report, Stonebridge makes no representations or warranties to the accuracy or thoroughness of this valuation report (see scope of appraisal and the engagement’s limiting conditions).
VALUATION CONCEPT OF BENEFIT STREAM AND RISK
Business value is derived from an economic benefit and is weighted by a risk factor that relates to the risk in the company’s business model. The economic benefit usually refers to a monetary flow such as earnings before interest, taxes, depreciation and amortization (EBITDA), Net Operating Profit After Tax (NOPAT), Gross Profit, or Net Cash Flow (NCF), etc. The risk factor is the rate of return a potential investor requires given the risk of attaining the expected economic benefits stream. The greater this risk, the greater the investor’s needed rate of return and the lesser the value of the interest being appraised. In the case of less risk, the less the needed investor’s rate of return and the greater the value of the interest being appraised. The investor’s needed rate of return is the Cost of Equity and the debt and equity return needed is the Discount Rate.
In order to arrive at a valuation opinion, this report will review the company’s historical and forecasted financial statements and the associated business and industry risk. This report will develop the cost of capital and apply that to the economic benefit stream to arrive at the Discounted Cash Flow Method and the Capitalization of Earnings Method. In addition, this report will apply the Market Selling Multiples Method to specific company benefit streams. When the company is being valued as an on-going concern, the asset or cost approach to value might not be relevant in this report (see premise of value) and may not be used.
INTEREST BEING APPRAISED
SMC Entertainment Fyniti Global EBT (“the Company) is being appraised for 1,121,275,825 shares out of 1,121,275,825 shares outstanding. Shares are valued on an equity basis which is defined as the enterprise value less any term debt.
This appraisal assumes no Discount for Lack of Control (DLOC) which is referred to as a control interest. A control interest is defined as an equity interest greater than 50% or an equity position that is considered a swing vote, and therefore a controlling interest. A control interest means the shareholder has operating control to make decisions and can influence company performance.
This appraisal assumes no adjustment or Discount for a Lack of Marketability (DLOM) referred to as a marketable interest. An adjustment for lack of marketability is defined as the percentage value deducted from the value of an ownership interest to reflect the absence of marketability relating to the longer period (and risk) it takes to convert ownership to sale proceeds (liquidity).
| Prepared by Stonebridge Advisors, Inc. | © 2023 Stonebridge Advisory Inc. - All Rights Reserved |
| VALUATION ASSIGNMENT (CONT.) | 5 |
THE VALUATION ASSIGNMENT (cont.)
SCOPE OF APPRAISAL
This valuation is an Appraisal that addresses the Standard of Value, the Premise of Value, the Purpose of the Appraisal, the Effective Date of the Appraisal, and describes the business ownership interest and the process to be used in the valuation and the report deliverables. This appraisal will express the value in a single dollar amount, and will consider all relevant information available to the appraiser as of the appraisal date. The appraiser will review all relevant data material to the valuation and utilize all conceptual approaches deemed relevant by the appraiser.
STANDARD OF VALUE
The Fair Market Value standard is being used in this appraisal to render an opinion of value (or range of value). The Fair Market Value addresses the broadest spectrum of value that is reflected by the Company’s operations, markets and potential buyers. The common definition of Fair Market Value is the price at which a property would change hands between a willing buyer and seller, when the buyer is not under any compulsion to purchase and the seller is not under any compulsion to sell. Fair Market Value also assumes both buyer and seller have reasonable knowledge of the relevant facts.
PREMISE OF VALUE
This appraisal is based on the Company as an on-going concern. The going concern premise of value assumes the Company has the financial resources to continue operating into the foreseeable future whereas a non-going concern does not have the resources to continue operating and is a liquidity event.
EFFECTIVE DATE OF APPRAISAL
The report date of the appraisal is 2023-11-15 and the latest reported financials are as of 2023-09-30. The effective date of the valuation is 2023-09-30. If material time has elapsed from these dates or events occurred subsequently that may impact value, we suggest an update to the report, depending on the significance of how this opinion of value will be used by the intended user of this report.
CLIENT AND PURPOSE OF APPRAISAL
The client is SMC Entertainment Fyniti Global EBT, the only intended user for this report. The purpose of this appraisal is to estimate the selected Standard of Value of SMC Entertainment Fyniti Global EBT for business planning purposes.
DATA SOURCES, VALUATION PROCESS & CONDITIONS
Financial (income statements and balance sheets) and operational information was furnished by the Company. The Company provided expectations regarding the Company’s future performance. This report may utilize information from Duff & Phelps Cost of Capital, BVR Deal Stats, BV DataWorld, Pluris DLOM, Mergerstat Review Premiums & Discounts, IBISWorld, PropStream and other online sources. Stonebridge did not tour the company’s facility or office in its process but is reasonably familiar with the type of facilities involved. There have been no extraordinary or hypothetical assumptions made (unless noted) nor any limiting conditions placed on Stonebridge.
THE VALUATION PROCESS
Value is derived from a risk adjusted economic benefit stream. In order to arrive at a valuation opinion, this report will review the Company’s risk associated with a “proposed” investment, the historical and forecasted financial statements, key ratios, the cost of capital and the future net cash flows. The cost of capital will be applied to the Company’s economic benefit stream and review risk adjusted market selling multiples. The appropriate weighing of specific approaches will be made that best represent the Company’s value.
| Prepared by Stonebridge Advisors, Inc. | © 2023 Stonebridge Advisory Inc. - All Rights Reserved |
| ECONOMIC OUTLOOK | 6 |
ECONOMIC ENVIRONMENT AND IMPACT
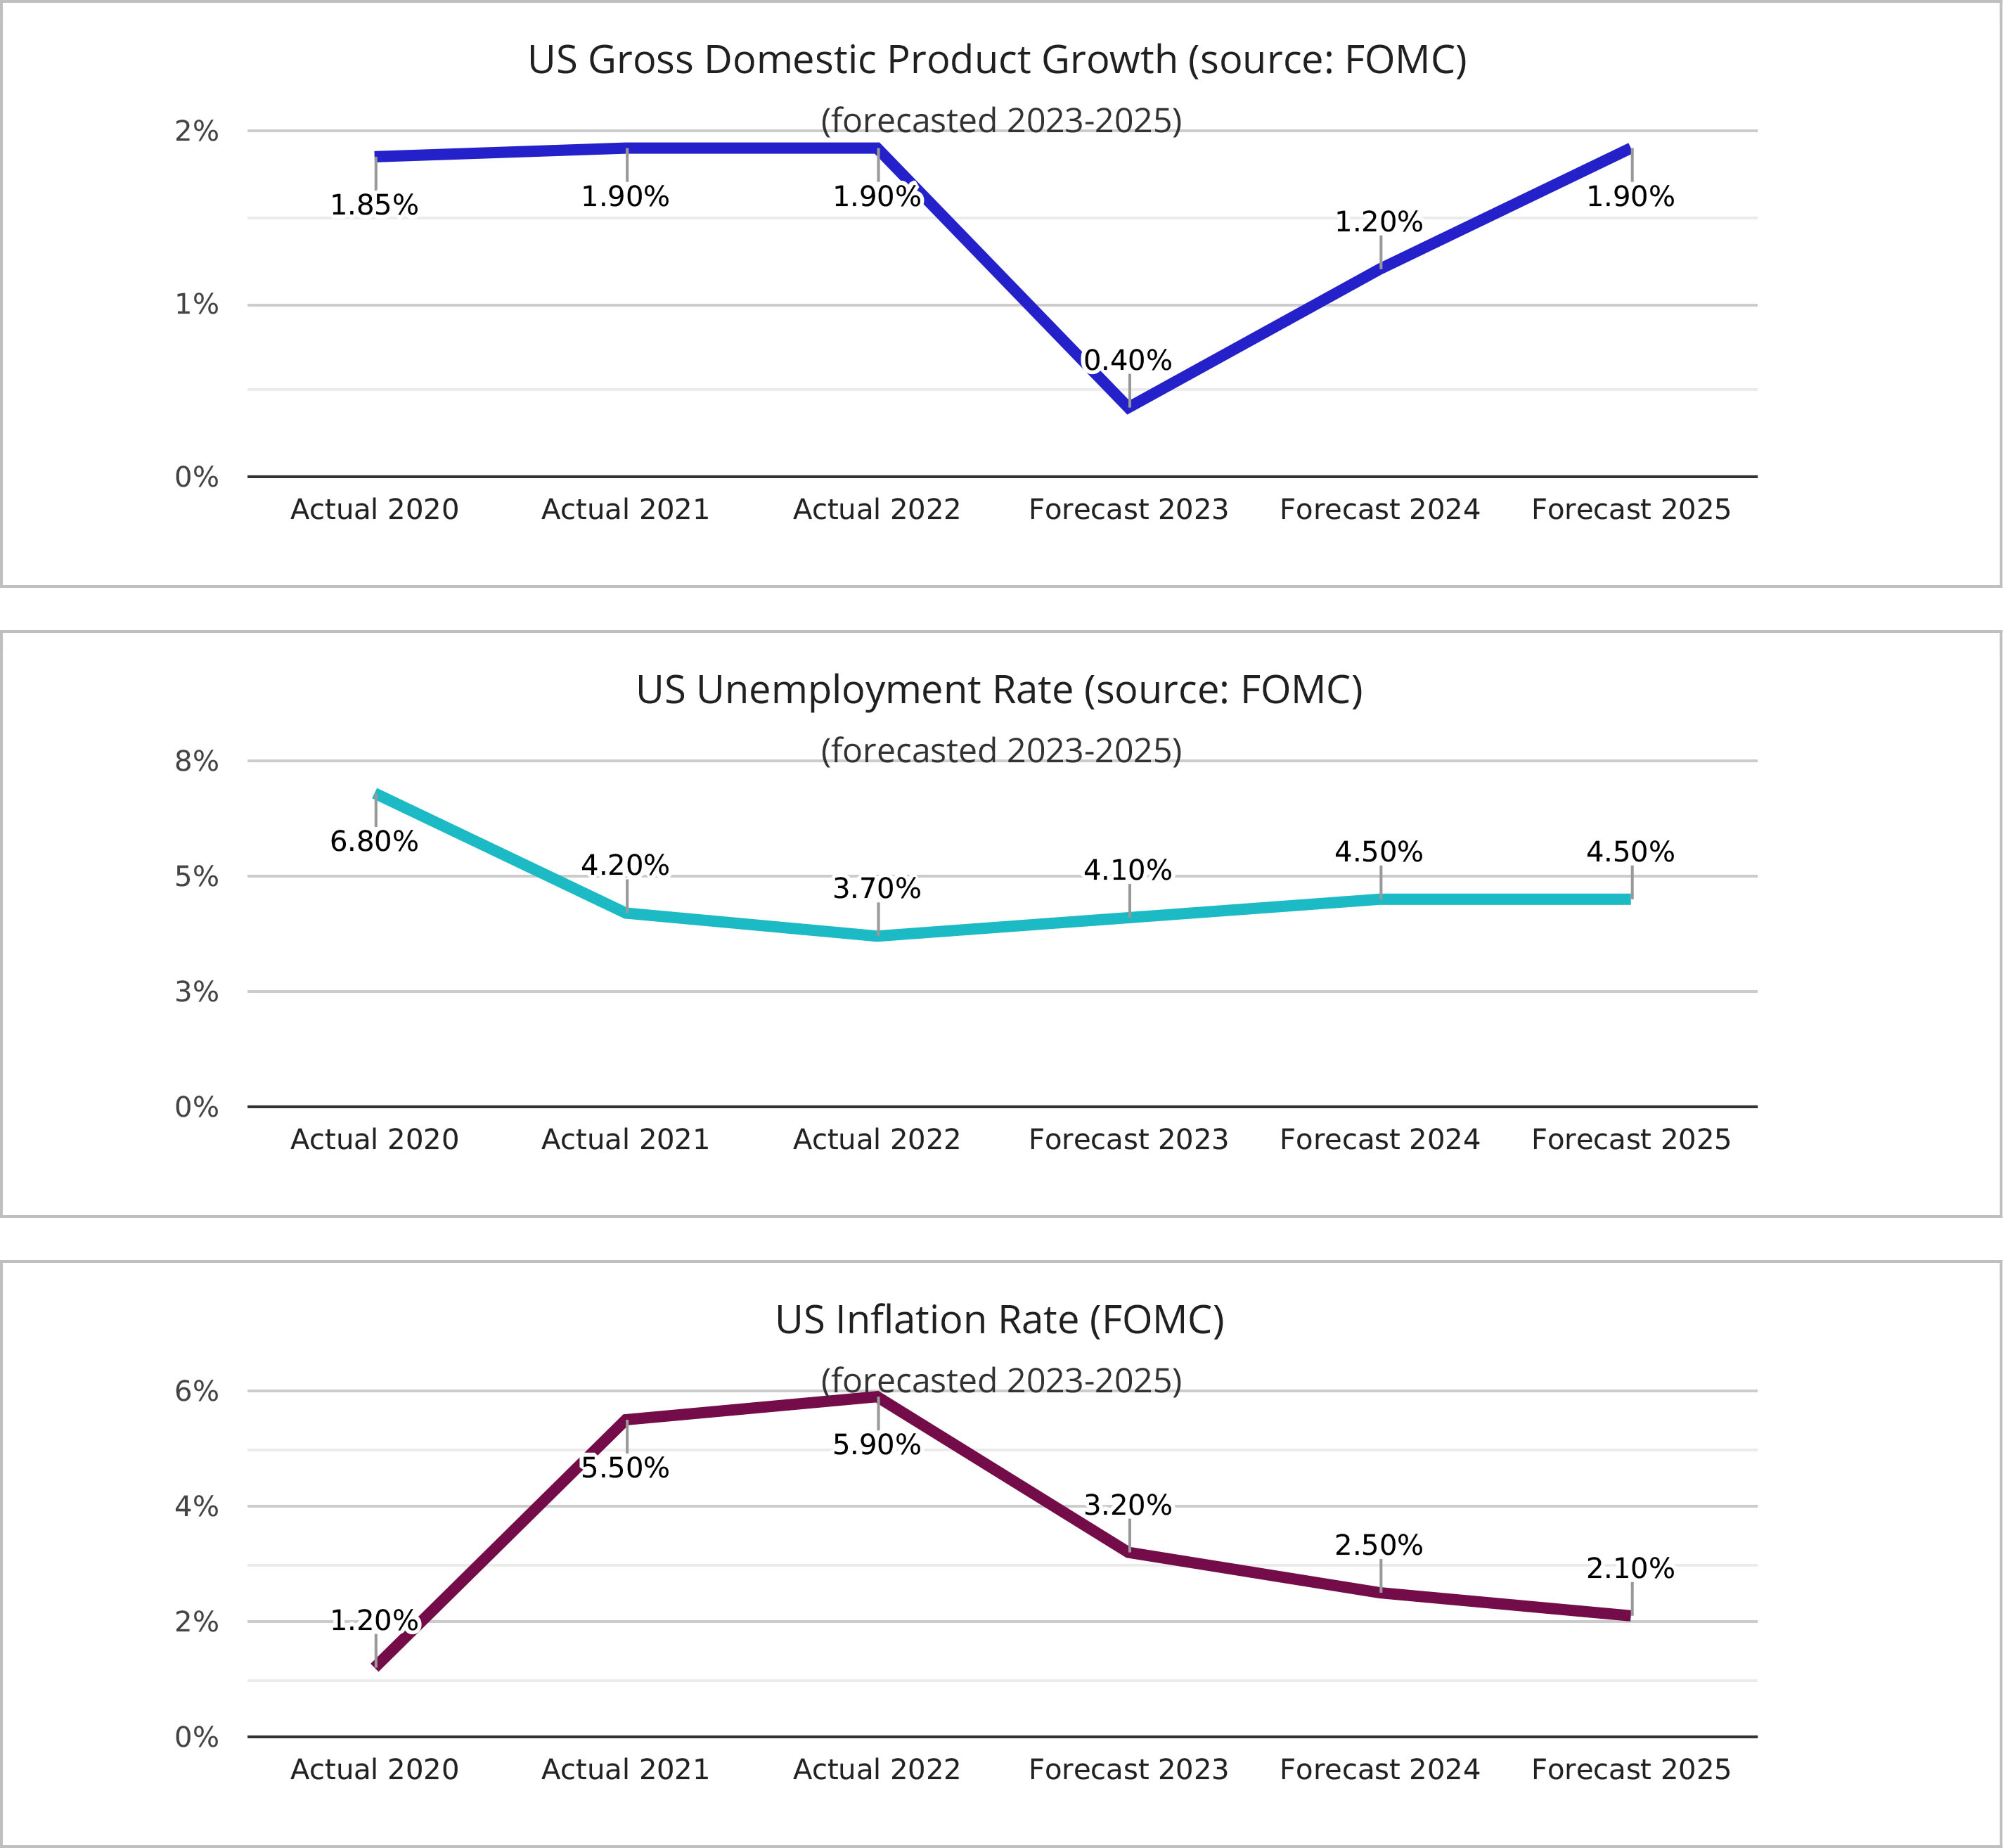
The economic outlook can be relevant and impact the Company and its industry. The economy continues to deal with global unrest, labor shortages, supply chain issues, inflation, federal reserve policies, trade issues, governmental policies and other economic considerations. A company’s impact can vary from industry to industry. Economic growth, lower inflation and moderate unemployment generally supports the private sector.
The Federal Reserve is the U.S. central bank that promotes maximum employment, moderate interest rates and stable prices. The Federal Open Market Committee (FOMC) meets four times per year to issue an economic forecast and a high-level analysis of the U.S. economy. Key economic factors are the Gross Domestic Product growth, the Unemployment Rate, and the Inflation Rate. The FOMC last met on June 14, 2023. GDP growth is expected to decrease to 0.4% this year, the unemployment rate to increase and the inflation rate to decrease which promotes greater stability and the private sectors ability to plan. Inflation has been stronger than expected and remains a challenge for the Federal Reserve. The Company might find the current economic environment challenging in some areas as labor and supply issues remain which can restrict sales growth and margins.
| Prepared by Stonebridge Advisors, Inc. | © 2023 Stonebridge Advisory Inc. - All Rights Reserved |
| COMPANY BRIEF | 7 |
COMPANY BRIEF

On April 21, 2023, the Company completed its acquisition of Al-enabled wealth management technology platform provider, Fyniti Global Equities EBT Inc. (“Fyniti”). Summary of acquisition agreement:
| ● | The aggregate purchase price to be paid by the Company to Fyniti will be Twenty-Five Million Dollars ($25,000,000.00) to be paid by delivery of Two Million Five Hundred Thousand (2,500,000) unregistered shares (the “Shares”) of the Company’s $10.00 Series B Preferred Stock. The Purchase Price was negotiated at arm’s length, and the parties agreed that the $10 par value of the Company’s Series B Preferred Stock would be used to represent the mutually agreed upon fair value of each Share, such that the Company and Fyniti acknowledged the Two Million Five Hundred Thousand (2,500,000) Shares as adequate consideration for the Acquisition Agreement |
| ● | The Preferred Stock is convertible into the Company’s common stock at a discount of ten percent (10%) to the preceding 10-day weighted average price prior to the conversion date; |
| ● | The Company agrees to raise up to $2,000,000 with $250,000 to be paid to Fyniti upon the Closing. The balance of the $2,000,000 raise will be paid to Fyniti in quarterly installments of $250,000 based on the milestone achievements. The Company has paid $50,000 of the $250,000 commitment. The Company is in discussions with a number of investors to raise the balance of the commitment. In addition, the Company is still waiting to be receive $300,000 from GFL for expenses incurred by the Company. |
The Company extends a consulting agreement to Mr. Jayakumar Gopalan; refer to Exhibit 10.9
The Company does not consider the transaction a related party transaction, as the terms were negotiated at arm’s length and did not result in change of control. Fyniti operates as a wholly owned subsidiary of the Company.
Our current business operation is conducted thru our wholly owned subsidiary, Fyniti Global Equities EBT Inc. (“Fyniti”) (www.fyniti.com, www.fynitiiq.com). Fyniti is a Fintech developer and provider of technology that combines Artificial Intelligence/Machine Learning (AI/ML) driven Quantitative investing (IQ Engine) with Al-enabled wealth management tools. Fyniti’s IQ Engine is an Al driven contextual analyzer that creates a repository of all equity research.
NOTE 9 — BUSINESS COMBINATIONS
On April 21, 2023, the Company completed its acquisition of AI-enabled wealth management technology platform provider, Fyniti Global Equities EBT Inc. (“Fyniti”) for 2,500,000 shares of Series B $10.00 Preferred Stock.
The Company accounted for the transaction as a business combination under ASC 805 and as a result, allocated the fair value of the book value of identifiable assets acquired and liabilities assumed as of the acquisition date as outlined in the table below. The consolidated income statement for the three and nine months ended September 30, 2023, includes $49,443 of expenses of Fyniti from the date of acquisition (April 21, 2023) through September 30, 2023.
The excess of the purchase price over the estimated fair values of the underlying identifiable assets acquired and liabilities assumed was allocated to goodwill.
| Consideration | ||||
| Consideration issued | $ | 25,000,000 | ||
| Identified assets, liabilities, and noncontrolling interest | ||||
| Cash overdraft | (425 | ) | ||
| Intangible assets, net | 14,155,000 | |||
| Accounts payable | (29,500 | ) | ||
| Accrued Expenses | (1,769 | ) | ||
| Total identified assets, liabilities, and noncontrolling interest | 14,123,306 | |||
| Excess purchase price allocated to goodwill | $ | 10,876,694 |
| Prepared by Stonebridge Advisors, Inc. | © 2023 Stonebridge Advisory Inc. - All Rights Reserved |
| COMPANY SHARES DEFINED | 8 |
FULLY DILUTED SHARES (OR UNITS)
“Price per Share” is interchangeable with “Price per Units in this report. This valuation applies a price per share using the Fully Diluted Shares (FDS). Fully diluted shares refer to the total number of outstanding shares of a company’s stock, including all potential additional shares that could be issued in the future due to various forms of conversion or exercise of securities that are not yet part of the current outstanding shares. The fully diluted shares calculation includes the following potential sources of additional shares:
Convertible Securities: This includes convertible bonds, convertible preferred stock, or any other financial instruments that can be converted into common shares at a predetermined price.
Stock Options: Employee stock options are a common form of equity compensation, allowing employees to purchase company stock at a specified price (the exercise price) in the future.
Warrants: Warrants are financial instruments that grant the holder the right to purchase a certain number of shares at a specific price within a defined period.
Restricted Stock Units (RSUs): RSUs are also a form of equity compensation issued to employees. RSUs represent a commitment to provide company stock at a future date upon vesting.
Convertible Notes: These are debt instruments that can be converted into equity shares under certain conditions.
Calculating fully diluted shares involves adding the total number of currently outstanding shares to the number of potential additional shares that could arise from the conversion or exercise of the above-mentioned securities. This calculation gives investors and stakeholders a more comprehensive view of a company’s capital structure and the potential dilution that could occur in the future. It’s important to understand the fully diluted share count when evaluating a company’s valuation and ownership percentages when contemplating equity-based compensation arrangements.
| Prepared by Stonebridge Advisors, Inc. | © 2023 Stonebridge Advisory Inc. - All Rights Reserved |
| INDUSTRY OUTLOOK | 9 |
About IBISWorld
IBISWorld specializes in industry research with coverage on thousands of global industries. They provide a comprehensive and in-depth analysis to help businesses of all types gain quick and actionable insights on industries around the world. Stonebridge has a license with IBISWorld whose data is reproduced in the following pages. The Company participates or has similarities with the following industry.
https://my.ibisworld.com//us/en/industry/51121/about
| NAICS 2017 - USA | 51121 |
| NAICS 2017 - USA | 511210 |
| NAICS 2022 - USA | 5132 |
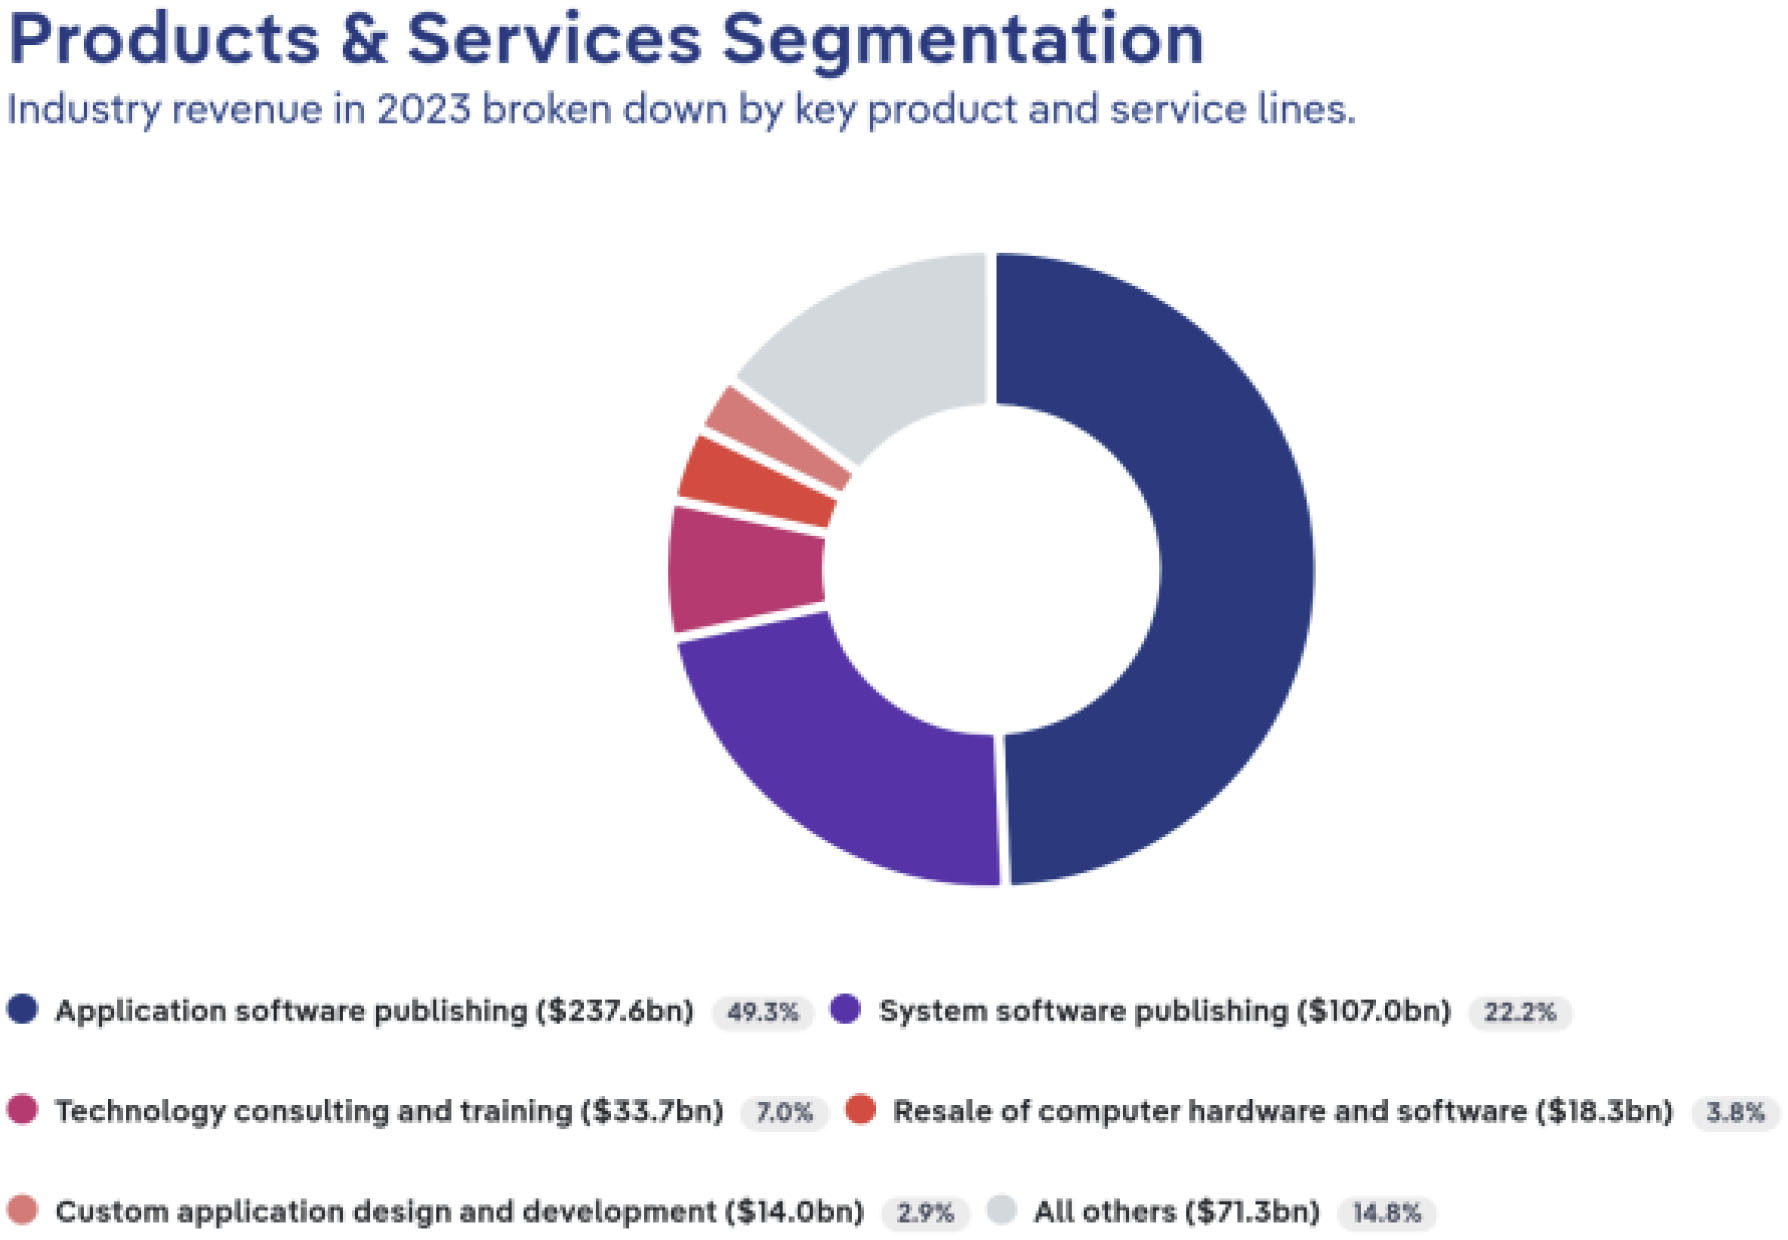
Definition
Software publishers disseminate licenses to customers for the right to execute software on their own computers. Operators in this industry market and distribute software products and may also design the software, produce support materials and provide support services.
Related Terms
OPEN-SOURCE SOFTWARE (OSS)
Software distributed under a licensing arrangement that enables computer codes to be shared, viewed and modified by other users and organizations.
SOFTWARE AS A SERVICE (SAAS)
A model of software deployment in which a provider licenses an application to customers for use as a service on demand.
ENTERPRISE SOFTWARE
A type of software, also known as enterprise application software (EAS), that is intended to solve an enterprise problem, rather than a departmental problem.
APPLICATION SOFTWARE
A computer program that functions with the purpose of supporting or improving the software user’s work.
CLOUD COMPUTING
A computing model in which storage and computing tasks are handled by networked machines (often servers in a data center owned by the service provider) rather than at the point of consumption.
| Prepared by Stonebridge Advisors, Inc. | © 2023 Stonebridge Advisory Inc. - All Rights Reserved |
| INDUSTRY TRENDS 1 | 10 |
| Companies | |||
| ● | Microsoft Corporation | ||
| ● | International Business Machines Corporation | ||
| ● | Apple Inc. | ||
| ● | Oracle Corporation | ||
| ● | Sap Se | ||
| ● | First Data Corp | ||
| ● | Vmware, Inc. | ||
| ● | Ss&C Technologies Inc. | ||
| ● | Ceridian HCM Holding Inc. | ||
| ● | Veeam Software Group GmbH | ||
| ● | Costar Group, Inc. | ||
| ● | Infosys Limited | ||
| ● | Ringcentral, Inc. | ||
| ● | Maxar Technologies Ltd. | ||
| ● | Datalogic S.P.A. | ||
| ● | Docusign, Inc. | ||
| ● | Uipath Srl | ||
| ● | Tech Data Corp | ||
| ● | Automation Anywhere, Inc. | ||
| ● | Blackbaud, Inc. | ||
| ● | Nice Ltd. | ||
| ● | Ultimate Software Group Inc. | ||
| ● | Riverbed Technology, Inc. | ||
| ● | Aci Worldwide, inc. | ||
| ● | Veritas Technologies LLC | ||
| ● | Sas Institute Inc. | ||
| ● | Athenahealth Inc. | ||
| Prepared by Stonebridge Advisors, Inc. | © 2023 Stonebridge Advisory Inc. - All Rights Reserved |
| INDUSTRY TRENDS 2 | 11 |
https://my.ibisworld.com//us/en/industry/51121/at-a-glance
Key Takeaways
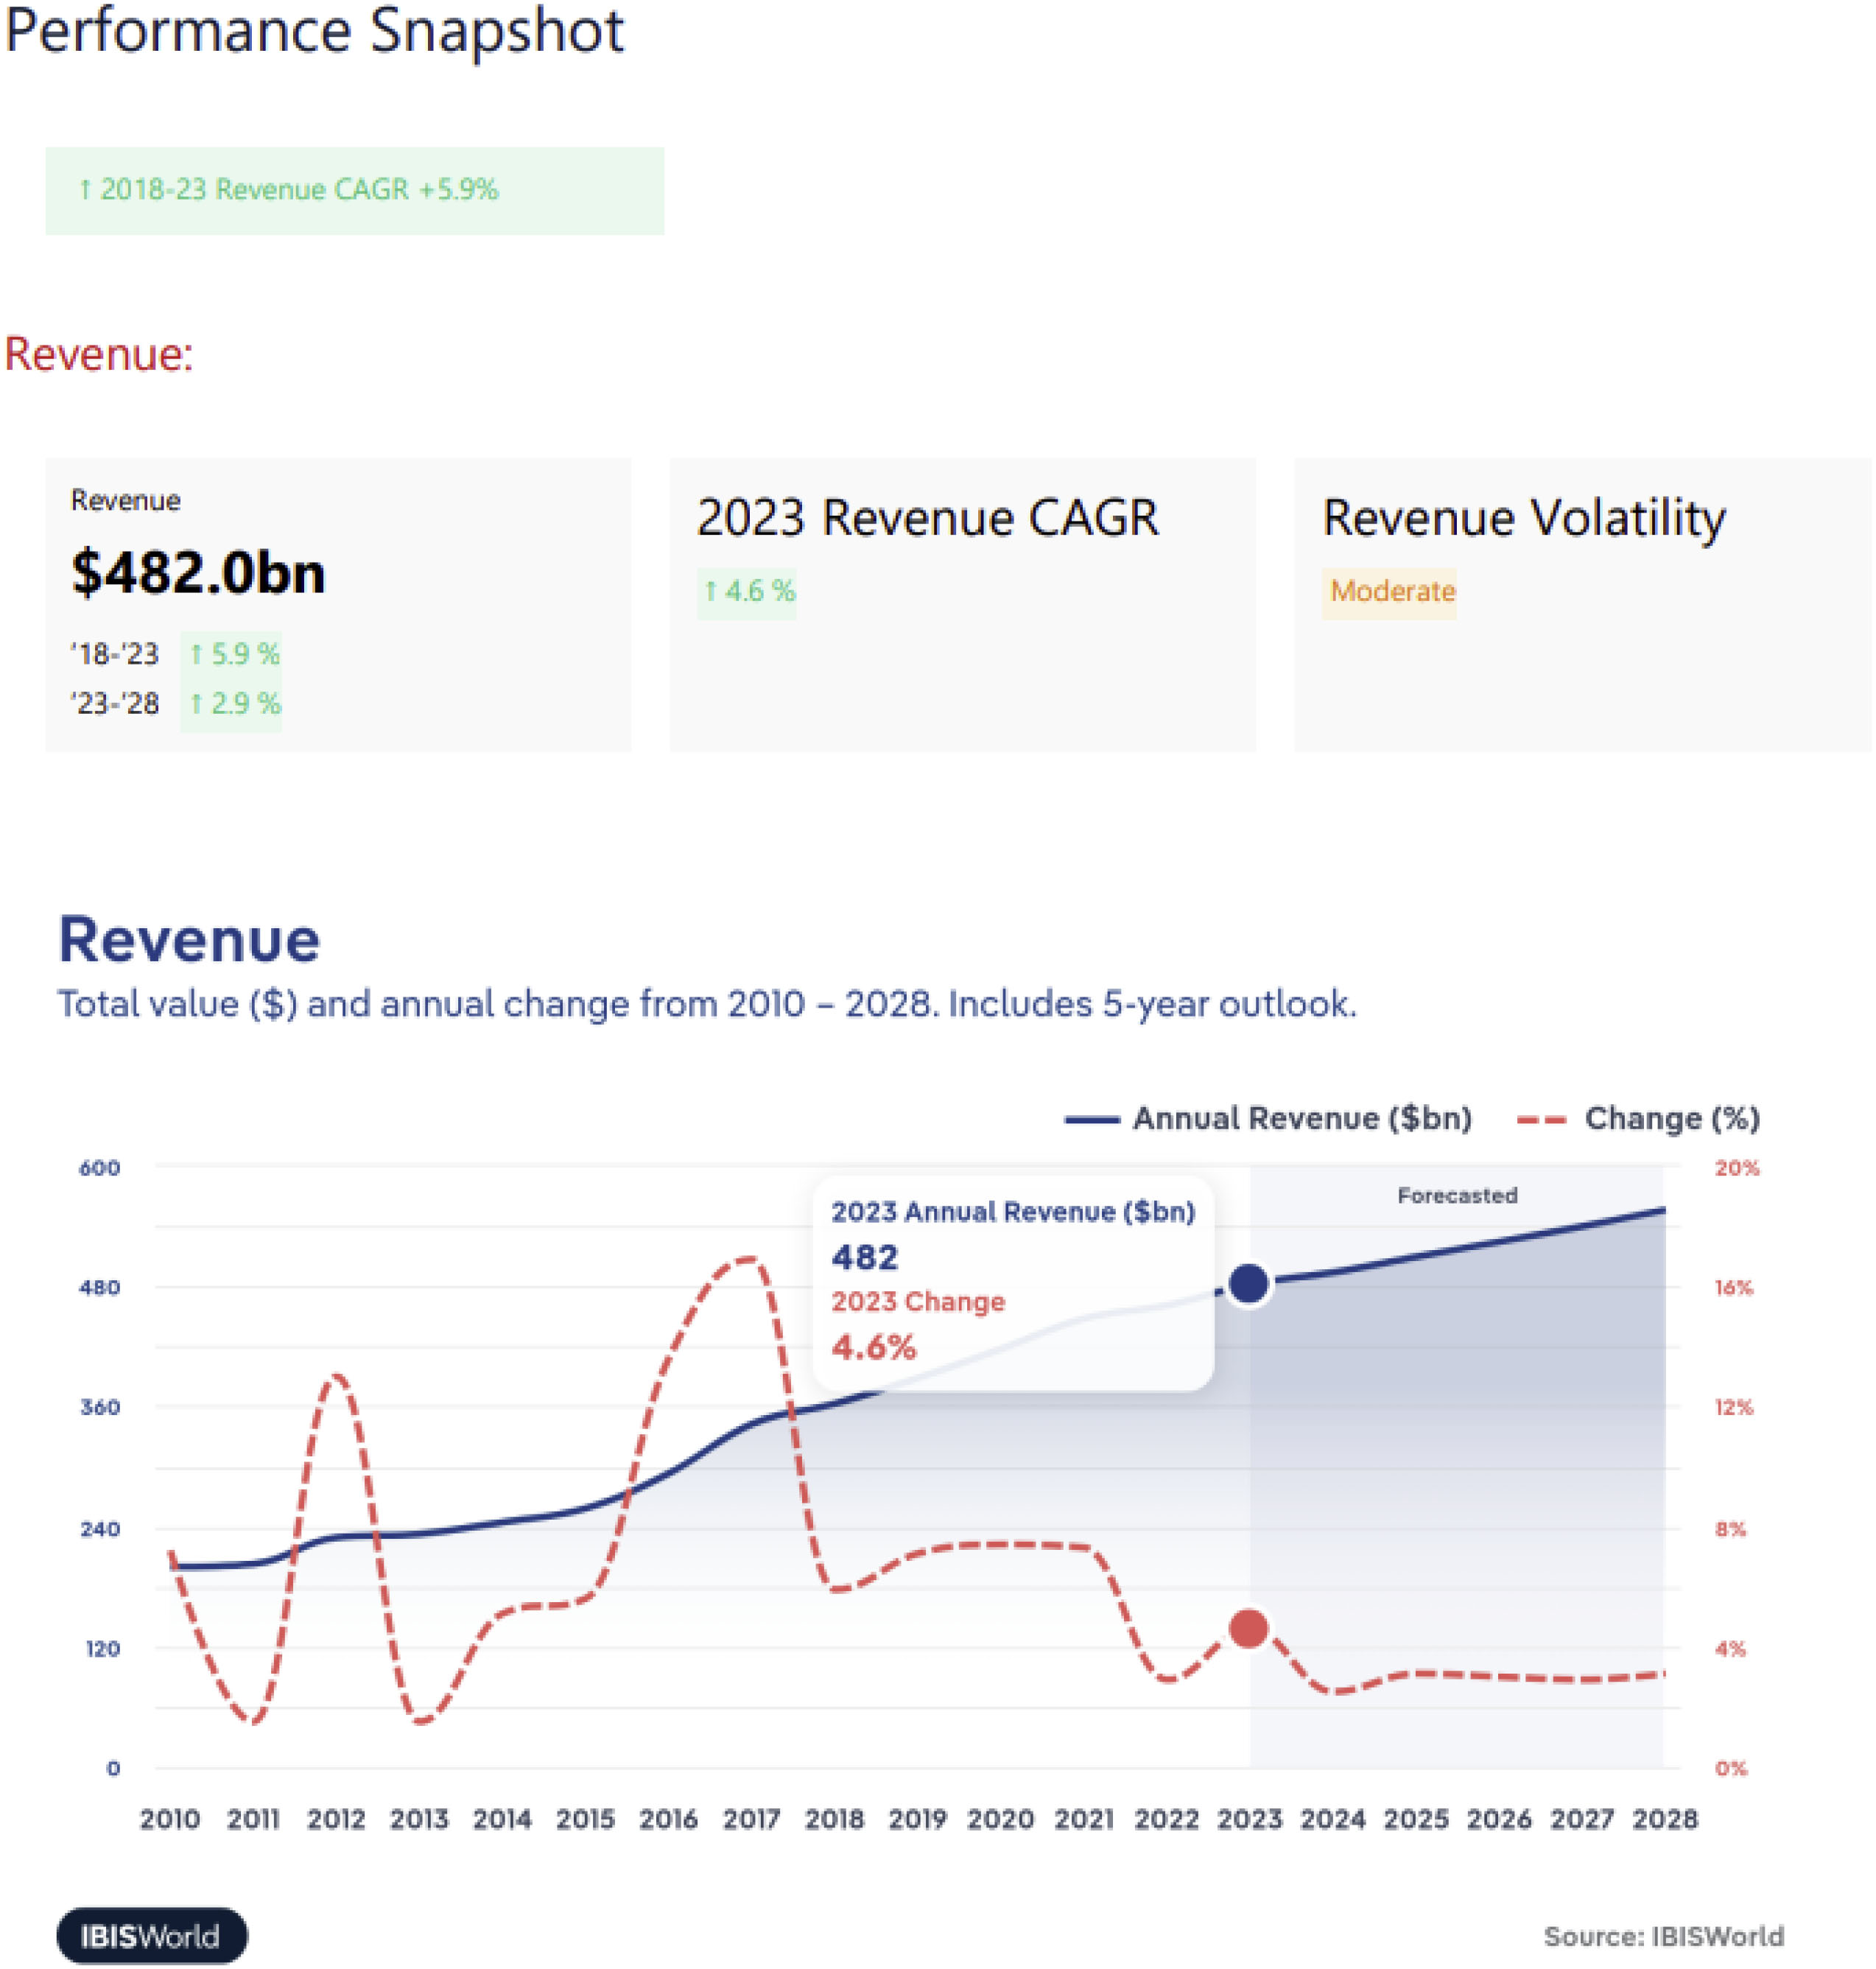
Performance
Software is reaching saturation for most home user clients. Instead, developers are switching to focus on mid-size and small businesses that are currently experiencing high churn.
Businesses have wrapped around software, and its use is non-negotiable in many circumstances. This dependence has enabled developers to charge high monthly fees and profit enormously.
External Environment
As a relatively new industry, the Software Development industry experiences little regulation. Even COVID failed to hit the industry hard, as many developers simply worked from home.
Volatility affects the numerous software developer nonemployers far more than established enterprises. Venture capital drying up or a key client going under can sink a fledgling software hopeful.
| Prepared by Stonebridge Advisors, Inc. | © 2023 Stonebridge Advisory Inc. - All Rights Reserved |
| INDUSTRY TRENDS 3 | 12 |
| Prepared by Stonebridge Advisors, Inc. | © 2023 Stonebridge Advisory Inc. - All Rights Reserved |
Software Industry Statistics
| Statistic | Count | Range | 10th Percentile | 25th Percentile | Median | 75th Percentile | 90th Percentile | H Mean | WH Mean | Mean |
| MVIC/Net Sales | 1,340 | 0.00x – 23,340.00x | 0.84x | 1.58x | 3.12x | 6.46x | 16.61x | 0.00x | 5.25x | 40.59x |
| MVIC/Gross Profit | 1,273 | 0.01x – 23,340.00x | 1.41x | 2.45x | 4.79x | 9.78x | 25.50x | 2.29x | 8.01x | 44.43x |
| MVIC/EBIT | 539 | 0.3x – 31,117.8x | 5.6x | 11.5x | 24.6x | 56.1x | 141.4x | 12.1x | 33.6x | 157.6x |
| MVIC/EBITDA | 530 | 0.2x – 17,175.5x | 5.2x | 11.1x | 19.4x | 42.6x | 103.1x | 11.2x | 24.6x | 91.3x |
| MVIC/SDE | 54 | 1.0x – 17.0x | 1.5x | 2.4x | 3.5x | 5.4x | 7.6x | 3.0x | 5.1x | 4.3x |
| MVIC/BVIC | 958 | 0.0x – 2,304.0x | 1.3x | 2.4x | 4.8x | 12.3x | 32.8x | 0.0x | 3.9x | 23.8x |
| MVIC Price | 1,358 | $35,000 – $28,407,000,000 | $2,500,000 | $9,449,582 | $43,980,750 | $249,923,961 | $1,048,146,400 | $576,414,087 | ||
| Net Sales | 1,358 | $0 – $4,235,000,000 | $589,685 | $3,021,721 | $14,321,320 | $66,028,500 | $253,294,400 | $109,194,091 | ||
| Gross Profit | 1,322 | ($37,499,000) – $3,635,000,000 | $279,897 | $1,801,325 | $9,005,106 | $43,383,000 | $154,827,600 | $71,098,579 | ||
| EBIT | 1,355 | ($1,048,975,000) – $1,119,000,000 | ($21,792,094) | ($6,838,902) | ($799,567) | $902,943 | $11,201,000 | ($1,281,230) | ||
| EBITDA | 1,124 | ($951,435,000) – $1,497,000,000 | ($17,331,062) | ($5,083,565) | ($140,842) | $2,785,143 | $22,532,500 | $8,468,446 | ||
| Seller’s Discretionary Earnings (SDE) | 57 | ($26,768,949) – $5,066,543 | $56,052 | $125,000 | $255,828 | $900,002 | $1,454,000 | $149,954 | ||
| Owner’s Compensation | 51 | $0 – $2,380,032 | $0 | $53,013 | $95,000 | $168,513 | $280,000 | $184,163 | ||
| Book Value Invested Capital | 1,242 | ($124,389,000) – $11,393,000,000 | ($1,625,800) | $101,352 | $4,762,877 | $58,432,750 | $300,356,500 | $154,425,394 | ||
| Gross Profit Margin | 1,304 | (6,305.3%) – 100.0% | 32.4% | 52.7% | 69.1% | 83.5% | 97.8% | 57.2% | ||
| SDE Margin | 57 | (104.8%) – 97.3% | 8.3% | 23.1% | 40.4% | 58.2% | 77.9% | 39.7% | ||
| EBITDA Margin | 1,110 | (63,652.3%) – 97.9% | (184.3%) | (41.8%) | (1.6%) | 13.3% | 28.1% | (231.7%) | ||
| Operating Profit Margin | 1,337 | (101,239.3%) – 97.9% | (199.0%) | (51.0%) | (7.8%) | 8.4% | 22.9% | (308.4%) |
Source: DealStats
| Prepared by Stonebridge Advisors, Inc. | © 2023 Stonebridge Advisory Inc. - All Rights Reserved |
DealStats contained 1358 selected transactions with the following criteria:
| ● | NAICS was 513210 |
This group of transactions displayed the following valuation multiples:
| Valuation Multiple | Count | Median | H Mean | WH Mean | Mean |
| MVIC/Net Sales | 1340 | 3.12x | 5.25x | 40.59x | |
| MVIC/Gross Profit | 1273 | 4.79x | 2.29x | 8.01x | 44.43x |
| MVIC/EBIT | 539 | 24.6x | 12.1x | 33.6x | 157.6x |
| MVIC/EBITDA | 530 | 19.4x | 11.2x | 24.6x | 91.3x |
| MVIC/SDE | 54 | 3.5x | 3.0x | 5.1x | 4.3x |
| MVIC/BVIC | 958 | 4.8x | 3.9x | 23.8x |
This group of transactions displayed the following ratios:
| Profitability Ratios | Count | Median | Mean |
| Gross Profit Margin | 1304 | 69.1% | 57.2% |
| SDE Margin | 57 | 40.4% | 39.7% |
| EBITDA Margin | 1110 | (1.6%) | (231.7%) |
| Operating Profit Margin | 1337 | (7.8%) | (308.4%) |
| Net Profit Margin | 1329 | (8.7%) | (319.1%) |
| Return on Assets | 1306 | (9.2%) | (110.5%) |
| Return on Equity | 1269 | 6.0% | 70.7% |
| Liquidity Ratios | Count | Median | Mean |
| Current Ratio | 1222 | 1.23 | 3.18 |
| Quick Ratio | 1147 | 1.20 | 3.24 |
| Leverage Ratios | Count | Median | Mean |
| Fixed Charge Coverage | 813 | (4.92) | 6287.18 |
| Long-Term Liabilities to Assets | 1243 | 5.16 | 32.60 |
| Long-Term Liabilities to Equity | 1241 | 1.31 | (87.62) |
| Activity Ratios | Count | Median | Mean |
| Total Asset Turnover | 1308 | 1.01 | 2.55 |
| Fixed Asset Turnover | 1255 | 16.07 | 55.22 |
| Inventory Turnover | 251 | 38.61 | 254.94 |
DealStats, Business Valuation Resources’ flagship product, is the largest database of complete, vetted private company and public company transaction data primarily sourced from those working on the transactions--data that is not available in the public domain. DealStats is a robust online database and contains details on 47,930 company transactions with the majority sourced from BVR’s Contributor Network consisting of business intermediaries and M&A advisors. DealStats reports details on the target’s income statement, balance sheet, purchase price allocation, deal terms, financial ratios, selling price multiples and more.
| Prepared by Stonebridge Advisors, Inc. | © 2023 Stonebridge Advisory Inc. - All Rights Reserved |
| THE VALUATION APPROACHES | 13 |
THE THREE APPROACHES TO VALUE
When valuing a company’s common stock (or an asset or a transfer of a liability) we need to value the enterprise by utilizing the various approaches to value and then allocate the methods and calculations from each approach. The three Approaches to Value are the Income, Market and Asset Approach. These approaches, methods and calculations are summarized below.
THE INCOME APPROACH
The Income Approach estimates value by estimating the benefits stream (income) generated by the assets over a period of time. The value of the business is equal to the present value of the future benefits from owning the assets. The two common methods are the Discounted Cash Flow Method and the Capitalization of Earnings Method.
The Discounted Cash Flow Method
The Discounted Cash Flow (DCF) summarizes the company’s cash flow for a period of time (usually five years but can be longer until the cash flows reach stability) as well as the cash flow from the Terminal Value (assumes a sale of the business in a future year). The future cash flows are brought to the present value by discounting the cash flows using the Discount Rate which measures the risk in achieving the expected cash flows. The DCF is a multi-year method and the advantages are that each year’s sales, costs, receivables, inventory, payables and capital expenditures can be estimated. These cash flows should be estimated with reasonable caution. Because a “fictitious buyer” is purchasing the future cash flow of the business, the DCF model is a strong indication of value.
The Capitalization of Earnings Method
The Capitalization of Earnings Method is similar to the DCF except that it is a single year method that only applies the operating cash flow to the capitalization rate. The Capitalization of Earnings Method is applicable when the cash flow is stable or consistent (mature company).
THE MARKET APPROACH
The Market Approach compares the subject company to its industry peers. This comparison is accomplished by reviewing either private sale transactions or publicly traded companies. The benefit stream multiples are variations of income such as earnings before interest and taxes (EBIT) or EBITDA (depreciation & amortization), net operating profit after tax, gross profit, sales, etc. The industry multiples are applied to the subject company’s benefit stream using the multiples from the Guideline Public Companies or the private company transactions. The Market Approach is applicable if the subject company is similar to its industry peers.
THE ASSET OR COST APPROACH
The Asset Approach normally results in the lowest value for an operating company (not a holding company) and measures the tangible assets. This approach can be based on the Net Asset Value or the Liquidation Value. The liquidation value assumes the company is not an on-going business. This report estimates the Net Asset Value which is defined as the market value of the assets less the market value of the liabilities. An asset-based holding company (eg: real estate or investment companies) would use the Asset Approach.
| Prepared by Stonebridge Advisors, Inc. | © 2023 Stonebridge Advisory Inc. - All Rights Reserved |
| INTERIM INCOME STATEMENT | 14 |
INTERIM INCOME STATEMENT AS OF 2023-09-30
| Interim Income Statement | Interim | |
| REVENUES | $0 | |
| Gross Profit Margin | - | |
| OPERATING EXPENSES | ||
| Amortization | $1,455,000 | |
| Depreciation | $0 | |
| Wages & Salaries | $0 | |
| Officer Salaries & Wages | $0 | |
| Other Expenses | $766,954 | |
| Total Operating Expenses | $2,221,954 | |
| OPERATING INCOME | ($2,221,954) | |
| Operating Income Margin | - | |
| Interest | $21,428 | |
| Other Expenses (Income) | $297,205 | |
| NET PROFIT BEFORE TAX | ($2,540,587) | |
| Addbacks | $0 | |
| Reported Profit (Loss) | ($2,540,587) |
| Prepared by Stonebridge Advisors, Inc. | © 2023 Stonebridge Advisory Inc. - All Rights Reserved |
| INTERIM BALANCE SHEET | 15 |
INTERIM BALANCE SHEET AS OF 2023-09-30
| Interim Balance Sheet | Interim | |
| CURRENT ASSETS | ||
| Cash & Equivalents | $17,917 | |
| Accounts Receivable (Trade) | $300,000 | |
| Inventory | $0 | |
| Other Current Assets | $0 | |
| Total Current Assets | $317,917 | |
| LONG-TERM ASSETS | ||
| Net Fixed Assets | $23,576,694 | |
| Other Long Term Assets | $0 | |
| Total Assets | $23,894,611 | |
| CURRENT LIABILITIES | ||
| Cur. Maturities of Long Term Debt | $0 | |
| Accounts Payable | $96,313 | |
| Notes Payable | $0 | |
| Other Current Liabilities | $3,199,663 | |
| Total Current Liabilities | $3,295,976 | |
| LONG-TERM LIABILITIES | ||
| Term Debt | $0 | |
| Other Long Term Liabilities | $0 | |
| Total Liabilities | $3,295,976 | |
| STOCKHOLDERS’ EQUITY | ||
| Equity Interim | $20,598,635 | |
| Total Liabilities & Stockholders Equity | $23,894,611 |
| Prepared by Stonebridge Advisors, Inc. | © 2023 Stonebridge Advisory Inc. - All Rights Reserved |
| FINANCIAL STATEMENT (FORECAST) | 16 |
| Income Statement (Forecast) | 2023 | 2024 | 2025 | 2026 | 2027 | |||||
| INCOME STATEMENT BRIEF | ||||||||||
| Sales | $250,000 | $1,875,000 | $2,343,750 | $2,812,500 | $3,093,750 | |||||
| Sales Growth | 0.00% | 650.00% | 25.00% | 20.00% | 10.00% | |||||
| Cost of Goods Sold | $0 | $0 | $0 | $0 | $0 | |||||
| Gross Profit | $250,000 | $1,875,000 | $2,343,750 | $2,812,500 | $3,093,750 | |||||
| Gross Profit Margin | 100.00% | 100.00% | 100.00% | 100.00% | 100.00% | |||||
| OPERATING EXPENSES | ||||||||||
| Depreciation | $0 | $0 | $0 | $0 | $0 | |||||
| Selling, General & Admin Expenses | ($2,962,500) | $1,781,250 | $2,062,500 | $2,390,625 | $2,629,688 | |||||
| Total Operating Expenses | ($2,962,500) | $1,781,250 | $2,062,500 | $2,390,625 | $2,629,688 | |||||
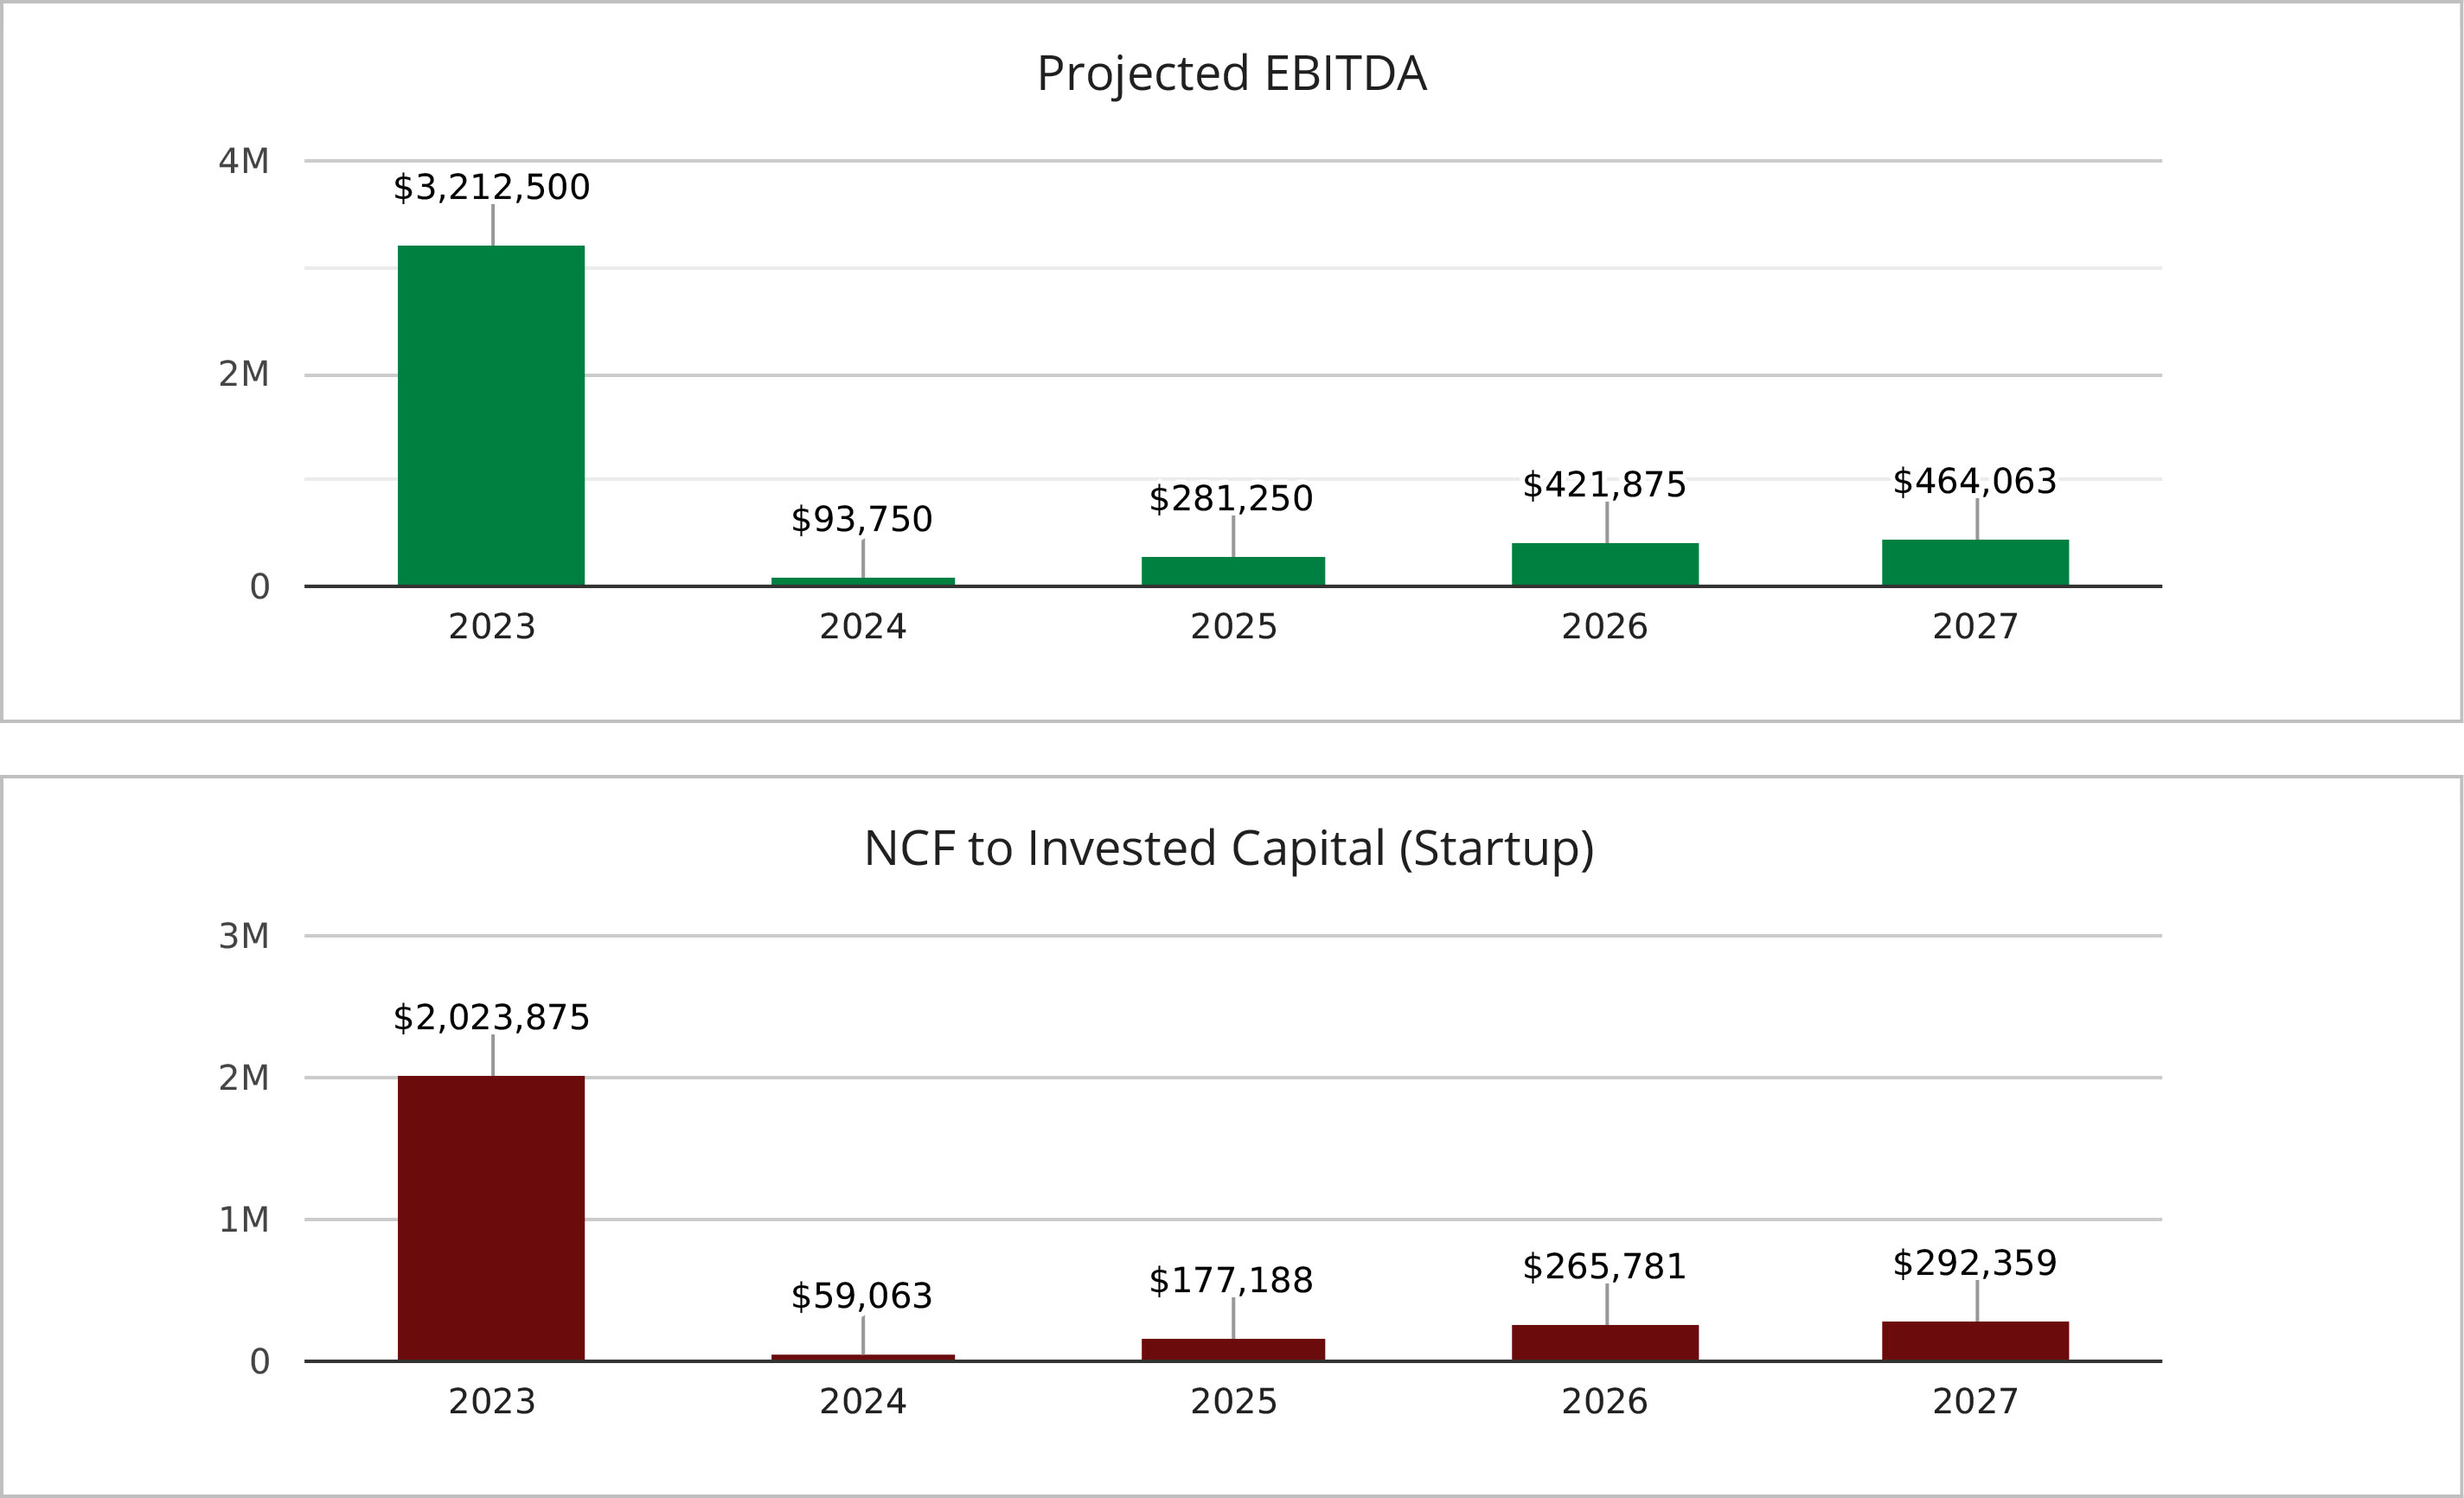
| Operating Income (EBIT) | $3,212,500 | $93,750 | $281,250 | $421,875 | $464,063 | |||||
| Operating Income % | 1285.00% | 5.00% | 12.00% | 15.00% | 15.00% | |||||
| Operating EBITDA | $3,212,500 | $93,750 | $281,250 | $421,875 | $464,063 | |||||
| EBITDA % | 1285.00% | 5.00% | 12.00% | 15.00% | 15.00% | |||||
| Net Operating Profit After Tax (NOPAT) | $2,023,875 | $59,063 | $177,188 | $265,781 | $292,359 | |||||
| NOPAT % | 809.55% | 3.15% | 7.56% | 9.45% | 9.45% |
NOTE: As a startup, the years above can be viewed as “Year 1”, “Year 2”, etc.
A startup’s balance sheet can change quickly as the capital structure and debt leverage changes
in the early years. Therefore, this report does not estimate the forecasted balance sheet.
| Prepared by Stonebridge Advisors, Inc. | © 2023 Stonebridge Advisory Inc. - All Rights Reserved |
| COST OF CAPITAL | 17 |
BUILD UP METHOD, DISCOUNT AND CAPITALIZATION RATE
The Build Up Method (BUM) applies risk factors to a proposed investment to arrive at the Discount Rate which is used in the Income Approach to Value. The BUM adds the Risk-Free Rate (assumes no risk on T Bills), the Equity Risk Premium (risk of equity above the T Bill), the Company Specific Risk Premium (CSRP) which is a non-diversified company risk, the Industry Risk (specific to the subject’s industry) and Size Premium Risk (smaller companies have more risk). These risk factors total the Cost of Equity which is the rate of return an investor would seek on this type of investment in the subject company. The 20 year T-bill is a “normalized” rate that considers the Federal Reserves’ policies to increase the money supply which drives interest rates lower.
The CSRP was given 1.00% points which adds to the investment risk which decreases value. The Cost of Equity and the Cost of Debt are weighted proportionately to determine the industry’s capital structure and is called the Weighted Average Cost of Capital (WACC) and is commonly referred to as the Discount Rate (Cost of Capital). The Discount Rate is applied to the future cash flows in the Discounted Cash Flow Method on the next page. The long-term Growth Rate is deducted from the Discount Rate to arrive at the Capitalization Rate. The Capitalization Rate is applied to the Capitalization of Earnings method reviewed on the “Valuation Approaches” page.
| Discount & Capitalization Rate | Percentage |
| Risk Free Rate | 3.50% |
| Equity Risk Premium | 5.50% |
| Industry Risk Premium | 1.15% |
| Size Premium | 4.80% |
| Company Specific Risk Premium | 1.00% |
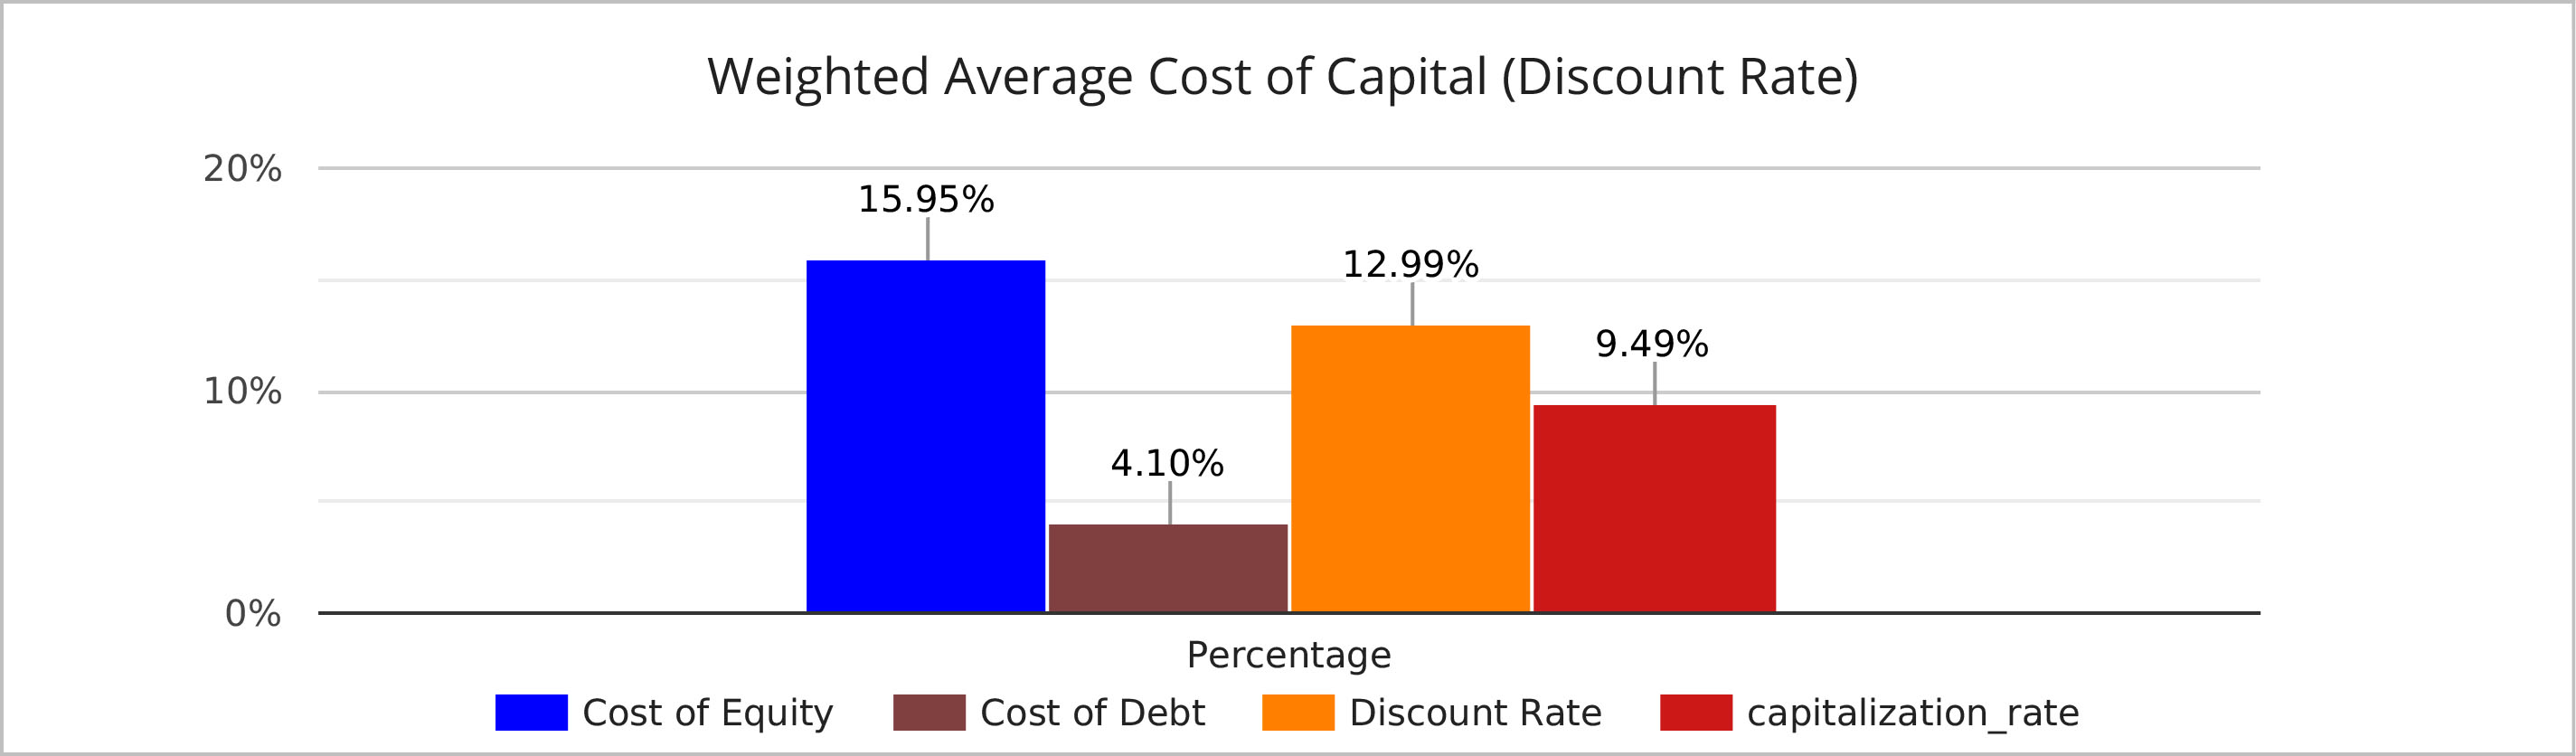
| Cost of Equity | 15.95% |
| Cost of Debt (tax effected) | 4.10% |
| Discount Rate (WACC) | 12.99% |
| Growth Rate Terminal Year | 3.50% |
| Capitalization Rate | 9.49% |
| Prepared by Stonebridge Advisors, Inc. | © 2023 Stonebridge Advisory Inc. - All Rights Reserved |
| DISCOUNT RATE DETAIL | 18 |
THE WEIGHTED AVERAGE COST OF CAPITAL DETAIL
Calculating the Cost of Equity is the first part to estimate the weighted average cost of capital. SMC Entertainment Fyniti Global EBT’s Cost of Equity is 15.95%. The information source is the CRSP Deciles Size Study from Duff & Phelps Cost of Capital (online) and the formula is:
Ke = Rf + ERP + RPi + RPs + CSRP
Ke = Cost of equity
(Source: Duff & Phelps Cost of Capital, normalized 20-year treasury)
Rf = Risk free rate of return on security
(Source: Duff & Phelps Cost of Capital)
ERP= Equity risk premium
(Source: Duff & Phelps Cost of Capital)
RPi = Industry risk premium
(Source: Duff and Phelps Cost of Capital Full Beta)
RPs = Risk premium on small stocks
(Source: Duff and Phelps Cost of Capital CRSP Decile 10)
CSRP = Company specific risk premium
(The CSRP is added to account for risk above the financial markets)
The Weighted Average Cost of Capital (WAAC) or Discount Rate for SMC Entertainment Fyniti Global EBT is 12.99%. The WACC proportionately weights the capital structure with the industry’s capitalization of equity and debt. To arrive at the WACC the Cost of Equity and the Cost of Debt need to be calculated. The formula is:
WACC = (Ke x’s E) + (Kd x’s D)
WACC = Weighted average cost of capital
Ke = Cost of equity
Kd = Cost of debt
E = Percentage of equity in the capital structure
D = Percentage of debt in the capital structure
| Prepared by Stonebridge Advisors, Inc. | © 2023 Stonebridge Advisory Inc. - All Rights Reserved |
| NET CASH FLOW | 19 |
NET CASH FLOW (TO INVESTED CAPITAL)
The Net Cash Flow to Invested Capital is the cash available to debt and equity holders and is projected for a period of years (below). In the “termination” year after the last projected year, the shareholders theoretically recapitalize the business to total the sale proceeds along with the years of Operating Net Cash Flow. The Terminal Value is based on the month after the last projected year of net cash flow which is capitalized using the Capitalization Rate. The present value of the sum of the Operating Net Cash Flow plus the Terminal Value cash flow is presented on the next page under the Discounted Cash Flow Method.
Mid-Year or End-of-Year Convention Note: When applying the discount rate, it is typical to use either the end-of-year or mid-year in assuming the timing of the annual cash flows. Normally the mid-year best reflects the timing of the cash flows as the first half of cash flows will be overly discounted and the last half of the year will be under discounted. However the mid-year convention is best as the first and last half both cancel each other out and the middle of the year takes precedence. The end-of-year convention assumes the cash flows will come in at the very end of the year such as strong retail holiday sales. This report uses the mid-year convention.
| Net Cash Flow to IC | 2023 | 2024 | 2025 | 2026 | 2027 | |||||
| Revenue | $250,000 | $1,875,000 | $2,343,750 | $2,812,500 | $3,093,750 | |||||
| Growth Rate | 0.00% | 650.00% | 25.00% | 20.00% | 10.00% | |||||
| EBITDA | $3,212,500 | $93,750 | $281,250 | $421,875 | $464,063 | |||||
| EBITDA % | 1285.00% | 5.00% | 12.00% | 15.00% | 15.00% | |||||
| Income Taxes (37% Marginal Rate) | ($1,188,625) | ($34,688) | ($104,063) | ($156,094) | ($171,703) | |||||
| Capital Expenditures | $0 | $0 | $0 | $0 | $0 | |||||
| NCF to Invested Capital (Startup) | $2,023,875 | $59,063 | $177,188 | $265,781 | $292,359 |
| Prepared by Stonebridge Advisors, Inc. | © 2023 Stonebridge Advisory Inc. - All Rights Reserved |
| NET CASH FLOW - FIVE YEAR DETAIL | 20 |
NET CASH FLOW CONCEPT
The Present Value (PV) of the Net Cash Flow of the Operating Cash Flow and Terminal Cash Flow are added together. The Operating Cash Flow is an annual review of the cash flow generated for a determined period of years. The Terminal Cash Flow is the cash generated by either selling the business or recapitalizing it after a determined period of years (more on the following page). The Operating Net Cash Flow (first table) multiplies the annual Net Cash Flows by the specific year’s Discount Factor. The Discount Factor applies the appropriate Discount Factor that correlates to the time value of money.
The Terminal Value (second table) reviews the latest year of Operating Cash Flow and adds the Mature Growth Rate in order to calculate the next years Cash Flow. The next year’s Cash Flow is divided by the Capitalization Rate to calculate the Terminal Value. That value is then multiplied by the latest Discount Factor to bring the value to today’s dollar value.
The last table totals the two cash flows to arrive at the Total Discounted Cash Flow (also called Firm Value).
| Five Year Operating Net Cash Flow Detail | NCF | Disc. Factor | Operating Value | |||
| Year 1, Net Cash Flow | ($2,962,500) | 94.08% | ($2,787,055) | |||
| Year 2, Net Cash Flow | $59,063 | 83.26% | $49,178 | |||
| Year 3, Net Cash Flow | $177,188 | 73.69% | $130,578 | |||
| Year 4, Net Cash Flow | $265,781 | 65.22% | $173,354 | |||
| Year 5, Net Cash Flow | $292,359 | 57.73% | $168,773 | |||
| Present Value - Operating Cash Flows (a) | - | - | ($2,265,172) |
| PV of Terminal Value (6th year) | Values | |
| Year 5 of Net Cash Flow | $292,359 | |
| Mature Growth Rate | 3.50% | |
| Terminal Net Cash Flow (c) | $302,592 | |
| Capitalization Rate (d) | 9.49% | |
| Capitalized Value (c / d) | $3,189,795 | |
| Year 5 Disc Factor | 57.73% | |
| Present Value of Terminal Value (b) | $1,841,398 |
| DCF Detail (5 years) | Value | |
| Operating Cash Flow (a) | ($2,265,172) | |
| Terminal Value Cash Flow (b) | $1,841,398 | |
| Firm Value (a+b) | ($423,774) |
Note: Numbers above include 2023 cash flow whereas the discounted cash flow on the page 28 calculates value based on 2024 to 2027 cash flow. The calculation for the Discount Factor is on the next page.
| Prepared by Stonebridge Advisors, Inc. | © 2023 Stonebridge Advisory Inc. - All Rights Reserved |
| DISCOUNT FACTOR CALCULATIONS | 21 |
DISCOUNT FACTOR CALCULATION
The Mid-Year Convention calculates the net cash flows as if these cash flows were generated at the midpoint of the year (or period of time). In most cases it would be incorrect to assume that the net cash flows would occur at the end of the year. By assuming the Mid-Year Convention (year less the 0.5 for half the year), the first half of the year’s net cash flows are offset by the last half which best reflects the middle of the year timing of the cash flows.
DISCOUNT FACTOR CALCULATION
1
| (Period Number - 0.5) |
| (1 + Discount Rate) |
DISCOUNT FACTOR EXAMPLE
Assume a cash flow in Year 5 of $10,000 and a discount rate of 15%.
1
| (5 - 0.5) |
| (1 + 15) |
1
| (4.5) |
| 1.15 |
The Discount Factor of 1/1.88 equals 53.32%. Multiplying 53% by $10,000 equals a fifth year present value of $5,332.
| Prepared by Stonebridge Advisors, Inc. | © 2023 Stonebridge Advisory Inc. - All Rights Reserved |
| VALUE METHODS & CALCULATIONS | 22 |
DISCOUNTED CASH FLOW METHOD (INCOME APPROACH)
The Net Cash Flow (NCF) is projected for 5 years. In the “termination” year after the fifth year, the shareholders theoretically recapitalize the business to total the sale proceeds and 5 years of operating net cash flow. The terminal value is based on the month after the fifth year’s net cash flow which is capitalized using the Capitalization Rate. The DCF Method is the present value of the two cash flows. Because this year is almost completed, the DCF calculation starts next year with an estimated $59,063 of Net Cash Flow.
| Discounted Cash Flow Method (NCF to IC) | Present Value | |
| Discounted Value of Operating Net Cash Flow | $589,656 | |
| Discounted Cash Flow of Terminal Value | $2,080,526 | |
| Discounted Cash Flow Method (DCF) | $2,670,182 |
THE TERMINAL VALUE METHOD
The mean of the selected Market Selling Multiples reflects public or private companies selling multiples of EBITDA. The Terminal Value Method is a variation of the Selling Multiples Method that is applied to startup businesses. Rather than applying the latest EBITDA to the applicable ’selling’ multiple, the Terminal Value Method applies this multiple to the estimated EBITDA in the fifth year after the Company is achieving sales and earnings. That value is brought to the present value using the discount rate. For the purposes of this valuation report, the industry multiples apply the industry mean and not individual companies within the industry. We believe the industry mean is a broad and accurate number.
| Terminal Value Method | Values | |
| Latest Proj. EBITDA | $464,063 | |
| EBITDA Multiple | 19.40 | |
| EBITDA Applied Value | $9,002,813 | |
| Applied Discount Rate | 12.99% | |
| Present Value | $4,889,340 |
NET ASSET VALUE METHOD (ASSET APPROACH)
The asset approach subtracts the market value of the liabilities from the market value of the assets to arrive at the Net Asset Value. If the asset and liabilities have been adjusted, this will be expanded on the next two pages.
| Net Asset Value | Value | |
| Total Assets | $23,594,611 | |
| Total Liabilities | $3,295,976 | |
| Net Asset Value | $20,298,635 |
| Prepared by Stonebridge Advisors, Inc. | © 2023 Stonebridge Advisory Inc. - All Rights Reserved |
| ASSET APPROACH TO VALUE | 23 |
NET ASSET VALUE AS OF 2023-09-30
| Net Asset Value | Historic | Adjustment | Adjusted | |||
| CURRENT ASSETS | ||||||
| Cash & Equivalents | $17,917 | $0 | $17,917 | |||
| Accounts Receivable | $300,000 | ($300,000) | $0 | |||
| Inventory | $0 | $0 | $0 | |||
| Other Current Assets | $0 | $0 | $0 | |||
| Total Current Assets | $317,917 | - | $17,917 | |||
| LONG-TERM ASSETS | ||||||
| Net Fixed Assets | $23,576,694 | $0 | $23,576,694 | |||
| Other Long-Term Assets | $0 | $0 | $0 | |||
| Total Assets | $23,894,611 | - | $23,594,611 | |||
| CURRENT LIABILITIES | ||||||
| Current Maturities of LT Debt | $0 | $0 | $0 | |||
| Accounts Payable | $96,313 | $0 | $96,313 | |||
| Notes Payable | $0 | $0 | $0 | |||
| Other Current Liabilities | $3,199,663 | $0 | $3,199,663 | |||
| Total Current Liabilities | $3,295,976 | - | $3,295,976 | |||
| LONG-TERM LIABILITIES | ||||||
| Term Debt | $0 | $0 | $0 | |||
| Other Long-Term Liabilities | $0 | $0 | $0 | |||
| Total Liabilities | $3,295,976 | - | $3,295,976 | |||
| NET ASSET VALUE | $20,598,635 | - | $20,298,635 |
The $300,000 receivable has been removed to reflect the actual accounting for the receivable.
| Prepared by Stonebridge Advisors, Inc. | © 2023 Stonebridge Advisory Inc. - All Rights Reserved |
| VALUE ALLOCATIONS | 24 |
ALLOCATED VALUATION FOR FMV
Startup companies can review several methods and calculations to determine value. The Discounted Cash Flow (DCF) estimates several years of cash flows and is useful when the forecast has a reasonable confidence level.
The Terminal Value applies the last forecasted year of earnings to an industry selling multiple which is useful when the cash flow expectations has a reasonable confidence level and the cash flow comes in the latter forecasted years.
The Net Asset Value is the market value of the assets less the market value of the liabilities and is useful when companies are in the early stages and value is best represented by the assets and liabilities.
If companies are in the early stages and have raised capital at an agreed upon valuation, the Prior Transaction Method (Market Approach) can be useful. The Funding Method is a general rule that capitalizes the company based on a multiple of funds being raised.
The DCF was weighted 0.00%; the Terminal Value was weighted 0.00%; the Net Asset Value was weighted 100.00%; the Prior Transaction Method was weighted 0.00% and the Funding Method was weighted 0.00%. This allocation best represents the Fair Market Value.
| Allocation | Valuation | Weighting | Applied Value | |||
| Discounted Cash Flow Method | $2,670,182 | 0.00% | $0 | |||
| Net Asset Value | $20,298,635 | 100.00% | $20,298,635 | |||
| Terminal Value Method | $4,889,340 | 0.00% | $0 | |||
| FMV for 100% Interest | 100.00% | $20,298,635 |
ALLOCATION CONCLUSION
SMC Entertainment Fyniti Global EBT is valued at approximately $20,298,635 for the enterprise value. Because the company is a startup, the Terminal Value Method was reviewed rather than the Selling Multiples Method that applies the latest income stream to an industry multiple. As a company that resembles a startup business (larger expected ramp up in revenues, margins or intangible assets) the Terminal Value Method, the Discounted Cash Flow Method, the Net Asset Value, and if available, the Prior Transaction Method have been reviewed to estimate enterprise value.
| Prepared by Stonebridge Advisors, Inc. | © 2023 Stonebridge Advisory Inc. - All Rights Reserved |
| VALUE CONCLUSIONS | 25 |
| Shares Valued | Share Value | |
| Shares Outstanding | 1,121,275,825 | |
| Shares Being Valued | 1,121,275,825 | |
| Value for 100% of Company | $20,298,635 | |
| Value For Lot | $20,298,635 | |
| Price Per Share $ | 0.018 |
NET ASSET VALUE
The Net Asset Value (NAV) of SMC Entertainment Fyniti Global EBT is estimated at $20,298,635. The NAV is the market value of the assets less the market value of the liabilities. The Asset Approach was used because at this time in the Company’s history, the market value of the assets is the best measure of value. This equates to $0.018 per share.
| Prepared by Stonebridge Advisors, Inc. | © 2023 Stonebridge Advisory Inc. - All Rights Reserved |
| QUALIFICATIONS | 26 |
APPRAISER’S INDEPENDENCE
A business appraiser offers an objective and independent opinion of value of the business interest and does not act in an advisory function. In this valuation, the appraiser is offering an objective and independent opinion of value of the business interest. The appraiser is independent of the client and has no ownership interest, employee benefits or role in the company, is not an officer of the company and has no ongoing role in the future of the company. The consideration paid to an appraiser for an engagement should not be subject to meeting a client’s expected concept of value. The appraisal fee for this valuation engagement is not dependent on any expectations of the client’s perceived value of the asset being valued. Regarding this valuation engagement, we are not acting as an advisor, are not receiving any benefits other than the flat valuation fee paid and have retained total independence.
DANIEL P. O’CONNELL, AM, BV, AMERICAN SOCIETY OF APPRAISERS
Dan has been active in the appraisal business for over 30 years and has testified in Federal and State jurisdictions providing expert testimony regarding company valuations for business damages, marital resolution of assets and shareholder disagreements. Dan co-founded Stonebridge Advisory Inc., and has been active in the financial services industry with a strong background in corporate finance, investment banking, financial analysis and business strategies. Dan consulted with hundreds of companies with $2 million to $250 million in sales on how to build equity in the business and has been active in the mergers and acquisitions area representing privately-owned businesses with $5 million to $100 million in sales as well as representing buyers for strategic acquisitions, assisting business owners in recapitalizing their balance sheet, raising growth capital, business reorganizations and buyouts.
Dan has performed business valuations ranging from startup businesses to service and manufacturing firms, to distribution and retail companies. In a career as a financial analyst and as an appraiser, Dan offers clients a unique perspective and depth of knowledge in the service, distribution, manufacturing and retail sectors. Dan has provided business valuations for various purposes including buying or selling a business, partner buy-sell situations, company recapitalizations, business planning, a review of value creation, issuing stock options with a 409 (a) valuation, 83 (b) elections, shareholder disputes, fairness opinions, litigation, estate planning, estate valuations, gifting for tax purposes, succession planning, economic loss, divorce and valuing patents or other intangible assets. Dan graduated from St. John’s University with a major in Business Administration and Management and is an Accredited Member, AM, BV, American Society of Appraisers and has USPAP Certification (Uniform Standards of Professional Appraisal Practice).
RYAN P. O’CONNELL, IRS QUALIFIED BUSINESS VALUATIONS
Ryan has a background in sales and business development having worked with large U.S. companies as well as small businesses. Ryan co-founded Stonebridge Advisory Inc. and incorporates IRS Revenue Ruling 59-60 guidelines that meet the IRS’s Qualified Valuation status for business valuations. Ryan has produced hundreds of business valuations in the manufacturing, retail, distribution, professional, and service sectors and has a strong knowledge base in accounting, financial statements and business valuations.
Ryan has provided business valuations for various purposes including buying or selling a business, partner buy-sell situations, business planning and a review of value creation, gifting for tax or transfer purposes, succession planning, economic loss, issuing 409 (A) stock options, estate planning, litigation and marital asset dissolutions.
| Prepared by Stonebridge Advisors, Inc. | © 2023 Stonebridge Advisory Inc. - All Rights Reserved |
| TERMINOLOGY AND CONCEPTS IN REPORT | 27 |
ADJUSTMENTS TO THE FINANCIAL STATEMENTS
A valuation reviews the benefits stream (income measure such as EBITDA) where owner discretionary spending is adjusted or added back to earnings to ‘restore’ the financial statements to a normalized basis. These adjustments can be made on the income statement and would include items such as one-time charges not expected to occur again and any shareholder distributions beyond a normal salary or expenses not pertinent to the day-to-day operations of the business. The balance sheet can also be adjusted to separate non-operating assets from the operating assets. The value of the non-operating assets is added to the fair market value.
BUILD UP METHOD (BUM)
The BUM’s purpose is to measure the totality of a company’s business risk. The risk measure starts with a risk-free rate which is the expected return on 20 Year Treasury Bills backed by the U.S. government. These risk-free investments generally offer a low risk and therefore lower rates of return. A company does not have the backing of the U.S. government and as an equity risk, the risk is higher than the T Bill. This Equity Risk is the risk of the equity investment beyond that of the risk-free rate. The Company Specific Risk Premium considers the non-diversified risk or the fact that this risk can’t be diversified or spread over several companies or industries. In this valuation, we are including a size risk premium due to the subject company being smaller than the Guideline Public Companies used in the comparisons.
CAPITALIZATION METHOD
The Capitalization Method converts a company’s benefit stream to a present value of the business. The Capitalization Method can use alternative measures such as Cash Flow to Equity or Cash Flow to Invested Capital. The formula is Benefit stream / Cap Rate.
CAPITALIZATION RATE
The Capitalization Rate is a percentage number calculated by deducting a company’s growth rate from the Discount Rate. The Capitalization Rate is used to convert a company’s single period benefits (income stream) to a capitalized value of a business.
DISCOUNTED CASH FLOW METHOD
Discounted Cash Flow (DCF) is the present value of future income streams. The DCF Method calculates the present value of a company’s benefits stream (cash flow) and termination value, to present value of the business value. DCF utilizes the discount rate in the calculation.
DISCOUNT RATE
The Discount Rate is the risk rate used in a valuation to convert multiple periods of future benefits (income stream) to a capitalization value (present value). The discount rate utilizes the weighted average cost of capital (WACC) debt and equity participants would require given the risk of the future income stream of a business. The smaller the discount rate, the larger the business value.
EXCESS WORKING CAPITAL
When companies sell, buyers expect sellers to deliver the appropriate working capital at the closing, that is consistent with the industry or the needed liquidity to maintain the business. This working capital variance can be positive (cash back to seller) or negative (credit to buyer). If working capital is insufficient, buyers will consider the variance as purchase price which means a reduction in value.
GUIDELINE PUBLIC COMPANIES METHOD
The Market Approach uses selling multiples from Guideline Public companies where stock is traded daily. Accessing private data on company transactions can be difficult and spotty. Publicly traded companies are typically larger than private companies, are better capitalized, have more transparency, and are openly traded. Therefore, private company multiples are normally discounted by 30% due to size and liquidity. Public companies traded in volume presents a strong valuation model.
| Prepared by Stonebridge Advisors, Inc. | © 2023 Stonebridge Advisory Inc. - All Rights Reserved |
| TERMINOLOGY (CONTINUED) | 28 |
NET CASH FLOW TO INVESTED CAPITAL
The Net Cash Flow (NCF) to Invested Capital is a widely used measure in determining the cash flow that is available to debt holders and shareholders. The NCF begins with the earnings before interest, taxes, depreciation and amortization or EBITDA. Interest is added back to reflect a debt free company (no debt, no interest paid). Because taxes will be paid and capital expenditures may be needed, these costs are subtracted from the EBITDA numbers. This net cash flow is used in the Discounted Cash Flow and Capitalization of Earnings Method.
WEIGHTING THE METHODS OF VALUE
Some valuation methods might better reflect value for a specific company. Experts select which methods best fits with the subject company being appraised to arrive at the Fair Market Value. A weighted average best suits most companies for a market-based appraisal. This valuation weighs up to five different methods to arrive at Fair market Value.
WEIGHTED AVERAGE COST OF CAPITAL (WACC)
The weighted average cost of capital is the rate of a company’s funding (debt and equity). WACC is the amount the debt and equity holders expect to receive and is the minimum return that is normally required by a company. If a company’s ROIC is greater than the WACC, value is being created. If less, value is being diminished.
MARKET VALUE OF EQUITY (MVE)
The Market Value of Equity (MVE) is based on the income stream of a business including interest on debt and principal amounts. By deducting the interest payment from the Net Cash Flow and considering the change in the debt (principal), the company is valuing its equity. The Net Cash Flow to MVE is the cash available to the shareholders as the debt holders have been paid.
MARKET VALUE OF INVESTED CAPITAL (MVIC)
The Market Value of Invested Capital (MVIC) is based on the income stream of a business and does not include interest on debt or any principal amounts. By not deducting any interest payment from the Net Cash Flow and not considering the change in the debt (principal), the company is valuing the business based on the enterprise value of debt and equity. The Net Cash Flow to MVIC is the cash available to the shareholders and debt holders.
SCOPE OF APPRAISAL
The scope of the appraisal defines the comprehensiveness of the process, the extent of the procedures used, and the detail of information collected and analyzed. The valuation scope ranges between a limited and a comprehensive valuation. A ‘Calculated Value’ such as this valuation, is a limited valuation. A calculated valuation provides an approximate indication of enterprise value or range of value based on limited procedures and information deemed to be relevant. The information collected is deemed to be accurate as presented by company management.
STANDARD OF VALUE
The standard of value refers to the type of value to be assessed. There are four types of values: Fair Market Value, Fair Value, Investment Value and Intrinsic Value. The Fair Market Value is the most common standard and is the value an asset would expect to sell for on the open market given broad assumptions. The Fair Value deals mostly with a fair value for legal purposes, and not the market or economic value. The Investment Value is based on what an asset would sell for given a specific buyer which is opportunistic in nature and is considered strategic. The Intrinsic Value considers all factors any prudent investor would see in the inherent value of a business and does not consider any extreme aspects of market conditions or behaviors.
GOODWILL (INTANGIBLE ASSETS)
Goodwill is the portion of the business value beyond the value of the identifiable tangible and intangible assets of the business. Goodwill is an intangible asset and is usually the result of an acquisition or purchase.
| Prepared by Stonebridge Advisors, Inc. | © 2023 Stonebridge Advisory Inc. - All Rights Reserved |
| REPORT’S LIMITING CONDITIONS | 29 |
ENGAGEMENT’S LIMITING CONDITIONS
1. This valuation is only valid for the stated purpose and as of the date listed in the Appraisal Assignment.
2. This valuation was performed with information from the Company and/or the Client. This information may include financials, ownership positions, business conditions, forecasted assumptions and other data and has been accepted and deemed to be accurate, but has not been verified. Stonebridge and the appraiser make no representations or warranties to the accuracy of this information.
3. This valuation relied upon industry information and has been accepted but not validated, but deemed accurate. Stonebridge makes no representations on the accuracy of this content.
4. Forecasted numbers are reliant on historical data and the Company or Clients vision and assumptions going forward. Because actual results can be different from forecasted results, sometimes significant variances can occur.
5. Forecasted numbers and the valuation conclusion both are predicated on continuous management execution and expertise and the company continuing to operate in such a manner as to not diminish the operations which may impact value. Because assumptions are based on client assumptions and Stonebridge has not performed an audit of the company or its financials, Stonebridge does not make any representations or warranties to the valuation conclusion as the forecast can differ from actual performance.
6. This valuation does not offer or imply any investment or accounting advice in any way. The value in this report is the product of both Company or Client information that was used in the valuation process to determine value. This report is only to be used by the intended user (the client) and only for the purpose listed in the Appraisal Assignment.
7. Any future work where the client is in need of testifying or expert witness testimony, will require a separate Expert Witness Agreement between the client and Stonebridge and the appraiser.
8. Stonebridge is not obligated to perform any future services that deal with any subject manner in this report including testimony or attendance in court, or conference calls or meetings of any type unless a separate agreement is made between the parties. Any separate agreement must agree on the services and pricing required.
9. Stonebridge is not responsible for any environmental conditions or governmental laws, codes or rulings in any event that relate to the subject company, it’s shareholders or client’s diminished value in the asset being appraised. Stonebridge has not conducted any compliance, analysis or review on property or general company compliance with any governmental organizations or authorities and Stonebridge makes no representations or warranties on these conditions.
10. Stonebridge recommends that the client further investigate or contact specific professionals who can provide guidance on any governmental, environmental, legal, operational or financial matters that may impact value.
11. No changes to this report can be made. Only Stonebridge is allowed to make changes.
12. This report does not present a fairness opinion as to an actual value for a proposed transaction, a solvency opinion or an investment opinion unless expressly stated in the Appraisal Assignment. Values of exchanged assets may be significantly different from the appraisal value on a specific date and between specific parties.
| Prepared by Stonebridge Advisors, Inc. | © 2023 Stonebridge Advisory Inc. - All Rights Reserved |