
PRELIMINARY ECONOMIC ASSESSMENT
FOR THE CERRO MORO GOLD-SILVER PROJECT,
SANTA CRUZ PROVINCE, ARGENTINA
Technical Report NI 43-101
Submitted by
Carlos Guzmán, Mining Eng, Registered Member of the Chilean Mining Commission
Bill Gosling, BSc Eng, MBA, FAusIMM
David (Ted) Coupland, BSc, DipGeoSc CFSG ASIA, MAusIMM (CP)
Anthony Sanford, BSc, MBA, SACNASP Pr.Sci.Nat.
Krishna Sinha, PhD, P. Eng Utah
Michael Gabora, BSc, MSc, P. Geo Ontario
Effective Date:
March 30, 2012
CERTIFICATE OF QUALIFIED PERSON
I,Carlos Guzmán,Mining Engineer do hereby certify that:
| 1. | I am Principal and Project Director with the firm NCL Ingenieria y Construccion Ltda, Santiago, Chile. My address is General del Canto 235, Providencia, Santiago, Chile. |
| 2. | This certificate applies to the technical report titled “Preliminary Economic Assessment for the Cerro Moro Gold-Silver Project, Santa Cruz Province, Argentina” dated effective March 30, 2012 (the “Technical Report”) with respect to the Cerro Moro Gold-Silver Project in Santa Cruz Province, Argentina (the “Property”). |
| 3. | I am a practicing mining engineer and a member of the Australasian Institute of Mining and Metallurgy (AusIMM, No. 229036); and a Registered Member of the Chilean Mining Commission. |
| 4. | I am a graduate of the Universidad de Chile and hold a Mining Engineer title (1965). |
| 5. | I have practiced my profession continuously since 1995. |
| 6. | I have read the definition of “qualified person” set out in National Instrument 43-101 (“NI 43-101”) and certify that by reason of my education, affiliation with a professional association (as defined in NI 43-101) and past relevant work experience, I fulfill the requirements to be a “qualified person” for the purposes of NI 43-101. |
| 7. | I most recently personally inspected the Property in November, 2010, for two days. |
| 8. | I am responsible for the preparation of sections 1.1, 1.2, 1.6, 1.9, 1.10, 1.11 (except for 1.11.4 and 1.11.8), 1.12, 1.14, 1.15, 1.16, 1.17, 2, 3, 16 (except for 16.3), 18 (except for 18.1.8 and 18.4), 21.1.2, 21.2.2, 21.2.3, 22, 25, 26 and 27 of the Technical Report. |
| 9. | I am independent of Extorre Gold Mines Limited as described in section 1.5 of NI 43-101. |
| 10. | I have had prior involvement with the Property, namely, I am a “qualified person” responsible for the preparation of portions of the technical report titled “Cerro Moro Gold-Silver Project, Second Preliminary Economic Assessment, Technical Report NI 43-101”, dated August 2, 2011. |
| 11. | I have read NI 43-101 and the sections of the Technical Report for which I am responsible have been prepared in compliance with that instrument. |
| 12. | At the effective date of the Technical Report, to the best of the my knowledge, information and belief, the sections of the Technical Report for which I am responsible contains all scientific and technical information that is required to be disclosed to make the Technical Report not misleading. |
Dated this 30th day of March, 2012.
CERTIFICATE OF QUALIFIED PERSON
I,Bill Gosling, do hereby certify that:
| 1. | I am a Senior Process Engineer. My address is 179 Great Eastern Highway, Belmont, Western Australia. |
| 2. | This certificate applies to the technical report titled “Preliminary Economic Assessment for the Cerro Moro Gold-Silver Project, Santa Cruz Province, Argentina” dated effective March 30, 2012 (the “Technical Report”) with respect to the Cerro Moro Gold-Silver Project in Santa Cruz Province, Argentina (the “Property”). |
| 3. | I possess a Bachelor of Engineering (Extractive Metallurgy) from the Western Australian Institute of Technology and a Masters in Business Administration from LaTrobe University. |
| 4. | I am a member in good standing of Australasian Institute of Mining and Metallurgy (AusIMM) Fellow Grade and Society for Mining, Metallurgy and Exploration (SME) Member Grade. |
| 5. | I have worked as process engineer and manager in the mining industry in Australia for 26 years in both base metal flotation and precious metal extraction operations. For the last six years I have been involved in the design, construction and commissioning of process plants throughout Australia. |
| 6. | I have read the definition of “qualified person” set out in National Instrument 43-101 (“NI 43-101”) and certify that by reason of my education, affiliation with a professional association (as defined in NI 43-101) and past relevant work experience, I fulfill the requirements to be a “qualified person” for the purposes of NI 43-101. |
| 7. | I have not personally inspected the Property. |
| 8. | I am responsible for the preparation of sections 1.7, 1.8, 13, 17, 21.1.1 and 21.2.1 of the Technical Report. |
| 9. | I am independent of Extorre Gold Mines Limited as described in section 1.5 of NI 43-101. |
| 10. | I have had prior involvement with the Property, namely, I am a “qualified person” responsible for the preparation of portions of the technical report titled “Cerro Moro Gold-Silver Project, Second Preliminary Economic Assessment, Technical Report NI 43-101”, dated August 2, 2011. |
| 11. | I have read NI 43-101 and the sections of the Technical Report for which I am responsible have been prepared in compliance with that instrument. |
| 12. | At the effective date of the Technical Report, to the best of the my knowledge, information and belief, the sections of the Technical Report for which I am responsible contains all scientific and technical information that is required to be disclosed to make the Technical Report not misleading. |
| Dated this 30th day of March, 2012. |
| |
| /s/ Bill Gosling |
| Bill Gosling,BEng(Extractive Metallurgy), MBA |
| |
| Senior Process Engineer |
| |
| GR Engineering Service |
CERTIFICATE OF QUALIFIED PERSON
I,David (Ted) Coupland, BSc DipGeoSc CFSG ASIA MAusIMM (CP) MMICA, do hereby certify that:
| 13. | I am a Director and Principal Geostatistician of Cube Consulting Pty Ltd. My address is Level 4, 1111 Hay Street, West Perth 6005. |
| 14. | This certificate applies to the technical report titled “Preliminary Economic Assessment for the Cerro Moro Gold-Silver Project, Santa Cruz Province, Argentina”” dated effective March 30, 2012 (the “Technical Report”) with respect to the Cerro Moro gold-silver project in Santa Cruz Province, Argentina (the “Property”). |
| 15. | I graduated with a Bachelor of Science Degree (Geology) from the University of New England, Australia in 1987. In addition, I have obtained a Post Graduate Diploma in Mineral Economics from Macquarie University, Australia in 1995 and a Post Graduate Diploma in Applied Finance and Investment from the Securities Institute of Australia in 1997. I have completed a Post Graduate Specialisation in Geostatistics (CFSG) from the Paris School of Mines, Fontainebleau, France in 2007. |
| 16. | I am a current Member of the Australian Institute of Mining and Metallurgy (AusIMM No. 109925). I am a holder of AusIMM Chartered Professional (CP) accreditation in the discipline of Geology. I am also a member of the Mineral Industry Consultants Association (MICA). |
| 17. | I have worked as a geologist continuously for 24 years since my graduation from University. I specialize in mineral resource estimation and mine geology. |
| 18. | I have read the definition of “qualified person” set out in National Instrument 43-101 (“NI 43-101”) and certify that by reason of my education, affiliation with a professional association (as defined in NI 43-101) and past relevant work experience, I fulfill the requirements to be a “qualified person” for the purposes of NI 43-101. |
| 19. | I most recently personally inspected the Property September 17 - 19, 2011. |
| 20. | I am responsible for the preparation of sections 1.3, 1.4, 1.5, 4, 6, 7, 8, 9, 10, 11, 12, 14, 15, 19, 23, 24, 25.1 and 26.1 of the Technical Report. |
| 21. | I am independent of Extorre Gold Mines Limited as described in section 1.5 of NI 43-101. |
| 22. | I have had prior involvement with the Property, namely, I am a “qualified person” responsible for the preparation of all or portions of four previous technical reports: |
“Independent Technical Report (NI 43 101) Update Report on the Cerro Moro Project, Santa Cruz Province, Argentina”, dated December 31, 2009;
“Independent Technical Report (NI 43 101), Resource Estimation for the Cerro Moro Project, Santa Cruz Province, Argentina”, dated May 31, 2010;
“Cerro Moro Project - Preliminary Economic Assessment Technical Report NI 43 101”, dated December 2, 2010;
“Cerro Moro Gold-Silver Project, Second Preliminary Economic Assessment, Technical Report NI 43-101”, dated August 2, 2011; and
“Independent Technical Report (NI 43-101), Resource Estimation for the Cerro Moro Project, Santa Cruz Province, Argentina, December 16th 2011”, dated December 16, 2011.
| 23. | I have read NI 43-101 and the sections of the Technical Report for which I am responsible have been prepared in compliance with that instrument. |
| 24. | At the effective date of the Technical Report, to the best of the my knowledge, information and belief, the sections of the Technical Report for which I am responsible contains all scientific and technical information that is required to be disclosed to make the Technical Report not misleading. |
Dated this 30th day of March, 2012.
| /s/ David (Ted) Coupland | |
| David (Ted) Coupland | |
CERTIFICATE OF QUALIFIED PERSON
I,Anthony M. Sanford, BSc. (Hons.), MBA (Mineral Resources Management), Pr.Sci.Nat., do hereby certify that:
| 1. | I am employed as the Environmental Services Manager with Ausenco Vector in Lima, Peru. My address is Calle Esquilache 371, Piso 6, San Isidro, Lima, Peru. |
| 2. | This certificate applies to the technical report titled “Preliminary Economic Assessment for the Cerro Moro Gold-Silver Project, Santa Cruz Province, Argentina” dated effective March 30, 2012 (the “Technical Report”) with respect to the Cerro Moro Gold-Silver Project in Santa Cruz Province, Argentina (the “Property”). |
| 3. | I graduated from the University of Dundee, Scotland, Centre for Energy, Petroleum and Mineral Law and Policy (MBA, Mineral Resources Management) in 1998, the University of Natal, Durban, South Africa (B.Sc (Hons.)., Geology) in 1985 and B.Sc. (Geology & Applied Geology) in 1984. |
| 4. | I am a professional natural scientist registered with the South African Council for Natural Scientific Professions (#400089/93). |
| 5. | I am a Registered Member of the Geological Society of South Africa (GSSA; Member # 37218). |
| 6. | I have practiced my profession for nearly 28 years since completing my honours degree in 1984 in the fields of geology, and environmental and social science related to the exploration, construction, operation, and closure phases of mine development. I have been directly involved in environmental and social issues related to both open pit and underground mining including heap leaching and mine waste/tailings disposal, and on the development of regulatory permits including ESIAs and mine closure plans, the last 12 years of which have been in South America. |
| 7. | I have read the definition of “qualified person” set out in National Instrument 43-101 (“NI 43-101”) and certify that by reason of my education, affiliation with a professional association (as defined in NI 43-101) and past relevant work experience, I fulfill the requirements to be a “qualified person” for the purposes of NI 43-101. |
| 8. | I most recently personally inspected the Property on March 7 and 8, 2012. |
| 9. | I am responsible for the preparation of sections 1.13. Sewerage content of section 1.11.4, section 5 and section 20 of the Technical Report. |
| 10. | I am independent of Extorre Gold Mines Limited as described in section 1.5 of NI 43-101. |
| 11. | I have had prior involvement with the Property. |
| 12. | I have read NI 43-101 and the sections of the Technical Report for which I am responsible have been prepared in compliance with that instrument. |
| 13. | At the effective date of the Technical Report, to the best of the my knowledge, information and belief, the sections of the Technical Report for which I am responsible contains all scientific and technical information that is required to be disclosed to make the Technical Report not misleading. |
Dated this 30th day of March, 2012.
| /s/ Anthony M. Sanford | |
| Anthony M. Sanford | |
CERTIFICATE OF QUALIFIED PERSON
I,Krishna P. Sinha, Ph.D., P.E, S.E.,do hereby certify that:
| 1. | I am employed as the Corporate Technical Director with Ausenco Vector. My address is 851 Northcrest Drive, Salt Lake City, UT 84103, USA. |
| 2. | This certificate applies to the technical report titled “Preliminary Economic Assessment for the Cerro Moro Gold-Silver Project, Santa Cruz Province, Argentina” dated effective March 30, 2012 (the “Technical Report”) with respect to the Cerro Moro Gold-Silver Project in Santa Cruz Province, Argentina (the “Property”). |
| 3. | I graduated from the University of Minnesota, Department of Civil & Mineral Engineering (Ph.D. Geological Engineering) in 1979, the University of Roorkee, India (M.E., Civil Engineering – Soil Mechanics & Foundation Eng.) in 1967, and Bihar Institute of Technology, Sindri, India, (B.Sc. Engineering, Civil) in 1964. |
| 4. | I am a professional engineer registered in the State of Utah (#272545). |
| 5. | I am a Registered Member of the Society for Mining, Metallurgy, and Exploration (SME; Member # 4038056RM) |
| 6. | I have practiced my profession for nearly 40 years since obtaining my undergraduate degree in 1964 in the fields of geotechnical engineering and energy resources related to drilling, exploration, production, stimulation and development. In the mining and other energy sector, I have been directly involved in and have worked on issues related to both open pit and underground mining including heap leaching and mine waste/tailings disposal. |
| 7. | I have read the definition of “qualified person” set out in National Instrument 43-101 (“NI 43-101”) and certify that by reason of my education, affiliation with a professional association (as defined in NI 43-101) and past relevant work experience, I fulfill the requirements to be a “qualified person” for the purposes of NI 43-101. |
| 8. | I most recently personally inspected the Property on February 22nd and 23rd, 2012. |
| 9. | I am responsible for the preparation of sections 1.11.8 and 18.4 of the Technical Report. |
| 10. | I am independent of Extorre Gold Mines Limited as described in section 1.5 of NI 43-101. |
| 11. | I have had prior involvement with the Property. |
| 12. | I have read NI 43-101 and the sections of the Technical Report for which I am responsible have been prepared in compliance with that instrument. |
| 13. | At the effective date of the Technical Report, to the best of the my knowledge, information and belief, the sections of the Technical Report for which I am responsible contains all scientific and technical information that is required to be disclosed to make the Technical Report not misleading. |
| Dated this 30th day of March, 2012. |  |
| /s/ Krishna P. Sinha |
| Krishna P. Sinha |
CERTIFICATE OF QUALIFIED PERSON
I,Michael Gabora, do hereby certify that:
| 14. | I am employed as a Senior Hydrogeologist with Ausenco Vector. My address is 5613 DTC Parkway, Suite 300, Greenwood Village, Colorado 80111, USA. |
| 15. | This certificate applies to the technical report titled “Preliminary Economic Assessment for the Cerro Moro Gold-Silver Project, Santa Cruz Province, Argentina” dated effective March 30, 2012 (the “Technical Report”) with respect to the Cerro Moro gold-silver project in Santa Cruz Province, Argentina (the “Property”). |
| 16. | I graduated with a degree in Bachelor of Science in Earth and Planetary Sciences from the University of New Mexico in 1998. In addition, I have obtained a Master of Water Resources from the University of New Mexico in 2003. |
| 17. | I am a professional geologist registered in Ontario, Canada #0969. My relevant experience includes having worked as a hydrogeologist in mining hydrology, dewatering, and groundwater flow modeling. |
| 18. | I have worked as a hydrogeologist for a total of 11 years since my graduation with a BSc from university. |
| 19. | I have read the definition of “qualified person” set out in National Instrument 43-101 (“NI 43-101”) and certify that by reason of my education, affiliation with a professional association (as defined in NI 43-101) and past relevant work experience, I fulfill the requirements to be a “qualified person” for the purposes of NI 43-101. |
| 20. | I most recently personally inspected the Property on January 10 and January 11, 2012. |
| 21. | I am responsible for the preparation of sections 16.3 and 18.1.8 of the Technical Report. |
| 22. | I am independent of Extorre Gold Mines Limited as described in section 1.5 of NI 43-101. |
| 23. | I have not had prior involvement with the Property. |
| 24. | I have read NI 43-101 and the section of the Technical Report for which I am responsible has been prepared in compliance with that instrument. |
| 25. | At the effective date of the Technical Report, to the best of the my knowledge, information and belief, the section of the Technical Report for which I am responsible contains all scientific and technical information that is required to be disclosed to make the Technical Report not misleading. |
Dated this 30th day of March, 2012.
| /s/ Michael Gabora | |
| Michael Gabora | |
TABLE OF CONTENTS
| 1. | SUMMARY | 29 |
| 2. | INTRODUCTION | 56 |
| 3. | RELIANCE ON OTHER EXPERTS | 58 |
| 4. | PROPERTY DESCRIPTION AND LOCATION | 59 |
| 5. | ACCESS, CLIMATE, LOCAL RESOURCES, INFRASTRUCTURE AND PHYSIOGRAPHY | 66 |
| 6. | HISTORY | 68 |
| 7. | GEOLOGICAL SETTING AND MINERALIZATION | 71 |
| 8. | DEPOSIT TYPES | 90 |
| 9. | EXPLORATION | 92 |
| 10. | DRILLING | 100 |
| 11. | SAMPLE PREPARATION, ANALYSIS AND SECURITY | 117 |
| 12. | DATA VERIFICATION | 125 |
| 13. | MINERAL PROCESSING AND METALLURGICAL TESTING | 135 |
| 14. | MINERAL RESOURCE ESTIMATES | 161 |
| 15. | MINERAL RESERVE ESTIMATES | 194 |
| 16. | MINING METHODS | 195 |
| 17. | RECOVERY METHODS | 232 |
| 18. | PROJECT INFRASTRUCTURE | 244 |
| 19. | MARKET STUDIES AND CONTRACTS | 259 |
| 20. | ENVIRONMENTAL STUDIES, PERMITTING AND SOCIAL OR COMMUNITY IMPACT | 262 |
| 21. | CAPITAL AND OPERATING COSTS | 276 |
| 22. | ECONOMIC ANALYSIS | 304 |
| 23. | ADJACENT PROPERTIES | 317 |
| 24. | OTHER RELEVANT DATA AND INFORMATION | 322 |
| 25. | INTERPRETATION AND CONCLUSIONS | 329 |
| 26. | RECOMMENDATIONS | 333 |
| 27. | REFERENCES | 336 |
TABLE OF CONTENTS
| 1. | SUMMARY | 29 |
| 1.1 | Introduction | 29 |
| 1.2 | Property and Location | 29 |
| 1.3 | Geology and Mineralization | 31 |
| 1.4 | Exploration | 32 |
| 1.5 | Mineral Resource Estimation | 32 |
| 1.6 | Preliminary Mining Studies | 34 |
| 1.7 | Metallurgical Testwork Summary | 37 |
| 1.8 | Mineral Processing and Recovery Methods | 37 |
| 1.9 | Mine Geotechnical | 38 |
| 1.10 | Plant Site Geotechnical | 38 |
| 1.11 | Site Infrastructure | 39 |
| 1.11.1 | Power Supply | 39 |
| 1.11.2 | Site Access Roads | 40 |
| 1.11.3 | Communications Link | 40 |
| 1.11.4 | Water Supply and Sewerage Treatment | 40 |
| 1.11.5 | Mine Infrastructure | 41 |
| 1.11.6 | Cerro Moro Administration | 41 |
| 1.11.7 | Accommodation Camps | 41 |
| 1.11.8 | Tailings Storage Facility | 42 |
| 1.12 | Project Implementation | 42 |
| 1.13 | Environmental Permits | 42 |
| 1.14 | Capital and Operating Cost Estimates | 44 |
| 1.15 | Economic Analysis | 50 |
| 1.16 | Conclusions | 52 |
| 1.16.1 | Mineral Resource | 52 |
| 1.16.2 | Risks and Uncertainties | 52 |
| 1.16.3 | Mining Studies | 52 |
| 1.16.4 | Metallurgical Processing | 53 |
| 1.16.5 | Preliminary Economic Assessment Results | 54 |
| 1.17 | Recommendations | 54 |
| 2. | Introduction and terms of reference | 56 |
| 2.1 | Introduction | 56 |
| 2.2 | Qualified Persons | 56 |
| 2.3 | Frequently Used Acronyms, Abbreviations, Definitions, and Units of Measure | 57 |
| 3. | RELIANCE ON OTHER EXPERTS | 58 |
| 3.1 | Qualified Persons | 58 |
| 3.2 | Other Independent Expert Persons | 58 |
| 4. | PROPERTY DESCRIPTION AND LOCATION | 59 |
| 4.1 | Location | 59 |
| 4.2 | Land Area | 60 |
| 4.3 | Company Ownership and Agreements | 60 |
| 4.4 | Title Agreements and Ownership | 61 |
| 4.4.1 | Estelar - CVSA Option Agreement | 62 |
| 4.4.2 | Estelar - Fomicruz Agreement | 63 |
| 4.4.3 | History of Cerro Moro Acquisition | 64 |
| 4.5 | Environmental Liabilities and Permitting | 65 |
| 5. | Access, Climate, Local Resources, Infrastructure and Physiography | 66 |
| 5.1 | Access | 66 |
| 5.2 | Climate | 66 |
| 5.3 | Local Resources and Infrastructure | 66 |
| 5.4 | Physiography | 66 |
| 6. | History | 68 |
| 6.1 | Cerro Moro History | 68 |
| 6.2 | Recent Exploration at Cerro Morro | 69 |
| 6.3 | Mining History | 70 |
| 7. | Geology | 71 |
| 7.1 | Regional Geology | 71 |
| 7.2 | Local Geology | 73 |
| 7.3 | Deposit Geology and Mineralization | 79 |
| 7.3.1 | Escondida | 80 |
| 7.3.2 | Gabriela | 81 |
| 7.3.3 | Esperanza | 81 |
| 7.3.4 | Loma Escondida | 82 |
| 7.3.5 | Silvia | 82 |
| 7.3.6 | Nini | 82 |
| 7.3.7 | Moro | 83 |
| 7.3.8 | Patricia | 83 |
| 7.3.9 | Deborah | 83 |
| 7.3.10 | Michelle | 83 |
| 7.3.11 | Carla | 84 |
| 7.3.12 | Natalia | 84 |
| 7.3.13 | Mosquito | 84 |
| 7.3.14 | Susy | 84 |
| 7.3.15 | Cassius | 84 |
| 7.3.16 | Carolene | 85 |
| 7.3.17 | Florencia | 85 |
| 7.3.18 | Virginia | 85 |
| 7.3.19 | Laura | 85 |
| 7.3.20 | Dora | 85 |
| 7.3.21 | Tres Lomas | 86 |
| 7.3.22 | Maria | 86 |
| 7.3.23 | Carlita | 86 |
| 7.3.24 | Lala | 86 |
| 7.3.25 | FMD | 86 |
| 7.3.26 | Romina | 87 |
| 7.3.27 | Ornella | 87 |
| 7.3.28 | Deborah Termination Structure | 87 |
| 7.3.29 | Lourdes | 87 |
| 7.3.30 | Lucia | 87 |
| 7.3.31 | Gabriela South-East Extension | 88 |
| 7.3.32 | Conceptual Targets | 88 |
| 7.3.33 | Agostina | 88 |
| 7.3.34 | Belen | 88 |
| 7.3.35 | Deborah Parallel | 89 |
| 8. | DEPOSIT TYPES | 90 |
| 9. | EXPLORATION | 92 |
| 9.1 | Introduction | 92 |
| 9.2 | Geophysics | 95 |
| 9.2.1 | Ground Magnetic Surveys | 95 |
| 9.2.2 | Gradient Array IP Surveys | 97 |
| 9.2.3 | CSAMT Surveys | 98 |
| 9.2.4 | Representivity of Exploration Programs | 98 |
| 10. | Drilling | 100 |
| 10.1 | Interpretation of Drilling Results | 103 |
| 10.1.1 | Escondida | 103 |
| 10.1.1.1 | Escondida Far West | 104 |
| 10.1.1.2 | Escondida West, Central and East | 104 |
| 10.1.1.3 | Escondida Far East | 104 |
| 10.1.1.4 | Martina | 105 |
| 10.1.1.5 | Zoe | 105 |
| 10.1.2 | Gabriela | 105 |
| 10.1.3 | Loma Escondida | 112 |
| 10.1.4 | Nini-Esperanza | 112 |
| 10.1.5 | Carla | 112 |
| 11. | SAMPLE PREPARATION, ANALYSES AND SECURITY | 117 |
| 11.1 | Previous Sampling | 117 |
| 11.2 | Sample Procedures and Protocols | 117 |
| 11.2.1 | Surface Sampling | 117 |
| 11.2.2 | Diamond Drilling | 117 |
| 11.2.3 | RC Percussion Drilling | 118 |
| 11.3 | Density Determination | 119 |
| 11.4 | Sample Preparation and Analysis | 119 |
| 11.4.1 | ACME On-site Sample Preparation Facility | 120 |
| 11.4.2 | ACME Procedures | 120 |
| 11.4.3 | ALS Chemex Procedures | 121 |
| 11.4.4 | Representivity of Metallurgical Sampling | 122 |
| 11.5 | Quality Control | 123 |
| 11.6 | Security | 124 |
| 11.7 | Authors Statement | 124 |
| 12. | Data Verification | 125 |
| 12.1 | QAQC Mincorp | 125 |
| 12.2 | QAQC Exeter / Extorre | 125 |
| 12.2.1 | Geochemical Standards | 125 |
| 12.2.2 | RC Percussion Duplicate Samples | 127 |
| 12.2.3 | Diamond Drilling Duplicate Samples | 127 |
| 12.2.4 | Check Assaying of Samples Greater than 1ppm Au | 129 |
| 12.2.5 | Blanks | 131 |
| 12.2.6 | Twinned Holes | 131 |
| 12.2.7 | Database | 131 |
| 12.3 | Data Verification by Cube | 131 |
| 12.3.1 | Drill Hole Collar Location | 131 |
| 12.3.2 | Database Validation | 132 |
| 12.3.3 | Independent Laboratory Checks | 132 |
| 12.3.4 | Independent Sampling | 134 |
| 12.4 | Author’s Statement | 134 |
| 13. | Mineral Processing and Metallurgical Testing | 135 |
| 13.1 | Introduction | 135 |
| 13.2 | Representivity of Metallurgical Sampling | 136 |
| 13.3 | Testwork Samples | 136 |
| 13.4 | Testwork Water | 137 |
| 13.5 | Testwork Analyses | 137 |
| 13.6 | Mineralization | 137 |
| 13.7 | Comminution | 146 |
| 13.8 | Gravity Concentration | 146 |
| 13.9 | Flotation | 147 |
| 13.10 | Flotation and Gravity Concentrate Treatment | 148 |
| 13.11 | Leaching | 149 |
| 13.12 | Merrill Crowe | 155 |
| 13.13 | Thickening and Filtration | 156 |
| 13.14 | Cyanide Destruction | 160 |
| 13.15 | Metallurgical Recoveries | 160 |
| 14. | Mineral Resource Estimate | 161 |
| 14.1 | Summary | 161 |
| 14.2 | Coordinate Systems | 164 |
| 14.3 | Drilling Database | 164 |
| 14.4 | Resource Estimation | 165 |
| 14.4.1 | Data Types | 165 |
| 14.4.1.1 | Escondida | 165 |
| 14.4.1.2 | Loma Escondida | 165 |
| 14.4.1.3 | Zoe | 166 |
| 14.4.1.4 | Martina | 166 |
| 14.4.1.5 | Carla | 166 |
| 14.4.1.6 | Gabriela | 166 |
| 14.4.1.7 | Nini-Esperanza} | 166 |
| 14.4.1.8 | Deborah | 166 |
| 14.4.2 | Domaining and Volume Modelling | 166 |
| 14.4.2.1 | Escondida and Loma Escondida | 171 |
| 14.4.2.2 | Zoe | 172 |
| 14.4.2.3 | Martina | 172 |
| 14.4.2.4 | Carla | 173 |
| 14.4.2.5 | Gabriela | 174 |
| 14.4.2.6 | Nini-Esperanza | 174 |
| 14.4.2.7 | Deborah | 175 |
| 14.4.3 | Database Coding and Compositing | 175 |
| 14.4.3.1 | Main Zone (MZ+HGZ) | 175 |
| 14.4.3.2 | Stockwork | 175 |
| 14.4.4 | Descriptive Statistics and High Grade Capping | 176 |
| 14.4.5 | Variography | 178 |
| 14.4.5.1 | Main Zone (MZ+HGZ) | 178 |
| 14.4.5.2 | Stockwork | 179 |
| 14.4.6 | Grade Estimation | 179 |
| 14.4.6.1 | Main Zone (MZ+HGZ) | 179 |
| 14.4.6.2 | Stockwork | 179 |
| 14.4.7 | 3D Block Model Definition | 180 |
| 14.4.8 | Bulk Density | 182 |
| 14.4.9 | Oxidation | 183 |
| 14.4.10 | Model Validation | 183 |
| 14.4.11 | Final Model | 188 |
| 14.5 | Resource Classification | 188 |
| 14.5.1 | Escondida | 188 |
| 14.5.2 | Loma Escondida | 189 |
| 14.5.3 | Zoe | 189 |
| 14.5.4 | Martina | 190 |
| 14.5.5 | Carla | 190 |
| 14.5.6 | Gabriela | 190 |
| 14.5.7 | Nini-Esperanza | 191 |
| 14.5.8 | Deborah | 191 |
| 14.6 | Cerro Moro Resource Reporting | 191 |
| 14.7 | Other Factors and Mineral Resources | 193 |
| 15. | Mineral RESERVES Estimate | 194 |
| 16. | Mining Methods | 195 |
| 16.1 | Preliminary Mining Study | 195 |
| 16.1.1 | Summary | 195 |
| 16.1.2 | Open Pit Mining | 198 |
| 16.1.3 | Underground Mining | 202 |
| 16.1.4 | Dilution | 205 |
| 16.1.5 | Cut-Off Grade | 207 |
| 16.1.6 | Underground Mining Inventory | 207 |
| 16.1.7 | Mine Production Schedule | 211 |
| 16.1.7.1 | Mine Schedule at 1,300 tpd (Option A) | 212 |
| 16.1.7.2 | Mine Schedule at 1,150 tpd (Option B) | 215 |
| 16.1.8 | Mobile Mining Fleet | 219 |
| 16.1.9 | Mine Labour | 223 |
| 16.2 | Geotechnical Studies | 224 |
| 16.3 | Hydrology and Hydrogeology | 229 |
| 17. | RECOVERY Methods | 232 |
| 17.1 | Introduction | 232 |
| 17.2 | Crushing Circuit | 232 |
| 17.3 | Crushed Product Storage and Reclaim | 234 |
| 17.4 | Grinding | 234 |
| 17.5 | Flash Flotation and Gravity Concentration | 234 |
| 17.6 | Flotation | 235 |
| 17.7 | Gravity and Flotation Concentrate Handling | 235 |
| 17.8 | Intensive Leaching | 236 |
| 17.9 | Leaching and CCD | 236 |
| 17.10 | Merrill Crowe | 237 |
| 17.11 | Reagents | 237 |
| 17.12 | Cyanide Destruction | 238 |
| 17.13 | Water Services | 239 |
| 17.14 | Air Services | 240 |
| 17.15 | Electrical | 240 |
| 17.16 | Projected Energy, Water, Process Material Requirements | 243 |
| 18. | PROJECT INFRASTURUCTURE | 244 |
| 18.1 | Cerro Moro Site | 244 |
| 18.1.1 | Water Supply | 244 |
| 18.1.2 | Process Plant Earthworks | 244 |
| 18.1.3 | Run of mine (ROM) Area | 245 |
| 18.1.4 | Roads | 245 |
| 18.1.5 | Site Accommodation | 245 |
| 18.1.6 | Power Supply | 245 |
| 18.1.7 | Fuel Storage | 246 |
| 18.1.8 | Potable Water Supply | 247 |
| 18.1.9 | Sewerage Treatment | 247 |
| 18.1.10 | Vehicle Washdown | 247 |
| 18.1.11 | Heavy Vehicle Workshop | 247 |
| 18.1.12 | Administration Office Complex | 247 |
| 18.1.13 | Stores and Plant Maintenance Workshop | 248 |
| 18.1.14 | Communications | 248 |
| 18.2 | Puerto Deseado Facilities | 248 |
| 18.2.1 | Office Facilities | 248 |
| 18.2.2 | Laboratory | 248 |
| 18.3 | Mining Facilities | 249 |
| 18.3.1 | Magazine | 249 |
| 18.3.2 | Workshop | 249 |
| 18.3.3 | Underground Ventilation | 249 |
| 18.3.4 | Refuge and Escape Shaft | 249 |
| 18.4 | Tailings Storage Facility | 249 |
| 18.4.1 | Introduction | 249 |
| 18.4.2 | Methodology | 250 |
| 18.4.3 | Design Criteria | 250 |
| 18.4.4 | Scheduled Costs | 252 |
| 18.4.5 | Tailing Storage Facilities | 252 |
| 18.4.6 | Dams Construction | 253 |
| 18.4.7 | Perimeter Service Roads | 255 |
| 18.4.8 | Waterproofing system | 255 |
| 18.4.9 | Surface water diversion system | 255 |
| 18.4.10 | Control and monitoring system | 255 |
| 18.4.11 | Geotechnical Site Investigations | 256 |
| 18.4.12 | 2011 Geotechnical Campaign (Ausenco) | 256 |
| 18.4.13 | Water Table Presence | 257 |
| 18.4.14 | Laboratory Testing | 257 |
| 18.4.15 | Conclusions | 257 |
| 18.4.16 | Recommendations | 258 |
| 19. | Marketing | 259 |
| 19.1 | Introduction | 259 |
| 19.2 | Market Outlook | 259 |
| 19.3 | Gold Demand | 260 |
| 19.4 | Available Refineries | 261 |
| 19.5 | Exchange (LME) | 261 |
| 19.6 | Shipping | 261 |
| 19.7 | Qualified Person's Statement | 261 |
| 20. | ENVIRONMENTAL STUDIES, PERMITTING AND SOCIAL OR COMMUNITY IMPACT | 263 |
| 20.1 | Environmental Studies | 263 |
| 20.1.1 | Main Environmental Findings | 263 |
| 20.2 | Permitting | 270 |
| 20.3 | Environmental Impact | 271 |
| 20.4 | Social and Community Impact | 272 |
| 20.5 | Environmental Management Plan | 273 |
| 20.6 | Community Relations Plan and Social Responsibility | 274 |
| 21. | CAPITAL AND OPERATING COSTs | 276 |
| 21.1 | Capital | 276 |
| 21.1.1 | Process Plant and Infrastructure | 277 |
| 21.1.2 | Process Plant and Infrastructure Sustaining Capital | 283 |
| 21.1.3 | Mining | 283 |
| 21.2 | Operating | 290 |
| 21.2.1 | Process Plant | 290 |
| 21.2.2 | Mining | 298 |
| 21.2.3 | General and Administrative (G&A) Costs | 303 |
| 22. | ECONOMIC ANALYSIS | 304 |
| 22.1 | Taxes and Royalties | 305 |
| 22.2 | Economic Analysis – 1,300 tpd (Option A) | 305 |
| 22.3 | Economic Analysis – 1,150 tpd (Option B) | 306 |
| 22.4 | Sensitivity Analysis | 315 |
| 23. | Adjacent Properties | 317 |
| 23.1 | Escondida-Formicruz Prospect | 319 |
| 23.2 | Bella Vista Prospect | 320 |
| 23.3 | Veta Olvidada Prospect | 321 |
| 23.4 | Union Domes Prospect | 321 |
| 24. | OTHER RELEVANT DATA | 322 |
| 24.1 | Plant Geotechnical | 322 |
| 24.2 | Operations Project Organisation | 322 |
| 24.3 | Project Implementation | 323 |
| 24.3.1 | Mine Management Team | 323 |
| 24.3.2 | EPCM Project Management Team | 324 |
| 24.3.3 | Development Objective | 324 |
| 24.3.4 | EPCM Services | 324 |
| 24.3.5 | Equipment and Materials Supplies | 325 |
| 24.3.6 | Construction Packages | 326 |
| 24.3.7 | Project Duration | 326 |
| 24.3.8 | Critical Path | 327 |
| 24.3.9 | Engineering Design | 327 |
| 24.3.10 | Equipment Procurement | 327 |
| 24.3.11 | Site Construction Activity | 328 |
| 25. | INTERPRETATION AND CONCLUSIONS | 329 |
| 25.1 | Mineral Resource | 329 |
| 25.2 | Risks and Uncertainties | 330 |
| 25.3 | Mining Studies | 330 |
| 25.4 | Metallurgical Processing | 331 |
| 25.5 | Preliminary Economic Assessment Results | 331 |
| 26. | Recommendations | 333 |
| 26.1 | Drilling | 333 |
| 26.2 | Mining | 333 |
| 26.3 | Infrastructure | 334 |
| 26.4 | Metallurgical Testwork | 334 |
| 26.5 | Site Geotechnical | 335 |
| 26.6 | Risk Assessment | 335 |
| 26.7 | Proposed Budget | 335 |
| 27. | References | 336 |
LIST OF FIGURES
| Figure 1 | Location and Access Map (Source Extorre, 2011) | 30 |
| Figure 2 | Conceptual Mine Development for Cerro Moro (Source: NCL, 2011) | 37 |
| Figure 3 | Overhead Powerline Route to Cerro Moro (Source: SIEyE, 2012) | 40 |
| Figure 4 | Location and Access Map (Source: Extorre, 2011) | 59 |
| Figure 5 | Exeter Property Tenement Map (Source: Exeter, 2009a) | 60 |
| Figure 6 | Fomicruz Property Tenement Map (Source: Extorre, 2011) | 63 |
| Figure 7 | Regional Geology and Schematic Columnar Section (Source: Extorre, 2011) | 72 |
| Figure 8 | Interpreted Geology and Vein Location Map (Source: Extorre, 2011) | 75 |
| Figure 9 | Legend for Figure 8 (Part 1 of 3) | 76 |
| Figure 10 | Legend for Figure 8 (Part 2 of 3) | 77 |
| Figure 11 | Legend for Figure 8 (Part 3 of 3) | 78 |
| Figure 12 | Geological Summary Map (Source: Extorre, 2011) | 79 |
| Figure 13 | Cerro Moro Prospect Locations (Source: Extorre, 2011) | 80 |
| Figure 14 | Cerro Moro Ground Magnetics – Reduced to Pole (RTP) Image (Source: Extorre 2010) | 96 |
| Figure 15 | Escondida to Bellavista – Chargeability Data (Source: Extorre 2010) | 97 |
| Figure 16 | Escondida to Bellavista – Resistivity Data (Source: Extorre 2010) | 98 |
| Figure 17 | Drill Collars and Prospects Location Map (Source: Extorre 2011) | 102 |
| Figure 18 | Escondida Total Project Longitudinal Projection - Octoberl 2011 Drilling (Local Grid) | 106 |
| Figure 19 | Escondida Far West Shoot - Schematic Cross-Section 29502E (Local Grid) | 107 |
| Figure 20 | Escondida West Shoot - Schematic Cross-Section 30117E (Local Grid) | 108 |
| Figure 21 | Escondida Central Shoot - Schematic Cross-Section 30475E (Local Grid) | 109 |
| Figure 22 | Martina Project - October 2011 Drilling - Vertical Section - AuEq*TW ppm | 110 |
| Figure 23 | Zoe Project - October 2011 Drilling - Vertical Section - AuEq*TW ppm | 111 |
| Figure 24 | Gabiela Project - October 2011 Drilling - Vertical Section - AuEq*TW ppm | 113 |
| Figure 25 | Loma Escondida Project - October 2011 Drilling - Vertical Section - AuEq*TW ppm | 114 |
| Figure 26 | Nini Esperanza Project - October 2011 Drilling - Vertical Section - AuEq*TW ppm | 115 |
| Figure 27 | Carla Project - October 2011 Drilling - Vertical Section - AuEq*TW ppm | 116 |
| Figure 28 | Escondida –Metallurgical Sampling Locations | 122 |
| Figure 29 | Loma Escondida – Metallurgical Sampling Locations | 123 |
| Figure 30 | Gabriela – Metallurgical Sampling Locations | 123 |
| Figure 31 | Esperanza – Metallurgical Sampling Locations | 123 |
| Figure 32 | Diamond Duplicate Samples vs Original Sample – Au ppm | 127 |
| Figure 33 | Diamond Duplicate Samples vs Original Sample – Ag ppm by Code G1D-ES | 128 |
| Figure 34 | Diamond Duplicate Samples vs Original Sample – Ag ppm by Code 8TD | 128 |
| Figure 35 | Diamond Duplicate Samples vs Original Sample – Ag ppm by Code G6 GRAV | 129 |
| Figure 36 | ACME Re-assays of diamond samples greater than 1 Au ppm | 130 |
| Figure 37 | ACME Re-assays of geochemical standards greater than 1 Au ppm | 130 |
| Figure 38 | Laboratory Checks - ACME vs Genalysis - Au ppm | 133 |
| Figure 39 | Laboratory Checks - ACME vs Genalysis - Ag ppm | 133 |
| Figure 40 | Zoe Drillhole MD1351 Showing Independent Sampling Interval | 134 |
| Figure 41 | 20 µm electrum(white) at galena/pyrite contact, also sphalerite | 139 |
| Figure 42 | 50 µm argentian gold within coarse pyrite also containing galena | 140 |
| Figure 43 | Electrum of 6 µm in chalcopyrite enclosed by 100 micron acanthite | 140 |
| Figure 44 | Two electrums (63% silver) 5 and 10 µm in pyrite, composite with sphalerite and jalpaite, also titanium oxide. | 141 |
| Figure 45 | Zoned electrum from 5 to 100 µm composite with acanthite, sphalerite and chalcopyrite. | 142 |
| Figure 46 | Electrum of 10 µm in acanthite in sphalerite | 142 |
| Figure 47 | Effect of Primary Grind Size on Flotation-Gravity Tail Leach – Escondida Central | 152 |
| Figure 48 | Effect of Primary Grind Size on Gravity Tail Leach – Escondida Central | 153 |
| Figure 49 | Effect of Primary Grind Size on Flotation - Gravity Tail Leach – Escondida Far West | 154 |
| Figure 50 | Leach Tailing Particle Size Distribution | 157 |
| Figure 51 | Filter cakes from tests showing plasticine nature. | 158 |
| Figure 52 | Escondida Drillhole MD633 Showing Styles of Mineralization | 167 |
| Figure 53 | Escondida Central – Quartz Float and Sub-Outcrop | 168 |
| Figure 54 | Escondida Main Zones - Gold Indicator Thresholds – Log-Probability Plot | 169 |
| Figure 55 | Escondida Main Zones – Geological Composites – Au ppm – Indicators - Long Section | 170 |
| Figure 56 | Escondida Central-East Zone – HGZ Indicator Probability Map | 170 |
| Figure 57 | Escondida Central-East Zone – Simulated Domains | 171 |
| Figure 58 | Escondida and Loma Escondida Main Epithermal Vein Zones – Plan View (Source: Cube, 2011) | 172 |
| Figure 59 | Zoe Vein Structures – Plan View (Source: Cube, 2011) | 172 |
| Figure 60 | Martina Vein Structures – Plan View (Source: Cube, 2011) | 173 |
| Figure 61 | Carla Vein Structures – Plan View (Source: Cube, 2011) | 173 |
| Figure 62 | Gabriela Main Epithermal Vein Zone – Plan View (Source: Cube, 2011) | 174 |
| Figure 63 | Nini-Esperanza Vein Structures – Plan View (Source: Cube, 2011) | 174 |
| Figure 64 | Deborah Main Epithermal Vein Zone – Plan View (Source: Cube, 2011) | 175 |
| Figure 65 | Escondida Main Zones (MZ+HGZ) – Composites vs Model Grades – Au ppm | 184 |
| Figure 66 | Escondida Main Zones (MZ+HGZ) – Composites vs Model Grades – Ag ppm | 184 |
| Figure 67 | Loma Escondida Main Zone (MZ+HGZ) – Composites vs Model Grades – Au ppm | 184 |
| Figure 68 | Loma Escondida Main Zone (MZ+HGZ) – Composites vs Model Grades – Ag ppm | 184 |
| Figure 69 | Zoe Main Vein– Composites vs Model Grades – Au ppm | 185 |
| Figure 70 | Zoe Main Vein– Composites vs Model Grades – Ag ppm | 185 |
| Figure 71 | Martina Main Vein– Composites vs Model Grades – Au ppm | 185 |
| Figure 72 | Martina Main Vein– Composites vs Model Grades – Ag ppm | 186 |
| Figure 73 | Carla Main Vein– Composites vs Model Grades – Au ppm | 186 |
| Figure 74 | Carla Main Vein– Composites vs Model Grades – Ag ppm | 186 |
| Figure 75 | Gabriela Main Zone – Composites vs Model Grades – Au ppm | 187 |
| Figure 76 | Gabriela Main Zone – Composites vs Model Grades – Ag ppm | 187 |
| Figure 77 | Nini-Esperanza Main Vein– Composites vs Model Grades – Au ppm | 187 |
| Figure 78 | Nini-Esperanza Main Vein– Composites vs Model Grades – Ag ppm | 187 |
| Figure 79 | Deborah Main Zone – Composites vs Model Grades – Au ppm | 188 |
| Figure 80 | Deborah Main Zone – Composites vs Model Grades – Ag ppm | 188 |
| Figure 81 | Escondida Main Zones – Resource Classification | 189 |
| Figure 82 | Loma Escondida Main Zone – Resource Classification | 189 |
| | |
| Figure 83 | Zoe Main Vein – Resource Classification | 190 |
| Figure 84 | Gabriela Main Zone – Resource Classification | 191 |
| Figure 85 | Conceptual Mine Development for Cerro Moro (Source: NCL, 2011) | 196 |
| Figure 86 | Conceptual Mine Development for Escondida (Source: NCL, 2011) | 197 |
| Figure 87 | Escondida Open Pits (Source: NCL, 2011) | 200 |
| Figure 88 | Gabriela Open Pits (Source: NCL, 2011) | 201 |
| Figure 89 | Nini-Esperanza Open Pits (Source: NCL, 2011) | 201 |
| Figure 90 | Deborah Open Pits (Source: NCL, 2011) | 202 |
| Figure 91 | Mining Method – Bench & Fill (Source: NCL, 2011) | 204 |
| Figure 92 | Bench & Fill – Split Blasting (Source: NCL, 2011) | 204 |
| Figure 93 | Bench & Fill - Sequence (Source: NCL, 2011) | 205 |
| Figure 94 | Underground Dilution Estimation (Source: NCL, 2011) | 206 |
| Figure 95 | Escondida West Mine Resources – Vertical Section | 208 |
| Figure 96 | Positive and Negative Mining Units (Source: NCL, 2011) | 208 |
| Figure 97 | Escondida Schematic Underground Layout (Source: NCL, 2011) | 209 |
| Figure 98 | Zoe Schematic Underground Layout (Source: NCL, 2011) | 210 |
| Figure 99 | Martina Schematic Underground Layout (Source: NCL, 2011) | 210 |
| Figure 100 | Gabriela Schematic Underground Layout (Source: NCL, 2011) | 211 |
| Figure 101 | Overall Flowsheet (Source: GRES, 2011) | 233 |
| Figure 102 | Proposed power line route for the Project | 246 |
| Figure 103 | Construction stages | 253 |
| Figure 104 | Dam crest diagram | 254 |
| Figure 105 | Geomembrane anchoring detail | 254 |
| Figure 106 | Transition between stages | 254 |
| Figure 107 | Perimeter road | 255 |
| Figure 108 | Location of the test pits | 256 |
| Figure 109 | Tailings Storage Facility conceptual view | 258 |
| Figure 110 | Gold Spot Price – January 29, 2011 to January 31, 2012 (Source: www.kitco.com) | 260 |
| Figure 111 | Silver Spot Price – January 29, 2011 to January 31, 2012 (Source: www.kitco.com) | 260 |
| Figure 112 | Fomicruz Properties Location (Source: Exeter, 2009a) | 317 |
| Figure 113 | Drilling Completed at Escondida (Fomicruz Extension), Bella Vista, and Veta Olvidada with Ground Magnetic Data (RTP) (Source:Extorre, 2011) | 319 |
| Figure 114 | Escondida-Fomicruz Prospect – Drill Hole Locations (Source: Cube 2011) | 320 |
LIST OF TABLES
| Table 1 | Summary of Exploration Work undertaken by Extorre - Jan 2011 to Jan 2012 | 32 |
| Table 2 | Cerro Moro Indicated Mineral Resources above 1 ppm Gold Equivalent | 33 |
| Table 3 | Cerro Moro Inferred Mineral Resources above 1 ppm Gold Equivalent | 33 |
| Table 4 | Mine Schedule Summary for 1,300 tpd (Option A) | 35 |
| Table 5 | Mine Schedule Summary for 1,150 tpd (Option B) | 36 |
| Table 6 | Schedule of the filing of the Environmental Impact Assessment (EIA) | 43 |
| Table 7 | Mine, Process Plant and Infrastructure CAPEX Summary (1,300 tpd Option A) | 44 |
| Table 8 | Mine, Process Plant and Infrastructure CAPEX Summary (1,150 tpd, Option B) | 45 |
| Table 9 | Process Plant Total Capex and Operating Cost Summary – 1,300 tpd Option A | 46 |
| Table 10 | Process Plant Total Capex and Operating Cost Summary – 1,150 tpd Option B | 47 |
| Table 11 | Mining CAPEX and OPEX Summary – 1,300 tpd Option A | 48 |
| Table 12 | Mining CAPEX and OPEX Summary – 1,150 tpd Option B | 49 |
| Table 13 | Economical Evaluation Results Summary (1,300 tpd) | 50 |
| Table 14 | Economical Evaluation Results Summary (1,150 tpd) | 51 |
| Table 15 | Economical Evaluation Results Summary (1,300 tpd & 1,150 tpd) | 54 |
| Table 16 | Technical Report Responsibility Matrix | 57 |
| Table 17 | Frequently used acronyms and abbreviations | 57 |
| Table 18 | Cerro Moro Tenements (Source Extorre, 2011) | 62 |
| Table 19 | Schedule of the filing of the Environmental Impact Assessments (EIAs) | 65 |
| Table 20 | Summary of Exploration Work undertaken by Exeter Prior to 2009 | 92 |
| Table 21 | Summary of Exploration Work undertaken between January, 2009 and December, 2010 | 94 |
| Table 22 | Summary of Exploration Work undertaken by Extorre to January 31, 2012 | 95 |
| Table 23 | Drilling Details for Cerro Moro at January 31, 2012 | 102 |
| Table 24 | Zoe Drillhole MD1351 Independent Sampling Results | 134 |
| Table 25 | Summary of flash flotation & gravity concentrate mineralogy findings (Escondida & Gabriela) | 144 |
| Table 26 | Liberation and composite details for Acanthite (Ag2S) in leach tailing (Escondida) | 145 |
| Table 27 | Test work results showing overall extractions for gold and silver using the flash flotation, gravity and cyanide leach flow sheet | 150 |
| Table 28 | Test work results showing overall extractions for gold and silver using the flash flotation, gravity and flotation flow sheet | 151 |
| Table 29 | Test work results showing overall extractions for gold and silver using the flash flotation, gravity, flotation and cyanide leach flow sheet | 151 |
| Table 30 | Critical Design Data for Merrill Crowe Circuit | 156 |
| Table 31 | Summary of Initial Thickening Test Work | 157 |
| Table 32 | Summary of Initial Filtration Test Work | 157 |
| Table 33 | Summary of Cyanide Destruction Test Work | 160 |
| Table 34 | Cerro Moro Indicated Mineral Resources above 1 ppm Gold Equivalent | 164 |
| Table 35 | Cerro Moro Inferred Mineral Resources above 1 ppm Gold Equivalent | 164 |
| Table 36 | Database - Numerical Equivalent Values for Below Detection Values | 165 |
| Table 37 | Escondida Main Zones - Summary Statistics – Geological Composites | 176 |
| Table 38 | Loma Escondida Main Zone - Summary Statistics – Geological Composites | 177 |
| Table 39 | Zoe Main Zone - Summary Statistics – Geological Composites | 177 |
| Table 40 | Martina Main Zone - Summary Statistics – Geological Composites | 177 |
| Table 41 | Carla Main Zone - Summary Statistics – Geological Composites | 177 |
| Table 42 | Gabriela Main Zone - Summary Statistics – Geological Composites | 177 |
| Table 43 | Nini-Esperanza Main Zone - Summary Statistics – Geological Composites | 178 |
| Table 44 | Deborah Main Zone - Summary Statistics – Geological Composites | 178 |
| Table 45 | Main Zones – Estimation Parameters | 179 |
| Table 46 | Stockwork Zones – Estimation Parameters | 180 |
| Table 47 | Escondida and Loma Escondida 3D Block Model Definition | 180 |
| Table 48 | Zoe 3D Block Model Definition | 180 |
| Table 49 | Martina 3D Block Model Definition | 181 |
| Table 50 | Carla 3D Block Model Definition | 181 |
| Table 51 | Gabriela 3D Block Model Definition | 181 |
| Table 52 | Nini-Esperanza 3D Block Model Definition | 181 |
| Table 53 | Deborah 3D Block Model Definition | 181 |
| Table 54 | Block Model Attribute Names | 182 |
| Table 55 | List of Domain Codes | 182 |
| Table 56 | Density Values | 183 |
| Table 57 | Cerro Moro Main Zones - De-Clustered Composite vs Model Grade | 183 |
| Table 58 | Cerro Moro Indicated Mineral Resources above 1 ppm Gold Equivalent | 191 |
| Table 59 | Cerro Moro Inferred Mineral Resources above 1 ppm Gold Equivalent | 192 |
| Table 60 | Mineral Inventory Summary by Sector | 198 |
| Table 61 | Pit Optimization Parameters | 199 |
| Table 62 | Pit Optimization Results | 199 |
| Table 63 | Final Pits Summary | 200 |
| Table 64 | Dilution Criteria | 206 |
| Table 65 | Underground Mining Inventory Summary | 209 |
| Table 66 | General Mining Sequence (1,300 tpd) | 212 |
| Table 67 | Mine Production Schedule (1,300 tpd) | 213 |
| Table 68 | Mine Plan and Plant Feed at 1,300tpd | 215 |
| Table 69 | General Mining Sequence (1,150 tpd) | 216 |
| Table 70 | Mine Production Schedule (1,150 tpd) | 217 |
| Table 71 | Mine Plan and Plant Feed at 1,150tpd | 219 |
| Table 72 | Open Pit Mining Equipment Requirement | 220 |
| Table 73 | Underground Mining Equipment Requirement | 222 |
| Table 74 | Open Pit Operators | 223 |
| Table 75 | Open Pit Maintenance | 223 |
| Table 76 | Underground Operators & Maintenance | 223 |
| Table 77 | Indirect Personnel | 224 |
| Table 78 | Final design angles for the pits at Cerro Moro | 225 |
| Table 79 | Maximum length of the open stope for the different mines of the Project | 227 |
| Table 80 | Details of reagent systems | 238 |
| Table 81 | Projected Energy, Water and Material Requirements | 243 |
| Table 82 | TSF Design Criteria | 251 |
| Table 83 | TSF Scheduled Costs | 252 |
| Table 84 | Forecast Annual Production | 259 |
| Table 85 | Main findings of the ABA test work program | 264 |
| Table 86 | Schedule of the filing of the Environmental Impact Assessment (EIA) | 271 |
| Table 87 | Overall Capital Costs (1,300 tpd option) | 276 |
| Table 88 | Overall Capital Costs (1,150 tpd option) | 277 |
| Table 89 | Capital Cost Summary by Discipline (1,300 tpd Option) | 279 |
| Table 90 | Capital Cost Summary by Discipline (1,150 tpd Option) | 280 |
| Table 91 | Capital Cost Summary by Area (1,300 tpd Option) | 281 |
| Table 92 | Capital Cost Summary by Area (1,150 tpd Option) | 282 |
| Table 93 | Open Pit Capital Cost (1,300 tpd option) | 284 |
| Table 94 | Open Pit Capital Cost (1,150 tpd option) | 285 |
| Table 95 | Underground Capital Cost Summary (MUS$) – 1,300 tpd option | 286 |
| Table 96 | Development Capital Cost – 1,300 tpd option | 286 |
| Table 97 | Underground Equipment Capital Cost – 1,300 tpd option | 287 |
| Table 98 | Underground Infrastructure and Services Capital Cost – 1,300 tpd option | 288 |
| Table 99 | Underground Capital Cost Summary (MUS$) – 1,150 tpd option | 288 |
| Table 100 | Development Capital Cost – 1,150 tpd option | 289 |
| Table 101 | Underground Equipment Capital Cost – 1,150 tpd option | 289 |
| Table 102 | Underground Infrastructure and Services Capital Cost – 1,150 tpd option | 290 |
| Table 103 | Operating Cost Estimate by Cost Centre (1,300 tpd option) | 291 |
| Table 104 | Operating Cost Estimate by Cost Area (1,300 tpd option) | 292 |
| Table 105 | Operating Cost Estimate by Cost Centre (1,150 tpd option) | 293 |
| Table 106 | Operating Cost Estimate by Cost Centre (1,150 tpd option) | 294 |
| Table 107 | Labour Cost Estimate Breakdown. | 295 |
| Table 108 | Power Cost Estimate Breakdown. | 296 |
| Table 109 | Reagents and Grinding Media Cost Estimate Input Breakdown | 297 |
| Table 110 | Linings Cost Estimate Breakdown. | 298 |
| Table 111 | Open Pit Operating Cost (US$) – 1,300 tpd option | 299 |
| Table 112 | Open Pit Operating Cost (US$/t ROM) – 1,300 tpd option | 299 |
| Table 113 | Underground Mine Operating Cost (US$) – 1,300 tpd option | 300 |
| Table 114 | Underground Mine Operating Cost (US$/t) – 1,300 tpd option | 300 |
| Table 115 | Open Pit Operating Cost (US$) – 1,150 tpd option | 301 |
| Table 116 | Open Pit Operating Cost (US$/t ROM) – 1,150 tpd option | 301 |
| Table 117 | Underground Mine Operating Cost (US$) – 1,150 tpd option | 302 |
| Table 118 | Underground Mine Operating Cost (US$/t) – 1,150 tpd option | 302 |
| Table 119 | Economical Model General Parameters | 303 |
| Table 120 | Economical Evaluation Results Summary (1,300 tpd) | 305 |
| Table 121 | Economical Evaluation Results Summary (1,150 tpd) | 306 |
| Table 122 | Cash Flow Economical Model for 1,300 tpd option | 307 |
| Table 123 | Cash Flow Economical Model for 1,150 tpd option | 311 |
| Table 124 | Sensitivity – Gold Price and Discount Rate (1,300 tpd option) | 315 |
| Table 125 | Sensitivity – Gold Price and Operating Cost (1,300 tpd option) | 315 |
| Table 126 | Sensitivity – Gold Price and Capital Cost (1,300 tpd option) | 315 |
| Table 127 | Sensitivity – Gold Price and Discount Rate (1,150 tpd option) | 316 |
| Table 128 | Sensitivity – Gold Price and Operating Cost (1,150 tpd option) | 316 |
| Table 129 | Sensitivity – Gold Price and Capital Cost (1,150 tpd option) | 316 |
| Table 130 | Drilling Completed in Fomicruz Properties (Source: Extorre, 2011) | 319 |
| Table 131 | Economical Evaluation Results Summary (1,300 tpd) | 332 |
| Table 132 | Economical Evaluation Results Summary (1,150 tpd) | 332 |
This technical report describes the Cerro Moro Gold-Silver Project (the “Project” or “Cerro Moro”), which is located in the Deseado Department, Santa Cruz Province, Argentina. The Project is held by Extorre Gold Mines Limited (“Extorre”) through its local subsidiary Estelar Resources Ltd (“Estelar”).
Cerro Moro consists of a series of low- to immediate-sulfidation epithermal-style veins with locally high grade gold-silver mineralization, especially in the Escondida zone. To date, National Instrument 43-101 Standards for Disclosure of Mineral Projects (“NI 43-101”) compliant mineral resources have been delineated in a total of 8 sectors (Escondida, Loma Escondida, Zoe, Martina, Carla, Esperanza-Nini, Gabriela, and Deborah) all of which are located within the central portion of the Cerro Moro tenements. This technical report considers the potential development options for the Project and is based upon the November, 2011, NI 43-101-compliant mineral resource estimate as prepared by Cube Consulting Pty Ltd.
Extraction of the mineral inventory at Cerro Moro could potentially be achieved using a combination of open pit and underground (bench-and-fill) mining techniques. Treatment of the mineral inventory is proposed through a processing plant that includes a standard crushing / milling circuit, flotation and gravity recovery stages, and a Merrill Crowe (zinc cementation) circuit for the recovery of precious metals from leach solutions. Throughput rates of 1,300 tonnes per day (Option A) and 1,150 tonnes per day (Option B) are considered and compared. Metallurgical testwork completed to date has indicated very high recoveries of both gold (95%) and silver (93%) from Cerro Moro mineralization. The projected precious metal production over the life of the Project is 848,000 ounces of gold and 47.2 million ounces of silver, with economic modelling (using the base case metal price assumptions of $US 1,320 / ounce for gold and $US 26 / ounce for silver) indicating that gold is expected to contribute approximately 48% of the projected future revenue stream for Cerro Moro and silver the remaining 52%.
NCL Ingeniería y Construcción Ltda. (“NCL”) was responsible for the compilation of information and preparation of the overall study. Significant contributions were also received from Cube Consulting Pty Ltd. (“Cube”; Geology and Mineral Resource Estimates), GR Engineering Services Ltd. (“GRES”; Metallurgy and Process Plant Design), and Ausenco Vector (“Ausenco”; Environmental, Hydrology, and Tailings Storage Facility).
The Cerro Moro Project comprises eighteen tenements covering an area of approximately 177 square kilometers. Sixteen of these tenements are mining claims (Manifestaciones de Descubrimiento), with the remaining two being exploration claims (Cateos de Exploracion). The Cerro Moro concessions are currently held 100% by Estelar, and are subject to a 2% NSR payable to Cerro Vanguardia SA on any future metal production. Provincial mining entity Fomicruz also possesses the right to receive a 5% participating interest in the Project once all permits required to begin production are received.
Extorre Gold Mines Limited
Cerro Moro Gold – Silver Project
Preliminary Economic Assessment | Page 29 |
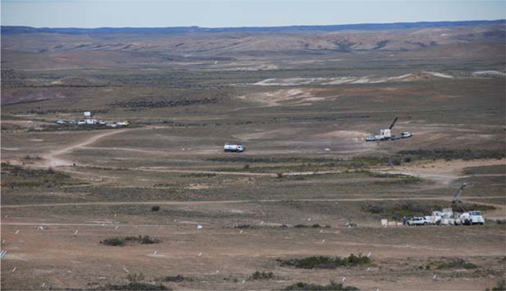
The Project is located 70 km (90 km by road) southwest of the port city of Puerto Deseado, Santa Cruz Province, southern Argentina (Figure 1). The Project area is geographically centred at approximately 48° 01’ 55” south latitude and 66° 33’ 45” west longitude. Access to the Project is via 20 km of paved road (Provincial Highway 281) from Puerto Deseado to the locality of Tellier, followed by 70 km of all-weather gravel road (Provincial Route 47) to the Project turnoff. The Project area is characterized by low altitudes (70 m to 150 m above mean sea level), flat to undulating relief, and a cool, dry climate typical of the Patagonian pampa (plains).

Figure 1 Location and Access Map (Source Extorre, 2011)
Extorre Gold Mines Limited
Cerro Moro Gold – Silver Project
Preliminary Economic Assessment | Page 30 |
| 1.3 | Geology and Mineralization |
The polymetallic gold-silver mineralization at Cerro Moro is of the low- to intermediate-sulphidation epithermal vein type. Individual prospects vary from simple, single veins to complex vein systems with spur and cymoid loop structures. Limited quartz stockwork veinlets are also present peripheral to the main veins.
The mineralization is hosted in sub-volcanic and volcanic rocks, which are interpreted to belong to the Jurassic age Chon Aike and La Matilde Formations. In general, the Project area is composed of many structural blocks produced by a conjugate set of north-west and north-east faults. Both fault directions contain mineralized quartz veins. In the eastern and central part of the Project, north-easterly trending faults control the mineralization at the Deborah, Belen, Maria, Michelle, Barbara and Ana prospects. In the central and western part of the Project, north-westerly trending structures are the dominant control to the mineralization at the Escondida, Carla, Esperanza, Nini, Gabriela, Carolene, Lucia, Dora, Moro, Florencia, Natalia, Tres Lomas and Lala prospects. The Escondida Structure has a much larger segment of east west strike in the area of the recently discovered Zoe Shoot. Several secondary east-west structures occur between the primary north-west structures, and these control the mineralization at the Patricia, Loma Escondida and Carlita prospects. The width of the veins varies generally from 1 to 5 m, but veins may locally attain widths of up to 10 m. The strike length of individual veins is variable, generally between 200 m and 1 kilometre. The Escondida structure has been defined by drilling for more than 8 km, and remains open along strike and also at depth.
Improved geological, structural and mineralization models developed over the past two years have led to the discovery of numerous high-grade gold-silver polymetallic veins at Cerro Moro. These base metal anomalous Au-Ag veins tend to be recessive and are represented on the surface by either very poorly outcropping quartz vein material or none at all. Extensive cover of Tertiary marine sediments and Quaternary gravels also hinder the location or extensions of some of the veins and targets. Detailed ground magnetic survey data, coupled with IP and resistivity data, has highlighted potential targets that are initially tested via trenching and/or scout drilling, as in the case of the Escondida prospect.
Presently structures in northwest-southeast and east-west orientation are the preferred exploration targets, the latter orientation being interpreted to be due to tensional, pull apart structures resulting from minor strike-slip movement of the larger north-west structures.
The discontinuous mineralized shoots within the larger structures appear to be locally controlled by changes in strike, which are thought to have produced dilational flexures and jogs allowing for greater fluid flow. Changes in wall-rock lithology, along the structures, may be an important factor in controlling the local strike direction of the structures. It has also been noted that the brittle, felsic units have a tendency to produce stronger stockwork style development around the main structures than the intermediate units.
Extorre Gold Mines Limited
Cerro Moro Gold – Silver Project
Preliminary Economic Assessment | Page 31 |
Exploration activities at the Project typically include a combination of geological mapping, geochemical sampling, geophysical surveys, and drilling. The exploration works completed since December 2010 include infill drilling and exploration drilling, Table 1 chronologically summarizes all exploration work undertaken since 1st January 2011 up until 31st January 2012.
| Date | | Extorre Exploration Works |
| Jan 2011 | | Complete infill drilling Martina, Loma Escondida, Gabriela with the aim to convert Inferred resource category mineralization to higher confidence categories. Exploration drilling to extend Lucia, Gabriela Loma Escondida and Esperanza. Scout drilling at Carolene |
| Feb 2011 to end March 2011 | | Exploration drilling to extend Gabriela, Esperanza- Nini, Escondida far west, Michelle, Loma Escondida. Scout drilling Agostina Gabriela NW, Belen and Zoe (discovery of Zoe) Regional drilling Union domes |
| April 2011 to end May 2011 | | Infill drilling at Carla and Gabriela SE. Exploration drilling at Zoe, Tres Lomas and Gabriela. Scout drilling Agostina, Deborah parallel, Loma Escondida and Zoe extensions |
| June 2011 to Jan 2012 | | Infill drilling at Zoe, Carla, and Gabriela. Exploration drilling at Zoe, Tres Lomas, Esperanza, Escondida, Loma Escondida and Gabriela. Scout drilling Carlita, Lala, Deborah parallel, Deborah Termination Structure, Mosquito, Alejandra, Romina, Lechuzo and Belen. |
Table 1 Summary of Exploration Work undertaken by Extorre - Jan 2011 to Jan 2012
| 1.5 | Mineral Resource Estimation |
This technical report includes mineral resources that are not mineral reserves and therefore do not have demonstrated economic viability.
The November 2011 mineral resource estimate for the Project is the third undertaken by Cube Consulting (“Cube”) of Perth, and supersedes a previous estimate that was announced on August 4, 2011. The mineral resource estimates were prepared by Mr. Ted Coupland, MAusIMM (CP), Director and Principal Geostatistician of Cube. Mineral resources have been classified and reported in accordance with the CIM guidelines (CIM 2011) and NI 43-101. Mr. Ted Coupland is ‘independent’ and a ‘qualified person’ as defined by NI 43-101.
Updated mineral resource estimates were compiled for the Gabriela and Esperanza prospects and maiden mineral resource estimates were compiled for the Zoe, Martina, Carla and Nini prospects. No changes have been made to the existing Escondida, Loma Escondida and Deborah mineral resource estimates.
All drilling data available as of October 10, 2011 was used for the November 2011 mineral resource estimation. Additional drilling data received subsequent to this date including geological logging and core photography was used to validate the geological interpretations where possible.
Extorre Gold Mines Limited
Cerro Moro Gold – Silver Project
Preliminary Economic Assessment | Page 32 |
Cube has classified a substantial proportion of the Cerro Moro mineral resources as “Indicated” where drill spacing is sufficient to demonstrate acceptable confidence in the geometry, continuity and grade of the mineralized zones. Surrounding areas have been classified as Inferred where drill spacing is wider or where unresolved geological complexity exists.
A summary of the Cerro Moro Indicated and Inferred mineral resources above a cut-off of 1 ppm gold equivalent are shown in Table 2 and Table 3 respectively.
| Zone | | Tonnes | | | Gold (ppm) | | | Silver (ppm) | | | Gold Equivalent
Grade* (ppm) | | | Gold
(ounces) | | | Silver (ounces) | | | Gold Equivalent
Ounces** | |
| Escondida | | | 620,000 | | | | 18.8 | | | | 829.2 | | | | 35.4 | | | | 374,000 | | | | 16,530,000 | | | | 705,000 | |
| Loma Esc | | | 44,000 | | | | 18.4 | | | | 919.5 | | | | 36.8 | | | | 26,000 | | | | 1,297,000 | | | | 52,000 | |
| Gabriela | | | 1,642,000 | | | | 1.5 | | | | 226.1 | | | | 6.0 | | | | 79,000 | | | | 11,936,000 | | | | 318,000 | |
| Zoe | | | 105,000 | | | | 27.2 | | | | 2,614.5 | | | | 79.5 | | | | 91,000 | | | | 8,798,000 | | | | 267,000 | |
| Carla | | | 15,000 | | | | 16.0 | | | | 701.2 | | | | 30.0 | | | | 7,000 | | | | 327,000 | | | | 14,000 | |
| Total | | | 2,425,000 | | | | 7.4 | | | | 498.8 | | | | 17.4 | | | | 578,000 | | | | 38,888,000 | | | | 1,356,000 | |
Table 2 Cerro Moro Indicated Mineral Resources above 1 ppm Gold Equivalent
| Zone | | Tonnes | | | Gold (ppm) | | | Silver (ppm) | | | Gold Equivalent
Grade* (ppm) | | | Gold
(ounces) | | | Silver (ounces) | | | Gold Equivalent
Ounces** | |
| Escondida | | | 508,000 | | | | 4.3 | | | | 164.8 | | | | 7.6 | | | | 70,000 | | | | 2,689,000 | | | | 123,000 | |
| Loma Esc | | | 13,000 | | | | 9.7 | | | | 595.4 | | | | 21.6 | | | | 4,000 | | | | 256,000 | | | | 9,000 | |
| Zoe | | | 1,248,000 | | | | 4.1 | | | | 280.3 | | | | 9.8 | | | | 167,000 | | | | 11,250,000 | | | | 391,000 | |
| Martina | | | 293,000 | | | | 13.0 | | | | 60.3 | | | | 14.2 | | | | 123,000 | | | | 568,000 | | | | 134,000 | |
| Carla | | | 2,000 | | | | 9.5 | | | | 390.4 | | | | 17.3 | | | | 1,000 | | | | 29,000 | | | | 1,000 | |
| Gabriela | | | 331,000 | | | | 1.3 | | | | 219.7 | | | | 5.7 | | | | 14,000 | | | | 2,336,000 | | | | 61,000 | |
| Esperanza-Nini | | | 1,773,000 | | | | 1.8 | | | | 144.3 | | | | 4.7 | | | | 105,000 | | | | 8,226,000 | | | | 270,000 | |
| Deborah | | | 578,000 | | | | 2.4 | | | | 48.1 | | | | 3.4 | | | | 45,000 | | | | 894,000 | | | | 62,000 | |
| Total | | | 4,747,000 | | | | 3.5 | | | | 172.0 | | | | 6.9 | | | | 528,0000 | | | | 26,249,000 | | | | 1,053,000 | |
Table 3 Cerro Moro Inferred Mineral Resources above 1 ppm Gold Equivalent
*Gold equivalent values have been calculated by Extorre on the basis of the following parameters:
| — | Long term gold price US$1,320/Oz |
| — | Long term silver price US$26/Oz |
| — | Metallurgical recovery gold 100% |
| — | Metallurgical recovery silver 100% |
The gold equivalent grade is calculated by dividing the silver grade (ppm) by 50 (approximate ratio of gold/silver US$ value) and adding it to the gold grade (ppm).
**The gold equivalent ounces are calculated by dividing the total silver ounces by 50 and adding this value to the total gold ounces.
Extorre Gold Mines Limited
Cerro Moro Gold – Silver Project
Preliminary Economic Assessment | Page 33 |
| 1.6 | Preliminary Mining Studies |
This study is based on Cube’s November, 2011, mineral resource statement for Cerro Moro which includes both Indicated and Inferred Category Mineral Resources.
The reader is cautioned that the mining study is a preliminary assessment and it includes inferred mineral resources that are considered too speculative geologically to have the economic considerations applied to them that would enable them to be categorized as mineral reserves. There is no certainty that the preliminary assessment will be realized. No Mineral Reserves have been estimated.
The mining study utilizes a combination of open pit and underground mining methods. The pit underground interface is determined by optimising the net value of the (mined) mineralization after mining costs have been considered. A number of different production scenarios were considered, ranging from 1,000 tpd to 1,500 tpd. However, above 1,300 tpd it becomes progressively more difficult to sustain a consistent output with the current resource. This is due to the low tonnes per metre and very high development rates associated with narrow vein mining. Both 1,300 tpd (Option A) and 1,150 tpd (Option B) are considered sustainable with the current resource and mining methods. The 1,300 tpd option is the preferred option for a higher gold-silver production profile.
The open pits will be mined by a conventional (owner-operated) method, using backhoe excavators, front end loaders and 50t mining trucks, together with the usual auxiliary support fleet such as graders bulldozers etc to produce a total material flow of between 3.5 and 7.3 million tonnes per year for the 1,300 tpd option, and between 2.8 and 7.3 million tonnes per year for the 1,150 tpd option.
The average open pit operating cost is estimated to be US$2.46 per tonne of mined material for the 1,300 tpd option and US$2.39 per tonne for the 1,150 tpd option.
In addition to the open pit study, a portion of the underground mineral resources directly below the open pits were considered to be mined using a bench and fill system. The mining analysis carried out indicate a total of 2.3 million tonnes at 7.55 g/t Au and 425.8 g/t Ag can be considered as underground mine resources.
Underground mining at Cerro Moro will be a modified Bench and Fill method that utilizes a primary decline, spiral ramps and cross cuts to access the mineralized horizon. Mining levels are spaced 12 m apart with 8 m high stope benches. The mineralized veins are drilled using hydraulic DTH equipment and the blasted mineral is removed using remote-controlled LHD’s. The mined-out stopes are backfilled with waste from development or the surface waste dumps.
The higher grade material at Cerro Moro comprises most of the indicated resources while the material estimated to have lower grades is mostly in the inferred category. The mining plan maximizes the use of the higher grade material in the early years of the Project, leaving the lower grade (inferred material) to make up the final years of production.
Extorre Gold Mines Limited
Cerro Moro Gold – Silver Project
Preliminary Economic Assessment | Page 34 |
| | Year -1 | Year 1 | Year 2 | Year 3 | Year 4 | Year 5 | Year 6 | Year 7 | Year 8 | Year 9 | Total |
| Combined Open Pit / Underground Mine Plan | Escondida | kt | 27 100 | 232 340 | 252 881 | 177 348 | 143 688 | 76 804 | 17 362 | | | | 927 523 |
| | Au g/t | 19.6 | 14.9 | 12.1 | 13.9 | 13.3 | 12.9 | 10.6 | | | | 13.6 |
| | Ag g/t | 1202.4 | 613.4 | 453.9 | 719.6 | 588.5 | 430.8 | 342.5 | | | | 583.4 |
| Zoe | kt | | 29 800 | 120 200 | 142 800 | 132 075 | 204 525 | 96 602 | 88 700 | 52 800 | 2 870 | 870 372 |
| | Au g/t | | 9.7 | 7.4 | 7.3 | 8.4 | 7.4 | 9.9 | 9.1 | 4.9 | 6.3 | 7.9 |
| | Ag g/t | | 914.4 | 648.2 | 475.9 | 580.8 | 626.6 | 685.6 | 737.5 | 286.2 | 159.5 | 603.4 |
| Gabriela | kt | | | 79 796 | 200 271 | 135 200 | 144 144 | 141 144 | 185 475 | 153 215 | 86 338 | 1125 584 |
| | Au g/t | | | 2.0 | 2.4 | 2.2 | 2.0 | 1.5 | 2.1 | 2.2 | 1.4 | 2.0 |
| | Ag g/t | | | 272.0 | 368.2 | 354.5 | 321.8 | 242.1 | 303.7 | 326.2 | 206.3 | 309.2 |
| Esperanza | kt | | 127 066 | | | | 70 717 | 136 867 | 103 466 | 134 602 | 44 635 | 617 353 |
| | Au g/t | | 1.5 | | | | 3.0 | 2.7 | 3.4 | 3.4 | 4.7 | 2.9 |
| | Ag g/t | | 132.7 | | | | 202.3 | 223.6 | 262.5 | 230.9 | 196.6 | 208.6 |
| Carla | kt | | | | | | | | | | 13 649 | 13 649 |
| | Au g/t | | | | | | | | | | 17.4 | 17.4 |
| | Ag g/t | | | | | | | | | | 762.3 | 762.3 |
| Martina | kt | | | | 45 300 | 95 600 | 85 500 | 53 500 | 8 300 | 1 661 | | 289 861 |
| | Au g/t | | | | 9.0 | 14.1 | 12.3 | 10.0 | 7.3 | 7.0 | | 11.8 |
| | Ag g/t | | | | 52.6 | 61.5 | 48.7 | 41.3 | 36.2 | 34.1 | | 51.7 |
| Deborah | kt | | | | | | | | | 1 543 | 189 392 | 190 935 |
| | Au g/t | | | | | | | | | 2.6 | 3.0 | 3.0 |
| | Ag g/t | | | | | | | | | 60.1 | 68.5 | 68.5 |
| TOTAL | kt | 27 100 | 389 206 | 452 877 | 565 719 | 506 564 | 581 689 | 445 476 | 385 941 | 343 822 | 336 883 | 4 035 278 |
| | Au g/t | 19.6 | 10.1 | 9.1 | 7.8 | 9.2 | 7.0 | 5.1 | 4.1 | 3.1 | 3.4 | 6.9 |
| | Ag g/t | 1202.4 | 479.5 | 473.4 | 480.3 | 424.6 | 388.7 | 312.4 | 386.6 | 280.2 | 149.7 | 391.9 |
Table 4 Mine Schedule Summary for 1,300 tpd (Option A)
Extorre Gold Mines Limited
Cerro Moro Gold – Silver Project
Preliminary Economic Assessment | Page 35 |
| | Year -1 | Year 1 | Year 2 | Year 3 | Year 4 | Year 5 | Year 6 | Year 7 | Year 8 | Year 9 | Total |
| Combined Open Pit / Underground Mine Plan | Escondida | ktonnes | 27 264 | 212 452 | 296 289 | 229 674 | 118 574 | 33 500 | 9 770 | | | | 927 523 |
| Au g/t | 19.5 | 16.1 | 13.9 | 13.3 | 8.6 | 11.3 | 7.6 | | | | 13.6 |
| Ag g/t | 1196.2 | 915.9 | 528.9 | 426.0 | 338.6 | 454.8 | 406.8 | | | | 583.4 |
| Esperanza Nini | ktonnes | | | | | 28 804 | 168 979 | 136 867 | 103 466 | 134 603 | 44 635 | 617 353 |
| Au g/t | | | | | 1.6 | 2.1 | 2.7 | 3.4 | 3.4 | 4.7 | 2.9 |
| Ag g/t | | | | | 150.5 | 158.8 | 223.6 | 262.5 | 230.9 | 196.6 | 208.6 |
| Zoe | ktonnes | | | 13 400 | 104 900 | 142 675 | 194 425 | 143 002 | 112 200 | 85 100 | 74 670 | 870 372 |
| Au g/t | | | 9.6 | 8.5 | 6.3 | 8.3 | 7.5 | 9.6 | 9.5 | 5.1 | 7.9 |
| Ag g/t | | | 991.5 | 725.8 | 462.0 | 687.2 | 539.9 | 633.6 | 750.8 | 322.4 | 603.4 |
| Martina | ktonnes | | | | 45 300 | 95 600 | 85 500 | 53 500 | 8 300 | 1 661 | | 289 861 |
| Au g/t | | | | 9.0 | 14.1 | 12.3 | 10.0 | 7.3 | 7.0 | | 11.8 |
| Ag g/t | | | | 52.6 | 61.5 | 48.7 | 41.3 | 36.2 | 34.1 | | 51.7 |
| Gabriela | ktonnes | | | 15 800 | 129 596 | 218 171 | 195 844 | 141 144 | 185 475 | 153 215 | 86 338 | 1125 584 |
| Au g/t | | | 2.6 | 2.0 | 2.4 | 2.0 | 1.5 | 2.1 | 2.2 | 1.4 | 2.0 |
| Ag g/t | | | 401.3 | 288.7 | 376.2 | 326.3 | 242.1 | 303.7 | 326.2 | 206.3 | 309.2 |
| Deborah | ktonnes | | | | | | | | | 1 543 | 189 392 | 190 935 |
| Au g/t | | | | | | | | | 2.6 | 3.0 | 3.0 |
| Ag g/t | | | | | | | | | 60.1 | 68.5 | 68.5 |
| Carla | ktonnes | | | | | | | | | | 13 649 | 13 649 |
| Au g/t | | | | | | | | | | 17.4 | 17.4 |
| Ag g/t | | | | | | | | | | 762.3 | 762.3 |
| TOTAL | ktonnes | 27 264 | 212 452 | 325 489 | 509 470 | 603 824 | 678 248 | 484 284 | 409 441 | 376 122 | 408 683 | 4 035 278 |
| Au g/t | 19.5 | 16.1 | 13.2 | 9.0 | 6.4 | 5.6 | 4.7 | 4.6 | 4.3 | 3.7 | 6.9 |
| Ag g/t | 1196.2 | 915.9 | 541.7 | 419.6 | 328.5 | 359.4 | 305.9 | 378.3 | 385.8 | 181.2 | 391.9 |
Table 5 Mine Schedule Summary for 1,150 tpd (Option B)
A general layout for the Project is shown in Figure 2
Extorre Gold Mines Limited
Cerro Moro Gold – Silver Project
Preliminary Economic Assessment | Page 36 |

Figure 2 Conceptual Mine Development for Cerro Moro (Source: NCL, 2011)
| 1.7 | Metallurgical Testwork Summary |
Metallurgical test work has demonstrated that the various mineralized zones are readily amenable to cyanidation. Given the high silver to gold ratio (~60:1) a Merrill Crowe circuit was selected for precious metal recovery from solution rather than a carbon adsorption and elution circuit.
Filtration of the leached residue resulted in low filtration rates due to ultrafine clay particles in the mineralization. The mineral inventory is however amenable to thickening and counter current decantation thickening has been selected to wash the leach residue.
The Inco cyanide destruction process proved successful in reducing the weak acid dissociable (“WAD”) cyanide in the process tailings to below 8 ppm. The expected metallurgical recoveries for the mineralization are 95% for gold and 93% for silver, further testwork has been recommended to confirm recoveries for any new potential mineralized zones.
| 1.8 | Mineral Processing and Recovery Methods |
The process design targeted simplicity consistent with maximising recovery of the precious metals and the utilization of well established and proven technologies.
The comminution circuit design involves a three stage crushing circuit followed by a single stage closed circuit ball mill. Classifier overflow from the grinding circuit reports to a conventional flotation circuit to enhance recovery of gold and silver minerals for the subsequent concentrate regrind and leaching stages. The flotation tailings are to be thickened prior to being leached in a five stage leach circuit with a nominal residence time of 48 hours.
Extorre Gold Mines Limited
Cerro Moro Gold – Silver Project
Preliminary Economic Assessment | Page 37 |
The leach residue is to be washed in a 5 stage counter current decantation (“CCD”) thickening circuit with precious metals recovered from the pregnant solution by a conventional Merrill Crowe circuit. The washed residue from the CCD thickening circuit is to undergo cyanide destruction prior to thickening and tailings disposal.
Flash flotation, centrifugal gravity and conventional flotation have been incorporated in the design to recover precious metals into a concentrate that is to be re-ground prior to intensive cyanidation leaching on a continuous basis. The leached concentrate is to be filtered and washed and the resulting pregnant solution fed to the Merrill Crowe circuit for precious metal recovery. The washed filter cake is to be repulped and returned to main leaching circuit to maximise the extraction of precious metals.
The processing plant has been designed to treat 1,300 tpd of feed with maximum head grades of 25 g/t of gold and 1000 g/t of silver. A design availability of 92% (8059 operating hours per year) for the process plant has been selected with standby equipment in critical areas. The process design criteria were developed from testwork and benchmarked data from similar projects.
Santiago-based A. Karzulovic & Assoc Ltd (“AKL”) carried out the geotechnical evaluation and determined the geomechanical parameters to be used in the proposed open pit and underground mining operations at Cerro Moro.
In general rock conditions in proposed mining areas appear to be stable and largely free from any significant structures.
AKL has recommended pit slope varying between 65° – 68° for all the pits at Cerro Moro.
Underground rockmass adjacent to the mineralized veins is predicted to be stable and general free from significant structures that may affect stope stability. This suggests that careful mining should result in relatively low levels of dilution.
| 1.10 | Plant Site Geotechnical |
Vector Argentina SA undertook geotechnical investigations for Extorre in April 2010. Three test pits and four bore holes were used for the preliminary investigations into the geotechnical conditions for the design of foundations for the process plant.
The process plant area topsoil and surface has low growing shrubs and contains organic matter, the topsoil average depth is 0.40m. At the bottom of the valley to the east of the proposed ROM pad location where the terrain opens into a plain, below the surface layer of silty sand there is a very wet clay layer starting at 0.80m extending to 1.80m below the surface. Below the clay layer there is weathered sedimentary rock sandstone that breaks very easily reaching a depth of 3.20m.
The central sector of the valley below the layer of topsoil, there is a layer of sedimentary rock very hard limiting excavation to 1.40m. In the upper valley below the top soil there is a silty sand layer that extends from 0.40 to 0.70m deep below which there is weathered sedimentary rock sandstone of medium hardness that was able to be removed by backhoe up to 1.70m.
Extorre Gold Mines Limited
Cerro Moro Gold – Silver Project
Preliminary Economic Assessment | Page 38 |
For the process plant foundation design all major foundations will require box cut to rock and backfill with suitably compacted engineered fill to provide satisfactory founding of concrete footings. Area slabs and general footings will be founded on gravel hardstands placed over the existing material once top soil has been removed.
Electrical power is expected to be supplied to the Project via a 132 kV line that will connect to the Argentine national grid (“Sistema Argentino de Interconexion”) at a point located on National Highway 281 approximately 60 km to the north-west of Puerto Deseado and near the locality of Antonio de Biedma. From Antonio de Biedma, where a new substation would need to be constructed, the Cerro Moro High Voltage Line (HVL) would broadly follow Provincial Route 66 southwards, crossing the Deseado River in the area of Paso Gregores and then continuing southwards along Provincial Route 87 to the Estancia El Mosquito before, finally, reaching the Project (Figure 3). The proposed routing for the power line was selected on the basis of representing one of the shortest routes (72 km) between the national power grid and the Project, and for crossing the least number of third-party surface rights owners.
At the Cerro Moro site, the process plant electrical substation is expected to be equipped with a single132/33/13.2 kV step-down transformer of 12 MW capacity and associated switchgear. From this site, 13.2 kV overhead transmission lines are expected to be drawn to the various portals.
Extorre Gold Mines Limited
Cerro Moro Gold – Silver Project
Preliminary Economic Assessment | Page 39 |
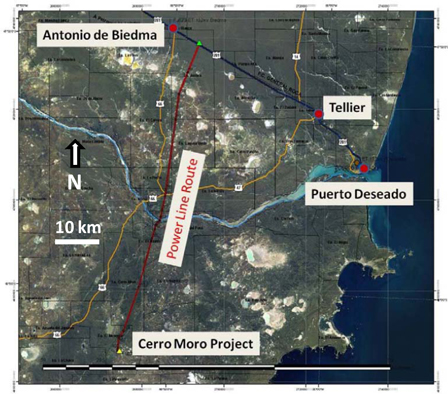
Figure 3 Overhead Powerline Route to Cerro Moro (Source: SIEyE, 2012)
Cerro Moro site is currently accessed using existing upgraded farm tracks from provincial road 66. The alignment for a new access road from provincial road 66 direct to the process plant site has been roughly cut and partially upgraded. This access road is approximately 13 km long and will be upgraded using a mix of local gravels and road-base to provide suitable access for light vehicles and trucks for delivery of construction equipment and operating requirements.
| 1.11.3 | Communications Link |
Communications for telephone and data services will be upgraded to a direct microwave link with the local providers nearest tower. A satellite dish will provide back-up.
| 1.11.4 | Water Supply and Sewerage Treatment |
Water supply to the process plant and infrastructure will be provided from water bores located to the north and east of the plant site and adjacent to the Zoe prospect. A water treatment plant will be located at the at the plant site and will provide potable water for distribution to offices, amenities and the accommodation camp.
The current water supply to Cerro Moro is transported by truck to tanks on site, this system will be held in place until such time as the borefield and water treatment plant are in operation.
Extorre Gold Mines Limited
Cerro Moro Gold – Silver Project
Preliminary Economic Assessment | Page 40 |
A central sewage plant will be located at the accommodation camp with pumps from site facilities utilized to transfer sewage to the central unit.
| 1.11.5 | Mine Infrastructure |
The following buildings will be newly constructed for the Project:
| · | Fuel storage and distribution facility |
The workshop facilities will be divided into heavy and light equipment and will provide for the servicing of all mobile equipment both surface and underground. They will be supplemented with underground workshops when the mining operation is sufficiently advanced.
Magazines for open pit and underground blasting operations will be located at safe and convenient locations.
| 1.11.6 | Cerro Moro Administration |
The following administration and plant buildings will be newly constructed for the Project:
| · | Main administration building with medical centre, rescue room and training room |
| · | Security office and gatehouse |
| · | Metallurgical office/laboratory |
| · | Plant crib room and training room |
| · | Plant workshop and warehouse |
| · | Reagent and sodium cyanide storage |
Office space requirements have been defined by the proposed departmental staffing structures.
| 1.11.7 | Accommodation Camps |
Accommodation facilities to house the construction, exploration and operational personnel for the Project will be constructed as required. During operations, the process plant and general and administrative staff will be housed in a single-status accommodation camp approximately 1000 m east of the process plant.
The accommodation camp will house the majority of the construction workforce prior to the mobilization of the operational personnel late in the construction period. The accommodation camp has been sized to house 350 personnel during operations. During the construction phase, additional accommodation units will enable approximately 600 personnel to be housed.
Extorre Gold Mines Limited
Cerro Moro Gold – Silver Project
Preliminary Economic Assessment | Page 41 |
| 1.11.8 | Tailings Storage Facility |
The process tailings from the first two years of production will be stored in a cell to be built adjacent to the process plant. The cell will be equipped with a geosynthetic liner and facilities to reclaim and recirculate tailings in the event that initial recoveries are erratic.
A larger Tailings Storage Facility (“TSF”) will be constructed after the mine commences production. In this case the process tailings will be stored in large shallow valley area with earth fill embankments providing the necessary enclosure. This TSF will have a geosynthetic liner to prevent seepage into the groundwater system. Surface water will be diverted around the TSF.
The tailings will be pumped from the process plant to the Cell or TSF as slurry; water will be recovered and pumped back to the process plant to minimize water consumption. The capacity of the cell will be approximately 630,000 m³ (0.9 Mt), whilst the total TSF facility will provide additional storage capacity of 2,214,000 m3 (3.3 Mt). The capacity of the two facilities comfortably exceeds the life of mine considered in this study.
| 1.12 | Project Implementation |
The study proposes that the process plant, associated facilities and site infrastructure be executed under the management of Extorre’s Project team and an EPCM engineer (acting on behalf of Extorre).
Equipment for the Project would be sourced from recognized international vendors, while fabrication and installation works will typically be undertaken by experienced Argentinean contractors.
Of particular note is the requirement to place orders for long-lead equipment items, with the implementation schedule critical path determined by delivery of the ball mill. The schedule assumes that much of the work required for Project and scope definition is already complete at the commencement of detailed engineering work. As such, after an initial minimum five week period to finalise and confirm plant layouts and Project definition document, design works are shown progressing.
| 1.13 | Environmental Permits |
Table 6 shows the schedule of filing, approval, and notification dates for the 5 exploration / advanced exploration permits (Environmental Impact Statements, or EIS’s) and one development permit (Environmental Impact Assessment, or EIA) that have been approved to date by the Santa Cruz Provincial Authorities for the Project. Under Santa Cruz Provincial legislation, all environmental permits have a validity of two years and, in order to allow work to continue, must be renewed prior to their respective expiry dates. All valid environmental permits for Cerro Moro are held in the name of Extorre’s subsidiary in Argentina, Estelar Resources Ltd.
Extorre Gold Mines Limited
Cerro Moro Gold – Silver Project
Preliminary Economic Assessment | Page 42 |
Company | |
Filing Date | |
Grant Date | | Notification
Date | |
Expiry Date | |
Project Stage |
| MINCORP EXPL. SA | | 23/05/97 | | 23/06/97 | | 15/07/97 | | 15/07/99 | | Exploration |
| MINCORP EXPL. SA | | 29/06/99 | | N/D | | N/D | | N/D | | Exploration |
| CERRO VANGUARDIA SA | | 08/04/05 | | 20/02/06 | | 24/02/06 | | 24/02/08 | | Exploration |
| ESTELAR RESOURCES LTD. | | 09/10/08 | | 30/03/09 | | 28/05/09 | | 28/05/11 | | Exploration |
| ESTELAR RESOURCES LTD. | | October 2010 | | 13/12/10 | | 15/12/10 | | 15/12/12 | | Advanced Expl. |
| ESTELAR RESOURCES LTD. | | 17/09/2010 | | 16/05/11 | | 16/05/11 | | 16/05/13 | | Development |
Table 6 Schedule of the filing of the Environmental Impact Assessment (EIA)
Extorre Gold Mines Limited
Cerro Moro Gold – Silver Project
Preliminary Economic Assessment | Page 43 |
| 1.14 | Capital and Operating Cost Estimates |
The total initial capital investment for the mining, process plant and infrastructure for the 1,300 tpd (Option A) and 1,150 tpd (Option B), in addition to the expected life of Project sustaining capital, has been summarized in Table 7 and Table 8 respectively.
| Category (MUS$) | | Initial Capital | | | Sustaining
Capital | | | Total
Capital | |
| Direct Costs | | | | | | | | | | | | |
| Open pit mining Equipment | | | 29.7 | | | | 3.6 | | | | 33.3 | |
| Underground mining equipment & Development & Infra/Services | | | 66.1 | | | | 109.4 | | | | 175.5 | |
| Plant | | | 82.1 | | | | | | | | 82.1 | |
| Tailings Storage Facility | | | 8.1 | | | | 22.3 | | | | 30.4 | |
| Water Borefield | | | 6.5 | | | | | | | | 6.5 | |
| Power Supply | | | 26.6 | | | | | | | | 26.6 | |
| Camp facilities | | | 14.5 | | | | | | | | 14.5 | |
| Access roads | | | 3.8 | | | | 8.5 | | | | 12.3 | |
| Mobile Equipment | | | 3.1 | | | | | | | | 3.1 | |
| Fuel Storage | | | 1.6 | | | | | | | | 1.6 | |
| Site Buildings | | | 1.8 | | | | | | | | 1.8 | |
| Assay Laboratory | | | 2.8 | | | | | | | | 2.8 | |
| Communications | | | 0.3 | | | | | | | | 0.3 | |
| Closure | | | | | | | 5.0 | | | | 5.0 | |
| Subtotal Direct Costs | | | 246.9 | | | | 148.7 | | | | 395.6 | |
| Indirect Costs | | | | | | | | | | | | |
| EPCM, Commissioning, Temporary facilities, Initial Fill and Spares | | | 32.9 | | | | | | | | 32.9 | |
| Owners Costs | | | 4.3 | | | | | | | | 4.3 | |
| Subtotal Indirect Costs | | | 37.2 | | | | | | | | 37.2 | |
| TOTAL | | | 284.1 | | | | 148.7 | | | | 432.9 | |
Table 7 Mine, Process Plant and Infrastructure CAPEX Summary (1,300 tpd Option A)
Extorre Gold Mines Limited
Cerro Moro Gold – Silver Project
Preliminary Economic Assessment | Page 44 |
| Category (MUS$) | | Initial Capital | | | Sustaining
Capital | | | Total
Capital | |
| Direct Costs | | | | | | | | | | | | |
| Open pit mining Equipment | | | 19.9 | | | | 11.6 | | | | 31.5 | |
| Open pit pre-stripping | | | 2.7 | | | | | | | | 2.7 | |
| Underground mining equipment & Development & Infra/Services | | | 50.9 | | | | 119.5 | | | | 170.4 | |
| Plant | | | 77.4 | | | | | | | | 77.4 | |
| Tailings Storage Facility | | | 8.1 | | | | 22.3 | | | | 30.4 | |
| Water Borefield | | | 6.5 | | | | | | | | 6.5 | |
| Power Supply | | | 26.6 | | | | | | | | 26.6 | |
| Camp facilities | | | 14.5 | | | | | | | | 14.5 | |
| Access roads | | | 3.8 | | | | 8.5 | | | | 12.3 | |
| Mobile Equipment | | | 3.1 | | | | | | | | 3.1 | |
| Fuel Storage | | | 1.6 | | | | | | | | 1.6 | |
| Site Buildings | | | 1.8 | | | | | | | | 1.8 | |
| Assay Laboratory | | | 2.8 | | | | | | | | 2.8 | |
| Communications | | | 0.3 | | | | | | | | 0.3 | |
| Closure | | | | | | | 5.0 | | | | 5.0 | |
| Subtotal Direct Costs | | | 219.9 | | | | 166.8 | | | | 386.8 | |
| Indirect Costs | | | | | | | | | | | | |
| EPCM, Commissioning, Temporary facilities, Initial Fill and Spares | | | 32.4 | | | | | | | | 32.4 | |
| Owners Costs | | | 4.3 | | | | | | | | 4.3 | |
| Subtotal Indirect Costs | | | 36.7 | | | | | | | | 36.7 | |
| TOTAL | | | 256.7 | | | | 166.8 | | | | 423.5 | |
Table 8 Mine, Process Plant and Infrastructure CAPEX Summary (1,150 tpd, Option B)
The total process plant capital and operating costs are summarized in Table 9 and Table 10, and are shown for each year of operation due to the high variability depending on silver grades in the plant feed. The mining capital and operating costs are summarized in Table 11 and Table 12, showing sustaining capital also.
Extorre Gold Mines Limited
Cerro Moro Gold – Silver Project
Preliminary Economic Assessment | Page 45 |
| Production | | | Y-02 | | | Y-01 | | | Y01 | | | Y02 | | | Y03 | | | Y04 | | | Y05 | | | Y06 | | | Y07 | | | Y08 | | | Y09 | | | Total | |
| Tonnes Treated (t) | | | | | | | | | 375,527 | | | 436,570 | | | 436,570 | | | 436,570 | | | 480,180 | | | 480,180 | | | 480,180 | | | 480,180 | | | 429,321 | | | 4,035,278 | |
| Gold (g/t) | | | | | | | | | 11.2 | | | 9.6 | | | 8.7 | | | 10.3 | | | 7.3 | | | 5.2 | | | 4.1 | | | 3.4 | | | 3.6 | | | 5.9 | |
| Silver (g/t) | | | | | | | | | 547.8 | | | 482.9 | | | 523.9 | | | 461.8 | | | 413.3 | | | 332.9 | | | 362.5 | | | 275.6 | | | 174.3 | | | 345 | |
| | | | | | | | | | | | | | | | | | | | | | | | | | | | | | | | | | | | | | |
| Cost Centre | | | Unit Cost
$/t | | | Unit Cost $/t | | | Unit Cost
$/t | | | Unit Cost
$/t | | | Unit Cost $/t | | | Unit Cost
$/t | | | Unit Cost
$/t | | | Unit Cost $/t | | | Unit Cost
$/t | | | Unit Cost
$/t | | | Unit Cost
$/t | | | Unit Cost $/t | |
| Cost Centre Labour | | | | | | | | | 15.93 | | | 13.7 | | | 13.7 | | | 13.7 | | | 12.45 | | | 12.45 | | | 12.45 | | | 12.45 | | | 13.93 | | | 13.34 | |
| Power | | | | | | | | | 6.06 | | | 5.78 | | | 5.78 | | | 5.78 | | | 5.26 | | | 5.26 | | | 5.26 | | | 5.26 | | | 5.88 | | | 5.57 | |
| Regents and Grinding | | | | | | | | | 46.79 | | | 45.2 | | | 45.85 | | | 44.93 | | | 44.21 | | | 42.85 | | | 43.41 | | | 42.1 | | | 40.58 | | | 43.92 | |
| Media Maintenance | | | | | | | | | 4.01 | | | 3.45 | | | 3.45 | | | 3.45 | | | 3.14 | | | 3.14 | | | 3.14 | | | 3.14 | | | 3.51 | | | 3.36 | |
| Linings | | | | | | | | | 1.51 | | | 1.3 | | | 1.3 | | | 1.3 | | | 1.18 | | | 1.18 | | | 1.18 | | | 1.18 | | | 1.32 | | | 1.26 | |
| Other | | | | | | | | | 6.96 | | | 6.07 | | | 6.07 | | | 6.07 | | | 5.57 | | | 5.49 | | | 5.49 | | | 5.43 | | | 6 | | | 5.87 | |
| Total | | | | | | | | | 81.26 | | | 75.49 | | | 76.15 | | | 75.23 | | | 71.81 | | | 70.36 | | | 70.92 | | | 69.55 | | | 71.22 | | | 73.32 | |
| Total Opex | | | | | | | | | 30,515,324 | | | 32,956,669 | | | 33,244,806 | | | 32,843,161 | | | 34,481,726 | | | 33,785,465 | | | 34,054,366 | | | 33,396,519 | | | 30,576,242 | | | 295,854,277 | |
| Total Capex | | | | | | 188,390,000 | | | 1,000,000 | | | 11,160,000 | | | 1,000,000 | | | 6,800,000 | | | 1,000,000 | | | 1,000,000 | | | 7,290,000 | | | 1,000,000 | | | 5,500,000 | | | 224,140,000 | |
| Return of VAT | | | | | | | | | -24,468,000 | | | | | | | | | | | | | | | | | | | | | | | | | | | -24,468,000 | |
| Overall Processing Costs | | | | | | 188,390,000 | | | 31,515,324 | | | 44,116,669 | | | 34,244,806 | | | 39,643,161 | | | 35,481,726 | | | 34,785,465 | | | 41,344,366 | | | 34,396,519 | | | 36,076,242 | | | 519,994,277 | |
Table 9 Process Plant Total Capex and Operating Cost Summary – 1,300 tpd Option A
Extorre Gold Mines Limited
Cerro Moro Gold – Silver Project
Preliminary Economic Assessment | Page 46 |
| Tonnes Treated (t) | | | | | | | | | 239,716 | | | 315,821 | | | 386,170 | | | 386,170 | | | 424,787 | | | 424,787 | | | 424,786 | | | 424,786 | | | 424,786 | | | 424,786 | | | 158,683 | | | 4,035,278 | |
| Gold (g/t) | | | | | | | | | 16.5 | | | 13.2 | | | 10.4 | | | 8.0 | | | 6.5 | | | 5.2 | | | 4.6 | | | 4.3 | | | 3.8 | | | 3.7 | | | 3.7 | | | 6.9 | |
| Silver (g/t) | | | | | | | | | 947.8 | | | 541.7 | | | 473.5 | | | 340.8 | | | 426.1 | | | 348.6 | | | 377.6 | | | 369.3 | | | 193.5 | | | 240.5 | | | 240.5 | | | 391.9 | |
| | | | | | | | | | | | | | | | | | | | | | | | | | | | | | | | | | | | | | | | | | | | |
| Cost Centre | | | Unit Cost
$/t | | | Unit Cost
$/t | | | Unit Cost $/t | | | Unit Cost $/t | | | Unit Cost
$/t | | | Unit Cost $/t | | | Unit Cost $/t | | | Unit Cost
$/t | | | Unit Cost $/t | | | Unit Cost $/t | | | Unit Cost $/t | | | Unit Cost $/t | | | Unit Cost $/t | | | Unit Cost
$/t | |
| Cost Centre Labour | | | | | | | | | 24.95 | | | 18.94 | | | 15.49 | | | 15.49 | | | 14.08 | | | 14.08 | | | 14.08 | | | 14.08 | | | 14.08 | | | 14.08 | | | 14.08 | | | 15.38 | |
| Power | | | | | | | | | 7.21 | | | 6.23 | | | 5.76 | | | 5.76 | | | 5.24 | | | 5.24 | | | 5.24 | | | 5.24 | | | 5.24 | | | 5.24 | | | 5.24 | | | 5.53 | |
| Reagents and Grinding | | | | | | | | | 52.79 | | | 46.77 | | | 45.81 | | | 43.77 | | | 44.99 | | | 43.85 | | | 44.29 | | | 44.18 | | | 41.48 | | | 42.27 | | | 42.27 | | | 44.51 | |
| Media Maintenance | | | | | | | | | 5.72 | | | 4.34 | | | 3.55 | | | 3.55 | | | 3.23 | | | 3.23 | | | 3.23 | | | 3.23 | | | 3.23 | | | 3.23 | | | 3.23 | | | 3.53 | |
| Linings | | | | | | | | | 2.01 | | | 1.52 | | | 1.25 | | | 1.25 | | | 1.13 | | | 1.13 | | | 1.13 | | | 1.13 | | | 1.13 | | | 1.13 | | | 1.13 | | | 1.24 | |
| Other | | | | | | | | | 10.49 | | | 8.1 | | | 6.73 | | | 6.56 | | | 6.11 | | | 6.11 | | | 6.11 | | | 6.11 | | | 6.11 | | | 6.11 | | | 6.11 | | | 6.63 | |
| Total | | | | | | | | | 103.15 | | | 85.9 | | | 78.58 | | | 76.38 | | | 74.77 | | | 73.63 | | | 74.07 | | | 73.97 | | | 71.27 | | | 72.06 | | | 72.06 | | | 76.81 | |
| Total Opex | | | | | | | | | 24,726,705 | | | 27,129,024 | | | 30,345,239 | | | 29,495,665 | | | 31,761,324 | | | 31,277,067 | | | 31,463,899 | | | 31,421,420 | | | 30,274,498 | | | 30,610,079 | | | 11,434,710 | | | 309,939,630 | |
| Total Capex | | | | | | 183,172,378 | | | 1,000,000 | | | 11,160,000 | | | 1,000,000 | | | 6,800,000 | | | 1,000,000 | | | 1,000,000 | | | 7,290,000 | | | 1,000,000 | | | 5,500,000 | | | 0 | | | 0 | | | 218,922,378 | |
| Return of VAT | | | | | | | | | -23,964,849 | | | | | | | | | | | | | | | | | | | | | | | | | | | | | | | | | -23,964,849 | |
| Overall Processing Costs | | | | | | 183,172,378 | | | 1,761,856 | | | 38,289,024 | | | 31,345,239 | | | 36,295,665 | | | 32,761,324 | | | 32,277,067 | | | 38,753,899 | | | 32,421,420 | | | 35,774,498 | | | 30,610,079 | | | 11,434,710 | | | 504,897,159 | |
Table 10 Process Plant Total Capex and Operating Cost Summary – 1,150 tpd Option B
Extorre Gold Mines Limited
Cerro Moro Gold – Silver Project
Preliminary Economic Assessment | Page 47 |
| Production | | Y-02 | | Y-01 | | Y01 | | Y02 | | Y03 | | Y04 | | Y05 | | Y06 | | Y07 | | Y08 | | Y09 | | Total | |
| Open Pit Operations | | | | | | | | | | | | | | | | | | �� | | | | | | | | | | | | | | | | | | | |
| Total CAPEX | | | | | | 29,663,026 | | | | | | 1,438,811 | | | 1,246,361 | | | 121,000 | | | 652,762 | | | | | | | | | 130,152 | | | | | | 33,252,111 | |
| Total OPEX | | | | | | | | | 14,247,923 | | | 16,154,852 | | | 16,876,700 | | | 11,744,530 | | | 16,480,915 | | | 14,633,160 | | | 16,965,551 | | | 16,106,590 | | | 10,563,936 | | | 133,774,157 | |
| Total open pit expenses | | | | | | 29,663,026 | | | 14,247,923 | | | 17,593,662 | | | 18,123,060 | | | 11,865,530 | | | 17,133,678 | | | 14,633,160 | | | 16,965,551 | | | 16,236,743 | | | 10,563,936 | | | 167,026,269 | |
| Underground Operations | | | | | | | | | | | | | | | | | | | | | | | | | | | | | | | | | | | | | |
| Development | | | 6,389,230 | | | 24,499,544 | | | 29,432,926 | | | 21,584,795 | | | 15,291,701 | | | 13,745,518 | | | 3,956,171 | | | | | | | | | | | | | | | 114,899,886 | |
| Equipment | | | 8,917,298 | | | 13,445,590 | | | 10,761,024 | | | 9,535,523 | | | 2,260,959 | | | | | | | | | | | | | | | | | | | | | 44,920,395 | |
| Infraestructure and Services | | | 2,217,525 | | | 1,033,776 | | | 495,625 | | | 186,849 | | | 71,276 | | | | | | | | | | | | | | | | | | | | | 4,005,049 | |
| Others | | | 958,719 | | | 1,214,583 | | | 938,903 | | | 806,745 | | | 193,984 | | | | | | 145,847 | | | | | | | | | | | | | | | 4,258,782 | |
| Pre-production Operation | | | 730,304 | | | 6,678,108 | | | | | | | | | | | | | | | | | | | | | | | | | | | | | | | |
| Total CAPEX | | | 19,213,076 | | | 46,871,601 | | | 41,628,479 | | | 32,113,912 | | | 17,817,920 | | | 13,745,518 | | | 4,102,019 | | | | | | | | | | | | | | | 175,492,524 | |
| Total OPEX | | | | | | | | | 13,974,375 | | | 21,802,485 | | | 24,590,489 | | | 20,572,985 | | | 12,525,382 | | | 9,440,918 | | | 5,641,259 | | | 3,537,156 | | | 1,098,009 | | | 113,183,059 | |
| Total underground expenses | | | 19,213,076 | | | 46,871,601 | | | 55,602,854 | | | 53,916,397 | | | 42,408,409 | | | 34,318,503 | | | 16,627,401 | | | 9,440,918 | | | 5,641,259 | | | 3,537,156 | | | 1,098,009 | | | 288,675,583 | |
| Return of VAT | | | | | | | | | -16,617,370 | | | | | | | | | | | | | | | | | | | | | | | | | | | -16,617,370 | |
| Overall Mining Expenses | | | 19,213,076 | | | 76,534,627 | | | 53,233,407 | | | 71,510,059 | | | 60,531,469 | | | 46,184,033 | | | 33,761,079 | | | 24,074,078 | | | 22,606,811 | | | 19,773,899 | | | 11,661,945 | | | 439,084,481 | |
Table 11 Mining CAPEX and OPEX Summary – 1,300 tpd Option A
Extorre Gold Mines Limited
Cerro Moro Gold – Silver Project
Preliminary Economic Assessment | Page 48 |
| Production | | Y-02 | | Y-01 | | Y01 | | Y02 | | Y03 | | Y04 | | Y05 | | Y06 | | Y07 | | Y08 | | Y09 | | Y10 | | Y11 | | Total | |
| Open Pit Operations | | | | | | | | | | | | | | | | | | | | | | | | | | | | | | | | | | | | | | | | | | | |
| Total CAPEX | | | | | | 19,914,849 | | | 1,438,811 | | | 7,109,082 | | | 996,677 | | | 1,899,123 | | | | | | | | | 144,672 | | | | | | | | | | | | | | | 31,503,213 | |
| Total OPEX | | | | | | | | | 8,592,987 | | | 14,849,107 | | | 15,228,268 | | | 15,332,889 | | | 14,881,004 | | | 14,670,063 | | | 16,615,959 | | | 15,898,466 | | | 10,925,537 | | | 553,280 | | | 207,315 | | | 127,754,873 | |
| Total open pit expenses | | | | | | 19,914,849 | | | 10,031,798 | | | 21,958,188 | | | 16,224,945 | | | 17,232,012 | | | 14,881,004 | | | 14,670,063 | | | 16,760,631 | | | 15,898,466 | | | 10,925,537 | | | 553,280 | | | 207,315 | | | 159,258,086 | |
| Underground Operations | | | | | | | | | | | | | | | | | | | | | | | | | | | | | | | | | | | | | | | | | | | |
| Development | | | 6,388,412 | | | 14,029,043 | | | 28,590,497 | | | 26,642,115 | | | 16,049,003 | | | 17,360,640 | | | 5,841,683 | | | | | | | | | | | | | | | | | | | | | 114,901,392 | |
| Equipment | | | 8,917,298 | | | 10,388,866 | | | 10,900,068 | | | 10,055,823 | | | 1,213,519 | | | | | | | | | | | | | | | | | | | | | | | | | | | 41,475,574 | |
| Infraestructure and Services | | | 2,215,671 | | | 1,033,405 | | | 494,883 | | | 186,478 | | | 70,905 | | | | | | | | | | | | | | | | | | | | | | | | | | | 4,001,343 | |
| Others | | | 958,534 | | | 961,924 | | | 950,320 | | | 849,708 | | | 107,381 | | | 25,000 | | | 145,847 | | | | | | | | | | | | | | | | | | | | | 3,998,715 | |
| Pre-production Operation | | | 729,846 | | | 5,292,719 | | | | | | | | | | | | | | | | | | | | | | | | | | | | | | | | | | | | | |
| Total CAPEX | | | 19,209,760 | | | 31,705,958 | | | 40,935,768 | | | 37,734,124 | | | 17,440,808 | | | 17,385,640 | | | 5,987,530 | | | | | | | | | | | | | | | | | | | | | 170,399,589 | |
| Total OPEX | | | | | | | | | 11,412,791 | | | 19,122,611 | | | 20,203,059 | | | 18,670,322 | | | 12,828,793 | | | 9,288,799 | | | 5,654,859 | | | 3,619,875 | | | 1,216,225 | | | | | | | | | 102,017,335 | |
| Total underground expenses | | | 19,209,760 | | | 31,705,958 | | | 52,348,559 | | | 56,856,735 | | | 37,643,867 | | | 36,055,962 | | | 18,816,324 | | | 9,288,799 | | | 5,654,859 | | | 3,619,875 | | | 1,216,225 | | | | | | | | | 272,416,924 | |
| Return of VAT | | | | | | | | | -12,292,908 | | | | | | | | | | | | | | | | | | | | | | | | | | | | | | | | | -12,292,908 | |
| Overall Mining Expenses | | | 19,209,760 | | | 51,620,807 | | | 50,087,448 | | | 78,814,923 | | | 53,868,812 | | | 53,287,974 | | | 33,697,327 | | | 23,958,861 | | | 22,415,490 | | | 19,518,341 | | | 12,141,762 | | | 553,280 | | | 207,315 | | | 419,382,101 | |
Table 12 Mining CAPEX and OPEX Summary – 1,150 tpd Option B
Extorre Gold Mines Limited
Cerro Moro Gold – Silver Project
Preliminary Economic Assessment | Page 49 |
This technical report includes mineral resources that are not mineral reserves and therefore do not have demonstrated economic viability.
The reader is cautioned that the preliminary economic assessment is preliminary in nature and includes Inferred mineral resources that are considered too speculative geologically to have the economic considerations applied to them that would enable them to be categorized as mineral reserves. There is no certainty that the preliminary economic assessment will be realized. No Mineral Reserves have been estimated.
Extorre should bear in mind that NCL is not a financial adviser, and that these models are indicative only, based on NCL’s experiences. NCL recommends that Extorre seeks its own financial and tax advice before taking action in relation to the financial matters rose herein.
Economic Analysis – 1,300 tpd (Option A)
The total estimated initial capital cost of the Project is US$ 284 million (VAT included), which comprises i) US$ 247 million for all plant, infrastructure, energy, tailings dam, and open pit and underground development and mining equipment; ii) an additional $US 37.2M for EPCM costs and owners costs. Adding sustaining capital and closure, the total capital cost for the life of the Project is estimated to be US$ 433 million.
The base case financial model assumes gold and silver prices of US$ 1320 per ounce and US$ 26 per ounce, respectively. Results of the discounted cash flow modelling (NPV5 and NPV10) for the 1,300 tpd throughput scenario at Cerro Moro, together with the projected Internal Rate of Return (IRR) and payback period, are presented in Table 13.
| Financial Model | | 1,300 tpd | |
| NPV5pre-tax | | US $ | 737.4 million | |
| NPV5Free cash flow (after tax) | | US $ | 463.2 million | |
| NPV10pre-tax | | US $ | 524.7 million | |
| NPV10Free cash flow (after tax) | | US $ | 320.1 million | |
| IRR pre-tax | | | 63.1 | % |
| IRR Free cash flow (after tax) | | | 46.8 | % |
| Years to payback from start of production (at 5% discount) | | | 1.98 | |
| Years to payback from start of production (at 10% discount) | | | 2.16 | |
Table 13 Economical Evaluation Results Summary (1,300 tpd)
Sensitivity analysis was undertaken to measure the effect of variations in gold price, discount rate, total operating cost and average tax rate, for after-tax and before-tax cases. The obtained results are very solid, with positive NPVs and attractive IRR for almost all the combinations as included in Section 22.
Extorre Gold Mines Limited
Cerro Moro Gold – Silver Project
Preliminary Economic Assessment | Page 50 |
Economic Analysis – 1,150 tpd (Option B)
The total estimated initial capital cost of the Project is US$ 257 million (VAT included), which comprises i) US$ 220 million for all plant, infrastructure, energy, tailings dam, and open pit and underground development and mining equipment; ii) an additional $US 36.7M for EPCM costs and owners costs. Adding sustaining capital and closure, the total capital cost for the life of the Project is estimated to be US$ 424 million.
The base case financial model assumes gold and silver prices of US$ 1320 per ounce and US$ 26 per ounce, respectively. Results of the discounted cash flow modelling (NPV5 and NPV10) for the 1,150 tpd throughput scenario at Cerro Moro, together with the projected Internal Rate of Return (IRR) and payback period, are presented in Table 14.
| Financial Model | | 1,150 tpd | |
| NPV5pre-tax | | US $ | 723.0 million | |
| NPV5Free cash flow (after tax) | | US $ | 453.8 million | |
| NPV10pre-tax | | US $ | 503.8 million | |
| NPV10Free cash flow (after tax) | | US $ | 306.8 million | |
| IRR pre-tax | | | 65.7 | % |
| IRR Free cash flow (after tax) | | | 47.4 | % |
| Years to payback from start of production (at 5% discount) | | | 1.84 | |
| Years to payback from start of production (at 10% discount) | | | 2.03 | |
Table 14 Economical Evaluation Results Summary (1,150 tpd)
Sensitivity analysis was undertaken to measure the effect of variations in gold price, discount rate, total operating cost and average tax rate, for after-tax and before-tax cases. The obtained results are very solid, with positive NPVs and attractive IRR for almost all the combinations as contained in Section 22.
In these financial models Extorre has assumed an accelerated depreciation schedule for the initial CAPEX of 60-20-20 (Years 1-2-3) together with recovery of the initial CAPEX-related VAT during the first year of commercial production, both of which are allowed under Argentine legislation for mining projects. Extorre will also seek to apply for tax credits of at least US$ 50 million that relate to pre-mining exploration expenditures (but have not been included in these financial analyses).
Extorre Gold Mines Limited
Cerro Moro Gold – Silver Project
Preliminary Economic Assessment | Page 51 |
The November, 2011 mineral resource estimate for Cerro Moro resulted in a significant increase to the Project mineral resource base. Of particular importance to the November, 2011 resource statement was the inclusion of the high grade Zoe prospect. Updated mineral resource estimates were also compiled for the Gabriela and Esperanza prospects and maiden mineral resource estimates were compiled for the Zoe, Martina, Carla and Nini prospects. There have been no changes to the existing Escondida, Loma Escondida and Deborah mineral resource estimates.
Ted Coupland has classified a substantial proportion of the Cerro Moro mineral resources as “Indicated” where drill spacing is sufficient to demonstrate acceptable confidence in the geometry, continuity and grade of the mineralized zones. Surrounding areas have been classified as Inferred where drill spacing is wider or where unresolved geological complexity exists.
Extorre’s ongoing resource definition strategy is aimed at
| · | further infill and extensional drilling at recently discovered prospects such as Zoe, Carla, Martina, and Nini-Esperanza; |
| · | the conversion of existing Inferred Category mineral resources to Indicated Category; and |
| · | the identification of potential new resources on other new and existing prospects. |
Ted Coupland believes that Extorre’s ongoing resource definition and exploration strategy is well considered, appropriately funded and has a high chance of successfully fulfilling its stated aims.
| 1.16.2 | Risks and Uncertainties |
As with all mineral resource projects there are risks and uncertainties associated with all aspects of exploration, sampling, data collection, analytical analysis, mineral resource estimation and economic evaluation. There is a high degree of geological and resource risk associated with Inferred mineral resources to the extent that there could be a significant material departure between the mineral resource estimates and reality. Reliance on Inferred mineral resources when undertaking preliminary economic evaluations is risky as there is no certainty of economic viability and mineral reserves cannot be formulated. Indicated mineral resources provide more certainty as to the geological and grade continuity of the mineralized system than Inferred mineral resources. Whilst Indicated resources may be converted to mineral reserves by applying appropriate modifying factors, there still exists a significant degree of geological and resource complexity that may affect the economic viability of the project.
The preliminary Cerro Moro mining studies are based on Cube’s November, 2011 mineral resource estimate which includes both Indicated and Inferred category mineral resources.
Extorre Gold Mines Limited
Cerro Moro Gold – Silver Project
Preliminary Economic Assessment | Page 52 |
The reader is cautioned that the mining study is a preliminary assessment and it includes inferred mineral resources that are considered too speculative geologically to have the economic considerations applied to them that would enable them to be categorized as mineral reserves. There is no certainty that the preliminary assessment will be realized. No Mineral Reserves have been estimated.
The mining study utilizes a combination of open pit and underground mining methods. The open pit underground interface was determined by optimizing the net value of the mineralization after projected mining costs have been considered. The open pit contained mineral inventory is estimated at 1.7 million tonnes at an average grade of 6.01 g Au/t and 347.6 g Ag/t, with open pit operating costs estimated to be US$2.46 per tonne for the 1,300 tpd option and US$2.39 for the 1,150 tpd option. In addition to the open pit study, a portion of the mineral inventory lying below the open pits was considered to be mined using an underground “bench and fill”-type system. Approximately 2.3 million tonnes at 7.55 g/t Au and 425.8 g/t Ag are estimated to be exploitable using underground mining techniques.
A number of different production scenarios were considered for Cerro Moro, ranging from 1,000 tpd to 1,500 tpd. However, above 1,300 tpd it becomes progressively more difficult to sustain a consistent output with the current resource. This is due to the low tonnes per metre and very high development rates associated with narrow vein mining. Either 1,300 tpd or 1,150 tpd are considered sustainable with the current resource and mining methods.
| 1.16.4 | Metallurgical Processing |
A treatment plant capable of processing either 1,300 tpd or 1,150 tpd has been proposed. The plant design incorporates both flotation and gravity recovery stages to maximise recovery from the variable mineralogy particularly of the silver minerals. Due to the high silver to gold ratios for the deposits – overall average ratio of 60:1 silver:gold – the Merrill Crowe (zinc cementation) process has been included instead of adsorption onto carbon for the recovery of precious metals from the leach solution. The plant design is intended to comply with the requirements of the International Cyanide Management Code. The processing plant has been designed to accommodate maximum head grades of 25 g/t of gold and 1000 g/t of silver. A design availability of 92% (8059 operating hours per year) for the process plant has been selected with standby equipment in critical areas. The process design criteria were developed from testwork and benchmarked data from similar projects.
The metallurgical recoveries selected for financial evaluation of the Escondida mineralized zone are 95% for gold and 93% for silver. This has been calculated from the leach extraction data for individual zones and proposed mining schedule on a weighted average basis. Where individual zones have not been subjected to metallurgical test work the leach extraction rates from a similar source were used as nominated by the client. It assumes a CCD wash efficiency of 99% and Merrill Crowe precipitation efficiency of 99%.
Extorre Gold Mines Limited
Cerro Moro Gold – Silver Project
Preliminary Economic Assessment | Page 53 |
| 1.16.5 | Preliminary Economic Assessment Results |
Simple cash flow financial models were created by NCL, based on its experience, utilizing the mine production schedule, associated gold/silver grades, gold/silver recoveries estimated from the preliminary metallurgical test program, and capital and operating costs as outlined in this technical study. Base case metal prices assumed in the financial modelling were US$ 1,320/oz for gold US$26/oz for silver and silver. Total metals recovered during the life of the Project are estimated to be 848koz Au and 47Moz Ag. A summary of the discounted cash flow modelling (NPV5 and NPV10) for both the 1,300 tpd and the 1,150 tpd throughput scenario at Cerro Moro, together with the projected Internal Rate of Return (IRR) and payback period, are presented in Table 15.
| Financial Model | | | 1,300 tpd | | | | 1,150 tpd | |
| NPV5pre-tax | | US $ | 737.4 million | | | US $ | 723.0 million | |
| NPV5Free cash flow (after tax) | | US $ | 463.2 million | | | US $ | 453.8 million | |
| NPV10pre-tax | | US $ | 524.7 million | | | US $ | 503.8 million | |
| NPV10Free cash flow (after tax) | | US $ | 320.1 million | | | US $ | 306.8 million | |
| IRR pre-tax | | | 63.1 | % | | | 65.7 | % |
| IRR Free cash flow (after tax) | | | 46.8 | % | | | 47.4 | % |
| Years to payback from start of production (at 5% discount) | | | 1.98 | | | | 1.84 | |
| Years to payback from start of production (at 10% discount) | | | 2.16 | | | | 2.03 | |
Table 15 Economical Evaluation Results Summary (1,300 tpd & 1,150 tpd)
Recommendations for Cerro Moro are discussed in detailed in Section 26, however, the key recommendations for both exploration activities and development-related studies going forward include the following:
| § | Continue the current well balanced drilling strategy of targeted infill drilling to increase resource confidence and extensional resource definition drilling at known prospects to add additional mineral resources; |
| § | Continue with exploration drilling at other encouraging known prospects; |
| § | Continue to update relevant mineral resource estimates for all significant mineralized zones to reflect ongoing changes to mineral resource confidence and the overall Cerro Moro mineral resource base; |
| § | Continue mine engineering and planning studies to define and confirm the economic viability of the Project, and move towards development stage; |
| § | Continue mining studies to refine the current mining model, optimize open pit and underground interface, and identify the optimum tonnage throughput that yields the best compromise between profitability and practicality; |
Extorre Gold Mines Limited
Cerro Moro Gold – Silver Project
Preliminary Economic Assessment | Page 54 |
| § | Continue geotechnical test work and studies including drilling geotechnical holes parallel to the vein-strike in order to identify structures that may be parallel to exploration drilling. Continue drilling of additional geotechnical holes for open pits; |
| § | Carry out extended pumping tests at current bore-sites to determine sustainably flow rates, in addition to continuing prospecting for water and testing of exploration bores intersect substantive flows; |
| § | Refine maximum demand studies for power and progress engineering designs for construction of powerline; |
| § | Continue to refine designs for the Tailings Storage Facility; |
| § | Additional metallurgical test work, including i) test work to confirm concentrate leach extraction rates at the slurry density nominated for the design of the concentrate leaching circuit, ii) test work to optimize the consumption of the cyanide and zinc because of the significant impact these reagents have on operating cost, and iii) test work to establish the impact of thiocyanate on flotation performance because of the impact this has on the selection of the cyanide destruction process and potential to significantly increase the operating cost. |
Extorre Gold Mines Limited
Cerro Moro Gold – Silver Project
Preliminary Economic Assessment | Page 55 |
| 2. | Introduction and terms of reference |
Extorre commissioned NCL to prepare an updated Preliminary Economic Assessment (“PEA”) for Cerro Moro. This PEA is based on an updated NI 43-101 compliant mineral resource estimate that was completed in November, 2011, by Cube.
Cerro Moro is located 70 km southwest of the port city of Puerto Deseado, Santa Cruz Province, southern Argentina.
The study was completed by NCL through the compilation of information generated by consultants and specialists appointed by Extorre. NCL was responsible for the compilation of information from these experts and specialists and the assembly of the overall study.
This report and the resource estimate have been prepared in compliance with the disclosure and reporting requirements set forth in NI 43-101, Companion Policy 43-101CP, and Form 43-101F1.
The following qualified persons have compiled this technical report:
| § | Carlos Guzman, Principal / Project Director of NCL, was responsible for the mining and infrastructure sections of the study, together with the financial modelling and compilation of the overall report; |
| § | Bill Gosling, Senior Process Metallurgist, of GRES was responsible for the information provided for the metallurgy and process plant design; |
| § | David (Ted) Coupland, Director Geological Consulting, of Cube, was responsible for the sections relating to geology (both regional and local), resource estimation, exploration, drilling, and data verification; |
| § | Anthony Sanford, Environmental Services Manager for Ausenco, was responsible for the environmental and community sections; |
| § | Krishna Sinha, Corporate Technical Director for Ausenco, was responsible for the sections relating to the TSF; |
| § | Michael Gabora, Senior Hydrogeologist for Ausenco, was responsible for the hydrology and hydrogeology sections of the technical report. |
Table 16 details the responsibility of the technical report sections to each of the persons involved.
Extorre Gold Mines Limited
Cerro Moro Gold – Silver Project
Preliminary Economic Assessment | Page 56 |
| Responsible Person | | Company | | Part |
| Carlos Guzman | | NCL | | 1.1, 1.2, 1.6, 1.9, 1.10, 1.11 (except for 1.11.4 and 1.11.8), 1.12, 1.14, 1.15, 1.16, 1.17, 2, 3, 16 (except for 16.3), 18 (except for 18.1.8 and 18.4), 21.1.2, 21.2.2, 21.2.3, 22, 25, 26, and 27 |
| David (Ted) Coupland | | Cube | | 1.3, 1.4, 1.5, 4, 6, 7, 8, 9, 10, 11, 12, 14, 15, 19, 23, 24 |
| Bill Gosling | | GRES | | 1.7, 1.8, 13, 17, 21.1.1, 21.2.1 |
| Anthony Sanford | | Ausenco | | 1.13, 1.11.4, 5, 20 |
| Krishna Sinha | | Ausenco | | 1.11.8, 18.4 |
| Michael Gabora | | Ausenco | | 16.3, 18.1.8 |
Table 16 Technical Report Responsibility Matrix
| 2.3 | Frequently Used Acronyms, Abbreviations, Definitions, and Units of Measure |
Unless otherwise indicated, all references to currency in this report refer to United States dollars (US$). Frequently used acronyms and abbreviations are listed in Table 17.
| Abbreviation | | Meaning |
| AAS | | atomic absorption spectrometry |
| Ag | | Silver |
| As | | Arsenic |
| Au | | Gold |
| Cu | | Copper |
| g/t | | grams per metric tonne |
| ha | | Hectare |
| Hg | | Mercury |
| ICMC | | International Cyanide Management Code |
| km | | Kilometers |
| l | | liters |
| m | | meters |
| masl | | meters above sea level |
| oz, koz, Moz | | ounces, thousands of ounces, million of ounces |
| Pb | | Lead |
| ppm | | parts per million |
| QA/QC | | quality assurance and quality control |
| RC | | reverse-circulation drilling method |
| RQD | | rock-quality designation |
| Sb | | antimony |
| ºT | | degrees relative to true north |
| t, kt, Mt | | tonnes, kilotonnes, million tonnes |
| t/y | | tonnes per year |
| tpd | | tonnes per day |
| Zn | | Zinc |
| µm | | micrometer |
| µS/cm | | micro Siemens per centimeter |
Table 17 Frequently used acronyms and abbreviations
Extorre Gold Mines Limited
Cerro Moro Gold – Silver Project
Preliminary Economic Assessment | Page 57 |
| 3. | RELIANCE ON OTHER EXPERTS |
The following six qualified persons have contributed to this technical report:
| § | Carlos Guzman, Principal / Project Director of NCL, was responsible for the mining and infrastructure sections of the study, together with the financial modelling and compilation of the overall report; |
| § | Bill Gosling, Senior Process Metallurgist, of GRES was responsible for the information provided for the metallurgy and process plant design; |
| § | David (Ted) Coupland, Director Geological Consulting, of Cube, was responsible for the sections relating to geology (both regional and local), resource estimation, exploration, drilling, and data verification; |
| § | Anthony Sanford, Environmental Services Manager for Ausenco, was responsible for the environmental and community sections; |
| § | Krishna Sinha, Corporate Technical Director for Ausenco, was responsible for the sections relating to the TSF; |
| § | Michael Gabora, Senior Hydrogeologist for Ausenco, was responsible for the hydrology and hydrogeology sections of the technical report. |
| 3.2 | Other Independent Expert Persons |
Other expert persons relied upon for the development of the study:
| § | Dra Patricia Inzirillo, Lawyer, contributed towards the sections relating to the management of mining and exploration claims in Argentina; |
| § | Jorge Gomez, Electrical Engineer employed by Servicios de Ingenieria Electrica y Electromecanica SRL (Sie y E), led the preliminary studies on power line design and capital costs; |
| § | Gabriel Valero and Victor D’Amico, Ausenco Vector SA (Mendoza), assisted with the compilation of information related to the design and costing of the TSF; |
| § | Guillermo Albornoz, Senior Mining Engineer employed by AKL, led the preliminary studies related to geomechanical characterization, pit slope angles, underground stope designs, and crown pillar calculations; |
| § | Mario Cuello, Geologist, employed by Ausenco (Mendoza), assisted with the preliminary studies on hydrology and hydrogeology, mine closure plans and costs, and environmental and social issues; |
| § | Leonardo Minguinelli, Consulting Hydrogeologist employed by Ausenco (Mendoza), performed calculations relating to ground water flow rates. |
Extorre Gold Mines Limited
Cerro Moro Gold – Silver Project
Preliminary Economic Assessment | Page 58 |
| 4. | PROPERTY DESCRIPTION AND LOCATION |
Cerro Moro is located approximately 70 km (90 km by road) southwest of the port city of Puerto Deseado, Santa Cruz Province, southern Argentina (Figure 4).
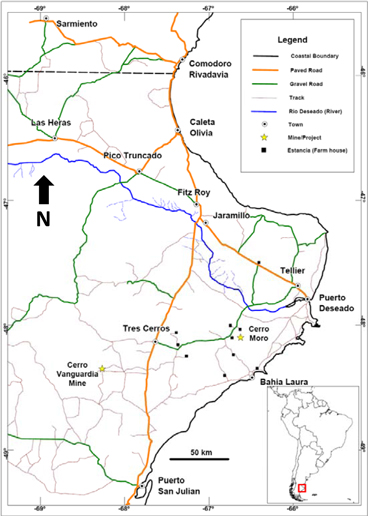
Figure 4 Location and Access Map (Source: Extorre, 2011)
The Project area is geographically centred at approximately 48° 01’ 55” south latitude and 66° 33’ 45” west longitude. Access to the Project is via 20 km of paved road (Provincial Highway 281) from Puerto Deseado to the locality of Tellier, followed by 70 km of all-weather gravel road (Provincial Route 47) to the Project turnoff. The Project area is characterized by low altitudes (70 m to 150 m above mean sea level), flat to undulating relief, and a cool, dry climate typical of the Patagonian pampa (plains).
Extorre Gold Mines Limited
Cerro Moro Gold – Silver Project
Preliminary Economic Assessment | Page 59 |
The Project currently comprises eighteen tenements covering an area of approximately 177 square km (Figure 5). Two of these tenements are cateos, with the remainder being Manifestaciones de Descubrimiento (“MD”).

Figure 5 Exeter Property Tenement Map (Source: Exeter, 2009a)
| 4.3 | Company Ownership and Agreements |
Mineral rights in Argentina are acquired through application to the government for concessions to either explore for or mine minerals located within a specified parcel of land (and not through ground staking). Generally, all persons or entities qualified to acquire and possess real estate can obtain mineral rights. There are 3 main types of mineral rights and titles, these being described in detail below:
‘Cateo’ - Before work may commence in an area, an exclusive exploration permit known as a “cateo” must be obtained. Once an application is submitted all rights to any mineral discoveries on a cateo by third parties belong to the applicant. A cateo is measured in 500 hectare (“ha”) units and can range in size from a minimum of 1 unit (500 ha) to a maximum of 20 units (10,000 ha). The approval of a cateo specifies the area and the term of the cateo. A one-time fee of $0.80 per ha is due on application for the cateo. The rights of the cateo holder are subject to surface rights.
Extorre Gold Mines Limited
Cerro Moro Gold – Silver Project
Preliminary Economic Assessment | Page 60 |
During the term of a cateo, which begins 30 days after approval, periodic relinquishment of ground is made such that after 300 days from the date of approval, 50% of the area in excess of 4 units must be relinquished and after 700 days, 50% of the remaining area must be relinquished. A cateo of 1 unit has duration of 150 days and for each additional unit, its duration is increased by an additional 50 days.
‘Manifestacion de Descubrimiento’ – upon discovery of a mineral occurrence within a cateo, the owner can apply for a Manifestacion de Descubrimiento (“MD”) to protect the discovery. The application for a MD can be made at any time during the term of the cateo but must be made before the expiry of the cateo. The maximum area of one MD is 3,000 ha. Upon verification and approval of the mineral discovery by the authorities, the MD will protect the mineral discovery until such time as the “mensura” (measurement) process begins leading to the eventual grant of a Mina (mining lease).
‘Mina’ - After the size and configuration of a MD are determined, a part or all of it is surveyed and the area applied for a ‘Mina’ or Mining Lease. This is usually done after the results of exploration indicate a potential mineralized zone.
| 4.4 | Title Agreements and Ownership |
A listing of the Cerro Moro tenements is provided in Table 18.
Extorre Gold Mines Limited
Cerro Moro Gold – Silver Project
Preliminary Economic Assessment | Page 61 |
| Number | | | Letter | | | Year | | | Title Holder | | Type | | | Name | | Area
(Hectares) | |
| | 407082 | | | | M | | | | 1993 | | | Estelar (ex-CVSA)* | | | MD | | | Bárbara II | | | 420 | |
| | 407083 | | | | M | | | | 1993 | | | Estelar (ex-CVSA) | | | MD | | | Michelle | | | 420 | |
| | 407084 | | | | M | | | | 1993 | | | Estelar (ex-CVSA) | | | MD | | | Michelle II | | | 420 | |
| | 407087 | | | | M | | | | 1993 | | | Estelar (ex-CVSA) | | | MD | | | Bárbara I | | | 420 | |
| | 407088 | | | | M | | | | 1993 | | | Estelar (ex-CVSA) | | | MD | | | Bárbara | | | 420 | |
| | 407101 | | | | M | | | | 1993 | | | Estelar (ex-CVSA) | | | MD | | | Michelle I | | �� | 420 | |
| | 407102 | | | | M | | | | 1993 | | | Estelar (ex-CVSA) | | | MD | | | Nini | | | 420 | |
| | 412988 | | | | M | | | | 1995 | | | Estelar (ex-CVSA) | | | MD | | | Hansen I | | | 3,000 | |
| | 412989 | | | | M | | | | 1995 | | | Estelar (ex-CVSA) | | | MD | | | Hansen II | | | 3,000 | |
| | 412990 | | | | M | | | | 1995 | | | Estelar (ex-CVSA) | | | MD | | | Hansen III | | | 3,000 | |
| | 412991 | | | | M | | | | 1995 | | | Estelar (ex-CVSA) | | | MD | | | Hansen | | | 2,500 | |
| | 412992 | | | | M | | | | 1995 | | | Estelar (ex-CVSA) | | | MD | | | Nini I | | | 402 | |
| | 412993 | | | | M | | | | 1995 | | | Estelar (ex-CVSA) | | | MD | | | Nini II | | | 408 | |
| | 404908 | | | | C | | | | 2002 | | | Estelar (ex-CVSA) | | | MD | | | La Virginia | | | 699 | |
| | 401961 | | | | E | | | | 2007 | | | Estelar | | | MD | | | Robertino | | | 976 | |
| | 411600 | | | | E | | | | 2004 | | | Estelar | | | MD | | | Williams | | | 74 | |
| | 402342 | | | | E | | | | 2007 | | | Estelar | | | Cateo | | | Edward | | | 185 | |
| | 402343 | | | | E | | | | 2007 | | | Estelar | | | Cateo | | | Matthew | | | 493 | |
| | | | | | | | | | | | | | | | | | | Total Hectares | | | 17,677 | |
Table 18 Cerro Moro Tenements (Source Extorre, 2011)
| 4.4.1 | Estelar - CVSA Option Agreement |
On the 30th of December, 2003 Cerro Vanguardia Sociedad Anonima (“CVSA”) and Estelar signed an agreement granting Estelar the right to undertake exploration and prospecting work on 39 CVSA properties (“Properties”) described in schedule “A” (“Agreement”).
The Agreement provides Estelar with the exclusive right to acquire a 100% interest in the Properties contained in four projects (located in three Argentine provinces; Rio Negro, Chubut and Santa Cruz) by incurring exploration expenditures of US$3 million over five years, with minimum expenditures in years one and two of $250,000 and $500,000, respectively, followed by $750,000 in each of years three through five including completing 8,000 m of drilling. Estelar completed a legal due diligence review over of the Properties in March, 2004. The Agreement does not require Estelar to issue shares or make any cash payment to CVSA, other than a signature fee of US$100,000 which was fully paid in September, 2004.
Estelar exercised its Option to acquire the Properties in 2007, having incurred US$3 million on exploration. Once Estelar completes 10,000 m of drilling on any project, CVSA has the right to back into a 60% interest in that project by paying Estelar 2.5 times Estelar's expenditures on that project and by carrying Estelar to the completion of a bankable feasibility study. CVSA may earn an additional 10% project interest (to bring its total interest to 70%) by financing Estelar's share of mine development costs (to be repaid at an agreed rate). Should CVSA not elect to back-in to a project, its interest will reverts to a 2% net smelter return (NSR) from production on that project.
Extorre Gold Mines Limited
Cerro Moro Gold – Silver Project
Preliminary Economic Assessment | Page 62 |
Estelar completed 10,000 m of drilling at Cerro Moro at the end of July, 2007 and following data collation and the receipt of drilling assays, delivered to CVSA a detailed report containing all geological data in early September 2007. CVSA then had a 45 day period in which to exercise its back-in right or its interest would revert to a 2% NSR. On the 29th of October, 2007 CVSA notified Estelar that they would not to exercise their back-in right.
| 4.4.2 | Estelar - Fomicruz Agreement |
On the 5th of March, 2008 Estelar and Fomento Minera de Santa Cruz Sociedad del Estado1 (“Fomicruz”), announced it had signed a letter of intent (“LOI”) that set out the key terms of a strategic agreement between Estelar and Fomicruz for the future development of the Project which also provides access to Fomicruz’s significant land holding around Cerro Moro.
The LOI states that Estelar and Fomicruz SE will, subject to approval by the parties, enter into a detailed agreement which will include the following terms:
| § | Fomicruz SE will acquire a 5% interest in Estelar’s 177 square kilometre Project; |
| § | Estelar will have the right to earn up to an 80% interest in 691 square km of Fomicruz SE exploration properties (see Figure 6) adjoining the Project by incurring US$10 million in exploration expenditures over a number of years; |
| § | Estelar will fund all exploration and development costs of the Project and Fomicruz SE will repay an agreed amount of those costs from 50% of Fomicruz SE’s share of net revenue from future operations; and |
| § | Estelar will manage the exploration and potential future development on the properties. |
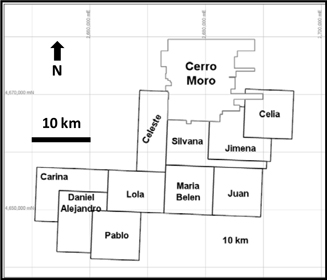
Figure 6 Fomicruz Property Tenement Map (Source: Extorre, 2011)
1Fomicruz is a company owned by the Government of Santa Cruz Province, Argentina
Extorre Gold Mines Limited
Cerro Moro Gold – Silver Project
Preliminary Economic Assessment | Page 63 |
| 4.4.3 | History of Cerro Moro Acquisition |
Cerro Moro was discovered in 1993 by Mincorp Explorations S.A. (“Mincorp”), while investigating Landsat Thematic Mapper (“TM”) satellite imagery colour alteration anomalies. The ensuing exploration program, comprising geological mapping, rock chip geochemistry, and drilling led to the discovery of widespread quartz vein structures, variably mineralized, over more than a hundred square kilometre area.
Mincorp collected a total of 2,982 surface samples: 2,163 of these were from trenches and rock chip channel samples, with the remaining 819 samples being select rock chip samples. In addition, Mincorp completed a total of 34 drill holes for 2,593 m, comprised of 19 diamond drill holes for 1,016 m and 15 reverse circulation (“RC”) percussion drill holes for 1,577 m.
In 2001 the rights of the property were transferred to Cerro Vanguardia Sociedad Anonima (“CVSA”) following the corporate takeover of Mincorp.
On the 30th of December, 2003 CVSA and Estelar2 signed an Exploration and Option Agreement (“Agreement”) granting Estelar the right to undertake exploration and prospecting work on 39 CVSA properties described in schedule “A” of the Agreement. Details of this Agreement have been provided in Section 4.4.1.
Since commencing work in June, 2003, Estelar has carried out diverse exploration activities at Cerro Moro including detailed geological mapping, geochemical sampling (rock, soil, LAG), geophysical surveys (ground magnetic and electrical methods), and diamond and reverse circulation drilling.
In March 2009, Estelar and the Fomento Minero de Santa Cruz Sociedad del Estado (“Fomicruz”), the Santa Cruz provincial mining company, signed a definitive agreement over ten Fomicruz concessions located adjacent to the Cerro Moro concessions. By spending a total of $10,000,000 on exploration on these concessions, Estelar has the option to acquire an 80% interest in the Fomicruz properties. In addition, Fomicruz will acquire a 5% participating interest in Cerro Moro following the granting of all the required exploitation concessions and permits to commence mining.
On February 11, 2010 Exeter announced its intention to spin out its Argentine assets (held by subsidiaries Estelar and Cognito) into a new company to be known as Extorre Gold Mines Limited (“Extorre”). This transaction was approved by Canandian regulatory authorities and completed on March 23, 2010. Extorre holds all of Exeter’s former interests in the Cerro Moro and Don Sixto Projects, in addition to its portfolio of exploration projects in Argentine, and received an initial C$25 million from Exeter. All work conducted prior to March, 2010 has been referenced to Exeter within this technical report.
2The Agreement was made between CVSA and Estelar with Exeter providing completion guarantees.
Extorre Gold Mines Limited
Cerro Moro Gold – Silver Project
Preliminary Economic Assessment | Page 64 |
| 4.5 | Environmental Liabilities and Permitting |
Table 19 shows the schedule of filing, approval, and notification dates for the 5 exploration / advanced exploration permits (Environmental Impact Statements, or EIS’s) and one development permit (Environmental Impact Assessment, or EIA) that have been approved to date by the Santa Cruz Provincial Authorities for the Project. Under Santa Cruz Provincial legislation, all environmental permits have a validity of two years and, in order to allow work to continue, must be renewed prior to their respective expiry dates. All valid environmental permits for Cerro Moro are held in the name of Extorre’s subsidiary in Argentina, Estelar.
| Company | | Filing Date | | Grant Date | | Notification Date | | Expiry Date | | Project Stage |
| MINCORP EXPL. SA | | 23/05/97 | | 23/06/97 | | 15/07/97 | | 15/07/99 | | Exploration |
| MINCORP EXPL. SA | | 29/06/99 | | N/D | | N/D | | N/D | | Exploration |
| CERRO VANGUARDIA SA | | 08/04/05 | | 20/02/06 | | 24/02/06 | | 24/02/08 | | Exploration |
| ESTELAR RESOURCES LTD. | | 09/10/08 | | 30/03/09 | | 28/05/09 | | 28/05/11 | | Exploration |
| ESTELAR RESOURCES LTD. | | October 2010 | | 13/12/10 | | 15/12/10 | | 15/12/12 | | Advanced Expl. |
| ESTELAR RESOURCES LTD. | | 17/09/2010 | | 16/05/11 | | 16/05/11 | | 16/05/13 | | Development |
Table 19 Schedule of the filing of the Environmental Impact Assessments (EIAs)
In September 2010, the EIA for the proposed Cerro Moro Mine Development was submitted to Santa Cruz Authorities. This EIA considered the development of an initial 750 tpd mining/processing option for Cerro Moro, and was approved by the competent authority in May 2011; thus, permits were granted to start the construction of the infrastructure required for Project development and the deposit mining/operation stage.
Extorre Gold Mines Limited
Cerro Moro Gold – Silver Project
Preliminary Economic Assessment | Page 65 |
| 5. | Access, Climate, Local Resources, Infrastructure and Physiography |
Cerro Moro is located 70 km (90 km by road) southwest of the port city of Puerto Deseado, Santa Cruz Province, southern Argentina.
The Project area is geographically cantered at approximately 48° 01’ 55” south latitude and 66° 33’ 45” west longitude.
Access to the Project is via 20 km of paved road (Provincial Highway 281) from Puerto Deseado to the locality of Tellier, followed by 70 km of all weather gravel road (Provincial Route 47) to the Project turnoff.
The Project is situated in a climatic zone that is classified as semi-arid, with temperatures ranging from minimums of minus 10 degrees Celsius to maximums of 20 degrees Celsius. The bulk of the rainfall and occasional snow fall during the winter months (May – September), and the area is affected by moderate to strong winds.
| 5.3 | Local Resources and Infrastructure |
The area surrounding the Project is sparsely populated. Farm stations or ‘estancias’ consisting of one to a few houses dot the country side, the majority occurring several kilometres apart. Traditionally, the main source of income in the Project area has been derived from the raising of sheep.
The operating Cerro Vanguardia Gold Mine (“Cerro Vanguardia”), owned and operated by CVSA, is located approximately 130 km (approximately 200 km by road) to the west-southwest of the Project.
The nearest regional centres are Puerto Deseado (pop. 17,000), Puerto San Julian (pop. 6,000), Caleta Olivia (pop. 36,000; located 210 km by road to the north-west), and Comodoro Rivadavia (pop. 200,000; located 290 km by road to the north-northwest of the Project area. The city of Rio Gallegos (pop. 79,000), the capital of Santa Cruz Province, is located approximately 500 km by road to the south of the Project. These major centres are able to provide basic goods and services, in addition to being connected to the national power grid.
Comodoro Rivadavia and Rio Gallegos are serviced with national airports. A well maintained concrete airstrip is located at Puerto Deseado, serviced via small to mid-size charter aircraft.
The Project area is characterized by low altitudes (70 m to 150 m above mean sea level), flat to undulating relief, and a cool, dry climate typical of the Patagonian pampa (plains).
Extorre Gold Mines Limited
Cerro Moro Gold – Silver Project
Preliminary Economic Assessment | Page 66 |
Cerro Moro has very low relief with an average elevation of 100 m above sea level. No permanent surface watercourses exist within the Project, and several saline lagoons and saltpans are scattered throughout the area.
Extorre Gold Mines Limited
Cerro Moro Gold – Silver Project
Preliminary Economic Assessment | Page 67 |
Cerro Moro was discovered in 1993 by Mincorp Explorations S.A. (“Mincorp”), while investigating Landsat Thematic Mapper (“TM”) satellite imagery colour alteration anomalies. The ensuing exploration program, comprising geological mapping, rock chip geochemistry, and drilling led to the discovery of widespread quartz vein structures, variably mineralized, over more than a hundred square kilometre area.
Mincorp collected a total of 2,982 surface samples: 2,163 of these were from trenches and rock chip channel samples, with the remaining 819 samples being select rock chip samples. In addition, Mincorp completed a total of 34 drill holes for 2,593 m, comprised of 19 diamond drill holes for 1,016 m and 15 reverse circulation (“RC”) percussion drill holes for 1,577 m.
In 2001 the rights of the property were transferred to Cerro Vanguardia Sociedad Anonima (“CVSA”) following the corporate takeover of Mincorp.
On the 30th of December, 2003 CVSA and Estelar3 signed an Exploration and Option Agreement (“Agreement”) granting Estelar the right to undertake exploration and prospecting work on 39 CVSA properties described in schedule “A” of the Agreement. Details of this Agreement have been provided in Section 4.4.1.
Since commencing work in June, 2003, Estelar has carried out diverse exploration activities at Cerro Moro including detailed geological mapping, geochemical sampling (rock, soil, LAG), geophysical surveys (ground magnetic and electrical methods), and diamond and reverse circulation drilling.
In March 2009, Estelar and the Fomento Minero de Santa Cruz Sociedad del Estado (“Fomicruz”), the Santa Cruz provincial mining company, signed a definitive agreement over ten Fomicruz concessions located adjacent to the Cerro Moro concessions. Details of this Agreement have been provided in Section 4.4.2.
On February 11, 2010 Exeter announced its intention to spin out its Argentine assets (held by subsidiaries Estelar and Cognito) into a new company to be known as Extorre Gold Mines Limited (“Extorre”). This transaction was approved by Canandian regulatory authorities and completed on March 23, 2010.
On April 19, 2010 Extorre announced the second NI 43-101 compliant mineral resource estimate for Cerro Moro. This updated mineral resource estimate contains both Indicated and Inferred category resources. The April 2010 mineral resource estimate was the first undertaken by Cube and follows a previous estimate undertaken by Snowden Mining Industry Consultants announced on 8th July, 2009 (Bargmann et al, 2009). A PEA based on this mineral resorce was completed in the fourth quarter of 2010 and indicated the potential of the Project to support a low capital cost high grade gold – silver mining operation. Of particular importance are the high grade Escondida prospects.
3The Agreement was made between CVSA and Estelar with Exeter providing completion guarantees.
Extorre Gold Mines Limited
Cerro Moro Gold – Silver Project
Preliminary Economic Assessment | Page 68 |
The primary focus of drilling activities for the April 2010 mineral resource statement was infill and extensional drilling on the Escondida prospect. Infill drilling to 20m x 20m was completed to upgrade the substantial portions of the Escondida prospect to the Indicated mineral resource category, in those areas where open-pit and underground mining activity is likely to be scheduled in the early stages of a mine development. In addition, resource drilling was also undertaken to define mineral resource extensions to the Escondida prospect. By the 12th of February, 2010 - the data cut-off date for April 2010 mineral resource estimate - a total of 887 drill holes for 97,302.10 m had been completed at Cerro Moro.
Between the 12th of February, 2010, and the 31st of May, 2011, exploration activities at Cerro Moro were focused primarily on testing the resource potential of extensions to the known mineralized structures (Escondida, Loma Escondida, Gabriela, Esperanza, Carla, Deborah, Deborah Parallel, Dora, Lucia, Michelle, Natalia, Nini, Patricia and Tres Lomas). New areas without previous drilling were also tested during this period and included Agostina, Belen, and notably Zoe, where a significant high grade gold-silver discovery has been made on the eastern part of the Escondida structure. Additional infill drilling was also conducted at the Loma Escondida, Martina, Carla, and Gabriela prospects. An updated NI 43-101 compliant mineral resource estimation for Cerro Moro was completed by Cube in April 2011, and incorporated results from infill and extensional drilling completed on the Escondida, Loma Escondida, and Gabriela zones up until January, 2011.
On November 3, 2011, Extorre announced a further updated mineral resource estimate for the Project which was completed by Cube. The November 2011 mineral resource included updates for the existing Gabriela and Esperanza prospects and maiden mineral resource estimates for the Zoe, Martina, Carla and Nini prospects. All drilling data available as of October 10, 2011 was used for the resource estimation. This technical report describes all relevant details with respect to the November 2011 mineral resource estimate. As of October 10, 2011, the data cut-off date for November 2011 resource estimate, a total of 1,490 drill holes for 209,075.1m had been completed at Cerro Moro. This mineral resource is discussed further in Section 14.
| 6.2 | Recent Exploration at Cerro Morro |
At the effective date of this technical report, a total of four diamond drill rigs were operating at Cerro Moro with the primary task of delineating additional gold-silver resources. The Project is an advanced stage exploration project in which a number of discrete mineralized vein zones have been identified. As of January 31, 2012, a total of 1,544 drill holes for 222,769.4m had been completed at Cerro Moro.
Extorre Gold Mines Limited
Cerro Moro Gold – Silver Project
Preliminary Economic Assessment | Page 69 |
Development at the Cerro Moro site is limited to farm buildings, portable accommodation, gravel roads and minor service infrastructure to support exploration activities. There is no historical or small scale artisanal mining on the property.
Extorre Gold Mines Limited
Cerro Moro Gold – Silver Project
Preliminary Economic Assessment | Page 70 |
Cerro Moro is geologically located within the Deseado Massif, which is a tectonic block in the central-portion of the Santa Cruz Province, covering an area of approximately 60,000 square kilometres.
The oldest rocks within the Deseado Massif are the Upper Pre-Cambrian and Lower Palaeozoic metamorphics of the La Modesta Formation (also known as the Rio Deseado Complex). This formation is intruded by granites of Lower to Middle Palaeozoic age. These rocks are in turn unconformably overlain by continental sandstone of the La Golondrina and El Tranquilo Formations, which were deposited in a series of graben and half-graben structures.
During the Jurassic and Cretaceous Periods the region underwent extensional tectonics, which initially resulted in the epiclastic and pyroclastic Roca Blanca Formation, followed by the widespread mafic volcanic field of the Bajo Pobre Formation during the Mid-Jurassic. During the Mid and Upper Jurassic these rocks were overlain by felsic and intermediate volcanics and sediments of the Bahia Laura Group. The Bahia Laura Group includes the Chon Aike and La Matilde Formations. The Chon Aike Formation constitutes a thick sequence of rhyolitic ignimbrites, tuffs and volcaniclastics, and is interpreted to host the gold mineralization at Cerro Moro.
During the Early Tertiary Period – Paleocene Epoch the region was draped with continental and marine sediments. More recently, during the Late Tertiary Period to Pleistocene Epoch, basaltic lava flows were extruded but these are not observed at Cerro Moro (refer to Figure 7).
Extorre Gold Mines Limited
Cerro Moro Gold – Silver Project
Preliminary Economic Assessment | Page 71 |

Figure 7 Regional Geology and Schematic Columnar Section (Source: Extorre, 2011)
Extorre Gold Mines Limited
Cerro Moro Gold – Silver Project
Preliminary Economic Assessment | Page 72 |
The Cerro Moro property is interpreted to be underlain by shallow south dipping Jurassic age volcanic stratigraphy broadly assigned to the Bahia Laura Group which is regionally documented to encompass:
| 1. | the Bajo Pobre Formation; which comprises tuffs, flows and sub-volcanic intrusives of andesitic to basaltic composition, |
| 2. | the Chon Aike Formation; the two principal components of which are the rhyolitic ignimbritic pyroclastic facies plus a late intrusive/extrusive flow-domes facies, and |
| 3. | the Matilde Formation; characterized by more epiclastic and aerially deposited ash rich volcaniclastic deposits that are observed to interdigitate or form a lateral facies variation to the main Chon Aike Formation sequence. |
A little over 30% of the Project is covered by Tertiary marine sediments and Quaternary gravels.
In 2008 contract geologist Nick Callan mapped the entire Project at a scale of 1:10,000 (refer to Figure 8 to Figure 11 for an Interpreted Geology map and accompanying legends). The following geological description is largely taken from his report (Callan, 2008).
Some 14 stratified volcanic units, were defined, that form mappable entities at 1:10,000 scale. These units may be grouped into five broad packages based on inferred ages (refer to Figure 12), composition, lithological characteristics and spatial relationships:
| 1. | The oldest of these packages is the P1 group, comprising an extensive pile of coarse rhyolite clast-bearing ash-flow tuffs and remnant flow-domes, the upper part of which is punctuated by several closely associated welded ignimbritic horizons of rhyodacitic to locally more dacitic composition. The P1 group was assigned to the Chon Aike Formation. |
| 2. | The P1 group forms an extensive litho-structural domain covering a large part of the property, the southern boundary of which is defined by an arcuate, linked normal fault system formed by the interaction of the northwest striking Escondida Fault and the informally named northeast striking Deborah South Fault. Post-P1 group stratigraphy, showing shallow south to southeast dips, is generally confined to the corresponding down-thrown structural domain lying to the south of this linked normal fault system. Field evidence suggests that this linked fault system was active during deposition of the post-P1 group volcanic stratigraphy. |
Extorre Gold Mines Limited
Cerro Moro Gold – Silver Project
Preliminary Economic Assessment | Page 73 |
Unconformably overlying the P1 group is a compositionally distinct volcanic-sedimentary assemblage of andesitic to basaltic composition comprising bedded volcanic sediments, coarse volcanic breccias, flows and possibly concordant sub-volcanic intrusive units. Tentatively this assemblage is inferred to represent a short-lived overlap of the Bajo Pobre Formation with the Chon Aike Formation which dominates the property geology.
| 3. | This more intermediate compositional interlude is overlain, again unconformably, by a bedded series of felsic air-fall tuffs and related epiclastic units, characterized by the presence of wood fragments, accretionary lapilli and local hot-spring “sinter”. The latter features are diagnostic of the Matilde Formation of the Jurassic age Bahia Laura Group. |
| 4. | The bedded tuff and epiclastic unit pass gradationally upwards via a thin “transitional” stratified sequence characterized by pumice-bearing vitric tuffs beds into the youngest mapped volcanic group, comprising a crudely stratified sequence of strongly welded ignimbritic tuffs of rhyolitic composition. Callan (2008) also considered this latter group to be part of the Chon Aike Formation. |
| 5. | Hosted within the stratified volcanic pile is a series of co-genetic, texturally diverse rhyolitic units forming simple and composite intrusive flow-domes, as well as dykes on a variety of scales. Emplacement of the rhyolitic units was strongly influenced by structure. Rhyolitic intrusives are for the most part discordant with host volcanics though some locally sub-concordant relations were observed by Callan (2008). Cross-cutting relationships with the younger mapped stratigraphic units indicate much of the rhyolite intrusive activity occurred quite late in the geological evolution of the sector. |
The area mapped by Callan (2008) is characterized by complex structural architecture comprising a mesh of steeply dipping to sub-vertical fault structures showing principally northwest to west-northwest strikes, northeast strikes, west-southwest strikes and more northeast to north-northeast strikes. “Several of the major mapped fault structures (e.g.: the west-northwest to northwest striking Escondida Fault, the northeast striking Deborah South Fault, and the northwest striking Deborah-Belen Fault) record evidence of a significant normal component of displacement over much of their kinematic history. Normal displacement occurred on some structures (e.g.: Escondida Fault, Deborah South Fault) synchronously with deposition of the post-P1 sequence and these structures very likely exerted some control on the primary distribution of volcanic units and Jurassic palaeo-topography. Normal or oblique faulting and associated dilation on variably oriented fault structures also likely controlled emplacement and geometry of rhyolite flow-domes and related dykes, and more importantly provided sites for epithermal Au-Ag vein mineralization. Post-mineral movement also occurred, localizing late rhyolitic intrusive activity, offsetting and brecciating vein mineralization, and locally preserving high-level alteration types. Thus a long-lived extensional structural regime prevailed and played an active role during much of the geological development of the area. This extensional regime is now manifest as widespread block-faulting with generally minor dip-slip or oblique slip on most faults, but with a locally more significant normal component of displacement across master faults (e.g.: Escondida Fault, Deborah South Fault).” (Callan, 2008).
Extorre Gold Mines Limited
Cerro Moro Gold – Silver Project
Preliminary Economic Assessment | Page 74 |
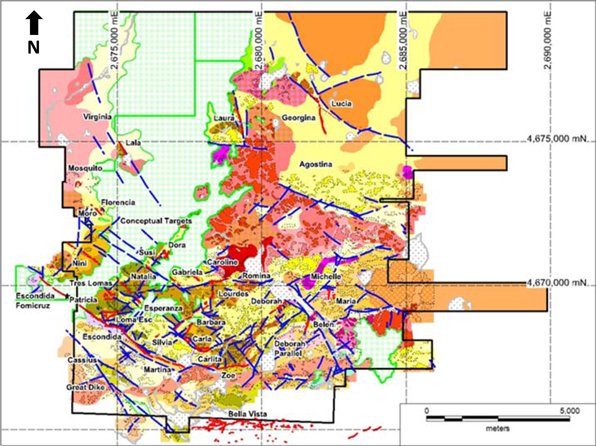
Figure 8 Interpreted Geology and Vein Location Map (Source: Extorre, 2011)
Extorre Gold Mines Limited
Cerro Moro Gold – Silver Project
Preliminary Economic Assessment | Page 75 |
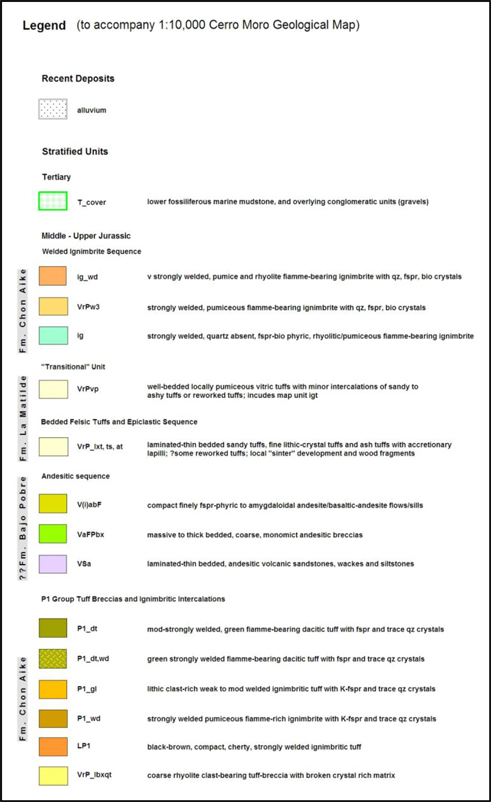
Figure 9 Legend for Figure 8 (Part 1 of 3)
Extorre Gold Mines Limited
Cerro Moro Gold – Silver Project
Preliminary Economic Assessment | Page 76 |
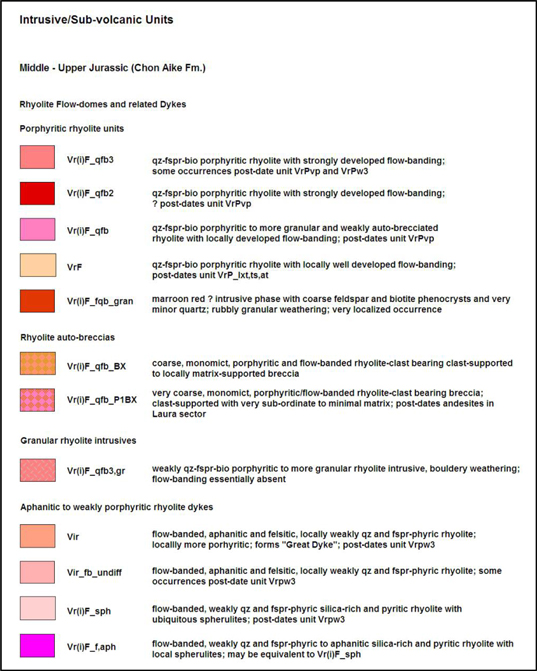
Figure 10 Legend for Figure 8 (Part 2 of 3)
Extorre Gold Mines Limited
Cerro Moro Gold – Silver Project
Preliminary Economic Assessment | Page 77 |
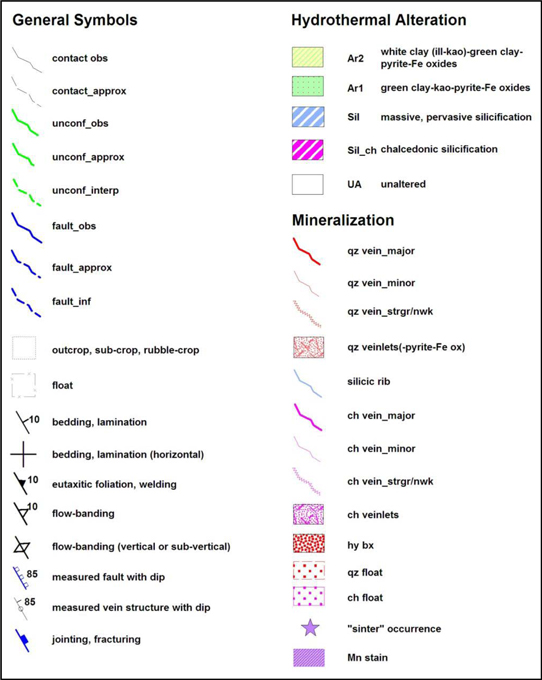
Figure 11 Legend for Figure 8 (Part 3 of 3)
Extorre Gold Mines Limited
Cerro Moro Gold – Silver Project
Preliminary Economic Assessment | Page 78 |
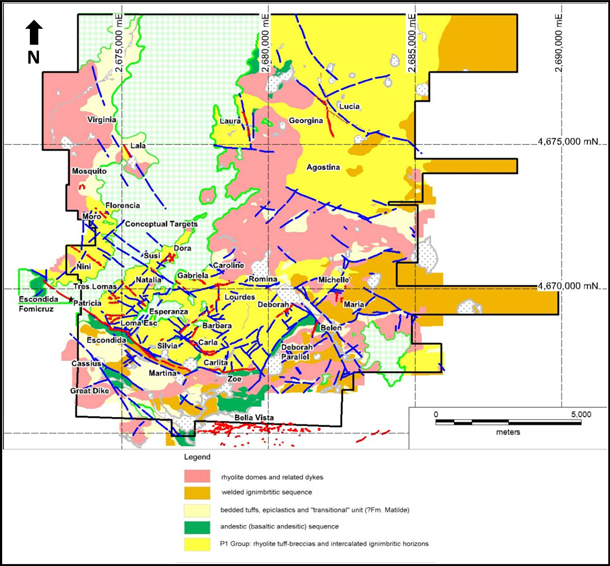
Figure 12 Geological Summary Map (Source: Extorre, 2011)
| 7.3 | Deposit Geology and Mineralization |
Polymetallic gold-silver mineralization is associated with epithermal veins. High-grade gold and silver mineralization is strongly associated with the presence of sulphides such as: pyrite, sphalerite, galena, acanthite and chalcopyrite. Detrimental toxic elements such as arsenic and mercury are at relatively low levels. The presence of yellow sphalerite and adularia are indicative of low temperature mineralization formation. At least two mineralization pulses have been observed. The first pulse deposited clean white quartz veins with low sulphide content and is generally poorly mineralized. This has been interpreted as the product of shallow, circulating meteoric dominated water with scarce mixing of magmatic water. A second, later pulse, consisting of black silica is rich in sulphides and hosts high-grade mineralization. Precious metal deposition is interpreted to be the product of mixing of magmatic dominated water with meteoric waters. Boiling textures, vein breccias and repeated quartz overgrowths with sulphidic ginguro bands are also observed. Coarse silver sulphide (acanthite) and electrum have been observed in several mineralized shoots and are common in the high grade shoots hosted in the Escondida structure Figure 13 shows the distribution of the various veins at Cerro Moro.
Extorre Gold Mines Limited
Cerro Moro Gold – Silver Project
Preliminary Economic Assessment | Page 79 |
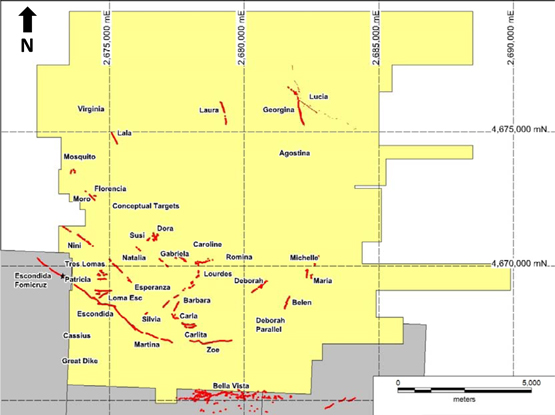
Figure 13 Cerro Moro Prospect Locations (Source: Extorre, 2011)
At the Escondida prospect work has concentrated on six main areas, designated here from east to west as Zoe, Martina, Escondida Far East, Escondida East, Escondida Central, Escondida West and Escondida Far West. Exploration drilling commenced on the Central and Western areas. Initially these two areas were thought to be two separate veins, but they have proven to be separate shoots within one continuous structure which traverses the entire property.
The Escondida structure has been followed with drilling for approximately 8 km, and remains open along strike and at depth. The width of the mineralization varies between 0.1 to 5 m on average. Drilling has shown that the mineralization continues to a minimum depth of 250 m below the present land surface. The Escondida structure has in general a northwest-southeast strike where high grade shoots are localised where the structure changes strike to east-west or west-northwest. This is the case for the Central, West and Far West high-grade shoots. The newly discovered Zoe Shoot is hosted in a long segment with east west strike. The Escondida quartz veins occur within this major north-west, pre-mineral fault, dipping between 70 to 85 degrees to the south-west. The fault is interpreted to have pre-, syn- and post-mineralization movement. To the north of the fault, the foot-wall rocks consist of volcanics, and to the south, the hanging-wall rock consists of sandstones. High-grade mineralization is strongly associated with a relatively late, black silica pulse of quartz which crosscuts and fills breccia voids within an earlier white quartz-adularia phase. The black silica is rich in coarse sulphides including; galena, sphalerite, pyrite, chalcopyrite and acanthite.
Extorre Gold Mines Limited
Cerro Moro Gold – Silver Project
Preliminary Economic Assessment | Page 80 |
Zoe is the name given to a new high grade shoot on the Escondida structure located approximately 3.4 km and 2.4 km to the southeast of the Escondida Far East and Martina shoots, respectively. The style of mineralization at Zoe is similar to the other high grade shoots on the Escondida structure. To date the significant mineralization has been traced for approximately 600 m along strike and to a depth of approximately 250 m from surface. The significant mineralization itself does not outcrop but a small section occurs relatively close to the surface and achieves a greater lateral extent at depth. The main vein is developed in the Escondida fault contact between andesitic sandstone (hangingwall) and rhyodacitic ignimbrites and intrusive felsic breccias (footwall). Mineralization is related to quartz-adularia and black silica material, rich in base metal sulphides. Coarse electrum and gold is observed in some of the high grade intersections. The Zoe vein is a prominent structure with thicknesses varying between 0.5 to 6 m. The upper near surface portion of the structure is characterized by a narrow low grade shear zone which can contain mineralized fragments brought up from deeper levels. To date the significant mineralization has been traced for approximately 1,400 m along strike and to a depth of approximately 380 m from surface.
The Gabriela prospect is a north-west oriented quartz vein dipping between 60 to 80 degrees to the north-east. Recent drilling and discovery of a new shoot to the south east has extended the strike length to 1.3 km. The width of the mineralized zone varies between 10 to 20 m in the near surface central-southeastern part of the structure, and 3 to 5 m to the northwest and south east. Mineralization at Gabriela is substantially more silver-rich, compared to other prospects at Cerro Moro. The vein is mostly characterised by white quartz-adularia with disseminated fine pyrite (and possible acanthite). The vein has been tested to a maximum depth of 350 m from surface. Mineralization cuts several volcanic units.
The Esperanza prospect is a north-west structure with one or more quartz veins, which dip steeply to the north-east. At the north-west end of the prospect the veins have been emplaced within coherent andesite. Towards the south east sector (also termed the Esperanza South-East prospect) the main structure displaces rhyodacite to the north and rhyolite to the south. The mineralization to the south-east is characterised by a 15 metre wide stock-work zone between several higher grade veins. Recent drilling has extended the Esperanza structure to the north-west as far as the Nini vein and now has a known strike length of approximately 2 km. The mineralization has been drilled to a vertical depth of approximately 120 m. The main veins are 1 to 3 m in width. Gold-silver mineralization is associated with disseminated fine pyrite, copper, lead, and zinc sulphides within quartz veins. Sulphidic ginguro banding, with pyrite, chalcopyrite and sphalerite within quartz veining is observed in high grade zones.
Extorre Gold Mines Limited
Cerro Moro Gold – Silver Project
Preliminary Economic Assessment | Page 81 |
The structure is presently open at depth at several points. The north-west extension of the Esperanza structure has recently been tested by drilling, confirming that the Esperanza and Nini prospects are hosted in the same structure. The host rock is a rhyodacitic ignimbrite with fiammes.
The Loma Escondida vein is an east-west structure dipping steeply to the north and is hosted entirely within andesite. This vein is located 500 m north of the Escondida prospect and has been interpreted as a secondary dilational structure formed by strike-slip movement of the major north-west structures. The vein crops out poorly, but has been followed by drilling and trenching for more than 600 m in length. It is a relatively narrow vein ranging in thickness from 0.30 to 2 m. Pyrite, galena, sphalerite and acanthite are associated with high-grade shoots.
The Silvia prospect consists of several east-west orientated breccia-vein sets located near the intersection of two major structures, the Esperanza-Nini structure and the Barbara structure. Outcrop is sparse, with scattered white quartz float over an area of 200 m by 350 m. The mineralization is complex with interpreted repeated brecciation; pre, syn and post mineralization. There are early quartz-adularia-sulphide (pyrite-galena-sphalerite-electrum) veins which have been brecciated and infilled with dark grey or white silica with minor base metal and coarse marcasite. An interpreted late phase consists of a barren breccia which contains clasts of all the previous events and is filled with a clay rock flour matrix. Vein widths vary between 1 to 4 m, and to date have been tested to a maximum depth of 125 m from surface.
The Nini prospect occurs as a major north-west vein structure which is partially covered by Tertiary sediments and has been traced by drilling and trenching for approximately 1.2 km in length. To the south-east the structure has been traced beneath Tertiary cover to the Esperanza structure indicating that these are the continuation of the same structure. In the north-west the vein dips shallowly to the north-east, with the hanging wall consisting of dacitic ignimbrite and the foot wall of andesitic lavas. In the central and south-eastern sectors of the structure the dip changes to 80 degrees to the north-east and the host rock is intermediate to rhyodacitic ignimbrite, in both the hanging wall and foot wall. The thickness is variable between 0.90 and 3.30 m. The predominant strike of the structure is north-westerly; however there are indications of potential east-west trending zones, which are presently thought to be more prospective for higher grades and widths. The mineralization is generally observed within a single quartz vein, however vein breccias and stock-works with disseminated sulphides have been observed in places.
Extorre Gold Mines Limited
Cerro Moro Gold – Silver Project
Preliminary Economic Assessment | Page 82 |
The Moro prospect is a north-west striking quartz vein structure with a north-east dip. It can be traced for at least 500 m, with widths ranging between 0.60 and 2.20 m. It is hosted in felsic to intermediate tuff and the mineralization is associated with a chalcedonic quartz veining with well developed lattice-blade textures and disseminated pyrite.
The Patricia prospect is an east-west, narrow quartz vein structure dipping steeply to the north and emplaced in coherent andesite, and rhyodacitic ignimbrites at depth. The area is partly covered by Tertiary and Quaternary sediments. The structure outcrops for 300 m, but is interpreted from the ground magnetics to continue for an additional 300 m to the west and 200 m to the east. High-grade gold and silver mineralization has been intersected in trenches and drill holes and is more elevated to the west, where the vein disappears under cover. This mineralization is associated with copper, lead and zinc sulphides in quartz veins, approximately 1 metre in width. It is currently interpreted that this east-west vein occurs within a similar structural setting to that of the Loma Escondida prospect to the south, and that both are secondary dilational structures formed by strike-slip movement of the major north-west structures such as Escondida and Esperanza.
The Deborah prospect is a north-east trending structure with a moderate north-west dip. The hanging wall rocks consist of felsic ignimbrite, and footwall rocks consist of intermediate to rhyodacitic ignimbrite. The vein has a total length of 700 m and mineralization has been tested to approximately 80 to 100 m vertical depth. The thickness is variable between 0.50 to 5 m.
The south-east portion of the structure continues under cover but can be traced for an additional 250 m in the ground magnetics. To the north-east the structure has been truncated by a north-west trending fault with apparent dextral displacement. The better gold-silver grades to date are located at the north-eastern end and are associated with white quartz vein breccias with a black silica matrix and disseminated sulphides (mostly pyrite). This truncating north-west trending structure (designated as the Deborah Termination Structure, “DTS”), clearly observed in the ground magnetic data, was originally interpreted as being post-mineral, however recent interpretations suggest that this could be a structure similar to that at Escondida, where recent drilling on the DTS has intersected anomalous gold values.
The Michelle prospect consists of several parallel sub-vertical quartz veins, trending approximately north-south to north-northeast. The veins have been tested by drilling and trenching over approximately 400 m in length and were found to be up to 2 m wide. The low-grade veins contain crystalline quartz with poorly developed coarse banding and occur in rhyolite.
Extorre Gold Mines Limited
Cerro Moro Gold – Silver Project
Preliminary Economic Assessment | Page 83 |
The Carla prospect contains a quartz vein stockwork and breccia vein which is sub parallel to a major north-west fault. This major fault has been interpreted as the same regional structure that controls the mineralization at the Esperanza and Nini prospects, however mineralized clasts within a tectonic breccia are evidence that it has had been reactivated after the mineralization. Patchy high grade mineralization has been followed by drilling and trenching for over 150 m and is truncated by the post mineral fault within 50 vertical metres of the surface. The thickness of the mineralization is variable between 1 to 10 m. High-grade mineralization is associated with hydrothermal black silica breccias rich in sulphides; including pyrite, galena, sphalerite (and acanthite?). The mineralization is emplaced close to a wide tectonic breccia zone that separates a felsic ignimbrite to the north and a coherent andesite unit to the south.
The Natalia prospect is a major northwest trending structure, located south of the Gabriela prospect and north of the Esperanza structure. The vein is characterised by low grade white massive quartz with disseminated fine pyrite with an interpreted late brecciation stage filled with a quartz-hematite matrix. The outcrop has been mapped for 200 m, but the ground magnetics and recent scout drilling suggest that the structure could be traced for 3 km, particularly to the northeast. The vein’s width varies between 1 to 2 m, but stock-work zones up to 4 m have been observed. The vein is emplaced in an interpreted fault contact between the rhyolite and rhyodacitic ignimbrite.
The Mosquito prospect is characterized by the presence of possible sinter caps and eruption breccias, which have been interpreted as the upper portion of a low sulphidation system. Loma Mosquito is located in the northern part of the property near the Virginia prospect and is the only place where sinters have been recognized. Drilling in this area has confirmed the presence of anomalous gold associated with shallow, east dipping eruption breccias and silicified tuff.
The Susy prospect is a northeast trending structure, clearly visible in the ground magnetic data, which may displace the north-western portion of the Gabriela structure. The vein is typically narrow (up to 1.5 m wide) and discontinuous with chalcedonic and minor crystalline quartz. The veining is hosted within dacitic, fiamme-bearing welded tuff and rhyolitic breccias. Initially traced by trenching and mapping by Mincorp for approximately 150 m, the drilling and ground magnetic data infer a strike length of approximately 700 m.
The Cassius prospect is a clay filled, approximately 2 kilometre long, northwest structure. It is approximately 800 m southwest of the Escondida prospect and trends sub-parallel to the Escondida structure. The Cassius structure juxtaposes the welded ignimbritic sequence to the north against the andesitic sequence to the south.
Extorre Gold Mines Limited
Cerro Moro Gold – Silver Project
Preliminary Economic Assessment | Page 84 |
The Carolene structure incorporates the Loma Stockwork prospect which was referred to in the previous PEA and a new structure which is 250m north of and parallel to the Gabriela resource. Recent drilling has confirmed narrow low-grade mineralization in pyritic quartz stock-work veining and a north-west trending vein up to 6 to 9 m in width, on the contact of la Matilde Formation to the north against Chon Aike volcanics to the south. This is interpreted to be the northern edge of the Chon Aike horst block and like Escondida forms the bounding fault to the structural block. This vein, located beneath Tertiary cover, and is interpreted from the ground magnetic data and drilling to strike for a minimum of 1000m m to the north-west.
The Florencia prospect is located 250 m toward the northeast of the Moro prospect and is characterised by sub-outcrop of veins and breccia-vein float, oriented approximately east-west. The Florencia structure has been traced for 300 m and is interpreted to potentially connect with the Moro structure at its western end. The vein’s width varies between 1 to 4 m. The presence of jarosite and anomalous arsenic values suggests that it has formed in an elevated crustal setting.
The Virginia prospect has been interpreted as an eroded acid sulphate cap, commonly found in the preserved upper portion of low sulphidation system. Two zones, each 200 m in length, have been tested by shallow drilling with some significant results. The trend of this silica-cap has a north-east strike and the disseminated mineralization is associated with pervasive silica-kaolin-alunite? alteration in a felsic tuff.
The Laura prospect is a north-south oriented white quartz vein located at the northern part of Cerro Moro. The structure dips 60 degrees to the east, and is situated at the lithological contact between rhyolite (hanging-wall) and rhyodacitic ignimbrite (foot-wall). The width of the vein varies between 3 to 6 m, and is composed of massive white-quartz with scarce disseminated sulphides (mostly pyrite). The boundaries of the vein are characterized by a less than one metre zone of quartz-gossanous material.
The Dora prospect is a wide quartz filled structure with a north-northwest strike, dipping steeply to the east. Low-grade quartz has been traced for 240 m and widths vary between 1 to 11 m. The mineralization is low grade and the white massive quartz vein is low in sulphides. The structure occurs in a felsic tuff with strong argillic alteration.
Extorre Gold Mines Limited
Cerro Moro Gold – Silver Project
Preliminary Economic Assessment | Page 85 |
The Tres Lomas prospect is named after three small hills aligned in a north-west orientation. Quartz veining on the hills can be traced for approximately 200 m along strike and are hosted in rhyodacitic ignimbrite. The veins are mostly near vertical and have well developed stock-works with widths ranging between 0.3 to 5 m. The gold-silver mineralization is associated with chalcedonic quartz with some base metal rich zones associated with higher grade gold and silver, as well as disseminated pyrite.
The Maria zone comprises a number of irregular ptygmatic veins up to 1 metre in width hosted within a spherulitic rhyolite dome. The veins comprise massive milky quartz with large dog tooth crystals in cavities. The veins are anomalous in base metals. Host rock alteration is not apparent. The interpretation is that the veins were emplaced whilst the dome was hot, possibly semi molten. The dome has a high silica content with quartz crystals observed in lithophysae.
The Carlita prospect is an east-west oriented, narrow, low-grade quartz vein structure, traced for 350 m. The vein is composed of white quartz with scarce disseminated sulphides (mostly pyrite). The widths vary between 0.5 to 2 m. The western end of the structure has split into two separate veins and is interpreted to be a splay of the major northwest trending Esperanza-Nini structure. The host-rock is rhyodacitic ignimbrite. To the south of the main vein there are outcrops of east-west sub-parallel veinlets close to the contact between the rhyolite and rhyodacite.
The Lala prospect is a north-northwest trending structure dipping to the north-east. Quartz vein outcrop can be observed for approximately 400 m on the surface, and the structure is interpreted from the ground magnetic to continue for an additional 1.8 km to the southeast under Tertiary marine sediments. The vein is emplaced at the contact between rhyodacitic ignimbrite with fiammes and rhyolite. Two pulses of mineralization are interpreted; an early phase of white quartz-adularia, which is brecciated by a second later pulse of black silica material with fine disseminated pyrite. This black silica is in part chalcedonic. The vein’s width varies between 0.5 to 2 m.
The FMD prospect is a strong east-west break in the ground magnetic data with an associated weak resistivity anomaly, that trend for at least 50 m. Abundant quartz float in scree is observed at surface, hosted within rhyolitic units.
Extorre Gold Mines Limited
Cerro Moro Gold – Silver Project
Preliminary Economic Assessment | Page 86 |
The Romina prospect is an east-west orientated vein, located to the east of the Gabriela prospect and north of the Barbara and Lourde structures. The vein can be traced for approximately 500 m as quartz vein sub-outcrop, but the ground magnetic data suggests the structure could be extended an additional 300 m to the west and east. The vein dips shallowly to the north and is dominated by white milky quartz style veining, with a variable width between 1 to 3 m. Minor fine disseminated sulphides (predominantly pyrite) have been observed. A post mineral breccia unit, with hematitic cement, cuts the vein in places.
The Ornella prospect is represented by an east-northeast trending structure, located approximately 300 m north of Escondida Central. The poorly outcropping vein has a strike of approximately 400 m, and a variable width between 1 to 5 m. The structure is clearly observed in the ground magnetic data, and dips steeply to the north-west, hosted within a coherent andesitic unit.
| 7.3.28 | Deborah Termination Structure |
The DTS prospect is a significant northwest trending structure that is interpreted to truncate the north-eastern end of the Deborah vein. The DTS structure can be clearly observed in the ground magnetic data and can be traced for at least 4.5 km. In the Deborah prospect area the structure is completely covered by recent sediments, however, to the south-east recent regional mapping has discovered outcropping quartz veining and breccias that are parallel to the structure observed in the magnetics that could be interpreted to belong to the DTS structure. In this south-eastern sector, field mapping has identified hydrothermal breccias with a hematite matrix and fluidized textures, with widths varying between 1 to 4 m.
The Lourdes prospect is a north-south trending quartz veining structure, with widths of over 5 m, dipping steeply to the east. It is located to the south of the Romina structure and has an interpreted strike length of approximately 500 m. The veining is dominated by white milky quartz with minor fine disseminated sulphides (predominantly pyrite) and is emplaced in a rhyodacitic ignimbritic unit.
Lucia is a northwest orientated vein located approximately 10 km from the Escondida prospect in the north-eastern corner of Cerro Moro. It was discovered in 2010 during an exploration program that included geological/structural mapping, surface sampling and ground geophysical surveys. Outcrops of the central portion of the structure have been mapped for over 200 m however the geophysical and recent drilling data indicates a potential strike length of at least 2.5 km. The vein dips steeply to the northeast and is hosted within a contact between rhyodacitc ignimbrites (hangingwall) and dome related felsic breccias (footwall). Multiple hydrothermal pulses have been observed in the vein zone, with very localised high grade gold and silver mineralization associated with the later events; consisting of coarse toothy quartz, white adularia and black silica material, rich in acantite. Although the thickness of the main mineralized structure is narrow (less than 2 m), stockwork or zones of minor veinlets are commonly observed as a low grade halo to the main vein. Silicification and strong smectite alteration is related to the mineralization.
Extorre Gold Mines Limited
Cerro Moro Gold – Silver Project
Preliminary Economic Assessment | Page 87 |
| 7.3.31 | Gabriela South-East Extension |
The Gabriela Southeast (“SE”) Extension prospect corresponds to a new shoot discovered on an extension of the main Gabriela structure. The vein does not outcrop and was discovered initially by a series of shallow exploration holes in an attempt to follow the Gabriela structure to the southeast. The Gabriela SE Extension is approximately 400 m in length and has been drilled to a depth of approximately 200 m from surface. The mineralization is associated with quartz-adularia, with typical lattice blade textures, hosted in a rhyodacitic ignimbrite (P1 unit). The thickness varies between 2 to 5 m with some wider zones being observed related with lower grade stockwork zones. Fine disseminated base metal sulphides, acantite and electrum are observed in the highest grade gold and silver zones of the shoot.
The Conceptual Targets represent an area of approximately 2 square km that is completely covered by a thick sequence of Tertiary Marine sediments, located in the northwest portion of the Project between two major structures, Gabriela and Nini-Esperanza. A total of seven, predominantly north-west orientated structures, were identified in the ground magnetic data and targeted by a series of scout drilling fences, resulting in numerous anomalous auriferous intersections. Most of the structures tested dip steeply to the north-east; with veining comprised of chalcedonic-quartz veining with fine disseminate pyrite, and widths varying between 1 to 3 m. The host rock is dominated by rhyodacitic ignimbrites.
This is a recently discovered vein stockwork zone which has had some scout drilling. The zone has an east west strike and dips steeply to the north, and occurs at the contact of a siliceous rhyolite breccia to the south with felsic tuffs to the north. Localised high grade gold and silver mineralization has been intersected, however follow-up drilling suggests it occurs in small discontinuous sections.
This west dipping vein was discovered and channel sampled by Mincorp prior to Extorre’s involvement with the Project in December 2003. The prospect consists of at least 2 white quartz veins to 2m wide with a north-north-east orientation and a strike of 450m. Although previous sampling returned low grade precious metal results at surface it was decided that the grade may improve with depth and two holes were recently drilled to test this possibility. The deepest hole returned a maximum result of 4.93 g/t Au and 54 g/t Ag with anomalous base metals in a quartz vein over a 0.65m interval on the contact between the P4 sandstone and a felsic breccia. This has shown that precious metal values are increasing at depth and the relationship between the footwall and hangingwall stratigraphy is of interest as it is similar to other Escondida prospects albeit in a different strike direction.
Extorre Gold Mines Limited
Cerro Moro Gold – Silver Project
Preliminary Economic Assessment | Page 88 |
The northeast trending Deborah Parallel structure is located between the Deborah and Belen veins, and can be mapped over a strike length of 2.5 km between the northwest trending Deborah Termination Structure and the east-west Zoe prospect on the Escondida structure. The Deborah Parallel structure dips steeply to the east and contains sections filled with quartz veins up to 9m wide. The Deborah Parallel structure is also considered to be significant as it is characterised by a downthrown block of P4 sandstone and andesitic lava to the east juxtaposed against a footwall of P1 Chon Aike material to the west, with a vertical displacement interpreted to be of the order of 200 m. Like Belen this same juxtaposition occurs across the Escondida structure and is considered to be a significant fault possibly bounding the eastern side of the Chon Aike horst block. To date 6 scout holes have been drilled into the Deborah Parallel structure and results of that work are yet to be assessed.
Extorre Gold Mines Limited
Cerro Moro Gold – Silver Project
Preliminary Economic Assessment | Page 89 |
The predominant mineralization concept model being explored for at the Project falls into the category of base metal rich, epithermal, gold-silver bearing, low-to-intermediate sulphidation veins. High-grade gold silver shoots within the Escondida structure contain lead, zinc and copper sulphides. Low Fe, white sphalerite and local marcasite were also observed and are indicative of low temperature formation in an elevated crustal setting (Corbett, 2007). These base metal sulphide rich veins are not common in the Deseado Massif and may be better classified as an intermediate sulphidation style deposit (Sillitoe, 2009). The high content of base metals within the veins indicates the fluids from which they are formed were primarily high saline magmatic in origin with little or no meteoric component (Sillitoe, 2009).
The polymetallic gold-silver mineralization at Cerro Moro is of the low to intermediate sulphidation epithermal quartz-adularia-sulphide vein type.
Individual prospects vary from simple, single veins to complex vein systems with spur and cymoid loop structures. Limited quartz stock-work veinlets are also present around the main veins. Vein strike orientations vary from:
| 1. | Northwest to west-northwest with easterly flexures (e.g.: Escondida, Zoe, Esperanza-Nini, Gabriela, Natalia, and Dora), and |
| 2. | Northeast (e.g.: Barbara, Deborah, and Maria-Michele) |
And the less common:
| 3. | East-west to west-southwest (e.g.: Sylvia area, Loma Escondida, and Patricia), and |
| 4. | North-northwest (e.g.: Lourdes, and Lala) |
Veins are typically steeply dipping to sub-vertical. Outcropping veins locally reach widths up to 4 m whilst associated zones of quartz stringers and stockworking may attain widths in the order of 10 to 15 m. The strike length of individual veins is variable generally between 200 m and 1 kilometre. The Escondida structure has been traced by drilling for approximately 8 km, and remains open along strike and at depth.
Argillic and locally silicic alteration is present peripheral to principal veins and within dense minor vein swarms; however the alteration halos are not extensive and may extend only as much as 5 times the vein width into host rock.
The discontinuous mineralized shoots within the larger structures appear to be locally controlled by changes in strike, which are thought to have produced dilational flexures and jogs allowing for greater fluid flow. Changes in wall-rock lithology, along the structures, may be an important factor in controlling the local strike direction of structures. It has also been noted that brittle, felsic units have a tendency to produce stronger stock-work style development around main structures than intermediate units.
Extorre Gold Mines Limited
Cerro Moro Gold – Silver Project
Preliminary Economic Assessment | Page 90 |
“Precise timing of the onset of mineralization is unclear, but the possibly long-lived vein mineralizing event certainly continued until quite late in the overall construction of the Jurassic volcanic pile since veins are observed to cut welded ignimbrites which comprise the youngest mapped stratigraphic group. Field evidence clearly indicates that vein mineralization overlapped in time with intrusion of rhyolite flow-domes and dykes. Intrinsically pyritic and strongly silica oversaturated rhyolites, characterized by internal development of irregular quartz veinlet stockworks and patchy hydrothermal breccias invite speculation as to a closer genetic link between vein mineralization and some of these rhyolitic intrusive phases.” (Callan, 2008).
Extorre Gold Mines Limited
Cerro Moro Gold – Silver Project
Preliminary Economic Assessment | Page 91 |
Since commencing work at Cerro Moro in June 2003,Exeter (the predecessor to Extorre) has carried out diverse exploration activities that include: geological mapping, various geophysical surveys, surface sampling and drilling. Table 20 chronologically summarizes all exploration work undertaken on the Project prior to 2009.
| Date | | Exeter Exploration Works |
| Jun 2003 | | Revision of the CVSA Information |
| Feb 2004 | | Aster Image Interpretation |
| Apr 2004 | | Planning Reverse Circulation Drilling |
| Jun 2004 | | Reverse Circulation Drilling |
| Jun 2004 | | Induced Polarization Survey by Quantec |
| Aug - Dec 2004 | | Magnetic Susceptibility Survey of Reverse Circulation Holes |
| Sep 2004 | | Resistivity Survey by Akubra |
| Oct 2004 - Feb 2005 | | Rock Chip Sampling on Geophysical Anomalies |
| Aug 2004 - Apr 2005 | | Rock Chip Sampling |
| Apr - Oct 2005 | | Ground Magnetic Survey |
| Mar - Aug 2006 | | Ground Magnetic Survey - E-W Grid |
| Jun 2006 | | Reverse Circulation Drilling |
| Jul 2006 | | CVSA half yearly Technical Report |
| Oct 2006 | | Geology Mapping and Stratigraphy Interpretation on Carla Prospect |
| Nov 2006 | | Trench Sampling |
| Nov - Dec 2006 | | Diamond Drilling |
| Jan - May 2007 | | Ground Magnetic Survey - N-S Grid |
| Jan - Mar 2007 | | Trench Sampling |
| Jan - Feb 2007 | | LAG Sampling |
| Mar 2007 | | CVSA half yearly Technical Report |
| Mar 2007 – Dec 2008 | | Ongoing Diamond and Reverse Circulation Drilling |
| Apr - Jun 2007 | | Induced Polarization Survey by Quantec |
| May 2007 | | LAG Sampling |
| May - Jun 2007 | | Project Scale Mapping of Central - West area |
| Jul 2007 | | CVSA Half yearly Technical Report |
| Sep 2007 | | Joint venture report Notification of Completion of 10,000 m of Drilling on the Co Moro Property |
| Oct 2007 –Jan 2008 | | LAG Sampling |
| Nov 2007 | | Comments on Au-Ag Mineralization Control and Drilling Target Definition |
| Jan – Mar 2008 | | Core Sampling for metallurgical test work |
| Feb – Jun 2008 | | Project scale mapping of the entire property at 1:10,000 |
| Jul – Dec 2008 | | LAG Sampling |
Table 20 Summary of Exploration Work undertaken by Exeter Prior to 2009
Extorre Gold Mines Limited
Cerro Moro Gold – Silver Project
Preliminary Economic Assessment | Page 92 |
Work at Cerro Moro during 2009 and Quarter 1, 2010 concentrated on drilling the Escondida prospect. Other regional exploration activities during this period included target generation through geophysical surveys and satellite imagery, minor RC scout drilling, mapping and sampling. Work during the remainder of 2010 was focussed on:
1. Resource Extension Drilling and Infill Drilling at the Known Prospects, where this work included:
| § | Peripheral drilling of the areas of Indicated resources at Escondida Far West, Escondida West, and Gabriela. |
| § | Infill drilling at the Loma Escondida, Gabriela and Esperanza prospects, with the aim to convert Inferred resource category mineralization to higher confidence categories. |
| § | Continual drilling along the Escondida structure away from the known mineralization, both to the northwest and southeast. This drill program was successful in identifying new high grade gold-silver mineralization to the southeast at Martina. |
| § | Continual drilling to the southeast of the known Gabriela mineralization, which has been successful in identifying a new zone of gold-silver mineralization. |
2. Drilling for the PEA and subsequent development drilling, where this work included:
| § | The drilling of 22 RC percussion drill holes for 1,710 m as part of the hydrology and hydrogeology investigations, |
| § | The drilling of 20 RC percussion drill holes for 2,018 m as part of a program to sterilize proposed infrastructure areas for the plant site, offices, accommodation, exploration camp, etc. |
| § | The drilling of 6 diamond drill holes in the area of the proposed exploration decline at Escondida Far West, primarily to provide geotechnical data to assist with the design. |
3. New Discovery Drilling, that included;
| § | Drilling at the Carolene and Lucia prospects. |
Table 21 summarizes in chronological order all exploration work undertaken on the Project during 2009 and 2010.
Extorre Gold Mines Limited
Cerro Moro Gold – Silver Project
Preliminary Economic Assessment | Page 93 |
| Date | | Exeter & Extorre Exploration Works |
| Jan 2009 | | Commencement of the first NI 43-101 compliant resource estimate |
| Apr 2009 - Jul 2009 | | Diamond Drilling at Escondida |
| Jun - Jul 2009 | | Magneto-Telluric and Transient Electromagnetic |
| Jul 2009 | | Public release of the first NI 43-101 compliant mineral resource estimate |
| Aug 2009 - Feb 2010 | | Extension and Infill Diamond Drilling at Escondida |
| Jan 2010 | | Commencement of the second NI 43-101 compliant mineral resource estimate |
| Apr 2010 | | Public release of the second NI 43-101 compliant mineral resource estimate |
| May – Oct 2010 | | Exploration diamond drilling with the aim to extend high grade mineralization on known structures (Escondida, Gabriela and Loma Escondida) and test new targets (Caroline and Lucia). |
| May – Sep 2010 | | Ground magnetic and IP Gradient surveys at the Lucia and Martina prospects. |
| May – Jun 2010 | | Condemnation drilling program at the "Great Dyke" area, located 2 km south of Escondida. This area has been proposed for infrastructure (plant, offices, accommodation) for the future mine |
| Jul – Aug 2010 | | Drilling at the "Tres Lagunas" area located to the east of the property to test for ground water. |
| Oct – Dec 2010 | | Diamond In-fill drilling program at the Gabriela and Loma Escondida prospects with the aim to convert Inferred resource category mineralization to higher confidence categories. Completion of the maiden PEA dated December 2, 2010 for the proposed Cerro Moro Mine Development. |
| Table 21 | Summary of Exploration Work undertaken between January, 2009 and December, 2010 |
From the beginning of 2011 to January 31, 2012, Extorre’s exploration activities were focused on increasing Cerro Moro’s global mineral resource base. Resource extension drilling was undertaken at existing prospects including Loma Escondida, Gabriela and Esperanza. Resource definition drilling was also targeted to allow maiden Inferred resource estimates to be generated for new discoveries at Carla, Martina, Gabriela SE and Nini. In addition, a significant new high grade gold-silver discovery was made at the Zoe prospect, which is located approximately 2.5 km southeast of the Martina zone on an east-west portion of the Escondida structure. Resource definition drilling and some infill drilling at the Zoe prospect has been a significant focus of drilling activities at Cerro Moro during much of 2011, culminating in a maiden mineral resource estimate being announced on November 3, 2011.
Exploration drilling also continued to test extensions to known mineralization at Lucia, Gabriela, Loma Escondida, and Esperanza. Scout drilling has also been aimed at finding new deposits at Agostina, Tres Lomas, Belen, Deborah Parallel, Carlita, Lala, Deborah Termination Structure, Mosquito, Alejandra, Romina, Lechuzo and Carolene. Regional drilling was also undertaken at the Union Domes Prospect, located some 14.5 km south of Escondida on the Formicruz joint venture tenements.
Table 22 chronologically summarize all exploration work undertaken on the Project up until January 31, 2012.
Extorre Gold Mines Limited
Cerro Moro Gold – Silver Project
Preliminary Economic Assessment | Page 94 |
| Date | | Extorre Exploration Works |
| Jan 2011 | | Complete infill drilling Martina, Loma Escondida, Gabriela with the aim to convert Inferred resource category mineralization to higher confidence categories. Exploration drilling to extend Lucia, Gabriela Loma Escondida and Esperanza. Scout drilling at Carolene |
| Feb 2011 to end March 2011 | | Exploration drilling to extend Gabriela, Esperanza- Nini, Escondida far west, Michelle, Loma Escondida. Scout drilling Agostina Gabriela NW, Belen and Zoe (discovery of Zoe) Regional drilling Union domes |
| April 2011 to end May 2011 | | Infill drilling at Carla and Gabriela SE. Exploration drilling at Zoe, Tres Lomas and Gabriela. Scout drilling Agostina, Deborah parallel, Loma Escondida and Zoe extensions |
| June 2011 to January 31, 2012 | | Infill drilling at Zoe, Carla, and Gabriela. Exploration drilling at Zoe, Tres Lomas, Esperanza, Escondida, Loma Escondida and Gabriela. Scout drilling Carlita, Lala, Deborah parallel, Deborah Termination Structure, Mosquito, Alejandra, Romina, Lechuzo and Belen |
Table 22 Summary of Exploration Work undertaken by Extorre to January 31, 2012
Geophysical surveys completed at Cerro Moro during 2010 and 2011 (refer to Coupland, 2010 for geophysical work conducted during 2009) consisted of additional ground magnetic data acquisition, gradient array induced polarization (“IP”)/resistivity surveys as well as a Controlled Source Audio-frequency Magnetotellurics (“CSAMT”) survey.
| 9.2.1 | Ground Magnetic Surveys |
Work completed in 2010 included a 4 km x 5.5 km block located in the north-eastern corner of the property covering the Lucia Prospect. This survey was undertaken utilizing north-south lines spaced 80 m apart. Refer to Figure 14 for current ground magnetic coverage of the tenements and an example of one of the data products, reduced to the pole (“RTP”).
Extorre Gold Mines Limited
Cerro Moro Gold – Silver Project
Preliminary Economic Assessment | Page 95 |

| Figure 14 | Cerro Moro Ground Magnetics – Reduced to Pole (RTP) Image (Source: Extorre 2010) |
An additional 31 sq km of ground magnetic survey was completed over the Zoe prospect and to the east during the Third Quarter of 2011. The previous survey was completed at 80 m line spacing, and the area was resurveyed at 40 m line spacing to improve the quality of the data to assist with drill targeting.
Extorre Gold Mines Limited
Cerro Moro Gold – Silver Project
Preliminary Economic Assessment | Page 96 |
| 9.2.2 | Gradient Array IP Surveys |
Approximately 91 line km of Gradient Array IP / Resistivity data were acquired in early- to mid-2010 along 70 survey lines in two areas. The first survey area, consisting of 59 line km and 29 survey lines, was conducted to fill a gap in the previous data coverage over the Escondida trend and the Bella Vista area to the southeast. The Gradient Array IP / Resistivity survey data was reported as the Newmont standard for integration with previously acquired data over the Project area. Data quality for this survey is considered to be good and the results of the survey provide a “coherent and reasonably accurate representation of the geo-electrical properties (apparent resistivity and chargeability) of the subsurface suitable for geological interpretation within normal limitations” (Scarbrough, 2010a). Results obtained from this survey are summarized in Figure 15 and Figure 16.
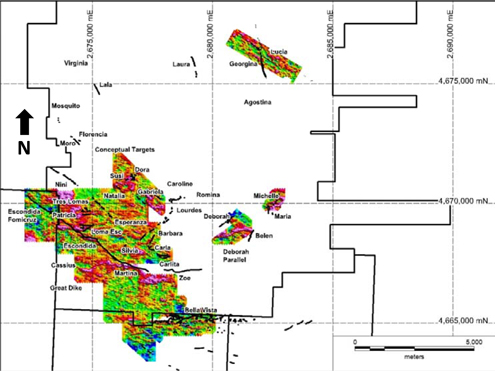
Figure 15 Escondida to Bellavista – Chargeability Data (Source: Extorre 2010)
Extorre Gold Mines Limited
Cerro Moro Gold – Silver Project
Preliminary Economic Assessment | Page 97 |
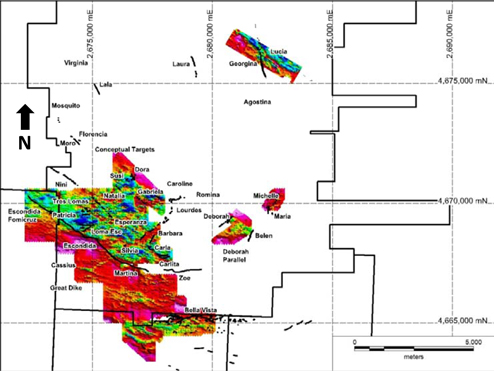
Figure 16 Escondida to Bellavista – Resistivity Data (Source: Extorre 2010)
The second survey area, conducted over the Lucia prospect, consisted of 32 line km along 41 survey lines. The “Gradient Array IP / Resistivity survey data was processed with in-house software and chargeability data was reported as the Newmont standard. Data quality for this survey is considered to be good and the results of the survey provide “a coherent and reasonably accurate representation of the geo-electrical properties (apparent resistivity and chargeability) of the subsurface suitable for geological interpretation within normal limitations” (Scarbrough, 2010b).
A Controlled Source Audio-frequency Magnetotellurics (CSAMT) survey was conducted during the Third Quarter of 2011. The aim of the CSAMT survey was to test up to 6 km east of the Zoe prospect in an attempt to identify the eastern continuation of the regional Escondida structure. A total of 15.35 km of CSAMT survey was conducted on 10 lines, two of which were north-south orientation lines conducted over known mineralization at the Martina and Zoe prospects. Results obtained from this survey are currently being evaluated.
| 9.2.4 | Representivity of Exploration Programs |
The exploration strategy employed at the Project has utilized a wide range of exploration techniques including, geological, soil sampling, lag sampling, channel sample, reverse circulation and diamond drilling, aerial photography, satellite imagery, remote sensing and a variety of geophysical techniques. In the author's opinion, all aspects of exploration have been carried out to a high industry standard with appropriate quality controls in place.
Extorre Gold Mines Limited
Cerro Moro Gold – Silver Project
Preliminary Economic Assessment | Page 98 |
The combination of exploration strategies employed at the Project has been highly successful in identifying significant mineral resources at the Project, to the extent that the Project may be classified as an advanced property.
A detailed description of the interpretation of exploration results and the estimation of mineral resources is included in Section 14.
Extorre Gold Mines Limited
Cerro Moro Gold – Silver Project
Preliminary Economic Assessment | Page 99 |
Prior to Exeter being involved in the Project, a program of 34 drill holes for 2,593 m was undertaken by Mincorp, comprising 19 diamond drill holes for 1,016 m and 15 RC percussion drill holes for 1,577 m.
As at the end of 2008, Exeter had drilled a total of 472 drill holes for 50,257.15 m, comprising 264 diamond holes for 20,876.85 m and 208 RC percussion drill holes for 29,380.30 m. During 2009 and Quarter 1, 2010 the drilling had focussed primarily on the Escondida prospect, with 327 diamond drill holes being drilled for 39,722.7 m to the 12th February 2010 (data cut-off date for the April 2010 resource estimate). In addition, an RC percussion drill rig arrived on site during August 2009 and by the end of December 2009 had drilled 44 holes for a total of 4,729.3 m at Cerro Moro. Of these, 35 holes were sited at 8 new exploratory targets with the remaining 9 holes drilled for water.
As at January 31, 2012, a total of 1,544 drill holes for 222,769.40 m had been completed on both exploration and infill drilling at Cerro Moro (Table 23). An additional 22 holes for 1,815.3 m had been drilled for water exploration, and a further 20 holes for 2018.0 m were completed for sterilization of the proposed processing plant and camp site. Approximately 80% of the holes have been drilled at Escondida (42.83%), Zoe (19.78%), Gabriela (10.87%), Esperanza (4.13%) and Loma Escondida (2.05%).
Prior to 2009 the majority of drilling at Cerro Moro had been undertaken by Major Perforaciones Argentina; a subsidiary of the Major Drilling group based in Canada, with a limited number of diamond holes drilled by Patagonia Drill Mining Services S.A. Experienced expatriate drilling supervisors supervised the drilling operations. All drilling during 2009 and early 2010 was undertaken by Connors Argentina, S.A., a wholly owned subsidiary of Boart Longyear, with corporate headquarters in Utah, U.S.A. In early 2010, one Major drill rig arrived on site to complement the three Boart-Longyear diamond drill rigs. The quantity of rigs stayed at four (although variable at to which company) and during mid-2011, two additional Boart-Longyear diamond drill rigs were added to expedite resource definition drilling at the Zoe prospect. As at October 10, 2011 (the data cut-off date for the November 2011 mineral resource estimate), all six drill rigs were operating on site, with three from Boart-Longyear and three from Major. As of January 31, 2012, four drill rigs were operating, with two from Boart-Longyear and two from Major.
All diamond core drilling has been HQ3 size utilising triple tube equipment. The majority of diamond core holes were orientated using the Ballmark orientation system to provide accurate core orientations, although this system was replaced in September, 2010, by the Reflex ACT2 electronic system. Where water was intersected in RC percussion holes, resulting in lower sample recoveries, the holes were completed using diamond core to test the target zones.
RC percussion holes and percussion pre-collars to diamond drill holes were drilled with face-sampling hammers with hole diameters between 13.0 and 14.0 centimetres.
Extorre Gold Mines Limited
Cerro Moro Gold – Silver Project
Preliminary Economic Assessment | Page 100 |
| Drilling Program | | Prospect | | Holes | | | RC (m) | | | DDH (m) | | | Total (m) | | | % | |
| MINERALIZATION | | Escondida | | | 635 | | | | 14,449.50 | | | | 80,952.70 | | | | 95,402.20 | | | | 42.8 | % |
| | Zoe | | | 190 | | | | 1,057.50 | | | | 43,005.40 | | | | 44,062.90 | | | | 19.8 | % |
| | | Gabriela | | | 159 | | | | 2,586.35 | | | | 21,619.80 | | | | 24,206.15 | | | | 10.9 | % |
| | | Esperanza | | | 76 | | | | 2,155.80 | | | | 7,033.80 | | | | 9,189.60 | | | | 4.1 | % |
| | | Loma Escondida | | | 69 | | | | 1,090.00 | | | | 3,473.25 | | | | 4,563.25 | | | | 2.1 | % |
| | | Carla | | | 41 | | | | 426.00 | | | | 3,356.30 | | | | 3,782.30 | | | | 1.7 | % |
| | | Lucia | | | 20 | | | | 0.00 | | | | 2,877.45 | | | | 2,877.45 | | | | 1.3 | % |
| | | Carolene | | | 18 | | | | 710.00 | | | | 1,961.30 | | | | 2,671.30 | | | | 1.2 | % |
| | | Zoe East | | | 9 | | | | 0.00 | | | | 2,659.60 | | | | 2,659.60 | | | | 1.2 | % |
| | | Tres Lomas | | | 23 | | | | 276.00 | | | | 2,088.70 | | | | 2,364.70 | | | | 1.1 | % |
| | | Patricia | | | 21 | | | | 640.00 | | | | 1,503.25 | | | | 2,143.25 | | | | 1.0 | % |
| | | Nini | | | 25 | | | | 1,011.50 | | | | 1,082.90 | | | | 2,094.40 | | | | 0.9 | % |
| | | Mosquito | | | 14 | | | | 470.00 | | | | 1,553.35 | | | | 2,023.35 | | | | 0.9 | % |
| | | Conceptual Target | | | 21 | | | | 1,691.45 | | | | 94.80 | | | | 1,786.25 | | | | 0.8 | % |
| | | Agostina | | | 17 | | | | 0.00 | | | | 1,715.50 | | | | 1,715.50 | | | | 0.8 | % |
| | | Natalia | | | 15 | | | | 624.00 | | | | 1,078.65 | | | | 1,702.65 | | | | 0.8 | % |
| | | Michelle | | | 15 | | | | 471.00 | | | | 1,200.80 | | | | 1,671.80 | | | | 0.8 | % |
| | | Silvia | | | 14 | | | | 921.00 | | | | 724.15 | | | | 1,645.15 | | | | 0.7 | % |
| | | Moro | | | 15 | | | | 1,124.00 | | | | 358.95 | | | | 1,482.95 | | | | 0.7 | % |
| | | Deborah | | | 24 | | | | 965.00 | | | | 501.10 | | | | 1,466.10 | | | | 0.7 | % |
| | | Deborah Parallel | | | 7 | | | | 269.00 | | | | 1,116.50 | | | | 1,385.50 | | | | 0.6 | % |
| | | Carlita | | | 12 | | | | 265.00 | | | | 745.00 | | | | 1,010.00 | | | | 0.5 | % |
| | | Belen | | | 6 | | | | 0.00 | | | | 940.30 | | | | 940.30 | | | | 0.4 | % |
| | | Lala | | | 7 | | | | 264.00 | | | | 667.20 | | | | 931.20 | | | | 0.4 | % |
| | | Cassius | | | 6 | | | | 474.00 | | | | 335.30 | | | | 809.30 | | | | 0.4 | % |
| | | Dora | | | 10 | | | | 342.00 | | | | 360.50 | | | | 702.50 | | | | 0.3 | % |
| | | Alejandra | | | 6 | | | | 0.00 | | | | 673.50 | | | | 673.50 | | | | 0.3 | % |
| | | Susy | | | 7 | | | | 526.00 | | | | 93.00 | | | | 619.00 | | | | 0.3 | % |
| | | TEM anomaly | | | 3 | | | | 420.00 | | | | 0.00 | | | | 420.00 | | | | 0.2 | % |
| | | DTS | | | 4 | | | | 321.00 | | | | 197.60 | | | | 518.60 | | | | 0.2 | % |
| | | Escondida North | | | 4 | | | | 310.00 | | | | 191.15 | | | | 501.15 | | | | 0.2 | % |
| | | Nini Esperanza gap | | | 4 | | | | 440.00 | | | | 50.50 | | | | 490.50 | | | | 0.2 | % |
| | | Florencia | | | 4 | | | | 304.00 | | | | 168.00 | | | | 472.00 | | | | 0.2 | % |
| | | Virginia | | | 11 | | | | 411.00 | | | | 0.00 | | | | 411.00 | | | | 0.2 | % |
| | | Laura | | | 4 | | | | 330.00 | | | | 80.00 | | | | 410.00 | | | | 0.2 | % |
| | | Marina | | | 5 | | | | 264.00 | | | | 131.00 | | | | 395.00 | | | | 0.2 | % |
| | | Romina | | | 4 | | | | 142.00 | | | | 221.00 | | | | 363.00 | | | | 0.2 | % |
| | | Jannet | | | 3 | | | | 208.00 | | | | 122.00 | | | | 330.00 | | | | 0.2 | % |
| | | Esperanza Parallel | | | 2 | | | | 0.00 | | | | 290.00 | | | | 290.00 | | | | 0.1 | % |
| | | Maria | | | 2 | | | | 284.00 | | | | 0.00 | | | | 284.00 | | | | 0.1 | % |
| | | Ornella | | | 3 | | | | 127.00 | | | | 131.00 | | | | 258.00 | | | | 0.1 | % |
| | | MT | | | 2 | | | | 257.00 | | | | 0.00 | | | | 257.00 | | | | 0.1 | % |
| | | FMD | | | 4 | | | | 447.00 | | | | 0.00 | | | | 447.00 | | | | 0.2 | % |
Extorre Gold Mines Limited
Cerro Moro Gold – Silver Project
Preliminary Economic Assessment | Page 101 |
| Drilling Program | | Prospect | | Holes | | | RC (m) | | | DDH (m) | | | Total (m) | | | % | |
| | Natalia NW | | | 1 | | | | 0.00 | | | | 185.00 | | | | 185.00 | | | | 0.1 | % |
| | Lechuzo | | | 1 | | | | 0.00 | | | | 75.00 | | | | 75.00 | | | | 0.0 | % |
| | Lourdes | | | 1 | | | | 80.00 | | | | 0.00 | | | | 80.00 | | | | 0.0 | % |
| Subtotal | | | | | 1544 | | | | 37,154.10 | | | | 185,615.30 | | | | 222,769.40 | | | | 100.0 | % |
| GROUND WATER | | Escondida | | | 8 | | | | 630.30 | | | | 100.00 | | | | 730.30 | | | | 40.2 | % |
| | Tres Lagunas | | | 7 | | | | 578.00 | | | | 0.00 | | | | 578.00 | | | | 31.8 | % |
| | TEM anomaly | | | 2 | | | | 133.00 | | | | 0.00 | | | | 133.00 | | | | 7.3 | % |
| | Lechuzo | | | 1 | | | | 90.00 | | | | 0.00 | | | | 90.00 | | | | 5.0 | % |
| | Esperanza | | | 1 | | | | 82.00 | | | | 0.00 | | | | 82.00 | | | | 4.5 | % |
| | Great Dyke | | | 1 | | | | 80.00 | | | | 0.00 | | | | 80.00 | | | | 4.4 | % |
| | Carla | | | 1 | | | | 61.00 | | | | 0.00 | | | | 61.00 | | | | 3.4 | % |
| | Gabriela | | | 1 | | | | 61.00 | | | | 0.00 | | | | 61.00 | | | | 3.4 | % |
| Subtotal | | | | | 22 | | | | 1,715.30 | | | | 100 | | | | 1,815.30 | | | | 100.0 | % |
| STERILIZATION | | Great Dike | | | 20 | | | | 2,018.00 | | | | 0 | | | | 2,018.00 | | | | | |
| TOTAL | | | | | 1586 | | | | 40,887.40 | | | | 185,715.30 | | | | 226,602.70 | | | | | |
Table 23 Drilling Details for Cerro Moro at January 31, 2012
All Mincorp and Exeter RC percussion and diamond drill collars up until MD0268 (31-1-2008) were surveyed by a surveying contractor using a total station EDM theodolite and a differential GPS. The remaining drill collars to January 31, 2012 have been positioned by a surveying contractor using a differential GPS. Down-hole surveys were performed at the time of drilling initially utilising an Ausmine (“Eastman-type”) down-hole camera, and since March 2007, using a digital Reflex down-hole camera.
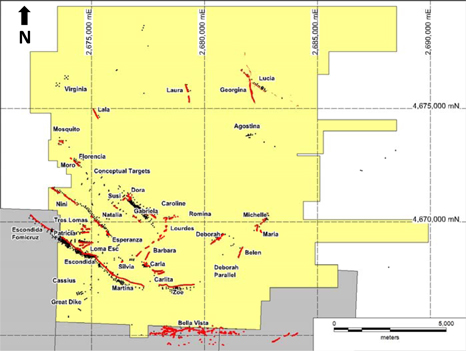
Figure 17 Drill Collars and Prospects Location Map (Source: Extorre 2011)
Extorre Gold Mines Limited
Cerro Moro Gold – Silver Project
Preliminary Economic Assessment | Page 102 |
| 10.1 | Interpretation of Drilling Results |
Approximately 227 km of drilling has been completed at the Project since 2004. The November 2011 mineral resource estimate has delineated Indicated mineral resources of 1.36 Moz of gold equivalent ounces and Inferred mineral resources of 1.05 Moz of gold equivalent ounces. The Project is an "Advanced Property" whereby a very large proportion of drilling is dedicated to mineral resource definition. As such, individual drill hole results are not presented in this technical report. Moreover, there is sufficient density of drilling of a suitable quality for robust 3D models of Cerro Moro mineralization to be developed, capturing important criteria such as zone thickness and extent for many of the prospects. A summary of the interpretation of drilling results constituting the November 2011 Cerro Moro mineral resources are included in Section 10.1.1 to 10.1.5.
A more detailed description of the interpretation of drilling results and the estimation of mineral resources is included in Section 14.
As of October 10, 2011 a total of 768 drill holes for 128,856.60 m (comprising 114,492.10 m of diamond drilling and 14,364.50 m of RC drilling) had been completed along the Escondida structure. This figure includes RC percussion metres drilled as pre-collars to diamond drill holes. Drilling has traced the Escondida structure for approximately 8 km, with mineralization having been identified in the following sectors (from west to east); Escondida Far West, Escondida West-Central-East, Escondida Far East, Martina, and Zoe.
The focus of the extensive drilling activities at Cerro Moro during 2009 and Quarter 1, 2010 was infill and extensional drilling on the Escondida prospect. Infill drilling to 20 m x 20 m was undertaken to upgrade substantial portions of the Escondida prospect to the Indicated mineral resource category. Since Q1, 2010, drilling has been focused on both the Martina zone (where drilling has been completed on a 60 m x 60 m grid allowing the definition of an Inferred category mineral resource) and on the newly-discovered Zoe sector, which is located approximately 2.5 km east of Martina. A significant proportion of the Zoe prospect has now been drilled on a 40 m x 40 m grid with some infill drilling to 20 m x 20 m allowing the estimation of Inferred and Indicated mineral resources.
Figure 18 shows a longitudinal projection, constructed in the plane of the Escondida main vein colour coded based on estimated true widths multiplied by the gold equivalent values. The gold equivalent value is calculated by dividing the silver grade (ppm) by 50 (approximate historical ratio of gold/silver US$ value) and adding it to the gold grade (ppm).
Selected schematic cross-sections within the Escondida prospect are also shown in Figure 19 to Figure 21.
Extorre Gold Mines Limited
Cerro Moro Gold – Silver Project
Preliminary Economic Assessment | Page 103 |
| 10.1.1.1 | Escondida Far West |
The Escondida Far West discovery was the result of scout fence drilling designed to locate the potential north-western extension of the main Escondida structure, in an area with extensive post mineralization cover. The detailed ground magnetic data was utilized to estimate the position of the structure. None of the mineralization outcrops at surface. In addition to being a blind mineralized body, near surface holes, as well as holes on the margin of the higher grade shoot, intersected only low grade to anomalous gold and silver values. This has implications over the entire property, where many of the veins are low grade near surface, and were previously assigned a low priority. Drilling at Escondida Far West during 2009 and Quarter 1, 2010 had focused on infill drilling of the higher grade mineralized shoots to 20 m x 20 m spacing to support an Indicated mineral resource category. Since Quarter 1, 2010 minor drilling has been done to test deeper mineralization and extensions to existing mineralized shoots at approximately 40 m x 40 m and 80 m x 80 m spacing.
| 10.1.1.2 | Escondida West, Central and East |
Following the discovery of the two higher grade shoots at the central and western portions of Escondida, drilling focussed on tracing these plunging zones. Initially Escondida Central and Escondida West were interpreted to be two separate veins, or represented a faulted offset of the structure. However, diamond drilling demonstrated that the two zones are in fact one continuous structural zone.
Drilling at Escondida West, Central and East during 2009 and Quarter 1, 2010 has focused on infill drilling of the higher grade mineralized shoots to 20 m x 20 m spacing to support an Indicated mineral resource category. In addition, some drilling to test deeper mineralization and extensions has been conducted at approximately 40 m x 40 m spacing. Since Quarter 1, 2010 only minor drilling has been done to test deeper mineralization and extensions to the existing mineralized shoots at approximately 40 m x 40 m and 80 m x 80 m spacing.
| 10.1.1.3 | Escondida Far East |
A significant event for Cerro Moro was the high grade intercept in MD373 located at Escondida Far East in mid-2008. It was a “blind discovery” below shallow RC percussion holes that were drilled to test the south-eastern extension of the Escondida structure beneath gravel cover which was predicted by geophysical surveys. A number of additional holes have been drilled around MD373 all of which have returned lower tenor results. This area of Escondida Far East appears to be complex and additional drilling and interpretation is required prior to inclusion in any reportable resources.
Extorre Gold Mines Limited
Cerro Moro Gold – Silver Project
Preliminary Economic Assessment | Page 104 |
The Martina zone was discovered by following the Escondida structure to the east of the Escondida Far East shoot until an easterly flexure was discovered below stratigraphic cover of the P5 unit (La Matilde felsic ignimbrite). The high grade gold-silver mineralization at Martina is completely blind at surface with no geophysical or geochemical evidence to guide drilling. The mineralization at Martina is also much deeper than the other known mineralized bodies to the west, commencing at 200 m below surface. Structurally, Martina is more complex than the other Escondida targets in that there are several areas where the veins split into the hangingwall and footwall. On the basis of drilling completed to date, Martina has a higher gold to silver ratio (and lower base metal content) than other mineralized sectors at Escondida. Figure 22 shows a longitudinal projection, constructed in the plane of the Martina main vein colour coded based on estimated true widths multiplied by the gold equivalent values (AuEq = Au ppm + Ag ppm/50)
The high grade Zoe gold-silver zone is located approximately 2.5 km east of Martina and was first intersected by drill hole MD1196 in March, 2011. Drill hole MD1196 was designed to test a small area of quartz rubble which returned 0.34 ppm Au and 115 ppm Ag from surface rock sampling. The overall geology at Zoe is identical to other Escondida mineralized zones, with the mineralized vein being hosted at the contact between a P4 sandstone (hangingwall) unit and P1 ignimbrites (footwall). However, the Escondida structure trends east-west in the Zoe sector rather than northwest-southeast. A significant proportion of the main known high grade zone within Zoe has now been drilled at 40 m x 40 m grid with some infill drilling to 20 m x 20 m allowing the generation of Inferred and Indicated mineral resources. Drilling is currently being undertaken at Zoe on a broader scale (80 m x 80 m) in order to define the limits of the mineralization together with some closer spaced infill drilling aimed at increasing resource confidence.
The Zoe shoot appears to have larger dimensions than the other Escondida shoots, with significant mineralization having been intersected over a strike length of 600 m and to a depth of 300 m. The Zoe mineralization appears to pinch out into a shear zone as it nears the surface, hence explaining the very poor surface expression of this shoot. Figure 23 shows a longitudinal projection, constructed in the plane of the Zoe main vein colour coded based on estimated true widths multiplied by the gold equivalent values (AuEq = Au ppm + Ag ppm/50).
Recent drilling at the Gabriela prospect has focused on i) infill drilling of the Gabriela Central shoot on a 40 m x 40 m spacing, with the primary purpose being to upgrade the existing Inferred mineral resources to a higher confidence level category, ii) infill drilling at a 40 m x 40 m spacing on the Gabriela SE mineralized shoot, and iii) a program of 4 deep drill holes to test for down-depth extensions of the Gabriela Central mineralized shoot. As of October 10, 2011 a total of 154 drill holes for 23,680.15 m (comprising 21,246.10 m of diamond drilling and 2,434.05 m of RC drilling) had been completed along the Gabriela structure.
Figure 10.8 shows a longitudinal projection, constructed in the plane of the Gabriela main vein colour coded based on estimated true widths multiplied by the gold equivalent values (AuEq = Au ppm + Ag ppm/50).
Extorre Gold Mines Limited
Cerro Moro Gold – Silver Project
Preliminary Economic Assessment | Page 105 |
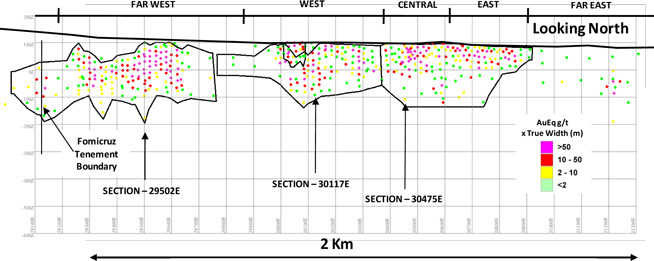
Figure 18 Escondida Total Project Longitudinal Projection - Octoberl 2011 Drilling (Local Grid)
Extorre Gold Mines Limited
Cerro Moro Gold – Silver Project
Preliminary Economic Assessment | Page 106 |
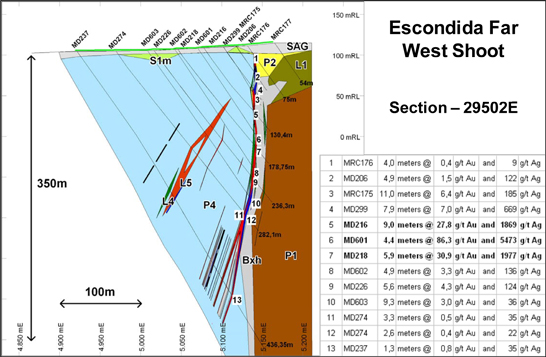
Figure 19 Escondida Far West Shoot - Schematic Cross-Section 29502E (Local Grid)
Extorre Gold Mines Limited
Cerro Moro Gold – Silver Project
Preliminary Economic Assessment | Page 107 |

Figure 20 Escondida West Shoot - Schematic Cross-Section 30117E (Local Grid)
Extorre Gold Mines Limited
Cerro Moro Gold – Silver Project
Preliminary Economic Assessment | Page 108 |

Figure 21 Escondida Central Shoot - Schematic Cross-Section 30475E (Local Grid)
Extorre Gold Mines Limited
Cerro Moro Gold – Silver Project
Preliminary Economic Assessment | Page 109 |
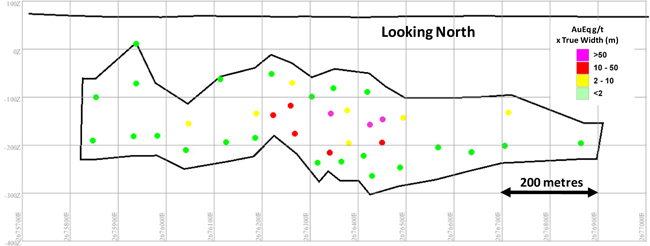
Figure 22 Martina Project - October 2011 Drilling - Vertical Section - AuEq*TW ppm
Extorre Gold Mines Limited
Cerro Moro Gold – Silver Project
Preliminary Economic Assessment | Page 110 |
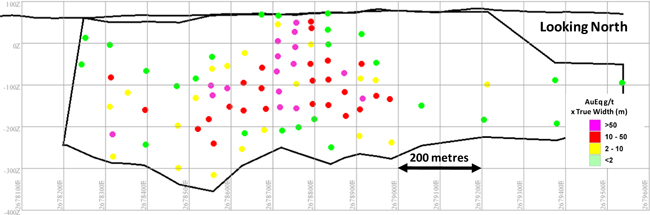
Figure 23 Zoe Project - October 2011 Drilling - Vertical Section - AuEq*TW ppm
Extorre Gold Mines Limited
Cerro Moro Gold – Silver Project
Preliminary Economic Assessment | Page 111 |
During Quarter 4, 2010 and Quarter 1, 2011, an infill drill program (20 m x 20 m spacing) was completed at the Loma Escondida prospect, with the primary purpose being to upgrade the existing Inferred mineral resources to a higher confidence level category. As of October 10, 2011 a total of 69 drill holes for 4,563.25 m (comprising 3,473.25 m of diamond drilling and 1,090.00 m of RC drilling) had been completed along the Loma Escondida structure. Figure 10.9 shows a longitudinal projection, constructed in the plane of the Loma Escondida main vein colour coded based on estimated true widths multiplied by the gold equivalent values (AuEq = Au ppm + Ag ppm/50).
During Quarter 4, 2010 and Quarter 1, 2011, resource definition drilling at the Esperanza prospect has focused on i) step-out and step-back drilling around the known gold-silver mineralization in the Esperanza Central shoot, and ii) scout drilling in the area of the “gap” between the Esperanza vein and the postulated northwestern extension at Nini. This drilling program was successful in delineating additional mineral resources along the Nini-Esperanza structure for the November, 2011 mineral resource update. As of October 10, 2011 a total of 107 drill holes for 11,984.5 m (comprising 8,377.2 m of diamond drilling and 3,607.3 m of RC drilling) had been completed along the Nini-Esperanza structure.
Further drilling is expected to be undertaken in these areas in 2012, with the primary aim being to increasing mineral resources in the Nini-Esperanza prospect. Figure 10.10 shows a longitudinal projection, constructed in the plane of the Nini-Esperanza main vein colour coded based on estimated true widths multiplied by the gold equivalent values (AuEq = Au ppm + Ag ppm/50).
An infill drill program (20 m x 20 m spacing) was completed on the high grade central portion of the Carla vein zone during 2011. As of October 10, 2011 a total of 40 drill holes for 3,746.80 m (comprising 3,320.80 m of diamond drilling and 426 m of RC drilling) had been completed on the Carla prospect. Figure 10.11 shows a longitudinal projection, constructed in the plane of the Carla main vein colour coded based on estimated true widths multiplied by the gold equivalent values (AuEq = Au ppm + Ag ppm/50).
Extorre Gold Mines Limited
Cerro Moro Gold – Silver Project
Preliminary Economic Assessment | Page 112 |
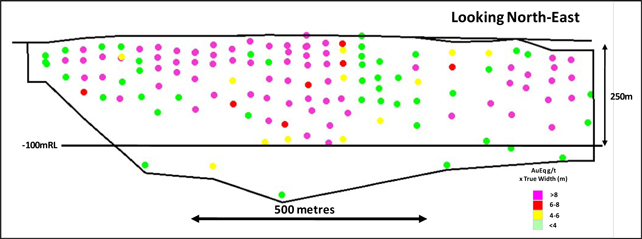
Figure 24 Gabiela Project - October 2011 Drilling - Vertical Section - AuEq*TW ppm
Extorre Gold Mines Limited
Cerro Moro Gold – Silver Project
Preliminary Economic Assessment | Page 113 |

Figure 25 Loma Escondida Project - October 2011 Drilling - Vertical Section - AuEq*TW ppm
Extorre Gold Mines Limited
Cerro Moro Gold – Silver Project
Preliminary Economic Assessment | Page 114 |
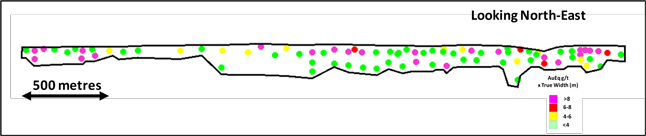
Figure 26 Nini Esperanza Project - October 2011 Drilling - Vertical Section - AuEq*TW ppm
Extorre Gold Mines Limited
Cerro Moro Gold – Silver Project
Preliminary Economic Assessment | Page 115 |
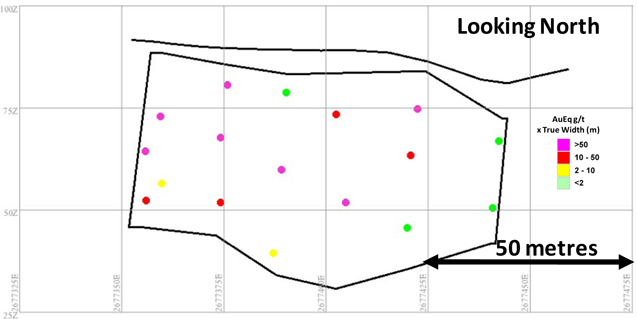
Figure 27 Carla Project - October 2011 Drilling - Vertical Section - AuEq*TW ppm
Extorre Gold Mines Limited
Cerro Moro Gold – Silver Project
Preliminary Economic Assessment | Page 116 |
| 11. | SAMPLE PREPARATION, ANALYSES AND SECURITY |
No information is available on Mincorp´s sampling procedures and protocols.
| 11.2 | Sample Procedures and Protocols |
The same methodology was used to collect the samples in the trenches and surface rock chip channel sampling. All the samples were taken by a field assistant under a geologist’s supervision utilising hammer and chisel. The samples to be collected are initially marked up by a geologist using a nominal 2 metre sample length with smaller lengths dependent on geological or mineralization contacts. All of the sampling in the trenches and surface rock chip channels are continuously sampled. Representative chips of each sample interval are stored in plastic boxes for future reference. The samples are placed in marked plastic bags, sealed and transported to the assay laboratory.
The lag soil samples are a composite of 5 sites taken every 5 m over every 25 m. The sampling was performed by field assistants under geologist supervision. The sampled material is sieved on-site to between 2 and 5 millimetres.
All diamond drilling at the Project has been completed by internationally-recognized drill contractors such as Boart-Longyear and Major Drilling Services.
All diamond drill holes completed by Extorre are orientated using either the Ballmark system or more recently by the Reflex ACT2 system. The Ballmark system uses gravity to make a mark on an aluminium disk with a small ball, with the mark representing the bottom of the hole in the oriented core. The Reflex ACT2 system is an electronic core orientation device that electronically records the bottom of hole position. An Extorre technician at the drill site measures core recovery and draws an initial orientation line on the core. The drill core is then placed in marked wooden core boxes at the drill site and transported to Extorre’s camp (currently located at the north-western corner of the property) for processing.
The orientation is verified at the camp before detailed geotechnical logging by trained specialist technicians. Geotechnical logging documents rock quality, which includes structural measurements of defects. All data is recorded on a metre by metre basis and includes; recovery, rock quality designation (“RQD”), strength, weathering, and the orientation of fractures. Utilising the orientation line (which represents the bottom of the hole) “alpha” and “beta” measurements are taken of the fractures. The alpha angle is the angle between the fracture plane and core axis. The beta angle is the angle between the axis of the fracture and orientation line measured in clockwise direction. Knowing the alpha and beta angles of the fractures and the orientation of the hole (dip and azimuth), the true spatial position of the fractures can be estimated (dip and dip direction) using Dips software.
Extorre Gold Mines Limited
Cerro Moro Gold – Silver Project
Preliminary Economic Assessment | Page 117 |
Core recoveries are estimated both on a “per drill run” basis using the core marker blocks and also on a “per metre” basis. Good recoveries (>95%) have generally been obtained from diamond drilling at Cerro Moro.
The core derived from each diamond drill hole is digitally photographed, wet and dry, by technicians before cutting and sampling. The geology is subsequently recorded by geologists, with both rock types and alteration / mineralization data being recorded and entered into the data-base to allow the construction of geological sections. Structural measurements of faults, veins and geological contact are taken with a Brunton compass in an orientation frame utilising the orientation line as a reference.
Upon completion of logging and photography, a geologist marks the core for sampling. Sample lengths through the obvious mineralized zones vary between 0.3 and 1.5 m, depending on geological and structural contacts, and these samples are classified as “high priority”. The remainder of each drill hole, classified as “low priority”, is generally sampled every one metre. To date, generally the complete hole has been sampled. Extorre technicians utilise a diamond saw on-site to cut the core in half; one half of the core is sampled and sent to the laboratory for analysis and the remaining half is stored on-site in the core boxes. The core saw is cleaned with a brick or other abrasive stone between each high priority sample to eliminate any possible contamination between potential high grade samples. The samples are placed in marked plastic bags, sealed, and transported to the assay laboratory.
| 11.2.3 | RC Percussion Drilling |
RC percussion samples are collected using a cyclone attached to the drill rig at one metre intervals. The geological logging is performed by Extorre geologists at the drill site. On the completion of logging, a geologist determines the sample interval lengths of the high and low priority zones. The high priority, potentially mineralized, zones are sampled at one metre intervals and composite samples of three metres are collected through the low priority zones. Each of the one metre samples are stored in plastic bags and are weighed and recorded by technicians at the drill site. The geologist records the diameter of the drilling tools (bit and shoes) at the beginning and end of each hole and uses these measurements to calculate an estimated weight of each sample. In this way the recovery of each sample can be estimated, assuming a density of 2.5. The resulting recoveries average above 85 percent. The sampling is performed at the Extorre camp by technicians, utilising a riffle splitter, where each metre sample is split 3 times. The average 1 metre sample weight is approximately 3 kilograms, with an average of 9 kilograms for the 3 metre composite samples.
Extorre Gold Mines Limited
Cerro Moro Gold – Silver Project
Preliminary Economic Assessment | Page 118 |
| 11.3 | Density Determination |
Specific gravity (“SG”) values have been calculated for core samples at Cerro Moro routinely since August, 2007. The methodology used is to calculate the ratio of the weight of sample in air to the difference between the weight in air and weight in water. Core samples, generally >10 cm in length are oven dried to 100° C, sprayed with waterproof sealant and weighed. The sample is then weighed whilst suspended in water and the SG is calculated as follows:
Where:
Wp = Weight of the sealed sample
Wps = Weight of the sealed suspended sample in water
The SG data is recorded for all lithologies encountered and will be used as the basis for assigning density values in future scoping studies. Vein samples, which include all types of quartz vein lithologies, vein breccias and stockworks, have SG values that vary between 2.45 and 2.81. Non vein samples, which include all other stratigraphic units, have SG values that vary between 2.34 and 2.61. The variations of the vein results are interpreted to mostly reflect the sulphide content associated with the veins.
As part of the quality control process, a set of check samples were submitted to Mecanica de Rocas in Santiago, Chile for SG determination. Ninety five percent (95%) of the 106 samples returned an error of <5%.
| 11.4 | Sample Preparation and Analysis |
The only sample preparation conducted by Extorre employees is the diamond saw cutting of diamond drill core samples and riffle splitting for the RC percussion samples (as detailed in sections 11.1.2 and 11.1.3 respectively), together with the bagging and sealing of samples on site. No other part of the sample preparation or analysis process, as detailed in the following sections, is conducted by an employee, officer, director, or associate of Extorre.
Prior to February 2011, samples from the Project were routinely sent to ACME Analytical Laboratories (Argentina) S.A. (“ACME”) in Mendoza, Argentina, for preparation (drying, crushing, and milling). Sample assaying is subsequently undertaken at ACME’s laboratory in Santiago, Chile. Historically, some diamond drill holes from Cerro Moro were also despatched to ALS Chemex’s sample preparation facility in Mendoza, Argentina, and then analyzed at ALS Chemex’s laboratory in La Serena, Chile.
Both AMCE and ALS Chemex are totally independent of Extorre.
Extorre Gold Mines Limited
Cerro Moro Gold – Silver Project
Preliminary Economic Assessment | Page 119 |
| 11.4.1 | ACME On-site Sample Preparation Facility |
In February 2011, ACME established a dedicated on-site sample preparation laboratory for Extorre at Cerro Moro. Samples are prepared by experienced personnel and a pulp split is sent to the company’s ISO9001 certified analytical laboratory located in Santiago Chile for analysis. The sample preparation facility has a capacity of 150-300 samples per day. Activities carried out by the on-site sample preparation facility are as follows:
| § | Pulverizing of the split fraction. |
The facility on site has a DCU (Dust Control Unit) that keeps the environment free of dust and contamination during processing.
The sample preparation facility is equipped with the following:
| § | Two crushers (Terminator TM); |
| § | One sample splitter (Hebro); |
| § | One drying oven (Made in house); |
| § | Two disc pulverizers (LM2 Labtechnics); |
| § | One air compressor (Compresores Hernandez de 7.5 HP; Local product). |
All sample batches are identified on the sample dispatch order form as being either of “high priority” (obvious mineralized zones) or “low priority” (not obviously mineralized).
A description of high and low priority sample preparation and analytical methods for ACME are detailed below.
Procedures for High Priority Samples
| § | Samples are received at the ACME on-site sample preparation facility at Cerro Moro; |
| § | Sample dispatch details are checked against samples received and confirmed with client; |
| § | Samples numbers are entered into the laboratory information system and bar coded sample number stickers matching the client sample numbers are generated; |
| § | Each sample is weighed at sample reception; |
| § | Samples are oven dried at 60°C for a minimum of 24 hours; |
| § | Samples are crushed to 85% passing -2mm using a TM Engineering Terminator Jaw crusher; |
| § | A barren quartz wash is inserted at the beginning and end of each job number and at every tenth sample during the crushing phase; |
| § | A 500 gram split is obtained using a stainless steel riffle splitter; |
| § | Pulverising to 85% passing 200 mesh (-75 micron) is achieved using a Labtechnics LM2 disc pulveriser (Code: R200-CRU85); |
Extorre Gold Mines Limited
Cerro Moro Gold – Silver Project
Preliminary Economic Assessment | Page 120 |
| § | A barren quartz wash is inserted at the beginning and end of each job number and at every tenth sample during the pulverising phase; |
| § | Pulps are weighed prior to dispatch to ACME Santiago, Chile; |
| § | Au (50 gram) by fire assay and AAS (Code: G6); |
| § | When the grade of Au is higher than 10 ppm, the samples are re-assayed by fire assay with a gravimetric finish (Code: G6 GRAV); |
| § | Ag (1 gram/100 millilitre) by 4 acid digestion and AAS (Code: 8TD); |
| § | When the grade of Ag is higher than 1,000 ppm, the samples are re-assayed by fire assay with a gravimetric finish (Code: G6 GRAV); |
| § | 35 elements by hot aqua regia digestion and ICP-ES (Code: G1D + Hg + Tl); |
| § | Samples with >1 ppm Au are repeated by fire assay and AAS (Code: G6); |
| § | Au via screen fire assay, if required (Code: G6 SFA). |
Procedures for Low Priority Samples
| § | Crush, split and pulverise drill core to 200 mesh (Code: R200-CRU85); |
| § | Au (50 gram) by fire assay and AAS (Code: G6); |
| § | 33 elements by hot aqua regia digestion and ICP-ES (Code: G1D). |
| 11.4.3 | ALS Chemex Procedures |
The two batches of drilling samples dispatched to the ALS Chemex laboratory were flagged, on the sample dispatch order form, as either “high priority” (obvious mineralized zones) or “low priority” (not obviously mineralized).
Procedures for High Priority Samples
| § | All samples to be crushed to –2 mm (laboratory code CRU-31) and followed before and after with a barren flush (laboratory code WSH-21); |
| § | Whole sample to be pulverised to –75 micron (laboratory code PUL-21); |
| § | Assay Au by laboratory code Au-AA26 (50 gram Au fire assay; 0.01 to 100 ppm detection.); |
| § | Ag by laboratory code Ag-GRA21 (30 gram Ag fire assay with gravimetric finish; 5 to 10,000 ppm detection); |
| § | Multi-elements analysis by laboratory code ME-MS61m (four acid near total digestion; 48 elements and mercury); |
| § | Samples with >1 ppm Au, repeat assay by laboratory code Au-AA26 (50 gram Au fire assay; 0.01 to 100 ppm detection). |
Procedures for Low Priority Samples
| § | Crush whole sample laboratory code CRU-31 (-2 mm); |
| § | Pulverise whole sample –75 micron laboratory code PUL-21; |
Extorre Gold Mines Limited
Cerro Moro Gold – Silver Project
Preliminary Economic Assessment | Page 121 |
| § | Analyse Au by laboratory code Au-AA24 (50 gram fire assay with AAS finish 0.05 to 10 ppm detection. Retain all residue); |
| § | Ag by laboratory code AgAA-61 (four acid digest with AAS finish; 0.5 to 100 ppm detection); |
| § | Samples >1 Au re-assay by laboratory code laboratory code Au-AA24. |
| 11.4.4 | Representivity of Metallurgical Sampling |
Extorre have undertaken extensive metallurgical sampling from the various mineralization styles at the Project. As of December 2009, a total of 114 metallurgical samples had been collected of which 113 are from the main potentially economic deposits at Cerro Moro (Escondida, Loma Escondida, Gabriela and Esperanza). Metallurgical samples have been assembled from representative diamond drill core and sent to Metcon Laboratories in Sydney, Australia for testing. The results of this metallurgical sampling program form the basis of this study. Additional metallurgical testwork was ongoing at the time of writing this technical report.
The metallurgical sampling program has been undertaken in such a way as to ensure that sufficient representative material has been selected from the various styles of mineralization likely to be encountered during mining. The sampling program includes a significant amount of material associated with the high grade sulphide mineralization found at Escondida and Loma Escondida together with lower grade peripheral sulphide mineralization and dilutant material. Specific samples have also been selected that are representative of the various oxidation conditions at Cerro Moro. Figure 28 to Figure 31 show metallurgical sample locations for Escondia, Loma Escondida, Gabriela and Esperanza as of December 2009.
It is the author’s opinion that the metallurgical sampling currently available for the Project is well advanced and is sufficiently representative of all styles of mineralization likely to be mined at the Project.
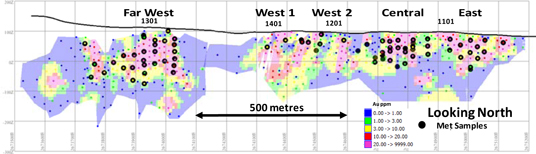
Figure 28 Escondida –Metallurgical Sampling Locations
Extorre Gold Mines Limited
Cerro Moro Gold – Silver Project
Preliminary Economic Assessment | Page 122 |

Figure 29 Loma Escondida – Metallurgical Sampling Locations

Figure 30 Gabriela – Metallurgical Sampling Locations
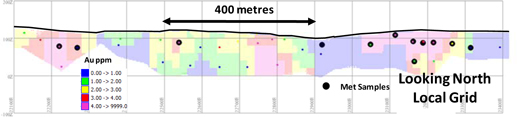
Figure 31 Esperanza – Metallurgical Sampling Locations
Quality control procedures include the regular use of client initiated geochemical standards, sample duplicates (RC percussion and lag soil samples only), geochemical blanks, check assaying of samples returning greater than 1.0 g/t gold, and twins of existing drill holes. These are fully discussed in Section 12. The results from the quality control sampling demonstrate that there were no obvious errors or bias in the sample preparation or analysis, and as such no corrective actions were required.
Extorre Gold Mines Limited
Cerro Moro Gold – Silver Project
Preliminary Economic Assessment | Page 123 |
Sampling of rock chips, trenches and rock chip channel samples, RC percussion chips, and drill core has been conducted on-site by Company personnel under the supervision of experienced Company geologists.
Regional exploration samples for assay are placed in sealed plastic bags with a numbered sample tag firmly stapled inside the bag. Depending on the individual sample size, two to six samples are then placed in larger woven plastic bags, which are then sealed with cable ties and numbered in preparation for transport to the laboratory.
Up until June, 2008, the majority of Cerro Moro samples were transported from site by Company vehicle to the bus station in either Caleta Olivia or to Comodoro Rivadavia. The samples were then transported by bus to the ALS Chemex preparation facility in Mendoza, Argentina. Commencing in July, 2008, samples were transported by a private contractor (30 tonne capacity truck) from site directly to the ACME sample preparation facility in Mendoza, Argentina. Regional exploration sample continue to be sent for sample preparation to ACME's sample preparation facility in Mendoza. Upon completion of sample preparation, pulps from regional exploration aresent by Jet Paq to ACME's laboratory in Santiago, Chile.
Commencing in February, 2011, sample preparation ofresource definition samples has occurred on site. Pulps from the on-site sample preparation facility are transported by van truck operated by a private contractor directly to Jet Paq (Aerolineas Argentina) in Comodoro Rivadavia. The pulps are transported by Jet Paq to Mendoza where they are stored at ACME's sample preparation facility for a short period before being sent by Jet Paq to ACME's laboratory in Santiago, Chile.
The author has witnessed all aspects of sample preparation and dispatch carried out by Extorre staff. In addition, the author has visited the ACME sample preparation facility in Mendoza, Argentina and found it to be a well organised, clean and high quality facility. The author has not yet had the opportunity to visit the on-site sample preparation facility at Cerro Moro. The author has not visited the ACME analytical facility in Santiago, Chile, however the author has no reason to doubt the integrity of this facility. In the author’s opinion, the sample preparation, security and analytical procedures employed by Extorre are consistent with standard industry practice particularly in the exploration for precious metals.
Extorre Gold Mines Limited
Cerro Moro Gold – Silver Project
Preliminary Economic Assessment | Page 124 |
The various steps taken by Extorre to ensure the integrity of analytical data are consistent with standard industry practice particularly in the exploration for precious metals. The sampling procedures are consistent with the authors’ understanding of the style of mineralization and structural controls in the various deposits. The authors’ examination of drill cores, particularly in regard to the recognition of mineralized intervals verified the soundness of the core sampling procedure.
Ted Coupland from Cube has visited the Project on two occasions, firstly, between December 12 and December 20, 2009 and secondly, between September 27 and September 29, 2011. Cube undertook several visits to the field where the main mineralized prospects were inspected and drilling activities were observed. Cube inspected representative drill core, observed geological and geotechnical logging activities, sample mark-up, core cutting, sample numbering and recording, insertion of QAQC reference material, sample bagging and dispatch. Cube also undertook an inspection of the recently established site based sample preparation facility operated by ACME.
During both site visits, Cube had the opportunity to discuss various Project details with several senior Extorre staff including Mr Matt Williams (Exploration Manager), Dr Eric Roth (President and CEO, Extorre) and Mr Fernando Chacon (Cerro Moro Site Manager).
Extorre has no documents supporting the QAQC procedures implemented or conducted by Mincorp. To the best of the author’s knowledge, no pulps or coarse rejects from the original Mincorp laboratory assaying still exist. Similarly, none of the remaining samples from the RC percussion drill holes could be located on-site. With respect to diamond drilling, approximately 70% of half core is stored on-site in varying condition. It is Extorre’s opinion that re-drilling of Mincorp drill holes is warranted in areas of interest or importance.
| 12.2 | QAQC Exeter / Extorre |
| 12.2.1 | Geochemical Standards |
Geochemical standards have been used by Extorre in all geochemical sampling and drilling programmes at Cerro Moro. During the period June 2003 to March 2007, one standard was inserted for every 40 samples. From March 2007, one standard was inserted for every 20 samples. The majority of standards are provided by Geostats Pty. Ltd. (“Geostats”) of Australia. To date, a total of 2,698 standards have been submitted from over 20 different standard types with recommended assay values varying from 0.33 to 47.24 Au ppm. The assays provided by ACME have been statistically analysed and separated into categories according to the recommended standard values. This analysis demonstrated that the greatest irregularities are associated with the lowest grade standards, however, standards with higher than recommended values have returned more acceptable levels.
Extorre Gold Mines Limited
Cerro Moro Gold – Silver Project
Preliminary Economic Assessment | Page 125 |
During 2009 to early 2010, Extorre routinely inserted 19 different commercially Certified Reference Materials (“CRM”) for laboratory quality control. As of 12th February 2010 (data cut off date for April 2010 resource estimate), Extorre had submitted approximately 1,000 CRMs and 1,800 blanks since the beginning of 2009. Cube undertook a review of the 19 CRM results for the period 2009 to February, 2010 (Coupland, 2010). In general, blanks showed acceptable performance with only 5 values exceeding 0.03 ppm Au. During this period, the majority of gold and silver CRM's performed within the limits expected from a well managed and robust QAQC program and there does not appear to be evidence of systematic error or material bias. Cube made some random checks of the database for CRM values that were outside two standard deviations of the expected value and noted that in all cases Extorre had highlighted these for follow-up.
During early 2010 to early 2011, Extorre has continued the regular insertion of CRM´s and blank samples as part of the company's standard QAQC procedure. Since the 12th February 2010 (data cut off date of April 2010 resource estimate, Coupland, 2010), Extorre has routinely inserted 29 different CRM's for laboratory quality control. As of 28th February 2011 (data cut off date for April 2011 resource estimate), Extorre had submitted approximately 2,200 CRMs and 2,200 blanks.
Cube undertook a review of the 29 CRM results for the period February 12th 2010 to February 28th 2011. As with the previous period, blanks showed acceptable performance with only 5 values exceeding 0.03 ppm Au. In general, apart from a small number of obvious errors, the majority of gold and silver CRM's have also performed within expected limits and there does not appear to be evidence of systematic error or material bias.
During the period 1st March 2011 and 10th October 2011 (data cut-off date of the November 2011 resource estimate), Extorre have routinely inserted 30 different CRM's for laboratory quality control. Approximately 1,700 CRM's and 1,600 blanks were inserted during this period. Cube undertook a review of the 30 CRM results for the period and concludes that the majority of gold and silver CRM's performed within the expected limits with 96% within two standard deviations of the expected value. Cube made some random checks of the database for CRM values that were outside two standard deviations of the expected value and noted that in all cases Extorre had highlighted these for follow-up.
In general, blanks showed acceptable performance with only 9 values exceeding 0.03 ppm Au.
The author is of the opinion that Extorre has implemented and continues to maintain a well-managed and robust QA/QC program and there does not appear to be evidence of systematic error or material bias.
Extorre Gold Mines Limited
Cerro Moro Gold – Silver Project
Preliminary Economic Assessment | Page 126 |
| 12.2.2 | RC Percussion Duplicate Samples |
A total of 2 duplicate RC percussion samples were submitted to ACME for the only RC percussion drill hole reported during 2009. Both samples originally assayed below the detection limit of the assaying method, as did the assays of the duplicate samples.
| 12.2.3 | Diamond Drilling Duplicate Samples |
A total of 251 duplicate diamond drill samples were selected for ALS Chemex. As demonstrated in Figure 32 the correlation between the original and duplicate samples for gold is within accepted limits.

Figure 32 Diamond Duplicate Samples vs Original Sample – Au ppm
As demonstrated in Figure 33 to Figure 35 the correlation between the original and duplicate samples for silver for the three different assay methods are also within accepted limits; hot aqua regia digestion and ICP-ES (G1d-ES), by 4 acid digestion and AAS (8TD), and by fire assay with a gravimetric finish (G6 GRAV).
Extorre Gold Mines Limited
Cerro Moro Gold – Silver Project
Preliminary Economic Assessment | Page 127 |
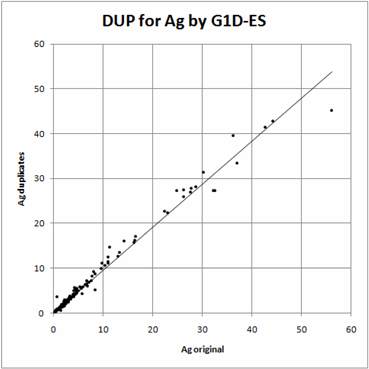
Figure 33 Diamond Duplicate Samples vs Original Sample – Ag ppm by Code G1D-ES

Figure 34 Diamond Duplicate Samples vs Original Sample – Ag ppm by Code 8TD
Extorre Gold Mines Limited
Cerro Moro Gold – Silver Project
Preliminary Economic Assessment | Page 128 |
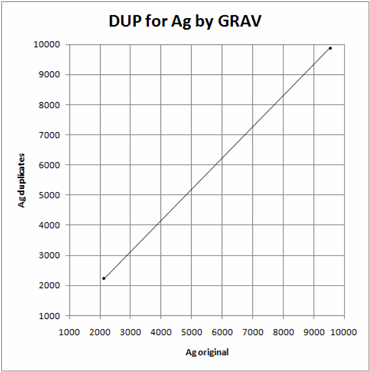
Figure 35 Diamond Duplicate Samples vs Original Sample – Ag ppm by Code G6 GRAV
| 12.2.4 | Check Assaying of Samples Greater than 1ppm Au |
As part of the assaying procedure, ACME re-assayed all samples that returned gold values of greater than 1.0 ppm Au with a second 50 gram fire assay and AAS finish (same method as original assay). Re-assaying is not routinely performed for samples returning gold values greater than 10 ppm Au as these samples are re-assayed by fire assay with a gravimetric finish. The plot of the original, versus re-assaying samples (a total of 4,860 pairs) shows reasonable correlation indicating relatively low variability within the pulp sample (refer to Figure 36).
This re-assaying procedure also includes the geochemical standards (a total of 2,243 pairs), which also shows reasonable correlation (refer to Figure 37).
Extorre Gold Mines Limited
Cerro Moro Gold – Silver Project
Preliminary Economic Assessment | Page 129 |
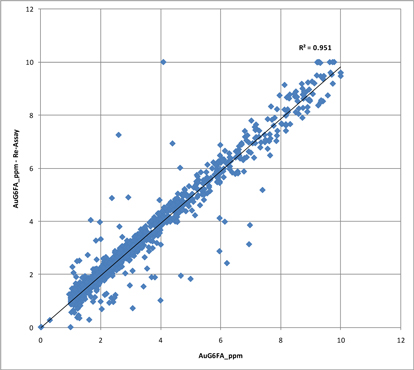
Figure 36 ACME Re-assays of diamond samples greater than 1 Au ppm
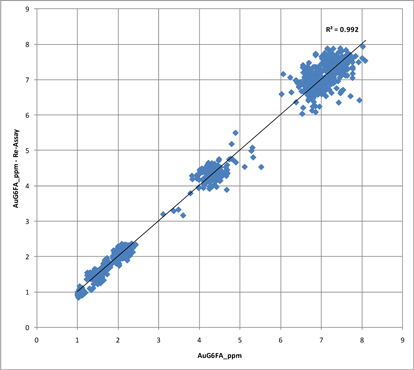
Figure 37 ACME Re-assays of geochemical standards greater than 1 Au ppm
Extorre Gold Mines Limited
Cerro Moro Gold – Silver Project
Preliminary Economic Assessment | Page 130 |
Geochemical blanks prepared from barren quartz have been submitted into the geochemical and drilling sample stream. From June 2003 to March 2007, the blanks were inserted every 40 samples. From March 2007, one blank was inserted for every 20 samples. These were offset with the standards giving a control sample every 10 samples.
Approximately 91% of the results assayed below a value 0.02 ppm Au.
As stated in Section 12.1, Extorre has no documentation of any QAQC procedures implemented or conducted by Mincorp. There are only three Mincorp drill holes at the Escondida prospect (all diamond drill holes), all located at Escondida West, and the two more significant drill holes were twinned.
Graphical logs of the 4 drill holes, displaying gold and silver results are presented in Coupland (2010).
Since early 2007, the entering of new assay data has been the sole responsibility of Extorre’s Chief Draftsman and Database Manager in Argentina. The Cerro Moro ‘database’ originally consisted of a series of separate MS Excel files containing collar locations, down hole surveys, geological logging, and assays. A relational database utilising MS Access was developed during the last quarter of 2007, and came into general use during 2008.
Validation of the database has been a four stage process:
1. Perusal of existing Quality Control products (i.e.: blanks, geochemical standards and duplicates) to identify areas for further investigation.
2. Visual checking by the Project geologist.
3. Detailed validation of all raw data.
4. Checking by senior Exeter personnel for simple errors utilising MS Excel and Micromine software packages.
| 12.3 | Data Verification by Cube |
| 12.3.1 | Drill Hole Collar Location |
Cube independently surveyed 60 drill hole locations using a hand held Garman 12XL GPS unit during the site visit in December 2009. An additional 30 drill hole locations were independently surveyed using a hand held Garman GPSMap 76Cx unit during Cube's September 2011 site visit. The holes were selected from various prospects at the Project. No significant discrepancies were detected and all coordinates were within ±5m which is within the accuracy of the GPS unit used.
Extorre Gold Mines Limited
Cerro Moro Gold – Silver Project
Preliminary Economic Assessment | Page 131 |
| 12.3.2 | Database Validation |
Cube has undertaken two extensive verification reviews of the Extorre's Cerro Moro drill hole database. The database reviews were conducted during Cube's site visits to Cerro Moro during December 2009 and September 2011.
Database verification included:
| 1. | A detailed overview of the database structure with Extorre's on-site database manager; |
| 2. | A detailed check of 1 in 10 drill holes drilled during 2009 and 1 in 25 drill holes drilled during 2010 and 2011. Checks included: |
| a. | Cross-validation of sample numbers from sample cutting sheet, sample dispatch tag book, Extorre dispatch number, laboratory job number and database - no errors detected; |
| b. | Cross-validation of certified reference material numbers between sample dispatch book and database - no errors detected; |
| c. | Cross-validation of original signed and scanned ACME lab assay reports (obtained directly from the laboratories at Cube's request) against database. Approximately 20% of all database assay records were checked - no errors detected; |
| d. | Check of downhole survey between original digital Reflex EZ Shot records and database - no errors detected; |
| e. | Check of database drill hole collar coordinates against original contract surveyor records - no errors detected. |
| 12.3.3 | Independent Laboratory Checks |
Cube requested the retrieval of a list of pulp or coarse reject material from ACME for selected mineralized intervals for approximately 1 in 10 holes covering all 2009 diamond drilling. This material was shipped directly to Genalysis Laboratory Services in Perth, Western Australia. An independent analysis of 213 pulp/reject samples was carried out by Genalysis using similar analytical techniques to that employed by ACME. Figure 38 and Figure 39 shows excellent correlation across all grade ranges for gold and silver between the ACME and Genalysis laboratories.
Extorre Gold Mines Limited
Cerro Moro Gold – Silver Project
Preliminary Economic Assessment | Page 132 |
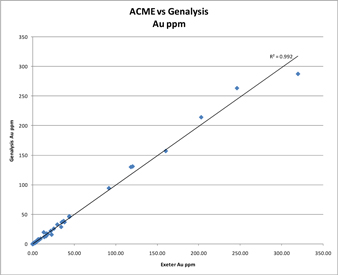
Figure 38 Laboratory Checks - ACME vs Genalysis - Au ppm
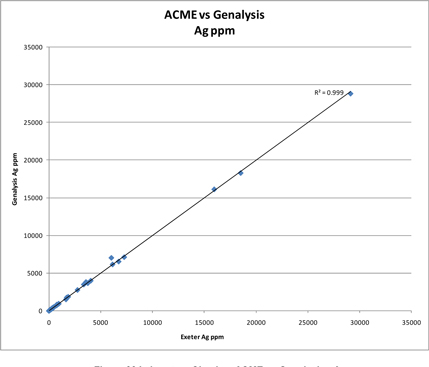
Figure 39 Laboratory Checks - ACME vs Genalysis - Ag ppm
Extorre Gold Mines Limited
Cerro Moro Gold – Silver Project
Preliminary Economic Assessment | Page 133 |
| 12.3.4 | Independent Sampling |
Cube selected an individual high grade drill hole intersection from the Zoe prospect for independent sampling during the September 2011 site visit. Cube supervised the interval selection, sample mark-up, core cutting to quarter core, sample numbering, bagging of the selected samples, and transport to Perth, Australia. Four samples were selected from drill hole MD1351 within the interval 258.58 m and 260.60 m. Analysis of the four samples was undertaken by Genalysis Laboratory Services in Perth, Western Australia using similar analytical techniques to that employed by ACME
Figure 40 shows the high grade Zoe mineralization independently sampled by Cube. Results of the independent sample are shown in Table 24. Whilst the independent sampling shows that the check results are slightly lower grade in this case, it does however confirm the presence of high grade gold and silver values and indicates the presence of considerable local scale variability within the style of mineralization under consideration.

Figure 40 Zoe Drillhole MD1351 Showing Independent Sampling Interval
| MD 1351 | | | Cerro Moro Database | | | Cube Sampling | |
| From | | | To | | | Length | | | Au ppm | | | Ag ppm | | | Au ppm | | | Ag ppm | |
| | 258.58 | | | | 259.09 | | | | 0.51 | | | | 113.6 | | | | 5,250 | | | | 112.3 | | | | 4,652 | |
| | 259.09 | | | | 259.82 | | | | 0.73 | | | | 24.4 | | | | 1,823 | | | | 15.1 | | | | 1,079 | |
| | 259.82 | | | | 260.12 | | | | 0.3 | | | | 2.3 | | | | 258 | | | | 6 | | | | 323 | |
| | 260.12 | | | | 260.6 | | | | 0.48 | | | | 5.3 | | | | 875 | | | | 3.4 | | | | 626 | |
| | Total Intercept | | | | 2.02 | | | | 39.1 | | | | 2,231 | | | | 35.5 | | | | 1,761 | |
Table 24 Zoe Drillhole MD1351 Independent Sampling Results
The author has undertaken reasonable endeavours assess the veracity of drilling data for the Project. It can be concluded that all logging, sampling and data QAQC procedures during the period 2009 to October, 2011 have been carried out to a high industry standard and record keeping and database management is excellent.
The author believes that the current database provides an accurate and robust representation of the Project and is appropriate for ongoing resource evaluation.
Extorre Gold Mines Limited
Cerro Moro Gold – Silver Project
Preliminary Economic Assessment | Page 134 |
| 13. | Mineral Processing and Metallurgical Testing |
The concentrator feed for the Project will be sourced from several deposits – Escondida (which includes the Central, East, West and Far West areas), Loma Escondida, Esperanza-Nini, Gabriela, Deborah, Zoe, Martina and Carla. The mineralized systems can be broadly described as silver - gold in nature and have been categorised by oxidation state. Both open pit and underground mining will be undertaken to extract material for processing.
The test work conducted to date has concentrated on the high tonnage mineralization types listed in Table 25 with flowsheet development based on results for Escondida as outlined in the following reports:
| § | Comminution Test Work Conducted Upon Samples from Cerro Moro Gold Project, AMMTEC Report No A11721, December 2008; |
| § | Initial Metallurgical Test Work on the Cerro Moro Silver/Gold Project, Argentina; Metcon Report M1668, February 2009 including Roger Townend & Associates mineralogy report 22301; |
| § | Cerro Moro Au-Ag Leach Residue Mineralogy; MODA, June 2009; |
| § | Metallurgical Test Work Conducted Upon Samples from Cerro Moro Gold Deposit; AMMTEC Report No A12671, May 2010 and Report No A12791, August 2010; |
| § | Metallurgical Characterisation Tests - Cerro Moro Mineralized Shoots - Escondida Far West, Metcon Report M2026, March 2010; |
| § | Flowsheet Development Test Work on the Cerro Moro Au/Ag Project; Metcon Report M2014, November 2010; |
| § | Flowsheet Development Test Work on the Cerro Moro Au/Ag Project; Metcon Report M2254, 2011; |
| § | Thickening of Cerro Moro Gold Leach Feed, Outotec Report S1474TB, February 2011; |
| § | Metallurgical Test Work Conducted Upon Test Work Products for Project, ALS AMMTEC Report No A13274, February 2011; |
| § | Cerro Moro Pressure Filtration Test Work, Ishigaki Oceania Pty Ltd, February 2011; |
| § | Transportable Moisture Test Report TML002-96, Australian Testing Sampling & Inspection Services Pty Ltd, March 2011; |
| § | Cerro Moro Metallurgical Development Tests Preliminary Testing of Zoe Structure Mineralization; Metcon Report M2470, March 2012; |
| § | Cerro Moro Metallurgical Development Tests November 2011 to February 2012; Metcon Report M2512, March 2012. |
The high grade of silver relative to gold indicates that the use of the Merrill Crowe process is favoured over carbon adsorption for the recovery of the precious metals after cyanidation leaching.
Extorre Gold Mines Limited
Cerro Moro Gold – Silver Project
Preliminary Economic Assessment | Page 135 |
| 13.2 | Representivity of Metallurgical Sampling |
The Representivity of Metallurgical Sampling is discussed in section 11.3.4 of this document.
The major domains for the early metallurgical test work were identified as:
| § | Escondida Central Fresh; |
| § | Escondida Central Oxide; |
Diamond drill hole (“DDH”) core samples were selected from the various mineralized zones to represent the major domains. As noted in Metcon Report M1668 (February 2009) the selection of intercepts to generate composites for metallurgical testing of the individual domains was done by Exeter metallurgical and geological management on the following basis:
“The drill logs, assays and descriptions were reviewed by metallurgical and geological management and the potentially economic intercepts were selected on the basis of grade, grade continuity, rock type, alteration type and width. Generally a minimum down-hole width of 2 m was used and a cut-off grade of 0.5g/t Au was applied however these were not rigorous criteria and discretion was applied on some occasions”.
Quarter core was used to generate the test composites for each domain.
After the initial phase of testing the subsequent test work was conducted on a composite representing the Escondida zone. The makeup of this composite on a weight for weight basis was as follows:
| § | | Escondida Central Fresh | | | 28.3 | % |
| § | | Escondida Central Oxide | | | 26.1 | % |
| § | | Escondida East | | | 26.1 | % |
| § | | Escondida West | | | 19.5 | % |
A further stage of test work was undertaken to investigate the potential to improve silver recoveries using a modified process flowsheet. This test work was conducted on samples representing the following metallurgical domains identified for the previous test work as well as the newly discovered Zoe shoot:
Extorre Gold Mines Limited
Cerro Moro Gold – Silver Project
Preliminary Economic Assessment | Page 136 |
| § | Escondida Central Fresh; |
| § | Escondida Central Oxide; |
Test work was conducted with tap water from Perth and Sydney.
Gold analyses on solid samples were conducted by fire assay with an AAS (atomic absorption spectroscopy) finish while the silver analyses on solid samples were conducted by acid digestion and ICPms (inductively coupled plasma mass spectroscopy) or AAS finish. Gold and silver analyses on solution samples were analysed by ICPms (inductively coupled plasma mass spectroscopy). Sulphur analyses on solid samples were conducted by Leco. Base metal analyses on solids were by acid digestion and ICPms finish and base metal analyses on solutions were by ICPms.
All analyses were conducted by Ammtec in Perth, Western Australia in accordance with their standard quality control procedures.
The deposits are classified as low sulphidation (sulphide minerals are about 5% of the mineralized zones) epithermal gold – silver veins where the mineralization is associated with sulphides (pyrite, sphalerite, chalcopyrite and galena) in quartz veins that typically occur along fault zones. Alteration of the surrounding rock by the hydrothermal fluids and faulting has produced illite clays. The host rocks include:
| § | Rhyolite – essentially a fine grained granite, typically felsic (silica rich) and sometimes brecciated with clasts of quartz and feldspar, and accessory biotite/mica and hornblende; |
| § | Andesite – porphyritic texture with phenocrysts of feldspar but little or no quartz; |
| § | Felsic tuff – silicate minerals (quartz, mica, muscovite, feldspar) often brecciated; |
| § | Volcaniclastic sediment. |
Extorre Gold Mines Limited
Cerro Moro Gold – Silver Project
Preliminary Economic Assessment | Page 137 |
As the veins in the deposits are narrow with widths ranging from 1 m to 5 m (Gabriela has veins up to 20 m wide in the central and south-eastern part of the deposit), the feed to the plant will include the host rocks and the illite clays from the alteration zone adjacent to the veins and these will impact on the operation and performance of the treatment plant.
The main minerals present based on the geology and the mineralogy of leach tails from oxide and fresh Escondida zones, mineralogy of flotation concentrates and gravity concentrates from Escondida and Gabrielazones , and head sample assays are:
| § | Quartz (SiO2) – The quartz is generally fine grained and occurs as chalcedony in places. Phenocrysts/clasts of quartz are also present and these would form pebbles in a SAG mill and rock scats from ball mills. The quartz will cause high abrasion in crushing and grinding equipment’; |
| § | Illite/mica - Illite is a very fine grained phyllosilicate sheet mineral (a form of mica) that will increase the viscosity of the slurry in the plant and reduce the settling and filtration rates in dewatering. The platy nature of most forms of mica usually causes a coarse grind and a very high work index to be reported due to the large two dimensional size of the particles however, illite grains range from 0.1 to 0.3 µm in diameter and are only 30 Å thick compared to most phyllosilicates that have grains up to 2.0 µm thick and are up to 4.0 µm wide. Therefore breakage during grinding into composite grains of apparent coarse platy particles does not inflate the work indices measured when illite is present. Illite is a non-expanding mica/clay in that it does not absorb water with expansion of its layer structure (as smectites such as bentonite and fuller’s earth do) and so excessive viscosity is not expected at most slurry densities that will be used in the treatment plant. Nevertheless the fineness of the particles will blind cloths in filtration and result in low settling rates in thickening; |
| § | Kaolin/kaolinite (Al4Si4O10(OH)8) - Clay particles 0.3 to 4.0 µm wide and 0.05 to 2.0 µm thick will affect the viscosity, thickening and filtration rates; |
| § | Chlorite ((Mg,Fe,Al)6(Si,Al)4O10(OH)8 – Chlorite can increase the viscosity and yield stress of slurry; |
| § | Feldspar/microcline (KAlSi3O8). |
The feed will therefore comprise predominantly silicate minerals that are fine grained which will increase the power required for size reduction and the wear life of equipment linings and grinding media. The mineralized veins of quartz – adularia (KAlSi3O8 a variety of microcline or orthoclase feldspar) contain gold and silver and associated sulphides as ginguro bands that alternate with the quartz and other silicates. Ginguro is a term used to describe a fine grained aggregate, usually dark in colour that consists of electrum, silver (sulphide) minerals and sulphide minerals such as chalcopyrite (CuFeS2), sphalerite ((Zn,Fe)S), galena (PbS) and pyrite (FeS2). The texture within the veins is also often brecciated.
Extorre Gold Mines Limited
Cerro Moro Gold – Silver Project
Preliminary Economic Assessment | Page 138 |
Gold occurs as native gold, argentian gold (up to 23% Ag) or electrum (an alloy of gold and silver with silver contents reported by Roger Townend to range from 40% to 76% Ag in the Escondida and Gabriela zones). The electrum and argentian gold occur as discrete particles and are often occluded within pyrite, acanthite (Ag2S) or sphalerite, or as mineral grains in association with galena, acanthite and/or chalcopyrite – see Figure 41 to Figure 46. Native gold can be readily recovered by gravity, flotation and cyanidation processes. Electrum does not respond well to flotation and as for argentian gold, has a lower rate of dissolution in cyanide than native gold (and requires a higher concentration of cyanide to achieve good recovery in equivalent leach times) but electrum is recovered readily by gravity means. Fine gold minerals were seen in binary, ternary and quaternary composites and inclusions within other sulphide minerals indicating that recovery of gold (and silver) will be maximised by producing a sulphide concentrate from gravity and flotation circuits or by ultrafine grinding prior to leaching.
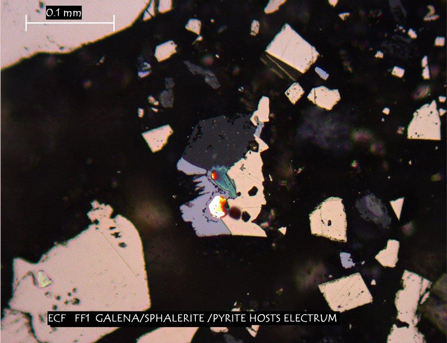
Figure 41 20 µm electrum(white) at galena/pyrite contact, also sphalerite
Extorre Gold Mines Limited
Cerro Moro Gold – Silver Project
Preliminary Economic Assessment | Page 139 |
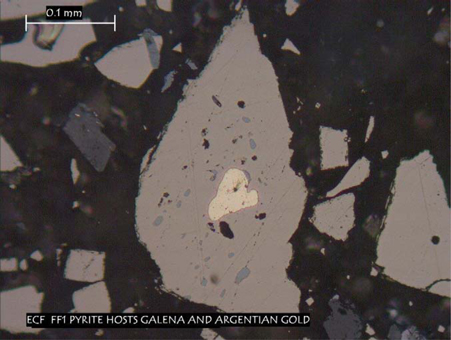
Figure 42 50 µm argentian gold within coarse pyrite also containing galena
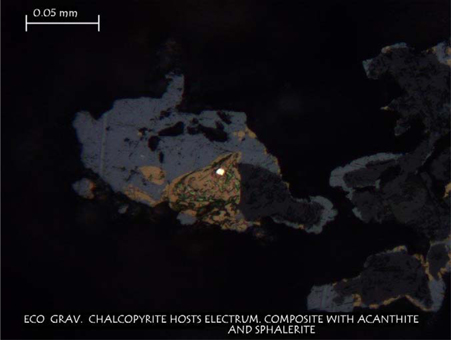
Figure 43 Electrum of 6 µm in chalcopyrite enclosed by 100 micron acanthite
Extorre Gold Mines Limited
Cerro Moro Gold – Silver Project
Preliminary Economic Assessment | Page 140 |
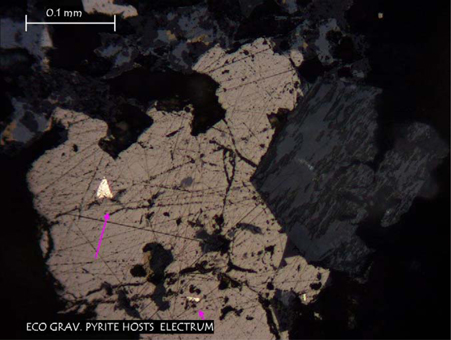
Figure 44 Two electrums (63% silver) 5 and 10 µm in pyrite, composite with sphalerite and jalpaite, also titanium oxide.
Silver is present as acanthite (Ag2S containing 87% Ag), tetrahedrite/freibergite ((Cu,Ag)10(Fe,Zn)2Sb4S13 with up to 34% Ag content) and in electrum and argentian gold. Generally there will also be silver within the lattice of other sulphide minerals associated with epithermal deposits – in galena, chalcopyrite and pyrite. The cyanidation rate of silver and silver minerals is slower than for gold and higher cyanide concentrations, finer grind sizes and longer leach times are generally required. The higher cyanide concentrations result in higher residual cyanide levels in the tailings stream which will require detoxification/neutralisation. The silver minerals are generally softer than the other minerals present and tend to be overground during grinding. Combined with their naturally fine grained nature and relatively lower specific gravity (7.5 for acanthite compared to 19.3 for gold), the silver recovery tends to be lower than gold in gravity circuits. The flotation kinetics of the silver sulphide minerals is moderately high although slimes losses will occur. As the silver minerals will preferentially grind to a smaller size than the majority of the other minerals in the various mineralized zones, a proportion of the silver minerals will report more readily to the cyclone overflow – the amount of acanthite in the circulating load relative to the other sulphide minerals will be lower - and therefore may not be presented to gravity or flash flotation which are typically fed a portion of the cyclone underflow stream. This suggests that a portion of the mill discharge should be treated by unit cell flotation or by gravity.
Extorre Gold Mines Limited
Cerro Moro Gold – Silver Project
Preliminary Economic Assessment | Page 141 |

Figure 45 Zoned electrum from 5 to 100 µm composite with acanthite, sphalerite and chalcopyrite.
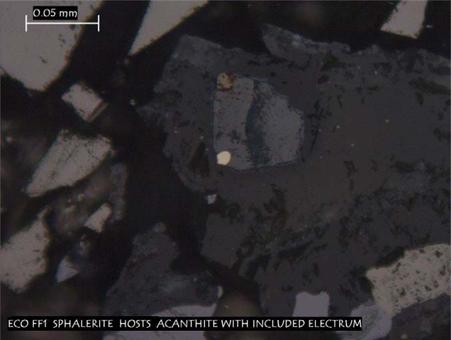
Figure 46 Electrum of 10 µm in acanthite in sphalerite
Table 25 summarizes the mineral occurrence and associations found from optical and scanning electron microprobe analysis of flash flotation and gravity concentrates generated in laboratory tests.
Extorre Gold Mines Limited
Cerro Moro Gold – Silver Project
Preliminary Economic Assessment | Page 142 |
| | | Escondida. Central
Fresh
Flash Conc. | | Escondida. Central
Oxide
Flash Conc. | | Escondida. East
Flash Conc. | | Gabriela
Flash Conc. | | Escondida. Central
Fresh
Gravity Conc. | | Escondida. Central
Oxide
Gravity Conc. | | Escondida. East
Gravity Conc. | | Gabriela
Gravity Conc. |
| | | | | | | | | | | | | | | | | |
| Dominant Mineral | | Pyrite 20-400µm 75% discrete | | Pyrite 20 -400µm 50% discrete; composite with or disseminated in quartz | | Pyrite 20 - 300µm discrete & with inclusions of galena & chalcopyrite | | Pyrite 20 - 250µm discrete | | Pyrite 50% free, 20% inclusions in quartz | | Pyrite 50% discrete, 35% disseminated in pyrite | | Pyrite 50 -150µm mostly discrete; fine inclusions in silicates | | Goethite discrete |
| | | | | | | | | | | | | | | | | |
| Major Mineral | | Sphalerite mostly discrete | | Sphalerite <100µm mostly discrete | | - | | - | | Sphalerite discrete & composite with galena | | - | | - | | - |
| | | | | | | | | | | | | | | | | |
| Major Mineral | | Galena composite with sphalerite | | - | | - | | - | | Galena | | - | | - | | - |
| | | | | | | | | | | | | | | | | |
| Minor Minerals | | - | | Galena <100µm; chalcopytite <100µm; sphalerite mostly discrete 150µm | | - | | - | | - | | - | | - | | Hematite micro-crystalline |
| | | | | | | | | | | | | | | | | |
| Accessory Minerals | | Chalcopyrite, galena, acanthite | | Acanthite; galena associated with acanthite | | Sphalerite <100µm mostly discrete; chalcopyrite | | Acanthite rarely discrete, sphalerite composite with & in pyrite; galena | | Acanthite discrete to 200µm, composite with pyrite, sphalerite, galena. jalpaite | | Sphalerite discrete & composite with galena; galena mostly composite; acanthite | | Sphalerite discrete <150µm | | Pyrite disseminated euhedral in silicate; magnetite; sphalerite composite with pyrite, jalpaite, quartz |
| | | | | | | | | | | | | | | | | |
| Trace Minerals | | Electrum, freibergite, jalpaite | | Pearcite, jalpaite, electrum, argentite gold, chalcopyrite, covellite; stromeyerite 50µm rimmed with native silver as rims on pyrite | | Galena, acanthite, bornite, electrum, argentite gold, jalpaite, marcasite | | Chalcopyrite & composite with galena or included in sphalerite; digenite; covellite rims pyrite; acanthite; electrum; jalpaite; argentite gold; native silver | | Bornite, chalcopyrite included in acanthite; electrum ; argentite gold | | Jalpaite; electrum; argentite gold; covellite; stromeyerite <50µm rimmed & veined by chalcopyrite | | Galena composite with sphalerite & in pyrite; chalcopyrite composite with pyrite & silicate; bornite | | Galena; chalcopyrite |
| | | | | | | | | | | | | | | | | |
Extorre Gold Mines Limited
Cerro Moro Gold – Silver Project
Preliminary Economic Assessment | Page 143 |
| | | Escondida. Central
Fresh
Flash Conc. | | Escondida. Central
Oxide
Flash Conc. | | Escondida. East
Flash Conc. | | Gabriela
Flash Conc. | | Escondida. Central
Fresh
Gravity Conc. | | Escondida. Central
Oxide
Gravity Conc. | | Escondida. East
Gravity Conc. | | Gabriela
Gravity Conc. |
| | | | | | | | | | | | | | | | | |
| Electrum occurrence | | 40% silver, inclusions in pyrite, composite with galena & sphalerite | | 52% silver composite with pyrite or acanthite, & within pyrite | | 76%silver composite with acanthite & pyrite; disseminated in acanthite | | Sub-µm in pyrite & acanthite | | Composite with pyrite, sphalerite & galena; 50% silver | | In pyrite | | Discrete | | In sphalerite |
| | | | | | | | | | | | | | | | | |
| Argentian Gold occurence | | Inclusions in pyrite | | In chalcopyrite & pyrite | | 90µm discrete | | 23%silver very fine inclusions in pyrite; native silver very fine with acanthite in pyrite | | Very fine in galena | | 23% silver; in or with jalpaite, acanthite, chalcopyrite | | 20µm with galena in sphalerite; composite with pyrite | | <5µm in pyrite & acanthite |
| | | | | | | | | | | | | | | | | |
| Acanthite occurrence | | 100µ discrete, inclusions in pyrite & sphalerite; composite with pyrite & galena | | coarse discrete & in pyrite | | Discrete to 200µm; composite with or in pyrite, galena, & silicate | | Discrete to 200µm; composite with pyrite, chalcopyrite, sphalerite, galena; fines in pyrite | | | | | | Included in pyrite & composite with galena or feldspar | | Up to 300µm; fine in silicate associated with jalpaite & pyrite |
| | | | | | | | | | | | | | | | | |
| Jalpaite occurrence | | 70µm discrete; composite with freibergite | | <200µm discrete | | | | 100µm composite with pyrite or chalcopyrite | | | | Composite with sphalerite, quartz, pyrite | | With galena as composites in pyrite & quartz | | 100µm hosting finer acanthite in quartz; 25-50µm in sphalerite & chalcopyrite |
Table 25 Summary of flash flotation & gravity concentrate mineralogy findings (Escondida & Gabriela)
Extorre Gold Mines Limited
Cerro Moro Gold – Silver Project
Preliminary Economic Assessment | Page 144 |
The modal analysis of leach tailings indicated that the silver occurred mainly as acanthite (accounting for 96% of the silver in the fresh mineralized zone tailing and 93% in the oxide mineralizedzone tailing). 3% of the silver was present in tetrahedrite for the fresh mineralized zone tailing and 6% in the oxide mineralized zone tailing. The liberation and composite particle analysis for acanthite is shown in Table 26 and indicates that liberation is higher for oxide mineralized zone.
| | | +53 µm
Fresh | | | +53 µm
Oxide | | | -53+20
µm
Fresh | | | -53+20
µm
Oxide | | | -20 µm
Fresh | | | -20 µm
Oxide | | | Overall
Fresh | | | Overall
Oxide | |
| Weight % | | | 26 | | | | 21 | | | | 27 | | | | 23 | | | | 47 | | | | 56 | | | | 100 | | | | 100 | |
| % Liberated | | | 48 | | | | 62 | | | | 19 | | | | 60 | | | | 92 | | | | 93 | | | | 67 | | | | 76 | |
| % Binary with Pyrite | | | 10 | | | | 6 | | | | 4 | | | | 3 | | | | 0 | | | | 0 | | | | 3 | | | | 2 | |
| % Binary with Sphalerite | | | 29 | | | | 18 | | | | 12 | | | | 0 | | | | 6 | | | | 0 | | | | 11 | | | | 5 | |
| % Binary with Chalcopyrite | | | 0 | | | | 2 | | | | 2 | | | | 14 | | | | 0 | | | | 6 | | | | 0 | | | | 7 | |
| % Binary with Gangue | | | 0 | | | | 3 | | | | 20 | | | | 15 | | | | 0 | | | | 0 | | | | 5 | | | | 5 | |
| % Ternary | | | 6 | | | | 6 | | | | 42 | | | | 7 | | | | 2 | | | | 1 | | | | 12 | | | | 4 | |
| % Quaternary | | | 8 | | | | 3 | | | | 0 | | | | 0 | | | | 0 | | | | 0 | | | | 1 | | | | 1 | |
Table 26 Liberation and composite details for Acanthite (Ag2S) in leach tailing (Escondida)
The mineralogy liberation analysis indicates significant compositing of the acanthite with other sulphide minerals and that a fine grind of 20 to 50 µm is required to liberate the acanthite especially for the fresh mineralization. It also indicates that regrinding of flotation and gravity concentrates to approximately 20 µm will liberate the majority of the acanthite that has reported to tailing. Without regrinding, upgrading of flotation and gravity concentrates using cleaning stages is likely to result in losses of gold and silver due to the complex associations and fineness of included grains. Based on the calculated assays for the particles analysed, 43% of the silver was lost in the -20 µm fraction and 31% in the +53 µm fraction of the fresh mineralized zone and 53% in the -20 µm fraction and 23% in the +53 µm fraction of the oxide mineralized zone – the highest losses were in the fines. Most acanthite particles in the coarse fractions showed corrosion on the surface indicating that leaching had occurred and that longer times or finer grinding may be required to increase silver leach recovery. The presence of a high proportion of liberated acanthite particles in the tailings (67% and 76% for the fresh and oxide mineralized zones respectively) also indicates there was insufficient time for the mineral to leach. It may also indicate that some passivation of the surface has occurred that slowed the leach rate or that insufficient cyanide was present.
The variety of minerals and the complexity of the mineral associations of the precious metals mineralogy (especially the proportion of ternary and quaternary particles containing tetrahedrite) therefore indicate that there is justification for both gravity and flotation processes to maximise recoveries with the processes tending to complement each other depending on the variation in mineral occurrence. For example, flaky or platelet gold formed during grinding of the ductile native gold tends to flutter into the tailing stream in gravity concentrators. This gold is able to be recovered in flotation.
Extorre Gold Mines Limited
Cerro Moro Gold – Silver Project
Preliminary Economic Assessment | Page 145 |
The unconfined compression strength (UCS) of the mineralized zones ranges from 81 MPa to 222 MPa with an average of 120 MPa and is considered to be moderately tough. The measured abrasion indices ranged from 0.1 to 0.5. The mineralized zones with the highest toughness occur with the finer grained volcanic rocks. As the majority of the gangue comprises silica, the abrasion index is high and tough rock will need to be broken, selection of a double toggle jaw crusher will minimize the wear rate of liners in the primary crusher however a double toggle jaw crusher is not available in the capacity range required so a single toggle jaw crusher was selected.
The SMC breakage data indicates the mineralized zones overall are of medium hardness relative to the data base with individual samples ranging from soft to moderately hard. The Bond ball mill work indices ranged from a moderate 14.4 kWh/t to a high (hard) 19.9 kWh/t. The respective rod mill work indices were only slightly higher than the ball mill work indices with ratios ranging from 0.95 to 1.17 indicating there would be little build up of a critical size in a semi-autogenous or autogenous mill. It also indicates that sufficient competent media may be lacking at times and a high ball charge would be needed to effect grinding in a semi-autogenous (SAG) mill.
Variations in the feed breakage characteristics will result in fluctuating plant treatment rates in a SAG mill operation which will cause a significant effect on downstream processes as the relative effect is amplified by the low average throughput of 59 t/h. Therefore, a three stage crush and single stage ball mill comminution process has been selected to provide a stable treatment rate.
Calculations using both the conventional Bond – Roland method and SMCC’s latest method for the power required to reduce the crushed product from a P80 of 8.5 mm to the target P80 of 75 µm at a rate of 59 t/h indicate a mill capable of drawing 2,000 kW is required.
| 13.8 | Gravity Concentration |
As discussed above, the mineralogy indicates that inclusion of both flotation and gravimetric devices will maximise recovery of the silver and gold minerals. The initial series of test work indicated gravity recoverable gold and silver varies from 2% to 30% for each metal. Flash flotation recovery will vary from 10% to 55% for each of gold and silver. To maximise the gravity recoverable gold a flash flotation machine and a centrifugal gravity separator will treat >75% of the cyclone underflow.
The cyclone underflow has been selected as the feed stream to the gravity circuit as it will be deslimed thereby overcoming viscosity issues in flotation. The process flowsheet developed from the initial phase of test work involved the gold and silver in the cyclone overflow stream (particles that have not been recovered in the flash flotation machine and gravity device in the cyclone underflow) reporting directly to the leaching circuit.
Extorre Gold Mines Limited
Cerro Moro Gold – Silver Project
Preliminary Economic Assessment | Page 146 |
Test work indicated that increasing the flotation time from 1 minute to 2 minutes improved the recovery of both gold and silver into flash flotation concentrate particularly for high grade mineralized zones (Metcon report M2026). Tests were conducted at 50% solids to overcome the viscosity associated with the illite clays and at natural pH which ranged from 7 to 8.
The latest series of test work (Metcon M2470 and M2512) indicates the flash flotation and gravity recovery of silver varies from 28% to 64% and gold from 46% to 80%. These tests were conducted using a particle size P80 of 500 µm to more accurately reflect the probable size distribution of the cyclone underflow stream. The mass recovery to the flash flotation concentrate was typically 2% (relative to plant feed).
A scale up factor of 1.7 has been applied to the laboratory test time which gives a required cell volume of 8.0 m³ (allowing for 15% air hold up). An 8 m³ SK240 flash flotation machine has been selected. A manually adjustable froth crowder will enable mass pull variations of 2% to 10% (relative to plant feed).
As per the optimum test work flowsheet, tailing from the flash flotation machine will report directly to a centrifugal concentrator to recover the precious metals minerals that were not collected in the flotation stage due to mineralogy, particle surface chemistry or particle size. Variable cycle times or bowl configurations can be used to change the mass pull to the gravity concentrate. A 20 minute cycle has been selected for design to maximise the mass recovery into concentrate.
Test work was conducted to investigate the potential for conventional flotation of the sulphide minerals in the cyclone overflow stream followed by regrinding to enhance recovery of gold and silver in the subsequent leaching stages. This series of test work demonstrated that a substantial improvement in overall silver recovery will be achievable using this extraction pathway (Metcon reports M2470 and M2512).
Batch flotation tests were conducted on samples of the major domains identified for the early test work. The rougher flotation stage recovery of silver will vary from 73% to 93% and gold from 62% to 96% (relative to flotation feed). The mass pull to rougher concentrate varies from 4.9% to 9.5% .
Tank flotation cells of 10 m³ volume were selected for rougher flotation based on a scale up of laboratory residence time with checks to ensure that area and lip length capacities were not exceeded. Laboratory rougher flotation times were scaled-up by a factor of 2.9 to 11.5 minutes. Each rougher cell will have 2.35 m² of surface area and will be fitted with an internal perimeter launder with total lip length of 6.3 m. The rougher flotation cells will be forced-air addition cells configured with individual pinch valves to assist with controlling mass pull variations from the different mineralized zones.
The laboratory flotation test work included 2 minutes of conditioning time. This mixing will be provided in the plant by adding reagent to rougher flotation cell feed box or via piping from tundishes into the mixing zone of flotation cells.
Extorre Gold Mines Limited
Cerro Moro Gold – Silver Project
Preliminary Economic Assessment | Page 147 |
| 13.10 | Flotation and Gravity Concentrate Treatment |
The concentrate from the gravity and flotation stages will be reground and report to a separate concentrate leaching circuit. The early intensive cyanidation test work indicated that a regrind P80 size of less than 62 µm was sufficient to extract over 94% of both the gold and silver. Without regrinding, extraction of gold and silver was lower at 92% for gold and 79% for silver. Copper extraction into solution ranged from 17% to 29% and appeared to be affected by copper grade and mineralogy with high cyanide consumptions when extraction of copper was higher.
The consumption of sodium cyanide was generally higher at 13.5 kg/t for the reground concentrate – unground concentrate consumed 12.6 kg/t of sodium cyanide. The effect of regrind sizes finer than 30 µm on leach time and reagent consumption has not been assessed and indications are that reagent consumption is driven by the mineralogy.
The leach kinetic curves indicate that silver reaches an equilibrium after 8 to 16 hours while gold continues to leach, although at a low rate for a further 8 hours at least. These test were done under intensive cyanidation conditions similar to those that occur in an Acacia reactor – 10% solids, 0.2% caustic (NaOH), 1% to 2% sodium cyanide and 12 kg/t to 25 kg/t leach aid. Dissolved oxygen levels were 7 ppm to 8 ppm. The initial intensive cyanidation tests were done using 200 g of sample. Leach kinetics tended to be faster when the cyanide concentration was maintained at a higher value, but 24 hour extractions were not affected.
The concentrate leach extractions were determined on the basis of the recent cyanidation test work results (Metcon M2470 and M2512). This test work indicated that a regrind P80 size of 30 µm was sufficient to extract 99% and 97% of the gold and silver from the rougher flotation concentrate on average. Dissolution of the gold generally reaches an equilibrium after 8 hours while silver continues to leach, although at a lower rate for a further 16 hours at least. These tests were done under similar intensive cyanidation conditions to the previous tests – 10% solids, 0.2% caustic (NaOH) and 1% sodium cyanide. Dissolved oxygen levels were 8 ppm to 9 ppm.
The test work also indicated that a regrind P80 size of 30 µm was sufficient to achieve high extraction rates for gold and silver from the flash flotation and gravity concentrates using a two stage leach. The first stage consisted of a 4 hour intensive cyanidation. These tests were done at a higher slurry density and cyanide concentration compared to the previous tests – 25% solids, 0.2% caustic (NaOH) and 2% sodium cyanide. Dissolved oxygen levels were 4 ppm to 8 ppm. Leaching was then extended for a further 48 hours under conditions similar to the flotation tailings leach – 40% solids and 0.1% sodium cyanide.
Extorre Gold Mines Limited
Cerro Moro Gold – Silver Project
Preliminary Economic Assessment | Page 148 |
The process design provides for continuous leaching of the combined flash flotation, gravity and rougher flotation concentrates under intensive cyanidation conditions after regrinding to a P80 size of 30 µm. The concentrate leaching circuit has been designed to provide a minimum residence time of 24 hours. The concentrate leach feed density will be 32% solids to minimize cyanide addition and reduce the size of the leach circuit. Five stages of leaching have been selected to minimize short circuiting, and to provide flexibility to maximise control of the leaching conditions. The concentrate leach residue will be thickened and filtered to remove soluble gold and silver and the pregnant solution will be sent to the Merrill Crowe circuit for precious metal recovery. The washed filter cake will be repulped and return to the main leaching circuit to ensure gold and silver extraction is maximised.
No test work to generate a signature plot of grind size versus power has been done to accurately size the concentrate regrind mill. A specific power of 20 kWh/t has been assumed based on similar duties for sulphide flotation concentrates. A 500 litre IsaMill which is powered by a 200 kW motor has been selected for the duty. This mill will have additional capacity to handle higher concentrate mass pulls, higher hardness concentrate or a greater size reduction.
A summary of the initial test work results showing overall extractions for gold and silver using the flash flotation, gravity and cyanide leach flowsheet is given in Table 27. The results show that overall extractions are generally high for both gold and silver. Test results (summarized in Table 28) also indicated that compared to flotation of the gravity tail, leaching of the gravity tail resulted in an overall higher extraction of 10% for gold and 5% for silver.
The leaching test work indicated typical slower leach kinetics for the silver minerals compared to the gold. The leach decay curves indicate that dissolution of silver continues 48 hours of leaching as indicated in Figure 47, Figure 48 and Figure 49. Several tests indicate that re-adsorption of gold onto solids occurred after 32 hours of leaching when the available free cyanide concentration decreased below 500 ppm. Therefore, stage addition of cyanide to maintain a suitable free cyanide concentration will be necessary. A cyanide concentration of 0.1% has been selected in the design. High residual cyanide levels in the tailings will therefore require a cyanide destruction circuit to minimize possible impacts on the environment from tailings disposal.
A leach pH of 10.5 has been selected to minimize generation of hydrogen cyanide gas.
A summary of the recent test work results showing extractions for gold and silver using a flowsheet comprising flash flotation, gravity separation, conventional flotation and separate cyanide leach circuits for the reground concentrates and flotation tailings streams is given in Table 29. The leach extraction of gold and silver from the flotation tailings was 89% for gold and 85% for silver. The latest results show an overall higher extraction of 1% for gold and 8% for silver compared to the flash flotation, gravity and cyanide leach flowsheet which had been adopted previously. Most tests were conducted without the injection of oxygen. Tests using oxygen sparged for up to 4 hours showed higher initial dissolution rates but extractions over 48 hours were similar. Nevertheless, as the concentrate leach residue will return to the main leaching circuit and to minimize losses when high grade feed is treated, the design includes provision to add oxygen into all leach tanks.
Extorre Gold Mines Limited
Cerro Moro Gold – Silver Project
Preliminary Economic Assessment | Page 149 |
| | | | | | | Calculated Feed | | Flash | | Gravity | | Gold Extraction | | Silver Extraction | | |
| Report | | Sample Description | | Test | | g/t Au | | g/t Ag | | %S | | % Wt | | % Wt | | Flash | | Gravity | | Conc Leach | | Leach | | Total | | Flash | | Gravity | | Conc Leach | | Leach | | Total | | Comment |
| M1668 | | Escondida Central - Fresh | | CMF3,CML1 | | 19.5 | | 565 | | 2.21 | | 2.8 | | 3.4 | | 31.6 | | 56.6 | | 99 | | 11.5 | | 98.8 | | 43.0 | | 30.4 | | 96 | | 18.6 | | 89.0 | | Series 1 |
| | | | | CMF21,CML5 | | 19.5 | | 390 | | 2.25 | | 3.8 | | 1.0 | | 49.6 | | 29.5 | | 99 | | 20.5 | | 98.8 | | 64.7 | | 7.3 | | 96 | | 17.5 | | 86.6 | | Series 2 |
| | | Escondida Central - Oxide | | CMF7,CML2 | | 19.1 | | 692 | | 2.19 | | 3.1 | | 3.5 | | 32.5 | | 44.3 | | 99 | | 22.7 | | 98.7 | | 37.0 | | 27.7 | | 96 | | 25.2 | | 87.3 | | Series 1 |
| | | | | CMF22,CML6 | | 18.9 | | 536 | | 2.10 | | 4.0 | | 0.9 | | 43.2 | | 11.3 | | 99 | | 44.6 | | 98.5 | | 55.1 | | 7.0 | | 96 | | 25.8 | | 85.4 | | Series 2 |
| | | Escondida East | | CMF11,CML3 | | 9.7 | | 132 | | 1.16 | | 2.0 | | 2.9 | | 37.3 | | 47.5 | | 99 | | 14.7 | | 98.6 | | 51.6 | | 8.0 | | 96 | | 31.3 | | 88.5 | | Series 1 |
| | | | | CMF23,CML7 | | 8.08 | | 118 | | 1.07 | | 2.4 | | 0.5 | | 50.9 | | 20.7 | | 99 | | 27.8 | | 98.7 | | 55.1 | | 2.3 | | 96 | | 30.0 | | 85.1 | | Series 2 |
| | | Gabriela | | CMF13,CML4 | | 0.95 | | 134 | | 0.51 | | 1.5 | | 3.1 | | 35.2 | | 8.9 | | 99 | | 53.3 | | 97.0 | | 51.2 | | 7.4 | | 96 | | 34.4 | | 90.6 | | Series 1 |
| | | | | CMF24,CML8 | | 0.85 | | 120 | | 0.53 | | 1.5 | | 0.8 | | 43.7 | | 1.6 | | 99 | | 48.9 | | 93.7 | | 48.8 | | 1.9 | | 96 | | 38.1 | | 86.8 | | Series 2 |
| | | Escondida West | | CMF25,CML9 | | 4.44 | | 146 | | 0.93 | | 2.3 | | 0.9 | | 48.7 | | 4.7 | | 99 | | 44.1 | | 97.0 | | 47.8 | | 3.1 | | 96 | | 41.0 | | 89.8 | | Series 2 |
| | | Esperanza | | CMF26,CML10 | | 1.91 | | 186 | | 1.11 | | 2.1 | | 1.0 | | 42.1 | | 2.0 | | 99 | | 50.6 | | 94.2 | | 41.3 | | 4.2 | | 96 | | 45.1 | | 88.8 | | Series 2 |
| | | Esperanza South East | | CMF27,CML11 | | 3.16 | | 83 | | 0.21 | | 1.2 | | 1.2 | | 61.1 | | 1.5 | | 99 | | 35.5 | | 97.5 | | 49.7 | | 3.6 | | 96 | | 37.1 | | 88.2 | | Series 2 |
| | | Loma Escondida | | CMF28,CML12 | | 9.11 | | 443 | | 1.17 | | 2.6 | | 1.4 | | 44.2 | | 6.4 | | 99 | | 46.0 | | 96.1 | | 57.1 | | 4.0 | | 96 | | 33.6 | | 92.2 | | Series 2 |
| M2026 | | Escondida Far West | | Oxide | | 36.7 | | 2,475 | | | | 1.4 | | 2.0 | | 18.5 | | 29.6 | | 99 | | 48.1 | | 95.7 | | 11.7 | | 22.9 | | 96 | | 34.6 | | 67.8 | | |
| | | | | Low Grade 1 | | 4.44 | | 254 | | 2.12 | | 2.3 | | 2.6 | | 32.9 | | 19.7 | | 99 | | 52.6 | | 104.6 | | 29.3 | | 8.0 | | 96 | | 37.3 | | 73.1 | | |
| | | | | Low Grade 2 | | 3.82 | | 235 | | | | 2.6 | | 2.6 | | 45.6 | | 15.8 | | 99 | | 36.0 | | 96.8 | | 43.5 | | 8.6 | | 96 | | 42.3 | | 92.3 | | Inc ti, xan |
| | | | | High Grade 1 | | 33.6 | | 2,245 | | 4.55 | | 3.7 | | 2.5 | | 17.8 | | 29.6 | | 99 | | 47.4 | | 94.3 | | 16.6 | | 14.9 | | 96 | | 31.5 | | 61.7 | | |
| | | | | High Grade 2 | | 31.6 | | 2,129 | | | | 8.1 | | 2.5 | | 45.7 | | 19.6 | | 99 | | 33.2 | | 97.8 | | 47.9 | | 12.7 | | 96 | | 34.8 | | 93.0 | | Inc ti, xan |
| M2014 | | Escondida Composite | | | | 11.9 | | 405 | | 1.57 | | 1.4 | | 1.9 | | 16.7 | | 47.4 | | 99 | | 34.9 | | 98.3 | | 19.6 | | 32.0 | | 96 | | 38.3 | | 87.8 | | |
| A12671 | | MD292A | | HS22238/85/99 | | 1.46 | | 25 | | 1.8 | | 7.1 | | 2.1 | | 22.7 | | 31.5 | | 99 | | 42.7 | | 96.3 | | 25.9 | | 10.5 | | 96 | | 45.7 | | 80.6 | | |
| | | MD293 | | HS22239/86/300 | | 9.27 | | 443 | | 1.11 | | 3.8 | | 1.7 | | 52.2 | | 15.0 | | 99 | | 32.1 | | 98.6 | | 61.4 | | 4.1 | | 96 | | 22.9 | | 85.7 | | |
| | | MD294 | | HS22240/87/301 | | 75.1 | | 1032 | | 1.86 | | 5.2 | | 2.5 | | 47.7 | | 38.7 | | 99 | | 13.4 | | 98.9 | | 60.7 | | 13.5 | | 96 | | 12.5 | | 83.7 | | |
| | | MD295 | | HS22241/88/302 | | 1.97 | | 158 | | 0.29 | | 2.9 | | 2.2 | | 25.7 | | 11.5 | | 99 | | 59.0 | | 95.8 | | 36.7 | | 10.0 | | 96 | | 42.5 | | 87.3 | | |
| | | MD297 | | HS22242/82/96 | | 2.92 | | 19.4 | | 0.03 | | 8.0 | | 2.2 | | 26.7 | | 23.4 | | 99 | | 48.9 | | 98.5 | | 13.6 | | 15.5 | | 96 | | 61.6 | | 89.5 | | |
| | | MD298 | | HS22243/83/97 | | 8.79 | | 130 | | 0.03 | | 8.5 | | 2.2 | | 22.0 | | 9.9 | | 99 | | 66.6 | | 98.2 | | 20.0 | | 16.9 | | 96 | | 53.4 | | 88.8 | | |
| | | MD299 | | HS22244/84/98 | | 8.24 | | 592 | | 0.84 | | 4.7 | | 2 | | 28.6 | | 21.0 | | 99 | | 47.0 | | 96.1 | | 39.0 | | 6.8 | | 96 | | 41.5 | | 85.5 | | |
| A12791 | | MD293 | | | | 9.11 | | 445 | | 1.09 | | 3.7 | | 2.2 | | 58.4 | | 9.7 | | 99 | | 31.3 | | 98.7 | | 62.5 | | 3.1 | | 96 | | 22.6 | | 85.6 | | |
| | | | | Average | | | | | | | | 3.6 | | 2.0 | | 37.7 | | 21.4 | | 99 | | 39.0 | | 97.6 | | 42.0 | | 11.0 | | 96 | | 34.6 | | 85.4 | | |
Table 27 Test work results showing overall extractions for gold and silver using the flash flotation, gravity and cyanide leach flow sheet
Extorre Gold Mines Limited
Cerro Moro Gold – Silver Project
Preliminary Economic Assessment | Page 150 |
| | | Flash - Gravity - Flotation | | | | | | | | | | | | | | Flash | | Gravity | | Flotn | | Conc Leach | | Total | | Flash | | Gravity | | Flotn | | Conc Leach | | Total | | |
| M1668 | | Escondida Central - Fresh | | CMF17 | | | | | | | | | | | | 31.6 | | 56.6 | | 10.6 | | 99 | | 97.8 | | 43.0 | | 30.4 | | 21.8 | | 96 | | 91.4 | | Series 1 |
| | | Escondida Central - Oxide | | CMF18 | | | | | | | | | | | | 32.5 | | 44.3 | | 19.1 | | 99 | | 94.9 | | 37.0 | | 27.7 | | 28.9 | | 96 | | 89.9 | | Series 1 |
| | | Escondida East | | CMF19 | | | | | | | | | | | | 37.3 | | 47.5 | | 12.7 | | 99 | | 96.5 | | 51.6 | | 8.0 | | 27.4 | | 96 | | 83.5 | | Series 1 |
| | | Gabriela | | CMF20 | | | | | | | | | | | | 35.2 | | 8.9 | | 19.2 | | 99 | | 62.7 | | 51.2 | | 7.4 | | 22.7 | | 96 | | 78.0 | | Series 1 |
| | | Flash - Gravity - Flotation | | Average | | | | | | | | | | | | 34.2 | | 39.3 | | 15.4 | | 99 | | 88.0 | | 45.7 | | 18.4 | | 25.2 | | 96 | | 85.7 | | Series 1 |
| | | Flash - Gravity - Leach | | Average | | | | | | | | | | | | 34.2 | | 39.3 | | | | 99 | | 98.1 | | 45.7 | | 18.4 | | | | 96 | | 88.8 | | Series 1 |
| | | Escondida Central - Fresh | | CMF29 | | | | | | | | | | | | 49.6 | | 29.5 | | 19.8 | | 99 | | 97.9 | | 64.7 | | 7.3 | | 22.5 | | 96 | | 90.7 | | |
| | | Escondida Central - Oxide | | CMF30 | | | | | | | | | | | | 43.2 | | 11.3 | | 41.5 | | 99 | | 95.0 | | 55.1 | | 7.0 | | 32.2 | | 96 | | 90.5 | | |
| | | Escondida East | | CMF31 | | | | | | | | | | | | 50.9 | | 20.7 | | 25.7 | | 99 | | 96.3 | | 55.1 | | 2.3 | | 29.3 | | 96 | | 83.2 | | |
| | | Gabriela | | CMF32 | | | | | | | | | | | | 43.7 | | 1.6 | | 25.9 | | 99 | | 70.5 | | 48.8 | | 1.9 | | 24.8 | | 96 | | 72.5 | | |
| | | Escondida West | | CMF33 | | | | | | | | | | | | 48.7 | | 4.7 | | 25.5 | | 99 | | 78.1 | | 47.8 | | 3.1 | | 30.5 | | 96 | | 78.1 | | |
| | | Esperanza | | CMF34 | | | | | | | | | | | | 42.1 | | 2.0 | | 32.9 | | 99 | | 76.2 | | 41.3 | | 4.2 | | 34.7 | | 96 | | 77.0 | | |
| | | Esperanza South East | | CMF35 | | | | | | | | | | | | 61.1 | | 1.5 | | 19.5 | | 99 | | 81.3 | | 49.7 | | 3.6 | | 23.7 | | 96 | | 73.9 | | |
| | | Loma Escondida | | CMF36 | | | | | | | | | | | | 44.2 | | 6.4 | | 23.4 | | 99 | | 73.3 | | 57.1 | | 4.0 | | 24 | | 96 | | 81.7 | | |
| | | Flash G____ - Flotation | | Average | | | | | | | | | | | | 47.9 | | 9.7 | | 26.8 | | | | 83.6 | | 52.5 | | 4.2 | | 27.7 | | | | 81.0 | | Series 2 |
| | | Flash G_____ - Leach | | Average | | | | | | | | | | | | 47.9 | | 9.7 | | | | | | 96.8 | | 52.5 | | 4.2 | | | | | | 87.9 | | Series 2 |
Table 28 Test work results showing overall extractions for gold and silver using the flash flotation, gravity and flotation flow sheet
| | | | | | | Calculated Feed | | Flash | | Gravity | | Flotn | | Gold Extraction | | Silver Extraction | | |
| Report | | Sample Description | | Test | | g/t Au | | g/t Ag | | % Wt | | % Wt | | % Wt | | Flash/ Gravity | | Flotn | | Conc Leach | | Leach | | Total | | Flash/ Gravity | | Flotn | | Conc Leach | | Leach | | Total | | Comment |
| M2470 | | Zoe Deeps | | Z1,Z1T,Z1FC,Z1FT | | 10.3 | | 644 | | 2.0 | | 2.0 | | 6.9 | | 61.9 | | 93.3 | | 98.9 | | 90.8 | | 98.7 | | 51.0 | | 86.8 | | 96.8 | | 87.1 | | 96.2 | | Series 1B |
| | | Zoe Shallows | | Z2,Z2T,Z2FC,Z2FT | | 16.4 | | 1889 | | 2.1 | | 2.1 | | 9.0 | | 67.3 | | 95.9 | | 95.9 | | 89.2 | | 95.8 | | 54.3 | | 92.8 | | 96.3 | | 82.4 | | 95.8 | | Series 1B |
| M2512 | | Esperanza | | E1,E1C,E1F,E1FC,E1FT | | 1.9 | | 201 | | 2.1 | | 2.0 | | 5.2 | | 45.7 | | 68.7 | | 97.7 | | 85.3 | | 95.5 | | 40.5 | | 77.0 | | 97.6 | | 86.0 | | 96.0 | | Series 1B |
| | | Esperanza South East | | E2,E2C,E2F,E2FC,E2FT | | 2.8 | | 88 | | 2.2 | | 2.1 | | 4.9 | | 52.7 | | 67.7 | | 99.6 | | 89.6 | | 98.1 | | 48.0 | | 73.4 | | 99.2 | | 79.2 | | 96.4 | | Series 1B |
| | | Loma Escondida | | E3,E3C,E3F,E3FC,E3FT | | 8.9 | | 505 | | 2.1 | | 2.0 | | 5.2 | | 51.5 | | 67.4 | | 99.2 | | 87.9 | | 97.4 | | 57.1 | | 78.9 | | 98.9 | | 84.0 | | 97.5 | | Series 1B |
| | | Gabriela | | E4,E4C,E4F,E4FC,E4FT | | 1.0 | | 133 | | 2.0 | | 2.1 | | 5.2 | | 60.4 | | 62.4 | | 98.5 | | 89.6 | | 97.2 | | 54.7 | | 73.0 | | 98.6 | | 82.9 | | 96.7 | | Series 1B |
| | | Escondida Fresh | | E5,E5C,E5F,E5FC,E5FT | | 14.9 | | 538 | | 2.8 | | 1.3 | | 9.5 | | 77.8 | | 96.1 | | 99.3 | | 83.2 | | 99.2 | | 64.3 | | 88.2 | | 92.1 | | 87.9 | | 91.9 | | Series 1B |
| | | Escondida Oxide | | E6,E6C,E6F,E6FC,E6FT | | 18.5 | | 683 | | 1.9 | | 2.2 | | 9.2 | | 56.4 | | 95.2 | | 99.5 | | 90.7 | | 99.3 | | 28.0 | | 92.8 | | 96.9 | | 87.1 | | 96.4 | | Series 1B |
| | | Escondida East | | E7,E7C,E7F,E7FC,E7FT | | 6.9 | | 125 | | 1.9 | | 2.2 | | 5.7 | | 79.5 | | 95.8 | | 98.9 | | 91.6 | | 98.9 | | 48.5 | | 82.5 | | 95.7 | | 84.6 | | 94.7 | | Series 1B |
| | | Escondida West | | E8,E8C,E8F,E8FC,E8FT | | 4.4 | | 174 | | 2.0 | | 2.1 | | 4.9 | | 49.8 | | 73.2 | | 99.2 | | 91.8 | | 98.2 | | 49.3 | | 77.4 | | 98.6 | | 86.6 | | 97.2 | | Series 1B |
| | | | | Average | | | | | | 2.1 | | 2.0 | | 6.6 | | 60.3 | | 81.6 | | 98.7 | | 89.0 | | 97.8 | | 49.6 | | 82.3 | | 97.1 | | 84.8 | | 95.9 | | |
Table 29 Test work results showing overall extractions for gold and silver using the flash flotation, gravity, flotation and cyanide leach flow sheet
Extorre Gold Mines Limited
Cerro Moro Gold – Silver Project
Preliminary Economic Assessment | Page 151 |
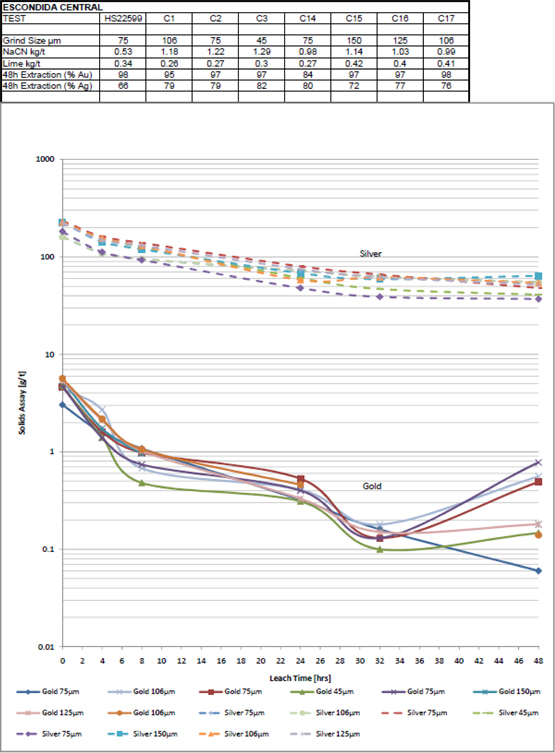
Figure 47 Effect of Primary Grind Size on Flotation-Gravity Tail Leach – Escondida Central
Extorre Gold Mines Limited
Cerro Moro Gold – Silver Project
Preliminary Economic Assessment | Page 152 |

Figure 48 Effect of Primary Grind Size on Gravity Tail Leach – Escondida Central
Extorre Gold Mines Limited
Cerro Moro Gold – Silver Project
Preliminary Economic Assessment | Page 153 |
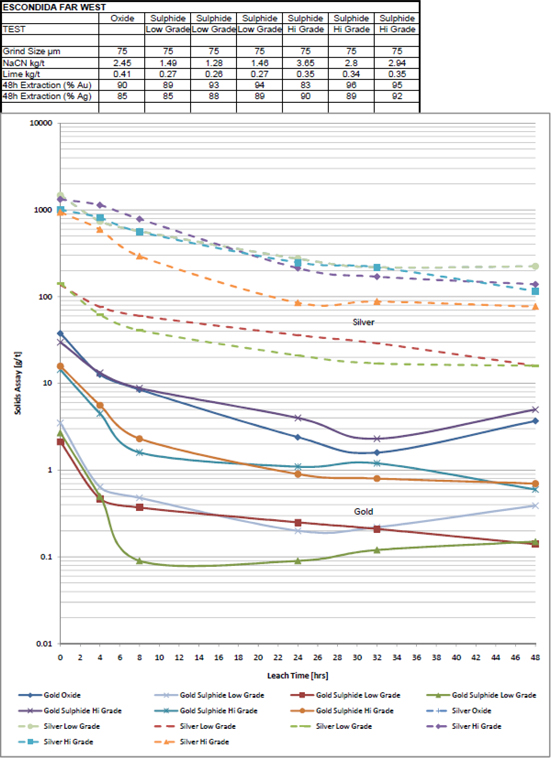
Figure 49 Effect of Primary Grind Size on Flotation - Gravity Tail Leach – Escondida Far West
Extorre Gold Mines Limited
Cerro Moro Gold – Silver Project
Preliminary Economic Assessment | Page 154 |
Due to the inclusion of flash flotation and gravity machines in the grinding circuit and the consequential high water additions required for their effective operation, the cyclone overflow and rougher flotation tailings densities will be low (<35% solids). A leach feed thickener has been included in the design to enable the density for the leach circuit to be increased – this reduces the size of the leach circuit, and will recover non-cyanide contaminated water for use in the grinding, flotation and gravity circuits.
The leach feed density will be approximately 40% solids to minimize any viscosity issues in the leach circuit. The leaching circuit has been designed to provide a minimum residence time of 48 hours. Five stages of leaching have been selected to minimize short circuiting, and to provide flexibility to maximise control of the leaching conditions.
Figure 47 shows the leach curves for different primary grind sizes – 45 µm to 150 µm. The 75 µm grind for test HS22599 gave a higher extraction but was from a different sample. The differences are within the variation shown by other tests and no clear trend is apparent although the 45 µm grind resulted in the highest extractions for both gold and silver. Leach kinetics were similar for silver. The initial 4 hour leach kinetics for gold was faster as the grind size decreased. The results indicate little difference between the 75 µm and 45 µm grind sizes in overall extraction, therefore a 75 µm grind size was selected.
Based on the rheological issues discussed in Part 13.1.13 for thickening and filtering, there is scope to coarsen the grind with minimal impact on overall extractions.
The high silver content of the leach solution has dictated the selection of cementation of the precious metals onto zinc powder rather than adsorption onto carbon.
The Merrill Crowe circuit has been designed on the basis of information from existing operations and laboratory test work as reported in AMMTEC Report no A12791(August 2010). The critical design parameters and values used in the design are listed in Table 30. After the zinc addition the oxygen levels were less than 1 ppm. In the test work a zinc dose rate of 80 times stoichiometric was selected although preliminary tests showed 40 times stoichiometric gave recoveries from solution of >99% for both gold and silver. It is considered that the 80 times stoichiometric dose is excessive and based on operating data from other operations a dosage rate of 15 times stoichiometric is more realistic. This figure (15 times stoichiometric) has been used in the design criteria and to determine operating costs.
Addition of lead nitrate was found not to affect recovery once sufficient zinc was added and the solution was de-aerated.
Extorre Gold Mines Limited
Cerro Moro Gold – Silver Project
Preliminary Economic Assessment | Page 155 |
Minor elements such as copper, antimony and arsenic can potentially have a detrimental impact on the zinc precipitation. The test work showed gold and silver could be effectively precipitated despite these elements being present at low concentrations in the pregnant leach solution.The design envisions recycling the barren solution from the Merrill Crowe circuit to the back of the counter current decantation (CCD) circuit as wash water and also using this solution to provide the flocculant dilution water for the CCD thickeners. Excess barren solution will be diverted to the cyanide destruction circuit to ensure cyanide is not recycled to the process water circuit.
| Design Parameter | | Value | | Source |
| Zinc Dose | | 15 times stoichiometric | | Operating Data |
| Lead Nitrate | | No addition required | | Test Work |
| Gold Precipitation | | 99% (solutions were 1.68 ppm gold) | | Test Work |
| Silver Precipitation | | 99% (solutions were 59 ppm silver) | | Test Work |
Table 30 Critical Design Data for Merrill Crowe Circuit
| 13.13 | Thickening and Filtration |
Separation of the leach solution and the leach tailing solids is required to provide the pregnant solution for the Merrill Crowe circuit and to determine options for disposal of tailings (dry stacked or wet conventional). The relatively small proportion of illite and kaolinite clays in the mineralized zones has adversely impacted on the rheological characteristics of the slurry. Metcon reported that at a shear rate of 2.5 sˉ¹ the viscosity of the leach slurry exceeded 1 Pas at densities >48% solids when lime was used to achieve a pH of 10.5. The fine nature, sheet-like grain geometry and electrical charge of the illite (micaceous) clay has resulted in low settling rates, low ultimate settled densities and low filtration rates. The particle size distribution for the tailings is shown in Figure 50 with more than 30% in the minus 10 µm size fraction. Consequently, the rheology of the leach slurry is a major aspect for option, design and equipment selection to recover the pregnant solution for the Merrill Crowe.
Options include:
| § | Filtration and cake washing; and |
| § | Combination of thickening and filtration with cake washing. |
Extorre Gold Mines Limited
Cerro Moro Gold – Silver Project
Preliminary Economic Assessment | Page 156 |
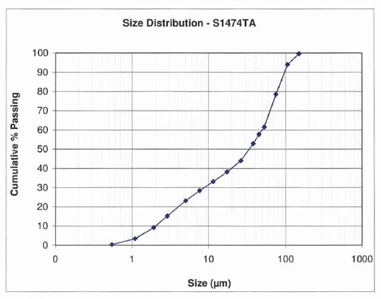
Figure 50 Leach Tailing Particle Size Distribution
Initial settling tests by Metcon and BASF investigated combinations of coagulants and flocculants to optimize thickening parameters. Outotec conducted their standard dynamic thickening test work. Samples of the thickener tailing were then despatched to Delkor and GBL for filtration test work. Table 31 and Table 32 summarize the results of the test work.
| Design Parameter | | Metcon | | | Outotec | | | Outotec | | | Outotec | |
| Coagulant Dose g/t | | | 1500 (lime) | | | | 250 (Magnafloc 368) | | | | 250 | | | | 300 | |
| Flocculant Dose g/t Magnafloc 5250 | | | 70 | | | | 20 | | | | 20 | | | | 25 | |
| Underflow/Settled Density % solids | | | 39 – 43 | | | | 43 | | | | 46 | | | | 45 | |
| Specific Settling Rate t/m²h | | | 0.11 – 0.16 | | | | 0.43 | | | | 0.30 | | | | 0.21 | |
| Overflow Clarity ppm solids | | | NA | | | | 390 | | | | 270 | | | | 510 | |
Table 31 Summary of Initial Thickening Test Work
The coagulant and flocculant dosage requirements will increase the operating costs. The specific settling rates are up to 10 times lower than typical tailings settling rates.
| Design Parameter | | Delkor | | GBL |
| Coagulant/Flocculant Dose g/t | | | | Residual |
| Feed Density % solids | | 46.6 | | 35 |
| Cake Moisture % | | 16 – 29 | | 20 – 27 |
| Specific Filtration Rate kg/m²h | | 17.5 – 30 | | 86 – 166 |
Table 32 Summary of Initial Filtration Test Work
Extorre Gold Mines Limited
Cerro Moro Gold – Silver Project
Preliminary Economic Assessment | Page 157 |
The filter cake, although having a high moisture content (27%), was compact and soft with a consistency of potter’s clay. Nevertheless, the cake tended to be friable when rubbed. The filtration rates were up to 10 times lower than typical for tailings. Typical plasticine-like filtration cakes from test work are shown in Figure 51.
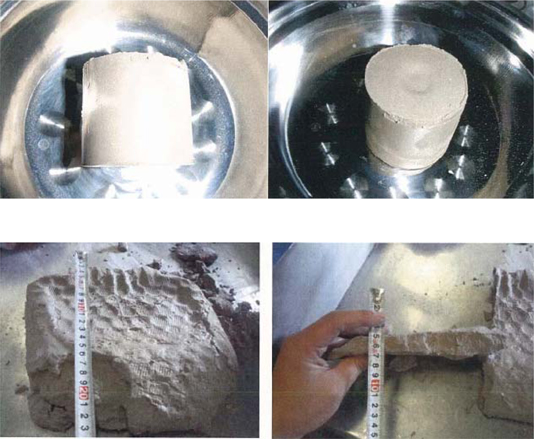
Figure 51 Filter cakes from tests showing plasticine nature.
Further thickening and filtration tests were undertaken to optimize the separation conditions. Thickening test work was conducted by using a higher feed pH (Outotec Report S1474TB) than the 10.3 pH used previously by Outotec – cylinder settling tests indicated that lime addition with a pH >11 resulted in clear supernatant. Using lime to adjust the feed pH above 10.67, an improvement in settling performance was achieved. An underflow density of 56% solids at a specific settling rate of 1.00 t/m2/h was achieved with a flocculant dosage of 20 g/t of Magnafloc 5250. The overflow clarity was less than 100 mg/L. The yield stress of the underflow was 93 Pa and the slurry exhibited shear thinning behaviour. This work is reported in Outotec Report S1474TB (February 2011). It is considered that the improvement in performance was due to the surface charge modification properties of the lime as this test work used the same composite as the previous test work. Therefore the thickener design has been based on this latest test work. A specific settling rate of 1.00 t/m2/h has been used for the leach feed, CCD and tailings duties.
Extorre Gold Mines Limited
Cerro Moro Gold – Silver Project
Preliminary Economic Assessment | Page 158 |
The CCD circuit modelling conducted by Outotec indicates that 99% recovery of both gold and silver is achievable based on a 5-stage circuit with a thickener underflow density of 50% solids. This recovery calculation ignores any gold or silver that may leach into solution in the CCD circuit. The recovery of gold and silver would increase further if the calculation model included additional gold or silver values that were further leached in the CCD circuit and recovered in solution. Vane feedwell technology may further enhance wash water and slurry mixing as it promotes velocity in the feedwell.
The CCD duty will allow for process and mineralized zone type variations to ensure a high clarity in the pregnant solution directed to the Merrill Crowe circuit.
The design has incorporated lime addition to the leach feed and tailings thickeners to provide the high pH in the thickener feed (the CCD thickener is already at an elevated pH courtesy of the leaching circuit). If the leach feed and tailings thickener overflows are untreated this will result in an elevated pH in the process water circuit which may adversely affect the flotation of sulphides in the grinding circuit. The design provides for the addition of sulphuric acid to the settling pond to ensure the pH of the process water remains approximately neutral.
Vendor filtration test work was also conducted by Ishigaki Oceania. The test work demonstrated that a specific filtration rate of 100 kg/m2/h with a filter cake moisture content of 18% to 21% can be achieved with a filter feed density of 37% to 43% solids in a vertical chamber filter press with a cake squeeze of 15 to 20 bar and no air blow of the filter cake. The filter cake was very compressible as evidenced by the effectiveness of the filter cake squeeze. While there was no overall improvement in filtration performance over the previous test work the ability to achieve acceptable cake moistures without an air blow of the filter cake would prolong filter cloth life in a full scale operation.
The plastic nature of the cake indicated that to effectively wash the cake in order to recover the residual pregnant liquor (which based on a cake moisture content of 21% represents approximately 16% of the pregnant solution in the leach tailing), the cake would need to be repulped with barren solution from the Merrill Crowe circuit and refiltered to effect a wash. Several filter washing stages would be required to provide an acceptable recovery of the gold and silver in solution. It was therefore considered that filtration did not offer any process advantage and would incur higher capital costs than an equivalent CCD circuit.
The flow point and transportable moisture limit of the tailings filter cake were 18.2% and 16.4% respectively. It is considered likely that the tailings would liquefy in transport and therefore that co-disposal of the tailings using truck transport will require leak proof containers and would present difficulties in unloading the contents. The tailings disposal design has therefore been based on thickening and pumping to either a conventional paddock or integrated landform tailings storage facility.
Extorre Gold Mines Limited
Cerro Moro Gold – Silver Project
Preliminary Economic Assessment | Page 159 |
The leach tailings were tested for cyanide destruction using the Inco process. This work is reported in ALS AMMTEC Report no A13274 (February 2011). The critical parameters and the values used in the test work are summarized in Table 33. The design has been based on a sulphur dioxide dose of 6.0 g SO2 per g of WAD cyanide, a lime dose of 1.0 g of lime per g of SO2 and a copper concentration of 150 ppm. WAD cyanide levels of approximately 7 ppm were achieved without the addition of copper sulphate and of less than 0.5 ppm with copper sulphate present.
The tests were conducted for up to 106 minutes of retention time. A total time of 120 minutes has been selected for design. Due to the local and environmental conditions, the cyanide detoxification circuit has been designed for 100% redundancy – two cyanide destruction tanks will be installed, each having 120 minutes of residence time.
| Design Parameter | | Unit | | Value |
| Initial WAD Cyanide Concentration | | ppm | | 306 |
| Sulphur Dioxide Dose | | g SO2 / g WAD Cyanide | | 5 - 7 |
| Lime Dose | | g Lime / g SO2 | | 0.7 – 1.3 |
| Copper Concentration | | ppm | | 30 – 150 |
| Residual WAD Cyanide Concentration | | ppm | | 0.2 - 8 |
Table 33 Summary of Cyanide Destruction Test Work
Low range residual WAD cyanide levels were targeted to minimize any effect on the flotation process. Thiocyanate, produced as a by-product of the leaching process, is also considered to have the potential to reduce flotation performance and subsequent recovery of gold and silver if allowed to accumulate in the process water system. Typically, less than 10% of the thiocyanate is oxidised by the Inco process.
The Caro’s acid cyanide destruction process was also considered to oxidise free cyanide as well as WAD cyanides, thiocyanate and other cyanide complexes. However, this process was rejected on the basis of increased operating costs pending further test work to establish the likely impact of thiocyanate on flotation performance in practice.
| 13.15 | Metallurgical Recoveries |
The metallurgical recoveries selected for financial evaluation of the Escondida mineralized zone are 95% for gold and 93% for silver. This has been calculated from the leach extraction data for individual zones and proposed mining schedule on a weighted average basis. Where individual zones have not been subjected to metallurgical test work the leach extraction rates from a similar mineralization source were used as nominated by the client. It assumes a CCD wash efficiency of 99% and Merrill Crowe precipitation efficiency of 99%.
Extorre Gold Mines Limited
Cerro Moro Gold – Silver Project
Preliminary Economic Assessment | Page 160 |
| 14. | Mineral Resource Estimate |
This technical report includes mineral resources that are not mineral reserves and therefore do not have demonstrated economic viability.
During September and October 2011, Cube was requested by Extorre to undertake an updated mineral resource estimate for Cerro Moro. This mineral resource estimate of the Project was the third undertaken by Cube and the results were announced on November 3, 2011. The November, 2011 mineral resource is based on drilling completed to the end of August, 2011 and utilizes assay results received up to and including October 10, 2011.
The mineral resource estimates were prepared by Ted Coupland, MAusIMM (CP), Director and Principal Geostatistician of Cube. The mineral resource estimates have been classified and reported in accordance with the CIM guidelines (CIM 2011) and NI 43-101. Ted Coupland is ‘independent’ and a ‘qualified person’ as defined by NI 43-101.
The November 2011 mineral resource estimate includes the prospects Escondida, Loma Escondida, Zoe, Martina, Gabriela, Nini-Esperanza, Carla and Deborah.
Drilling since the April 2011 resource estimate has been largely aimed at infill drilling to increase resource confidence from the Inferred to Indicated mineral resources category at existing prospects and resource definitional drilling at more recent discoveries such as the high grade Zoe Martina and Carla prospects.
All drilling data available as of October 10, 2011 was used for the resource estimation. Additional drilling data received subsequent to this date including geological logging and core photography was used to validate the geological interpretations where possible.
A summary of drilling data as of October 10, 2011 for each prospect is as follows:
| Escondida (incl. Martina) | 631 drill holes for 94,115m (Extorre 94,010m, Mincorp 105m) |
| Zoe (Incl. Zoe East) | 151 drill holes for 37,562m (Extorre 37,562m) |
| Loma Escondida | 69 drill holes for 4,563m (Extorre 4,439m, Mincorp 124m) |
| Carla | 41 drill holes for 3,808m (Extorre 3,808m) |
| Gabriela | 155 drill holes for 23,741m (Extorre 23,741m) |
| Nini | 25 drill holes for 2,094m (Extorre 1,946m, Mincorp 148m) |
All resource estimates were based predominantly on Extorre diamond drilling and a small number of selected reverse circulation drill holes and surface trench sampling.
Extorre Gold Mines Limited
Cerro Moro Gold – Silver Project
Preliminary Economic Assessment | Page 161 |
Extorre and Cube worked collaboratively on producing a set of 3D geological wireframe models defining the key mineralized components of each prospect. In most cases, a clear distinction between a main epithermal quartz vein structure and surrounding stockwork mineralization could be determined based on detailed geological logging and core photography. The resulting 3D mineralization model reflects an in-situ geological model whereby no cut-off grade or minimum mining width criteria has been applied.
The epithermal vein structures at Cerro Moro are relatively narrow sub-vertical structures with horizontal widths typically ranging between 0.1 m and 5 m (Averages: Escondida 1.4 m, Loma Escondida 0.7 m, Martina 1.0 m, Zoe 1.8 m, Carla 1.5 m, Gabriela 1.7 m, Nini-Esperanza 1.8 m and Deborah 4.6 m).
Exploratory data analysis was undertaken on raw samples, geological composites and accumulation variables to determine appropriate capping of grade outliers. Variography was used to characterise the spatial continuity of the horizontal width and accumulation variables within the plane of the vein structure and to determine appropriate estimation inputs to the interpolation process.
Block grade estimates of gold and silver for all vein structures were achieved using 2D Ordinary Kriging (“OK”) of the accumulation and horizontal width variables into 10 m x 10 m parent blocks. An estimation of this type is based on the interpolation of two variables, the accumulation a(x) and the thickness t(x). Final block grade is calculated by dividing the estimated accumulation by the estimated thickness. Many of the Cerro Moro vein structures (Escondida, Loma Escondida, Martina, Zoe, Carla and Nini-Esperanza) are characterised by distinct shoot-like high grade zones within the plane of the main epithermal vein structure effectively creating two mineralization styles:
| · | Main Zone (“MZ”) – continuous material characterised by classic epithermal vein textures including crustiform/colloform chalky white quartz-adularia sulphide banded and brecciated veining typically grading 0.5 to 8 g/t gold; |
| · | High Grade Zone (“HGZ”) – semi-continuous identifiable zones within the MZ. Characterised by brecciated quartz-adularia sulphide banded vein ‘ginguro’ material typically grading 8 to 200 g/t gold. Associated with this high grade zone are gold grades averaging around ten times higher than the surrounding MZ. |
The high grade zones appear to have sharp boundaries requiring separate domaining to avoid the over-smoothing properties of OK. Cube adopted an Indicator Simulation (Sequential Indicator Simulation) approach to objectively define HGZ and MZ domains for Escondida, Loma Escondida, Martina, Zoe, Carla and Nini-Esperanza. Exploratory data analysis showed that the grade tenor of the HGZ domains is somewhat prospect dependent with gold grade indicators of 8-15 g/t gold typically resulting in excellent definition of the HGZ shoots. The MZ domain for these prospects was further split into a low grade and moderate grade domain using gold grade indicators of 1-2 g/t gold. No HGZ-MZ domaining was required for the Gabriela and Deborah prospects.
Extorre Gold Mines Limited
Cerro Moro Gold – Silver Project
Preliminary Economic Assessment | Page 162 |
All 2D models were subsequently re-located into 3D block models. Stockwork domains were estimated for Escondida and Gabriela. The stockwork mineralization surrounding the main epithermal vein zones was estimated using traditional 3D OK of 1 m downhole composites.
All estimates were visually and statistically validated and compared to a variety of alternative estimation methods resulting in acceptable comparisons.
Densities have been directly assigned to each model based on geological characteristics on a prospect by prospect basis. Significant density testwork has been carried out for the various rock types and prospects. Density values for the Cerro Moro epithermal vein structures typically vary between 2.51 and 2.65 g/cm3.
Cube has classified a substantial proportion of the Cerro Moro mineral resources as “Indicated” where drill spacing is sufficient to demonstrate acceptable confidence in the geometry, continuity and grade of the mineralized zones. Surrounding areas have been classified as Inferred where drill spacing is wider or where unresolved geological complexity exists. Cube believes that Inferred resources at Cerro Moro have an appropriate level of drilling information to support classification into the Inferred category.
A summary of the Cerro Moro Indicated and Inferred mineral resources above a cut-off of 1 ppm gold equivalent are shown in 0 and Table 35 respectively.
Extorre Gold Mines Limited
Cerro Moro Gold – Silver Project
Preliminary Economic Assessment | Page 163 |
| Zone | | Tonnes | | | Gold (ppm) | | | Silver (ppm) | | | Gold Equivalent
Grade* (ppm) | | | Gold
(ounces) | | | Silver (ounces) | | | Gold Equivalent
Ounces** | |
| Escondida | | | 620,000 | | | | 18.8 | | | | 829.2 | | | | 35.4 | | | | 374,000 | | | | 16,530,000 | | | | 705,000 | |
| Loma Esc | | | 44,000 | | | | 18.4 | | | | 919.5 | | | | 36.8 | | | | 26,000 | | | | 1,297,000 | | | | 52,000 | |
| Gabriela | | | 1,642,000 | | | | 1.5 | | | | 226.1 | | | | 6.0 | | | | 79,000 | | | | 11,936,000 | | | | 318,000 | |
| Zoe | | | 105,000 | | | | 27.2 | | | | 2,614.5 | | | | 79.5 | | | | 91,000 | | | | 8,798,000 | | | | 267,000 | |
| Carla | | | 15,000 | | | | 16.0 | | | | 701.2 | | | | 30.0 | | | | 7,000 | | | | 327,000 | | | | 14,000 | |
| Total | | | 2,425,000 | | | | 7.4 | | | | 498.8 | | | | 17.4 | | | | 578,000 | | | | 38,888,000 | | | | 1,356,000 | |
Table 34 Cerro Moro Indicated Mineral Resources above 1 ppm Gold Equivalent
| Zone | | Tonnes | | | Gold (ppm) | | | Silver (ppm) | | | Gold Equivalent
Grade* (ppm) | | | Gold
(ounces) | | | Silver (ounces) | | | Gold Equivalent
Ounces** | |
| Escondida | | | 508,000 | | | | 4.3 | | | | 164.8 | | | | 7.6 | | | | 70,000 | | | | 2,689,000 | | | | 123,000 | |
| Loma Esc | | | 13,000 | | | | 9.7 | | | | 595.4 | | | | 21.6 | | | | 4,000 | | | | 256,000 | | | | 9,000 | |
| Zoe | | | 1,248,000 | | | | 4.1 | | | | 280.3 | | | | 9.8 | | | | 167,000 | | | | 11,250,000 | | | | 391,000 | |
| Martina | | | 293,000 | | | | 13.0 | | | | 60.3 | | | | 14.2 | | | | 123,000 | | | | 568,000 | | | | 134,000 | |
| Carla | | | 2,000 | | | | 9.5 | | | | 390.4 | | | | 17.3 | | | | 1,000 | | | | 29,000 | | | | 1,000 | |
| Gabriela | | | 331,000 | | | | 1.3 | | | | 219.7 | | | | 5.7 | | | | 14,000 | | | | 2,336,000 | | | | 61,000 | |
| Esperanza-Nini | | | 1,773,000 | | | | 1.8 | | | | 144.3 | | | | 4.7 | | | | 105,000 | | | | 8,226,000 | | | | 270,000 | |
| Deborah | | | 578,000 | | | | 2.4 | | | | 48.1 | | | | 3.4 | | | | 45,000 | | | | 894,000 | | | | 62,000 | |
| Total | | | 4,747,000 | | | | 3.5 | | | | 172.0 | | | | 6.9 | | | | 528,0000 | | | | 26,249,000 | | | | 1,053,000 | |
Table 35 Cerro Moro Inferred Mineral Resources above 1 ppm Gold Equivalent
* Gold equivalent values have been calculated by Extorre on the basis of the following parameters:
| · | Long term gold price US$1,320/oz; |
| · | Long term silver price US$26/oz; |
| · | Metallurgical recovery gold 100%; |
| · | Metallurgical recovery silver 100%. |
The gold equivalent value is calculated by dividing the silver grade (ppm) by 50 (approximate ratio of gold/silver US$ value) and adding it to the gold grade (ppm).
**The gold equivalent ounces are calculated by dividing the total silver ounces by 50 and adding this value to the total gold ounces.
The grid system used at Cerro Moro is Zone 2 of the Argentinean Gauss-Krüger (GK) projection which is based on the Campo Inchauspe datum. All block models have been provided in Gauss-Krüger coordinates.
Extorre Gold Mines Limited
Cerro Moro Gold – Silver Project
Preliminary Economic Assessment | Page 164 |
Extorre provided Cube with a complete MS Access drilling database for the Project area (CM_GeoData.mdb) on October 10th 2011. This database was suitable for direct connectivity to Surpac mining software and was subsequently renamed by cube to CM_GeoData_10102011.mdb. The database contains all relevant tables including collars, surveys, assays, stratigraphy, oxidation and veining.
A preferred gold and silver value was created based on a hierarchical system of analysis techniques. Gold values below 10 ppm are based on a 50 gm fire assay whereas gold values reporting greater than 10 ppm are re-assayed by fire assay with a gravimetric finish. Occasional screen fire assays are performed when visible gold is observed. Screen fire assays are used in preference to other assays when available. Similarly, silver values below 1000 ppm are based on a four acid digest and AAS finish whereas silver values reporting greater than 1000 ppm are re-assayed by fire assay with a gravimetric finish.
All gold grades greater than 1 ppm are routinely re-assayed. Cube compared all original and repeated gold assay values and notes that there is excellent correspondence between the two values with no apparent biases. The averaging of the two values results in little, if any, reduction in sample variability, confirming that the averaged value can be confidently used for resource estimation. Table 36 shows the numerical equivalent values assigned to below detection character values stored in the assay fields.
| Au | | AgPlot_ppm | | Ag | | AgPlot_ppm |
| -0.01 | | 0.005 | | -1 | | 0.5 |
| -0.005 | | 0 0025 | | -0.5 | | 0.5 |
Table 36 Database - Numerical Equivalent Values for Below Detection Values
The Escondida mineral resource estimate was primarily based on Extorre diamond drilling and small number of selected reverse circulation drill holes. Trenching was used to aid geological interpretation but trench grades have not been used in the estimation. The Escondida dataset comprises 622 drill holes for 90,796.50m (Extorre 90,691.50m, Mincorp 105m).
The Loma Escondida mineral resource estimate was based on Extorre diamond holes and trenches. Trench sampling at Loma Escondida is considered to be of high quality and trench grades have been incorporated in the estimation. The total Loma Escondida dataset comprises 57 diamond drill holes (57 Extorre 3588.55m), 8 RC drill holes (6 Extorre 432m and 2 Mincorp 124m) and 42 Extorre trenches. No RC holes intersected the Loma Escondida mineralized structure.
Extorre Gold Mines Limited
Cerro Moro Gold – Silver Project
Preliminary Economic Assessment | Page 165 |
The Zoe mineral resource estimate was based on Extorre diamond holes and trenches. Trench sampling at Zoe is considered to be of high quality and trench grades have been incorporated in the estimation. The total Zoe dataset (including Zoe East) comprises 151 diamond drill holes (151 Extorre 37,562.3m) and 4 Extorre trenches.
The Martina mineral resource estimate was based on Extorre diamond and RC holes. The total Martina dataset comprises 46 diamond drill holes (46 Extorre 14,252.85m) and 10 RC drill holes (Extorre 994m)
The Carla mineral resource estimate was based on Extorre diamond and RC holes. The total Carla dataset comprises 35 diamond drill holes (46 Extorre 3,274.8m) and 6 RC drill holes (Extorre 533m)
The Gabriela mineral resource estimate was based on a mixture of Extorre diamond drilling and reverse circulation drill holes. The total Gabriela dataset comprises 141 diamond drill holes (Extorre 22,502.15m), 14 RC drill holes (Extorre 1,239m) and 6 trenches (Extorre Dec 2010).
The Nini-Esperanza mineral resource estimate was primarily based on Extorre diamond and RC holes. The total Nini-Esperanza dataset comprises 79 diamond drill holes (63 Extorre 8,545.25m, 6 Mincorp 336.25m) and 37 RC holes (37 Extorre 2,895m). The approximate proportion of drilling between the Nini and Esperanza prospects is as follows:
| Nini | 25 drill holes for 2,094m (Extorre 1,946m, Mincorp 147.9m) |
| | |
| Esperanza | 81 drill holes for 9,682m (Extorre 9,494m, Mincorp 188.35m) |
| | |
The Deborah mineral resource estimate was based on a mixture of Extorre diamond drilling and reverse circulation drill holes. A small number of Mincorp diamond holes were used within Inferred areas of the resource estimate. Trenching was used to aid geological interpretation but trench grades have not been used in the estimation. The total Deborah dataset comprises 6 diamond drill holes (4 Extorre 189.45m, 2 Mincorp 102.15m) and 15 RC holes (15 Extorre 737m).
Extorre Gold Mines Limited
Cerro Moro Gold – Silver Project
Preliminary Economic Assessment | Page 166 |
| 14.4.2 | Domaining and Volume Modelling |
Typically, the main economic mineralized zones within the Escondida prospect area consist of a series of steeply dipping E-W to ESE vertically extensive narrow (0.1-4 m) epithermal quartz vein structures. Economic gold and silver mineralization primarily occurs in multi-phase banded quartz-adularia and quartz-chlorite-sulphide veins, hydrothermal breccias and peripheral stockworks. The domain outlines used to control volume and estimations have been predominantly based on geological attributes and observations from drill core, particularly epithermal vein textures rather than grade criteria. In most cases, a clear distinction between a main epithermal quartz vein structure and surrounding stockwork mineralization can be determined based on detailed geological logging and core photography (Figure 52). In addition, a number of surface trenches and sub-outcrop (Figure 53) have been used to guide the interpretation. Surrounding stockwork zones are characterised by stockwork veining of varying intensity with minor breccia zones.
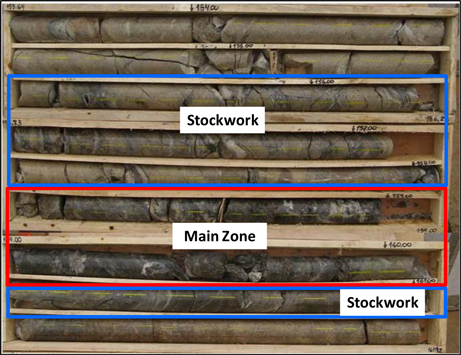
Figure 52 Escondida Drillhole MD633 Showing Styles of Mineralization
Extorre Gold Mines Limited
Cerro Moro Gold – Silver Project
Preliminary Economic Assessment | Page 167 |
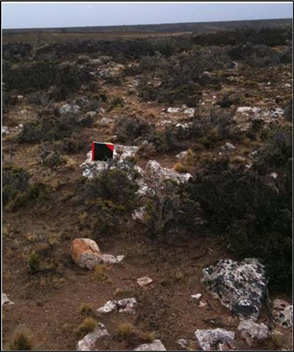
Figure 53 Escondida Central – Quartz Float and Sub-Outcrop
Many of the Cerro Moro main epithermal vein structures (with the possible exception of Gabriela and Deborah) are characterised by distinct shoot like high grade zones occurring wholly within the plane of the main epithermal vein structure, effectively creating two mineralzation styles:
| § | Main Zone (MZ) – continuous material characterised by classic epithermal vein textures including crustiform/colloform chalky white quartz-adularia sulphide banded and brecciated veining - typically grading 0.5 to 10 ppm Au; |
| § | High Grade Zone (HGZ) – semi-continuous identifiable zones within the Main Zone. Characterised by brecciated quartz-adularia sulphide banded vein ‘ginguro’ material and often associated with base metal sulphides and black silica - typically grading 10 to 200 ppm Au. |
The MZ vein structures can be manually (deterministically) interpreted and modelled in 3D with a high degree of confidence directly from drill hole data. By contrast, the HGZ shoots within the MZ often exhibit somewhat more complex architecture making it problematic to accurately generate 3D models from a deterministic interpretation approach. It is however, necessary to separate the MZ and HGZ mineralization events during estimation due to the distinct geological and statistical differences between these domains.
Extorre Gold Mines Limited
Cerro Moro Gold – Silver Project
Preliminary Economic Assessment | Page 168 |
The domaining and volume modelling approach is threefold:
Main Zone (MZ): Cross-sectional interpretations of the MZ vein structure using geological logging and core photography. The resulting MZ mineralization interpretation was graphically digitised and a 3D wireframe model produced. The interpretation of the MZ is based on geological attributes such as epithermal vein textures ensuring that the final 3D mineralization model reflects an in-situ geological model whereby no cut-off grade or minimum mining width criteria has been applied..
High Grade Zone (HGZ): The HGZ domains are ‘shoot-like’ zones wholly contained within the MZ. The HGZ shoots exhibit a somewhat more complex architecture than the encompassing MZ zones and require separate treatment for grade estimation to avoid potential over-smoothing of the high grades.
While the HGZ zones appear to exhibit sharp grade boundaries, the continuity and geometry of these zones is quite variable making it difficult to apply separate deterministic domaining. Cube adopted an Indicator Simulation (Sequential Indicator Simulation - SIS) approach to objectively define the HGZ and MZ domains. Exploratory data analysis of the various prospects showed that a gold grade indicator of between 8 and 16 ppm Au resulted in excellent definition of the HGZ shoots effectively creating a grade based separation of HGZ and surrounding MZ. The MZ domains were further split into a low grade and moderate grade domain using a gold grade indicator of 1-2 ppm Au. As an example, Figure 54 and Figure 55 show a statistical and spatial representation of the indicator thresholds applied for the Indicator Simulation for the Escondida prospect.
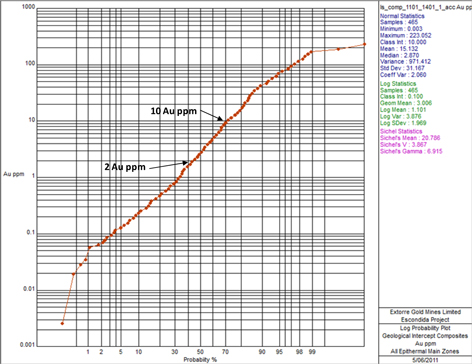
Figure 54 Escondida Main Zones - Gold Indicator Thresholds – Log-Probability Plot
Extorre Gold Mines Limited
Cerro Moro Gold – Silver Project
Preliminary Economic Assessment | Page 169 |
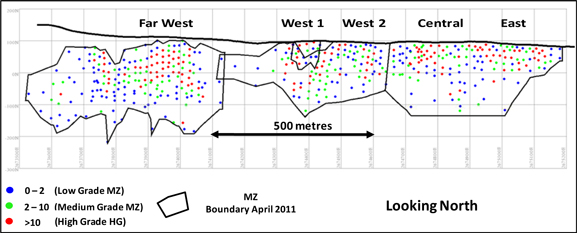
Figure 55 Escondida Main Zones – Geological Composites – Au ppm – Indicators - Long Section
Figure 55 clearly shows that the spatial distribution of HGZ is not evenly distributed throughout the Project area. It was determined that the results of the SIS could be improved by estimating a localised HGZ and MZ probability at each location. This was achieved by interpolating the HGZ and MZ indicators using Ordinary Kriging into each simulation grid node. This process effectively creates a 2D probability map of each indicator similar to that shown for HGZ in the Escondida Central and East Zone (Figure 56). A variogram model based on the HGZ indicator threshold was fitted for each prospect dataset and used as the basis for the SIS.

Figure 56 Escondida Central-East Zone – HGZ Indicator Probability Map
Extorre Gold Mines Limited
Cerro Moro Gold – Silver Project
Preliminary Economic Assessment | Page 170 |
The SIS process incorporates a Simple Kriging step which uses these localised probabilities as a local mean during simulation. A sequential neighbourhood was defined whereby a maximum of 16 initial data points and 10 already simulated nodes were used to condition the simulation. A set of 100 simulation realizations of the HGZ and MZ indicators was performed into 2D 1m x 1m grid nodes. The use of SIS allows the generation of a series of equally probable geological models whereby a statistically derived ‘most probable’ geological/mineralization model can be determined. Figure 57 shows examples of several simulated domain models together with the statistically derived ‘most probable’ geological model. The ‘most probable’ geological model was re-grouped into X=10m x Z=10m blocks whereby each larger block has an estimated proportion of each mineralization style.
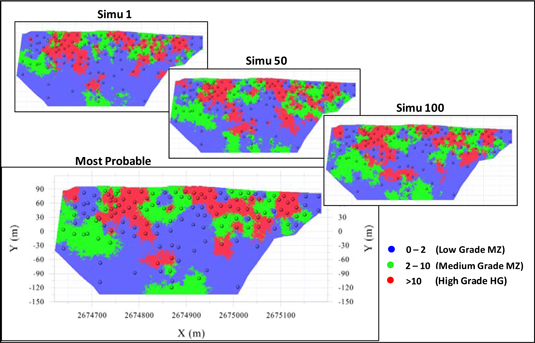
Figure 57 Escondida Central-East Zone – Simulated Domains
Stockwork: A surrounding stockwork interpretation was generated in a similar manner to the MZ domains and a 3D wireframe model produced. Whilst the stockwork domain was predominantly based on geological logging and core photography, anomalous gold and silver grades outside the MZ were also used as a guide. The stockwork domain typically extends 2-5m from the MZ hangingwall and footwall contacts and encompasses stockwork veining of varying intensity and minor breccia zones.
| 14.4.2.1 | Escondida and Loma Escondida |
Figure 58 shows the Escondida and Loma Escondida main epithermal vein zones together with drilling locations.
Extorre Gold Mines Limited
Cerro Moro Gold – Silver Project
Preliminary Economic Assessment | Page 171 |
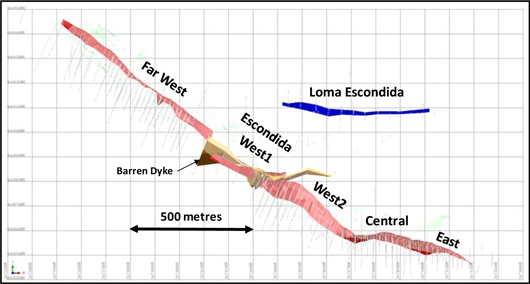
Figure 58 Escondida and Loma Escondida Main Epithermal Vein Zones – Plan View (Source: Cube, 2011)
Figure 59 shows the Zoe main epithermal vein zones together with drilling locations.
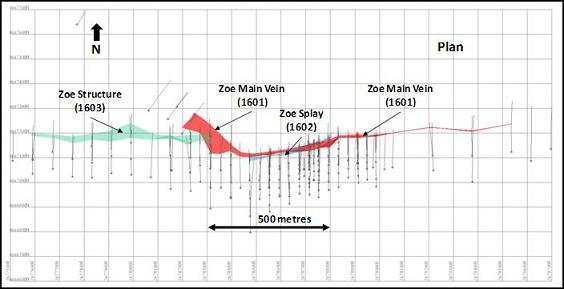
Figure 59 Zoe Vein Structures – Plan View (Source: Cube, 2011)
Figure 60 shows the Martina main epithermal vein zones together with drilling locations.
Extorre Gold Mines Limited
Cerro Moro Gold – Silver Project
Preliminary Economic Assessment | Page 172 |
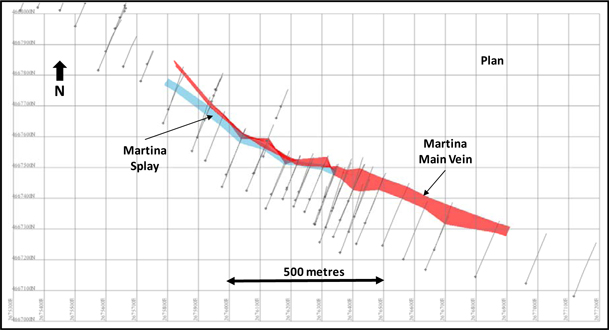
Figure 60 Martina Vein Structures – Plan View (Source: Cube, 2011)
Figure 61 shows the Carla main epithermal vein zones together with drilling locations.
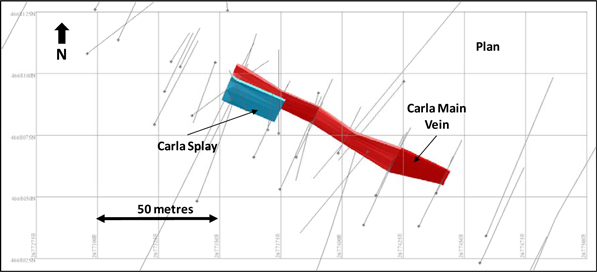
Figure 61 Carla Vein Structures – Plan View (Source: Cube, 2011)
Extorre Gold Mines Limited
Cerro Moro Gold – Silver Project
Preliminary Economic Assessment | Page 173 |
Figure 62 shows the Gabriela main epithermal vein zone together with drilling locations.

Figure 62 Gabriela Main Epithermal Vein Zone – Plan View (Source: Cube, 2011)
Figure 63 shows the Nini-Esperanza main epithermal vein zone together with drilling locations.
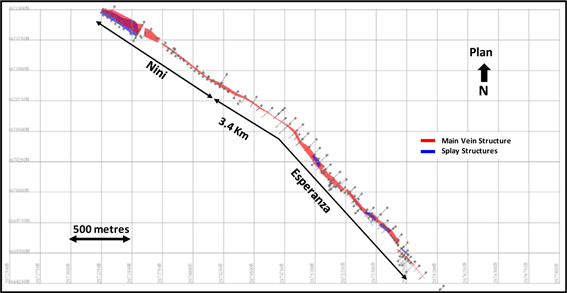
Figure 63 Nini-Esperanza Vein Structures – Plan View (Source: Cube, 2011)
Extorre Gold Mines Limited
Cerro Moro Gold – Silver Project
Preliminary Economic Assessment | Page 174 |
Figure 64 shows the Deborah main epithermal vein zone together with drilling locations.
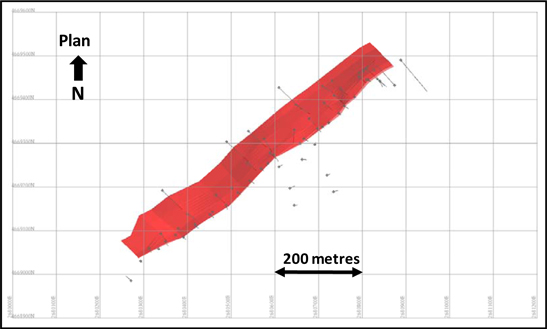
Figure 64 Deborah Main Epithermal Vein Zone – Plan View (Source: Cube, 2011)
| 14.4.3 | Database Coding and Compositing |
| 14.4.3.1 | Main Zone (MZ+HGZ) |
Cube has generally adopted a geostatistical 2D metal accumulation approach to the estimation of the epithermal vein zones. Samples within the epithermal vein zones are assigned a unique database code that is used to generate a single composite across the vein structure. The geological composites are projected onto a vertical 2D plane approximately parallel with the vein structure. Geological intercept composites are not of equal support as the lode thickness varies. Given the variable thickness, an additive variable must be created as the product of grade and thickness or ‘metal accumulation’ variable.
The mid-point of each geological composite is assigned the horizontal width of the vein structure and used to compute a ‘metal accumulation’ variable. The accumulation a(x) is defined as the product of thickness t(x) and grade z(x):
a(x) = t(x) . z(x)
Extorre Gold Mines Limited
Cerro Moro Gold – Silver Project
Preliminary Economic Assessment | Page 175 |
Traditional downhole composites of 1m were generated for the surrounding stockwork domains whereby the zonecode flagging was used to control compositing. The downhole composites were extracted using a ‘best fit’ method which optimizes the composite length over the coded interval to eliminate the problem of residuals.
| 14.4.4 | Descriptive Statistics and High Grade Capping |
An examination of gold and silver raw sample statistics within the coded intervals was undertaken prior to compositing. In some cases, a modest high grade assay cut was applied to raw assays prior to compositing, however, more generally, high grade assay capping was applied to the geological composites where appropriate.
It is important to consider the raw and declustered grade statistics together with the spatial distribution of grade when analysing a mineral deposit. Furthermore, when dealing with unequal length composites such as geological intercept composites it is necessary to incorporate width and the accumulation in the analysis.
In many of the Cerro Moro epithermal veins, there appears to be a strong association between areas of elevated gold and silver grades and increased vein width. This positive association between grade and width is common in epithermal vein systems and often reflects structural features such as dilation zones or flexures in zone geometry.
Table 37 to Table 44summarize MZ geological composite statistcs for all Cerro Moro prospects. It can be seen that declustering reduces the average gold and silver grades reflecting greater drilling density (by design) in higher grade areas. It is also important to note that the width weighted declustered mean grades (highlighted in red) are significantly higher grade than the raw declustered mean grades (highlighted in blue) for all prospects. This confirms statistically that there is a positive association between elevated grade and zone width. Furthermore, the association between grade and width necessitates the application of an accumulation style method of estimation for the epithermal main vein domains.
| | | Raw Au
ppm | | | Raw Ag
ppm | | | Cut Au
ppm | | | Cut Ag
ppm | | | Horizontal
Width | | | Cut Au X
HW | | | Cut Ag X
HW | | | HWidth
Weighted
Cut Au ppm | | | HWidth
Weighted
Cut Ag ppm | |
| Number | | | 465 | | | | 465 | | | | 465 | | | | 465 | | | | 465 | | | | 465 | | | | 465 | | | | 437 | | | | 437 | |
| Minimum | | | 0 | | | | 0.4 | | | | 0 | | | | 0.4 | | | | 0.13 | | | | 0 | | | | 0.25 | | | | | | | | | |
| Maximum | | | 290.06 | | | | 8668.31 | | | | 223.05 | | | | 7130.15 | | | | 5.51 | | | | 494.3 | | | | 20113.89 | | | | | | | | | |
| Raw Mean | | | 15.61 | | | | 588.81 | | | | 15.13 | | | | 563.23 | | | | 1.43 | | | | 25.69 | | | | 1024.65 | | | | 18.01 | | | | 718.05 | |
| Declust. Mean | | | 9.29 | | | | 348.44 | | | | 9.27 | | | | 344.57 | | | | 1.37 | | | | 15.53 | | | | 608.45 | | | | 11.34 | | | | 444.12 | |
| Coeff Var | | | 2.15 | | | | 2.03 | | | | 2.06 | | | | 1.93 | | | | 0.61 | | | | 2.23 | | | | 2.3 | | | | | | | | | |
Table 37 Escondida Main Zones - Summary Statistics – Geological Composites
Extorre Gold Mines Limited
Cerro Moro Gold – Silver Project
Preliminary Economic Assessment | Page 176 |
| | | Raw Au
ppm | | | Raw Ag
ppm | | | Cut Au
ppm | | | Cut Ag
ppm | | | Horizontal
Width | | | Cut Au X
HW | | | Cut Ag X
HW | | | HWidth
Weighted
Cut Au ppm | | | HWidth
Weighted
Cut Ag ppm | |
| Number | | | 75 | | | | 75 | | | | 75 | | | | 75 | | | | 75 | | | | 75 | | | | 75 | | | | | | | | | |
| Minimum | | | 0.08 | | | | 0.53 | | | | 0.08 | | | | 0.53 | | | | 0.17 | | | | 0.02 | | | | 0.09 | | | | | | | | | |
| Maximum | | | 145.5 | | | | 5963 | | | | 100 | | | | 4000 | | | | 2.6 | | | | 100 | | | | 4000 | | | | | | | | | |
| Raw Mean | | | 18.02 | | | | 887.95 | | | | 17.06 | | | | 804.72 | | | | 0.7 | | | | 11.644 | | | | 527.503 | | | | 16.59 | | | | 751.43 | |
| Declust. Mean | | | 14.73 | | | | 738.67 | | | | 14.02 | | | | 652.25 | | | | 0.66 | | | | 9.84 | | | | 430.5 | | | | 15 | | | | 656.25 | |
| Coeff Var | | | 1.672 | | | | 1.64 | | | | 1.566 | | | | 1.509 | | | | 0.65 | | | | 1.77 | | | | 1.67 | | | | | | | | | |
Table 38 Loma Escondida Main Zone - Summary Statistics – Geological Composites
| | | Raw Au
ppm | | | Raw Ag
ppm | | | Cut Au
ppm | | | Cut Ag
ppm | | | Horizontal
Width | | | Cut Au X
HW | | | Cut Ag X
HW | | | HWidth
Weighted
Cut Au ppm | | | HWidth
Weighted
Cut Ag ppm | |
| Number | | | 86 | | | | 86 | | | | 86 | | | | 86 | | | | 86 | | | | 86 | | | | 86 | | | | | | | | | |
| Minimum | | | 0.01 | | | | 0.3 | | | | 0.01 | | | | 0.3 | | | | 0.27 | | | | 0.01 | | | | 0.45 | | | | | | | | | |
| Maximum | | | 162.03 | | | | 7530.04 | | | | 80 | | | | 6500 | | | | 6.89 | | | | 235.39 | | | | 23280.89 | | | | | | | | | |
| Raw Mean | | | 9 | | | | 629.14 | | | | 8.04 | | | | 608.79 | | | | 1.82 | | | | 16.39 | | | | 1369.3 | | | | 9 | | | | 786.91 | |
| Declust. Mean | | | 6.95 | | | �� | 453.1 | | | | 6.36 | | | | 445.69 | | | | 1.67 | | | | 12.64 | | | | 943.1 | | | | 7.57 | | | | 564.73 | |
| Coeff Var | | | 2.38 | | | | 2.02 | | | | 1.93 | | | | 1.93 | | | | 0.63 | | | | 2.4 | | | | 2.73 | | | | | | | | | |
Table 39 Zoe Main Zone - Summary Statistics – Geological Composites
| | | Raw Au
ppm | | | Raw Ag
ppm | | | Cut Au
ppm | | | Cut Ag
ppm | | | Horizontal
Width | | | Cut Au X
HW | | | Cut Ag X
HW | | | HWidth
Weighted
Cut Au ppm | | | HWidth
Weighted
Cut Ag ppm | |
| Number | | | 38 | | | | 38 | | | | 38 | | | | 38 | | | | 38 | | | | 38 | | | | 38 | | | | | | | | | |
| Minimum | | | 0.01 | | | | 0.36 | | | | 0.01 | | | | 0.36 | | | | 0.12 | | | | 0 | | | | 0.26 | | | | | | | | | |
| Maximum | | | 310.13 | | | | 3426.97 | | | | 80 | | | | 300 | | | | 3.88 | | | | 156 | | | | 585 | | | | | | | | | |
| Raw Mean | | | 16.58 | | | | 133.2 | | | | 9.48 | | | | 49.6 | | | | 0.94 | | | | 10.26 | | | | 48.6 | | | | 10.91 | | | | 51.7 | |
| Declust. Mean | | | 9.82 | | | | 72.15 | | | | 5.49 | | | | 36.25 | | | | 0.9 | | | | 5.69 | | | | 32.01 | | | | 6.32 | | | | 35.57 | |
| Coeff Var | | | 3.26 | | | | 4.16 | | | | 2.32 | | | | 1.67 | | | | 0.79 | | | | 2.73 | | | | 2.18 | | | | | | | | | |
Table 40 Martina Main Zone - Summary Statistics – Geological Composites
| | | Raw Au
ppm | | | Raw Ag
ppm | | | Cut Au
ppm | | | Cut Ag
ppm | | | Horizontal
Width | | | Cut Au X
HW | | | Cut Ag X
HW | | | HWidth
Weighted
Cut Au ppm | | | HWidth
Weighted
Cut Ag ppm | |
| Number | | | 17 | | | | 17 | | | | 17 | | | | 17 | | | | 17 | | | | 17 | | | | 17 | | | | | | | | | |
| Minimum | | | 0.03 | | | | 12.76 | | | | 0.03 | | | | 12.76 | | | | 0.42 | | | | 0.02 | | | | 5.36 | | | | | | | | | |
| Maximum | | | 50.8 | | | | 2631.26 | | | | 30 | | | | 1800 | | | | 2.94 | | | | 83.27 | | | | 4305.92 | | | | | | | | | |
| Raw Mean | | | 16.33 | | | | 653.45 | | | | 14.22 | | | | 604.56 | | | | 1.49 | | | | 24.68 | | | | 1016.92 | | | | 16.56 | | | | 682.5 | |
| Declust. Mean | | | 13.42 | | | | 544.01 | | | | 11.63 | | | | 510.24 | | | | 1.37 | | | | 19.8 | | | | 852.24 | | | | 14.45 | | | | 622.07 | |
| Coeff Var | | | 15.97 | | | | 674.91 | | | | 12.44 | | | | 539.11 | | | | 0.7 | | | | 26.7 | | | | 1119.55 | | | | | | | | | |
Table 41 Carla Main Zone - Summary Statistics – Geological Composites
| | | Raw Au
ppm | | | Raw Ag
ppm | | | Cut Au
ppm | | | Cut Ag
ppm | | | Horizontal
Width | | | Cut Au X
HW | | | Cut Ag X
HW | | | HWidth
Weighted
Cut Au ppm | | | HWidth
Weighted
Cut Ag ppm | |
| Number | | | 135 | | | | 135 | | | | 135 | | | | 135 | | | | 135 | | | | 135 | | | | 135 | | | | | | | | | |
| Minimum | | | 0.02 | | | | 2.62 | | | | 0.02 | | | | 2.62 | | | | 0.22 | | | | 0.02 | | | | 2.41 | | | | | | | | | |
| Maximum | | | 17.36 | | | | 2222.54 | | | | 10 | | | | 1500 | | | | 8.54 | | | | 45.52 | | | | 6147.61 | | | | | | | | | |
| Raw Mean | | | 2.35 | | | | 356.37 | | | | 2.26 | | | | 343.46 | | | | 1.72 | | | | 4.58 | | | | 683.74 | | | | 2.66 | | | | 397.52 | |
| Coeff Var | | | 1.13 | | | | 1.09 | | | | 1.01 | | | | 0.98 | | | | 0.77 | | | | 1.42 | | | | 1.41 | | | | | | | | | |
Table 42 Gabriela Main Zone - Summary Statistics – Geological Composites
Extorre Gold Mines Limited
Cerro Moro Gold – Silver Project
Preliminary Economic Assessment | Page 177 |
| | | Raw Au
ppm | | | Raw Ag
ppm | | | Cut Au
ppm | | | Cut Ag
ppm | | | Horizontal
Width | | | Cut Au X
HW | | | Cut Ag X
HW | | | HWidth
Weighted
Cut Au ppm | | | HWidth
Weighted
Cut Ag ppm | |
| Number | | | 85 | | | | 85 | | | | 85 | | | | 85 | | | | 85 | | | | 85 | | | | 85 | | | | | | | | | |
| Minimum | | | 0 | | | | 0.25 | | | | 0 | | | | 0.25 | | | | 0.15 | | | | 0 | | | | 0.39 | | | | | | | | | |
| Maximum | | | 14.63 | | | | 935.18 | | | | 10 | | | | 500 | | | | 9.54 | | | | 29.24 | | | | 1929.24 | | | | | | | | | |
| Raw Mean | | | 1.76 | | | | 128.36 | | | | 1.67 | | | | 118.94 | | | | 1.75 | | | | 3.39 | | | | 248.78 | | | | 1.93 | | | | 142.16 | |
| Declust. Mean | | | 1.69 | | | | 132.73 | | | | 1.55 | | | | 121.35 | | | | 1.76 | | | | 3.17 | | | | 257.85 | | | | 1.8 | | | | 146.5 | |
| Coeff Var | | | 1.55 | | | | 1.32 | | | | 1.43 | | | | 1.15 | | | | 0.85 | | | | 1.61 | | | | 1.48 | | | | | | | | | |
Table 43 Nini-Esperanza Main Zone - Summary Statistics – Geological Composites
| | | Raw Au
ppm | | | Raw Ag
ppm | | | Cut Au
ppm | | | Cut Ag
ppm | | | Horizontal
Width | | | Cut Au X
HW | | | Cut Ag X
HW | | | HWidth
Weighted
Cut Au ppm | | | HWidth
Weighted
Cut Ag ppm | |
| Number | | | 20 | | | | 20 | | | | 20 | | | | 20 | | | | 20 | | | | 20 | | | | 20 | | | | | | | | | |
| Minimum | | | 0.75 | | | | 5.3 | | | | 0.75 | | | | 5.3 | | | | 1.17 | | | | 1.19 | | | | 6.2 | | | | | | | | | |
| Maximum | | | 7.38 | | | | 93 | | | | 4 | | | | 93 | | | | 9.65 | | | | 29.42 | | | | 662.9 | | | | | | | | | |
| Raw Mean | | | 2.36 | | | | 46.5 | | | | 2.19 | | | | 46.5 | | | | 4.63 | | | | 11.06 | | | | 233.8 | | | | 2.63 | | | | 50.5 | |
| Declust. Mean | | | 2.3 | | | | 42.74 | | | | 2.19 | | | | 42.74 | | | | 4.55 | | | | 10.67 | | | | 215.5 | | | | 2.35 | | | | 47.4 | |
| Coeff Var | | | 0.64 | | | | 0.6 | | | | 0.47 | | | | 0.6 | | | | 0.53 | | | | 0.75 | | | | 0.84 | | | | | | | | | |
Table 44 Deborah Main Zone - Summary Statistics – Geological Composites
| 14.4.5.1 | Main Zone (MZ+HGZ) |
Geological composites for individual MZ domains were separated on the basis of the gold grade indicator. Variography was used to characterise the spatial continuity of the horizontal width and accumulation variables for each grade indicator within the plane of each vein structure. It was decided to combine the low grade MZ and medium grade MZ data to improve the quality of variography for these indicators.
Generally, no obvious direction of preferred continuity was determined and omni-directional variogram models were fitted for all variables. Variograms of horizontal width and accumulations demonstrated similar spatial structure and variance proportions. Given the similarities between these variograms a simplification was made whereby a single variogram model was used to estimate both the accumulation and thickness variables. This approach has the advantage that it is simpler and ensures no instability in the back-calculated block grades due to unstable or unexpected width estimations which may occur when a different variogram model is used. Experimental variography was undertaken on Gaussian transformed data. Variogram models were fitted to the Gaussian data and subsequently back-transformed into real variances to obtain the appropriate parameters for interpolation of the raw accumulation variables by Ordinary Kriging.
Variography indicated that the Cerro Moro epithermal vein zones generally have moderate variability with nugget effects of 30-50% and maximum continuity of up to 100m.
Extorre Gold Mines Limited
Cerro Moro Gold – Silver Project
Preliminary Economic Assessment | Page 178 |
3D experimental variography was undertaken on cut Gaussian transformed 1m down hole composites. Variogram models were fitted to the Gaussian data and subsequently back-transformed into real variances to obtain the appropriate parameters for interpolation of the raw accumulation variables by Ordinary Kriging.
| 14.4.6.1 | Main Zone (MZ+HGZ) |
Estimation of block grades within the MZ domains used an accumulation methodology whereby the gold and silver accumulations and horizontal width were estimated on a 2D vertical plane into X=10m x Z=10m blocks using Ordinary Kriging for each grade component. Final block grade is calculated by dividing the estimated accumulation by the estimated thickness and weighted by the proportion of each mineralization style (HGZ and MZ) computed previously by the SIS approach. The adopted estimation methodology resulted in very good reproduction of the high grade shoots within the main vein zones.
Kriging neighbourhood analysis was undertaken to determine appropriate inputs to the Ordinary Kriging process. Estimation parameters for the MZ domains are summarized in Table 45.
| Parameter | | Escondida | | | Loma
Escondida | | | Zoe | | | Martina | | | Carla | | | Gabriela | | | Nini-Esperanza | | | Deborah | |
| Minimum number of Comps | | | 2 | | | | 2 | | | | 2 | | | | 2 | | | | 3 | | | | 2 | | | | 2 | | | | 2 | |
| Maximum number of Comps | | | 16 | | | | 20 | | | | 16 | | | | 16 | | | | 16 | | | | 10 | | | | 12 | | | | 4 | |
| Search Major Distance | | | 120 | | | | 150 | | | | 150 | | | | 150 | | | | 250 | | | | 200 | | | | 300 | | | | 200 | |
| Search Orientation | | | 0 | | | | 0 | | | | 0 | | | | 0 | | | | 0 | | | | 0 | | | | 0 | | | | 0 | |
| Plunge of Major Axis | | | 0 | | | | 0 | | | | 0 | | | | 0 | | | | 0 | | | | 0 | | | | 0 | | | | 0 | |
| Dip of Major Axis | | | 0 | | | | 0 | | | | 0 | | | | 0 | | | | 0 | | | | 0 | | | | 0 | | | | 0 | |
| Anisotropy major/semi-major | | | 1 | | | | 1 | | | | 1 | | | | 1 | | | | 1 | | | | 1 | | | | 1 | | | | 1 | |
| Anisotropy major/minor | | | 1 | | | | 1 | | | | 1 | | | | 1 | | | | 1 | | | | 1 | | | | 1 | | | | 1 | |
| Block Discretization | | | 10 x 10 | | | | 10 x 10 | | | | 10 x 10 | | | | 10 x 10 | | | | 10 x 10 | | | | 5 x 5 | | | | 10 x 10 | | | | 5 x 5 | |
Table 45 Main Zones – Estimation Parameters
The stockwork mineralization surrounding the main epithermal vein zones is estimated using traditional 3D Ordinary Kriging of the uniquely coded 1.0m downhole composite data.
All block estimates were based on grade interpolation into X=10m x Z=10m x Y=2m (Escondida) and X=8m x Z=8m x Y=2m (Gabriela) parent cells. Estimation parameters for the Stockwork domains are summarized in Table 46.
Extorre Gold Mines Limited
Cerro Moro Gold – Silver Project
Preliminary Economic Assessment | Page 179 |
| Parameter | | Escondida | | | Gabriela | |
| Minimum number of Comps | | | 3 | | | | 4 | |
| Maximum number of Comps | | | 15 | | | | 20 | |
| Search Major Distance | | | 125 | | | | 200 | |
| Search Orientation | | | 0 | | | | 136 | |
| Plunge of Major Axis | | | 0 | | | | 0 | |
| Dip of Major Axis | | | 0 | | | | 83 | |
| Anisotropy major/semi-major | | | 1 | | | | 1 | |
| Anisotropy major/minor | | | 1 | | | | 5 | |
| Block Discretization | | | 5 x 5 x 1 | | | | 3 x 3 x 3 | |
Table 46 Stockwork Zones – Estimation Parameters
| 14.4.7 | 3D Block Model Definition |
At the completion of 2D block grade back-calculation each of the X=10m x Z=10m parent cells was re-located into real-world space and imported into a 3D block model. The primary consideration of the 3D models was to provide an adequate level of resolution to cope with all volume related complexity. The 3D wireframes were used to create block model volume constraints for each mineralized zone. All individual mineralized zones were ultimately combined to create a single block model in the Gauss-Krüger coordinate system.
Block model definitions for all prospects are shown in Table 47 to Table 53. A standard list of field names and descriptions used in the block models are shown in Table 54 and list of zone codes for the all modelled mineralized zones are shown in Table 55.
| Origin | | Minimum | | Maximum | | Model Extent |
| Y | | 4,667,500 | | 4,669,500 | | 2,000 |
| X | | 2,673,000 | | 2,676,500 | | 3,500 |
| Z | | -500 | | 200 | | 700 |
| Parent Cell Y | | 2m | | Min Sub-Cell Y m | | 0.25 |
| Parent Cell X | | 10m | | Min Sub-Cell X m | | 1.25 |
| Parent Cell Z | | 10m | | Min Sub-Cell Z m | | 1.25 |
Table 47 Escondida and Loma Escondida 3D Block Model Definition
| Origin | | Minimum | | Maximum | | Model Extent |
| Y | | 4,666,900 | | 4,667,500 | | 600 |
| X | | 2,677,200 | | 2,679,700 | | 2,500 |
| Z | | -500 | | 200 | | 700 |
| Parent Cell Y | | 2m | | Min Sub-Cell Y m | | 0.25 |
| Parent Cell X | | 10m | | Min Sub-Cell X m | | 1.25 |
| Parent Cell Z | | 10m | | Min Sub-Cell Z m | | 1.25 |
Table 48 Zoe 3D Block Model Definition
Extorre Gold Mines Limited
Cerro Moro Gold – Silver Project
Preliminary Economic Assessment | Page 180 |
| Origin | | Minimum | | Maximum | | Model Extent |
| Y | | 4,667,100 | | 4,668,000 | | 900 |
| X | | 2,675,700 | | 2,677,000 | | 1,300 |
| Z | | -400 | | 100 | | 500 |
| Parent Cell Y | | 2m | | Min Sub-Cell Y m | | 0.25 |
| Parent Cell X | | 10m | | Min Sub-Cell X m | | 1.25 |
| Parent Cell Z | | 10m | | Min Sub-Cell Z m | | 1.25 |
Table 49 Martina 3D Block Model Definition
| Origin | | Minimum | | Maximum | | Model Extent |
| Y | | 4,668,000 | | 4,668,200 | | 200 |
| X | | 2,677,300 | | 2,677,500 | | 200 |
| Z | | -50 | | 200 | | 250 |
| Parent Cell Y | | 2m | | Min Sub-Cell Y m | | 0.25 |
| Parent Cell X | | 10m | | Min Sub-Cell X m | | 1.25 |
| Parent Cell Z | | 10m | | Min Sub-Cell Z m | | 1.25 |
Table 50 Carla 3D Block Model Definition
| Origin | | Minimum | | Maximum | | Model Extent |
| Y | | 4,669,900 | | 4,671,180 | | 1,280 |
| X | | 2,676,400 | | 2,677,600 | | 1,200 |
| Z | | -300 | | 200 | | 500 |
| Parent Cell Y | | 10m | | Min Sub-Cell Y m | | 0.5 |
| Parent Cell X | | 8m | | Min Sub-Cell X m | | 0.5 |
| Parent Cell Z | | 8m | | Min Sub-Cell Z m | | 1.25 |
Table 51 Gabriela 3D Block Model Definition
| Origin | | Minimum | | Model Extent | | Rotation |
| Y | | 4,671,400 | | 600 | | |
| X | | 2,673,100 | | 2,500 | | |
| Z | | -200 | | 400 | | 39.431111 |
| Parent Cell Y | | 2m | | Min Sub-Cell Y m | | 0.25 |
| Parent Cell X | | 10m | | Min Sub-Cell X m | | 1.25 |
| Parent Cell Z | | 10m | | Min Sub-Cell Z m | | 1.25 |
Table 52 Nini-Esperanza 3D Block Model Definition
| Origin | | Minimum | | Model Extent | | Rotation |
| Y | | 4,668,850 | | 350 | | |
| X | | 2,680,277 | | 1,000 | | |
| Z | | -200 | | 400 | | 321.218611 |
| Parent Cell Y | | 2m | | Min Sub-Cell Y m | | 0.25 |
| Parent Cell X | | 20m | | Min Sub-Cell X m | | 2.5 |
| Parent Cell Z | | 20m | | Min Sub-Cell Z m | | 2.5 |
Table 53 Deborah 3D Block Model Definition
Extorre Gold Mines Limited
Cerro Moro Gold – Silver Project
Preliminary Economic Assessment | Page 181 |
| Field Name | | Description |
| x | | X Block Centroid |
| y | | Y Block Centroid |
| z | | Z Block Centroid |
| au | | Au ppm – Interpolated |
| ag | | Ag ppm – Interpolated |
| Aueq50 | | Gold Equivalent ppm = Au + Ag/50 |
| density | | Density g/cm3 – Direct Assignment – Default 2.5 |
| rescode | | Resource Classification - 1=Measured 2=Indicated 3=Inferred |
| zone | | Domain Code Eg. 1101, 1201, 1301, 1401, 1901 , 1902 |
Table 54 Block Model Attribute Names
| Zone | | Domain |
| 1101 | | Escondida Central-East Main Zone |
| 1201 | | Escondida West 2 Main Zone |
| 1301 | | Escondida Far West Main Zone |
| 1401 | | Escondida West 1 Main Zone |
| 1901 | | Escondida Footwall Stockwork |
| 1902 | | Escondida Hangingwall Stockwork |
| 1501 | | Martina Main Vein |
| 1502 | | Martina Splay |
| 1601 | | Zoe Main Vein |
| 1602 | | Zoe Splay |
| 1603 | | Zoe Structure |
| 1501 | | Martina Main Vein |
| 1502 | | Martina Splay |
| 2101 | | Loma Escondida Main Zone |
| 2901 | | Loma Escondida Alteration Zone |
| 3101 | | Gabriela Main Zone |
| 3901 | | Gabriela Stockwork Zone |
| 4101 | | Nini-Esperanza Main Vein |
| 4101-4107 | | Nini-Esperanza Splay Zones |
| 5101 | | Deborah Main Zone |
| 6101 | | Carla Main Vein |
| 6102 | | Carla Splay |
Table 55 List of Domain Codes
Global bulk densities were assigned to each prospect as shown in Table 56.
Extorre Gold Mines Limited
Cerro Moro Gold – Silver Project
Preliminary Economic Assessment | Page 182 |
| Domain | | Density | | # Density Measurements |
| Escondida, Loma Escondida Main Vein | | 2.65 | | 58 |
| Escondida, Loma Escondida Stockwork | | 2.50 | | 1 |
| Martina Main Vein | | 2.55 | | 66 |
| Zoe Main Vein | | 2.58 | | 42 |
| Gabriela Main Vein | | 2.54 | | 20 |
| Gabriela Stockwork | | 2.54 | | Assumed |
| Nini-Esperanza Main Vein | | 2.58 | | 12 |
| Deborah Main Vein | | 2.60 | | Assumed |
| Carla Main Vein | | 2.51 | | 24 |
Table 56 Density Values
Oxidation of mineralized domains is observed to be of insignificant depth and does not appear to materially influence the bulk density or characteristics of the main mineralized zones. Whilst trenching and sub-outcrop indicates that some of the minealized zones are very close to the surface in places, Cube has assigned a zero grade to all material within 1m below the topographical surface.
Model validation was carried out visually and by comparing the modelled outcomes against de-clustered composite grades. Statistical comparisons of composite grades (raw and declustered width weighted) with the modelled outcomes are shown in Table 57 for all Cerro Moro epithermal main zones. Figure 65 to Figure 80 show back-calculated model grades for gold and silver together with geological intercept composites for all Cerro Moro epithermal main zones (MZ+HGZ). The model outcomes show very good correspondence to the informing composite, in particular, providing very good definition of the high grade shoots. Cube concludes that both visual and statistical comparisons confirm that a robust and unbiased model outcome has been achieved.
| Zone | | De-clustering
Cell Size | | Composites Cut
Au ppm | | De-clustered
Composites
Au ppm | | Model
Grade Au
ppm | | Composites
Cut Ag ppm | | De-clustered
Composites
Ag ppm | | Model Grade
Ag ppm |
| Escondida | | X=60 x Z=60 | | 15.10 | | 11.30 | | 11.60 | | 563.20 | | 444.10 | | 501.00 |
| Loma Escondida | | X=45 x Z=45 | | 18.02 | | 15.00 | | 14.29 | | 804.25 | | 656.25 | | 735.12 |
| Zoe | | X=100 x Z=100 | | 9.00 | | 5.73 | | 5.35 | | 629.14 | | 356.66 | | 421.98 |
| Martina | | X=80 x Z=80 | | 16.58 | | 6.32 | | 6.93 | | 133.20 | | 35.57 | | 34.35 |
| Carla | | X=40 x Z=40 | | 16.33 | | 14.45 | | 16.01 | | 653.45 | | 622.07 | | 701.23 |
| Nini-Esperanza | | X=80 x Z=80 | | 1.76 | | 1.80 | | 1.70 | | 128.36 | | 146.50 | | 133.16 |
| Deborah | | Y=60 X=60 Z=30 | | 2.63 | | 2.35 | | 2.40 | | 50.50 | | 47.40 | | 48.10 |
Table 57 Cerro Moro Main Zones - De-Clustered Composite vs Model Grade
Extorre Gold Mines Limited
Cerro Moro Gold – Silver Project
Preliminary Economic Assessment | Page 183 |

Figure 65 Escondida Main Zones (MZ+HGZ) – Composites vs Model Grades – Au ppm
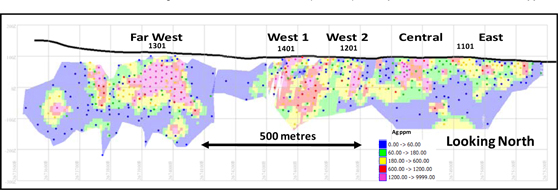
Figure 66 Escondida Main Zones (MZ+HGZ) – Composites vs Model Grades – Ag ppm
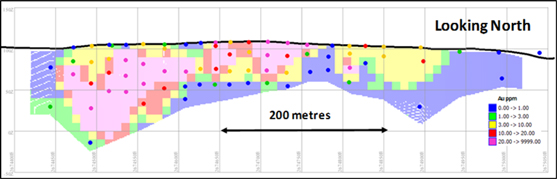
Figure 67 Loma Escondida Main Zone (MZ+HGZ) – Composites vs Model Grades – Au ppm
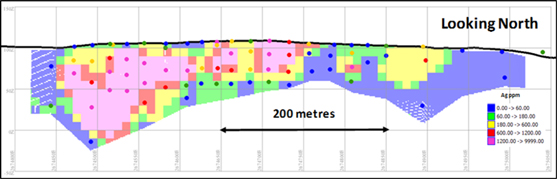
Figure 68 Loma Escondida Main Zone (MZ+HGZ) – Composites vs Model Grades – Ag ppm
Extorre Gold Mines Limited
Cerro Moro Gold – Silver Project
Preliminary Economic Assessment | Page 184 |
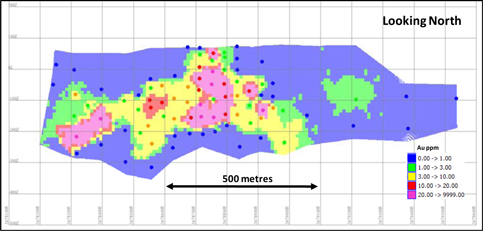
Figure 69 Zoe Main Vein– Composites vs Model Grades – Au ppm
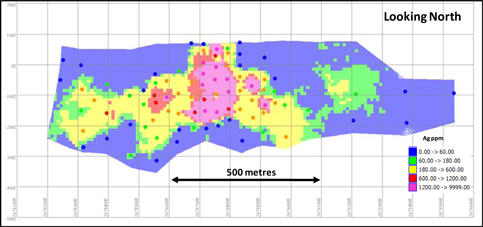
Figure 70 Zoe Main Vein– Composites vs Model Grades – Ag ppm
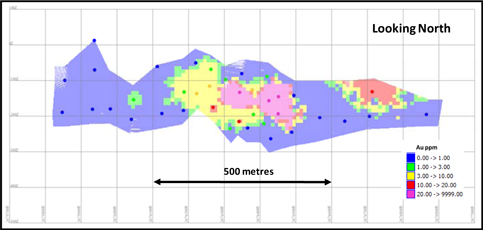
Figure 71 Martina Main Vein– Composites vs Model Grades – Au ppm
Extorre Gold Mines Limited
Cerro Moro Gold – Silver Project
Preliminary Economic Assessment | Page 185 |

Figure 72 Martina Main Vein– Composites vs Model Grades – Ag ppm
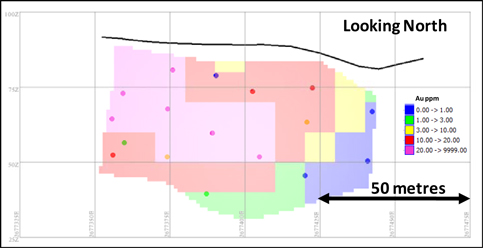
Figure 73 Carla Main Vein– Composites vs Model Grades – Au ppm

Figure 74 Carla Main Vein– Composites vs Model Grades – Ag ppm
Extorre Gold Mines Limited
Cerro Moro Gold – Silver Project
Preliminary Economic Assessment | Page 186 |
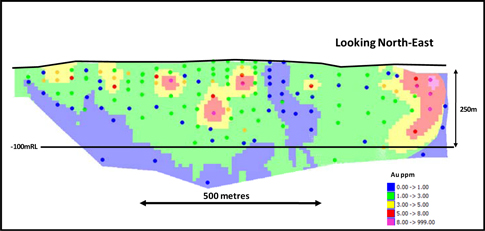
Figure 75 Gabriela Main Zone – Composites vs Model Grades – Au ppm
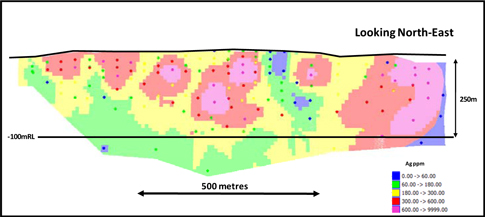
Figure 76 Gabriela Main Zone – Composites vs Model Grades – Ag ppm
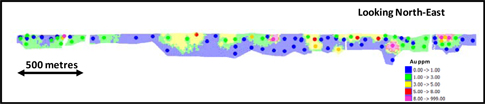
Figure 77 Nini-Esperanza Main Vein– Composites vs Model Grades – Au ppm

Figure 78 Nini-Esperanza Main Vein– Composites vs Model Grades – Ag ppm
Extorre Gold Mines Limited
Cerro Moro Gold – Silver Project
Preliminary Economic Assessment | Page 187 |

Figure 79 Deborah Main Zone – Composites vs Model Grades – Au ppm
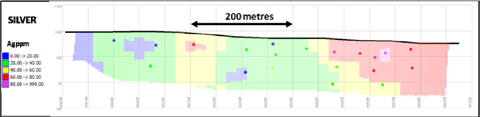
Figure 80 Deborah Main Zone – Composites vs Model Grades – Ag ppm
All final Surpac block models were clipped by the topography to remove volume above current surface and exported into CSV format and provided to Extorre.
| 14.5 | Resource Classification |
The mineral resource estimate was prepared by Ted Coupland, MAusIMM (CP), Director and Principal Geostatistician of Cube. The mineral resource estimates have been classified and reported in accordance with the CIM guidelines (CIM 2011) and NI 43-101. Ted Coupland is ‘independent’ and a ‘qualified person’ as defined by NI 43-101.
A substantial proportion of the Cerro Moro mineral resources are classified as Indicated where drilling is sufficient to demonstrate a high level of confidence in the geometry, continuity and grade of the mineralization. All Inferred resources are based on sufficient drilling to demonstrate the presence of mineralization with an appropriate level of confidence in the geometry, continuity and grade to support the Inferred mineral resource classification.
Cube has classified the Escondida mineral resources as Indicated where drilling is 20m x 20m or closer. Surrounding areas of Escondida have been classified as Inferred where drill spacing is wider spaced or where unresolved geological complexity exists. Figure 81 shows the resource classification applied to the Escondida epithermal main zones.
Extorre Gold Mines Limited
Cerro Moro Gold – Silver Project
Preliminary Economic Assessment | Page 188 |

Figure 81 Escondida Main Zones – Resource Classification
Cube has classified the Loma Escondida mineral resources as Indicated where drilling is 20m x 20m or closer. Surrounding areas of Loma Escondida have been classified as Inferred where drill spacing is wider than 20m x 20m. Figure 82 shows the resource classification applied to the Loma Escondida epithermal main zones.
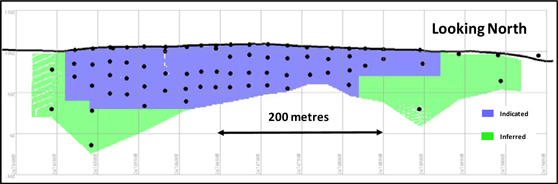
Figure 82 Loma Escondida Main Zone – Resource Classification
Cube has classified approximately 40% of the Zoe mineral resources as Indicated. Indicated mineral resources are restricted to a central area where resource definition drilling has been completed to 40m x 40m with all assays available and infill drilling has been completed to 20m x 20m or closer with assays pending. Ted Coupland has inspected physical core for some of the 20m x 20m infill drilling and has reviewed all core photography, geological logging and handheld Niton XL3t XRF results. Ted Coupland believes that the level of information available is sufficient to demonstrate a high level of confidence in the geometry, continuity and grade of the Indicated portion of the Zoe deposit. Surrounding areas of Zoe have been classified as Inferred where drill spacing is wider spaced or where unresolved geological complexity exists. Figure 83 shows the resource classification applied to the Zoe Main Vein.
Extorre Gold Mines Limited
Cerro Moro Gold – Silver Project
Preliminary Economic Assessment | Page 189 |
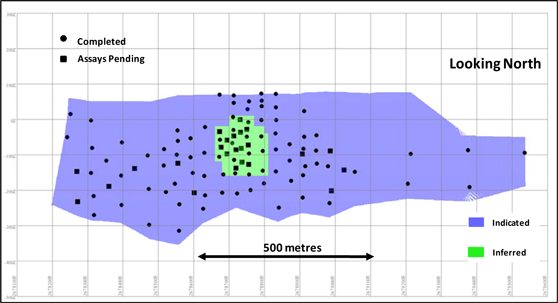
Figure 83 Zoe Main Vein – Resource Classification
Cube has classified the entire Martina mineral resource as Inferred.
Cube has classified the entire Carla Main Vein mineral resource as Indicated and the Carla Splay as Inferred. Ted Coupland believes that the level of information available is adequate to demonstrate a high level of confidence in the geometry, continuity and grade to declare Indicated mineral resources for the Carla Main Vein.
Cube has classified a substantial proportion of the Gabriela mineral resources as Indicated where drilling is 40m x 40m or closer. Ted Coupland believes that this level of drill hole spacing is sufficient to demonstrate a high level of confidence in the geometry, continuity and grade of the Gabriela deposit. Surrounding areas of Gabriela have been classified as Inferred where drill spacing is wider spaced or where unresolved geological complexity exists. Figure 84 shows the resource classification applied to the Gabriela epithermal main zone. Gabriela mineral resources have been reported above the -100mRL (approximately 250m below topography) and include main epithermal vein and stockwork style mineralization.
Extorre Gold Mines Limited
Cerro Moro Gold – Silver Project
Preliminary Economic Assessment | Page 190 |
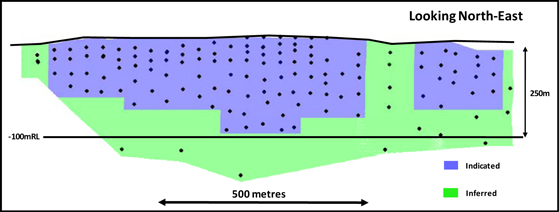
Figure 84 Gabriela Main Zone – Resource Classification
Cube has classified the entire Nini-Esperanza mineral resource as Inferred. Ted Coupland believes that the level of information available is adequate to demonstrate a sufficient level of confidence in the geometry, continuity and grade to declare Inferred mineral resources for the Nini-Esperanza deposit.
Cube has classified the entire Deborah mineral resource as Inferred. Ted Coupland believes that the level of information available is adequate to demonstrate a sufficient level of confidence in the geometry, continuity and grade to declare Inferred mineral resources for the Deborah deposit.
| 14.6 | Cerro Moro Resource Reporting |
The reader is cautioned that the mineral resource estimate is part of a preliminary economic assessment that is preliminary in nature and includes Inferred mineral resources that are considered too speculative geologically to have the economic considerations applied to them that would enable them to be categorized as mineral reserves. There is no certainty that the preliminary economic assessment will be realized. No Mineral Reserves have been estimated.
A summary of the Cerro Moro Indicated and Inferred mineral resources above a cut-off of 1 ppm gold equivalent are shown in Table 14.25 and Table 14.26 respectively.
| Zone | | Tonnes | | | Gold (ppm) | | | Silver (ppm) | | | Gold Equivalent
Grade* (ppm) | | | Gold
(ounces) | | | Silver (ounces) | | | Gold Equivalent
Ounces** | |
| Escondida | | | 620,000.00 | | | | 18.80 | | | | 829.20 | | | | 35.40 | | | | 374,000.00 | | | | 16,530,000.00 | | | | 705,000.00 | |
| Loma Esc | | | 44,000.00 | | | | 18.40 | | | | 919.50 | | | | 36.80 | | | | 26,000.00 | | | | 1,297,000.00 | | | | 52,000.00 | |
| Gabriela | | | 1,642,000.00 | | | | 1.50 | | | | 226.10 | | | | 6.00 | | | | 79,000.00 | | | | 11,936,000.00 | | | | 318,000.00 | |
| Zoe | | | 105,000.00 | | | | 27.20 | | | | 2,614.50 | | | | 79.50 | | | | 91,000.00 | | | | 8,798,000.00 | | | | 267,000.00 | |
| Carla | | | 15,000.00 | | | | 16.00 | | | | 701.20 | | | | 30.00 | | | | 7,000.00 | | | | 327,000.00 | | | | 14,000.00 | |
| Total | | | 2,426,000.00 | | | | 7.43 | | | | 499.12 | | | | 17.40 | | | | 577,000.00 | | | | 38,888,000.00 | | | | 1,356,000.00 | |
Table 58 Cerro Moro Indicated Mineral Resources above 1 ppm Gold Equivalent
Extorre Gold Mines Limited
Cerro Moro Gold – Silver Project
Preliminary Economic Assessment | Page 191 |
| Zone | | Tonnes | | | Gold (ppm) | | | Silver (ppm) | | | Gold Equivalent
Grade* (ppm) | | | Gold
(ounces) | | | Silver (ounces) | | | Gold Equivalent
Ounces** | |
| Escondida | | | 508,000.00 | | | | 4.30 | | | | 164.80 | | | | 7.60 | | | | 70,000.00 | | | | 2,689,000.00 | | | | 123,000.00 | |
| Loma Esc | | | 13,000.00 | | | | 9.70 | | | | 595.40 | | | | 21.60 | | | | 4,000.00 | | | | 256,000.00 | | | | 9,000.00 | |
| Zoe | | | 1,248,000.00 | | | | 4.10 | | | | 280.30 | | | | 9.80 | | | | 167,000.00 | | | | 11,250,000.00 | | | | 391,000.00 | |
| Martina | | | 293,000.00 | | | | 13.00 | | | | 60.30 | | | | 14.20 | | | | 123,000.00 | | | | 568,000.00 | | | | 134,000.00 | |
| Carla | | | 2,000.00 | | | | 9.50 | | | | 390.40 | | | | 17.30 | | | | 1,000.00 | | | | 29,000.00 | | | | 1,000.00 | |
| Gabriela | | | 331,000.00 | | | | 1.30 | | | | 219.70 | | | | 5.70 | | | | 14,000.00 | | | | 2,336,000.00 | | | | 61,000.00 | |
| Esperanza-Nini | | | 1,773,000.00 | | | | 1.80 | | | | 144.30 | | | | 4.70 | | | | 105,000.00 | | | | 8,226,000.00 | | | | 270,000.00 | |
| Deborah | | | 578,000.00 | | | | 2.40 | | | | 48.10 | | | | 3.40 | | | | 45,000.00 | | | | 894,000.00 | | | | 62,000.00 | |
| Total | | | 4,746,000.00 | | | | 3.43 | | | | 171.95 | | | | 6.90 | | | | 529,000.00 | | | | 26,248,000.00 | | | | 1,051,000.00 | |
Table 59 Cerro Moro Inferred Mineral Resources above 1 ppm Gold Equivalent
* Gold equivalent values have been calculated by Extorre on the basis of the following parameters:
| · | Long term gold price US$1,320/oz; |
| · | Long term silver price US$26/oz; |
| · | Metallurgical recovery gold 100%; |
| · | Metallurgical recovery silver 100%. |
The gold equivalent value is calculated by dividing the silver grade (ppm) by 50 (approximate ratio of gold/silver US$ value) and adding it to the gold grade (ppm).
**The gold equivalent ounces are calculated by dividing the total silver ounces by 50 and adding this value to the total gold ounces.
It is the opinion of Ted Coupland that the Indicated and Inferred mineral resources summarized in Table 58 and Table 59 respectively have reasonable prospects for economic extraction. A number of factors have been taken into consideration when quantifying a subset of the Cerro Moro mineralized system with reasonable prospects for economic extraction. These include:
Potentially economic mineralization at Cerro Moro occurs at relatively shallow depths, with the majority being within 200 meters of the surface. The shallow depth of occurrence indicates that exploitation may be achieved by well-established open pit or shallow underground mining methods.
| · | The gold and silver grade of the Cerro Moro mineralization is high by world standards. High grade mineralization at Cerro Moro occurs in well developed “shoot-like” zones surrounded by minor occurrences of low grade material within a distinct geological structure. |
| · | Extorre, with the assistance of independent engineering consultants, has recently estimated a cut-off grade for open pit mining of 2.1 ppm Au equivalent and underground mining of 3.4 ppm Au (including milling and processing costs). |
| · | Based on preliminary metallurgical testwork gold and silver recoveries have been estimated at 95% and 90%, respectively. |
| · | Base assumptions for long-term gold and silver prices are US$1,320/oz and US$26/oz, respectively. |
Extorre Gold Mines Limited
Cerro Moro Gold – Silver Project
Preliminary Economic Assessment | Page 192 |
| · | Approximately 93% of the reported Cerro Moro mineral resources shown in Table 58 and Table 59 are above a nominal economic cut-off grade of 3.4 ppm Au equivalent and less 2% of the total mineral resources are below a cut-off of 2.1 ppm Au equivalent. |
Ted Coupland believes that the cost and commodity price parameters set out above are consistent with those adopted by companies with similar sized projects elsewhere in the world. While Ted Coupland believes that the long-term gold and silver price assumptions of US $1,320/oz and US $26/oz, respectively, provide an appropriate basis for project evaluation, recent commodity spot prices have reached significantly higher levels. Since January 2011, gold and silver spot prices have consistently traded in excess of US $1,320/oz and US $26.00/oz respectively. It is Ted Coupland’s opinion that at current commodity spot prices there is a reasonable expectation that material below the 1.0 ppm Au equivalent cut-off used for reporting current mineral resources may become available for economic extraction.
Ted Coupland has extensive experience in mining similar deposits in other parts of the world with both open pit and underground methods and expects mining will be focused on extracting the full geological structure including some peripheral sub-grade mineralized material. It is Ted Coupland’s opinion that the small proportion of mineralized material that falls below a nominal economic cut-off grade of 2.1 ppm Au should be included within reportable resources as there is a strong likelihood that the majority of this material will be mined in conjunction with extracting the potentially economic component of the mineralized system. Ted Coupland believes that a range of potentially viable low grade processing options, such as heap leach technology, may provide realistic opportunities to exploit lower grade resources in the Project area. These options could be particularly attractive given the relatively shallow nature of mineralization readily amenable to open-pit mining. Such options could result in processing costs being as low as U.S.$5.50/tonne resulting in potentially economic cut-off grades of 0.3 ppm Au equivalent.
| 14.7 | Other Factors and Mineral Resources |
The declaration of mineral resources for the Project is based solely on the estimated in-situ metal content of the mineralization together with current knowledge regarding Project tenure, economic and other considerations to conclude that there are reasonable prospects for economic extraction. Such considerations include the environmental, permitting, legal, title, taxation, socio-economic, marketing and political factors. Should circumstances arise where any of these factors change to the extent that there are no longer reasonable prospects for economic extraction the declaration of mineral resources may be detrimentally affected or eliminated entirely.
Extorre Gold Mines Limited
Cerro Moro Gold – Silver Project
Preliminary Economic Assessment | Page 193 |
| 15. | Mineral RESERVES Estimate |
The mineral resources at Cerro Moro have not been proven to a mineral reserve level at the stage of writing this study.
Extorre Gold Mines Limited
Cerro Moro Gold – Silver Project
Preliminary Economic Assessment | Page 194 |
| 16.1 | Preliminary Mining Study |
This study is based on Cube’s November, 2011, mineral resource estimate for Cerro Moro which includes both Indicated and Inferred category mineral resources.
The reader is cautioned that the mining study is part of a preliminary economic assessment that is preliminary in nature and includes Inferred mineral resources that are considered too speculative geologically to have the economic considerations applied to them that would enable them to be categorized as mineral reserves. There is no certainty that the preliminary economic assessment will be realized. No Mineral Reserves have been estimated.
This study is categorised as a Preliminary Economic Assessment (PEA).
In general, Indicated mineral resources have been depleted as early as possible in the mining schedule and Inferred resources are depleted later in the Project life. The result of this is that the early years of the schedule contains predominantly Indicated resources while the final years are predominantly Inferred.
Two mining rates - 1,300 tpd (Option A) and 1,150 tpd (Option B) – were considered. Metal prices of US$ 1,320/oz for gold and US$ 26/oz for silver were used for estimating the mineral inventory.
Mining of the narrow, near-vertical gold-silver veins at Cerro Moro is expected to be undertaken using a combination of open pit and underground mining methods.
Cerro Moro open pits will be mined using conventional drill, blast, load and haul techniques. Equipment to be used includes; hydraulic top hammer drill rigs, hydraulic backhoe excavators and 50t mining trucks. Track and wheel dozers, front end loaders and graders will be used to support the operation.
On each bench waste rock will be mined first using backhoes and frontal end loaders to expose the full length of the mineralized veins. The mineral inventory will be mined in a single operation using smaller backhoe equipment to minimize the dilution and mineralization loss.
Maximum pit depth is approximately 110m with the depth of individual pits being determined by the formula described in detail in the study.
A modified bench and fill method will be employed to mine the Cerro Moro high-grade mineralized veins underground. Level spacing used is 16m resulting in a bench height of 12m. This ensures a high degree of accuracy in drilling and blasting of the narrow high grade vein structures, resulting in low dilution and mineral losses.
Extorre Gold Mines Limited
Cerro Moro Gold – Silver Project
Preliminary Economic Assessment | Page 195 |
The levels are accessed through inclined crosscuts connecting the mining horizon to a series of decline haulages, spaced at regular intervals along the mineralized structure. Waste developments are placed in the footwall of the almost vertical mineralized vein structures.
In the 1,300 tpd scenario, the mine development schedule commences with the development of three declines at Escondida Far West, Escondida Central and Zoe. This is followed closely by the commencement of open pit mining at Escondida and Esperanza-Nini. In the 1,150 tpd scenario, the mine development schedule commences with the development of two declines at Escondida Far West, Escondida Central (postponing the Zoe decline until Year 1). This is followed by the commencement of open pit mining at Escondida Far West and Escondida.
A general layout for the Project is shown in Figure 85, and Figure 86 corresponds to a detail of Escondida.
The total estimated mineral inventory in the open pits is 1.7 million tonnes averaging 6.01g/t gold and 347.6 g/t silver, with a strip ratio of 30.1 to 1. Underground mineral inventory is 2.3 million tonnes at an average grade of 7.55 g/t gold and 425.8 g/t silver. The summary by sector is shown in Table 60.
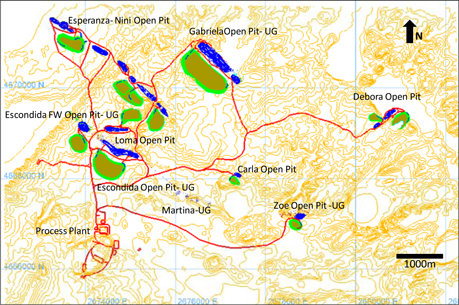
Figure 85 Conceptual Mine Development for Cerro Moro (Source: NCL, 2011)
Extorre Gold Mines Limited
Cerro Moro Gold – Silver Project
Preliminary Economic Assessment | Page 196 |

Figure 86 Conceptual Mine Development for Escondida (Source: NCL, 2011)
Extorre Gold Mines Limited
Cerro Moro Gold – Silver Project
Preliminary Economic Assessment | Page 197 |
| | | Mineral inventory | | | | | | | |
| Open Pit | | kt | | | Au g/t | | | Ag g/t | | | AuEq g/t (*) | | | Waste kt | | | Strip Ratio | |
| Escondida | | | 341 | | | | 18.68 | | | | 687.94 | | | | 32.43 | | | | 14,000 | | | | 41.02 | |
| Esperanza-Nini | | | 617 | | | | 2.89 | | | | 208.62 | | | | 7.06 | | | | 14,463 | | | | 23.43 | |
| Zoe | | | 68 | | | | 6.40 | | | | 873.16 | | | | 23.87 | | | | 1,742 | | | | 25.61 | |
| Gabriela | | | 516 | | | | 2.15 | | | | 311.76 | | | | 8.38 | | | | 19,913 | | | | 38.59 | |
| Debora | | | 191 | | | | 2.99 | | | | 68.46 | | | | 4.36 | | | | 1,990 | | | | 10.42 | |
| Carla | | | 14 | | | | 17.38 | | | | 762.28 | | | | 32.62 | | | | 543 | | | | 39.79 | |
| TOTAL | | | 1,747 | | | | 6.01 | | | | 347.57 | | | | 12.97 | | | | 52,652 | | | | 30.14 | |
| | | Mineral inventory | |
| Underground | | kt | | | Au g/t | | | Ag g/t | | | AuEq g/t (*) | |
| Escondida | | | 586 | | | | 10.64 | | | | 522.51 | | | | 21.09 | |
| Zoe | | | 802 | | | | 8.04 | | | | 580.56 | | | | 19.65 | |
| Martina | | | 290 | | | | 11.80 | | | | 51.74 | | | | 12.84 | |
| Gabriela | | | 610 | | | | 1.91 | | | | 307.05 | | | | 8.05 | |
| TOTAL | | | 2,288 | | | | 7.55 | | | | 425.82 | | | | 16.06 | |
| | | Mineral inventory | |
| TOTAL | | kt | | | Au g/t | | | Ag g/t | | | AuEq g/t (*) | |
| Escondida | | | 928 | | | | 13.59 | | | | 583.38 | | | | 25.26 | |
| Esperanza-Nini | | | 617 | | | | 2.89 | | | | 208.62 | | | | 7.06 | |
| Zoe | | | 870 | | | | 7.91 | | | | 603.42 | | | | 19.98 | |
| Gabriela | | | 1,126 | | | | 2.02 | | | | 309.21 | | | | 8.21 | |
| Debora | | | 191 | | | | 2.99 | | | | 68.46 | | | | 4.36 | |
| Carla | | | 14 | | | | 17.38 | | | | 762.28 | | | | 32.62 | |
| Martina | | | 290 | | | | 11.80 | | | | 51.74 | | | | 12.84 | |
| TOTAL | | | 4,035 | | | | 6.88 | | | | 391.94 | | | | 14.72 | |
(*) The gold equivalent value is calculated by dividing the silver (g/t / ounces) by 50 (approximate ratio of gold/silver US$ value) and adding it to the gold (g/t / ounces).
Table 60 Mineral Inventory Summary by Sector
Optimal interface between open pit and underground operations were determined using the Whittle Four-X optimization package. The optimization process considers that if a particular block can be mined by either above-ground methods or underground methods, then the value that is given to it during open pit optimization is the difference between its value when mined above-ground and its value when mined underground.
For example:
If a block is worth $1000 if mined by open pit and only $800 of mined from underground then:
If no underground mining takes place, the value of that block when used in the whittle optimization would be $1000.
Extorre Gold Mines Limited
Cerro Moro Gold – Silver Project
Preliminary Economic Assessment | Page 198 |
If underground mining is envisaged, only the premium gained by mining the block by open pit rather than underground methods is used in the optimization. In this case $1000 - $800 = $200.
When a combination of open pit and underground mining methods are applied to a mineralized zone the pit resulting in the greatest overall profit will be smaller than the pit if no underground mining takes place.
Pit optimization parameters shown in Table 61 were used for the Whittle Four-X and results shown in Table 62 were obtained.
| Item | | Unit | | | Escondida | | | Esperanza-
Nini | | | Zoe | | | Gabriela | | | Deborah-
Carla |
| OP mine cost | | | $/t | | | | 2.6 | | | | 2.6 | | | | 2.6 | | | | 2.6 | | | 2.6 |
| UG mine cost | | | $/t | | | | 45.9 | | | | 45.9 | | | | 45.9 | | | | 45.9 | | | 45.9 |
| Process Cost | | | $/t | | | | 58 | | | | 58 | | | | 58 | | | | 58 | | | 58 |
| G&A | | | $/t | | | | 20 | | | | 20 | | | | 20 | | | | 20 | | | 20 |
| Selling Au | | | $/oz | | | | 5 | | | | 5 | | | | 5 | | | | 5 | | | 5 |
| Selling Ag | | | $/oz | | | | 1 | | | | 1 | | | | 1 | | | | 1 | | | 1 |
| Recovery Au | | | % | | | | 95.0 | | | | 95.0 | | | | 95.0 | | | | 95.0 | | | 95.0 |
| Recovery Ag | | | % | | | | 92.5 | | | | 92.5 | | | | 92.5 | | | | 92.5 | | | 92.5 |
| Au Price | | | $/oz | | | | 1320 | | | | 1320 | | | | 1320 | | | | 1320 | | | 1320 |
| Ag Price | | | $/oz | | | | 26 | | | | 26 | | | | 26 | | | | 26 | | | 26 |
| Royalty % of revenue | | | % | | | | 6 | | | | 6 | | | | 6 | | | | 6 | | | 6 |
| Royalty % of net profit | | | % | | | | 3 | | | | 3 | | | | 3 | | | | 3 | | | 3 |
| Royalty %NSR | | | % | | | | 2 | | | | 2 | | | | 2 | | | | 2 | | | 2 |
| IR Slope angle | | | ° | | | | 65/68 | | | | 68 | | | | 65 | | | | 68 | | | 68 |
(*) Au eq: Gold equivalent value is calculated by dividing the silver (g/t / ounces) by 50 (approximate ratio of gold/silver US$ value) and adding it to the gold (g/t / ounces).
Table 61 Pit Optimization Parameters
| Whittle Four-X | | Mineral inventory | | | Waste | | | Mineralized+ | | | Strip | | | Contained Ounces | |
| Results | | kt | | | Au g/t | | | Ag g/t | | | kt | | | Waste kt | | | Ratio | | | Au koz | | | Ag koz | |
| Escondida | | | 386 | | | | 19.3 | | | | 743.0 | | | | 13,710 | | | | 14,096 | | | | 35.5 | | | | 240 | | | | 9,217 | |
| Esperanza-Nini | | | 607 | | | | 3.0 | | | | 218.9 | | | | 14,990 | | | | 15,597 | | | | 24.7 | | | | 59 | | | | 4,270 | |
| Zoe | | | 104 | | | | 13.9 | | | | 1588.7 | | | | 3,827 | | | | 3,931 | | | | 36.9 | | | | 46 | | | | 5,304 | |
| Gabriela | | | 433 | | | | 2.2 | | | | 324.8 | | | | 14,696 | | | | 15,129 | | | | 34.0 | | | | 31 | | | | 4,520 | |
| Deborah | | | 198 | | | | 3.0 | | | | 68.7 | | | | 1,775 | | | | 1,973 | | | | 9.0 | | | | 19 | | | | 438 | |
| Carla | | | 14 | | | | 18.2 | | | | 791.4 | | | | 456 | | | | 470 | | | | 33.7 | | | | 8 | | | | 345 | |
| Total | | | 1,741 | | | | 7.2 | | | | 430.5 | | | | 49,453 | | | | 51,194 | | | | 28.4 | | | | 404 | | | | 24,094 | |
Table 62 Pit Optimization Results
Extorre Gold Mines Limited
Cerro Moro Gold – Silver Project
Preliminary Economic Assessment | Page 199 |
Ultimately the selection of the Whittle pit shells used in the mine design was a combination of classical open pit optimization and the open pit/underground approach described above. This was done in order to balance the need for feed to the plant against the time required to develop the underground mines.
The optimized pit-shells obtained above, were developed into operational pit designs by the addition of 12m wide access ramps and a longitudinal slot in the pit bottom (this maximizes the recovery of mineralization from the final bench). The ramps result in a significant increase in the strip ratios compared to the optimized shells.
Table 63 summarized the open pit tonnages and grades by sector and Figure 87 through Figure 90 show those designs, including waste storage areas
| | | Mineral inventory | | | | | | | |
| Open Pit | | kt | | | Au g/t | | | Ag g/t | | | AuEq g/t
(*) | | | Waste kt | | | Strip
Ratio | |
| Escondida | | | 341 | | | | 18.7 | | | | 687.9 | | | | 32.4 | | | | 14,000 | | | | 41.0 | |
| Esperanza-Nini | | | 617 | | | | 2.9 | | | | 208.6 | | | | 7.1 | | | | 14,463 | | | | 23.4 | |
| Zoe | | | 68 | | | | 6.4 | | | | 873.2 | | | | 23.9 | | | | 1,742 | | | | 25.6 | |
| Gabriela | | | 516 | | | | 2.1 | | | | 311.8 | | | | 8.4 | | | | 19,913 | | | | 38.6 | |
| Deborah | | | 191 | | | | 3.0 | | | | 68.5 | | | | 4.4 | | | | 1,990 | | | | 10.4 | |
| Carla | | | 14 | | | | 17.4 | | | | 762.3 | | | | 32.6 | | | | 543 | | | | 39.8 | |
| Total | | | 1,747 | | | | 6.0 | | | | 347.6 | | | | 13.0 | | | | 52,652 | | | | 30.1 | |
(*) The gold equivalent value is calculated by dividing the silver (g/t / ounces) by 50 (approximate ratio of gold/silver US$ value) and adding it to the gold (g/t / ounces).
The reader is cautioned that the mining study is part of a preliminary economic assessment that is preliminary in nature and includes Inferred mineral resources that are considered too speculative geologically to have the economic considerations applied to them that would enable them to be categorized as mineral reserves. There is no certainty that the preliminary economic assessment will be realized. No Mineral Reserves have been estimated.
Table 63 Final Pits Summary

Figure 87 Escondida Open Pits (Source: NCL, 2011)
Extorre Gold Mines Limited
Cerro Moro Gold – Silver Project
Preliminary Economic Assessment | Page 200 |
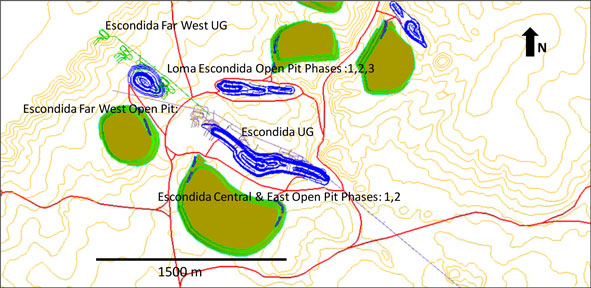
Figure 88 Gabriela Open Pits (Source: NCL, 2011)
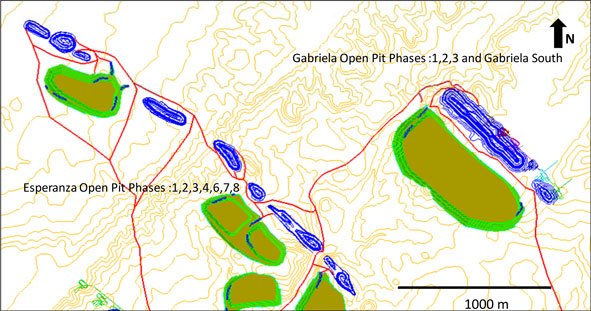
Figure 89 Nini-Esperanza Open Pits (Source: NCL, 2011)
Extorre Gold Mines Limited
Cerro Moro Gold – Silver Project
Preliminary Economic Assessment | Page 201 |

Figure 90 Deborah Open Pits (Source: NCL, 2011)
The most common mining methods employed in mechanized (steep dipping) narrow vein deposits are either open stoping with pillars or cut and fill (normally employed where the mineralization is high grade or the ground is unstable).
The method finally adopted for Cerro Moro is a modified bench and fill design agreed between NCL and Extorre.
Geotechnical input from Extorre’s geotechnical consultants (AKL) was used in the design of the mining method and AKL have approved the final layouts used in this report.
The main reasons for the adopting this mining method are:
| · | The mineralized veins are subvertical and average 1.5m in width. Mineralization is high grade to very high grade and maximum extraction is desirable. |
| · | Veins are narrow and typically undulate on dip and strike necessitating very accurate drilling and blasting to minimize dilution and loss of mineralization. |
| · | There is a substantial amount of waste development associated with mechanized mining of narrow vein deposits. This waste is most suitable for back-filling the stopes and in so doing reduces the cost of transporting it to surface and stockpiling it. |
| · | Geotechnical knowledge is currently limited to (geotechnical) logging of all exploration drill core. |
| · | Experience at other mines with similar deposits. |
Extorre Gold Mines Limited
Cerro Moro Gold – Silver Project
Preliminary Economic Assessment | Page 202 |
Description of the bench and fill method to be used at Cerro Moro:
| · | The mineralized horizon will be accessed from surface using 4 x 4.5 m decline haulages inclined at 14% from the horizontal. |
| · | At 300 m intervals along strike spiral ramps (4m x 4.5m inclined at 14%) will be developed off the decline. These ramps will be driven up/down the full height of the mining horizon. |
| · | Each spiral ramp will be provided with a raise-bore vent rise to surface. The rises will have a surface mounted 200KW exhaust fans which will extract spent air from the stoping horizon. |
| · | At 24m intervals (vertically), a pair of (4m x4m) inclined crosscuts (one up one down) will be driven from the ramps to intersect the mineralized body. |
| · | From this intersection point, (4m x 4m) drives will be developed in both directions along the mineralized zone, effectively dividing the mineralized horizon into 12m high slices. |
| · | The drives will be developed using a resue technique in which the mineralized vein (exposed in the development face) is removed first and then the surrounding waste blasted and mucked separately. |
| · | Since the material used to back-fill the stopes is uncemented waste rock, this will be a bottom-up mining method. In order to increase the face availability, the mining horizon will be divided into an upper and lower zone by a horizontal concrete pillar. This pillar will be constructed in the lowest drive of the upper mining zone and will provide a safe hangingwall for the topmost stope in the lower zone. |
| · | Once the two lowest drifts in each mining zone are completed benching starts from the furthest point, working back to the access crosscut. |
| · | Benching commences with a slot raise joining the two drives and creating the first breaking face. |
| · | The stopes are drilled (down) from the upper drive, using rubber-tyred long-hole drill rigs equipped with automated carousels and hydraulic DTH drifters. The rigs are remotely controlled by an operator standing close to the drill head. |
| · | The mineralized veins are fully mapped on both levels and modelled in 3D. The drill holes are individually laid out to ensure that all the mineralization is extracted with as little dilution as possible. |
| · | At the drill site the operator marks off each hole individually. When the holes are completed they are surveyed (top and bottom) and any misaligned holes are redrilled. |
| · | Blasting is by conventional explosives initiated by electronic detonators (to guarantee very precise timing). |
| · | Mucking will be carried out using remote control 3.5 yd3 LHDs. The mineral inventory is trammed to a centralized stockpile (at the drive – crosscut intersection) for on-loading into 30t underground trucks. |
Extorre Gold Mines Limited
Cerro Moro Gold – Silver Project
Preliminary Economic Assessment | Page 203 |
| · | Periodically, (determined by current geotech conditions) a cemented plug is inserted in the stope and the mined out area behind the plug is backfilled from the upper drive with waste material derived from development. A new slot is developed and stoping continues. |
| · | Once the lowest level is mined out, the fill is levelled and capped with an impermeable layer and a new mining cycle begins in the drive above. A new cycle starts when the stope is completely filled. |

Figure 91 Mining Method – Bench & Fill (Source: NCL, 2011)
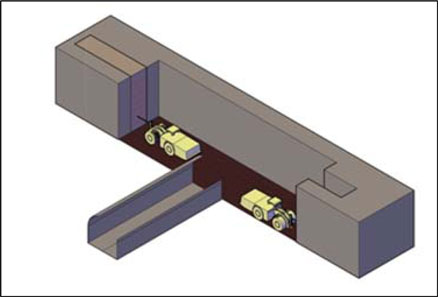
Figure 92 Bench & Fill – Split Blasting (Source: NCL, 2011)
Extorre Gold Mines Limited
Cerro Moro Gold – Silver Project
Preliminary Economic Assessment | Page 204 |
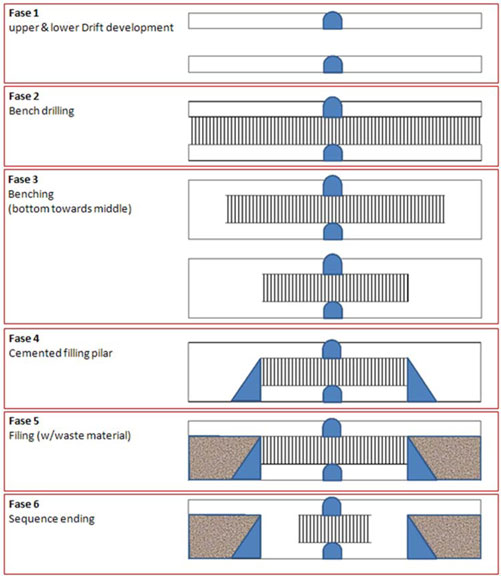
Figure 93 Bench & Fill - Sequence (Source: NCL, 2011)
Open Pit
On each bench waste will be completely mined from one side of the mineralized vein. Careful presplitting will ensure the vein is left intact during this operation. Once the waste has been completely mucked out, the vein will be blasted using carefully controlled techniques and once again, presplitting will ensure separation from the remaining waste rock. Small backhoe excavators will be used to load the mineral inventory, providing accurate separation of the mineral inventory. Once this is completed the remaining waste will be mined from the bench.
Extorre Gold Mines Limited
Cerro Moro Gold – Silver Project
Preliminary Economic Assessment | Page 205 |
Underground
Cerro Moro’s extensive geotechnical database (including photographs of all mineralized intersections) shows that the rockmass surrounding the mineralized veins is substantially competent and free from any major discontinuities. This should result in very stable hanging and footwall conditions around the stope openings. Conservative mining rates and short bench heights will allow accurate blast-hole drill planning and execution. This should result in minimal unplanned dilution in the stoping operation.
| Mining Unit | | Over-breaking by side (m) |
| Open pit Bench | | 0.3 |
| Drift Split Blast | | 0.3 |
| Underground Bench | | 0.4 |
Table 64 Dilution Criteria
Vein widths were calculated perpendicular to a “best-fit” incline section for each vein. Average values were applied by zone, according to Figure 94. Dilution grade was considered as 0.0 g/t which is a conservative approach, future estimates should apply the block model grades.

Figure 94 Underground Dilution Estimation (Source: NCL, 2011)
Extorre Gold Mines Limited
Cerro Moro Gold – Silver Project
Preliminary Economic Assessment | Page 206 |
Cut-off grades have been estimated using the following formula:
COG = Cm+ Cp+ G&A
(PAu — Cs ) × RAu
Where:
| | · | Cm: | Mining Cost |
| | · | Cp: | Process Cost |
| | · | G&A: | General and Administration Cost |
| | · | Pau: | Gold Price |
| | · | Cs: | Selling Cost |
| | · | Rau: | Gold recovery |
Cut-off grades values for open pit mining are:
| · | 2.1 g/t of AuEq4 for economic |
Cut-off grades values for underground mining are:
| · | 3.4 g/t of AuEq for economic |
| · | 2.1 g/t of AuEq for marginal (without mining operation cost) |
| 16.1.6 | Underground Mining Inventory |
In order to determine the mining inventory at Cerro Moro, the Indicated and Inferred mineral resources were divided into mining units. Mining units that were determined to produce a positive value when mined, were included into the mining inventory
The criteria used in determining the size of mining units is generally grade variability and mining method.
The mining units used for this study are one mining level high (16m) and 20 m long (on strike). The width of each mining unit is determined individually by adding dilution to the (Indicated or Inferred) resource width with a minimum width of 1 m.
The volume, contained tonnage and grade (Au and Ag) for each mining unit were calculated.
Mining units with a grade greater than the cutoff grade are selected for initial consideration.
In order to be worth mining, mining units must support the cost of the drives directly associated with mining it. For this study this cost was estimated at US$ 40.00 per cubic metre.
4(*) The gold equivalent value (AuEq) is calculated by dividing the silver (g/t / ounces) by 50 (approximate ratio of gold/silver US$ value) and adding it to the gold (g/t / ounces).
Extorre Gold Mines Limited
Cerro Moro Gold – Silver Project
Preliminary Economic Assessment | Page 207 |
The selected mining inits were tested against these criteria and those still returning a positive value were included into the mining inventory.
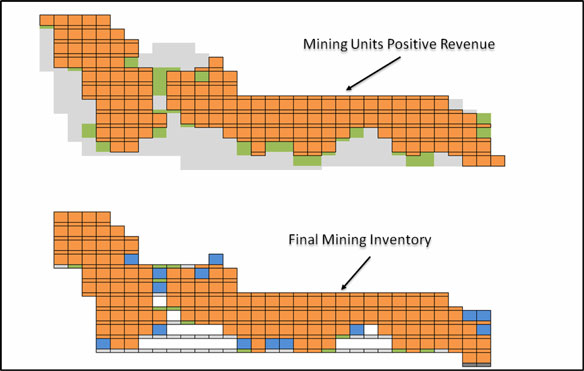
Figure 95 Escondida West Mine Resources – Vertical Section
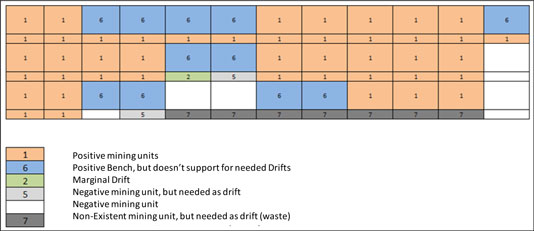
Figure 96 Positive and Negative Mining Units (Source: NCL, 2011)
Table 65 summarized the underground mining inventory by sector. The total inventory is 2.3 million tonnes at an average grade of 7.55 g/t gold and 425.8 g/t silver.
Extorre Gold Mines Limited
Cerro Moro Gold – Silver Project
Preliminary Economic Assessment | Page 208 |
| | | Mineral Inventory | |
| Underground | | kt | | | Au g/t | | | Ag g/t | | | AuEq g/t (*) | |
| Escondida | | | 586 | | | | 10.64 | | | | 522.51 | | | | 21.09 | |
| Zoe | | | 802 | | | | 8.04 | | | | 580.56 | | | | 19.65 | |
| Martina | | | 290 | | | | 11.80 | | | | 51.74 | | | | 12.84 | |
| Gabriela | | | 610 | | | | 1.91 | | | | 307.05 | | | | 8.05 | |
| TOTAL | | | 2,288 | | | | 7.55 | | | | 425.82 | | | | 16.06 | |
(*) The gold equivalent value is calculated by dividing the silver (g/t / ounces) by 50 (approximate ratio of gold/silver US$ value) and adding it to the gold (g/t / ounces).
The reader is cautioned that the mining study is part of a preliminary economic assessment that is preliminary in nature and includes Inferred mineral resources that are considered too speculative geologically to have the economic considerations applied to them that would enable them to be categorized as mineral reserves. There is no certainty that the preliminary economic assessment will be realized. No Mineral Reserves have been estimated.
Table 65 Underground Mining Inventory Summary
Figure 97 to Figure 100 show schematic 3D layouts of the required underground developments.

Figure 97 Escondida Schematic Underground Layout (Source: NCL, 2011)
Extorre Gold Mines Limited
Cerro Moro Gold – Silver Project
Preliminary Economic Assessment | Page 209 |
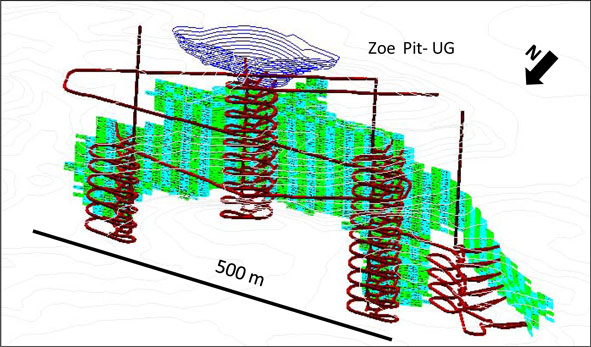
Figure 98 Zoe Schematic Underground Layout (Source: NCL, 2011)
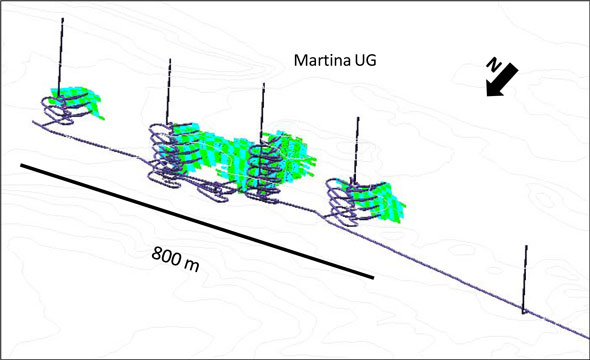
Figure 99 Martina Schematic Underground Layout (Source: NCL, 2011)
Extorre Gold Mines Limited
Cerro Moro Gold – Silver Project
Preliminary Economic Assessment | Page 210 |
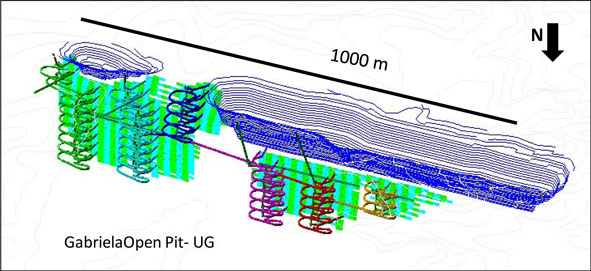
Figure 100 Gabriela Schematic Underground Layout (Source: NCL, 2011)
| 16.1.7 | Mine Production Schedule |
Combined open pit and underground mine production schedules for 1,300 tpd and 1,150 tpd plant throughputs were developed, showing mineralized tonnes and grades, waste tonnes and total movement of material by year for the life of the mine. The distribution of mineralization and waste contained in each of the open pit and underground mining phases was used to develop the schedule, thus assuring that criteria such as adequate mineralization exposure, mining accessibility, and consistent material movement were met.
NCL used an in-house system to evaluate several potential production schedules. Annual tonnes milled and (user specified) total annual material movement are entered into the algorithm, which then calculates a mine schedule. Several runs using different total material movement schedules and operating cut-off grades were carried out to determine the most efficient production schedule strategy. It is important to note that this program is not a simulation package, but a tool for calculating mine schedule and haulage profiles for a given set of phases and constraints that must be set by the user.
Careful grade control will be required during the mining operation to minimize losses due to the inclination of the mineralized body. Grade control efforts will require taking advantage of all the experience of selective mining to assure the mineralization classes are properly selected and processed. These efforts should include the following standard procedures:
Thorough and aggressive grade control measures will be required to minimize dilution and mineralization losses. Mining on surface and underground will be highly selective, requiring the following grade control procedures as standard practice.
| § | Implement a comprehensive and systematic program of sampling, mapping, laboratory analyses, and reporting. |
Extorre Gold Mines Limited
Cerro Moro Gold – Silver Project
Preliminary Economic Assessment | Page 211 |
| § | Utilise specialised in-pit, bench sampling drills for sampling well ahead of production drilling and blasting. |
| § | Use small backhoe excavators and benches no higher than 5 m (as presently planned) to selectively mine mineralized zones. |
| § | Maintain high quality laboratory staff, equipment, and procedures to provide accurate and timely assay reporting. |
| § | Use trained and experienced geologists and technicians working with excavator operators (on all shifts), to identify, mark, and selectively mine the open pits. |
| § | Carefully map and sample the veins in all the backs and headings underground, in order to clearly define the mineralized and minimize dilution. |
| 16.1.7.1 | Mine Schedule at 1,300 tpd (Option A) |
The mining plan envisages simultaneous mining of the open pits and underground mines. Underground mining operations will commence at Escondida Far West, Escondida and Zoe; and progressively include Martina and Gabriela. The open pits will commence also at Escondida, followed by Nini-Esperanza and Gabriela; and finally by Deborah and Carla.
The general mining sequence is graphically shown in Table 66.
| | Year -2 | Year -1 | Year 1 | Year 2 | Year 3 | Year 4 | Year 5 | Year 6 | Year 7 | Year 8 | Year 9 | Total |
| Mine Plan | Kton | Kton | Kton | Kton | Kton | Kton | Kton | Kton | Kton | Kton | Kton | Kton |
| Open Pit | | | | | | | | | | | | |
| EFW | | | | | 48 | 11 | | | | | | 59 |
| ESC | | | 83 | 68 | | 22 | 43 | 8 | | | | 224 |
| LOM | | | | 34 | 11 | 13 | | | | | | 58 |
| ZOE | | | | | | 4 | 62 | 2 | | | | 68 |
| GAB | | | | 64 | 135 | 52 | 27 | 27 | 96 | 75 | 42 | 516 |
| ESP-NIN | | | 127 | | | | 71 | 137 | 103 | 135 | 45 | 617 |
| CAR | | | | | | | | | | | 14 | 14 |
| DEB | | | | | | | | | | 2 | 189 | 191 |
| Subtotal Open Pit | | | 211 | 167 | 194 | 101 | 203 | 173 | 199 | 211 | 289 | 1747 |
| | | | | | | | | | | | | |
| Underground | | | | | | | | | | | | |
| EFW | | 25 | 113 | 100 | 61 | 30 | 15 | 4 | | | | 347 |
| ESC | | 2 | 36 | 51 | 58 | 68 | 18 | 5 | | | | 239 |
| ZOE | | | 30 | 120 | 143 | 128 | 143 | 95 | 89 | 53 | 3 | 802 |
| MAR | | | | | 45 | 96 | 86 | 54 | 8 | 2 | | 290 |
| GAB | | | | 16 | 66 | 84 | 117 | 114 | 90 | 79 | 45 | 610 |
| Subtotal Underground | | 27 | 179 | 286 | 372 | 405 | 379 | 272 | 187 | 133 | 47 | 2288 |
| | | | | | | | | | | | | |
| Total | | 27 | 389 | 453 | 566 | 507 | 582 | 445 | 386 | 344 | 337 | 4035 |
Table 66 General Mining Sequence (1,300 tpd)
Extorre Gold Mines Limited
Cerro Moro Gold – Silver Project
Preliminary Economic Assessment | Page 212 |
The detailed mine production schedule by sector is shown in Table 67.
The plant feed is a result of a combination between what is mined from the underground mine, open pit mine and re-handling from the stockpile; and it is shown in Table 68.
| | | | | | | Year -1 | | Year 1 | | Year 2 | | Year 3 | | Year 4 | | Year 5 | | Year 6 | | Year 7 | | Year 8 | | Year 9 | | Total |
| | | Escondida | | kt | | | | 3 635 | | 3 313 | | 2 328 | | 2 338 | | 2 308 | | 78 | | | | | | | | 14 000 |
| | | Esperanza-Nini | | kt | | | | 1 088 | | | | | | | | 2 312 | | 3 590 | | 3 449 | | 3 475 | | 549 | | 14 463 |
| | | Zoe | | kt | | | | | | | | | | 434 | | 1 301 | | 7 | | | | | | | | 1 742 |
| Waste | | Gabriela | | kt | | | | | | 2 961 | | 4 797 | | 641 | | 1 040 | | 2 407 | | 3 535 | | 3 538 | | 996 | | 19 913 |
| | | Deborah | | kt | | | | | | | | | | | | | | | | | | 61 | | 1 929 | | 1 990 |
| | | Carla | | kt | | | | | | | | | | | | | | | | | | | | 543 | | 543 |
| | | Total | | kt | | | | 4 723 | | 6 273 | | 7 125 | | 3 413 | | 6 961 | | 6 081 | | 6 984 | | 7 073 | | 4 018 | | 52 652 |
| | | Escondida | | kt | | | | 83 | | 103 | | 59 | | 45 | | 43 | | 8 | | | | | | | | 341 |
| | | | | Au g/t | | | | 18.9 | | 17.4 | | 21.1 | | 23.0 | | 14.1 | | 14.4 | | | | | | | | 18.7 |
| | | | | Ag g/t | | | | 440.5 | | 506.1 | | 1321.4 | | 1065.8 | | 412.3 | | 259.8 | | | | | | | | 687.9 |
| | | Esperanza-Nini | | kt | | | | 127 | | | | | | | | 71 | | 137 | | 103 | | 135 | | 45 | | 617 |
| | | | | Au g/t | | | | 1.5 | | | | | | | | 3.0 | | 2.7 | | 3.4 | | 3.4 | | 4.7 | | 2.9 |
| | | | | Ag g/t | | | | 132.7 | | | | | | | | 202.3 | | 223.6 | | 262.5 | | 230.9 | | 196.6 | | 208.6 |
| | | Zoe | | kt | | | | | | | | | | 4 | | 62 | | 2 | | | | | | | | 68 |
| | | | | Au g/t | | | | | | | | | | 6.0 | | 6.1 | | 15.4 | | | | | | | | 6.4 |
| | | | | Ag g/t | | | | | | | | | | 781.1 | | 849.4 | | 1751.3 | | | | | | | | 873.2 |
| Open Pit | | Martina | | kt | | | | | | | | | | | | | | | | | | | | | | |
| Mineral | | | | Au g/t | | | | | | | | | | | | | | | | | | | | | | |
| Inventory | | | | Ag g/t | | | | | | | | | | | | | | | | | | | | | | |
| | | Gabriela | | kt | | | | | | 64 | | 135 | | 52 | | 27 | | 27 | | 96 | | 75 | | 42 | | 516 |
| | | | | Au g/t | | | | | | 1.8 | | 2.5 | | 2.1 | | 4.2 | | 1.8 | | 2.1 | | 1.8 | | 1.1 | | 2.1 |
| | | | | Ag g/t | | | | | | 240.0 | | 383.8 | | 339.1 | | 654.6 | | 244.1 | | 290.8 | | 244.6 | | 147.4 | | 311.8 |
| | | Deborah | | kt | | | | | | | | | | | | | | | | | | 2 | | 189 | | 191 |
| | | | | Au g/t | | | | | | | | | | | | | | | | | | 2.6 | | 3.0 | | 3.0 |
| | | | | Ag g/t | | | | | | | | | | | | | | | | | | 60.1 | | 68.5 | | 68.5 |
| | | Carla | | kt | | | | | | | | | | | | | | | | | | | | 14 | | 14 |
| | | | | Au g/t | | | | | | | | | | | | | | | | | | | | 17.4 | | 17.4 |
| | | | | Ag g/t | | | | | | | | | | | | | | | | | | | | 762.3 | | 762.3 |
| | | TOTAL | | kt | | | | 211 | | 167 | | 194 | | 101 | | 203 | | 173 | | 199 | | 211 | | 289 | | 1 747 |
| | | | | Au g/t | | | | 8.4 | | 11.4 | | 8.2 | | 11.6 | | 6.5 | | 3.2 | | 2.8 | | 2.9 | | 3.7 | | 6.0 |
| | | | | Ag g/t | | | | 254.7 | | 403.8 | | 669.3 | | 682.9 | | 504.4 | | 246.9 | | 276.1 | | 234.5 | | 132.4 | | 347.6 |
| | | Escondida | | kt | | | | 3 718 | | 3 415 | | 2 387 | | 2 384 | | 2 351 | | 86 | | | | | | | | 14 341 |
| | | Esperanza-Nini | | kt | | | | 1 215 | | | | | | | | 2 383 | | 3 727 | | 3 553 | | 3 609 | | 594 | | 15 081 |
| | | Zoe | | kt | | | | | | | | | | 438 | | 1 363 | | 9 | | | | | | | | 1 810 |
| Total Open | | Gabriela | | kt | | | | | | 3 025 | | 4 932 | | 692 | | 1 066 | | 2 434 | | 3 630 | | 3 612 | | 1 038 | | 20 429 |
| Pit Material | | Deborah | | kt | | | | | | | | | | | | | | | | | | 63 | | 2 119 | | 2 181 |
| | | Carla | | kt | | | | | | | | | | | | | | | | | | | | 557 | | 557 |
| | | Total | | kt | | | | 4 933 | | 6 440 | | 7 319 | | 3 514 | | 7 163 | | 6 255 | | 7 183 | | 7 284 | | 4 307 | | 54 399 |
| Open Pit Strip Ratio (Mineral inventory / Waste) | | | | 22.4 | | 37.7 | | 36.8 | | 33.7 | | 34.4 | | 35.1 | | 35.1 | | 33.5 | | 13.9 | | 30.1 |
Table 67 Mine Production Schedule (1,300 tpd)
Extorre Gold Mines Limited
Cerro Moro Gold – Silver Project
Preliminary Economic Assessment | Page 213 |
Continue - Table 67
| | | | | | | Year -1 | | Year 1 | | Year 2 | | Year 3 | | Year 4 | | Year 5 | | Year 6 | | Year 7 | | Year 8 | | Year 9 | | Total |
| | | Escondida | | kt | | 27 | | 149 | | 150 | | 118 | | 98 | | 34 | | 10 | | | | | | | | 586 |
| | | | | Au g/t | | 19.6 | | 12.7 | | 8.5 | | 10.3 | | 8.8 | | 11.3 | | 7.6 | | | | | | | | 10.6 |
| | | | | Ag g/t | | 1202.4 | | 710.3 | | 418.3 | | 420.0 | | 368.0 | | 454.8 | | 406.8 | | | | | | | | 522.5 |
| | | Esperanza Nini | | kt | | | | | | | | | | | | | | | | | | | | | | |
| | | | | Au g/t | | | | | | | | | | | | | | | | | | | | | | |
| | | | | Ag g/t | | | | | | | | | | | | | | | | | | | | | | |
| | | Zoe | | kt | | | | 30 | | 120 | | 143 | | 128 | | 143 | | 95 | | 89 | | 53 | | 3 | | 802 |
| | | | | Au g/t | | | | 9.7 | | 7.4 | | 7.3 | | 8.5 | | 7.9 | | 9.7 | | 9.1 | | 4.9 | | 6.3 | | 8.0 |
| | | | | Ag g/t | | | | 914.4 | | 648.2 | | 475.9 | | 574.4 | | 530.1 | | 661.8 | | 737.5 | | 286.2 | | 159.5 | | 580.6 |
| | | Martina | | kt | | | | | | | | 45 | | 96 | | 86 | | 54 | | 8 | | 2 | | | | 290 |
| Underground | | | | Au g/t | | | | | | | | 9.0 | | 14.1 | | 12.3 | | 10.0 | | 7.3 | | 7.0 | | | | 11.8 |
| | | | | Ag g/t | | | | | | | | 52.6 | | 61.5 | | 48.7 | | 41.3 | | 36.2 | | 34.1 | | | | 51.7 |
| | | Gabriela | | kt | | | | | | 16 | | 66 | | 84 | | 117 | | 114 | | 90 | | 79 | | 45 | | 610 |
| | | | | Au g/t | | | | | | 2.6 | | 2.1 | | 2.2 | | 1.5 | | 1.5 | | 2.0 | | 2.6 | | 1.6 | | 1.9 |
| | | | | Ag g/t | | | | | | 401.3 | | 336.1 | | 364.0 | | 246.0 | | 241.6 | | 317.4 | | 403.9 | | 261.4 | | 307.1 |
| | | Deborah | | kt | | | | | | | | | | | | | | | | | | | | | | |
| | | | | Au g/t | | | | | | | | | | | | | | | | | | | | | | |
| | | | | Ag g/t | | | | | | | | | | | | | | | | | | | | | | |
| | | Carla | | kt | | | | | | | | | | | | | | | | | | | | | | |
| | | | | Au g/t | | | | | | | | | | | | | | | | | | | | | | |
| | �� | | | Ag g/t | | | | | | | | | | | | | | | | | | | | | | |
| | | TOTAL | | kt | | 27 | | 179 | | 286 | | 372 | | 405 | | 379 | | 272 | | 187 | | 133 | | 47 | | 2 288 |
| | | | | Au g/t | | 19.6 | | 12.2 | | 7.7 | | 7.6 | | 8.6 | | 7.2 | | 6.2 | | 5.6 | | 3.6 | | 1.9 | | 7.5 |
| | | | | Ag g/t | | 1202.4 | | 744.3 | | 513.9 | | 382.0 | | 360.1 | | 326.9 | | 354.1 | | 504.3 | | 352.5 | | 255.2 | | 425.8 |
Continue - Table 67
| | | | | | | Year -1 | | Year 1 | | Year 2 | | Year 3 | | Year 4 | | Year 5 | | Year 6 | | Year 7 | | Year 8 | | Year 9 | | Total |
| | | Escondida | | kt | | 27 | | 232 | | 253 | | 177 | | 144 | | 77 | | 17 | | | | | | | | 928 |
| | | | | Au g/t | | 19.6 | | 14.9 | | 12.1 | | 13.9 | | 13.3 | | 12.9 | | 10.6 | | | | | | | | 13.6 |
| | | | | Ag g/t | | 1202.4 | | 613.4 | | 453.9 | | 719.6 | | 588.5 | | 430.8 | | 342.5 | | | | | | | | 583.4 |
| | | Esperanza Nini | | kt | | | | 127 | | | | | | | | 71 | | 137 | | 103 | | 135 | | 45 | | 617 |
| | | | | Au g/t | | | | 1.5 | | | | | | | | 3.0 | | 2.7 | | 3.4 | | 3.4 | | 4.7 | | 2.9 |
| | | | | Ag g/t | | | | 132.7 | | | | | | | | 202.3 | | 223.6 | | 262.5 | | 230.9 | | 196.6 | | 208.6 |
| | | Zoe | | kt | | | | 30 | | 120 | | 143 | | 132 | | 205 | | 97 | | 89 | | 53 | | 3 | | 870 |
| | | | | Au g/t | | | | 9.7 | | 7.4 | | 7.3 | | 8.4 | | 7.4 | | 9.9 | | 9.1 | | 4.9 | | 6.3 | | 7.9 |
| | | | | Ag g/t | | | | 914.4 | | 648.2 | | 475.9 | | 580.8 | | 626.6 | | 685.6 | | 737.5 | | 286.2 | | 159.5 | | 603.4 |
| | | Martina | | kt | | | | | | | | 45 | | 96 | | 86 | | 54 | | 8 | | 2 | | | | 290 |
| Combined | | | | Au g/t | | | | | | | | 9.0 | | 14.1 | | 12.3 | | 10.0 | | 7.3 | | 7.0 | | | | 11.8 |
| Open Pit / | | | | Ag g/t | | | | | | | | 52.6 | | 61.5 | | 48.7 | | 41.3 | | 36.2 | | 34.1 | | | | 51.7 |
| Underground | | Gabriela | | kt | | | | | | 80 | | 200 | | 135 | | 144 | | 141 | | 185 | | 153 | | 86 | | 1 126 |
| Mine Plan | | | | Au g/t | | | | | | 2.0 | | 2.4 | | 2.2 | | 2.0 | | 1.5 | | 2.1 | | 2.2 | | 1.4 | | 2.0 |
| | | | | Ag g/t | | | | | | 272.0 | | 368.2 | | 354.5 | | 321.8 | | 242.1 | | 303.7 | | 326.2 | | 206.3 | | 309.2 |
| | | Deborah | | kt | | | | | | | | | | | | | | | | | | 2 | | 189 | | 191 |
| | | | | Au g/t | | | | | | | | | | | | | | | | | | 2.6 | | 3.0 | | 3.0 |
| | | | | Ag g/t | | | | | | | | | | | | | | | | | | 60.1 | | 68.5 | | 68.5 |
| | | Carla | | kt | | | | | | | | | | | | | | �� | | | | | | 14 | | 14 |
| | | | | Au g/t | | | | | | | | | | | | | | | | | | | | 17.4 | | 17.4 |
| | | | | Ag g/t | | | | | | | | | | | | | | | | | | | | 762.3 | | 762.3 |
| | | TOTAL | | kt | | 27 | | 389 | | 453 | | 566 | | 507 | | 582 | | 445 | | 386 | | 344 | | 337 | | 4 035 |
| | | | | Au g/t | | 19.6 | | 10.1 | | 9.1 | | 7.8 | | 9.2 | | 7.0 | | 5.1 | | 4.1 | | 3.1 | | 3.4 | | 6.9 |
| | | | | Ag g/t | | 1202.4 | | 479.5 | | 473.4 | | 480.3 | | 424.6 | | 388.7 | | 312.4 | | 386.6 | | 280.2 | | 149.7 | | 391.9 |
Extorre Gold Mines Limited
Cerro Moro Gold – Silver Project
Preliminary Economic Assessment | Page 214 |
| | | | | | | Year -1 | | Year 1 | | Year 2 | | Year 3 | | Year 4 | | Year 5 | | Year 6 | | Year 7 | | Year 8 | | Year 9 | | TOTAL |
| | | Mineral inventory | | kt | | | | 211 | | 167 | | 194 | | 101 | | 203 | | 173 | | 199 | | 211 | | 289 | | 1,747 |
| | | Gold | | Au g/t | | | | 8.39 | | 11.43 | | 8.15 | | 11.65 | | 6.46 | | 3.22 | | 2.78 | | 2.85 | | 3.65 | | 6.01 |
| | | Silver | | Ag g/t | | | | 254.7 | | 403.8 | | 669.3 | | 682.9 | | 504.4 | | 246.9 | | 276.1 | | 234.5 | | 132.4 | | 347.6 |
| Open Pit | | Contained Gold | | koz | | | | 57 | | 61 | | 51 | | 38 | | 42 | | 18 | | 18 | | 19 | | 34 | | 338 |
| Mining | | Contained Silver | | koz | | | | 1724 | | 2163 | | 4166 | | 2221 | | 3285 | | 1377 | | 1767 | | 1590 | | 1232 | | 19,524 |
| | | Waste | | kt | | | | 4723 | | 6273 | | 7125 | | 3413 | | 6961 | | 6081 | | 6984 | | 7073 | | 4018 | | 52,652 |
| | | Total Mined | | kt | | | | 4933 | | 6440 | | 7319 | | 3514 | | 7163 | | 6255 | | 7183 | | 7284 | | 4307 | | 54,399 |
| | | Mineral inventory | | kt | | 27 | | 179 | | 286 | | 372 | | 405 | | 379 | | 272 | | 187 | | 133 | | 47 | | 2,288 |
| | | Gold | | Au g/t | | 19.61 | | 12.21 | | 7.71 | | 7.56 | | 8.61 | | 7.23 | | 6.24 | | 5.57 | | 3.57 | | 1.92 | | 7.55 |
| Underground | | Silver | | Ag g/t | | 1202.4 | | 744.3 | | 513.9 | | 382.0 | | 360.1 | | 326.9 | | 354.1 | | 504.3 | | 352.5 | | 255.2 | | 425.8 |
| Mining | | Contained Gold | | koz | | 17 | | 70 | | 71 | | 90 | | 112 | | 88 | | 55 | | 33 | | 15 | | 3 | | 555 |
| | | Contained Silver | | koz | | 1048 | | 4276 | | 4730 | | 4569 | | 4693 | | 3984 | | 3097 | | 3030 | | 1507 | | 390 | | 31,325 |
| | | Mineral inventory | | kt | | 27 | | 389 | | 453 | | 566 | | 507 | | 582 | | 445 | | 386 | | 344 | | 337 | | 4,035 |
| Total | | Gold | | Au g/t | | 19.61 | | 10.14 | | 9.08 | | 7.76 | | 9.22 | | 6.96 | | 5.07 | | 4.13 | | 3.13 | | 3.41 | | 6.88 |
| Mining | | Silver | | Ag g/t | | 1202.4 | | 479.5 | | 473.4 | | 480.3 | | 424.6 | | 388.7 | | 312.4 | | 386.6 | | 280.2 | | 149.7 | | 391.9 |
| | | Contained Gold | | koz | | 17 | | 127 | | 132 | | 141 | | 150 | | 130 | | 73 | | 51 | | 35 | | 37 | | 893 |
| | | Contained Silver | | koz | | 1048 | | 6000 | | 6893 | | 8735 | | 6914 | | 7269 | | 4474 | | 4797 | | 3097 | | 1621 | | 50,849 |
| | | Mineral inventory | | kt | | | | 376 | | 437 | | 437 | | 437 | | 480 | | 480 | | 480 | | 480 | | 429 | | 4,035 |
| Plant | | Gold | | Au g/t | | | | 11.19 | | 9.55 | | 8.69 | | 10.27 | | 7.26 | | 5.20 | | 4.13 | | 3.41 | | 3.56 | | 6.88 |
| Feed | | Silver | | Ag g/t | | | | 547.8 | | 482.9 | | 523.9 | | 461.8 | | 413.3 | | 322.9 | | 362.5 | | 275.6 | | 174.3 | | 391.9 |
| | | Contained Gold | | koz | | | | 135 | | 134 | | 122 | | 144 | | 112 | | 80 | | 64 | | 53 | | 49 | | 893 |
| | | Contained Silver | | koz | | | | 6614 | | 6778 | | 7353 | | 6482 | | 6381 | | 4985 | | 5597 | | 4254 | | 2406 | | 50,849 |
Table 68 Mine Plan and Plant Feed at 1,300tpd
| 16.1.7.2 | Mine Schedule at 1,150 tpd (Option B) |
For the 1,150 tpd option the mine plan also considers simultaneous mining of the open pits and underground mines. Underground mining operations will commence at Escondida Far West and Escondida before moving on to Zoe, Martina and Gabriela. The open pits will commence at Escondida Far West and Escondida, followed by Nini-Esperanza, Gabriela, Zoe, Deborah and Carla.
The general mining sequence is graphically shown in Table 69.
Extorre Gold Mines Limited
Cerro Moro Gold – Silver Project
Preliminary Economic Assessment | Page 215 |
| | Y-2 | Y-1 | Y1 | Y2 | Y3 | Y4 | Y5 | Y6 | Y7 | Y8 | Y9 | Total |
| Mine Plan Ore Kton | kt | kt | kt | kt | kt | kt | kt | kt | kt | kt | kt | kt |
| Open Pit | | | | | | | | | | | | |
| EFW | | 0 | 51 | 8 | | | | | | | | 59 |
| ESC | | | 12 | 104 | 100 | 8 | | | | | | 224 |
| LOM | | | | 34 | 11 | 13 | | | | | | 58 |
| ZOE | | | | | | 4 | 62 | 2 | | | | 68 |
| GAB | | | | | 64 | 135 | 78 | 27 | 96 | 75 | 42 | 516 |
| ESP-NIN | | | | | | 29 | 169 | 137 | 103 | 135 | 45 | 617 |
| CAR | | | | | | | | | | | 14 | 14 |
| DEB | | | | | | | | | | 2 | 189 | 191 |
| Subtotal Open Pit | | 0 | 64 | 146 | 175 | 188 | 309 | 166 | 199 | 211 | 289 | 1747 |
| | | | | | | | | | | | | |
| Underground | | | | | | | | | | | | |
| EFW | | 25 | 113 | 100 | 61 | 30 | 15 | 4 | | | | 347 |
| ESC | | 2 | 36 | 51 | 58 | 68 | 18 | 5 | | | | 239 |
| ZOE | | | | 13 | 105 | 139 | 133 | 141 | 112 | 85 | 75 | 802 |
| MAR | | | | | 45 | 96 | 86 | 54 | 8 | 2 | | 290 |
| GAB | | | | 16 | 66 | 84 | 117 | 114 | 90 | 79 | 45 | 610 |
| Subtotal Underground | | 27 | 149 | 180 | 334 | 416 | 369 | 318 | 210 | 165 | 119 | 2288 |
| | | | | | | | | | | | | |
| Total | | 27 | 212 | 325 | 509 | 604 | 678 | 484 | 409 | 376 | 409 | 4035 |
Table 69 General Mining Sequence (1,150 tpd)
The detailed mine production schedule by sector is shown in Table 70.
The plant feed is a result of a combination between what is mined from the underground mine, open pit mine and re-handling from the stockpile; and it is shown in Table 71.
Extorre Gold Mines Limited
Cerro Moro Gold – Silver Project
Preliminary Economic Assessment | Page 216 |
| | | | | | | Year -1 | | Year 1 | | Year 2 | | Year 3 | | Year 4 | | Year 5 | | Year 6 | | Year 7 | | Year 8 | | Year 9 | | Total |
| | | Escondida | | kt | | 942 | | 2 778 | | 6 451 | | 3 353 | | 476 | | | | | | | | | | | | 14 000 |
| | | Esperanza-Nini | | kt | | | | | | | | | | 514 | | 2 886 | | 3 590 | | 3 449 | | 3 475 | | 549 | | 14 463 |
| | | Zoe | | kt | | | | | | | | | | 434 | | 1 301 | | 7 | | | | | | | | 1 742 |
| Waste | | Gabriela | | kt | | | | | | | | 2 961 | | 4 797 | | 1 680 | | 2 407 | | 3 535 | | 3 538 | | 996 | | 19 913 |
| | | Deborah | | kt | | | | | | | | | | | | | | | | | | 61 | | 1 929 | | 1 990 |
| | | Carla | | kt | | | | | | | | | | | | | | | | | | | | 543 | | 543 |
| | | Total | | kt | | 942 | | 2 778 | | 6 451 | | 6 314 | | 6 222 | | 5 867 | | 6 003 | | 6 984 | | 7 073 | | 4 018 | | 52 652 |
| | | Escondida | | kt | | 0 | | 64 | | 146 | | 111 | | 20 | | | | | | | | | | | | 341 |
| | | | | Au g/t | | 2.4 | | 24.0 | | 19.5 | | 16.5 | | 7.9 | | | | | | | | | | | | 18.7 |
| | | | | Ag g/t | | 185.2 | | 1397.6 | | 642.8 | | 432.3 | | 196.0 | | | | | | | | | | | | 687.9 |
| | | Esperanza-Nini | | kt | | | | | | | | | | 29 | | 169 | | 137 | | 103 | | 135 | | 45 | | 617 |
| | | | | Au g/t | | | | | | | | | | 1.6 | | 2.1 | | 2.7 | | 3.4 | | 3.4 | | 4.7 | | 2.9 |
| | | | | Ag g/t | | | | | | | | | | 150.5 | | 158.8 | | 223.6 | | 262.5 | | 230.9 | | 196.6 | | 208.6 |
| | | Zoe | | kt | | | | | | | | | | 4 | | 62 | | 2 | | | | | | | | 68 |
| | | | | Au g/t | | | | | | | | | | 6.0 | | 6.1 | | 15.4 | | | | | | | | 6.4 |
| | | | | Ag g/t | | | | | | | | | | 781.1 | | 849.4 | | 1751.3 | | | | | | | | 873.2 |
| Open Pit | | Martina | | kt | | | | | | | | | | | | | | | | | | | | | | |
| Mineralised | | | | Au g/t | | | | | | | | | | | | | | | | | | | | | | |
| Material | | | | Ag g/t | | | | | | | | | | | | | | | | | | | | | | |
| | | Gabriela | | kt | | | | | | | | 64 | | 135 | | 78 | | 27 | | 96 | | 75 | | 42 | | 516 |
| | | | | Au g/t | | | | | | | | 1.8 | | 2.5 | | 2.8 | | 1.8 | | 2.1 | | 1.8 | | 1.1 | | 2.1 |
| | | | | Ag g/t | | | | | | | | 240.0 | | 383.8 | | 446.6 | | 244.1 | | 290.8 | | 244.6 | | 147.4 | | 311.8 |
| | | Deborah | | kt | | | | | | | | | | | | | | | | | | 2 | | 189 | | 191 |
| | | | | Au g/t | | | | | | | | | | | | | | | | | | 2.6 | | 3.0 | | 3.0 |
| | | | | Ag g/t | | | | | | | | | | | | | | | | | | 60.1 | | 68.5 | | 68.5 |
| | | Carla | | kt | | | | | | | | | | | | | | | | | | | | 14 | | 14 |
| | | | | Au g/t | | | | | | | | | | | | | | | | | | | | 17.4 | | 17.4 |
| | | | | Ag g/t | | | | | | | | | | | | | | | | | | | | 762.3 | | 762.3 |
| | | TOTAL | | kt | | 0 | | 64 | | 146 | | 175 | | 188 | | 309 | | 166 | | 199 | | 211 | | 289 | | 1 747 |
| | | | | Au g/t | | 2.4 | | 24.0 | | 19.5 | | 11.1 | | 3.0 | | 3.1 | | 2.7 | | 2.8 | | 2.9 | | 3.7 | | 6.0 |
| | | | | Ag g/t | | 185.2 | | 1397.6 | | 642.8 | | 362.1 | | 336.4 | | 369.9 | | 246.3 | | 276.1 | | 234.5 | | 132.4 | | 347.6 |
| | | Escondida | | kt | | 942 | | 2 841 | | 6 597 | | 3 465 | | 497 | | | | | | | | | | | | 14 341 |
| | | Esperanza-Nini | | kt | | | | | | | | | | 543 | | 3 055 | | 3 727 | | 3 553 | | 3 609 | | 594 | | 15 081 |
| Total Open | | Zoe | | kt | | | | | | | | | | 438 | | 1 363 | | 9 | | | | | | | | 1 810 |
| Pit | | Gabriela | | kt | | | | | | | | 3 025 | | 4 932 | | 1 759 | | 2 433 | | 3 630 | | 3 612 | | 1 038 | | 20 429 |
| Material | | Deborah | | kt | | | | | | | | | | | | | | | | | | 63 | | 2 119 | | 2 181 |
| | | Carla | | kt | | | | | | | | | | | | | | | | | | | | 557 | | 557 |
| | | Total | | kt | | 942 | | 2 841 | | 6 597 | | 6 489 | | 6 410 | | 6 176 | | 6 169 | | 7 183 | | 7 284 | | 4 307 | | 54 399 |
| Open Pit Strip Ratio (Mineralised Material / Waste) | | 5,728.7 | | 43.7 | | 44.2 | | 36.0 | | 33.1 | | 19.0 | | 36.2 | | 35.1 | | 33.5 | | 13.9 | | 30.1 |
Table 70 Mine Production Schedule (1,150 tpd)
Extorre Gold Mines Limited
Cerro Moro Gold – Silver Project
Preliminary Economic Assessment | Page 217 |
Continued - Table 70
| | | | | | | Year -1 | | Year 1 | | Year 2 | | Year 3 | | Year 4 | | Year 5 | | Year 6 | | Year 7 | | Year 8 | | Year 9 | | Total |
| | | Escondida | | kt | | 27 | | 149 | | 150 | | 118 | | 98 | | 33 | | 10 | | | | | | | | 586 |
| | | | | Au g/t | | 19.6 | | 12.7 | | 8.5 | | 10.3 | | 8.8 | | 11.3 | | 7.6 | | | | | | | | 10.6 |
| | | | | Ag g/t | | 1202.4 | | 710.3 | | 418.3 | | 420.0 | | 368.0 | | 454.8 | | 406.8 | | | | | | | | 522.5 |
| | | Esperanza Nini | | kt | | | | | | | | | | | | | | | | | | | | | | |
| | | | | Au g/t | | | | | | | | | | | | | | | | | | | | | | |
| | | | | Ag g/t | | | | | | | | | | | | | | | | | | | | | | |
| | | Zoe | | kt | | | | | | 13 | | 105 | | 139 | | 133 | | 141 | | 112 | | 85 | | 75 | | 802 |
| | | | | Au g/t | | | | | | 9.6 | | 8.5 | | 6.3 | | 9.3 | | 7.4 | | 9.6 | | 9.5 | | 5.1 | | 8.0 |
| | | | | Ag g/t | | | | | | 991.5 | | 725.8 | | 452.6 | | 611.5 | | 521.8 | | 633.6 | | 750.8 | | 322.4 | | 580.6 |
| | | Martina | | kt | | | | | | | | 45 | | 96 | | 86 | | 54 | | 8 | | 2 | | | | 290 |
| | | | | Au g/t | | | | | | | | 9.0 | | 14.1 | | 12.3 | | 10.0 | | 7.3 | | 7.0 | | | | 11.8 |
| Underground | | | | Ag g/t | | | | | | | | 52.6 | | 61.5 | | 48.7 | | 41.3 | | 36.2 | | 34.1 | | | | 51.7 |
| | | Gabriela | | kt | | | | | | 16 | | 66 | | 84 | | 117 | | 114 | | 90 | | 79 | | 45 | | 610 |
| | | | | Au g/t | | | | | | 2.6 | | 2.1 | | 2.2 | | 1.5 | | 1.5 | | 2.0 | | 2.6 | | 1.6 | | 1.9 |
| | | | | Ag g/t | | | | | | 401.3 | | 336.1 | | 364.0 | | 246.0 | | 241.6 | | 317.4 | | 403.9 | | 261.4 | | 307.1 |
| | | Deborah | | kt | | | | | | | | | | | | | | | | | | | | | | |
| | | | | Au g/t | | | | | | | | | | | | | | | | | | | | | | |
| | | | | Ag g/t | | | | | | | | | | | | | | | | | | | | | | |
| | | Carla | | kt | | | | | | | | | | | | | | | | | | | | | | |
| | | | | Au g/t | | | | | | | | | | | | | | | | | | | | | | |
| | | | | Ag g/t | | | | | | | | | | | | | | | | | | | | | | |
| | | TOTAL | | kt | | 27 | | 149 | | 180 | | 334 | | 416 | | 369 | | 318 | | 210 | | 165 | | 119 | | 2 288 |
| | | | | Au g/t | | 19.6 | | 12.7 | | 8.0 | | 8.0 | | 7.9 | | 7.7 | | 5.7 | | 6.3 | | 6.2 | | 3.8 | | 7.5 |
| | | | | Ag g/t | | 1202.4 | | 710.3 | | 459.6 | | 449.7 | | 325.0 | | 350.6 | | 337.0 | | 474.9 | | 578.8 | | 299.6 | | 425.8 |
Continued - Table 70
| | | | | | | Year -1 | | Year 1 | | Year 2 | | Year 3 | | Year 4 | | Year 5 | | Year 6 | | Year 7 | | Year 8 | | Year 9 | | Total |
| | | Escondida | | kt | | 27 | | 212 | | 296 | | 230 | | 119 | | 33 | | 10 | | | | | | | | 928 |
| | | | | Au g/t | | 19.5 | | 16.1 | | 13.9 | | 13.3 | | 8.6 | | 11.3 | | 7.6 | | | | | | | | 13.6 |
| | | | | Ag g/t | | 1196.2 | | 915.9 | | 528.9 | | 426.0 | | 338.6 | | 454.8 | | 406.8 | | | | | | | | 583.4 |
| | | Esperanza Nini | | kt | | | | | | | | | | 29 | | 169 | | 137 | | 103 | | 135 | | 45 | | 617 |
| | | | | Au g/t | | | | | | | | | | 1.6 | | 2.1 | | 2.7 | | 3.4 | | 3.4 | | 4.7 | | 2.9 |
| | | | | Ag g/t | | | | | | | | | | 150.5 | | 158.8 | | 223.6 | | 262.5 | | 230.9 | | 196.6 | | 208.6 |
| | | Zoe | | kt | | | | | | 13 | | 105 | | 143 | | 194 | | 143 | | 112 | | 85 | | 75 | | 870 |
| | | | | Au g/t | | | | | | 9.6 | | 8.5 | | 6.3 | | 8.3 | | 7.5 | | 9.6 | | 9.5 | | 5.1 | | 7.9 |
| | | | | Ag g/t | | | | | | 991.5 | | 725.8 | | 462.0 | | 687.2 | | 539.9 | | 633.6 | | 750.8 | | 322.4 | | 603.4 |
| Combined | | Martina | | kt | | | | | | | | 45 | | 96 | | 86 | | 54 | | 8 | | 2 | | | | 290 |
| Open Pit / | | | | Au g/t | | | | | | | | 9.0 | | 14.1 | | 12.3 | | 10.0 | | 7.3 | | 7.0 | | | | 11.8 |
| Underground | | | | Ag g/t | | | | | | | | 52.6 | | 61.5 | | 48.7 | | 41.3 | | 36.2 | | 34.1 | | | | 51.7 |
| Mine Plan | | Gabriela | | kt | | | | | | 16 | | 130 | | 218 | | 196 | | 141 | | 185 | | 153 | | 86 | | 1 126 |
| | | | | Au g/t | | | | | | 2.6 | | 2.0 | | 2.4 | | 2.0 | | 1.5 | | 2.1 | | 2.2 | | 1.4 | | 2.0 |
| | | | | Ag g/t | | | | | | 401.3 | | 288.7 | | 376.2 | | 326.3 | | 242.1 | | 303.7 | | 326.2 | | 206.3 | | 309.2 |
| | | Deborah | | kt | | | | | | | | | | | | | | | | | | 2 | | 189 | | 191 |
| | | | | Au g/t | | | | | | | | | | | | | | | | | | 2.6 | | 3.0 | | 3.0 |
| | | | | Ag g/t | | | | | | | | | | | | | | | | | | 60.1 | | 68.5 | | 68.5 |
| | | Carla | | kt | | | | | | | | | | | | | | | | | | | | 14 | | 14 |
| | | | | Au g/t | | | | | | | | | | | | | | | | | | | | 17.4 | | 17.4 |
| | | | | Ag g/t | | | | | | | | | | | | | | | | | | | | 762.3 | | 762.3 |
| | | TOTAL | | kt | | 27 | | 212 | | 325 | | 509 | | 604 | | 678 | | 484 | | 409 | | 376 | | 409 | | 4 035 |
| | | | | Au g/t | | 19.5 | | 16.1 | | 13.2 | | 9.0 | | 6.4 | | 5.6 | | 4.7 | | 4.6 | | 4.3 | | 3.7 | | 6.9 |
| | | | | Ag g/t | | 1196.2 | | 915.9 | | 541.7 | | 419.6 | | 328.5 | | 359.4 | | 305.9 | | 378.3 | | 385.8 | | 181.2 | | 391.9 |
Extorre Gold Mines Limited
Cerro Moro Gold – Silver Project
Preliminary Economic Assessment | Page 218 |
| | | | | | | Year -1 | | Year 1 | | Year 2 | | Year 3 | | Year 4 | | Year 5 | | Year 6 | | Year 7 | | Year 8 | | Year 9 | | Year 10 | | Year 11 | | TOTAL |
| | | Mineralised Material | | kt | | 0 | | 64 | | 146 | | 175 | | 188 | | 309 | | 166 | | 199 | | 211 | | 289 | | | | | | 1,747 |
| | | Gold | | Au g/t | | 2.37 | | 23.98 | | 19.55 | | 11.14 | | 3.00 | | 3.08 | | 2.71 | | 2.78 | | 2.85 | | 3.65 | | | | | | 6.01 |
| Open Pit | | Silver | | Ag g/t | | 185.2 | | 1397.6 | | 642.8 | | 362.1 | | 336.4 | | 369.9 | | 246.3 | | 276.1 | | 234.5 | | 132.4 | | | | | | 347.6 |
| Mining | | Contained Gold | | koz | | 0 | | 49 | | 92 | | 63 | | 18 | | 31 | | 14 | | 18 | | 19 | | 34 | | | | | | 338 |
| | | Contained Silver | | koz | | 1 | | 2856 | | 3017 | | 2040 | | 2031 | | 3677 | | 1313 | | 1767 | | 1590 | | 1232 | | | | | | 19,524 |
| | | Waste | | kt | | 942 | | 2778 | | 6451 | | 6314 | | 6222 | | 5867 | | 6003 | | 6984 | | 7073 | | 4018 | | | | | | 52,652 |
| | | Total Mined | | kt | | 942 | | 2841 | | 6597 | | 6489 | | 6410 | | 6176 | | 6169 | | 7183 | | 7284 | | 4307 | | | | | | 54,399 |
| | | Mineralised Material | | kt | | 27 | | 149 | | 180 | | 334 | | 416 | | 369 | | 318 | | 210 | | 165 | | 119 | | | | | | 2,288 |
| Underground | | Gold | | Au g/t | | 19.61 | | 12.72 | | 8.04 | | 7.95 | | 7.87 | | 7.72 | | 5.72 | | 6.26 | | 6.22 | | 3.82 | | | | | | 7.55 |
| Mining | | Silver | | Ag g/t | | 1202.4 | | 710.3 | | 459.6 | | 449.7 | | 325.0 | | 350.6 | | 337.0 | | 474.9 | | 578.8 | | 299.6 | | | | | | 425.8 |
| | | Contained Gold | | koz | | 17 | | 61 | | 46 | | 85 | | 105 | | 92 | | 59 | | 42 | | 33 | | 15 | | | | | | 555 |
| | | Contained Silver | | koz | | 1048 | | 3400 | | 2652 | | 4832 | | 4347 | | 4159 | | 3450 | | 3213 | | 3075 | | 1149 | | | | | | 31,325 |
| | | Mineralised Material | | kt | | 27 | | 212 | | 325 | | 509 | | 604 | | 678 | | 484 | | 409 | | 376 | | 409 | | | | | | 4,035 |
| Total | | Gold | | Au g/t | | 19.51 | | 16.09 | | 13.20 | | 9.05 | | 6.36 | | 5.61 | | 4.69 | | 4.57 | | 4.33 | | 3.70 | | | | | | 6.88 |
| Mining | | Silver | | Ag g/t | | 1196.2 | | 915.9 | | 541.7 | | 419.6 | | 328.5 | | 359.4 | | 305.9 | | 378.3 | | 385.8 | | 181.2 | | | | | | 391.9 |
| | | Contained Gold | | koz | | 17 | | 110 | | 138 | | 148 | | 123 | | 122 | | 73 | | 60 | | 52 | | 49 | | | | | | 893 |
| | | Contained Silver | | koz | | 1049 | | 6256 | | 5669 | | 6872 | | 6378 | | 7837 | | 4763 | | 4979 | | 4665 | | 2380 | | | | | | 50,849 |
| | | Mineralised Material | | kt | | | | 240 | | 316 | | 386 | | 386 | | 425 | | 425 | | 425 | | 425 | | 425 | | 425 | | 159 | | 4,035 |
| Plant | | Gold | | Au g/t | | | | 16.48 | | 13.24 | | 10.41 | | 7.99 | | 6.52 | | 5.22 | | 4.61 | | 4.29 | | 3.77 | | 3.73 | | 3.73 | | 6.88 |
| Feed | | Silver | | Ag g/t | | | | 947.8 | | 541.7 | | 473.5 | | 340.8 | | 426.1 | | 348.6 | | 377.6 | | 369.3 | | 193.5 | | 240.5 | | 240.5 | | 391.9 |
| | | Contained Gold | | koz | | | | 127 | | 134 | | 129 | | 99 | | 89 | | 71 | | 63 | | 59 | | 51 | | 51 | | 19 | | 893 |
| | | Contained Silver | | koz | | | | 7304 | | 5500 | | 5879 | | 4232 | | 5819 | | 4761 | | 5157 | | 5043 | | 2643 | | 3285 | | 1227 | | 50,849 |
Table 71 Mine Plan and Plant Feed at 1,150tpd
| 16.1.8 | Mobile Mining Fleet |
The equipment fleet selection was based on the mine production schedules, haulage distances and the performance and operational characteristics of the equipment, and auxiliary units. A model was created to estimate the number of units required and the operating hours for each unit. This model was also used to calculate equipment procurement schedules, workforce productivity, capital expenses and operating costs.
Benchmarking together with NCL personnel’s knowledge of similar operations was used to confirm these choices.
Extorre Gold Mines Limited
Cerro Moro Gold – Silver Project
Preliminary Economic Assessment | Page 219 |
Open Pit Mining Equipment
The following criteria were used in the selection of open-pit mining equipment.
| § | Medium capacity, consistent with the size of the operation |
| § | Proven technology, used in other operations of similar type |
| § | Flexibility in operations, where required |
| § | High productivity in waste removal, as well as high selectivity for mineral extraction. |
The equipment was selected for a standard mining operation using conventional drill, blast, load and haul, plus the regular activities of face and road maintenance.
The equipment selection includes:
| § | Diesel driven percussion drills of 35/8-5" diameter (Pantera DP1500) for waste and mineralization |
| § | 8.3 yd3 front-end loaders (Cat 988H) for waste |
| § | 6.2 yd3 hydraulic excavator (Cat 385) for mineralization |
| § | 55 tonne capacity trucks (Cat 773). |
The main fleet is supported by ancillary units including track dozers (Cat D8), wheel dozers (834H), motor graders (Cat 14M) and 15 m3 water trucks.
The total open pit requirement is show in Table 72 including also minor support equipment.
| | | 1,300 tpd | | | 1,150 tpd | |
| Description | | Initial | | | Peak | | | Initial | | | Peak | |
| Main Equipment | | | | | | | | | | | | | | | | |
| Loading | | | | | | | | | | | | | | | | |
| FEL (8.3 yd3) | | | 1 | | | | 1 | | | | 1 | | | | 2 | |
| Excavator (6.2 yd3) | | | 1 | | | | 1 | | | | 1 | | | | 1 | |
| Hauling (50 tonnes truck) | | | 5 | | | | 5 | | | | 3 | | | | 6 | |
| Drilling (diesel 35/8 - 5 ") | | | 2 | | | | 2 | | | | 1 | | | | 2 | |
| Ancillary | | | | | | | | | | | | | | | | |
| Bulldozer (D8) | | | 1 | | | | 2 | | | | 1 | | | | 2 | |
| Wheeldozer (834H) | | | 2 | | | | 2 | | | | 1 | | | | 2 | |
| Motorgrader (14M) | | | 1 | | | | 1 | | | | 1 | | | | 2 | |
| Water truck (15m3) | | | 2 | | | | 2 | | | | 1 | | | | 2 | |
| Support | | | | | | | | | | | | | | | | |
| Backhoe | | | 1 | | | | 1 | | | | 1 | | | | 1 | |
| Fuel Truck | | | 1 | | | | 1 | | | | 1 | | | | 1 | |
| Lube Truck | | | 1 | | | | 1 | | | | 1 | | | | 1 | |
| Mobil Crane | | | 0 | | | | 0 | | | | 0 | | | | 0 | |
| Tires Handler | | | 0 | | | | 0 | | | | 0 | | | | 0 | |
| Lightning Plant | | | 8 | | | | 12 | | | | 6 | | | | 8 | |
Table 72 Open Pit Mining Equipment Requirement
Extorre Gold Mines Limited
Cerro Moro Gold – Silver Project
Preliminary Economic Assessment | Page 220 |
Underground Mining Equipment
Underground mining equipment was selected to work simultaneously in several underground workings.
Drills
Electro-hydraulic twin boom jumbo’s will be used for development, bolting and stripping in stopes exceeding 4m in width.
Twin boom jumbos have been selected due to their higher level of productivity. This is important given the large number of work areas in the mines. Accuracy and straightness is required for drilling in 12 m high stopes. Two types of drilling rigs can be used, down-the-hole (DTH) and hydraulic top hammer. DTH was selected for a drilling pattern of 2.0 x 1,2 m. Stope drilling will use rubber-tyre mounted electro-hydraulic long-hole rigs fitted with remote controls and automatic carousels. In order to ensure accuracy and straightness the drills will be filled with DTH drills.
Bolting jumbos will be used for systematic support of the hanging wall in development.
Loading Units
Development loading will be done with 6 yd3 LHDs, smaller 3.5 yd3 units will be used for production (drifts and stopes).
Trucks
30 tonne underground dump trucks fitted with push-plates have been selected to transport mineralization from the haulage levels to the surface, and to haul waste material for backfill from surface (or from loading points inside the mine) to the stopes. The push plates allow the trucks to dump in standard size drives eliminating the need to enlarge them.
Ancillary Fleet
The type and quantity of this equipment took into account the maximum number of active stopes at any given time and the overall requirements to provide a modern standard operation.
The following support equipment was selected for the Project:
| o | For explosives distribution: Conventional I.5 tonne diesel trucks equipped to meet all the explosives regulations. These can be conventional diesel trucks, 1,500 kg loading capacity, equipped with all the requirements established in regulations for explosive transportation. |
| o | For materials transportation inside the mine (all-purpose): Conventional 1.5 tonne flat-bed trucks. |
Extorre Gold Mines Limited
Cerro Moro Gold – Silver Project
Preliminary Economic Assessment | Page 221 |
| o | For general maintenance services: Conventional 1.5 tonne trucks suitably equipped for maintenance of equipment on site. |
| | | |
| § | Main and Ancillary Fans: |
| o | Main fans were estimated as per the ventilation requirement. Ancillary fans are estimated as a function of active stopes and galleries in development at a given time, according to production and development plans. |
Development Fleet
To develop 5.0 x 4.5 m and 4.0 x 4.0 m tunnels, the same equipment described above will be used (i.e., two boom jumbos, 6 yd3 LHDs, and 30 tonne trucks).
The total underground requirement is Table 73 shown including also minor support equipment.
| | | 1,300 tpd | | | 1,150 tpd | |
| Description | | Initial | | | Peak | | | Initial | | | Peak | |
| Main Equipment | | | | | | | | | | | | | | | | |
| LHD 6 yd3 | | | 1 | | | | 3 | | | | 1 | | | | 3 | |
| LHD 3.5yd3 | | | 1 | | | | 7 | | | | 1 | | | | 7 | |
| Trucks 30t | | | 2 | | | | 12 | | | | 2 | | | | 9 | |
| Jumbo horizontal | | | 1 | | | | 8 | | | | 1 | | | | 8 | |
| Jumbo Radial | | | 0 | | | | 2 | | | | 0 | | | | 2 | |
| Jumbo support | | | 1 | | | | 2 | | | | 1 | | | | 2 | |
| Explosives charger | | | 1 | | | | 4 | | | | 1 | | | | 3 | |
| Others | | | | | | | | | | | | | | | | |
| Compressors 7cfm | | | 1 | | | | 1 | | | | 1 | | | | 1 | |
| Main Fans | | | 4 | | | | 4 | | | | 4 | | | | 4 | |
| Secondary Fans | | | 7 | | | | 7 | | | | 7 | | | | 7 | |
| Service truck | | | 1 | | | | 1 | | | | 1 | | | | 1 | |
| Fuel truck | | | 1 | | | | 1 | | | | 1 | | | | 1 | |
| Lube truck | | | 1 | | | | 1 | | | | 1 | | | | 1 | |
| Explosives truck | | | 1 | | | | 1 | | | | 1 | | | | 1 | |
| Lighting plant | | | 6 | | | | 6 | | | | 6 | | | | 6 | |
| Pickups | | | 3 | | | | 3 | | | | 3 | | | | 3 | |
| Platform | | | 1 | | | | 1 | | | | 1 | | | | 1 | |
| Mixer 6 m3 | | | 1 | | | | 1 | | | | 1 | | | | 1 | |
| Minibus | | | 0 | | | | 3 | | | | 0 | | | | 3 | |
| Gunning machine | | | 1 | | | | 1 | | | | 1 | | | | 1 | |
| Water truck | | | 1 | | | | 1 | | | | 1 | | | | 1 | |
| Scaler | | | 1 | | | | 1 | | | | 1 | | | | 1 | |
| Auxiliary truck | | | 0 | | | | 1 | | | | 0 | | | | 1 | |
Table 73 Underground Mining Equipment Requirement
The mining department will be led by the Mine Manager who needs to be a fully qualified graduate engineer with 20 years of experience for open pit and underground operations (including mine planning and maintenance).
The required personnel are shown in Table 74 through Table 77.
Extorre Gold Mines Limited
Cerro Moro Gold – Silver Project
Preliminary Economic Assessment | Page 222 |
The Mine Manager needs to be hired 3 – 6 months before the start of the mining operations so that he can be involved with the hiring process for the operators and maintenance people plus be involved with the preparation of the training program.
In addition to the Mine Manager, there are four other key people for the other areas of the mining operation for maintenance, mine engineering and planning, geology. The senior people for these positions will require 15 – 20 years of experience and need to be hired two months before the start of the mine operations.
| Period | | Year 1 | | | Year 2 | | | Year 3 | | | Year 4 | | | Year 5 | | | Year 6 | | | Year 7 | | | Year 8 | | | Year 9 | |
| Total Open Pit Operators | | | 66 | | | | 71 | | | | 73 | | | | 57 | | | | 69 | | | | 62 | | | | 71 | | | | 70 | | | | 70 | |
| Loading | | | 14 | | | | 14 | | | | 14 | | | | 14 | | | | 14 | | | | 14 | | | | 14 | | | | 14 | | | | 14 | |
| FEL | | | 9 | | | | 9 | | | | 9 | | | | 9 | | | | 9 | | | | 9 | | | | 9 | | | | 9 | | | | 9 | |
| Hydraulic Shovel | | | 5 | | | | 5 | | | | 5 | | | | 5 | | | | 5 | | | | 5 | | | | 5 | | | | 5 | | | | 5 | |
| Hauling | | | 22 | | | | 22 | | | | 26 | | | | 14 | | | | 21 | | | | 18 | | | | 23 | | | | 22 | | | | 21 | |
| Haul trucks | | | 22 | | | | 22 | | | | 26 | | | | 14 | | | | 21 | | | | 18 | | | | 23 | | | | 22 | | | | 21 | |
| Drilling | | | 5 | | | | 9 | | | | 9 | | | | 5 | | | | 9 | | | | 5 | | | | 9 | | | | 9 | | | | 9 | |
| Diesel Drill | | | 5 | | | | 9 | | | | 9 | | | | 5 | | | | 9 | | | | 5 | | | | 9 | | | | 9 | | | | 9 | |
| Ancillary | | | 17 | | | | 18 | | | | 16 | | | | 16 | | | | 17 | | | | 17 | | | | 17 | | | | 17 | | | | 18 | |
| Bulldozer D8 | | | 7 | | | | 7 | | | | 7 | | | | 7 | | | | 7 | | | | 7 | | | | 7 | | | | 7 | | | | 7 | |
| Wheeldozer 834H | | | 3 | | | | 3 | | | | 3 | | | | 3 | | | | 3 | | | | 3 | | | | 3 | | | | 3 | | | | 3 | |
| Motorgrader 14M | | | 3 | | | | 3 | | | | 3 | | | | 3 | | | | 3 | | | | 3 | | | | 3 | | | | 3 | | | | 3 | |
| Water Truck 15000 l | | | 3 | | | | 4 | | | | 3 | | | | 3 | | | | 3 | | | | 4 | | | | 3 | | | | 3 | | | | 4 | |
| Support | | | 8 | | | | 8 | | | | 8 | | | | 8 | | | | 8 | | | | 8 | | | | 8 | | | | 8 | | | | 8 | |
| Backhoe | | | 2 | | | | 2 | | | | 2 | | | | 2 | | | | 2 | | | | 2 | | | | 2 | | | | 2 | | | | 2 | |
| Fuel Truck | | | 1 | | | | 1 | | | | 1 | | | | 1 | | | | 1 | | | | 1 | | | | 1 | | | | 1 | | | | 1 | |
| Lube Truck | | | 1 | | | | 1 | | | | 1 | | | | 1 | | | | 1 | | | | 1 | | | | 1 | | | | 1 | | | | 1 | |
| Support Truck | | | 1 | | | | 1 | | | | 1 | | | | 1 | | | | 1 | | | | 1 | | | | 1 | | | | 1 | | | | 1 | |
| Lowboy Truck | | | 2 | | | | 2 | | | | 2 | | | | 2 | | | | 2 | | | | 2 | | | | 2 | | | | 2 | | | | 2 | |
Table 74 Open Pit Operators
| Period | | Year 1 | | | Year 2 | | | Year 3 | | | Year 4 | | | Year 5 | | | Year 6 | | | Year 7 | | | Year 8 | | | Year 9 | |
| Open Pit Maintenance | | | 45.0 | | | | 45.0 | | | | 47.0 | | | | 45.0 | | | | 45.0 | | | | 44.0 | | | | 42.0 | | | | 39.0 | | | | 32.0 | |
| Site | | | 4.5 | | | | 4.5 | | | | 4.5 | | | | 4.5 | | | | 4.5 | | | | 3.5 | | | | 2.0 | | | | 2.0 | | | | 2.0 | |
| Drills | | | 2.0 | | | | 2.0 | | | | 2.0 | | | | 2.0 | | | | 2.0 | | | | 1.0 | | | | 1.0 | | | | 1.0 | | | | 1.0 | |
| Shovels | | | 2.5 | | | | 2.5 | | | | 2.5 | | | | 2.5 | | | | 2.5 | | | | 2.5 | | | | 1.0 | | | | 1.0 | | | | 1.0 | |
| Workshop | | | 40.0 | | | | 40.0 | | | | 42.5 | | | | 40.0 | | | | 40.0 | | | | 40.0 | | | | 40.0 | | | | 37.0 | | | | 30.0 | |
| FEL | | | 5.0 | | | | 5.0 | | | | 5.0 | | | | 5.0 | | | | 5.0 | | | | 5.0 | | | | 5.0 | | | | 2.0 | | | | 2.0 | |
| Truck | | | 15.0 | | | | 15.0 | | | | 17.5 | | | | 15.0 | | | | 15.0 | | | | 15.0 | | | | 15.0 | | | | 15.0 | | | | 12.0 | |
| Ancillary | | | 20.0 | | | | 20.0 | | | | 20.0 | | | | 20.0 | | | | 20.0 | | | | 20.0 | | | | 20.0 | | | | 20.0 | | | | 16.0 | |
Table 75 Open Pit Maintenance
| Period | | Year -2 | | | Year -1 | | | Year 1 | | | Year 2 | | | Year 3 | | | Year 4 | | | Year 5 | | | Year 6 | | | Year 7 | | | Year 8 | | | Year 9 | |
| Underground Operators & Maintenance | | | 7.0 | | | | 34.0 | | | | 69.5 | | | | 176.0 | | | | 186.0 | | | | 156.0 | | | | 108.0 | | | | 79.0 | | | | 38.0 | | | | 29.0 | | | | 14.0 | |
| LHD Operators | | | | | | | 3.4 | | | | 12.5 | | | | 37.0 | | | | 37.0 | | | | 33.0 | | | | 25.0 | | | | 21.0 | | | | 13.0 | | | | 9.0 | | | | 5.0 | |
| Truck drivers | | | | | | | 4.2 | | | | 16.5 | | | | 41.0 | | | | 45.0 | | | | 37.0 | | | | 21.0 | | | | 17.0 | | | | 13.0 | | | | 9.0 | | | | | |
| Frontal Jumbo Operators | | | | | | | 11.0 | | | | 4.0 | | | | 7.0 | | | | 7.0 | | | | 4.0 | | | | 4.0 | | | | 4.0 | | | | | | | | | | | | | |
| Support Jumbo Operators | | | | | | | 2.6 | | | | 10.5 | | | | 25.0 | | | | 25.0 | | | | 21.0 | | | | 13.0 | | | | 5.0 | | | | | | | | | | | | | |
| Explosives Charger Operators | | | | | | | 1.8 | | | | 6.5 | | | | 17.0 | | | | 17.0 | | | | 13.0 | | | | 9.0 | | | | 5.0 | | | | | | | | | | | | | |
| Radial Jumbo Operators | | | | | | | 1.0 | | | | 2.5 | | | | 5.0 | | | | 9.0 | | | | 9.0 | | | | 9.0 | | | | 9.0 | | | | 5.0 | | | | 5.0 | | | | 5.0 | |
| Mechanic/Electrician | | | 5.0 | | | | 8.0 | | | | 13.0 | | | | 35.0 | | | | 37.0 | | | | 31.0 | | | | 21.0 | | | | 14.0 | | | | 5.0 | | | | 4.0 | | | | 3.0 | |
| Mine Services | | | 2.0 | | | | 2.0 | | | | 4.0 | | | | 9.0 | | | | 9.0 | | | | 8.0 | | | | 6.0 | | | | 4.0 | | | | 2.0 | | | | 2.0 | | | | 1.0 | |
| Supervision & Administration | | | 3.8 | | | | 12.0 | | | | 30.0 | | | | 30.0 | | | | 30.0 | | | | 30.0 | | | | 30.0 | | | | 30.0 | | | | 15.0 | | | | 10.0 | | | | 7.5 | |
Table 76 Underground Operators & Maintenance
Extorre Gold Mines Limited
Cerro Moro Gold – Silver Project
Preliminary Economic Assessment | Page 223 |
| Undirect Personnel | | TOTAL | | | Common | | | Open Pit | | | Underground | |
| Mine Management | | | 12 | | | | 4 | | | | 4 | | | | 4 | |
| OP & UG Mine Operations Manager | | | 1 | | | | 1 | | | | | | | | | |
| Mine Captain | | | 1 | | | | 1 | | | | | | | | | |
| OP Shift Supervisor | | | 4 | | | | | | | | 4 | | | | | |
| UG Shift Supervisor | | | 4 | | | | | | | | | | | | 4 | |
| Foreman Drill/Blast | | | 2 | | | | 2 | | | | | | | | | |
| Mine Maintenance Overhead | | | 14 | | | | 9 | | | | 3 | | | | 2 | |
| Maintenance Manager | | | 1 | | | | 1 | | | | | | | | | |
| Maintenance Chief | | | 2 | | | | | | | | 1 | | | | 1 | |
| Maintenance Programming Engineer | | | 3 | | | | | | | | 2 | | | | 1 | |
| Maintenance Assistant | | | 4 | | | | 4 | | | | | | | | | |
| Maintenance Shift Leaders | | | 4 | | | | 4 | | | | | | | | | |
| Technical Services | | | 40 | | | | 3 | | | | 18 | | | | 19 | |
| Mine Planning Superintendent | | | 1 | | | | 1 | | | | | | | | | |
| Senior Engineer | | | 1 | | | | | | | | | | | | 1 | |
| Engineers | | | 5 | | | | | | | | 3 | | | | 2 | |
| Mine planning Draftsman | | | 3 | | | | | | | | 2 | | | | 1 | |
| Statistician | | | 1 | | | | | | | | | | | | 1 | |
| Surveyor | | | 3 | | | | | | | | 2 | | | | 1 | |
| Surveyor helpers | | | 6 | | | | | | | | 4 | | | | 2 | |
| Samplers | | | 10 | | | | | | | | 4 | | | | 6 | |
| Geology Manager | | | 1 | | | | 1 | | | | | | | | | |
| Geologist | | | 5 | | | | | | | | 3 | | | | 2 | |
| Geology Draftsman | | | 1 | | | | | | | | | | | | 1 | |
| Geology Helper | | | 2 | | | | | | | | | | | | 2 | |
| Rock Mechanic Engineer | | | 1 | | | | 1 | | | | | | | | | |
| TOTAL | | | 66 | | | | 16 | | | | 25 | | | | 25 | |
Table 77 Indirect Personnel
Extorre has engaged AKL to carry out a geotechnical evaluation of the designs of the pits, underground mining and dumps of the prospects Escondida Central, Escondida Far West, Loma Escondida, Gabriela and Zoe.
The basis for this study was the collation and analysis by AKL professionals, of all the geological, geotechnical and hydrological data collected during exploration operations at Cerro Moro.
The geologists at Cerro Moro were professionally trained to measure and record comprehensive geotechnical data which was systematically fed into a digital geotechnical database. Extorre employs a geotechnical engineer to oversee this process and to validate the accuracy of the database. Periodically the database is reviewed by an independent third party who checks and validates its accuracy and completeness.
Extorre Gold Mines Limited
Cerro Moro Gold – Silver Project
Preliminary Economic Assessment | Page 224 |
The study included the following steps:
| · | The geotechnical database from Cerro Moro was used to define structural domains for different areas within each prospect. The structural domains within each prospect were combined to produce a single structural domain for each prospect. |
| · | The geotechnical properties of minor structures were estimated by professional staff at AKL |
| · | Groups of stratigraphic units compiled by Extorre were analysed by AKL and regrouped uing RMR values to form geotechnical units. |
| · | The geological profiles and the location and geometry of the contacts of the different lithological units were provided by Extorre. |
| · | In order to evaluate the bench, interramp and global slope stabilities of the various pits at Cerro Moro, the following geotechnical evaluations were carried out. |
| · | Bench-berm analysis: Evaluates the possibility of bench instability resulting from minor structures such as slip planes, slip wedges and toppling. |
| · | The stability of interramps and global slopes: Uses anisotropic rock mass and phreatic level (obtained from hydrological studies carried out by Ausenco Vector) with “Slide” software, to analyze the limit of equilibrium. |
The geotechnical analysis of the open pit designs at Cerro Moro shows that all the prospects analysed have a safety factor exceeding 3.0 and a probability of failure of lower than 1%. As a result of this, AKL considers the pit designs as acceptable from a geotechnical perspective.
It should be noted that although the stability analysis of interramp and global slopes shows high safety factors, it is not possible to optimize the interramp angles because the behavior of the slopes is affected and controlled by the bench behavior (slip planes and slip wedge) and not the rock mass strength, ie, the interramp angles are limited by the results of the bench-berm analysis.
The final design angles summarized in the following table:
| Prospect | | Dip-Dir | | αIR (º) | | αB (º) | | hB (m) |
| Escondida Central | | 0 – 190 | | 68.00 | | 84.00 | | 5 |
| | | 190 – 245 | | 60.00 | | 75.00 | | |
| | | 245 – 360 | | 68.00 | | 84.00 | | |
| Escondida Far West | | 0 – 100 | | 68.00 | | 84.00 | | 5 |
| | | 100 – 145 | | 60.00 | | 75.00 | | |
| | | 145 - 190 | | 68.00 | | 84.00 | | |
| | | 190 – 245 | | 60.00 | | 75.00 | | |
| | | 245 - 360 | | 68.00 | | 84.00 | | |
| Loma Escondida | | 0 – 5 | | 68.00 | | 84.00 | | 5 |
| | | 5 – 75 | | 65.00 | | 81.00 | | |
| | | 75 – 310 | | 68.00 | | 84.00 | | |
| | | 310 – 360 | | 65.00 | | 81.00 | | |
| Gabriela | | 0 – 75 | | 65.00 | | 81.00 | | 5 |
| | | 75 – 300 | | 68.00 | | 84.00 | | |
| | | 300 – 360 | | 65.00 | | 81.00 | | |
| Zoe | | 0 – 145 | | 65.00 | | 81.00 | | 5 |
| | | 145 – 240 | | 60.00 | | 75.00 | | |
| | | 240 - 360 | | 65.00 | | 81.00 | | |
Table 78 Final design angles for the pits at Cerro Moro
Extorre Gold Mines Limited
Cerro Moro Gold – Silver Project
Preliminary Economic Assessment | Page 225 |
AKL performed a stability evaluation on the proposed waste dumps at Escondida, Loma Escondida and Gabriela, using limit equilibrium models together with the Slide software.
The Stability Evaluation used the following assumptions.
| · | The dump will be located on a layer of soil, underlain by rock of poor geotechnical quality. |
| · | The dump will consist of barren rock fragment s from the open pit and underground mining operations. |
| · | For the stability analysis of dumps 2 types of seismic events were considered: earthquake normal magnitude and earthquake at the highest maximum magnitude. These will be represented by the horizontal seismic coefficients 0.003g and 0.01g respectively. |
| · | It was assumed that there are no phreatic water levels or water flows within the dumps or runoff from the dumps that would affect their stability or foundations. The designs consider 15m slices with batter angles of 37° and catch berms of 12m wide. |
The results of the The Dump Stability Analysis confirm that, the design of 3 dumps analyzed, meet with criteria AKL has defined for this study, in static conditions, and the conditions relating to earthquake occurrences conditions.
AKL also performed the geotechnical evaluation and determination of geomechanical parameter for the proposed underground mining operations at Escondida Central, Escondida Far West, Gabriela and Zoe. This study focused primarily on a stability analysis of stopes and tunnels, and the evaluation and implementation of a rock support system.
For the study and stability evaluation of the stopes of the Project, AKL used the methodology presented by Hoek et al (1995), using the graphical stability method. The method is mainly based on the calculation of number of stability and hydraulic radius. For this analysis was considered a dry rock mass.
Extorre Gold Mines Limited
Cerro Moro Gold – Silver Project
Preliminary Economic Assessment | Page 226 |
AKL used the Stability Graph Method (Hoek et al. 1995) to analyse and evaluate the stope stability at Cerro Moro. This procedure requires the calculation of two factors, N’, the modified stability number which represents the ability of the rock mass to stand up under a given stress condition and S, the hydraulic radius which accounts for the stope size and shape. For this analysis the rock mass was considered to be dry. The following results were obtained for the four areas analysed at Cerro Moro.
| Prospect | | Dip of vein
(º) | | Length of
stope (m) |
| Escondida Central | | 70.00 | | 410.00 |
| | | 60.00 | | 90.00 |
| Escondida Fw | | 85.00 | | 90.00 |
| Gabriela | | 85.00 | | 90.00 |
| Zoe | | 90.00 | | 144.00 |
| | | 60.00 | | 40.00 |
Table 79 Maximum length of the open stope for the different mines of the Project
In order to evaluate the potential over-excavation or loosening of the walls and roof of the stopes, a finite element analysis was performed using Phase2 software 3 different scenarios were analysed using this method:
| · | Mining in a competent rock mass without structures: In this case the potential zones of slip and weakness only appear at 200 m depth, making it necessary to consider the implementation of support systems such as bolt-mesh, from this depth. |
| · | Mining in a fractured rock mass: which contains significant structures structures: In this case the stope is excavated in a fractured rock mass, which significantly affects the stability of the stope and generates large areas of potential slippage. It should be noted case that does not match the structural analysis of drillholes, because when analyzing the photographs of these, are not appreciated relevant structural systems can thus affect the stability of the stope. |
| · | Mining in a fracrured rockmass containing structures: Mining within a fractured rock mass significantly affects stope stability, generating large areas of potential slippage. This is an extreme scenario unlikely to apply at Cerro Moro. The structural analysis and intersection photography show no fractured ground or appreciable structural systems that could affect stope stability. |
| · | Mining in a rock mass affected by a major structure: A stope excavated in a rock mass containing a major structure that is sub-parallel to the excavation weakens the adjacent stope sidewall significantly, increasing the potential for slippage and failure. This scenario is only theoretical as no major structures have been identified or modeled at Cerro Moro at this time. |
For the analysis of prospects underground tunnels stability from the Project, was made a bidimensional numeric model of finite elements, considering the most significant cross sectional and the most adverse case, that correspond to the section with highest column of rock.
Extorre Gold Mines Limited
Cerro Moro Gold – Silver Project
Preliminary Economic Assessment | Page 227 |
The results of the bidimensional model let say the following:
| · | There will be local stress concentration on the lower corners and the roof of tunnels; however the maximum values of the major principal stress will not exceed 30 MPa. |
| · | There will be failure zones in the lower corners and hanging of the tunnels resulting from normal stress and shearing. The amount of failure will be proportional to the stresses due to shear and normal stresses on the lower corners and the roof of the excavation. The yielding zones are deeply linked to the stress concentration that was mentioned before. |
| · | There will be some failure zones in the lower corners and hanging of the tunnels as a result from normal stress and shearing. The amount of failure will be proportional to the stresses. |
| · | The displacement of the rock mass in the hanging-wall of the excavation will be less than 1.5 x 10⁻³ m (1.5 mm) and in the side-walls may reach a maximum of 1.5 mm. There is almost no risk of a tunnel collapse as these deformations correspond to displacements of less than 1%. |
| · | At depths of 300m or more, it will become necessary to install a mesh and bolts to control potential failure zones in the hanging wall of the tunnels. Diamond mesh should be used with 1.8m bolts set in a 2m x 2m pattern. |
| · | It will also be necessary to install a bolt and mesh support system in the crosscuts. The system should include I.8m bolts set at 1.5m x 1.5m spacing and diamond shaped mesh. |
“Unwedge” software was used to simulate and analyse the geotechnical behaviour of the excavations when supported with a systematic mining support system. This analysis indicates the support regimes required in different parts of the mine for Escondida Central, Escondida FW y Gabriela: 1.8 m long rock bolts installed in a 2m x 2m pattern, installed immediately there is any evidence of the formation of unstable wedges in the hanging or sidewalls. The installation of rockbolts 1.8 meters long and 2 x 2 meters of pattern, for the purpose avoid the block fall from the tunnels roof. Is necessary to mentioned that this support system is punctual and should be applied in sectors that favorable condition for the wedge appearance.
In order to determine the geotechnical influence on mining dilution at the edges of the vein, a detailed study was made of the vein-intersection photographs (5m either side). As a result of this study AKL provided the following guidance on stoping dilution.
Escondida Central: A total of 17 drillholes, from 9 sections were reviewed. Forecast dilution in this case is 300 mm on either side of the vein.
| · | Escondida Far West: A total of 74 drillholes from 21 sections were reviewed. Forecast dilution in this case is 400mm on either side of the vein. |
| · | Zoe: A total of 73 drillholes from 18 sections were reviewed. Forecast dilution in this case from section 2679055 to section 2678470 was 300mm on either side of the vein and from the section 2678470 to section 2678310 400mm on either side of the vein. |
Extorre Gold Mines Limited
Cerro Moro Gold – Silver Project
Preliminary Economic Assessment | Page 228 |
| 16.3 | Hydrology and Hydrogeology |
As part of the hydrogeological study of Cerro Moro, the followed prospects were evaluated in detail: Escondida, Esperanza, Gabriela, Silvia Carla, Casius, Lechuzo, Deborah, Moro, and Nini. The piezometric characteristics of a total of 293 drill holes were measured for the study. In addition, a total of 18 new holes were either drilled or re-drilled in order to carry out pumping tests, and a further 17 drill holes located in close proximity to these new holes were selected to carry out constant head tests (slug tests). The main purpose of the slug tests was to provide information on the boreholes’ construction quality, the ideal pumping rate, transmissivity (T), the aquifer's storage factor (S) and permeability (K), and to test for the existence of nearby impervious barriers or borders, zones of recharge / discharge, and areas of fluid flow, etc. Water samples were also taken from tested holes and piezometers.
After completing a detailed field study and literature review of the Project, the conclusion may be drawn that no permanent water courses exist in the district. Indeed, the Project area contains a total of 38 endorheic superrficial water basins. From the perspective of underground water flows, the main “head” areas lie in the northern part of the Project area with the main discharge areas being located in the south. Another “head” area is located along the water divide separating the Project from the Laguna El Mosquito.
Distinct groundwater flow lines are identifiable depending on the sector, NW to SE, NE to SW, and N to S; gradients vary from 8% (North of Deborah) to 9% (North East of Escondida Far West) on the Eastern slope of the Tertiary gravel cover.
Hydrolithology
Three main hydrolithological units have been identified in the Project area.
Fractured rock unit (Chon Aike Formation): Volcaniclastic and acid volcanic rocks (ignimbrites, tuffs, and rhyolites), which only enable water circulation via its secondary porosity (density, fracture continuity and intercommunication, presence of joints, faults, open stratification planes), and degree of cementing and argillic alteration. This unit is considered to be a poor aquifer with water flow only being developed along the main fracture systems; in areas distal to these fracture systems, this rock unit forms an aquifuge.
Tertiary clay unit: Includes all rock types in the Patagonia Formation. In the Cerro Moro district, this geological unit is characterized by the predominance of clay over sand. As a direct result, this unit is characterized by low permeability and is therefore considered to be an aquitard. The Tertiary clay unit is located beneath the conglomerates of the La Avenida Formation, and overlies the Chon Aike formation volcanic rocks and pyroclastics.
Extorre Gold Mines Limited
Cerro Moro Gold – Silver Project
Preliminary Economic Assessment | Page 229 |
Tertiary conglomerate unit:The plateau-like mesetas of sandy gravels that constitute the La Avenida formation are the best water receivers and transmitters to the undersoil, due to their coarse texture and meager gradient. The Tertiary conglomerate unit is typically less than 10 m in thickness, although in specific locations may attain a thickness of up to 20 m. The Tertiary conglomerate unit is the region's most important phreatic aquifer, with the recharge index being higher than for the rest of the exposed rocks (values of 13% were recorded near the city of Tellier; González Arzac, CFI, 1989).
Conceptual hydrogeological model
Given the heterogeneous nature of the local geology, no one single conceptual hydrodynamic model can be applied to the Cerro Moro district. Indeed, it is possible to summarize the likely underground recharge, circulation, and unload alternatives into three models:
In the first model, a scenario in which gravels of the La Avenida Formation are exposed was considered. In response to the high permeability of the gravels, rainwater easily percolates to the phreatic level (and noting that water movement within the phreatic level generally has a regional component towards the east). A portion of the water is also transferred to the pebbles' basement, formed by the marine sedimentary rocks of the Patagonia formation. As the latter have aquitard characteristics, water is unable to permeate through them.
The second model considered the fact that volcanic and sedimentary rocks of the Bahia Laura Group rocks are found at the surface of an endorheic depression. In this scenario, water filters to the bedrock from recharge areas, in deeply fractured areas, and percolates down the rocks' fractures to the piezometric level, which occurs at varying depths. Subsequently, the groundwater flow mostly follows the principal fault zones in the Project area, which generally coincide with, or are parallel to, mineralized veins. Below the endorheic depression, there would be a vertical water flow exchange, which could also be horizontal depending on the season.
The third scenario is a variation of the second: water percolates via the surface fractures of the Jurassic-age bedrock, or by percolation in the valleys' porous sedimentary rocks. After moving through the transit area in steep slopes (greater gradient), water becomes "stagnant" under the canyons' riverbeds, thus enabling a portion of the water to evaporate. After having analyzed the geological and geotechnical profiles of the drill holes, and having evaluated the hydraulic information derived from the drill holes, it was possible to conclude, that beyond around 80-meters in depth, the rocks are compact and do not permit significant groundwater circulation.
Hydrodynamic modeling results
In order to simulate the hydrogeological model under the different geological scenarios and with time, modeling was undertaken using a Modflow combination in its original version, with Modflow2000 inside the Groundwater Vistas graphical environment.
Extorre Gold Mines Limited
Cerro Moro Gold – Silver Project
Preliminary Economic Assessment | Page 230 |
The technical criteria and bibliographical background recommended working with a 4% underground recharge rate. This index was used for all the hydrodynamic modeling. Rainfall was estimated at 207.5 mm/year, implying an Rd of 0.00002274 m/d.
Storage indexes for the fractured mean ranged from a maximum of 0.011 to values within the 2 E10-5 area. The highest transmissivities were around 58.4 m2/day, while the lowest were around 0.08 m2/day, which reflects how heterogeneous and anisotropic the medium is. In Escondida, cones of depression obtained from modeling do not go beyond the model's limits, except for in hole GW-01, in which the cone may continue for some 300 m in a N-NW orientation. In further detail, depression cones do not cover the mining area, not even during the fifth mining year.
According to Piper's classification, waters are generally sodium chloride, although there are certain exceptions: slightly sodium-bicarbonate-chloride waters, sodium-bicarbonate-chloride waters, and – to a lesser extent – sodium-sulphate-bicarbonate-chloride waters and sodium chloride bicarbonate waters. The modeling area's hydrogeological resources (15.81 km2) total 753.615m3, and reach a sustainable pumping level of 615.34 cubic metres/day for the modeled area.
Extorre Gold Mines Limited
Cerro Moro Gold – Silver Project
Preliminary Economic Assessment | Page 231 |
A treatment plant capable of processing 474,500 t/y of the gold-silver mineralized rock from the various deposits at the Project is proposed. The design incorporates both flotation and gravity recovery stages to maximise recovery from the variable mineralogy particularly of the silver minerals. Due to the high silver to gold ratios for the deposits – overall average ratio of 60:1 silver gold – the Merrill Crowe (zinc cementation) process has been included instead of adsorption onto carbon for the recovery of precious metals from the leach solution. The plant design is intended to comply with the requirements of the International Cyanide Management Code. Figure 101 is the process flow diagram for the proposed circuit.
A three stage closed circuit design has been selected for the crushing circuit. The circuit is designed for single shift crushing with a design throughput rate of 200 tonnes per hour.
The primary crusher will be a single toggle jaw crusher with a 1,000 mm by 850 mm opening. An apron feeder will transfer feed stock from a 100 tonne capacity run of mine (“ROM”) bin to a vibrating grizzly feeder that will scalp the rock greater than 100 mm into the jaw crusher. Jaw crusher product and grizzly undersize will be transferred to the product screen feed conveyor by the primary crusher discharge conveyor. An in-line belt magnet will remove tramp metal at the head chute of the primary crusher discharge conveyor.
The secondary and tertiary crushers will be standard and shorthead cone crushers respectively that will operate in closed circuit with the product screen. The product screen will be a double deck banana screen 2.4 m wide by 7.3 m long with polyurethane panels on both decks having nominal cut sizes of 30 mm and 12 mm for the top and bottom decks respectively. Oversize from the top deck will be conveyed to the secondary crusher feed bin while the oversize from the bottom deck will be conveyed to the tertiary crusher feed bin. Static tramp metal magnets will be positioned over each of the cone crusher feed conveyors and metal detectors used to trip the conveyors in the event tramp metal that could damage the crushers has not been removed by the magnets.
The cone crushers will be 1,535 mm in size with an installed motor power of 355 kW and will operate with a 28 mm closed side setting for the secondary crusher and 10 mm for the tertiary crusher. Metso Minerals Bruno crushing simulation package was used to determine the equipment sizes and tonnage rates for the mass balance in the crushing plant.
Extorre Gold Mines Limited
Cerro Moro Gold – Silver Project
Preliminary Economic Assessment | Page 232 |
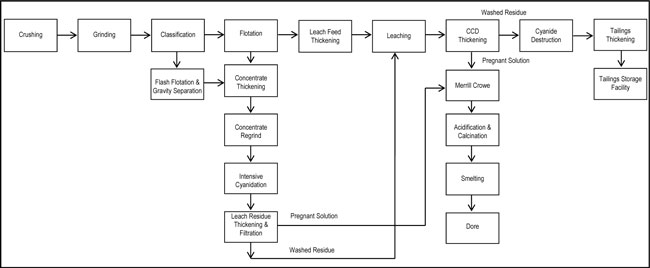
Figure 101 Overall Flowsheet (Source: GRES, 2011)
Extorre Gold Mines Limited
Cerro Moro Gold – Silver Project
Preliminary Economic Assessment | Page 233 |
Crushed product with a P100 of 12 mm and a P80 of 8.5 mm will be conveyed for storage in the crushed product bin. The crushing rate will be monitored by a weightometer located on the crushed product bin feed conveyor.
All transfer points will be enclosed and fitted with dust extraction hoods. This will minimize the use of water for dust suppression. The dust will be discharged from the dust collector into the crushing area sump pump and pumped to the mill discharge hopper.
| 17.3 | Crushed Product Storage and Reclaim |
To cater for single shift crushing a crushed product bin with a live capacity of 1,500 t will provide 24 hours of milling capacity and act as a buffer between the crushing and grinding circuits. The crushed product bin will be provided with an opening to permit the bin to be emptied in the event of a hang up and to produce a stockpile for feed through the emergency reclaim system to enable the grinding circuit to be fed if no crushed product is available from the bin.
A variable speed belt feeder will be used to remove the crushed product from a slot in the base of the crushed product bin.
The proposed grinding circuit design consists of a single stage overflow ball mill that will operate in closed circuit with hydrocyclones, flash flotation and gravity concentration machines. The fine crushed product size and use of a ball mill will enable stable throughput rates to be achieved on each mineralized rock type. The treatment rate will be 59 t/h and the grinding circuit will operate 24 hours per day, seven days per week. The inclusion of both flash flotation and gravity recovery devices will maximise the recovery of liberated precious metals minerals into a concentrate which will be reground to increase liberation and exposure of the gold and silver.
The grinding mill will be a ..88 m diameter (inside shell) by 4.88 m long (EGL) ball mill powered by a 2,000 kW motor. The mill will operate with a ball charge of 30% by volume and a top ball size of 80 mm.
The cyclone cluster will consist of four 250 mm diameter hydrocyclones (three duty – one standby) with an additional spare distributor outlet. There will be dual cyclone feed pumps arranged in a duty – standby configuration. The cyclone overflow will have a product particle size P80 of 75 µm.
| 17.5 | Flash Flotation and Gravity Concentration |
To maximise the gravity recoverable precious metals a flash flotation machine and a centrifugal gravity separator will treat 80% of the cyclone underflow. The water added in the gravity circuit will displace ball mill feed water to minimize the impact on the density in the grinding mill.
Extorre Gold Mines Limited
Cerro Moro Gold – Silver Project
Preliminary Economic Assessment | Page 234 |
The feed to the gravity circuit will be split from the cyclone underflow which will report to a screen to remove the +3 mm particles. The cyclone underflow stream has been selected as the gravity circuit feed because the precious metals will tend to be concentrated in this stream due to the preferential separation of higher density minerals to the cyclone underflow. The cyclone underflow will also be essentially deslimed so that the effects of viscosity will be minimized in the gravity circuit.
The flash flotation machine will be a SkimAir SK240 fitted with a dual outlet whereby the top outlet will remove a low density stream containing mostly water that will be directed to the mill discharge hopper. This arrangement will reduce the water reporting to the mill feed and help maximise the mill density. The SK240 with a cell volume of 8 m³ will provide a residence time of 5 minutes. The tailing from the flash machine will report directly into a 760 mm diameter centrifugal gravity recovery machine. Tailing from the centrifugal concentrator will report to the feed of the ball mill. Concentrate from the gravity concentrator will combine with the flash flotation concentrate and be directed to the concentrate regrind circuit.
The cyclone overflow reports to a conventional flotation circuit to enhance recovery of gold and silver minerals for the subsequent concentrate regrind and leaching stages. The flotation circuit will consist of a single roughing stage of three 10 m³ tank flotation cells. Cyclone overflow slurry will be screened on a trash screen to remove any coarse particles, wood fibre or other trash before the flotation process is commenced. Undersize from the trash screen flows directly to the rougher flotation cells. The trash screen oversize (trash) is rejected to a trash bin for disposal as waste.
Flotation reagents used will be potassium amyl xanthate (collector) and Interfroth 50 (frother) while copper sulphate (activator) has also been allowed for in the flowsheet. The rougher flotation concentrate will be combined with the flash flotation and gravity concentrates and directed to the concentrate regrind circuit. The rougher flotation tailings will report to the leach feed thickener hopper, from where the slurry will be pumped to the leach feed thickener.
| 17.7 | Gravity and Flotation Concentrate Handling |
The combined flash flotation, gravity and rougher flotation concentrates totalling approximately 4.1 t/h of solids will be thickened in the concentrate regrind feed thickener and then reground in an M500 IsaMill™ to a product size P80 of 30 µm and powered by a 200 kW motor.
The concentrate regrind feed thickener will provide a feed density for the IsaMill™ of 50% solids. The concentrate regrind feed thickener underflow will be pumped to a static screen to ensure tramp metal and larger rocks do not enter the IsaMill™. Process water recovered from the regrind feed thickener overflow will be directed to the settling pond via the non-cyanide thickener overflow tank.
Extorre Gold Mines Limited
Cerro Moro Gold – Silver Project
Preliminary Economic Assessment | Page 235 |
The use of ceramic media in the regrind mill will minimize the effect of iron on cyanide consumption and leach kinetics. The reground concentrate will be pumped to an intensive leaching circuit where it will be leached on a continuous basis.
The intensive leaching circuit consists of five agitated leach tanks. Each tank has a capacity of 50 m³ slurry, resulting is a total leach retention time of 24 hours. Leaching will be conducted at 32% solids using a solution of 1% sodium cyanide and 0.2% sodium hydroxide. Oxygen will be sparged down the agitator shaft of each leach tank to maintain high dissolved oxygen levels in the pulp and thereby maximise leaching kinetics.
The leached residue will be thickened and filtered to remove soluble gold and silver. The leach residue thickener is a 5 m diameter high rate thickener capable of achieving an underflow density of 50% solids. The leach residue thickener underflow is pumped to the filter feed tank which will provide 24 hours of surge capacity prior to filtration. The thickened leach residue will be further dewatered by a 1.5 m wide by 15 m long vacuum belt filter with a filtration area of 17 m².
The resulting pregnant solution will then be pumped into the Merrill Crowe circuit with the pregnant solution from the main leaching circuit. The washed filter cake will be repulped and pumped back into the main leach feed circuit to maximise the gold and silver leach extraction.
The main leaching circuit design includes a leach feed thickening stage to maximise the recovery of non-cyanide contaminated process water prior to leaching and to minimize the volumetric capacity of the leaching train. A 9 m diameter high rate thickener was selected based on a settling flux rate of 1.0 t/m2h determined from test work to achieve an underflow density of 40% solids.
The leaching circuit design has been based on a leach feed density of 38% solids, an initial leach feed pH of 10.5 and the maintenance of a free sodium cyanide level of 1,000 ppm throughout the leach train via staged addition of cyanide. Oxygen will be sparged down the agitator shaft of each leach tank to maintain high dissolved oxygen levels in the pulp and thereby maximise leaching kinetics. The leaching circuit will provide a residence time of 48 hours. Five stages of leaching have been incorporated into the design to minimize short circuiting and maximise turn-over of slurry in the leaching stage. The pH of the leach tail slurry will be maintained at above 10.7 to provide the best conditions for flocculation in the CCD thickeners.
The leach tail will flow to the first of five CCD thickeners which will be used to separate and recover the solution phase carrying the dissolved precious metals from the residue solids. Pregnant solution will be removed from the first CCD thickener. Barren solution from the Merrill Crowe zinc cementation circuit will be added to the fifth (last) CCD thickener as the wash solution.
Extorre Gold Mines Limited
Cerro Moro Gold – Silver Project
Preliminary Economic Assessment | Page 236 |
A five stage CCD circuit has been selected to achieve a wash efficiency of 99% due to the difficulty filtering the slurry, which has a high inherent fines content due to the presence of illite clay. The CCD thickeners will be 9 m diameter high rate thickeners. Underflow hoppers will be provided to maximise mixing of the wash (‘barren’) solution from the second thickener down the line, with the underflow from any particular CCD thickener. Washing efficiency will therefore be improved.
The Merrill Crowe circuit has been designed on the basis of information from existing operations and laboratory test work.
The Merrill Crowe circuit will be a vendor supplied package with a volumetric capacity of 190 to 380 m³/h. It will be designed to handle pregnant tenors between 2 to 6 ppm gold and 52 to 207 ppm silver.
The design envisions recycling the barren solution from the Merrill Crowe circuit to the back of the CCD circuit as wash water and also using this solution to provide the flocculant dilution water in the CCD circuit. Excess cyanide containing water will be directed to the cyanide destruction circuit.
The following process additives will be necessary to operate the processing facilities:
| § | Potassium Amyl Xanthate; |
| § | Liquefied petroleum gas (LPG); and |
Extorre Gold Mines Limited
Cerro Moro Gold – Silver Project
Preliminary Economic Assessment | Page 237 |
Reagents will be received to site, mixed and dosed as outlined in Table 80.
| Reagent | | Packaging | | Mixing | | Storage | | Dosing |
| Frother | | 1000 litre IBC | | N/A | | 1.0 m³ | | VS metering pump |
| Potassium Amyl Xanthate | | 25 kg bags | | Bag splitter to 0.25 m³ enclosed, ventilated, agitated tank | | 0.5 m³ | | VS Metering pump |
| Copper Sulphate | | 1,200 kg bags | | Bag splitter to 12 m³ agitated tank | | 24 m³ | | VS metering pump and ring main dosing valve |
| Hydrated Lime | | Bulk | | 200t silo, feeder, vortex mixer | | 30 m³ | | Circulating pump, ring main, dosing valves |
| Sodium Cyanide | | 1000 kg boxes | | Bag splitter to 25 m³ enclosed, ventilated, agitated tank | | 50 m³ | | Circulating pump, ring main, dosing valves |
| Sodium Hydroxide | | Bulk | | N/A | | 35 m³ | | Helical rotor pump |
| Oxygen | | Bulk | | N/A | | 6.59 m³ | | Sparged down leach tank agitator shafts |
| Sodium Metabisulphite | | Bulk | | 100t silo, feeder, 25 m³ agitated mixing tank | | 100m³ | | Circulating pump, ring main, dosing valves |
| Zinc Powder | | 400 kg bags | | N/A | | | | VS feeder |
| Diatomaceous Earth | | 400 kg bags | | Bag splitter to enclosed, ventilated, agitated tanks | | | | Centrifugal pumps |
| Sulphuric Acid | | 1,000 litre IBC | | N/A | | 1.0 m³ | | Air diaphragm pumps |
| Flocculant | | 25 kg bags | | 200 kg hopper, feeder, wetting head, 6 m³ agitated mixing tank | | 12 m³ | | VS metering pumps (one to each thickener) |
| LPG | | Bulk | | | | 15.0 m³ | | |
| Smelting Fluxes | | 1000 kg bags, 25 kg bags | | N/A | | | | |
Table 80 Details of reagent systems
The underflow from the last CCD thickener will be combined with excess barren solution and pumped at a pulp density of 38% solids to the cyanide destruction circuit. Cyanide destruction will be based on the Inco cyanide destruction process. The circuit will consist of two 250 m³ capacity agitated cyanide destruction tanks with a combined nominal residence time of 4 hours. Sodium metabisulphite, copper sulphate and lime will be added to the first cyanide destruction tank. The WAD cyanide level can be reduced to less than 1.0 ppm using this circuit if required.
Extorre Gold Mines Limited
Cerro Moro Gold – Silver Project
Preliminary Economic Assessment | Page 238 |
Tailings Thickening
The tailings from cyanide destruction will be pumped to the tailings thickener for thickening to 55% solids prior to disposal in the tailings storage facility. The tailings thickener will be a 9 m diameter high rate thickener.
Raw water will be produced from desalination plants on the coast and be pumped to site. Raw water will discharge into the raw water pond (nominal capacity 3,000 m³). The raw water pond will be fitted with 1.0 mm thick high density polyethylene (HDPE) liner.
One of two raw water pumps, arranged in a duty – standby configuration, will draw water from the base of the raw water pond to feed non-contaminated raw water to the following:
| § | Crusher area and water sprays, |
One of two gland water pumps, arranged in a duty and standby configuration, will draw water from the base of the raw water pond to feed raw water to gland seals on the horizontal slurry pumps in the process plant.
The gravity fluidising water pump will draw water from the base of the raw water pond to supply fluidising water to the centrifugal gravity concentrator.
The raw water pond will overflow into the process water pond (nominal capacity 3,000 m³). The process water pond will be fitted with 1.0 mm thick HDPE liner. One of two process water pumps, arranged in a duty - standby configuration, will draw from the base of the process water dam to feed process water to the following:
| § | General 25 mm NB hose down points throughout the plant, |
| § | Grinding area dilution water, |
| § | Flocculant dilution water for leach feed and tailings thickeners. |
A diesel operated fire water pump will draw from the base of the process water pond to supply hydrants distributed throughout the process facility.
Tailings return water, which will be contaminated with some fine solids, will be pumped to a settling pond to remove suspended solids. The overflows from the leach feed thickener and the tailings thickener will also be directed to the settling pond. The settling pond will overflow into the process water pond. The settling pond will be dosed with sulphuric acid to ensure the process water is maintained at approximately neutral pH to ensure the flotation performance is not adversely impacted.
Extorre Gold Mines Limited
Cerro Moro Gold – Silver Project
Preliminary Economic Assessment | Page 239 |
Potable water will be supplied to both the potable water tank and fresh water tank from the raw water supply. The potable water tank will be a 9 m³ capacity HDPE tank. One of two potable water pumps, arranged in a duty – standby configuration, will draw water from the potable water tank to supply the process plant and the safety shower water tank. The fresh water tank will be a 23 m³ capacity HDPE tank. One of two fresh water pumps, arranged in a duty – standby configuration, will draw water from the fresh water tank to supply seal water to the vacuum pump and the regrind mill. The safety shower water tank will be a 23 m³ capacity HDPE tank. One of two safety shower circulating water pumps, arranged in a duty – standby configuration, will draw from the safety shower water tank to feed a set of accumulators and safety showers distributed throughout the processing facility. The safety shower accumulator bank will maintain the pressure in the safety shower piping network in the event of power failure or shutdown of the safety shower circulating pumps.
Given the presence of both flotation and leaching circuits in the process facility the design philosophy has been to ensure that non-cyanide and cyanide containing process water are effectively segregated. Non-cyanide process water from the leach feed and tailings thickeners will be directed to the process water pond via the settling pond. Cyanide containing process water from the Merrill Crowe circuit will be recycled as wash water in the CCD thickeners and also to provide the flocculant dilution water in the CCD circuit. Excess cyanide containing water will be directed to the cyanide destruction circuit.
A set of three wet screw air compressors will generate plant air which will be stored in a plant air receiver with 5 m³ capacity. Plant air will be distributed around the plant to hose points in 25 mm NB galvanised steel pipeline. 1.0 m³ capacity air receivers will be situated at the laboratory and plant workshop facilities.
A pipe from the plant air receiver will be filtered and dried in a refrigerated drier before being directed to a 1.0 m³ capacity instrument air receiver. Instrument air will be reticulated to instruments throughout the plant from this air receiver.
Flotation air will be supplied by two dedicated blowers arranged in a duty-standby configuration. Dedicated compressors will provide low pressure air for the cyanide detoxification process.
Power will be supplied to the site by the local supply authority at 11,000 Volts.
A 13,000 V switchboard will be installed in the wet plant switchroom. The switchboard will comprise an incoming circuit breaker, two transformer feeders and a starter for the mill drive motor.
The transformer feeders will supply a 1,500 kVA 13,000 V/415 volt step-down transformer for the Wet Plant 415 V Motor Control Centre (MCC) and a 1,000 kVA 13,000/415 Volt transformer for the Crushing and Screening 415 V MCC.
Extorre Gold Mines Limited
Cerro Moro Gold – Silver Project
Preliminary Economic Assessment | Page 240 |
The transformer will be located in a bunded and fenced compound adjacent to their switchrooms.
The wet plant 415 V MCC will also supply power to the Gold & Reagent Area MCC, site offices, and stores and workshop areas.
The switchrooms will be prefabricated, air-conditioned buildings constructed of Colorbond polystyrene sandwich panels on a substantial steel base and fitted with VESDA smoke detection and hand held fire extinguishers. The switchrooms will be elevated above the ground on either concrete or steel plinths to allow for the installation of cables entries from below.
The switchrooms will house the medium voltage switchboards, 415 V MCCs, variable speed drives, lighting and small power distribution boards and programmable logic controller (PLC) cubicles.
The 415 V MCC will be of form 4 design either single sided or back to back construction and arranged for connection from below. The PLC equipment associated with the motor control modules will be built into one or more tiers of the MCC and the PLC inputs and outputs (I/O) will be hard wired between drive modules and the PLC racks.
Communications between the MCC and control system human machine interface (HMI) will be via Ethernet and will be by fibre or copper as appropriate.
Generally low voltage (LV) drives above 200 kW will be equipped with electronic soft-starters with integral bypass contactors to reduce heat dissipation and these will be housed in the MCC tiers. LV variable speed drives will be VVVF six pulse type and will be either wall or floor mounted depending upon their size and weight.
All drives will have local control stations with start and stop buttons adjacent to the drive to provide local control for maintenance. All major drives will also be remotely operable from the central control room via the operator interface terminal. The operating status of all drives will be displayed on the operator interface mimic pages. Any drive fault will be reported by the control system and an alarm will be initiated and logged.
Control voltage for all drives and local controls will be 24 V DC.
Cable ladders to be installed throughout the plant will be NEMA 20B type, hot dipped galvanised. Where necessary cable ladder bends, risers, tees and reducers of the same specification will be installed. Peaked cable ladder covers will be installed where cables in the ladder are subjected to direct sunlight or the potential for mechanical damage.
All LV power and control cables will be either CPVCPVC or CXLPEPVC armoured cables. Screened cable will be used for all variable speed drive applications. All HV cables will be CXLPEPVC with copper screened conductors and wire armouring.
Extorre Gold Mines Limited
Cerro Moro Gold – Silver Project
Preliminary Economic Assessment | Page 241 |
High pressure sodium and metal halide light fittings will be used for general plant lighting. Battery back- up lighting will be installed in all switchrooms and access ways to ensure safe evacuation in the event of a blackout. All LV power circuits and sub circuits will be protected by instantaneous residual current devices (RCD).
The process plant control system will be a PLC based system. The HMI will utilise standard personal computers running Citect software. The main control room will be located in the wet plant area with a subsidiary control room in the crushing and screening area.
Two visual display units (VDU) will be installed in the main control room and one in the crushing and screening control room these will provide the operator interface. These VDU’s will present the operator with graphical process information in the form of trends, mimic pages, alarm summaries, logs and reports. This interface will also enable the operator to start and stop equipment, control variable speed drives and alter process set-points.
The adjustment of controller parameters will be made from the controller face plate and it will be possible to password protect this adjustment to prevent unauthorized adjustments. Display screens will be configured for the trending of individual or related parameters and a number of alarm pages will be developed to allow the setting of alarm points attached to various parameters. All analogue input signals including outputs from flow, pressure, temperature and weighing instruments will be displayed appropriately on mimic pages. A short term trend plot for each input and output from the system can be provided where required on the mimic pages.
The analogue and digital input and output (I/O) associated with the plant instrumentation will be cabled to one or more process control cubicles (PCC) within the plant areas. The PCC’s will be located within the area switchroom and will house the PLC racks, instrumentation power supplies and communication hardware. Communications between the PCC’s and control system HMI will be via Ethernet and will be by fibre optic or copper cable as appropriate.
Extorre Gold Mines Limited
Cerro Moro Gold – Silver Project
Preliminary Economic Assessment | Page 242 |
| 17.16 | Projected Energy, Water, Process Material Requirements |
The projected energy, water and process material requirements are itemised in Table 81.
| Item | | Usage |
| Interfroth 50 (kg/t) | | 0.190 |
| Potassium Amyl Xanthate (kg/t) | | 0.075 |
| Copper Sulphate (kg/t) | | 0.973 |
| Hydrated Lime (kg/t) | | 11.483 |
| Sodium Cyanide (kg/t) | | 3.700 |
| Sodium Hydroxide (kg/t) | | 0.596 |
| Oxygen (m3/t) | | 0.100 |
| Sodium Metabisulphite (kg/t) | | 10.999 |
| Diatomaceous Earth (kg/t) | | 0.435 – 0.988 |
| Zinc (kg/t) | | 0.456 |
| Sulphuric Acid (kg/t) | | 32.119 |
| LPG (L/t) | | 0.097 – 0.290 |
| Flocculant (kg/t) | | 0.141 |
| Grinding Balls (80 mm) (kg/t) | | 2.35 |
| Ceramic Media (kg/t) | | 0.021 |
| Borax (kg/t) | | 0.224 – 0.717 |
| Silica (kg/t) | | 0.095 – 0.304 |
| Nitre (kg/t) | | 0.030 – 0.097 |
| Soda Ash (kg/t) | | 0.030 – 0.097 |
| Power (kWh/t) | | 59.1 |
| Water (m3/t) | | 0.81 |
| Note: | Zinc, diatomaceous earth and LPG consumption dependent on head grade. |
Table 81 Projected Energy, Water and Material Requirements
Extorre Gold Mines Limited
Cerro Moro Gold – Silver Project
Preliminary Economic Assessment | Page 243 |
| 18. | PROJECT INFRASTURUCTURE |
This section outlines the infrastructure associated with the proposed Cerro Moro development.
Water demand for the process plant is based on initial operating conditions and the conditions that would prevail should there be no reclaim water available from the tailings storage facility. As such, the plant will require a borefield capable of producing up to 50 m³/h; when operating with the design return water from the tailing storage facility, the demand when operating will reduce to 45 m³/h.
A borefield has been identified and developed to the top of the bore casing that is capable of producing 31 m³/h and additional capital costs have been included for the development of additional bores to meet the plant throughput requirements.
The capital costs allow for the design and supply a borefield pumping system from the top of the bore holes (including pumps and rising mains) to the raw water tank at the process plant. Each bore pump will be driven by a diesel generator feeding switchgear in a control panel controllable via telemetry.
The capital costs include provision for the establishment of pipeline access track. The track will provide maintenance access for the borefield equipment.
| 18.1.2 | Process Plant Earthworks |
The plant and its associated infrastructure is contained in an area approximately 45,000 m2 and has been located by topographical information as provided by Extorre. The location has been selected to avoid, as much as possible the prevailing winds, local water courses and sandy river beds while taking advantage of hills for building the ROM pad.
The cost estimates assume that 100 mm of top soil will be removed across the site and stored within 500 m of the plant site for future reuse during mine closure. Based on geotechnical investigative work carried out for the plant site, the estimate assumes that detailed excavation and backfill with selected material will only be required under the heavy foundation loads expected for the ROM bin, crushers, mill and major building foundation areas. The balance of the site will be cut to provide appropriate cross falls for drainage to site open drains and backfilled with material using cut and fill. Allowance has been made in the cost estimate for the mobilisation of a contract crushing plant for the production of suitable gravels for site earthworks and engineered fill.
Plant site drainage will be via these cross falls and then into drains directed to a lined site drainage dam. A two compartment water (raw and process water) dam will also be constructed as part of the site earthworks scope of work.
Extorre Gold Mines Limited
Cerro Moro Gold – Silver Project
Preliminary Economic Assessment | Page 244 |
| 18.1.3 | Run of mine (ROM) Area |
The ROM pad will be constructed from development waste provided by the mining contractor using mine waste.
The plant estimate includes provision for the supply and erection of a concrete wall for the crushing plant.
Internal process plant roads will be formed and compacted from local gravels. A graded track to provide access to the borefield from the treatment plant has also been included within the water supply capital costs.
Access from and to the site will be via 13 km of access road from the plant site interior roads to the provincial road. Provision has been made in the infrastructure costs to construct this 13 km access road to allow for truck access.
It is assumed, for the purposes of the capital cost estimate that suitable gravel material will be available in borrow pits to be established along the access road.
Construction water will be sourced from existing bores located on the Project site. Water will be pumped from these bores into temporary ‘turkey nest’ dams established at suitable locations along the road. Diesel hire pumps will be used to transfer water from the temporary dams to water trucks provided by the site earthworks contractor.
Provision has been made for the construction of exploration, permanent and construction accommodation facilities at the site. Costs associated with the supply of food and accommodation at Cerro Moro and payment of any travelling time per employee for the duration of the construction period have been included in the man-hour rate build-up.
The construction facilities have been assumed to be hire facilities for the duration of the construction period, with demobilisation and off hire of the units once the process plant is complete.
Sewage treatment facilities, potable water supply facilities and power supply facilities will be installed to handle the full capacity of the exploration, permanent and construction camps.
Electrical power will be supplied to the Project via a 132 kV line that will connect to the Argentine national grid (“Sistema Argentino de Interconexion”) at a point located on National Highway 281 between the communities of Antonio de Biedma and Tellier. From Antonio de Biedma, the Cerro Moro High Voltage (HV) power line will broadly follow Provincial Route 66 southwards, crossing the Deseado River in the area of Paso Gregores and then continuing southwards to the Estancia El Mosquito and to the Project. At Cerro Moro, a transformer station with two secondary coils will reduce the 132kV input to 33kV and 13.2kV. Peak electrical consumption for the Project has been estimated at 12 MW.
Extorre Gold Mines Limited
Cerro Moro Gold – Silver Project
Preliminary Economic Assessment | Page 245 |
Three possible alternative routes for the HV power line between Antonio de Biedma and Cerro Moro were originally evaluated, with the final option (Figure 102) having been selected on the basis of representing the shortest route (72 km) and crossing the least number of third-party surface right holders (“estancias”). Preliminary designs for the 132 kV line contemplate the use of towers 25 m in height, spaced either 250 m (steel towers) or 300 m (concrete towers) apart, with a minimum ground clearance for transmission cables of 7 m in rural sectors and 7.5 m in the vicinity of roads / highways. An Environmental Impact Assessment for the proposed power line has been presented to Santa Cruz Authorities.

Figure 102 Proposed power line route for the Project
The major site fuel storage will be located adjacent to the mining contractors’ workshop. The fuel farm will be constructed using self bunded fuel tanks. This will provide storage for the mining fleet and the process plant mobile equipment. The tanks will be installed directly onto an earthen pad constructed for the fuel storage area.
Extorre Gold Mines Limited
Cerro Moro Gold – Silver Project
Preliminary Economic Assessment | Page 246 |
| 18.1.8 | Potable Water Supply |
A reverse osmosis (RO) plant will be installed on the bank of the plant water dam. The bore water transfer pumps will pump to a RO plant feed tank situated alongside the RO plant. The RO plant feed tank will overflow to the plant water dam. Cleaned water from the RO plant will be directed to an ultraviolet stabiliser and then to the plant potable water tank. A set of pressure sustaining pumps and accumulators will be used to reticulate potable water to service points around the plant and associated infrastructure areas.
Potable water storage and distribution to safety showers in the process plant and to administration, workshop and control rooms in the plant along with power supply to the equipment in the potable water area are included in the process plant capital costs.
A waste treatment system has been allowed in the capital cost estimates for waste streams from the Project. The waste water system will be established adjacent to the administration building.
Provision for the supply and installation of pits and submersible machination pumps have been allowed adjacent to the plant ablutions building and the mine services workshop. These two submersible pumps will transfer effluent to the waste water system adjacent to the administration building.
A light vehicle wash down facility will be provided capable of cleaning vehicles up to 8 tonne truck size.
A fresh water tank fitted with a high pressure water pump will be installed along with a buried oil/water separator. A purpose built concrete slab will be designed to drain to the oil water separator.
Cleaned effluent from the separator will be returned to the process water streams in the process facility.
| 18.1.11 | Heavy Vehicle Workshop |
Heavy vehicle workshop facilities for the mining fleet will be provided by Extorre.
| 18.1.12 | Administration Office Complex |
A centralized administration complex will be provided at the process plant. The office will consist of transportable modules complexed together to form a single building. Site installed colorbond verandas will be installed around the perimeter of the building.
Extorre Gold Mines Limited
Cerro Moro Gold – Silver Project
Preliminary Economic Assessment | Page 247 |
| 18.1.13 | Stores and Plant Maintenance Workshop |
A combined stores and workshop building will be constructed. The building will be a steel frame building with a central partition segregating it into a stores building and a maintenance workshop building.
The workshop will also have a personnel access (PA) door connecting to a transportable workshop/stores office. The workshop will be provided with hi-bay lighting. Provision has been made in the capital cost estimates for workshop fit out, tools or equipment.
A roller door at the front and rear of the maintenance building will be installed to provide drive through access into a fenced stores yard. A double access gate at the front of this yard will enable vehicle access to the stores yard.
Provision for a three sided reagents stores building has been made to be located adjacent to the reagent mixing and storage facility.
Two 12 m x 3 m transportable building will be installed near the stores/workshop building. One of these transportable buildings will be outfitted as a male/female ablutions building, the other will be established as a crib room. Provision has been made to outfit this building with a sink, pie warmer, microwave oven, hot water facilities and benches.
Refuse from the ablutions and crib rooms will be plumbed to a below ground concrete tank fitted with a submersible grinder pump and automatic level control, this pump will transfer effluent to a central sewerage treatment facility situated adjacent to the main administration office.
Provision of a PABX system (mobile satellite connection) and a local UHF radio system for the mining process plant and administration facilities will be established.
| 18.2 | Puerto Deseado Facilities |
The office facilities in Puerto Deseado will be utilized for administration of the Project requirements for liaison with local authorities, expediting cargo through the port and procurement requirements.
The office facilities in Puerto Deseado will be the main contact point for labour employment and subcontractor prequalification.
A contract analytical laboratory will be established in Puerto Deseado that will handle all grade control assays for mining (approximately 100 samples per day) and all process plant assays required for operating of the process plant.
Extorre Gold Mines Limited
Cerro Moro Gold – Silver Project
Preliminary Economic Assessment | Page 248 |
The laboratory will consist of all solution and sample preparation equipment, AAS instrumentation, dust extraction systems and fire furnace for assays necessary to handle the high quantity of samples required to undertake grade control for the mine.
The explosives magazine has been designed taking into account an estimated replenishment time of 45 days. The minimum stock was estimated as being 40,000 kg of ammonium nitrate, 57 kg of detonating cord, and 930 kg of detonators, which will be stored in a magazine area of 3,000 square metres with 2 containers for high explosives and 2 equally-sized containers for the detonators warehouse, all protected by a border fence. A temporary underground magazine is considered, capable to store explosives for 15 days.
The maintenance workshop for both heavy mining equipment and light vehicles will cover an area of approximately 1,945 square metres, and will be located within a precinct covering a total area of 5,093 square metres. Both the vehicle washing area and mud separation unit will be located separately.
| 18.3.3 | Underground Ventilation |
Fresh air will be introduced into the mine through a central raise equipped with one 200 kW fan, and then into the stopes, through the corresponding accesses. Mine air will exhaust from the stopes through the upper levels connected to the exhaust raises where 56 kW fans will be installed; exhaust air will also exit the mine through the main haulage decline and secondary vein raises.
| 18.3.4 | Refuge and Escape Shaft |
Mine refuges consist of a transportable, hermetically sealed, 20-person cabin. In the case of fire, personnel may take shelter within the cabin. An air scrubbing system constantly removes he excess CO2 to supply breathable air, and there is a CO detection system. The refuges are stocked with water, food and basic facilities for 48 hours. Cabin dimensions are 6.4 m length x 2.2 m wide x 2.2 m height. The location for refuges will be located at the side of the decline. Escape shaftways consist of a set of metal stairs installed in the main raise that connect to every level of the mine. The stairs will have a rest landing every 26 m and will exit to surface alongside the principal ventilation fan.
| 18.4 | Tailings Storage Facility |
Extorre engaged Ausenco to provide a conceptual level design for the TSF at Cerro Moro.
Extorre Gold Mines Limited
Cerro Moro Gold – Silver Project
Preliminary Economic Assessment | Page 249 |
Extorre requested Ausenco to design the tailings impoundment in two Phases, an initial phase comprising a small storage cell (Cell) close to process plant, and a second larger phase comprising a TSF divided into three expansion stages, sited to take advantage of favorable topography.
This is a scoping level study in which the conceptual engineering development has given preliminarily definition to the storage capacity, surface area required, earthwork quantities, embankment characteristics, waterproofing system, perimeter roads and monitoring system. This level of detail is sufficient to enable cost to be determined within a range of +/- 30%.
It should be noted that, where sufficient data was not available, the experts involved resorted to their previous experience. The preliminary engineering stage used existing geological, geotechnical and hydrological information. For subsequent stages, the referred information will have to be confirmed.
The selection of the potential TSF sites was based on qualitative and quantitative assessments
The qualitative study identified possible locations for the facilities within the area considered as easily accessible and with low social-environmental sensitivity. This study was conducted and agreed upon with Estelar.
A quantitative study was conducted on the most favorable sites, taking into account the required capacity, the expansion potential, the plant location, the roads and the related facilities. The quantitative parameters include the following aspects:
| · | Dam maximum height (crest elevation measured from the downstream toe); |
The criteria used for the conceptual engineering design were determined based on the information provided by Extorre.
Extorre Gold Mines Limited
Cerro Moro Gold – Silver Project
Preliminary Economic Assessment | Page 250 |
| DESCRIPTION | | UNIT | | THICKENED
TAILINGS | | SOURCE |
| Process data | | | | | | |
| Plan production rate | | tpd | | 1300 | | A |
| Tailings specific gravity | | t/m3 | | 1.5 | | A |
| Annual tailing production | | tpy | | 475,000 | | A |
| Operation cycle | | d/year | | 365 | | A |
| Percentage of tailing conducted to the storage facility | | % | | 100 | | A |
| Cell and TSF Storage Capacity | | | | | | |
| Cell (2 years) | | m3 | | 632,667 | | D |
| TSF (8 years) | | m3 | | 2,537,000 | | D |
| · Stage 1 (2 years and 3 months) | | m3 | | 720,500 | | D |
| · Stage 2 (2 years and 7 months) | | m3 | | 816,000 | | D |
| · Stage 3 (3 years and 2 months) | | m3 | | 1,000,500 | | D |
| Cell and TSF life: (accumulated) | | years | | 10 years | | D |
| Embankments | | | | | | |
| Slopes* | | H:V | | 2.0:1 | | D |
| Minimum safety factor for static conditions | | S.F. | | 1.5 | | C |
| Minimum safety factor for pseudo-static conditions | | S.F. | | 1.1 | | C |
| Minimum freeboard** | | m | | 2 | | D |
| Lining system | | simple/double | | simple | | D |
| Liner | | type | | LLDPE | | D |
| Liner thickness | | mm | | 1.5 | | D |
| Rain water management within the storage facility | | | | | | |
| Design storm return period | | years | | 1000 | | C |
| Channels section | | | | trapezoidal | | D |
| Minimum speed | | m/s | | 0.5 | | D |
| Maximum speed with no liner | | m/s | | 1 | | D |
| Maximum speed with liner | | m/s | | 4 | | D |
| Liner | | | | Riprap or gabions | | D |
| Slopes | | H:V | | 2.0:1 | | D |
| Minimum freeboard | | m | | 0.3 | | D |
| Maintenance road | | Yes/No | | Yes | | C |
* May vary in accordance with further geotechnical analyses of the soils
**Between crest level and maximum dam level.
References;A: Information or criteria provided by Estelar. –B: Standard industrial practice. -C: AV’s recommendations. –D: Criteria defined based on the detailed engineering development.
Table 82 TSF Design Criteria
Extorre Gold Mines Limited
Cerro Moro Gold – Silver Project
Preliminary Economic Assessment | Page 251 |
This table below shows the schedule and associated costs for constructing the various phases and stages of the tailings storage system at Cerro Moro.
Only the first Phase (Cell) will be completed at the start of the mine. This facility provides sufficient storage for two years at full production and will be equipped to enable tailings to be returned plant for retreatment in the event that recoveries are lower than anticipated in the early stages of production.
The main TSF will be constructed after the start of production, minimizing initial capital requirements
| Phase | | Time (in months) from the
start of operations | | Partial cost
(M USD) |
| Phase 1 - Cell | | 0 - 24 | | 6,9 |
| Phase 2 – TSF Stage 1 | | 24 - 51 | | 8,4 |
| Phase 2 – TSF Stage 2 | | 51 - 82 | | 4,8 |
| Phase 2 – TSF Stage 3 | | 82 - 120 | | 5,2 |
Table 83 TSF Scheduled Costs
| 18.4.5 | Tailing Storage Facilities |
Cell
The cell is a fully impounded roughly rectangular facility built close to the process plant. The cell is able to contain 2 years of normal production and has a facility to recirculate tailings to the plant. Once the first stage of the TSF is completed tailings can be transferred from the cell to the TSF leaving capacity for additional tailings in the cell if recovery problems are encountered.
TSF
The Tailings Storage Facility was projected in a natural depression area located southwest of the site determined by Extorre for the process plant. The depression presents moderate to gentle slopes to the south, and is part of a natural runoff system toward an endorheic depression.
An excavation of at least 0.30 m deep has been planned for removal of top soil (which will be stored separately). The excavation will also assist in levelling the surface making the installation of the impermeable membrane easier.
Ausenco’s preference is for the construction of a clear water pond in an area opposite the internal perimeter of the embankments, built in such a way that the tailings deposited during initial production behind the embankments. As the tailings settle a water pond will be formed near the edges of the facility, making water intake works considerably easier. At the detail engineering stage, a plan for filling the facility from the southern end will be developed.
Extorre Gold Mines Limited
Cerro Moro Gold – Silver Project
Preliminary Economic Assessment | Page 252 |
The location and elevation of the embankments to suit the design criteria was determined from satellite (topographical) images, Ausenco Vector’s staff during the site visits and guidelines provided by Extorre.
Each embankment is aligned with its subsequent embankment in such a way that they both meet at the greatest possible narrowing in order to maximise storage capacity. This minimizes the soil movements required to build the embankment.
Figure 103 presents a cross-section of South Dam 1, identified as Dam 1 in the drawings, which shows the elevations at the different stages of the Project.
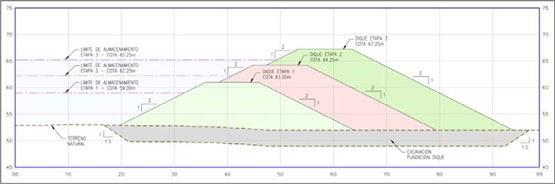
Figure 103 Construction stages
The embankments have been designed with a typical 2:1 (H:V) slope. However, in this case the embankments will be constructed using material obtained from mine stripping. Since there is no data on this material available at this time, the slopes gradients may need to be varied once material studies have been completed.
The planned depth of excavation for embankment foundations is 3.0m. However the actual depth may vary once geotechnical testing and soils studies have been completed.
Dam crests and transition between construction stages
The dam crest for each stage has been designed with a total width of 10 m, of which 5.60 m will be passable and the rest will form perimeter safety berms and anchoring trenches (Figure 104)
A 1 metre-wide double-lined berm is planned on the upstream face of the dam to provide a platform for the tailings transportation pipes.
Extorre Gold Mines Limited
Cerro Moro Gold – Silver Project
Preliminary Economic Assessment | Page 253 |
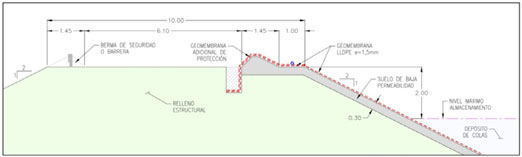
Figure 104 Dam crest diagram
Figure 105 shows in greater detail the geomembrane anchoring trench that will be constructed on the dams’ crests at each stage.
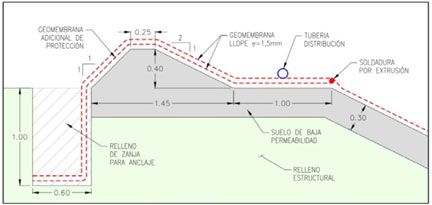
Figure 105 Geomembrane anchoring detail
Figure 106 shows the transition between construction stages. A 0.30 metre thick soil layer on the crest is removed and replaced and the liners from both stages are joined using extrusion welding.
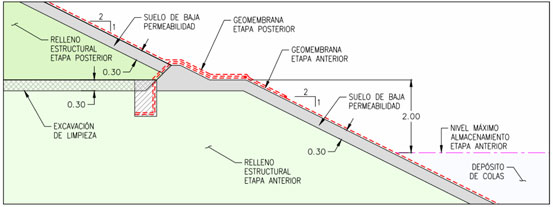
Figure 106 Transition between stages
Extorre Gold Mines Limited
Cerro Moro Gold – Silver Project
Preliminary Economic Assessment | Page 254 |
To avoid acid drainage and dust generation, the TSF has been designed to operate as a sub-aquatic storage and accordingly, a 2 m freeboard is established from the crest level to the tailings deposition maximum level. The first metre of freeboard corresponds to the storage maximum level and the remaining meter provides a safety margin.
| 18.4.7 | Perimeter Service Roads |
8m wide (5.5m passable) service roads will be built around the perimeter of the tailings storage facility perimeter at the crest of each stage (Figure 107).
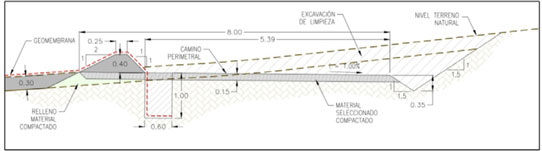
Figure 107 Perimeter road
| 18.4.8 | Waterproofing system |
The impermeabilization system designed both for the Cell and the TSF is made up of 0.30 m thick layer of low-permeability compacted soil covered by 1.5 mm LLDPE geomembrane. The design is based on Ausenco’s experience in similar projects; however, design criteria may vary as design parameters are defined in greater detail.
| 18.4.9 | Surface water diversion system |
The TSF will be located in a natural drainage channel, making it necessary to provide an alternate (diversion) channel to ensure that area above the TSF continues draining normally.
A trapezoidal channel was planned, which intercepts the runoff upstream and takes it downstream of the TSF and returns it into the natural stream flow. The channel diverts the runoff from the North and the West to the South, while towards the East, diversion works were considered unnecessary, as the watershed is unaffected by the TSF.
Runoff from the area between the drainage channel and the TSF will be collected into excavated pond with a capacity of 50,000 m3. Water accumulated in the pond can either be sent to the plant as process water or disposed by evaporation.
| 18.4.10 | Control and monitoring system |
In order to monitor dam stability, three benchmarks (monoliths) will be established on each dam crest, one in the centre and one on each periphery. These points will be monitored with respect to three fixed points (also monoliths) established on the slopes adjacent to the TSF. This system will provide warning of any movement (horizontal or vertical) in the dam wall.
Extorre Gold Mines Limited
Cerro Moro Gold – Silver Project
Preliminary Economic Assessment | Page 255 |
In order to monitor the integrity of the waterproofing system, two monitoring wells are planned. The wells will be regularly monitored to assess groundwater quality; if an anomaly occurs, the flow can be returned to the tailings dam or the process plant.
In the opinion of Ausenco, the seismic stability of the area and the relatively low height of the embankments make it unnecessary to use monitoring instruments such as accelerometers, inclinometers, vibrating wire piezometers and open piezometers. If the embankments are raised beyond Stage 3, Ausenco would require the use of these instruments.
| 18.4.11 | Geotechnical Site Investigations |
In order to complete the geotechnical information presented by Ausenco in previous campaigns, the next three sub-sections of this report include a summarized description of the field and laboratory work performed in the selected area, named Alternative 4 (TSF).
| 18.4.12 | 2011 Geotechnical Campaign (Ausenco) |
In June, 2011, Ausenco conducted a Geotechnical Campaign to obtain information for the TSF.
Test pits were excavated at selected locations at Cerro Moro. The test pits were separated in groups for their designation, according to the kind of work to be constructed in the site. Figure 6 presents the location of the excavated test pits.
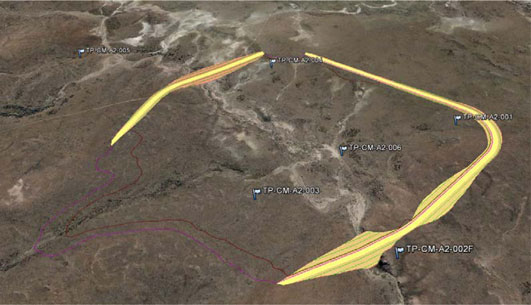
Figure 108 Location of the test pits
A total of 6 test pits were excavated to investigate the conditions of surface soils. The stratigraphic profile composition found at each test pit was determined by means of the photographic register, the description of the soil type and the measurement of the layer. Samples of the characteristic soils were taken at the different test pits and sent to the laboratory for testing.
Extorre Gold Mines Limited
Cerro Moro Gold – Silver Project
Preliminary Economic Assessment | Page 256 |
| 18.4.13 | Water Table Presence |
The presence of water was not registered in any of the test pits excavated during the geotechnical campaign.
| 18.4.14 | Laboratory Testing |
The samples obtained in the field were delivered to the soils laboratory, located in the city of Comodoro Rivadavia, for testing in order to determine their physical properties and supplement the information obtained from field works.
Atterberg limits and grain size distribution analyses were performed on soil samples. The results were used to classify each material according to the Unified Soil Classification System (USCS). Direct shear tests were carried out on samples obtained from the foundation area.
| · | The conceptual design for the tailings storage facility was developed with a sufficient detail to estimate costs within a range of +/- 30%. |
| · | The overall facility comprises of a small Cell for the temporary storage of tailings during the first two years (Phase 1) of production and a larger TSF to be constructed in three stages (Phase 2) for the permanent storage of tailings over the life of mine. |
| · | The partial costs for Phase 1 and the three stages of Phase 2 are estimated as 6.9, 8.4, 4.8 and 5.2 M USD, respectively. |
Extorre Gold Mines Limited
Cerro Moro Gold – Silver Project
Preliminary Economic Assessment | Page 257 |
| · | Three stages for the TSF construction are outlined in the following figure: |

Figure 109 Tailings Storage Facility conceptual view
Ausenco considers appropriate to provide the following recommendations:
| § | At a subsequent engineering stage, the diversion system individual works design must be developed in detail. |
| § | The embankments’ slopes and foundation must be assessed at a later engineering stage, when geotechnical parameters describing the properties of the soils in the deposit and borrow areas are available. Slopes have been pre-designed according to estimated values and observations during the site visit. |
Extorre Gold Mines Limited
Cerro Moro Gold – Silver Project
Preliminary Economic Assessment | Page 258 |
The Cerro Morro Project will produce and sell a gold and silver doré in order to generate revenue. Based on the production profiles presented in Chapters 16 and 17 of this technical report, a total of 848 koz of gold and 47 Moz of silver is expected to be recovered as doré during the life of the Project. This doré is expected be sold to an overseas refinery for separation into gold and silver bullion; however, no formal contracts have yet been entered into.
The annual production for the Project is provided in Table 84.
| | | 1,300 tpd | | | 1,150 tpd | |
| | | Au (Ozs) | | | Ag (Ozs) | | | Au (Ozs) | | | Ag (Ozs) | |
| Year 1 | | | 128,400 | | | | 6,151,300 | | | | 120,600 | | | | 6,793,000 | |
| Year 2 | | | 127,400 | | | | 6,303,300 | | | | 127,800 | | | | 5,114,900 | |
| Year 3 | | | 115,800 | | | | 6,838,100 | | | | 122,800 | | | | 5,467,500 | |
| Year 4 | | | 137,000 | | | | 6,028,000 | | | | 94,200 | | | | 3,935,400 | |
| Year 5 | | | 106,500 | | | | 5,934,100 | | | | 84,500 | | | | 5,411,900 | |
| Year 6 | | | 76,200 | | | | 4,636,100 | | | | 67,700 | | | | 4,427,300 | |
| Year 7 | | | 60,500 | | | | 5,205,100 | | | | 59,800 | | | | 4,795,600 | |
| Year 8 | | | 50,000 | | | | 3,956,500 | | | | 55,600 | | | | 4,690,000 | |
| Year 9 | | | 46,600 | | | | 2,237,500 | | | | 48,800 | | | | 2,457,500 | |
| Year 10 | | | 0 | | | | 0 | | | | 48,400 | | | | 3,055,500 | |
| Year 11 | | | 0 | | | | 0 | | | | 18,200 | | | | 1,141,400 | |
| TOTAL | | | 848,400 | | | | 47,290,000 | | | | 848,400 | | | | 47,290,000 | |
Table 84 Forecast Annual Production
The doré produced by Cerro Morro is not expected to contain any deleterious elements that would affect its acceptance by refineries. The anticipated product quality is 95% precious metals and 5% base metals.
Revenue generated by the Project over total Life-of-Project includes a 52% contribution from silver and 48% from gold. However, during the early years of production Years 1-4) a slightly larger proportion of revenue is generated from gold sales, whereas in the latter stages of production (Years 5-9) silver generates a greater proportion of revenue.
Changes in market prices for both gold and silver will affect both cash flows and profitability of the Project. Figure 19.1 and Figure 19.2 indicate the variability of gold and silver prices during the period January 29, 2011, to January 31, 2012. Gold prices during this period ranged from a low of US$ 1,338/oz (on January 29, 2011) to a high of US$ 1,884/oz (on September 2, 2011) and consistently exceeded the price assumptions utilized in the base case financial modelling for Cerro Moro. Silver prices during this period ranged from a low of US$ 27.15/oz (on December 28, 2011) to a high of US$ 47.94/oz (on April 29, 2011), and therefore consistently exceeded the silver price assumptions used in the base case financial modelling.
Extorre Gold Mines Limited
Cerro Moro Gold – Silver Project
Preliminary Economic Assessment | Page 259 |
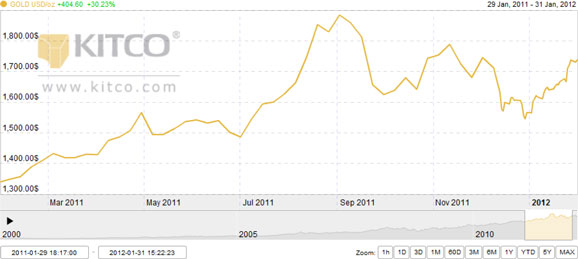
Figure 110 Gold Spot Price – January 29, 2011 to January 31, 2012 (Source: www.kitco.com)
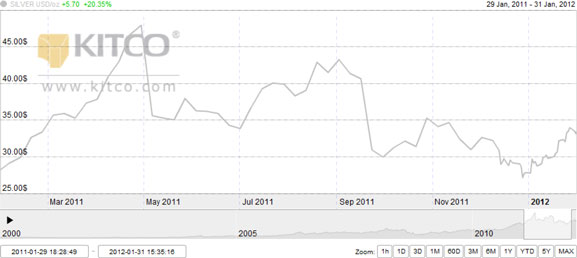
Figure 111 Silver Spot Price – January 29, 2011 to January 31, 2012 (Source: www.kitco.com)
Current demand and supply relationships affect both gold and silver prices, but not necessarily in the same way as the current demand and supply affect the prices of other commodities. Historically, gold has tended to maintain its value compared to basic goods in times of inflation, currency crisis, and global macroeconomic events.
Extorre Gold Mines Limited
Cerro Moro Gold – Silver Project
Preliminary Economic Assessment | Page 260 |
Central banks, financial institutions and individuals have historically acquired gold for reserves, and the production for any given year constitutes only a part of the total potential supply of gold. Given that the potential world supply of gold is largely independent of annual mine production, normal variations in current production do not necessarily have a significant impact the supply or price of gold. Investor demand for silver also grew significantly in 2011 on the back of the increases in gold prices during the same period.
The following refineries are located in Europe and North America and are sufficiently close to the Project to be cost effective:
| § | Johnson Matthey Limited — Brampton, Canada |
| § | Royal Canadian Mint — Ottawa, Canada |
| § | Argor-Heraeus SA — Mendrisio, Switzerland |
| § | Cendres & Metaux SA — Biel-Bienne, Switzerland |
| § | Metalor Technologies SA — Marin, Switzerland |
| § | PAMP SA — Castel San Pietro, Switzerland |
| § | Valcambi SA — Balerna, Switzerland |
| § | Johnson Matthey Inc — Salt Lake City, United States |
| § | Metalor USA Refining Corporation — North Attleboro, United States. |
Their availability to refine dore and cost structures will be investigated further.
The terms of payment by the refiner are expected to be as follows: 99% of the value of the shipment, calculated using Estelar’s assays and the LME spot prices, is due for payment to Estalar the day after the dore is received in the refinery. The 1% outstanding is withheld for adjustment subject to metal content and is due for payment the day following the exchange of the gold and silver assays between the refinery and Estelar.
The doré bars produced at Cerro Morro will be stamped, numbered and weighed prior to shipping for refining. The bars will be transported by a security vehicle in a maximum 5,000 kg per shipment to Commodoro Rividavia. From Commodoro Rividavia, the shipment will be air freighted to Buenos Aires for transfer to an international carrier for air freight to the refinery’s location.
| 19.7 | Qualified Person's Statement |
The Qualified Person, Mr Ted Coupland, has reviewed the commodity price and marketing analyses proposed by Extorre for the purposes of this study. The Qualified Person believes that the results of the marketing and commodity price analyses are appropriate and are consistent with the parameters applied by many other companies operating in the same line of business and support the assumptions in the PEA.
Extorre Gold Mines Limited
Cerro Moro Gold – Silver Project
Preliminary Economic Assessment | Page 261 |
| 20. | ENVIRONMENTAL STUDIES, PERMITTING AND SOCIAL OR COMMUNITY IMPACT |
| 20.1 | Environmental Studies |
The original Environmental Impact Statement (“EIS”; Exploration Stage) for the Project was submitted by Mincorp Exploraciones SA to the Santa Cruz Provincial Authorities in 1997. Subsequently, four updates to the original exploration-level EIS were submitted between 1997 and 2010 according to File 403.897/M/97 – Province Mining Bureau, Ministry of Economy and Public Works, Province of Santa Cruz.
In September 2010, an EIA (Exploitation Stage) was submitted to Santa Cruz Provincial Authorities for a small scale (750 tpd) mining operation at Cerro Moro. This EIA was approved in May 2011, and thus granted the Company permission to start the construction of the infrastructure required for the development of Cerro Moro.
Baseline environmental studies on the Project started in 2008. The consulting company chosen to perform the Environmental Baseline survey was Ausenco.
In order to perform the Baseline studies, the following environmental aspects were analysed:
| § | Physical Aspect. Geology and Geomorphology. Seismology. Soils. Hydrology. Water Quality (Surface and Groundwater). Air Quality. Climate. Hydrogeology, ARD. |
| § | Biological Aspect. Ecosystemic Characterization. Flora. Fauna. Limnology. |
| § | Socio-Economic and Cultural Aspect Archaeology and Palentology. Landscape. Traffic. Socio-Economic Baseline Study in Puerto Deseado. |
The general methods used for performing the Environmental Baseline Study consisted in: to begin with, collection of secondary background; preparation of background and required maps for field visits; field visits (in subject areas such as flora, fauna and water quality, seasonal monitoring has been required), and finally, preparation of Partial Report per specialty.
Estelar Resources Ltd is currently performing environmental monitoring activities in the Project’s areas of direct and indirect impact. This includes the taking of surface and groundwater samples, limnology, and meteorology.
| 20.1.1 | Main Environmental Findings |
Physical Aspect
The Region has arid plateau cold-to-warm weather, with annual mean temperatures which do not exceed 16°C. It is severely arid, with annual rainfall under 200 mm. Generally speaking, there are harsh conditions, which are typical of the southernmost part of South America. Summers are cool and winters are intensely cold, slightly moderated by the closeness to the sea, which —especially during the summer— provides humidity thanks to a sea breeze front developed during the day’s central hours along the coast. Evaporation coming from the own meteorological station installed at Cerro Moro was 1600 mm/year, which indicates that there is a serious water deficit.
Extorre Gold Mines Limited
Cerro Moro Gold – Silver Project
Preliminary Economic Assessment | Page 262 |
A geological description which identified and described the regional and local lithological and structural features was prepared. Some of the existing geomorphic units identified in the Project area are: Jurassic ignimbrite environment, La Matilde formation environment, tertiary sedimentary rocks environment, plateau-like relief, endorheic depression relief and alluvial deposits.
The Project is located in a zone where seismic activity is much reduced, classified as Zone 0, according to the National Institute for Seismic Prevention(Instituto Nacional de Prevención Sísmica). The region’s seismic risk, the earthquake occurrence rate and potential seismic sources were estimated with an expected acceleration rock value equal to 0.03 g.
For Air Quality assessment, PM10, NO2, SO2, SH2, and environmental noise concentrations were calculated. These hourly concentrations were extrapolated to equivalent daily and annual “USEPA (2005)” concentrations, and it was noted that base values did not exceed the maximum Environmental Air Quality Standards’ concentration levels set forth in the referenced legislation.
The study area is homogeneous as to the type of soils it has. They are shallow soils, with little evolution, where no horizons can practically be differentiated. On the runoff lines, protected from the wind, material build-up generates profiles deeper than the mean, on which high shrub-like patches develop. Based on the Soil Taxonomy classification, soils were classified in the Aridisoles Order, and in turn, in two suborders: Argides, including great group Natridurids; and Ortides, including great group Cambortides. Soil use capabilities are limited to natural pasture and use by wild fauna. The main limiting factors are the region’s soil useful depth, wind erosion and severe weather conditions. Soils are currently used mainly for sheep farming, with a significant mining development in the region over the last decade.
An Acid Rock Drainage (ARD) research program was carried out on the Deborah, Escondida (East, Central and West), Esperanza, Gabriela and Loma Escondida deposits, both for waste rock (and host rock) and process tailings by means of a static test work program. The static tests (ABA tests) allowed the rapid analysis of the Net Neutralization Potential (NNP) of the various lithologies before performing kinetic tests (Humidity Cell Test), which take longer to perform but provide temporal data on the metals leaching characteristics of the materials tested. The ABA test program was carried out on a total of 190 samples (Escondida 62, Esperanza 47, Loma Escondida 16, Gabriella 46, Deborah 19). Results were presented based on their position with respect to mineralization in the respective deposits (hanging wall and footwall) with no analysis done on the basis of lithology (although the sample selection process was done based on lithology) or alteration. Non-standard nomenclature was also used to identify the potentially acid generating (PAG) categories of non-PAG, potentially-PAG and PAG, although these differences do not materially change the results of the assessment. Table 85 highlights the main findings of the study.
Extorre Gold Mines Limited
Cerro Moro Gold – Silver Project
Preliminary Economic Assessment | Page 263 |
| Deposit | | # of
Samples (n) | | Sample
position | | Average
pH | | Average
Sulfide (%) | | Average AP (kg CaCO3/T) | | Average NP (kg CaCO3/T) | | Average NNP (kg CaCO3/T) | | PAG
Categorization
(after MEND) |
| Escondida East (E) | | 8 | | Hanging wall | | 8.2 | | 0.56 | | 16 | | 45 | | 29 | | Non-PAG |
| | | 3 | | Foot wall | | 8.1 | | 1.50 | | 47 | | 17 | | -31 | | PAG |
| Escondida Central (C) | | 9 | | Hanging wall | | 8.1 | | 0.63 | | 20 | | 13 | | -7 | | I-PAG |
| | | 4 | | Foot wall | | 8.3 | | 0.97 | | 30 | | 11 | | -20 | | PAG |
| Escondida Gap Central-West (C-W) | | 6 | | Hanging wall | | 8.1 | | 1.10 | | 35 | | 12 | | -23 | | PAG |
| | | 2 | | Foot wall | | 8.4 | | 0.41 | | 13 | | 15 | | 2 | | I-PAG |
| Escondida West (W) | | 9 | | Hanging wall | | 8.0 | | 0.28 | | 20 | | 13 | | 3 | | I-PAG |
| | | 4 | | Foot wall | | 8.3 | | 0.33 | | 14 | | 9 | | -2 | | I-PAG |
| Escondida Gap West Far West (W-FW) | | 5 | | Hanging wall | | 7.8 | | 0.36 | | 11 | | 10 | | -1 | | I-PAG |
| | | 1 | | Foot wall | | 7.1 | | 0.86 | | 28 | | 9 | | -19 | | I-PAG |
| Escondida Far West (FW) | | 8 | | Hanging wall | | 8.0 | | 0.08 | | 6 | | 46 | | 28 | | Non-PAG |
| | | 3 | | Foot wall | | 8.7 | | 0.01 | | 1 | | 15 | | 45 | | Non-PAG |
| Loma Escondida | | 11 | | Hanging wall | | 8.7 | | 0.86 | | 23 | | 47 | | 89 | | Non-PAG |
| | | 5 | | Foot wall | | 8.5 | | 0.37 | | 9 | | 14 | | 5 | | I-PAG |
| Esperanza | | 33 | | Hanging wall | | 8.0 | | 0.44 | | 18 | | 12 | | 2 | | I-PAG |
| | | 14 | | Foot wall | | 8.2 | | 0.53 | | 16 | | 13 | | 0 | | I-PAG |
| Gabriela | | 35 | | Hanging wall | | 8.0 | | 0.52 | | 21 | | 12 | | -1 | | I-PAG |
| | | 11 | | Foot wall | | 8.0 | | 0.74 | | 23 | | 14 | | -10 | | I-PAG |
| Deborah | | 12 | | Hanging wall | | 7.6 | | 0.33 | | 9 | | 7 | | -2 | | I-PAG |
| | | 7 | | Foot wall | | 7.7 | | 0.83 | | 23 | | 16 | | -6 | | I-PAG |
Table 85 Main findings of the ABA test work program
Extorre Gold Mines Limited
Cerro Moro Gold – Silver Project
Preliminary Economic Assessment | Page 264 |
A kinetic test program has been carried out on 20 samples involving the different prospects and lithologies on the Project.
Taking into account that the laboratory conditions in which standard ARD kinetic tests are performed differ greatly from those actually existing in the zone (average 200 mm annual precipitation and average annual evaporation of 1600 mm), it is estimated that the weather, geological and environmental conditions present in the region under study would substantially inhibit metal solubilisation in the short term, with leaching occurring in the long-run.
Further studies on ARD and metals leaching will be carried out by the company over the coming months. The objective of this work will be to determine the long-term geochemical behaviour of the waste rock materials. The environmental geo-units and the expected mining schedule will be used to identify the volumes and the proportions of the different lithologies reporting to the waste dump. This, with a water balance for the facility and kinetic test results for the component lithologies, will enable the geochemical modelling of any effluent water and consequently allow the identification of the environmental control measures and mitigation that will be required for the facility.
A Surface and Groundwater Quality Study was performed. It included the Analysis of Physico-Chemical and Microbiological Parameters for 17 sampling stations (8 stations correspond to groundwater and 9 to surface water samples). All analyses were performed pursuant to “Standard Methods for the Examination of Water and Wastewater”, (APHA, AWWA y WPCF), “Methods for Chemical Analysis of Water and Wastes”, as established by EPA/600/4-79-020. The main aspects to be taken into account are as follows:
Extorre Gold Mines Limited
Cerro Moro Gold – Silver Project
Preliminary Economic Assessment | Page 265 |
Surface Waters:
| § | In the Project area there are only surfaces drainage network which channels waters towards endorheic saline depressions. These collect surface runoff in winter, and are an evaporation area in spring-summer, naturally concentrating salts, with neutral to alkaline pH. Due to strong evaporation processes and little rainfall, there is salt concentration throughout the spring-summer period until it dries up. In the monitored endorheic depressions there are relatively high values of fluorides, boron, manganese, and vanadium. |
| § | With regard to the Deseado River, it has a seasonal regime all through its run. At “Paso Gobernador Gregores” bridge, for instance, the river has water in winter, but remains dried up for the rest of the year. Downstream, to 40 km approximately, east-westward, the river water comes from the elevation of tides, which are typical in the zone (seawater entering the continent). |
Groundwater
Two groundwater types or qualities maybe distinguished:
| § | Water extracted from mills to provide for the hacienda and for local people's consumption (6 sampling points) is taken from 5 to 20 m deep, and is water stored in alluvial sands and silts which fill the most depressed areas of basins and valleys, creating surface aquifers. This water has a relatively low saline content, with an electrical conductivity from 1,500 to 5,000 µS/cm. As for the anionic composition of these waters, they mainly have chloride content and bicarbonate content as well. Cationic composition is mainly sodic, and calcic to a lesser degree. |
| § | The deepest waters (samples from mining holes) (2 sampling points in Escondida and Déborah) catch the water in greater depths (over 40 m) and correspond to rock aquifers with secondary porosity and high salinity, around 7,000 µS/cm for the Déborah well and 15,000 µS/cm for the Escondida well. They primarily have sodium chloride content. |
Biotic Aspect
Fauna was characterized by means of seasonal survey campaigns. The wild fauna living in the Project area corresponds - biogeographically - to the Neotropical Region, Andean-Patagonian Dominion and within this, to the Patagonian Province. The latter is known for its ways of adapting to extreme living conditions, namely a severe aridity and very low temperatures in winter. The severe weather conditions deeply influence the temporal distribution patterns of the main vertebrate groups; this is most obvious in birds. The region's most typical reptile, bird, and mammal species were observed in the Project's area.
Extorre Gold Mines Limited
Cerro Moro Gold – Silver Project
Preliminary Economic Assessment | Page 266 |
Mammals:
Sixteen out of the 68 native and exotic mammal species recorded in the province of Santa Cruz have been found in the study area with Guanacos (Lama guanicoe), European hare (Lepus europeaus) and Darwin's Leaf-eared Mouse (Phyllotis darwinii) being the most representative species of this group within the study area. The main carnivore species is the gray fox (Pseudalopex griseus). This species' population has recovered considerably due to a lack of hunting and poisoning. Guanaco are also increasing in number in the study area.
Three endemic species were recognized: Skunk (Conepatus humboldtii), the Dwarf armadillo or ‘pichi’ (Zaedyus pichiy) and Patagonian hare or ‘mara’ (Dolichotis patagonum). Few examples of the mara were observed, though it is expected that this species is actually more abundant than this in the area. It is recommended that monitoring cameras be installed exclusively for the purpose of determining the real situation (abundance, territorial occupation, behavior, population growth, etc.) of this species within the study area.
Birds:
Forty out of the 205 bird species listed for the province where found in the Project area. The Mourning Sierra-finch (Phrygilus fruticeti) and Darwin's Rhea (Pterocnemia pennata) are the most representative species found in the study area. Among the species linked to water bodies, the Ashy-headed Goose (Chloephaga poliocephala) is the most abundant; and together with Baird's Sandpiper (Calidris bairdii) and the chocolate monjita (Neoxolmis rufiventri) are the three migrant species found in the study area.
Based on the conservation status proposed by Ubeda and Grigera (1995) for birds, the Quiula or Patagonian Tinamou (Tinamotis ingoufi) is a species categorized as rare. During the surveys carried out in the area its relative abundance has however been found to be high (number 11 of the 40 species of birds registered). It is therefore not considered to be a "rare" species in the area. Further studies should be carried out in order to determine its range and abundance beyond the Project area with an eye to a potential special management plan for this species.
The Band-tailed Earthcreeper (Eremobius phoenicurus) or Patagonian Bandurrita, which is considered to be in a "certain degree of danger in Patagonia" according to Narosky and Babarskas (2000), is relatively abundant in the area, and is present in all seasons of the year, though less so in summer. Again, further studies should be carried out in order to determine its range and abundance beyond the Project area with an eye to a potential special management plan for this species.
Flamingoes (Phoenicopterus chilensis) and Lesser Rhea (Pterocnemia pennata) or Choique are two species categorized as NT (Near Treatened) according to the IUCN. Flamingoes were seen in the endorheic lakes during the winter. The presence of this species is determined by the amount of water that has accumulated in the lagoons. The Choique is an abundant species throughout the year.
Extorre Gold Mines Limited
Cerro Moro Gold – Silver Project
Preliminary Economic Assessment | Page 267 |
Reptiles:
Seven of the species listed as endemic were observed in the study area. A single individual of Darwin's Iguana or ‘matuasto’ (Diplolaemus darwinii), which qualifies as a "rare species, little known and vulnerable" according to Scolaro (2005), was recorded in the spring and summer campaigns.
Flora:
Flora were investigated during four seasonal campaigns. Vegetation was characterized phytosociologically, and the data was presented in a vegetation map which included vegetation units in the Project area, fodder availability, grazing land condition, monitors, and a complete list of species. In the Project area there are three basic vegetation communities that cover 99% of the surface area of the Project: desert (11%), barren land or sub-shrub steppe (67), and shrub-steppe (21%). Saline depressions or lakes with little or no water account for the remaining 1% of the Project's surface area. The following Table gives a brief description and visual depiction of the composition of these communities.
Extorre Gold Mines Limited
Cerro Moro Gold – Silver Project
Preliminary Economic Assessment | Page 268 |
| Desert |
This vegetation unit is mainly located in the Project's S and NW areas. These are places where vegetation is scarce and scattered. Topsoil values range from 5% to 10% and are mainly represented by sub-shrubs. This vegetation unit accounts for 11% of the Project's area. | 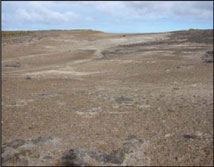 |
Sub-shrub steppe |
This is the predominant vegetation unit within the study area. Topsoil accounts for 30%-40% of the area. The remaining area is covered by pebble paving. In these places, the soil has been completely lost, and the surface is covered by gravel. Leaf litter is also lost; there is only some dead material standing. This vegetation unit accounts for 67% of the Project's area. | 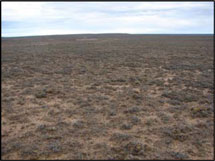 |
| Shrub-steppe |
Topsoil accounts for 46% of the area. The predominant life form is shrubs, covering 26%. The dominant species is Senecio filaginoides; others are Berberis heterophylla, Nardophyllum obtusifolium, Schinus sp., Lycium ameghinoi. This vegetation unit accounts for 21% of the Project's area. |  |
Socio-economic and Cultural Aspect
The Area of Direct Impact (ADI) for socio-economic and cultural factors was defined as the towns linked to the Project (Puerto Deseado, Tellier, Jaramillo, and Fitz Roy) and the communication paths, considering commercial interactions (demand for goods and services, source of human resources, etc.).
Extorre Gold Mines Limited
Cerro Moro Gold – Silver Project
Preliminary Economic Assessment | Page 269 |
The Area of Indirect Influence (AII) for socio-economic and cultural factors comprises the towns of Comodoro Rivadavia, Puerto San Julián, Pico Truncado, Las Heras, and Río Gallegos.
The town nearest to the Project area is Puerto Deseado. This town has a population of 12,963 inhabitants according to the 2009 Census, up from 10,237 inhabitants in the 2001 Census. Its main commercial base relies on retailing, which is focused on the supply and sale of goods to satisfy basic needs as food, clothing and cleaning materials, and supplies for dwellings and motor vehicles. This town’s productive capacity is based around the industrialization of fishing products and fishing-related services. Although tourism constitutes a significant activity, it is not reflected on the town’s commercial and service structure. In the rural areas, livestock breeding is the major activity, and mining has expanded during the last decade.
Small towns in the region are: Tellier (~80 inhabitants), Jaramillo (~220 inhabitants) and Fitz Roy (~180 inhabitants), which originated as towns on a railway branch line. These towns have a “floating population” associated with the personnel transferred by contracting companies from current road works.
There are no natural protected areas in the Project area.
The landscape was assessed in terms of quality, frailty, and visual accessibility. The following Landscape Units were identified: El Espinazo, El Mosquito Lake, Plateau Plain, Lakeside Hills, Quebrada de Gabriela, Valleys, and Hills.
Archaeological and paleontological survey campaigns were carried out. Archaeological finds can be grouped into three categories: sets of lithic material or isolated lithic findings; caves and/or rock shelters; and structures possibly linked to funerary activities. All the archaeology sites are distant from the proposed Project infrastructure. Outside of the Project's area of impact, five archaeologically-relevant sites were identified: one is a cave or rock shelter containing pictographs, which is north of the Project; two are places with lithic material concentrations which could correspond to lithic material extraction quarries; and two are possible sites related to funerary activities (chenques).
Four sites with paleontological findings have been defined; three of them are not related to the Project's facilities. The fourth site is next to Prospecto Esperanza SE’s facilities, where sea macrofossil remains have been found.
Table 86 shows the schedule of filing, approval, and notification dates for the 5 exploration / advanced exploration permits (Environmental Impact Statements, or EIS’s) and one development permit (Environmental Impact Assessment, or EIA) that have been approved to date by the Santa Cruz Provincial Authorities for the Project. Under Santa Cruz Provincial legislation, all environmental permits have a validity of two years and, in order to allow work to continue, must be renewed prior to their respective expiry dates. All valid environmental permits for Cerro Moro are held in the name of Extorre’s subsidiary in Argentina, Estelar Resources Ltd.
Extorre Gold Mines Limited
Cerro Moro Gold – Silver Project
Preliminary Economic Assessment | Page 270 |
| Company | | Eia Filing | | Eis Grant | | Eis Notification | | Eis Expiry | | Project
Stage |
| MINCORP EXPL. SA | | 23/05/97 | | 23/06/97 | | 15/07/97 | | 15/07/99 | | Exploration |
| MINCORP EXPL. SA | | 29/06/99 | | N/D | | N/D | | N/D | | Exploration |
| CERRO VANGUARDIA SA | | 08/04/05 | | 20/02/06 | | 24/02/06 | | 24/02/08 | | Exploration |
| CERRO VANGUARDIA SA | | 08/04/05 | | 20/02/06 | | 24/02/06 | | 24/02/08 | | Exploration |
| ESTELAR RESOURCES LTD. | | 09/10/08 | | 30/03/09 | | 28/05/09 | | 28/05/11 | | Exploration |
| ESTELAR RESOURCES LTD. | | October 2010 | | 13/12/10 | | 15/12/10 | | 15/12/12 | | Advanced Expl. |
| ESTELAR RESOURCES LTD. | | 17/09/2010 | | 16/05/11 | | 16/05/11 | | 16/05/13 | | Development |
Table 86 Schedule of the filing of the Environmental Impact Assessment (EIA)
While most of the generated environmental impacts are moderately significant, they are localized and may be reversed or mitigated in the short, mid and long term. They are detailed below:
| § | Decreased air quality as a result of the emission of particulate matter and combustion gases. |
| § | Increased level of existing noise due to higher sound pressure generated by the operation of equipment, machinery and vehicles, blasting, and the operation of the Process plant. |
| § | Alteration of vegetation processes and its population dynamics, due to the emission of dust and environmental fragmentation resulting from the presence of the components of the Project, thus altering the habitat of the land fauna as a consequence of the noise, vibration, introduction of barriers and human presence. |
| § | Worsening of erosive processes due to soil movements (grubbing, excavations, and stockpiled barren material) generated during the construction of the proposed infrastructure, pit opening, and waste dump development. |
| § | Caving and subsidence processes as a result of mineralization extraction in veins (underground mines). |
| § | Quality of surface and underground water will be affected due to accidental spills during operation of mining equipment, transport, handling and storage of process supplies. |
| § | On archaeological resources and paleontological heritage, due to the risk involved in soil movement activities. |
| § | On road infrastructure, due to the deterioration that may be caused by increased vehicle traffic on the haul road. |
Extorre Gold Mines Limited
Cerro Moro Gold – Silver Project
Preliminary Economic Assessment | Page 271 |
| § | The sense of wellbeing of the population will be affected, and the increased risk of accidents and/or the sense of insecurity as a consequence of the increased vehicle traffic generated by the activities related to the transport of material, supplies, finished product and staff from and/or to the Project location on the haul road. The city affected will be Puerto Deseado and the towns of Tellier, Jaramillo and Fitz Roy, on National Road No. 281. Such disturbances will be mainly the result of the emissions of noise, vibration and particulate material produced by the increased traffic on Provincial Road No. 47. |
| § | On water resources, given the characteristics of the region where the Project is located, this is an environmentally critical factor. Regarding this environmental factor, the Project has considered the sustainable extraction from the aquifer by calculating the safe flow rate extraction, in order to avoid any impact on the current users of this resource. This flow rate is the volume that may be extracted from the total resources consumed by the replenishment flow plus a part for storage (hydro-geological resources), taking levels to sustainable values in the mid term, without affecting water catchment points for cattle. |
The above-mentioned impacts are non-significant because their occurrence rate is medium or low, since it is possible to effectively implement preventive control measures on the activities entailed; these impacts may be reversed or mitigated immediately.
Others, which, as a result of their permanence and reversibility, will cause residual impacts on environmental factors, are:
| § | Topography alteration, generated by the deepening of open pits and barren material stockpiled, and storage of process tailings from the plant. |
| § | Loss of soil as a resource and modification of its current use, loss of topsoil and destruction of the habitat for land fauna, as a result of open pits excavation and barren material stockpiled, and process tailings. |
The above-mentioned impacts are considered moderately significant on the surfaces affected, although their extent is partial or local in the frame of a regional context, and they can’t be reversed.
| 20.4 | Social and Community Impact |
The impacts caused from a socio-economic perspective are detailed below.
| § | The Project development will bring about social changes on the local community, which entail negative impacts, such as changes in the urban centers’ profiles resulting from the pressure of immigration, which also has effects such as temporary shortage of dwellings and the resulting increase in the value of real estate and rents; increase in social problems related to health and safety due to higher income, and to the circulation of a higher number of people who do not belong to the communities related to the Project; together with deficiencies in the availability of education and health infrastructure. |
Extorre Gold Mines Limited
Cerro Moro Gold – Silver Project
Preliminary Economic Assessment | Page 272 |
The above-mentioned impacts are considered moderately significant, due to the fact that the affected factor holds a high environmental value and to the permanence of the impact.
| § | The development of the Project will cause a mildly significant positive impact on employment levels, as a result of the demand of direct and indirect jobs that will bring dynamism to the provincial and local markets; the community gives a higher value to the benefits obtained for such employment of individuals belonging to the relatively poorer socio-economic levels, which would be the benefited local residents. |
| § | The economic factor will be positively impacted, given that the Project stands out for the income and wealth generated by the commissioning phase for the whole production circuit. These activities involve a gross production value in which the value added will be of great relevance, because during operation only a minor proportion of the investment will go towards buying supplies and services. The Project will generate a substantial retribution in terms of value added, since it will generate an important proportion of wealth through taxes and royalties withheld by the jurisdiction involved and the wages paid to employees, among others. |
The above-mentioned positive impacts with residual effect are moderately significant in the area of direct influence (Puerto Deseado) and the area of indirect influence (Santa Cruz and the Argentine Republic).
| 20.5 | Environmental Management Plan |
The Environmental Management Plan developed by Estelar states the preventive, control and mitigation measures for environmental and socio-economic impacts resulting from the execution of the Project, in a framework of a series of plans and programs which will be complied with by Estelar and the contractors. The prime objective is to comply with the legal environmental regulations of Argentina and with Estelar’s environmental policy.
The Environmental Management Plan is based on the objectives of ensuring that, by preparing documented procedures, negative environmental impacts that may be caused during the different phases of the Project, be they of construction, operation or closure, are prevented, controlled, minimized and mitigated, while positive impacts on the socio-economic and technological spheres are promoted, thus forging a good relationship with the community.
The Environmental Management Plan is made up of the following Prevention, and Control and Preservation Measures Programs:
Prevention Programs developed:
| § | Safety and Occupational Health Program. |
| § | Community Relations Plan. |
Extorre Gold Mines Limited
Cerro Moro Gold – Silver Project
Preliminary Economic Assessment | Page 273 |
| § | Monitoring, Control, and Follow-up Program. |
| § | Environmental Training Program. |
| § | Affected Areas Recovery Program. |
Control and Preservation Measures developed:
| § | Measures to control and mitigate atmospheric emissions. |
| § | Measures to control and mitigate noise emissions. |
| § | Measures to control erosion and settlement. |
| § | Measures to control the physical stability of the Project components (open pits, underground mines, and waste dumps). |
| § | Measures to preserve water resources. |
| § | Measures to control hazardous materials transport, storage, and handling. |
| § | Waste management measures. |
| § | Biodiversity protection measures. |
| § | Cultural heritage preservation measures. |
| § | Measures to preserve soil and soil use. |
| § | Measures of landscape value preservation control. |
A Conceptual Closure Plan has been developed for all the Project’s components that will be implemented progressively through construction, operation and into the final closure stage of the Project. The main objectives of the Conceptual Closure Plan are to ensure that all areas where mining or processing activities took place are restored in such a way that they provide adequate safety to the public, and to rehabilitate land so post-mining land capability is maximised and a sustainable future use is established.
| 20.6 | Community Relations Plan and Social Responsibility |
The preparation of a Community Relations Plan (started in 2008), includes a commitment to inform and communicate all information related to the development of the Project in a transparent and responsible manner with the objective of promoting the sustainable development of Puerto Deseado and the region, through the construction, operation and closure stages of the Project.
Objective: Manage the construction, operation and closure of the Project taking into account the interests of the community and other stakeholders, and to communicate technical, environmental and social aspects of the Project to them.
The Community Relations Plan, includes a series of six programs and twenty two projects which are the product of social responses to issues identified by the Stakeholders, including;
| • | The lack of information about metalliferous mining and its relation to the environment; |
Extorre Gold Mines Limited
Cerro Moro Gold – Silver Project
Preliminary Economic Assessment | Page 274 |
| • | The local economic development model acomplished in times of crisis and topics related togovernment subsidies; |
| • | Accumulated and pre-existing social impacts (inequality and exclusion—particularily among young people) |
Extorre Gold Mines Limited
Cerro Moro Gold – Silver Project
Preliminary Economic Assessment | Page 275 |
| 21. | CAPITAL AND OPERATING COSTs |
The total initial capital investment for the mining, process plant and infrastructure for the 1,300 tpd (Option A) and 1,150 tpd (Option B), in addition to the expected life of Project sustaining capital, has been summarized in Table 87 and Table 88 respectively. All local costs are inclusive of 21% VAT.
| Category (MUS$) | | Initial Capital | | | Sustaining
Capital | | | Total
Capital | |
| Direct Costs | | | | | | | | | | | | |
| Open pit mining Equipment | | | 29.7 | | | | 3.6 | | | | 33.3 | |
| Underground mining equipment & Development & Infra/Services | | | 66.1 | | | | 109.4 | | | | 175.5 | |
| Plant | | | 82.1 | | | | | | | | 82.1 | |
| Tailings Storage Facility | | | 8.1 | | | | 22.3 | | | | 30.4 | |
| Water Borefield | | | 6.5 | | | | | | | | 6.5 | |
| Power Supply | | | 26.6 | | | | | | | | 26.6 | |
| Camp facilities | | | 14.5 | | | | | | | | 14.5 | |
| Access roads / Reclamation | | | 3.8 | | | | 8.5 | | | | 12.3 | |
| Mobile Equipment | | | 3.1 | | | | | | | | 3.1 | |
| Fuel Storage | | | 1.6 | | | | | | | | 1.6 | |
| Site Buildings | | | 1.8 | | | | | | | | 1.8 | |
| Assay Laboratory | | | 2.8 | | | | | | | | 2.8 | |
| Communications | | | 0.3 | | | | | | | | 0.3 | |
| Closure | | | | | | | 5.0 | | | | 5.0 | |
| Subtotal Direct Costs | | | 246.9 | | | | 148.7 | | | | 395.6 | |
| Indirect Costs | | | | | | | | | | | | |
| EPCM, Commissioning, Temporary facilities, Initial Fill and Spares | | | 32.9 | | | | | | | | 32.9 | |
| Owners Costs | | | 4.3 | | | | | | | | 4.3 | |
| Subtotal Indirect Costs | | | 37.2 | | | | | | | | 37.2 | |
| TOTAL | | | 284.1 | | | | 148.7 | | | | 432.9 | |
Table 87 Overall Capital Costs (1,300 tpd option)
Extorre Gold Mines Limited
Cerro Moro Gold – Silver Project
Preliminary Economic Assessment | Page 276 |
| Category (MUS$) | | Initial Capital | | | Sustaining
Capital | | | Total
Capital | |
| Direct Costs | | | | | | | | | | | | |
| Open pit mining Equipment | | | 19.9 | | | | 11.6 | | | | 31.5 | |
| Open pit pre-stripping | | | 2.7 | | | | | | | | 2.7 | |
| Underground mining equipment & Development & Infra/Services | | | 50.9 | | | | 119.5 | | | | 170.4 | |
| Plant | | | 77.4 | | | | | | | | 77.4 | |
| Tailings Storage Facility | | | 8.1 | | | | 22.3 | | | | 30.4 | |
| Water Borefield | | | 6.5 | | | | | | | | 6.5 | |
| Power Supply | | | 26.6 | | | | | | | | 26.6 | |
| Camp facilities | | | 14.5 | | | | | | | | 14.5 | |
| Access roads | | | 3.8 | | | | 8.5 | | | | 12.3 | |
| Mobile Equipment | | | 3.1 | | | | | | | | 3.1 | |
| Fuel Storage | | | 1.6 | | | | | | | | 1.6 | |
| Site Buildings | | | 1.8 | | | | | | | | 1.8 | |
| Assay Laboratory | | | 2.8 | | | | | | | | 2.8 | |
| Communications | | | 0.3 | | | | | | | | 0.3 | |
| Closure | | | | | | | 5.0 | | | | 5.0 | |
| Subtotal Direct Costs | | | 219.9 | | | | 166.8 | | | | 386.8 | |
| Indirect Costs | | | | | | | | | | | | |
| EPCM, Commissioning, Temporary facilities, Initial Fill and Spares | | | 32.4 | | | | | | | | 32.4 | |
| Owners Costs | | | 4.3 | | | | | | | | 4.3 | |
| Subtotal Indirect Costs | | | 36.7 | | | | | | | | 36.7 | |
| TOTAL | | | 256.7 | | | | 166.8 | | | | 423.5 | |
Table 88 Overall Capital Costs (1,150 tpd option)
| 21.1.1 | Process Plant and Infrastructure |
General
The capital cost estimate is quoted to an accuracy level of -20% to +50%. The following qualifications are made:
| § | The estimate is in United States of America dollars USD; |
| § | The estimate is only for capital costs from the commencement of the process plant design and construction award; all costs prior to this are excluded including exploration and development related studies; |
| § | The estimate excludes all exploration and development drilling expenditures. Extorre’s “Owners costs” for Project development are included, but Extorre’s corporate costs are excluded; |
| § | Charges related to financing (e.g., fees, consultants, etc.) are excluded; |
| § | Capitalised interests and standby fees from third-party lenders are excluded; |
| § | There is no escalation added to the estimate. |
Extorre Gold Mines Limited
Cerro Moro Gold – Silver Project
Preliminary Economic Assessment | Page 277 |
Capital cost estimates for the process plant and associated infrastructure have been based upon:
| § | Preliminary engineering including process design criteria, quantity take-offs; |
| § | Budget price quotations (for major equipment) and current cost data (for the remaining equipment and material); |
| § | Unit rates have been based on budget prices received from subcontractors and fabricators in Argentina; |
| § | The costs of engineering, procurement, construction management and commissioning have been estimated from knowledge on similar projects; |
| § | Topographical information obtained from site survey provided by Extorre; |
| § | Preliminary geotechnical investigation information provided by Extorre. |
Summary
The capital cost estimates for the 1,300 tpd and 1,150 tpd processing plant options and associated infrastructure are summarized in Table 89 and Table 90 by discipline. Table 91 and Table 92 provide summaries of the capital cost by process plant area for the two options.
Extorre Gold Mines Limited
Cerro Moro Gold – Silver Project
Preliminary Economic Assessment | Page 278 |
| ITEM | | Capital Estimate
US$'000 | | | Contingency
US$'000 | | | Subtotal
US$'000 | | | VAT
US$'000 | | | TOTAL
INCL VAT
US$'000 | |
| DIRECT COSTS | | | | | | | | | | | | | | | | | | | | |
| Earthworks | | | 6,958 | | | | 748 | | | | 7,705 | | | | 1,618 | | | | 9,324 | |
| Civil works | | | 8,449 | | | | 1,014 | | | | 9,464 | | | | 1,987 | | | | 11,451 | |
| Buildings | | | 13,762 | | | | 1,430 | | | | 15,192 | | | | 3,190 | | | | 18,382 | |
| Mechanical equipment | | | 36,049 | | | | 3,746 | | | | 39,795 | | | | 4,526 | | | | 44,321 | |
| Platework | | | 6,980 | | | | 797 | | | | 7,777 | | | | 1,633 | | | | 9,410 | |
| Structural steel | | | 7,787 | | | | 848 | | | | 8,635 | | | | 1,813 | | | | 10,449 | |
| Piping | | | 5,039 | | | | 574 | | | | 5,613 | | | | 1,179 | | | | 6,792 | |
| Electrical installations | | | 6,734 | | | | 766 | | | | 7,500 | | | | 1,433 | | | | 8,933 | |
| Power Line | | | 19,988 | | | | 1,999 | | | | 21,987 | | | | 4,617 | | | | 26,605 | |
| Construction equipment | | | 4,065 | | | | 463 | | | | 4,528 | | | | 951 | | | | 5,478 | |
| Total Direct Costs | | | 115,811 | | | | 12,385 | | | | 128,196 | | | | 22,948 | | | | 151,144 | |
| INDIRECT COSTS | | | | | | | | | | | | | | | | | | | | |
| Temporary construction facilities | | | 1,724 | | | | 243 | | | | 1,967 | | | | 413 | | | | 2,381 | |
| Mobilisation and demobilisation | | | 1,307 | | | | 131 | | | | 1,438 | | | | 302 | | | | 1,740 | |
| Project and procurement management | | | 6,859 | | | | 686 | | | | 7,545 | | | | 125 | | | | 7,669 | |
| Engineering design | | | 6,209 | | | | 621 | | | | 6,830 | | | | 31 | | | | 6,861 | |
| Site supervision & constr’n management | | | 8,652 | | | | 865 | | | | 9,517 | | | | 75 | | | | 9,592 | |
| Commissioning | | | 960 | | | | 96 | | | | 1,056 | | | | 37 | | | | 1,093 | |
| Vendor commissioning | | | 1,365 | | | | 136 | | | | 1,501 | | | | 69 | | | | 1,570 | |
| Initial fills | | | 562 | | | | 56 | | | | 618 | | | | 130 | | | | 747 | |
| Spare Parts | | | 1,217 | | | | 122 | | | | 1,339 | | | | 27 | | | | 1,366 | |
| Owners cost | | | 3,640 | | | | 364 | | | | 4,004 | | | | 312 | | | | 4,315 | |
| Total Indirect Costs | | | 32,494 | | | | 3,320 | | | | 35,815 | | | | 1,521 | | | | 37,335 | |
| TOTAL | | | 148,305 | | | | 15,705 | | | | 164,011 | | | | 24,469 | | | | 188,479 | |
Table 89 Capital Cost Summary by Discipline (1,300 tpd Option)
Extorre Gold Mines Limited
Cerro Moro Gold – Silver Project
Preliminary Economic Assessment | Page 279 |
| ITEM | | Capital Estimate
$'000 | | | Contingency
$'000 | | | Subtotal
$'000 | | | VAT
$'000 | | | TOTAL
INCL VAT
$'000 | |
| DIRECT COSTS | | | | | | | | | | | | | | | | | | | | |
| Earthworks | | | 6,912,303 | | | | 742,963 | | | | 7,655,266 | | | | 1,607,606 | | | | 9,262,872 | |
| Civil works | | | 8,253,356 | | | | 990,646 | | | | 9,244,002 | | | | 1,941,240 | | | | 11,185,243 | |
| Buildings | | | 13,762,247 | | | | 1,429,885 | | | | 15,192,132 | | | | 3,190,348 | | | | 18,382,479 | |
| Mechanical equipment | | | 34,317,891 | | | | 3,570,299 | | | | 37,888,190 | | | | 4,380,692 | | | | 42,268,882 | |
| Platework | | | 6,351,080 | | | | 725,812 | | | | 7,076,892 | | | | 1,486,147 | | | | 8,563,039 | |
| Structural steel | | | 7,620,358 | | | | 830,182 | | | | 8,450,540 | | | | 1,774,613 | | | | 10,225,153 | |
| Piping | | | 4,664,154 | | | | 536,309 | | | | 5,200,463 | | | | 1,170,926 | | | | 6,371,389 | |
| Electrical installations | | | 6,278,635 | | | | 720,727 | | | | 6,999,362 | | | | 1,423,271 | | | | 8,422,632 | |
| Power Line | | | 19,988,380 | | | | 1,998,838 | | | | 21,987,218 | | | | 4,617,316 | | | | 26,604,534 | |
| Construction equipment | | | 3,764,543 | | | | 433,053 | | | | 4,197,596 | | | | 944,558 | | | | 5,142,154 | |
| Total Direct Costs | | | 111,912,947 | | | | 11,978,713 | | | | 123,891,660 | | | | 22,536,717 | | | | 146,428,377 | |
| INDIRECT COSTS | | | | | | | | | | | | | | | | | | | | |
| Temporary construction facilities | | | 1,724,190 | | | | 243,192 | | | | 1,967,382 | | | | 413,150 | | | | 2,380,533 | |
| Mobilisation and demobilisation | | | 1,295,305 | | | | 129,531 | | | | 1,424,836 | | | | 299,216 | | | | 1,724,051 | |
| Project and procurement management | | | 6,508,800 | | | | 650,880 | | | | 7,159,680 | | | | 43,890 | | | | 7,203,570 | |
| Engineering design | | | 6,208,750 | | | | 620,875 | | | | 6,829,625 | | | | 31,185 | | | | 6,860,810 | |
| Site supervision & constr’n management | | | 8,652,260 | | | | 865,226 | | | | 9,517,486 | | | | 74,511 | | | | 9,591,997 | |
| Commissioning | | | 960,000 | | | | 96,000 | | | | 1,056,000 | | | | 37,422 | | | | 1,093,422 | |
| Vendor commissioning | | | 1,364,622 | | | | 136,462 | | | | 1,501,085 | | | | 68,607 | | | | 1,569,692 | |
| Initial fills | | | 528,861 | | | | 52,886 | | | | 581,747 | | | | 122,167 | | | | 703,914 | |
| Spare Parts | | | 1,158,541 | | | | 115,854 | | | | 1,274,395 | | | | 26,134 | | | | 1,300,529 | |
| Owners cost | | | 3,639,667 | | | | 363,967 | | | | 4,003,633 | | | | 311,850 | | | | 4,315,483 | |
| Total Indirect Costs | | | 32,040,996 | | | | 3,274,873 | | | | 35,315,869 | | | | 1,428,132 | | | | 36,744,002 | |
| TOTAL | | | 143,953,943 | | | | 15,253,586 | | | | 159,207,529 | | | | 23,964,849 | | | | 183,172,378 | |
Table 90 Capital Cost Summary by Discipline (1,150 tpd Option)
Extorre Gold Mines Limited
Cerro Moro Gold – Silver Project
Preliminary Economic Assessment | Page 280 |
| Description | | Capital
Estimate
US$'000 | | | Contingency
US$'000 | | | Subtotal
US$'000 | | | VAT
US$'000 | | | TOTAL
INCLUDING
VAT US$'000 | |
| AREA 200 - PLANT BULK EARTHWORKS | | | 1,802 | | | | 231 | | | | 2,033 | | | | 427 | | | | 2,460 | |
| AREA 310 - CRUSHING | | | 10,253 | | | | 1,096 | | | | 11,349 | | | | 1,595 | | | | 12,945 | |
| AREA 320 – PLANT FEED STORAGE | | | 3,126 | | | | 361 | | | | 3,487 | | | | 649 | | | | 4,136 | |
| AREA 330 - GRINDING AND CLASS’N | | | 6,946 | | | | 733 | | | | 7,679 | | | | 738 | | | | 8,418 | |
| AREA 331 - FLOTATION | | | 1,535 | | | | 162 | | | | 1,697 | | | | 127 | | | | 1,825 | |
| AREA 334 - CONCENTRATE REGRIND | | | 1,068 | | | | 113 | | | | 1,181 | | | | 116 | | | | 1,296 | |
| AREA 336/342 - CONS LEACH & WASHING | | | 2,950 | | | | 325 | | | | 3,276 | | | | 411 | | | | 3,686 | |
| AREA 340 - LEACH & ADSORPTION | | | 5,368 | | | | 631 | | | | 5,999 | | | | 1,076 | | | | 7,074 | |
| AREA 340 - CCD CIRCUIT | | | 4,142 | | | | 457 | | | | 4,598 | | | | 572 | | | | 5,170 | |
| AREA 350 - GOLD RECOVERY | | | 3,777 | | | | 401 | | | | 4,178 | | | | 370 | | | | 4,547 | |
| AREA 360 – REAGENTS | | | 3,240 | | | | 357 | | | | 3,598 | | | | 639 | | | | 4,236 | |
| AREA 370 - POWER AND RETICULATION | | | 6,754 | | | | 769 | | | | 7,523 | | | | 1,437 | | | | 8,960 | |
| AREA 390 - WATER STORE AND DIST’N | | | 1,163 | | | | 123 | | | | 1,286 | | | | 270 | | | | 1,556 | |
| AREA 400/402 - TAILINGS | | | 1,892 | | | | 204 | | | | 2,096 | | | | 292 | | | | 2,388 | |
| AREA 420 - COMPRESSED AIR | | | 622 | | | | 65 | | | | 687 | | | | 49 | | | | 736 | |
| AREA 499 - PLANT PIPING | | | 5,346 | | | | 608 | | | | 5,954 | | | | 1,250 | | | | 7,205 | |
| AREA 804 - CONSTRUCTION EQUIP’NT | | | 4,065 | | | | 463 | | | | 4,528 | | | | 951 | | | | 5,478 | |
| TOTAL DIRECT COST ESTIMATE | | | 64,049 | | | | 7,100 | | | | 71,149 | | | | 10,968 | | | | 82,117 | |
| AREA 500 - ENGINEERING | | | 21,720 | | | | 2,172 | | | | 23,892 | | | | 230 | | | | 24,122 | |
| AREA 510 - COMMISSIONING | | | 2,325 | | | | 232 | | | | 2,557 | | | | 106 | | | | 2,663 | |
| AREA 550/560 - INITIAL FILLS AND SPARES | | | 1,779 | | | | 178 | | | | 1,957 | | | | 157 | | | | 2,114 | |
| AREA 600 - TEMPORARY FACILITIES | | | 3,032 | | | | 374 | | | | 3,405 | | | | 715 | | | | 4,121 | |
| AREA 700 - OWNERS COSTS | | | 3,640 | | | | 364 | | | | 4,004 | | | | 312 | | | | 4,315 | |
| TOTAL INDIRECT COSTS | | | 32,494 | | | | 3,320 | | | | 35,815 | | | | 1,521 | | | | 37,335 | |
| TOTAL PROCESS PLANT | | | 96,543 | | | | 10,420 | | | | 106,964 | | | | 12,489 | | | | 119,452 | |
| INFRASTRUCTURE | | | | | | | | | | | | | | | | | | | | |
| AREA 201 - ACCESS ROADS | | | 2,851 | | | | 285 | | | | 3,136 | | | | 659 | | | | 3,795 | |
| AREA 205 - MOBILE EQUIPMENT | | | 2,305 | | | | 231 | | | | 2,536 | | | | 532 | | | | 3,068 | |
| AREA 375 - POWER SUPPLY | | | 19,988 | | | | 1,999 | | | | 21,987 | | | | 4,617 | | | | 26,605 | |
| AREA 391 - WATER SUPPLY (BOREFIELD) | | | 4,855 | | | | 518 | | | | 5,373 | | | | 1,128 | | | | 6,501 | |
| AREA 401 - TAILINGS STORAGE FACILITY | | | 6,091 | | | | 609 | | | | 6,700 | | | | 1,407 | | | | 8,108 | |
| AREA 410 - FUEL SUPPLY | | | 1,194 | | | | 127 | | | | 1,321 | | | | 277 | | | | 1,599 | |
| AREA 430 / 440 - SITE BUILDINGS AND WORKSHOP | | | 1,335 | | | | 143 | | | | 1,478 | | | | 310 | | | | 1,788 | |
| AREA 460 - ASSAY LABORATORY | | | 2,085 | | | | 210 | | | | 2,295 | | | | 482 | | | | 2,777 | |
| AREA 480/481/485 - CAMP FACILITIES | | | 10,844 | | | | 1,142 | | | | 11,985 | | | | 2,517 | | | | 14,502 | |
| AREA 490 - COMMUNICATIONS | | | 214 | | | | 21 | | | | 235 | | | | 49 | | | | 285 | |
| TOTAL INFRASTRUCTURE | | | 51,762 | | | | 5,285 | | | | 57,047 | | | | 11,980 | | | | 69,027 | |
| TOTAL COST ESTIMATE | | | 148,305 | | | | 15,705 | | | | 164,011 | | | | 24,469 | | | | 188,479 | |
Table 91 Capital Cost Summary by Area (1,300 tpd Option)
Extorre Gold Mines Limited
Cerro Moro Gold – Silver Project
Preliminary Economic Assessment | Page 281 |
| Description | | Capital
Estimate
$'000 | | | Contingency
$'000 | | | Subtotal
$'000 | | | VAT
$'000 | | | TOTAL INCLUDING
VAT $'000 | |
| AREA 200 - PLANT BULK EARTHWORKS | | | 1,756 | | | | 227 | | | | 1,983 | | | | 416 | | | | 2,400 | |
| AREA 310 - CRUSHING | | | 9,511 | | | | 1,020 | | | | 10,531 | | | | 1,541 | | | | 12,072 | |
| AREA 320 - ORE STORAGE | | | 2,997 | | | | 347 | | | | 3,344 | | | | 619 | | | | 3,963 | |
| AREA 330 - GRINDING AND CLASS’N | | | 6,475 | | | | 683 | | | | 7,157 | | | | 692 | | | | 7,849 | |
| AREA 331 - FLOTATION | | | 1,068 | | | | 113 | | | | 1,181 | | | | 116 | | | | 1,296 | |
| AREA 334 - CONCENTRATE REGRIND | | | 1,341 | | | | 142 | | | | 1,483 | | | | 116 | | | | 1,599 | |
| AREA 336/342 - CONS LEACH & WASHING | | | 2,885 | | | | 318 | | | | 3,203 | | | | 400 | | | | 3,603 | |
| AREA 340 - LEACH & ADSORPTION | | | 4,863 | | | | 573 | | | | 5,436 | | | | 973 | | | | 6,409 | |
| AREA 340 - CCD CIRCUIT | | | 4,017 | | | | 444 | | | | 4,461 | | | | 543 | | | | 5,004 | |
| AREA 350 - GOLD RECOVERY | | | 3,577 | | | | 381 | | | | 3,958 | | | | 323 | | | | 4,281 | |
| AREA 360 – REAGENTS | | | 3,115 | | | | 345 | | | | 3,460 | | | | 610 | | | | 4,070 | |
| AREA 370 - POWER AND RETICULATION | | | 6,299 | | | | 723 | | | | 7,022 | | | | 1,428 | | | | 8,450 | |
| AREA 390 - WATER STORE AND DIST’N | | | 1,163 | | | | 123 | | | | 1,286 | | | | 270 | | | | 1,556 | |
| AREA 400/402 - TAILINGS | | | 1,751 | | | | 189 | | | | 1,941 | | | | 274 | | | | 2,215 | |
| AREA 420 - COMPRESSED AIR | | | 597 | | | | 62 | | | | 660 | | | | 48 | | | | 708 | |
| AREA 499 - PLANT PIPING | | | 4,971 | | | | 571 | | | | 5,542 | | | | 1,243 | | | | 6,784 | |
| AREA 804 - CONSTRUCTION EQUIP’NT | | | 3,765 | | | | 433 | | | | 4,198 | | | | 945 | | | | 5,142 | |
| TOTAL DIRECT COST ESTIMATE | | | 60,151 | | | | 6,694 | | | | 66,845 | | | | 10,557 | | | | 77,401 | |
| AREA 500 - ENGINEERING | | | 21,370 | | | | 2,137 | | | | 23,507 | | | | 150 | | | | 23,656 | |
| AREA 510 - COMMISSIONING | | | 2,325 | | | | 232 | | | | 2,557 | | | | 106 | | | | 2,663 | |
| AREA 550/560 - INITIAL FILLS AND SPARES | | | 1,687 | | | | 169 | | | | 1,856 | | | | 148 | | | | 2,004 | |
| AREA 600 - TEMPORARY FACILITIES | | | 3,019 | | | | 373 | | | | 3,392 | | | | 712 | | | | 4,105 | |
| AREA 700 - OWNERS COSTS | | | 3,640 | | | | 364 | | | | 4,004 | | | | 312 | | | | 4,315 | |
| TOTAL INDIRECT COSTS | | | 32,041 | | | | 3,275 | | | | 35,316 | | | | 1,428 | | | | 36,744 | |
| TOTAL PROCESS PLANT | | | 92,192 | | | | 9,969 | | | | 102,160 | | | | 11,985 | | | | 114,145 | |
| INFRASTRUCTURE | | | | | | | | | | | | | | | | | | | | |
| AREA 201 - ACCESS ROADS | | | 2,851 | | | | 285 | | | | 3,136 | | | | 659 | | | | 3,795 | |
| AREA 205 - MOBILE EQUIPMENT | | | 2,305 | | | | 231 | | | | 2,536 | | | | 532 | | | | 3,068 | |
| AREA 375 - POWER SUPPLY | | | 19,988 | | | | 1,999 | | | | 21,987 | | | | 4,617 | | | | 26,605 | |
| AREA 391 - WATER SUPPLY (BOREFIELD) | | | 4,855 | | | | 518 | | | | 5,373 | | | | 1,128 | | | | 6,501 | |
| AREA 401 - TAILINGS STORAGE FACILITY | | | 6,091 | | | | 609 | | | | 6,700 | | | | 1,407 | | | | 8,108 | |
| AREA 410 - FUEL SUPPLY | | | 1,194 | | | | 127 | | | | 1,321 | | | | 277 | | | | 1,599 | |
| AREA 430 / 440 - SITE BUILDINGS AND WORKSHOP | | | 1,335 | | | | 143 | | | | 1,478 | | | | 310 | | | | 1,788 | |
| AREA 460 - ASSAY LABORATORY | | | 2,085 | | | | 210 | | | | 2,295 | | | | 482 | | | | 2,777 | |
| AREA 480/481/485 - CAMP FACILITIES | | | 10,844 | | | | 1,142 | | | | 11,985 | | | | 2,517 | | | | 14,502 | |
| AREA 490 - COMMUNICATIONS | | | 214 | | | | 21 | | | | 235 | | | | 49 | | | | 285 | |
| TOTAL INFRASTRUCTURE | | | 51,762 | | | | 5,285 | | | | 57,047 | | | | 11,980 | | | | 69,027 | |
| TOTAL COST ESTIMATE | | | 143,954 | | | | 15,254 | | | | 159,208 | | | | 23,965 | | | | 183,172 | |
Table 92 Capital Cost Summary by Area (1,150 tpd Option)
Extorre Gold Mines Limited
Cerro Moro Gold – Silver Project
Preliminary Economic Assessment | Page 282 |
| 21.1.2 | Process Plant and Infrastructure Sustaining Capital |
The main area of sustaining capital for the process plant and infrastructure is for the TSF. The TSF will be built in three stages, in years two, four and seven of operation respectively. The estimated sustaining capital costs for these stages are US$ 10,160,000 for stage one, US$ 5,800,000 for stage two and US$ 6,290,000 for stage three, all of them inclusive of 21% VAT.
A provision of US$ 1,000,000 per year was considered for access construction.
In addition in Year 9 a provision US$ 5,000,000 has been included for mine closure.
The mine capital cost estimate was divided into open pit and underground. Using the developed mine schedule estimates were obtained for both equipment and underground development.
For the 1,300 tpd option, the initial mine capital for the open pit amounts to US$ 29.7 million, from which US$ 19.9 million is for main equipment, US$ 1.4 million for support equipment, US$ 6.5 million in other investments and US$ 1.9 million for dispatch, as detailed in Table 93. An additional US$ 3.6 million is required for the open pit as sustaining capital due to fleet increase.
For the 1,150 tpd option, the initial mine capital for the open pit amounts to US$ 19.9 million, from which US$ 11.0 million is for main equipment, US$ 1.4 million for support equipment, US$ 6.0 million in other investments and US$ 1.6 million for dispatch, as detailed in Table 94. An additional US$ 11.6 million is required for the open pit as sustaining capital due to fleet increase. A further US$ 2.7 million is estimated to be required for the open pit pre-stripping.
Extorre Gold Mines Limited
Cerro Moro Gold – Silver Project
Preliminary Economic Assessment | Page 283 |
| Period name | | %VAT | | | | | | -1 | | | 1 | | | 2 | | | 3 | | | 4 | | | 5 | | | 6 | | | 7 | | | 8 | |
| Main Equipment | | | | | | | MUS$ | | | | 19.86 | | | | - | | | | 0.87 | | | | 1.22 | | | | - | | | | - | | | | - | | | | - | | | | - | |
| Loading | | | 21 | % | | | MUS$ | | | | 3.60 | | | | - | | | | - | | | | - | | | | - | | | | - | | | | - | | | | - | | | | - | |
| Hauling | | | 21 | % | | | MUS$ | | | | 7.33 | | | | - | | | | - | | | | 1.22 | | | | - | | | | - | | | | - | | | | - | | | | - | |
| Drilling | | | 21 | % | | | MUS$ | | | | 0.87 | | | | - | | | | 0.87 | | | | - | | | | - | | | | - | | | | - | | | | - | | | | - | |
| Ancillary | | | 21 | % | | | MUS$ | | | | 8.06 | | | | - | | | | - | | | | - | | | | - | | | | - | | | | - | | | | - | | | | - | |
| Support | | | | | | | MUS$ | | | | 1.37 | | | | - | | | | 0.06 | | | | - | | | | - | | | | - | | | | - | | | | - | | | | - | |
| Backhoe | | | 21 | % | | | MUS$ | | | | 0.27 | | | | - | | | | - | | | | - | | | | - | | | | - | | | | - | | | | - | | | | - | |
| Fuel Truck | | | 21 | % | | | MUS$ | | | | 0.12 | | | | - | | | | - | | | | - | | | | - | | | | - | | | | - | | | | - | | | | - | |
| Lube Truck | | | 21 | % | | | MUS$ | | | | 0.17 | | | | - | | | | - | | | | - | | | | - | | | | - | | | | - | | | | - | | | | - | |
| Support Truck | | | 21 | % | | | MUS$ | | | | 0.11 | | | | - | | | | - | | | | - | | | | - | | | | - | | | | - | | | | - | | | | - | |
| Lowboy Truck | | | 21 | % | | | MUS$ | | | | 0.61 | | | | - | | | | - | | | | - | | | | - | | | | - | | | | - | | | | - | | | | - | |
| Lightning Plant | | | 21 | % | | | MUS$ | | | | 0.09 | | | | - | | | | 0.06 | | | | - | | | | - | | | | - | | | | - | | | | - | | | | - | |
| Other Investments (US$) | | | | | | | MUS$ | | | | 6.49 | | | | - | | | | 0.42 | | | | - | | | | 0.12 | | | | 0.65 | | | | - | | | | - | | | | 0.13 | |
| Small backhoe 0,5 - 1 yd3 | | | 21 | % | | | MUS$ | | | | 0.27 | | | | - | | | | - | | | | - | | | | - | | | | - | | | | - | | | | - | | | | - | |
| Sump Pumps | | | 21 | % | | | MUS$ | | | | 0.29 | | | | - | | | | 0.07 | | | | - | | | | - | | | | - | | | | - | | | | - | | | | - | |
| Pickups | | | 21 | % | | | MUS$ | | | | 0.61 | | | | - | | | | - | | | | - | | | | - | | | | 0.61 | | | | - | | | | - | | | | - | |
| Explosives Truck | | | 21 | % | | | MUS$ | | | | 0.12 | | | | - | | | | - | | | | - | | | | - | | | | - | | | | - | | | | - | | | | - | |
| Forklift 7t | | | 21 | % | | | MUS$ | | | | 0.17 | | | | - | | | | - | | | | - | | | | - | | | | - | | | | - | | | | - | | | | - | |
| Manlift 25t | | | 21 | % | | | MUS$ | | | | 0.15 | | | | - | | | | - | | | | - | | | | - | | | | - | | | | - | | | | - | | | | - | |
| Compactor | | | 21 | % | | | MUS$ | | | | 0.50 | | | | - | | | | - | | | | - | | | | - | | | | - | | | | - | | | | - | | | | - | |
| Computer Equipment (Tech Service) | | | 21 | % | | | MUS$ | | | | 0.12 | | | | - | | | | - | | | | - | | | | 0.12 | | | | - | | | | - | | | | - | | | | - | |
| Mining - Geology Soft Ware | | | 21 | % | | | MUS$ | | | | 0.42 | | | | - | | | | - | | | | - | | | | - | | | | - | | | | - | | | | - | | | | - | |
| Furnitures | | | 21 | % | | | MUS$ | | | | 0.12 | | | | - | | | | - | | | | - | | | | - | | | | - | | | | - | | | | - | | | | - | |
| Radio Equipment | | | 21 | % | | | MUS$ | | | | 0.07 | | | | - | | | | - | | | | - | | | | - | | | | - | | | | - | | | | - | | | | - | |
| Spare parts (6% Main Equip.) | | | 21 | % | | | MUS$ | | | | 1.27 | | | | - | | | | - | | | | - | | | | - | | | | - | | | | - | | | | - | | | | - | |
| Consulting / Engineering | | | 21 | % | | | MUS$ | | | | 0.73 | | | | - | | | | - | | | | - | | | | - | | | | - | | | | - | | | | - | | | | - | |
| Survey Equipment | | | 21 | % | | | MUS$ | | | | 0.36 | | | | - | | | | - | | | | - | | | | - | | | | - | | | | - | | | | - | | | | - | |
| Geology & Geotechnical Equipment | | | 21 | % | | | MUS$ | | | | 0.48 | | | | - | | | | - | | | | - | | | | - | | | | - | | | | - | | | | - | | | | - | |
| Buses | | | 21 | % | | | MUS$ | | | | 0.18 | | | | - | | | | - | | | | - | | | | - | | | | - | | | | - | | | | - | | | | - | |
| Mining Haul Roads | | | 21 | % | | | | | | | 0.62 | | | | - | | | | 0.34 | | | | - | | | | - | | | | 0.05 | | | | - | | | | - | | | | 0.13 | |
| Dispatch | | | 21 | % | | | MUS$ | | | | 1.94 | | | | - | | | | 0.09 | | | | 0.02 | | | | - | | | | - | | | | - | | | | - | | | | - | |
| Total Open Pit Capital Cost | | | | | | | MUS$ | | | | 29.66 | | | | - | | | | 1.44 | | | | 1.25 | | | | 0.12 | | | | 0.65 | | | | - | | | | - | | | | 0.13 | |
Table 93 Open Pit Capital Cost (1,300 tpd option)
Extorre Gold Mines Limited
Cerro Moro Gold – Silver Project
Preliminary Economic Assessment | Page 284 |
| Period name | | %VAT | | | | | | -1 | | | 1 | | | 2 | | | 3 | | | 4 | | | 5 | | | 6 | | | 7 | |
| Main Equipment | | | | | | | MUS$ | | | | 11.00 | | | | 0.87 | | | | 6.85 | | | | 0.78 | | | | 1.22 | | | | - | | | | - | | | | - | |
| Loading | | | 21 | % | | | MUS$ | | | | 2.44 | | | | - | | | | 1.16 | | | | - | | | | - | | | | - | | | | - | | | | - | |
| Hauling | | | 21 | % | | | MUS$ | | | | 3.67 | | | | - | | | | 2.44 | | | | - | | | | 1.22 | | | | - | | | | - | | | | - | |
| Drilling | | | 21 | % | | | MUS$ | | | | 0.87 | | | | 0.87 | | | | - | | | | - | | | | - | | | | - | | | | - | | | | - | |
| Ancillary | | | 21 | % | | | MUS$ | | | | 4.03 | | | | - | | | | 3.24 | | | | 0.78 | | | | - | | | | - | | | | - | | | | - | |
| Support | | | | | | | MUS$ | | | | 1.37 | | | | 0.06 | | | | 0.01 | | | | - | | | | - | | | | - | | | | - | | | | 0.01 | |
| Backhoe | | | 21 | % | | | MUS$ | | | | 0.27 | | | | - | | | | - | | | | - | | | | - | | | | - | | | | - | | | | - | |
| Fuel Truck | | | 21 | % | | | MUS$ | | | | 0.12 | | | | - | | | | - | | | | - | | | | - | | | | - | | | | - | | | | - | |
| Lube Truck | | | 21 | % | | | MUS$ | | | | 0.17 | | | | - | | | | - | | | | - | | | | - | | | | - | | | | - | | | | - | |
| Support Truck | | | 21 | % | | | MUS$ | | | | 0.11 | | | | - | | | | - | | | | - | | | | - | | | | - | | | | - | | | | - | |
| Lowboy Truck | | | 21 | % | | | MUS$ | | | | 0.61 | | | | - | | | | - | | | | - | | | | - | | | | - | | | | - | | | | - | |
| Lightning Plant | | | 21 | % | | | MUS$ | | | | 0.09 | | | | 0.06 | | | | 0.01 | | | | - | | | | - | | | | - | | | | - | | | | 0.01 | |
| Other Investments (US$) | | | | | | | MUS$ | | | | 5.96 | | | | 0.42 | | | | - | | | | 0.12 | | | | 0.65 | | | | - | | | | - | | | | 0.13 | |
| Small backhoe 0,5 - 1 yd3 | | | 21 | % | | | MUS$ | | | | 0.27 | | | | - | | | | - | | | | - | | | | - | | | | - | | | | - | | | | - | |
| Sump Pumps | | | 21 | % | | | MUS$ | | | | 0.29 | | | | 0.07 | | | | - | | | | - | | | | - | | | | - | | | | - | | | | - | |
| Pickups | | | 21 | % | | | MUS$ | | | | 0.61 | | | | - | | | | - | | | | - | | | | 0.61 | | | | - | | | | - | | | | - | |
| Explosives Truck | | | 21 | % | | | MUS$ | | | | 0.12 | | | | - | | | | - | | | | - | | | | - | | | | - | | | | - | | | | - | |
| Forklift 7t | | | 21 | % | | | MUS$ | | | | 0.17 | | | | - | | | | - | | | | - | | | | - | | | | - | | | | - | | | | - | |
| Manlift 25t | | | 21 | % | | | MUS$ | | | | 0.15 | | | | - | | | | - | | | | - | | | | - | | | | - | | | | - | | | | - | |
| Compactor | | | 21 | % | | | MUS$ | | | | 0.50 | | | | - | | | | - | | | | - | | | | - | | | | - | | | | - | | | | - | |
| Computer Equipment (Tech Service) | | | 21 | % | | | MUS$ | | | | 0.12 | | | | - | | | | - | | | | 0.12 | | | | - | | | | - | | | | - | | | | - | |
| Mining - Geology Soft Ware | | | 21 | % | | | MUS$ | | | | 0.42 | | | | - | | | | - | | | | - | | | | - | | | | - | | | | - | | | | - | |
| Furnitures | | | 21 | % | | | MUS$ | | | | 0.12 | | | | - | | | | - | | | | - | | | | - | | | | - | | | | - | | | | - | |
| Radio Equipment | | | 21 | % | | | MUS$ | | | | 0.07 | | | | - | | | | - | | | | - | | | | - | | | | - | | | | - | | | | - | |
| Spare parts (6% Main Equip.) | | | 21 | % | | | MUS$ | | | | 0.74 | | | | - | | | | - | | | | - | | | | - | | | | - | | | | - | | | | - | |
| Consulting / Engineering | | | 21 | % | | | MUS$ | | | | 0.73 | | | | - | | | | - | | | | - | | | | - | | | | - | | | | - | | | | - | |
| Survey Equipment | | | 21 | % | | | MUS$ | | | | 0.36 | | | | - | | | | - | | | | - | | | | - | | | | - | | | | - | | | | - | |
| Geology & Geotechnical Equipment | | | 21 | % | | | MUS$ | | | | 0.48 | | | | - | | | | - | | | | - | | | | - | | | | - | | | | - | | | | - | |
| Buses | | | 21 | % | | | MUS$ | | | | 0.18 | | | | - | | | | - | | | | - | | | | - | | | | - | | | | - | | | | - | |
| Mining Haul Roads | | | 21 | % | | | MUS$ | | | | 0.62 | | | | 0.34 | | | | - | | | | - | | | | 0.05 | | | | - | | | | - | | | | 0.13 | |
| Dispatch | | | 21 | % | | | MUS$ | | | | 1.58 | | | | 0.09 | | | | 0.24 | | | | 0.09 | | | | 0.02 | | | | - | | | | - | | | | - | |
| Total Open Pit Capital Cost | | | - | | | | MUS$ | | | | 19.91 | | | | 1.44 | | | | 7.11 | | | | 1.00 | | | | 1.90 | | | | - | | | | - | | | | 0.14 | |
Table 94 Open Pit Capital Cost (1,150 tpd option)
The underground mine capital cost estimate for 1,300 tpd option is detailed in Table 95 through Table 98. The estimate had been divided into development, equipment, infrastructure & services, pre-production operation and others. The initial capital cost amounts to US$ 22.4 million for equipment, because even though they are required during the first year they need to be ordered one year before, and US$ 43.7 million for development and infrastructure. Additional US$ 109.4 million is required as sustaining capital, mainly because of development requirement and fleet increase and substitution.
Extorre Gold Mines Limited
Cerro Moro Gold – Silver Project
Preliminary Economic Assessment | Page 285 |
| Year | | Development | | | Equipment | | | Infraestructure
and Services | | | Others | | | Pre-production
Operation | | | Total | |
| -2 | | | 6.39 | | | | 8.92 | | | | 2.22 | | | | 0.96 | | | | 0.73 | | | | 19.21 | |
| -1 | | | 24.50 | | | | 13.45 | | | | 1.03 | | | | 1.21 | | | | 6.68 | | | | 46.87 | |
| 1 | | | 29.43 | | | | 10.76 | | | | 0.50 | | | | 0.94 | | | | - | | | | 41.63 | |
| 2 | | | 21.58 | | | | 9.54 | | | | 0.19 | | | | 0.81 | | | | - | | | | 32.11 | |
| 3 | | | 15.29 | | | | 2.26 | | | | 0.07 | | | | 0.19 | | | | - | | | | 17.82 | |
| 4 | | | 13.75 | | | | - | | | | - | | | | - | | | | - | | | | 13.75 | |
| 5 | | | 3.96 | | | | - | | | | - | | | | 0.15 | | | | - | | | | 4.10 | |
| 6 | | | - | | | | - | | | | - | | | | - | | | | - | �� | | | - | |
| 7 | | | | | | | | | | | | | | | | | | | | | | | | |
| TOTAL | | | 114.90 | | | | 44.92 | | | | 4.01 | | | | 4.26 | | | | 7.41 | | | | 175.49 | |
Table 95 Underground Capital Cost Summary (MUS$) – 1,300 tpd option
| Developments (m) | | US$/m | | | Year -2 | | | Year -1 | | | Year 1 | | | Year 2 | | | Year 3 | | | Year 4 | | | Year 5 | |
| Horizontal Developments (single end) | | | 7,000.00 | | | | 705 | | | | 2,362 | | | | 1,646 | | | | 73 | | | | | | | | | | | | | |
| Horizontal Developments (multiple ends) | | | 3,000.00 | | | | 269 | | | | 2,206 | | | | 4,139 | | | | 5,764 | | | | 4,255 | | | | 3,539 | | | | 538 | |
| Vertical Developments (RB) | | | 4,416.00 | | | | 147 | | | | 305 | | | | 1,244 | | | | 856 | | | | 572 | | | | 708 | | | | 530 | |
| TOTAL | | | MUS$ | | | | 6.39 | | | | 24.50 | | | | 29.43 | | | | 21.58 | | | | 15.29 | | | | 13.75 | | | | 3.96 | |
Table 96 Development Capital Cost – 1,300 tpd option
Extorre Gold Mines Limited
Cerro Moro Gold – Silver Project
Preliminary Economic Assessment | Page 286 |
| Equipment | | US$/un | | | | Year -2 | | Year -1 | | Year 1 | | Year 2 | | Year 3 | | Year 4 | | Year 5 | | Year 6 | | Year 7 | | Year 8 | | Year 9 |
| LHD 6 yd3 | | | | | Requirement | | 1 | | 1 | | 2 | | 3 | | 3 | | 2 | | 1 | | 1 | | | | | | |
| | | $ | 744,114 | | Acquisition | | 1 | | | | 1 | | 1 | | | | | | | | | | | | | | |
| LHD 3.5yd3 | | | | | Requirement | | 1 | | 3 | | 4 | | 7 | | 7 | | 7 | | 6 | | 4 | | 3 | | 2 | | 1 |
| | | $ | 537,683 | | Acquisition | | 1 | | 2 | | 1 | | 3 | | | | | | | | | | | | | | |
| Trucks 30t | | | | | Requirement | | 2 | | 5 | | 9 | | 11 | | 12 | | 10 | | 5 | | 4 | | 3 | | 2 | | |
| | | $ | 865,653 | | Acquisition | | 2 | | 3 | | 4 | | 2 | | 1 | | | | | | | | | | | | |
| Jumbo horizontal | | | | | Requirement | | 1 | | 6 | | 6 | | 8 | | 8 | | 6 | | 3 | | 2 | | | | | | |
| | | $ | 730,565 | | Acquisition | | 1 | | 5 | | | | 2 | | | | | | 1 | | | | | | | | |
| Jumbo Radial | | | | | Requirement | | | | 1 | | 1 | | 1 | | 2 | | 2 | | 2 | | 2 | | 1 | | 1 | | 1 |
| | | $ | 727,908 | | Acquisition | | | | 1 | | | | | | 1 | | | | 1 | | | | | | | | |
| Jumbo support | | | | | Requirement | | 1 | | 2 | | 2 | | 1 | | | | | | | | | | | | | | |
| | | $ | 680,000 | | Acquisition | | 1 | | 2 | | 2 | | 1 | | | | | | | | | | | | | | |
| Explosives charger | | | | | Requirement | | 1 | | 2 | | 3 | | 4 | | 4 | | 3 | | 2 | | 1 | | | | | | |
| | | $ | 250,000 | | Acquisition | | 1 | | 1 | | 1 | | 1 | | | | | | | | | | | | | | |
| Others | | | | | | | | | | | | | | | | | | | | | | | | | | | |
| Compressors 7cfm | | $ | 79,000 | | | | 1 | | 1 | | 1 | | | | | | | | | | | | | | | | |
| Main Fans | | $ | 100,000 | | | | 4 | | 2 | | 2 | | 2 | | | | | | | | | | | | | | |
| Secondary Fans | | $ | 30,000 | | | | 7 | | 5 | | 5 | | 5 | | | | | | | | | | | | | | |
| Service truck | | $ | 95,000 | | | | 1 | | 1 | | | | | | | | | | | | | | | | | | |
| Fuel truck | | $ | 100,000 | | | | 1 | | | | | | 1 | | | | | | | | | | | | | | |
| Lube truck | | $ | 140,000 | | | | 1 | | | | | | 1 | | | | | | | | | | | | | | |
| Explosives truck | | $ | 100,000 | | | | 1 | | | | | | 1 | | | | | | | | | | | | | | |
| Lighting plant | | $ | 12,000 | | | | 6 | | | | | | 3 | | | | | | | | | | | | | | |
| Pickups | | $ | 50,000 | | | | 3 | | 5 | | | | 10 | | | | | | | | | | | | | | |
| Platform | | $ | 380,000 | | | | 1 | | | | 3 | | | | | | | | | | | | | | | | |
| Mixer 6 m3 | | $ | 420,000 | | | | 1 | | | | 1 | | | | | | | | | | | | | | | | |
| Minibus | | $ | 75,000 | | | | | | 3 | | | | 1 | | | | | | | | | | | | | | |
| Shotcrete machine | | $ | 275,000 | | | | 1 | | | | 1 | | | | | | | | | | | | | | | | |
| Water truck | | $ | 100,000 | | | | 1 | | | | 1 | | | | | | | | | | | | | | | | |
| Scaler | | $ | 175,000 | | | | 1 | | 2 | | 1 | | | | 1 | | | | | | | | | | | | |
| Auxiliary truck | | $ | 100,000 | | | | | | 1 | | | | 1 | | 1 | | | | | | | | | | | | |
| Subtotal | | | MUS$ | | | | 7.37 | | 11.11 | | 8.89 | | 7.88 | | 1.87 | | - | | 1.46 | | - | | - | | | | |
| VAT | | | 21 | % | | | 1.55 | | 2.33 | | 1.87 | | 1.65 | | 0.39 | | - | | 0.31 | | - | | - | | - | | - |
| TOTAL | | | MUS$ | | | | 8.92 | | 13.45 | | 10.76 | | 9.54 | | 2.26 | | - | | 1.76 | | - | | - | | - | | - |
Table 97 Underground Equipment Capital Cost – 1,300 tpd option
Extorre Gold Mines Limited
Cerro Moro Gold – Silver Project
Preliminary Economic Assessment | Page 287 |
| Infrastructure and Services | | US$ | | | -2 | | | -1 | | | 1 | | | 2 | | | 3 | |
| Workshops & Offices | | $ | 500,000 | | | | 100 | % | | | | | | | | | | | | | | | | |
| Workshops & Offices Equipment | | $ | 100,000 | | | | 100 | % | | | | | | | | | | | | | | | | |
| Explosives UG Facilities | | $ | 80,000 | | | | 100 | % | | | | | | | | | | | | | | | | |
| Filling Cement Plant | | $ | 250,000 | | | | | | | | 100 | % | | | | | | | | | | | | |
| Mine Portal (4) | | $ | 462,293 | | | | 50 | % | | | | | | | 25 | % | | | 25 | % | | | | |
| Fire Refuge | | $ | 400,000 | | | | 50 | % | | | 50 | % | | | | | | | | | | | | |
| Escape Ways (Ladderways) | | $ | 250,000 | | | | 50 | % | | | 50 | % | | | | | | | | | | | | |
| Mine Electric Transformer | | $ | 350,000 | | | | 50 | % | | | 25 | % | | | 25 | % | | | | | | | | |
| Transf. Excavations | | $ | 712,756 | | | | 50 | % | | | 10 | % | | | 20 | % | | | 10 | % | | | 10 | % |
| Electric Cables & Protections | | $ | 400,000 | | | | 50 | % | | | 25 | % | | | 25 | % | | | | | | | | |
| Comunication Equipment | | $ | 200,000 | | | | 50 | % | | | 25 | % | | | 25 | % | | | | | | | | |
| Dewatering | | $ | 300,000 | | | | 50 | % | | | 50 | % | | | | | | | | | | | | |
| TOTAL | | | MUS$ | | | | 2.22 | | | | 1.03 | | | | 0.50 | | | | 0.19 | | | | 0.07 | |
Table 98 Underground Infrastructure and Services Capital Cost – 1,300 tpd option
The underground mine capital cost estimate for 1,150 tpd option is detailed in Table 99 through Table 102. The estimate had been divided into development, equipment, infrastructure & services, pre-production operation and others. The initial capital cost amounts to US$ 19.3 million for equipment, because even though they are required during the first year needed to be ordered one year before, and US$ 31.6 million for development and infrastructure. Additional US$ 119.5 million is required as sustaining capital, mainly because of development requirements and fleet increase and substitution.
| Year | | Development | | | Equipment | | | Infraestructure
and Services | | | Others | | | Pre-production
Operation | | | Total | |
| -2 | | | 6.39 | | | | 8.92 | | | | 2.22 | | | | 0.96 | | | | 0.73 | | | | 19.21 | |
| -1 | | | 14.03 | | | | 10.39 | | | | 1.03 | | | | 0.96 | | | | 5.29 | | | | 31.71 | |
| 1 | | | 28.59 | | | | 10.90 | | | | 0.49 | | | | 0.95 | | | | - | | | | 40.94 | |
| 2 | | | 26.64 | | | | 10.06 | | | | 0.19 | | | | 0.85 | | | | - | | | | 37.73 | |
| 3 | | | 16.05 | | | | 1.21 | | | | 0.07 | | | | 0.11 | | | | - | | | | 17.44 | |
| 4 | | | 17.36 | | | | - | | | | - | | | | 0.03 | | | | - | | | | 17.39 | |
| 5 | | | 5.84 | | | | - | | | | - | | | | 0.15 | | | | - | | | | 5.99 | |
| 6 | | | - | | | | - | | | | - | | | | - | | | | - | | | | - | |
| 7 | | | | | | | | | | | | | | | | | | | | | | | | |
| TOTAL | | | 114.90 | | | | 41.48 | | | | 4.00 | | | | 4.00 | | | | 6.02 | | | | 170.40 | |
Table 99 Underground Capital Cost Summary (MUS$) – 1,150 tpd option
Extorre Gold Mines Limited
Cerro Moro Gold – Silver Project
Preliminary Economic Assessment | Page 288 |
| Developments (m) | | US$/m | | | Year -2 | | | Year -1 | | | Year 1 | | | Year 2 | | | Year 3 | | | Year 4 | | | Year 5 | |
| Horizontal Developments (single end) | | | 7,000.00 | | | | 705 | | | | 1,015 | | | | 2,171 | | | | 896 | | | | | | | | | | | | | |
| Horizontal Developments (multiple ends) | | | 3,000.00 | | | | 269 | | | | 1,940 | | | | 3,229 | | | | 5,172 | | | | 4,490 | | | | 4,603 | | | | 1,008 | |
| Vertical Developments (RB) | | | 4,416.00 | | | | 147 | | | | 250 | | | | 840 | | | | 1,099 | | | | 584 | | | | 804 | | | | 638 | |
| TOTAL | | | MUS$ | | | | 6.39 | | | | 14.03 | | | | 28.59 | | | | 26.64 | | | | 16.05 | | | | 17.36 | | | | 5.84 | |
Table 100 Development Capital Cost – 1,150 tpd option
| Equipment | | US$/un | | | | Year -2 | | Year -1 | | Year 1 | | Year 2 | | Year 3 | | Year 4 | | Year 5 |
| LHD 6 yd3 | | | | | Requirement | | 1 | | 1 | | 2 | | 3 | | 3 | | 2 | | 1 |
| | | US$ | 744,114 | | Acquisition | | 1 | | | | 1 | | 1 | | | | | | |
| LHD 3.5yd3 | | | | | Requirement | | 1 | | 3 | | 4 | | 7 | | 7 | | 7 | | 6 |
| | | US$ | 537,683 | | Acquisition | | 1 | | 2 | | 1 | | 3 | | | | | | |
| Trucks 30t | | | | | Requirement | | 2 | | 4 | | 7 | | 9 | | 9 | | 9 | | 5 |
| | | US$ | 865,653 | | Acquisition | | 2 | | 2 | | 3 | | 2 | | | | | | |
| Jumbo horizontal | | | | | Requirement | | 1 | | 5 | | 6 | | 8 | | 8 | | 6 | | 4 |
| | | US$ | 730,565 | | Acquisition | | 1 | | 4 | | 1 | | 2 | | | | | | 1 |
| Jumbo Radial | | | | | Requirement | | | | 1 | | 1 | | 1 | | 2 | | 2 | | 2 |
| | | US$ | 727,908 | | Acquisition | | | | 1 | | | | | | 1 | | | | 1 |
| Jumbo support | | | | | Requirement | | 1 | | 1 | | 2 | | 2 | | | | | | |
| | | US$ | 680,000 | | Acquisition | | 1 | | 1 | | 2 | | 2 | | | | | | |
| Explosives charger | | | | | Requirement | | 1 | | 1 | | 3 | | 3 | | 3 | | 3 | | 2 |
| | | US$ | 250,000 | | Acquisition | | 1 | | | | 2 | | | | | | 1 | | |
| Others | | | | | | | | | | | | | | | | | | | |
| Compressors 7cfm | | US$ | 79,000 | | | | 1 | | 1 | | 1 | | | | | | | | |
| Main Fans | | US$ | 100,000 | | | | 4 | | 2 | | 2 | | 2 | | | | | | |
| Secondary Fans | | US$ | 30,000 | | | | 7 | | 5 | | 5 | | 5 | | | | | | |
| Service truck | | US$ | 95,000 | | | | 1 | | 1 | | | | | | | | | | |
| Fuel truck | | US$ | 100,000 | | | | 1 | | | | | | 1 | | | | | | |
| Lube truck | | US$ | 140,000 | | | | 1 | | | | | | 1 | | | | | | |
| Explosives truck | | US$ | 100,000 | | | | 1 | | | | | | 1 | | | | | | |
| Lightingplant | | US$ | 12,000 | | | | 6 | | | | | | 3 | | | | | | |
| Pickups | | US$ | 50,000 | | | | 3 | | 5 | | | | 10 | | | | | | |
| Platform | | US$ | 380,000 | | | | 1 | | | | 3 | | | | | | | | |
| Mixer 6 m3 | | US$ | 420,000 | | | | 1 | | | | 1 | | | | | | | | |
| Minibus | | US$ | 75,000 | | | | | | 3 | | | | 1 | | | | | | |
| Shotcrete machine | | US$ | 275,000 | | | | 1 | | | | 1 | | | | | | | | |
| Water truck | | US$ | 100,000 | | | | 1 | | | | 1 | | | | | | | | |
| Scaler | | US$ | 175,000 | | | | 1 | | 2 | | 1 | | | | 1 | | | | |
| Auxiliary truck | | US$ | 100,000 | | | | | | 1 | | | | 1 | | 1 | | | | |
| Subtotal | | | MUS$ | | | | 7.37 | | 8.59 | | 9.01 | | 8.31 | | 1.00 | | 0.25 | | 1.46 |
| VAT | | | 21 | % | | | 1.55 | | 1.80 | | 1.89 | | 1.75 | | 0.21 | | 0.05 | | 0.31 |
| TOTAL | | | MUS$ | | | | 8.92 | | 10.39 | | 10.90 | | 10.06 | | 1.21 | | 0.30 | | 1.76 |
Table 101 Underground Equipment Capital Cost – 1,150 tpd option
Extorre Gold Mines Limited
Cerro Moro Gold – Silver Project
Preliminary Economic Assessment | Page 289 |
| Infrastructure and Services | | US$ | | | -2 | | | -1 | | | 1 | | | 2 | | | 3 | |
| Workshops & Offices | | US$ | 500,000 | | | | 100 | % | | | | | | | | | | | | | | | | |
| Workshops & Offices Equipment | | US$ | 100,000 | | | | 100 | % | | | | | | | | | | | | | | | | |
| Explosives UG Facilities | | US$ | 80,000 | | | | 100 | % | | | | | | | | | | | | | | | | |
| Filling Cement Plant | | US$ | 250,000 | | | | | | | | 100 | % | | | | | | | | | | | | |
| Mine Portal (4) | | US$ | 462,293 | | | | 50 | % | | | | | | | 25 | % | | | 25 | % | | | | |
| Fire Refuge | | US$ | 400,000 | | | | 50 | % | | | 50 | % | | | | | | | | | | | | |
| Escape Ways (Ladder ways) | | US$ | 250,000 | | | | 50 | % | | | 50 | % | | | | | | | | | | | | |
| Mine Electric Transformer | | US$ | 350,000 | | | | 50 | % | | | 25 | % | | | 25 | % | | | | | | | | |
| Transf. Excavations | | US$ | 709,050 | | | | 50 | % | | | 10 | % | | | 20 | % | | | 10 | % | | | 10 | % |
| Electric Cables & Protections | | US$ | 400,000 | | | | 50 | % | | | 25 | % | | | 25 | % | | | | | | | | |
| Communication Equipment | | US$ | 200,000 | | | | 50 | % | | | 25 | % | | | 25 | % | | | | | | | | |
| Dewatering | | US$ | 300,000 | | | | 50 | % | | | 50 | % | | | | | | | | | | | | |
| TOTAL | | | MUS$ | | | | 2.22 | | | | 1.03 | | | | 0.49 | | | | 0.19 | | | | 0.07 | |
Table 102 Underground Infrastructure and Services Capital Cost – 1,150 tpd option
General
The operating cost estimate is quoted to an accuracy level of -20 to +50% in line with PEA requirements. The following qualifications are made:
| § | The estimate is in United States of America dollars USD; |
| § | All measurement units are metric; |
| § | The estimate is only for the process plant and associated borefield operating costs. No allowance has been made for any corporate overhead or offsite costs; |
| § | No allowance has been made for offsite bullion transport and refining costs; |
| § | There is no escalation in the estimate. |
Operating cost estimates for the process plant and associated borefield have been based upon:
| § | Budget price quotations for reagents and grinding media; |
| § | Reagent and grinding media consumptions based on testwork; |
Summary
The operating cost estimate for 1,300 tpd option on an annual basis is summarized in tables Table 103 and Table 104, which also include life of mine (LOM) weighted averages for the operating costs per cost centre. Table 105 and Table 106 show summaries for the 1,150 tpd option.
Extorre Gold Mines Limited
Cerro Moro Gold – Silver Project
Preliminary Economic Assessment | Page 290 |
| Production | | Y01 | | | Y02 | | | Y03 | | | Y04 | | | Y05 | | | Y06 | | | Y07 | | | Y08 | | | Y09 | | | LOM | |
| Tonnes Treated (t) | | | 375,527 | | | | 436,570 | | | | 436,570 | | | | 436,570 | | | | 480,180 | | | | 480,180 | | | | 480,180 | | | | 480,180 | | | | 429,321 | | | | 4,035,278 | |
| Gold (g/t) | | | 11.2 | | | | 9.6 | | | | 8.7 | | | | 10.3 | | | | 7.3 | | | | 5.2 | | | | 4.1 | | | | 3.4 | | | | 3.6 | | | | 6.9 | |
| Silver (g/t) | | | 547.8 | | | | 482.9 | | | | 523.9 | | | | 461.8 | | | | 413.3 | | | | 332.9 | | | | 362.5 | | | | 275.6 | | | | 174.3 | | | | 391.6 | |
| Cost Centre | | Unit Cost
($/t) | | | Unit Cost
($/t) | | | Unit Cost
($/t) | | | Unit Cost
($/t) | | | Unit Cost
($/t) | | | Unit Cost
($/t) | | | Unit Cost
($/t) | | | Unit Cost
($/t) | | | Unit Cost
($/t) | | | Unit Cost
($/t) | |
| Cost Centre Labour | | | 15.93 | | | | 13.70 | | | | 13.70 | | | | 13.70 | | | | 12.45 | | | | 12.45 | | | | 12.45 | | | | 12.45 | | | | 13.93 | | | | 13.34 | |
| Power | | | 6.06 | | | | 5.78 | | | | 5.78 | | | | 5.78 | | | | 5.26 | | | | 5.26 | | | | 5.26 | | | | 5.26 | | | | 5.88 | | | | 5.57 | |
| Regents and Grinding | | | 46.79 | | | | 45.20 | | | | 45.85 | | | | 44.93 | | | | 44.21 | | | | 42.85 | | | | 43.41 | | | | 42.10 | | | | 40.58 | | | | 43.92 | |
| Media Maintenance | | | 4.01 | | | | 3.45 | | | | 3.45 | | | | 3.45 | | | | 3.14 | | | | 3.14 | | | | 3.14 | | | | 3.14 | | | | 3.51 | | | | 3.36 | |
| Linings | | | 1.51 | | | | 1.30 | | | | 1.30 | | | | 1.30 | | | | 1.18 | | | | 1.18 | | | | 1.18 | | | | 1.18 | | | | 1.32 | | | | 1.26 | |
| Other | | | 6.96 | | | | 6.07 | | | | 6.07 | | | | 6.07 | | | | 5.57 | | | | 5.49 | | | | 5.49 | | | | 5.43 | | | | 6.00 | | | | 5.87 | |
| Total | | | 81.26 | | | | 75.49 | | | | 76.15 | | | | 75.23 | | | | 71.81 | | | | 70.36 | | | | 70.92 | | | | 69.55 | | | | 71.22 | | | | 73.32 | |
Table 103 Operating Cost Estimate by Cost Centre (1,300 tpd option)
Extorre Gold Mines Limited
Cerro Moro Gold – Silver Project
Preliminary Economic Assessment | Page 291 |
| Production | | Y01 | | | Y02 | | | Y03 | | | Y04 | | | Y05 | | | Y06 | | | Y07 | | | Y08 | | | Y09 | | | LOM | |
| Tonnes Treated (+) | | | 375,527 | | | | 436,570 | | | | 436,570 | | | | 436,570 | | | | 480,180 | | | | 480,180 | | | | 480,180 | | | | 480,180 | | | | 429,321 | | | | 4,035,278 | |
| Gold (g / +) | | | 11.2 | | | | 9.6 | | | | 8.7 | | | | 10.3 | | | | 7.3 | | | | 5.2 | | | | 4.1 | | | | 3.4 | | | | 3.6 | | | | 6.9 | |
| Silver (g / +) | | | 547.8 | | | | 482.9 | | | | 523.9 | | | | 461.8 | | | | 413.3 | | | | 332.9 | | | | 362.5 | | | | 275.6 | | | | 174.3 | | | | 391.9 | |
| Cost Area | | Unit Cost
($/t) | | | Unit Cost
($/t) | | | Unit Cost
($/t) | | | Unit Cost
($/t) | | | Unit Cost
($/t) | | | Unit Cost
($/t) | | | Unit Cost
($/t) | | | Unit Cost
($/t) | | | Unit Cost
($/t) | | | Unit Cost
($/t) | |
| Crushing and Screening | | | 2.36 | | | | 2.03 | | | | 2.03 | | | | 2.03 | | | | 1.84 | | | | 1.84 | | | | 1.84 | | | | 1.84 | | | | 2.06 | | | | 1.97 | |
| Grinding and Classification | | | 9.42 | | | | 9.34 | | | | 9.34 | | | | 9.34 | | | | 8.92 | | | | 8.92 | | | | 8.92 | | | | 8.92 | | | | 9.41 | | | | 9.16 | |
| Flotation | | | 0.42 | | | | 0.39 | | | | 0.39 | | | | 0.39 | | | | 0.37 | | | | 0.37 | | | | 0.37 | | | | 0.37 | | | | 0.39 | | | | 0.39 | |
| Regrind and Leaching | | | 6.03 | | | | 5.89 | | | | 5.89 | | | | 5.89 | | | | 5.80 | | | | 5.80 | | | | 5.80 | | | | 5.80 | | | | 5.90 | | | | 5.86 | |
| Leaching and CCD | | | 7.73 | | | | 7.53 | | | | 7.53 | | | | 7.53 | | | | 7.43 | | | | 7.43 | | | | 7.43 | | | | 7.43 | | | | 7.55 | | | | 7.50 | |
| Tailings Thickening and Disposal | | | 20.00 | | | | 19.95 | | | | 19.96 | | | | 19.96 | | | | 19.93 | | | | 19.93 | | | | 19.93 | | | | 19.93 | | | | 19.96 | | | | 19.95 | |
| Gold and Silver Recovery | | | 11.85 | | | | 10.08 | | | | 10.73 | | | | 9.81 | | | | 8.98 | | | | 7.53 | | | | 8.09 | | | | 6.72 | | | | 5.31 | | | | 8.71 | |
| Reagents Mixing and Distribution | | | 0.38 | | | | 0.33 | | | | 0.33 | | | | 0.33 | | | | 0.30 | | | | 0.30 | | | | 0.30 | | | | 0.30 | | | | 0.34 | | | | 0.32 | |
| Water and Air Services | | | 1.83 | | | | 1.69 | | | | 1.69 | | | | 1.69 | | | | 1.62 | | | | 1.62 | | | | 1.62 | | | | 1.62 | | | | 1.71 | | | | 1.67 | |
| Workshop | | | 0.46 | | | | 0.39 | | | | 0.39 | | | | 0.39 | | | | 0.36 | | | | 0.36 | | | | 0.36 | | | | 0.36 | | | | 0.40 | | | | 0.38 | |
| Laboratory | | | 0.39 | | | | 0.33 | | | | 0.33 | | | | 0.33 | | | | 0.30 | | | | 0.30 | | | | 0.30 | | | | 0.30 | | | | 0.34 | | | | 0.32 | |
| Administration | | | 20.39 | | | | 17.54 | | | | 17.54 | | | | 17.54 | | | | 15.95 | | | | 15.95 | | | | 15.95 | | | | 15.95 | | | | 17.84 | | | | 17.08 | |
| Total | | | 81.26 | | | | 75.49 | | | | 76.15 | | | | 75.23 | | | | 71.81 | | | | 70.36 | | | | 70.92 | | | | 69.55 | | | | 71.22 | | | | 73.32 | |
Table 104 Operating Cost Estimate by Cost Area (1,300 tpd option)
Extorre Gold Mines Limited
Cerro Moro Gold – Silver Project
Preliminary Economic Assessment | Page 292 |
| Production | | Y01 | | | Y02 | | | Y03 | | | Y04 | | | Y05 | | | Y06 | | | Y07 | | | Y08 | | | Y09 | | | Y10 | | | Y11 | | | LOM | |
| Tonnes Treated (t) | | | 239,718 | | | | 315,822 | | | | 386,170 | | | | 386,170 | | | | 424,788 | | | | 424,788 | | | | 424,788 | | | | 424,788 | | | | 424,788 | | | | 424,788 | | | | 158,678 | | | | 4,035,286 | |
| Gold (g/t) | | | 16.5 | | | | 13.2 | | | | 10.4 | | | | 8.0 | | | | 6.5 | | | | 5.2 | | | | 4.6 | | | | 4.3 | | | | 3.8 | | | | 8.5 | | | | 8.5 | | | | 7.6 | |
| Silver (g/t) | | | 947.8 | | | | 541.7 | | | | 473.5 | | | | 340.8 | | | | 426.1 | | | | 348.6 | | | | 377.6 | | | | 369.3 | | | | 193.5 | | | | 240.5 | | | | 240.5 | | | | 391.9 | |
| Cost Centre | | Unit Cost
($/t) | | | Unit Cost
($/t) | | | Unit Cost
($/t) | | | Unit Cost
($/t) | | | Unit Cost
($/t) | | | Unit Cost
($/t) | | | Unit Cost
($/t) | | | Unit Cost
($/t) | | | Unit Cost
($/t) | | | Unit Cost
($/t) | | | Unit Cost
($/t) | | | Unit Cost
($/t) | |
| Cost Centre Labour | | | 24.95 | | | | 18.94 | | | | 15.49 | | | | 15.49 | | | | 14.08 | | | | 14.08 | | | | 14.08 | | | | 14.08 | | | | 14.08 | | | | 14.08 | | | | 14.08 | | | | 15.37 | |
| Power | | | 7.21 | | | | 6.23 | | | | 5.76 | | | | 5.76 | | | | 5.24 | | | | 5.24 | | | | 5.24 | | | | 5.24 | | | | 5.24 | | | | 5.24 | | | | 5.24 | | | | 5.53 | |
| Regents and Grinding | | | 52.79 | | | | 46.77 | | | | 45.81 | | | | 43.77 | | | | 44.99 | | | | 43.85 | | | | 44.29 | | | | 44.18 | | | | 41.48 | | | | 42.27 | | | | 42.27 | | | | 44.51 | |
| Media Maintenance | | | 5.72 | | | | 4.34 | | | | 3.55 | | | | 3.55 | | | | 3.23 | | | | 3.23 | | | | 3.23 | | | | 3.23 | | | | 3.23 | | | | 3.23 | | | | 3.23 | | | | 3.52 | |
| Linings | | | 2.01 | | | | 1.52 | | | | 1.25 | | | | 1.25 | | | | 1.13 | | | | 1.13 | | | | 1.13 | | | | 1.13 | | | | 1.13 | | | | 1.13 | | | | 1.13 | | | | 1.24 | |
| Other | | | 10.49 | | | | 8.10 | | | | 6.73 | | | | 6.56 | | | | 6.11 | | | | 6.11 | | | | 6.11 | | | | 6.11 | | | | 6.11 | | | | 6.11 | | | | 6.11 | | | | 6.63 | |
| Total | | | 103.15 | | | | 85.90 | | | | 78.58 | | | | 76.38 | | | | 74.77 | | | | 73.63 | | | | 74.07 | | | | 73.97 | | | | 71.27 | | | | 72.06 | | | | 72.06 | | | | 76.81 | |
Table 105 Operating Cost Estimate by Cost Centre (1,150 tpd option)
Extorre Gold Mines Limited
Cerro Moro Gold – Silver Project
Preliminary Economic Assessment | Page 293 |
| Production | | Y01 | | | Y02 | | | Y03 | | | Y04 | | | Y05 | | | Y06 | | | Y07 | | | Y08 | | | Y09 | | | Y10 | | | Y11 | | | LOM | |
| Tonnes Treated (+) | | | 239,718 | | | | 315,822 | | | | 386,170 | | | | 386,170 | | | | 424,788 | | | | 424,788 | | | | 424,788 | | | | 424,788 | | | | 424,788 | | | | 424,788 | | | | 158,678 | | | | 4,035,286 | |
| Gold (g / +) | | | 16.5 | | | | 13.2 | | | | 10.4 | | | | 8.0 | | | | 6.5 | | | | 5.2 | | | | 4.6 | | | | 4.3 | | | | 3.8 | | | | 8.5 | | | | 8.5 | | | | 7.6 | |
| Silver (g / +) | | | 947.8 | | | | 541.7 | | | | 473.5 | | | | 340.8 | | | | 426.1 | | | | 348.6 | | | | 377.6 | | | | 369.3 | | | | 193.5 | | | | 240.5 | | | | 240.5 | | | | 391.9 | |
| Cost Area | | Unit Cost
($/t) | | | Unit Cost
($/t) | | | Unit Cost
($/t) | | | Unit Cost
($/t) | | | Unit Cost
($/t) | | | Unit Cost
($/t) | | | Unit Cost
($/t) | | | Unit Cost
($/t) | | | Unit Cost
($/t) | | | Unit Cost
($/t) | | | Unit Cost
($/t) | | | Unit Cost
($/t) | |
| Crushing and Screening | | | 3.36 | | | | 2.55 | | | | 2.09 | | | | 2.09 | | | | 1.90 | | | | 1.90 | | | | 1.90 | | | | 1.90 | | | | 1.90 | | | | 1.90 | | | | 1.90 | | | | 2.07 | |
| Grinding and Classification | | | 10.14 | | | | 9.51 | | | | 9.32 | | | | 9.32 | | | | 8.90 | | | | 8.90 | | | | 8.90 | | | | 8.90 | | | | 8.90 | | | | 8.90 | | | | 8.90 | | | | 9.10 | |
| Flotation | | | 0.56 | | | | 0.47 | | | | 0.42 | | | | 0.42 | | | | 0.40 | | | | 0.40 | | | | 0.40 | | | | 0.40 | | | | 0.40 | | | | 0.40 | | | | 0.40 | | | | 0.42 | |
| Regrind and Leaching | | | 6.35 | | | | 6.12 | | | | 5.91 | | | | 5.91 | | | | 5.82 | | | | 5.82 | | | | 5.82 | | | | 5.82 | | | | 5.82 | | | | 5.82 | | | | 5.82 | | | | 5.89 | |
| Leaching and CCD | | | 8.23 | | | | 7.77 | | | | 7.51 | | | | 7.51 | | | | 7.40 | | | | 7.40 | | | | 7.40 | | | | 7.40 | | | | 7.40 | | | | 7.40 | | | | 7.40 | | | | 7.50 | |
| Tailings Thickening and Disposal | | | 17.77 | | | | 11.29 | | | | 10.07 | | | | 7.87 | | | | 9.09 | | | | 7.95 | | | | 8.39 | | | | 8.28 | | | | 5.58 | | | | 6.37 | | | | 6.37 | | | | 8.71 | |
| Gold and Silver Recovery | | | 20.79 | | | | 20.68 | | | | 20.61 | | | | 20.61 | | | | 20.59 | | | | 20.59 | | | | 20.59 | | | | 20.59 | | | | 20.59 | | | | 20.59 | | | | 20.59 | | | | 20.61 | |
| Reagents Mixing and Distribution | | | 0.57 | | | | 0.44 | | | | 0.36 | | | | 0.36 | | | | 0.32 | | | | 0.32 | | | | 0.32 | | | | 0.32 | | | | 0.32 | | | | 0.32 | | | | 0.32 | | | | 0.35 | |
| Water and Air Services | | | 2.11 | | | | 1.81 | | | | 1.64 | | | | 1.64 | | | | 1.57 | | | | 1.57 | | | | 1.57 | | | | 1.57 | | | | 1.57 | | | | 1.57 | | | | 1.57 | | | | 1.64 | |
| Workshop | | | 0.72 | | | | 0.55 | | | | 0.45 | | | | 0.45 | | | | 0.41 | | | | 0.41 | | | | 0.41 | | | | 0.41 | | | | 0.41 | | | | 0.41 | | | | 0.41 | | | | 0.44 | |
| Laboratory | | | 0.61 | | | | 0.46 | | | | 0.38 | | | | 0.38 | | | | 0.34 | | | | 0.34 | | | | 0.34 | | | | 0.34 | | | | 0.34 | | | | 0.34 | | | | 0.34 | | | | 0.37 | |
| Administration | | | 31.95 | | | | 24.25 | | | | 19.83 | | | | 19.83 | | | | 18.03 | | | | 18.03 | | | | 18.03 | | | | 18.03 | | | | 18.03 | | | | 18.03 | | | | 18.03 | | | | 19.69 | |
| Total | | | 103.15 | | | | 85.90 | | | | 78.58 | | | | 76.38 | | | | 74.77 | | | | 73.63 | | | | 74.07 | | | | 73.97 | | | | 71.27 | | | | 72.06 | | | | 72.06 | | | | 76.81 | |
Table 106 Operating Cost Estimate by Cost Centre (1,150 tpd option)
Extorre Gold Mines Limited
Cerro Moro Gold – Silver Project
Preliminary Economic Assessment | Page 294 |
Operating Cost Centres
Labour
The labour cost has been estimated at US$ 5,980,500 for a full production year. Table 107 provides a breakdown and details of the labour cost estimate for a full production year.
| Position | | Number | | | Position
Salary
(US$) | | | Total
Salary
(US$) | | | On Cost
Factor | | | Total
Cost
(US$) | |
| Production | | | | | | | | | | | | | | | | | | | | |
| Processing Plant Manager | | | 1 | | | | 300,000 | | | | 300,000 | | | | 1.35 | | | | 405,000 | |
| Production Superintendent | | | 1 | | | | 250,000 | | | | 250,000 | | | | 1.35 | | | | 337,500 | |
| Plant Metallurgist | | | 2 | | | | 200,000 | | | | 400,000 | | | | 1.35 | | | | 540,000 | |
| Laboratory Technicians | | | 2 | | | | 50,000 | | | | 100,000 | | | | 1.35 | | | | 135,000 | |
| Panel Supervisor (shift) | | | 4 | | | | 80,000 | | | | 320,000 | | | | 1.35 | | | | 432,000 | |
| Process Technician (shift) | | | 32 | | | | 50,000 | | | | 1,200,000 | | | | 1.35 | | | | 2,160,000 | |
| Goldroom Supervisor (day) | | | 1 | | | | 80,000 | | | | 80,000 | | | | 1.35 | | | | 108,000 | |
| Process Technician (day) | | | 8 | | | | 50,000 | | | | 400,000 | | | | 1.35 | | | | 540,000 | |
| Maintenance | | | | | | | | | | | | | | | | | | | | |
| Maintenance Superintendent | | | 1 | | | | 250,000 | | | | 250,000 | | | | 1.35 | | | | 337,500 | |
| Maintenance Planner | | | 1 | | | | 50,000 | | | | 50,000 | | | | 1.35 | | | | 67,500 | |
| Fitter | | | 4 | | | | 50,000 | | | | 200,000 | | | | 1.35 | | | | 270,000 | |
| Boilermaker | | | 4 | | | | 50,000 | | | | 200,000 | | | | 1.35 | | | | 270,000 | |
| Mechanical Apprentice | | | 2 | | | | 25,000 | | | | 50,000 | | | | 1.35 | | | | 67,500 | |
| Electrical Leading Hand | | | 1 | | | | 80,000 | | | | 80,000 | | | | 1.35 | | | | 108,000 | |
| Electrician/Instrument Technician | | | 2 | | | | 50,000 | | | | 100,000 | | | | 1.35 | | | | 135,000 | |
| Electrical Apprentice | | | 2 | | | | 25,000 | | | | 50,000 | | | | 1.35 | | | | 67,500 | |
| TOTAL | | | 68 | | | | | | | | 4,430,000 | | | | 1.35 | | | | 5,980,500 | |
Table 107 Labour Cost Estimate Breakdown.
The salaries for the Processing Manager, the Maintenance Superintendent, the Production Superintendent and the two metallurgists are based on expatriate personnel. All other salaries are based on local labour rates. There will be a total of 68 personnel comprising forty-two operations personnel, sixteen maintenance personnel, and ten supervisory or management personnel.
The working roster for the process plant will be two 12 hour shifts per day, seven days per week. Each of four operating shift crews will comprise a Shift Supervisor and four operators who will work a 4 days on, 4 days off roster. The crushing plant will be operated on day shift only by a day crew which will comprise six operators who will also be responsible for reagent mixing, gold room support activities, general site housekeeping and shift operator relief. There will be a dedicated gold room supervisor.
Extorre Gold Mines Limited
Cerro Moro Gold – Silver Project
Preliminary Economic Assessment | Page 295 |
Maintenance personnel will work day shift only seven days per week with a call out system for night shift. The tradespersons will work a 4 days on, 4 days off roster which will provide two mechanical tradespersons, two boilermakers and one electrician each day.
Power
The power cost has been estimated at US$ 2,524,061 for a full production year. Table 108 provides a breakdown of the power cost estimate. The unit cost for power of US$ 0.09 per kWh is based on off-site generation by local power providers.
| Cost Centre | | Total Power Consumption
(kWh) | | | Total Power Cost
(US$) | |
| Crushing and Screening | | | 3,765,684 | | | | 338,912 | |
| Grinding and Classification | | | 14,179,210 | | | | 1,276,129 | |
| Flotation | | | 372,335 | | | | 33,510 | |
| Regrind & Leaching | | | 1,238,049 | | | | 111,424 | |
| Leaching and CCD | | | 2,887,785 | | | | 259,901 | |
| Tailings Thickening and Disposal | | | 653,549 | | | | 58,919 | |
| Gold and Silver Recovery | | | 1,337,887 | | | | 120,410 | |
| Reagent Mixing and Distribution | | | 438,993 | | | | 39,509 | |
| Water Services | | | 941,770 | | | | 84,759 | |
| Air Services | | | 1,791,420 | | | | 161.228 | |
| Workshop | | | 39,858 | | | | 3,587 | |
| Laboratory | | | 113,880 | | | | 10,249 | |
| Administration | | | 284,700 | | | | 25,623 | |
| TOTAL | | | 28,045,120 | | | | 2,524,061 | |
Table 108 Power Cost Estimate Breakdown.
Reagents and Grinding Media
Table 109 provides a breakdown the inputs to the reagents and grinding media cost estimate. Reagents and grinding media costs are based on either local or overseas vendor quotations and estimated transport costs.
Vendor supplied facilities have been assumed for oxygen and LPG delivery and storage. Facility charges for these have been included in the operating cost estimate.
Extorre Gold Mines Limited
Cerro Moro Gold – Silver Project
Preliminary Economic Assessment | Page 296 |
It should be noted that cost of the cyanide and zinc is over 35% of the total reagent and grinding media operating cost. The cost of sodium metabisulphite, hydrated lime and copper sulphate required for the Inco cyanide destruction process is a further 45% of the total reagent and grinding media operating cost. The combined cost of these reagents represents around 50% of the overall operating cost for the process plant. Further test work to optimize of the consumption of these reagents and investigate additional options for cyanide destruction and/or recovery has the potential to significantly reduce operating costs.
| Item | | Consumption (kg/t) | | | Unit Price ($/kg) | |
| Interfroth 50 | | | 0.190 | | | | 5.00 | |
| Potassium Amyl Xanthate | | | 0.075 | | | | 3.60 | |
| Copper Sulphate | | | 0.973 | | | | 5.38 | |
| Hydrated Lime | | | 11.4830 | | | | 0.22 | |
| Sodium Cyanide | | | 3.700 | | | | 2.50 | |
| Sodium Hydroxide | | | 0.596 | | | | 1.27 | |
| Oxygen | | | 0.100 | | | | 1.00 | |
| Sodium Metabisulphite | | | 10.999 | | | | 1.10 | |
| Diatomaceous Earth | | | 0.435 – 0.988 | | | | 0.50 | |
| Zinc | | | 1.278 – 2.888 | | | | 2.76 | |
| Sulphuric Acid | | | 0.456 | | | | 0.47 | |
| LPG | | | 0.097 – 0.290 | | | | 0.60 | |
| Flocculant | | | 0.141 | | | | 4.50 | |
| Grinding Balls (80 mm) | | | 2.35 | | | | 1.70 | |
| Ceramic Media | | | 0.021 | | | | 12.00 | |
| Borax (smelting flux) | | | 0.224 – 0.717 | | | | 1.38 | |
| Silica (smelting flux) | | | 0.095 – 0.304 | | | | 0.20 | |
| Nitre (smelting flux) | | | 0.030 – 0.097 | | | | 0.16 | |
| Soda Ash (smelting flux) | | | 0.030 – 0.097 | | | | 0.69 | |
| TOTAL | | | | | | | | |
| Note: | Oxygen consumption in m3/t and unit price in US$/m3 |
| | | LPG consumption in L/t and unit price in US$/L |
| | | Zinc, diatomaceous earth, LPG and smelting flux consumption dependent on head grade. |
Table 109 Reagents and Grinding Media Cost Estimate Input Breakdown
Maintenance
The maintenance (excluding labour) cost is estimated to be US$ 1,506,000 for a full production year. This has been based on scaling maintenance spares from the capital cost estimate and in house data for similar sized projects.
Extorre Gold Mines Limited
Cerro Moro Gold – Silver Project
Preliminary Economic Assessment | Page 297 |
Linings
The cost of liners for the crushers and ball mill (excluding installation) is estimated to be US$ 567,000 for a full production year. Table 110 provides a breakdown of the linings cost estimate.
| Linings | | Unit Price
(each) | | | Yearly Changes | | | Total Cost
(US$) | |
| Jaw Crusher | | | | | | | | | | | | |
| - Fixed Jaw | | | 5,800 | | | | 3.9 | | | | 22,495 | |
| - Movable Jaw | | | 5,936 | | | | 2.4 | | | | 14,323 | |
| - Upper Cheek Plate | | | 920 | | | | 1.0 | | | | 960 | |
| - Lower Cheek Plate | | | 629 | | | | 1.9 | | | | 1,220 | |
| Subtotal | | | | | | | | | | | 38,998 | |
| Product Screen | | | | | | | | | | | | |
| - Top Screen Deck | | | 8,760 | | | | 2.1 | | | | 18,107 | |
| - Bottom Screen Deck | | | 8,760 | | | | 1.4 | | | | 12,055 | |
| Subtotal | | | | | | | | | | | 30,162 | |
| Cone Crushers | | | | | | | | | | | | |
| - Secondary Mantle and Bowl | | | 20,001 | | | | 2.5 | | | | 50,003 | |
| - Tertiary Mantle and Bowl | | | 20,001 | | | | 2.2 | | | | 43,534 | |
| Subtotal | | | | | | | | | | | 93,537 | |
| Primary Mill | | | | | | | | | | | | |
| - Lining | | | 180,000 | | | | 2.0 | | | | 360,000 | |
| Regrind Mill | | | | | | | | | | | | |
| - Lining | | | 44,190 | | | | 1 | | | | 44,190 | |
| TOTAL | | | | | | | | | | | 566,887 | |
Table 110 Linings Cost Estimate Breakdown.
Open pit operating costs were developed from the recommended equipment requirements and the personnel requirements. The mine operating costs include all the parts, supplies, and labour costs associated with mine operation, and maintenance. Mining labour cost for supervision is included as part of the G&A. Table 111 and Table 112 summarize the total open pit operating costs for the 1,300 tpd option, whereas xxxx for the 1,150 tpd option. Total cost, unit cost per total tonne of material moved (including rehandling), and unit cost per tonne of material mined respectively.
In a similar way the underground mine operating costs were estimated for the 1,300 tpd option, as shown in Table 113 and Table 114. XXX indicate the estimated costs for the 1,150 tpd option.
Extorre Gold Mines Limited
Cerro Moro Gold – Silver Project
Preliminary Economic Assessment | Page 298 |
| | | | | Year 1 | | | Year 2 | | | Year 3 | | | Year 4 | | | Year 5 | | | Year 6 | | | Year 7 | | | Year 8 | | | Year 9 | | | Total | |
| Mine Total Expenses | | US$ | | $ | 14,247,923 | | | $ | 16,154,852 | | | $ | 16,876,700 | | | $ | 11,744,530 | | | $ | 16,480,915 | | | $ | 14,633,160 | | | $ | 16,965,551 | | | $ | 16,106,590 | | | $ | 10,563,936 | | | | 133,774,157 | |
| Loading | | US$ | | $ | 830,499 | | | $ | 1,963,359 | | | $ | 1,645,958 | | | $ | 1,353,321 | | | $ | 2,119,324 | | | $ | 1,845,309 | | | $ | 2,596,085 | | | $ | 1,979,242 | | | $ | 1,182,196 | | | | 15,515,294 | |
| Hauling | | US$ | | $ | 4,244,382 | | | $ | 4,317,637 | | | $ | 4,884,906 | | | $ | 2,627,218 | | | $ | 4,000,907 | | | $ | 3,404,503 | | | $ | 4,195,216 | | | $ | 3,935,863 | | | $ | 2,531,030 | | | | 34,141,661 | |
| Drilling | | US$ | | $ | 966,820 | | | $ | 990,353 | | | $ | 950,584 | | | $ | 566,592 | | | $ | 1,062,029 | | | $ | 921,071 | | | $ | 1,054,018 | | | $ | 1,085,733 | | | $ | 792,882 | | | | 8,390,082 | |
| Blasting | | US$ | | $ | 1,554,335 | | | $ | 2,038,781 | | | $ | 2,297,377 | | | $ | 1,184,819 | | | $ | 2,348,188 | | | $ | 2,040,422 | | | $ | 2,303,659 | | | $ | 2,385,336 | | | $ | 1,488,507 | | | | 17,641,425 | |
| Ancillary | | US$ | | $ | 671,136 | | | $ | 695,208 | | | $ | 653,346 | | | $ | 644,526 | | | $ | 858,652 | | | $ | 847,425 | | | $ | 857,484 | | | $ | 858,420 | | | $ | 589,333 | | | | 6,675,529 | |
| Support | | US$ | | $ | 365,012 | | | $ | 391,691 | | | $ | 391,691 | | | $ | 285,245 | | | $ | 311,925 | | | $ | 294,938 | | | $ | 321,618 | | | $ | 302,854 | | | $ | 201,903 | | | | 2,866,877 | |
| Engineering and Administration | | US$ | | $ | 1,003,286 | | | $ | 862,213 | | | $ | 952,756 | | | $ | 659,117 | | | $ | 909,995 | | | $ | 753,110 | | | $ | 845,948 | | | $ | 931,517 | | | $ | 860,719 | | | | 7,778,661 | |
| Pit Dewatering | | US$ | | $ | 94,975 | | | $ | 106,225 | | | $ | 156,850 | | | $ | 156,850 | | | $ | 156,850 | | | $ | 156,850 | | | $ | 173,725 | | | $ | 173,725 | | | $ | 143,942 | | | | 1,319,991 | |
| Labour | | US$ | | $ | 4,517,477 | | | $ | 4,789,385 | | | $ | 4,943,232 | | | $ | 4,266,842 | | | $ | 4,713,045 | | | $ | 4,369,532 | | | $ | 4,617,800 | | | $ | 4,453,900 | | | $ | 2,773,424 | | | | 39,444,638 | |
Table 111 Open Pit Operating Cost (US$) – 1,300 tpd option
| | | | | Year 1 | | | Year 2 | | | Year 3 | | | Year 4 | | | Year 5 | | | Year 6 | | | Year 7 | | | Year 8 | | | Year 9 | | Total |
| Mining cost (t rom) | | US$/t | | $ | 2.89 | | | $ | 2.51 | | | $ | 2.31 | | | $ | 3.34 | | | $ | 2.30 | | | $ | 2.34 | | | $ | 2.36 | | | $ | 2.21 | | | $ | 2.45 | | $ | 2.46 |
| Loading | | US$/t | | $ | 0.17 | | | $ | 0.30 | | | $ | 0.22 | | | $ | 0.39 | | | $ | 0.30 | | | $ | 0.30 | | | $ | 0.36 | | | $ | 0.27 | | | $ | 0.27 | | $ | 0.29 |
| Hauling | | US$/t | | $ | 0.86 | | | $ | 0.67 | | | $ | 0.67 | | | $ | 0.75 | | | $ | 0.56 | | | $ | 0.54 | | | $ | 0.58 | | | $ | 0.54 | | | $ | 0.59 | | $ | 0.63 |
| Drilling | | US$/t | | $ | 0.20 | | | $ | 0.15 | | | $ | 0.13 | | | $ | 0.16 | | | $ | 0.15 | | | $ | 0.15 | | | $ | 0.15 | | | $ | 0.15 | | | $ | 0.18 | | $ | 0.15 |
| Blasting | | US$/t | | $ | 0.32 | | | $ | 0.32 | | | $ | 0.31 | | | $ | 0.34 | | | $ | 0.33 | | | $ | 0.33 | | | $ | 0.32 | | | $ | 0.33 | | | $ | 0.35 | | $ | 0.32 |
| Ancillary | | US$/t | | $ | 0.14 | | | $ | 0.11 | | | $ | 0.09 | | | $ | 0.18 | | | $ | 0.12 | | | $ | 0.14 | | | $ | 0.12 | | | $ | 0.12 | | | $ | 0.14 | | $ | 0.12 |
| Support | | US$/t | | $ | 0.07 | | | $ | 0.06 | | | $ | 0.05 | | | $ | 0.08 | | | $ | 0.04 | | | $ | 0.05 | | | $ | 0.04 | | | $ | 0.04 | | | $ | 0.05 | | $ | 0.05 |
| Engineering and Administration | | US$/t | | $ | 0.20 | | | $ | 0.13 | | | $ | 0.13 | | | $ | 0.19 | | | $ | 0.13 | | | $ | 0.12 | | | $ | 0.12 | | | $ | 0.13 | | | $ | 0.20 | | $ | 0.14 |
| Pit Dewatering | | US$/t | | $ | 0.02 | | | $ | 0.02 | | | $ | 0.02 | | | $ | 0.04 | | | $ | 0.02 | | | $ | 0.03 | | | $ | 0.02 | | | $ | 0.02 | | | $ | 0.03 | | $ | 0.02 |
| Labour | | US$/t | | $ | 0.92 | | | $ | 0.74 | | | $ | 0.68 | | | $ | 1.21 | | | $ | 0.66 | | | $ | 0.70 | | | $ | 0.64 | | | $ | 0.61 | | | $ | 0.64 | | $ | 0.73 |
Table 112 Open Pit Operating Cost (US$/t ROM) – 1,300 tpd option
Extorre Gold Mines Limited
Cerro Moro Gold – Silver Project
Preliminary Economic Assessment | Page 299 |
| | | | | Year 1 | | | Year 2 | | | Year 3 | | | Year 4 | | | Year 5 | | | Year 6 | | | Year 7 | | | Year 8 | | | Year 9 | | | Total | |
| Mine Total Expenses | | US$ | | $ | 13,974,375 | | | $ | 21,802,485 | | | $ | 24,590,489 | | | $ | 20,572,985 | | | $ | 12,525,382 | | | $ | 9,440,918 | | | $ | 5,641,259 | | | $ | 3,537,156 | | | $ | 1,098,009 | | | $ | 113,183,059 | |
| Drilling | | US$ | | $ | 601,693 | | | $ | 947,280 | | | $ | 1,205,784 | | | $ | 1,167,201 | | | $ | 1,012,807 | | | $ | 778,157 | | | $ | 498,953 | | | $ | 354,955 | | | $ | 126,749 | | | $ | 6,693,580 | |
| Blasting | | US$ | | $ | 568,083 | | | $ | 853,595 | | | $ | 1,023,512 | | | $ | 619,368 | | | $ | 312,955 | | | $ | 398,175 | | | $ | 153,033 | | | $ | 108,868 | | | $ | 38,875 | | | $ | 4,076,465 | |
| Loading | | US$ | | $ | 245,530 | | | $ | 399,507 | | | $ | 528,555 | | | $ | 629,656 | | | $ | 617,700 | | | $ | 424,470 | | | $ | 304,668 | | | $ | 216,741 | | | $ | 77,395 | | | $ | 3,444,222 | |
| Hauling | | US$ | | $ | 2,035,581 | | | $ | 2,759,644 | | | $ | 3,036,338 | | | $ | 2,669,751 | | | $ | 1,214,406 | | | $ | 1,110,042 | | | $ | 954,465 | | | $ | 665,901 | | | $ | 230,276 | | | $ | 14,676,405 | |
| Preparation | | US$ | | $ | 4,352,368 | | | $ | 4,943,693 | | | $ | 6,140,079 | | | $ | 4,604,516 | | | $ | 1,475,622 | | | $ | 0 | | | $ | 0 | | | $ | 0 | | | $ | 0 | | | $ | 21,516,277 | |
| Services | | US$ | | $ | 1,308,222 | | | $ | 1,308,222 | | | $ | 1,308,222 | | | $ | 1,308,222 | | | $ | 1,308,222 | | | $ | 1,737,810 | | | $ | 1,193,798 | | | $ | 707,724 | | | $ | 252,718 | | | $ | 10,433,158 | |
| Others | | US$ | | $ | 1,270,398 | | | $ | 1,982,044 | | | $ | 2,235,499 | | | $ | 1,870,271 | | | $ | 1,138,671 | | | $ | 858,265 | | | $ | 512,842 | | | $ | 321,560 | | | $ | 99,819 | | | $ | 10,289,369 | |
| Administration Labour | | US$ | | $ | 357,000 | | | $ | 357,000 | | | $ | 357,000 | | | $ | 357,000 | | | $ | 357,000 | | | $ | 357,000 | | | $ | 178,500 | | | $ | 119,000 | | | $ | 89,250 | | | $ | 2,528,750 | |
| Operational Labour | | US$ | | $ | 3,235,500 | | | $ | 8,251,500 | | | $ | 8,755,500 | | | $ | 7,347,000 | | | $ | 5,088,000 | | | $ | 3,777,000 | | | $ | 1,845,000 | | | $ | 1,042,407 | | | $ | 182,926 | | | $ | 39,524,833 | |
| TOTAL (US$/t) | | US$/t | | | 78.20 | | | | 76.15 | | | | 66.09 | | | | 50.75 | | | | 33.04 | | | | 34.70 | | | | 30.18 | | | | 26.60 | | | | 23.13 | | | $ | 50.06 | |
Table 113 Underground Mine Operating Cost (US$) – 1,300 tpd option
| | | | | Year 1 | | | Year 2 | | | Year 3 | | | Year 4 | | | Year 5 | | | Year 6 | | | Year 7 | | | Year 8 | | | Year 9 | | Total |
| Mine Total Cost (t mined) | | US$/t | | $ | 78.20 | | | $ | 76.15 | | | $ | 66.09 | | | $ | 50.75 | | | $ | 33.04 | | | $ | 34.70 | | | $ | 30.18 | | | $ | 26.60 | | | $ | 23.13 | | $ | 50.06 |
| Drilling | | US$/t | | $ | 3.37 | | | $ | 3.31 | | | $ | 3.24 | | | $ | 2.88 | | | $ | 2.67 | | | $ | 2.86 | | | $ | 2.67 | | | $ | 2.67 | | | $ | 2.67 | | $ | 2.96 |
| Blasting | | US$/t | | $ | 3.18 | | | $ | 2.98 | | | $ | 2.75 | | | $ | 1.53 | | | $ | 0.83 | | | $ | 1.46 | | | $ | 0.82 | | | $ | 0.82 | | | $ | 0.82 | | $ | 1.80 |
| Loading | | US$/t | | $ | 1.37 | | | $ | 1.40 | | | $ | 1.42 | | | $ | 1.55 | | | $ | 1.63 | | | $ | 1.56 | | | $ | 1.63 | | | $ | 1.63 | | | $ | 1.63 | | $ | 1.52 |
| Hauling | | US$/t | | $ | 11.39 | | | $ | 9.64 | | | $ | 8.16 | | | $ | 6.59 | | | $ | 3.20 | | | $ | 4.08 | | | $ | 5.11 | | | $ | 5.01 | | | $ | 4.85 | | $ | 6.49 |
| Preparation | | US$/t | | $ | 24.36 | | | $ | 17.27 | | | $ | 16.50 | | | $ | 11.36 | | | $ | 3.89 | | | $ | 0.00 | | | $ | 0.00 | | | $ | 0.00 | | | $ | 0.00 | | $ | 9.52 |
| Services | | US$/t | | $ | 7.32 | | | $ | 4.57 | | | $ | 3.52 | | | $ | 3.23 | | | $ | 3.45 | | | $ | 6.39 | | | $ | 6.39 | | | $ | 5.32 | | | $ | 5.32 | | $ | 4.61 |
| Others | | US$/t | | $ | 7.11 | | | $ | 6.92 | | | $ | 6.01 | | | $ | 4.61 | | | $ | 3.00 | | | $ | 3.15 | | | $ | 2.74 | | | $ | 2.42 | | | $ | 2.10 | | $ | 4.55 |
| Administration Labour | | US$/t | | $ | 2.00 | | | $ | 1.25 | | | $ | 0.96 | | | $ | 0.88 | | | $ | 0.94 | | | $ | 1.31 | | | $ | 0.96 | | | $ | 0.90 | | | $ | 1.88 | | $ | 1.12 |
| Operational Labour | | US$/t | | $ | 18.11 | | | $ | 28.82 | | | $ | 23.53 | | | $ | 18.12 | | | $ | 13.42 | | | $ | 13.88 | | | $ | 9.87 | | | $ | 7.84 | | | $ | 3.85 | | $ | 17.48 |
Table 114 Underground Mine Operating Cost (US$/t) – 1,300 tpd option
Extorre Gold Mines Limited
Cerro Moro Gold – Silver Project
Preliminary Economic Assessment | Page 300 |
| | | | | | Year 1 | | | Year 2 | | | Year 3 | | | Year 4 | | | Year 5 | | | Year 6 | | | Year 7 | | | Year 8 | | | Year 9 | | | Year 10 | | | Year 11 | | | TOTAL | |
| Mine Total Expenses | | | US$ | | | $ | 8,592,987 | | | $ | 14,849,107 | | | $ | 15,228,268 | | | $ | 15,332,889 | | | $ | 14,881,004 | | | $ | 14,670,063 | | | $ | 16,615,959 | | | $ | 15,898,466 | | | $ | 10,925,537 | | | $ | 553,280 | | | $ | 207,315 | | | | 127,754,873 | |
| Loading | | | US$ | | | $ | 871,958 | | | $ | 1,485,892 | | | $ | 1,762,443 | | | $ | 1,749,092 | | | $ | 1,850,388 | | | $ | 2,026,514 | | | $ | 2,260,013 | | | $ | 1,966,054 | | | $ | 1,189,540 | | | $ | 110,109 | | | $ | 41,126 | | | | 15,313,129 | |
| Hauling | | | US$ | | | $ | 1,752,817 | | | $ | 3,780,062 | | | $ | 3,741,294 | | | $ | 3,734,342 | | | $ | 3,310,563 | | | $ | 3,159,831 | | | $ | 4,100,595 | | | $ | 4,423,232 | | | $ | 2,649,173 | | | $ | 0 | | | $ | 0 | | | | 30,651,910 | |
| Drilling | | | US$ | | | $ | 446,636 | | | $ | 942,575 | | | $ | 1,015,070 | | | $ | 863,208 | | | $ | 966,553 | | | $ | 982,432 | | | $ | 1,117,171 | | | $ | 1,178,194 | | | $ | 763,618 | | | $ | 0 | | | $ | 0 | | | | 8,275,457 | |
| Blasting | | | US$ | | | $ | 924,317 | | | $ | 2,142,268 | | | $ | 2,128,372 | | | $ | 2,067,134 | | | $ | 2,071,209 | | | $ | 2,040,812 | | | $ | 2,342,454 | | | $ | 2,405,580 | | | $ | 1,503,740 | | | $ | 0 | | | $ | 0 | | | | 17,625,886 | |
| Ancillary | | | US$ | | | $ | 413,669 | | | $ | 607,043 | | | $ | 677,991 | | | $ | 723,727 | | | $ | 754,369 | | | $ | 790,808 | | | $ | 856,964 | | | $ | 857,898 | | | $ | 675,243 | | | $ | 88,398 | | | $ | 33,149 | | | | 6,479,260 | |
| Support | | | US$ | | | $ | 338,332 | | | $ | 365,012 | | | $ | 285,245 | | | $ | 285,245 | | | $ | 294,938 | | | $ | 294,938 | | | $ | 302,854 | | | $ | 302,854 | | | $ | 280,876 | | | $ | 0 | | | $ | 0 | | | | 2,750,296 | |
| Engineering and Administration | | | US$ | | | $ | 899,703 | | | $ | 1,131,521 | | | $ | 1,096,789 | | | $ | 1,264,530 | | | $ | 1,106,603 | | | $ | 992,419 | | | $ | 971,296 | | | $ | 452,422 | | | $ | 270,025 | | | $ | 0 | | | $ | 0 | | | | 8,185,308 | |
| Pit Dewatering | | | US$ | | | $ | 106,225 | | | $ | 156,850 | | | $ | 156,850 | | | $ | 156,850 | | | $ | 156,850 | | | $ | 173,725 | | | $ | 173,725 | | | $ | 117,475 | | | $ | 117,475 | | | $ | 0 | | | $ | 0 | | | | 1,316,024 | |
| Labour | | | US$ | | | $ | 2,839,329 | | | $ | 4,237,884 | | | $ | 4,364,214 | | | $ | 4,488,760 | | | $ | 4,369,532 | | | $ | 4,208,583 | | | $ | 4,490,887 | | | $ | 4,194,756 | | | $ | 3,475,846 | | | $ | 354,773 | | | $ | 133,040 | | | | 37,157,604 | |
Table 115 Open Pit Operating Cost (US$) – 1,150 tpd option
| | | | | | Year 1 | | | Year 2 | | | Year 3 | | | Year 4 | | | Year 5 | | | Year 6 | | | Year 7 | | | Year 8 | | | Year 9 | | | Year 10 | | | Year 11 | | TOTAL |
| Mining cost (t rom) | | | US$/t | | | $ | 3.02 | | | $ | 2.25 | | | $ | 2.35 | | | $ | 2.39 | | | $ | 2.41 | | | $ | 2.38 | | | $ | 2.31 | | | $ | 2.18 | | | $ | 2.54 | | | $ | 0.00 | | | $ | 0.00 | | $ | 2.39 |
| Loading | | | US$/t | | | $ | 0.31 | | | $ | 0.23 | | | $ | 0.27 | | | $ | 0.27 | | | $ | 0.30 | | | $ | 0.33 | | | $ | 0.31 | | | $ | 0.27 | | | $ | 0.28 | | | $ | 0.00 | | | $ | 0.00 | | $ | 0.29 |
| Hauling | | | US$/t | | | $ | 0.62 | | | $ | 0.57 | | | $ | 0.58 | | | $ | 0.58 | | | $ | 0.54 | | | $ | 0.51 | | | $ | 0.57 | | | $ | 0.61 | | | $ | 0.62 | | | $ | 0.00 | | | $ | 0.00 | | $ | 0.57 |
| Drilling | | | US$/t | | | $ | 0.16 | | | $ | 0.14 | | | $ | 0.16 | | | $ | 0.13 | | | $ | 0.16 | | | $ | 0.16 | | | $ | 0.16 | | | $ | 0.16 | | | $ | 0.18 | | | $ | 0.00 | | | $ | 0.00 | | $ | 0.15 |
| Blasting | | | US$/t | | | $ | 0.33 | | | $ | 0.32 | | | $ | 0.33 | | | $ | 0.32 | | | $ | 0.34 | | | $ | 0.33 | | | $ | 0.33 | | | $ | 0.33 | | | $ | 0.35 | | | $ | 0.00 | | | $ | 0.00 | | $ | 0.33 |
| Ancillary | | | US$/t | | | $ | 0.15 | | | $ | 0.09 | | | $ | 0.10 | | | $ | 0.11 | | | $ | 0.12 | | | $ | 0.13 | | | $ | 0.12 | | | $ | 0.12 | | | $ | 0.16 | | | $ | 0.00 | | | $ | 0.00 | | $ | 0.12 |
| Support | | | US$/t | | | $ | 0.12 | | | $ | 0.06 | | | $ | 0.04 | | | $ | 0.04 | | | $ | 0.05 | | | $ | 0.05 | | | $ | 0.04 | | | $ | 0.04 | | | $ | 0.07 | | | $ | 0.00 | | | $ | 0.00 | | $ | 0.05 |
| Engineering and Administration | | | US$/t | | | $ | 0.32 | | | $ | 0.17 | | | $ | 0.17 | | | $ | 0.20 | | | $ | 0.18 | | | $ | 0.16 | | | $ | 0.14 | | | $ | 0.06 | | | $ | 0.06 | | | $ | 0.00 | | | $ | 0.00 | | $ | 0.15 |
| Pit Dewatering | | | US$/t | | | $ | 0.04 | | | $ | 0.02 | | | $ | 0.02 | | | $ | 0.02 | | | $ | 0.03 | | | $ | 0.03 | | | $ | 0.02 | | | $ | 0.02 | | | $ | 0.03 | | | $ | 0.00 | | | $ | 0.00 | | $ | 0.02 |
| Labour | | | US$/t | | | $ | 1.00 | | | $ | 0.64 | | | $ | 0.67 | | | $ | 0.70 | | | $ | 0.71 | | | $ | 0.68 | | | $ | 0.63 | | | $ | 0.58 | | | $ | 0.81 | | | $ | 0.00 | | | $ | 0.00 | | $ | 0.70 |
Table 116 Open Pit Operating Cost (US$/t ROM) – 1,150 tpd option
Extorre Gold Mines Limited
Cerro Moro Gold – Silver Project
Preliminary Economic Assessment | Page 301 |
| | | | | Year 1 | | | Year 2 | | | Year 3 | | | Year 4 | | | Year 5 | | | Year 6 | | | Year 7 | | | Year 8 | | | Year 9 | | | Total | |
| Mine Total Expenses | | US$ | | $ | 11,412,791 | | | $ | 19,122,611 | | | $ | 20,203,059 | | | $ | 18,670,322 | | | $ | 12,828,793 | | | $ | 9,288,799 | | | $ | 5,654,859 | | | $ | 3,619,875 | | | $ | 1,216,225 | | | $ | 102,017,335 | |
| Drilling | | US$ | | $ | 601,693 | | | $ | 947,280 | | | $ | 1,205,784 | | | $ | 1,167,201 | | | $ | 1,012,807 | | | $ | 778,157 | | | $ | 498,953 | | | $ | 354,955 | | | $ | 126,749 | | | $ | 6,693,580 | |
| Blasting | | US$ | | $ | 568,083 | | | $ | 853,595 | | | $ | 1,023,512 | | | $ | 619,368 | | | $ | 312,955 | | | $ | 398,175 | | | $ | 153,033 | | | $ | 108,868 | | | $ | 38,875 | | | $ | 4,076,465 | |
| Loading | | US$ | | $ | 245,530 | | | $ | 399,507 | | | $ | 528,555 | | | $ | 629,656 | | | $ | 617,700 | | | $ | 424,470 | | | $ | 304,668 | | | $ | 216,741 | | | $ | 77,395 | | | $ | 3,444,222 | |
| Hauling | | US$ | | $ | 1,644,473 | | | $ | 2,276,599 | | | $ | 2,231,883 | | | $ | 2,203,550 | | | $ | 1,309,844 | | | $ | 971,752 | | | $ | 966,829 | | | $ | 741,100 | | | $ | 337,745 | | | $ | 12,683,776 | |
| Preparation | | US$ | | $ | 2,740,264 | | | $ | 3,612,988 | | | $ | 3,830,461 | | | $ | 3,533,023 | | | $ | 1,596,012 | | | $ | 0 | | | $ | 0 | | | $ | 0 | | | $ | 0 | | | $ | 15,312,748 | |
| Services | | US$ | | $ | 1,308,222 | | | $ | 1,308,222 | | | $ | 1,308,222 | | | $ | 1,308,222 | | | $ | 1,308,222 | | | $ | 1,737,810 | | | $ | 1,193,798 | | | $ | 707,724 | | | $ | 252,718 | | | $ | 10,433,158 | |
| Others | | US$ | | $ | 1,037,526 | | | $ | 1,738,419 | | | $ | 1,836,642 | | | $ | 1,697,302 | | | $ | 1,166,254 | | | $ | 844,436 | | | $ | 514,078 | | | $ | 329,080 | | | $ | 110,566 | | | $ | 9,274,303 | |
| Administration Labour | | US$ | | $ | 357,000 | | | $ | 357,000 | | | $ | 357,000 | | | $ | 357,000 | | | $ | 357,000 | | | $ | 357,000 | | | $ | 178,500 | | | $ | 119,000 | | | $ | 89,250 | | | $ | 2,528,750 | |
| Operational Labour | | US$ | | $ | 2,910,000 | | | $ | 7,629,000 | | | $ | 7,881,000 | | | $ | 7,155,000 | | | $ | 5,148,000 | | | $ | 3,777,000 | | | $ | 1,845,000 | | | $ | 1,042,407 | | | $ | 182,926 | | | $ | 37,570,333 | |
| TOTAL (US$/t) | | US$/t | | | 63.87 | | | | 66.79 | | | | 54.29 | | | | 46.05 | | | | 33.84 | | | | 34.14 | | | | 30.26 | | | | 27.23 | | | �� | 25.62 | | | $ | 45.12 | |
Table 117 Underground Mine Operating Cost (US$) – 1,150 tpd option
| | | | | | Year 1 | | | Year 2 | | | Year 3 | | | Year 4 | | | Year 5 | | | Year 6 | | | Year 7 | | | Year 8 | | | Year 9 | | | Total |
| Mine Total Cost (t ore) | | | US$/t | | | $ | 63.87 | | | $ | 66.79 | | | $ | 54.29 | | | $ | 46.05 | | | $ | 33.84 | | | $ | 34.14 | | | $ | 30.26 | | | $ | 27.23 | | | $ | 25.62 | | | $45.12 |
| Drilling | | | US$/t | | | $ | 3.37 | | | $ | 3.31 | | | $ | 3.24 | | | $ | 2.88 | | | $ | 2.67 | | | $ | 2.86 | | | $ | 2.67 | | | $ | 2.67 | | | $ | 2.67 | | | $ 2.96 |
| Blasting | | | US$/t | | | $ | 3.18 | | | $ | 2.98 | | | $ | 2.75 | | | $ | 1.53 | | | $ | 0.83 | | | $ | 1.46 | | | $ | 0.82 | | | $ | 0.82 | | | $ | 0.82 | | | $ 1.80 |
| Loading | | | US$/t | | | $ | 1.37 | | | $ | 1.40 | | | $ | 1.42 | | | $ | 1.55 | | | $ | 1.63 | | | $ | 1.56 | | | $ | 1.63 | | | $ | 1.63 | | | $ | 1.63 | | | $ 1.52 |
| Hauling | | | US$/t | | | $ | 9.20 | | | $ | 7.95 | | | $ | 6.00 | | | $ | 5.44 | | | $ | 3.46 | | | $ | 3.57 | | | $ | 5.17 | | | $ | 5.57 | | | $ | 7.11 | | | $ 5.61 |
| Preparation | | | US$/t | | | $ | 15.33 | | | $ | 12.62 | | | $ | 10.29 | | | $ | 8.71 | | | $ | 4.21 | | | $ | 0.00 | | | $ | 0.00 | | | $ | 0.00 | | | $ | 0.00 | | | $ 6.77 |
| Services | | | US$/t | | | $ | 7.32 | | | $ | 4.57 | | | $ | 3.52 | | | $ | 3.23 | | | $ | 3.45 | | | $ | 6.39 | | | $ | 6.39 | | | $ | 5.32 | | | $ | 5.32 | | | $ 4.61 |
| Others | | | US$/t | | | $ | 5.81 | | | $ | 6.07 | | | $ | 4.94 | | | $ | 4.19 | | | $ | 3.08 | | | $ | 3.10 | | | $ | 2.75 | | | $ | 2.48 | | | $ | 2.33 | | | $ 4.10 |
| Administration Labour | | | US$/t | | | $ | 2.00 | | | $ | 1.25 | | | $ | 0.96 | | | $ | 0.88 | | | $ | 0.94 | | | $ | 1.31 | | | $ | 0.96 | | | $ | 0.90 | | | $ | 1.88 | | | $ 1.12 |
| Operational Labour | | | US$/t | | | $ | 16.28 | | | $ | 26.65 | | | $ | 21.18 | | | $ | 17.65 | | | $ | 13.58 | | | $ | 13.88 | | | $ | 9.87 | | | $ | 7.84 | | | $ | 3.85 | | | $16.62 |
Table 118 Underground Mine Operating Cost (US$/t) – 1,150 tpd option
Extorre Gold Mines Limited
Cerro Moro Gold – Silver Project
Preliminary Economic Assessment | Page 302 |
| 21.2.3 | General and Administrative (G&A) Costs |
General and administrative (G&A) costs for the Project have been estimated using January, 2012 US dollars. The G&A costs are inclusive of the following:
| § | On-site and off-site labour costs relating to General Management (Mine General Manager, Section Manager for excluding Process Plant Manager), HSE, community relations, finance and administration, and legal. Note that GRES has already included the cost of the Process Plant Manager in the OPEX cost for processing. |
| § | Cost of the Cerro Moro camp (including catering / meals and cleaning services) |
| § | Off-site offices in Puerto Deseado and Buenos Aires |
| § | Miscellaneous costs, including: camp and general site power, safety clothing and personal protection equipment, environmental monitoring and auditing, site security, first aid and medical services. |
| § | Management (including on site admin) US$2.5M |
| § | Social program Puerto Deseado US$0.75M |
| § | Off site offices US$0.6M |
| - | Safety clothing US$0.15M |
| - | Camp and General Site Power US$0.4M |
| - | Environmental Monitoring: US$0.15M |
| - | Recruitment and Training: US$0.15M |
| - | Road Maintenance US$0.25M |
| - | First Aid and Medical US$0.24M |
| - | Auditing and Bank Fees: US$0.08M |
The average G&A costs equate to US$ 20/t.
Extorre Gold Mines Limited
Cerro Moro Gold – Silver Project
Preliminary Economic Assessment | Page 303 |
This technical report includes mineral resources that are not mineral reserves and therefore do not have demonstrated economic viability.
The reader is cautioned that the preliminary economic assessment is preliminary in nature and includes Inferred mineral resources that are considered too speculative geologically to have the economic considerations applied to them that would enable them to be categorized as mineral reserves. There is no certainty that the preliminary economic assessment will be realized. No Mineral Reserves have been estimated.
Extorre should bear in mind that NCL is not a financial adviser, and that these models are indicative only, based on NCL’s experiences. NCL recommends that Extorre seeks its own financial and tax advice before taking action in relation to the financial matters rose herein.
NCL has considered the cash flow on a 100% equity basis, i.e. no account has been taken of financing arrangements and associated costs.
Economical parameters used for the evaluation are shown in Table 119.
| Item | | Unit | | Value |
| Average Mining Costs | | Open Pit US$/tonne mined Underground US$/tonne mined | | 2.46 (1,300 tpd), 2.39 (1,150 tpd) 50 (1,300 tpd), 45 (1,150 tpd) |
| Processing Cost | | US$/tonne | | 73 (1,300 tpd), 77 (1,150 tpd) |
| G&A | | US$/tonne | | 20.00 |
| Reclamation fee | | US$ million per year | | 1.00 |
| Base Case Prices | | Gold US$/oz | | 1320.00 |
| | | SilverUS$/oz | | 26.00 |
| Transport, Freight, Insurance, Refining | | Gold US$/oz | | 10.00 |
| | | Silver US$/oz | | 0.50 |
| Metallurgical Recovery | | Gold (%) | | 95% |
| | | Silver (%) | | 93% |
| Income Tax | | % | | 35 |
| Royalties | | Export tax - % of total revenue | | 5.0 |
| | | New Provincial Royalty - % of total revenue | | 1.0 |
| | | CVSA NSR - % of total revenues less refining costs | | 2.0 |
| | | Boca mina - % of operating profit | | 3.0 |
| Depreciation | | Accelerated in three years | | 60%-20%-20% |
| | | | | Common in Argentina for capex, as
recommended by PwC5 |
Table 119 Economical Model General Parameters
In these financial models Extorre has assumed an accelerated depreciation schedule for the initial CAPEX of 60-20-20 (Years 1-2-3) together with recovery of the initial CAPEX-related VAT during the first year of commercial production, both of which are allowed under Argentine legislation for mining projects. Extorre will also seek to apply for tax credits of at least US$ 50 million that relate to pre-mining exploration expenditures (but have not been included in these financial analyses).
5 PwC: Price Waterhouse Coopers, financial advisors of Extorre in Argentina
Extorre Gold Mines Limited
Cerro Moro Gold – Silver Project
Preliminary Economic Assessment | Page 304 |
Taxation and royalties criteria were applied as follows:
Income tax: A corporate tax rate of 35% was considered.
Export tax: 5% of total revenues were applied.
New Provincial Royalty: 1% of total revenues was applied.
CVSA NSR: 2% of total revenue less refining costs was applied. This corresponds to the agreement with Cerro Vanguardia SA (CVSA).
Boca Mina: 3% of operating profit was applied, which corresponds to operating cash flow less export tax and CVSA NSR.
| 22.2 | Economic Analysis – 1,300 tpd (Option A) |
The total estimated initial capital cost of the Project is US$ 284 million (VAT included), which comprises i) US$ 247 million for all plant, infrastructure, energy, tailings dam, and open pit and underground development and mining equipment; ii) an additional $US 37.2M for EPCM costs and owners costs. Adding sustaining capital and closure, the total capital cost for the life of the Project is estimated to be US$ 433 million.
The base case financial model assumes gold and silver prices of US$ 1320 per ounce and US$ 26 per ounce, respectively. Results of the discounted cash flow modelling (NPV5 and NPV10) for the 1,300 tpd throughput scenario at Cerro Moro, together with the projected Internal Rate of Return (IRR) and payback period, are presented in Table 120.
| Financial Model | | 1,300 tpd |
| NPV5pre-tax | | US $ 737.4 million |
| NPV5Free cash flow (after tax) | | US $ 463.2 million |
| NPV10pre-tax | | US $ 524.7 million |
| NPV10Free cash flow (after tax) | | US $ 320.1 million |
| IRR pre-tax | | 63.1% |
| IRR Free cash flow (after tax) | | 46.8% |
| Years to payback from start of production (at 5% discount) | | 1.98 |
| Years to payback from start of production (at 10% discount) | | 2.16 |
Table 120 Economical Evaluation Results Summary (1,300 tpd)
Extorre Gold Mines Limited
Cerro Moro Gold – Silver Project
Preliminary Economic Assessment | Page 305 |
| 22.3 | Economic Analysis – 1,150 tpd (Option B) |
The total estimated initial capital cost of the Project is US$ 257 million (VAT included), which comprises i) US$ 220 million for all plant, infrastructure, energy, tailings dam, and open pit and underground development and mining equipment; ii) an additional $US 36.7M for EPCM costs and owners costs. Adding sustaining capital and closure, the total capital cost for the life of the Project is estimated to be US$ 424 million.
The base case financial model assumes gold and silver prices of US$ 1320 per ounce and US$ 26 per ounce, respectively. Results of the discounted cash flow modelling (NPV5 and NPV10) for the 1,150 tpd throughput scenario at Cerro Moro, together with the projected Internal Rate of Return (IRR) and payback period, are presented in Table 121.
| Financial Model | | 1,150 tpd |
| NPV5pre-tax | | US $ 723.0 million |
| NPV5Free cash flow (after tax) | | US $ 453.8 million |
| NPV10pre-tax | | US $ 503.8 million |
| NPV10Free cash flow (after tax) | | US $ 306.8 million |
| IRR pre-tax | | 65.7% |
| IRR Free cash flow (after tax) | | 47.4% |
| Years to payback from start of production (at 5% discount) | | 1.84 |
| Years to payback from start of production (at 10% discount) | | 2.03 |
Table 121 Economical Evaluation Results Summary (1,150 tpd)
Extorre Gold Mines Limited
Cerro Moro Gold – Silver Project
Preliminary Economic Assessment | Page 306 |
| | | | | Year -2 | | | Year -1 | | | Year 1 | | | Year 2 | | | Year 3 | | | Year 4 | | | Year 5 | | | Year 6 | | | Year 7 | | | Year 8 | | | Year 9 | | | TOTAL | |
| 1 Mine Plan | | | | | | | | | | | | | | | | | | | | | | | | | | | | | | | | | | | | | | | | | | | | | | | | | | |
| Open Pit Mining | | | | | | | | | | | | | | | | | | | | | | | | | | | | | | | | | | | | | | | | | | | | | | | | | | |
| Ore | | t | | | - | | | | - | | | | 210,506 | | | | 166,577 | | | | 193,619 | | | | 101,164 | | | | 202,589 | | | | 173,406 | | | | 199,041 | | | | 210,861 | | | | 289,405 | | | | 1,747,169 | |
| Gold | | Au g/t | | | - | | | | - | | | | 8.39 | | | | 11.43 | | | | 8.15 | | | | 11.65 | | | | 6.46 | | | | 3.22 | | | | 2.78 | | | | 2.85 | | | | 3.65 | | | | 6.01 | |
| Silver | | Ag g/t | | | - | | | | - | | | | 254.71 | | | | 403.85 | | | | 669.27 | | | | 682.94 | | | | 504.36 | | | | 246.91 | | | | 276.09 | | | | 234.52 | | | | 132.37 | | | | 347.57 | |
| Contained Gold | | oz | | | - | | | | - | | | | 56,763 | | | | 61,231 | | | | 50,764 | | | | 37,887 | | | | 42,088 | | | | 17,975 | | | | 17,777 | | | | 19,333 | | | | 33,991 | | | | 337,810 | |
| Contained Silver | | oz | | | - | | | | - | | | | 1,723,833 | | | | 2,162,807 | | | | 4,166,130 | | | | 2,221,204 | | | | 3,285,018 | | | | 1,376,544 | | | | 1,766,733 | | | | 1,589,856 | | | | 1,231,603 | | | | 19,523,728 | |
| Waste | | t | | | - | | | | - | | | | 4,722,971 | | | | 6,273,266 | | | | 7,125,079 | | | | 3,413,183 | | | | 6,960,609 | | | | 6,081,377 | | | | 6,983,787 | | | | 7,073,386 | | | | 4,017,911 | | | | 52,651,569 | |
| Total Mined | | t | | | - | | | | - | | | | 4,933,477 | | | | 6,439,843 | | | | 7,318,698 | | | | 3,514,347 | | | | 7,163,198 | | | | 6,254,783 | | | | 7,182,828 | | | | 7,284,247 | | | | 4,307,316 | | | | 54,398,738 | |
| | | | | | | | | | | | | | | | | | | | | | | | | | | | | | | | | | | | | | | | | | | | | | | | | | | |
| Underground Mining | | | | | | | | | | | | | | | | | | | | | | | | | | | | | | | | | | | | | | | | | | | | | | | | | | |
| Ore | | t | | | - | | | | 27,100 | | | | 178,700 | | | | 286,300 | | | | 372,100 | | | | 405,400 | | | | 379,100 | | | | 272,070 | | | | 186,900 | | | | 132,961 | | | | 47,478 | | | | 2,288,109 | |
| Gold | | Au g/t | | | - | | | | 19.61 | | | | 12.21 | | | | 7.71 | | | | 7.56 | | | | 8.61 | | | | 7.23 | | | | 6.24 | | | | 5.57 | | | | 3.57 | | | | 1.92 | | | | 7.55 | |
| Silver | | Ag g/t | | | - | | | | 1,202.35 | | | | 744.31 | | | | 513.88 | | | | 381.95 | | | | 360.09 | | | | 326.90 | | | | 354.11 | | | | 504.28 | | | | 352.54 | | | | 255.23 | | | | 425.82 | |
| Contained Gold | | oz | | | - | | | | 17,085 | | | | 70,153 | | | | 70,954 | | | | 90,385 | | | | 112,228 | | | | 88,157 | | | | 54,612 | | | | 33,481 | | | | 15,277 | | | | 2,932 | | | | 555,264 | |
| Contained Silver | | oz | | | - | | | | 1,047,573 | | | | 4,276,217 | | | | 4,730,087 | | | | 4,569,330 | | | | 4,693,278 | | | | 3,984,359 | | | | 3,097,408 | | | | 3,030,135 | | | | 1,506,991 | | | | 389,597 | | | | 31,324,976 | |
| | | | | | | | | | | | | | | | | | | | | | | | | | | | | | | | | | | | | | | | | | | | | | | | | | | |
| Total Mining | | | | | | | | | | | | | | | | | | | | | | | | | | | | | | | | | | | | | | | | | | | | | | | | | | |
| Ore | | t | | | - | | | | 27,100 | | | | 389,206 | | | | 452,877 | | | | 565,719 | | | | 506,564 | | | | 581,689 | | | | 445,476 | | | | 385,941 | | | | 343,822 | | | | 336,883 | | | | 4,035,278 | |
| Gold | | Au g/t | | | - | | | | 19.61 | | | | 10.14 | | | | 9.08 | | | | 7.76 | | | | 9.22 | | | | 6.96 | | | | 5.07 | | | | 4.13 | | | | 3.13 | | | | 3.41 | | | | 6.88 | |
| Silver | | Ag g/t | | | - | | | | 1,202.35 | | | | 479.50 | | | | 473.41 | | | | 480.29 | | | | 424.56 | | | | 388.71 | | | | 312.38 | | | | 386.59 | | | | 280.16 | | | | 149.68 | | | | 391.94 | |
| Contained Gold | | oz | | | - | | | | 17,085 | | | | 126,915 | | | | 132,184 | | | | 141,149 | | | | 150,115 | | | | 130,245 | | | | 72,588 | | | | 51,258 | | | | 34,611 | | | | 36,923 | | | | 893,073 | |
| Contained Silver | | oz | | | - | | | | 1,047,573 | | | | 6,000,050 | | | | 6,892,894 | | | | 8,735,460 | | | | 6,914,482 | | | | 7,269,377 | | | | 4,473,952 | | | | 4,796,868 | | | | 3,096,847 | | | | 1,621,200 | | | | 50,848,704 | |
| | | | | | | | | | | | | | | | | | | | | | | | | | | | | | | | | | | | | | | | | | | | | | | | | | | |
| Plant Feed | | | | | | | | | | | | | | | | | | | | | | | | | | | | | | | | | | | | | | | | | | | | | | | | | | |
| Ore | | t | | | - | | | | - | | | | 375,527 | | | | 436,570 | | | | 436,570 | | | | 436,570 | | | | 480,180 | | | | 480,179 | | | | 480,179 | | | | 480,179 | | | | 429,324 | | | | 4,035,278 | |
| Gold | | Au g/t | | | - | | | | - | | | | 11.19 | | | | 9.55 | | | | 8.69 | | | | 10.27 | | | | 7.26 | | | | 5.20 | | | | 4.13 | | | | 3.41 | | | | 3.56 | | | | 6.88 | |
| Silver | | Ag g/t | | | - | | | | - | | | | 547.84 | | | | 482.88 | | | | 523.85 | | | | 461.79 | | | | 413.31 | | | | 322.91 | | | | 362.54 | | | | 275.57 | | | | 174.31 | | | | 391.94 | |
| Contained Gold | | oz | | | - | | | | - | | | | 135,148 | | | | 134,098 | | | | 121,943 | | | | 144,204 | | | | 112,048 | | | | 80,231 | | | | 63,681 | | | | 52,597 | | | | 49,123 | | | | 893,073 | |
| Contained Silver | | oz | | | - | | | | - | | | | 6,614,220 | | | | 6,777,671 | | | | 7,352,718 | | | | 6,481,571 | | | | 6,380,648 | | | | 4,984,976 | | | | 5,596,778 | | | | 4,254,194 | | | | 2,405,929 | | | | 50,848,704 | |
| | | | | | | | | | | | | | | | | | | | | | | | | | | | | | | | | | | | | | | | | | | | | | | | | | | |
| 2 Recoveries | | | | | | | | | | | | | | | | | | | | | | | | | | | | | | | | | | | | | | | | | | | | | | | | | | |
| Gold | | | | | | | | | | | | | 95.0 | % | | | 95.0 | % | | | 95.0 | % | | | 95.0 | % | | | 95.0 | % | | | 95.0 | % | | | 95.0 | % | | | 95.0 | % | | | 95.0 | % | | | | |
| Sliver | | | | | | | | | | | | | 93.0 | % | | | 93.0 | % | | | 93.0 | % | | | 93.0 | % | | | 93.0 | % | | | 93.0 | % | | | 93.0 | % | | | 93.0 | % | | | 93.0 | % | | | | |
| | | | | | | | | | | | | | | | | | | | | | | | | | | | | | | | | | | | | | | | | | | | | | | | | | | |
| 3 Production | | | | | | | | | | | | | | | | | | | | | | | | | | | | | | | | | | | | | | | | | | | | | | | | | | |
| Gold | | oz | | | | | | | | | | | 128,400 | | | | 127,391 | | | | 115,848 | | | | 136,993 | | | | 106,451 | | | | 76,221 | | | | 60,504 | | | | 49,975 | | | | 46,651 | | | | 848,434 | |
| Silver | | oz | | | | | | | | | | | 6,151,328 | | | | 6,303,334 | | | | 6,838,136 | | | | 6,027,950 | | | | 5,934,097 | | | | 4,636,114 | | | | 5,205,096 | | | | 3,956,474 | | | | 2,237,528 | | | | 47,290,058 | |
| Gold Equivalent | | oz | | | | | | | | | | | 251,426 | | | | 253,458 | | | | 252,610 | | | | 257,552 | | | | 225,133 | | | | 168,943 | | | | 164,606 | | | | 129,104 | | | | 91,402 | | | | 1,794,235 | |
| Silver Equivalent | | oz | | | | | | | | | | | 12,571,322 | | | | 12,672,890 | | | | 12,630,516 | | | | 12,877,604 | | | | 11,256,650 | | | | 8,447,153 | | | | 8,230,317 | | | | 6,455,213 | | | | 4,570,083 | | | | 89,711,748 | |
Table 122Cash Flow Economical Model for 1,300 tpd option
Extorre Gold Mines Limited
Cerro Moro Gold – Silver Project
Preliminary Economic Assessment | Page 307 |
| (Continued) | | | | Year -2 | | | Year -1 | | | Year 1 | | | Year2 | | | Year 3 | | | Year4 | | | Year 5 | | | Year 6 | | | Year 7 | | | Year8 | | | Year 9 | | | TOTAL | |
| 4 Prices | | | | | | | | | | | | | | | | | | | | | | | | | | | | | | | | | | | | | | | | | | | | | | | | | | |
| Gold | | US$/oz | | | 1320 | | | | 1320 | | | | 1320 | | | | 1320 | | | | 1320 | | | | 1320 | | | | 1320 | | | | 1320 | | | | 1320 | | | | 1320 | | | | 1320 | | | | | |
| Silver | | US$/oz | | | 26 | | | | 26 | | | | 26 | | | | 26 | | | | 26 | | | | 26 | | | | 26 | | | | 26 | | | | 26 | | | | 26 | | | | 26 | | | | | |
| | | | | | | | | | | | | | | | | | | | | | | | | | | | | | | | | | | | | | | | | | | | | | | | | | | |
| 5 Total revenue | | | | | | | | | | | | | | | | | | | | | | | | | | | | | | | | | | | | | | | | | | | | | | | | | | |
| Gold | | US$ | | | - | | | | - | | | | 169,487,853 | | | | 168,156,275 | | | | 152,918,837 | | | | 180,830,870 | | | | 140,515,402 | | | | 100,611,421 | | | | 79,865,817 | | | | 65,966,689 | | | | 61,579,455 | | | | 1,119,932,620 | |
| Silver | | US$ | | | - | | | | - | | | | 159,934,519 | | | | 163,886,681 | | | | 177,791,540 | | | | 156,726,709 | | | | 154,286,515 | | | | 120,538,973 | | | | 135,332,506 | | | | 102,868,334 | | | | 58,175,721 | | | | 1,229,541,498 | |
| Total Revenue | | US$ | | | - | | | | - | | | | 329,422,372 | | | | 332,042,957 | | | | 330,710,378 | | | | 337,557,578 | | | | 294,801,917 | | | | 221,150,394 | | | | 215,198,324 | | | | 168,835,022 | | | | 119,755,176 | | | | 2,349,474,118 | |
| | | | | | | | | | | | | | | | | | | | | | | | | | | | | | | | | | | | | | | | | | | | | | | | | | | |
| Gold credit | | US$/oz | | | - | | | | - | | | | 27.55 | | | | 26.68 | | | | 22.36 | | | | 30.00 | | | | 23.68 | | | | 21.70 | | | | 15.34 | | | | 16.67 | | | | 27.52 | | | | 23.68 | |
| Silver credit | | US$/oz | | | - | | | | - | | | | 1,245.60 | | | | 1,286.48 | | | | 1,534.70 | | | | 1,144.05 | | | | 1,449.37 | | | | 1,581.45 | | | | 2,236.74 | | | | 2,058.41 | | | | 1,247.04 | | | | 1,449.19 | |
| | | | | | | | | | | | | | | | | | | | | | | | | | | | | | | | | | | | | | | | | | | | | | | | | | | |
| 6 Operating Costs | | | | | | | | | | | | | | | | | | | | | | | | | | | | | | | | | | | | | | | | | | | | | | | | | | |
| Mining | | US$ | | | | | | | | | | | 28,222,298 | | | | 37,957,337 | | | | 41,467,189 | | | | 32,317,515 | | | | 29,006,298 | | | | 24,074,078 | | | | 22,606,811 | | | | 19,643,747 | | | | 11,661,945 | | | | 246,957,216 | |
| Milling | | US$ | | | | | | | | | | | 30,515,324 | | | | 32,956,669 | | | | 33,244,806 | | | | 32,843,161 | | | | 34,481,726 | | | | 33,785,394 | | | | 34,054,295 | | | | 33,396,449 | | | | 30,576,468 | | | | 295,854,292 | |
| G &A | | US$ | | | | | | | | | | | 7,510,540 | | | | 8,731,400 | | | | 8,731,400 | | | | 8,731,400 | | | | 9,603,600 | | | | 9,603,580 | | | | 9,603,580 | | | | 9,603,580 | | | | 8,586,484 | | | | 80,705,564 | |
| Total Operating Cost | | US$ | | | | | | | | | | | 66,248,162 | | | | 79,645,406 | | | | 83,443,395 | | | | 73,892,076 | | | | 73,091,624 | | | | 67,463,052 | | | | 66,264,685 | | | | 62,643,776 | | | | 50,824,896 | | | | 623,517,072 | |
| Total Operating Cost | | US$/t | | | | | | | | | | | 170.21 | | | | 175.87 | | | | 147.50 | | | | 145.87 | | | | 125.65 | | | | 151.44 | | | | 171.70 | | | | 182.20 | | | | 150.87 | | | | 154.52 | |
| | | | | | | | | | | | | | | | | | | | | | | | | | | | | | | | | | | | | | | | | | | | | | | | | | | |
| 7 Operating Cash Flow | | US$ | | | - | | | | - | | | | 263,174,210 | | | | 252,397,550 | | | | 247,266,983 | | | | 263,665,503 | | | | 221,710,294 | | | | 153,687,342 | | | | 148,933,638 | | | | 106,191,246 | | | | 68,930,280 | | | | 1,725,957,046 | |
| | | | | | | | | | | | | | | | | | | | | | | | | | | | | | | | | | | | | | | | | | | | | | | | | | | |
| 8 Cash Cost | | | | | | | | | | | | | | | | | | | | | | | | | | | | | | | | | | | | | | | | | | | | | | | | | | |
| Cash cost wo/credit (gold) | | US$/oz | | | - | | | | - | | | | 515.95 | | | | 625.20 | | | | 720.29 | | | | 539.39 | | | | 686.62 | | | | 885.10 | | | | 1,095.20 | | | | 1,253.51 | | | | 1,089.47 | | | | 734.90 | |
| Cash cost w/ credit (gold) | | US$/oz | | | - | | | | - | | | | 729.65 | | | | 661.28 | | | | 814.42 | | | | 604.66 | | | | 762.74 | | | | 696.34 | | | | 1,141.53 | | | | 804.90 | | | | 157.57 | | | | 714.29 | |
| Cash cost (gold equivalent) | | US$/oz | | | - | | | | - | | | | 263.49 | | | | 314.24 | | | | 330.32 | | | | 286.90 | | | | 324.66 | | | | 399.32 | | | | 402.56 | | | | 485.22 | | | | 556.06 | | | | 347.51 | |
| Cash cost wo/credit (s ilver) | | US$/oz | | | - | | | | - | | | | 10.77 | | | | 12.64 | | | | 12.20 | | | | 12.26 | | | | 12.32 | | | | 14.55 | | | | 12.73 | | | | 15.83 | | | | 22.71 | | | | 13.18 | |
| Cash cost w/ credit (silver) | | US$/oz | | | - | | | | - | | | | 16.78 | | | | 14.04 | | | | 10.16 | | | | 17.74 | | | | 11.36 | | | | 7.15 | | | | 2.61 | | | | 0.84 | | | | 4.81 | | | | 10.50 | |
| Cash cost (silver equivalent) | | US$/oz | | | - | | | | - | | | | 5.27 | | | | 6.28 | | | | 6.61 | | | | 5.74 | | | | 6.49 | | | | 7.99 | | | | 8.05 | | | | 9.70 | | | | 11.12 | | | | 6.95 | |
| | | | | | | | | | | | | | | | | | | | | | | | | | | | | | | | | | | | | | | | | | | | | | | | | | | |
| 9 Refining + transport + insurance | | | | | | | | | | | | | | | | | | | | | | | | | | | | | | | | | | | | | | | | | | | | | | | | | | |
| Gold | | US$ | | | - | | | | - | | | | 1,283,999 | | | | 1,273,911 | | | | 1,158,476 | | | | 1,369,931 | | | | 1,064,511 | | | | 762,208 | | | | 605,044 | | | | 499,748 | | | | 466,511 | | | | 8,484,338 | |
| Silver | | US$ | | | - | | | | - | | | | 3,075,664 | | | | 3,151,667 | | | | 3,419,068 | | | | 3,013,975 | | | | 2,967,048 | | | | 2,318,057 | | | | 2,602,548 | | | | 1,978,237 | | | | 1,118,764 | | | | 23,645,029 | |
| Total Refining | | US$ | | | - | | | | - | | | | 4,359,663 | | | | 4,425,578 | | | | 4,577,544 | | | | 4,383,906 | | | | 4,031,559 | | | | 3,080,265 | | | | 3,207,592 | | | | 2,477,985 | | | | 1,585,275 | | | | 32,129,367 | |
| | | | | | | | | | | | | | | | | | | | | | | | | | | | | | | | | | | | | | | | | | | | | | | | | | | |
| 10 Royalties | | | | | | | | | | | | | | | | | | | | | | | | | | | | | | | | | | | | | | | | | | | | | | | | | | |
| Export tax(5% of total revenue) | | US$ | | | - | | | | - | | | | 16,471,119 | | | | 16,602,148 | | | | 16,535,519 | | | | 16,877,879 | | | | 14,740,096 | | | | 11,057,520 | | | | 10,759,916 | | | | 8,441,751 | | | | 5,987,759 | | | | 117,473,706 | |
| NSRCVSA (2% of Total Revenue Less Refining Costs) | | US$ | | | - | | | | - | | | | 6,501,254 | | | | 6,552,348 | | | | 6,522,657 | | | | 6,663,473 | | | | 5,815,407 | | | | 4,361,403 | | | | 4,239,815 | | | | 3,327,141 | | | | 2,363,398 | | | | 46,346,895 | |
| Boca Mina Tax (3% of Operating Profit) | | US$ | | | - | | | | - | | | | 7,206,055 | | | | 6,877,292 | | | | 6,726,264 | | | | 7,203,725 | | | | 6,034,644 | | | | 4,148,053 | | | | 4,018,017 | | | | 2,832,671 | | | | 1,817,374 | | | | 46,864,093 | |
| New Provincial Royalty(1% of total revenue) | | US$ | | | - | | | | - | | | | 3,294,224 | | | | 3,320,430 | | | | 3,307,104 | | | | 3,375,576 | | | | 2,948,019 | | | | 2,211,504 | | | | 2,151,983 | | | | 1,688,350 | | | | 1,197,552 | | | | 23,494,741 | |
| Total Royalties | | US$ | | | - | | | | - | | | | 33,472,652 | | | | 33,352,217 | | | | 33,091,544 | | | | 34,120,653 | | | | 29,538,166 | | | | 21,778,479 | | | | 21,169,731 | | | | 16,289,913 | | | | 11,366,082 | | | | 234,179,435 | |
Extorre Gold Mines Limited
Cerro Moro Gold – Silver Project
Preliminary Economic Assessment | Page 308 |
| (Continued) | | | | Year -2 | | | Year -1 | | | Year 1 | | | Year 2 | | | Year 3 | | | Year 4 | | | Year 5 | | | Year 6 | | | Year 7 | | | Year 8 | | | Year 9 | | | TOTAL | |
| 11 Net Revenue | | US$ | | | - | | | | - | | | | 291,590,058 | | | | 294,265,162 | | | | 293,041,290 | | | | 299,053,020 | | | | 261,232,192 | | | | 196,291,650 | | | | 190,821,000 | | | | 150,067,125 | | | | 106,803,819 | | | | 2,083,165,316 | |
| | | | | | | | | | | | | | | | | | | | | | | | | | | | | | | | | | | | | | | | | | | | | | | | | | | |
| 12 Total cost per ounce, including refining & royalty | | | | | | | | | | | | | | | | | | | | | | | | | | | | | | | | | | | | | | | | | | | | | | | | | | |
| Total cost per ounce, including refining & royalty (wo/credit) (gold) | | US$/oz | | | - | | | | - | | | | 810.60 | | | | 921.75 | | | | 1,045.45 | | | | 820.45 | | | | 1,001.98 | | | | 1,211.24 | | | | 1,498.11 | | | | 1,629.06 | | | | 1,367.09 | | | | 1,048.79 | |
| Total cost per ounce, including refining & royalty (w/ credit) (gold) | | US$/oz | | | - | | | | - | | | | 435.00 | | | | 364.73 | | | | 489.26 | | | | 323.59 | | | | 447.39 | | | | 370.20 | | | | 738.63 | | | | 429.35 | | | | 120.05 | | | | 400.40 | |
| Total cost per ounce, including refining & royalty (gold equivalent) | | US$/oz | | | - | | | | - | | | | 413.96 | | | | 463.29 | | | | 479.44 | | | | 436.40 | | | | 473.77 | | | | 546.47 | | | | 550.66 | | | | 630.59 | | | | 697.76 | | | | 495.94 | |
| Total cost per ounce, including refining & royalty (wo/credit) (silver) | | US$/oz | | | - | | | | - | | | | 16.92 | | | | 18.63 | | | | 17.71 | | | | 18.65 | | | | 17.97 | | | | 19.91 | | | | 17.41 | | | | 20.58 | | | | 28.50 | | | | 18.82 | |
| Total cost per ounce, including refining & royalty (w/ credit) (silver) | | US$/oz | | | - | | | | - | | | | 10.63 | | | | 8.05 | | | | 4.65 | | | | 11.35 | | | | 5.71 | | | | 1.79 | | | | 2.07 | | | | 3.90 | | | | 0.98 | | | | 4.87 | |
| Total cost per ounce, including refining & royalty (silver equivalent) | | US$/oz | | | - | | | | - | | | | 8.28 | | | | 9.27 | | | | 9.59 | | | | 8.73 | | | | 9.48 | | | | 10.93 | | | | 11.01 | | | | 12.61 | | | | 13.96 | | | | 9.92 | |
| | | | | | | | | | | | | | | | | | | | | | | | | | | | | | | | | | | | | | | | | | | | | | | | | | | |
| 13 Total Gross Margin | | US$ | | | - | | | | - | | | | 225,341,896 | | | | 214,619,756 | | | | 209,597,896 | | | | 225,160,944 | | | | 188,140,569 | | | | 128,828,598 | | | | 124,556,315 | | | | 87,423,349 | | | | 55,978,922 | | | | 1,459,648,244 | |
| | | | | | | | | | | | | | | | | | | | | | | | | | | | | | | | | | | | | | | | | | | | | | | | | | | |
| 14 Reclamation | | US$ | | | | | | | | | | | 1,000,000 | | | | 1,000,000 | | | | 1,000,000 | | | | 1,000,000 | | | | 1,000,000 | | | | 1,000,000 | | | | 1,000,000 | | | | 1,000,000 | | | | | | | | 8,000,000 | |
| | | | | | | | | | | | | | | | | | | | | | | | | | | | | | | | | | | | | | | | | | | | | | | | | | | |
| 15 EBITDA | | US$ | | | - | | | | - | | | | 224,341,896 | | | | 213,619,756 | | | | 208,597,896 | | | | 224,160,944 | | | | 187,140,569 | | | | 127,828,598 | | | | 123,556,315 | | | | 86,423,349 | | | | 55,978,922 | | | | 1,451,648,244 | |
| | | | | | | | | | | | | | | | | | | | | | | | | | | | | | | | | | | | | | | | | | | | | | | | | | | |
| 16 Depreciation & Amortization | | US$ | | | - | | | | 10,599,267 | | | | 143,318,069 | | | | 74,584,600 | | | | 79,376,017 | | | | 28,035,133 | | | | 23,888,042 | | | | 12,080,197 | | | | 5,949,097 | | | | 5,339,993 | | | | 2,104,538 | | | | 385,274,954 | |
| (see capex sheet) | | | | | | | | | | | | | | | | | | | | | | | | | | | | | | | | | | | | | | | | | | | | | | | | | | |
| | | | | | | | | | | | | | | | | | | | | | | | | | | | | | | | | | | | | | | | | | | | | | | | | | | |
| 17 EBIT | | US$ | | | - | | | | 10,599,267 | | | | 81,023,827 | | | | 139,035,156 | | | | 129,221,878 | | | | 196,125,811 | | | | 163,252,526 | | | | 115,748,401 | | | | 117,607,218 | | | | 81,083,356 | | | | 53,874,384 | | | | 1,066,373,290 | |
| | | | | | | | | | | | | | | | | | | | | | | | | | | | | | | | | | | | | | | | | | | | | | | | | | | |
| 18 Interests on debt | | US$ | | | - | | | | - | | | | - | | | | - | | | | - | | | | - | | | | - | | | | - | | | | - | | | | - | | | | - | | | | - | |
| | | | | | | | | | | | | | | | | | | | | | | | | | | | | | | | | | | | | | | | | | | | | | | | | | | |
| 19 EBT | | US$ | | | - | | | | 10,599,267 | | | | 81,023,827 | | | | 139,035,156 | | | | 129,221,878 | | | | 196,125,811 | | | | 163,252,526 | | | | 115,748,401 | | | | 117,607,218 | | | | 81,083,356 | | | | 53,874,384 | | | | 1,066,373,290 | |
| | | | | | | | | | | | | | | | | | | | | | | | | | | | | | | | | | | | | | | | | | | | | | | | | | | |
| 20 Taxes (35%) | | US$ | | | - | | | | - | | | | 28,358,340 | | | | 48,662,305 | | | | 45,227,657 | | | | 68,644,034 | | | | 57,138,384 | | | | 40,511,940 | | | | 41,162,526 | | | | 28,379,174 | | | | 18,856,034 | | | | 376,940,395 | |
| | | | | | | | | | | | | | | | | | | | | | | | | | | | | | | | | | | | | | | | | | | | | | | | | | | |
| 21 Net Earnings | | US$ | | | - | | | | 10,599,267 | | | | 52,665,488 | | | | 90,372,851 | | | | 83,994,221 | | | | 127,481,777 | | | | 106,114,142 | | | | 75,236,461 | | | | 76,444,692 | | | | 52,704,181 | | | | 35,018,350 | | | | 689,432,895 | |
| | | | | | | | | | | | | | | | | | | | | | | | | | | | | | | | | | | | | | | | | | | | | | | | | | | |
| 22 CASH FLOW | | US$ | | | - | | | | - | | | | 195,983,556 | | | | 164,957,451 | | | | 163,370,238 | | | | 155,516,910 | | | | 130,002,185 | | | | 87,316,658 | | | | 82,393,788 | | | | 58,044,174 | | | | 37,122,888 | | | | 1,074,707,849 | |
| | | | | | | | | | | | | | | | | | | | | | | | | | | | | | | | | | | | | | | | | | | | | | | | | | | |
| 23 Net Capex | | | | | | | | | | | | | | | | | | | | | | | | | | | | | | | | | | | | | | | | | | | | | | | | | | |
| Capex | | US$ | | | 17,665,446 | | | | 232,974,966 | | | | | | | | | | | | | | | | | | | | | | | | | | | | | | | | | | | | | | | | 250,640,412 | |
| VAT | | US$ | | | 1,547,630 | | | | 31,949,661 | | | | 33,497,291 | | | | | | | | | | | | | | | | | | | | | | | | | | | | | | | | | | | | | |
| Sustaining /Closure | | US$ | | | | | | | | | | | 42,628,479 | | | | 44,712,722 | | | | 20,064,280 | | | | 20,666,518 | | | | 5,754,781 | | | | 1,000,000 | | | | 7,290,000 | | | | 1,130,152 | | | | 5,500,000 | | | | 148,746,932 | |
| Total Capex | | US$ | | | 19,213,076 | | | | 264,924,627 | | | | 9,131,188 | | | | 44,712,722 | | | | 20,064,280 | | | | 20,666,518 | | | | 5,754,781 | | | | 1,000,000 | | | | 7,290,000 | | | | 1,130,152 | | | | 5,500,000 | | | | 399,387,344 | |
Extorre Gold Mines Limited
Cerro Moro Gold – Silver Project
Preliminary Economic Assessment | Page 309 |
| (Continued) | | | | Year -2 | | | Year -1 | | | Year1 | | | Year 2 | | | Year3 | | | Year 4 | | | Year 5 | | | Year 6 | | | Year7 | | | Year 8 | | | Year 9 | | | TOTAL | |
| 24 Total cost per ounce, including capex | | | | | | | | | | | | | | | | | | | | | | | | | | | | | | | | | | | | | | | | | | | | | | | | | | |
| Total cost per ounce, including capex(wo/ credit) (gold) | | US$/oz | | | - | | | | - | | | | 881.71 | | | | 1,272.74 | | | | 1,218.64 | | | | 971.31 | | | | 1,056.04 | | | | 1,224.36 | | | | 1,618.59 | | | | 1,651.67 | | | | 1,484.99 | | | | 1,519.52 | |
| Total cost per ounce, including capex(w/ credit) (gold) | | US$/oz | | | - | | | | - | | | | 363.89 | | | | 13.74 | | | | 316.06 | | | | 172.74 | | | | 393.33 | | | | 357.08 | | | | 618.15 | | | | 406.74 | | | | 237.95 | | | | 70.33 | |
| Total cost per ounce, including refining & royalty(gold equivalent) | | US$/oz | | | - | | | | - | | | | 450.28 | | | | 639.70 | | | | 558.87 | | | | 516.65 | | | | 499.33 | | | | 552.39 | | | | 594.95 | | | | 639.34 | | | | 757.93 | | | | 718.53 | |
| | | | | | | | | | | | | | | | | | | | | | | | | | | | | | | | | | | | | | | | | | | | | | | | | | | |
| 25 Net Free Cash Flow (yearly & cumulative) | | | | | | | | | | | | | | | | | | | | | | | | | | | | | | | | | | | | | | | | | | | | | | | | | | |
| Net Free Cash Flow | | US$ | | | (19,213,076 | ) | | | (264,924,627 | ) | | | 186,852,369 | | | | 120,244,729 | | | | 143,305,958 | | | | 134,850,392 | | | | 124,247,404 | | | | 86,316,658 | | | | 75,103,788 | | | | 56,914,022 | | | | 31,622,888 | | | | 675,320,504 | |
| Cumulative | | US$ | | | (19,213,076 | ) | | | (284,137,703 | ) | | | (97,285,334 | ) | | | 22,959,395 | | | | 166,265,353 | | | | 301,115,745 | | | | 425,363,149 | | | | 511,679,806 | | | | 586,783,595 | | | | 643,697,616 | | | | 675,320,504 | | | | | |
| 26 Net Present Value (NPV) | | | | | | | | | 27 Payback (years) |
| | 5 | % | | $ | 463,219,444 | | | 2.0 |
| | 10 | % | | $ | 320,106,277 | | | 2.2 |
Extorre Gold Mines Limited
Cerro Moro Gold – Silver Project
Preliminary Economic Assessment | Page 310 |
| | | | | Year -2 | | | Year -1 | | | Year 1 | | | Year 2 | | | Year 3 | | | Year 4 | | | Year 5 | | | Year 6 | | | Year 7 | | | Year 8 | | | Year 9 | | | Year 10 | | | Year 11 | | | TOTAL | |
| 1 Mine Plan | | | | | | | | | | | | | | | | | | | | | | | | | | | | | | | | | | | | | | | | | | | | | | | | | | | | | | | | | | |
| Open Pit Mining | | | | | | | | | | | | | | | | | | | | | | | | | | | | | | | | | | | | | | | | | | | | | | | | | | | | | | | | | | |
| Ore | | t | | | - | | | | 164 | | | | 63,552 | | | | 145,989 | | | | 175,270 | | | | 187,824 | | | | 309,248 | | | | 165,814 | | | | 199,041 | | | | 210,861 | | | | 289,405 | | | | - | | | | - | | | | 1,747,169 | |
| Gold | | Au g/t | | | - | | | | 2.37 | | | | 23.98 | | | | 19.55 | | | | 11.14 | | | | 3.00 | | | | 3.08 | | | | 2.71 | | | | 2.78 | | | | 2.85 | | | | 3.65 | | | | - | | | | - | | | | 6.01 | |
| Silver | | Ag g/t | | | - | | | | 185.18 | | | | 1,397.61 | | | | 642.77 | | | | 362.08 | | | | 336.38 | | | | 369.87 | | | | 246.32 | | | | 276.09 | | | | 234.52 | | | | 132.37 | | | | - | | | | - | | | | 347.57 | |
| Contained Gold | | oz | | | - | | | | 13 | | | | 48,994 | | | | 91,752 | | | | 62,750 | | | | 18,132 | | | | 30,611 | | | | 14,457 | | | | 17,777 | | | | 19,333 | | | | 33,991 | | | | - | | | | - | | | | 337,810 | |
| Contained Silver | | oz | | | - | | | | 979 | | | | 2,855,607 | | | | 3,016,898 | | | | 2,040,283 | | | | 2,031,266 | | | | 3,677,378 | | | | 1,313,127 | | | | 1,766,733 | | | | 1,589,856 | | | | 1,231,603 | | | | - | | | | - | | | | 19,523,728 | |
| Waste | | t | | | - | | | | 941,636 | | | | 2,777,848 | | | | 6,450,783 | | | | 6,313,871 | | | | 6,222,209 | | | | 5,867,004 | | | | 6,003,132 | | | | 6,983,787 | | | | 7,073,386 | | | | 4,017,911 | | | | - | | | | - | | | | 52,651,566 | |
| Total Mined | | t | | | - | | | | 941,800 | | | | 2,841,400 | | | | 6,596,772 | | | | 6,489,141 | | | | 6,410,032 | | | | 6,176,253 | | | | 6,168,947 | | | | 7,182,828 | | | | 7,284,247 | | | | 4,307,315 | | | | - | | | | | | | | 54,398,735 | |
| | | | | | | | | | | | | | | | | | | | | | | | | | | | | | | | | | | | | | | | | | | | | | | | | | | | | | | | | | | |
| Underground Mining | | | | | | | | | | | | | | | | | | | | | | | | | | | | | | | | | | | | | | | | | | | | | | | | | | | | | | | | | | |
| Ore | | t | | | - | | | | 27,100 | | | | 148,900 | | | | 179,500 | | | | 334,200 | | | | 416,000 | | | | 369,000 | | | | 318,470 | | | | 210,400 | | | | 165,261 | | | | 119,278 | | | | - | | | | - | | | | 2,288,109 | |
| Gold | | Au g/t | | | - | | | | 19.61 | | | | 12.72 | | | | 8.04 | | | | 7.95 | | | | 7.87 | | | | 7.72 | | | | 5.72 | | | | 6.26 | | | | 6.22 | | | | 3.82 | | | | - | | | | - | | | | 7.55 | |
| Silver | | Ag g/t | | | - | | | | 1,202.35 | | | | 710.26 | | | | 459.59 | | | | 449.72 | | | | 324.99 | | | | 350.59 | | | | 336.99 | | | | 474.91 | | | | 578.82 | | | | 299.59 | | | | - | | | | - | | | | 425.82 | |
| Contained Gold | | oz | | | - | | | | 17,085 | | | | 60,894 | | | | 46,372 | | | | 85,437 | | | | 105,259 | | | | 91,628 | | | | 58,537 | | | | 42,330 | | | | 33,061 | | | | 14,660 | | | | - | | | | - | | | | 555,264 | |
| Contained Silver | | oz | | | - | | | | 1,047,573 | | | | 3,400,154 | | | | 2,652,263 | | | | 4,832,114 | | | | 4,346,523 | | | | 4,159,230 | | | | 3,450,356 | | | | 3,212,504 | | | | 3,075,381 | | | | 1,148,877 | | | | - | | | | - | | | | 31,324,976 | |
| | | | | | | | | | | | | | | | | | | | | | | | | | | | | | | | | | | | | | | | | | | | | | | | | | | | | | | | | | | |
| Total Mining | | | | | | | | | | | | | | | | | | | | | | | | | | | | | | | | | | | | | | | | | | | | | | | | | | | | | | | | | | |
| Ore | | t | | | - | | | | 27,264 | | | | 212,452 | | | | 325,489 | | | | 509,470 | | | | 603,824 | | | | 678,248 | | | | 484,284 | | | | 409,441 | | | | 376,122 | | | | 408,683 | | | | - | | | | - | | | | 4,035,278 | |
| Gold | | Au g/t | | | - | | | | 19.51 | | | | 16.09 | | | | 13.20 | | | | 9.05 | | | | 6.36 | | | | 5.61 | | | | 4.69 | | | | 4.57 | | | | 4.33 | | | | 3.70 | | | | - | | | | - | | | | 6.88 | |
| Silver | | Ag g/t | | | - | | | | 1,196.22 | | | | 915.87 | | | | 541.75 | | | | 419.57 | | | | 328.53 | | | | 359.38 | | | | 305.94 | | | | 378.26 | | | | 385.80 | | | | 181.17 | | | | - | | | | - | | | | 391.94 | |
| Contained Gold | | oz | | | - | | | | 17,098 | | | | 109,888 | | | | 138,123 | | | | 148,188 | | | | 123,391 | | | | 122,239 | | | | 72,994 | | | | 60,107 | | | | 52,394 | | | | 48,651 | | | | - | | | | - | | | | 893,073 | |
| Contained Silver | | oz | | | - | | | | 1,048,552 | | | | 6,255,761 | | | | 5,669,161 | | | | 6,872,397 | | | | 6,377,789 | | | | 7,836,608 | | | | 4,763,482 | | | | 4,979,237 | | | | 4,665,237 | | | | 2,380,480 | | | | - | | | | - | | | | 50,848,704 | |
| | | | | | | | | | | | | | | | | | | | | | | | | | | | | | | | | | | | | | | | | | | | | | | | | | | | | | | | | | | |
| Plant Feed | | | | | | | | | | | | | | | | | | | | | | | | | | | | | | | | | | | | | | | | | | | | | | | | | | | | | | | | | | |
| Ore | | t | | | - | | | | - | | | | 239,716 | | | | 315,821 | | | | 386,170 | | | | 386,170 | | | | 424,787 | | | | 424,787 | | | | 424,786 | | | | 424,786 | | | | 424,786 | | | | 424,786 | | | | 158,683 | | | | 4,035,278 | |
| Gold | | Au g/t | | | - | | | | - | | | | 16.48 | | | | 13.24 | | | | 10.41 | | | | 7.99 | | | | 6.52 | | | | 5.22 | | | | 4.61 | | | | 4.29 | | | | 3.77 | | | | 3.73 | | | | 3.73 | | | | 6.88 | |
| Silver | | Ag g/t | | | - | | | | - | | | | 947.76 | | | | 541.66 | | | | 473.52 | | | | 340.84 | | | | 426.10 | | | | 348.58 | | | | 377.58 | | | | 369.26 | | | | 193.49 | | | | 240.53 | | | | 240.53 | | | | 391.94 | |
| Contained Gold | | oz | | | - | | | | - | | | | 126,986 | | | | 134,484 | | | | 129,254 | | | | 99,169 | | | | 88,979 | | | | 71,300 | | | | 62,990 | | | | 58,564 | | | | 51,421 | | | | 50,909 | | | | 19,017 | | | | 893,073 | |
| Contained Silver | | oz | | | - | | | | - | | | | 7,304,312 | | | | 5,499,841 | | | | 5,879,012 | | | | 4,231,639 | | | | 5,819,207 | | | | 4,760,506 | | | | 5,156,562 | | | | 5,043,036 | | | | 2,642,515 | | | | 3,284,946 | | | | 1,227,129 | | | | 50,848,704 | |
| | | | | | | | | | | | | | | | | | | | | | | | | | | | | | | | | | | | | | | | | | | | | | | | | | | | | | | | | | | |
| 2 Recoveries | | | | | | | | | | | | | | | | | | | | | | | | | | | | | | | | | | | | | | | | | | | | | | | | | | | | | | | | | | |
| Gold | | | | | | | | | | | | | 95.0 | % | | | 95.0 | % | | | 95.0 | % | | | 95.0 | % | | | 95.0 | % | | | 95.0 | % | | | 95.0 | % | | | 95.0 | % | | | 95.0 | % | | | 95.0 | % | | | 95.0 | % | | | | |
| Sliver | | | | | | | | | | | | | 93.0 | % | | | 93.0 | % | | | 93.0 | % | | | 93.0 | % | | | 93.0 | % | | | 93.0 | % | | | 93.0 | % | | | 93.0 | % | | | 93.0 | % | | | 93.0 | % | | | 93.0 | % | | | | |
| | | | | | | | | | | | | | | | | | | | | | | | | | | | | | | | | | | | | | | | | | | | | | | | | | | | | | | | | | | |
| 3 Production | | | | | | | | | | | | | | | | | | | | | | | | | | | | | | | | | | | | | | | | | | | | | | | | | | | | | | | | | | |
| Gold | | oz | | | | | | | | | | | 120,637 | | | | 127,760 | | | | 122,791 | | | | 94,211 | | | | 84,530 | | | | 67,735 | | | | 59,840 | | | | 55,636 | | | | 48,850 | | | | 48,364 | | | | 18,067 | | | | 848,420 | |
| Silver | | oz | | | | | | | | | | | 6,793,010 | | | | 5,114,852 | | | | 5,467,481 | | | | 3,935,424 | | | | 5,411,863 | | | | 4,427,270 | | | | 4,795,602 | | | | 4,690,023 | | | | 2,457,539 | | | | 3,055,000 | | | | 1,141,230 | | | | 47,289,295 | |
| Gold Equivalent | | oz | | | | | | | | | | | 256,497 | | | | 230,057 | | | | 232,140 | | | | 172,919 | | | | 192,768 | | | | 156,281 | | | | 155,752 | | | | 149,436 | | | | 98,001 | | | | 109,464 | | | | 40,891 | | | | 1,794,206 | |
| Silver Equivalent | | oz | | | | | | | | | | | 12,824,841 | | | | 11,502,836 | | | | 11,607,023 | | | | 8,645,953 | | | | 9,638,380 | | | | 7,814,033 | | | | 7,787,624 | | | | 7,471,809 | | | | 4,900,036 | | | | 5,473,186 | | | | 2,044,560 | | | | 89,710,281 | |
Table 123 Cash Flow Economical Model for 1,150 tpd option
Extorre Gold Mines Limited
Cerro Moro Gold – Silver Project
Preliminary Economic Assessment | Page 311 |
| (Continued) | | | | Year -2 | | | Year -1 | | | Year 1 | | | Year 2 | | | Year 3 | | | Year 4 | | | Year 5 | | | Year 6 | | | Year 7 | | | Year 8 | | | Year 9 | | | Year 10 | | | Year 11 | | | TOTAL | |
| 4 Prices | | | | | | | | | | | | | | | | | | | | | | | | | | | | | | | | | | | | | | | | | | | | | | | | | | | | | | | | | | |
| Gold | | US$/oz | | | 1320 | | | | 1320 | | | | 1320 | | | | 1320 | | | | 1320 | | | | 1320 | | | | 1320 | | | | 1320 | | | | 1320 | | | | 1320 | | | | 1320 | | | | 1320 | | | | 1320 | | | | | |
| Silver | | US$/oz | | | 26 | | | | 26 | | | | 26 | | | | 26 | | | | 26 | | | | 26 | | | | 26 | | | | 26 | | | | 26 | | | | 26 | | | | 26 | | | | 26 | | | | 26 | | | | | |
| | | | | | | | | | | | | | | | | | | | | | | | | | | | | | | | | | | | | | | | | | | | | | | | | | | | | | | | | | | |
| 5 Total revenue | | | | | | | | | | | | | | | | | | | | | | | | | | | | | | | | | | | | | | | | | | | | | | | | | | | | | | | | | | |
| Gold | | US$ | | | - | | | | - | | | | 159,240,329 | | | | 168,642,792 | | | | 162,083,894 | | | | 124,357,962 | | | | 111,580,060 | | | | 89,410,546 | | | | 78,989,384 | | | | 73,439,138 | | | | 64,481,908 | | | | 63,840,117 | | | | 23,847,913 | | | | 1,119,914,042 | |
| Silver | | US$ | | | - | | | | - | | | | 176,618,270 | | | | 132,986,148 | | | | 142,154,518 | | | | 102,321,031 | | | | 140,708,429 | | | | 115,109,025 | | | | 124,685,661 | | | | 121,940,607 | | | | 63,896,016 | | | | 79,429,991 | | | | 29,671,968 | | | | 1,229,521,664 | |
| Total Revenue | | US$ | | | - | | | | - | | | | 335,858,599 | | | | 301,628,940 | | | | 304,238,412 | | | | 226,678,993 | | | | 252,288,489 | | | | 204,519,571 | | | | 203,675,044 | | | | 195,379,746 | | | | 128,377,924 | | | | 143,270,108 | | | | 53,519,881 | | | | 2,349,435,706 | |
| Gold credit | | US$/oz | | | - | | | | - | | | | 23.44 | | | | 32.97 | | | | 29.65 | | | | 31.60 | | | | 20.62 | | | | 20.20 | | | | 16.47 | | | | 15.66 | | | | 26.24 | | | | 20.90 | | | | 20.90 | | | | 23.68 | |
| Silver credit | | US$/oz | | | - | | | | - | | | | 1,464.05 | | | | 1,040.91 | | | | 1,157.70 | | | | 1,086.09 | | | | 1,664.59 | | | | 1,699.40 | | | | 2,083.64 | | | | 2,191.77 | | | | 1,308.01 | | | | 1,642.35 | | | | 1,642.37 | | | | 1,449.19 | |
| | | | | | | | | | | | | | | | | | | | | | | | | | | | | | | | | | | | | | | | | | | | | | | | | | | | | | | | | | | |
| 6 Operating Costs | | | | | | | | | | | | | | | | | | | | | | | | | | | | | | | | | | | | | | | | | | | | | | | | | | | | | | | | | | |
| Mining | | US$ | | | | | | | | | | | 20,005,778 | | | | 33,971,718 | | | | 35,431,327 | | | | 34,003,211 | | | | 27,709,797 | | | | 23,958,861 | | | | 22,270,818 | | | | 19,518,341 | | | | 12,141,762 | | | | 553,280 | | | | 207,315 | | | | 229,772,208 | |
| Milling | | US$ | | | | | | | | | | | 24,726,705 | | | | 27,129,024 | | | | 30,345,239 | | | | 29,495,665 | | | | 31,761,324 | | | | 31,277,067 | | | | 31,463,899 | | | | 31,421,420 | | | | 30,274,498 | | | | 30,610,079 | | | | 11,434,710 | | | | 309,939,630 | |
| G&A | | US$ | | | | | | | | | | | 4,794,320 | | | | 6,316,420 | | | | 7,723,400 | | | | 7,723,400 | | | | 8,495,740 | | | | 8,495,740 | | | | 8,495,720 | | | | 8,495,720 | | | | 8,495,720 | | | | 8,495,720 | | | | 3,173,663 | | | | 80,705,563 | |
| Total Operating Cost | | US$ | | | | | | | | | | | 49,526,803 | | | | 67,417,162 | | | | 73,499,965 | | | | 71,222,276 | | | | 67,966,861 | | | | 63,731,668 | | | | 62,230,437 | | | | 59,435,481 | | | | 50,911,980 | | | | 39,659,079 | | | | 14,815,688 | | | | 620,417,402 | |
| Total Op erating Cost | | US$/t | | | | | | | | | | | 233.12 | | | | 207.13 | | | | 144.27 | | | | 117.95 | | | | 100.21 | | | | 131.60 | | | | 151.99 | | | | 158.02 | | | | 124.58 | | | | - | | | | - | | | | 153.75 | |
| | | | | | | | | | | | | | | | | | | | | | | | | | | | | | | | | | | | | | | | | | | | | | | | | | | | | | | | | | | |
| 7 Operating Cash Flow | | US$ | | | - | | | | - | | | | 286,331,796 | | | | 234,211,778 | | | | 230,738,447 | | | | 155,456,718 | | | | 184,321,627 | | | | 140,787,903 | | | | 141,444,607 | | | | 135,944,264 | | | | 77,465,943 | | | | 103,611,029 | | | | 38,704,193 | | | | 1,729,018,304 | |
| | | | | | | | | | | | | | | | | | | | | | | | | | | | | | | | | | | | | | | | | | | | | | | | | | | | | | | | | | | |
| 8 Cash Cost | | | | | | | | | | | | | | | | | | | | | | | | | | | | | | | | | | | | | | | | | | | | | | | | | | | | | | | | | | |
| Cash cost wo/ credit (gold) | | US$/oz | | | - | | | | - | | | | 410.55 | | | | 527.69 | | | | 598.58 | | | | 755.99 | | | | 804.05 | | | | 940.89 | | | | 1,039.94 | | | | 1,068.30 | | | | 1,042.21 | | | | 820.02 | | | | 820.06 | | | | 731.26 | |
| Cash cost w/ credit (gold) | | US$/oz | | | - | | | | - | | | | 1,053.51 | | | | 513.22 | | | | 559.12 | | | | 330.10 | | | | 860.54 | | | | 758.50 | | | | 1,043.70 | | | | 1,123.47 | | | | 265.79 | | | | 822.33 | | | | 822.31 | | | | 717.93 | |
| Cash cost (gold equivalent) | | US$/oz | | | - | | | | - | | | | 193.09 | | | | 293.05 | | | | 316.62 | | | | 411.88 | | | | 352.58 | | | | 407.80 | | | | 399.55 | | | | 397.73 | | | | 519.51 | | | | 362.30 | | | | 362.32 | | | | 345.79 | |
| Cash cost wo/ credit (silver) | | US$/oz | | | - | | | | - | | | | 7.29 | | | | 13.18 | | | | 13.44 | | | | 18.10 | | | | 12.56 | | | | 14.40 | | | | 12.98 | | | | 12.67 | | | | 20.72 | | | | 12.98 | | | | 12.98 | | | | 13.12 | |
| Cash cost w/ credit (silver) | | US$/oz | | | - | | | | - | | | | 16.15 | | | | 19.79 | | | | 16.20 | | | | 13.50 | | | | 8.06 | | | | 5.80 | | | | 3.49 | | | | 2.99 | | | | 5.52 | | | | 7.92 | | | | 7.91 | | | | 10.56 | |
| Cash cost (silver equivalent) | | US$/oz | | | - | | | | - | | | | 3.86 | | | | 5.86 | | | | 6.33 | | | | 8.24 | | | | 7.05 | | | | 8.16 | | | | 7.99 | | | | 7.95 | | | | 10.39 | | | | 7.25 | | | | 7.25 | | | | 6.92 | |
| | | | | | | | | | | | | | | | | | | | | | | | | | | | | | | | | | | | | | | | | | | | | | | | | | | | | | | | | | | |
| 9 Refining + transport + insurance | | | | | | | | | | | | | | | | | | | | | | | | | | | | | | | | | | | | | | | | | | | | | | | | | | | | | | | | | | |
| Gold | | US$ | | | - | | | | - | | | | 1,206,366 | | | | 1,277,597 | | | | 1,227,908 | | | | 942,106 | | | | 845,303 | | | | 677,353 | | | | 598,404 | | | | 556,357 | | | | 488,499 | | | | 483,637 | | | | 180,666 | | | | 8,484,197 | |
| Silver | | US$ | | | - | | | | - | | | | 3,396,505 | | | | 2,557,426 | | | | 2,733,741 | | | | 1,967,712 | | | | 2,705,931 | | | | 2,213,635 | | | | 2,397,801 | | | | 2,345,012 | | | | 1,228,770 | | | | 1,527,500 | | | | 570,615 | | | | 23,644,647 | |
| Total Refining | | US$ | | | - | | | | - | | | | 4,602,871 | | | | 3,835,023 | | | | 3,961,649 | | | | 2,909,818 | | | | 3,551,235 | | | | 2,890,988 | | | | 2,996,206 | | | | 2,901,369 | | | | 1,717,269 | | | | 2,011,137 | | | | 751,281 | | | | 32,128,845 | |
| | | | | | | | | | | | | | | | | | | | | | | | | | | | | | | | | | | | | | | | | | | | | | | | | | | | | | | | | | | |
| 10 Royalties | | | | | | | | | | | | | | | | | | | | | | | | | | | | | | | | | | | | | | | | | | | | | | | | | | | | | | | | | | |
| Export tax (5% of total revenue) | | US$ | | | - | | | | - | | | | 16,792,930 | | | | 15,081,447 | | | | 15,211,921 | | | | 11,333,950 | | | | 12,614,424 | | | | 10,225,979 | | | | 10,183,752 | | | | 9,768,987 | | | | 6,418,896 | | | | 7,163,505 | | | | 2,675,994 | | | | 117,471,785 | |
| NSR CVSA (2% of Total Revenue Less Refining | | | | | | | | | | | | | | | | | | | | | | | | | | | | | | | | | | | | | | | | | | | | | | | | | | | | | | | | | | |
| Costs) | | US$ | | | - | | | | - | | | | 6,625,115 | | | | 5,955,878 | | | | 6,005,535 | | | | 4,475,384 | | | | 4,974,745 | | | | 4,032,572 | | | | 4,013,577 | | | | 3,849,568 | | | | 2,533,213 | | | | 2,825,179 | | | | 1,055,372 | | | | 46,346,137 | |
| | | | | | | | | | | | | | | | | | | | | | | | | | | | | | | | | | | | | | | | | | | | | | | | | | | | | | | | | | |
| Boca Mina Tax (3% of Operating Profit) | | US$ | | | - | | | | - | | | | 7,887,413 | | | | 6,395,234 | | | | 6,285,630 | | | | 4,189,422 | | | | 5,001,974 | | | | 3,795,881 | | | | 3,817,418 | | | | 3,669,771 | | | | 2,055,415 | | | | 2,808,670 | | | | 1,049,185 | | | | 46,956,011 | |
| New Provincial Royalty (1% of total revenue) | | US$ | | | - | | | | - | | | | 3,358,586 | | | | 3,016,289 | | | | 3,042,384 | | | | 2,266,790 | | | | 2,522,885 | | | | 2,045,196 | | | | 2,036,750 | | | | 1,953,797 | | | | 1,283,779 | | | | 1,432,701 | | | | 535,199 | | | | 23,494,357 | |
| Total Royalties | | US$ | | | - | | | | - | | | | 34,664,043 | | | | 30,448,848 | | | | 30,545,470 | | | | 22,265,545 | | | | 25,114,028 | | | | 20,099,626 | | | | 20,051,498 | | | | 19,242,124 | | | | 12,291,304 | | | | 14,230,056 | | | | 5,315,750 | | | | 234,268,291 | |
Extorre Gold Mines Limited
Cerro Moro Gold – Silver Project
Preliminary Economic Assessment | Page 312 |
| (Continued) | | | | Year -2 | | | Year -1 | | | Year 1 | | | Year 2 | | | Year 3 | | | Year 4 | | | Year 5 | | | Year 6 | | | Year 7 | | | Year 8 | | | Year 9 | | | Year 10 | | | Year 11 | | | TOTAL | |
| 11 Net Revenue | | US$ | | | - | | | | - | | | | 296,591,685 | | | | 267,345,068 | | | | 269,731,293 | | | | 201,503,631 | | | | 223,623,226 | | | | 181,528,957 | | | | 180,627,341 | | | | 173,236,253 | | | | 114,369,351 | | | | 127,028,915 | | | | 47,452,851 | | | | 2,083,038,570 | |
| | | | | | | | | | | | | | | | | | | | | | | | | | | | | | | | | | | | | | | | | | | | | | | | | | | | | | | | | | | |
| 12 Total cost per ounce, including refining & royalty | | | | | | | | | | | | | | | | | | | | | | | | | | | | | | | | | | | | | | | | | | | | | | | | | | | | | | | | | | |
| Total cost per ounce, including refining & royalty (wo/ credit) (gold) | | US$/oz | | | - | | | | - | | | | 736.04 | | | | 796.03 | | | | 879.60 | | | | 1,023.21 | | | | 1,143.16 | | | | 1,280.31 | | | | 1,425.09 | | | | 1,466.31 | | | | 1,328.98 | | | | 1,155.83 | | | | 1,155.87 | | | | 1,045.25 | |
| Total cost per ounce, including refining & royalty (w/ credit) (gold) | | US$/oz | | | - | | | | - | | | | 728.01 | | | | 244.87 | | | | 278.09 | | | | 62.87 | | | | 521.43 | | | | 419.08 | | | | 658.54 | | | | 725.46 | | | | 20.97 | | | | 486.52 | | | | 486.49 | | | | 403.94 | |
| Total cost pe ounce, r including refining & royalty (gold equivalent) | | US$/oz | | | - | | | | - | | | | 346.18 | | | | 442.07 | | | | 465.27 | | | | 557.47 | | | | 501.29 | | | | 554.91 | | | | 547.52 | | | | 545.91 | | | | 662.45 | | | | 510.67 | | | | 510.69 | | | | 494.27 | |
| Total cost per ounce, including refining & royalty (wo/ credit) (silver) | | US$/oz | | | - | | | | - | | | | 13.07 | | | | 19.88 | | | | 19.75 | | | | 24.49 | | | | 17.86 | | | | 19.59 | | | | 17.78 | | | | 17.39 | | | | 26.42 | | | | 18.30 | | | | 18.30 | | | | 18.75 | |
| Total cost per ounce, including refining & royalty (w/ credit) (silver) | | US$/oz | | | - | | | | - | | | | 10.37 | | | | 13.09 | | | | 9.89 | | | | 7.10 | | | | 2.76 | | | | 0.61 | | | | 1.31 | | | | 1.74 | | | | 0.18 | | | | 2.60 | | | | 2.60 | | | | 4.93 | |
| Total cost per ounce, including refining & royalty (silver equivalent) | | US$/oz | | | - | | | | - | | | | 6.92 | | | | 8.84 | | | | 9.31 | | | | 11.15 | | | | 10.03 | | | | 11.10 | | | | 10.95 | | | | 10.92 | | | | 13.25 | | | | 10.21 | | | | 10.21 | | | | 9.89 | |
| | | | | | | | | | | | | | | | | | | | | | | | | | | | | | | | | | | | | | | | | | | | | | | | | | | | | | | | | | | |
| 13 Total Gross Margin | | US$ | | | - | | | | - | | | | 247,064,882 | | | | 199,927,907 | | | | 196,231,328 | | | | 130,281,355 | | | | 155,656,364 | | | | 117,797,288 | | | | 118,396,904 | | | | 113,800,772 | | | | 63,457,371 | | | | 87,369,836 | | | | 32,637,163 | | | | 1,462,621,169 | |
| | | | | | | | | | | | | | | | | | | | | | | | | | | | | | | | | | | | | | | | | | | | | | | | | | | | | | | | | | | |
| 14 Reclamation | | US$ | | | | | | | | | | | 1,000,000 | | | | 1,000,000 | | | | 1,000,000 | | | | 1,000,000 | | | | 1,000,000 | | | | 1,000,000 | | | | 1,000,000 | | | | 1,000,000 | | | | | | | | | | | | | | | | 8,000,000 | |
| | | | | | | | | | | | | | | | | | | | | | | | | | | | | | | | | | | | | | | | | | | | | | | | | | | | | | | | | | | |
| 15 EBITDA | | US$ | | | - | | | | - | | | �� | 246,064,882 | | | | 198,927,907 | | | | 195,231,328 | | | | 129,281,355 | | | | 154,656,364 | | | | 116,797,288 | | | | 117,396,904 | | | | 112,800,772 | | | | 63,457,371 | | | | 87,369,836 | | | | 32,637,163 | | | | 1,454,621,169 | |
| | | | | | | | | | | | | | | | | | | | | | | | | | | | | | | | | | | | | | | | | | | | | | | | | | | | | | | | | | | |
| 16 Depreciation & Amortization | | US$ | | | - | | | | 10,597,278 | | | | 128,483,575 | | | | 69,922,681 | | | | 80,655,511 | | | | 29,931,797 | | | | 29,066,712 | | | | 13,879,414 | | | | 7,290,233 | | | | 5,680,939 | | | | 2,063,913 | | | | - | | | | - | | | | 377,572,054 | |
| (see capex sheet) | | | | | | | | | | | | | | | | | | | | | | | | | | | | | | | | | | | | | | | | | | | | | | | | | | | | | | | | | | |
| 17 EBIT | | US$ | | | - | | | | 10,597,278 | | | | 117,581,306 | | | | 129,005,225 | | | | 114,575,817 | | | | 99,349,558 | | | | 125,589,653 | | | | 102,917,874 | | | | 110,106,670 | | | | 107,119,833 | | | | 61,393,458 | | | | 87,369,836 | | | | 32,637,163 | | | | 1,077,049,115 | |
| | | | | | | | | | | | | | | | | | | | | | | | | | | | | | | | | | | | | | | | | | | | | | | | | | | | | | | | | | | |
| 18 Interests on debt | | US$ | | | - | | | | - | | | | - | | | | - | | | | - | | | | - | | | | - | | | | - | | | | - | | | | - | | | | - | | | | - | | | | - | | | | - | |
| | | | | | | | | | | | | | | | | | | | | | | | | | | | | | | | | | | | | | | | | | | | | | | | | | | | | | | | | | | |
| 19 EBT | | US$ | | | - | | | | 10,597,278 | | | | 117,581,306 | | | | 129,005,225 | | | | 114,575,817 | | | | 99,349,558 | | | | 125,589,653 | | | | 102,917,874 | | | | 110,106,670 | | | | 107,119,833 | | | | 61,393,458 | | | | 87,369,836 | | | | 32,637,163 | | | | 1,077,049,115 | |
| | | | | | | | | | | | | | | | | | | | | | | | | | | | | | | | | | | | | | | | | | | | | | | | | | | | | | | | | | | |
| 20 Taxes (35%) | | US$ | | | - | | | | - | | | | 41,153,457 | | | | 45,151,829 | | | | 40,101,536 | | | | 34,772,345 | | | | 43,956,378 | | | | 36,021,256 | | | | 38,537,335 | | | | 37,491,941 | | | | 21,487,710 | | | | 30,579,443 | | | | 11,423,007 | | | | 380,676,238 | |
| | | | | | | | | | | | | | | | | | | | | | | | | | | | | | | | | | | | | | | | | | | | | | | | | | | | | | | | | | | |
| 21 Net Earnings | | US$ | | | - | | | | 10,597,278 | | | | 76,427,849 | | | | 83,853,396 | | | | 74,474,281 | | | | 64,577,213 | | | | 81,633,274 | | | | 66,896,618 | | | | 71,569,336 | | | | 69,627,891 | | | | 39,905,748 | | | | 56,790,393 | | | | 21,214,156 | | | | 696,372,878 | |
| | | | | | | | | | | | | | | | | | | | | | | | | | | | | | | | | | | | | | | | | | | | | | | | | | | | | | | | | | | |
| 22 CASH FLOW | | US$ | | | - | | | | - | | | | 204,911,424 | | | | 153,776,078 | | | | 155,129,792 | | | | 94,509,010 | | | | 110,699,986 | | | | 80,776,032 | | | | 78,859,569 | | | | 75,308,830 | | | | 41,969,660 | | | | 56,790,393 | | | | 21,214,156 | | | | 1,073,944,931 | |
| | | | | | | | | | | | | | | | | | | | | | | | | | | | | | | | | | | | | | | | | | | | | | | | | | | | | | | | | | | |
| 23 Net Capex | | | | | | | | | | | | | | | | | | | | | | | | | | | | | | | | | | | | | | | | | | | | | | | | | | | | | | | | | | |
| Capex | | US$ | | | 17,662,130 | | | | 208,251,916 | | | | | | | | | | | | | | | | | | | | | | | | | | | | | | | | | | | | | | | | | | | | | | | | 225,914,046 | |
| VAT | | US$ | | | 1,547,630 | | | | 29,224,171 | | | | 30,771,802 | | | | | | | | | | | | | | | | | | | | | | | | | | | | | | | | | | | | | | | | | | | | | |
| Sustaining / Closure | | US$ | | | | | | | | | | | 43,374,579 | | | | 56,003,205 | | | | 19,437,485 | | | | 26,084,763 | | | | 6,987,530 | | | | 1,000,000 | | | | 7,434,672 | | | | 1,000,000 | | | | 5,500,000 | | | | - | | | | - | | | | 166,822,235 | |
| Total Capex | | US$ | | | 19,209,760 | | | | 237,476,087 | | | | 12,602,777 | | | | 56,003,205 | | | | 19,437,485 | | | | 26,084,763 | | | | 6,987,530 | | | | 1,000,000 | | | | 7,434,672 | | | | 1,000,000 | | | | 5,500,000 | | | | - | | | | - | | | | 392,736,280 | |
Extorre Gold Mines Limited
Cerro Moro Gold – Silver Project
Preliminary Economic Assessment | Page 313 |
| (Continued) | | | | Year -2 | | | Year -1 | | | Year 1 | | | Year 2 | | | Year 3 | | | Year 4 | | | Year 5 | | | Year 6 | | | Year 7 | | | Year 8 | | | Year 9 | | | Year 10 | | | Year 11 | | | TOTAL | |
| | | | | | | | | | | | | | | | | | | | | | | | | | | | | | | | | | | | | | | | | | | | | | | | | | | | | | | | | | | |
| 24 Total cost per ounce, including capex | | | | | | | | | | | | | | | | | | | | | | | | | | | | | | | | | | | | | | | | | | | | | | | | | | | | | | | | | | |
| Total cost per ounce, including capex (wo/ credit) (gold) | | US$/oz | | | - | | | | - | | | | 840.51 | | | | 1,234.38 | | | | 1,037.90 | | | | 1,300.09 | | | | 1,225.83 | | | | 1,295.08 | | | | 1,549.33 | | | | 1,484.28 | | | | 1,441.57 | | | | 1,155.83 | | | | 1,155.87 | | | | 1,508.16 | |
| Total cost per ounce, including capex (w/ credit) (gold) | | US$/oz | | | - | | | | - | | | | 623.54 | | | | 193.47 | | | | 119.80 | | | | 214.00 | | | | 438.76 | | | | 404.32 | | | | 534.30 | | | | 707.49 | | | | 133.56 | | | | 486.52 | | | | 486.49 | | | | 58.97 | |
| Total cost per ounce, including refining & royalty (gold equivalent) | | US$/oz | | | - | | | | - | | | | 395.31 | | | | 685.50 | | | | 549.00 | | | | 708.32 | | | | 537.54 | | | | 561.31 | | | | 595.26 | | | | 552.60 | | | | 718.57 | | | | 510.67 | | | | 510.69 | | | | 713.16 | |
| | | | | | | | | | | | | | | | | | | | | | | | | | | | | | | | | | | | | | | | | | | | | | | | | | | | | | | | | | | |
| 25 Net Free Cash Flow (yearly & cumulative) | | | | | | | | | | | | | | | | | | | | | | | | | | | | | | | | | | | | | | | | | | | | | | | | | | | | | | | | | | |
| Net Free Cash Flow | | US$ | | | (19,209,760 | ) | | | (237,476,087 | ) | | | 192,308,647 | | | | 97,772,872 | | | | 135,692,307 | | | | 68,424,247 | | | | 103,712,456 | | | | 79,776,032 | | | | 71,424,897 | | | | 74,308,830 | | | | 36,469,660 | | | | 56,790,393 | | | | 21,214,156 | | | | 681,208,651 | |
| Cumulative | | US$ | | | (19,209,760 | ) | | | (256,685,847 | ) | | | (64,377,200 | ) | | | 33,395,672 | | | | 169,087,979 | | | | 237,512,226 | | | | 341,224,682 | | | | 421,000,714 | | | | 492,425,611 | | | | 566,734,442 | | | | 603,204,102 | | | | 659,994,495 | | | | 681,208,651 | | | | | |
| 26 Net Present Value (NPV) | | | | | | | | | | 27 Payback (years) |
| | | 5 | % | | $ | 453,805,059 | | | 1.84 |
| | | 10 | % | | $ | 306,817,768 | | | 2.03 |
Extorre Gold Mines Limited
Cerro Moro Gold – Silver Project
Preliminary Economic Assessment | Page 314 |
The Project’s sensitivity to changes in revenue, operating costs, capital costs and discount rate was tested with the following observations (Table 124 through Table 126 for 1,300 tpd option and Table 127 through Table 129 for 1,150 tpd option). Note that all figures given in the following tables are after tax.
| § | When the gold price was increased to a constant US$ 1,584 per ounce gold (+20%), NPV after tax at a 5% discount rate increases by US$ 97 million to US$ 560 million and the IRR increases from 47% to 54% for the 1,300 tpd option. |
| § | In none of the analysed cases the Project NPV became negative. The lowest obtained value was US$ 198 million for the combination of US$ 1,056 per ounce gold and 10% discount rate for the 1,150 tpd option. |
Gold Price &
Discount Rate | | | Gold Price (US$/oz) | |
| | | | | | | | 1,056 | | | | 1,320 | | | | 1,584 | |
| Discount | | | 5.0 | % | | $ | 366.3M | | | $ | 463.2M | | | $ | 560.1M | |
| Rate | | | 10.0 | % | | $ | 246.0M | | | $ | 320.1M | | | $ | 394.2M | |
| IRR (%) | | | | | | | 39 | % | | | 47 | % | | | 54 | % |
Table 124 Sensitivity – Gold Price and Discount Rate (1,300 tpd option)
|
| NPV (M$) | |
Gold Price &
Operating Cost | | | Gold Price (US$/oz) | |
| | | | | | | | 1,056 | | | | 1,320 | | | | 1,584 | |
| | | -20 | % | | $ | 439.1M | | | $ | 537.0M | | | $ | 635.0M | |
| Opertaing Cost | | | Base Case | | | $ | 366.3M | | | $ | 463.2M | | | $ | 560.1M | |
| | | | +20 | % | | $ | 325.1M | | | $ | 423.1M | | | $ | 521.1M | |
Table 125 Sensitivity – Gold Price and Operating Cost (1,300 tpd option)
|
| NPV (M$) | |
Gold Price &
Capital Cost | | | Gold Price (US$/oz) | |
| | | | | | | | 1,056 | | | | 1,320 | | | | 1,584 | |
| | | -20 | % | | $ | 415.5M | | | $ | 512.4M | | | $ | 609.3M | |
| Capital Cost | | | Base Case | | | $ | 366.3M | | | $ | 463.2M | | | $ | 560.1M | |
| | | | +20 | % | | $ | 319.0M | | | $ | 415.9M | | | $ | 512.8M | |
Table 126 Sensitivity – Gold Price and Capital Cost (1,300 tpd option)
Extorre Gold Mines Limited
Cerro Moro Gold – Silver Project
Preliminary Economic Assessment | Page 315 |
|
| NPV (M$) | |
Gold Price &
Discount Rate | | Gold Price (US$/oz) | |
| | | | | | | | 1,056 | | | | 1,320 | | | | 1,584 | |
| Discount | | | 5.0 | % | | $ | 292.2M | | | $ | 453.8M | | | $ | 470.7M | |
| Rate | | | 10.0 | % | | $ | 197.6M | | | $ | 306.8M | | | $ | 334.2M | |
| IRR (%) | | | | | | | 38 | % | | | 47 | % | | | 55 | % |
Table 127 Sensitivity – Gold Price and Discount Rate (1,150 tpd option)
|
| NPV (M$) | |
Gold Price &
Operating Cost | | | Gold Price (US$/oz) | |
| | | | | | | | 1,056 | | | | 1,320 | | | | 1,584 | |
| | | -20 | % | | $ | 388.2M | | | $ | 540.9M | | | $ | 568.7M | |
| Opertaing Cost | | | Base Case | | | $ | 292.2M | | | $ | 453.8M | | | $ | 470.7M | |
| | | | +20 | % | | $ | 285.6M | | | $ | 438.3M | | | $ | 466.1M | |
Table 128 Sensitivity – Gold Price and Operating Cost (1,150 tpd option)
|
| NPV (M$) | |
Gold Price &
Capital Cost | | | Gold Price (US$/oz) | |
| | | | | | | | 1,056 | | | | 1,320 | | | | 1,584 | |
| | | -20 | % | | $ | 369.8M | | | $ | 459.0M | | | $ | 526.5M | |
| Capital Cost | | | Base Case | | | $ | 292.2M | | | $ | 453.8M | | | $ | 470.7M | |
| | | | +20 | % | | $ | 275.4M | | | $ | 364.6M | | | $ | 424.4M | |
Table 129 Sensitivity – Gold Price and Capital Cost (1,150 tpd option)
Extorre Gold Mines Limited
Cerro Moro Gold – Silver Project
Preliminary Economic Assessment | Page 316 |
All relevant adjacent properties are within the current Extorre-Formicruz agreement area. All previous exploration results from within the Formicruz properties are publicly available through various disclosures by Extorre. There are no known published mineral resources within the Formicruz properties. There are no other known relevant adjacent properties to the Project outside of the Formicruz properties.
On March 3, 2009, Exeter and Fomicruz, the Santa Cruz provincial mining development agency, signed a definitive agreement over ten Fomicruz concessions, covering 69,100 ha (691.0 km2), adjacent to Cerro Moro. Under the terms of the agreement, Exeter (now Extorre) has the option to acquire an 80% interest in the Fomicruz properties by spending US$10 Million on exploration over a number of years. As part of this agreement, Fomicruz will acquire a 5% participation interest in Exeter´s Project on the granting of the required exploitation concessions and permits to commence a mining operation. Extorre will manage and fund future exploration and development on both the Cerro Moro and Fomicruz concessions. Fomicruz will repay an agreed amount of its attributable exploration and development costs from the 50% of its share of the net revenue from future mining operations.
As indicated in Figure 112 the Fomicruz properties border the south-western, southern and south-eastern portions of the Cerro Moro property.
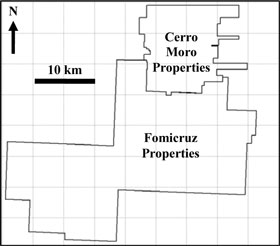
Figure 112 Fomicruz Properties Location (Source: Exeter, 2009a)
Fomicruz is a provincial state entity and is not required to publicly release any results from their properties and, as far as the author is aware, they have not done so. Previous work on the property by Fomicruz is limited to preliminary minor geological mapping and rock chip sampling of selected veins.
Extorre Gold Mines Limited
Cerro Moro Gold – Silver Project
Preliminary Economic Assessment | Page 317 |
Preliminary reconnaissance exploration commenced during 2009 on the Fomicruz properties, working from the north to the south. The exploration methodology has been threefold:
| 1. | Regional stream sediment sampling, involving the collection of; |
| i. | An approximate 3 kilogram BLEG6sample, -2mm to 5 mm size fraction. |
| ii. | An approximate 500 g of 2 mm to 4 mm size fraction. |
| iii. | Approximately 500 g of -2 mm size fraction |
During this program the geology, structure and any alteration is mapped at a scale of 1:25,000, along with rock chip sampling of any potentially or obviously mineralized structures.
| 2. | Ground magnetic data collection - Exeter purchased two GEM 19 Overhauser Magnetometers for this task; a base station and a ‘walking’ magnetometer. The walking magnetometer is fitted with a GPS and was set to take readings every 2 seconds. As detailed in Williams and Perkins (2009) the majority of the Project was covered by either 40 metre or 80 metre spaced lines. This surveying is now being extended on to the Fomicruz tenements. The data will be used to assist with geological mapping, the identification of major structures (particularly those under cover), with the principal aim of identifying potential mineralized structures. |
| 3. | The current third phase is follow-up of any anomalous sampling results (stream sediment sampling or rock chip results) with more detailed mapping and the collection of additional rock chip samples. Follow-up drill testing of defined target areas on a priority basis. |
To May 31, 2011, a total of 61 drill holes for 12,383,50 m had been completed on the Fomicruz Properties in four principal targets – Escondida Fomicruz, Bella Vista, Veta Olvidada, and Union Domes (Table 130). Drilling in 2011 was restricted to the Union Domes target area and select drilling on the Escondida Fomicruz area.
6 BLEG = Bulk Leach Extractable Gold – utilizes cyanide leach procedures for the extraction of gold, which are often used in grassroots exploration where cyanide extractable gold from a very large sample can sometimes detect small gold anomalies that otherwise would go undetected.
Extorre Gold Mines Limited
Cerro Moro Gold – Silver Project
Preliminary Economic Assessment | Page 318 |
| Drilling Program | | Prospect | | Holes | | | RC (m) | | | DDH (m) | | | Total (m) | | | % | |
| MINERALIZATION | | Escondida Fomicruz | | | 42 | | | | 1,212.00 | | | | 8,428.9 | | | | 9,640.90 | | | | 78 | % |
| | Bella Vista | | | 9 | | | | 430.00 | | | | 883.40 | | | | 1,313.40 | | | | 11 | % |
| | Veta Olvidada | | | 1 | | | | 0.00 | | | | 190.00 | | | | 190.00 | | | | 1 | % |
| | Union Domes | | | 9 | | | | 0.00 | | | | 1,239.20 | | | | 1,239.20 | | | | 10 | % |
| Total | | | | | 61 | | | | 1,642.00 | | | | 10,741.50 | | | | 12,383.50 | | | | 100 | % |
Table 130 Drilling Completed in Fomicruz Properties (Source: Extorre, 2011)
| 23.1 | Escondida-Formicruz Prospect |
The Cerro Moro Escondida mineralized structure trends northwest into the Fomicruz property and is clearly evident in the ground magnetic data to trend for an additional 2 km (refer to Figure 114).
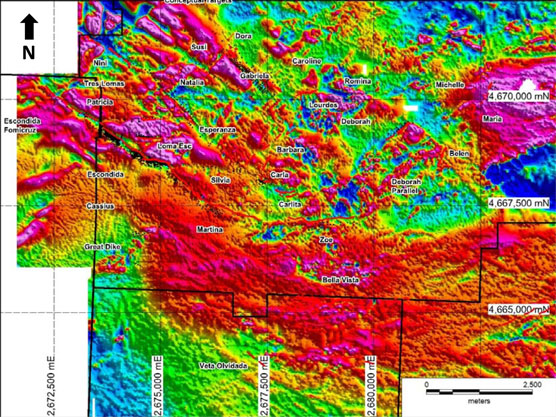
Figure 113 Drilling Completed at Escondida (Fomicruz Extension), Bella Vista, and Veta Olvidada with Ground Magnetic Data (RTP) (Source:Extorre, 2011)
Extorre Gold Mines Limited
Cerro Moro Gold – Silver Project
Preliminary Economic Assessment | Page 319 |
The majority of the Escondida-Fomicruz structure is under cover and as such does not outcrop. Initial exploration (scout) drilling along the Escondida-Fomicruz structure was undertaken with RC percussion holes on sections spaced 160 m apart. The main objective of this drilling was to locate the trace of the Escondida-Fomicruz structure under the Tertiary marine sediment cover. Evaluation of the geochemical data obtained from this initial drill campaign led to the design of the follow-up drill program, in which nine diamond drill holes were completed on five sections. The target depth for these nine holes was 150 m below surface; all holes encountered hydrothermal alteration (silicification and illite-smectite) but returned low precious metal values. Follow-up work is being undertaken to determine whether the drilling completed to date was targeted too close to surface (i.e. potential for economic mineralization may still exist below 150 m vertically below surface).
Recent drilling on the Escondida-Fomicruz structure has been focused on diamond drilling at the southerneastern end of the structure (essentially western extensions to the Escondida Far West mineralized zone). Significant results have been reported from drilling in this area.
The locations of drill holes in the Escondida-Fomicruz structure are indicated in Figure 114.
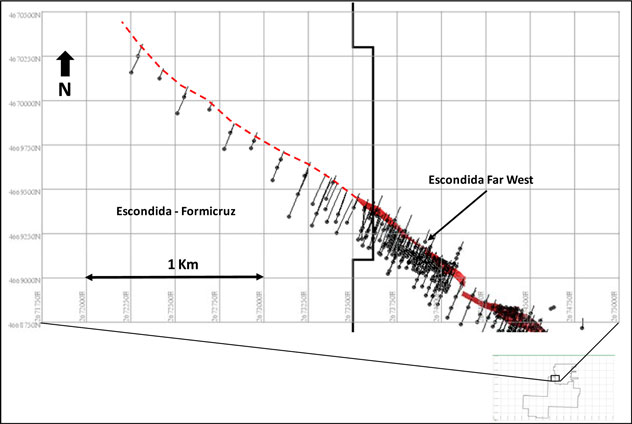
Figure 114 Escondida-Fomicruz Prospect – Drill Hole Locations (Source: Cube 2011)
The Bella Vista prospect is a 4 kilometre long, predominantly east-west striking, structure, consisting of fault breccia, chalcedonic cement, and local black silica with fine grained sulphides (Figure 113).
Extorre Gold Mines Limited
Cerro Moro Gold – Silver Project
Preliminary Economic Assessment | Page 320 |
Surface expressions of the main structure are anomalous in gold (up to 2.6 g/t), silver (up to 30 g/t), molybdenum (up to 350 ppm), arsenic, mercury, lead and zinc. It also has a moderate to subtle signature in the ground magnetic data and the one trial MT survey line. Located approximately 300 m to the south of this prospect is another structure represented by poor outcropping quartz/breccia outcrop, and interpreted to trend parallel to Bella Vista. Reconnaissance rock chip sampling of this area encountered gold grades up to 7.6 g/t Au.
As a first test of the Bella Vista prospect, three RC percussion drill holes and six diamond drill holes were drilled during September 2009 and April 2010, respectively. No significant results were returned from the initial RC percussion drilling. The April 2010 diamond drilling was focused on those portions of the Bella Vista vein system with significant surface geochemical anomalies, with drilling designed to intersect gold-silver mineralization at approximately 100 m depth below surface. This drilling succeeded in intersecting the Bella Vista structure and quartz veining; however, no potentially economic grades were encountered.
| 23.3 | Veta Olvidada Prospect |
The Veta Olvidada is a narrow, northwest-trending vein / structure located approximately 1 km south of the Bella Vista vein. On surface, the Veta Olvidada is characterized by chalcedonic quartz with very low sulfide content and low precious metal contents (but highly anomalous trace element geochemistry). Alteration on the host rocks is domintantly illite and smectite. Only one diamond drill hole was drilled in to the central portion of Veta Olvidada (Figure 113), with only low level gold and silver values being reported.
Preliminary geological mapping and a first pass reconnaissance drill program have indicated that gold(-silver) mineralization at the Union Domes prospect, located approximately 13 km south of the Escondida structure at Cerro Moro, is associated with a shallow northwards-dipping tectonic breccia. Host rocks to the mineralization are shallowly dipping (to the south – southeast) felsic tuffs of the Matilde Formation and minor carbonaceous epiclastics. The La Matilde Formation has been locally intruded by a fine grained rhyolitic sill. A total of 9 drill holes for 1,239.20 m were completed in late March 2011 at Union Domes.
Extorre Gold Mines Limited
Cerro Moro Gold – Silver Project
Preliminary Economic Assessment | Page 321 |
Ausenco undertook preliminary geotechnical investigations in the area of the proposed process plant site in order to assist with the future design of foundations. Three test pits and four bore holes were used for the study. In general, the area proposed for the process plant contains topsoil to 40 cm and supports low growing shrubs. At the bottom of the valley to the east of the proposed ROM pad location, a very wet clay layer (starting at 0.80m and extending to 1.80m below surface) underlies a surficial layer of silty sand. Beneath the clay layer there is weathered sedimentary rock sandstone that breaks very easily and which reaches a depth of 3.20m.
In the central portion of the valley, the topsoil overlies a hard layer of sedimentary rock (which limits excavation to 1.4 m in depth). In the upper portion of the valley, the topsoil overlies a silty sand layer that extends from 0.40 to 0.70m in depth, and which in turn overlies a weathered sedimentary rock of medium hardness that could be excavated by backhoe to a depth of 1.70m.
For the process plant foundation design all major foundations will require box cut to rock and backfill with suitably compacted engineered fill to provide satisfactory founding of concrete footings. Area slabs and general footings will be founded on gravel hardstands placed over the existing material once top soil has been removed.
| 24.2 | Operations Project Organisation |
A total of 520 are expected tol be employed for the Project, distributed as follows:
| �� | General Management and Administration | 80 |
| § | Process Plant | 68 |
| § | Mining Department | 372 |
| § | Total | 520 |
The General Manager will be responsible for the entire operation. The area managers, Environmental Coordinator and safety engineer will report directly to him.
The mining department will be led by the Mine Manager who needs to be a fully qualified graduate engineer with 20 years of experience for open pit and underground operations including mine planning and maintenance.
The Mine Manager needs to be hired 3 – 6 months before the start of the mining operations so that he can be involved with the hiring process for the operators and maintenance people plus be involved with the preparation of the training program.
In addition to the Mine Manager, there are four other key people for the other areas of the mining operation for maintenance, mine engineering and planning, geology. The senior people for these positions will require 15 – 20 years of experience and need to be hired two months before the start of the mine operations.
Extorre Gold Mines Limited
Cerro Moro Gold – Silver Project
Preliminary Economic Assessment | Page 322 |
The process group will be led by the Process Manager who will report to the General Manager. The Process Manager will require being an engineer with 10 – 15 years of process experience including a minimum of five years of experience senior supervisory with gold processing plants. This person will need to be hired about six months before the start-up of the process plant and be involved with the hiring of his team plus the development of the training program.
The Administration Manger will be responsible for accounting and cost control, human resources, site security, and procurement. This person will need to have 5 – 10 years of experience with mining operations. He will need to be hired about six months before start-up.
The Environmental Coordinator will report to the General Manager. This person will need to be a university graduate and have five years of experience with environmental control, and legal and governmental procedures. This person needs to be hired one month before the start of the mining operations.
The Safety Coordinator will report to the General Manager. This person will be a safety engineer with 5 – 10 years of experience with construction and mining operations and will be responsible for implementing the zero accident safety policies plus training.
Contractors will provide services for cleaning the offices and dry, security, waste removal (organic, hazardous and non hazardous), exploration drilling, and transportation of people and gold.
| 24.3 | Project Implementation |
The Project will be implemented under two main banners:
| § | Client managed open pit and underground mining design, mining equipment and infrastructure procurement and mining implementation; |
| § | Engineering Procurement and Construction Management (EPCM) contract for the design and construction management of the process plant and infrastructure; |
The complete Project will be managed by a Clients Representative who will report to Extorre.
| 24.3.1 | Mine Management Team |
The mine design and implementation will be managed by the Mine Manager as described in section 24.2.
Extorre Gold Mines Limited
Cerro Moro Gold – Silver Project
Preliminary Economic Assessment | Page 323 |
| 24.3.2 | EPCM Project Management Team |
The implementation strategy for the Cerro Moro process plant would required a robust EPCM team for the management of design, procurement and construction. The team will be formed from Extorre personnel, EPCM contractor personnel and Argentinean consultant engineers;
| EPCM Contractors Office | EPCM design team for the generation of project drawings, equipment specifications, tenders and construction work packages for award by Extorre, including all project management and cost control functions. |
| | |
| Puerto Deseado, Argentina | EPCM Contractor / Extorre Project office for local procurement and logistics management, including local cost control and labour recruitment. |
| | |
| Cerro Moro, Argentina | EPCM Contractor / Extorre construction management office for all site construction works implementation supervision and controls. |
| 24.3.3 | Development Objective |
The objective of the Project implementation plan is to provide Extorre Gold Mines Limited (Extorre) with the most cost effective and timely approach to Project development. The most cost effective outcome will be achieved by a project that is delivered on schedule and ramps up to full production capacity in as short a time as possible.
These outcomes will enable Extorre to effectively bring mining, plant operating and administration resources into the project at appropriate times to minimize the phase of the project when operating costs exceed revenue.
The EPCM engineer will provide the following services associated with the development of the Cerro Moro Gold-Silver Project:
Infrastructure
| § | Design and construction of the plant access roads; |
| § | Management of the design and construction of the site HV power supply and distribution system; |
| § | Design and installation of Project buildings including the accommodation camp and administration facilities; |
| § | Design and installation of water supply requirements; |
| § | Design and installation of fuel storage and handling facilities; |
Extorre Gold Mines Limited
Cerro Moro Gold – Silver Project
Preliminary Economic Assessment | Page 324 |
Process Plant
| § | Finalise geotechnical engineering for the plant site; |
| § | Surveying services during construction; |
| § | Design engineering and drafting of earthworks, civil works, structural steel, mechanical and electrical installations; |
| § | Project management services including cost control, scheduling, reporting and claims processing; |
| § | Procurement of materials, equipment and fabricated items including tendering, purchasing, expediting and contract preparation and administration; |
| § | Construction management including site management, and control and inspection of all construction activities; |
| § | Commissioning including pre-commissioning and testing, dry commissioning, wet commissioning and operational assistance until handover; |
| § | Regulatory compliance monitoring and reporting of Project activities; |
| § | Overall site management until completion of commissioning. |
The EPCM engineer will execute the engineering, design and procurement from its home office and will maintain direct construction management from a site office at the plant site. The EPCM engineer will also be responsible for ensuring all engineering design is verified and signed off by a certified engineer in Argentina to ensure all approvals and statutory requirements are met.
Extorre will retain responsibility for government liaison and permitting, all operating and related activities, community relations, power supply infrastructure and provider contact award and administration, asset insurances, land purchases and legal services.
| 24.3.5 | Equipment and Materials Supplies |
Generally, all equipment and materials will be competitively tendered. Award of supply packages will be made on the basis of technical compliance, price and delivery period. Supply packages will be tailored to suit individual supplier’s capacity to optimize schedule, cost and risk.
The processing and mechanical equipment required for the Project will manufactured in a number of countries and where possible consolidated for sea freight utilising a combination of Buenos Aeries and Puerto Deseado for receipt of goods into Argentina.
Some specialised equipment will be purchased as design, fabricate and site installation packages. Examples include the Merrill Crowe plant and some infrastructure buildings.
Extorre Gold Mines Limited
Cerro Moro Gold – Silver Project
Preliminary Economic Assessment | Page 325 |
Generally equipment and materials will be installed by local Argentinean construction crews not affiliated with the equipment or materials supplier, under direct supervision of the Engineers personnel.
| 24.3.6 | Construction Packages |
A construction workforce would be established by utilising Argentinean contractors to provide direct supervision and labour for the majority of packages who would be directed by the EPCM engineers supervisory staff and will be utilized to complete works associated with mechanical installations, structural and plate work installation and erection, electrical and instrumentation installation and piping installations.
Specialist subcontractors will be utilized to complete bulk earthworks associated with the plant and for concrete batching and placement.
The Project implementation schedule is based on using all new equipment. The Project schedule indicates a duration of seventy eight (78) weeks from unhindered commencement of design activities in the key process plant area to practical completion (commencement of commissioning). Key milestone dates required to achieve this schedule are:
| § | Commencement of process facilities design works | Week 0 |
| § | Commencement of major equipment procurement | Week 0 |
| § | Site access available | Week 3 |
| § | Finalisation of PID and flow sheets | Week 3 |
| § | Finalisation of plant layout | Week 5 |
| § | Major equipment orders secured | Week 9 |
| § | Commencement of plant site bulk earthworks and access road | Week13 |
| § | Commencement of offsite fabrication works | Week 16 |
| § | Mobilisation of civil workforce | Week 18 |
| § | Commencement of structural steel erection | Week 41 |
| § | Commencement of mechanical installation | Week 37 |
| § | Commencement of piping installation | Week 55 |
| § | Commencement of electrical installations | Week 55 |
| § | Commencement of dry commissioning | Week 71 |
| § | Commencement of commissioning | Week 78 |
It is anticipated that a period of 8 weeks from the commencement of commissioning will enable the plant to ramp up to full production rates. During this period operator training, rectification of any defects and optimization of operation will take place.
Extorre Gold Mines Limited
Cerro Moro Gold – Silver Project
Preliminary Economic Assessment | Page 326 |
The critical path for this schedule is defined by the time taken to complete the following activities:
| § | Ball mill and flotation cell specification, ordering, manufacture and delivery. |
| § | Installation of the ball mill and associated structures. |
| § | General arrangement and mechanical drawings sufficient to commence structural steel design and drafting. |
| § | Structural steel design and drafting. |
| § | Structural steel erection sufficient to establish safe access for mechanical, piping and electrical work groups. |
| § | Subsequent mechanical, electrical and piping installations. |
| § | Electrical and plant control system installations. |
| § | Dry and wet commissioning. |
The schedule assumes that much of the work required for project and scope definition is already complete at the commencement of detailed engineering work. As such, after an initial minimum five week period to finalise and confirm plant layouts and project definition document, design works are shown progressing in discipline order from mechanical and equipment layouts to structural steel arrangement, concrete and piping drawings.
Electrical and plant control system (PCS) design is indicated starting later in the design phase reflecting both the later requirement for information to the site installations crews and the fact that most of the mechanical design (such as equipment and drive selection) needs to be completed before electrical design work can be efficiently progressed.
| 24.3.10 | Equipment Procurement |
Generally (with the exception of the critical path ball mill) float of at least two weeks exists between the scheduled delivery of the major equipment and the date the equipment is required on site for incorporation into the works.
Delivery periods (to site) for major equipment are as follows:
| § | Ball mill | 55 weeks |
| § | Jaw and cone crushers | 45 weeks |
| § | Vibrating screens | 35 weeks |
| § | Gravity Concentrator | 34 weeks |
| § | Flotation cell | 34 weeks |
| § | Thickeners | 45 weeks |
| § | Transformers | 42 weeks |
| § | MCCs and variable speed drives | 38 weeks |
Extorre Gold Mines Limited
Cerro Moro Gold – Silver Project
Preliminary Economic Assessment | Page 327 |
| 24.3.11 | Site Construction Activity |
Site construction activities are shown progressing generally on a discipline by discipline basis from bulk earthworks, concrete installations, structural steel installations, equipment installations and piping and electrical installations.
The mobilisation of site earthworks contractor, site supervision personnel and the commencement of civil works will be scheduled to allow these tasks to be substantially complete prior to the mobilisation of the critical path structural steelwork erection phase of the construction works. Sufficient time is allowed at the start of the project to confirm specialised site requirements and to finalise HSE requirements and inductions prior to mobilisation.
Extorre Gold Mines Limited
Cerro Moro Gold – Silver Project
Preliminary Economic Assessment | Page 328 |
| 25. | INTERPRETATION AND CONCLUSIONS |
On November 3, 2011 Extorre announced an updated NI 43-101 compliant mineral resource estimate for Cerro Moro. The November 2011 mineral resource estimate is the third undertaken by Cube and follows a previous estimate completed in April 2011 announced on August 4, 2011 and an earlier estimate announced on April 19, 2010.
The November 2011 mineral resource estimate resulted in a material increase to the Project mineral resource base. The material increase in mineral resources has the potential to significantly change the fundamentals of the Project. Of particular importance to the November 2011 resource statement is the inclusion of the high grade Zoe prospect. Updated mineral resource estimates were compiled for the Gabriela and Esperanza prospects and maiden mineral resource estimates were compiled for the Zoe, Martina, Carla and Nini prospects. There have been no changes to the existing Escondida, Loma Escondida and Deborah mineral resources.
Cube has classified a substantial proportion of the Cerro Moro mineral resources as “Indicated” where drill spacing is sufficient to demonstrate acceptable confidence in the geometry, continuity and grade of the mineralized zones. Surrounding areas have been classified as Inferred where drill spacing is wider or where unresolved geological complexity exists.
Drilling since the April 2011 resource estimate has been largely aimed at infill drilling to increase resource confidence from the Inferred to Indicated mineral resources category at existing prospects and resource definitional drilling at more recently discoveries such as the high grade Zoe and Martina prospects. It is Cube’s opinion that the resource definition and exploration strategy since April 2011 has been highly successful as evidenced by the significant increase in mineral resources attributable to new discoveries. In particular, the addition of the high-grade Zoe prospect has contributed a material increase to the resource base at Cerro Moro. As at January 31, 2012, a total of 1,544 drill holes for 222,769.40 m had been completed on both exploration and infill drilling at Cerro Moro. Approximately 80% of the holes have been drilled at Escondida (42.83%), Zoe (19.78%), Gabriela (10.87%), Esperanza (4.13%) and Loma Escondida (2.05%).
All logging, sampling and data QAQC procedures have been carried out to a high industry standard and record keeping and database management is excellent. Cube believes that the current database provides an accurate and robust representation of the Cerro Moro Gold-Silver Project and is appropriate for ongoing resource evaluation.
Extorre’s ongoing resource definition strategy is aimed at
| · | further infill and extensional drilling at recently discovered prospects such as Zoe, Carla, Martina, and Nini-Esperanza; |
Extorre Gold Mines Limited
Cerro Moro Gold – Silver Project
Preliminary Economic Assessment | Page 329 |
| · | the conversion of existing Inferred Category mineral resources to Indicated Category; and |
| · | the identification of potential new resources on other new and existing prospects. |
Cube believes that Extorre’s ongoing resource definition and exploration strategy is well considered, appropriately funded and has a high chance of successfully fulfilling its stated aims.
| 25.2 | Risks and Uncertainties |
As with all mineral resource projects there are risks and uncertainties associated with all aspects of exploration, sampling, data collection, analytical analysis, mineral resource estimation and economic evaluation. There is a high degree of geological and resource risk associated with Inferred mineral resources to the extent that there could be a significant material departure between the mineral resource estimates and reality. Reliance on Inferred mineral resources when undertaking preliminary economic evaluations is risky as there is no certainty of economic viability and mineral reserves cannot be formulated. Indicated mineral resources provide more certainty as to the geological and grade continuity of the mineralized system than Inferred mineral resources. Whilst Indicated resources may be converted to mineral reserves by applying appropriate modifying factors, there still exists a significant degree of geological and resource complexity that may affect the economic viability of the Project.
No mineral reserves have been declared within this current study.
Preliminary mining studies have been completed using the resource estimate as of November, 2011, and include de following aspects:
| § | Pit optimization using Whittle FX to determine the ultimate pits limits for each sector. |
| § | Several pits have been proposed for Cerro Moro. Bench and overall pit slope design was based on recommendations by the geotechnical consultants (AKL). Maximum pit depths are of the order of 60-100 m. |
| § | Open pit contained mineral inventory amounts to 1.7 million tonnes at an average grade of 6.01 g/t Au and 347.6 g/t Ag. Inferred mineral resources have been included that are considered too speculative geologically to have the economic considerations applied to them that would enable them to be categorised as mineral reserves. |
| § | Underground mine design are based on a “bench and fill” system. Underground mineral inventory total 2.3 million tonnes at an average grade of 7.55 g/t Au and 425.8 g/t Au. Inferred mineral resources have been included that are considered too speculative geologically to have the economic considerations applied to them that would enable them to be categorised as mineral reserves. |
| § | Waste storage areas close to the pits were designed in accordance with geotechnical recommendations. |
Extorre Gold Mines Limited
Cerro Moro Gold – Silver Project
Preliminary Economic Assessment | Page 330 |
| § | Two mining and processing rates were considered: 1,300 tpd (Option A) and 1,150 tpd (Option B). Project lives range from 9 to 11 years. |
| § | Identification of suitable mining equipment types and calculation of mining fleet requirements for both open pit and underground mining. |
| § | Estimates of both mine capital (CAPEX) and operating (OPEX) costs. Capital costs consider owner-operator mining, and include a provision for preproduction mining. Replacement and additional equipment purchase costs have been included over the life of Project. |
| § | The mining operating cost (OPEX) estimate is dominated by equipment operating costs (fuel, tyres, labour, and maintenance). Blasting, administration/management and services have also been included. Owner maintenance of the mining fleet has been assumed. |
| 25.4 | Metallurgical Processing |
A treatment plant capable of processing 474,500 t/y is proposed. The plant design incorporates both flotation and gravity recovery stages to maximise recovery from the variable mineralogy particularly of the silver minerals. Due to the high silver to gold ratios for the deposits – overall average ratio of 60:1 silver:gold – the Merrill Crowe (zinc cementation) process has been included instead of adsorption onto carbon for the recovery of precious metals from the leach solution. The plant design is intended to comply with the requirements of the International Cyanide Management Code. The processing plant has been designed to accommodate maximum head grades of 25 g/t of gold and 1000 g/t of silver. A design availability of 92% (8059 operating hours per year) for the process plant has been selected with standby equipment in critical areas. The process design criteria were developed from testwork and benchmarked data from similar projects.
The metallurgical recoveries selected for financial evaluation of the Escondida mineralized zone are 95% for gold and 93% for silver. This has been calculated from the leach extraction data for individual zones and proposed mining schedule on a weighted average basis. Where individual zones have not been subjected to metallurgical test work the leach extraction rates from a similar source were used as nominated by the client. It assumes a CCD wash efficiency of 99% and Merrill Crowe precipitation efficiency of 99%.
| 25.5 | Preliminary Economic Assessment Results |
Economic Analysis – 1,300 tpd (Option A)
The total estimated initial capital cost of the Project is US$ 284 million (VAT included), which comprises i) US$ 247 million for all plant, infrastructure, energy, tailings dam, and open pit and underground development and mining equipment; ii) an additional $US 37.2M for EPCM costs and owners costs. Adding sustaining capital and closure, the total capital cost for the life of the Project is estimated to be US$ 433 million.
Extorre Gold Mines Limited
Cerro Moro Gold – Silver Project
Preliminary Economic Assessment | Page 331 |
The base case financial model assumes gold and silver prices of US$ 1320 per ounce and US$ 26 per ounce, respectively. Results of the discounted cash flow modelling (NPV5 and NPV10) for the 1,300 tpd throughput scenario at Cerro Moro, together with the projected Internal Rate of Return (IRR) and payback period, are presented in Table 131.
| Financial Model | | 1,300 tpd |
| NPV5pre-tax | | US $ 737.4 million |
| NPV5Free cash flow (after tax) | | US $ 463.2 million |
| NPV10pre-tax | | US $ 524.7 million |
| NPV10Free cash flow (after tax) | | US $ 320.1 million |
| IRR pre-tax | | 63.1% |
| IRR Free cash flow (after tax) | | 46.8% |
| Years to payback from start of production (at 5% discount) | | 1.98 |
| Years to payback from start of production (at 10% discount) | | 2.16 |
Table 131 Economical Evaluation Results Summary (1,300 tpd)
Economic Analysis – 1,150 tpd (Option B)
The total estimated initial capital cost of the Project is US$ 257 million (VAT included), which comprises i) US$ 220 million for all plant, infrastructure, energy, tailings dam, and open pit and underground development and mining equipment; ii) an additional $US 36.7M for EPCM costs and owners costs. Adding sustaining capital and closure, the total capital cost for the life of the Project is estimated to be US$ 424 million.
The base case financial model assumes gold and silver prices of US$ 1320 per ounce and US$ 26 per ounce, respectively. Results of the discounted cash flow modelling (NPV5 and NPV10) for the 1,150 tpd throughput scenario at Cerro Moro, together with the projected Internal Rate of Return (IRR) and payback period, are presented in Table 132.
| Financial Model | | 1,150 tpd |
| NPV5pre-tax | | US $ 723.0 million |
| NPV5Free cash flow (after tax) | | US $ 453.8 million |
| NPV10pre-tax | | US $ 503.8 million |
| NPV10Free cash flow (after tax) | | US $ 306.8 million |
| IRR pre-tax | | 65.7% |
| IRR Free cash flow (after tax) | | 47.4% |
| Years to payback from start of production (at 5% discount) | | 1.84 |
| Years to payback from start of production (at 10% discount) | | 2.03 |
Table 132 Economical Evaluation Results Summary (1,150 tpd)
Extorre Gold Mines Limited
Cerro Moro Gold – Silver Project
Preliminary Economic Assessment | Page 332 |
| § | Continue the current well balanced drilling strategy of targeted infill drilling to increase resource confidence and extensional resource definition drilling at known prospects to add additional mineral resources; |
| § | Continue with exploration drilling at other encouraging known prospects; |
| § | Continue with current regional exploration strategy; |
| § | Continue to develop a 'project scale' geological, structural and mineralization model to assist with identifying additional exploration targets; |
| § | Continue to update relevant mineral resource estimates for all significant mineralized zones to reflect ongoing changes to mineral resource confidence and the overall Cerro Moro mineral resource base; |
| § | Progress exploration activities in close proximity to Escondida to either define additional resources or to locate appropriate 'barren' areas for location of open pit waste dumps and other near mine infrastructure. |
| § | Continue mine engineering and planning studies to define and confirm the economic viability of the Project, and move towards development stage. |
| § | Continue mining studies to refine the current mining model, optimize open pit and underground interface and identify the optimum tonnage throughput that yields the best compromise between profitability and practicality. |
| § | Define grade-control requirements for both open pit and underground mining scenarios. |
| § | Continue to develop a 'project scale' geological and structural model to support further geotechnical and mining studies. |
| § | Continue geotechnical testwork and studies including drilling geotechnical holes parallel to the vein-strike in order to identify structures that may be parallel to exploration drilling. Continue drilling of additional geotechnical holes for open pits. |
| § | As surface mapping is made difficult on the existing surface of the prospects being covered with tertiary or quaternary materials, geotechnical mapping simultaneous to the exploration decline and other excavations is recommended to complement drill core data. |
| § | Additional laboratory tests on rock mass and structure surface properties are also recommended to further improve the database. |
| § | Continue geotechnical logging and analysis of all exploration core. |
| § | Benchmark similar mining operations to ensure that optimum design, cost and output are being achieved in the mining model. |
| § | Define acceptability criteria. |
| § | Evaluate option of constructing decline at Escondida Far West. |
Extorre Gold Mines Limited
Cerro Moro Gold – Silver Project
Preliminary Economic Assessment | Page 333 |
Water:
| § | Carry out extended pumping tests at current bore-sites to determine sustainably flow rates. |
| § | Continue prospecting for water and testing of exploration bores intersect substantive flows. |
| § | Continue feasibility and engineering study into viability of desalination plant on adjacent coastline. |
Plant site:
| § | Define positions of major equipment and conduct geotechnical investigations. |
| § | Critically asses the accommodation requirements for construction and operation labour. |
Roads:
| § | Progress design and alignment of access and haulage roads. |
Accommodation:
| § | Progress design of accommodation facilities for employees and contractors. |
| § | Define company shift roster and accommodation philosophy. |
Power supply:
| § | Refine maximum demand studies and progress engineering designs for construction of powerline and electrical reticulation. |
Tailings Storage:
| § | The diversion system design will need to be refined and detailed. |
The embankments’ slopes and embankment foundation will require further assessment once geotechnical parameters describing the properties of the soils in the deposit and borrow areas are available. Slopes designs have only been estimated from site visit observations and will requires further studies and design refinement.
| 26.4 | Metallurgical Testwork |
The following additional test work is recommended:
| § | Test work to confirm concentrate leach extraction rates at the slurry density nominated for the design of the concentrate leaching circuit; |
| § | Test work to optimize the consumption of the cyanide and zinc because of the significant impact these reagents have on operating cost; |
| § | Test work to establish the impact of thiocyanate on flotation performance because of the impact this has on the selection of the cyanide destruction process and potential to significantly increase the operating cost; |
Extorre Gold Mines Limited
Cerro Moro Gold – Silver Project
Preliminary Economic Assessment | Page 334 |
| § | Test work to assess potential cyanide recovery options, including the acidification-volatilisation-reneutralization (AVR) process, and alternative cyanide destruction techniques should be undertaken to establish a more cost effective solution for cyanide management whilst maintaining compliance with environmental protocols; |
| § | Test work on any new potential mineralized zones to verify metallurgical performance; |
| § | Test work to generate a signature plot of grind size versus power to accurately size the concentrate regrind mill; |
| § | Test work to establish the suitable design criteria for thickening and vacuum filtration and washing of the concentrate leach residue. |
| | | |
The next phase of the Project development work should include site geotechnical investigations based on major equipment locations as shown in the preliminary layouts.
A high level risk assessment has been conducted in the process of developing this study; it is recommended that this risk assessment is expanded into contract execution and construction activities during the next phase.
A budget of US$ 38M is proposed to cover exploration and development-related studies at Cerro Moro in 2012. A breakdown of this budget is indicated below:
| Drilling (4 Rigs; 71,000m), Assays, Exploration | $US 17M |
| Camp and Project Operational Costs | $US 7M |
| Ongoing Development-Related Studies | $US 2M |
| New Camp, Office Facilities | $US 3M |
| Salaries, Travel, HSE, Access Agreements | $US 7M |
| Environmental, Community Relations | $US 2M |
In addition, a provision of $US 12M is being made in 2012 for the commencement of the construction of an exploration decline in the Escondida Far West sector. This decline, which will ultimately measure 2,325 m in length and which has a cross-section of 5 m x 4.5 m, is expected to take 22 months to complete. Commencement of the decline construction will be dependent on further financings being successfully completed.
Extorre Gold Mines Limited
Cerro Moro Gold – Silver Project
Preliminary Economic Assessment | Page 335 |
| · | AMMTEC Report No A11721 (2009): Comminution Test Work Conducted Upon Samples from Cerro Moro Gold Project. |
| · | AMMTEC Report No A12671 and No A12791 (2010): Metallurgical Test Work Conducted Upon Samples from Cerro Moro Gold Deposit. |
| · | AMMTEC Report No A13274 (2011): Metallurgical Test Work Conducted Upon Test Work Products for Cerro Moro. |
| · | Ausenco Vector (2009): Hidrogeología Cerro Moro. |
| · | Ausenco Vector (2010):Análisis Hidrogeológico Cuantitativo Preliminar para El Desague de la Rampa de Acceso en Escondida Far West, Proyecto Cerro Moro. |
| · | Ausenco Vector (2011): Informes Hidráulicos MRC-1463 y MRC 1454, Sector Zoe, Proyecto Cerro Moro. |
| · | Ausenco Vector (2012): Proyecto Cerro Moro – Memoria Descriptiva Diseño Conceptual del Depósito de Colas, Febrero 2012. |
| · | Australian Testing Sampling & Inspection Services Pty Ltd (2011): Transportable Moisture Test Report TML002-96. |
| · | Callan, N.J., 2008: Report to Accompany 1:10,000 Scale Geological Mapping, Cerro Moro Au-Ag Project, Puerto Deseado District, Santa Cruz Province, Patagonian Argentina., For Exeter Resource Corporation., Unpublished Company report dated 30 June 2008. |
| · | Corbett, G., 2007: Comments on the Cerro Moro and La Calandria prospects, Argentine Patagonia. A report prepared for Exeter Resource Corporation Ltd., Unpublished Company report dated February, 2007. |
| · | Coupland, T., 2010 (Cube, March 2010): Independent Technical Report – Update Report on the Cerro Moro Project, Santa Cruz Province, Argentina. December 31st 2009, Cube Consulting Pty Ltd, Published (on SEDAR) Company report dated March 18, 2010. |
| · | Coupland, T., 2010 (Cube, May 2010): Independent Technical Report – Resource Estimation for the Cerro Moro Project, Santa Cruz Province, Argentina., Cube Consulting Pty Ltd, Published (on SEDAR) Company report dated May 31, 2010. |
| · | Gomez, J and SIEyE (2012): Memoria Técnica del Sistema de Transmisión Eléctrica Asociado al Proyecto Cerro Moro. |
| · | Ishigaki Oceania Pty Ltd (2011): Cerro Moro Pressure Filtration Test Work. |
| · | Metcon Report M1668, including Roger Townend & Associates mineralogy report 22301 (2009): Initial Metallurgical Test Work on the Cerro Moro Silver/Gold Project, Argentina. |
| · | Metcon Report M2026 (2010): Metallurgical Characterization Tests - Cerro Moro Mineralized Shoots - Escondida Far West. |
Extorre Gold Mines Limited
Cerro Moro Gold – Silver Project
Preliminary Economic Assessment | Page 336 |
| · | Metcon Report M2014 (2010): Flowsheet Development Test Work on the Cerro Moro Au/Ag Project. |
| · | Metcon Report M2254 (2011): Flowsheet Development Test Work on the Cerro Moro Au/Ag Project. |
| · | Metcon Report M2512 (2012): Cerro Moro Metallurgical Development Tests November 2011 to February 2012. |
| · | Metcon Report M2470 (2012): Cerro Moro Metallurgical Development Tests Preliminary Testing of Zoe Structure Mineralization. |
| · | MODA (2009): Cerro Moro Au-Ag Leach Residue Mineralogy. |
| · | Outotec Report S1474TB (2011): Thickening of Cerro Moro Gold Leach Feed. |
| · | Perkins, J. & Williams, M.T., 2009 (Exeter, 2009a): Technical Report – Cerro Moro Project, Santa Cruz Province, Argentina., Exeter Resource Corporation, Published (on SEDAR) Company report dated February 9, 2009. |
| · | Sillitoe, R.H., 2009: Exploration Potential of the Cerro Moro Gold-Silver District, Santa Cruz, Argentina. A report prepared for Exeter Resource Corporation Ltd., Unpublished Company report dated April, 2009. |
| · | Williams, M.T., 2009 (Exeter, 2009b): Technical Report – Cerro Moro Project, Santa Cruz Province, Argentina., Exeter Resource Corporation, Published (on SEDAR) Company report dated October 30, 2009. |
Extorre Gold Mines Limited
Cerro Moro Gold – Silver Project
Preliminary Economic Assessment | Page 337 |