| OMB APPROVAL |
OMB Number: 3235-0570
Expires: January 31, 2017
Estimated average burden hours per response: 20.6 |
UNITED STATES
SECURITIES AND EXCHANGE COMMISSION
Washington, D.C. 20549
FORM N-CSR
CERTIFIED SHAREHOLDER REPORT OF REGISTERED
MANAGEMENT INVESTMENT COMPANIES
Investment Company Act file number 811-22445
Pinnacle Capital Management Funds Trust
(Exact name of registrant as specified in charter)
| 100 Limestone Plaza Fayetteville, NY | 19901 |
| (Address of principal executive offices) | (Zip code) |
Capital Services, Inc. 615 S. Dupont Hwy. Dover, DE 19901
(Name and address of agent for service)
With a copy to:
| Patricia M. Plavko |
| Ultimus Fund Solutions, LLC |
| 225 Pictoria Drive, Suite 450 |
| Cincinnati, Ohio 45246 |
Registrant's telephone number, including area code: (315) 234-9716
Date of fiscal year end: October 31, 2014
Date of reporting period: October 31, 2014
Form N-CSR is to be used by management investment companies to file reports with the Commission not later than 10 days after the transmission to stockholders of any report that is required to be transmitted to stockholders under Rule 30e-1 under the Investment Company Act of 1940 (17 CFR 270.30e-1). The Commission may use the information provided on Form N-CSR in its regulatory, disclosure review, inspection, and policymaking roles.
A registrant is required to disclose the information specified by Form N-CSR, and the Commission will make this information public. A registrant is not required to respond to the collection of information contained in Form N-CSR unless the Form displays a currently valid Office of Management and Budget ("OMB") control number. Please direct comments concerning the accuracy of the information collection burden estimate and any suggestions for reducing the burden to Secretary, Securities and Exchange Commission, 450 Fifth Street, NW, Washington, DC 20549-0609. The OMB has reviewed this collection of information under the clearance requirements of 44 U.S.C. § 3507.
Item 1. Reports to Stockholders.
1789 Growth and Income Fund
| Class A Shares | (PSEAX) |
| Class C Shares | (PSECX) |
| Class P Shares | (PSEPX) |
ANNUAL REPORT
October 31, 2014
1789 GROWTH AND INCOME FUND
LETTER TO SHAREHOLDERS | December, 2014 |
Review and Outlook
At the end of the Fund’s fiscal year, October 31, 2014, the markets had just recovered from what might be called a case of the jitters. While equity returns were strongly positive for the 2014 fiscal year, things looked somewhat unsettled at year end. Over the last two months, volatility had increased as the pace of advances decelerated. Perhaps a recent Wall Street Journal headline says it best: “Global Anxiety Roils Markets.” We believe the source of the turmoil was four major interrelated concerns: 1) regional economic weakness, 2) geopolitical turmoil, 3) monetary policy, and 4) currency issues. While we’ll attempt to cover them one at a time, the discussions by necessity will overlap.
Let’s start with economic issues. First of all, the U.S. economy is progressing nicely. Through September 30th, real GDP expanded by 2.4% year over year. Likewise, the official unemployment rate fell from 7.2% to 5.8% for the year ended October 31st. These are not outstanding numbers, but they certainly represent forward progress. The real concerns involve the rest of the world, with Europe primarily in focus. The irony is that European weakness is nothing new. The equity and currency markets until recently have tended to treat the lack of a crisis situation as evidence of economic health. Now that even Germany is showing weakness, long-running difficulties of the continental economies have come front and center.
In addition, Chinese growth is slowing down, and there are concerns that many loans on the books of Chinese banks are not sound. While recognizing the bad-loan issues, we point out that this is nothing new. Even the pessimists are talking about 7% GDP growth. That’s astonishingly high, in our opinion, for the world’s second largest economy. It’s below where it has been, but we still consider it to be a positive.
Moving to Latin America, Brazil’s economy has been weaker than expected. The currency sank as the Presidential election neared. As feared by the markets, President Dilma Rouseff won a narrow election in a runoff. Even though President Rouseff is viewed as favoring inflation over fiscal responsibility and long-term growth, we believe the government will be forced to take a more growth-oriented stance going forward. Back across the Pacific, it seems it doesn’t matter who tries to stimulate the Japanese economy. It just won’t take off. Now this is nothing new for Japan. The economy hasn’t been a disaster. It just seems to be stuck in permanent neutral. What may be impacting investors is that many who had expected that accelerated growth was imminent are coming to realize this may not be the case.
The imbalance in global economic strength makes the situation tricky. Many are coming to believe that the Fed will begin reversing course from its current easing stance. While we would argue that this would be a net positive, the markets are very nervous about such a prospect. The combination of higher interest rates in the U.S. and attempts by other countries to stimulate their economies has led to a rapidly rising dollar. This in turn is perceived as negative for U.S. competitiveness and corporate profitability. All of these
concerns are interspersed with geopolitical concerns, including uncertainty in Syria, Iraq, Russia, and the Ukraine, to name a few hot spots. Throw in a touch of Ebola and investors can really get spooked.
We lay out the above scenario in the context of a market that by August 31st had appreciated as measured by the S&P 500 Index (the “S&P 500”) 48.67% over the prior 24 months. From the beginning of the Fund’s fiscal year on November 1, 2013 through August 31st, 2014, the S&P 500 returned 16.10%. During these periods there have been no significant corrections. Perhaps we’ve become too accustomed to that. However, as prices are set at the margins, it doesn’t take a lot of fear to drive prices down. The fact is markets can be extremely emotional, especially in the short run. Over the subsequent month and a half, between August 31st and October 15th, the S&P 500 declined 6.82%. However, over the remainder of the month, the markets recouped their losses, with the S&P 500 generating a return of 8.39% from its interim low.
So where does this leave us? First, we’ve believed for some time that markets were inexpensive. This was based on our belief that the risk premium was too high. In other words, prices were low because investors demanded a higher potential return given the risks involved. As prices have advanced over the last few years, the risk premium has shrunk. In fact, we would argue that the shrinkage of risk premiums was as big a factor driving advancing stock prices as were earnings. Nonetheless, this premium, even after the markets reversed their losses in late October, is high by historical standards. What had happened in the markets during the month of September and the first half of October was that the risk premium had increased a bit. Put another way, the potential returns became higher with lower prices.
Against these lower prices, the long-term outlook became no worse. There have always been negatives and risks. The expansion, as we cited earlier, nonetheless remains in place – albeit at a modest pace. One of the lesser appreciated factors is that the weak pace of expansion has produced very few excesses in terms of capacity or inventories. As a result, there is less risk that the expansion will be cut short. Combined with weak commodity prices, the situation augurs well for sustained profit growth. Reasonable prices and sustained profits are what drive long term returns.
The road to success is not a straight line. September and early October displayed one of those diversions. The temperament of the market, which has recently improved, may continue to improve for some time; or it may reverse tomorrow. The only thing we know for certain is that instead of worrying or getting overly enthused about each move in the market, investors would do better by focusing on their long-term goals. And when we look at the long term, we like what we see.
Asset Allocation
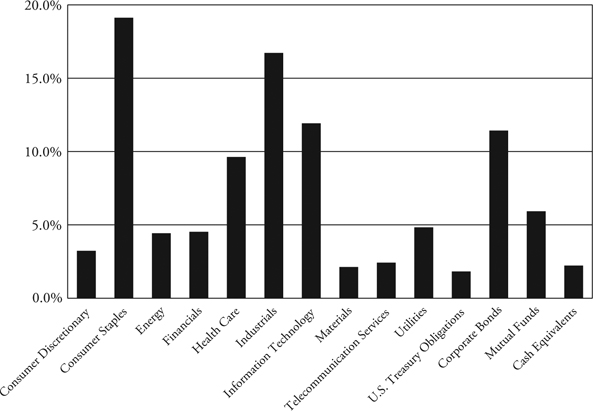
As we stated in last year’s Annual Report, we intend to maintain, within the equity component of the Fund’s portfolio a balance between those companies that we believe can provide growth and those that we believe can provide substantial income. Ideally, we’ll find companies that can accomplish both objectives. As of October 31, 2014, equities represented 78.7% of the Fund’s net assets and fixed income investments, including mutual
funds and exchange traded funds investing primarily in fixed income securities, represented 19.1% of the Fund’s net assets. The remaining 2.2% consisted of cash and equivalents as well as other assets and liabilities. While the economic outlook remains favorable and equity prices are attractive relative to fixed income, the Fund will likely maintain its equity / fixed income mix at a similar level to the equity / fixed income mix that the Fund maintained as of fiscal year end.
While we believe that the balance just described is appropriate given the Fund’s objectives, the Fund’s benchmark is the S&P 500, which returned 17.27% over the fiscal year ended October 31, 2014. Over that same time period, Class A shares, Class C shares and Class P shares of the 1789 Growth and Income Fund (the “Fund”) produced a return of 11.53%, 10.79% and 11.87%, respectively. A significant factor which impacted the Fund’s relative performance to its benchmark was the Fund’s investments in the fixed income markets (described below). It should be noted that when investment returns in the equity markets significantly outpace returns in the fixed income markets, it is highly likely that a fund which maintains a balance between equities and fixed income will not keep pace with the returns generally realized by investors in the equity markets. Indeed this was the case for the Fund during the past fiscal year. Nonetheless, it is not our intention in most cases to expose the Fund to the full risk of the equity markets in order to surpass the returns of the S&P 500. We believe that maintaining investments in fixed income securities and / or cash equivalents is also important in order to dampen overall volatility and generate income.
Equity Strategy
The year ended October 31st, 2014 was a stellar year for equities, notwithstanding the gyrations during the latter part of the year. The S&P 500 generated a return of 17.27% inclusive of dividends over that period. This follows a 27.18% gain over the prior 12 months. Given our outlook, the 1789 Growth and Income Fund (the “Fund”) has attempted to keep equity exposure close to 80%, which we believe has benefited shareholders. Within that equity component, we have not neglected to keep a certain portion of the portfolio invested in stocks with more of a focus on dividend income than on capital appreciation. As such, the Fund holds utility companies including SCANA Corporation and Exelon Corporation. Ironically, both generated total returns in excess of the S&P 500 during the fiscal year inclusive of their dividend yields.
The Fund’s bets in the health care industry last year largely paid off. Teva Pharmaceutical Industries Ltd., Mylan, Inc., and CVS Health Corporation generated 3 of the 4 highest returns among individual stocks for the Fund for the year (the other being Intel Corporation). What those three stocks have in common is that they benefit from the proliferation of health care and, in particular, generic drugs. Teva and Mylan are generic drug manufacturers, and CVS operates drug stores, thereby profiting from their sale. Unfortunately, this benefit was partially offset by our investment in Rite Aid Corporation, first made at the end of February. After a disappointing earnings report in September, the stock fell over 20% during the next week. We believe this was an overreaction, and we still maintain our position. We believe the future of health care delivery lies largely with the drug store industry, and both CVS and Rite Aid should be beneficiaries.
Two of the stocks in the portfolio are currently acquisition targets. DIRECTV has agreed to be acquired by ATT, and Lorillard, Inc. has agreed to be acquired by Reynolds American. As a result, both holdings substantially outperformed the broad market. Neither of these acquisitions has been completed as of yet, and we have reduced holdings of DIRECTV to provide funds for other acquisitions.
Unfortunately, not all of the Fund’s holdings have fared as well. In late August, the Fund purchased shares of Terex Corporation, a manufacturer of construction equipment and overhead cranes. Almost immediately, the company reported earnings that were disappointing, and the stock fell sharply. The Fund purchased additional shares, but the stock continued to drop through mid October. The shares have since rebounded somewhat, but the position is still not profitable.
Also disappointing were results from our Latin American holdings, particularly Groupo Pao de Acucar (the largest grocery store chain in Brazil) and Embotelladora Andina S.A. (a Latin American Coca Cola bottling company). Groupo Pao de Acucar was particularly hard hit due to the fall of the Brazilian currency in the lead up to Presidential elections in that country. Towards the end of the fiscal year, the Fund reduced holdings of that company by approximately half.
Fixed Income Strategy
There were many ups and downs in the bond market during the Fund’s fiscal year, but overall bonds appreciated in value as yields fell. While not a stellar return, bonds, as measured by the Barclays U.S. Aggregate Bond Index returned 4.14% between October 31st 2013 and October 31st 2014. Meanwhile, over the same period, the yield on the 10 year U.S. Treasury fell from 2.55% to 2.34%. There was considerable fluctuation in between, with the yield ranging between 2.14% and 3.03%. Our outlook has been (incorrectly to date) that interest rates are likely to rise. We maintain that view, though we recognize we can’t forecast when this will occur. Why do we think rates will rise? There are several reasons, but one observation in particular should suffice. Other than times of recession, the 10 year Treasury yield tends to approximate nominal GDP – that is, the rate of real GDP growth plus inflation. Given the latest readings of 4.0% year-over-year growth in nominal GDP, one might infer a 4.0% 10 year Treasury yield.
And it is not just Treasury yields that we believe are too low. U.S. Treasury yields form the standard from which corporate bond rates are set. As such, as of October 31st, 2014, the typical 10 year BBB was yielding just a hair over 4% - exactly where Treasuries would typically trade at this point in a business cycle. We believe the fact that yields are so much lower requires the added explanation of a recessionary mentality. Obviously, rates have held much lower than we ever imagined. Nevertheless, at some point we believe rates will revert to more normal levels. Perhaps our error was having a firm conviction for the past several years that a renewed recession was not imminent. We find it interesting and even a bit confusing that such a pessimistic outlook in the general market has persisted in an expansion which is currently in its sixth year.
With our outlook for continued economic growth and expectations of higher interest rates, we believe that it is more prudent to garner returns by taking on some credit risk than it is to improve returns by extending maturities. With this in mind, the Fund has chosen to focus on the low end of the investment grade spectrum with maturities under 10 years. Also included is some exposure to below investment grade securities. Having said this, the bulk of the Fund’s fixed-income exposure is investment grade. Additionally, the Fund maintains a small holding of U.S. Treasury securities.
Within the below investment grade space, the Fund has chosen to utilize third party funds to achieve adequate diversification. The BlackRock Floating Rate Income Strategies Fund, Inc. is held within the Fund and focuses on below investment grade, high priority bank loans with relatively short duration. The DoubleLine Total Return Bond Fund is also held by the Fund and focuses on both investment grade and below investment grade mortgage backed securities. The combination of these Funds is intended to provide ample diversification.
Among individual securities, all individual fixed income holdings have maturities ranging from less than a year to just under 10 years. Other than maturing securities, no bonds have been sold during the course of the fiscal year. All individual bonds held by the Fund currently maintain investment grade ratings by both Moody’s and S&P. During the fiscal year, new purchases, to replace maturing securities or to invest new moneys, have been in the 8 – 10 year range with S&P ratings of BBB or BBB-. These have been purchased to replace either maturing securities or to invest new money.
For now, the Fund is expecting to maintain its fixed income exposure roughly as it has been for the past year. Currently the risk / reward characteristics of the fixed income markets are not where we’d like them to be. The intent is to obtain extra income by investing in the equity markets, where dividend yields are often as high as or higher than bond yields. As conditions change at some point in the future, this investment posture is likely to change as well.
Past performance is not predictive of future performance. Investment results and principal value will fluctuate so that shares, when redeemed, may be worth more or less than their original cost. Current performance may be higher or lower than the performance data quoted. Performance current through the most recent month end is available by calling 1-888-229-9448.
An investor should consider the investment objectives, risks, charges and expenses of the Fund carefully before investing. The Fund’s prospectus contains this and other important information. To obtain a copy of the Fund’s prospectus please call 1-888-229-9448 and a copy will be sent to you free of charge. Please read the prospectus carefully before you invest. The Fund is distributed by Pinnacle Investments, LLC.
The Letter to Shareholders seeks to describe some of the Adviser’s current opinions and views of the financial markets. Although the Adviser believes it has a reasonable basis for any opinions or views expressed, actual results may differ, sometimes significantly so, from those expected or expressed.
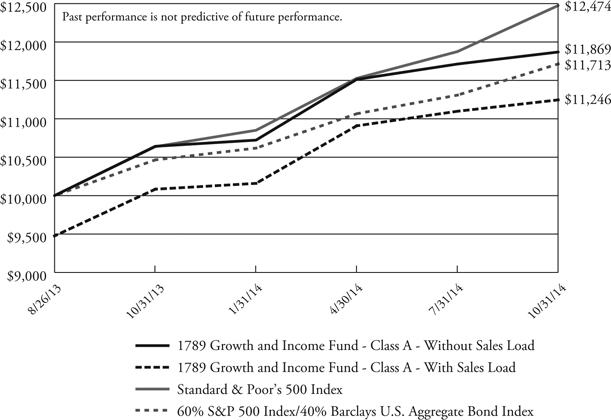
1789 GROWTH AND INCOME FUND - CLASS A
PERFORMANCE INFORMATION
October 31, 2014 (Unaudited)
Comparison of the Change in Value of a $10,000 Investment in
1789 Growth and Income Fund - Class A, Standard & Poor’s 500 Index,
and 60% S&P 500 Index/40% Barclays U.S. Aggregate Bond Index
Average Annual Total Returns(a)
(for periods ended October 31, 2014) |
| | One
Year | Since
Inception(b) | |
| 1789 Growth and Income Fund - Class A - Without Sales Load | 11.53% | 15.62% | |
| 1789 Growth and Income Fund - Class A - With Sales Load | 5.69% | 10.47% | |
| Standard & Poor’s 500 Index | 17.27% | 20.59% | |
| 60% S&P 500 Index/40% Barclays U.S. Aggregate Bond Index | 11.93% | 14.33% | |
(a) | The total returns shown do not reflect the deduction of taxes that a shareholder would pay on Fund distributions or the redemption of Fund shares. |
(b) | Commencement of operations was August 26, 2013. |
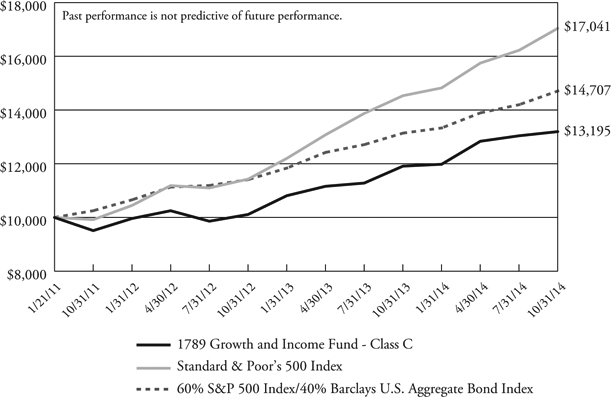
1789 GROWTH AND INCOME FUND - CLASS C
PERFORMANCE INFORMATION
October 31, 2014 (Unaudited)
Comparison of the Change in Value of a $10,000 Investment in
1789 Growth and Income Fund - Class C, Standard & Poor’s 500 Index and
60% S&P 500 Index/40% Barclays U.S. Aggregate Bond Index
Average Annual Total Returns(a)
(for periods ended October 31, 2014) |
| | One
Year | Since
Inception(b) | |
| 1789 Growth and Income Fund - Class C - Without CDSC | 10.79% | 7.62% | |
| 1789 Growth and Income Fund - Class C - With CDSC | 9.79% | 7.62% | |
| Standard & Poor’s 500 Index | 17.27% | 15.17% | |
| 60% S&P 500 Index/40% Barclays U.S. Aggregate Bond Index | 11.93% | 10.76% | |
(a) | The total returns shown do not reflect the deduction of taxes that a shareholder would pay on Fund distributions or the redemption of Fund shares. |
(b) | Commencement of operations was January 21, 2011. |
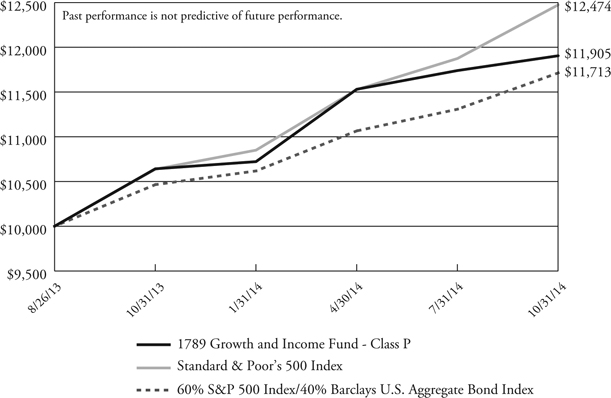
1789 GROWTH AND INCOME FUND - CLASS P
PERFORMANCE INFORMATION
October 31, 2014 (Unaudited)
Comparison of the Change in Value of a $10,000 Investment in
1789 Growth and Income Fund - Class P, Standard & Poor’s 500 Index
and 60% S&P 500 Index/40% Barclays U.S. Aggregate Bond Index
Average Annual Total Returns(a)
(for periods ended October 31, 2014) |
| | One
Year | Since
Inception(b) | |
| 1789 Growth and Income Fund - Class P | 11.87% | 15.92% | |
| Standard & Poor’s 500 Index | 17.27% | 20.59% | |
| 60% S&P 500 Index/40% Barclays U.S. Aggregate Bond Index | 11.93% | 14.33% | |
(a) | The total returns shown do not reflect the deduction of taxes that a shareholder would pay on Fund distributions or the redemption of Fund shares. |
(b) | Commencement of operations was August 26, 2013. |
1789 GROWTH AND INCOME FUND
PORTFOLIO INFORMATION
October 31, 2014 (Unaudited)
Sector Diversification
(% of Net Assets)
Top Ten Holdings
| Security Description | % of
Net Assets |
| DoubleLine Total Return Bond Fund - Institutional Class | 3.0% |
| BlackRock Floating Rate Income Strategies Fund, Inc. | 2.9% |
| BRF S.A. - ADR | 2.6% |
| Bristol-Myers Squibb Company | 2.5% |
| Teva Pharmaceutical Industries Ltd. - ADR | 2.5% |
| Mylan, Inc. | 2.5% |
| SCANA Corporation | 2.4% |
| Exelon Corporation | 2.4% |
| Verizon Communications, Inc. | 2.4% |
| First Cash Financial Services, Inc. | 2.3% |
1789 GROWTH AND INCOME FUND
SCHEDULE OF INVESTMENTS
October 31, 2014 |
| COMMON STOCKS — 78.7% | | Shares | | | Value | |
| Consumer Discretionary — 3.2% | | | | | | |
| Media — 3.2% | | | | | | |
DIRECTV (a) | | | 1,707 | | | $ | 148,151 | |
Walt Disney Company (The) | | | 2,186 | | | | 199,756 | |
| | | | | | | | 347,907 | |
| Consumer Staples — 19.1% | | | | | | | | |
| Beverages — 2.5% | | | | | | | | |
Embotelladora Andina S.A. - Class B - ADR | | | 6,653 | | | | 123,812 | |
SABMiller plc - ADR | | | 2,568 | | | | 145,452 | |
| | | | | | | | 269,264 | |
| Food & Staples Retailing — 3.5% | | | | | | | | |
Companhia Brasileira de Distribuição - ADR | | | 2,610 | | | | 109,098 | |
CVS Health Corporation | | | 2,257 | | | | 193,673 | |
Rite Aid Corporation (a) | | | 14,684 | | | | 77,091 | |
| | | | | | | | 379,862 | |
| Food Products — 9.0% | | | | | | | | |
BRF S.A. - ADR | | | 10,996 | | | | 286,445 | |
Kellogg Company | | | 3,864 | | | | 247,141 | |
| Mondelēz International, Inc. - Class A | | | 6,183 | | | | 218,013 | |
Unilever plc - ADR | | | 5,687 | | | | 228,788 | |
| | | | | | | | 980,387 | |
| Household Products — 2.2% | | | | | | | | |
Clorox Company (The) | | | 2,448 | | | | 243,576 | |
| | | | | | | | | |
| Tobacco — 1.9% | | | | | | | | |
Lorillard, Inc. | | | 3,400 | | | | 209,100 | |
| | | | | | | | | |
| Energy — 4.4% | | | | | | | | |
| Oil, Gas & Consumable Fuels — 4.4% | | | | | | | | |
Apache Corporation | | | 1,249 | | | | 96,423 | |
Exxon Mobil Corporation | | | 2,354 | | | | 227,655 | |
Hess Corporation | | | 1,875 | | | | 159,019 | |
| | | | | | | | 483,097 | |
| Financials — 4.5% | | | | | | | | |
| Consumer Finance — 2.3% | | | | | | | | |
First Cash Financial Services, Inc. (a) | | | 4,278 | | | | 252,744 | |
See accompanying notes to financial statements.
1789 GROWTH AND INCOME FUND
SCHEDULE OF INVESTMENTS (Continued) |
| COMMON STOCKS — 78.7% (Continued) | | Shares | | | Value | |
| Financials — 4.5% (Continued) | | | | | | |
| Insurance — 2.2% | | | | | | |
Aflac, Inc. | | | 3,944 | | | $ | 235,575 | |
| | | | | | | | | |
| Health Care — 9.6% | | | | | | | | |
| Pharmaceuticals — 9.6% | | | | | | | | |
Bristol-Myers Squibb Company | | | 4,747 | | | | 276,228 | |
Merck & Company, Inc. | | | 3,942 | | | | 228,399 | |
Mylan, Inc. (a) | | | 5,032 | | | | 269,464 | |
Teva Pharmaceutical Industries Ltd. - ADR | | | 4,776 | | | | 269,701 | |
| | | | | | | | 1,043,792 | |
| Industrials — 16.7% | | | | | | | | |
| Aerospace & Defense — 1.5% | | | | | | | | |
United Technologies Corporation | | | 1,523 | | | | 162,961 | |
| | | | | | | | | |
| Air Freight & Logistics — 2.0% | | | | | | | | |
FedEx Corporation | | | 1,283 | | | | 214,774 | |
| | | | | | | | | |
| Commercial Services & Supplies — 1.3% | | | | | | | | |
MSA Safety, Inc. | | | 2,374 | | | | 136,434 | |
| | | | | | | | | |
| Industrial Conglomerates — 2.1% | | | | | | | | |
General Electric Company | | | 8,974 | | | | 231,619 | |
| | | | | | | | | |
| Machinery — 7.6% | | | | | | | | |
ITT Corporation | | | 5,048 | | | | 227,463 | |
Pall Corporation | | | 1,757 | | | | 160,625 | |
Terex Corporation | | | 7,375 | | | | 212,179 | |
Xylem, Inc. | | | 6,441 | | | | 234,195 | |
| | | | | | | | 834,462 | |
| Trading Companies & Distributors — 2.2% | | | | | | | | |
Textainer Group Holdings Ltd. | | | 6,976 | | | | 240,253 | |
| | | | | | | | | |
| Information Technology — 11.9% | | | | | | | | |
| IT Services — 5.4% | | | | | | | | |
CACI International, Inc. - Class A (a) | | | 1,413 | | | | 116,276 | |
Fidelity National Information Services, Inc. | | | 3,885 | | | | 226,845 | |
Xerox Corporation | | | 17,988 | | | | 238,880 | |
| | | | | | | | 582,001 | |
See accompanying notes to financial statements.
1789 GROWTH AND INCOME FUND
SCHEDULE OF INVESTMENTS (Continued) |
| COMMON STOCKS — 78.7% (Continued) | | Shares | | | Value | |
| Information Technology — 11.9% (Continued) | | | | | | |
| Semiconductors & Semiconductor Equipment — 1.5% | | | | | | |
Intel Corporation | | | 4,652 | | | $ | 158,215 | |
| | | | | | | | | |
| Software — 3.0% | | | | | | | | |
Adobe Systems, Inc. (a) | | | 2,650 | | | | 185,818 | |
Intuit, Inc. | | | 1,636 | | | | 143,984 | |
| | | | | | | | 329,802 | |
| Technology Hardware, Storage & Peripherals — 2.0% | | | | | | | | |
EMC Corporation | | | 7,727 | | | | 221,997 | |
| | | | | | | | | |
| Materials — 2.1% | | | | | | | | |
| Chemicals — 2.1% | | | | | | | | |
Dow Chemical Company (The) | | | 4,553 | | | | 224,918 | |
| | | | | | | | | |
| Telecommunication Services — 2.4% | | | | | | | | |
| Diversified Telecommunication Services — 2.4% | | | | | | | | |
Verizon Communications, Inc. | | | 5,133 | | | | 257,933 | |
| | | | | | | | | |
| Utilities — 4.8% | | | | | | | | |
| Electric Utilities — 2.4% | | | | | | | | |
Exelon Corporation | | | 7,179 | | | | 262,680 | |
| | | | | | | | | |
| Multi-Utilities — 2.4% | | | | | | | | |
SCANA Corporation | | | 4,843 | | | | 265,832 | |
| | | | | | | | | |
Total Common Stocks (Cost $7,125,186) | | | | | | $ | 8,569,185 | |
| U.S. TREASURY OBLIGATIONS — 1.8% | | Coupon | Maturity | | Par Value | | | Value | |
U.S. Treasury Notes | | | 0.250 | % | 02/15/15 | | $ | 100,000 | | | $ | 100,031 | |
U.S. Treasury Notes | | | 0.875 | % | 12/31/16 | | | 100,000 | | | | 100,571 | |
Total U.S. Treasury Obligations (Cost $199,987) | | | | | | | | | | | $ | 200,602 | |
See accompanying notes to financial statements.
1789 GROWTH AND INCOME FUND
SCHEDULE OF INVESTMENTS (Continued) |
| CORPORATE BONDS — 11.4% | | Coupon | Maturity | | Par Value | | | Value | |
| Consumer Discretionary — 4.1% | | | | | | | | | | |
Advanced Auto Parts, Inc. | | | 4.500 | % | 01/15/22 | | $ | 200,000 | | | $ | 211,097 | |
Marriott International, Inc. | | | 3.250 | % | 09/15/22 | | | 200,000 | | | | 200,272 | |
Yum! Brands, Inc. | | | 4.250 | % | 09/15/15 | | | 40,000 | | | | 41,132 | |
| | | | | | | | | | | | | 452,501 | |
| Consumer Staples — 0.6% | | | | | | | | | | | | | |
Clorox Company (The) | | | 5.950 | % | 10/15/17 | | | 60,000 | | | | 67,489 | |
| | | | | | | | | | | | | | |
| Energy — 0.9% | | | | | | | | | | | | | |
Hess Corporation | | | 3.500 | % | 07/15/24 | | | 100,000 | | | | 99,345 | |
| | | | | | | | | | | | | | |
| Financials — 2.7% | | | | | | | | | | | | | |
American Express Credit Company | | | 2.750 | % | 09/15/15 | | | 120,000 | | | | 122,353 | |
HSBC Finance Corporation | | | 5.600 | % | 02/15/18 | | | 42,000 | | | | 46,276 | |
JPMorgan Chase & Company | | | 5.250 | % | 05/01/15 | | | 25,000 | | | | 25,553 | |
Morgan Stanley (b) | | | 4.042 | % | 03/01/20 | | | 25,000 | | | | 25,750 | |
Wells Fargo & Company | | | 5.000 | % | 11/15/14 | | | 70,000 | | | | 70,087 | |
| | | | | | | | | | | | | 290,019 | |
| Industrials — 1.1% | | | | | | | | | | | | | |
Emerson Electric Company | | | 5.375 | % | 10/15/17 | | | 108,000 | | | | 120,503 | |
| | | | | | | | | | | | | | |
| Telecommunication Services — 1.0% | | | | | | | | | | | | | |
Verizon Communications, Inc. | | | 6.100 | % | 04/15/18 | | | 100,000 | | | | 113,836 | |
| | | | | | | | | | | | | | |
| Utilities — 1.0% | | | | | | | | | | | | | |
Empresa Nacional de Electricidad S.A. | | | 8.625 | % | 08/01/15 | | | 45,000 | | | | 47,391 | |
Public Service Electric & Gas Company | | | 6.750 | % | 01/01/16 | | | 50,000 | | | | 53,416 | |
| | | | | | | | | | | | | 100,807 | |
Total Corporate Bonds (Cost $1,214,167) | | | | | | | | | | | $ | 1,244,500 | |
| CLOSED-END FUNDS — 2.9% | | Shares | | | Value | |
BlackRock Floating Rate Income Strategies Fund, Inc. (Cost $341,165) | | | 23,194 | | | $ | 318,686 | |
See accompanying notes to financial statements.
1789 GROWTH AND INCOME FUND
SCHEDULE OF INVESTMENTS (Continued) |
| OPEN-END FUNDS — 3.0% | | Shares | | | Value | |
DoubleLine Total Return Bond Fund - Institutional Class (Cost $325,000) | | | 29,783 | | | $ | 326,721 | |
| MONEY MARKET FUNDS — 2.2% | | Shares | | | Value | |
Fidelity Institutional Money Market Portfolio - Class I, 0.02% (c) (Cost $242,081) | | | 242,081 | | | $ | 242,081 | |
| | | | | | | | | |
Total Investments at Value — 100.0% (Cost $9,447,586) | | | | | | $ | 10,901,775 | |
| | | | | | | | | |
Liabilities in Excess of Other Assets — (0.0%) (d) | | | | | | | (1,583 | ) |
| | | | | | | | | |
Net Assets — 100.0% | | | | | | $ | 10,900,192 | |
ADR - American Depositary Receipt. |
(a) | Non-income producing security. |
(b) | Variable rate security. The rate shown is the effective interest rate as of October 31, 2014. |
(c) | The rate shown is the 7-day effective yield as of October 31, 2014. |
(d) | Percentage rounds to less than (0.1%). |
| See accompanying notes to financial statements. |
1789 GROWTH AND INCOME FUND
STATEMENT OF ASSETS AND LIABILITIES
October 31, 2014 |
| ASSETS | | | |
| Investments in securities: | | | |
At acquisition cost | | $ | 9,447,586 | |
At value (Note 2) | | $ | 10,901,775 | |
Cash | | | 406 | |
Dividends and interest receivable | | | 22,213 | |
TOTAL ASSETS | | | 10,924,394 | |
| | | | | |
| LIABILITIES | | | | |
Accrued advisory fees (Note 4) | | | 6,659 | |
Accrued service fees (Note 4) | | | 1,779 | |
Accrued distribution and service plan fees (Note 4) | | | 14,764 | |
Accrued Trustees’ fees (Note 4) | | | 1,000 | |
TOTAL LIABILITIES | | | 24,202 | |
| | | | | |
NET ASSETS | | $ | 10,900,192 | |
| | | | | |
| Net assets consist of: | | | | |
Paid-in capital | | $ | 9,191,782 | |
Undistributed net investment income | | | 43,096 | |
| Undistributed net realized gains from security transactions | | | 211,125 | |
Net unrealized appreciation on investments | | | 1,454,189 | |
| NET ASSETS | | $ | 10,900,192 | |
| See accompanying notes to financial statements. |
1789 GROWTH AND INCOME FUND
STATEMENT OF ASSETS AND LIABILITIES (Continued)
October 31, 2014 |
| PRICING OF CLASS A SHARES | | | |
Net assets applicable to Class A shares | | $ | 194,025 | |
| Shares of beneficial interest outstanding (unlimited number of shares authorized, no par value) | | | 14,990 | |
| Net asset value and redemption price per share (Note 2) | | $ | 12.94 | |
Offering price per share (Note 2) | | $ | 13.66 | |
Short-term redemption price per share (Note 5) * | | $ | 12.81 | |
| | | | | |
| PRICING OF CLASS C SHARES | | | | |
Net assets applicable to Class C shares | | $ | 8,915,275 | |
| Shares of beneficial interest outstanding (unlimited number of shares authorized, no par value) | | | 695,602 | |
| Net asset value, offering price and redemption price per share (Note 2) | | $ | 12.82 | |
Short-term redemption price per share (Note 2) * | | $ | 12.69 | |
| Minimum redemption price per share with CDSC fee (Note 2) ** | | $ | 12.69 | |
| | | | | |
| PRICING OF CLASS P SHARES | | | | |
Net assets applicable to Class P shares | | $ | 1,790,892 | |
| Shares of beneficial interest outstanding (unlimited number of shares authorized, no par value) | | | 137,991 | |
| Net asset value, offering price and redemption price per share (Note 2) | | $ | 12.98 | |
Short-term redemption price per share (Note 2) * | | $ | 12.85 | |
| * | The Fund imposes a 1.00% redemption fee on shares redeemed within 60 days of purchase. |
| ** | A contingent deferred sales charge (“CDSC”) of 1.00% is charged on Class C shares redeemed within one year of purchase. Redemption price per share is equal to net asset value less any redemption fee or CDSC. |
| See accompanying notes to financial statements. |
1789 GROWTH AND INCOME FUND
STATEMENT OF OPERATIONS
For the Year Ended October 31, 2014 |
| INVESTMENT INCOME | | | |
Dividends (net foreign withholding taxes of $2,034) | | $ | 173,498 | |
Interest | | | 33,333 | |
TOTAL INVESTMENT INCOME | | | 206,831 | |
| | | | | |
| EXPENSES | | | | |
Investment management fees (Note 4) | | | 68,875 | |
Service fees (Note 4) | | | 22,040 | |
Distribution fees, Class A (Note 4) | | | 271 | |
Distribution fees, Class C (Note 4) | | | 79,710 | |
Trustees’ fees (Note 4) | | | 1,000 | |
TOTAL EXPENSES | | | 171,896 | |
| | | | | |
NET INVESTMENT INCOME | | | 34,935 | |
| | | | | |
| REALIZED AND UNREALIZED GAINS ON INVESTMENTS | | | | |
Net realized gains from security transactions | | | 572,879 | |
| Net change in unrealized appreciation/(depreciation) on investments | | | 314,017 | |
| NET REALIZED AND UNREALIZED GAINS ON INVESTMENTS | | | 886,896 | |
| | | | | |
| NET INCREASE IN NET ASSETS RESULTING FROM OPERATIONS | | $ | 921,831 | |
| See accompanying notes to financial statements. |
1789 GROWTH AND INCOME FUND
STATEMENTS OF CHANGES IN NET ASSETS |
| | | Year
Ended
October 31, 2014 | | | Year
Ended
October 31, 2013 | |
| FROM OPERATIONS | | | | | | |
Net investment income | | $ | 34,935 | | | $ | 7,009 | |
Net realized gains from security transactions | | | 572,879 | | | | 54,970 | |
Long-term capital gains from underlying investment companies | | | — | | | | 1,453 | |
Net change in unrealized appreciation/(depreciation) on investments | | | 314,017 | | | | 901,475 | |
Net increase in net assets resulting from operations | | | 921,831 | | | | 964,907 | |
| | | | | | | | | |
| FROM DISTRIBUTIONS TO SHAREHOLDERS | | | | | | | | |
From net realized gains on investments, Class A | | | (1,903 | ) | | | — | |
From net realized gains on investments, Class C | | | (219,830 | ) | | | — | |
From net realized gains on investments, Class P | | | (23,643 | ) | | | — | |
Decrease in net assets from distributions to shareholders | | | (245,376 | ) | | | — | |
| | | | | | | | | |
| FROM CAPITAL SHARE TRANSACTIONS (Note 5) | | | | | | | | |
| CLASS A | | | | | | | | |
Proceeds from shares sold | | | 156,949 | | | | 26,769 | |
| Net asset value of shares issued in reinvestment of distributions | | | 1,903 | | | | — | |
| Net increase in net assets from Class A shares capital share transactions | | | 158,852 | | | | 26,769 | |
| | | | | | | | | |
| CLASS C | | | | | | | | |
Proceeds from shares sold | | | 2,022,221 | | | | 1,313,146 | |
| Net asset value of shares issued in reinvestment of distributions | | | 189,585 | | | | — | |
Proceeds from redemption fees collected | | | 42 | | | | — | |
Payments for shares redeemed | | | (821,075 | ) | | | (404,610 | ) |
| Net increase in net assets from Class C shares capital share transactions | | | 1,390,773 | | | | 908,536 | |
| See accompanying notes to financial statements. |
1789 GROWTH AND INCOME FUND
STATEMENTS OF CHANGES IN NET ASSETS (Continued) |
| | | Year
Ended
October 31, 2014 | | | Year
Ended
October 31, 2013 | |
| CLASS P | | | | | | |
Proceeds from shares sold | | $ | 1,709,200 | | | $ | 23,100 | |
| Net asset value of shares issued in reinvestment of distributions | | | 21,945 | | | | — | |
Payments for shares redeemed | | | (51,020 | ) | | | — | |
| Net increase in net assets from Class P shares capital share transactions | | | 1,680,125 | | | | 23,100 | |
| | | | | | | | | |
TOTAL INCREASE IN NET ASSETS | | | 3,906,205 | | | | 1,923,312 | |
| | | | | | | | | |
| NET ASSETS | | | | | | | | |
Beginning of year | | | 6,993,987 | | | | 5,070,675 | |
End of year | | $ | 10,900,192 | | | $ | 6,993,987 | |
| | | | | | | | | |
UNDISTRIBUTED NET INVESTMENT INCOME | | $ | 43,096 | | | $ | 9,001 | |
| See accompanying notes to financial statements. |
1789 GROWTH AND INCOME FUND - CLASS A
FINANCIAL HIGHLIGHTS |
| Per share data for a share outstanding throughout each period: | |
| | | Year
Ended
October 31,
2014 | | | Period
Ended
October 31,
2013(a) | |
Net asset value at beginning of period | | $ | 11.94 | | | $ | 11.22 | |
| | | | | | | | | |
| Income from investment operations: | | | | | | | | |
Net investment income | | | 0.09 | | | | 0.05 | (b) |
Net realized and unrealized gains on investments | | | 1.27 | | | | 0.67 | |
Total from investment operations | | | 1.36 | | | | 0.72 | |
| | | | | | | | | |
| Less distributions: | | | | | | | | |
From net realized gains on investments | | | (0.36 | ) | | | — | |
| | | | | | | | | |
Net asset value at end of period | | $ | 12.94 | | | $ | 11.94 | |
| | | | | | | | | |
Total return (c) | | | 11.53 | % | | | 6.41 | %(d) |
| | | | | | | | | |
Net assets at end of period (000's) | | $ | 194 | | | $ | 28 | |
| | | | | | | | | |
Ratio of total expenses to average net assets | | | 1.25 | % | | | 1.24 | %(e) |
| | | | | | | | | |
Ratio of net investment income to average net assets | | | 1.33 | % | | | 2.31 | %(e) |
| | | | | | | | | |
Portfolio turnover rate | | | 29 | % | | | 26 | %(d) |
(a) | Represents the period from the commencement of operations (August 26, 2013) through October 31, 2013. |
(b) | Net investment income per share is based on average shares outstanding during the period. |
(c) | Total return is a measure of the change in value of an investment in the Fund over the period covered, which assumes any dividends or capital gains distributions are reinvested in shares of the Fund. Returns shown exclude the effect of applicable sales loads and do not reflect the deduction of taxes a shareholder would pay on Fund distributions or the redemption of Fund shares. |
(d) | Not annualized. |
(e) | Annualized. |
| See accompanying notes to financial statements. |
1789 GROWTH AND INCOME FUND - CLASS C
FINANCIAL HIGHLIGHTS |
| Per share data for a share outstanding throughout each period: | |
| | | Year
Ended
October 31,
2014 | | | Year
Ended
October 31,
2013 | | | Year
Ended
October 31,
2012 | | | Period
Ended
October 31,
2011(a) | |
Net asset value at beginning of period | | $ | 11.91 | | | $ | 10.11 | | | $ | 9.51 | | | $ | 10.00 | |
| | | | | | | | | | | | | | | | | |
| Income (loss) from investment operations: | | | | | | | | | | | | | | | | |
Net investment income (loss) | | | 0.02 | | | | 0.01 | (b) | | | 0.00 | (b)(c) | | | (0.02 | )(b) |
| Net realized and unrealized gains (losses) on investments | | | 1.25 | | | | 1.79 | | | | 0.60 | | | | (0.47 | ) |
Total from investment operations | | | 1.27 | | | | 1.80 | | | | 0.60 | | | | (0.49 | ) |
| | | | | | | | | | | | | | | | | |
| Less distributions: | | | | | | | | | | | | | | | | |
From net realized gains on investments | | | (0.36 | ) | | | — | | | | — | | | | — | |
| | | | | | | | | | | | | | | | | |
| Proceeds from redemption | | | | | | | | | | | | | | | | |
fees collected (Note 5) | | | 0.00 | (c) | | | — | | | | — | | | | — | |
| | | | | | | | | | | | | | | | | |
Net asset value at end of period | | $ | 12.82 | | | $ | 11.91 | | | $ | 10.11 | | | $ | 9.51 | |
| | | | | | | | | | | | | | | | | |
Total return (d) | | | 10.79 | % | | | 17.80 | % | | | 6.31 | % | | | (4.90% | )(e) |
| | | | | | | | | | | | | | | | | |
Net assets at end of period (000's) | | $ | 8,915 | | | $ | 6,943 | | | $ | 5,071 | | | $ | 2,864 | |
| | | | | | | | | | | | | | | | | |
Ratio of total expenses to average net assets | | | 2.00 | % | | | 1.99 | % | | | 1.99 | % | | | 1.99 | %(f) |
| | | | | | | | | | | | | | | | | |
| Ratio of net investment income (loss) to average net assets | | | 0.22 | % | | | 0.12 | % | | | 0.02 | % | | | (0.27% | )(f) |
| | | | | | | | | | | | | | | | | |
Portfolio turnover rate | | | 29 | % | | | 26 | % | | | 12 | % | | | 42 | %(e) |
(a) | Represents the period from the commencement of operations (January 21, 2011) through October 31, 2011. |
(b) | Net investment income (loss) per share is based on average shares outstanding during the period. |
(c) | Amount rounds to less than $0.01 per share. |
(d) | Total return is a measure of the change in value of an investment in the Fund over the period covered, which assumes any dividends or capital gains distributions are reinvested in shares of the Fund. Returns shown exclude the effect of applicable sales loads and do not reflect the deduction of taxes a shareholder would pay on Fund distributions or the redemption of Fund shares. |
(e) | Not annualized. |
(f) | Annualized. |
| See accompanying notes to financial statements. |
1789 GROWTH AND INCOME FUND - CLASS P
FINANCIAL HIGHLIGHTS |
| Per share data for a share outstanding throughout each period: | |
| | | Year
Ended
October 31,
2014 | | | Period
Ended
October 31,
2013(a) | |
Net asset value at beginning of period | | $ | 11.94 | | | $ | 11.22 | |
| | | | | | | | | |
| Income from investment operations: | | | | | | | | |
Net investment income | | | 0.12 | | | | 0.00 | (b)(c) |
Net realized and unrealized gains on investments | | | 1.28 | | | | 0.72 | |
Total from investment operations | | | 1.40 | | | | 0.72 | |
| | | | | | | | | |
| Less distributions: | | | | | | | | |
From net realized gains on investments | | | (0.36 | ) | | | — | |
| | | | | | | | | |
Net asset value at end of period | | $ | 12.98 | | | $ | 11.94 | |
| | | | | | | | | |
Total return (d) | | | 11.87 | % | | | 6.45 | %(e) |
| | | | | | | | | |
Net assets at end of period (000's) | | $ | 1,791 | | | $ | 23 | |
| | | | | | | | | |
Ratio of total expenses to average net assets | | | 1.00 | % | | | 0.99 | %(f) |
| | | | | | | | | |
Ratio of net investment income to average net assets | | | 1.47 | % | | | 0.17 | %(f) |
| | | | | | | | | |
Portfolio turnover rate | | | 29 | % | | | 26 | %(e) |
(a) | Represents the period from the commencement of operations (August 26, 2013) through October 31, 2013. |
(b) | Net investment income per share is based on average shares outstanding during the period. |
(c) | Amount rounds to less than $0.01 per share. |
(d) | Total return is a measure of the change in value of an investment in the Fund over the period covered, which assumes any dividends or capital gains distributions are reinvested in shares of the Fund. Returns shown do not reflect the deduction of taxes a shareholder would pay on Fund distributions or the redemption of Fund shares. |
(e) | Not annualized. |
(f) | Annualized. |
| See accompanying notes to financial statements. |
1789 GROWTH AND INCOME FUND
NOTES TO FINANCIAL STATEMENTS
October 31, 2014
1. ORGANIZATION
1789 Growth and Income Fund (the “Fund”), (formerly Pinnacle Growth and Income Fund) is a diversified series of Pinnacle Capital Management Funds Trust (the “Trust”), an open-end management investment company registered under the Investment Company Act of 1940 (the “1940 Act”), as amended, and organized as a statutory trust under the laws of Delaware by the filing of a Certificate of Trust on July 6, 2010.
The Fund seeks total return comprised of current income, growth of income, and capital appreciation.
The Fund currently offers three classes of shares: Class A shares (sold subject to an initial maximum front-end sales load of 5.25% and a distribution fee of up to 0.25% of the Fund’s average daily net assets attributable to Class A shares), Class C shares (sold subject to a contingent deferred sales charge (“CDSC”) of 1.00% if the shares are redeemed less than one year after the original purchase of the shares and a distribution and/or service fee of up to 1.00% of the Fund’s average daily net assets attributable to Class C shares) and Class P shares (sold without any sales loads, distribution or service fees). Each class of shares represents an interest in the same assets of the Fund, has the same rights and is identical in all material respects except that (1) the classes bear differing levels of sales loads and distribution fees and (2) each class has exclusive voting rights with respect to matters relating to its own distribution arrangements.
2. SIGNIFICANT ACCOUNTING POLICIES
The following is a summary of the Fund’s significant accounting policies which are in conformity with accounting principles generally accepted in the United States of America (“GAAP”).
SECURITIES VALUATION: The Fund’s portfolio securities are valued as of the close of business of the regular session of the New York Stock Exchange (normally 4:00 p.m., Eastern time). Equity securities generally are valued by using market quotations, but may be valued on the basis of prices furnished by a pricing service when Pinnacle Capital Management, LLC (the “Adviser”), the investment adviser to the Fund, believes such prices more accurately reflect the fair market value of such securities. Securities that are traded on any stock exchange or on the NASDAQ over-the-counter market are generally valued at the last quoted sale price. Lacking a last sale price, an equity security is generally valued at its last bid price. When quotations are not readily available, when the Adviser determines that the market quotation or the price provided by the pricing service does not accurately reflect the current market value, or when restricted or illiquid securities are being valued, such securities are valued as determined in good faith by the Adviser, in conformity with guidelines adopted by and subject to review of the Board of Trustees of the Trust.
1789 GROWTH AND INCOME FUND
NOTES TO FINANCIAL STATEMENTS (Continued)
Fixed income securities generally are valued by using market quotations, but may be valued on the basis of prices furnished by a pricing service when the Adviser believes such prices accurately reflect the fair market value of such securities. A pricing service utilizes electronic data processing techniques based on yield spreads relating to securities with similar characteristics to determine prices for normal institutional-size trading units of debt securities without regard to sale or bid prices. If the Adviser decides that a price provided by the pricing service does not accurately reflect the fair value of the securities, when prices are not readily available from a pricing service, or when restricted or illiquid securities are being valued, securities are valued at fair value as determined in good faith by the Adviser, in conformity with guidelines adopted by and subject to review of the Board of Trustees.
The Fund utilizes various methods to measure the fair value of most of its investments on a recurring basis. GAAP establishes a single authoritative definition of fair value, sets out a framework for measuring fair value and requires additional disclosures about fair value measurements.
Various inputs are used in determining the value of the Fund’s investments. These inputs are summarized in the three broad levels listed below:
| • | Level 1 - Unadjusted quoted prices in active markets for identical assets or liabilities |
| • | Level 2 - Observable inputs other than quoted prices included in Level 1 that are observable for the asset or liability, either directly or indirectly. These inputs may include quoted prices for the identical instrument on an inactive market, prices for similar instruments, interest rates, prepayment speeds, credit risk, yield curves, default rates and similar data |
| • | Level 3 - Unobservable inputs for the asset or liability, to the extent relevant observable inputs are not available, representing the Fund’s own assumptions about the assumptions a market participant would use in valuing the asset or liability, and would be based on the best information available |
The inputs or methodology used for valuing securities are not necessarily an indication of the risks associated with investing in those securities. The inputs used to measure fair value may fall into different levels of the fair value hierarchy. In such cases, for disclosure purposes, the level in the fair value hierarchy within which the fair value measurement falls in its entirety is determined based on the lowest level input that is significant to the fair value measurement.
1789 GROWTH AND INCOME FUND
NOTES TO FINANCIAL STATEMENTS (Continued)
The following is a summary of the inputs used to value the Fund’s investments measured as of October 31, 2014 by security type:
| | | Level 1 | | | Level 2 | | | Level 3 | | | Total | |
| Common Stocks | | $ | 8,569,185 | | | $ | — | | | $ | — | | | $ | 8,569,185 | |
| U.S. Treasury Obligations | | | — | | | | 200,602 | | | | — | | | | 200,602 | |
| Corporate Bonds | | | — | | | | 1,244,500 | | | | — | | | | 1,244,500 | |
| Closed-End Funds | | | 318,686 | | | | — | | | | — | | | | 318,686 | |
| Open-End Funds | | | 326,721 | | | | — | | | | — | | | | 326,721 | |
| Money Market Funds | | | 242,081 | | | | — | | | | — | | | | 242,081 | |
Total | | $ | 9,456,673 | | | $ | 1,445,102 | | | $ | — | | | $ | 10,901,775 | |
Refer to the Fund’s Schedule of Investments for a listing of the common stocks and corporate bonds by sector type. The Fund did not hold any Level 3 assets or liabilities as of October 31, 2014. The Fund did not hold any derivative instruments at any time during the year ended October 31, 2014. There were no transfers into or out of any Levels during the year. It is the Fund’s policy to recognize transfers into or out of Levels at the end of the reporting period.
SHARE VALUATION: The net asset value per share of each class of shares of the Fund is calculated daily by dividing the total value of the assets attributable to that class, less liabilities attributable to that class, by the number of shares of that class outstanding, rounded to the nearest cent. The maximum offering price per share of Class A shares of the Fund is equal to the net asset value per share plus a sales load equal to 5.56% of the net asset value (or 5.25% of the offering price). The offering price of Class C shares and Class P shares is equal to the net asset value per share. The redemption price per share of each class of shares of the Fund is equal to the net asset value per share. However, Class C shares are subject to a CDSC of 1.00% on amounts redeemed within one year of purchase and shares of each class are generally subject to a redemption fee of 1.00%, payable to the applicable class, if redeemed 60 days or less from the date of purchase. During the year ended October 31, 2014, proceeds from redemption fees, recorded in capital, totaled $42 for Class C shares. No redemption fees were collected for Class A or Class P shares.
INVESTMENT INCOME: Interest income is accrued as earned. Dividend income is recorded on the ex-dividend date. Discounts and premiums on fixed income securities are amortized using the interest method. Withholding taxes on foreign dividends have been provided for in accordance with the Fund’s understanding of the appropriate country’s rules and tax rates.
1789 GROWTH AND INCOME FUND
NOTES TO FINANCIAL STATEMENTS (Continued)
SECURITIES TRANSACTIONS: Securities transactions are accounted for on trade date for financial reporting purposes. Gains and losses on securities sold are determined on a specific identification basis.
DISTRIBUTIONS TO SHAREHOLDERS: Dividends arising from net investment income, if any, are declared and paid quarterly to shareholders. Net realized short-term capital gains, if any, may be distributed throughout the year and net realized long-term capital gains, if any, are distributed at least once each year. The amount of distributions from net investment income and net realized capital gains are determined in accordance with federal income tax regulations, which may differ from GAAP. Dividend and distributions are recorded on the ex-dividend date.
The tax character of distributions paid during the year ended October 31, 2014 was ordinary income. No distributions were paid during the year ended October 31, 2013.
USE OF ESTIMATES: The preparation of financial statements in conformity with GAAP requires management to make estimates and assumptions that affect the reported amounts of assets and liabilities and disclosure of contingent assets and liabilities at the date of the financial statements and the reported amounts of income and expenses during the reporting period. Actual results could differ from those estimates.
FEDERAL INCOME TAX: The Fund has qualified and intends to continue to qualify as a regulated investment company under the Internal Revenue Code of 1986 (the “Code”). Qualification generally will relieve the Fund of liability for federal income taxes to the extent 100% of its net investment income and net realized capital gains are distributed in accordance with the Code. Accordingly, no provision for income tax has been made.
In order to avoid imposition of the excise tax applicable to regulated investment companies, it is also the Fund’s intention to declare as dividends in each calendar year at least 98% of its net investment income (earned during the calendar year) and 98.2% of its net realized capital gains (earned during the twelve motnhs ended October 31) plus undistributed amounts from the prior year.
The following information is computed on a tax basis for each item as of October 31, 2014:
| Cost of portfolio investments | | $ | 9,459,320 | |
| Gross unrealized appreciation | | $ | 1,695,341 | |
| Gross unrealized depreciation | | | (252,886 | ) |
| Net unrealized appreciation | | | 1,442,455 | |
| Undistributed ordinary income | | | 91,289 | |
| Undistributed long-term gains | | | 174,666 | |
| Accumulated earnings | | $ | 1,708,410 | |
1789 GROWTH AND INCOME FUND
NOTES TO FINANCIAL STATEMENTS (Continued)
The difference between the federal income tax cost and the financial statement cost of the Fund’s portfolio investments is due to certain timing differences in the recognition of capital gains and losses under income tax regulations and GAAP. These timing differences are temporary in nature and are due to the tax deferral of losses on wash sales.
During the year ended October 31, 2014, the Fund utilized $96,165 of capital loss carryforwards to offset current year realized gains.
As of October 31, 2014, the Fund reclassified $840 of net investment income against paid-in capital on the Statement of Assets and Liabilities. Such reclassification, the result of permanent differences between the financial statement and income tax reporting requirements, has no effect on the Fund’s net assets or net asset values per share.
The Fund recognizes the tax benefits or expenses of uncertain tax positions only where the position is “more likely than not” to be sustained assuming examination by tax authorities. Management has reviewed the tax positions taken on Federal income tax returns for all open tax years (tax years ended October 31, 2011 through October 31, 2014) and has concluded that no provision for unrecognized tax benefits or expenses is required in these financial statements. The Fund identifies its major tax jurisdictions as U.S. Federal and certain State tax authorities; however the Fund is not aware of any tax positions for which it is reasonably possible that the total amounts of unrecognized tax benefits will change materially in the next twelve months.
The Fund recognizes interest and penalties, if any, related to unrecognized tax benefits as income tax expense in the Statement of Operations. During the year ended October 31, 2014, the Fund did not incur any material interest or penalties.
3. INVESTMENT TRANSACTIONS
During the year ended October 31, 2014, the cost of purchases and the proceeds from sales, other than U.S. Government securities and short-term securities, totaled $5,584,341 and $2,614,189, respectively.
4. TRANSACTIONS WITH RELATED PARTIES
INVESTMENT MANAGER: Under the terms of an Investment Management Agreement, the Adviser manages the investment portfolio of the Fund, subject to policies adopted by the Board of Trustees. Under the Investment Management Agreement, the Adviser furnishes office space and all necessary office facilities, equipment and executive personnel necessary for managing the assets of the Fund. For its services, the Adviser receives an investment advisory fee at the rate of 0.75% per annum of the Fund’s average daily net assets. During the year ended October 31, 2014, the Adviser earned $68,875 of advisory fees. At October 31, 2014, the Fund owed the Adviser $6,659 in advisory fees.
1789 GROWTH AND INCOME FUND
NOTES TO FINANCIAL STATEMENTS (Continued)
Under a Services Agreement, the Adviser is obligated to pay all of the operating expenses of the Fund, excluding advisory fees, brokerage fees and commissions, 12b-1 fees, taxes, borrowing costs, Trustee fees, dividend expense on securities sold short, the fees and expenses of acquired funds and extraordinary expenses. Under the Services Agreement, the Adviser receives a service fee at the rate of 0.24% per annum of the Fund’s average daily net assets. During the year ended October 31, 2014, the Fund incurred $22,040 of service fees. At October 31, 2014, the Fund owed the Adviser $1,779 in service fees.
Pinnacle Investments, LLC (the “Distributor”) is an affiliate of the Adviser and serves as the principal underwriter and distributor of the Fund’s shares pursuant to an agreement with the Trust. The Distributor promotes and sells shares of the Fund on a continuous basis. During the year ended October 31, 2014, the Distributor earned fees of $4,630 from underwriting and broker commissions on the sale of Class A shares of the Fund. In addition, Pinnacle collected $1,040 in contingent deferred sales loads on redemptions of Class C shares of the Fund.
DISTRIBUTION PLAN: The Fund has adopted a plan pursuant to Rule 12b-1 under the 1940 Act. Pursuant to the plan, Class A shares and Class C shares may pay for activities primarily intended to result in the sale of shares. The annual limitation for payment of expenses pursuant to the plan is 0.25% of average daily net assets attributable to Class A shares and 1.00% of average daily net assets attributable to Class C shares. During the year ended October 31, 2014, Class A shares and Class C shares incurred distribution fees of $271 and $79,710, respectively. At October 31, 2014, the Fund owed $14,764 in distribution fees.
TRUSTEE COMPENSATION: Each Trustee who is not an interested person of the Trust (“Independent Trustee”) receives from the Fund a fee of $250 for each in person Board meeting attended and $150 for each telephonic Board meeting attended.
1789 GROWTH AND INCOME FUND
NOTES TO FINANCIAL STATEMENTS (Continued)
5. CAPITAL SHARE TRANSACTIONS
Transactions in capital shares were as follows:
| | | Year Ended
October 31, 2014 | | | Period Ended
October 31, 2013* | |
| CLASS A SHARES | | Shares | | | Shares | |
| Shares sold | | | 12,535 | | | | 2,304 | |
| Shares issued in reinvestment of dividends | | | 151 | | | | — | |
| Net increase in shares outstanding | | | 12,686 | | | | 2,304 | |
| Shares outstanding, beginning of period | | | 2,304 | | | | — | |
| Shares outstanding, end of period | | | 14,990 | | | | 2,304 | |
| | | Year Ended
October 31, 2014 | | | Year Ended
October 31, 2013 | |
| CLASS C SHARES | | Shares | | | Shares | |
| Shares sold | | | 162,607 | | | | 119,408 | |
| Shares issued in reinvestment of dividends | | | 15,495 | | | | — | |
| Shares redeemed | | | (65,452 | ) | | | (37,788 | ) |
| Net increase in shares outstanding | | | 112,650 | | | | 81,620 | |
| Shares outstanding, beginning of year | | | 582,952 | | | | 501,332 | |
| Shares outstanding, end of year | | | 695,602 | | | | 582,952 | |
| | | Year Ended
October 31, 2014 | | | Period Ended
October 31, 2013* | |
| CLASS P SHARES | | Shares | | | Shares | |
| Shares sold | | | 138,314 | | | | 1,935 | |
| Shares issued in reinvestment of dividends | | | 1,764 | | | | — | |
| Shares redeemed | | | (4,022 | ) | | | — | |
| Net increase in shares outstanding | | | 136,056 | | | | 1,935 | |
| Shares outstanding, beginning of period | | | 1,935 | | | | — | |
| Shares outstanding, end of period | | | 137,991 | | | | 1,935 | |
| * | Represents the period from the commencement of operations (August 26, 2013) through October 31, 2013. |
1789 GROWTH AND INCOME FUND
NOTES TO FINANCIAL STATEMENTS (Continued)
6. BENEFICIAL OWNERSHIP
The beneficial ownership, either directly or indirectly, of more than 25% of the voting securities of the Fund creates a presumption of control of the Fund, under Section 2(a)(9) of the 1940 Act. As of October 31, 2014, approximately 78% of all outstanding shares of the Fund are owned by National Financial Service Corp. (“NFS”), for the benefit of its customers. The Fund does not know whether NFS held its shares beneficially or as record holder. Accordingly, the Fund does not know whether NFS or any other person controlled the Fund as of October 31, 2014.
7. CONTINGENCIES AND COMMITMENTS
The Fund indemnifies the Trust’s officers and Trustees for certain liabilities that might arise from their performance of their duties to the Fund. Additionally, in the normal course of business, the Fund enters into contracts that contain a variety of representations and warranties and which provide general indemnifications. The Fund’s maximum exposure under these arrangements is unknown, as this would involve future claims that may be made against the Fund that have not yet occurred. However, based on experience, the Fund expects the risk of loss to be remote.
8. SUBSEQUENT EVENTS
The Fund is required to recognize in the financial statements the effects of all subsequent events that provide additional evidence about conditions that existed as of the date of the Statement of Assets and Liabilities. For non-recognized subsequent events that must be disclosed to keep the financial statements from being misleading, the Fund is required to disclose the nature of the event as well as an estimate of its financial effect, or a statement that such an estimate cannot be made. Management has evaluated subsequent events through the issuance of these financial statements and has noted no such events.
1789 GROWTH AND INCOME FUND
REPORT OF INDEPENDENT REGISTERED
PUBLIC ACCOUNTING FIRM |
To the Shareholders of 1789 Growth and Income Fund
(formerly Pinnacle Growth and Income Fund) and
Board of Trustees of Pinnacle Capital Management Funds Trust
We have audited the accompanying statement of assets and liabilities, including the schedule of investments, of 1789 Growth and Income Fund (the “Fund”), a series of Pinnacle Capital Management Funds Trust, as of October 31, 2014, and the related statement of operations for the year then ended, the statements of changes in net assets for each of the two years in the period then ended, and the financial highlights for each of the four periods in the period then ended. These financial statements and financial highlights are the responsibility of the Fund’s management. Our responsibility is to express an opinion on these financial statements and financial highlights based on our audits.
We conducted our audits in accordance with the standards of the Public Company Accounting Oversight Board (United States). Those standards require that we plan and perform the audit to obtain reasonable assurance about whether the financial statements and financial highlights are free of material misstatement. An audit includes examining, on a test basis, evidence supporting the amounts and disclosures in the financial statements. Our procedures included confirmation of securities owned as of October 31, 2014, by correspondence with the custodian. An audit also includes assessing the accounting principles used and significant estimates made by management, as well as evaluating the overall financial statement presentation. We believe that our audits provide a reasonable basis for our opinion.
In our opinion, the financial statements and financial highlights referred to above present fairly, in all material respects, the financial position of 1789 Growth and Income Fund as of October 31, 2014, the results of its operations for the year then ended, the changes in its net assets for each of the two years in the period then ended, and the financial highlights for each of the four periods in the period then ended, in conformity with accounting principles generally accepted in the United States of America.
COHEN FUND AUDIT SERVICES, LTD.
Cleveland, Ohio
December 23, 2014
1789 GROWTH AND INCOME FUND
ABOUT YOUR FUND’S EXPENSES (Unaudited) |
We believe it is important for you to understand the impact of costs on your investment. All mutual funds have operating expenses. As a shareholder of the Fund, you incur two types of costs: (1) transaction costs, possibly including front-end and contingent deferred sales loads and redemption fees, and (2) ongoing costs, including management fees, Rule 12b-1 distribution fees (if applicable to your class) and other Fund expenses. The following examples are intended to help you understand your ongoing costs (in dollars) of investing in the Fund and to compare these costs with the ongoing costs of investing in other mutual funds.
A mutual fund’s ongoing costs are expressed as a percentage of its average net assets. This figure is known as the expense ratio. The expenses in the tables that follow are based on an investment of $1,000 made at the beginning of the most recent semi-annual period (May 1, 2014) and held until the end of the period (October 31, 2014).
The table that follows illustrates the Fund’s ongoing costs in two ways:
Actual fund return – This section helps you to estimate the actual expenses that you paid over the period. The “Ending Account Value” shown is derived from the Fund’s actual return, and the third column shows the dollar amount of operating expenses that would have been paid by an investor who started with $1,000 in the Fund. You may use the information here, together with the amount you invested, to estimate the expenses that you paid over the period.
To do so, simply divide your account value by $1,000 (for example, an $8,600 account value divided by $1,000 = 8.6), then multiply the result by the number given for the Fund under the heading “Expenses Paid During Period.”
Hypothetical 5% return – This section is intended to help you compare the Fund’s ongoing costs with those of other mutual funds. It assumes that the Fund had an annual return of 5% before expenses during the period shown, but that the expense ratio is unchanged. In this case, because the return used is not the Fund’s actual return, the results do not apply to your investment. The example is useful in making comparisons because the SEC requires all mutual funds to calculate expenses based on a 5% return. You can assess the Fund’s ongoing costs by comparing this hypothetical example with the hypothetical examples that appear in shareholder reports of other funds.
Note that expenses shown in the table are meant to highlight and help you compare ongoing costs only.
The calculations assume no shares were bought or sold during the period. Your actual costs may have been higher or lower, depending on the amount of your investment and the timing of any purchases or redemptions.
1789 GROWTH AND INCOME FUND
ABOUT YOUR FUND’S EXPENSES (Unaudited) (Continued)
More information about the Fund’s expenses, including historical expense ratios, can be found in this report. For additional information on operating expenses and other shareholder costs, please refer to the Fund’s prospectus.
| Class A | Beginning
Account Value
May 1, 2014 | Ending
Account Value
October 31, 2014 | Expenses
Paid During
Period* |
Based on Actual Fund Return | $1,000.00 | $1,030.90 | $6.81 |
Based on Hypothetical 5% Return (before expenses) | $1,000.00 | $1,018.50 | $6.77 |
| * | Expenses are equal to Class A shares’ annualized expense ratio of 1.33% for the period, multiplied by the average account value over the period, multiplied by 184/365 (to reflect the one-half year period). |
| Class C | Beginning
Account Value
May 1, 2014 | Ending
Account Value
October 31, 2014 | Expenses
Paid During
Period* |
Based on Actual Fund Return | $1,000.00 | $1,027.90 | $10.27 |
Based on Hypothetical 5% Return (before expenses) | $1,000.00 | $1,015.07 | $10.21 |
| * | Expenses are equal to Class C shares’ annualized expense ratio of 2.01% for the period, multiplied by the average account value over the period, multiplied by 184/365 (to reflect the one-half year period). |
| Class P | Beginning
Account Value
May 1, 2014 | Ending
Account Value
October 31, 2014 | Expenses
Paid During
Period* |
Based on Actual Fund Return | $1,000.00 | $1,032.50 | $5.17 |
Based on Hypothetical 5% Return (before expenses) | $1,000.00 | $1,020.11 | $5.14 |
| * | Expenses are equal to Class P shares’ annualized expense ratio of 1.01% for the period, multiplied by the average account value over the period, multiplied by 184/365 (to reflect the one-half year period). |
1789 GROWTH AND INCOME FUND
OTHER INFORMATION (Unaudited) |
A description of the policies and procedures that the Fund uses to vote proxies relating to portfolio securities is available without charge upon request by calling toll-free 1-888-229-9448, or on the SEC’s website at http://www.sec.gov. Information regarding how the Fund voted proxies relating to portfolio securities during the most recent 12-month period ended June 30 is available without charge upon request by calling toll-free 1-888-229-9448, or on the SEC’s website at http://www.sec.gov.
The Trust files a complete listing of portfolio holdings for the Fund with the SEC as of the end of the first and third quarters of each fiscal year on Form N-Q. These filings are available upon request by calling 1-888-229-9448. Furthermore, you may obtain a copy of the filings on the SEC’s website at http://www.sec.gov. The Trust’s Forms N-Q may also be reviewed and copied at the SEC’s Public Reference Room in Washington, DC, and information on the operation of the Public Reference Room may be obtained by calling 1-800-SEC-0330.
FEDERAL TAX INFORMATION (Unaudited)
In accordance with federal tax requirements, the following provides shareholders with information concerning distributions from ordinary income and net realized gains made by the Fund during the year ended October 31, 2014. Certain dividends paid by the Funds may be subject to a maximum rate of 23.8%. The Fund intends to designate up to a maximum amount of $245,376 as taxed at a maximum rate of 23.8%. As required by federal regulations, complete information will be computed and reported in conjunction with your 2014 1099-DIV.
1789 GROWTH AND INCOME FUND
BOARD OF TRUSTEES AND EXECUTIVE OFFICERS (Unaudited)
The Board of Trustees has overall responsibility for management of the Trust’s affairs. The Trustees serve during the lifetime of the Trust and until its termination, or until death, resignation, retirement, or removal. The Trustees, in turn, elect the officers of the Trust to actively supervise its day-to-day operations. The officers have been elected for an annual term. The following are the Trustees and executive officers of the Trust:
Name,
Address(1),
and Age | Position(s) with the Trust | Length of Time Served | Principal Occupation(s) During Past 5 Years | Number of Portfolios in Fund Complex Overseen by Trustee | Other Directorships Held by Trustee During the Past 5 Years |
| Independent Trustees |
Joseph Reagan, MD, (61) | Trustee | Indefinite Term; Since 2010 | Anesthesiologist, Anesthesia Group of Onondaga, PC. Adjunct Professor, Cornell University’s Sloan School of Management. Practice Consultant, Community General Hospital’s Anesthesia Group. | 1 | None |
Mark E. Wadach (63) | Trustee | Indefinite Term; Since 2014 | Sales Representative for Upstate Utilities Inc. (utilities, telecom and cellular) 2007 to present. | 1 | NYSA Series Trust for its one series. |
| Interested Trustee |
Michael Cuddy (2) (59) | Trustee | Indefinite Term; Since 2010 | First Vice President, Financial Advisor, Pinnacle Investments, LLC (Broker-Dealer, Registered Investment Advisor), July 2009 to present. | 1 | None |
1789 GROWTH AND INCOME FUND
BOARD OF TRUSTEES AND EXECUTIVE OFFICERS (Unaudited) (Continued)
Name,
Address(1),
and Age | Position(s)
with the
Trust | Length of
Time Served | Principal Occupation(s) During Past 5 Years |
| Executive Officers |
Cortland Schroder
(49) | President, Chief Executive Officer and Secretary | Indefinite
Term; Since 2014 | Chief Marketing Officer, Pinnacle Holding Co., LLC, July 2014 to present; Chief Marketing Officer, Pinnacle Capital Management, March 2014 to July 2014; Employment Transition Consultant (self employed), March 2013 to March 2014; Assoc. Director, Employer & External Relations at Colgate University (relationship management with business, banking and finance alumni/employers), August 2004 to March 2013. |
Stephen J. Fauer
(54) | Vice President and Treasurer | Indefinite
Term; Since 2010 | Chief Investment Officer, Portfolio Manager, Pinnacle Capital Management, LLC (Registered Investment Advisor), August 2006 to present. |
Kevin McClelland (27) | Vice President, Chief Operating Officer, and Chief Compliance Officer | Indefinite
Term; Since 2012 (CCO Since 2013) | Chief Operating Officer, Pinnacle Capital Management, LLC, April 2010 to present; Business Analyst, Pinnacle Investments, LLC (Broker-Dealer), 2008 to 2010. |
Cortland Schroder (49) | Secretary | Indefinite
Term; Since 2014 | Chief Marketing Officer, Pinnacle Holding Co., LLC, July 2014 to Present; Chief Marketing Officer, Pinnacle Capital Management, March 2014 to July 2014; Employment Transition Consultant (self employed), March 2013 to March 2014; Assoc. Director, Employer & External Relations at Colgate University (relationship management with business, banking and finance alumni/employers), August 2004 to March 2013. |
(1) | The address of each Trustee and officer is c/o Pinnacle Capital Management Funds Trust, 100 Limestone Plaza, Fayetteville, New York 13066. |
(2) | Trustee who is considered an “interested person” as defined in Section 2(a)(19) of the 1940 Act by virtue of his affiliation with the Investment Adviser. |
Additional information about the Trustees and executive officers is available in the Fund’s Statement of Additional Information (“SAI”). To obtain a free copy of the SAI, please call 1-888-229-9448.
1789 GROWTH AND INCOME FUND
APPROVAL OF INVESTMENT ADVISORY AGREEMENT (Unaudited)
Pinnacle Capital Management, LLC (the “Adviser”), 100 Limestone Plaza, Fayetteville, New York 13066, serves as the investment adviser to the 1789 Growth and Income Fund (the “Fund”). The Adviser provides the Fund with a continuous program of investing the Fund’s assets and determining the composition of the Fund’s portfolio. In addition to serving as the investment adviser to the Fund, the Adviser provides investment advisory services to individuals, corporations, pension funds, foundations, endowments, labor unions, insurance companies, healthcare organizations and governments.
The Adviser is subject to the oversight of the Fund and the Fund’s board of trustees (the “Board of Trustees”). The Adviser serves as investment adviser to the Fund pursuant to a written investment management agreement between the Adviser and the Fund dated November 19, 2010 (the “Advisory Agreement”). The Advisory Agreement provides that the Adviser shall not be liable for any loss suffered by the Fund or its shareholders, except by reason of its own willful misfeasance, bad faith or gross negligence, or from its reckless disregard of its duties under the Advisory Agreement. The Advisory Agreement is terminable by the Fund at any time, without penalty, either by action of the Board of Trustees or upon a vote of the holders of a majority of the outstanding voting securities of the Fund upon 60 days’ prior written notice to the Adviser. The Advisory Agreement is also terminable by the Adviser with 60 days’ prior written notice to the Fund, and will terminate automatically in the event of its “assignment,” as defined in the Investment Company Act of 1940 (the “1940 Act”), including in the event of a change of control or sale of the Adviser. The Advisory Agreement’s continues in force until November 19, 2014, after which it may be continued from year to year thereafter only as long as such continuance is approved annually by (a) the vote of a majority of the Board of Trustees, including a majority of the Trustees who are not “interested persons,” as defined by the 1940 Act, of the Trust (the “Independent Trustees”); or (b) the vote of a majority of the Fund’s outstanding voting securities (as defined in the 1940 Act).
The Board of Trustees, including the Fund’s Independent Trustees voting separately, reviewed and approved the continuance of the Advisory Agreement for an additional term of one year at an in-person meeting held on September 19, 2014, at which all of the Trustees were present. In the course of their deliberations, the Independent Trustees were advised by their independent legal counsel of their obligations in determining to approve the Advisory Agreement. The Trustees received and reviewed a substantial amount of information provided by the Adviser in response to requests of the Trustees and counsel.
In considering whether to approve the Advisory Agreement, the Board of Trustees, including the Independent Trustees, did not identify any single factor as determinative, and each Trustee weighed the various factors independently as he or she deemed appropriate. The Trustees considered the following matters, among other things, in connection with their approval of the Advisory Agreement.
1789 GROWTH AND INCOME FUND
APPROVAL OF INVESTMENT ADVISORY AGREEMENT (Unaudited) (Continued)
Nature, Extent and Quality of Services
The Trustees received and considered information regarding the nature, extent and quality of services provided to the Fund by the Adviser. The Trustees specifically reviewed the qualifications, backgrounds and responsibilities of the key personnel that oversee the investment management and day-to-day operations of the Fund, including the support resources available for investment research. The Trustees noted that Mr. Stephen Fauer is responsible for the day-to-day management of the Fund. The Trustees considered that the Adviser has a staff of skilled investment professionals that provide research and trading services to the Fund and determined that the Adviser possesses adequate resources to manage the Fund. The Trustees also considered the Adviser’s compliance program and noted the resources it has dedicated towards compliance, including providing a qualified compliance officer to oversee its compliance program. The Trustees also considered the overall investment management capabilities of the Adviser and its ongoing financial commitment to the Fund. The Trustees considered the Adviser’s responsibilities with regards to brokerage selection and best execution and were mindful that the Adviser does not enter into any “soft dollar” arrangements on behalf of the Fund.
Investment Performance of the Fund
The Fund’s returns were compared to the returns of its benchmark, the S&P 500 Total Return Index, and other domestic growth and income funds of similar size with similar investment styles. In reviewing the comparative performance, the Board considered that the Fund’s average annual total return for all three classes was higher than the average and median returns for the year to date and one year periods ended June 30, 2014 of its peer group, the “Moderate Allocation” category as derived from Morningstar, Inc. The Board also considered that the Fund’s investment objective and strategy had changed in August of 2013 from a balanced fund to a growth and income fund and the impact of such change on the historical performance of the Fund.
Expenses
The Board of Trustees considered statistical information regarding the Fund’s expense ratio and its various components, including the contractual advisory fee. It also considered that, in return for a service fee paid by the Fund, the Adviser pays all operating expenses of the Fund excluding advisory fees, brokerage fees and commissions, fees paid pursuant to the Fund’s Plan of Distribution Pursuant to Rule 12b-1 (“12b-1 fees”), taxes, borrowing costs, Trustee fees, dividend expense on securities sold short, the fees and expenses of acquired funds and extraordinary expenses. The Board of Trustees also considered a comparison of these fees and expenses to the expense information for other domestic growth and income funds of similar size with similar investment styles. The Fund’s overall expense ratio was compared to funds within its relevant peer group, as defined above. The Trustees noted that
1789 GROWTH AND INCOME FUND
APPROVAL OF INVESTMENT ADVISORY AGREEMENT (Unaudited) (Continued)
the overall expense ratio of the Fund’s Class A and Class P shares was lower than the average and median expense ratios for the peer group presented and that the overall expense ratio of the Fund’s Class C shares was higher than the average and median for the peer group.
Investment Advisory Fee Rates
The Trustees reviewed and considered the proposed contractual investment advisory fee rate payable by the Fund to the Adviser for investment advisory services. Additionally, the Trustees received and considered information comparing the Fund’s advisory fee rate with those of the other funds in its relevant peer group, as defined above. The Trustees noted that the advisory fee rate for the Fund was higher than the median and average rates for the peer group presented.
The Trustees reviewed the Adviser’s financial statements and discussed its financial condition. The Trustees discussed the level of Fund assets necessary for the Adviser to break even, the projected profits of the Adviser and the other ancillary benefits that the Adviser may receive with regard to providing advisory services to the Fund. The Trustees further considered the Adviser’s commitment to grow assets in the Fund and the Adviser’s representation that is has adequate financial resources to continue to provide service to the Fund.
Economies of Scale
The Trustees noted that the investment advisory fee schedule for the Fund does not contain breakpoints but that shareholders have benefited from the lower expense ratios that resulted from the service fee arrangement. The Trustees noted that the Fund’s assets have grown, but not to an extent that permits it to realize any meaningful economies of scale. The Trustees observed that as the Fund grows further in assets, this factor will become more relevant to their consideration process.
Conclusion
The Trustees determined that the overall arrangement between the Fund and the Adviser, as provided in the Advisory Agreement, was fair and reasonable and that approval of the continuance of the Advisory Agreement was in the best interests of the Fund and its shareholders.
This page intentionally left blank.
This page intentionally left blank.
INVESTMENT ADVISER
Pinnacle Capital Management, LLC
100 Limestone Plaza
Fayetteville, NY 13066
INDEPENDENT REGISTERED PUBLIC ACCOUNTING FIRM
Cohen Fund Audit Services, Ltd.
1350 Euclid Ave., Suite 800
Cleveland, OH 44115
LEGAL COUNSEL
Bond Schoeneck & King PLLC
One Lincoln Center
110 West Fayette Street
Syracuse, NY 13202
CUSTODIAN
U.S. Bank, N.A.
425 Walnut Street
Cincinnati, OH 45202
TRANSFER AGENT
Ultimus Fund Solutions, LLC
225 Pictoria Drive, Suite 450
Cincinnati, OH 45246
DISTRIBUTOR
Pinnacle Investments, LLC
100 Limestone Plaza
Fayetteville, NY 13066
This report is intended only for the information of shareholders or those who
have received the Fund’s prospectus which contains information about the Fund’s
management fee and expenses. Please read the prospectus carefully before investing.