UNITED STATES
SECURITIES AND EXCHANGE COMMISSION
Washington, D.C. 20549
FORM N-CSR
CERTIFIED SHAREHOLDER REPORT OF REGISTERED
MANAGEMENT INVESTMENT COMPANIES
| Investment Company Act file number | 811-22445 | |
| Pinnacle Capital Management Funds Trust |
| (Exact name of registrant as specified in charter) |
| 507 Plum Street, Suite 120, Syracuse, NY | 13204 |
| (Address of principal executive offices) | (Zip code) |
| Capital Services, Inc. 615 S. Dupont Hwy. Dover, DE 19901 |
| (Name and address of agent for service) |
With a copy to:
Jesse D. Hallee, Esq.
Ultimus Fund Solutions, LLC
225 Pictoria Drive, Suite 450
Cincinnati, Ohio 45246
| Registrant's telephone number, including area code: | (315) 234-9716 | |
| Date of fiscal year end: | October 31 | |
| | | |
| Date of reporting period: | April 30, 2023 | |
Form N-CSR is to be used by management investment companies to file reports with the Commission not later than 10 days after the transmission to stockholders of any report that is required to be transmitted to stockholders under Rule 30e-1 under the Investment Company Act of 1940 (17 CFR 270.30e-1). The Commission may use the information provided on Form N-CSR in its regulatory, disclosure review, inspection, and policymaking roles.
A registrant is required to disclose the information specified by Form N-CSR, and the Commission will make this information public. A registrant is not required to respond to the collection of information contained in Form N-CSR unless the Form displays a currently valid Office of Management and Budget ("OMB") control number. Please direct comments concerning the accuracy of the information collection burden estimate and any suggestions for reducing the burden to Secretary, Securities and Exchange Commission, 450 Fifth Street, NW, Washington, DC 20549-0609. The OMB has reviewed this collection of information under the clearance requirements of 44 U.S.C. § 3507.
| Item 1. | Reports to Stockholders. |

1789 Growth and Income Fund
Class P Shares | (PSEPX) |
Class C Shares | (PSECX) |
SEMI-ANNUAL REPORT
April 30, 2023
(Unaudited)
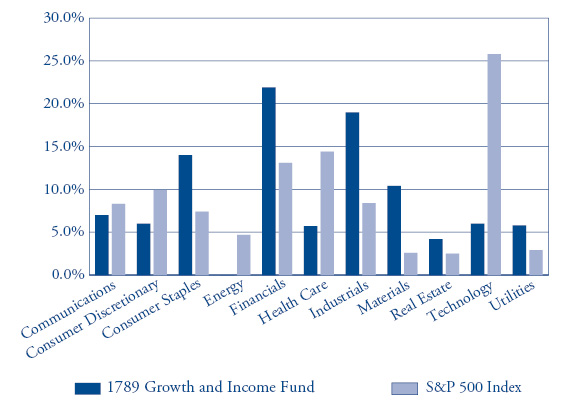
1789 GROWTH AND INCOME FUND
PORTFOLIO INFORMATION
April 30, 2023 (Unaudited)
Sector Diversification vs. S&P 500 Index (% of Common Stocks)
Top 10 Equity Holdings
Security Description | % of Net Assets |
Kroger Company (The) | 6.5% |
Interpublic Group of Companies, Inc. (The) | 5.8% |
Lockheed Martin Corporation | 5.8% |
Republic Services, Inc. | 5.3% |
Ingredion, Inc. | 5.1% |
First American Financial Corporation | 5.1% |
Mastercard, Inc. - Class A | 5.0% |
Home Depot, Inc. (The) | 5.0% |
NextEra Energy, Inc. | 4.8% |
CME Group, Inc. | 4.8% |
1
1789 GROWTH AND INCOME FUND
SCHEDULE OF INVESTMENTS
April 30, 2023 (Unaudited) |
COMMON STOCKS — 83.0% | | Shares | | | Value | |
Communications — 5.8% | | | | | | | | |
Advertising & Marketing — 5.8% | | | | | | | | |
Interpublic Group of Companies, Inc. (The) | | | 50,700 | | | $ | 1,811,511 | |
| | | | | | | | | |
Consumer Discretionary — 5.0% | | | | | | | | |
Retail - Discretionary — 5.0% | | | | | | | | |
Home Depot, Inc. (The) | | | 5,150 | | | | 1,547,781 | |
| | | | | | | | | |
Consumer Staples — 11.6% | | | | | | | | |
Food — 5.1% | | | | | | | | |
Ingredion, Inc. | | | 15,000 | | | | 1,592,550 | |
| | | | | | | | | |
Retail - Consumer Staples — 6.5% | | | | | | | | |
Kroger Company (The) | | | 41,250 | | | | 2,005,988 | |
| | | | | | | | | |
Financials — 18.2% | | | | | | | | |
Banking — 3.8% | | | | | | | | |
JPMorgan Chase & Company | | | 8,500 | | | | 1,175,040 | |
| | | | | | | | | |
Institutional Financial Services — 4.8% | | | | | | | | |
CME Group, Inc. | | | 7,950 | | | | 1,476,871 | |
| | | | | | | | | |
Insurance — 0.1% | | | | | | | | |
F&G Annuities & Life, Inc. | | | 2,645 | | | | 48,483 | |
| | | | | | | | | |
Specialty Finance — 9.5% | | | | | | | | |
Fidelity National Financial, Inc. | | | 38,900 | | | | 1,380,561 | |
First American Financial Corporation | | | 27,200 | | | | 1,566,992 | |
| | | | | | | | 2,947,553 | |
Health Care — 4.7% | | | | | | | | |
Health Care Facilities & Services — 4.7% | | | | | | | | |
UnitedHealth Group, Inc. | | | 2,975 | | | | 1,463,968 | |
| | | | | | | | | |
Industrials — 15.8% | | | | | | | | |
Aerospace & Defense — 5.8% | | | | | | | | |
Lockheed Martin Corporation | | | 3,875 | | | | 1,799,744 | |
See accompanying notes to financial statements. |
2
1789 GROWTH AND INCOME FUND
SCHEDULE OF INVESTMENTS (CONTINUED) |
COMMON STOCKS — 83.0% (Continued) | | Shares | | | Value | |
Industrials — 15.8% (Continued) | | | | | | | | |
Commercial Support Services — 5.3% | | | | | | | | |
Republic Services, Inc. | | | 11,300 | | | $ | 1,634,206 | |
| | | | | | | | | |
Transportation Equipment — 4.7% | | | | | | | | |
Cummins, Inc. | | | 6,250 | | | | 1,469,000 | |
| | | | | | | | | |
Materials — 8.6% | | | | | | | | |
Chemicals — 4.1% | | | | | | | | |
Celanese Corporation | | | 11,950 | | | | 1,269,568 | |
| | | | | | | | | |
Containers & Packaging — 4.5% | | | | | | | | |
Packaging Corporation of America | | | 10,350 | | | | 1,399,941 | |
| | | | | | | | | |
Real Estate — 3.5% | | | | | | | | |
REITs — 3.5% | | | | | | | | |
Crown Castle, Inc. | | | 8,750 | | | | 1,077,037 | |
| | | | | | | | | |
Technology — 5.0% | | | | | | | | |
Technology Services — 5.0% | | | | | | | | |
Mastercard, Inc. - Class A | | | 4,090 | | | | 1,554,323 | |
| | | | | | | | | |
Utilities — 4.8% | | | | | | | | |
Electric Utilities — 4.8% | | | | | | | | |
NextEra Energy, Inc. | | | 19,500 | | | | 1,494,285 | |
| | | | | | | | | |
Total Common Stocks (Cost $19,401,778) | | | | | | $ | 25,767,849 | |
|
MONEY MARKET FUNDS — 17.1% | | Shares | | | Value | |
Fidelity Institutional Money Market Government Portfolio - Class I, 4.73% (a) (Cost $5,313,055) | | | 5,313,055 | | | $ | 5,313,055 | |
| | | | | | | | | |
Total Investments at Value — 100.1% (Cost $24,714,833) | | | | | | $ | 31,080,904 | |
| | | | | | | | | |
Liabilities in Excess of Other Assets — (0.1%) | | | | | | | (52,331 | ) |
| | | | | | | | | |
Net Assets — 100.0% | | | | | | $ | 31,028,573 | |
(a) | The rate shown is the 7-day effective yield as of April 30, 2023. |
See accompanying notes to financial statements. |
3
1789 GROWTH AND INCOME FUND
STATEMENT OF ASSETS AND LIABILITIES
April 30, 2023 (Unaudited) |
ASSETS | | | | |
Investments in securities: | | | | |
At cost | | $ | 24,714,833 | |
At value (Note 2) | | $ | 31,080,904 | |
Cash | | | 12,000 | |
Dividends receivable | | | 33,307 | |
Other assets | | | 1,525 | |
TOTAL ASSETS | | | 31,127,736 | |
| | | | | |
LIABILITIES | | | | |
Accrued investment advisory fees (Note 4) | | | 30,137 | |
Accrued service fees (Note 4) | | | 5,798 | |
Accrued distribution plan fees (Note 4) | | | 63,228 | |
TOTAL LIABILITIES | | | 99,163 | |
| | | | | |
NET ASSETS | | $ | 31,028,573 | |
| | | | | |
Net assets consist of: | | | | |
Paid-in capital | | $ | 24,711,313 | |
Accumulated earnings | | | 6,317,260 | |
NET ASSETS | | $ | 31,028,573 | |
| | | | | |
PRICING OF CLASS P SHARES | | | | |
Net assets applicable to Class P Shares | | $ | 12,927,747 | |
Shares of beneficial interest outstanding (unlimited number of shares authorized, no par value) | | | 833,591 | |
Net asset value, offering price and redemption price per share (Note 2) | | $ | 15.51 | |
Short-term redemption price per share (Note 2) (a) | | $ | 15.35 | |
| | | | | |
PRICING OF CLASS C SHARES | | | | |
Net assets applicable to Class C Shares | | $ | 18,100,526 | |
Shares of beneficial interest outstanding (unlimited number of shares authorized, no par value) | | | 1,199,319 | |
Net asset value, offering price and redemption price per share (Note 2) | | $ | 15.09 | |
Redemption price per share with CDSC fee (Note 2) (b) | | $ | 14.94 | |
(a) | Class P shares of the Fund impose a 1.00% redemption fee on shares redeemed within 60 days of purchase. |
(b) | A contingent deferred sales charge (“CDSC”) of 1.00% is charged on Class C shares redeemed within one year of purchase. Redemption price per share is equal to net asset value less any redemption fee or CDSC. |
See accompanying notes to financial statements. |
4
1789 GROWTH AND INCOME FUND
STATEMENT OF OPERATIONS
For the Six Months Ended April 30, 2023 (Unaudited) |
INVESTMENT INCOME | | | | |
Dividends | | $ | 546,537 | |
| | | | | |
EXPENSES | | | | |
Investment advisory fees (Note 4) | | | 117,295 | |
Distribution fees, Class C (Note 4) | | | 90,198 | |
Service fees (Note 4) | | | 37,534 | |
Trustees’ fees (Note 4) | | | 2,975 | |
TOTAL EXPENSES | | | 248,002 | |
| | | | | |
NET INVESTMENT INCOME | | | 298,535 | |
| | | | | |
REALIZED AND UNREALIZED GAINS (LOSSES) ON INVESTMENTS | | | | |
Net realized losses from investment transactions | | | (40,439 | ) |
Net change in unrealized appreciation (depreciation) on investments | | | 922,796 | |
NET REALIZED AND UNREALIZED GAINS ON INVESTMENTS | | | 882,357 | |
| | | | | |
NET INCREASE IN NET ASSETS RESULTING FROM OPERATIONS | | $ | 1,180,892 | |
See accompanying notes to financial statements. |
5
1789 GROWTH AND INCOME FUND
STATEMENTS OF CHANGES IN NET ASSETS |
| | Six Months
Ended
April 30,
2023
(Unaudited) | | | Year
Ended
October 31,
2022 | |
FROM OPERATIONS | | | | | | | | |
Net investment income | | $ | 298,535 | | | $ | 76,024 | |
Net realized gains (losses) from investment transactions | | | (40,439 | ) | | | 1,200,547 | |
Net change in unrealized appreciation (depreciation) on investments | | | 922,796 | | | | (3,234,443 | ) |
Net increase (decrease) in net assets resulting from operations | | | 1,180,892 | | | | (1,957,872 | ) |
| | | | | | | | | |
FROM DISTRIBUTIONS TO SHAREHOLDERS (Note 2) | | | | | | | | |
From distributable earnings | | | | | | | | |
Class P | | | (649,850 | ) | | | (238,542 | ) |
Class C | | | (841,886 | ) | | | (314,791 | ) |
Decrease in net assets from distributions to shareholders | | | (1,491,736 | ) | | | (553,333 | ) |
| | | | | | | | | |
FROM CAPITAL SHARE TRANSACTIONS (Notes 1 and 5) | | | | | | | | |
Class P | | | | | | | | |
Proceeds from shares sold | | | 608,257 | | | | 1,934,803 | |
Net asset value of shares issued in reinvestment of distributions | | | 535,013 | | | | 200,484 | |
Proceeds from redemption fees collected (Note 2) | | | — | | | | 3,883 | |
Payments for shares redeemed | | | (1,246,487 | ) | | | (1,813,245 | ) |
Net increase (decrease) in Class P shares capital share transactions | | | (103,217 | ) | | | 325,925 | |
| | | | | | | | | |
Class C | | | | | | | | |
Proceeds from shares sold | | | 518,740 | | | | 2,659,011 | |
Net asset value of shares issued in reinvestment of distributions | | | 796,934 | | | | 298,123 | |
Payments for shares redeemed | | | (836,958 | ) | | | (2,788,733 | ) |
Net increase in Class C shares capital share transactions | | | 478,716 | | | | 168,401 | |
| | | | | | | | | |
TOTAL INCREASE (DECREASE) IN NET ASSETS | | | 64,655 | | | | (2,016,879 | ) |
| | | | | | | | | |
NET ASSETS | | | | | | | | |
Beginning of period | | | 30,963,918 | | | | 32,980,797 | |
End of period | | $ | 31,028,573 | | | $ | 30,963,918 | |
See accompanying notes to financial statements. |
6
1789 GROWTH AND INCOME FUND - CLASS P
FINANCIAL HIGHLIGHTS |
Per share data for a share outstanding throughout each period: |
| | Six Months
Ended
April 30,
2023
(Unaudited) | | | Year
Ended
October 31,
2022 | | | Year
Ended
October 31,
2021 | | | Year
Ended
October 31,
2020 | | | Year
Ended
October 31,
2019 | | | Year
Ended
October 31,
2018 | |
Net asset value at beginning of period | | $ | 15.65 | | | $ | 16.79 | | | $ | 12.97 | | | $ | 13.95 | | | $ | 12.81 | | | $ | 12.60 | |
| | | | | | | | | | | | | | | | | | | | | | | | | |
Income (loss) from investment operations: | | | | | | | | | | | | | | | | | | | | | | | | |
Net investment income (a) | | | 0.19 | | | | 0.13 | | | | 0.14 | | | | 0.15 | | | | 0.24 | | | | 0.17 | |
Net realized and unrealized gains (losses) on investments | | | 0.45 | | | | (0.98 | ) | | | 3.77 | | | | (0.96 | ) | | | 1.87 | | | | 0.20 | |
Total from investment operations | | | 0.64 | | | | (0.85 | ) | | | 3.91 | | | | (0.81 | ) | | | 2.11 | | | | 0.37 | |
| | | | | | | | | | | | | | | | | | | | | | | | | |
Less distributions from: | | | | | | | | | | | | | | | | | | | | | | | | |
Net investment income | | | (0.18 | ) | | | (0.05 | ) | | | (0.09 | ) | | | (0.13 | ) | | | (0.25 | ) | | | (0.16 | ) |
Net realized gains on investments | | | (0.60 | ) | | | (0.24 | ) | | | — | | | | (0.03 | ) | | | (0.72 | ) | | | — | |
Return of capital | | | — | | | | — | | | | — | | | | (0.01 | ) | | | — | | | | — | |
Total distributions | | | (0.78 | ) | | | (0.29 | ) | | | (0.09 | ) | | | (0.17 | ) | | | (0.97 | ) | | | (0.16 | ) |
| | | | | | | | | | | | | | | | | | | | | | | | | |
Proceeds from redemption fees collected (Note 2) | | | — | | | | 0.00 | (b) | | | — | | | | 0.00 | (b) | | | 0.00 | (b) | | | 0.00 | (b) |
| | | | | | | | | | | | | | | | | | | | | | | | | |
Net asset value at end of period | | $ | 15.51 | | | $ | 15.65 | | | $ | 16.79 | | | $ | 12.97 | | | $ | 13.95 | | | $ | 12.81 | |
| | | | | | | | | | | | | | | | | | | | | | | | | |
Total return (c) | | | 4.16 | %(d) | | | (5.22 | %) | | | 30.26 | % | | | (5.84 | %) | | | 17.98 | % | | | 2.88 | % |
| | | | | | | | | | | | | | | | | | | | | | | | | |
Net assets at end of period (000’s) | | $ | 12,928 | | | $ | 13,152 | | | $ | 13,779 | | | $ | 13,047 | | | $ | 14,030 | | | $ | 17,886 | |
| | | | | | | | | | | | | | | | | | | | | | | | | |
Ratio of total expenses to average net assets | | | 1.01 | %(e) | | | 1.01 | % | | | 1.00 | % | | | 1.00 | % | | | 1.01 | % | | | 1.00 | % |
| | | | | | | | | | | | | | | | | | | | | | | | | |
Ratio of net investment income to average net assets | | | 2.49 | %(e) | | | 0.82 | % | | | 0.91 | % | | | 1.13 | % | | | 1.84 | % | | | 1.29 | % |
| | | | | | | | | | | | | | | | | | | | | | | | | |
Portfolio turnover rate | | | 3 | %(d) | | | 14 | % | | | 10 | % | | | 5 | % | | | 18 | % | | | 120 | % |
(a) | Net investment income per share is based on average shares outstanding during the period. |
(b) | Amount rounds to less than $0.01 per share. |
(c) | Total return is a measure of the change in value of an investment in the Fund over the period covered, which assumes any dividends or capital gains distributions are reinvested in shares of the Fund. Returns shown do not reflect the deduction of taxes a shareholder would pay on Fund distributions or the redemption of Fund shares. |
(d) | Not annualized. |
(e) | Annualized. |
See accompanying notes to financial statements. |
7
1789 GROWTH AND INCOME FUND - CLASS C
FINANCIAL HIGHLIGHTS |
Per share data for a share outstanding throughout each period: |
| | Six Months
Ended
April 30,
2023
(Unaudited) | | | Year
Ended
October 31,
2022 | | | Year
Ended
October 31,
2021 | | | Year
Ended
October 31,
2020 | | | Year
Ended
October 31,
2019 | | | Year
Ended
October 31,
2018 | |
Net asset value at beginning of period | | $ | 15.27 | | | $ | 16.53 | | | $ | 12.84 | | | $ | 13.85 | | | $ | 12.73 | | | $ | 12.54 | |
| | | | | | | | | | | | | | | | | | | | | | | | | |
Income (loss) from investment operations: | | | | | | | | | | | | | | | | | | | | | | | | |
Net investment income (loss) (a) | | | 0.11 | | | | (0.03 | ) | | | (0.02 | ) | | | 0.02 | | | | 0.10 | | | | 0.04 | |
Net realized and unrealized gains (losses) on investments | | | 0.43 | | | | (0.96 | ) | | | 3.74 | | | | (0.96 | ) | | | 1.87 | | | | 0.19 | |
Total from investment operations | | | 0.54 | | | | (0.99 | ) | | | 3.72 | | | | (0.94 | ) | | | 1.97 | | | | 0.23 | |
| | | | | | | | | | | | | | | | | | | | | | | | | |
Less distributions from: | | | | | | | | | | | | | | | | | | | | | | | | |
Net investment income | | | (0.12 | ) | | | (0.03 | ) | | | (0.03 | ) | | | (0.04 | ) | | | (0.13 | ) | | | (0.04 | ) |
Net realized gains on investments | | | (0.60 | ) | | | (0.24 | ) | | | — | | | | (0.03 | ) | | | (0.72 | ) | | | — | |
Return of capital | | | — | | | | — | | | | — | | | | (0.00 | )(b) | | | — | | | | — | |
Total distributions | | | (0.72 | ) | | | (0.27 | ) | | | (0.03 | ) | | | (0.07 | ) | | | (0.85 | ) | | | (0.04 | ) |
| | | | | | | | | | | | | | | | | | | | | | | | | |
Net asset value at end of period | | $ | 15.09 | | | $ | 15.27 | | | $ | 16.53 | | | $ | 12.84 | | | $ | 13.85 | | | $ | 12.73 | |
| | | | | | | | | | | | | | | | | | | | | | | | | |
Total return (c) | | | 3.58 | %(d) | | | (6.19 | %) | | | 29.02 | % | | | (6.79 | %) | | | 16.80 | % | | | 1.84 | % |
| | | | | | | | | | | | | | | | | | | | | | | | | |
Net assets at end of period (000’s) | | $ | 18,101 | | | $ | 17,812 | | | $ | 19,202 | | | $ | 15,932 | | | $ | 15,679 | | | $ | 9,981 | |
| | | | | | | | | | | | | | | | | | | | | | | | | |
Ratio of total expenses to average net assets | | | 2.01 | %(e) | | | 2.01 | % | | | 2.00 | % | | | 2.00 | % | | | 2.01 | % | | | 2.00 | % |
| | | | | | | | | | | | | | | | | | | | | | | | | |
Ratio of net investment income (loss) to average net assets | | | 1.48 | %(e) | | | (0.19 | %) | | | (0.10 | %) | | | 0.15 | % | | | 0.77 | % | | | 0.32 | % |
| | | | | | | | | | | | | | | | | | | | | | | | | |
Portfolio turnover rate | | | 3 | %(d) | | | 14 | % | | | 10 | % | | | 5 | % | | | 18 | % | | | 120 | % |
(a) | Net investment income (loss) per share is based on average shares outstanding during the period. |
(b) | Amount rounds to less than $0.01 per share. |
(c) | Total return is a measure of the change in value of an investment in the Fund over the period covered, which assumes any dividends or capital gains distributions are reinvested in shares of the Fund. Returns shown do not reflect the deduction of taxes a shareholder would pay on Fund distributions or the redemption of Fund shares. |
(d) | Not annualized. |
(e) | Annualized. |
See accompanying notes to financial statements. |
8
1789 GROWTH AND INCOME FUND
NOTES TO FINANCIAL STATEMENTS
April 30, 2023 (Unaudited)
1. ORGANIZATION
1789 Growth and Income Fund (the “Fund”) is a diversified series of Pinnacle Capital Management Funds Trust (the “Trust”), an open-end management investment company registered under the Investment Company Act of 1940, as amended (the “1940 Act”), and organized as a statutory trust under the laws of Delaware by the filing of a Certificate of Trust on July 6, 2010.
The Fund seeks total return comprised of current income, growth of income, and capital appreciation.
The Fund currently offers two classes of shares: Class P shares (sold without any sales loads or distribution fees); and Class C shares (sold subject to a contingent deferred sales charge (“CDSC”) of 1.00% if the shares are redeemed within one year after the original purchase of the shares and a distribution fee of up to 1.00% per annum of the Fund’s average daily net assets attributable to Class C shares).
Each class of shares represents an interest in the same assets of the Fund, has the same rights and is identical in all material respects except that (1) the classes bear differing levels of sales loads and distribution fees and (2) each class has exclusive voting rights with respect to matters relating to its own distribution arrangements.
2. SIGNIFICANT ACCOUNTING POLICIES
The following is a summary of the Fund’s significant accounting policies used in the preparation of its financial statements. These policies are in conformity with accounting principles generally accepted in the United States of America (“GAAP”). The Fund follows accounting and reporting guidance under Financial Accounting Standards Board Accounting Standards Codification Topic 946, Financial Services – Investment Companies.
SECURITIES VALUATION: The Fund’s portfolio securities are valued as of the close of business of the regular session of the New York Stock Exchange (normally 4:00 p.m., Eastern time). Common stocks generally are valued using market quotations but may be valued on the basis of prices furnished by a pricing service when Pinnacle Capital Management, LLC (the “Adviser”), and (‘valuation designee’), believes such prices more accurately reflect the fair value of such securities. Securities that are traded on any stock exchange or on the NASDAQ over-the-counter market are generally valued at the last quoted sale price. Lacking a last sale price, an equity security is generally valued at its last bid price. Investments representing shares of other open-end investment companies, including money market funds, are valued at their net asset value (“NAV”) as reported by such companies. When using a quoted price and when the market for the security is considered active, the security will be classified as Level 1 within the fair value hierarchy (see below). When quotations are not readily available, when the valuation designee determines that the
9
1789 GROWTH AND INCOME FUND
NOTES TO FINANCIAL STATEMENTS (Continued)
market quotation or the price provided by the pricing service does not accurately reflect the current market value, or when restricted or illiquid securities are being valued, such securities are valued at fair value as determined in good faith by the valuation designee, in conformity with guidelines adopted by and subject to review of the Board of Trustees of the Trust, pursuant to Rule 2a-5 under the 1940 Act. Under these procedures, the securities will be classified as Level 2 or 3 within the fair value hierarchy, depending on the inputs used. Such methods of fair valuation may include, but are not limited to: multiple of earnings, multiple of book value, discount from market of a similar freely traded security, purchase price of the security, subsequent private transactions in the security or related securities, or a combination of these and other factors.
The Fund utilizes various methods to measure the fair value of its investments on a recurring basis. GAAP establishes a single authoritative definition of fair value, sets out a framework for measuring fair value and requires additional disclosures about fair value measurements.
Various inputs are used in determining the value of the Fund’s investments. These inputs are summarized in the three broad levels listed below:
| | ● | Level 1 - Unadjusted quoted prices in active markets for identical assets or liabilities |
| | ● | Level 2 - Observable inputs other than quoted prices included in Level 1 that are observable for the asset or liability, either directly or indirectly; these inputs may include quoted prices for the identical instrument on an inactive market, prices for similar instruments, interest rates, prepayment speeds, credit risk, yield curves, default rates and similar data |
| | ● | Level 3 - Unobservable inputs for the asset or liability, to the extent relevant observable inputs are not available, representing the Fund’s own assumptions about the assumptions a market participant would use in valuing the asset or liability, and based on the best information available |
The inputs or methodology used for valuing securities are not necessarily an indication of the risks associated with investing in those securities. The inputs used to measure fair value may fall into different levels of the fair value hierarchy. In such cases, for disclosure purposes, the level in the fair value hierarchy within which the fair value measurement falls in its entirety is determined based on the lowest level input that is significant to the fair value measurement.
The following is a summary of the Fund’s investments based on the inputs used to value the investments as of April 30, 2023 by security type:
| | Level 1 | | | Level 2 | | | Level 3 | | | Total | |
Common Stocks | | $ | 25,767,849 | | | $ | — | | | $ | — | | | $ | 25,767,849 | |
Money Market Funds | | | 5,313,055 | | | | — | | | | — | | | | 5,313,055 | |
Total | | $ | 31,080,904 | | | $ | — | | | $ | — | | | $ | 31,080,904 | |
10
1789 GROWTH AND INCOME FUND
NOTES TO FINANCIAL STATEMENTS (Continued)
Refer to the Fund’s Schedule of Investments for a listing of the common stocks by sector and industry type. The Fund did not hold derivative instruments or any assets or liabilities that were measured at fair value on a recurring basis using significant unobservable inputs (Level 3) as of or during the six months ended April 30, 2023.
SHARE VALUATION: The NAV per share of each class of shares of the Fund is calculated daily by dividing the total value of the assets attributable to that class, less liabilities attributable to that class, by the number of shares of that class outstanding, rounded to the nearest cent. The offering price of Class C shares and Class P shares is equal to the NAV per share. The redemption price per share of each class of shares of the Fund is equal to the NAV per share, except that (i) Class C shares are subject to a CDSC of 1.00% on shares redeemed within one year of purchase and (ii) Class P shares are generally subject to a redemption fee of 1.00%, payable to the class, if redeemed within 60 days or less from the date of purchase. During the periods ended April 30, 2023 and October 31, 2022, proceeds from redemption fees, recorded in capital, totaled $0 and $3,883, respectively, for Class P Shares.
INVESTMENT INCOME: Interest income is accrued as earned. Dividend income is recorded on the ex-dividend date. Non-cash dividends included in dividend income, if any, are recorded at the fair market value of the security received. The Fund may invest in real estate investment trusts (“REITs”) that pay distributions to their shareholders based on available funds from operations. It is common for these distributions to exceed the REIT’s taxable earnings and profits resulting in the excess portion of such distribution to be designated as return of capital. Distributions received from REITs are generally recorded as dividend income and, if necessary, are reclassified annually in accordance with tax information provided by the underlying REITs. Discounts and premiums on fixed income securities, if any, are amortized using the interest method.
INVESTMENT TRANSACTIONS: Investment transactions are accounted for on trade date for financial reporting purposes. Realized gains and losses on investments sold are determined on a specific identification basis.
ALLOCATIONS BETWEEN CLASSES: Investment income earned, realized capital gains and losses, and unrealized appreciation and depreciation are allocated daily to each class of shares based upon its proportionate share of total net assets of the Fund. Class specific expenses are charged directly to the class incurring the expense. Common expenses which are not attributable to a specific class are allocated daily to each class of shares based upon its proportionate share of total net assets of the Fund.
DISTRIBUTIONS TO SHAREHOLDERS: Dividends arising from net investment income, if any, are declared and paid quarterly to shareholders. Net realized short-term capital gains, if any, may be distributed throughout the year and net realized long-term capital gains, if any, are distributed at least once each year. The amount of distributions from net investment income and net realized capital gains are determined in accordance
11
1789 GROWTH AND INCOME FUND
NOTES TO FINANCIAL STATEMENTS (Continued)
with federal income tax regulations, which may differ from GAAP. Dividends and distributions are recorded on the ex-dividend date. The tax character of distributions paid during the periods ended April 30, 2023 and October 31, 2022 was as follows:
Period Ended | | Ordinary
Income | | | Long-Term
Capital Gains | | | Total
Distributions | |
April 30, 2023 | | $ | 389,865 | | | $ | 1,101,871 | | | $ | 1,491,736 | |
October 31, 2022 | | $ | 101,097 | | | $ | 452,236 | | | $ | 553,333 | |
USE OF ESTIMATES: The preparation of financial statements in conformity with GAAP requires management to make estimates and assumptions that affect the reported amounts of assets and liabilities and disclosure of contingent assets and liabilities as of the date of the financial statements and the reported amounts of increase (decrease) in net assets from operations during the reporting period. Actual results could differ from those estimates.
FEDERAL INCOME TAX: The Fund has qualified and intends to continue to qualify as a regulated investment company under the Internal Revenue Code of 1986, as amended (the “Code”). Qualification generally will relieve the Fund of liability for federal income taxes to the extent 100% of its net investment income and net realized capital gains are distributed in accordance with the Code.
In order to avoid imposition of the excise tax applicable to regulated investment companies, it is also the Fund’s intention to declare as dividends in each calendar year at least 98% of its net investment income (earned during the calendar year) and 98.2% of its net realized capital gains (earned during the twelve months ended October 31) plus undistributed amounts from the prior year.
The following information is computed on a tax basis for each item as of October 31, 2022:
Cost of investments | | $ | 24,591,018 | |
Gross unrealized appreciation | | $ | 6,147,473 | |
Gross unrealized depreciation | | | (722,616 | ) |
Net unrealized appreciation | | | 5,424,857 | |
Undistributed ordinary income | | | 101,486 | |
Undistributed long-term capital gains | | | 1,101,761 | |
Distributable earnings | | $ | 6,628,104 | |
12
1789 GROWTH AND INCOME FUND
NOTES TO FINANCIAL STATEMENTS (Continued)
The Federal tax cost, unrealized appreciation (depreciation) as of April 30, 2023 is as follows:
Cost of investments | | $ | 24,733,251 | |
Gross unrealized appreciation | | $ | 6,728,036 | |
Gross unrealized depreciation | | | (380,383 | ) |
Net unrealized appreciation | | | 6,347,653 | |
The difference between the federal income tax cost and the financial statement cost of the Fund’s investments is due to certain timing differences in the recognition of capital gains and losses under income tax regulations and GAAP. These timing differences are temporary in nature and are due to the tax deferral of losses on wash sales.
The Fund recognizes the tax benefits or expenses of uncertain tax positions only where the position is “more likely than not” to be sustained assuming examination by tax authorities. Management has reviewed the tax positions taken on Federal income tax returns for the current and all open tax years (generally, three years) and has concluded that no provision for unrecognized tax benefits or expenses is required in these financial statements. The Fund identifies its major tax jurisdictions as U.S. Federal and certain State tax authorities. The Fund is not aware of any tax positions for which it is reasonably likely that the total amounts of unrecognized tax benefits or expenses will change materially in the next twelve months.
The Fund recognizes interest and penalties, if any, related to unrecognized tax expenses as income tax expense on the Statement of Operations. During the six months ended April 30, 2023, the Fund did not incur any interest or penalties.
3. INVESTMENT TRANSACTIONS
During the six months ended April 30, 2023, the cost of purchases and the proceeds from sales and maturities of investment securities, other than U.S. Government securities and short-term securities, totaled $1,591,635 and $759,761 respectively.
4. TRANSACTIONS WITH RELATED PARTIES
A Trustee and certain officers of the Trust are affiliated with the Adviser, Ultimus Fund Solutions, LLC (“Ultimus”), the Fund’s administrator, transfer agent and fund accounting agent, or Pinnacle Investments, LLC (the “Distributor”), the principal underwriter of the Fund’s shares.
INVESTMENT MANAGER: Under the terms of an Investment Management Agreement, the Adviser manages the investment portfolio of the Fund, subject to policies adopted by the Board of Trustees. Under the Investment Management Agreement, the Adviser furnishes
13
1789 GROWTH AND INCOME FUND
NOTES TO FINANCIAL STATEMENTS (Continued)
office space and all necessary office facilities, equipment and executive personnel necessary for managing the assets of the Fund. For its services, the Adviser receives an investment advisory fee at the rate of 0.75% per annum, accrued daily and paid monthly, of the Fund’s average daily net assets. For the six months ended April 30, 2023, the Adviser earned $117,295 in investment advisory fees.
Under a Services Agreement, the Adviser is obligated to pay all of the operating expenses of the Fund, excluding advisory fees, brokerage fees and commissions, distribution fees, taxes, borrowing costs, fees and expenses of non-interested Trustees of the Trust, dividend expense on securities sold short, the fees and expenses of acquired funds and extraordinary expenses. Under the Services Agreement, the Adviser receives a service fee at the rate of 0.24% per annum of the Fund’s average daily net assets.
DISTRIBUTOR: The Distributor is an affiliate of the Adviser and serves as the principal underwriter of the Fund’s shares pursuant to an agreement with the Trust. The Distributor promotes and sells shares of the Fund on a continuous basis. During the six months ended April 30, 2023, the Distributor collected $776 in CDSCs on redemptions of Class C shares of the Fund.
DISTRIBUTION PLAN: The Fund has adopted a distribution plan pursuant to Rule 12b-1 under the 1940 Act (the “Plan”). Pursuant to the Plan, Class C shares may pay brokers for activities primarily intended to result in the sale of shares. The annual limitation for payment of expenses pursuant to the Plan is 1.00% of average daily net assets attributable to Class C shares. During the six months ended April 30, 2023, Class C shares incurred distribution fees of $90,198.
TRUSTEE COMPENSATION: Each Trustee who is not an interested person of the Trust (“Independent Trustee”) receives from the Fund a fee of $500 for each Board meeting attended, either in person or by telephone.
OTHER SERVICE PROVIDER: The Trust has entered into mutual fund services agreements with Ultimus, pursuant to which Ultimus provides day-to-day operational services to the Fund including, but not limited to, accounting, administrative, transfer agent, dividend disbursing, and recordkeeping services. The fees payable to Ultimus are paid by the Adviser (not the Fund).
14
1789 GROWTH AND INCOME FUND
NOTES TO FINANCIAL STATEMENTS (Continued)
PRINCIPAL HOLDER OF FUND SHARES: As of April 30, 2023, the following shareholder owned of record 25% or more of the outstanding shares of each class of the Fund:
NAME OF RECORD OWNER | | % Ownership | |
Class P Shares | | | | |
Wells Fargo Clearing Services (for the benefit of its customers) | | | 75 | % |
Class C Shares | | | | |
Wells Fargo Clearing Services (for the benefit of its customers) | | | 71 | % |
A beneficial owner of 25% or more of the Fund’s outstanding shares may be considered a controlling person. That shareholder’s vote could have a more significant effect on matters presented at a shareholders’ meeting.
5. CAPITAL SHARE TRANSACTIONS
Transactions in capital shares were as follows:
| | | Six Months Ended
April 30, 2023 | | | Year Ended
October 31, 2022 | |
CLASS P SHARES | | Shares | | | Shares | |
Shares sold | | | 38,812 | | | | 116,324 | |
Shares issued in reinvestment of dividends | | | 34,832 | | | | 11,482 | |
Shares redeemed | | | (80,244 | ) | | | (108,114 | ) |
Net increase (decrease) in shares outstanding | | | (6,600 | ) | | | 19,692 | |
Shares outstanding, beginning of period | | | 840,191 | | | | 820,499 | |
Shares outstanding, end of period | | | 833,591 | | | | 840,191 | |
| | | Six Months Ended
April 30, 2023 | | | Year Ended
October 31, 2022 | |
CLASS C SHARES | | Shares | | | Shares | |
Shares sold | | | 34,051 | | | | 160,622 | |
Shares issued in reinvestment of dividends | | | 53,288 | | | | 17,353 | |
Shares redeemed | | | (54,596 | ) | | | (172,956 | ) |
Net increase in shares outstanding | | | 32,743 | | | | 5,019 | |
Shares outstanding, beginning of period | | | 1,166,576 | | | | 1,161,557 | |
Shares outstanding, end of period | | | 1,199,319 | | | | 1,166,576 | |
15
1789 GROWTH AND INCOME FUND
NOTES TO FINANCIAL STATEMENTS (Continued)
6. CONTINGENCIES AND COMMITMENTS
The Fund indemnifies the Trust’s officers and Trustees for certain liabilities that might arise from their performance of their duties to the Fund. Additionally, in the normal course of business, the Fund enters into contracts that contain a variety of representations and warranties and which provide general indemnifications. The Fund’s maximum exposure under these arrangements is unknown, as this would involve future claims that may be made against the Fund that have not yet occurred. However, based on experience, the Trust expects the risk of loss to be remote.
7. SUBSEQUENT EVENTS
The Fund is required to recognize in the financial statements the effects of all subsequent events that provide additional evidence about conditions that existed as of the date of the Statement of Assets and Liabilities. For non-recognized subsequent events that must be disclosed to keep the financial statements from being misleading, the Fund is required to disclose the nature of the event as well as an estimate of its financial effect, or a statement that such an estimate cannot be made. Management has evaluated subsequent events through the issuance of these financial statements and has noted no such events.
16
1789 GROWTH AND INCOME FUND
ABOUT YOUR FUND’S EXPENSES (Unaudited)
We believe it is important for you to understand the impact of costs on your investment. All mutual funds have operating expenses. As a shareholder of the Fund, you incur two types of costs: (1) transaction costs, possibly including contingent deferred sales loads and redemption fees, and (2) ongoing costs, including management fees, Rule 12b-1 distribution fees (if applicable to your class) and other Fund expenses. The following examples are intended to help you understand your ongoing costs (in dollars) of investing in the Fund and to compare these costs with the ongoing costs of investing in other mutual funds.
A mutual fund’s ongoing costs are expressed as a percentage of its average net assets. This figure is known as the expense ratio. The expenses in the table that follows are based on an investment of $1,000 made at the beginning of the most recent semi-annual period (November 1, 2022) and held until the end of the period (April 30, 2023).
The table that follows illustrates the Fund’s ongoing costs in two ways:
Actual fund return – This section helps you to estimate the actual expenses that you paid over the period. The “Ending Account Value” shown is derived from the Fund’s actual return, and the fourth column shows the dollar amount of operating expenses that would have been paid by an investor who started with $1,000 in the Fund. You may use the information here, together with the amount you invested, to estimate the expenses that you paid over the period.
To do so, simply divide your account value by $1,000 (for example, an $8,600 account value divided by $1,000 = 8.6), then multiply the result by the number given for the Fund under the heading “Expenses Paid During Period.”
Hypothetical 5% return – This section is intended to help you compare the Fund’s ongoing costs with those of other mutual funds. It assumes that the Fund had an annual return of 5% before expenses during the period shown, but that the expense ratio is unchanged. In this case, because the return used is not the Fund’s actual return, the results do not apply to your investment. The example is useful in making comparisons because the U.S. Securities and Exchange Commission (the “SEC”) requires all mutual funds to calculate expenses based on a 5% return. You can assess the Fund’s ongoing costs by comparing this hypothetical example with the hypothetical examples that appear in shareholder reports of other funds.
Note that expenses shown in the table are meant to highlight and help you compare ongoing costs only.
The calculations assume no shares were bought or sold during the period. Your actual costs may have been higher or lower, depending on the amount of your investment and the timing of any purchases or redemptions.
17
1789 GROWTH AND INCOME FUND
ABOUT YOUR FUND’S EXPENSES (Unaudited) (Continued)
More information about the Fund’s expenses, including historical expense ratios, can be found in this report. For additional information on operating expenses and other shareholder costs, please refer to the Fund’s prospectus.
| Beginning
Account Value
November 1,
2022 | Ending
Account Value
April 30,
2023 | Expense
Ratio (a) | Expenses
Paid During
Period (b) |
Class P Shares | | | | |
Based on Actual Fund Return | $ 1,000.00 | $ 1,041.60 | 1.01% | $ 5.11 |
Based on Hypothetical 5% Return (before expenses) | $ 1,000.00 | $ 1,019.79 | 1.01% | $ 5.06 |
Class C Shares | | | | |
Based on Actual Fund Return | $ 1,000.00 | $ 1,035.80 | 2.01% | $ 10.15 |
Based on Hypothetical 5% Return (before expenses) | $ 1,000.00 | $ 1,014.83 | 2.01% | $ 10.04 |
(a) | Annualized, based on the most recent one-half year expenses. |
(b) | Expenses are equal to the annualized expense ratio of each Class, multiplied by the average account value over the period, multiplied by 181/365 (to reflect the one-half year period). |
18
1789 GROWTH AND INCOME FUND
OTHER INFORMATION (Unaudited)
A description of the policies and procedures that the Fund uses to vote proxies relating to portfolio securities is available without charge upon request by calling toll-free 1-888-229-9448, or on the SEC’s website at www.sec.gov. Information regarding how the Fund voted proxies relating to portfolio securities during the most recent 12-month period ended June 30 is available without charge upon request by calling toll-free 1-888-229-9448, or on the SEC’s website at www.sec.gov.
The Trust files a complete listing of portfolio holdings for the Fund with the SEC as of the end of the first and third quarters of each fiscal year as an exhibit to its reports on Form N-PORT. The filings are available upon request by calling 1-888-229-9448. Furthermore, you may obtain a copy of the filings on the SEC’s website at www.sec.gov and on the Fund’s website at www.pcm-advisors.com.
19
Privacy Notice
FACTS | WHAT DOES THE PINNACLE CAPITAL MANAGEMENT FUNDS TRUST DO WITH YOUR PERSONAL INFORMATION? |
| | | | |
Why? | Financial companies choose how they share your personal information. Federal law gives consumers the right to limit some but not all sharing. Federal law also requires us to tell you how we collect, share, and protect your personal information. Please read this notice carefully to understand what we do. |
| | | | |
What? | The types of personal information we collect and share depend on the product or service you have with us. This information can include: ● Social Security Number ● Assets ● Retirement Assets ● Transaction History ● Checking Account Information ● Purchase History ● Account Balances ● Account Transactions ● Wire Transfer Instructions When you are no longer our customer, we continue to share your information as described in this notice. |
| | | | |
How? | All financial companies need to share your personal information to run their everyday business. In the section below, we list the reasons financial companies can share their customers’ personal information; the reasons the Pinnacle Capital Management Funds Trust chooses to share; and whether you can limit this sharing. |
| | | | |
Reasons we can share your personal information | Does the Pinnacle Capital Management Funds Trust share? | Can you limit this sharing? |
For our everyday business purposes –
such as to process your transactions, maintain your account(s), respond to court orders and legal investigations, or report to credit bureaus | Yes | No |
For our marketing purposes –
to offer our products and services to you | No | We don’t share |
For joint marketing with other financial companies | No | We don’t share |
For our affiliates’ everyday business purposes –
information about your transactions and experiences | No | We don’t share |
For our affiliates’ everyday business purposes –
information about your creditworthiness | No | We don’t share |
For nonaffiliates to market to you | No | We don’t share |
Questions? | Call 1-888-229-9448 |
20
Who we are |
Who is providing this notice? | Pinnacle Capital Management Funds Trust Pinnacle Investments, LLC (Distributor) Ultimus Fund Solutions, LLC (Administrator) |
What we do |
How does the Pinnacle Capital Management Funds Trust protect my personal information? | To protect your personal information from unauthorized access and use, we use security measures that comply with federal law. These measures include computer safeguards and secured files and buildings. Our service providers are held accountable for adhering to strict policies and procedures to prevent any misuse of your nonpublic personal information. |
How does the Pinnacle Capital Management Funds Trust collect my personal information? | We collect your personal information, for example, when you ● Open an account ● Provide account information ● Give us your contact information ● Make deposits or withdrawals from your account ● Make a wire transfer ● Tell us where to send the money ● Tell us who receives the money ● Show your government-issued ID ● Show your driver’s license We also collect your personal information from other companies. |
Why can’t I limit all sharing? | Federal law gives you the right to limit only ● Sharing for affiliates’ everyday business purposes – information about your creditworthiness ● Affiliates from using your information to market to you ● Sharing for nonaffiliates to market to you State laws and individual companies may give you additional rights to limit sharing. |
Definitions |
Affiliates | Companies related by common ownership or control. They can be financial and nonfinancial companies. ● Pinnacle Capital Management, LLC, the investment adviser to the Pinnacle Capital Management Funds Trust, could be deemed to be an affiliate. |
Nonaffiliates | Companies not related by common ownership or control. They can be financial and nonfinancial companies ● Pinnacle Capital Management Funds Trust does not share with nonaffiliates so they can market to you. |
Joint marketing | A formal agreement between nonaffiliated financial companies that together market financial products or services to you. ● Pinnacle Capital Management Funds Trust does not jointly market. |
21
INVESTMENT ADVISER
Pinnacle Capital Management, LLC
5845 Widewaters Parkway,
Suite 300
East Syracuse, NY 13057
INDEPENDENT REGISTERED PUBLIC ACCOUNTING FIRM
Cohen & Company, Ltd.
151 North Franklin Street, Suite 575
Chicago, IL 60606
LEGAL COUNSEL
Bond Schoeneck & King PLLC
One Lincoln Center
110 West Fayette Street
Syracuse, NY 13202
CUSTODIAN
U.S. Bank, N.A.
425 Walnut Street
Cincinnati, OH 45202
TRANSFER AGENT
Ultimus Fund Solutions, LLC
225 Pictoria Drive, Suite 450
Cincinnati, OH 45246
DISTRIBUTOR
Pinnacle Investments, LLC
507 Plum Street, Suite 120
Syracuse, NY 13204
This report is intended only for the information of shareholders or those who have received the Fund’s prospectus which contains information about the Fund’s management fee and expenses. Please read the prospectus carefully before investing.
PCM-SAR-23
(b) Not applicable.
Not required
| Item 3. | Audit Committee Financial Expert. |
Not required
| Item 4. | Principal Accountant Fees and Services. |
Not required
| Item 5. | Audit Committee of Listed Registrants. |
Not applicable
| Item 6. | Schedule of Investments. |
| (a) | See Schedule I (Investments in securities of unaffiliated issuers) |
| Item 7. | Disclosure of Proxy Voting Policies and Procedures for Closed-End Management Investment Companies. |
Not applicable
| Item 8. | Portfolio Managers of Closed-End Management Investment Companies. |
Not applicable
| Item 9. | Purchases of Equity Securities by Closed-End Management Investment Company and Affiliated Purchasers. |
Not applicable
| Item 10. | Submission of Matters to a Vote of Security Holders. |
The registrant has not adopted procedures by which shareholders may recommend nominees to the registrant’s board of trustees.
| Item 11. | Controls and Procedures. |
(a) Based on their evaluation of the registrant’s disclosure controls and procedures (as defined in Rule 30a-3(c) under the Investment Company Act of 1940) as of a date within 90 days of the filing date of this report, the registrant’s principal executive officer and principal financial officer have concluded that such disclosure controls and procedures are reasonably designed and are operating effectively to ensure that material information relating to the registrant, including its consolidated subsidiaries, is made known to them by others within those entities, particularly during the period in which this report is being prepared, and that the information required in filings on Form N-CSR is recorded, processed, summarized, and reported on a timely basis.
(b) There were no changes in the registrant’s internal control over financial reporting (as defined in Rule 30a-3(d) under the Investment Company Act of 1940) that occurred during the period covered by this report that have materially affected, or are reasonably likely to materially affect, the registrant’s internal control over financial reporting.
| Item 12. | Disclosure of Securities Lending Activities for Closed-End Management Investment Companies. |
Not applicable
File the exhibits listed below as part of this Form. Letter or number the exhibits in the sequence indicated.
(a)(1) Any code of ethics, or amendment thereto, that is the subject of the disclosure required by Item 2, to the extent that the registrant intends to satisfy the Item 2 requirements through filing of an exhibit: Not required
(a)(2) A separate certification for each principal executive officer and principal financial officer of the registrant as required by Rule 30a-2(a) under the Act (17 CFR 270.30a-2(a)): Attached hereto
(1) Not applicable
(2) Change in the registrant’s independent public accountants: Not applicable
(b) Certifications required by Rule 30a-2(b) under the Act (17 CFR 270.30a-2(b)): Attached hereto
SIGNATURES
Pursuant to the requirements of the Securities Exchange Act of 1934 and the Investment Company Act of 1940, the registrant has duly caused this report to be signed on its behalf by the undersigned, thereunto duly authorized.
| (Registrant) | Pinnacle Capital Management Funds Trust | |
| | | | |
| By (Signature and Title)* | | /s/ Stephen Fauer | |
| | | Stephen Fauer, President | |
| | | | |
| Date | June 29, 2023 | | |
| | | | |
| Pursuant to the requirements of the Securities Exchange Act of 1934 and the Investment Company Act of 1940, this report has been signed below by the following persons on behalf of the registrant and in the capacities and on the dates indicated. |
| | | | |
| By (Signature and Title)* | | /s/ Stephen Fauer | |
| | | Stephen Fauer, President | |
| | | | |
| Date | June 29, 2023 | | |
| | | | |
| By (Signature and Title)* | | /s/ Paul A. Tryon | |
| | | Paul A. Tryon, Treasurer and Principal Financial Officer | |
| | | | |
| Date | June 29, 2023 | | |
* Print the name and title of each signing officer under his or her signature.