As filed with the United States Securities and Exchange Commission on December 2, 2010
Registration No. 333-168686
UNITED STATES SECURITIES AND EXCHANGE COMMISSION
Washington, D.C. 20549
Washington, D.C. 20549
Amendment No. 3
to
Form S-11
FOR REGISTRATION UNDER THE SECURITIES ACT OF 1933
OF SECURITIES OF CERTAIN REAL ESTATE COMPANIES
OF SECURITIES OF CERTAIN REAL ESTATE COMPANIES
SUMMIT HOTEL PROPERTIES, INC.
(Exact name of registrant as specified in governing instruments)
2701 South Minnesota Avenue, Suite 6
Sioux Falls, South Dakota 57105
(605) 361-9566
(Address, including zip code, and telephone number, including area code, of registrant’s principal executive offices)
Sioux Falls, South Dakota 57105
(605) 361-9566
(Address, including zip code, and telephone number, including area code, of registrant’s principal executive offices)
Daniel P. Hansen
President and Chief Executive Officer
2701 South Minnesota Avenue, Suite 6
Sioux Falls, South Dakota 57105
(605) 361-9566
(Name and address, including zip code, and telephone number, including area code, of agent for service)
President and Chief Executive Officer
2701 South Minnesota Avenue, Suite 6
Sioux Falls, South Dakota 57105
(605) 361-9566
(Name and address, including zip code, and telephone number, including area code, of agent for service)
Copies to:
| David C. Wright, Esq. Edward W. Elmore, Jr., Esq. Hunton & Williams LLP Riverfront Plaza, East Tower 951 E. Byrd Street Richmond, Virginia 23219-4074 Tel: (804) 788-8200 Fax: (804) 788-8218 | James E. Showen, Esq. Kevin L. Vold, Esq. Hogan Lovells US LLP Columbia Square 555 13th Street NW Washington, DC 20004 Tel: (202) 637-5600 Fax: (202) 637-5910 |
Approximate date of commencement of proposed sale to the public: As soon as practicable after the effective date of this Registration Statement.
If any of the securities being registered on this form are to be offered on a delayed or continuous basis pursuant to Rule 415 under the Securities Act, check the following box: o
If this form is filed to register additional securities for an offering pursuant to Rule 462(b) under the Securities Act, check the following box and list the Securities Act registration statement number of the earlier effective registration statement for the same offering. o
If this form is a post-effective amendment filed pursuant to Rule 462(c) under the Securities Act, check the following box and list the Securities Act registration statement number of the earlier effective registration statement for the same offering. o
If this form is a post-effective amendment filed pursuant to Rule 462(d) under the Securities Act, check the following box and list the Securities Act registration statement number of the earlier effective registration statement for the same offering. o
If delivery of the prospectus is expected to be made pursuant to Rule 434, please check the following box. o
Indicate by check mark whether the registrant is a large accelerated filer, an accelerated filer, a non-accelerated filer, or a smaller reporting company. See the definitions of “large accelerated filer,” “accelerated filer” and “smaller reporting company” in Rule 12b-2 of the Exchange Act. (Check one):
| Large accelerated filer o | Accelerated filer o | Non-accelerated filer þ | Smaller reporting company o |
(Do not check if a smaller reporting company)
The registrant hereby amends this registration statement on such date or dates as may be necessary to delay its effective date until the registrant shall file a further amendment which specifically states that this registration statement shall thereafter become effective in accordance with Section 8(a) of the Securities Act of 1933 or until the registration statement shall become effective on such date as the Commission, acting pursuant to said Section 8(a), may determine.
| The information in this prospectus is not complete and may be changed. We may not sell these securities until the registration statement filed with the Securities and Exchange Commission is effective. This prospectus is not an offer to sell these securities, and it is not soliciting an offer to buy these securities in any state where the offer or sale is not permitted. |
Subject to Completion
PROSPECTUS

Shares of Common Stock
Summit Hotel Properties, Inc. is selling all of the common stock offered by this prospectus. Prior to this offering, there has been no public market for our common stock. The initial public offering price of our common stock is expected to be between $ and $ per share. We have applied to list our common stock on the New York Stock Exchange, or NYSE, under the symbol “INN.”
Concurrently with this offering, we will sell in a separate private placement to an affiliate of InterContinental Hotels Group $12.5 million in shares of our common stock (subject to a maximum investment of 4.9% of the total number of shares to be sold in this offering, excluding any shares sold pursuant to the underwriters’ over-allotment option) at a price per share equal to the initial public offering price per share less the underwriting discount shown in the table below.
We intend to elect and qualify to be taxed as a real estate investment trust, or REIT, for federal income tax purposes. The common stock offered by this prospectus is subject to restrictions on ownership and transfer that are intended to, among other purposes, assist us in qualifying and maintaining our qualification as a REIT. Our charter generally limits beneficial and constructive ownership to no more than 9.8% in value or number of shares, whichever is more restrictive, of the outstanding shares of any class or series of our capital stock. See “Description of Capital Stock—Restrictions on Ownership and Transfer.”
Investing in our common stock involves risks. See “Risk Factors” beginning on page 18 of this prospectus for a description of various risks you should consider in evaluating an investment in the shares.
| Per Share | Total | |||||||
| Public offering price | $ | $ | ||||||
| Underwriting discount | $ | $ | ||||||
| Proceeds, before expenses, to us | $ | $ | ||||||
The underwriters have a 30-day option to purchase up to additional shares of common stock from us on the same terms set forth above to cover over-allotments, if any.
Neither the Securities and Exchange Commission nor any state securities commission has approved or disapproved of these securities or determined if this prospectus is truthful or complete. Any representation to the contrary is a criminal offense.
Baird
The date of this prospectus is , 2010.


Table of Contents
| Page | ||||
| 1 | ||||
| 18 | ||||
| 41 | ||||
| 42 | ||||
| 43 | ||||
| 44 | ||||
| 46 | ||||
| 49 | ||||
| 52 | ||||
| 70 | ||||
| 71 | ||||
| 74 | ||||
| 95 | ||||
| 99 | ||||
| 118 | ||||
| 121 | ||||
| 122 | ||||
| 125 | ||||
| 129 | ||||
| 131 | ||||
| 136 | ||||
| 142 | ||||
| 167 | ||||
| 168 | ||||
| 172 | ||||
| 172 | ||||
| 172 | ||||
| F-1 | ||||
You should rely only on the information contained in this prospectus and any free writing prospectus prepared by us. We have not, and the underwriters have not, authorized any other person to provide you with different information. If anyone provides you with different or inconsistent information, you should not rely on it. We are not, and the underwriters are not, making an offer to sell these securities in any jurisdiction where the offer or sale is not permitted. The information in this prospectus is current as of the date such information is presented. Our business, financial condition and results of operations and prospectus may have changed since those dates.
Through and including , 2010 (the 25th day after the date of this prospectus) federal securities law may require all dealers that effect transactions in these securities, whether or not participating in this offering, to deliver a prospectus. This requirement is in addition to the dealers’ obligation to deliver a prospectus when acting as underwriters and with respect to their unsold allotments or subscriptions.
This prospectus contains registered trademarks that are the exclusive property of their respective owners, which are companies other than us, including Marriott International, Inc., or Marriott, Hilton Worldwide, or Hilton, InterContinental Hotels Group, or IHG, Hyatt Corporation, or Hyatt, Choice Hotels International, Inc., or Choice, Country Inn & Suites By Carlson, Inc., and Starwood Hotels and Resorts Worldwide, Inc., or Starwood. None of the owners of the trademarks appearing in this prospectus, their parents, subsidiaries or affiliates or any of their respective officers, directors, members,
i
managers, stockholders, owners, agents or employees, which we refer to collectively as the “trademark owners,” is an issuer or underwriter of the shares being offered hereby, plays (or will play) any role in the offer or sale of our shares or has any responsibility for the creation or contents of this prospectus. In addition, none of the trademark owners has or will have any liability or responsibility whatsoever arising out of or related to the sale or offer of the shares being offered hereby, including any liability or responsibility for any financial statements, projections or other financial information or other information contained in this prospectus or otherwise disseminated in connection with the offer or sale of the shares offered by this prospectus. You must understand that, if you purchase our common stock in this offering, your sole recourse for any alleged or actual impropriety relating to the offer and sale of the common stock and the operation of our business will be against us (and/or, as may be applicable, the seller of such shares) and in no event may you seek to impose liability arising from or related to such activity, directly or indirectly, upon any of the trademark owners.
WE WILL BE A PARTY TO A LICENSE AGREEMENT WITH THE SHERATON, LLC THAT WILL ENABLE A THIRD-PARTY HOTEL MANAGEMENT COMPANY ENGAGED BY US TO OPERATE A HOTEL USING THE SERVICE MARK “ALOFT sm.” NEITHER THE SHERATON, LLC NOR ANY OF ITS AFFILIATES OWNS SUCH HOTEL, IS A PARTICIPANT IN THIS OFFERING, OR HAS PROVIDED OR REVIEWED, OR IS RESPONSIBLE FOR, ANY DISCLOSURES OR OTHER INFORMATION SET FORTH IN THIS PROSPECTUS.
We use market data and industry forecasts and projections throughout this prospectus, including data from publicly available information and industry publications. These sources generally state that the information they provide has been obtained from sources believed to be reliable, but that the accuracy and completeness of the information are not guaranteed. The forecasts and projections are based on industry surveys and the preparers’ experience in the industry and there can be no assurance that any of the projections will be achieved. We believe that the surveys and market research others have performed are reliable, but we have not independently verified this information.
ii
Summary
The following summary highlights information contained elsewhere in this prospectus. This summary is not complete and does not contain all of the information that you should consider before investing in our common stock. You should read the following summary together with the more detailed information regarding our company and an investment in our common stock, including the information under the caption “Risk Factors” and the historical and pro forma financial statements, including the related notes, appearing elsewhere in this prospectus. Unless the context otherwise requires or indicates, references in this prospectus to our “predecessor” refer to Summit Hotel Properties, LLC and its consolidated subsidiaries, including Summit Group of Scottsdale, Arizona, LLC, or Summit of Scottsdale. Unless the context otherwise requires or indicates, references in this prospectus to “we,” “our,” “us,” “our company” and “the company” refer to Summit Hotel Properties, Inc., a Maryland corporation, together with its consolidated subsidiaries, including Summit Hotel OP, LP, a Delaware limited partnership, which we refer to in this prospectus as the “operating partnership,” Summit Hotel GP, LLC, a Delaware limited liability company that is the general partner of our operating partnership, Summit Hotel TRS, Inc., a Delaware corporation, which we refer to in this prospectus as “Summit TRS,” and Summit Hotel TRS II, Inc., a Delaware corporation we will form prior to completion of this offering, which we refer to as “Summit TRS II.” We refer to Summit TRS, Summit TRS II and the wholly owned subsidiaries of Summit TRS and Summit TRS II that will lease our hotels from our operating partnership as our “TRS lessees.” References to “the concurrent private placement” mean the separate private placement, concurrent with this offering, in which we will sell to an affiliate of IHG $12.5 million in shares of our common stock (subject to a maximum investment of 4.9% of the total number of shares to be sold in this offering, excluding any shares sold pursuant to the underwriters’ over-allotment option) at a price per share equal to the initial public offering, or IPO, price per share less the underwriting discount.
In addition, unless the context otherwise requires or indicates, the information set forth in this prospectus assumes that: (i) the formation transactions described elsewhere in this prospectus have been completed; (ii) the underwriters’ over-allotment option is not exercised; (iii) shares of our common stock are sold in the offering at $ per share, which is the mid-point of the anticipated IPO price range shown on the cover of this prospectus; (iv) shares of our common stock are sold in the concurrent private placement to an affiliate of IHG at a price of $ per share; and (v) the value of each unit of limited partnership interest in our operating partnership, which we refer to as an “OP unit,” issued in the formation transactions is equivalent to the IPO price of one share of our common stock.
Overview
We are a self-managed hotel investment company that was recently organized to continue and expand the existing hotel investment business of our predecessor, Summit Hotel Properties, LLC, a leading U.S. hotel owner. We will focus exclusively on acquiring and owning premium-branded limited-service and select-service hotels in the upscale and midscale without food and beverage segments of the U.S. lodging industry. Following completion of this offering and the formation transactions, our initial portfolio will consist of 65 hotels with a total of 6,533 guestrooms located in 19 states. Our initial portfolio consists of what we consider both “seasoned” and “unseasoned” hotels that are located in markets in which we have extensive experience and that exhibit multiple demand generators, such as business and corporate headquarters, retail centers, airports and tourist attractions. Based on total number of rooms, 48% of our portfolio is positioned in the top 50 metropolitan statistical areas, or MSAs, and 68% is located within the top 100 MSAs.
Entities controlled by our Executive Chairman, Kerry W. Boekelheide, have been in the business of acquiring, developing, financing, operating and selling hotels since 1991, have acquired a total of 93 hotels in transactions having an aggregate value of approximately $606.8 million, and have sold, transferred or otherwise disposed of a total of 27 hotels in transactions having an aggregate value of approximately $104.6 million.
The majority of our hotels operate under premium franchise brands owned by Marriott International, Inc. (Courtyard by Marriott®, Residence Inn® by Marriott, SpringHill Suites® by Marriott, Fairfield Inn® by Marriott and TownePlace Suites® by Marriott), Hilton Worldwide (Hampton Inn®, Hampton Inn & Suites® and Hilton Garden Inn®), IHG (Holiday Inn Express® and Staybridge Suites®) and an affiliate of Hyatt Hotels Corporation (Hyatt Place®).
Since January 1, 2007, we have made approximately $311.0 million of capital investments through development, strategic acquisitions and upgrades and improvements to our hotels to be well-positioned for improving general lodging fundamentals. Further, we expect to use up to approximately $10.0 million of the net proceeds of this offering to make additional capital improvements to hotels in our portfolio. We believe the U.S. economy has begun to recover from the recent economic recession and, as a result, lodging industry fundamentals will strengthen over the near-term. As a result,
1
we believe our portfolio is well-positioned for significant internal growth in hotel operating revenues in this environment based on our mix of seasoned hotels and unseasoned hotels.
We intend to identify and acquire undermanaged and underperforming hotels and use our expertise to renovate, rebrand and reposition the hotels to improve cash flows and long-term value. In addition, we have entered into a sourcing agreement with IHG that we believe will enhance our ability to execute our business strategy by potentially providing us with additional attractive acquisition opportunities. We believe we will be able to source a significant volume of acquisition opportunities, particularly due to the relative size of our target lodging industry segments, lack of available debt financing in the capital markets and the weakness experienced from mid-2008 through early 2010 in the lodging industry. We also believe that, while other public REITs and well-capitalized institutional owners seek to acquire assets that fit our investment criteria, we will be the only publicly traded REIT focused solely on these segments on a national basis.
We were organized as a Maryland corporation on June 30, 2010 and intend to elect to be taxed as a REIT for federal income tax purposes beginning with our short taxable year ending December 31, 2010. We will conduct substantially all of our business through our operating partnership, Summit Hotel OP, LP, a Delaware limited partnership. See “Structure of Our Company.”
Our Competitive Strengths
High-Quality Portfolio of Hotels. Our initial portfolio is composed of 65 hotels located in 19 states with an average age of ten years. No single hotel accounted for more than 3.5% of our predecessor’s hotel operating revenues for the 12-month period ended September 30, 2010. We believe all of our hotels are located in markets where there will be limited growth in lodging supply over the next several years. Additionally, in many of our markets, we own two or more hotels in close proximity to each other, which we believe allows our hotel managers to maintain room-rate integrity and maximize occupancy rates, or occupancy, by referring travelers to our other hotels. Similarly, franchise areas of protection, which prohibit the opening of hotels with the same brand as one of our hotels within certain proximities of our hotels, provide barriers to entry in suburban markets where many of our hotels are located.
Seasoned Portfolio and Significant Upside Potential. Our initial portfolio is composed of 46 seasoned hotels with established track records and strong positions within their markets. We classify our other 19 hotels, which were either built after January 1, 2007 or experienced a brand conversion since January 1, 2008, as unseasoned. We believe that the market penetration of our unseasoned hotels is significantly less than that of our seasoned hotels due to the dramatic economic slowdown over the past two years that delayed these hotels from achieving anticipated growth rates and revenues. However, most of our unseasoned hotels operate under premium brands and are newer, larger and are located in larger markets than our seasoned hotels. As a result, we believe our unseasoned hotels can experience significant growth in room revenue per available room, or RevPAR, and profitability as the economy and industry fundamentals improve.
Experienced Executive Management Team With a Proven Track Record. Our management team, led by our Executive Chairman, Mr. Boekelheide, has extensive experience acquiring, developing, owning, operating, renovating, rebranding and financing hotel properties. Through this experience, our management team has developed strong execution capabilities as well as an extensive network of industry, corporate and institutional relationships, including relationships with the leading lodging franchisors in our targeted markets. We believe these relationships will provide insight and access to attractive investment opportunities and allow us to react to local market conditions by seeking the optimal franchise brand for the market in which each of our hotels is located.
Aggressive Asset Management and Experienced Asset Management Team. We will maintain a dedicated asset management team led by our Executive Vice President and Chief Operating Officer, Craig J. Aniszewski, to analyze our portfolio as a whole and oversee our independent hotel managers. Our asset management team has managed hotel assets in every industry segment through multiple hotel business cycles. Our entire asset management team has worked together at The Summit Group, Inc., or The Summit Group, the manager of our predecessor and its hotels, for the last ten years, which provides us expertise, operational stability and in-depth knowledge of our portfolio. We will work proactively with our hotel managers to continue to drive operational performance by identifying and implementing strategies to optimize hotel profitability through revenue management strategies, budgeting, analyzing cost structure, market positioning, evaluating and making capital improvements and continually reviewing and refining our overall business strategy. Among other techniques, we initially
2
will employ three full-time asset managers who will assist our hotel management companies to structure room rate plans and develop occupancy strategies to achieve optimum revenues.
Strategic Focus on Largest Segments of Lodging Industry. We believe we will be the only publicly traded REIT that focuses exclusively on upscale hotels and midscale without food and beverage hotels on a national basis. By number of rooms, 81% of our hotels operate under brands owned by Marriott, Hilton, IHG or Hyatt, which are generally regarded as the premium global franchises in our segments. We believe that business and leisure travelers prefer the consistent service and quality associated with these premium brands, and that brand serves as a significant driver of demand for hotel rooms. As reported by Smith Travel Research in 2010, of the approximately 29,735 branded hotels in the United States, 13,066 hotels, or 43.9%, are within our target segments (upscale: 3,536 hotels; midscale without food and beverage: 9,530 hotels). The size of this market represents a potential acquisition pool significantly larger than the upper upscale (1,669 hotels, or 5.6%, of total branded hotels) or luxury (341 hotels, or 1.2%, of total branded hotels) segments. We believe the fragmented ownership of premium-branded limited-service and select-service hotels in the upscale and midscale without food and beverage segments, the size of the segments, our longstanding relationships with franchisors, the lack of well-capitalized competitors and our extensive experience and expertise provide us a distinct competitive advantage and a significant opportunity to profitably grow our company.
Growth-Oriented Capital Structure. Upon completion of this offering, the concurrent private placement and the formation transactions, we expect to employ a prudent leverage structure that will provide us the ability to make strategic acquisitions as industry fundamentals and the lending environment improves. Upon completion of this offering and the concurrent private placement and application of the net proceeds as described in “Use of Proceeds,” we will have approximately $198.4 million in outstanding indebtedness and 33 hotels unencumbered by indebtedness, including 25 hotels with 2,330 rooms operating under premium brands owned by Marriott, Hilton, IHG or Hyatt available to secure future loans. At or shortly after the closing of this offering, the concurrent private placement and the formation transactions, we anticipate entering into a $ million revolving credit facility that we expect will be secured by at least 15 of these properties. We believe our capital structure positions us well to capitalize on what we expect to be significant acquisition opportunities. As described further in “Distribution Policy,” we expect to pay our initial distribution with respect to the period commencing on the date of completion of this offering and ending March 31, 2011 based on a rate of $ per share for a full quarter. On an annualized basis, this would equal approximately $ per share, or an annual distribution rate of approximately % based on an assumed IPO price of $ , the mid-point of the anticipated IPO price range set forth on the cover of this prospectus.
Strategic Relationship with IHG. We have entered into a sourcing agreement with IHG, a global hospitality company with widely recognized, industry-leading brands. We believe our strategic relationship with IHG, as well as IHG’s strong brands and excellent hotel management services, will enhance our ability to execute our business strategy and potentially provide us with additional attractive acquisition opportunities. In addition, an affiliate of IHG has agreed to make a significant equity investment in our common stock concurrent with the completion of this offering. We believe that this equity stake will serve to align IHG’s interests with ours and may provide IHG with added incentive to help us to execute our strategy.
Summary Risk Factors
An investment in our common stock involves various risks. You should carefully consider the matters discussed in “Risk Factors” beginning on page 18 of this prospectus before you decide whether to invest in our common stock. Some of the risks include the following:
| § | Our business strategy depends significantly on achieving revenue and net income growth from anticipated increases in demand for hotel rooms—any delay or a weaker than anticipated economic recovery will adversely affect our future results of operations and our growth prospects. | |
| § | Our unseasoned hotels have limited operating history and may not achieve the operating performance we anticipate, and as a result, our overall returns may not improve as we expect or may decline. | |
| § | We have no operating history as a publicly traded REIT and may not be successful in operating as a publicly traded REIT, which may adversely affect our ability to make distributions to our stockholders. | |
| § | Our success depends on key personnel whose continued service is not guaranteed. |
3
| § | We may be unable to complete acquisitions that would grow our business, and even if they are completed, we may fail to successfully integrate and operate such acquired hotels. | |
| § | Upon completion of this offering and the formation transactions, the management of all of the hotels in our portfolio will be concentrated in one hotel management company, Interstate Management Company, LLC, or Interstate, and termination of our hotel management agreement with that company may cause us to pay substantial termination fees or experience significant disruptions at our hotels. | |
| § | Funds spent to maintain franchisor operating standards, the loss of a franchise license or a decline in the value of a franchise brand may have a material adverse effect on our business and financial results. | |
| § | We will rely on external sources of capital to fund future capital needs, and if we encounter difficulty in obtaining such capital we may not be able to make future acquisitions necessary to grow our business or meet maturing obligations. | |
| § | We have a significant amount of debt, and our organizational documents have no limitation on the amount of additional indebtedness that we may incur in the future. As a result, we may become highly leveraged in the future, which could adversely affect our financial condition. | |
| § | The agreements governing our indebtedness place restrictions on us and our subsidiaries, reducing operational flexibility and creating default risks. |
| § | We may not be able to obtain a secured revolving credit facility on the indicative terms and conditions described in this prospectus or at all. |
| § | Our Executive Chairman, Mr. Boekelheide, and other members of our management team exercised significant influence with respect to the terms of the formation transactions, including transactions in which they determined the compensation they would receive. | |
| § | Competition from other upscale and midscale without food and beverage hotels in the markets in which we operate could have a material adverse effect on our results of operations. | |
| § | Our operating results and ability to make distributions to our stockholders may be adversely affected by the markets in which we operate and risks inherent to the ownership of hotels. | |
| § | Illiquidity of real estate investments could significantly impede our ability to respond to adverse changes in the performance of hotels in which we may invest or to adjust our portfolio in response to changes in economic and other conditions, and, therefore, may harm our financial condition. | |
| § | We may change the distribution policy with respect to our common stock in the future. | |
| § | The cash available for distribution may not be sufficient to make distributions at expected levels, and we cannot assure you of our ability to make distributions in the future. We may use borrowed funds or funds from other sources to make distributions, which may adversely impact our operations. |
| § | We may use a portion of the net proceeds from this offering and the concurrent private placement to make distributions to our stockholders, if necessary to permit us to satisfy the requirements for qualification as a REIT and eliminate federal income and excise taxes that otherwise would be imposed on us, which would, among other things, reduce our cash available for investing. |
| § | If you purchase shares of common stock in this offering, you will experience immediate dilution. | |
| § | Failure to qualify as a REIT, or failure to remain qualified as a REIT, would cause us to be taxed as a regular corporation, which would substantially reduce funds available for distributions to our stockholders. |
Our Growth Strategies and Investment Criteria
Our strategy focuses on maximizing the cash flow of our portfolio through focused asset management, targeted capital investment and opportunistic acquisitions. Our primary objective is to enhance stockholder value over time by generating strong risk-adjusted returns for our stockholders. We believe we can create long-term value by pursuing the following strategies.
4
Internal Growth from Strengthening Lodging Industry Fundamentals. Since January 1, 2007, we have made approximately $311.0 million of capital investments through development, strategic acquisitions and upgrades and improvements to our hotels to be well-positioned for improving general lodging fundamentals. We believe our hotels will experience significant revenue growth as lodging industry fundamentals recover from the economic recession which caused industry-wide RevPAR to suffer a combined 18.4% decline in 2008 and 2009, according to Smith Travel Research. Industry conditions have shown improvement during the first nine months of 2010, with RevPAR growth across all segments of 4.5% as compared to the same period of 2009, according to Smith Travel Research. Colliers PKF Hospitality Research forecasts significant compound annual growth in RevPAR from 2010 to 2014 of 7.0% for the upscale segment and 8.5% for the midscale without food and beverage segment, among the largest for any segment in the industry.
Disciplined Acquisition of Hotels. We intend to grow through acquisitions of existing hotels using a disciplined and targeted approach while maintaining a prudent capital structure. We employ a proactive and continuous assessment of our hotels, markets and brands in order to quickly and efficiently upgrade our hotels as market conditions warrant. We intend to target upscale and midscale without food and beverage hotels that meet one or more of the following acquisition criteria:
| § | have potential for strong risk-adjusted returns located in the top 50 MSAs, with a secondary focus on the next 100 markets; |
| § | operate under leading franchise brands, which may include but are not limited to brands owned by Marriott, Hilton, IHG and Hyatt; |
| § | are located in close proximity to multiple demand generators, including businesses and corporate headquarters, retail centers, airports, medical facilities, tourist attractions and convention centers, with a diverse source of potential guests, including corporate, government and leisure travelers; | |
| § | are located in markets exhibiting barriers to entry due to strong franchise areas of protection or other factors; | |
| § | can be acquired at a discount to replacement cost; and | |
| § | provide an opportunity to add value through operating efficiencies, repositioning, renovating or rebranding. |
Selective Hotel Development. We believe there will be attractive opportunities to partner on a selective basis with experienced hotel developers to acquire upon completion newly constructed hotels that meet our investment criteria.
Strategic Hotel Sales. Our strategy is to acquire and own hotels. However, consistent with our strategy of maximizing the cash flow of our portfolio and our return on invested capital, we periodically review our hotels to determine if any significant changes to area markets or our hotels have occurred or are anticipated to occur that would warrant the sale of a particular hotel.
Our Industry and Market Opportunity
We focus on hotels in the upscale and midscale without food and beverage segments of the lodging industry.
We believe that our focus on these segments provides us the opportunity to achieve stronger risk-adjusted returns across multiple lodging cycles than if we owned hotels in other segments of the lodging industry for several reasons, including:
| • | RevPAR Growth. Colliers PKF Hospitality Research forecasts that our two market segments will experience among the largest amount of RevPAR growth of any segment in the industry. | |
| • | Consistently Strong and Growing Demand. Over the last twenty years, our market segments have demonstrated the strongest compounded growth in demand of all segments of the lodging industry, and strong demand growth is expected to continue. | |
| • | More Stable Cash Flow Potential. Our hotels can be operated with fewer employees than full-service hotels that offer more expansive food and beverage options, which we believe enables us to generate more consistent cash flows with less volatility resulting from reductions in RevPAR and less dependence on group travel. |
| • | Broad Customer Base. Our target brands deliver consistently high-quality hotel accommodations with value-oriented pricing that we believe appeals to a wider range of customers, including both business and leisure travelers, than more expensive full-service hotels. We believe that our hotels are particularly popular with frequent business travelers who seek to stay in hotels operating under Marriott, Hilton, Hyatt or IHG brands, which offer strong loyalty rewards program points that can be redeemed for family travel. |
5
| • | Enhanced Diversification. Premium-branded limited-service and select-service assets generally cost significantly less, on a per-key basis, than hotels in the midscale with food and beverage, upper upscale and luxury segments of the industry. As a result, we can diversify our ownership into a larger number of hotels than we could in other segments. |
Lodging Industry Fundamentals. Beginning in August 2008, the U.S. lodging industry experienced 19 consecutive months of RevPAR declines, as measured against the same month in the prior year, driven by a combination of deterioration in room-night demand and increasing supply. Although the lodging industry has historically lagged broader economic recoveries, economic fundamentals are beginning to improve from the recent declines resulting from the recessionary environment. In September 2010, the U.S. unemployment rate continued to show improvement from its high in late 2009. After continuing declines for almost two years prior, September 2010 marked the U.S. lodging industry’s eighth consecutive month of positive year-over-year RevPAR growth with an 8.8% increase.
According to Smith Travel Research, RevPAR increased 4.9% and 2.9% in our target upscale and midscale without food and beverage segments, respectively, for the first nine months of 2010 as compared to the same period of 2009, and we expect RevPAR growth to continue as the U.S. economy continues to strengthen. Colliers PKF Hospitality Research currently projects RevPAR growth of upscale hotels to be 4.2% in 2011, 11.1% in 2012 and 9.5% in 2013 and RevPAR growth of midscale without food and beverage hotels to be 5.9% in 2011, 12.2% in 2012 and 10.9% in 2013, among the highest in any industry segment. We expect that our hotels, and particularly our unseasoned hotels, will realize significant RevPAR gains as the economy and lodging industry improve.
Demand Overview. Room-night demand in the U.S. lodging industry is directly correlated to macroeconomic trends. Key drivers of demand include growth in gross domestic product, or GDP, corporate profits, capital investments and employment. Following periods of recession, recovery in room-night demand for lodging historically has lagged improvements in the overall economy.
Supply Overview. Growth in lodging supply typically lags growth in room-night demand. Key drivers of lodging supply include the availability and cost of capital, construction costs, local real estate market conditions and availability and pricing of existing properties. As a result of scarcity of financing, severe recession and declining operating fundamentals during 2008 and 2009, many planned hotel developments have been cancelled or postponed, and the number of rooms under construction and in planning has declined significantly. According to Lodging Econometrics, during the third quarter of 2010, approximately 62,000 new hotel rooms were under construction in the U.S., as compared to approximately 242,000 rooms under construction in the second quarter of 2008, a decline of 74%. New hotel construction is expected to remain below historical averages through 2014 according to Colliers PKF Hospitality Research.
Attractive Transaction Landscape. We believe that the significant decline in lodging fundamentals and subsequent declines in cash flows has created a difficult environment for hotel owners lacking ready access to financing or suffering from reduced cash flows due to declining industry fundamentals since 2008. As a result, we believe that the significant number of hotel properties experiencing substantial declines in operating cash flow, coupled with tight credit markets, near-term debt maturities and, in some instances, covenant defaults relating to outstanding indebtedness, will present attractive investment opportunities to acquire hotel properties at prices significantly below replacement cost, with substantial appreciation potential as the U.S. economy recovers from the current recession.
Our Formation Transactions
Historically, the 65 hotels in our initial portfolio were owned or controlled by our predecessor and were managed by The Summit Group, which is wholly owned and controlled by our Executive Chairman, Mr. Boekelheide. We will engage in the transactions described below, which we refer to as our formation transactions, in order to consolidate the business of our predecessor into a publicly traded REIT.
| § | We will sell shares of our common stock in this offering. |
| § | Concurrently with this offering, we will sell in a separate private placement to an affiliate of IHG $12.5 million in shares of our common stock (subject to a maximum investment of 4.9% of the total number of shares to be sold in this offering, excluding any shares sold pursuant to the underwriters’ over-allotment option) at a price per share equal to the IPO price per share less the underwriting discount. The closing of the concurrent private placement is contingent upon the completion of this offering; however, the closing of this offering is not contingent upon the closing of the concurrent private placement. |
6
§ We will contribute the net proceeds of this offering and the concurrent private placement to our operating partnership in exchange for OP units. We will continue to be, through a wholly owned subsidiary, the sole general partner of our operating partnership and will own an approximate % ( % if the underwriters exercise their over-allotment option in full) partnership interest in our operating partnership upon completion of the formation transactions, this offering and the concurrent private placement.
| § | Our predecessor will merge with and into our operating partnership, which will be the survivor of the merger. Pursuant to the merger, our predecessor’s members, including two of our executive officers and their affiliates as described below, will receive an aggregate of 9,993,992 OP units having an aggregate assumed value of $ based on the mid-point of the anticipated IPO price range shown on the cover of this prospectus. The total number of OP units to be issued to our predecessor’s members in the merger reflects our predecessor’s 100% ownership of 63 of our initial hotels prior to the merger and its ownership of a 49% Class A membership interest in Summit of Scottsdale, the owner of two Scottsdale, Arizona hotels prior to the merger. Of the 9,993,992 OP units to be issued in the merger, (1) our Executive Chairman, Mr. Boekelheide, and his affiliates, including The Summit Group, will receive an aggregate of 1,517,879 OP units having an aggregate assumed value of $ based on the mid-point of the anticipated IPO price range shown on the cover of this prospectus and (2) our Executive Vice President and Chief Operating Officer, Mr. Aniszewski, will receive an aggregate of 4,105 OP units having an aggregate value of $ based on the mid-point of the anticipated IPO price range shown on the cover of this prospectus. On November 30, 2010, our predecessor’s members approved the merger. The merger is subject to customary closing conditions, including obtaining all required third-party consents and approvals and completion of this offering. The closing of the merger is not conditioned on the completion of the concurrent private placement. In addition to the OP units issued in the merger, our operating partnership will issue an aggregate of 106,008 OP units to The Summit Group and an unaffiliated third-party investor in the Summit of Scottsdale transaction described below. |
| § | The Summit Group will contribute its 36% Class B membership interest in Summit of Scottsdale to our operating partnership in exchange for 74,829 OP units having an aggregate assumed value of $ based on the mid-point of the anticipated IPO price range shown on the cover of this prospectus. An unaffiliated third-party investor will contribute its 15% Class C membership interest in Summit of Scottsdale to our operating partnership in exchange for 31,179 OP units having an aggregate assumed value of $ based on the mid-point of the anticipated IPO price range shown on the cover of this prospectus. The contributions of the Class B and Class C membership interests in Summit of Scottsdale are subject to customary closing conditions, including obtaining all required third-party consents and approvals and completion of this offering. The closing of these contributions is not conditioned on the completion of the concurrent private placement. |
Our predecessor owns a 49% Class A membership interest in Summit of Scottsdale, which our operating partnership will acquire in the merger. As a result of these contributions and the merger, our operating partnership will assume approximately $13.8 million of existing mortgage debt secured by the Courtyard by Marriott and the SpringHill Suites by Marriott, both located in Scottsdale, Arizona, or the Scottsdale hotels, and will become the sole owner of the two Scottsdale hotels.
| § | Upon completion of the merger and the contributions described above, our operating partnership will become the sole owner of our 65 initial hotels and will enter into new lease agreements with our TRS lessees with respect to the 65 hotels in our initial portfolio. |
| § | The Summit Group will assign all of the hotel management agreements pursuant to which it managed the hotels owned by our predecessor to Interstate for consideration payable to The Summit Group of $12.75 million, and our TRS lessees will enter into a hotel management agreement with Interstate pursuant to which those hotels will be operated. Interstate has advised us that it expects to offer continued employment to nearly all of the employees of The Summit Group responsible for the day-to-day operations of our hotels prior to the formation transactions. |
| § | Our operating partnership intends to use the net proceeds of this offering and the concurrent private placement as follows: (1) approximately $227.6 million to repay or extinguish existing indebtedness that we will assume following completion of the formation transactions, including estimated costs related to this debt repayment totaling approximately $3.8 million; (2) approximately $10.0 million to fund capital improvements at our initial hotels; and (3) the balance for general corporate and working capital purposes, including possible future acquisitions of hotels. |
7
Our Structure
The following diagram depicts our ownership structure immediately following completion of this offering, the concurrent private placement and the formation transactions:
| (1) | To be formed prior to completion of this offering. |
| (2) | Upon completion of the formation transactions, our operating partnership will own 25 of our 65 hotel properties and will lease these hotel properties to our TRS lessees. |
Material Benefits to Related Parties
Upon completion of this offering and the formation transactions, certain of our executive officers and directors will receive, either directly or indirectly, the financial and other benefits summarized below. For a more detailed discussion of these benefits see “Management” and “Certain Relationships and Related Transactions.”
8
Formation Transactions. In connection with the formation transactions, Mr. Boekelheide, our Executive Chairman, and his affiliates, including The Summit Group, which is wholly owned and controlled by Mr. Boekelheide, and Mr. Aniszewski, our Executive Vice President and Chief Operating Officer, will receive the following benefits:
Name | Benefits Received | |
Kerry W. Boekelheide, Executive Chairman and Director | In the formation transactions, Mr. Boekelheide and The Summit Group will receive an aggregate of 1,200,993 OP units, including: (1) 17,000 OP units to be issued to a revocable trust, the trustee and sole beneficiary of which is Mr. Boekelheide, in exchange for the trust’s Class A membership interests in our predecessor; (2) 1,109,164 OP units to be issued to The Summit Group in the merger; and (3) 74,829 OP units to be issued to The Summit Group in exchange for its 36% Class B membership interest in Summit of Scottsdale. These OP units will represent approximately % of our combined common stock and OP units outstanding upon completion of this offering, the concurrent private placement and the formation transactions and have an aggregate value of $ million based on the mid-point of the anticipated IPO price range shown on the cover of this prospectus. | |
| In addition, entities affiliated with Mr. Boekelheide other than The Summit Group will receive an aggregate of 316,886 OP units. Mr. Boekelheide will share voting and investment power over these OP units with individuals who are not affiliated with us. These OP units will represent approximately % of our combined common stock and OP units outstanding upon completion of this offering, the concurrent private placement and the formation transactions and have a combined aggregate value of $ million based on the mid-point of the anticipated IPO price range shown on the cover of this prospectus. | ||
| In consideration for assigning to them the existing hotel management agreements with our predecessor, The Summit Group will receive a cash payment from Interstate in the amount of $12.75 million. | ||
Craig J. Aniszewski, Executive Vice President and Chief Operating Officer | In the merger, Mr. Aniszewski will receive an aggregate of 4,105 OP units in exchange for his Class B membership interests in our predecessor. These OP units represent approximately % of our combined common stock and OP units outstanding upon completion of this offering, the concurrent private placement and the formation transactions and have an aggregate value of $ based on the mid-point of the anticipated IPO price range shown on the cover of this prospectus. |
In addition to the OP units and other material benefits described above to be received in connection with the formation transactions, our executive officers will also benefit from the following:
| § | employment agreements that will provide for salary, bonus and other benefits, including severance benefits in the event of a termination of employment in certain circumstances (see “Management—Employment Agreements”); |
| § | options to purchase an aggregate of 940,000 shares of our common stock, exercisable at the IPO price, will be granted to our named executive officers upon completion of this offering pursuant to the 2010 Equity Incentive Plan (see “Management—Executive Compensation”); |
| § | agreements providing for indemnification by us for certain liabilities and expenses incurred as a result of actions brought, or threatened to be brought, against them as an officer and/or director of our company (see “Management—Indemnification Agreements” and “Certain Provisions of Maryland Law and of Our Charter and Bylaws”); and |
| § | redemption and registration rights under our operating partnership’s partnership agreement with respect to OP units to be issued in the formation transactions (see “Description of the Partnership Agreement” and “Shares Eligible for Future Sale”). |
Furthermore, in connection with the formation transactions, our operating partnership will offer to enter into tax protection agreements with a limited number of the members of our predecessor, including The Summit Group. See “Formation Transactions—Tax Protection Agreements.”
9
Our Financing Strategy
We expect to maintain a prudent capital structure and intend to limit the sum of the outstanding principal amount of our consolidated net indebtedness to not more than 5.5x of our earnings before interest, tax, depreciation and amortization, or EBITDA, for the 12-month period preceding the incurrence of such debt. Over time, we intend to finance our long-term growth with common and preferred equity issuances and debt financing having staggered maturities. Our debt may include mortgage debt secured by hotels and unsecured debt.
At or shortly after completion of this offering and the concurrent private placement, we anticipate entering into a $ million secured revolving credit facility to fund future acquisitions, as well as for property redevelopments, capital expenditures and working capital requirements. We may not succeed in obtaining a secured revolving credit facility on the indicative terms and conditions described in “Management’s Discussion and Analysis of Financial Condition and Results of Operations—Liquidity and Capital Resources—Our Anticipated Secured Revolving Credit Facility” or at all. We cannot predict the size of a secured revolving credit facility if we are able to obtain one.
When purchasing hotel properties, we may issue OP units as full or partial consideration to sellers who may desire to take advantage of tax deferral on the sale of a hotel or participate in the potential appreciation in value of our common stock.
Conflicts of Interest
Following completion of this offering and the formation transactions, there will be conflicts of interest between the holders of OP units, including certain of our executive officers and directors, and our stockholders with respect to certain transactions. In addition to their ownership of OP units, these executive officers and directors may have conflicting duties because, in their capacities as our executive officers and directors, they have a duty to us and our stockholders, while at the same time, we, through our wholly owned subsidiary that serves as the general partner of our operating partnership, have a fiduciary duty to the limited partners. Conflicts may arise when the interests of our stockholders and the limited partners of our operating partnership diverge, particularly in circumstances in which there may be an adverse tax consequence to the limited partners. For example, the sale of any of the hotels in our portfolio or the repayment of indebtedness may have different tax consequences to holders of OP units as compared to our stockholders. The amended and restated limited partnership agreement of our operating partnership contains a provision that in the event of a conflict of interest between our stockholders and the limited partners of our operating partnership, as general partner we will endeavor in good faith to resolve the conflict in a manner not adverse to either our stockholders or the limited partners of our operating partnership, and, if we, in our sole discretion as general partner of our operating partnership, determine that a conflict cannot be resolved in a manner not adverse to our stockholders and the limited partners of our operating partnership, the conflict will be resolved in favor of our stockholders.
Both we and our predecessor have sought to structure the formation transactions so as to minimize potential conflicts of interest, including by appointing a special committee of our predecessor’s independent managers to review the terms of the proposed merger of our predecessor into our operating partnership. However, we did not conduct arm’s-length negotiations with our predecessor’s members or the members of Summit of Scottsdale with respect to the terms of the formation transactions, including the merger. Our Executive Chairman, Mr. Boekelheide, and his affiliates, including The Summit Group, have substantial, pre-existing ownership interests in our predecessor and Summit of Scottsdale. In addition, Mr. Aniszewski, our Executive Vice President and Chief Operating Officer, has a pre-existing ownership interest in our predecessor. Both Mr. Boekelheide and Mr. Aniszewski sat on the board of managers of our predecessor that approved the terms of the formation transactions. In the course of structuring the formation transactions, Mr. Boekelheide and Mr. Aniszewski had the ability to influence the type and level of benefits they will receive from us. Although our predecessor’s special committee received a fairness opinion from an independent third-party financial advisor that is not one of the underwriters of this offering with respect to the fairness, from a financial point of view, of the merger consideration to the former members of our predecessor, assuming that the value of the OP units issued as the merger consideration was between $140 million and $160 million, we did not obtain a fairness opinion with respect to the fairness of the merger consideration to us and we did not obtain recent third-party appraisals for all of the hotels to be acquired by us in the formation transactions. As a result, the consideration to be paid by us to the members of our predecessor in the merger for our predecessor’s 63 hotels and its 49% ownership interest in the two Scottsdale hotels may exceed the fair market value of the hotels and other assets being acquired by us in the formation transactions or the price that would have been paid in an arm’s-length transaction.
10
Our Tax Status
We intend to elect to be taxed as a REIT for federal income tax purposes commencing with our short taxable year ending December 31, 2010. Our qualification as a REIT will depend upon our ability to meet, on a continuing basis, through actual investment and operating results, various complex requirements under the Internal Revenue Code, as amended, or the Code, relating to, among other things, the sources of our gross income, the composition and values of our assets, our distribution levels and the diversity of ownership of our shares of capital stock. We believe that we will be organized in conformity with the requirements for qualification as a REIT under the Code and that our intended manner of operation will enable us to meet the requirements for qualification and taxation as a REIT for federal income tax purposes commencing with our short taxable year ending December 31, 2010 and continuing thereafter.
In order for the income from our hotel operations to constitute “rents from real property” for purposes of the gross income tests required for REIT qualification, we cannot directly operate any of our hotel properties. Instead, we must lease our hotel properties. Accordingly, we will lease each of our hotel properties to one of our TRS lessees, which will be wholly owned by our operating partnership. Our TRS lessees will pay rent to us that can qualify as “rents from real property,” provided that the TRS lessees engage “eligible independent contractors” to manage our hotels. A TRS is a corporate subsidiary of a REIT that jointly elects with the REIT to be treated as a TRS of the REIT and that pays federal income tax at regular corporate rates on its taxable income. We expect that all of the hotels in our portfolio will be leased to one of our TRS lessees, which will be able to pay us rent out of the revenue of the hotels. Our TRS lessees will engage Interstate to manage the hotels in our initial portfolio. We believe Interstate will qualify as an eligible independent contractor.
As a REIT, we generally will not be subject to federal income tax on our REIT taxable income that we distribute currently to our stockholders. Under the Code, REITs are subject to numerous organizational and operational requirements, including a requirement that they distribute each year at least 90% of their taxable income, determined without regard to the deduction for dividends paid and excluding any net capital gains. If we fail to qualify for taxation as a REIT in any taxable year and do not qualify for certain statutory relief provisions, our income for that year will be taxed at regular corporate rates, and we will be disqualified from taxation as a REIT for the four taxable years following the year during which we ceased to qualify as a REIT. Even if we qualify as a REIT for federal income tax purposes, we may still be subject to state and local taxes on our income and assets and to federal income and excise taxes on our undistributed income. Additionally, any income earned by our TRS lessees will be fully subject to federal, state and local corporate income tax.
Distribution Policy
To qualify as a REIT, we must distribute annually to our stockholders an amount at least equal to 90% of our REIT taxable income, determined without regard to the deduction for dividends paid and excluding any net capital gain. We will be subject to income tax on our taxable income that is not distributed and to an excise tax to the extent that certain percentages of our taxable income are not distributed by specified dates. See “Material Federal Income Tax Considerations.” Income as computed for purposes of the foregoing tax rules will not necessarily correspond to our income as determined for financial reporting purposes. Our cash available for distribution may be less than the amount required to meet the distribution requirements for REITs under the Code, and we may be required to borrow money, sell assets or issue capital stock to satisfy the distribution requirements. Additionally, we may pay future distributions from the proceeds from this offering or other securities offerings.
We intend to make regular quarterly cash distributions to our stockholders, as more fully described below. We expect to pay our initial distribution with respect to the period commencing upon completion of this offering and ending March 31, 2011, based on a rate of $ per share for a full quarter. On an annualized basis, this would equal approximately $ per share, or an estimated initial annual dividend rate of approximately % based on the mid-point of the anticipated IPO price range shown on the cover of this prospectus. We do not intend to reduce the expected dividend per share if the underwriters’ option to purchase additional shares is exercised.
The timing and frequency of distributions will be authorized by our board of directors and declared by us based upon a variety of factors deemed relevant by our directors, including restrictions under applicable law and our loan agreements, capital requirements of our company and the REIT requirements of the Code. Distributions to stockholders generally will be taxable to our stockholders as ordinary income, although a portion of such distributions may be designated by us as long-term capital gain or may constitute a return of capital. We will furnish annually to each of our stockholders a statement setting forth distributions paid during the preceding year and their federal income tax status. For a discussion of the federal income tax treatment of our distributions, see “Material Federal Income Tax Considerations.”
11
Restrictions on Ownership of Our Capital Stock
In order to assist us in qualifying as a REIT, our charter, subject to certain exceptions, restricts the amount of shares of our capital stock that a person may beneficially or constructively own. Our charter provides that, subject to certain exceptions, no person may beneficially or constructively own more than 9.8% in value or in number of shares, whichever is more restrictive, of the outstanding shares of any class or series of our capital stock. Our charter also prohibits any person from:
| § | beneficially owning shares of our capital stock to the extent that such beneficial ownership would result in our being “closely held” within the meaning of Section 856(h) of the Code (without regard to whether the ownership interest is held during the last half of the taxable year); | |
| § | transferring shares of our capital stock to the extent that such transfer would result in shares of our capital stock being beneficially owned by fewer than 100 persons (determined under the principles of Section 856(a)(5) of the Code); | |
| § | beneficially or constructively owning shares of our capital stock to the extent such beneficial or constructive ownership would cause us to constructively own ten percent or more of the ownership interests in a tenant (other than a TRS) of our real property within the meaning of Section 856(d)(2)(B) of the Code; or | |
| § | beneficially or constructively owning or transferring shares of our capital stock if such beneficial or constructive ownership or transfer would otherwise cause us to fail to qualify as a REIT under the Code, including, but not limited to, as a result of any hotel management companies failing to qualify as an “eligible independent contractor” under the REIT rules. |
Our board of directors, in its sole discretion, may prospectively or retroactively exempt a person from certain of these limits and may establish or increase an excepted holder percentage limit for such person. The person seeking an exemption must provide to our board of directors such representations, covenants and undertakings as our board of directors may deem appropriate in order to conclude that granting the exemption will not cause us to lose our status as a REIT.
Our Corporate Information
We were formed as a Maryland corporation on June 30, 2010 and intend to elect and qualify to be taxed as a REIT for federal income tax purposes commencing with our short taxable year ending December 31, 2010. Our corporate offices are located at 2701 South Minnesota Avenue, Suite 6, Sioux Falls, South Dakota 57105. Our telephone number is (605) 361-9566. Our website is www.shpreit.com. The information contained on, or accessible through, our website is not incorporated by reference into this prospectus and should not be considered a part of this prospectus.
12
The Offering
| Common stock offered by us in this offering | shares |
| Common stock to be outstanding after this offering and the concurrent private placement | shares(1) |
| Common stock and OP units to be outstanding after this offering, the concurrent private placement and the formation transactions | shares and OP units(2) |
| Use of proceeds | We estimate that the net proceeds we will receive from the sale of shares of our common stock in this offering and shares of our common stock in the concurrent private placement will be approximately $ million (or approximately $ million if the underwriters exercise their over-allotment option in full), after deducting the underwriting discount of approximately $ million (or approximately $ million if the underwriters exercise their over-allotment option in full) and estimated expenses related to this offering, the concurrent private placement and the formation transactions of approximately $3.6 million payable by us. We will contribute the net proceeds of this offering and the concurrent private placement to our operating partnership. Our operating partnership intends to use the net proceeds of this offering and the concurrent private placement as follows: (1) approximately $227.6 million to repay or extinguish existing indebtedness that we will assume upon completion of the formation transactions, including estimated related costs totaling approximately $3.8 million; (2) approximately $10.0 million to fund capital improvements at our hotels; and (3) the balance for general corporate and working capital purposes, including possible future hotel acquisitions. See “Use of Proceeds” for additional information. |
| Ownership and transfer restrictions | In order to assist us in qualifying as a REIT, our charter provides that, subject to certain exceptions, no person may beneficially or constructively own more than 9.8% in value or in number of shares, whichever is more restrictive, of our common stock and places certain other restrictions on ownership of our stock. | |
| Proposed NYSE symbol | “INN” |
| (1) | Immediately prior to the closing of this offering and the concurrent private placement, we will have a total of 1,000 shares of common stock outstanding. We sold these shares to our Executive Chairman, Mr. Boekelheide, in connection with our formation and initial capitalization for total consideration of $1,000. At the closing of this offering and the concurrent private placement, we will repurchase these shares from Mr. Boekelheide for $1,000. The number of shares of common stock to be outstanding immediately after the repurchase of these shares and the closing of this offering and the concurrent private placement includes: (i) shares of common stock to be sold in this offering, (ii) shares of common stock to be sold in the concurrent private placement to an affiliate of IHG and (iii) an aggregate of 4,000 shares of common stock to be issued to our independent directors pursuant to the 2010 Equity Incentive Plan upon completion of this offering. The number of shares of common stock to be outstanding immediately after the closing of this offering and the concurrent private placement excludes: (i) up to shares of common stock issuable upon exercise of the underwriters’ over-allotment option; (ii) an aggregate of 940,000 shares of common stock issuable upon exercise of options that we will grant to our Executive Chairman, Mr. Boekelheide, our President and Chief Executive Officer, Daniel P. Hansen, our Executive Vice President and Chief Operating Officer, Mr. Aniszewski, our Executive Vice President and Chief Financial Officer, Stuart J. Becker, and our Vice President of Acquisitions, Ryan A. Bertucci, pursuant to the 2010 Equity Incentive Plan upon completion of this offering; (iii) the shares of common stock remaining available for future issuance under the 2010 Equity Incentive Plan after the stock awards to our independent directors and the option grants to our named executive officers, each of which is described above, have been made; and (iv) up to 10,100,000 shares of common stock issuable upon redemption of the 10,100,000 OP units to be issued by our operating partnership in the formation transactions. |
| (2) | Includes all of the shares of common stock identified in the fourth sentence of footnote (1) above, and 10,100,000 OP units to be issued in the formation transactions to our predecessor’s former members and the former Class B and Class C members of Summit of Scottsdale in exchange for their membership interests in those entities. Pursuant to the limited partnership agreement of our operating partnership, limited partners, other than us, will have redemption rights which will enable them to cause our operating partnership to redeem their OP units in exchange for cash or, at our operating partnership’s option, shares of our common stock on a one-for-one basis. The number of shares of common stock issuable upon redemption of OP units may be adjusted upon the occurrence of certain events described under “Description of the Partnership Agreement—Redemption Rights.” |
13
Summary Pro Forma Financial Information
You should read the following summary pro forma financial and operating data in conjunction with “Management’s Discussion and Analysis of Financial Condition and Results of Operations” and our unaudited pro forma condensed consolidated financial statements and our predecessor’s consolidated financial statements, including the related notes, appearing elsewhere in this prospectus.
The following unaudited summary pro forma financial information is presented to reflect:
| § | the sale of shares of our common stock in this offering at $ per share, the mid-point of the anticipated IPO price range shown on the cover of this prospectus, and the sale of shares of our common stock in the concurrent private placement at $ per share, the mid-point of the anticipated IPO price range on the cover of this prospectus less the underwriting discount per share, for approximately $260.4 million of estimated net proceeds, after the deduction of the estimated underwriting discount of approximately $ million and the payment by us of approximately $3.6 million of estimated expenses related to this offering, the concurrent private placement and the formation transactions; |
| § | the merger of our predecessor with and into our operating partnership, with our predecessor as the acquirer for accounting purposes, and the issuance by our operating partnership of an aggregate of 9,993,992 OP units to the Class A, Class A-1, Class B and Class C members of our predecessor in exchange for their membership interests in our predecessor; |
| § | the contribution to our operating partnership of the Class B and Class C membership interests in Summit of Scottsdale held by The Summit Group and an unaffiliated third-party investor in exchange for an aggregate of 106,008 OP units; |
| § | the contribution of the net proceeds of this offering and the concurrent private placement to our operating partnership in exchange for OP units that represent an approximate % partnership interest in our operating partnership, including the sole general partnership interest; |
| § | the repayment or extinguishment of approximately $223.8 million of outstanding indebtedness and the payment of estimated costs and expenses of approximately $3.8 million in connection with the retirement of this indebtedness; and |
| § | the grant upon completion of this offering of an aggregate of 4,000 shares of our common stock to our independent directors and options to purchase an aggregate of 940,000 shares of our common stock to Messrs. Boekelheide, Hansen, Aniszewski, Becker and Bertucci pursuant to the 2010 Equity Incentive Plan. |
Following completion of the merger, the historical consolidated financial statements of our predecessor will become our historical consolidated financial statements, and our assets and liabilities will be recorded at their respective historical carrying values as of the date of completion of the merger.
The unaudited pro forma balance sheet data appearing below assumes that each of these transactions occurred on September 30, 2010. The unaudited pro forma statements of operations and other operating data assume that each of these transactions occurred on January 1, 2009.
In the opinion of our management, all material adjustments to reflect the effects of the preceding transactions have been made. The unaudited pro forma balance sheet data is presented for illustrative purposes only and is not necessarily indicative of what our actual financial position would have been had the transactions referred to above occurred on September 30, 2010, nor does it purport to represent our future financial position. The unaudited pro forma condensed statements of operations and other operating data are presented for illustrative purposes only and are not necessarily indicative of what our actual results of operations would have been had the transactions referred to above occurred on January 1, 2009, nor do they purport to represent our future results of operations.
14
The following table presents summary unaudited pro forma balance sheet data as of September 30, 2010 (dollars in thousands):
| Pro Forma | ||||
| as of September 30, 2010 | ||||
| (unaudited) | ||||
| Cash and cash equivalents | $ | 35,836 | ||
| Property and equipment, net | $ | 454,983 | ||
| Total assets | $ | 534,173 | ||
| Mortgages and notes payable | $ | 198,425 | ||
| Total liabilities | $ | 212,357 | ||
| Stockholders’ equity | $ | 256,260 | ||
| Noncontrolling interest | $ | 65,556 | ||
| Total liabilities and equity | $ | 534,173 | ||
The following table presents summary unaudited pro forma statement of operations and other data for the nine months ended September 30, 2010 and for the year ended December 31, 2009 (dollars in thousands, except per-share data):
| Pro Forma | Pro Forma | |||||||
| Nine Months Ended | Year Ended | |||||||
| September 30, 2010 | December 31, 2009 | |||||||
| (unaudited) | (unaudited) | |||||||
Statement of Operations Data: | ||||||||
Revenue | ||||||||
| Room revenues | $ | 102,874 | $ | 118,960 | ||||
| Other hotel operations revenues | 1,939 | 2,240 | ||||||
Total Revenue | 104,813 | 121,200 | ||||||
Expenses(1) | ||||||||
| Hotel operating expenses: | ||||||||
| Rooms | 30,677 | 36,720 | ||||||
| Other direct | 13,068 | 18,048 | ||||||
| Other indirect | 28,392 | 33,540 | ||||||
| Other | 460 | 681 | ||||||
| Total hotel operating expenses | 72,597 | 88,989 | ||||||
| Depreciation and amortization | 20,094 | 23,088 | ||||||
| Corporate general and administrative: | ||||||||
| Salaries and other compensation | 2,950 | 3,933 | ||||||
| Equity-based compensation | ||||||||
| Other | 1,381 | 1,841 | ||||||
| Hotel property acquisition costs | 130 | 1,389 | ||||||
| Loss on impairment of assets | — | 7,506 | ||||||
Total expenses | 97,152 | 126,746 | ||||||
Income (loss) from operations | 7,661 | (5,546 | ) | |||||
| Other Income (expense): | ||||||||
| Interest income | 36 | 50 | ||||||
| Interest expense | (7,770 | ) | (9,052 | ) | ||||
| Loss on disposal of assets | (40 | ) | (4 | ) | ||||
Total other expense | (7,774 | ) | (9,006 | ) | ||||
Loss from continuing operations | (113 | ) | (14,552 | ) | ||||
Net loss before income taxes | (113 | ) | (14,552 | ) | ||||
| Income tax expense | (770 | ) | (840 | ) | ||||
Net loss | $ | (883 | ) | $ | (15,392 | ) | ||
15
| Pro Forma | Pro Forma | |||||||
| Nine Months Ended | Year Ended | |||||||
| September 30, 2010 | December 31, 2009 | |||||||
| (unaudited) | (unaudited) | |||||||
| Net loss attributable to noncontrolling interest | $ | (309 | ) | $ | (5,387 | ) | ||
| Net loss attributable to common stockholders | (574 | ) | (10,005 | ) | ||||
| Pro forma net income (loss) per common share: | ||||||||
| Basic | ||||||||
| Diluted | ||||||||
| Pro forma weighted-average number of shares outstanding: | ||||||||
| Basic | ||||||||
| Diluted | ||||||||
Other Data: | ||||||||
FFO(2) | $ | 19,211 | $ | 7,696 | ||||
EBITDA(3) | $ | 27,715 | $ | 17,538 | ||||
| (1) | Historically, our predecessor segregated its operating expenses (direct hotel operations expense, other hotel operating expense, general, selling and administrative expense and repairs and maintenance) from its other operating expenses, such as depreciation and amortization and impairment losses. Following completion of this offering, we intend to reclassify our operating expenses into categories of hotel operating expenses (room expenses, other direct expenses, other indirect expenses and other expenses) and reclassify our predecessor’s historical items of hotel operating expense to increase the comparability of our hotel operating expenses and our hotel operating results with those of other publicly traded hospitality REITs. Accordingly, historical balances included in our predecessor’s: |
| § | direct hotel operations expense related to (1) wages, payroll taxes and benefits, linens, cleaning and guestroom supplies and complimentary breakfast will be reclassified to rooms expense in our consolidated statements of operations and (2) franchise fees will be reclassified to other indirect expense in our consolidated statements of operations; | |
| § | other hotel operating expenses related to (1) utilities and telephone will be reclassified to other direct expenses in our consolidated statements of operations and (2) real and personal property taxes, insurance and cable will be reclassified to other indirect expenses in our consolidated statements of operations; | |
| § | general, selling and administrative expenses related to (1) office supplies, advertising, miscellaneous operating expenses and bad debt expense will be reclassified to other direct expenses in our consolidated statements of operations, (2) credit card/travel agent commissions, management company expenses, management company legal and accounting fees and franchise fees will be reclassified to other indirect expenses in our consolidated statements of operations, (3) hotel development and startup costs will be reclassified to hotel property acquisition costs in our consolidated statements of operations and (4) ground rent and other miscellaneous expenses will be reclassified to other expenses in our consolidated statements of operations; and | |
| § | repairs and maintenance will be reclassified to other direct expenses in our consolidated statements of operations. |
| On a pro forma basis, the reclassification reduces total hotel operating expenses (direct hotel operations expense, other hotel operating expense, general, selling and administrative expense and repairs and maintenance) by $130,000 for the nine months ended September 30, 2010 and $1.4 million for the year ended December 31, 2009, which were reclassified to hotel operating costs. The reclassification does not impact amounts reported by our predecessor as total expenses (total hotel operating expenses, depreciation and amortization and loss on impairment of assets), income from operations, total other income, income (loss) from continuing operations, income (loss) from discontinued operations, net income (loss) before income taxes or net income (loss). See “Unaudited Pro Forma Condensed Consolidated Financial Statements” for additional information. |
| (2) | As defined by the National Association of Real Estate Investment Trusts, or NAREIT, funds from operations, or FFO, represents net income or loss (computed in accordance with GAAP), excluding gains (or losses) from sales of property, plus real estate depreciation and amortization (excluding amortization of deferred financing costs). We present FFO because we consider it an important supplemental measure of our operational performance and believe it is frequently used by securities analysts, investors and other interested parties in the evaluation of REITs, many of which present FFO when reporting their results. FFO is intended to exclude GAAP historical cost depreciation and amortization of real estate and related assets, which assumes that the value of real estate assets diminishes ratably over time. Historically, however, real estate values have risen or fallen with market conditions. Because FFO excludes depreciation and amortization unique to real estate, gains and losses from property dispositions and extraordinary items, it provides a performance measure that, when compared year over year, reflects the impact to operations from trends in occupancy, room rates, operating costs, development activities and interest costs, providing perspective not immediately apparent from net income. We compute FFO in accordance with standards established by the Board of Governors of NAREIT in its March 1995 White Paper (as amended in November 1999 and April 2002), which may differ from the methodology for calculating FFO utilized by other equity REITs and, accordingly, may not be comparable to such other REITs. Further, FFO does not represent amounts available for management’s discretionary use because of needed capital replacement or expansion, debt service obligations, or other commitments and uncertainties. FFO should not be considered as an alternative to net income (loss) (computed in accordance with GAAP) as an indicator of our liquidity, nor is it indicative of funds available to fund our cash needs, including our ability to pay dividends or make distributions. |
| We caution investors that amounts presented in accordance with our definitions of FFO may not be comparable to similar measures disclosed by other companies, since not all companies calculate this non-GAAP measure in the same manner. FFO should not be considered as an alternative measure of our net income (loss) or operating performance. FFO may include funds that may not be available for our discretionary use due to functional requirements to conserve funds for capital expenditures and property acquisitions and other commitments and uncertainties. Although we believe that FFO can enhance your understanding of our financial condition and results of operations, this non-GAAP financial measure is not necessarily a better indicator of any trend as compared to a comparable GAAP measure such as net income (loss). Below, we include a quantitative |
16
| reconciliation of pro forma FFO to the most directly comparable GAAP financial performance measure, which is pro forma net income (loss) (dollars in thousands): |
| Pro Forma | Pro Forma | |||||||
| Nine Months Ended | Year Ended | |||||||
| September 30, 2010 | December 31, 2009 | |||||||
| Net loss | $ | (883 | ) | $ | (15,392 | ) | ||
| Depreciation and amortization | 20,094 | 23,088 | ||||||
| FFO | $ | 19,211 | $ | 7,696 | ||||
| (3) | EBITDA represents net income or loss, excluding: (i) interest, (ii) income tax expense and (iii) depreciation and amortization. We believe EBITDA is useful to an investor in evaluating our operating performance because it provides investors with an indication of our ability to incur and service debt, to satisfy general operating expenses, to make capital expenditures and to fund other cash needs or reinvest cash into our business. We also believe it helps investors meaningfully evaluate and compare the results of our operations from period to period by removing the impact of our asset base (primarily depreciation and amortization) from our operating results. Our management also uses EBITDA as one measure in determining the value of acquisitions and dispositions. | |
| We caution investors that amounts presented in accordance with our definitions of EBITDA may not be comparable to similar measures disclosed by other companies, since not all companies calculate this non-GAAP measure in the same manner. EBITDA should not be considered as an alternative measure of our net income (loss) or operating performance. EBITDA may include funds that may not be available for our discretionary use due to functional requirements to conserve funds for capital expenditures and property acquisitions and other commitments and uncertainties. Although we believe that EBITDA can enhance your understanding of our financial condition and results of operations, this non-GAAP financial measure is not necessarily a better indicator of any trend as compared to a comparable GAAP measure such as net income (loss). Below, we include a quantitative reconciliation of pro forma EBITDA to the most directly comparable GAAP financial performance measure, which is pro forma net income (loss) (dollars in thousands): |
| Pro Forma | Pro Forma | |||||||
| Nine Months Ended | Year Ended | |||||||
| September 30, 2010 | December 31, 2009 | |||||||
| Net loss | $ | (883 | ) | $ | (15,392 | ) | ||
| Interest income | (36 | ) | (50 | ) | ||||
| Interest expense | 7,770 | 9,052 | ||||||
| Income tax expense | 770 | 840 | ||||||
| Depreciation and amortization | 20,094 | 23,088 | ||||||
| EBITDA | $ | 27,715 | $ | 17,538 | ||||
17
Risk Factors
An investment in our common stock involves risks. Before making an investment decision, you should carefully consider the following risk factors, which address the material risks concerning our business and an investment in our common stock, together with the other information contained in this prospectus. If any of the risks discussed in this prospectus were to occur, our business, prospects, financial condition, results of operation and our ability to service our debt and make distributions to our stockholders could be materially and adversely affected, the market price per share of our common stock could decline significantly and you could lose all or a part of your investment. Some statements in this prospectus, including statements in the following risk factors constitute forward-looking statements. Please refer to the section entitled “Cautionary Note Regarding Forward-Looking Statements.”
Risks Related to Our Business
Our business strategy depends significantly on achieving revenue and net income growth from anticipated increases in demand for hotel rooms—any delay or a weaker than anticipated economic recovery will adversely affect our future results of operations and our growth prospects.
Our hotel properties experienced declining operating performance across various U.S. markets during the recent economic recession. Our business strategy depends significantly on achieving revenue and net income growth from anticipated improvement in demand for hotel rooms as part of a future economic recovery. We, however, cannot provide any assurances that demand for hotel rooms will increase from current levels. If demand does not increase in the near future, or if demand weakens further, our operating results and growth prospects could be adversely affected. In particular, we already have reduced our operating expenses significantly in response to the recent economic recession and our ability to reduce operating expenses further to improve our operating performance is limited. As a result, any delay or a weaker than anticipated economic recovery will adversely affect our future results of operations and our growth prospects.
Our unseasoned hotels have limited, if any, operating history and may not achieve the operating performance we anticipate, and as a result, our overall returns may not improve as we expect or may decline.
Our unseasoned hotels have experienced extended stabilization periods as a result of the significant decline in general economic conditions. Consequently, many of these hotels continue to generate negative cash flow beyond our original expectations for them. Significant increases in anticipated hotel room supply or decreases in hotel room demand in the markets where any one or more of our unseasoned hotels are located could cause the operating performance of those hotels to be below our original plans for them. If macroeconomic conditions or conditions specific to their markets do not improve significantly or our anticipated improved results for these hotels do not otherwise materialize, our overall returns may not improve as we expect or may decline.
We have no operating history as a publicly traded REIT and may not be successful in operating as a publicly traded REIT, which may adversely affect our ability to make distributions to our stockholders.
We have no operating history as a publicly traded REIT. The REIT rules and regulations are highly technical and complex. We cannot assure you that our management team’s past experience will be sufficient to successfully operate our company as a publicly traded REIT, implement appropriate operating and investment policies and comply with Code or Treasury Regulations that are applicable to us. Failure to comply with the income, asset, and other requirements imposed by the REIT rules and regulations could prevent us from qualifying as a REIT, and could force us to pay unexpected taxes and penalties which may adversely affect our ability to make distributions to our stockholders.
Our success depends on key personnel whose continued service is not guaranteed.
We depend on the efforts and expertise of our management team to manage our day-to-day operations and strategic business direction. The loss of services from any of the members of our management team, particularly our Executive Chairman, Mr. Boekelheide, and our President and Chief Executive Officer, Daniel P. Hansen, and our inability to find suitable replacements on a timely basis could have an adverse effect on our operations.
18
We may be unable to complete acquisitions that would grow our business.
Our growth strategy includes the disciplined acquisition of hotels as opportunities arise. Our ability to acquire hotels on satisfactory terms or at all is subject to the following significant risks:
| § | we may be unable to acquire or may be forced to acquire at significantly higher prices desired hotels because of competition from other real estate investors with more capital, including other real estate operating companies, REITs and investment funds; | |
| § | we may be unable to obtain the necessary debt or equity financing to consummate an acquisition or, if obtainable, financing may not be on satisfactory terms; and | |
| § | agreements for the acquisition of hotels are typically subject to customary conditions to closing, including satisfactory completion of due diligence investigations, and we may spend significant time and money on potential acquisitions that we do not consummate. |
If we cannot complete hotel acquisitions on favorable terms or at all, our business, financial condition, results of operations and cash flow, the market price per share of our common stock and our ability to satisfy our debt service obligations and make distributions to our stockholders could be materially and adversely affected.
We may not be able to acquire the hotels we have under letter of intent.
We have not entered into a definitive purchase agreement to acquire the 216-room hotel located in downtown Minneapolis, Minnesota that we have under a letter of intent. The letter of intent is non-binding and we cannot assure you that the seller will be willing to proceed with a transaction, that we will be able to negotiate and execute a satisfactory definitive purchase and sale agreement with the seller, that our due diligence will be satisfactory or that the conditions to closing will be satisfied.
We have not entered into a definitive purchase agreement to acquire the 143-room hotel located in Duluth, Georgia and the 121-room hotel located in Glendale (Denver), Colorado that we have under a letter of intent. The letter of intent is non-binding and we cannot assure you that the seller will be willing to proceed with a transaction, that we will be able to negotiate and execute a satisfactory definitive purchase and sale agreement with the seller, that our due diligence will be satisfactory or that the conditions to closing will be satisfied.
We may fail to successfully integrate and operate newly acquired hotels.
Our ability to successfully integrate and operate newly acquired hotels is subject to the following risks:
| § | we may not possess the same level of familiarity with the dynamics and market conditions of any new markets that we may enter, which could result in us paying too much for hotels in new markets; |
| § | market conditions may result in lower than expected occupancy and room rates; |
| § | we may acquire hotels without any recourse, or with only limited recourse, for liabilities, whether known or unknown, such as clean-up of environmental contamination, claims by tenants, vendors or other persons against the former owners of the hotels and claims for indemnification by general partners, directors, officers and others indemnified by the former owners of the hotels. | |
| § | we may need to spend more than budgeted amounts to make necessary improvements or renovations to our newly acquired hotels; and | |
| § | we may be unable to quickly and efficiently integrate new acquisitions, particularly acquisitions of portfolios of hotels, into our existing operations. |
If we cannot operate acquired hotels to meet our goals or expectations, our business, financial condition, results of operations and cash flow, the market price per share of our common stock and our ability to satisfy our debt service obligations and make distributions to our stockholders could be materially and adversely affected.
We may not succeed in managing our growth, in which case our financial results could be adversely affected.
Our ability to grow our business depends upon our management team’s business contacts and their ability to successfully hire, train, supervise and manage additional personnel. We may not be able to hire and train sufficient personnel or develop management, information and operating systems suitable for our expected growth. If we are unable to manage any future growth effectively, our operations and financial results could be adversely affected.
19
Upon completion of this offering and the formation transactions, the management of all of the hotels in our initial portfolio will be concentrated in one hotel management company.
Upon completion of this offering and the formation transactions, all of the hotels in our initial portfolio will be operated by Interstate. This significant concentration of credit and operational risk in one hotel management company makes us more vulnerable economically than if we entered into hotel management agreements with several hotel management companies. Any adverse developments in Interstate’s business and affairs, financial strength or ability to operate our hotels efficiently and effectively could have a material adverse effect on our results of operations. We cannot assure you that Interstate will have sufficient assets, income and access to financing and insurance coverage to enable it to satisfy its obligations to us or effectively and efficiently operate our initial hotel properties. The failure or inability of Interstate to satisfy its obligations to us or effectively and efficiently operate our initial hotel properties would materially reduce our revenues and net income, which could in turn reduce the amount of our distributable cash and cause the market price per share of our common stock to decline.
Termination of our hotel management agreement with Interstate may cause us to pay substantial termination fees or to experience significant disruptions at the affected hotels.
If we replace Interstate as the hotel manager of any of our hotels, we may be required to pay a substantial termination fee and we may experience significant disruptions at the affected hotel. If we experience disruptions at the affected hotel, our financial condition, results of operations and our ability to service debt and make distributions to our stockholders could be materially and adversely affected.
Restrictive covenants in hotel management and franchise agreements could preclude us from taking actions with respect to the sale or refinancing of a hotel that would otherwise be in our best interest.
Hotel management and franchise agreements typically contain restrictive covenants that do not provide us with flexibility to sell or refinance a hotel without the consent of a manager or franchisor. For example, the terms of some of these agreements may restrict our ability to sell a hotel unless the purchaser is not a competitor of the hotel management company, assumes the related agreement and meets specified other conditions. We could be forced to pay consent or possibly termination fees to hotel managers or franchisors under these agreements. As a result of these types of restrictive covenants, we may be precluded from taking actions that would otherwise be in our best interest or could cause us to incur substantial expense.
IHG is not obligated to refer acquisition opportunities to us and we may fail to realize any benefits from our sourcing agreement with IHG.
We consider IHG’s potential willingness to refer potential acquisition opportunities to us, in IHG’s sole discretion, to be an important component of our sourcing relationship with IHG. Under the terms of our agreement with it, however, IHG will not be obligated to refer any of these opportunities to us and there can be no assurance that the sourcing agreement will result in the completion of any transactions between us and IHG. As a result, we may not realize the benefits of this agreement in full or at all.
We may not be able to cause our hotel management companies to operate any of our hotels in a manner satisfactory to us, which could adversely affect our financial condition, results of operations and our ability to service debt and make distributions to our stockholders.
To qualify as a REIT, we cannot operate our hotels. We will lease our hotels to our TRS lessees, which will, in turn, enter into hotel management agreements with hotel management companies, such as Interstate, that qualify as “eligible independent contractors” to operate our hotels. As a result, our financial condition, results of operations and our ability to service debt and make distributions to stockholders are dependent on the ability of Interstate and any other hotel management companies that we may retain in the future to operate our hotels successfully. Any failure by our hotel management companies to provide quality services and amenities or maintain a quality brand name and reputation could have a negative impact on their ability to operate our hotels and could have a material and adverse affect our financial condition, results of operations and our ability to service debt and make distributions to our stockholders.
We cannot and will not control the hotel management companies that operate and are responsible for maintenance and other day-to-day management of our hotels, including, but not limited to, the implementation of significant operating decisions. We cannot assure you that our hotel management companies will manage our properties in a manner that is consistent with their obligations under the management agreement or our obligations under our hotel franchise agreements, that our hotel
20
management companies will not be negligent in their performance or engage in other criminal or fraudulent activity, or that they will not otherwise default on their management obligations to us. If any of the foregoing occurs, our relationships with the franchisors may be damaged and we may then be in breach of the franchise agreements, and we could incur liabilities resulting from loss or injury to our property or to persons at our properties, any of which could have a material adverse effect on our operating results and financial condition, as well as our ability to pay dividends to stockholders.
Even if we believe a hotel is being operated inefficiently or in a manner that does not result in satisfactory operating results, we will have limited ability to require the hotel management company to change its method of operation. We generally will attempt to resolve issues with our hotel management companies through discussions and negotiations. However, if we are unable to reach satisfactory results through discussions and negotiations, we may choose to litigate the dispute or submit the matter to third-party dispute resolution or arbitration. We would only be able to seek redress if a hotel management company violates the terms of the applicable hotel management agreement, and then only to the extent of the remedies provided for under the terms of the hotel management agreement. Our hotel managers or their affiliates manage, and in some cases own, have invested in, or provided credit support or operating guarantees to hotels that compete with our hotels, all of which may result in conflicts of interest. As a result, our hotel managers may in the future make decisions regarding competing lodging facilities that are not or would not be in our best interest.
Funds spent to maintain franchisor operating standards, the loss of a franchise license or a decline in the value of a franchise brand may have a material adverse effect on our business and financial results.
Our hotels operate under franchise agreements, and the maintenance of franchise licenses for our hotels is subject to our franchisors’ operating standards and other terms and conditions. We expect that franchisors will periodically inspect our hotels to ensure that we, our TRS lessees and our hotel management companies maintain our franchisors’ standards. Failure by us, our TRS lessees or any of our hotel management companies to maintain these standards or other terms and conditions could result in a franchise license being canceled. If a franchise license terminates due to our failure to make required improvements or to otherwise comply with its terms, we could also be liable to the franchisor for a termination payment, which varies by franchisor and by hotel. As a condition of our continued holding of a franchise license, a franchisor could also require us to make capital improvements to our hotels, even if we do not believe the improvements are necessary or desirable or would result in an acceptable return on our investment. Nonetheless, we may risk losing a franchise license if we do not make franchisor-required capital improvements.
If a franchisor terminated a franchise license, we could try either to obtain a suitable replacement franchise or to operate the hotel without a franchise license. The loss of a franchise license could materially and adversely affect the operations or the underlying value of the hotel because of the loss of associated name recognition, marketing support and centralized reservation systems provided by the franchisor. A loss of a franchise license for one or more hotels, particularly if our hotels become concentrated in a limited number of franchise brands in the future, could materially and adversely affect our revenues. This loss of revenues could, therefore, also adversely affect our financial condition, results of operations and ability to service debt and make distributions to our stockholders.
Negative publicity related to one of the franchise brands or the general decline of a brand also may adversely affect the underlying value of our hotels or result in a reduction in business.
We will rely on external sources of capital to fund future capital needs, and if we encounter difficulty in obtaining such capital, we may not be able to make future acquisitions necessary to grow our business or meet maturing obligations.
In order to qualify as a REIT under the Code, we will be required, among other things, to distribute each year to our stockholders at least 90% of our REIT taxable income, determined without regard to the dividends paid deduction and excluding any net capital gain. Because of this distribution requirement, we may not be able to fund, from cash retained from operations, all of our future capital needs, including capital needed to make investments and to satisfy or refinance maturing obligations.
We expect to rely on external sources of capital, including debt and equity financing, to fund future capital needs. Part of our strategy involves the use of additional debt financing to supplement our equity capital. Our ability to effectively implement and accomplish our business strategy will be affected by our ability to obtain and utilize additional leverage in sufficient amounts and on favorable terms. However, the recent U.S. and global economic slowdown has resulted in a capital environment characterized by limited availability of both debt and equity financing, increasing costs, stringent credit terms and significant volatility. If we are unable to obtain needed capital on satisfactory terms or at all, we may not be
21
able to make the investments needed to expand our business, or to meet our obligations and commitments as they mature. Our access to capital will depend upon a number of factors over which we have little or no control, including general market conditions, the market’s perception of our current and potential future earnings and cash distributions and the market price of the shares of our common stock. We may not be in a position to take advantage of attractive investment opportunities for growth if we are unable to access the capital markets on a timely basis on favorable terms.
We have a significant amount of debt, and our organizational documents have no limitation on the amount of additional indebtedness that we may incur in the future. As a result, we may become highly leveraged in the future, which could adversely affect our financial condition.
As of September 30, 2010, after giving pro forma effect to this offering, the concurrent private placement and the formation transactions, we would have had total outstanding indebtedness of approximately $198.4 million, all of which would have been secured indebtedness. At or shortly after the closing of this offering, the concurrent private placement and the formation transactions, we anticipate entering into a $ million secured revolving credit facility and, in the future, we may incur additional indebtedness to finance future hotel acquisitions and development activities and other corporate purposes. In addition, there are no restrictions in our charter or bylaws that limit the amount or percentage of indebtedness that we may incur nor restrict the form in which our indebtedness will be incurred (including recourse or non-recourse debt or cross-collateralized debt).
A substantial level of indebtedness could have adverse consequences for our business, results of operations and financial condition because it could, among other things:
| § | require us to dedicate a substantial portion of our cash flow from operations to make principal and interest payments on our indebtedness, thereby reducing our cash flow available to fund working capital, capital expenditures and other general corporate purposes, including to pay dividends on our common stock as currently contemplated or necessary to satisfy the requirements for qualification as a REIT; | |
| § | increase our vulnerability to general adverse economic and industry conditions and limit our flexibility in planning for, or reacting to, changes in our business and our industry; | |
| § | limit our ability to borrow additional funds or refinance indebtedness on favorable terms or at all to expand our business or ease liquidity constraints; and | |
| § | place us at a competitive disadvantage relative to competitors that have less indebtedness. |
The agreements governing our indebtedness place restrictions on us and our subsidiaries, reducing operational flexibility and creating default risks.
The agreements governing our anticipated secured revolving credit facility and other indebtedness that will remain outstanding following completion of this offering and the formation transactions contain covenants that place restrictions on us and our subsidiaries. These covenants may restrict, among other activities, our and our subsidiaries’ ability to:
| § | merge, consolidate or transfer all or substantially all of our or our subsidiaries’ assets; | |
| § | sell, transfer, pledge or encumber our stock or the ownership interests of our subsidiaries; | |
| § | incur additional debt or issue preferred stock; | |
| § | enter into, terminate or modify leases for our hotels and hotel management and franchise agreements; | |
| § | make certain expenditures, including capital expenditures; | |
| § | pay dividends on or repurchase our capital stock; and | |
| § | enter into certain transactions with affiliates. |
These covenants could impair our ability to grow our business, take advantage of attractive business opportunities or successfully compete. Our ability to comply with financial and other covenants may be affected by events beyond our control, including prevailing economic, financial and industry conditions. A breach of any of these covenants or covenants under any other agreements governing our indebtedness could result in an event of default. Cross-default provisions in our debt agreements could cause an event of default under one debt agreement to trigger an event of default under our other debt agreements. Upon the occurrence of an event of default under any of our debt agreements, the lenders could elect to declare all outstanding debt under such agreements to be immediately due and payable. If we were unable to repay or refinance the accelerated debt, the lenders could proceed against any assets pledged to secure that debt, including
22
foreclosing on or requiring the sale of our hotels, and the proceeds from the sale of these hotels may not be sufficient to repay such debt in full.
Mortgage debt obligations expose us to the possibility of foreclosure, which could result in the loss of our investment in any hotel subject to mortgage debt.
Borrowings under our anticipated secured revolving credit facility and $198.4 million of our other debt that will remain outstanding after closing of this offering, the concurrent private placement and the formation transactions will be secured by mortgages on our hotel properties and related assets. Incurring mortgage and other secured debt obligations increases our risk of property losses because defaults on secured indebtedness may result in foreclosure actions initiated by lenders and ultimately our loss of the hotels securing any loans for which we are in default. If we are in default under a cross-defaulted mortgage loan, we could lose multiple hotels to foreclosure. For tax purposes, a foreclosure of any of our hotels would be treated as a sale of the hotel for a purchase price equal to the outstanding balance of the debt secured by the mortgage. If the outstanding balance of the debt secured by the mortgage exceeds our tax basis in the hotel, we would recognize taxable income on foreclosure, but would not receive any cash proceeds, which could hinder our ability to meet the REIT distribution requirements imposed by the Code. As we execute our business plan, we may assume or incur new mortgage indebtedness on the hotels in our portfolio or hotels that we acquire in the future. Any default under any one of our mortgage debt obligations may increase the risk of our default on our other indebtedness.
An increase in interest rates would increase our interest costs on our variable rate debt and could adversely impact our ability to refinance existing debt or sell assets.
We anticipate that $105.9 million of the $198.4 million of indebtedness that will remain outstanding after closing of this offering, the concurrent private placement and the formation transactions will bear interest at variable rates, as will all future borrowings under our anticipated secured revolving credit facility. An increase in interest rates would increase our interest payments and reduce our cash flow available for other corporate purposes, including capital improvements to our hotels or acquisitions of additional hotels. In addition, rising interest rates could limit our ability to refinance existing debt when it matures and increase interest costs on any debt that is refinanced. Further, an increase in interest rates could increase the cost of financing, thereby decreasing the amount third parties are willing to pay for our hotels, which would limit our ability to dispose of hotels when necessary or desired. See “Management’s Discussion and Analysis of Financial Condition and Results of Operations—Qualitative and Quantitative Effects of Market Risk.”
Although we have not entered into any hedging arrangements, we may, from time to time, enter into agreements such as interest rate swaps, caps, floors and other interest rate hedging contracts. However, these agreements reduce, but do not eliminate, the impact of rising interest rates, and they also expose us to the risk that other parties to the agreements will not perform or that the agreements will be unenforceable.
We may not be able to obtain a secured revolving credit facility on the indicative terms described in this prospectus or at all.
As described under “Management’s Discussion and Analysis of Financial Condition and Results of Operations—Liquidity and Capital Resources—Our Anticipated Secured Revolving Credit Facility,” we intend to enter into a $ million secured revolving credit facility following completion of this offering. We have negotiated indicative terms for the facility with the administrative agent and lead arranger. Our ability to obtain the secured revolving credit facility remains subject to satisfaction of the lenders’ due diligence and other conditions, including our ability to raise gross proceeds of at least $ million through this offering and the concurrent private placement, as well as the successful syndication of commitments to other lenders. These efforts are ongoing, but we may not succeed in obtaining a secured revolving credit facility on the indicated terms or at all. We cannot predict the size or terms of the secured revolving credit facility if we are able to obtain it. Our failure to obtain a secured revolving credit facility could adversely affect our ability to grow our business and meet our obligations as they come due.
Joint venture investments could be adversely affected by a lack of sole decision-making authority with respect to such investments.
In the future we may enter into strategic joint ventures with unaffiliated investors to acquire, develop, improve or dispose of hotels, thereby reducing the amount of capital required by us to make investments and diversifying our capital sources for growth. We may not have sole decision-making authority with respect to these investments, which may:
| § | prevent us from taking actions that are opposed by our joint venture partners; |
23
| § | create impasses on major decisions, such as acquisitions or sales; | |
| § | prevent us from selling our interests in the joint venture without the consent of our joint venture partners; or | |
| § | subject us to liability for the actions of our joint venture partners. |
Joint venture investments could subject us to risks related to the financial condition of joint venture partners.
If a joint venture partner becomes bankrupt or otherwise defaults on its obligations under a joint venture agreement, we and any other remaining joint venture partners would generally remain liable for the joint venture liabilities. Furthermore, if a joint venture partner becomes bankrupt or otherwise defaults on its obligations under a joint venture agreement, we may be unable to continue the joint venture other than by purchasing such joint venture partner’s interests or the underlying assets at a premium to the market price. If any of the above risks are realized, it could materially adversely affect our business, financial condition and results of operations and our ability to make distributions to our stockholders.
We may have disputes with joint venture partners.
Disputes between us and our joint venture partners may result in litigation or arbitration which could increase our expenses and prevent our officers and directors from focusing their time and effort on our business and could result in subjecting the hotels owned by the applicable joint venture to additional risks.
Our tax protection agreements may require our operating partnership to maintain certain debt levels that otherwise would not be required to operate our business, which may impair our ability to generate cash available for distribution and otherwise not be in your best interests.
We anticipate that the Class C member of our predecessor, The Summit Group, and certain Class B members of our predecessor may recognize a taxable deemed cash distribution in connection with the formation transactions unless affirmative measures are taken to cause special allocations of liabilities of our operating partnership to those members. Under the tax protection agreements, our operating partnership will provide those members with the opportunity to guarantee debt or enter into a deficit restoration obligation, both of which are intended to cause a special allocation of liabilities to those members to prevent them from recognizing a taxable deemed cash distribution. If our operating partnership fails to make those opportunities available, our operating partnership will be required to deliver to each such member a cash payment intended to approximate that member’s tax liability resulting from our operating partnership’s failure to make such opportunities available to them. See “Formation Transactions—Tax Protection Agreements.” Our operating partnership agreed to these provisions in order to assist those members in avoiding a taxable deemed cash distribution that may otherwise occur in connection with the formation transactions. These obligations may require our operating partnership to maintain more or different indebtedness than would otherwise have been required for our business, which could result in higher interest expense than we would prefer to incur, reducing cash available for distribution to stockholders.
Risks Related to the Lodging Industry
Recent economic conditions may continue to adversely affect the lodging industry.
The performance of the lodging industry has historically been closely linked to the performance of the general economy and, specifically, growth in U.S. gross domestic product, or GDP. The lodging industry is also sensitive to business and personal discretionary spending levels. Declines in corporate budgets and consumer demand due to adverse general economic conditions, risks affecting or reducing travel patterns, lower consumer confidence or adverse political conditions can lower the revenues and profitability of our assets and therefore the net operating profits of our investments. The recent economic downturn has led to a significant decline in demand for products and services provided by the lodging industry.
We anticipate that any recovery of demand for lodging services will lag an improvement in economic conditions. We cannot predict how severe or prolonged the global economic downturn will be or how severe or prolonged the downturn in the lodging industry will be. A further extended period of economic weakness could have an adverse impact on our revenues and negatively affect our profitability.
Competition from other upscale and midscale without food and beverage hotels in the markets in which we operate could have a material adverse effect on our results of operations.
The lodging industry is highly competitive. Our hotels compete with other hotels for guests in each market in which our hotels operate based on a number of factors, including location, convenience, brand affiliation, room rates, range of services and guest amenities or accommodations offered and quality of customer service. Competition will often be specific
24
to the individual markets in which our hotels are located and includes competition from existing and new hotels. Our competitors may have an operating model that enables them to offer rooms at lower rates than we can, which, particularly in the current economic recession, could result in our competitors increasing their occupancy at our expense. Competition could adversely affect our occupancy, average daily rates, or ADRs, and RevPAR, and may require us to provide additional amenities or make capital improvements that we otherwise would not have to make, which could reduce our profitability and could materially and adversely affect our results of operations.
Our investment opportunities and growth prospects may be affected by competition for investment opportunities.
We compete for investment opportunities with other entities, some of which have substantially greater financial resources than we do. This competition may generally limit the number of suitable investment opportunities offered to us, which may limit our ability to grow. This competition may also increase the bargaining power of the owners of assets seeking to sell to us, making it more difficult for us to acquire new hotels on attractive terms or at all.
Our operating results and ability to make distributions to our stockholders may be adversely affected by the markets in which we operate.
Our hotels will be subject to various operating risks within the markets in which we will operate. These risks include:
| § | over-building of hotels in our markets, which could adversely affect occupancy and revenues at the hotels we acquire; | |
| § | adverse effects of international, national, regional and local economic and market conditions; and | |
| § | changes in governmental laws and regulations, fiscal policies and zoning ordinances and the related costs of compliance with laws and regulations, fiscal policies and ordinances. |
Our operating results and ability to make distributions to our stockholders may be adversely affected by the risks inherent to the ownership of hotels.
Hotels have different economic characteristics than many other real estate assets. A typical office property owner, for example, has long-term leases with third-party tenants, which provide a relatively stable long-term stream of revenue. By contrast, our hotels will be subject to various operating risks common to the lodging industry, many of which are beyond our control, including the following:
| § | dependence on business and commercial travelers and tourism; | |
| § | increases in energy costs and other expenses affecting travel, which may affect travel patterns and reduce the number of business and commercial travelers and tourists; | |
| § | increases in operating costs due to inflation and other factors that may not be offset by increased room rates; | |
| § | events beyond our control, such as terrorist attacks, travel related health concerns including pandemics and epidemics such as H1N1 influenza (swine flu), avian bird flu and severe acute respiratory syndrome, or SARS, imposition of taxes or surcharges by regulatory authorities, travel-related accidents and unusual weather patterns, including natural disasters such as hurricanes and environmental disasters such as the oil spill in the Gulf of Mexico; | |
| § | potential increases in labor costs at our hotels, including as a result of unionization of the labor force; and | |
| § | adverse effects of a downturn in the lodging industry. |
We will have significant ongoing needs to make capital expenditures in our hotels, which will require us to devote funds to these purposes and could pose related risks that might impair our ability to make distributions to our stockholders.
Our hotels will have an ongoing need for renovations and other capital improvements, including replacements, from time to time, of furniture, fixtures and equipment. Our franchisors also require periodic capital improvements as a condition of keeping the franchise licenses. In addition, lenders may require that we set aside annual amounts for capital improvements to our assets. These capital improvements and replacements may give rise to the following risks:
| § | possible environmental problems; | |
| § | construction cost overruns and delays; | |
| § | a possible shortage of available cash to fund capital improvements and replacements and, the related possibility that financing for these capital improvements may not be available to us on affordable terms; |
25
| § | these capital improvements and replacements may not prove to be accretive to FFO; and | |
| § | uncertainties as to market demand or a loss of market demand after capital improvements and replacements have begun. |
If any of the above risks were to be realized, it could materially adversely affect our business, financial condition and results of operations and our ability to make distributions to our stockholders.
Hotel development is subject to timing, budgeting and other risks. To the extent we develop hotels or acquire hotels that are under development, these risks may adversely affect our operating results and liquidity position.
We may develop hotels or acquire hotels that are under development from time to time as suitable opportunities arise, taking into consideration general economic conditions. Hotel development involves a number of risks, including the following:
| § | possible environmental problems; | |
| § | construction delays or cost overruns that may increase project costs; | |
| § | receipt of zoning, occupancy and other required governmental permits and authorizations; | |
| § | development costs incurred for projects that are not pursued to completion; | |
| § | acts of God such as earthquakes, hurricanes, floods or fires that could adversely impact a project; | |
| § | inability to raise capital; and | |
| § | governmental restrictions on the nature or size of a project. |
To the extent we develop hotels or acquire hotels under development, we cannot assure you that any development project will be completed on time or within budget. Our inability to complete a project on time or within budget may adversely affect our projected operating results and our liquidity position.
The increasing use of Internet travel intermediaries by consumers may adversely affect our profitability.
Our hotel rooms are likely to be booked through Internet travel intermediaries, including, but not limited to, Travelocity.com, Expedia.com and Priceline.com. As these Internet bookings increase, these intermediaries may be able to obtain higher commissions, reduced room rates or other significant contract concessions from us and our management companies. Moreover, some of these Internet travel intermediaries are attempting to offer hotel rooms as a commodity, by increasing the importance of price and general indicators of quality (such as “three-star downtown hotel”) at the expense of brand identification. These agencies hope that consumers will eventually develop brand loyalties to their reservations system rather than to the brands under which our hotels are franchised. If the amount of sales made through Internet intermediaries increases significantly, room revenues may flatten or decrease and our profitability may be adversely affected.
Uninsured and underinsured losses could adversely affect our operating results.
We intend to maintain comprehensive insurance on our hotels, including liability, fire and extended coverage, of the type and amount we believe are customarily obtained for or by owners of hotels similar to our hotels. Various types of catastrophic losses, like earthquakes and floods, may not be insurable or may not be economically insurable. In the event of a substantial loss, our insurance coverage may not be sufficient to cover the full current market value or replacement cost of our lost investment. Should an uninsured loss or a loss in excess of insured limits occur, we could lose all or a portion of the capital we have invested in a hotel, as well as the anticipated future revenue from the hotel. In that event, we might nevertheless remain obligated for any mortgage debt or other financial obligations related to the asset. Inflation, changes in building codes and ordinances, environmental considerations and other factors might also keep us from using insurance proceeds to replace or renovate an asset after it has been damaged or destroyed. Under those circumstances, the insurance proceeds we receive might be inadequate to restore our economic position on the damaged or destroyed hotels.
26
Risks Related to the Real Estate Industry and Real Estate-Related Investments
Illiquidity of real estate investments could significantly impede our ability to respond to adverse changes in the performance of hotels in which we may invest or to adjust our portfolio in response to changes in economic and other conditions, and, therefore, may harm our financial condition.
In the future, we may decide to sell hotels. Real estate investments are relatively illiquid. Our ability to promptly sell one or more hotels in our portfolio in response to changing economic, financial and investment conditions may be limited. We cannot predict whether we will be able to sell any hotels for the price or on the terms set by us, or whether any price or other terms offered by a prospective purchaser would be acceptable to us. We also cannot predict the length of time needed to find a willing purchaser and to close the sale of an asset. The real estate market is affected by many factors that are beyond our control, including:
| § | adverse changes in international, national, regional and local economic and market conditions; | |
| § | changes in interest rates and in the availability, cost and terms of debt financing; | |
| § | changes in governmental laws and regulations, fiscal policies and zoning ordinances and the related costs of compliance with laws and regulations, fiscal policies and ordinances; | |
| § | the ongoing need for capital improvements, particularly in older structures, that may require us to expend funds to correct defects or to make improvements before an asset can be sold; | |
| § | changes in operating expenses; and | |
| § | civil unrest, acts of God, including earthquakes, floods and other natural disasters, which may result in uninsured losses, and acts of war or terrorism, including the consequences of the terrorist acts such as those that occurred on September 11, 2001. |
Increases in our property taxes would adversely affect our operating results and our ability to make distributions to our stockholders.
Our hotels are subject to real and personal property taxes. These taxes may increase as tax rates change and as our hotels are assessed or reassessed by taxing authorities. If property taxes increase, our operating results and our ability to make distributions to our stockholders could be adversely affected.
We could incur significant costs related to government regulation and litigation over environmental, health and safety matters.
Our hotels and development parcels are subject to various federal, state and local environmental laws that impose liability for contamination. Under these laws, governmental entities have the authority to require us, as the current owner of the property, to perform or pay for the clean up of contamination (including hazardous substances, waste or petroleum products) at, on, under or emanating from the property and to pay for natural resource damages arising from contamination. These laws often impose liability without regard to whether the owner or operator or other responsible party knew of, or caused the contamination, and the liability may be joint and several. Because these laws also impose liability on persons who owned a property at the time it became contaminated, we could incur cleanup costs or other environmental liabilities even after we sell properties. Contamination at, on, under or emanating from our properties also may expose us to liability to private parties for costs of remediation, personal injury and death and/or property damage. In addition, environmental liens may be created on contaminated sites in favor of the government for damages and costs it incurs to address contamination. If contamination is discovered on our properties, environmental laws also may impose restrictions on the manner in which property may be used or businesses may be operated, and these restrictions may require substantial expenditures. Moreover, environmental contamination can affect the value of a property and, therefore, an owner’s ability to borrow funds using the property as collateral or to sell the property on favorable terms or at all. Furthermore, persons who sent waste to a waste disposal facility, such as a landfill or an incinerator, may be liable for costs associated with cleanup of that facility.
In addition, our hotels (including our real property, operations and equipment) are subject to various federal, state and local environmental, health and safety regulatory requirements that address a wide variety of issues, including, but not limited to, the registration, maintenance and operation of our boilers and storage tanks, the supply of potable water to our guests, air emissions from emergency generators, storm water and wastewater discharges, protection of natural resources, asbestos, lead-based paint, mold and mildew, and waste management. Some of our hotels also routinely handle and use hazardous or regulated substances and wastes as part of their operations, which are subject to regulation (for example,
27
swimming pool chemicals or biological waste). Our hotels incur costs to comply with these environmental, health and safety laws and regulations and if these regulatory requirements are not met or unforeseen events result in the discharge of dangerous or toxic substances at our hotels, we could be subject to fines and penalties for non-compliance with applicable laws and material liability from third parties for harm to the environment, damage to real property or personal injury and death. We are aware of no past or present environmental liability for non-compliance with environmental, health and safety laws and regulations that we believe would have a material adverse effect on our business, assets or results of operations.
Certain hotels we currently own or those we acquire in the future contain, may contain, or may have contained, asbestos-containing material, or ACM. Environmental, health and safety laws require that ACM be properly managed and maintained, and include requirements to undertake special precautions, such as removal or abatement, if ACM would be disturbed during maintenance, renovation, or demolition of a building. These laws regarding ACM may impose fines and penalties on building owners, employers and operators for failure to comply with these requirements or expose us to third-party liability.
Our properties may contain or develop harmful mold, which could lead to liability for adverse health effects and costs of remediating the problem.
When excessive moisture accumulates in buildings or on building materials, mold growth may occur, particularly if the moisture problem remains undiscovered or is not addressed over a period of time. Some molds may produce airborne toxins or irritants. Indoor air quality issues can also stem from inadequate ventilation, chemical contamination from indoor or outdoor sources, and other biological contaminants such as pollen, viruses and bacteria. Indoor exposure to airborne toxins or irritants above certain levels can be alleged to cause a variety of adverse health effects and symptoms, including allergic or other reactions. As a result, the presence of significant mold or other airborne contaminants at any of our properties could require us to undertake a costly remediation program to contain or remove the mold or other airborne contaminants from the affected property or increase indoor ventilation. In addition, the presence of significant mold or other airborne contaminants could expose us to material liability from third parties if property damage or personal injury occurs.
Compliance with the laws, regulations and covenants that are applicable to our hotels, including permit, license and zoning requirements, may adversely affect our ability to make future acquisitions or renovations, result in significant costs or delays and adversely affect our growth strategy.
Our hotels are subject to various covenants and local laws and regulatory requirements, including permitting and licensing requirements. Local regulations, including municipal or local ordinances, zoning restrictions and restrictive covenants imposed by community developers may restrict our use of our hotels and may require us to obtain approval from local officials or community standards organizations at any time with respect to our hotels, including prior to acquiring a hotel or when undertaking any renovations of any of our hotels. Among other things, these restrictions may relate to fire and safety, seismic, asbestos-cleanup or hazardous material abatement requirements. We cannot assure you that existing regulatory policies will not adversely affect us or the timing or cost of any future acquisitions or renovations, or that additional regulations will not be adopted that would increase such delays or result in additional costs. Our growth strategy may be materially and adversely affected by our ability to obtain permits, licenses and zoning approvals. Our failure to obtain such permits, licenses and zoning approvals could have a material adverse effect on our business, financial condition and results of operations.
In addition, federal and state laws and regulations, including laws such as the Americans with Disabilities Act of 1990, or the ADA, impose further restrictions on our operations. Under the ADA, all public accommodations must meet federal requirements related to access and use by disabled persons. Some of our hotels may currently be in non-compliance with the ADA. If one or more of the hotels in our portfolio is not in compliance with the ADA or any other regulatory requirements, we may be required to incur additional costs to bring the hotel into compliance and we might incur damages or governmental fines. In addition, existing requirements may change and future requirements may require us to make significant unanticipated expenditures that would adversely impact our business, financial condition, results of operations and cash flow, the market price per share of our common stock and our ability to satisfy our debt service obligations and to make distributions to our stockholders.
28
If we default on ground leases for land on which four of our hotels are located, our business could be materially and adversely affected.
Four of the 65 hotels in our initial portfolio are subject to ground leases. If we default under the terms of these ground leases and are unable to cure the default in a timely manner, we may be liable for damages and could lose our leasehold interest in the applicable property and interest in the hotel on the applicable property. If any of the events of default were to occur and are not timely cured, our business, financial condition, results of operations and cash flow, the market price per share of our common stock and our ability to satisfy our debt service obligations and to make distributions to our stockholders could be materially and adversely affected.
Risks Related to The Formation Transactions and Conflicts of Interest
Our Executive Chairman, Mr. Boekelheide, and other members of our management team exercised significant influence with respect to the terms of the formation transactions, including transactions in which they determined the compensation they would receive.
The number of OP units issuable by our operating partnership in the formation transactions was determined by our management team based on its valuation of our predecessor and the hotels owned by our predecessor and Summit of Scottsdale. In each case, the assumed value per OP unit is equal to the mid-point of the anticipated IPO price range of our common stock shown on the cover of this prospectus. Our management team determined the value of our predecessor and these hotels by considering various valuation factors and methodologies, including an analysis of available third-party valuations on some of the hotels, market sales comparables, market capitalization rates and general market conditions for similar hotels. The numbers of OP units issuable in the formation transactions are fixed. As a result, if the IPO price for our common stock is higher or lower than the mid-point of the anticipated IPO price range shown on the cover of this prospectus, the value of the OP units to be issued in the formation transactions will increase or decrease accordingly.
Both we and our predecessor have sought to structure the formation transactions so as to minimize potential conflicts of interest, including by appointing a special committee of our predecessor’s independent managers to review the terms of the proposed merger of our predecessor into our operating partnership. However, we did not conduct arm’s-length negotiations with our predecessor’s members or the members of Summit of Scottsdale with respect to the terms of the formation transactions, including the merger. Our Executive Chairman, Mr. Boekelheide, and his affiliates, including The Summit Group, have substantial, pre-existing ownership interests in our predecessor and Summit of Scottsdale. In addition, Mr. Aniszewski, our Executive Vice President and Chief Operating Officer, has a pre-existing ownership interest in our predecessor. Both Mr. Boekelheide and Mr. Aniszewski sat on the board of managers of our predecessor that approved the terms of the formation transactions. In the course of structuring the formation transactions, Mr. Boekelheide and Mr. Aniszewski had the ability to influence the type and level of benefits they will receive from us. In addition, although our predecessor’s special committee received a fairness opinion from an independent third-party investment bank that is not one of the underwriters of this offering with respect to the fairness, from a financial point of view, of the merger consideration to the former members of our predecessor, assuming that the value of the OP units issued as the merger consideration was between $140 million and $160 million, we did not obtain a fairness opinion with respect to the fairness of the merger consideration to us and we did not obtain recent third-party appraisals for all of the hotels to be acquired by us in the formation transactions. As a result, the consideration to be paid by us to the members of our predecessor in the merger for our predecessor’s 63 hotels and its 49% ownership interest in the two Scottsdale hotels may exceed the fair market value of the hotels and other assets being acquired by us in the formation transactions or the price that would have been paid in an arm’s-length transaction.
The value of the aggregate consideration to be issued in the formation transactions is based on the IPO price of our common stock, which will be determined in consultation with the underwriters and does not necessarily bear any relationship to the book value or the fair market value of the hotels to be acquired by us in the formation transactions. As a result, the consideration being paid by us in exchange for the membership interests in our predecessor may exceed the aggregate fair market value of those assets.
We are assuming liabilities in connection with the formation transactions, including unknown liabilities, which, if significant, could adversely affect our business.
As part of the formation transactions, we will assume existing liabilities of our predecessor and its affiliates, including, but not limited to, liabilities in connection with our hotels, some of which may be unknown or unquantifiable at the time this offering is completed. Unknown liabilities might include liabilities for cleanup or remediation of undisclosed environmental
29
conditions, claims of hotel guests, vendors or other persons dealing with our predecessor, The Summit Group, and their affiliates prior to this offering, tax liabilities, employment-related issues and accrued but unpaid liabilities whether incurred in the ordinary course of business or otherwise. If the magnitude of such unknown liabilities is high, they could adversely affect our business, financial condition, results of operations and cash flow, the market price per share of our common stock and our ability to satisfy our debt service obligations and to make distributions.
Upon completion of this offering, the concurrent private placement and the formation transactions, our Executive Chairman, Mr. Boekelheide, and his affiliates may be able to exercise significant influence over us and our affairs and any matter presented to our stockholders and our operating partnership’s limited partners, and their interests may differ from the interests of the other limited partners of our operating partnership, including us, and our stockholders.
Upon completion of this offering, the concurrent private placement and the formation transactions, our Executive Chairman, Mr. Boekelheide, and his affiliates, including The Summit Group, will beneficially own an aggregate of 1,443,050 OP units in our operating partnership. These OP units will represent approximately % of our combined common stock and OP units outstanding upon completion of this offering, the concurrent private placement and the formation transactions.
As a result, Mr. Boekelheide and his affiliates may be able to exercise significant influence over us and our operating partnership and any matter presented to our stockholders and the limited partners of our operating partnership for their consideration and approval. The interests of Mr. Boekelheide and his affiliates may differ from or conflict with the interests of our stockholders and the other limited partners of our operating partnership.
Tax consequences to holders of OP units upon a sale or refinancing of our hotels may cause the interests of holders of OP units, including certain of our executive officers and directors, to differ from the interests of our other stockholders.
As a result of the unrealized built-in gain that may be attributable to one or more of our hotels, holders of OP units, including certain of our executive officers and directors, may experience more onerous tax consequences than holders of our common stock upon the sale or refinancing of these hotels, including disproportionately greater allocations of items of taxable income and gain upon the occurrence of such an event. The tax protection agreements that we will offer to enter into with certain former members of our predecessor, including The Summit Group, which is wholly owned by our Executive Chairman, Mr. Boekelheide, will not provide protection from those more onerous tax consequences. A holder of OP units that receives a disproportionately greater allocation of taxable income and gain will not receive a correspondingly greater distribution of cash proceeds with which to pay the income taxes on such income. Accordingly, they may have different objectives regarding the appropriate pricing, timing and other material terms of any sale or refinancing of such hotels and could exercise their influence over our affairs by attempting to delay, defer or prevent a transaction that might otherwise be in the best interests of our stockholders.
Our tax protection agreements may require us to maintain certain debt levels that otherwise would not be required to operate our business, which may impair our ability to generate cash available for distribution and otherwise not be in your best interests.
Our operating partnership will offer to enter into tax protection agreements with a limited number of the members of our predecessor, including The Summit Group, to protect those members from recognizing taxable gain in connection with the formation transactions. Under the tax protection agreements, our operating partnership will provide those former members of our predecessor with the opportunity to guarantee debt or enter into a deficit restoration obligation, both of which are intended to prevent the former members of our predecessor from recognizing a taxable deemed cash distribution. If our operating partnership fails to make those opportunities available, it will be required to deliver to each such former member a cash payment intended to approximate the former member’s tax liability resulting from its failure to make such opportunities available to them. These obligations may require us to maintain more or different indebtedness than would otherwise have been required for our business, which could result in higher interest expense than we would prefer to incur, reducing cash available for distribution to stockholders.
Our fiduciary duties as the general partner of our operating partnership could create conflicts of interest.
Upon completion of this offering and the formation transactions, we, through our wholly owned subsidiary that serves as the sole general partner of our operating partnership, will have fiduciary duties to our operating partnership’s limited partners, the discharge of which may conflict with the interests of our stockholders. The limited partners of our operating
30
partnership have agreed for so long as we own a controlling interest in our operating partnership that, in the event of a conflict between the duties owed by our directors to our company and the duties that we owe, in our capacity as the sole general partner of our operating partnership, to the limited partners, our directors are under no obligation to give priority to the interests of the limited partners. In addition, those persons holding OP units will have the right to vote on certain amendments to the limited partnership agreement (which require approval by a majority in interest of the limited partners, including us) and individually to approve certain amendments that would adversely affect their rights, as well as the right to vote on mergers and consolidations of the general partner or us in certain limited circumstances. These voting rights may be exercised in a manner that conflicts with the interests of our stockholders. For example, we cannot adversely affect the limited partners’ rights to receive distributions, as set forth in the limited partnership agreement, without their consent, even though modifying such rights might be in the best interest of our stockholders generally.
Certain key members of our senior management team will continue to be involved in other businesses, which may interfere with their ability to devote time and attention to our business and affairs.
We will rely on our senior management team, including Mr. Boekelheide, for the day-to-day operations of our business. Following completion of this offering, Mr. Boekelheide and other key members of our senior management team, including Messrs. Hansen and Aniszewski, will continue to serve as executive officers and directors of The Summit Group. The Summit Group will continue to manage one hotel that is not owned by us, a Comfort Suites located in Tucson, Arizona. Our employment agreement with Mr. Boekelheide requires him to devote a substantial portion of his business time and attention to our business and our employment agreements with our other executive officers require our executives to devote substantially all of their business time and attention to our business. In addition, Mr. Boekelheide, as well as our Executive Vice President and Chief Financial Officer, Mr. Becker, and our Vice President of Acquisitions, Mr. Bertucci, will continue to serve as officers of Summit Green Tiger Investments, LLC, or Summit Green Tiger. Summit Green Tiger co-manages two private investment funds, which own a total of six multi-family properties. We will not compete with these funds for investment opportunities. These outside business interests may reduce the amount of time that Messrs. Boekelheide, Hansen, Aniszewski, Becker and Bertucci are able to devote to our business. For more information, see “Certain Relationships and Related Party Transactions—Outside Business Interests.”
Risks Related to Our Organization and Structure
Provisions of our charter may limit the ability of a third party to acquire control of us by authorizing our board of directors to issue additional securities.
Our board of directors may, without stockholder approval, amend our charter to increase or decrease the aggregate number of our shares or the number of shares of any class or series that we have the authority to issue and to classify or reclassify any unissued shares of common stock or preferred stock, and set the preferences, rights and other terms of the classified or reclassified shares. As a result, our board of directors may authorize the issuance of additional shares or establish a series of common or preferred stock that may have the effect of delaying or preventing a change in control of our company, including transactions at a premium over the market price of our shares, even if stockholders believe that a change in control is in their interest. These provisions, along with the restrictions on ownership and transfer contained in our charter and certain provisions of Maryland law described below, could discourage unsolicited acquisition proposals or make it more difficult for a third party to gain control of us, which could adversely affect the market price of our securities. See “Certain Provisions of Maryland Law and of Our Charter and Bylaws.”
Provisions of Maryland law may limit the ability of a third party to acquire control of us by requiring our board of directors or stockholders to approve proposals to acquire our company or effect a change in control.
Certain provisions of the Maryland General Corporation Law, or the MGCL, applicable to Maryland corporations may have the effect of inhibiting a third party from making a proposal to acquire us or of impeding a change in control under circumstances that otherwise could provide our common stockholders with the opportunity to realize a premium over the then-prevailing market price of such shares, including:
| § | “business combination” provisions that, subject to limitations, prohibit certain business combinations between us and an “interested stockholder” (defined generally as any person who beneficially owns 10% or more of the voting power of our outstanding voting stock or an affiliate or associate of us who, at any time within the two-year period immediately prior to the date in question, was the beneficial owner of 10% or more of the voting power of our then outstanding stock) or an affiliate of any interested stockholder for five years after the most recent date on which the stockholder becomes an interested stockholder, and thereafter imposes two super- |
31
| majority stockholder voting requirements on these combinations, unless, among other conditions, our common stockholders receive a minimum price, as defined in the MGCL, for their stock and the consideration is received in cash or in the same form as previously paid by the interested stockholder for its shares; and |
| § | “control share” provisions that provide that our “control shares” (defined as voting shares of stock which, when aggregated with all other shares of stock controlled by the stockholder, entitle the stockholder to exercise one of three increasing ranges of voting power in electing directors) acquired in a “control share acquisition” (defined as the direct or indirect acquisition of ownership or control of issued and outstanding “control shares”) have no voting rights except to the extent approved by our stockholders by the affirmative vote of at least two-thirds of all the votes entitled to be cast on the matter, excluding shares owned by the acquirer, by our officers or by our employees who are also directors of our company. |
By resolution of our board of directors, we have opted out of the business combination provisions of the MGCL and provided that any business combination between us and any other person is exempt from the business combination provisions of the MGCL, provided that the business combination is first approved by our board of directors (including a majority of directors who are not affiliates or associates of such persons). In addition, pursuant to a provision in our bylaws, we have opted out of the control share provisions of the MGCL. However, our board of directors may by resolution elect to opt in to the business combination provisions of the MGCL and we may, by amendment to our bylaws, opt in to the control share provisions of the MGCL in the future.
Our rights and the rights of our stockholders to take action against our directors and officers are limited, which could limit your recourse in the event of actions not in your best interests.
Under Maryland law, generally, a director will not be liable if he or she performs his or her duties in good faith, in a manner he or she reasonably believes to be in our best interests and with the care that an ordinarily prudent person in a like position would use under similar circumstances. In addition, our charter limits the liability of our directors and officers to us and our stockholders for money damages, except for liability resulting from:
| § | actual receipt of an improper benefit or profit in money, property or services; or | |
| § | active and deliberate dishonesty by the director or officer that was established by a final judgment as being material to the cause of action adjudicated. |
Our charter authorizes us to indemnify our directors and officers for actions taken by them in those capacities to the maximum extent permitted by Maryland law. Our bylaws require us to indemnify each director and officer, to the maximum extent permitted by Maryland law, in the defense of any proceeding to which he or she is made, or threatened to be made, a party by reason of his or her service to us. In addition, we may be obligated to advance the defense costs incurred by our directors and officers. As a result, we and our stockholders may have more limited rights against our directors and officers than might otherwise exist absent the current provisions in our charter and bylaws or that might exist with other companies.
Our charter contains provisions that make removal of our directors difficult, which could make it difficult for our stockholders to effect changes to our management.
Our charter provides that a director may be removed only for cause (as defined in our charter) and then only by the affirmative vote of holders of shares entitled to cast at least two-thirds of all the votes entitled to be cast generally in the election of directors. Our charter also provides that vacancies on our board of directors may be filled only by a majority of the remaining directors in office, even if less than a quorum. These requirements prevent stockholders from removing directors except for cause and with a substantial affirmative vote and from replacing directors with their own nominees and may prevent a change in control of our company that is in the best interests of our stockholders.
The ability of our board of directors to change our major policies without the consent of stockholders may not be in your interest.
Our board of directors determines our major policies, including policies and guidelines relating to our acquisitions, leverage, financing, growth, operations and distributions to stockholders. Our board of directors may amend or revise these and other policies and guidelines from time to time without the vote or consent of our stockholders. Accordingly, our stockholders will have limited control over changes in our policies and those changes could adversely affect our financial condition, results of operations, the market price of our common stock and our ability to make distributions to our stockholders.
32
The ability of our board of directors to revoke our REIT qualification without stockholder approval may cause adverse consequences to our stockholders.
Our charter provides that our board of directors may revoke or otherwise terminate our REIT election, without the approval of our stockholders, if it determines that it is no longer in our best interest to continue to qualify as a REIT. If we cease to be a REIT, we would become subject to federal income tax on our taxable income and would no longer be required to distribute most of our taxable income to our stockholders, which may have adverse consequences on the total return to our stockholders.
We are a holding company with no direct operations. As a result, we will rely on funds received from our operating partnership to pay liabilities and dividends, our stockholders’ claims will be structurally subordinated to all liabilities of our operating partnership and our stockholders will not have any voting rights with respect to our operating partnership activities, including the issuance of additional OP units.
We are a holding company and will conduct all of our operations through our operating partnership. We do not have, apart from our ownership of our operating partnership, any independent operations. As a result, we will rely on distributions from our operating partnership to pay any dividends we might declare on shares of our common stock. We will also rely on distributions from our operating partnership to meet any of our obligations, including tax liability on taxable income allocated to us from our operating partnership (which might make distributions to us that do not equal to the tax on such allocated taxable income).
In addition, because we are a holding company, stockholders’ claims will be structurally subordinated to all existing and future liabilities and obligations (whether or not for borrowed money) of our operating partnership and its subsidiaries. Therefore, in the event of our bankruptcy, liquidation or reorganization, claims of our stockholders will be satisfied only after all of our and our operating partnership’s and its subsidiaries’ liabilities and obligations have been paid in full.
After giving effect to the formation transactions, this offering and the concurrent private placement, we will own approximately % of the partnership interests in our operating partnership, or % if the underwriters exercise their over-allotment option in full. In addition, our operating partnership may issue additional OP units in the future. Such issuances could reduce our ownership percentage in our operating partnership. Because our common stockholders will not directly own any OP units, they will not have any voting rights with respect to any such issuances or other partnership level activities of our operating partnership.
Risks Related to Ownership of Our Common Stock and this Offering
There is currently no market for our common stock and a market for our common stock may not develop, which could adversely affect the liquidity and price of our common stock.
Prior to this offering, there has not been a public market for our common stock, and we cannot assure you that a regular trading market for the common stock offered hereby will develop or, if developed, that any such market will be sustained. In the absence of a public trading market, an investor may be unable to liquidate an investment in our common stock. The IPO price has been determined by us and the underwriters. We cannot assure you that the price at which the common stock will sell in the public market after the closing of the offering will not be lower than the price at which it is sold by the underwriters.
The NYSE or another nationally recognized exchange may not continue to list our securities, which could limit investors’ ability to make transactions in our securities and subject us to additional trading restrictions.
We have applied to list our common stock on the NYSE under the symbol “INN.” If we are approved for listing on the NYSE, in order to remain listed we will be required to meet the continued listing requirements of the NYSE or, in the alternative, any other nationally recognized exchange to which we apply. We may be unable to satisfy those listing requirements, and there is no guarantee our securities will remain listed on a nationally recognized exchange. If our securities are delisted from the NYSE or another nationally recognized exchange, we could face significant material adverse consequences, including:
| § | a limited availability of market quotations for our securities; | |
| § | reduced liquidity with respect to our securities; | |
| § | a determination that our common stock is “penny stock,” which will require brokers trading in our common stock to adhere to more stringent rules, possibly resulting in a reduced level of trading activity in the secondary trading market for the common stock; |
33
| § | a limited amount of news and analyst coverage; and | |
| § | a decreased ability to issue additional securities or obtain additional financing in the future. |
The cash available for distribution may not be sufficient to make distributions at expected levels, and we cannot assure you of our ability to make distributions in the future. We may use borrowed funds or funds from other sources to make distributions, which may adversely impact our operations.
We intend to make distributions to our common stockholders and holders of OP units. Distributions declared by us will be authorized by our board of directors in its sole discretion out of funds legally available for distribution and will depend upon a number of factors, including restrictions under applicable law and the capital requirements of our company. All distributions will be made at the discretion of our board of directors and will depend on our earnings, our financial condition, the requirements for qualification as a REIT, restrictions under applicable law and other factors as our board of directors may deem relevant from time to time. We may be required to fund distributions from working capital, borrowings under the secured revolving credit facility we anticipate obtaining following completion of this offering, proceeds of this offering or a sale of assets to the extent distributions exceed earnings or cash flows from operations. Funding distributions from working capital would restrict our operations. If we borrow from the secured revolving credit facility we anticipate obtaining following completion of this offering in order to pay distributions, we would be more limited in our ability to execute our strategy of using that secured revolving credit facility to fund acquisitions. Finally, selling assets may require us to dispose of assets at a time or in a manner that is not consistent with our disposition strategy. If we borrow to fund distributions, our leverage ratios and future interest costs would increase, thereby reducing our earnings and cash available for distribution from what they otherwise would have been. We may not be able to make distributions in the future. In addition, some of our distributions may be considered a return of capital for income tax purposes. If we decide to make distributions in excess of our current and accumulated earnings and profits, such distributions would generally be considered a return of capital for federal income tax purposes to the extent of the holder’s adjusted tax basis in their shares. A return of capital is not taxable, but it has the effect of reducing the holder’s adjusted tax basis in its investment. If distributions exceed the adjusted tax basis of a holder’s shares, they will be treated as gain from the sale or exchange of such stock.
We may change the distribution policy for our common stock in the future.
The decision to declare and make distributions on our common stock in the future, as well as the timing, amount and composition of any such future distributions, will be at the sole discretion of our board of directors and will depend on our earnings, funds from operations, liquidity, financial condition, capital requirements or contractual prohibitions, the annual distribution requirements under the REIT provisions of the Code, state law and such other factors as our board of directors deems relevant. While the statements under “Distribution Policy” reflect our current intentions, the actual distribution payable will be determined by our board of directors based upon the circumstances at the time of declaration and the actual distribution payable may vary from such expected amounts. Any change in our distribution policy could have a material adverse effect on the market price of our common stock.
We may use a portion of the net proceeds from this offering and the concurrent private placement to make distributions to our stockholders, if necessary to permit us to satisfy the requirements for qualification as a REIT and eliminate federal income and excise taxes that otherwise would be imposed on us, which would, among other things, reduce our cash available for investing.
We may fund our distributions to our stockholders, if necessary to permit us to satisfy the requirements for qualification as a REIT and eliminate federal income and excise taxes that otherwise would be imposed on us, out of the net proceeds of this offering and the concurrent private placement, which would reduce the amount of cash we have available for investing and other purposes. The use of the net proceeds to fund distributions could be dilutive to our financial results. In addition, funding distributions from the net proceeds may constitute a return of capital to our investors, which would have the effect of reducing each stockholder’s basis in its shares of our common stock.
The market price of our common stock may be volatile due to numerous circumstances beyond our control.
The trading prices of equity securities issued by REITs and other real estate companies historically have been affected by changes in market interest rates. One of the factors that may influence the price of our common stock is the annual yield from distributions on our common stock as compared to yields on other financial instruments. An increase in market interest rates, or a decrease in our distributions to stockholders, may lead prospective purchasers of our common stock to demand a higher annual yield, which could reduce the market price of our common stock.
34
Other factors that could affect the market price of our common stock include the following:
| § | actual or anticipated variations in our quarterly results of operations; | |
| § | changes in market valuations of companies in the lodging industry; | |
| § | changes in expectations of future financial performance or changes in estimates of securities analysts; | |
| § | fluctuations in stock market prices and volumes; | |
| § | our issuances of common stock or other securities in the future; | |
| § | the inclusion of our common stock in equity indices, which could induce additional purchases; | |
| § | the addition or departure of key personnel; | |
| § | announcements by us or our competitors of acquisitions, investments or strategic alliances; and | |
| § | unforeseen events beyond our control, such as terrorist attacks, travel related health concerns including pandemics and epidemics such as H1N1 influenza (swine flu), avian bird flu and SARS, political instability, regional hostilities, increases in fuel prices, imposition of taxes or surcharges by regulatory authorities and travel-related accidents and unusual weather patterns, including natural disasters such as hurricanes. |
The market’s perception of our growth potential and our current and potential future cash distributions, whether from operations, sales or refinancings, as well as the real estate market value of the underlying assets, may cause our common stock to trade at prices that differ from our net asset value per share. If we retain operating cash flow for investment purposes, working capital reserves or other purposes, these retained funds, while increasing the value of our underlying assets, may not correspondingly increase the market price of our common stock. Our failure to meet the market’s expectations with regard to future earnings and distributions likely would adversely affect the market price of our common stock.
The trading market for our common stock will rely in part on the research and reports that industry or financial analysts publish about us or our business. We do not control these analysts. Furthermore, if one or more of the analysts who do cover us downgrades our stock or our industry, or the stock of any of our competitors, the price of our common stock could decline. If one or more of these analysts ceases coverage of our company, we could lose attention in the market, which in turn could cause the price of our common stock to decline.
The offering price per share of common stock offered under this prospectus may not accurately reflect the value of your investment.
Prior to this offering there has been no market for our common stock. The offering price of the common stock offered by this prospectus was negotiated between us and the representatives. Factors considered in determining the prices of our common stock include:
| § | the history of, and prospects for, us and the industry in which we compete; | |
| § | an assessment of our management; | |
| § | the prospects for our future earnings; | |
| § | the prevailing conditions of the applicable United States securities market at the time of this offering; | |
| § | market valuations of publicly traded companies that we and the underwriters believe to be comparable to us; and | |
| § | other factors as were deemed relevant. |
The offering price may not accurately reflect the value of the common stock and may not be realized upon any subsequent disposition of the shares.
If you purchase shares of common stock in this offering, you will experience immediate dilution.
We expect the IPO price of our common stock to be higher than the book value per share of our outstanding common stock following completion of this offering and the application of the net proceeds. If you purchase shares of common stock in this offering, you will experience immediate dilution. This means that the investors who purchase shares of common stock in this offering will likely pay a price per share that exceeds the book value of our assets after subtracting our liabilities. See “Dilution.”
35
The number of shares of our common stock available for future sale could adversely affect the market price per share of our common stock, and future sales by us of shares of our common stock or issuances by our operating partnership of OP units may be dilutive to existing stockholders.
Sales of substantial amounts of shares of our common stock in the public market, or upon exchange of OP units or exercise of any equity awards, or the perception that such sales might occur could adversely affect the market price per share of our common stock. The exercise of the underwriters’ over-allotment option, the exchange of OP units for common stock, the vesting of any equity-based awards granted to certain directors, executive officers and other employees under our 2010 Equity Incentive Plan, the issuance of our common stock or OP units in connection with hotel, portfolio or business acquisitions and other issuances of our common stock or OP units could have an adverse effect on the market price of the shares of our common stock.
Holders of OP units, which are redeemable for cash or, at our operating partnership’s option, shares of our common stock on a one-for-one basis, and the affiliate of IHG purchasing shares of our common stock in the concurrent private placement, have registration rights with respect to a substantial amount of our common stock. These registration rights, which require us to prepare, file and have declared effective a resale registration statement permitting the public resale of any shares issued upon redemption of the 10,100,000 OP units to be issued in the formation transactions and shares purchased in the concurrent private placement, could result in a significant amount of sales of our common stock in a short period of time or the perception that a substantial amount of sales may occur, either or both of which could depress the market price per share of our common stock. The existence of these OP units, as well as additional OP units that may be issued in the future, and shares of our common stock reserved for issuance under our 2010 Equity Incentive Plan and any related resales may adversely affect the market price per share of our common stock and the terms upon which we may be able to obtain additional capital through the sale of equity securities. In addition, future sales by us of shares of our common stock may be dilutive to existing stockholders.
Future borrowings, offerings of debt securities, which would be senior to our common stock upon liquidation, and/or issuances of equity securities (including OP units), which may be dilutive to our existing stockholders and be senior to our common stock for purposes of dividend distributions or upon liquidation, may materially and adversely affect the market price of our common stock.
In the future we may borrow money from lenders, offer debt securities and/or issue equity securities, including OP units or preferred shares that may be senior to our common stock and OP units for purposes of dividend distributions or upon liquidation. We are also in discussions to obtain commitments from a lending syndicate for a secured revolving credit facility that we anticipate will be in place at or following completion of this offering. Upon liquidation, holders of our debt securities and our preferred shares and lenders with respect to other borrowings will receive distributions of our available assets prior to the holders of our common stock and OP units. Holders of our common stock and OP units are not entitled to preemptive rights or other protections against us borrowing money in the future or offering senior debt or equity securities. Therefore, additional common share issuances, directly or through convertible or exchangeable securities (including OP units), warrants or options, will dilute the holdings of our existing common stockholders and OP unit holders and such issuances or the perception of such issuances may reduce the market price of our common stock. In addition, our preferred shares, if issued, could have a preference on liquidating distributions and a preference on dividend payments that could limit our ability to pay a dividend or make another distribution to the holders of our common stock. Because our decision to borrow money or issue securities in any future offering will depend on market conditions and other factors beyond our control, we cannot predict or estimate the amount, timing or nature of our future offerings. Thus, our stockholders bear the risk of our future offerings reducing the market price of our common stock and diluting their interest in us.
The consolidated financial statements of our predecessor and our unaudited pro forma financial statements may not be indicative of our future results or an investment in our common stock.
The consolidated financial statements of our predecessor and our unaudited pro forma financial statements that are included in this prospectus do not necessarily reflect what our results of operations, financial position or cash flows would have been had we been an independent entity during the periods presented. Furthermore, this financial information is not necessarily indicative of what our results of operations, financial position or cash flows will be in the future. It is impossible for us to accurately estimate all adjustments reflecting all the significant changes that will occur in our cost structure, funding and operations as a result of our being a publicly traded REIT. For additional information, see “Selected Financial Data” and the consolidated financial statements of our predecessor and our unaudited pro forma financial statements, as well as “Management’s Discussion and Analysis of Financial Condition and Results of Operations,” appearing elsewhere in this prospectus.
36
Risks Related to Our Status as a REIT
Failure to qualify as a REIT, or failure to remain qualified as a REIT, would cause us to be taxed as a regular corporation, which would substantially reduce funds available for distributions to our stockholders.
We believe that our organization and proposed method of operation will enable us to meet the requirements for qualification and taxation as a REIT commencing with our short taxable year ending December 31, 2010. However, we cannot assure you that we will qualify and remain qualified as a REIT. In connection with this offering, we will receive an opinion from Hunton & Williams LLP that, commencing with our short taxable year ending December 31, 2010, we will be organized in conformity with the requirements for qualification and taxation as a REIT under the federal income tax laws and our proposed method of operations will enable us to satisfy the requirements for qualification and taxation as a REIT under the federal income tax laws for our short taxable year ending December 31, 2010 and subsequent taxable years. Investors should be aware that Hunton & Williams LLP’s opinion is based upon customary assumptions, will be conditioned upon certain representations made by us as to factual matters, including representations regarding the nature of our assets and the conduct of our business, is not binding upon the Internal Revenue Service, or the IRS, or any court and speaks as of the date issued. In addition, Hunton & Williams LLP’s opinion will be based on existing federal income tax law governing qualification as a REIT, which is subject to change either prospectively or retroactively. Moreover, our qualification and taxation as a REIT depend upon our ability to meet on a continuing basis, through actual annual operating results, certain qualification tests set forth in the federal tax laws. Hunton & Williams LLP will not review our compliance with those tests on a continuing basis. Accordingly, no assurance can be given that our actual results of operations for any particular taxable year will satisfy such requirements.
If we fail to qualify as a REIT in any taxable year, we will face serious tax consequences that will substantially reduce the funds available for distributions to our stockholders because:
| § | we would not be allowed a deduction for dividends paid to stockholders in computing our taxable income and would be subject to federal income tax at regular corporate rates; | |
| § | we could be subject to the federal alternative minimum tax and possibly increased state and local taxes; and | |
| § | unless we are entitled to relief under certain federal income tax laws, we could not re-elect REIT status until the fifth calendar year after the year in which we failed to qualify as a REIT. |
In addition, if we fail to qualify as a REIT, we will no longer be required to make distributions. As a result of all these factors, our failure to qualify as a REIT could impair our ability to expand our business and raise capital, and it would adversely affect the value of our common stock. See “Material Federal Income Tax Considerations” for a discussion of material federal income tax consequences relating to us and our common stock.
Even if we qualify as a REIT, we may face other tax liabilities that reduce our cash flows.
Even if we qualify for taxation as a REIT, we may be subject to certain federal, state and local taxes on our income and assets, including taxes on any undistributed income, tax on income from some activities conducted as a result of a foreclosure, and state or local income, property and transfer taxes. In addition, our TRSs will be subject to regular corporate federal, state and local taxes. Any of these taxes would decrease cash available for distributions to stockholders.
Failure to make required distributions would subject us to federal corporate income tax.
We intend to operate in a manner so as to qualify as a REIT for federal income tax purposes. In order to qualify as a REIT, we generally are required to distribute at least 90% of our REIT taxable income, determined without regard to the dividends paid deduction and excluding any net capital gain, each year to our stockholders. To the extent that we satisfy this distribution requirement, but distribute less than 100% of our REIT taxable income, we will be subject to federal corporate income tax on our undistributed taxable income. In addition, we will be subject to a 4% nondeductible excise tax if the actual amount that we pay out to our stockholders in a calendar year is less than a minimum amount specified under the Code.
REIT distribution requirements could adversely affect our liquidity and may force us to borrow funds or sell assets during unfavorable market conditions.
In order to satisfy our qualification as a REIT and to meet the REIT distribution requirements, we may need to borrow funds on a short-term basis or sell assets, even if the then-prevailing market conditions are not favorable for these borrowings or sales. Our cash flows from operations may be insufficient to fund required distributions as a result of differences in timing between the actual receipt of income and the recognition of income for federal income tax purposes,
37
or the effect of non-deductible capital expenditures, the creation of reserves or required debt service or amortization payments. For example, we may be required to accrue income from mortgage loans and other types of debt instruments that we may acquire before we receive any payments of interest or principal on such assets. We may also acquire distressed debt investments that are subsequently modified or foreclosed upon, which could result in significant taxable income without any corresponding cash payment. See “Material Federal Income Tax Considerations.” The insufficiency of our cash flows to cover our distribution requirements could have an adverse impact on our ability to raise short- and long-term debt or sell equity securities in order to fund distributions required to maintain our qualification as a REIT. Also, although the IRS has issued Revenue Procedure 2010-12 sanctioning certain issuances of taxable stock dividends by REITs under certain circumstances for taxable years ending on or before December 31, 2011, no assurance can be given that the IRS will extend this treatment or that we will otherwise be able to pay taxable stock dividends to meet our REIT distribution requirements.
The formation of our TRSs and TRS lessees increases our overall tax liability.
Summit TRS, Summit TRS II and any other of our domestic TRSs will be subject to federal, state and local income tax on their taxable income, which will consist of the revenues from the hotels leased by our TRS lessees, net of the operating expenses for such hotels and rent payments to us. Accordingly, although our ownership of our TRS lessees will allow us to participate in the operating income from our hotels in addition to receiving rent, that operating income will be fully subject to income tax. The after-tax net income of our TRS lessees is available for distribution to us. If we have any non-U.S. TRSs, then they may be subject to tax in jurisdictions where they operate.
Our TRS lessee structure subjects us to the risk of increased hotel operating expenses that could adversely affect our operating results and our ability to make distributions to stockholders.
Our leases with our TRS lessees will require our TRS lessees to pay us rent based in part on revenues from our hotels. Our operating risks include decreases in hotel revenues and increases in hotel operating expenses, including but not limited to the increases in wage and benefit costs, repair and maintenance expenses, energy costs, property taxes, insurance costs and other operating expenses, which would adversely affect our TRS lessees’ ability to pay us rent due under the leases.
Increases in these operating expenses can have a significant adverse impact on our financial condition, results of operations, the market price of our common shares and our ability to make distributions to our stockholders.
Our ownership of our TRSs will be subject to limitations and our transactions with our TRSs will cause us to be subject to a 100% penalty tax on certain income or deductions if those transactions are not conducted on arm’s-length terms.
Overall, no more than 25% of the value of a REIT’s assets may consist of stock or securities of one or more TRSs. In addition, the Code limits the deductibility of interest paid or accrued by a TRS to its parent REIT to assure that the TRS is subject to an appropriate level of corporate taxation. The Code also imposes a 100% excise tax on certain transactions between a TRS and its parent REIT that are not conducted on an arm’s-length basis. The 100% tax would apply, for example, to the extent that we were found to have charged our TRS lessees rent in excess of an arm’s-length rent. Furthermore, we will monitor the value of our respective investments in our TRSs for the purpose of ensuring compliance with TRS ownership limitations and will structure our transactions with our TRSs on terms that we believe are arm’s length to avoid incurring the 100% excise tax described above. There can be no assurance, however, that we will be able to comply with the 25% TRS limitation or to avoid application of the 100% excise tax.
If the leases of our hotels to the TRS lessees are not respected as true leases for federal income tax purposes, we will fail to qualify as a REIT.
To qualify as a REIT, we must annually satisfy two gross income tests, under which specified percentages of our gross income must be derived from certain sources, such as “rents from real property.” Rents paid to our operating partnership by TRS lessees pursuant to the leases of our hotels will constitute substantially all of our gross income. In order for such rent to qualify as “rents from real property” for purposes of the gross income tests, the leases must be respected as true leases for federal income tax purposes and not be treated as service contracts, financing arrangements, joint ventures or some other type of arrangement. If our leases are not respected as true leases for federal income tax purposes, we will fail to qualify as a REIT.
38
If our operating partnership is treated as a publicly traded partnership taxable as a corporation for federal income tax purposes, we will cease to qualify as a REIT.
Although Hunton & Williams LLP, our tax counsel, is of the opinion that our operating partnership will be treated as a partnership for federal income tax purposes, no assurance can be given that the IRS will not successfully challenge that position. If the IRS were to successfully contend that our operating partnership should be treated as a publicly traded partnership taxable as a corporation, we would fail to meet the 75% gross income test and certain of the asset tests applicable to REITs and, unless we qualified for certain statutory relief provisions, we would cease to qualify as a REIT. Also, our operating partnership would become subject to federal, state and local income tax, which would reduce significantly the amount of cash available for debt service and for distribution to us.
If Interstate or any other hotel management companies that we may engage in the future do not qualify as “eligible independent contractors,” or if our hotels are not “qualified lodging facilities,” we will fail to qualify as a REIT.
Rent paid by a lessee that is a “related party tenant” of ours will not be qualifying income for purposes of the two gross income tests applicable to REITs. An exception is provided, however, for leases of “qualified lodging facilities” to a TRS so long as the hotels are managed by an “eligible independent contractor” and certain other requirements are satisfied. We expect to lease all or substantially all of our hotels to TRS lessees and to engage Interstate and, in the future, other hotel management companies that are intended to qualify as an “eligible independent contractor.” Among other requirements, in order to qualify as an eligible independent contractor, the hotel manager must not own, directly or through its stockholders, more than 35% of our outstanding shares, and no person or group of persons can own more than 35% of our outstanding shares and the shares (or ownership interest) of the hotel manager, taking into account certain ownership attribution rules. The ownership attribution rules that apply for purposes of these 35% thresholds are complex, and monitoring actual and constructive ownership of our shares by our hotel managers and their owners may not be practical. Accordingly, there can be no assurance that these ownership levels will not be exceeded.
In addition, for a hotel management company to qualify as an eligible independent contractor, such company or a related person must be actively engaged in the trade or business of operating “qualified lodging facilities” (as defined below) for one or more persons not related to the REIT or its TRSs at each time that such company enters into a hotel management contract with a TRS or its TRS lessee. As of the date hereof, we believe Interstate operates qualified lodging facilities for certain persons who are not related to us or our TRSs. However, no assurances can be provided that Interstate or any other hotel managers that we may engage in the future will in fact comply with this requirement. Failure to comply with this requirement would require us to find other managers for future contracts, and, if we hired a management company without knowledge of the failure, it could jeopardize our status as a REIT.
Finally, each property with respect to which our TRS lessees pay rent must be a “qualified lodging facility.” A “qualified lodging facility” is a hotel, motel or other establishment more than one-half of the dwelling units in which are used on a transient basis, including customary amenities and facilities, provided that no wagering activities are conducted at or in connection with such facility by any person who is engaged in the business of accepting wagers and who is legally authorized to engage in such business at or in connection with such facility. As of the date hereof, we believe that the properties that will be leased to our TRS lessees will be qualified lodging facilities. Although we intend to monitor future acquisitions and improvements of properties, REIT provisions of the Code provide only limited guidance for making determinations under the requirements for qualified lodging facilities, and there can be no assurance that these requirements will be satisfied.
We may be subject to adverse legislative or regulatory tax changes that could reduce the market price of our common stock.
At any time, the federal income tax laws governing REITs or the administrative interpretations of those laws may be amended. We cannot predict when or if any new federal income tax law, regulation, or administrative interpretation, or any amendment to any existing federal income tax law, regulation or administrative interpretation, will be adopted, promulgated or become effective and any such law, regulation, or interpretation may take effect retroactively. We and our stockholders could be adversely affected by any such change in, or any new, federal income tax law, regulation or administrative interpretation.
You may be restricted from acquiring or transferring certain amounts of our common stock.
The stock ownership restrictions of the Code for REITs and the 9.8% stock ownership limit in our charter may inhibit market activity in our capital stock and restrict our business combination opportunities.
39
In order to qualify as a REIT for each taxable year after 2010, five or fewer individuals, as defined in the Code, may not own, beneficially or constructively, more than 50% in value of our issued and outstanding stock at any time during the last half of a taxable year. Attribution rules in the Code determine if any individual or entity beneficially or constructively owns our capital stock under this requirement. Additionally, at least 100 persons must beneficially own our capital stock during at least 335 days of a taxable year for each taxable year after 2010. To help insure that we meet these tests, our charter restricts the acquisition and ownership of shares of our capital stock.
Our charter, with certain exceptions, authorizes our directors to take such actions as are necessary and desirable to preserve our qualification as a REIT. Unless exempted by our board of directors, our charter prohibits any person from beneficially or constructively owning more than 9.8% in value or number of shares, whichever is more restrictive, of the outstanding shares of any class or series of our capital stock. Our board of directors may not grant an exemption from these restrictions to any proposed transferee whose ownership in excess of 9.8% of the value of our outstanding shares would result in our failing to qualify as a REIT. These restrictions on transferability and ownership will not apply, however, if our board of directors determines that it is no longer in our best interest to continue to qualify as a REIT.
Under recently issued IRS guidance, we may pay taxable dividends of our common stock and cash, in which case stockholders may sell shares of our common stock to pay tax on such dividends, placing downward pressure on the market price of our common stock.
Under recently issued IRS guidance, we may distribute taxable dividends that are payable in cash and common stock at the election of each stockholder. Under Revenue Procedure 2010-12, up to 90% of any such taxable dividend paid with respect to our 2010 and 2011 taxable years could be payable in shares of our common stock. Taxable stockholders receiving such dividends will be required to include the full amount of the dividend as ordinary income to the extent of our current and accumulated earnings and profits, as determined for federal income tax purposes. As a result, stockholders may be required to pay income tax with respect to such dividends in excess of the cash dividends received. If a U.S. stockholder sells the common stock that it receives as a dividend in order to pay this tax, the sales proceeds may be less than the amount included in income with respect to the dividend, depending on the market price of our common stock at the time of the sale. Furthermore, with respect to certain non-U.S. stockholders, we may be required to withhold federal income tax with respect to such dividends, including in respect of all or a portion of such dividend that is payable in common stock. If we utilize Revenue Procedure 2010-12 and a significant number of our stockholders determine to sell shares of our common stock in order to pay taxes owed on dividends, it may put downward pressure on the trading price of our common stock. We do not currently intend to utilize Revenue Procedure 2010-12.
40
Cautionary Note Regarding Forward-Looking Statements
We make forward-looking statements in this prospectus that are subject to risks and uncertainties. These forward-looking statements include information about possible or assumed future results of our business, financial condition, liquidity, results of operations, cash flow and plans and objectives. When we use the words “believe,” “expect,” “anticipate,” “estimate,” “plan,” “continue,” “intend,” “should,” “may” or similar expressions, we intend to identify forward-looking statements. Statements regarding the following subjects, among others, may be forward-looking:
| § | use of the proceeds of this offering and the concurrent private placement; |
| § | the state of the U.S. economy generally or in specific geographic regions in which we operate, and the effect of general economic conditions on the lodging industry in particular; | |
| § | market trends in our industry, interest rates, real estate values and the capital markets; | |
| § | our business and investment strategy and, particularly, our ability to identify and complete hotel acquisitions; | |
| § | our projected operating results; | |
| § | actions and initiatives of the U.S. government and changes to U.S. government policies and the execution and impact of these actions, initiatives and policies; | |
| § | our ability to manage our relationships with Interstate and other management companies, as well as franchisors; |
| § | our ability to obtain a secured revolving credit facility on the indicative terms and conditions described in this prospectus or at all and our ability to maintain our existing and future financing arrangements; |
| § | changes in the value of our properties; | |
| § | impact of and changes in governmental regulations, tax law and rates, accounting guidance and similar matters; | |
| § | our ability to satisfy the requirements for qualification as a REIT under the Code; | |
| § | availability of qualified personnel; | |
| § | estimates relating to our ability to make distributions to our stockholders in the future; | |
| § | general volatility of the market price of our common stock; and | |
| § | degree and nature of our competition. |
The forward-looking statements are based on our beliefs, assumptions and expectations of our future performance, taking into account all information currently available to us. Forward-looking statements are not predictions of future events. These beliefs, assumptions and expectations can change as a result of many possible events or factors, not all of which are known to us. Some of these factors are described in this prospectus under the headings “Risk Factors,” “Management’s Discussion and Analysis of Financial Condition and Results of Operations” and “Our Business and Properties.” If a change occurs, our business, financial condition, liquidity and results of operations may vary materially from those expressed in our forward-looking statements. Any forward-looking statement speaks only as of the date on which it is made. New risks and uncertainties arise over time, and it is not possible for us to predict those events or how they may affect us. Except as required by law, we are not obligated to, and do not intend to, update or revise any forward-looking statements, whether as a result of new information, future events or otherwise.
41
Use of Proceeds
We estimate that the net proceeds we will receive from the sale of shares of our common stock in this offering and shares of our common stock in the concurrent private placement will be approximately $ million (or approximately $ million if the underwriters exercise their over-allotment option in full), after deducting the underwriting discount of approximately $ million (or approximately $ million if the underwriters exercise their over-allotment option in full) and estimated expenses related to this offering, the concurrent private placement and the formation transactions of approximately $3.6 million payable by us. A $1.00 increase (decrease) in the assumed public offering price per share would increase (decrease) net proceeds to us from this offering and the concurrent private placement by $ million, assuming the number of shares offered by us as set forth on the cover of this prospectus remains the same. Any additional proceeds to us resulting from an increase in the public offering price or the number of shares offered pursuant to this prospectus will be used by us as described below.
We will contribute the net proceeds of this offering and the concurrent private placement to our operating partnership in exchange for OP units. Our operating partnership intends to use the net proceeds of this offering and the concurrent private placement as follows: (1) approximately $227.6 million to repay or extinguish existing indebtedness that we will assume upon completion of the formation transactions, including the payment of accrued interest and exit fees related to our repayment of the Fortress Credit Corp. indebtedness described below and the payment of an extinguishment premium and other transaction costs related to the extinguishment of the Lehman Brothers Bank indebtedness described below; (2) approximately $10.0 million to fund capital improvements at our hotels; and (3) the balance for general corporate and working capital purposes, including possible future hotel acquisitions.
Pending the use of the net proceeds as described above, we intend to invest the net proceeds in interest-bearing, short-term investment-grade securities, money-market accounts or other investments that are consistent with our intention to elect and qualify to be taxed as a REIT.
If the underwriters exercise their over-allotment option in full, we expect to use the additional net proceeds to us, which will be approximately $ million in the aggregate, for general working capital purposes, including potential future acquisitions.
The following table sets forth information, as of September 30, 2010, with respect to the indebtedness that we intend to repay in full with a portion of the net proceeds from this offering and the concurrent private placement:
| Outstanding Principal | ||||||||||
| Balance as of | ||||||||||
Indebtedness to be Repaid | September 30, 2010 | Interest Rate(1) | Maturity Date | |||||||
| Fortress Credit Corp. | $ | 86,075,691 | (2) | 30-day LIBOR + 8.75%(3) | March 5, 2011 | |||||
| Lehman Brothers Bank | 77,380,701 | (4) | 5.40% | January 11, 2012 | ||||||
| Marshall & Ilsley Bank | 21,420,178 | 30-day LIBOR + 3.90% | December 31, 2010 | |||||||
| First National Bank of Omaha | 18,902,762 | 90-day LIBOR + 4.00%(5) | July 31, 2011 | |||||||
| First National Bank of Omaha | 19,992,785 | (6) | 90-day LIBOR + 4.00%(5) | July 31, 2011 | ||||||
| Total | $ | 223,772,117 | (7) | |||||||
| (1) | As of September 30, 2010, the 30-day LIBOR rate was 0.26% and the 90-day LIBOR rate was 0.29%. |
| (2) | We will be required to pay an exit fee equal to 1.0% of the outstanding principal balance of the Fortress Credit Corp. indebtedness being repaid. We estimate that the exit fee will be approximately $0.9 million. After December 31, 2010, the exit fee increases to 1.5% of the outstanding principal balance. From September 8, 2009 to November 30, 2010, we borrowed an aggregate of approximately $4.2 million of this indebtedness from Fortress to pay accrued interest under the Fortress loans. |
| (3) | Interest is paid monthly at the 30-day LIBOR rate plus 5.75%, and additional interest accrues at the annual rate of 30-day LIBOR plus 3.00% and is deferred until the maturity date. As a result, the outstanding principal balance will increase prior to the date of repayment. | |
| (4) | We will be required to pay a extinguishment premium and other transaction costs in an amount estimated to be approximately $2.9 million in connection with the extinguishment of the Lehman Brothers Bank indebtedness. | |
| (5) | Subject to a minimum interest rate of 5.5%. |
| (6) | On December 31, 2009, we borrowed approximately $12.9 million of this indebtedness from First National Bank of Omaha to fund construction costs of our AloftSM hotel in Jacksonville, Florida. |
| (7) | Excludes approximately $3.8 million of prepayment and related fees as described in footnotes (2) and (4) above to be paid with the net proceeds of this offering and the concurrent private placement. |
42
Capitalization
The following table presents:
| § | our predecessor’s historical capitalization as of September 30, 2010; and |
| § | our capitalization as of September 30, 2010 on a pro forma basis, after giving effect to the repurchase, for $1,000 upon the closing of this offering, of 1,000 shares of common stock purchased by our Executive Chairman, Mr. Boekelheide, in connection with our initial capitalization for $1,000, the formation transactions, including this offering and the concurrent private placement, and the application of the net proceeds from this offering and the concurrent private placement as described in “Use of Proceeds,” as if each of them had occurred on September 30, 2010. |
You should read the following capitalization table in conjunction with “Use of Proceeds,” “Selected Financial and Operating Data,” “Management’s Discussion and Analysis of Financial Condition and Results of Operations” and the more detailed information contained in our predecessor’s consolidated financial statements and notes thereto included elsewhere in this prospectus.
| As of September 30, 2010 | ||||||||
| Historical | ||||||||
| Summit Hotel | Pro Forma | |||||||
| Properties, LLC | Summit Hotel | |||||||
| (our predecessor) | Properties, Inc. | |||||||
| (unaudited) | ||||||||
| (dollars in thousands) | ||||||||
| Mortgages and notes payable, including current portion | $ | 422,198 | $ | |||||
| Common stock, $0.01 par value, 1,000 shares authorized, issued and outstanding, historical; 500,000,000 shares authorized, shares issued and outstanding, pro forma | — | (1 | ) | |||||
| Preferred stock, $0.01 par value, no shares authorized, issued and outstanding, historical; 100,000,000 shares authorized, no shares issued and outstanding, pro forma | — | — | ||||||
| Additional paid-in capital | — | |||||||
| Members’ equity | 75,463 | — | ||||||
| Noncontrolling interest of our predecessor’s consolidated subsidiaries | (1,624 | ) | — | |||||
| Noncontrolling interest in our operating partnership | — | |||||||
| Total members’ equity/stockholders’ equity | 73,839 | |||||||
| Total capitalization | $ | 496,037 | $ | |||||
| (1) | Includes: (i) shares of common stock to be sold in this offering; (ii) shares of common stock to be sold in the concurrent private placement; and (iii) an aggregate of 4,000 shares of common stock to be issued to our independent director nominees pursuant to the 2010 Equity Incentive Plan upon completion of this offering. Excludes: (i) up to shares of common stock issuable by us upon exercise of the underwriters’ over-allotment option; (ii) an aggregate of 940,000 shares of common stock issuable upon exercise of options that we will grant to Messrs. Boekelheide, Hansen, Aniszewski, Becker and Bertucci pursuant to the 2010 Equity Incentive Plan upon completion of this offering; (iii) the shares of common stock remaining available for future issuance under the 2010 Equity Incentive Plan after the stock awards to our independent directors and the option grants to our named executive officers, each of which is described above, have been made; and (iv) up to 10,100,000 shares of common stock issuable upon redemption of the 10,100,000 OP units to be issued by our operating partnership in the formation transactions. |
43
Dilution
At September 30, 2010, our pro forma net tangible book value, after giving effect to the formation transactions, but before this offering and the concurrent private placement, was approximately $321.6 million, or $ per share. Pro forma net tangible book value per share is determined by dividing our pro forma net tangible book value (tangible assets less liabilities) by the pro forma total number of shares of our common stock outstanding upon completion of the formation transactions, assuming all the OP units to be issued in the formation transactions are redeemed for shares of our common stock on a one-for-one basis.
After giving effect to: (i) the sale by us of shares of our common stock in this offering at an assumed IPO price of $ per share, which is the mid-point of the anticipated IPO price per share shown on the cover of this prospectus; (ii) the deduction of the underwriting discount and the payment of the estimated expenses of this offering; (iii) the sale by us of shares of common stock in the concurrent private placement to an affiliate of IHG at a price per share equal to the mid-point of the anticipated IPO price per share shown on the cover of this prospectus less the underwriting discount; and (iv) the formation transactions, our pro forma net tangible book value as of September 30, 2010 would have been $ million, or $ per share. This represents an immediate increase in pro forma net tangible book value per share of $ per share to the members of our predecessor and the Class B and Class C members of Summit of Scottsdale receiving OP units in the formation transactions and an immediate dilution of $ per share to new investors in this offering. The following table illustrates this per-share dilution:
| Assumed IPO price per share | $ | |||
Pro forma net tangible book value per share as of September 30, 2010, after giving effect to the formation transactions, but before this offering and the concurrent private placement(1) | ||||
| Increase in pro forma net tangible book value per share attributable to this offering | ||||
| Increase in pro forma net tangible book value per share attributable to the concurrent private placement | ||||
Pro forma net tangible book value per share after the formation transactions, this offering and the concurrent private placement(2) | ||||
Dilution in pro forma net tangible book value per share to new investors(3) | $ | |||
| (1) | Represents pro forma net tangible book value as of September 30, 2010, after giving effect to the formation transactions, but before this offering and the concurrent private placement, of approximately $73.8 million, divided by the sum of (i) 10,100,000 shares of our common stock, which assumes the 10,100,000 OP units to be issued in the formation transactions to the members of our predecessor and the Class B and Class C members of Summit of Scottsdale are redeemed for shares of our common stock on a one-for-one basis, and (ii) 1,000 shares of common stock purchased by our Executive Chairman, Mr. Boekelheide, in connection with our initial capitalization for $1,000, all of which will be repurchased for $1,000 upon the closing of this offering. |
| (2) | Represents pro forma net tangible book value as of September 30, 2010, after giving effect to the formation transactions, this offering, the concurrent private placement, the deduction of the underwriting discount and the payment of estimated expenses related to this offering and the formation transactions of approximately $ million, divided by the sum of (i) shares of our common stock to be sold in this offering, (ii) shares of our common stock to be sold in the concurrent private placement, (iii) 10,100,000 shares of our common stock, which assumes the 10,100,000 OP units to be issued in the formation transactions to the members of our predecessor and the Class B and Class C members of Summit of Scottsdale are redeemed for shares of our common stock on a one-for-one basis, and (iv) an aggregate of 4,000 shares of our common stock to be granted to our independent directors upon completion of this offering pursuant to the 2010 Equity Incentive Plan. The pro forma total number of shares of our common stock outstanding after the formation transactions, this offering and the concurrent private placement excludes: (i) up to shares of our common stock issuable upon exercise of the underwriters’ over-allotment option and (ii) an aggregate of 940,000 shares of our common stock issuable upon exercise of options to be granted to Messrs. Boekelheide, Hansen, Aniszewski, Becker and Bertucci pursuant to the 2010 Equity Incentive Plan upon completion of this offering. |
| (3) | Dilution is determined by subtracting pro forma net tangible book value per share after the formation transactions, this offering and the concurrent private placement from the assumed IPO price per share paid by a new investor for a share of our common stock. |
44
The table below summarizes, as of September 30, 2010, on a pro forma basis after giving effect to the formation transactions, this offering and the concurrent private placement, the differences between:
| § | the number of OP units to be received by our predecessor’s members and the Class B and Class C members of Summit of Scottsdale, or the continuing investors, in the formation transactions, the number of shares of common stock to be received by the affiliate of IHG purchasing shares in the concurrent private placement and the number of shares of common stock to be received by the new investors purchasing shares in this offering; and |
| § | the total consideration paid and the average price per OP unit paid by the continuing investors (based on the net tangible book value of the assets being acquired by our operating partnership in the formation transactions) and the total consideration paid and the average price per share paid by each of the affiliate of IHG purchasing shares in the concurrent private placement and the new investors purchasing shares in this offering. |
| Net Tangible | ||||||||||||||||||||
| Book Value of | Average | |||||||||||||||||||
| OP Units/ Shares Issued | Contribution/Cash | Price per | ||||||||||||||||||
| Number | Percentage(1) | Amount | Percentage | Share/OP Unit | ||||||||||||||||
| Continuing investors | (2) | (3) | ||||||||||||||||||
| Concurrent private placement purchaser | (4) | |||||||||||||||||||
| New investors | (5) | |||||||||||||||||||
| Total | ||||||||||||||||||||
| (1) | Represents the percentage of the total number of shares of common stock to be outstanding upon completion of the formation transactions, this offering and the concurrent private placement and assumes all of the 10,100,000 OP units to be issued to the continuing investors in the formation transactions are redeemed for shares of our common stock on a one-for-one basis. |
| (2) | Includes: (i) 10,100,000 shares of common stock, assuming all of the 10,100,000 OP units to be issued to the continuing investors in the formation transactions are redeemed for shares of our common stock on a one-for-one basis and (ii) an aggregate of 4,000 shares of common stock to be issued to our independent directors upon completion of this offering pursuant to the 2010 Equity Incentive Plan. Excludes 940,000 shares of our common stock issuable upon exercise of options to be granted to Messrs. Boekelheide, Hansen, Aniszewski, Becker and Bertucci pursuant to the 2010 Equity Incentive Plan upon completion this offering. |
| (3) | Represents pro forma net tangible book value as of September 30, 2010 of the assets being acquired by our operating partnership in the formation transactions. |
| (4) | Represents the aggregate offering price of the shares to be sold in the concurrent private placement. |
| (5) | Represents the aggregate IPO price of the shares to be sold in this offering. |
45
Distribution Policy
We intend to make regular quarterly cash distributions to our stockholders, as more fully described below. To qualify as a REIT, we must distribute annually to our stockholders an amount at least equal to 90% of our REIT taxable income, determined without regard to the deduction for dividends paid and excluding any net capital gain. We will be subject to income tax on our taxable income that is not distributed and to an excise tax to the extent that certain percentages of our taxable income are not distributed by specified dates. See “Material Federal Income Tax Considerations.” Income as computed for purposes of the foregoing tax rules will not necessarily correspond to our income as determined for financial reporting purposes.
The amount, timing and frequency of distributions will be authorized by our board of directors based upon a variety of factors, including:
| § | actual results of operations; | |
| § | our level of retained cash flows; |
| § | the timing of the investment of the net proceeds of this offering and the concurrent private placement; |
| § | any debt service requirements; | |
| § | capital expenditure requirements for our properties; | |
| § | our taxable income; | |
| § | the annual distribution requirements under the REIT provisions of the Code; and | |
| § | other factors that our board of directors may deem relevant. |
Distributions to stockholders generally will be taxable to our stockholders as ordinary income, although a portion of such distributions may be designated by us as long-term capital gain or may constitute a return of capital. We will furnish annually to each of our stockholders a statement setting forth distributions paid during the preceding year and their federal income tax status. For a discussion of the federal income tax treatment of our distributions, see “Material Federal Income Tax Considerations.”
We intend to make regular quarterly cash distributions to our stockholders. We expect to pay our initial distribution with respect to the period commencing on the date of completion of this offering and ending March 31, 2011 based on a rate of $ per share for a full quarter. On an annualized basis, this would equal approximately $ per share, or an annual distribution rate of approximately % based on an assumed IPO price of $ , the mid-point of the anticipated IPO price range set forth on the cover of this prospectus. We estimate that our initial annual distribution rate will represent approximately 100% of estimated cash available for distribution for the 12-month period ending September 30, 2011. This initial distribution rate is based upon an estimate of cash available for distribution after this offering, the concurrent private placement and completion of the formation transactions, which is calculated based on adjustments to our pro forma net income for the year ended December 31, 2009 as described below. We have estimated cash available for distribution for the sole purpose of determining our initial distribution amount.
Our estimate of cash available for distribution does not include the effect of any changes in our working capital resulting from changes in our working capital accounts or attempt to project the effect on our results of operations of any changes in the U.S. economy, the lodging industry generally or the market segments in which we operate, in particular. Our estimate also does not reflect the amount of cash estimated to be used for investing activities, such as acquisitions, other than a provision for recurring capital expenditures. It also does not reflect the amount of cash estimated to be used for financing activities. Any acquisitions or other investing activities and financing activities may have a material effect on our estimate of cash available for distribution. Because we have made the assumptions set forth above in estimating cash available for distribution, we do not intend this estimate to be a projection or forecast of our actual results of operations or our liquidity, and have estimated cash available for distribution for the sole purpose of determining our initial annual distribution rate. Our estimate of cash available for distribution should not be considered as an alternative to cash flow from operating activities (computed in accordance with GAAP) or as an indicator of our liquidity or our ability to make distributions. In addition, the methodology upon which we made the adjustments described below is not necessarily intended to be a basis for determining future distributions.
46
Distributions made by us will be authorized and determined by our board of directors in its sole discretion out of funds legally available therefor and will be dependent upon a number of factors, including maintaining our status as a REIT, restrictions under applicable law and our loan agreements and other factors described below. We believe that our estimate of cash available for distribution constitutes a reasonable basis for setting the initial distribution rate as most of the hotel properties in our initial portfolio have been in operation for a significant period of time, and is conservative in that it does not give effect to the internal growth we expect to generate, particularly in our unseasoned portfolio, if the lodging industry continues to recover. However, we cannot assure you that the estimate will prove accurate, and actual distributions may therefore be significantly different from the expected distributions. Actual results of operations, economic conditions or other factors may differ materially from the assumptions used in the estimate. Our actual results of operations will be affected by a number of factors, including the revenue received from our hotels, performance of our property manager, our operating expenses, interest expense (including the effect of variable rate debt), and unanticipated capital expenditures. We may, from time to time, be required, or elect, to borrow funds under our anticipated secured revolving credit facility or otherwise, sell assets or issue capital stock to pay distributions. Additionally, we may pay future distributions from the proceeds from this offering or other securities offerings.
We anticipate that, at least initially, our distributions will exceed our then-current and then-accumulated earnings and profits as determined for federal income tax purposes due to the write-off of prepayment fees that we expect to pay in respect of the debt we will be retiring from the net proceeds of this offering and the concurrent private placement and non-cash expenses, primarily depreciation and amortization charges that we expect to incur. Therefore, a portion of these distributions may represent a return of capital for federal income tax purposes. Distributions in excess of our current and accumulated earnings and profits will not be taxable to a stockholder under current federal income tax law to the extent those distributions do not exceed the stockholder’s adjusted tax basis in his or her common stock. Instead, these distributions will reduce the adjusted tax basis of the common stock. In that case, the gain (or loss) recognized on the sale of that common stock or upon our liquidation will be increased (or decreased) accordingly. To the extent those distributions exceed a stockholder’s adjusted tax basis in his or her common stock, they will be treated as a gain from the sale or exchange of the stock. We expect to pay our first distribution in April 2011, which will include a payment with respect to the period commencing on the date of completion of this offering and ending March 31, 2011. We expect that approximately 0%-25% of our estimated initial distribution will represent a return of capital for the tax period ending December 31, 2011. The percentage of our stockholder distributions (if any) that exceeds our current and accumulated earnings and profits may vary substantially from year to year. For a more complete discussion of the tax treatment of distributions to holders of our common stock, see “Material Federal Income Tax Considerations.”
We currently expect to maintain our initial distribution rate for the 12-month period following completion of this offering and the formation transactions. However, our board of directors will monitor and adjust this rate as it deems appropriate to reflect our actual results of operations, economic conditions, capital expenditure requirements, debt service requirements, including limits on distributions that may be contained in our financing agreements, including those of our anticipated revolving credit facility, from time to time, and other factors that could cause actual distributions to differ materially from our current expectations. Even if lodging industry fundamentals and our results of operations continue to improve, we do not expect to pay in the near term quarterly dividends at a rate in excess of approximately $ per share, reflecting an annual distribution rate of approximately 4% based on an assumed IPO price of $ , the mid-point of the anticipated IPO price range shown on the cover of this prospectus. Our actual results of operations will be affected by a number of factors, including the revenue we receive from our properties, our operating expenses, interest expense and unanticipated expenditures. For more information regarding risk factors that could materially adversely affect our actual results of operations, please see “Risk Factors.” To the extent that our cash available for distribution is less than the amount required to be distributed under the REIT provisions of the Code, we may consider various funding sources to cover any shortfall, including borrowing under our anticipated secured revolving credit facility, selling certain of our assets or using a portion of the net proceeds we receive in this offering and the concurrent private placement or future offerings. In addition, our charter allows us to issue preferred stock that could have a preference over our common stock as to distributions. We currently have no intention to issue any preferred stock, but if we do, the distribution preference on the preferred stock could limit our ability to make distributions to the holders of our common stock. We also may elect to pay all or a portion of any distribution in the form of a taxable distribution of our common stock or distribution of debt securities.
The following table sets forth calculations relating to the intended initial distribution based on our pro forma financial data, and we cannot assure you that the intended initial distribution will be made or sustained. The calculations are being
47
made solely for the purpose of illustrating the initial distribution and are not necessarily intended to be a basis for determining future distributions. The calculations include the following material assumptions:
| § | income and cash flows from operations for the twelve months ended December 31, 2009 is substantially the same for the twelve months ended September 30, 2010, with the exception of increases in contractual ground rent; |
| § | cash flows used in investing activities will be the contractually committed and planned amounts for the twelve months ending September 30, 2011; and |
| § | cash flows used in financing activities will be the contractually committed amounts for the twelve months ending September 30, 2011. |
These calculations do not assume any changes to our operations or any acquisitions or dispositions, which would affect our operating results and cash flows, or changes in our outstanding common stock. We cannot assure you that our actual results will be as indicated in the calculations below. All dollar amounts, other than per-share amounts, are in thousands.
Pro forma net income for the year ended December 31, 2009 | $ | (15,392 | ) | |
| Less: Pro forma net income for the nine months ended September 30, 2009 | 8,907 | |||
| Add: Pro forma net income for the nine months ended September 30, 2010 | (883 | ) | ||
Pro forma net income for the twelve months ended September 30, 2010 | (7,368 | ) | ||
| Add: Pro forma depreciation and amortization for the twelve months ended September 30, 2010 | 26,431 | |||
Add: Pro forma non-cash straight line ground rent expense for the twelve months ended September 30, 2010(1) | 119 | |||
Add: Pro forma amortization of deferred financing costs for the twelve months ended September 30, 2010(2) | — | |||
Add: Pro forma loss on impairment of assets(3) | 1,001 | |||
Add: Pro forma loss (gain) on disposal of assets(4) | 40 | |||
Add: Pro forma hotel property acquisition costs(5) | 453 | |||
Less: Pro forma increase in contractual ground rent expense for the twelve months ended September 30, 2010(6) | — | |||
Add: Pro forma non-cash amortization of stock and option awards for the twelve months ended September 30, 2010(7) | ||||
Estimated cash flows from operating activities for the twelve months ending September 30, 2011 | 20,676 | |||
Estimated cash flows used in investing activities—required capital expenditure reserve contributions(8) | (5,744 | ) | ||
Estimated cash flows used in financing activities—scheduled principal payments on debt payable(9) | (6,090 | ) | ||
Estimated cash available for distribution for the twelve months ending September 30, 2011 | $ | 8,842 | ||
| Our share of cash available for distribution | ||||
| Noncontrolling interests’ share of cash available for distribution | ||||
Total estimated initial annual distribution | $ | 8,842 | ||
Estimated initial annual distribution per share(10) | $ | |||
| Payout ratio based on cash available for distribution | 100 | % | ||
| (1) | Represents non-cash item recorded as an operating expense. | |
| (2) | Represents non-cash item recorded as interest expense. | |
| (3) | Represents non-cash item recorded as loss on impairment of assets. | |
| (4) | Represents non-cash item recorded on the disposal of assets. | |
| (5) | Represents hotel property acquisition costs funded with loan or equity proceeds. | |
| (6) | Represents estimated higher ground rent expense pursuant to existing ground lease agreement. | |
| (7) | Represents non-cash compensation recorded as an administrative and general corporate expense. | |
| (8) | Estimated amount based on the amount of reserves required pursuant to management, franchise and loan agreements, at 4% of the revenues of each hotel. | |
| (9) | Estimated amount based on pro forma indebtedness to be outstanding following completion of this offering. | |
| (10) | Represents the aggregate amount of the estimated intended annual distribution divided by the shares of common stock that will be outstanding upon completion of this offering. The number of shares to be outstanding upon completion of this offering excludes shares of common stock that may be issued by us upon exercise of the underwriters’ overallotment option or upon exercise of options or redemption of OP units. |
48
Selected Financial and Operating Data
You should read the following selected historical and pro forma financial and operating data in conjunction with “Management’s Discussion and Analysis of Financial Condition and Results of Operations” and our unaudited pro forma condensed consolidated financial statements and our predecessor’s consolidated financial statements, including the related notes, appearing elsewhere in this prospectus.
We have not presented historical financial information for Summit Hotel Properties, Inc., because we have not had any corporate activity since our formation other than the issuance of 1,000 shares of common stock to our Executive Chairman in connection with the formation and initial capitalization of our company and because we believe that a presentation of the results of Summit Hotel Properties, Inc. would not be meaningful.
We consider Summit Hotel Properties, LLC our predecessor for accounting purposes. Our predecessor’s historical consolidated balance sheet information as of December 31, 2009 and 2008 and our predecessor’s historical consolidated statements of operations information for the years ended December 31, 2009, 2008 and 2007 have been derived from our predecessor’s historical audited consolidated financial statements appearing elsewhere in this prospectus. Our predecessor’s historical consolidated balance sheet information as of September 30, 2010 and our predecessor’s historical consolidated statements of operations information for the nine months ended September 30, 2010 and 2009 have been derived from the historical audited and unaudited consolidated financial statements, respectively, appearing elsewhere in this prospectus. In the opinion of our management, the unaudited interim financial information includes the adjustments (consisting of only normal recurring adjustments) necessary to present fairly the unaudited interim financial information. Our predecessor’s historical consolidated balance sheet information as of December 31, 2007, 2006 and 2005 and our predecessor’s historical consolidated statements of operations information for the years ended December 31, 2006 and 2005 have been derived from our predecessor’s historical audited consolidated financial statements.
Our selected unaudited pro forma balance sheet data and statements of operation and other operating data is presented to reflect: (1) the sale of shares of our common stock in this offering at $ per share, the mid-point of the anticipated IPO price range shown on the cover of this prospectus, and the sale of shares of our common stock in the concurrent private placement at $ per share, the mid-point of the anticipated IPO price range on the cover of this prospectus less the underwriting discount per share, for approximately $260.4 million of estimated net proceeds, after the deduction of the underwriting discount and the payment by us of approximately $3.6 million of expenses related to this offering, the concurrent private placement and the formation transactions; (2) the merger of our predecessor with and into our operating partnership, with our predecessor as the acquirer for accounting purposes, and the issuance by our operating partnership of an aggregate of 9,993,992 OP units to the Class A, Class A-1, Class B and Class C members of our predecessor in exchange for their membership interests in our predecessor; (3) the contribution to our operating partnership of the Class B and Class C membership interests in Summit of Scottsdale held by The Summit Group and an unaffiliated third-party investor in exchange for an aggregate of 106,008 OP units; (4) the contribution of the net proceeds of this offering and the concurrent private placement to our operating partnership in exchange for OP units that represent an approximate % partnership interest in our operating partnership, including the sole general partnership interest; (5) the repayment or extinguishment of approximately $223.8 million of outstanding indebtedness and the payment of estimated costs and expenses of approximately $3.8 million in connection with the retirement of this indebtedness; and (6) the grant upon completion of this offering of an aggregate of 4,000 shares of common stock to our independent directors and options to purchase an aggregate of 940,000 shares of common stock to Messrs. Boekelheide, Hansen, Aniszewski, Becker and Bertucci pursuant to the 2010 Equity Incentive Plan upon completion of this offering.
Following completion of the merger, the historical consolidated financial statements of our predecessor will become our historical consolidated financial statements, and our assets and liabilities will be recorded at their respective historical carrying values as of the date of completion of the merger.
The unaudited pro forma balance sheet data appearing below assumes that each of these transactions occurred on September 30, 2010. The unaudited pro forma statements of operations and other operating data assume that each of these transactions occurred on January 1, 2009.
In the opinion of our management, all material adjustments to reflect the effects of the preceding transactions have been made. The unaudited pro forma balance sheet data is presented for illustrative purposes only and is not necessarily indicative of what our actual financial position would have been had the transactions referred to above occurred on September 30, 2010, nor does it purport to represent our future financial position. The unaudited pro forma condensed statements of operations data and operating data are presented for illustrative purposes only and are not necessarily
49
indicative of what our actual results of operations would have been had the transactions referred to above occurred on January 1, 2009, nor does it purport to represent our future results of operations.
| Pro Forma* | Historical | Pro Forma* | Historical | |||||||||||||||||||||||||||||||||
| Nine | ||||||||||||||||||||||||||||||||||||
| Months | Year | |||||||||||||||||||||||||||||||||||
| Ended | Nine Months Ended | Ended | ||||||||||||||||||||||||||||||||||
| September 30, | September 30, | December 31, | Year Ended December 31, | |||||||||||||||||||||||||||||||||
| 2010 | 2010 | 2009 | 2009 | 2009 | 2008 | 2007 | 2006 | 2005 | ||||||||||||||||||||||||||||
| (unaudited) | (unaudited) | (unaudited) | (unaudited) | (restated) | ||||||||||||||||||||||||||||||||
| (dollars in thousands, except statistical data) | ||||||||||||||||||||||||||||||||||||
Statement of Operations Data: | ||||||||||||||||||||||||||||||||||||
Revenue | ||||||||||||||||||||||||||||||||||||
| Room revenues | $ | 102,874 | $ | 102,874 | $ | 91,096 | $ | 118,960 | $ | 118,960 | $ | 132,797 | $ | 112,044 | $ | 99,009 | $ | 71,025 | ||||||||||||||||||
| Other hotel operations revenues | 1,939 | 1,939 | 1,708 | 2,240 | 2,240 | 2,310 | 1,845 | 1,653 | 1,301 | |||||||||||||||||||||||||||
Total revenue | 104,813 | 104,813 | 92,804 | 121,200 | 121,200 | 135,107 | 113,889 | 100,662 | 72,326 | |||||||||||||||||||||||||||
Expenses | ||||||||||||||||||||||||||||||||||||
Direct hotel operations | – | 35,351 | 31,415 | – | 42,071 | 42,381 | 35,021 | 31,036 | 22,143 | |||||||||||||||||||||||||||
| Other hotel operating expenses | – | 14,056 | 12,564 | – | 16,987 | 15,186 | 11,980 | 10,589 | 7,982 | |||||||||||||||||||||||||||
| General, selling and administrative | – | 18,810 | 17,862 | – | 24,017 | 25,993 | 22,009 | 18,038 | 12,786 | |||||||||||||||||||||||||||
| Repairs and maintenance | – | 3,396 | 5,049 | – | 6,152 | 8,009 | 10,405 | 8,157 | 3,741 | |||||||||||||||||||||||||||
| Rooms | 30,677 | – | – | 36,720 | – | – | – | – | – | |||||||||||||||||||||||||||
| Other direct | 13,068 | – | – | 18,048 | – | – | – | – | – | |||||||||||||||||||||||||||
| Other indirect | 28,392 | – | – | 33,540 | – | – | – | – | – | |||||||||||||||||||||||||||
| Other | 460 | – | – | 681 | – | – | – | – | – | |||||||||||||||||||||||||||
| Total hotel operating expenses | 72,597 | 71,613 | 66,890 | 88,989 | 89,227 | 91,569 | 79,415 | 67,820 | 46,652 | |||||||||||||||||||||||||||
| Depreciation and amortization | 20,094 | 20,328 | 16,985 | 23,088 | 23,971 | 22,307 | 16,136 | 13,649 | 9,891 | |||||||||||||||||||||||||||
| Corporate general and administrative | 4,331 | – | – | 5,774 | – | – | – | – | – | |||||||||||||||||||||||||||
| Salaries and other compensation | – | – | – | – | – | – | – | – | – | |||||||||||||||||||||||||||
| Equity-based compensation | – | – | – | – | – | – | – | – | – | |||||||||||||||||||||||||||
| Other | – | – | – | – | – | – | – | – | – | |||||||||||||||||||||||||||
| Hotel property acquisition costs | 130 | – | – | 1,389 | – | – | – | – | – | |||||||||||||||||||||||||||
| Loss on impairment of assets | – | – | 6,505 | 7,506 | 7,506 | – | – | – | – | |||||||||||||||||||||||||||
Total expenses | 97,152 | 91,941 | 90,380 | 126,746 | 120,704 | 113,876 | 95,551 | 81,469 | 56,543 | |||||||||||||||||||||||||||
Income from operations | 7,661 | 12,872 | 2,424 | (5,546 | ) | 496 | 21,231 | 18,338 | 19,193 | 15,783 | ||||||||||||||||||||||||||
| Other Income (expense): | ||||||||||||||||||||||||||||||||||||
| Interest income | 36 | 36 | 29 | 50 | 50 | 195 | 446 | 605 | 278 | |||||||||||||||||||||||||||
| Interest expense | (7,770 | ) | (19,520 | ) | (12,639 | ) | (9,052 | ) | (18,321 | ) | (17,025 | ) | (14,214 | ) | (11,135 | ) | (7,934 | ) | ||||||||||||||||||
| Loss on disposal of assets | (40 | ) | (40 | ) | (4 | ) | (4 | ) | (4 | ) | (390 | ) | (652 | ) | (749 | ) | (155 | ) | ||||||||||||||||||
Total other expense | (7,774 | ) | (19,524 | ) | (12,614 | ) | (9,006 | ) | (18,275 | ) | (17,220 | ) | (14,420 | ) | (11,279 | ) | (7,811 | ) | ||||||||||||||||||
Income (loss) from continuing operations | (113 | ) | (6,652 | ) | (10,190 | ) | (14,552 | ) | (17,779 | ) | 4,011 | 3,918 | 7,914 | 7,972 | ||||||||||||||||||||||
Income (loss) from discontinued operations | – | – | 1,465 | – | 1,465 | 10,278 | 11,587 | 2,728 | (3,118 | ) | ||||||||||||||||||||||||||
Net income (loss) before income taxes | (113 | ) | (6,652 | ) | (8,725 | ) | (14,552 | ) | (16,314 | ) | 14,289 | 15,505 | 10,642 | 4,854 | ||||||||||||||||||||||
| Income tax expense | (770 | ) | (273 | ) | (20 | ) | (840 | ) | – | (826 | ) | (715 | ) | (539 | ) | (827 | ) | |||||||||||||||||||
Net income (loss) | (883 | ) | (6,925 | ) | (8,745 | ) | (15,392 | ) | (16,314 | ) | 13,463 | 14,790 | 10,103 | 4,027 | ||||||||||||||||||||||
| Net income (loss) attributable to noncontrolling interest | (309 | ) | – | (207 | ) | (5,387 | ) | – | 384 | 778 | 661 | 352 | ||||||||||||||||||||||||
| Net income (loss) attributable to Summit Hotel Properties, LLC | $ | (574 | ) | $ | (6,925 | ) | $ | (8,952 | ) | $ | (10,005 | ) | $ | (16,314 | ) | $ | 13,079 | $ | 14,012 | $ | 9,442 | $ | 3,675 | |||||||||||||
Balance Sheet Data (as of period end): | ||||||||||||||||||||||||||||||||||||
| Cash and cash equivalents | $ | 35,836 | $ | 11,247 | $ | 8,239 | $ | 18,153 | $ | 7,776 | $ | 7,999 | $ | 7,340 | ||||||||||||||||||||||
| Property and equipment, net | $ | 454,983 | $ | 454,983 | $ | 482,767 | $ | 461,894 | $ | 426,494 | $ | 331,707 | $ | 288,486 | ||||||||||||||||||||||
| Other assets | $ | 31,556 | $ | 32,880 | ||||||||||||||||||||||||||||||||
Total assets | $ | 534,173 | $ | 509,969 | $ | 518,246 | $ | 494,755 | $ | 447,990 | $ | 355,959 | $ | 317,278 | ||||||||||||||||||||||
| Mortgages and notes payable | $ | 198,425 | $ | 422,198 | $ | 426,182 | $ | 390,094 | $ | 336,659 | $ | 237,074 | $ | 196,162 | ||||||||||||||||||||||
Total liabilities | $ | 212,357 | $ | 436,130 | $ | 436,947 | $ | 406,994 | $ | 352,298 | $ | 249,248 | $ | 207,009 | ||||||||||||||||||||||
| Members’/stockholders’ equity | $ | 256,260 | $ | 75,463 | $ | 82,923 | $ | 89,385 | $ | 97,395 | $ | 108,222 | $ | 111,472 | ||||||||||||||||||||||
| Noncontrolling interest | $ | 65,556 | $ | (1,624 | ) | $ | (1,624 | ) | $ | (1,624 | ) | $ | (1,703 | ) | $ | (1,511 | ) | $ | (1,203 | ) | ||||||||||||||||
Total liabilities and equity | $ | 534,173 | $ | 509,969 | $ | 518,246 | $ | 494,755 | $ | 447,990 | $ | 355,959 | $ | 317,278 | ||||||||||||||||||||||
Other Data (unaudited): | ||||||||||||||||||||||||||||||||||||
FFO(1) | $ | 19,211 | $ | 13,403 | $ | 8,394 | $ | 7,696 | $ | 6,514 | $ | 27,886 | $ | 23,297 | $ | 25,511 | $ | 17,023 | ||||||||||||||||||
EBITDA(2) | $ | 27,715 | $ | 33,160 | $ | 21,024 | $ | 17,538 | $ | 26,082 | $ | 54,147 | $ | 48,160 | $ | 37,820 | $ | 25,506 | ||||||||||||||||||
Statistical Data (unaudited): | ||||||||||||||||||||||||||||||||||||
| Average room count | 6,533 | 5,956 | 6,079 | 5,725 | 5,647 | 5,426 | 4,570 | |||||||||||||||||||||||||||||
| Ending number of hotels | 65 | 63 | 65 | 62 | 64 | 60 | 60 | |||||||||||||||||||||||||||||
| Occupancy | 65.6 | % | 64.1 | % | 61.9 | % | 66.2 | % | 66.9 | % | 69.7 | % | 68.9 | % | ||||||||||||||||||||||
| ADR | $ | 87.88 | $ | 88.42 | $ | 87.40 | $ | 100.95 | $ | 96.20 | $ | 88.57 | $ | 80.62 | ||||||||||||||||||||||
| RevPAR | $ | 57.68 | $ | 56.71 | $ | 54.12 | $ | 66.78 | $ | 64.37 | $ | 61.77 | $ | 55.53 | ||||||||||||||||||||||
50
| * | Historically, our predecessor segregated its operating expenses (direct hotel operations expense, other hotel operating expense, general, selling and administrative expense and repairs and maintenance) from its other operating expenses, such as depreciation and amortization and impairment losses. Following completion of this offering, we intend to reclassify our operating expenses into categories of hotel operating expenses (room expenses, other direct expenses, other indirect expenses and other expenses) and reclassify our predecessor’s historical items of hotel operating expense to increase the comparability of our hotel operating expenses and our hotel operating results with other publicly traded hospitality REITs. Accordingly, historical balances included in our predecessor’s: |
| § | direct hotel operations expense related to (1) wages, payroll taxes and benefits, linens, cleaning and guestroom supplies and complimentary breakfast will be reclassified to rooms expense in our consolidated statements of operations and (2) franchise fees will be reclassified to other indirect expense in our consolidated statements of operations; | |
| § | other hotel operating expenses related to (1) utilities and telephone will be reclassified to other direct expenses in our consolidated statements of operations and (2) real and personal property taxes, insurance and cable will be reclassified to other indirect expenses in our consolidated statements of operations; | |
| § | general, selling and administrative expenses related to (1) office supplies, advertising, miscellaneous operating expenses and bad debt expense will be reclassified to other direct expenses in our consolidated statements of operations, (2) credit card/travel agent commissions, management company expenses, management company legal and accounting fees and franchise fees will be reclassified to other indirect expenses in our consolidated statements of operations, (3) hotel development and startup costs will be reclassified to hotel property acquisition costs in our consolidated statements of operations and (4) ground rent and other miscellaneous expenses will be reclassified to other expenses in our consolidated statements of operations; and | |
| § | repairs and maintenance will be reclassified to other direct expenses in our consolidated statements of operations. |
On a pro forma basis, the reclassification reduces total hotel operating expenses (direct hotel operations expense, other hotel operating expense, general, selling and administrative expense and repairs and maintenance) by $130,000 for the nine months ended September 30, 2010 and $1.4 million for the year ended December 31, 2009, which were reclassified to hotel operating costs. The reclassification does not impact amounts reported by our predecessor as total expenses (total hotel operating expenses, depreciation and amortization and loss on impairment of assets), income from operations, total other income, income (loss) from continuing operations, income (loss) from discontinued operations, net income (loss) before income taxes or net income (loss). See “Unaudited Pro Forma Condensed Consolidated Financial Statements” appearing elsewhere in this prospectus for additional information.
| (1) | Below, we include a quantitative reconciliation of historical FFO to the most directly comparable GAAP financial performance measure, which is net income (loss) (dollars in thousands): |
| Pro Forma | ||||||||||||||||||||||||||||||||||||
| Nine Months | Pro Forma | |||||||||||||||||||||||||||||||||||
| Ended | Historical | Year Ended | Historical | |||||||||||||||||||||||||||||||||
| September 30, | Nine Months Ended September 30, | December 31, | Year Ended December 31, | |||||||||||||||||||||||||||||||||
| 2010 | 2010 | 2009 | 2009 | 2009 | 2008 | 2007 | 2006 | 2005 | ||||||||||||||||||||||||||||
| (restated) | ||||||||||||||||||||||||||||||||||||
| Net income (loss) | $ | (883 | ) | $ | (6,925 | ) | $ | (8,745 | ) | $ | (15,392 | ) | $ | (16,314 | ) | $ | 13,463 | $ | 14,790 | $ | 10,103 | $ | 4,027 | |||||||||||||
| (Gain) on disposition of assets | – | – | – | – | (1,297 | ) | (8,605 | ) | (10,380 | ) | (1,240 | ) | – | |||||||||||||||||||||||
| Depreciation and amortization | 20,094 | 20,328 | 17,139 | 23,088 | 24,125 | 23,028 | 18,887 | 16,648 | 12,996 | |||||||||||||||||||||||||||
FFO | $ | 19,211 | $ | 13,403 | $ | 8,394 | $ | 7,696 | $ | 6,514 | $ | 27,886 | $ | 23,297 | $ | 25,511 | $ | 17,023 | ||||||||||||||||||
| �� | ||||||||||||||||||||||||||||||||||||
| (2) | Below, we include a quantitative reconciliation of EBITDA to the most directly comparable GAAP financial performance measure, which is net income (loss). |
| Pro Forma | Historical | Pro Forma | Historical | |||||||||||||||||||||||||||||||||
| Nine | Nine | |||||||||||||||||||||||||||||||||||
| Months | Months | Year | ||||||||||||||||||||||||||||||||||
| Ended | Ended | Ended | ||||||||||||||||||||||||||||||||||
| September 30, | September 30, | December 31, | Year Ended December 31, | |||||||||||||||||||||||||||||||||
| 2010 | 2010 | 2009 | 2009 | 2009 | 2008 | 2007 | 2006 | 2005 | ||||||||||||||||||||||||||||
| (restated) | ||||||||||||||||||||||||||||||||||||
| Net income (loss) | $ | (883 | ) | $ | (6,925 | ) | $ | (8,745 | ) | $ | (15,392 | ) | $ | (16,314 | ) | $ | 13,463 | $ | 14,790 | $ | 10,103 | $ | 4,027 | |||||||||||||
| Depreciation and amortization | 20,094 | 20,328 | 17,139 | 23,088 | 24,125 | 23,028 | 18,887 | 16,648 | 12,996 | |||||||||||||||||||||||||||
| Interest expense | 7,770 | 19,520 | 12,639 | 9,052 | 18,321 | 17,025 | 14,214 | 11,135 | 7,934 | |||||||||||||||||||||||||||
| Interest income | (36 | ) | (36 | ) | (29 | ) | (50 | ) | (50 | ) | (195 | ) | (446 | ) | (605 | ) | (278 | ) | ||||||||||||||||||
| Income taxes | 770 | 273 | 20 | 840 | – | 826 | 715 | 539 | 827 | |||||||||||||||||||||||||||
EBITDA | $ | 27,715 | $ | 33,160 | $ | 21,024 | $ | 17,538 | $ | 26,082 | $ | 54,147 | $ | 48,160 | $ | 37,820 | $ | 25,506 | ||||||||||||||||||
51
Management’s Discussion and Analysis of
Financial Condition and Results of Operations
Financial Condition and Results of Operations
The following discussion should be read in conjunction with the “Selected Financial and Operating Data,” our predecessor’s audited consolidated financial statements as of December 31, 2009 and 2008 and for the years ended December 31, 2009, 2008 and 2007, our predecessor’s unaudited condensed consolidated financial statements as of September 30, 2010 and for the nine months ended September 30, 2010 and 2009, and related notes thereto, appearing elsewhere in this prospectus. Where appropriate, the following discussion includes analysis of the effects of the formation transactions and this offering. These effects are reflected in the unaudited pro forma condensed consolidated financial statements appearing elsewhere in this prospectus.
Overview
We are a self-managed hotel investment company that was incorporated in June 2010 to continue our predecessor’s business of acquiring and owning limited-service and select-service hotels in the upscale and midscale without food and beverage segments of the U.S. lodging industry. As a newly formed company with no business activity to date, we have no operating history and only nominal assets. We will commence operations upon completion of this offering and the formation transactions described in this prospectus. Following completion of this offering and the formation transactions, our initial portfolio will consist of 65 upscale and midscale without food and beverage hotels with a total of 6,533 guestrooms located in 19 states. Our initial hotels, with the exception of one independent hotel, will be operated under nationally recognized brands, including the brands owned by Marriott, Hilton, IHG and Hyatt families of brands, among others.
Substantially all of our assets will be held by, and all of our operations will be conducted through, our operating partnership, Summit Hotel OP, LP. Our operating partnership is a recently formed Delaware limited partnership. Through a wholly owned subsidiary, we are the sole general partner of our operating partnership. Through the merger of our predecessor with and into our operating partnership, our operating partnership will succeed to the business and assets of our predecessor. Although our operating partnership will be the surviving entity in the merger, our predecessor is considered our predecessor for accounting purposes and the following discussion is based on our accounting predecessor’s historical operating results. Following completion of the formation transactions, this offering and the concurrent private placement we will own an approximate % ( % if the underwriters’ over-allotment option is exercised in full) partnership interest in our operating partnership, including general and limited partnership interests. The other limited partners of our operating partnership, the former members of our predecessor and The Summit Group, the former Class B member of Summit of Scottsdale and the former Class C member of Summit of Scottsdale, will own the remaining % limited partnership interest in our operating partnership. Pursuant to the partnership agreement, we will have full, exclusive and complete responsibility and discretion in the management and control of our operating partnership, including the ability to cause our operating partnership to enter into certain major transactions including acquisitions, dispositions and refinancings, make distributions to partners and to cause changes in our operating partnership’s business activities.
We intend to elect to be taxed as a REIT for federal income tax purposes beginning with our short taxable year ending December 31, 2010. To qualify as a REIT, we cannot operate or manage our hotels. Instead, we will lease our hotels to our TRS lessees, which will be wholly owned, directly or indirectly, by our operating partnership. Our TRS lessees will engage one or more third-party hotel management companies to operate and manage our hotels pursuant to hotel management agreements. In connection with completion of this offering, our TRS lessees will enter into a hotel management agreement with Interstate, pursuant to which our initial hotels will be operated by Interstate. Our TRS lessees may also employ other hotel managers in the future. We expect Interstate will qualify as an “eligible independent contractor” for federal income tax purposes. We will have no ownership or economic interest in any of the hotel management companies engaged by our TRS lessees. Our TRS lessees will be disregarded as separate from Summit TRS and Summit TRS II for federal income tax purposes and their operations will be consolidated into our financial statements for accounting purposes. Summit TRS and Summit TRS II will each be taxed as a separate “C” corporation, and, unlike our predecessor, Summit TRS’s, Summit TRS II’s and our TRS lessees’ income will be subject to federal, state and local income tax, which will reduce our funds from operations and the cash otherwise available for distribution to our stockholders.
Our revenue is derived from hotel operations and consists of room revenues and other hotel operations revenues. As a result of our focus on limited-service and select-service hotels in the upscale and midscale without food and beverage
52
segments of the U.S. lodging industry, substantially all of our revenue is room revenue generated from sales of hotel rooms. We also generate other hotel operations revenues, which consists of ancillary revenue related to meeting rooms, entertainment and other guest services provided at our hotels.
Our hotel operating expenses consist primarily of expenses incurred in the day-to-day operation of our hotels. Many of our expenses are fixed, such as essential hotel staff, real estate taxes, insurance, depreciation and certain types of franchise fees, and these expenses do not decrease even if the revenues at our hotels decrease. Our hotel operating expenses consist of room expenses, other direct expenses, other indirect expenses and other expenses. Room expenses include wages, cleaning and guestroom supplies and complimentary breakfast. Other direct expenses include office supplies, utilities, telephone, advertising and bad debts. Other indirect expenses include real and personal property taxes, insurance, travel agent and credit card commissions, management expenses and franchise fees. Other expenses include ground rent and other items of miscellaneous expense.
Historically, our predecessor segregated its operating expenses (direct hotel operations expense, other hotel operating expense, general, selling and administrative expense and repairs and maintenance) from its other operating expenses, such as depreciation and amortization and impairment losses. Following completion of this offering, we intend to reclassify our operating expenses into categories of hotel operating expenses (room expenses, other direct expenses, other indirect expenses and other expenses) to increase the comparability of our hotel operating expenses and our hotel operating results with other publicly traded hospitality REITs. Accordingly, historical balances included in our predecessor’s:
| § | direct hotel operations expense related to (1) wages, payroll taxes and benefits, linens, cleaning and guestroom supplies and complimentary breakfast will be reclassified to rooms expense in our consolidated statements of operations and (2) franchise fees will be reclassified to other indirect expense in our consolidated statements of operations; | |
| § | other hotel operating expenses related to (1) utilities and telephone will be reclassified to other direct expenses in our consolidated statements of operations and (2) real and personal property taxes, insurance and cable will be reclassified to other indirect expenses in our consolidated statements of operations; | |
| § | general, selling and administrative expenses related to (1) office supplies, advertising, miscellaneous operating expenses and bad debt expense will be reclassified to other direct expenses in our consolidated statements of operations, (2) credit card/travel agent commissions, management company expenses, management company legal and accounting fees and franchise fees will be reclassified to other indirect expenses in our consolidated statements of operations, (3) hotel development and startup costs will be reclassified to hotel property acquisition costs in our consolidated statements of operations and (4) ground rent and other miscellaneous expenses will be reclassified to other expenses in our consolidated statements of operations; and | |
| § | repairs and maintenance will be reclassified to other direct expenses in our consolidated statements of operations. |
On a pro forma basis, the reclassification reduces total hotel operating expenses (direct hotel operations expense, other hotel operating expense, general, selling and administrative expense and repairs and maintenance) by $130,000 for the nine months ended September 30, 2010 and $1.4 million for the year ended December 31, 2009, which were reclassified to hotel property acquisition costs. The reclassification does not impact amounts reported by our predecessor as total expenses (total hotel operating expenses, depreciation and amortization and loss on impairment of assets), income from operations, total other income, income (loss) from continuing operations, income (loss) from discontinued operations, net income (loss) before income taxes or net income (loss). See “Unaudited Pro Forma Condensed Consolidated Financial Statements” appearing elsewhere in this prospectus for additional information.
Reflecting the changes in the management agreements effective upon transfer of the management agreements for our initial 65 hotels from The Summit Group to Interstate, on a pro forma basis, management expenses for the year ended December 31, 2009 would have increased from $3.0 million to $3.6 million. Also, we expect that our accounting expenses, on a pro forma basis, would have increased from $589,000 to $1.1 million. Additionally, we expect that our management expenses and accounting expenses, on a pro forma basis, for the nine months ended September 30, 2010 would have increased from $2.4 million to $3.1 million and $480,000 to $850,000, respectively. We increased the corporate general and administrative expenses in our pro forma financial statements compared to our predecessor’s historical financial statements by $4.3 million for the nine months ended September 30, 2010 and $5.8 million for the year ended December 31, 2009. This adjustment is due to expenses we will incur related to changes in our management structure,
53
including compensating our executives and other employees directly rather than indirectly through profits distributed by our predecessor to The Summit Group.
Industry Trends and Outlook
In mid-2008, U.S. lodging demand started to decline as a result of the economic recession which caused industry-wide RevPAR to decline for the year, as reported by Smith Travel Research. Throughout 2009, the decrease in lodging demand accelerated, with RevPAR down 16.7% for the year according to Smith Travel Research. Beginning in the first quarter of 2010, we saw trends of improved fundamentals in the U.S. lodging industry with demand for rooms showing signs of stabilization, and even growth in many of the major markets, as general economic indicators began to experience positive improvement. With supply of available rooms expected to rise at a significantly slower pace over the next several years than during 2006-2008 and demand for rooms expected to increase as the U.S. economy rebounds, we expect meaningful growth in RevPAR to start in 2011 and to continue for several years thereafter.
While we believe the trends in room demand and supply growth will result in improvement in lodging industry fundamentals, we can provide no assurances that the U.S. economy will strengthen at projected levels and within the expected time periods. If the economy does not improve or if any improvements do not continue for any number of reasons, including, among others, an economic slowdown and other events outside of our control, such as terrorism, lodging industry fundamentals may not improve as expected. In the past, similar events have adversely affected the lodging industry and if these events recur, they may adversely affect the lodging industry in the future.
Key Operating Metrics
We use a variety of operating and other information to evaluate the financial condition and operating performance of our business. These key indicators include financial information that is prepared in accordance with GAAP, as well as other financial information that is not prepared in accordance with GAAP. In addition, we use other information that may not be financial in nature, including statistical information and comparative data. We use this information to measure the performance of individual hotels, groups of hotels and/or our business as a whole. We periodically compare historical information to our internal budgets as well as industry-wide information. These key indicators include:
| § | Occupancy; |
| § | ADR; and |
| § | RevPAR. |
Occupancy, ADR and RevPAR are commonly used measures within the hotel industry to evaluate operating performance. RevPAR, which is calculated as the product of ADR and occupancy, is an important statistic for monitoring operating performance at the individual hotel level and across our business as a whole. We evaluate individual hotel RevPAR performance on an absolute basis with comparisons to budget and prior periods, as well as on a company-wide and regional basis. ADR and RevPAR include only room revenue. Room revenue depends on demand, as measured by occupancy, pricing, as measured by ADR, and our available supply of hotel rooms. Our ADR, occupancy and RevPAR performance may be impacted by macroeconomic factors such as regional and local employment growth, personal income and corporate earnings, office vacancy rates and business relocation decisions, airport and other business and leisure travel, new hotel construction and the pricing strategies of competitors. In addition, our ADR, occupancy and RevPAR performance is dependent on the continued success of our franchisors and their brands.
In addition to occupancy, ADR and RevPAR, we use FFO and EBITDA, non-GAAP financial measures, to assess our financial condition and operating performance. These measures should not be considered in isolation or as a substitute for measures of performance in accordance with GAAP. FFO and EBITDA are supplemental financial measures and are not defined by GAAP. FFO and EBITDA, as calculated by us, may not be comparable to FFO and EBITDA reported by other companies that do not define FFO and EBITDA exactly as we define those terms. FFO and EBITDA do not represent cash generated from operating activities determined in accordance with GAAP and should not be considered as alternatives to operating income or net income determined in accordance with GAAP, as indicators of performance or as alternatives to cash flows from operating activities as indicators of liquidity.
54
See “Summary—Summary Pro Forma Financial Information” and “Selected Financial and Operating Data” for further discussion of our use of FFO and EBITDA and reconciliations of those non-GAAP financial measures to the most comparable GAAP financial measure, net income (loss).
Our Portfolio
Following completion of this offering and the formation transactions, our initial portfolio will consist of 65 upscale and midscale without food and beverage hotels with a total of 6,533 guestrooms located in 19 states. Our initial hotels, with the exception of one independent hotel, will be operated under nationally recognized brands as shown below:
Franchisor/Brand | No. of Hotels | No. of Rooms | ||||||
Marriott | ||||||||
| Courtyard by Marriott | 6 | 715 | ||||||
| Residence Inn | 4 | 411 | ||||||
| Fairfield Inn | 9 | 787 | ||||||
| Fairfield Inn & Suites | 1 | 80 | ||||||
| SpringHill Suites | 7 | 671 | ||||||
| TownePlace Suites | 1 | 90 | ||||||
| 28 | 2,754 | |||||||
Hilton | ||||||||
| Hampton Inn | 8 | 821 | ||||||
| Hampton Inn & Suites | 3 | 390 | ||||||
| Hilton Garden Inn | 1 | 120 | ||||||
| 12 | 1,331 | |||||||
IHG | ||||||||
| Holiday Inn Express | 2 | 182 | ||||||
| Holiday Inn Express & Suites | 4 | 365 | ||||||
| Staybridge Suites | 1 | 92 | ||||||
| 7 | 639 | |||||||
Hyatt | ||||||||
| Hyatt Place | 4 | 556 | ||||||
Choice | ||||||||
Cambria Suites® | 4 | 485 | ||||||
Comfort Inn® | 3 | 201 | ||||||
Comfort Inn & Suites® | 1 | 111 | ||||||
Comfort Suites® | 3 | 199 | ||||||
| 11 | 996 | |||||||
Starwood | ||||||||
| Aloft | 1 | 136 | ||||||
Carlson | ||||||||
Country Inn & Suites By Carlson® | 1 | 64 | ||||||
Independent | ||||||||
| Aspen Hotel & Suites | 1 | 57 | ||||||
Total | 65 | 6,533 | ||||||
55
Our initial portfolio consists of what we consider “seasoned” and “unseasoned” hotels. We view 46 of our hotels as seasoned based on their construction date. We consider 19 of our hotels to be unseasoned. Our unseasoned hotels were either built after January 1, 2007 or experienced a brand conversion since January 1, 2008. We believe our unseasoned hotels are in the early stages of stabilizing since their construction or brand conversion occurred during a dramatic economic slowdown. Most of our unseasoned hotels are newer, larger and are located in larger markets than those of our seasoned hotels and operate under premium franchise brands. As a result, we believe our unseasoned hotels are particularly well-positioned to generate RevPAR growth for our portfolio as economic conditions improve.
The following table sets forth various statistical and operating information related to our seasoned hotel portfolio (dollars in thousands, except ADR and RevPAR):
| Nine Months Ended September 30, | Year Ended December 31, | |||||||||||||||||||
| 2010 | 2009 | 2009 | 2008 | 2007 | ||||||||||||||||
| Number of hotels at end of period | 46 | 46 | 46 | 45 | 45 | |||||||||||||||
| Average number of rooms | 4,173 | 4,173 | 4,173 | 4,093 | 4,012 | |||||||||||||||
| Undepreciated (gross) book value at end of period | $ | 295,159 | $ | 293,316 | $ | 283,985 | $ | 276,148 | $ | 268,974 | ||||||||||
| Revenues | $ | 67,431 | $ | 68,276 | $ | 87,542 | $ | 105,542 | $ | 103,871 | ||||||||||
| Occupancy | 66.4% | 66.7% | 64.8% | 69.5% | 70.0% | |||||||||||||||
| ADR | $ | 87.97 | $ | 88.55 | $ | 87.42 | $ | 100.29 | $ | 99.78 | ||||||||||
| RevPAR | $ | 58.41 | $ | 59.04 | $ | 56.63 | $ | 69.70 | $ | 69.80 | ||||||||||
The following table sets forth various statistical and operating information related to our unseasoned hotel portfolio (dollars in thousands, except ADR and RevPAR):
| �� | ||||||||||||||||||||
| Nine Months Ended September 30, | Year Ended December 31, | |||||||||||||||||||
| 2010 | 2009 | 2009 | 2008 | 2007 | ||||||||||||||||
| Number of hotels at end of period | 19 | 17 | 19 | 14 | 11 | |||||||||||||||
| Average number of rooms | 2,360 | 1,706 | 2,360 | 1,324 | 625 | |||||||||||||||
| Undepreciated (gross) book value at end of period | $ | 266,161 | $ | 227,851 | $ | 265,333 | $ | 163,232 | $ | 125,529 | ||||||||||
| Revenues | $ | 37,382 | $ | 24,528 | $ | 33,658 | $ | 29,565 | $ | 10,018 | ||||||||||
| Occupancy | 64.3% | 57.9% | 55.3% | 55.3% | 49.2% | |||||||||||||||
| ADR | $ | 87.70 | $ | 88.44 | $ | 87.58 | $ | 107.37 | $ | 87.58 | ||||||||||
| RevPAR | $ | 56.38 | $ | 51.16 | $ | 48.47 | $ | 59.33 | $ | 43.09 | ||||||||||
Results of Operations of Summit Hotel Properties, Inc.
We have not presented historical financial information for Summit Hotel Properties, Inc., because it has not had any corporate activity since its formation other than the issuance of 1,000 shares of common stock to our Executive Chairman in connection with its formation and initial capitalization and activity in connection with this offering and the formation transactions and, as a result, we believe that a discussion of the results of Summit Hotel Properties, Inc. would not be meaningful. We have set forth below a discussion of the consolidated historical results of operations and financial position of our predecessor, Summit Hotel Properties, LLC, which is merging with and into our operating partnership upon completion of this offering. Following completion of this offering, the concurrent private placement and the formation transactions, our predecessor’s historical consolidated financial statements will become our consolidated financial statements as our predecessor will be considered the acquirer in the merger for accounting purposes.
Results of Operations of Our Predecessor
Comparison of the Nine Months Ended September 30, 2010 to the Nine Months Ended September 30, 2009
Income from Operations. Income from operations increased by $10.5 million, or 438%, to $12.9 million for the nine months ended September 30, 2010 from $2.4 million for the nine months ended September 30, 2009. This increase was primarily due to the increased revenue from six new hotels opened in late 2009. There was also a $6.5 impairment loss in 2009 that did not recur in 2010.
56
Revenues. The following table sets forth key operating metrics for our total portfolio, our seasoned hotel portfolio, our unseasoned hotel portfolio and our same-store portfolio for the nine months ended September 30, 2010 and 2009 (dollars in thousands, except ADR and RevPAR):
| Nine Months Ended September 30, 2010 | Nine Months Ended September 30, 2009 | |||||||||||||||||||||||||||||||||||||||
| Revenue | Expense | Occupancy | ADR | RevPAR | Revenue | Expense | Occupancy | ADR | RevPAR | |||||||||||||||||||||||||||||||
Total (65 and 63 hotels, respectively)(1) | $ | 104,813 | $ | 91,941 | 65.6 | % | $ | 87.88 | $ | 57.68 | $ | 92,804 | $ | 90,380 | 64.1 | % | $ | 88.42 | $ | 56.71 | ||||||||||||||||||||
Seasoned (46 hotels)(2) | $ | 67,431 | $ | 53,461 | 66.4 | % | $ | 87.97 | $ | 58.41 | $ | 68,276 | $ | 55,031 | 66.7 | % | $ | 88.55 | $ | 59.04 | ||||||||||||||||||||
Unseasoned (19 and 17 hotels, respectively)(2) | $ | 37,382 | $ | 38,480 | 64.3 | % | $ | 87.70 | $ | 56.38 | $ | 24,528 | $ | 35,349 | 57.9 | % | $ | 88.44 | $ | 51.16 | ||||||||||||||||||||
Same-store (60 hotels)(3) | $ | 94,735 | $ | 79,757 | 66.1 | % | $ | 88.53 | $ | 58.55 | $ | 92,212 | $ | 82,397 | 64.5 | % | $ | 88.52 | $ | 57.10 | ||||||||||||||||||||
| (1) | Includes revenues from discontinued operations. | |
| (2) | Excludes hotels that were reclassified to discontinued operations during either period. | |
| (3) | Includes seasoned and unseasoned hotels that were owned during both periods presented for the full periods presented, but excludes hotels that were reclassified to discontinued operations during either period. |
On a total portfolio basis, revenues increased by $12.0 million, or 12.9%, from $92.8 million for the nine months ended September 30, 2009 to $104.8 million for the nine months ended September 30, 2010. The increase was primarily due to the opening of six new hotels during the third and fourth quarters of 2009. As a result, we do not believe that a comparison of our total portfolio revenue for the periods presented is meaningful.
Seasoned hotel revenues decreased by $0.9 million, or 1.3%, to $67.4 million for the nine months ended September 30, 2010 from $68.3 million for the nine months ended September 30, 2009. The decrease in seasoned hotel revenue was primarily caused by a 1.1% decrease in seasoned hotel RevPAR. Seasoned hotel RevPAR decreased to $58.41 for the six months ended September 30, 2010 from $59.04 for the prior period as a result of adverse economic conditions, which caused lower occupancy and also caused us to lower room rates at our hotels in order to remain competitive in our markets.
Unseasoned hotel revenues increased by $12.9 million, or 52.7%, to $37.4 million for the nine months ended September 30, 2010 from $24.5 million for the nine months ended September 30, 2009. The increase in unseasoned hotel revenue was primarily due to revenues from the six new hotels opened during the third and fourth quarters of 2009.
In order to compare operating results of our total portfolio on a period-to-period basis, we also view our results on a same-store basis. Our same-store hotels include seasoned and unseasoned hotels that were owned throughout the comparable periods, but exclude hotels that were classified to discontinued operations during either period. We believe our same-store analysis enhances our understanding of our results by eliminating the effects of purchases and sales of hotels during comparable periods and focusing on the operating results of our core hotels. On a same-store basis, revenues increased by $2.5 million, or 2.7%, to $94.7 million for the nine months ended September 30, 2010 from $92.2 million for the nine months ended September 30, 2009.
Operating Expenses. Total operating expenses from continuing operations, excluding depreciation and amortization and impairment losses, increased by $4.7 million, or 7.0%, to $71.6 million for the nine months ended September 30, 2010 from $66.9 million for the prior period as a result of operating expenses for the six new hotels opened in the third and fourth quarters of 2009. Of this increase, direct hotel operations expense increased by 12.7% to $35.4 million for the nine months ended September 30, 2010 from $31.4 million for the prior period. The increased operating expenses were in direct relationship to the $12.0 million dollar increase in revenues from the six new hotels opened during the third and fourth quarters of 2009. Hotel renovations during early 2009 caused repairs and maintenance for the nine-month period ended September 30, 2009 to be $1.6 million higher than repairs and maintenance in the first nine months of 2010.
Depreciation and Amortization. Total depreciation and amortization expense from continuing operations increased by $3.3 million, or 19.4%, from $17.0 million for the nine months ended September 30, 2009 to $20.3 million for the nine months ended September 30, 2010. This increase was primarily due to the six new hotels opened during the third and fourth quarters of 2009.
Impairment Losses. During the nine months ended September 30, 2009, our predecessor determined that six parcels of undeveloped land, which were held for sale, were impaired due to the fact that their aggregate historical carrying value exceeded their aggregate fair value. As a result, our predecessor recorded a $6.5 million non-cash impairment charge for the nine months ended September 30, 2009.
57
The following table details our hotel expenses for our seasoned hotel portfolio, our unseasoned hotel portfolio and our same-store portfolio for the nine months ended September 30, 2010 and September 30, 2009 (dollars in thousands):
| Nine Months Ended | Nine Months Ended | |||||||
| September 30, 2010 | September 30, 2009 | |||||||
Seasoned Hotel Expenses (46 hotels): | ||||||||
| Direct hotel operations | $ | 22,328 | $ | 22,301 | ||||
| Other hotel operating expenses | 8,482 | 8,440 | ||||||
| General, selling and administrative | 11,992 | 12,040 | ||||||
| Repairs and maintenance | 2,246 | 3,332 | ||||||
| Depreciation and amortization | 8,413 | 8,918 | ||||||
| Loss on impairment of assets | — | — | ||||||
Total Expenses | $ | 53,461 | $ | 55,031 | ||||
Unseasoned Hotel Expenses (19 and 14 hotels, respectively): | ||||||||
| Direct hotel operations | $ | 13,023 | $ | 9,114 | ||||
| Other hotel operating expenses | 5,574 | 4,124 | ||||||
| General, selling and administrative | 6,818 | 5,822 | ||||||
| Repairs and maintenance | 1,150 | 1,717 | ||||||
| Depreciation and amortization | 11,915 | 8,067 | ||||||
| Loss on impairment of assets | — | 6,505 | ||||||
Total Expenses | $ | 38,480 | $ | 35,349 | ||||
Same-Store Portfolio Expenses (60 hotels): | ||||||||
| Direct hotel operations | $ | 31,769 | $ | 31,239 | ||||
| Other hotel operating expenses | 12,643 | 12,487 | ||||||
| General, selling and administrative | 16,886 | 16,673 | ||||||
| Repairs and maintenance | 3,147 | 5,013 | ||||||
| Depreciation and amortization | 15,312 | 16,985 | ||||||
| Loss on impairment of assets | — | — | ||||||
Total Expenses | $ | 79,757 | $ | 82,397 | ||||
Comparison of the Year Ended December 31, 2009 to the Year Ended December 31, 2008
Income from Operations. Income from operations decreased by $20.7 million, or 98%, to $0.5 million for the year ended December 31, 2009 from $21.2 million for the year ended December 31, 2008. This decrease was primarily the result of a $13.9 million decrease in revenues as well as an impairment loss of $7.5 million recognized for the year ended December 31, 2009.
Revenues. The following table sets forth key operating metrics for our total portfolio, our seasoned portfolio, our unseasoned portfolio and our same-store portfolio for the year ended December 31, 2009 and the year ended December 31, 2008 (dollars in thousands, except ADR and RevPAR):
| Year Ended December 31, 2009 | Year Ended December 31, 2008 | |||||||||||||||||||||||||||||||||||||||
| Total | Total | Total | Total | |||||||||||||||||||||||||||||||||||||
| Revenues | Expenses | Occupancy | ADR | RevPAR | Revenues | Expenses | Occupancy | ADR | RevPAR | |||||||||||||||||||||||||||||||
Total (65 and 62 hotels, respectively)(1) | $ | 122,333 | $ | 120,704 | 61.9 | % | $ | 87.40 | $ | 54.12 | $ | 141,933 | $ | 113,876 | 66.2 | % | $ | 100.95 | $ | 66.78 | ||||||||||||||||||||
Seasoned (46 and 45 hotels, respectively)(2) | $ | 87,542 | $ | 73,553 | 64.8 | % | $ | 87.42 | $ | 56.63 | $ | 105,542 | $ | 79,540 | 69.5 | % | $ | 100.29 | $ | 69.70 | ||||||||||||||||||||
Unseasoned (19 and 14 hotels, respectively)(2) | $ | 33,657 | $ | 47,151 | 55.3 | % | $ | 87.58 | $ | 48.47 | $ | 29,565 | $ | 34,336 | 55.3 | % | $ | 107.37 | $ | 59.33 | ||||||||||||||||||||
Same-store (57 hotels)(3) | $ | 112,129 | $ | 99,020 | 63.7 | % | $ | 88.13 | $ | 56.13 | $ | 134,934 | $ | 110,898 | 66.3 | % | $ | 101.82 | $ | 67.47 | ||||||||||||||||||||
| (1) | Includes revenues from discontinued operations. | |
| (2) | Excludes hotels that were reclassified to discontinued operations during either period. | |
| (3) | Includes seasoned and unseasoned hotels that were owned during both periods presented for the full periods presented, but excludes hotels that were reclassified to discontinued operations during either period. |
Total revenues decreased by $19.6 million, or 13.8%, to $122.3 million for the year ended December 31, 2009 from $141.9 million for the year ended December 31, 2008. The decrease was primarily due to continuing unfavorable economic
58
conditions affecting our markets and included a $5.7 million decrease in revenues as a result of the sale of seven hotels (discontinued operations) during 2008 and 2009 offset by increases in revenues from nine new hotels opened during 2008 and 2009.
Seasoned hotel revenues decreased by $18.0 million, or 17.1%, to $87.5 million for the year ended December 31, 2009 from $105.5 million for the year ended December 31, 2008. The decrease in seasoned hotel revenue was primarily caused by a 18.8% decrease in seasoned hotel RevPAR. Seasoned hotel RevPAR decreased to $56.63 for the year ended December 31, 2009 from $69.70 for the prior year as a result of adverse economic conditions, which caused lower occupancy and also caused us to lower room rates at our hotels in order to remain competitive in our markets.
Unseasoned hotel revenues increased by $4.1 million, or 13.8%, to $33.7 million for the year ended December 31, 2009 from $29.6 million for the year ended December 31, 2008. The increase in unseasoned hotel revenue was primarily due to revenues from nine new hotels opened during 2008 and 2009.
On a same-store basis, revenues decreased by $22.8 million, or 16.9%, to $112.1 million for the year ended December 31, 2009 from $134.9 million for the year ended December 31, 2008. The decrease in same-store revenue was primarily caused by a 16.8% decrease in same-store RevPAR. Same-store RevPAR decreased to $56.13 for the year ended December 31, 2009 from $67.47 for the prior period as a result of adverse economic conditions, which caused lower occupancy and also caused us to lower room rates at our hotels in order to remain competitive in our markets.
Operating Expenses. Total operating expenses from continuing operations, excluding depreciation and amortization and impairment losses, decreased $2.3 million, or 2.5%, to $89.2 million for the year ended December 31, 2009 from $91.5 million for the year ended December 31, 2008. Repairs and maintenance expenses decreased $1.8 million, or 23.2%, to $6.2 million for the year ended December 31, 2009 from $8.0 million for the year ended December 31, 2008. The decrease was primarily due to fewer renovations being performed during 2009 than in 2008 at our hotels. The decrease in total expenses of 2.6% was not as significant as the decrease in total revenues of 13.8% due to the increased operating expenses related to opening of new hotels. Typically, operating profit margin is not significant for newly opened hotels until they become established in the market.
Depreciation and Amortization. On a total portfolio basis, depreciation and amortization expense from continuing operations increased by $1.7 million, or 7.6%, to $24.0 million for the year ended December 31, 2009 from $22.3 million for the year ended December 31, 2008. The increase was primarily due to the nine hotels opened in 2008 and 2009.
Impairment Losses. During the year ended December 31, 2009, our predecessor determined that six parcels of undeveloped land were impaired due to the fact that their aggregate historical carrying value exceeded their aggregate fair value. As a result, our predecessor recorded a $6.3 million non-cash impairment charge for the year ended December 31, 2009. Our predecessor also determined that the Courtyard by Marriott located in Memphis, Tennessee was impaired due to the fact that its historical carrying value was higher than the hotel’s fair value. This determination was made based on recent economic distress on this particular hotel and market. Accordingly, our predecessor recorded a $1.2 million non-cash impairment charge in 2009. Our predecessor did not record any impairment charges during the year ended December 31, 2008.
The following table details our hotel expenses for our seasoned portfolio, our unseasoned portfolio and our same-store portfolio for years ended December 31, 2009 and December 31, 2008 (dollars in thousands):
| Year Ended | Year Ended | |||||||
| December 31, 2009 | December 31, 2008 | |||||||
Seasoned Hotel Expenses (46 and 45 hotels, respectively): | ||||||||
| Direct hotel operations | $ | 29,272 | $ | 32,182 | ||||
| Other hotel operating expenses | 11,205 | 11,002 | ||||||
| General, selling and administrative | 15,870 | 19,091 | ||||||
| Repairs and maintenance | 4,083 | 4,342 | ||||||
| Depreciation and amortization | 11,950 | 12,923 | ||||||
| Loss on impairment of assets | 1,173 | – | ||||||
Total Expenses | $ | 73,553 | $ | 79,540 | ||||
59
| Year Ended | Year Ended | |||||||
| December 31, 2009 | December 31, 2008 | |||||||
Unseasoned Hotel Expenses (19 and 14 hotels, respectively): | ||||||||
| Direct hotel operations | $ | 12,799 | $ | 10,199 | ||||
| Other hotel operating expenses | 5,782 | 4,184 | ||||||
| General, selling and administrative | 8,147 | 6,902 | ||||||
| Repairs and maintenance | 2,069 | 3,667 | ||||||
| Depreciation and amortization | 12,021 | 9,384 | ||||||
| Loss on impairment of assets | 6,333 | – | ||||||
Total Expenses | $ | 47,151 | $ | 34,336 | ||||
Same-Store Portfolio Expenses (57 hotels): | ||||||||
| Direct hotel operations | $ | 37,867 | $ | 42,136 | ||||
| Other hotel operating expenses | 15,359 | 15,132 | ||||||
| General, selling and administrative | 20,414 | 24,328 | ||||||
| Repairs and maintenance | 4,849 | 7,970 | ||||||
| Depreciation and amortization | 19,358 | 21,332 | ||||||
| Loss on impairment of assets | 1,173 | – | ||||||
Total Expenses | $ | 99,020 | $ | 110,898 | ||||
Comparison of the Year Ended December 31, 2008 to the Year Ended December 31, 2007
Income from Operations. Our predecessor’s income from operations increased by $2.9 million, or 15.8%, to $21.2 million for the year ended December 31, 2008 from $18.3 million for the year ended December 31, 2007. The increase was primarily due to a 5% increase in ADR from $96.20 for the year ended December 31, 2007 to $100.95 for the year ended December 31, 2008.
Revenues. The following table sets forth key operating metrics for our total portfolio, our seasoned portfolio, our unseasoned portfolio and our same-store portfolio for the year ended December 31, 2008 and the year ended December 31, 2007 (dollars in thousands, except ADR and RevPAR):
| Year Ended December 31, 2008 | Year Ended December 31, 2007 | |||||||||||||||||||||||||||||||||||||||
| Total | Total | Total | Total | |||||||||||||||||||||||||||||||||||||
| Revenues | Expenses | Occupancy | ADR | RevPAR | Revenues | Expenses | Occupancy | ADR | RevPAR | |||||||||||||||||||||||||||||||
Total (62 and 64 hotels, respectively)(1) | $ | 141,933 | $ | 113,876 | 66.2 | % | $ | 100.95 | $ | 66.78 | $ | 134,748 | $ | 95,551 | 66.9 | % | $ | 96.20 | $ | 64.37 | ||||||||||||||||||||
Seasoned (45 hotels)(2) | $ | 105,542 | $ | 79,540 | 69.5 | % | $ | 100.29 | $ | 69.70 | $ | 103,871 | $ | 80,049 | 70.0 | % | $ | 99.78 | $ | 69.80 | ||||||||||||||||||||
Unseasoned (14 and 11 hotels, respectively)(2) | $ | 29,565 | $ | 34,336 | 55.3 | % | $ | 107.37 | $ | 59.33 | $ | 10,018 | $ | 15,502 | 49.2 | % | $ | 87.58 | $ | 43.09 | ||||||||||||||||||||
Same-store (47 hotels)(3) | $ | 107,840 | $ | 81,889 | 68.7 | % | $ | 100.69 | $ | 69.20 | $ | 107,819 | $ | 86,105 | 69.8 | % | $ | 99.08 | $ | 69.18 | ||||||||||||||||||||
| (1) | Includes revenues from discontinued operations. | |
| (2) | Excludes hotels that were reclassified to discontinued operations during either period. | |
| (3) | Includes seasoned and unseasoned hotels that were owned during both periods presented for the full periods presented, but excludes hotels that were reclassified to discontinued operations during either period. |
Total revenues increased by $7.2 million, or 5.3%, to $141.9 million for the year ended December 31, 2008 from $134.7 million for the year ended December 31, 2007, reflecting the addition of 13 new hotels opened in 2007 and 2008 which more than offset the decline in revenues from the sale of 11 hotels in 2007 and 2008. The increase also reflected a 5% increase in ADR from $96.20 in 2007 to $100.95 in 2008 and the addition of 13 new hotels in 2007 and 2008.
Seasoned hotel revenues increased by $1.7 million, or 1.6%, to $105.5 million for the year ended December 31, 2008 from $103.9 million for the year ended December 31, 2007. The increase in seasoned hotel revenue was primarily caused by a 0.5% increase in seasoned hotel ADR. Seasoned hotel ADR increased to $100.29 for the year ended December 31, 2008 from $99.78 for the prior period.
60
Unseasoned hotel revenues increased by $19.5 million, or 195%, to $29.6 million for the year ended December 31, 2008 from $10.0 million for the year ended December 31, 2007. The increase in unseasoned hotel revenue was primarily due to 13 new hotels opened during 2007 and 2008.
On a same-store basis, revenues remained steady at $107.8 million for the years ended December 31, 2008 and 2007.
Operating Expenses. Total operating expenses from continuing operations, excluding depreciation and amortization, increased $12.2 million, or 15.4%, to $91.6 million for the year ended December 31, 2008 from $79.4 million for the year ended December 31, 2007. The increase was primarily due to increased franchise fees and direct hotel operations expense, including room expenses. Direct hotel operations expense increased by $7.4 million, or 21.1%, to $42.4 million for the year ended December 31, 2008 from $35.0 million for the year ended December 31, 2007. The increase was primarily due to 13 additional hotels opened in 2007 and 2008. For the year ended December 31, 2008, our predecessor made $8.0 million of capital improvements compared to $10.4 million in the prior year. Total expenses, excluding depreciation and repairs and maintenance, remained relatively flat as a percentage of revenue at 61.8% for 2008 and 60.6% for 2007.
Depreciation and Amortization. Depreciation and amortization expense from continuing operations increased by $6.2 million, or 38.2%, to $22.3 million for the year ended December 31, 2008 from $16.1 million for the year ended December 31, 2007. The increase in depreciation and amortization was primarily due to 13 new hotels opened in 2007 and 2008.
The following table details our hotel expenses for our seasoned portfolio, our unseasoned portfolio and our same-store portfolio for years ended December 31, 2008 and December 31, 2007 (dollars in thousands):
| Year Ended | Year Ended | |||||||
| December 31, 2008 | December 31, 2007 | |||||||
Seasoned Hotel Expenses (45 hotels): | ||||||||
| Direct hotel operations | $ | 32,182 | $ | 30,655 | ||||
| Other hotel operating expenses | 11,002 | 10,159 | ||||||
| General, selling and administrative | 19,091 | 18,389 | ||||||
| Repairs and maintenance | 4,342 | 7,978 | ||||||
| Depreciation and amortization | 12,923 | 12,868 | ||||||
| Loss on impairment of assets | – | – | ||||||
Total Expenses | $ | 79,540 | $ | 80,049 | ||||
Unseasoned Hotel Expenses (14 and 11 hotels, respectively): | ||||||||
| Direct hotel operations | $ | 10,199 | $ | 4,366 | ||||
| Other hotel operating expenses | 4,184 | 1,821 | ||||||
| General, selling and administrative | 6,902 | 3,620 | ||||||
| Repairs and maintenance | 3,667 | 2,427 | ||||||
| Depreciation and amortization | 9,384 | 3,268 | ||||||
| Loss on impairment of assets | – | – | ||||||
Total Expenses | $ | 34,336 | $ | 15,502 | ||||
61
| Year Ended | Year Ended | |||||||
| December 31, 2008 | December 31, 2007 | |||||||
Same-Store Portfolio Expenses (47 hotels): | ||||||||
| Direct hotel operations | $ | 33,066 | $ | 32,120 | ||||
| Other hotel operating expenses | 11,327 | 10,701 | ||||||
| General, selling and administrative | 19,597 | 19,059 | ||||||
| Repairs and maintenance | 4,654 | 9,814 | ||||||
| Depreciation and amortization | 13,245 | 14,411 | ||||||
| Loss on impairment of assets | – | – | ||||||
Total Expenses | $ | 81,889 | $ | 86,105 | ||||
Liquidity and Capital Resources
Our short-term liquidity requirements will consist primarily of operating expenses and other expenditures directly associated with our hotel properties, including recurring maintenance and capital expenditures necessary to maintain our hotel properties in accordance with brand standards, capital expenditures to improve our hotel properties, interest expense and scheduled principal payments on outstanding indebtedness and distributions to our stockholders.
In connection with the formation transactions, our predecessor entered into a merger agreement with our operating partnership that requires our predecessor to, among other things, pay accrued and unpaid priority returns on its Class A and Class A-1 membership interests through August 31, 2010 and through the closing date of this offering, subject to the availability of cash and certain other limitations. Through August 31, 2010, the aggregate amount of accrued and unpaid priority returns on our predecessor’s Class A and Class A-1 membership interests was approximately $8.3 million. Based on our current estimates of future cash flows, our predecessor may not have available cash to pay priority returns that accrue after August 31, 2010. For the period of September 1, 2010 through November 15, 2010, the aggregate amount of accrued and unpaid priority returns was approximately $3.3 million. Payment of these returns will reduce our predecessor’s available cash upon completion of this offering.
We expect to satisfy these short-term liquidity requirements through working capital, cash provided by operations and short-term borrowings under an anticipated secured revolving credit facility that we intend to enter into at or shortly after completion of this offering. After giving effect to the formation transactions and the use of proceeds of this offering, we believe that our working capital and cash provided by operations will be sufficient to meet our ongoing short-term liquidity requirements for at least the next 12 months.
Our long-term liquidity requirements consist primarily of the costs of acquiring additional hotel properties, renovations, and other non-recurring capital expenditures that need to be made periodically with respect to our hotel properties and scheduled debt payments. We will seek to satisfy these long-term liquidity requirements through various sources of capital, including working capital, cash provided by operations, long-term hotel mortgage indebtedness and other borrowings, including borrowings under an anticipated secured revolving credit facility that we intend to enter into at or shortly after completion of this offering. In addition, we may seek to raise capital through public or private offerings of our equity or debt securities. However, certain factors may have a material adverse effect on our ability to access these capital sources, including our degree of leverage, the value of our unencumbered hotel properties and borrowing restrictions imposed by lenders. We will continue to analyze which source of capital is most advantageous to us at any particular point in time, but financing may not be consistently available to us on terms that are attractive, or at all.
To satisfy the requirements for qualification as a REIT, we must meet a number of organizational and operational requirements, including a requirement that we distribute annually at least 90% of our REIT taxable income to our stockholders, determined without regard to the deduction for dividends paid and excluding any net capital gain. Therefore, once the total net proceeds of this offering and the concurrent private placement have been invested, we will need to raise additional capital in order to grow our business and invest in additional hotel properties. However, there is no assurance that we will be able to borrow funds or raise additional equity capital on terms acceptable to us, if at all. We anticipate that any debt we incur in the future will include restrictions (including lockbox and cash management provisions) that under certain circumstances will limit or prohibit our operating partnership and its subsidiaries from making distributions or paying
62
dividends, repaying loans or transferring assets. For additional information regarding our distribution policies and requirements, see “Distribution Policy.”
Our Anticipated Secured Revolving Credit Facility
The following is a summary of the indicative terms and conditions for an anticipated secured revolving credit facility that we intend to enter into at or shortly after completion of this offering. These terms and conditions reflect the current perception of market conditions by the lead arranger as they relate to the proposed credit facility and are subject to change. At this time, neither the lead arranger nor any of its affiliates has a legally binding commitment to provide the anticipated secured revolving credit facility to us based on the indicative terms and conditions described below or at all.
We intend to enter into a $ million, three-year (with an option to extend for one additional year if we meet certain requirements) senior secured revolving credit facility with , as administrative agent, , in its capacity as the lead arranger, and a syndicate of lenders including . Our operating partnership will be the borrower under the secured revolving credit facility. The secured revolving credit facility will be guaranteed by us and certain of our existing and future subsidiaries that own or lease a “borrowing base property.” The secured revolving credit facility will be secured by first priority mortgage liens on each borrowing base property and a first priority pledge of our equity interests in the subsidiaries that hold, and Summit TRS II, which will wholly own the TRS lessees that will lease, each of at least 15 borrowing base properties.
Outstanding borrowings on the secured revolving credit facility will be limited to the least of (1) $ million, (2) 55% of the value of the borrowing base properties and (3) the aggregate adjusted net operating income of the borrowing base properties securing the facility divided by 150% of the monthly factor shown on a standard level constant payment table for a fully amortizing 25-year loan based on an assumed interest rate equal to the greatest of (x) the ten-year U.S. Treasury rate plus 3.5%, (y) 7.00% and (z) the weighted-average interest rate then applicable to advances outstanding under the secured revolving credit facility. The initial availability of the secured revolving credit facility is also subject to a borrowing base having no fewer than 15 properties. Subject to our continued compliance with certain financial covenants described below, we may remove properties from the borrowing base in connection with a sale or refinancing of such property as long as at least 15 borrowing base properties remain and the value of the remaining borrowing base properties exceeds the amount outstanding under the secured revolving credit facility. We may also request to add additional properties, subject to the required lenders’ approval and delivery of certain documentation. Prior to the second anniversary of the facility’s closing date we also may elect to increase the amount of the secured revolving credit facility up to $ million, subject to the identification of a lender or lenders willing to make available the additional amounts, including new lenders acceptable to us and the administrative agent.
Payment Terms. We will be obligated to pay interest at the end of each selected interest period, but not less than quarterly, with all outstanding principal and accrued but unpaid interest due at maturity. We have the right to repay all or any portion of the outstanding borrowings from time to time without penalty or premium, other than customary early payment fees if we repay a LIBOR loan before the end of the contract period. In addition, we will be required to make earlier principal reduction payments in the event of certain changes in the borrowing base availability.
Interest is paid on the periodic advances under the secured revolving credit facility at varying rates, based upon, at our option, either (i) 1-, 2-, 3- or 6-month LIBOR, subject to a floor of %, plus the applicable LIBOR margin or (ii) the applicable base rate, which is the greater of the administrative agent’s prime rate, 0.50% above the fed funds effective rate, or thirty-day LIBOR (incorporating the floor of %) plus 1.00%, plus the applicable margin for base rate loans. The applicable LIBOR and base rate margin depends upon the ratio of our outstanding consolidated total indebtedness to EBITDA, as follows:
Total Debt to EBITDA | LIBOR Margin | Base Rate Margin | ||||||
| <3.50x | % | % | ||||||
³3.50x; <5.00x | % | % | ||||||
³5.00x | % | % | ||||||
On a quarterly basis, we will be required to pay one-quarter of the annual amount equal to % of the unused portion of the secured revolving credit facility if our outstanding balance is less than or equal to $ and % of the unused portion of the secured revolving credit facility if our outstanding balance is greater than $ . We will also be required to pay other fees, including customary arrangement, administrative and fronting fees.
63
Financial and Other Covenants. In addition, we will be required to comply with a series of financial and other covenants in order to borrow under the secured revolving facility. The material financial covenants, tested quarterly, will be as follows:
| • | a minimum consolidated tangible net worth (as defined in the loan documentation) equal to 80% of our consolidated tangible net worth as of the facility’s closing date plus 80% of the net proceeds of common equity issuances; |
| • | a minimum ratio of adjusted consolidated EBITDA (as defined in the loan documentation) to consolidated fixed charges (as defined in the loan documentation) of not less than 1.50 to 1.00 for the first two years of the secured revolving credit facility, increasing to not less than 1.60 to 1:00 for year three and 1.75 to 1.0 for any extension period; |
| • | a maximum dividend payout ratio of 95% of FFO (as defined in the loan documentation) or an amount necessary to maintain REIT tax status and avoid corporate income and excise taxes; and |
| • | a maximum ratio of consolidated indebtedness (as defined in the loan documentation) to consolidated EBITDA (as defined in the loan documentation) of not more than 6.00 to 1.00 for the first year, not more than 5.75 to 1.00 for the second year, not more than 5.50 to 1.00 for the third year and not more than 5.25 to 1.00 for any extension period. |
We also will be subject to other customary covenants, including restrictions on investments, limitations on liens and maintenance of properties. The secured revolving credit facility will also contain customary events of default, including, among others, the failure to make payments when due under any of the secured revolving credit facility documentation, breach of any covenant continuing beyond any cure period and bankruptcy or insolvency.
Conditions to Effectiveness. We intend to negotiate, execute and deliver definitive documentation for the secured revolving credit facility prior to the completion of this offering. However, the secured revolving credit facility will not become effective unless we comply with all of the conditions to effectiveness, including the satisfactory completion of financial, accounting and business due diligence and the raising of at least $ million of gross proceeds from this offering and the concurrent private placement. We also have agreed to actively assist the administrative agent in syndicating the secured revolving credit facility. There can be no assurance that all of the conditions to effectiveness, will be satisfied by the completion of this offering.
Pro Forma Indebtedness
Upon completion of this offering and the concurrent private placement and the application of the net proceeds as described in “Use of Proceeds,” we will have approximately $198.4 million in outstanding indebtedness and 33 hotels unencumbered by mortgage debt, including 25 hotels with 2,330 rooms operating under brands owned by Marriott, Hilton, IHG or Hyatt, available as collateral for potential future loans. We intend to enter into a secured revolving credit facility to fund future acquisitions, as well as for property redevelopments and working capital requirements. We may not succeed in obtaining a secured revolving credit facility on favorable terms or at all and we cannot predict the size or terms of the secured revolving credit facility if we are able to obtain it. Our failure to obtain a secured revolving credit facility could adversely affect our ability to grow our business and meet our obligations as they come due.
On a pro forma basis as of September 30, 2010, after application of a portion of the net proceeds from this offering and the concurrent private placement to repay outstanding indebtedness as described in “Use of Proceeds,” we expect to have approximately $198.4 million of outstanding mortgage indebtedness. The following table sets forth on a pro forma
64
basis as of September 30, 2010, our pro forma mortgage debt obligations that will remain outstanding following the application of the net proceeds from this offering and the concurrent private placement:
| Outstanding | ||||||||||||||||
| Principal | Interest Rate | |||||||||||||||
| Balance as of | as of | Amortization | Maturity | |||||||||||||
Lender | Collateral | September 30, 2010 | September 30, 2010(1) | (years) | Date | |||||||||||
| Bank of the Cascades | Residence Inn, Portland, OR | $ | 12,623,347 | Prime rate, subject to a floor of 6.00% | 25 | 09/30/11 | ||||||||||
ING Investment Management(2) | Fairfield Inn & Suites, Germantown, TN Residence Inn, Germantown, TN Holiday Inn Express, Boise, ID Courtyard by Marriott, Memphis, TN Hampton Inn & Suites, El Paso, TX Hampton Inn, Ft. Smith, AR | 29,204,498 | 5.60% | 20 | 07/01/25 | |||||||||||
| MetaBank | Cambria Suites, Boise, ID SpringHill Suites, Lithia Springs, GA | 7,339,544 | Prime rate, subject to a floor of 5.00% | 20 | 03/01/12 | |||||||||||
| Chambers Bank | Aspen Hotel & Suites, Ft. Smith, AR | 1,615,101 | 6.50% | 20 | 06/24/12 | |||||||||||
Bank of the Ozarks(3) | Hyatt Place, Portland, OR | 6,444,447 | 90-day LIBOR + 4.00%, subject to a floor of 6.75% | 25 | 06/29/12 | |||||||||||
ING Investment Management(4)(10) | Hilton Garden Inn, Ft. Collins, CO | 7,954,303 | 6.34% | 20 | 07/01/12 | |||||||||||
ING Investment Management(4)(11) | Comfort Inn, Ft. Smith, AR Holiday Inn Express, Sandy, UT Fairfield Inn, Lewisville, TX Hampton Inn, Denver, CO Holiday Inn Express, Vernon Hills, IL Hampton Inn, Fort Wayne, IN Courtyard by Marriott, Missoula, MT Comfort Inn, Missoula, MT | 29,601,595 | 6.10% | 20 | 07/01/12 | |||||||||||
BNC National Bank(13) | Hampton Inn & Suites, Ft. Worth, TX | 5,768,755 | 5.01% | 20 | 11/01/13 | |||||||||||
First National Bank of Omaha(5) | Courtyard by Marriott, Germantown, TN Courtyard by Marriott, Jackson, MS Hyatt Place, Atlanta, GA | 24,367,948 | 90-day LIBOR + 4.00%, subject to a floor of 5.25% | 20 | 07/01/13 | |||||||||||
ING Investment Management(6)(12) | Residence Inn, Jackson, MS | 6,281,130 | 6.61% | 20 | 11/01/28 | |||||||||||
General Electric Capital Corp.(7)(14) | Cambria Suites, San Antonio, TX | 11,262,138 | 90-day LIBOR + 2.55% | 25 | 04/01/14 | |||||||||||
National Western Life Insurance(8) | Courtyard by Marriott, Scottsdale, AZ SpringHill Suites, Scottsdale, AZ | 13,734,486 | 8.00% | 17 | 01/01/15 | |||||||||||
BNC National Bank(13) | Holiday Inn Express & Suites, Twin Falls, ID | 5,814,136 | Prime rate – 0.25% | 20 | 04/01/16 | |||||||||||
| Compass Bank | Courtyard by Marriott, Flagstaff, AZ | 16,492,293 | Prime rate – 0.25%, subject to a floor of 4.50% | 20 | 05/17/18 | |||||||||||
General Electric Capital Corp.(14) | SpringHill Suites, Denver, CO | 8,802,903 | 90-day LIBOR + 1.75% | 20 | 04/01/18 | |||||||||||
General Electric Capital Corp.(9)(14) | Cambria Suites, Baton Rouge, LA | 11,119,105 | 90-day LIBOR + 1.80% | 25 | 03/01/19 | |||||||||||
Total | $ | 198,425,729 | ||||||||||||||
| (1) | As of September 30, 2010, the Prime rate was 3.25% and the 90-day LIBOR rate was 0.29%. |
| (2) | The lender has the right to call the loan, which is secured by multiple hotel properties, at January 1, 2012, January 1, 2017 and January 1, 2022. At January 1, 2012, the loan begins to amortize according to a 19.5 year amortization schedule. If this loan is repaid prior to maturity, there is a prepayment penalty equal to the greater of (i) 1% of the principal being repaid and the (ii) the yield maintenance premium. There is no prepayment penalty if the loan is prepaid 60 days prior to any call date. | |
| (3) | The maturity date may be extended to June 20, 2014 based on the exercise of two, one-year extension options, subject to the satisfaction of certain conditions. If this loan is repaid prior to June 29, 2011, there is a prepayment penalty equal to 1% of the principal being repaid. | |
| (4) | If this loan is repaid prior to maturity, there is a prepayment penalty equal to the greater of (i) 1% of the principal being repaid and the (ii) the yield maintenance premium. |
| (5) | Evidenced by three promissory notes, the loan secured by the Hyatt Place located in Atlanta, Georgia has a maturity date of February 1, 2014. The three promissory notes are cross-defaulted and cross-collateralized. |
| (6) | The lender has the right to call the loan at November 1, 2013, 2018 and 2023. If this loan is repaid prior to maturity, there is a prepayment penalty equal to the greater of (i) 1% of the principal being repaid and the (ii) the yield maintenance premium. There is no prepayment penalty if the loan is prepaid 60 days prior to any call date. |
65
| (7) | If this loan is repaid prior to April 1, 2011, there is a prepayment penalty equal to 0.75% of the principal being repaid. After this date, there is no prepayment penalty. A portion of the loan can be prepaid without penalty at any time to bring the loan-to-value ratio to no less than 65%. | |
| (8) | On December 8, 2009, we entered into two cross-collateralized and cross-defaulted mortgage loans with National Western Life Insurance in the amounts of $8,650,000 and $5,350,000 to refinance the JP Morgan debt on the two Scottsdale, AZ hotels. Prior to February 1, 2011, these loans cannot be prepaid. If these loans are prepaid, there is a prepayment penalty ranging from 5% to 1% of the principal being prepaid. A one-time, ten-year extension of the maturity date is permitted, subject to the satisfaction of certain conditions. | |
| (9) | If this loan is repaid prior to February 27, 2011, there is a prepayment penalty equal to 0.75% of the principal being repaid. After this date, and until July 1, 2011, there is no prepayment penalty. A portion of the loan can be prepaid without penalty at any time to bring the loan-to-value ratio to no less than 65%. |
| (10) | This loan is cross-collateralized with the ING Investment Management loan secured by the following hotel properties: Comfort Inn, Ft. Smith, AR; Holiday Inn Express, Sandy, UT; Fairfield Inn, Lewisville, TX; Hampton Inn, Denver, CO; Holiday Inn Express, Vernon Hills, IL; Hampton Inn, Fort Wayne, IN; Courtyard by Marriott, Missoula, MT; Comfort Inn, Missoula, MT. |
| (11) | This loan is secured by multiple hotel properties. |
| (12) | This loan is cross-collateralized with the ING Investment Management loan secured by the following hotel properties: Fairfield Inn & Suites, Germantown, TN; Residence Inn, Germantown, TN; Holiday Inn Express, Boise, ID; Courtyard by Marriott, Memphis, TN; Hampton Inn & Suites, El Paso, TX; Hampton Inn, Ft. Smith, AR. |
| (13) | The two BNC loans are cross-defaulted. | |
| (14) | The three General Electric Capital Corp. loans are cross-defaulted. Effective July 1, 2011, the interest rate on all three loans will increase to 90-day LIBOR + 4.00%. Effective August 1, 2011, all three loans will be subject to a prepayment penalty equal to 2% of the principal repaid prior to August 1, 2012, 1% of the principal repaid prior to August 1, 2013, and 0% thereafter. |
The yield maintenance premium under each of the ING Investment Management loans described in the table above is calculated as follows: (A) if the entire amount of the loan is being prepaid, the yield maintenance premium is equal to the sum of (i) the present value of the scheduled monthly installments from the date of prepayment to the maturity date, and (ii) the present value of the amount of principal and interest due on the maturity date (assuming all scheduled monthly installments due prior to the maturity date were made when due), less (iii) the outstanding principal balance as of the date of prepayment; and (B) if only a portion of the loan is being prepaid, the yield maintenance premium is equal to the sum of (i) the present value of the scheduled monthly installments on the pro rata portion of the loan being prepaid, or the release price, from the date of prepayment to the maturity date, and (ii) the present value of the pro rata amount of principal and interest due on the release price due on the maturity date (assuming all scheduled monthly installments due prior to the maturity date were made when due), less (iii) the outstanding amortized principal allocation, as defined in the loan agreement, as of the date of prepayment.
We believe that we will have adequate liquidity to meet requirements for scheduled maturities. However, we can provide no assurances that we will be able to refinance our indebtedness as it becomes due and, if refinanced, whether such refinancing will be available on favorable terms.
Capital Expenditures and Reserve Funds
We have budgeted approximately $30.0 million for capital improvements to be made to the hotels in our initial portfolio in 2011. Of this amount, approximately $10.0 million is expected to be funded from the net proceeds of this offering and the concurrent private placement, with the remaining approximately $20.0 million expected to be funded from operating cash flows or from other potential sources of capital, including our anticipated secured revolving credit facility.
Off-Balance Sheet Arrangements
We have no off-balance sheet arrangements that have or are reasonably likely to have a current or future effect on our financial condition, changes in financial condition, revenues or expenses, results of operations, liquidity, capital expenditures or capital resources that is material to investors.
66
Contractual Obligations
The following table outlines the timing of payment requirements related to our long-term debt obligations and other contractual obligations as of September 30, 2010 (dollars in millions).
| Payments Due By Periods | ||||||||||||||||||||
| Less than | One to Three | Four to Five | More than | |||||||||||||||||
| Total | One Year | Years | Years | Five Years | ||||||||||||||||
Long-term debt obligations(1) | $ | 439.0 | $ | 176.0 | $ | 184.0 | $ | 36.8 | $ | 42.2 | ||||||||||
| Operating lease obligations | 8.2 | 0.2 | 0.5 | 0.5 | 7.0 | |||||||||||||||
Total | $ | 447.2 | $ | 176.2 | $ | 184.5 | $ | 37.3 | $ | 49.2 | ||||||||||
| (1) | The amounts shown include amortization of principal on our fixed-rate and variable-rate obligations, debt maturities on our fixed-rate and variable-rate obligations and estimated interest payments of our fixed-rate obligations. Interest payments have been included based on the weighted-average interest rate. |
The following table outlines the timing of payment requirements related to our long-term debt obligations and other contractual obligations as of December 31, 2009 on a pro forma basis, after application of the net proceeds from this offering and the concurrent private placement as described under “Use of Proceeds” (dollars in millions).
| Pro Forma | ||||||||||||||||||||
| Payments Due By Periods | ||||||||||||||||||||
| Less than | One to Three | Four to Five | More than | |||||||||||||||||
| Total | One Year | Years | Years | Five Years | ||||||||||||||||
Long-term debt obligations(1) | $ | 227.1 | $ | 9.2 | $ | 140.2 | $ | 35.6 | $ | 42.1 | ||||||||||
| Operating lease obligations | 8.2 | 0.2 | 0.5 | 0.5 | 7.0 | |||||||||||||||
Total | $ | 235.3 | $ | 9.4 | $ | 140.7 | $ | 36.1 | $ | 49.1 | ||||||||||
| (1) | The amounts shown include amortization of principal on our fixed-rate and variable-rate obligations, debt maturities on our fixed-rate and variable-rate obligations and estimated interest payments of our fixed-rate obligations. Interest payments have been included based on the weighted-average interest rate. |
Qualitative and Quantitative Effects of Market Risk
Market risk includes risks that arise from changes in interest rates, foreign currency exchange rates, commodity prices, equity prices and other market changes that affect market sensitive instruments. In pursuing our business strategies, the primary market risk to which we are currently exposed, and to which we expect to be exposed in the future, is interest rate risk. Our primary interest rate exposures are to the 30-day LIBOR rate, the 90-day LIBOR rate and the Prime rate. We primarily use fixed interest rate financing to manage our exposure to fluctuations in interest rates. We do not use any hedge or other instruments to manage interest rate risk.
As of September 30, 2010, approximately 47.5% of our pro forma debt carried fixed interest rates and 52.5% carried variable interest rates. As of September 30, 2010, our fixed interest rate pro forma debt totaled $94.1 million. Our variable interest rate pro forma debt totaled $104.3 million as of September 30, 2010. Assuming no increase in the amount of our variable rate pro forma debt, if the interest rates on our variable rate pro forma debt were to increase by 1.0%, our cash flow would decrease by approximately $1.0 million per year.
Inflation
Operators of hotels, in general, possess the ability to adjust room rates daily to reflect the effects of inflation. However, competitive pressures may limit the ability of our management companies to raise room rates.
Seasonality
Due to our portfolio’s geographic diversification, our revenues have not experienced significant seasonality. For the year ended December 31, 2009, our predecessor received 24.2% of its total revenues in the first quarter, 25.8% in the second quarter, 26.6% in the third quarter and 23.4% in the fourth quarter. For the year ended December 31, 2008, our predecessor received 24.0% of its total revenues in the first quarter, 26.3% in the second quarter, 28.1% in the third quarter and 21.6% in the fourth quarter.
67
Critical Accounting Policies
The preparation of financial statements in conformity with GAAP requires management to make estimates and assumptions that affect the reported amount of assets and liabilities at the date of our financial statements and the reported amounts of revenues and expenses during the reporting period. While we do not believe the reported amounts would be materially different, application of these policies involves the exercise of judgment and the use of assumptions as to future uncertainties and, as a result, actual results could differ materially from these estimates. We evaluate our estimates and judgments, including those related to the impairment of long-lived assets, on an ongoing basis. We base our estimates on experience and on various other assumptions that are believed to be reasonable under the circumstances. All of our predecessor’s significant accounting policies are disclosed in the notes to its consolidated financial statements. The following represent certain critical accounting policies that will require our management to exercise their business judgment or make significant estimates:
Principles of Consolidation and Basis of Presentation. Our consolidated financial statements will include our accounts, the accounts of our wholly owned subsidiaries or subsidiaries for which we have a controlling interest, the accounts of variable interest entities in which we are the primary beneficiary, and the accounts of other subsidiaries over which we have a controlling interest. All material inter-company transactions, balances and profits will be eliminated in consolidation. The determination of whether we are the primary beneficiary is based on a combination of qualitative and quantitative factors which require management in some cases to estimate future cash flows or likely courses of action.
Hotels—Acquisitions. Upon acquisition, we allocate the purchase price based on the fair value of the acquired land, building, furniture, fixtures and equipment, goodwill, other assets and assumed liabilities. We determine the acquisition-date fair values of all assets and assumed liabilities using methods similar to those used by independent appraisers, for example, using a discounted cash flow analysis, and that utilize appropriate discount and/or capitalization rates and available market information. Estimates of future cash flows are based on a number of factors including historical operating results, known and anticipated trends, and market and economic conditions. Acquisition costs are expensed as incurred. Changes in estimates and judgments related to the allocation of the purchase price could result in adjustments to real estate or intangible assets, which can impact depreciation and/or amortization expense and our results of operations.
Depreciation and Amortization of Hotels. Hotels are carried at cost and depreciated using the straight-line method over an estimated useful life of 27 to 40 years for buildings and two to 15 years for furniture, fixtures and equipment. We are required to make subjective assessments as to the useful lives and classification of our properties for purposes of determining the amount of depreciation expense to reflect each year with respect to the assets. While management believes its estimates are reasonable, a change in the estimated useful lives could affect the results of operations.
Impairment of Hotels. We monitor events and changes in circumstances for indicators that the carrying value of a hotel and related assets may be impaired. Factors that could trigger an impairment analysis include, among others: (1) significant underperformance relative to historical or projected operating results, (2) significant changes in the manner of use of a hotel or the strategy of our overall business, (3) a significant increase in competition, (4) a significant adverse change in legal factors or regulations or (5) significant negative industry or economic trends. When such factors are identified, we will prepare an estimate of the undiscounted future cash flows, without interest charges, of the specific hotel and determine if the investment in such hotel is recoverable based on the undiscounted future cash flows. If impairment is indicated, an adjustment is made to the carrying value of the hotel to reflect the hotel at fair value. These assessments may impact the results of our operations.
Revenue Recognition. Revenue is recognized when rooms are occupied and services have been rendered. These revenue sources are affected by conditions impacting the travel and hospitality industry as well as competition from other hotels and businesses in similar markets.
Stock-Based Compensation. We have adopted the 2010 Equity Incentive Plan, which provides for the grants of stock options, stock appreciation rights, restricted stock, restricted stock units, dividend equivalent rights and other stock-based awards, or any combination of the foregoing. Equity-based compensation will be recognized as an expense in the financial statements over the vesting period and measured at the fair value of the award on the date of grant. The amount of the expense may be subject to adjustment in future periods depending on the specific characteristics of the equity-based award and the application of accounting guidance.
Income Taxes. We intend to elect to be taxed as a REIT under the Code and intend to operate as such beginning with our short taxable year ending December 31, 2010. To qualify as a REIT, we must meet certain organizational and
68
operational requirements, including a requirement to distribute annually to our stockholders at least 90% of our REIT taxable income, determined without regard to the deduction for dividends paid and excluding net capital gains, which does not necessarily equal net income as calculated in accordance with GAAP. As a REIT, we generally will not be subject to federal income tax (other than taxes paid by our TRSs) to the extent we currently distribute 100% of our REIT taxable income to our stockholders. If we fail to qualify as a REIT in any taxable year, we will be subject to federal income tax on our taxable income at regular corporate income tax rates and generally will not be permitted to qualify for treatment as a REIT for the four taxable years following the year during which qualification is lost unless we satisfy certain relief provisions. Such an event could materially adversely affect our net income and net cash available for distribution to stockholders. However, we intend to be organized and operate in such a manner as to qualify for treatment as a REIT.
Deferred Tax Assets and Liabilities. We will account for federal and state income taxes with respect to our TRSs using the asset and liability method. Deferred tax assets and liabilities are recognized for the future tax consequences attributable to differences between the consolidated financial statements’ carrying amounts of existing assets and liabilities and respective tax bases and operating losses and tax-credit carry forwards. Deferred tax assets and liabilities are measured using enacted tax rates expected to apply to taxable income in the years in which those temporary differences are expected to be recovered or settled. The effect on deferred tax assets and liabilities of a change in tax rates is recognized in income in the period that includes the enactment date. In the event that these assumptions change, the deferred taxes may change.
New Accounting Pronouncements
In January 2010, the Financial Accounting Standards Board (FASB) issued an update (ASU No. 2010-06) to Accounting Standards Codification (ASC) 820, Fair Value Measurements and Disclosures, to improve disclosure requirements regarding transfers, classes of assets and liabilities, and inputs and valuation techniques. This update is effective for interim and annual reporting periods beginning after December 15, 2009. Our predecessor adopted this ASC update on January 1, 2010, and it had no material impact on our predecessor’s consolidated financial statements.
In February 2010, the FASB issued an update (ASU No. 2010-09) to ASC 855, Subsequent Events, by removing the requirement for an SEC filer to disclose the date through which that filer had evaluated subsequent events. Our predecessor has adopted this change and therefore has removed the related disclosure from the “Basis of Presentation.”
Certain provisions of ASU No. 2010-06 to ASC 820, Fair Value Measurements and Disclosures, related to separate line items for all purchases, sales, issuances and settlements of financial instruments valued using Level 3 are effective for fiscal years beginning after December 15, 2010. We do not believe that this adoption will have a material impact on our financial statements or disclosures.
69
Structure of Our Company
We were formed as a Maryland corporation on June 30, 2010. We will conduct our business through an umbrella partnership structure, in which our hotel properties are owned by our operating partnership, Summit Hotel OP, LP, and limited partnerships, limited liability companies or other subsidiaries of our operating partnership. Summit Hotel GP, LLC, our wholly owned subsidiary, is the sole general partner of our operating partnership. Through Summit Hotel GP, LLC, we have the exclusive power to manage and conduct our operating partnership’s business, subject to the limitations described in the partnership agreement. We will contribute the net proceeds of this offering and the concurrent private placement to our operating partnership in exchange for additional OP units.
Upon completion of the formation transactions, this offering and the concurrent private placement and the contribution of the net proceeds of this offering and the concurrent private placement to our operating partnership, we will own an approximate % ( % if the underwriters exercise their over-allotment option in full) partnership interest in our operating partnership, including general and limited partnership interests. The remaining interests in our operating partnership will be owned by limited partners, including certain of our executive officers, directors and their affiliates, who received OP units in the formation transactions.
Beginning one year after completion of the formation transactions, limited partners (other than us) may, subject to certain restrictions, elect to redeem their OP units for a per-OP unit cash amount based on the then-current market price of our common stock or, at our operating partnership’s option, shares of our common stock on a one-for-one basis, subject to adjustments for stock splits, dividends, recapitalizations and similar events. Holders of OP units generally will receive distributions per OP unit equivalent to the per share distributions we make to holders of our common stock. See “Description of the Partnership Agreement.”
In order for the income from our hotel operations to constitute “rents from real property” for purposes of the gross income tests applicable to a REIT, we cannot directly or indirectly operate any of our hotels. Instead, we must lease our hotels. Accordingly, we will lease each of our initial hotel properties to our TRS lessees, which will be wholly owned by our operating partnership. Our TRS lessees will pay rents to us that will be treated as “rents from real property,” provided that the hotel management companies engaged by our TRS lessees to manage our hotels are “eligible independent contractors” and certain other requirements are met. Concurrently with completion of this offering and the formation transactions, our TRS lessees will engage Interstate to manage our hotels pursuant to management agreements.
70
Formation Transactions
Overview
Historically, the 65 hotels in our portfolio were owned by our predecessor and were operated by The Summit Group, which is wholly owned and controlled by our Executive Chairman, Mr. Boekelheide. In connection with completion of this offering, we will engage in the transactions described below, which we refer to as our formation transactions, in order to consolidate the business and properties of our predecessor into a publicly traded REIT with improved access to capital and increased flexibility to execute our growth strategy. The formation transactions are subject to customary closing conditions, including obtaining required third-party consents and approvals and the closing of this offering. The formation transactions are not conditioned on the completion of the concurrent private placement.
The significant elements of the formation transactions include:
| § | the formation of our company, our operating partnership, Summit TRS and Summit TRS II; |
| § | the sale of shares of our common stock in this offering; |
| § | the sale of shares of our common stock in the concurrent private placement; |
| § | the contribution of the net proceeds of this offering and the concurrent private placement to our operating partnership in exchange for OP units; |
| § | the merger of our predecessor with and into our operating partnership, with our predecessor’s members receiving OP units; | |
| § | the contribution of the Class B and Class C membership interests in Summit of Scottsdale to our operating partnership in exchange for OP units and our assumption of mortgage debt secured by the two Scottsdale hotels owned by Summit of Scottsdale; | |
| § | the lease of the 65 hotels in our portfolio to our TRS lessees; and | |
| § | assignment by The Summit Group of all of the hotel management agreements pursuant to which it managed the hotels owned by our predecessor to Interstate for consideration consisting of $12,750,000 and the entry into a new hotel management agreement with Interstate, an independent hotel management company, pursuant to which Interstate will operate the 65 hotels in our portfolio. |
Formation of Summit Hotel Properties, Inc., Our Operating Partnership, Summit TRS and Summit TRS II
Summit Hotel Properties, Inc. was incorporated on June 30, 2010 under the laws of the State of Maryland. We intend to elect and qualify as a REIT for federal income tax purposes. Our operating partnership, Summit Hotel OP, LP, was organized as a limited partnership under the laws of the State of Delaware on June 30, 2010. Summit Hotel GP, LLC, our wholly owned subsidiary, is our operating partnership’s sole general partner.
We incorporated Summit Hotel TRS, Inc. on August 11, 2010 under the laws of the State of Delaware. We will incorporate Summit Hotel TRS II, Inc. under the laws of the State of Delaware prior to completion of this offering. Summit TRS is, and Summit TRS II will be, as the parent companies of our TRS lessees, wholly owned by our operating partnership. We will lease all of our initial hotel properties to our TRS lessees. Summit TRS is, and Summit TRS II will be, taxed as a regular corporation and their income therefore will be subject to federal, state and local income tax. We may form additional TRSs in the future in order to engage in certain activities that otherwise might jeopardize our qualification as a REIT. Any income earned by our TRSs will not be included for purposes of the 90% distribution requirement discussed under “Material Federal Income Tax Considerations—Annual Distribution Requirements,” unless that income is actually distributed to us. For a further discussion of TRSs, see “Material Federal Income Tax Considerations—Taxation of Our Company.”
Merger of Summit Hotel Properties, LLC into Our Operating Partnership
Currently, our predecessor owns or controls 65 hotels, including the two Scottsdale hotels currently held by Summit of Scottsdale. In connection with completion of this offering, our predecessor will merge with and into our operating partnership, with our operating partnership continuing as the surviving entity. Pursuant to the merger, the members of our predecessor, including certain of our executive officers and directors and their affiliates, will receive OP units in exchange for their membership interests in our predecessor. The aggregate merger consideration will consist of 9,993,992 OP units
71
(having an aggregate assumed value of $ based on the mid-point of the anticipated IPO price range shown on the cover of this prospectus). Upon completion of the merger, our operating partnership will become the owner of the 63 hotels currently held by our predecessor and the two Scottsdale hotels and assume approximately $422.2 million of indebtedness, approximately $223.8 million of which we expect to repay with the net proceeds of this offering and the concurrent private placement. In the merger, (1) our Executive Chairman, Mr. Boekelheide, and his affiliates, including The Summit Group, will receive an aggregate of 1,517,879 OP units for membership interests in our predecessor having an aggregate assumed value of $ based on the mid-point of the anticipated IPO price range shown on the cover of this prospectus and (2) our Executive Vice President and Chief Operating Officer, Mr. Aniszewski, will receive an aggregate of 4,105 OP units for membership interests in our predecessor having an aggregate value of $ based on the mid-point of the anticipated IPO price range shown on the cover of this prospectus. On November 30, 2010, our predecessor’s members approved the merger. The merger is subject to customary closing conditions, including obtaining all required third-party consents and approvals and completion of this offering. The closing of the merger is not conditioned on the completion of the concurrent private placement.
Contribution of Class B and Class C Membership Interests in Summit of Scottsdale
In connection with completion of this offering, The Summit Group will contribute its 36% Class B membership interest in Summit of Scottsdale to our operating partnership in exchange for 74,829 OP units having an aggregate assumed value of $ based on the mid-point of the anticipated IPO price range shown on the cover of this prospectus. An unaffiliated third-party investor will contribute its 15% Class C membership interest in Summit of Scottsdale to our operating partnership in exchange for 31,179 OP units having an aggregate assumed value of $ based on the mid-point of the anticipated IPO price range shown on the cover of this prospectus. The contributions of the Class B and Class C membership interests in Summit of Scottsdale are subject to customary closing conditions, including obtaining all required third-party consents and approvals and completion of this offering. The closing of these contributions is not conditioned on the completion of the concurrent private placement. Our predecessor owns a 49% Class A membership interest in Summit of Scottsdale, which our operating partnership is acquiring in the merger. As a result of these contributions and the merger described above, our operating partnership will assume approximately $13.8 million of existing mortgage debt secured by the two Scottsdale hotels and will become the sole owner of those hotels.
Lease of the Hotels in Our Portfolio to Our TRS Lessees
In order for the income from our hotel operations to constitute “rents from real property” for purposes of the gross income tests required for REIT qualification, we cannot directly or indirectly operate any of our hotels. Instead, we must lease our hotels. Accordingly, in connection with completion of this offering, we will enter into lease agreements pursuant to which we will lease the 65 hotels in our portfolio to our TRS lessees, which will be wholly owned by our operating partnership. Our TRS lessees will pay rent to us that we intend to treat as “rents from real property,” provided that Interstate and any other hotel management companies engaged by our TRS lessees qualifies as an “eligible independent contractor” and certain other requirements are met. See “Our Hotel Operating Agreements—Hotel Management Agreement.”
Hotel Management Agreement
Prior to this offering and completion of the formation transactions, the hotels owned by our predecessor, including the two Scottsdale, Arizona hotels owned by Summit of Scottsdale, were managed by The Summit Group. In connection with completion of this offering, these hotel management agreements will be terminated and our TRS lessees will enter into a new hotel management agreement with Interstate, pursuant to which Interstate will operate and manage the 65 hotels in our portfolio on the anticipated terms described below. In consideration for terminating the existing hotel management agreements with our predecessor, The Summit Group, the current hotel management company, which is wholly owned by Mr. Boekelheide, will receive a total cash payment from Interstate in the amount of $12,750,000. See “Our Hotel Operating Agreements—Hotel Management Agreement.”
Tax Protection Agreements
Our operating partnership will offer to enter into tax protection agreements with a limited number of the members of our predecessor, including The Summit Group. Under the Code, any reduction in a partner’s share of partnership liabilities that exceeds the partner’s adjusted tax basis in the partnership would result in taxable gain to the partner. The tax protection agreements are intended to protect those members of our predecessor from recognizing such a taxable gain as
72
a result of a reduction in their share of liabilities of our operating partnership as compared to their share of liabilities of our predecessor that is attributable to our repayment of liabilities with the proceeds of this offering. The tax protection agreements will provide that our operating partnership will offer those members the opportunity to guarantee debt, or, alternatively, to enter into a deficit restoration obligation in a manner intended to provide an allocation of our operating partnership’s liabilities to those members for federal income tax purposes. We anticipate that those members will guarantee approximately $2.1 million of our operating partnership’s liabilities, including approximately $2 million of our operating partnership’s liabilities that will be guaranteed by The Summit Group. If our operating partnership fails to offer those members the opportunity to guarantee debt or to enter into a deficit restoration obligation, our operating partnership will be required to deliver to each member who was not offered the opportunity to guarantee debt or enter into a deficit restoration obligation a cash payment intended to approximately compensate for the tax liability resulting from our operating partnership’s failure to make these opportunities available. Although our operating partnership’s liability under the tax protection agreements will depend on certain factors, including without limitation the applicable maximum federal, state and local tax rates, we anticipate that the maximum amount our operating partnership may have to indemnify under the tax protection agreements is approximately $1.05 million. The tax protection agreements will apply to a particular member of our predecessor until the earlier of (i) the date the member (or its successor) has disposed of 100% of the OP units received in the formation transactions or (ii) ten years from the anniversary of the closing of this offering. The tax protection agreements are expected to benefit those members by assisting them in continuing to defer federal income taxes that would otherwise be recognized in connection with the formation transactions. The tax protection agreements do not obligate our operating partnership to provide new opportunities or indemnities to those members if a future reduction of the liabilities of our operating partnership after the repayment of operating partnership liabilities with the proceeds of this offering causes those members to recognize a taxable deemed cash distribution.
Valuation of Interests Being Acquired in the Formation Transactions
The number of OP units issuable by our operating partnership in the formation transactions was determined by our management team based on its valuation of our predecessor and the hotels owned by Summit of Scottsdale. In each case, the assumed value per OP unit is equal to the mid-point of the anticipated IPO price range of our common stock shown on the cover of this prospectus. Our management team determined the value of our predecessor and the Scottsdale hotels by considering various valuation factors and methodologies, including an analysis of available third-party valuations on some of the hotels, market sales comparables, market capitalization rates and general market conditions for similar hotel companies and publicly traded REITs. The numbers of OP units issuable in the formation transactions are fixed. As a result, if the IPO price for our common stock is higher or lower than the mid-point of the anticipated IPO price range shown on the cover of this prospectus, the value of the OP units to be issued in the formation transactions will increase or decrease accordingly.
Both we and our predecessor have sought to structure the formation transactions so as to minimize potential conflicts of interest, including by appointing a special committee of our predecessor’s independent managers to review the terms of the proposed merger of our predecessor into our operating partnership. However, we did not conduct arm’s-length negotiations with our predecessor’s members or the members of Summit of Scottsdale with respect to the terms of the formation transactions, including the merger. Our Executive Chairman, Mr. Boekelheide, and his affiliates, including The Summit Group, have substantial, pre-existing ownership interests in our predecessor and Summit of Scottsdale. In addition, Mr. Aniszewski, our Executive Vice President and Chief Operating Officer, has a pre-existing ownership interest in our predecessor. Both Mr. Boekelheide and Mr. Aniszewski sat on the board of managers of our predecessor that approved the terms of the formation transactions. In the course of structuring the formation transactions, Mr. Boekelheide and Mr. Aniszewski had the ability to influence the type and level of benefits they will receive from us. Although our predecessor’s special committee received a fairness opinion from an independent third-party financial advisor that is not one of the underwriters of this offering with respect to the fairness, from a financial point of view, of the merger consideration to the former members of our predecessor, assuming that the value of the OP units issued as the merger consideration was between $140 million and $160 million, we did not obtain a fairness opinion with respect to the fairness of the merger consideration to us and we did not obtain recent third-party appraisals for all of the hotels to be acquired by us in the formation transactions. As a result, the consideration to be paid by us to the members of our predecessor in the merger for our predecessor’s 63 hotels and its 49% ownership interest in the two Scottsdale hotels may exceed the fair market value of the hotels and other assets being acquired by us in the formation transactions or the price that would have been paid in an arm’s-length transaction.
73
Our Business and Properties
Overview
We are a self-managed hotel investment company that was recently organized to continue and expand the existing hotel investment business of our predecessor, Summit Hotel Properties, LLC, a leading U.S. hotel owner. We will focus exclusively on acquiring, owning, renovating, repositioning and aggressively asset-managing and selling premium-branded limited-service and select-service hotels in the upscale and midscale without food and beverage segments of the U.S. lodging industry. Our strategy focuses on maximizing the cash flow of our portfolio through focused asset management, targeted capital investment and opportunistic acquisitions. Following completion of this offering and the formation transactions, our initial portfolio will consist of 65 hotels with a total of 6,533 guestrooms located in 19 states. Our initial portfolio consists of what we consider both “seasoned” and “unseasoned” hotels that are located in markets in which we have extensive experience and that exhibit multiple demand generators, such as business and corporate headquarters, retail centers, airports and tourist attractions. Based on total number of rooms, 48% of our portfolio is positioned in the top 50 MSAs and 68% is located within the top 100 MSAs.
Entities controlled by our Executive Chairman, Mr. Boekelheide, have been in the business of acquiring, developing, financing, operating and selling hotels since 1991, have acquired a total of 93 hotels in transactions having an aggregate value of approximately $606.8 million, and have sold, transferred or otherwise disposed of a total of 27 hotels in transactions having an aggregate value of approximately $104.6 million.
The majority of our hotels operate under premium franchise brands owned by Marriott International, Inc. (Courtyard by Marriott, Residence Inn, SpringHill Suites, Fairfield Inn and TownePlace Suites), Hilton Worldwide (Hampton Inn, Hampton Inn & Suites and Hilton Garden Inn), IHG (Holiday Inn Express and Staybridge Suites) and an affiliate of Hyatt Hotels Corporation (Hyatt Place). Our franchise mix, by total number of rooms, consists of Marriott (2,754 rooms, or 42%), Hilton Worldwide (1,331 rooms, or 20%), IHG (639 rooms, or 10%), Hyatt Hotels and Resorts (556 rooms, or 9%) and others (1,253 rooms, or 19%). Smith Travel Research classifies 28 of our hotels within the “upscale” segment and 36 of our hotels within the “midscale without food and beverage” segment. We classify our one independent hotel as midscale without food and beverage.
We view 46 of our hotels as seasoned based on their construction date. We consider 19 of our hotels to be unseasoned. Our unseasoned hotels were either built after January 1, 2007 or experienced a brand conversion since January 1, 2008. We believe our unseasoned hotels are in the early stages of stabilizing since their construction or brand conversion occurred during a dramatic economic slowdown. Most of our unseasoned hotels are newer , larger and are located in larger markets than those of our seasoned portfolio and operate under leading premium franchise brands. As a result, we believe our unseasoned hotels are particularly well-positioned to generate RevPAR growth for our portfolio as economic conditions improve. The tables under “—Our Portfolio” below provide information regarding our initial portfolio according to our classification of seasoned and unseasoned.
Since January 1, 2007, we have made approximately $311.0 million of capital investments through development, strategic acquisitions and upgrades and improvements to our hotels to be well-positioned for improving general lodging fundamentals, of which $133.4 million were made in 2007, $52.6 million were made in 2008, $119.4 million were made in 2009 and $5.6 million were made during the nine months ended September 30, 2010. Further, we expect to use up to approximately $10.0 million of the net proceeds of this offering and the concurrent private placement to make additional capital improvements to hotels in our portfolio. We believe the U.S. economy has begun to recover from the recent economic recession and, as a result, lodging industry fundamentals will strengthen over the near-term. As a result, we believe our portfolio is well-positioned for significant internal growth in hotel operating revenues in this environment based on our mix of seasoned hotels and unseasoned hotels.
We intend to generate external growth through disciplined acquisitions of hotels. We believe we will be able to source a significant volume of opportunities through our management team’s extensive network of industry, corporate and institutional relationships, particularly due to the lack of available debt financing in the capital markets and the weakness experienced since mid-2008 in the lodging industry. Similarly, we believe some hotel owners will be unable or unwilling to make capital improvements required by franchisors and will ultimately sell their hotels. Moreover, we have entered into a sourcing agreement with IHG that we believe will enhance our ability to execute our business strategy by potentially providing us with additional attractive acquisition opportunities. The total number of hotels in the upscale and midscale without food and beverage hotel segments, taken together, is more than six times larger than the total number of hotels in
74
the luxury and upper upscale segments, providing a broad potential acquisition pool. We also believe that while other public REITs and well-capitalized institutional owners seek to acquire assets that fit our investment criteria, we will be the only publicly traded REIT focused solely on these segments on a national basis. A key aspect of our strategy is to identify and acquire undermanaged and underperforming hotels and use our expertise to renovate, rebrand and reposition the hotels to improve cash flows and long-term value. Going forward, we plan to focus on acquiring premium-branded limited-service and select-service hotels in the upscale and midscale without food and beverage segments of the lodging industry in both urban and suburban markets.
We have entered into a non-binding letter of intent to purchase a 216-room hotel located in downtown Minneapolis, Minnesota for a purchase price of $10.5 million. If we complete this acquisition, we expect to convert the brand of the hotel after completing significant capital improvements. We expect to complete the purchase in the first quarter of 2011. We have not entered into a definitive purchase agreement for the acquisition of this hotel. We cannot assure you that the seller will be willing to proceed with a transaction, that we will be able to negotiate and execute a satisfactory definitive purchase and sale agreement with the seller, that our due diligence will be satisfactory or that the conditions to closing will be satisfied.
We have entered into a non-binding letter of intent to purchase a 143-room hotel located in Duluth, Georgia and a 121-room hotel located in Glendale (Denver), Colorado for a combined purchase price of $17.0 million. We expect to complete the purchase in the first quarter of 2011. We have not entered into a definitive purchase agreement for the acquisition of these hotels. We cannot assure you the seller will be willing to proceed with a transaction, that we will be able to negotiate and execute a satisfactory definitive purchase and sale agreement with the seller, that our due diligence will be satisfactory or that the conditions to closing will be satisfied.
We were organized as a Maryland corporation on June 30, 2010 and intend to elect to be taxed as a REIT for federal income tax purposes beginning with our short taxable year ending December 31, 2010. We will conduct substantially all of our business through our operating partnership. See “Structure of Our Company.”
Our Competitive Strengths
| § | High-Quality Portfolio of Hotels. Our initial portfolio is composed of 65 hotels with characteristics that we believe will provide a solid platform on which to deliver strong risk-adjusted returns to our stockholders. Our hotels are located in 19 states and have an average age of ten years. No single hotel accounted for more than 3.5% of our predecessor’s hotel operating revenues for the 12-month period ended September 30, 2010, which we believe positions our portfolio to experience more consistent risk-adjusted returns and lower volatility compared to owners with properties more highly concentrated in particular geographic regions. We believe all of our hotels are located in markets where there will be limited growth in lodging supply over the next several years. Additionally, in many of our markets, we own two or more hotels in close proximity to each other, which we believe allows our hotel managers to maintain rate integrity and maximize occupancy by referring travelers to our other hotels. Similarly, franchise areas of protection, which prohibit the opening of hotels with the same brand as one of our hotels within certain proximities of our hotels, provide barriers to entry in suburban markets where many of our hotels are located. |
| § | Seasoned Portfolio and Significant Upside Potential. Our initial portfolio is composed of 46 seasoned hotels with established track records and strong positions within their markets. We classify our other 19 hotels, which were either built after January 1, 2007 or experienced a brand conversion since January 1, 2008, as unseasoned. We believe that the market penetration of our unseasoned hotels is significantly less than that of our seasoned hotels due to the dramatic economic slowdown over the past two years that delayed these hotels from achieving anticipated growth rates and revenues. However, most of our unseasoned hotels operate under premium brands and are newer, larger and are located in larger markets than our seasoned hotels. As a result, we believe our unseasoned hotels can experience significant growth in RevPAR and profitability as the economy and industry fundamentals improve. | |
| § | Experienced Executive Management Team With a Proven Track Record. Our management team, led by our Executive Chairman, Mr. Boekelheide, has extensive experience acquiring, developing, owning, operating, renovating, rebranding and financing hotel properties. Our Executive Chairman, Mr. Boekelheide, our President and Chief Executive Officer, Mr. Hansen, and our Executive Vice President and Chief Operating Officer, Mr. Aniszewski, have extensive experience in the hotel business and have worked together as a team for the last seven years on behalf of our predecessor. Through this experience, our management team has developed strong execution capabilities as well as an extensive network of industry, corporate and institutional relationships, including relationships with the leading lodging franchisors in our targeted markets. We believe these relationships |
75
| will provide insight and access to attractive investment opportunities and allow us to react to local market conditions by seeking the optimal franchise brand for the market in which each of our hotels is located. |
| § | Aggressive Asset Management and Experienced Asset Management Team. We will maintain a dedicated asset management team led by our Executive Vice President and Chief Operating Officer, Mr. Aniszewski, to analyze our portfolio as a whole and oversee our independent hotel managers. Our asset management team has managed hotel assets in every industry segment through multiple hotel business cycles. Our entire asset management team has worked together at The Summit Group for the last ten years, providing us expertise, operational stability and in-depth knowledge of our portfolio. Although we will not manage our hotels directly following this offering, we intend to structure our hotel management agreements to allow us to closely monitor the performance of our hotels. We will work proactively with our hotel managers to continue to drive operational performance by identifying and implementing strategies to optimize hotel profitability through revenue management strategies, budgeting, analyzing cost structure, market positioning, evaluating and making capital improvements and continually reviewing and refining our overall business strategy. We believe that by working with our hotel managers to implement sophisticated revenue management techniques we have the opportunity to enhance revenue performance for our hotels. Among other techniques, we initially will employ three full-time asset managers who will assist our hotel management companies to structure room rate plans and develop occupancy strategies to achieve optimum revenues. |
| § | Strategic Focus on Largest Segments of Lodging Industry. We believe we will be the only publicly traded REIT that focuses exclusively on upscale hotels and midscale without food and beverage hotels on a national basis. According to Smith Travel Research, representative brands in these segments include Courtyard by Marriott, Hilton Garden Inn, Hyatt Place, Homewood Suites, Residence Inn, SpringHill Suites, Staybridge Suites, Fairfield Inn, Hampton Inn, Hampton Inn & Suites, Holiday Inn Express and TownePlace Suites. By number of rooms, 81% of our hotels operate under brands owned by Marriott, Hilton, IHG or Hyatt. These brands are generally regarded as the premium global franchises in our segments. We believe that business and leisure travelers prefer the consistent service and quality associated with these premium brands, and that brand serves as a significant driver of demand for hotel rooms. As reported by Smith Travel Research in 2010, of the approximately 29,735 branded hotels in the United States, 13,066 hotels, or 43.9%, are within our target segments (upscale: 3,536 hotels; midscale without food and beverage: 9,530 hotels). The size of this market represents a potential acquisition pool significantly larger than the upper upscale (1,669 hotels, or 5.6%, of total branded hotels) or luxury (341 hotels, or 1.2%, of total branded hotels) segments. We believe the fragmented ownership of premium-branded limited-service and select-service hotels in the upscale and midscale without food and beverage segments, the size of the segments, our longstanding relationships with franchisors, the lack of well-capitalized competitors and our extensive experience and expertise provide us a distinct competitive advantage and a significant opportunity to profitably grow our company. |
76
| § | Growth-Oriented Capital Structure. Upon completion of this offering and the formation transactions, we expect to employ a prudent leverage structure that will provide us the ability to make strategic acquisitions as industry fundamentals and the lending environment improves. Upon completion of this offering and the concurrent private placement and application of the net proceeds as described in “Use of Proceeds,” we will have approximately $198.4 million in outstanding indebtedness and 33 hotels unencumbered by indebtedness, including 25 hotels with 2,330 rooms operating under premium brands owned by Marriott, Hilton, IHG or Hyatt available to secure future loans. At or shortly after the closing of this offering, the concurrent private placement and the formation transactions, we anticipate entering into a $ million revolving credit facility that we expect will be secured by at least 15 of these properties. We believe our capital structure positions us well to capitalize on what we expect to be significant acquisition opportunities. As described further in “Distribution Policy,” we expect to pay our initial distribution with respect to the period commencing on the date of completion of this offering and ending March 31, 2011 based on a rate of $ per share for a full quarter. On an annualized basis, this would equal approximately $ per share, or an annual distribution rate of approximately % based on an assumed IPO price of $ , the mid-point of the anticipated IPO price range shown on the cover of this prospectus. |
| § | Strategic Relationship with IHG. We have entered into a sourcing agreement with IHG, a global hospitality company with widely recognized, industry-leading brands. We believe this strategic relationship with IHG, as well as IHG’s strong brands and excellent hotel management services, will enhance our ability to execute our business strategy and potentially provide us with additional attractive acquisition opportunities. In addition, an affiliate of IHG has agreed to make a significant equity investment in our common stock concurrent with the completion of this offering. We believe that this equity stake will serve to align IHG’s interests with ours and may provide IHG with added incentive to help us to execute our strategy. For a full description of our relationship with IHG, see “—Relationship with IHG.” |
Our Portfolio
Following completion of this offering and the formation transactions, we will own 65 hotels with a total of 6,533 guestrooms located in 19 states. Our hotels operate under leading brands owned by Marriott International, Inc., Hilton Worldwide, IHG and Hyatt Hotels and Resorts. Except as described in the footnotes to the following table, we will own our hotels in fee simple. All financial and room information is for the 12-month period ended September 30, 2010. The following table provides certain operating information for each of the 65 hotels comprising our initial portfolio:
| Year of | ||||||||||||||||||||||||
| Opening | Twelve Months Ended | |||||||||||||||||||||||
| or Brand | Number of | September 30, 2010 | ||||||||||||||||||||||
Franchise/Brand | Location | Conversion | Rooms | Occupancy(1) | ADR(2) | RevPAR(3) | Segment | |||||||||||||||||
Marriott | ||||||||||||||||||||||||
| Courtyard by Marriott* | Flagstaff, AZ | 2009 | 164 | 60.3 | % | $ | 87.37 | $ | 52.68 | Upscale | ||||||||||||||
| Courtyard by Marriott | Germantown, TN | 2005 | 93 | 64.7 | 93.21 | 60.35 | Upscale | |||||||||||||||||
| Courtyard by Marriott | Jackson, MS | 2005 | 117 | 67.3 | 93.58 | 63.02 | Upscale | |||||||||||||||||
| Courtyard by Marriott | Memphis, TN | 2005 | 96 | 63.8 | 75.13 | 47.90 | Upscale | |||||||||||||||||
| Courtyard by Marriott | Missoula, MT | 2005 | 92 | 63.7 | 102.46 | 65.29 | Upscale | |||||||||||||||||
| Courtyard by Marriott | Scottsdale, AZ | 2003 | 153 | 59.0 | 100.34 | 59.17 | Upscale | |||||||||||||||||
| Fairfield Inn | Baton Rouge, LA | 2004 | 79 | 58.3 | 81.75 | 47.62 | Midscale w/o F&B | |||||||||||||||||
| Fairfield Inn | Bellevue, WA | 1997 | 144 | 60.1 | 103.16 | 61.98 | Midscale w/o F&B | |||||||||||||||||
| Fairfield Inn | Boise, ID | 1995 | 63 | 61.7 | 69.22 | 42.73 | Midscale w/o F&B | |||||||||||||||||
| Fairfield Inn | Denver, CO | 1997 | 161 | 68.8 | 85.11 | 58.52 | Midscale w/o F&B | |||||||||||||||||
| Fairfield Inn | Emporia, KS | 1994 | 57 | 62.6 | 75.63 | 47.38 | Midscale w/o F&B | |||||||||||||||||
| Fairfield Inn | Lakewood, CO | 1995 | 63 | 65.3 | 86.47 | 56.45 | Midscale w/o F&B | |||||||||||||||||
77
| Year of | ||||||||||||||||||||||||
| Opening | Twelve Months Ended | |||||||||||||||||||||||
| or Brand | Number of | September 30, 2010 | ||||||||||||||||||||||
Franchise/Brand | Location | Conversion | Rooms | Occupancy(1) | ADR(2) | RevPAR(3) | Segment | |||||||||||||||||
| Fairfield Inn | Lewisville, TX | 2000 | 71 | 49.0 | % | $ | 74.48 | $ | 36.47 | Midscale w/o F&B | ||||||||||||||
| Fairfield Inn | Salina, KS | 1994 | 63 | 67.8 | 70.66 | 47.91 | Midscale w/o F&B | |||||||||||||||||
| Fairfield Inn | Spokane, WA | 1995 | 86 | 67.8 | 106.75 | 72.41 | Midscale w/o F&B | |||||||||||||||||
| Fairfield Inn & Suites | Germantown, TN | 2005 | 80 | 54.7 | 76.16 | 41.64 | Midscale w/o F&B | |||||||||||||||||
| Residence Inn | Fort Wayne, IN | 2006 | 109 | 67.4 | 94.06 | 63.37 | Upscale | |||||||||||||||||
| Residence Inn | Germantown, TN | 2005 | 78 | 65.5 | 96.83 | 63.42 | Upscale | |||||||||||||||||
Residence Inn*(4) | Portland, OR | 2009 | 124 | 71.1 | 98.16 | 69.76 | Upscale | |||||||||||||||||
| Residence Inn* | Ridgeland, MS | 2007 | 100 | 79.4 | 98.18 | 77.96 | Upscale | |||||||||||||||||
| SpringHill Suites | Baton Rouge, LA | 2004 | 78 | 58.9 | 86.85 | 51.12 | Upscale | |||||||||||||||||
| SpringHill Suites* | Denver, CO | 2007 | 124 | 64.5 | 95.43 | 61.55 | Upscale | |||||||||||||||||
| SpringHill Suites* | Flagstaff, AZ | 2008 | 112 | 64.9 | 86.83 | 56.35 | Upscale | |||||||||||||||||
| SpringHill Suites | Lithia Springs, GA | 2004 | 78 | 49.6 | 75.66 | 37.54 | Upscale | |||||||||||||||||
| SpringHill Suites | Little Rock, AR | 2004 | 78 | 60.6 | 89.34 | 54.11 | Upscale | |||||||||||||||||
| SpringHill Suites | Nashville, TN | 2004 | 78 | 68.9 | 97.55 | 67.23 | Upscale | |||||||||||||||||
| SpringHill Suites | Scottsdale, AZ | 2003 | 123 | 57.2 | 91.93 | 52.57 | Upscale | |||||||||||||||||
| TownePlace Suites | Baton Rouge, LA | 2004 | 90 | 70.0 | 76.24 | 53.39 | Midscale w/o F&B | |||||||||||||||||
| Subtotal/Weighted Average | 2,754 | 63.6 | % | $ | 89.64 | $ | 57.15 | |||||||||||||||||
Hilton | ||||||||||||||||||||||||
| Hampton Inn | Denver, CO | 2003 | 149 | 46.3 | % | $ | 81.36 | $ | 37.68 | Midscale w/o F&B | ||||||||||||||
| Hampton Inn | Fort Collins, CO | 1996 | 75 | 61.1 | 81.75 | 49.95 | Midscale w/o F&B | |||||||||||||||||
Hampton Inn(4) | Fort Smith, AR | 2005 | 178 | 60.2 | 97.10 | 58.43 | Midscale w/o F&B | |||||||||||||||||
| Hampton Inn | Fort Wayne, IN | 2006 | 119 | 62.3 | 90.19 | 56.15 | Midscale w/o F&B | |||||||||||||||||
| Hampton Inn | Medford, OR | 2001 | 75 | 70.4 | 101.10 | 71.13 | Midscale w/o F&B | |||||||||||||||||
| Hampton Inn | Twin Falls, ID | 2004 | 75 | 64.6 | 80.87 | 52.25 | Midscale w/o F&B | |||||||||||||||||
| Hampton Inn | Provo, UT | 1996 | 87 | 72.9 | 86.27 | 62.91 | Midscale w/o F&B | |||||||||||||||||
| Hampton Inn | Boise, ID | 1995 | 63 | 69.8 | 85.77 | 59.84 | Midscale w/o F&B | |||||||||||||||||
| Hampton Inn & Suites* | Bloomington, MN | 2007 | 146 | 72.2 | 113.94 | 82.23 | Midscale w/o F&B | |||||||||||||||||
| Hampton Inn & Suites | El Paso, T X | 2005 | 139 | 82.9 | 109.36 | 90.65 | Midscale w/o F&B | |||||||||||||||||
| Hampton Inn & Suites* | Fort Worth, TX | 2007 | 105 | 67.2 | 111.39 | 74.82 | Midscale w/o F&B | |||||||||||||||||
| Hilton Garden Inn* | Fort Collins, CO | 2007 | 120 | 54.1 | 89.57 | 48.50 | Upscale | |||||||||||||||||
| Subtotal/Weighted Average | 1,331 | 64.7 | % | $ | 95.50 | $ | 62.53 | |||||||||||||||||
IHG | ||||||||||||||||||||||||
| Holiday Inn Express | Boise, ID | 2005 | 63 | 70.7 | % | $ | 77.86 | $ | 55.07 | Midscale w/o F&B | ||||||||||||||
| Holiday Inn Express* | Vernon Hills, IL | 2008 | 119 | 52.5 | 80.99 | 42.56 | Midscale w/o F&B | |||||||||||||||||
| Holiday Inn Express & Suites | Emporia, KS | 2000 | 58 | 77.2 | 87.53 | 67.61 | Midscale w/o F&B | |||||||||||||||||
| Holiday Inn Express & Suites* | Las Colinas, TX | 2007 | 128 | 38.6 | 79.51 | 30.66 | Midscale w/o F&B | |||||||||||||||||
| Holiday Inn Express & Suites | Sandy, UT | 1998 | 88 | 72.8 | 88.05 | 64.09 | Midscale w/o F&B | |||||||||||||||||
| Holiday Inn Express & Suites* | Twin Falls, ID | 2009 | 91 | 58.1 | 86.38 | 50.20 | Midscale w/o F&B | |||||||||||||||||
| Staybridge Suites | Jackson, MS | 2007 | 92 | 65.5 | 86.31 | 56.53 | Midscale w/o F&B | |||||||||||||||||
| Subtotal/Weighted Average | 639 | 59.2 | % | $ | 83.48 | $ | 49.75 | |||||||||||||||||
78
| Year of | ||||||||||||||||||||||||
| Opening | Twelve Months Ended | |||||||||||||||||||||||
| or Brand | Number of | September 30, 2010 | ||||||||||||||||||||||
Franchise/Brand | Location | Conversion | Rooms | Occupancy(1) | ADR(2) | RevPAR(3) | Segment | |||||||||||||||||
Hyatt | ||||||||||||||||||||||||
| Hyatt Place | Atlanta, GA | 2006 | 150 | 81.1 | % | $ | 72.89 | $ | 59.15 | Upscale | ||||||||||||||
| Hyatt Place* | Fort Myers, FL | 2009 | 148 | 32.3 | 76.94 | 24.87 | Upscale | |||||||||||||||||
| Hyatt Place* | Las Colinas, TX | 2007 | 122 | 57.3 | 87.95 | 50.43 | Upscale | |||||||||||||||||
Hyatt Place*(4) | Portland, OR | 2009 | 136 | 61.2 | 80.29 | 49.13 | Upscale | |||||||||||||||||
| Subtotal/Weighted Average | 556 | 58.0 | % | $ | 79.08 | $ | 45.66 | |||||||||||||||||
Choice | ||||||||||||||||||||||||
| Cambria Suites* | Baton Rouge, LA | 2008 | 127 | 67.2 | % | $ | 83.31 | $ | 56.02 | Upscale | ||||||||||||||
| Cambria Suites* | Bloomington, MN | 2007 | 113 | 69.6 | 78.22 | 54.41 | Upscale | |||||||||||||||||
| Cambria Suites* | Boise, ID | 2007 | 119 | 62.4 | 73.37 | 45.78 | Upscale | |||||||||||||||||
| Cambria Suites* | San Antonio, TX | 2008 | 126 | 64.0 | 79.19 | 50.69 | Upscale | |||||||||||||||||
Comfort Inn(4) | Fort Smith, AR | 1995 | 89 | 52.4 | 70.95 | 37.14 | Midscale w/o F&B | |||||||||||||||||
| Comfort Inn | Missoula, MT | 1996 | 52 | 64.2 | 86.67 | 55.63 | Midscale w/o F&B | |||||||||||||||||
| Comfort Inn | Salina, KS | 1992 | 60 | 64.5 | 69.85 | 45.04 | Midscale w/o F&B | |||||||||||||||||
| Comfort Inn & Suites | Twin Falls, ID | 1992 | 111 | 65.9 | 68.77 | 45.31 | Midscale w/o F&B | |||||||||||||||||
| Comfort Suites | Charleston, WV | 2001 | 67 | 73.2 | 94.11 | 68.94 | Midscale w/o F&B | |||||||||||||||||
| Comfort Suites | Fort Worth, TX | 1999 | 70 | 50.5 | 83.77 | 42.29 | Midscale w/o F&B | |||||||||||||||||
| Comfort Suites | Lakewood, CO | 1995 | 62 | 64.3 | 83.03 | 53.38 | Midscale w/o F&B | |||||||||||||||||
| Subtotal/Weighted Average | 996 | 63.8 | % | $ | 78.40 | $ | 50.12 | |||||||||||||||||
Starwood | ||||||||||||||||||||||||
| Aloft* | Jacksonville. FL | 2009 | 136 | 57.2 | % | $ | 63.29 | $ | 36.20 | Upscale | ||||||||||||||
Carlson | ||||||||||||||||||||||||
| Country Inn & Suites By Carlson | Charleston, WV | 2001 | 64 | 76.2 | 95.85 | 73.06 | Midscale w/o F&B | |||||||||||||||||
Independent | ||||||||||||||||||||||||
| Aspen Hotel & Suites | Fort Smith, AR | 2003 | 57 | 51.3 | 64.81 | 33.27 | Midscale w/o F&B | |||||||||||||||||
Total/Weighted Average | 6,533 | 62.8 | % | $ | 86.91 | $ | 54.98 | |||||||||||||||||
| * | Unseasoned hotel. | |
| (1) | Occupancy represents the percentage of available rooms that were sold during a specified period of time and is calculated by dividing the number of rooms sold by the total number of rooms available, expressed as a percentage. | |
| (2) | ADR represents the average rate paid for rooms sold, calculated by dividing room revenue (i.e., excluding food and beverage revenues or other hotel operations revenues such as telephone, parking and other guest services) by rooms sold. |
| (3) | RevPAR is the product of ADR and occupancy. RevPAR does not include food and beverage revenues or other hotel operations revenues such as telephone, parking and other guest services. |
| (4) | These hotels are subject to ground leases. See “Our Hotel Operating Agreements—Ground Lease Agreements.” |
RevPAR Penetration Index
We assess the market share of each of our hotels by analyzing the RevPAR penetration index of each hotel and changes in this number for each hotel over time. A hotel’s RevPAR penetration index is its RevPAR divided by the weighted-average RevPAR of the hotels that our management has determined to be in that hotel’s competitive set. A RevPAR penetration index of 100 would indicate that a hotel’s RevPAR, and hence its market share, is, on average, the same as its competitors’. A RevPAR penetration index exceeding 100 would indicate that a hotel maintains a RevPAR
79
premium in relation to its competitive set, while a RevPAR penetration index below 100 would be an indicator that a hotel is underperforming as compared to its competitive set.
One critical component of the RevPAR penetration index calculation, which Smith Travel Research performs based on data that it collects from us and from other hotel owners, is the hotel’s competitive set. We determine the competitive set of each of our hotels and submit the relevant hotels to Smith Travel Research for purposes of calculating each hotel’s RevPAR penetration index. Smith Travel Research established the following guidelines for determining competitive sets:
| § | the competitive set must include a minimum of three hotels (other than our own hotel) that have provided data to Smith Travel Research for any of the three months preceding a report, or participating hotels; | |
| § | no single company (other than us) can exceed 60% of the total room supply of the participating hotels of the competitive set; | |
| § | no single hotel (excluding our hotel) or brand can represent more than 40% of the total room supply of the competitive set; and | |
| § | the competitive set must include at least two brands other than that of our hotel. |
We determine our competitive sets in accordance with the Smith Travel Research guidelines. Within these guidelines, the factors that we consider in determining a hotel’s competitive set include hotel segment and geographic proximity based on franchise area of protection. For example, for an upscale property in a suburban market, we generally would include in that hotel’s competitive set each upscale property within a five-mile radius of our hotel. Our methodology for determining a hotel’s competitive set may differ materially from that used by other owners or managers.
The following tables set forth the RevPAR penetration index for each of the hotels in our seasoned and unseasoned portfolios for the twelve-month period ended September 30, 2010.
RevPAR Penetration Index—Seasoned Portfolio
For the Twelve Months Ended September 30, 2010
For the Twelve Months Ended September 30, 2010
| RevPAR | ||||||
Hotel | Location | Penetration Index | ||||
Marriott | ||||||
| Courtyard by Marriott | Germantown, TN | 101.0 | % | |||
| Courtyard by Marriott | Jackson, MS | 109.6 | ||||
| Courtyard by Marriott | Memphis, TN | 99.9 | ||||
| Courtyard by Marriott | Missoula, MT | 116.0 | ||||
| Courtyard by Marriott | Scottsdale, AZ | 120.6 | ||||
| Fairfield Inn | Baton Rouge, LA | 125.8 | ||||
| Fairfield Inn | Bellevue, WA | 115.3 | ||||
| Fairfield Inn | Boise, ID | 146.0 | ||||
| Fairfield Inn | Denver, CO | 114.0 | ||||
| Fairfield Inn | Emporia, KS | 124.6 | ||||
| Fairfield Inn | Lakewood, CO | 121.3 | ||||
| Fairfield Inn | Lewisville, TX | 86.5 | ||||
| Fairfield Inn | Salina, KS | 125.9 | ||||
| Fairfield Inn | Spokane, WA | 131.9 | ||||
| Fairfield Inn & Suites | Germantown, TN | 109.2 | ||||
| Residence Inn | Fort Wayne, IN | 110.9 | ||||
| Residence Inn | Germantown, TN | 111.8 | ||||
| SpringHill Suites | Baton Rouge, LA | 92.4 | ||||
| SpringHill Suites | Lithia Springs, GA | 96.5 | ||||
| SpringHill Suites | Little Rock, AR | 100.0 | ||||
| SpringHill Suites | Nashville, TN | 132.6 | ||||
| SpringHill Suites | Scottsdale, AZ | 112.3 | ||||
| TownePlace Suites | Baton Rouge, LA | 161.6 | ||||
80
| RevPAR | ||||||
Hotel | Location | Penetration Index | ||||
Hilton | ||||||
| Hampton Inn | Denver, CO | 79.9 | % | |||
| Hampton Inn | Fort Collins, CO | 118.5 | ||||
| Hampton Inn | Fort Smith, AR | 128.8 | ||||
| Hampton Inn | Fort Wayne, IN | 110.2 | ||||
| Hampton Inn | Medford, OR | 125.3 | ||||
| Hampton Inn | Twin Falls, ID | 133.8 | ||||
| Hampton Inn | Provo, UT | 126.8 | ||||
| Hampton Inn | Boise, ID | 124.3 | ||||
| Hampton Inn & Suites | El Paso, TX | 139.0 | ||||
IHG | ||||||
| Holiday Inn Express | Boise, ID | 144.6 | ||||
| Holiday Inn Express & Suites | Emporia, KS | 195.5 | ||||
| Holiday Inn Express & Suites | Sandy, UT | 137.3 | ||||
| Staybridge | Jackson, MS | 126.6 | ||||
Hyatt | ||||||
| Hyatt Place | Atlanta, GA | 101.0 | ||||
Choice | ||||||
| Comfort Inn | Fort Smith, AR | 108.4 | ||||
| Comfort Inn | Missoula, MT | 135.3 | ||||
| Comfort Inn | Salina, KS | 148.0 | ||||
| Comfort Inn & Suites | Twin Falls, ID | 129.3 | ||||
| Comfort Suites | Charleston, WV | 105.4 | ||||
| Comfort Suites | Fort Worth, TX | 103.8 | ||||
| Comfort Suites | Lakewood, CO | 122.1 | ||||
Carlson | ||||||
| Country Inn & Suites By Carlson | Charleston, WV | 114.0 | ||||
Independent | ||||||
| Aspen Hotel & Suites | Fort Smith, AR | 80.9 | ||||
Weighted average (based on number of rooms) | 118.3 | % | ||||
81
RevPAR Penetration Index—Unseasoned Portfolio
For the Twelve Months Ended September 30, 2010
For the Twelve Months Ended September 30, 2010
| RevPAR | ||||||
Hotel | Location | Penetration Index | ||||
Marriott | ||||||
| Courtyard by Marriott | Flagstaff, AZ | 84.4 | % | |||
| Residence Inn | Portland, OR | 114.9 | ||||
| Residence Inn | Ridgeland, MS | 128.8 | ||||
| SpringHill Suites | Denver, CO | 93.7 | ||||
| SpringHill Suites | Flagstaff, AZ | 92.4 | ||||
Hilton | ||||||
| Hampton Inn & Suites | Bloomington, MN | 116.0 | ||||
| Hampton Inn & Suites | Fort Worth, TX | 116.4 | ||||
| Hilton Garden Inn | Fort Collins, CO | 96.0 | ||||
IHG | ||||||
| Holiday Inn Express | Vernon Hills, IL | 87.7 | ||||
| Holiday Inn Express & Suites | Las Colinas, TX | 64.3 | ||||
| Holiday Inn Express & Suites | Twin Falls, ID | 128.7 | ||||
Hyatt | ||||||
| Hyatt Place | Fort Myers, FL | 51.2 | ||||
| Hyatt Place | Las Colinas, TX | 86.8 | ||||
| Hyatt Place | Portland, OR | 76.8 | ||||
Choice | ||||||
| Cambria Suites | Baton Rouge, LA | 89.9 | ||||
| Cambria Suites | Bloomington, MN | 77.5 | ||||
| Cambria Suites | Boise, ID | 92.7 | ||||
| Cambria Suites | San Antonio, TX | 77.4 | ||||
Starwood | ||||||
| Aloft | Jacksonville, FL | 65.8 | ||||
Weighted average (based on number of rooms) | 90.0 | % | ||||
82
In addition to these hotel properties, our predecessor owns the following parcels of vacant land that we believe are suitable for the development of new hotels, the possible expansion of existing hotels or the development of restaurants in proximity to certain of our predecessor’s hotels:
Location | Potential Use | Acres | ||||
| Flagstaff, Arizona | Development of one restaurant pad | 2.0 | ||||
| Jacksonville, Florida | Development of one hotel | 3.3 | ||||
| Ft. Myers, Florida | Development of one or two restaurant pads | 3.1 | ||||
| Boise, Idaho | Development of one hotel | 3.1 | ||||
| Boise, Idaho | Possible expansion of existing hotel | 2.3 | ||||
| Boise, Idaho | Possible expansion of existing hotel | 1.0 | ||||
| Twin Falls, Idaho | Development of one hotel | 2.5 | ||||
| Missoula, Montana | Development of one hotel | 2.2 | ||||
| El Paso, Texas | Development of two hotels | 5.0 | ||||
| Houston, Texas | Development of one hotel | 2.8 | ||||
| San Antonio, Texas | Development of one hotel | 2.6 | ||||
| San Antonio, Texas | Development of two hotels | 6.0 | ||||
| San Antonio, Texas | Development of two restaurant pads | 3.0 | ||||
| Spokane, Washington | Development of two hotels | 4.6 | ||||
We have no current intention of developing new hotels or restaurants or expanding any of our existing hotels at these parcels. We may in the future sell these parcels when market conditions warrant. To reduce the risk of incurring a prohibited transaction tax on any sales, we may transfer some or all of those parcels of undeveloped land to Summit TRS or another TRS.
Our Growth Strategies and Investment Criteria
Our primary objective is to enhance stockholder value over time by generating strong risk-adjusted returns for our stockholders. We believe we can create long-term value by pursuing the following strategies.
| § | Internal Growth from Strengthening Lodging Industry Fundamentals. Since January 1, 2007, we have made approximately $311.0 million of capital investments through development, strategic acquisitions and upgrades and improvements to our hotels to be well-positioned for improving general lodging fundamentals. We believe our hotels will experience significant revenue growth as lodging industry fundamentals recover from the economic recession which caused industry-wide RevPAR to suffer a combined 18.4% decline in 2008 and 2009, according to Smith Travel Research. Industry conditions have shown improvement during the first nine months of 2010, with RevPAR growth across all segments of 4.5% as compared to the same period of 2009, according to Smith Travel Research. Colliers PKF Hospitality Research forecasts significant compound annual growth in RevPAR from 2010 to 2014 of 7.0% for the upscale segment and 8.5% for the midscale without food and beverage segment, among the largest for any segment in the industry. We believe both our seasoned and unseasoned hotels will benefit from these improving fundamentals. In particular, we expect our unseasoned hotels to contribute significantly to cash flow as the hotels continue to stabilize. In addition, we believe the significant recent capital investments in our hotels will position our hotels to outperform their competitors during this recovery period. |
| § | Disciplined Acquisition of Hotels. We intend to grow through acquisitions of existing hotels using a disciplined and targeted approach while maintaining a prudent capital structure. Our expectation is that the current lodging cycle will present us with many favorable acquisition opportunities, as hotel owners seek to exit distressed investments or minimize refinancing risks through hotel sales. We also believe that franchisors may be interested in focusing their capital on hotel management as opposed to ownership, which could enable us to leverage our relationships with our brand partners to acquire hotels directly from them in off-market transactions. We believe that our strategic relationship with IHG will also potentially provide us with attractive acquisition opportunities. In this favorable acquisition environment, we will actively screen investment opportunities, analyzing changing business demand dynamics, consumer habits and the landscape of city development. In addition, we employ a proactive and continuous assessment of our hotels, markets and brands in order to quickly and efficiently |
83
| upgrade our hotels as market conditions warrant. We intend to target upscale and midscale without food and beverage hotels that meet one or more of the following acquisition criteria including: |
| – | have potential for strong risk-adjusted returns located in the top 50 MSAs, with a secondary focus on the next 100 markets; |
| – | operate under leading franchise brands, which may include but are not limited to Marriott, Hilton, IHG and Hyatt; |
| – | are located in close proximity to multiple demand generators, including businesses and corporate headquarters, retail centers, airports, medical facilities, tourist attractions, and convention centers, with a diverse source of potential guests, including corporate, government and leisure travelers; | |
| – | are located in markets exhibiting barriers to entry due to strong franchise areas of protection or other factors; | |
| – | can be acquired at a discount to replacement cost; and | |
| – | provide an opportunity to add value through operating efficiencies, repositioning, renovating or rebranding. |
| § | Selective Hotel Development. We believe there will be attractive opportunities to partner on a selective basis with experienced hotel developers to acquire upon completion newly constructed hotels that meet our investment criteria. In reviewing these opportunities, we target markets exhibiting one or more of the following characteristics: |
| – | no suitable and appropriately priced existing hotel in the market that is available for purchase; | |
| – | demonstrated demand in the market for upscale hotels or midscale without food and beverage hotels; | |
| – | barriers to entry of additional new hotels from franchise areas of protection; | |
| – | availability of a high-quality franchise appropriate for the market; and | |
| – | availability of a high-quality franchise near one of our existing hotels that could otherwise compete with us. |
| § | Strategic Hotel Sales. Our strategy is to acquire and own hotels. However, consistent with our strategy of maximizing the cash flow of our portfolio and our return an invested capital, we periodically review our hotels to determine if any significant changes to area markets or our hotels have occurred or are anticipated to occur that would warrant the sale of a particular hotel. We also consistently evaluate the best way to optimize our portfolio and return on invested capital. The factors we use in evaluating whether to sell a hotel include, among others: |
| – | quality of brand; | |
| – | new hotel supply; | |
| – | age of the hotel; | |
| – | cost of renovation; | |
| – | major infrastructure expansion; | |
| – | changes to major area employers; | |
| – | changes to hotel demand generators; | |
| – | ability to profitably invest the proceeds of a sale; and | |
| – | tax consequences of a sale. |
In addition, we may sell older hotels in markets where we own a single hotel, or where we own only one hotel franchised with a particular franchisor.
Our Financing Strategy
We expect to maintain a prudent capital structure and intend to limit the sum of the outstanding principal amount of our consolidated net indebtedness to not more than 5.5x of our EBITDA for the 12-month period preceding the incurrence
84
of such debt. Over time, we intend to finance our long-term growth with common and preferred equity issuances and debt financing having staggered maturities. Our debt may include mortgage debt secured by hotels and unsecured debt.
We are in discussions to obtain a secured revolving credit facility that we anticipate will be in place at or shortly after the completion of this offering. The proposed secured revolving credit facility may be used to fund hotel acquisitions and capital expenditures, to repay existing debt encumbering borrowing base properties and for general corporate purposes. We cannot provide any assurance that we will be able to enter into a definitive agreement to obtain this secured revolving credit facility on terms we find acceptable. See “Management’s Discussion and Analysis of Financial Condition and Results of Operations—Liquidity and Capital Resources—Our Anticipated Secured Revolving Credit Facility—Conditions to Effectiveness. Over time, as market conditions permit, we intend to finance our growth with issuances of common equity, preferred equity and secured and unsecured debt having staggered maturities.
When purchasing hotel properties, we may issue OP units as full or partial consideration to sellers who may desire to take advantage of tax deferral on the sale of a hotel or participate in the potential appreciation in value of our common stock.
Our Industry and Market Opportunity
Following the global economic recession in recent years, the U.S. economy is showing signs of stabilization, and lodging industry experts are projecting a strong recovery in fundamentals over the next several years.
Focus on Premium Brands and Segments
We focus on hotels in the upscale and midscale without food and beverage segments of the lodging industry. Within these segments, we target hotels operating under premium franchise brands such as Courtyard by Marriott, Hilton Garden Inn, Hyatt Place, Homewood Suites, Residence Inn, SpringHill Suites, Staybridge Suites, Fairfield Inn, Hampton Inn, Hampton Inn & Suites, Holiday Inn Express and TownePlace Suites.
We believe that our focus on these segments provides us the opportunity to achieve stronger risk-adjusted returns across multiple lodging cycles than if we owned hotels in other segments of the lodging industry for several reasons, including:
| • | RevPAR Growth. Colliers PKF Hospitality Research forecasts that our two market segments will experience among the largest amount of RevPAR growth of any segment in the industry, as shown in the following chart. |
| • | Consistently Strong and Growing Demand. As shown in the chart below, over the last twenty years, our market segments have demonstrated the strongest compounded growth in demand of all segments of the lodging industry, and strong demand growth is expected to continue. |
85
Historical vs. Forecast Compound Average Annual Demand Change
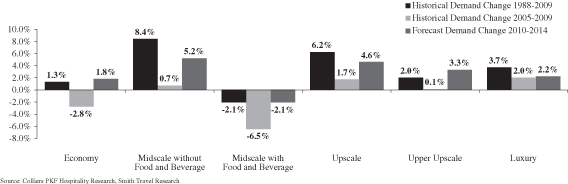
| • | More Stable Cash Flow Potential. Our hotels can be operated with fewer employees than full-service hotels that offer more expansive food and beverage options, which we believe enables us to generate more consistent cash flows with less volatility resulting from reductions in RevPAR and less dependence on group travel. |
| • | Broad Customer Base. Our target brands deliver consistently high-quality hotel accommodations with value-oriented pricing that we believe appeals to a wider range of customers, including both business and leisure travelers, than more expensive full-service hotels. We believe that our hotels are particularly popular with frequent business travelers who seek to stay in hotels operating under Marriott, Hilton, Hyatt or IHG brands, which offer strong loyalty rewards program points that can be redeemed for family travel. |
| • | Enhanced Diversification. Premium-branded limited-service and select-service assets generally cost significantly less, on a per-key basis, than hotels in the midscale with food and beverage, upper upscale and luxury segments of the industry. As a result, we can diversify our ownership into a larger number of hotels than we could in other segments. |
Lodging Industry Fundamentals
Beginning in August 2008, the U.S. lodging industry experienced 19 consecutive months of RevPAR declines, as measured against the same month in the prior year, driven by a combination of deterioration in room-night demand and increasing supply. According to Smith Travel Research, hotel room-night demand decreased 2.3% and 6.0% in 2008 and 2009, respectively, marking the greatest decline in the past 22 years. Conversely, room supply growth of 2.5% and 3.0% in 2008 and 2009, respectively, exceeded the historical average of 2.2%, as construction initiated prior to the economic downturn was completed. For the year ended December 31, 2009, average annual hotel occupancy in the United States was 54.7%, representing the lowest annual level in the past 22 years and well below the industry average of 62.2% for that period. Deteriorating demand and increasing supply led to a combined 18.4% decline in RevPAR in 2008 and 2009.
Although the lodging industry has historically lagged broader economic recoveries, economic fundamentals are beginning to improve from the recent declines resulting from the recessionary environment. In September 2010, the U.S. unemployment rate continued to show improvement from its high in late 2009. After continuing declines for almost two years prior, September 2010 marked the U.S. lodging industry’s eighth consecutive month of positive year-over-year RevPAR growth with an 8.8% increase.
We believe that, until lodging industry fundamentals and credit terms return to more attractive levels, proposed new hotel development will not generate the returns necessary to justify the construction of new hotels. According to Smith Travel Research, RevPAR increased 4.9% and 2.9% in our target upscale and midscale without food and beverage segments, respectively, for the first nine months of 2010 as compared to the same period of 2009, and we expect RevPAR growth to continue as the U.S. economy continues to strengthen. Colliers PKF Hospitality Research currently projects RevPAR growth of upscale hotels to be 4.2% in 2011, 11.1% in 2012 and 9.5% in 2013 and RevPAR growth of midscale without food and beverage hotels to be 5.9% in 2011, 12.2% in 2012 and 10.9% in 2013, among the highest in any industry segment. We expect that our hotels, and particularly our unseasoned hotels, will realize significant RevPAR gains as the economy and lodging industry improve.
86
Demand Overview
Room-night demand in the U.S. lodging industry is directly correlated to macroeconomic trends. Key drivers of demand include growth in GDP, corporate profits, capital investments and employment. Following periods of recession, recovery in room-night demand for lodging historically has lagged improvements in the overall economy.
According to the International Monetary Fund, or the IMF, U.S. GDP increased 0.4% in 2008 and decreased 2.4% in 2009 during which periods room-night demand declined 2.3% and 6.0% respectively, as measured by Smith Travel Research. The IMF is forecasting GDP growth of 2.6% and 2.3% in 2010 and 2011 respectively, and Colliers PKF Hospitality Research expects that room-night demand will grow at similar rates over those years as the U.S. economy improves. The following chart illustrates the correlation between U.S. GDP and demand for hotel rooms.
Annual Percentage Change in U.S. Hotel Room Demand vs. U.S. GDP Growth
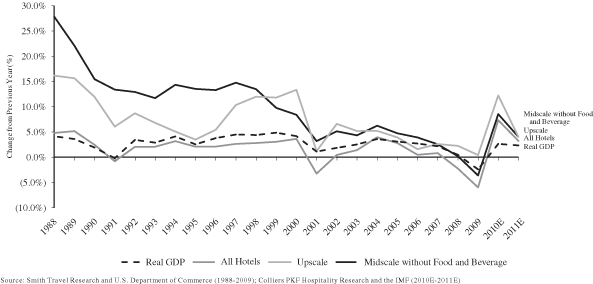
With expected growth in room-night demand and limited new supply, occupancy is projected to increase from industry lows experienced in 2009.
U.S. Hotel Industry Annual Occupancy
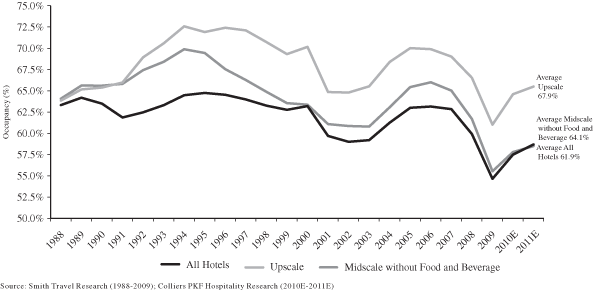
87
Supply Overview
Growth in lodging supply typically lags growth in room-night demand. Key drivers of lodging supply in a given market include the availability and cost of capital, construction costs, local real estate market conditions and availability and pricing of existing properties. Given the decline in room-night demand and inefficiencies in the financing market nationally, new hotel construction is expected to remain below historical averages through 2014 according to Colliers PKF Hospitality Research. The charts appearing below outline the relationship between supply and demand of hotel rooms in the upscale and midscale without food and leverage segments of the U.S. lodging industry over the last 22 years.
As a result of scarcity of financing, severe recession and declining operating fundamentals during 2008 and 2009, many planned hotel developments have been cancelled or postponed, and the number of rooms under construction and in planning has declined significantly. According to Lodging Econometrics, during the third quarter of 2010, approximately 62,000 new hotel rooms were under construction in the U.S., as compared to approximately 242,000 rooms under construction in the second quarter of 2008, a decline of 74%. Accordingly, Colliers PKF Hospitality Research has projected room supply to increase 1.1% in 2011, increase 0.8% in 2012 and increase 1.2% and 2.3% in 2013 and 2014, respectively. The projected 1.5% average annual growth in supply from 2010 to 2014 is significantly below the 2.2% annual average from 1988 to 2009. We believe this below-average projected supply growth is due to scarcity of financing for hotel properties and operating fundamentals that do not generate adequate returns relative to the cost of new hotel construction. The lodging industry is influenced significantly by the cyclical relationship between the supply of and demand for hotels and, as a result, we believe minimal new room supply growth will create an environment favorable for sustainable increases in hotel occupancy, ADR and RevPAR. The following charts show annual historical and projected change in RevPAR, room demand and room supply:
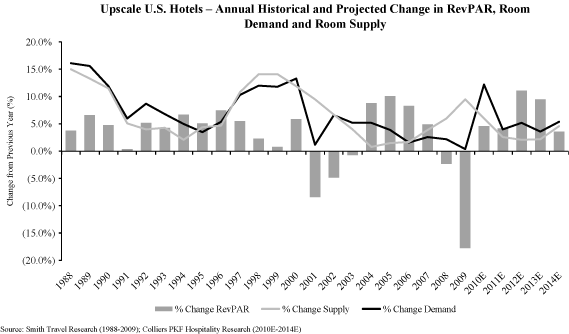
88
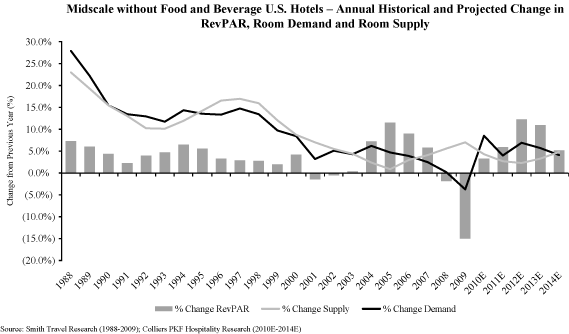
Attractive Transaction Landscape
We believe that the significant decline in lodging fundamentals and subsequent declines in of cash flows has created a difficult environment for undercapitalized hotel owners. Hotel-related CMBS delinquency rates have steadily increased since January 2009 as many hotel owners have been unable to fund debt service payments. As of September 30, 2010, approximately 15.2% of all hotel-related CMBS was delinquent compared to just 1.5% delinquent as of January 2009. The following chart shows hotel delinquency rates and amounts from January 2009 to September 2010.
Hotel CMBS Delinquency Rates and Amounts

89
Without sufficient cash flow, many hotel owners may be unable to fund the capital improvements required to maintain their properties’ brand standards. Additionally, hotel owners could face additional future financing issues arising from existing debt obligations and, according to Bloomberg, L.P., upcoming maturities with approximately $27.3 billion of hotel-related commercial mortgage-backed securities, or CMBS, are scheduled to mature through 2013 and a significant number of additional maturities are expected between 2015 and 2017. The following chart shows future maturities of hotel-related CMBS.
Hotel CMBS Maturities
We believe traditional lending sources, such as banks, insurance companies and pension funds, have adopted more conservative lending policies and have materially reduced lending exposure to hotels as a result of the recent recessionary environment. We also believe that the significant number of hotel properties experiencing substantial declines in operating cash flow, coupled with tight credit markets, near-term debt maturities and, in some instances, covenant defaults relating to outstanding indebtedness, will present attractive investment opportunities in the lodging industry. Accordingly, we believe our conservative balance sheet upon completion of this offering will allow us to take advantage of opportunities to acquire hotel properties at prices significantly below replacement cost, with substantial appreciation potential as the U.S. economy recovers from the current recession.
Relationship with IHG
We have entered into a sourcing agreement with IHG. IHG is a global hospitality company with widely recognized, industry leading brands. IHG manages, franchises, owns and develops IHG-branded hotels, resorts and residential and vacation ownership properties around the world. As of November 30, 2010, IHG or its subsidiaries franchise, lease, manage or own over 4,500 hotels and more than 650,000 guest rooms in 100 countries and territories around the world. IHG operates full-service hotels under four world-recognized brands: InterContinental®, Crowne Plaza®, Holiday Inn® and Indigo®. Additionally, IHG operates three select-service brands: Holiday Inn Express, Staybridge Suites and Candlewood Suites®.
We believe that our sourcing relationship with IHG will enhance our ability to execute our business strategy by potentially providing us with additional attractive acquisition opportunities. Pursuant to the sourcing agreement with IHG, we will, for five years following the completion of this offering, provide IHG with an exclusive right of first offer to franchise or manage each hotel we acquire, but only to the extent those properties are, or during the term of the sourcing agreement become, free of franchise or management arrangements with third parties and we determine, in our sole discretion, to brand those properties, whether with an IHG brand or any other brand. The sourcing agreement provides that IHG may, in its sole discretion, identify and refer acquisition opportunities to us. We believe that our relationship with IHG will benefit our stockholders as a result of IHG’s strong brands and excellent hotel management services. We plan to continue to
90
explore with IHG how to further our sourcing relationship in order to maximize the value of the relationship to both parties. However, IHG will not be obligated to refer any potential acquisition opportunities to us and there can be no assurance that the sourcing agreement will result in the consummation of any transaction between IHG and us.
Concurrently with this offering, we will sell in a separate private placement to an affiliate of IHG $12.5 million in shares of our common stock (subject to a maximum investment of 4.9% of the total number of shares to be sold in this offering, excluding any shares sold pursuant to the underwriters’ over-allotment option) at a price per share equal to the IPO price per share less the underwriting discount. The closing of the concurrent private placement is contingent upon the completion of this offering; however, the closing of this offering is not contingent upon the closing of the concurrent private placement. We believe that this equity stake will serve to align IHG’s interests with ours and may provide IHG with added incentive to help us to execute our business strategy. In addition, IHG will enter into a lock-up agreement with us, pursuant to which it will agree, subject to the terms and conditions of the lock-up agreement (including specific limited exceptions), not to sell the shares purchased in the concurrent private placement for one year.
Regulation
Our properties are subject to various covenants, laws, ordinances and regulations, including regulations relating to accessibility, fire and safety requirements. We believe each of our initial hotels has the necessary permits and approvals to operate its business.
Americans with Disabilities Act
Our properties must comply with Title III of the ADA to the extent that they are “public accommodations” as defined by the ADA. Under the ADA, all public accommodations must meet federal requirements related to access and use by disabled persons. The ADA may require removal of structural barriers to access by persons with disabilities in certain public areas of our properties where removal is readily achievable. Although we believe the properties in our portfolio substantially comply with present requirements of the ADA, we have not conducted a comprehensive audit or investigation of all of our properties to determine our compliance, and we are aware that some particular properties may currently be in non-compliance with the ADA. Noncompliance with the ADA could result in the incurrence of additional costs to attain compliance. The obligation to make readily achievable accommodations is an ongoing one, and we will continue to assess our properties and to make alterations as appropriate in this respect.
Environmental, Health and Safety Matters
Our hotels and development parcels are subject to various federal, state and local environmental laws that impose liability for contamination. Under these laws, governmental entities have the authority to require us, as the current owner of property, to perform or pay for the clean up of contamination (including hazardous substances, waste, or petroleum products) at, on, under or emanating from the property and to pay for natural resource damages arising from contamination. These laws often impose liability without regard to whether the owner or operator or other responsible party knew of, or caused the contamination, and the liability may be joint and several. Because these laws also impose liability on persons who owned a property at the time it became contaminated, we could incur cleanup costs or other environmental liabilities even after we sell properties. Contamination at, on, under or emanating from our properties also may expose us to liability to private parties for costs of remediation, personal injury and death and/or property damage. In addition, environmental liens may be created on contaminated sites in favor of the government for damages and costs it incurs to address contamination. If contamination is discovered on our properties, environmental laws also may impose restrictions on the manner in which property may be used or businesses may be operated, and these restrictions may require substantial expenditures. Moreover, environmental contamination can affect the value of a property and, therefore, an owner’s ability to borrow funds using the property as collateral or to sell the property on favorable terms or at all. Furthermore, persons who sent waste to a waste disposal facility, such as a landfill or an incinerator, may be liable for costs associated with cleanup of that facility.
Some of our properties may have contained historic uses which involved the use and/or storage of hazardous chemicals and petroleum products (for example, storage tanks, gas stations, dry cleaning operations) which, if released, could have impacted our properties. In addition, some of our properties may be near or adjacent to other properties that have contained or currently contain storage tanks containing petroleum products or conducted or currently conduct
91
operations which utilize other hazardous or toxic substances. Releases from these adjacent or surrounding properties could impact our properties and we may be liable for any associated cleanup.
Independent environmental consultants conducted Phase I environmental site assessments on all of our properties prior to acquisition and we intend to conduct Phase I environmental site assessments on properties we acquire in the future. Phase I site assessments are intended to discover and evaluate information regarding the environmental condition of the surveyed properties and surrounding properties. These assessments do not generally include soil sampling, subsurface investigations, comprehensive asbestos surveys or mold investigations. In some cases, the Phase I environmental site assessments were conducted by another entity (i.e., a lender) and we may not have the authority to rely on such reports. Except for our Bloomington, Minnesota hotels, and our Cambria Suites hotel located in San Antonio, Texas, none of the Phase I environmental site assessments of the hotel properties in our initial portfolio revealed any past or present environmental condition that we believe could have a material adverse effect on our business, assets or results of operations. Soil and groundwater contamination at the site of our Bloomington, Minnesota hotels was voluntarily remediated by our predecessor to the satisfaction of the Minnesota Pollution Control Agency. A material liability could arise in the future if the contamination at the site of the Bloomington, Minnesota hotels impacted third parties or an adjacent property if the Minnesota agency requires further clean-up or if our predecessor’s clean-up does not satisfy the U.S. Environmental Protection Agency. Soil and groundwater contamination was also identified in an undeveloped portion of our property adjacent to our Cambria Suites hotel located in San Antonio, Texas. The property was sampled on two occasions, after which our environmental consultant recommended no further action unless the contaminated soil was disturbed. A material liability could arise in the future if the contamination impacts an adjacent property or if we are required to remediate it. In addition, the Phase I environmental site assessments may also have failed to reveal all environmental conditions, liabilities or compliance concerns. The Phase I environmental site assessments were completed at various times within the past seven and one-half years and material environmental conditions, liabilities or compliance concerns may have arisen after the review was completed or may arise in the future; and future laws, ordinances or regulations may impose material additional environmental liability.
In addition, our hotels (including our real property, operations and equipment) are subject to various federal, state and local environmental, health and safety regulatory requirements that address a wide variety of issues, including, but not limited to, the registration, maintenance and operation of our boilers and storage tanks, the supply of potable water to our guests, air emissions from emergency generators, storm water and wastewater discharges, protection of natural resources, asbestos, lead-based paint, mold and mildew, and waste management. Some of our hotels also routinely handle and use hazardous or regulated substances and wastes as part of their operations, which are subject to regulation (for example, swimming pool chemicals or biological waste). Our hotels incur costs to comply with these environmental, health and safety laws and regulations and if these regulatory requirements are not met or unforeseen events result in the discharge of dangerous or toxic substances at our hotels, we could be subject to fines and penalties for non-compliance with applicable laws and material liability from third parties for harm to the environment, damage to real property or personal injury and death. We are aware of no past or present environmental liability for non-compliance with environmental, health and safety laws and regulations that we believe would have a material adverse effect on our business, assets or results of operations.
Certain hotels we currently own or those we acquire in the future contain, may contain, or may have contained, ACM. Environmental, health and safety laws require that ACM be properly managed and maintained, and include requirements to undertake special precautions, such as removal or abatement, if ACM would be disturbed during maintenance, renovation, or demolition of a building. These laws regarding ACM may impose fines and penalties on building owners, employers and operators for failure to comply with these requirements or expose us to third-party liability.
When excessive moisture accumulates in buildings or on building materials, mold growth may occur, particularly if the moisture problem remains undiscovered or is not addressed over a period of time. Some molds may produce airborne toxins or irritants. Indoor air quality issues can also stem from inadequate ventilation, chemical contamination from indoor or outdoor sources, and other biological contaminants such as pollen, viruses and bacteria. Indoor exposure to airborne toxins or irritants above certain levels can be alleged to cause a variety of adverse health effects and symptoms, including allergic or other reactions. As a result, the presence of significant mold or other airborne contaminants at any of our properties could require us to undertake a costly remediation program to contain or remove the mold or other airborne contaminants from the affected property or increase indoor ventilation. For example, a large-scale remediation took place at the Amerisuites Las Colinas/Hidden Ranch hotel in 2002 and we expended roughly $500,000 to complete the renovation. In addition, the presence of significant mold or other airborne contaminants could expose us to material liability
92
from third parties if property damage or personal injury occurs. We are not presently aware of any indoor air quality issues at our properties that would result in a material adverse effect on our business, assets or results of operations.
Insurance
We carry comprehensive liability, fire, earthquake, flood, extended coverage and business income loss insurance covering our initial hotel pursuant to several insurance policies. We also carry terrorism insurance covering all of the initial hotel properties. We believe the policy specifications and insured limits are appropriate and adequate given the relative risk of loss, the cost of the coverage and industry practice; however, our insurance coverage may not be sufficient to fully cover our losses. We do not carry insurance for certain losses, including, but not limited to, losses caused by riots, war, acts of God or government action, neglect, criminal activity or nuclear hazard. If destroyed, we may not be able to rebuild certain of our properties due to current zoning and land use regulations. In addition, our title insurance policies may not insure for the current aggregate market value of our portfolio, and we do not intend to increase our title insurance coverage as the market value of our portfolio increases.
Competition
We face competition for investments in hotel properties from institutional pension funds, private equity investors, REITs, hotel companies and others who are engaged in hotel acquisitions and investments. Some of these entities have substantially greater financial and operational resources than we have. This competition may increase the bargaining power of property owners seeking to sell, reduce the number of suitable investment opportunities available to us and increase the cost of acquiring our targeted hotel properties.
The lodging industry is highly competitive. Our hotels will compete with other hotels for guests in their respective markets based on a number of factors, including location, convenience, brand affiliation, room rates, range of services and guest amenities or accommodations offered and quality of customer service. Competition will often be specific to the individual markets in which our hotels are located and includes competition from existing and new hotels. Competition could adversely affect our occupancy and RevPAR, and may require us to provide additional amenities or make capital improvements that we otherwise would not have to make, which may reduce our profitability.
Employees
Upon completion of this offering, we expect to have approximately 20 employees. We do not expect any of our employees to be covered by a collective bargaining agreement.
Legal Proceedings
We are involved from time to time in litigation arising in the ordinary course of our business; however, except as described below, we are not involved in any material litigation nor, to our knowledge, is any material litigation threatened against us.
Peter J. Poulos, a former employee of our predecessor, filed a complaint against our predecessor, Mr. Boekelheide and others with the U.S. Department of Labor/Occupational Safety and Health Administration, or OSHA. The administrative file was opened on April 6, 2009. The complaint alleges that, as a result of one circumstance of a payment being applied to incorrect accounts, our predecessor engaged in a scheme to perpetuate fraud and that the employee’s subsequent termination was retaliatory and in violation of the Corporate and Criminal Fraud Accountability Act of 2002, or the CCFA. The only relief sought under the complaint is an administrative finding that our predecessor violated the CCFA. Our predecessor vehemently denies these allegations and is vigorously defending the claim. OSHA has completed its investigation and our predecessor is awaiting its findings. On August 24, 2010, OSHA determined that there was no reasonable cause to believe that our predecessor violated the CCFA and the complaint was dismissed. On August 30, 2010, Mr. Poulos objected to the findings and requested a formal hearing in the matter. A scheduling conference with the administrative law judge was held on October 6, 2010. The formal hearing before the administrative law judge is being held in abeyance until the federal lawsuit described below is adjudicated. The parties are to file a status report with the administrative law judge assigned to the matter on or before December 7, 2010.
93
On May 12, 2009, Mr. Poulos filed a complaint in the United States District Court, Southern District of South Dakota against our predecessor, Mr. Boekelheide and Trent Peterson, our Vice President of Asset Management—Eastern United States. The complaint is based upon the same set of circumstances as in the OSHA complaint described above. The relief sought includes damages, including front and back pay, compensatory damages, punitive damages and other relief, in excess of $10.0 million. Our predecessor vehemently denies these allegations and is vigorously defending the claim. On July 10, 2009, Mr. Boekelheide was dismissed from the lawsuit. Discovery is proceeding in this case. A pre-trial conference and motions hearing was held on August 6, 2010. On September 10, 2010, the court granted summary judgment in favor of our predecessor and Mr. Peterson and dismissed five of the six claims asserted by Mr. Poulos. The court denied summary judgment on the claim asserting wrongful termination for whistleblowing. Trial on the wrongful termination for whistleblowing claim has been set for March 21, 2011.
94
Our Hotel Operating Agreements
TRS Leases
In order for us to qualify as a REIT, none of our company, our operating partnership or any subsidiary can operate our hotels. Subsidiaries of our operating partnership, as lessors, lease our hotels to our TRS lessees, which will enter into a hotel management agreement with Interstate. The leases for our hotel properties are between two related parties controlled by us.
Ground Lease Agreements
Four of our hotels are subject to ground lease agreements that cover all of the land underlying the respective hotel property.
| § | The Comfort Inn located in Fort Smith, Arkansas is subject to a ground lease with an initial lease termination date of August 31, 2022. The initial lease term may be extended for an additional 30 years. Annual ground rent currently is $44,088 per year. Annual ground rent is adjusted every fifth year with adjustments based on the Consumer Price Index for All Urban Consumers. The next scheduled ground rent adjustment is January 1, 2015. |
| § | The Hampton Inn located in Fort Smith, Arkansas is subject to a ground lease with an initial lease termination date of May 31, 2030 with 11, five-year renewal options. Annual ground rent currently is $145,987 per year. Annual ground rent is adjusted on June 1st of each year, with adjustments based on increases in RevPAR calculated in accordance with the terms of the ground lease. |
| § | The Residence Inn located in Portland, Oregon is subject to a ground lease with an initial lease termination date of June 30, 2084 with one option to extend for an additional 14 years. Ground rent for the initial lease term was prepaid in full at the time we acquired the leasehold interest. If the option to extend is exercised, monthly ground rent will be charged based on a formula established in the ground lease. |
| § | The Hyatt Place located in Portland, Oregon is subject to a ground lease with a lease termination date of June 30, 2084 with one option to extend for an additional 14 years. Ground rent for the initial lease term was prepaid in full at the time we acquired the leasehold interest. If the option to extend is exercised, monthly ground rent will be charged based on a formula established in the ground lease. |
These ground leases generally require us to make rental payments and payments for our share of charges, costs, expenses, assessments and liabilities, including real property taxes and utilities. Furthermore, these ground leases generally require us to obtain and maintain insurance covering the subject property.
Franchise Agreements
We will assume or enter into new franchise agreements with Marriott, Hilton, IHG, Hyatt, Choice, Starwood and Country Inns & Suites By Carlson, Inc. for our hotels upon completion of this offering. All of our hotels, except for our one independent hotel, currently operate under franchise agreements with these franchisors. We believe that the public’s perception of the quality associated with a brand-name hotel is an important feature in its attractiveness to guests. Franchisors provide a variety of benefits to franchisees, including centralized reservation systems, national advertising, marketing programs and publicity designed to increase brand awareness, training of personnel and maintenance of operational quality at hotels across the brand system.
The franchise agreements will require our TRS lessees, as franchisees, to pay franchise fees ranging between 2% and 6% of each hotel’s gross revenues. In addition, some of our franchise agreements will require our TRS lessees to pay marketing fees of up to 4% of each hotel’s gross revenues. These agreements generally will specify management, operational, record-keeping, accounting, reporting and marketing standards and procedures with which our TRS lessees, as the franchisees, must comply. The franchise agreements will obligate our TRS lessees to comply with the franchisors’ standards and requirements, including training of operational personnel, safety, maintaining specified insurance, the types of services and products ancillary to guest room services that may be provided by the TRS lessee, display of signage and the type, quality and age of furniture, fixtures and equipment included in guest rooms, lobbies and other common areas.
95
Some of the agreements may require that we deposit a set percentage, generally not more than 5% of the gross revenues of the hotels, into a reserve fund for capital expenditures.
We will be required to obtain the written consent of a hotel’s franchisor to sell a hotel or we may be required to pay franchise termination fees. The franchise agreements generally will also provide for termination at the applicable franchisor’s option upon the occurrence of certain events, including failure to pay royalties and fees or to perform other obligations under the franchise license, bankruptcy and abandonment of the franchise or a change in control or proposed sale of a franchised property. The TRS lessee that is the franchisee will be responsible for making all payments under the applicable franchise agreement to the franchisor. We anticipate the obligations under each of the franchise agreements will be guaranteed by us, our operating partnership or one of our subsidiaries; however, the franchisors will determine the appropriate guarantors.
Hotel Management Agreement
The following summary of the principal terms of the hotel management agreement for the initial portfolio does not purport to be complete and is qualified in its entirety by reference to the form of hotel management agreement filed as an exhibit to this registration statement of which this prospectus is a part.
Overview
In order to qualify as a REIT, we cannot directly or indirectly operate any of our hotels. We will lease our hotels to our TRS lessees, which will in turn engage property managers to manage our hotels.
Our TRS lessees will enter into a hotel management agreement for the 65 hotels in our initial portfolio with Interstate, as our hotel manager. We may, but we are not required to, enter into hotel management agreements with Interstate for any additional hotels that we may acquire. Interstate is an affiliate of Interstate Hotels & Resorts, Inc, a wholly owned subsidiary of a 50/50 joint venture between Thayer Hotel Investors V-A L.P., an investment fund sponsored by Thayer Lodging Group, a privately held hotel investment company based in Annapolis, Maryland, and Jin Jiang Hotels International (Group) Company Limited, a hotel operator and manager in the Peoples Republic of China. As of the date of this prospectus, Interstate and its affiliates (excluding Thayer Lodging and Jin Jiang) manage and/or have ownership interests in 227 properties with more than 45,000 rooms in 36 states, the District of Columbia, Russia, India, Mexico, Belgium, Canada, Ireland and England.
Interstate has advised us that it expects to offer continued employment to substantially all of the employees of The Summit Group responsible for the day-to-day operations of our hotels prior to completion of the formation transactions. Pursuant to the hotel management agreement with Interstate, our TRS lessees will be required to fund working capital needs, fixed asset supplies, capital expenditures and operating expenses of the hotels. Interstate, subject to certain limited owner approval rights, will have control of all operational aspects of the hotels in our initial portfolio, including employee-related matters. Interstate will be required to maintain each hotel in good repair and condition and make such routine maintenance and repairs as are reasonably necessary or appropriate consistent with the business plan we approve.
Term
The hotel management agreement will become effective upon the closing of this offering and provides for an initial term that expires on the tenth anniversary of the effective date of the agreement, unless earlier terminated as described below.
Amounts Payable under our Hotel Management Agreement
We will pay Interstate a base management fee and, if certain financial thresholds are met or exceeded, an incentive management fee.
Base Management Fee. The base management fee is 3% of total revenues for all of the hotels covered by the hotel management agreement. Total revenue is all income, revenue and proceeds resulting directly or indirectly from the operation of the hotels and all of their facilities (net of refunds and credits to guests and other allowances) before subtracting expenses.
Incentive Fee. The incentive fee is 10% of the amount by which actual aggregate EBITDA for all hotels covered by the hotel management agreement exceeds $65 million. “EBITDA” is defined as the amount by which gross operating profit (the amount by which total revenues exceed operating expenses) exceeds fixed charges. The incentive fee for any fiscal year is capped at 1.5% of the total revenues for all of the hotels covered by the hotel management agreement for that fiscal year.
96
In addition, Interstate will receive, on a monthly basis, a fee for the use of its centralized accounting services in an amount equal to $1,500 per hotel per month for hotels with 90 or more rooms and $1,375 per hotel per month for hotels with less than 90 rooms, subject to annual increases of the lesser of (i) the percentage change in the Consumer Price Index for the previous fiscal year and (ii) 3%.
Termination Events
Early Termination for Cause. Subject to certain qualifications, the hotel management agreement is generally terminable by either party upon the occurrence of certain events of default that continue uncured after written notice by the non-defaulting party. Events of default under the hotel management agreement generally include:
| § | a default by either party in the payment of any amount required to by paid under the terms of the agreement; | |
| § | a material default by either party of its obligations under the agreement that is reasonably likely to result in a threat to the health and safety of a hotel’s employees or guests; | |
| § | a material default by either party in the performance of its other obligations under the agreement; | |
| § | the following actions by either party: (i) the making of an assignment for the benefit of creditors; (ii) the institution of any proceeding seeking relief under any federal or state bankruptcy or insolvency laws; (iii) the institution of any proceeding seeking the appointment of a receiver, trustee, custodian or similar official for its business or assets; or (iv) the consent to the institution against it of any such proceeding by any other person or entity; | |
| § | the commencement of an involuntary proceeding against either party (defined as the institution of any of the aforementioned proceedings by another person or entity) that has remained undismissed for a period of 60 days; or | |
| § | our violation of representations in the agreement relating to (i) affiliations with persons on various U.S. government restricted lists or persons owned or controlled by, or acting on behalf of, foreign governments that are subject to an embargo by the U.S. government and (ii) violations of the Foreign Corrupt Practices Act. |
If an event of default occurs and continues beyond the grace period set forth in the hotel management agreement, the non-defaulting party generally has, among other remedies, the option of terminating the applicable hotel management agreement, upon five days’ notice to the other party. Additionally, if within 30 days after receiving Interstate’s written request, we fail to approve any changes, repairs, alterations, improvements, renewals or replacements to a hotel which Interstate determines in its reasonable judgment are necessary to (i) protect such hotel, Interstate or us from innkeeper liability exposure, (ii) ensure material compliance with any applicable code requirements pertaining to life safety systems requirements or (iii) ensure material compliance with any applicable state, local or federal employment law, including the Americans with Disabilities Act, then Interstate may terminate the agreement and we will be required to pay a termination fee to Interstate equal to the amount which would provide Interstate with a 30% Internal Rate of Return (as defined in the agreement) with respect to such hotel, however, solely for the first five terminations, if the effective date of such termination occurs on or before the end of the eighteenth month following the effective date of the agreement, the Internal Rate of Return shall be 20% instead of 30%.
Early Termination—Without Cause. We may terminate the agreement with respect to up to five hotels during any fiscal year with or without cause by delivering written notice at least 60 days prior to termination, after having paid in full all amounts otherwise due to Interstate under the agreement and paying Interstate a termination fee equal to the amount which would provide Interstate with a 30% (20% if the termination occurs within the first 18 months following the effective date of the agreement) Internal Rate of Return with respect to such hotels.
Termination Due to Damage or Condemnation. If a hotel is damaged by fire or other casualty, both we and Interstate may terminate the management agreement with respect to such hotel upon 30 days’ written notice if (i) we elect to close such hotel (except on a temporary basis for repairs or restoration) or determine in good faith not to proceed with the restoration of such hotel, or (ii) if 20% or more of the rooms of such hotel are unavailable for rental for a period of 60 days or more as a result of such casualty. If we decide to terminate the management agreement as a result of fire or casualty damages to a hotel, we will be required to pay a termination fee equal to the amount which would provide Interstate with a 30% Internal Rate of Return with respect to such hotel, however, solely for the first five terminations, if the effective date of such termination occurs on or before the end of the eighteenth month following the effective date of the agreement, the Internal Rate of Return shall be 20% instead of 30%. Both we and Interstate may terminate the management agreement
97
upon 30 days’ written notice with respect to a hotel all or substantially all of which is taken through condemnation or, if less than all or substantially all of a hotel is taken through condemnation, it is determined that the hotel, once restored, could not be operated profitably in a manner that existed immediately prior to such condemnation.
Termination on Failure of Interstate to Comply with REIT Provisions. Under the hotel management agreement, if, at any time, Interstate does not qualify as an “eligible independent contractor” for federal income tax purposes or if wagering activities are being conducted at or in connection with a hotel by any person who is engaged in the business of accepting wagers and who is legally authorized to engage in such business at or in connection with such hotel, we may, in our sole discretion, elect to terminate the management agreement immediately and without payment of any termination fee or penalty.
Performance Termination. The hotel management agreement also provides that we may terminate the management agreement with respect to a hotel upon 60 days’ written notice if, as of the end of any fiscal year, such hotel fails to achieve (i) actual gross operating profit of at least 87.5% of the budgeted gross operating profit for such hotel for such fiscal year, and (ii) 87.5% of such hotel’s RevPAR Benchmark (as defined in the agreement); provided, that such notice of termination shall be stayed and will become null and void if such hotel achieves as of the end of the following fiscal year (i) actual gross operating profit of at least 87.5% of the budget gross operating profit for such hotel or (ii) 87.5% of such hotel’s RevPAR Benchmark. Additionally, Interstate shall have the right, exercisable no more than two times per hotel, to cure a performance termination by making a payment to us equal to the amount by which 87.5% of the budgeted gross operating profit for such hotel exceeds actual gross operating profit for such hotel for such fiscal year.
Termination Due to Competitive Business. If, without our express permission, Interstate elects to own, operate, lease or otherwise have an interest in, directly or indirectly, one or more hotels in a competitive set of one of our hotels, upon 30 days’ written notice we may terminate the agreement solely with respect to that hotel without payment of any termination fee.
Sale of a Hotel
The hotel management agreement provides that if we sell a hotel to an unaffiliated third party, we may terminate the agreement with respect to such hotel so long as (i) we provide 60 days’ written notice of such termination to Interstate, (ii) all amounts due to Interstate with respect to such hotel have been paid in full and (iii) we pay Interstate a termination fee equal to an amount that would provide Interstate with a 30% Internal Rate of Return (as defined in the agreement) with respect to such hotel.
Assignment
The hotel management agreement provides that neither Interstate nor we may assign its or our interest in the agreement without the other party’s prior written consent provided that Interstate may assign its rights and obligations to (i) a party that is directly or indirectly controlled by or under common control with Interstate, (ii) any entity which is the successor by merger, consolidation or reorganization of Interstate or its general partner, managing member or parent corporation or (iii) the purchaser of all or substantially all of the hotel management business of Interstate or its general partner, managing member or parent corporation, unless any such assignment results in a Change in Control (as defined in the agreement) of Interstate or Interstate Hotels & Resorts, Inc. However, we may assign our interest without Interstate’s consent to any person acquiring the hotel and agreeing to be bound by the terms of the hotel management agreement.
Indemnity Provisions
The hotel management agreement provides that Interstate will indemnify us against any liabilities arising from (i) the fraud, willful misconduct or gross negligence of Interstate’s off-site employees or Key Hotel Personnel (as defined in the agreement); (ii) the breach by Interstate of any provision of the hotel management agreement caused by fraud, willful misconduct or gross negligence of Interstate’s off-site employees or Key Hotel Personnel; or (iii) any action taken by Interstate which is beyond the scope of its authority under the agreement.
The hotel management agreement provides that we will indemnify Interstate against any liabilities arising from (i) Interstate’s performance of its services under the agreement, (ii) any act or omission of us or any third party or (iii) any other occurrence related to hotels covered by the agreement or Interstate’s duties under the agreement whether arising before, during or after the term of the agreement.
98
Management
Directors and Executive Officers
Our board of directors is responsible for directing the management of our business and affairs. Our stockholders will elect our entire board of directors annually. Upon completion of this offering and the formation transactions, we expect to have six directors on our board, four of whom will be independent under NYSE listing standards. We currently have two directors, our Executive Chairman, Mr. Boekelheide, and our President and Chief Executive Officer, Mr. Hansen, neither of whom is independent under the NYSE listing standards. Upon completion of this offering and the formation transactions, we do not expect that there will be any familial relationships between any of our directors and executive officers.
The following table provides certain information regarding our initial directors, our executive officers and our director nominees:
Name | Age | Position | ||||
| Kerry W. Boekelheide | 56 | Executive Chairman of the Board and Director | ||||
| Daniel P. Hansen | 41 | President and Chief Executive Officer and Director | ||||
| Craig J. Aniszewski | 47 | Executive Vice President and Chief Operating Officer | ||||
| Stuart J. Becker | 49 | Executive Vice President, Chief Financial Officer and Treasurer | ||||
| Ryan A. Bertucci | 37 | Vice President of Acquisitions | ||||
| Christopher R. Eng | 39 | Vice President, General Counsel and Secretary | ||||
| Bjorn R. L. Hanson | 59 | Independent Director* | ||||
| David S. Kay | 44 | Independent Director* | ||||
| Thomas W. Storey | 54 | Independent Director* | ||||
| Wayne W. Wielgus | 56 | Independent Director* | ||||
| * | Has agreed to become a director upon completion of this offering. |
Biographies of Our Directors, Director Nominees and Executive Officers
Kerry W. Boekelheide, Executive Chairman of the Board and Director
Mr. Boekelheide will serve as our Executive Chairman of the Board and as a member of our board of directors. He has served as the Chief Executive Officer and as a member of the board of managers of our predecessor since its formation in 2004. Mr. Boekelheide has served as the Chairman and sole director of The Summit Group since 1991. The Summit Group, with its affiliates, developed and acquired 54 hotels from 1991 through 2004. Prior to forming The Summit Group, Mr. Boekelheide was President and a shareholder of Super 8 Management, Inc., which was responsible for the management of over 100 Super 8 Motels located across the United States and Canada, and held numerous other positions in various companies that developed, owned and operated Super 8 Motels in the United States and Canada. Mr. Boekelheide graduated with a B.S. degree in business from Northern State University.
Mr. Boekelheide brings leadership and extensive experience and knowledge of our company and industry to our board of directors. As the founder and president of our predecessor, Mr. Boekelheide has the most long-term and valuable hands-on knowledge of the issues, opportunities and challenges facing us and our business. In addition, Mr. Boekelheide brings his broad strategic vision for our company to our board of directors.
Daniel P. Hansen, President, Chief Executive Officer and Director
Mr. Hansen will serve as our President and Chief Executive Officer and as a member of our board of directors. Mr. Hansen joined The Summit Group in October of 2003 as Vice President of Investor Relations. His responsibilities included leading the capital raising efforts for our predecessor’s private placements of its equity securities and assisting in acquisition due diligence. In 2005, he was appointed to our predecessor’s board of managers and was promoted to Executive Vice President, in which capacity he was part of the team that acquired over $140 million of hotel properties and led the development of over $240 million of hotel assets. He was appointed President of The Summit Group and Chief Financial Officer of our predecessor in 2008. His primary responsibilities included the development and execution of
99
growth strategies for both companies, raising equity capital and hotel development and acquisition. Prior to joining The Summit Group, Mr. Hansen spent 11 years with Merrill Lynch, Pierce, Fenner & Smith Incorporated, or Merrill Lynch, in various leadership positions, culminating as a Vice President and Regional Sales Manager for Merrill Lynch in the Texas Mid-South Region, which included Texas, Louisiana, Arkansas and Oklahoma. Mr. Hansen graduated from South Dakota State University with a B.A. in economics.
Mr. Hansen’s service as our President and Chief Executive Officer provides a critical link between management and our board of directors, enabling our board of directors perform its oversight function with the benefits of management’s perspectives on the business. Mr. Hansen also provides us with extensive experience in the hospitality industry as well as a capital markets background that will assist our board of directors in analyzing capital raising opportunities and issues.
Craig J. Aniszewski, Executive Vice President and Chief Operating Officer
Mr. Aniszewski will serve as our Executive Vice President and Chief Operating Officer. Mr. Aniszewski joined The Summit Group in January 1997 as Vice President of Operations and Development. He became the Executive Vice President and Chief Operating Officer of The Summit Group in 2007 and has been a member of the board of managers of our predecessor since 2004. Mr. Aniszewski will continue to serve as an officer of The Summit Group upon completion of this offering. Mr. Aniszewski joined The Summit Group following 13 years with Marriott International, Inc., where he held sales and operations positions in full-service convention and resort hotels. During his career with Marriott, he also worked in the select-service sector, holding positions including the Director of Sales and General Manager for Residence Inn- and Courtyard-branded hotels located in Florida, New York, Connecticut, Pennsylvania, Maryland and North Carolina. Mr. Aniszewski graduated from the University of Dayton with a B.S. degree in criminal justice and minors in business and psychology.
Stuart J. Becker, Executive Vice President and Chief Financial Officer
Mr. Becker will serve as our Executive Vice President, Chief Financial Officer and Treasurer. Mr. Becker joined Summit Green Tiger, an affiliate of The Summit Group, in 2007 as an Executive Vice President and Secretary where he focused on acquisitions, capital allocation, debt placement and strategic analysis. Prior to joining Summit Green Tiger, Mr. Becker served as a principal of McCarthy Group, Inc. and its subsidiary, McCarthy Capital, Inc. from 2005 to 2007. McCarthy Group is a private equity company headquartered in Omaha, Nebraska, which focuses on diversified investments in growth companies. Mr. Becker was responsible for managing deal flow, acquisitions, underwriting and investment oversight. From 1984 until 2005, Mr. Becker was involved in finance and corporate banking for several regional and national banking firms, including First Interstate, First Bank (predecessor to US Bank) and most recently, First National Bank of Omaha, from 1997 to 2005, where he was Vice President for corporate banking, regional credit and syndications. Mr. Becker earned a B.S. degree in business management from the University of South Dakota and an M.B.A. from the University of Nebraska at Omaha.
Ryan A. Bertucci, Vice President of Acquisitions
Mr. Bertucci will serve as our Vice President of Acquisitions. Mr. Bertucci joined Summit Green Tiger, an affiliate of The Summit Group, in 2007 as an Executive Vice President and Treasurer. In addition, Mr. Bertucci led the capital-raising efforts for Summit Capital Partners, LLC, or Summit Capital, an SEC registered securities broker dealer affiliated with The Summit Group. Prior to joining Summit Green Tiger and Summit Capital, Mr. Bertucci worked for First National Nebraska, Inc. From 2004 to 2007, he served as Vice President with First National Investment Banking, or FNIB, an affiliate of First National Nebraska, Inc. While with FNIB, Mr. Bertucci was responsible for starting and building the firm’s alternative investment platform. Prior to his service at FNIB, Mr. Bertucci spent three years with First National Bank of Omaha as a corporate loan officer. Mr. Bertucci earned a B.S. degree in business administration with an emphasis in both finance and marketing from the University of Nebraska at Kearney.
Christopher R. Eng, Vice President, General Counsel and Secretary
Mr. Eng will serve as our Vice President, General Counsel and Secretary. Mr. Eng was appointed Vice President, General Counsel and Secretary of The Summit Group and our predecessor in 2004. Mr. Eng was responsible for The Summit Group’s legal affairs and for guiding its corporate compliance, focusing on real estate acquisitions and dispositions, franchise licensing, corporate insurance coverage, corporate governance and securities industry regulatory compliance. Prior to joining
100
The Summit Group, Mr. Eng was an Assistant Vice President and Trust Officer for The First National Bank in Sioux Falls. Mr. Eng earned his B.A. degree from Augustana College and his J.D. degree from the University of Denver College of Law.
Bjorn R. L. Hanson, Independent Director
Dr. Hanson has agreed to serve on our board of directors effective upon completion of this offering. Dr. Hanson has worked in the hospitality industry for more than 35 years and has been involved in consulting, research and investment banking in the lodging sector. He joined the New York University School of Continuing Professional Studies in June 2008 as a clinical professor teaching in the school’s graduate and undergraduate hospitality and tourism programs and directing applied research projects. In 2010, he was appointed as the divisional dean of that school’s Preston Robert Tisch Center for Hospitality, Tourism, and Sports Management. Before joining the Tisch Center, Dr. Hanson was a partner with PricewaterhouseCoopers LLP and its predecessor, Coopers & Lybrand LLP, which he joined in 1989. Dr. Hanson founded the hospitality, sports, convention and leisure practice and held various positions at PricewaterhouseCoopers and Coopers & Lybrand, including National Industry Chairman for the Hospitality Industries, National Service Line Director for Hospitality Consulting, National Industry Chairman for Real Estate, Real Estate Service Line Director and National Director of Appraisal Services. Additionally, he served on the U.S. leadership committee and global financial advisory services management committee of PricewaterhouseCoopers. Dr. Hanson was also managing director with two Wall Street firms, Kidder, Peabody & Co. and PaineWebber Inc., for which he led banking and research departments for lodging and gaming. Dr. Hanson received a B.S. from Cornell University School of Hotel Administration, an M.B.A. from Fordham University and a Ph.D. from New York University.
Dr. Hanson brings a wide range of experience in consulting, research and investment banking in the lodging sector to our board of directors. Further, he brings an academic perspective on the hospitality and tourism industries, which enhances the ability of our board of directors to analyze macroeconomic issues and trends relevant to our business. Finally, Dr. Hanson’s leadership roles in market trend analysis, economic analysis and financial analysis specific to our industry provide our board of directors with additional depth in analyzing financial reporting issues faced by companies similar to ours.
David S. Kay, Independent Director
Mr. Kay has agreed to serve on our board of directors effective upon completion of this offering. Mr. Kay has worked in finance, accounting and business planning and strategy for more than 20 years and has been involved with REITs for over 13 years, which we believe qualifies him to serve as a member of our board of directors. He is the Executive Vice President, Chief Financial Officer and Treasurer of Capital Automotive Real Estate Services, Inc., whose predecessor, Capital Automotive REIT, he co-founded in 1997 and took public in 1998. Mr. Kay served as Senior Vice President, Chief Financial Officer and Treasurer for Capital Automotive until it was taken private in a nearly $4 billion privatization transaction in 2005. Prior to founding Capital Automotive, Mr. Kay worked at the public accounting firm of Arthur Andersen LLP in Washington, D.C. for approximately ten years. While at Arthur Andersen, Mr. Kay provided consulting services to clients regarding mergers and acquisitions, business planning and strategy and equity financing. He has experience with capital formation projects, roll-up transactions and IPOs for companies in various industries. Mr. Kay is a member of James Madison University’s College of Business Executive Advisory Council and is a certified public accountant. Mr. Kay received a B.B.A., with a concentration in accounting, from James Madison University.
Mr. Kay was chosen to join our board of directors specifically to serve our audit committee as its audit committee financial expert. We targeted a director with financial and auditing experience specific to the REIT industry. Mr. Kay worked in auditing for Arthur Andersen for ten years and is the Executive Vice President, Chief Financial Officer and Treasurer of Capital Automotive Real Estate Services, Inc., whose predecessor, Capital Automotive REIT, was a publicly traded REIT. Mr. Kay also gained experienced with the issues facing new, publicly traded REITs at Capital Automotive. These experiences position Mr. Kay to serve on our board of directors and its audit committee.
Thomas W. Storey, Independent Director
Mr. Storey has agreed to serve on our board of directors effective upon completion of this offering. Mr. Storey has worked in the hospitality industry for more than 25 years. He is Executive Vice President Business Strategy for Fairmont Raffles Hotels International (FRHI), a leading global hotel company with over 100 hotels worldwide under the Fairmont, Raffles and Swissôtel brands, that Mr. Storey joined in 1999. Having helped launch FRHI as a publicly traded company and
101
its subsequent privatization, Mr. Storey is responsible for strategic planning and helping to identify new opportunities for FRHI that capitalize on improving business fundamentals. Mr. Storey has held a series of progressive leadership positions with FRHI, including Executive Vice President, Development and Executive Vice President Business Development & Strategy, as well as President of Fairmont Hotels and Resorts. Mr. Storey has been a member of various hospitality industry organizations, including the American Hotel & Lodging Association, the Travel Industry Association of America, and Professional Conference and Meeting Planners. Mr. Storey received a B.A. in economics from Bates College and an M.B.A. from the Johnson School at Cornell University.
Mr. Storey provides our board of directors with strategic vision to position our company as lodging industry fundamentals begin to strengthen after the economic recession. As Executive Vice President Business Strategy of Fairmont Raffles Hotels International, Mr. Storey has been instrumental in helping lead that company through various lodging cycles. We expect Mr. Storey’s experience in analyzing and reacting to changing conditions in the hospitality industry will serve our board of directors as our company grows. We also expect Mr. Storey’s operations experience as President of Fairmont Hotels and Resorts to help him provide valuable insights to our board of directors. Mr. Storey also possesses particular expertise in business travel, an important aspect of our business.
Wayne W. Wielgus, Independent Director
Mr. Wielgus has agreed to serve on our board of directors effective upon completion of this offering. Mr. Wielgus has worked in the hospitality industry for more than 30 years. In August 2009, Mr. Wielgus founded International Advisor Group LLC, which advises several companies in the hospitality industry. Before founding International Advisor Group, he served as Senior Vice President of Marketing of Celebrity and Azamara Cruises, two of Royal Caribbean Cruises Ltd.’s brands, from March 2008 until August 2009, where he was responsible for the two brands’ overall marketing efforts, including brand strategy and development, advertising, web marketing and research. Mr. Wielgus served as Executive Vice President and Chief Marketing Officer of Choice Hotels International, Inc. from September 2004 until July 2007, after serving as that company’s Senior Vice President, Marketing from September 2000 to September 2004. Prior to joining Choice Hotels, Mr. Wielgus held various positions with Best Western International, Inc., Trusthouse Forte PLC, InterContinental Hotels Corporation and Ramada Worldwide Inc. Mr. Wielgus received a B.S. in Marketing from Fairfield University and an M.B.A. from Memphis University.
Mr. Wielgus contributes significant leadership experience in marketing, brand strategy and promotions. His service as Senior Vice President of Marketing of Celebrity and Azamara Cruises provides valuable business, leadership and management experience, including expertise leading marketing strategy and initiatives for a company in the tourism industry, which is a significant part of our business. Mr. Wielgus also gained similar experience specific to the hospitality industry in his role as Executive Vice President and Chief Marketing Officer of Choice Hotels International, Inc., one of the primary franchisors of our hotels. Thus, Mr. Wielgus also brings to our board of directors insights from the perspective of hotel franchisors, which we expect to enhance our ability to maximize our brand strategy and franchisor relationships. He currently acts as an outside consultant to companies in the hospitality industry, which gives him a keen understanding of some of the issues our company will face.
Other Key Employees
JoLynn M. Sorum, Vice President, Controller and Chief Accounting Officer
Ms. Sorum will serve as our Vice President, Controller and Chief Accounting Officer. Ms. Sorum has been the Controller for The Summit Group since 1998 and for our predecessor since its inception in 2004. Ms. Sorum is responsible for accounting, SEC reporting and internal control practices for The Summit Group and our predecessor. Prior to joining The Summit Group, she worked for First Premier Bank as a Finance Officer for three years and for Western Bank as an Internal Auditor for seven years. Ms. Sorum is a Certified Public Accountant and currently serves on the board of directors of the South Dakota CPA Society. Ms. Sorum earned a B.S. degree in accounting from Huron University.
David W. Heinen, Vice President of Asset Management – Western United States
Mr. Heinen will serve as our Vice President of Asset Management – Western United States. Mr. Heinen joined The Summit Group in 2000 and was promoted to Director of Operations for the Western United States in 2005. Prior to joining The Summit Group, from 1985 to 2000, Mr. Heinen held direct hotel management positions with Red Lion Hotels and Radisson Hotels. Mr. Heinen has over 20 years of direct hotel experience that includes all facets of full-service and select-
102
service hotels. Mr. Heinen graduated from Spokane Falls College/Eastern Washington University with a B.S. degree in business.
Trent A. Peterson, Vice President of Asset Management – Eastern United States
Mr. Peterson will serve as our Vice President of Asset Management – Eastern United States. Mr. Peterson joined The Summit Group in 1999 as a Regional Manager and was promoted to Director of Operations for the Eastern United States in 2005. Prior to joining The Summit Group, from 1991 to 1999, he held direct hotel management positions with both Fairfield Inn and Residence Inn- and Best Western-branded hotels. Mr. Peterson is a graduate of Moorhead State University with a B.S. degree in hotel and restaurant management.
Our Promoter
We consider our Executive Chairman, Mr. Boekelheide, to be our promoter, in that he has taken initiative in funding and organizing our company. Mr. Boekelheide is the only person we consider to be a promoter of our company.
Our Board of Directors
Director Qualifications and Skills
Our directors were chosen based on their experience, qualifications and skills. We first identified nominees for the board through professional contacts and other resources. We then assessed each nominee’s integrity and accountability, judgment, maturity, willingness to commit the time and energy needed to satisfy the requirements of board and committee membership, balance with other commitments, financial literacy and independence from us. We relied on information provided by the nominees in their biographies and responses to questionnaires, as well as independent third-party sources.
Board Leadership Structure, Corporate Governance and Risk Oversight
We place a high premium on good corporate governance. We have a non-staggered, majority-independent board of directors whose members will be elected annually. We do not have a stockholder rights plan. In addition, we have opted out of certain state anti-takeover provisions.
Our board of directors has the primary responsibility for overseeing risk management of our company, and our management intends to provide it with a regular report highlighting risk assessments and recommendations. Our audit committee will focus on oversight of financial risks relating to us; our compensation committee will focus primarily on risks relating to remuneration of our officers and employees; and our nominating and corporate governance committee will focus on reputational and corporate governance risks relating to our company. In addition, the audit committee and board of directors intend to regularly hold discussions with our executive and other officers regarding the risks that may affect our company.
Committees of the Board of Directors
Our board of directors will establish three standing committees: an audit committee, a compensation committee and a nominating and corporate governance committee. Each of these committees, the principal functions of which are briefly described below, will consist solely of independent directors under the NYSE’s definition of independence and its transition rules for newly listed public companies. Our board of directors may from time to time establish other committees to facilitate the management of our company.
Audit Committee. The audit committee will help ensure the integrity of our financial statements, the qualifications and independence of our independent auditors and the performance of our internal audit function and independent auditors. The audit committee will select, assist and meet with the independent auditors, oversee each annual audit and quarterly review, establish and maintain our internal audit controls and prepare the audit committee report required by the federal securities laws to be included in our annual proxy statement. Each member of our audit committee will be independent pursuant to the listing standards of the NYSE. In addition, each member of our audit committee will be “financially literate” as required by the NYSE, and at least one member of our audit committee will qualify as an “audit committee financial expert” as required by the SEC. We anticipate that Mr. Kay will be the chair of our audit committee and be designated as
103
our audit committee financial expert, as that term is defined by the SEC, and Mr. Wielgus and Dr. Hanson will also serve as members of this committee.
Compensation Committee. The compensation committee will review and approve the compensation and benefits of our executive officers, administer and make recommendations to our board of directors regarding our compensation and long-term incentive plans and produce an annual report on executive compensation for inclusion in our proxy statement. Each member of our compensation committee will qualify as an “outside director” as such term is defined under Section 162(m) of the Code and will be independent pursuant to the listing standards of the NYSE. In addition, each member of our compensation committee will be an independent director as set forth in Rule 16b-3 of the Exchange Act. We anticipate that Mr. Wielgus will be the chair of our compensation committee and Mr. Kay and Mr. Storey will also serve as members of this committee.
Nominating and Corporate Governance Committee. The nominating and corporate governance committee will develop and recommend to our board of directors a set of corporate governance principles, a code of business conduct and ethics and policies with respect to conflicts of interest, monitor our compliance with corporate governance requirements of state and federal law and the rules and regulations of the NYSE, develop and recommend to our board of directors criteria for prospective members of our board of directors, conduct candidate searches and interviews, oversee and evaluate our board of directors and management, evaluate from time to time the appropriate size and composition of our board of directors, recommend, as appropriate, increases, decreases and changes in the composition of our board of directors and formally propose the slate of nominees for election as directors at each annual meeting of our stockholders. Our stockholders will elect our entire board of directors annually. Each member of our nominating and corporate governance committee will be independent pursuant to the listing standards of the NYSE. We anticipate that Mr. Storey will be the chair of our nominating and corporate governance committee and Dr. Hanson and Mr. Wielgus will also serve as members of this committee.
Compensation of Directors
Upon completion of this offering, our board of directors will establish a compensation program for our independent directors. Pursuant to this compensation program, we will pay the following fees to our independent directors:
| § | an annual cash retainer of $50,000; | |
| § | an initial grant of 1,000 shares of our common stock to be issued upon completion of this offering; | |
| § | on the date of each director’s reelection to our board of directors beginning on the date of our 2012 annual meeting of stockholders, an annual grant of shares of our common stock having a value of $15,000 based on the market price of our common stock on the date of grant; | |
| § | an additional annual cash retainer of $12,500 to the chair of our audit committee; | |
| § | an additional annual cash retainer of $10,000 to the chair of our compensation committee; and | |
| § | an additional annual cash retainer of $7,500 to the chair of our nominating and corporate governance committee. |
We will also reimburse our independent directors for reasonable out-of-pocket expenses incurred in connection with performance of their duties as directors, including, without limitation, travel expenses in connection with their attendance at in-person board and committee meetings. Directors who are our employees will not receive compensation for their services as directors.
Commencing in 2011, in connection with each annual meeting of stockholders, each of our independent directors will receive $15,000 payable in the form of common stock (based upon the volume-weighted average closing market price of our common stock on the NYSE for the ten trading days preceding the date of grant).
Code of Business Conduct and Ethics
Upon completion of this offering and the formation transactions, our board of directors will establish a code of business conduct and ethics that applies to our officers, directors and employees. Among other matters, our code of business conduct and ethics will be designed to deter wrongdoing and to promote:
| § | honest and ethical conduct, including the ethical handling of actual or apparent conflicts of interest between personal and professional relationships; |
104
| § | full, fair, accurate, timely and understandable disclosure in our SEC reports and other public communications; | |
| § | compliance with applicable governmental laws, rules and regulations; | |
| § | prompt internal reporting of violations of the code to appropriate persons identified in the code; and | |
| § | accountability for adherence to the code. |
Any waiver of the code of business conduct and ethics for our executive officers or directors must be approved by our board of directors or a committee of our board of directors, and any such waiver shall be promptly disclosed as required by law or NYSE regulations.
Compensation Committee Interlocks and Insider Participation
No member of the compensation committee will be a current or former officer or employee of our company or any of our subsidiaries. None of our executive officers serves as a member of the board of directors or compensation committee of any company that will have one or more of its executive officers serving as a member of our board of directors.
Indemnification of Directors and Executive Officers and Limitations on Liability
For information concerning limitations on liability and indemnification applicable to our directors and executive officers, see “Certain Provisions of Maryland Law and of Our Charter and Bylaws.”
Compensation Discussion and Analysis
We believe the primary goal of executive compensation is to align the interests of our senior management team with those of our stockholders in a way that allows us to attract and retain the best executive talent. Our board of directors has not yet formed our compensation committee. Accordingly, our compensation committee has not adopted compensation policies with respect to, among other things, setting base salaries, awarding bonuses or making future grants of equity awards to our executive officers. We expect that the compensation committee, once formed, will design a compensation program that rewards, among other things, favorable stockholder returns, share appreciation, the company’s competitive position within its segment of the real estate industry and each member of our senior management team’s long-term career contributions to the company. Compensation incentives designed to further these goals may take the form of annual cash compensation and equity awards, as well as long-term cash and equity incentives measured by performance targets to be established by our compensation committee. We will pay base salaries and annual bonuses and expect to make grants of awards under our equity incentive plan to our executive officers, effective upon completion of this offering, in accordance with their employment agreements. Awards under our equity incentive plan will be granted to recognize such individuals’ efforts on our behalf in connection with our formation and this offering and to provide a retention element to their compensation.
Compensation of Named Executive Officers
We intend to enter into employment agreements with our named executive officers, which will become effective upon completion of this offering.
Summary Compensation Table
The following table sets forth the annualized base salary and other compensation that would have been paid in 2010 to our Executive Chairman, our President and Chief Executive Officer, our Chief Financial Officer and the two other most highly compensated members of our senior management team, whom we refer to collectively as our “named executive officers,” had these employment agreements been in effect for all of 2010. We expect such employment agreements will provide for salary, bonus and other benefits, including severance upon a termination of employment under certain circumstances. See “—Employment Agreements.” Because we were recently organized, meaningful individual compensation information is not available for prior periods.
The anticipated 2010 compensation for each of our named executive officers listed in the table below was determined through negotiation of their individual employment agreements. These employment agreements were not approved by our
105
compensation committee or any of our independent director nominees. We expect to disclose actual 2010 compensation for our named executive officers in 2011, to the extent required by applicable SEC disclosure rules.
| Option | ||||||||||||||||||||
Name and Principal Position | Year | Base Salary(1) | Bonus(2) | Awards(3)(4) | Total | |||||||||||||||
| Kerry W. Boekelheide | 2010 | $ | 380,000 | $ | — | $ | $ | |||||||||||||
| Executive Chairman of the Board | ||||||||||||||||||||
| Daniel P. Hansen | 2010 | 350,000 | — | |||||||||||||||||
| President and Chief Executive Officer | ||||||||||||||||||||
| Craig J. Aniszewski | 2010 | 300,000 | — | |||||||||||||||||
| Executive Vice President and Chief Operating Officer | ||||||||||||||||||||
| Stuart J. Becker | 2010 | 250,000 | — | |||||||||||||||||
| Executive Vice President, Chief Financial Officer and Treasurer | ||||||||||||||||||||
| Ryan A. Bertucci | 2010 | 220,000 | — | |||||||||||||||||
| Vice President of Acquisitions | ||||||||||||||||||||
| (1) | Full-year amount. Each executive will receive a pro rata portion of his base salary for the period from the date of completion of this offering through December 31, 2010. | |
| (2) | We will not pay annual bonuses to these executives for 2010. | |
| Under their employment agreements, Messrs. Boekelheide, Hansen and Aniszewski will receive annual bonuses for 2011 equal to $380,000, $350,000 and $225,000, respectively, if the 2011 hotel-level earnings before interest, taxes, depreciation and amortization for the 65 properties in our initial portfolio is at least $55 million. Beginning in 2012, Messrs. Boekelheide, Hansen and Aniszewski will be eligible to earn an annual cash bonus to the extent that individual and corporate goals to be established by our compensation committee are achieved. Our compensation committee will determine the actual amount of the cash bonus payable in 2012 and subsequent years. For 2012 and subsequent years, each of Messrs. Boekelheide and Hansen has the opportunity to earn an annual cash bonus of up to 100% of his annual base salary and Mr. Aniszewski has the opportunity to earn an annual cash bonus of up to 75% of his annual base salary. | ||
| Under their employment agreements, Messrs. Becker and Bertucci will be eligible to earn an annual cash bonus for 2011 and subsequent years to the extent that individual and corporate goals to be established by our compensation committee are achieved. Our compensation committee will determine the actual amount of the cash bonus payable in 2011 and subsequent years. Each of Messrs. Becker and Bertucci has the opportunity to earn an annual cash bonus of up to 50% of his annual base salary for 2011 and subsequent years. | ||
| (3) | Reflects option awards to be made to Mr. Boekelheide (376,000 shares), Mr. Hansen (235,000 shares), Mr. Aniszewski (235,000 shares), Mr. Becker (47,000 shares) and Mr. Bertucci (47,000 shares). These options will be granted pursuant to the 2010 Equity Incentive Plan upon completion of this offering, will have an exercise price equal to the IPO price, and will vest ratably on the first five anniversaries of the date of grant unless otherwise accelerated under certain circumstances. The compensation committee of our board of directors may make additional equity awards to our named executive officers in the future. | |
| (4) | Represents the aggregate grant date fair value of the option awards referred to in note (3) above is computed in accordance with FASB ASC Topic 718 and assumes exercise of the options within a five-year period. The compensation reported in the table above is not necessarily an indication of actual compensation that will be received by the named executive officers. For more information on the valuation of these option awards and the assumptions used in arriving at the amounts disclosed, please see the footnotes to our pro forma financial statements beginning on page F-2 of this prospectus. |
IPO Grants of Plan-Based Awards
Upon completion of this offering, we will grant to our named executive officers, pursuant to the 2010 Equity Incentive Plan, options to purchase an aggregate of 940,000 shares of our common stock, as shown in the following table:
| All Other Option | ||||||||||||||
| Awards: Number of | Exercise or Base | |||||||||||||
| Securities | Price of Option | Grant Date Fair | ||||||||||||
| Underlying Options | Awards | Value of Option | ||||||||||||
Name | Date of Grant | (#) | ($/share) | Awards | ||||||||||
| Kerry W. Boekelheide | (1) | 376,000(2 | ) | (3 | ) | (4 | ) | |||||||
| Daniel P. Hansen | (1) | 235,000(2 | ) | (3 | ) | (4 | ) | |||||||
| Craig J. Aniszewski | (1) | 235,000(2 | ) | (3 | ) | (4 | ) | |||||||
| Stuart J. Becker | (1) | 47,000(2 | ) | (3 | ) | (4 | ) | |||||||
| Ryan A. Bertucci | (1) | 47,000(2 | ) | (3 | ) | (4 | ) | |||||||
| (1) | Date of completion of this offering. | |
| (2) | The awarded options will vest ratably on the first five anniversaries of the date of grant. | |
| (3) | The exercise price of the options will be equal to the IPO price of the shares sold in this offering. |
106
| (4) | The amount is computed in accordance with FASB ASC Topic 718 and assumes exercise of the options within a five-year period. |
None of our other employees will receive equity awards upon completion of this offering.
Discussion of Summary Compensation and Grants of Plan-Based Awards Tables
Our executive compensation policies and practices, pursuant to which the compensation set forth in the Summary Compensation Table and the Grants of Plan-Based Awards Table is expected to be paid or awarded, are described above under “—Compensation Discussion and Analysis.” The terms of employment agreements that we have entered into with our executive officers are described below under “—Employment Agreements.”
Employment Agreements
Kerry W. Boekelheide and Daniel P. Hansen. Effective upon completion of this offering, we will enter into employment agreements with Mr. Boekelheide and Mr. Hansen, each of which will have an initial term of three years and will renew for one-year terms thereafter unless terminated by written notice delivered at least 30 days before the end of the then-current term. The employment agreements provide for an annual base salary to Mr. Boekelheide of $380,000 and to Mr. Hansen of $350,000, subject to increase in the discretion of our board of directors or its compensation committee.
Under their employment agreements, Mr. Boekelheide and Mr. Hansen are eligible to earn an annual cash bonus for 2011 and subsequent years (but no bonus will be payable for 2010). For 2011, Mr. Boekelheide will receive an annual bonus of $380,000 and Mr. Hansen will receive an annual bonus of $350,000 if the 2011 hotel-level earnings before interest, taxes, depreciation and amortization for the 65 properties in our initial portfolio is at least $55 million. Assuming no purchases of additional hotels, or sales of hotels in our initial portfolio, we will calculate this measure by subtracting total hotel operating expenses from total revenues, each as reported in accordance with GAAP. For the year ended December 31, 2009, total revenues were $121.2 million and total hotel operating expenses were $89.2 million. For the nine months ended September 30, 2010, total revenues were $104.8 million and total hotel operating expenses were $71.6 million. In determining whether the $55 million target is met for 2011, we will exclude revenues or operating expenses of hotels acquired following completion of this offering and prior to December 31, 2011. If we sell one or more of the 65 hotels in our initial portfolio following completion of this offering and before December 31, 2011, we will reduce the $55 million target number in a manner that our compensation committee determines is equitable and appropriate to reflect the absence of the sold asset or assets for all, or the remaining portion, of 2011, as applicable, in assessing whether the hotels in our initial portfolio generated hotel-level earnings before interest, taxes, depreciation and amortization that met the target. Beginning in 2012, Mr. Boekelheide and Mr. Hansen will be eligible to earn an annual cash bonus of up to 100% of annual base salary, to the extent that individual and corporate goals established by the compensation committee are achieved.
The employment agreements entitle Mr. Boekelheide and Mr. Hansen to customary fringe benefits, including vacation and health benefits, and the right to participate in any other benefits or plans in which other executive-level employees participate. Each employment agreement also provides that if Mr. Boekelheide or Mr. Hansen loses the supplemental health benefit provided to him by The Summit Group, we will establish, if permitted by applicable law, a medical reimbursement plan providing the same level of supplemental health benefits.
Each employment agreement provides for certain payments in the event that the employment of Mr. Boekelheide or Mr. Hansen ends upon termination by us for “cause,” a resignation without “good reason” (as defined below), death or disability or any reason other than a termination by us without “cause” or resignation with “good reason.” Each agreement defines “cause” as (1) a failure to perform a material duty or a material breach of an obligation set forth in the employment agreement or a breach of a material and written policy other than by reason of mental or physical illness or injury, (2) a breach of the executive’s fiduciary duties, (3) conduct that demonstrably and materially injures us monetarily or otherwise or (4) a conviction of, or plea of nolo contendere to, a felony or crime involving moral turpitude or fraud or dishonesty involving our assets, and that in each case is not cured, to our board of directors’ reasonable satisfaction, within 30 days after written notice. In any such event, the employment agreements provide for the payment to Mr. Boekelheide and Mr. Hansen of any earned but unpaid compensation up to the date of termination and any benefits due under the terms of any of our employee benefit plans.
Each employment agreement provides for certain severance payments in the event that the employment of Mr. Boekelheide or Mr. Hansen is terminated by us without “cause” or the executive resigns for “good reason.” Each agreement
107
defines “good reason” as (1) our material breach of the terms of the employment agreement or a direction from our board of directors that the executive act or refrain from acting in a manner that is unlawful or contrary to a material and written policy, (2) a material diminution in the executive’s duties, functions and responsibilities without his consent or our preventing him from fulfilling or exercising his material duties, functions and responsibilities without his consent, (3) a material reduction in the executive’s base salary or annual bonus opportunity or (4) a requirement that the executive relocate more than 50 miles from the current location of his principal office without his consent, in each case provided that Mr. Boekelheide or Mr. Hansen has given written notice to our board of directors within 30 days after he knows of the circumstances constituting “good reason,” the circumstances constituting “good reason” are not cured within 30 days of such notice and the executive resigns within 30 days after the expiration of the cure period. In any such event, the executive is entitled to receive any earned but unpaid compensation up to the date of termination and any benefits due under the terms of our employee benefit plans and, if the executive executes a general release of claims, any outstanding options, restricted shares and other equity awards shall be vested and exercisable as of the date of termination and outstanding options shall remain exercisable thereafter until their stated expiration date as if the executive’s employment had not terminated. Mr. Boekelheide and Mr. Hansen shall also be entitled to receive, subject to the execution of a general release of claims, an amount equal to three times his base salary in effect at the time of termination, an amount equal to three times the greater of (i) the highest annual bonus paid to him for the three fiscal years ended immediately before the date of termination and (ii) the executive’s annual base salary, a prorated bonus for the then-current fiscal year based on his annual bonus for the fiscal year ended prior to his termination, an amount equal to three times the annual premium or cost paid by us for health, dental and vision insurance coverage for the executive and his eligible dependents in effect on the termination date and an amount equal to three times the annual premium or cost paid by us for disability and life insurance coverage for the executive in effect on the termination date.
Each employment agreement includes covenants that prohibit Mr. Boekelheide and Mr. Hansen from disclosing confidential information about us except in connection with our business and affairs. Each employment agreement also provides that, during employment and for the one-year period following termination of employment, Mr. Boekelheide and Mr. Hansen, subject to certain exceptions, will not compete with us by working with, or making a material investment in, an entity that owns or proposes to own 25 or more hotels in the upscale or midscale without food and beverage hotel segments, solicit any of our employees to leave employment or interfere with our relationship with any of our customers or clients. The restrictive covenants that prohibit or restrict Mr. Boekelheide or Mr. Hansen from being employed by, or providing services to, a competitor of our company following the termination of employment with us do not apply after a termination without cause or after the executive resigns with good reason as defined in the agreement.
Craig J. Aniszewski and Stuart J. Becker. Effective upon completion of this offering, we will enter into employment agreements with Mr. Aniszewski and Mr. Becker, each of which will have an initial term of three years and will renew for one-year terms thereafter unless terminated by written notice delivered at least 30 days before the end of the then-current term. The employment agreements provide for annual base salaries to each of Mr. Aniszewski and Mr. Becker of $300,000 and $250,000, respectively, subject to increase in the discretion of our board of directors or its compensation committee. The employment agreements entitle each of Mr. Aniszewski and Mr. Becker to fringe benefits substantially similar to those afforded to Mr. Boekelheide and Mr. Hansen, as described above (except that the employment agreement with Mr. Becker does not provide for the establishment of a medical reimbursement plan that provides supplemental health benefits).
Under their employment agreements, Mr. Aniszewski and Mr. Becker are eligible to earn an annual cash bonus for 2011 and subsequent years (but no bonus will be payable for 2010). Mr. Aniszewski will receive an annual bonus of $225,000 for 2011 if the same 2011 performance objective described above for Messrs. Boekelheide and Hansen is achieved. For 2012 and subsequent years Mr. Aniszewski will be eligible to earn an annual cash bonus of up to 75% of annual base salary, to the extent that individual and corporate goals established by the compensation committee are achieved. For 2011 and subsequent years, Mr. Becker will be eligible to earn an annual cash bonus, of up to 50% of annual base salary, to the extent that individual and corporate goals established by the compensation committee are achieved.
Each employment agreement provides for certain payments in the event the employment of Mr. Aniszewski or Mr. Becker ends upon termination by us for “cause,” a resignation without “good reason,” death or disability or any reason other than a termination by us without “cause” or resignation with “good reason.” The definitions of “cause” and “good reason” in the employment agreements with Mr. Aniszewski and Mr. Becker are the same as those in the employment agreements with Mr. Boekelheide and Mr. Hansen, as described above (except that a requirement that Mr. Becker relocate to Sioux Falls, South Dakota will not constitute “good reason”). In any such event, the employment agreements with Mr.
108
Aniszewski and Mr. Becker provide for the payment of any earned but unpaid compensation up to the date of termination and any benefits due under the terms of any of our employee benefit plans.
Each employment agreement provides for certain severance payments in the event the employment of Mr. Aniszewski or Mr. Becker is terminated by us without “cause” or the executive resigns for “good reason.” In any such event, the executive would be entitled to receive any earned but unpaid compensation up to the date of termination and any benefits due under the terms of our employee benefit plans and, if the executive executes a general release of claims, any outstanding options, restricted shares and other equity awards shall be vested and exercisable as of the date of termination and outstanding options shall remain exercisable thereafter until their stated expiration date as if employment had not terminated. Each of Mr. Aniszewski and Mr. Becker shall also be entitled to receive, subject to the execution of a general release of claims, an amount equal to one and one-half times his base salary at the time of termination, an amount equal to one and one-half times the greater of (i) the highest annual bonus paid to him for the three fiscal years ended immediately before the date of termination or (ii) 75% of annual base salary (in the case of Mr. Aniszewski) or 50% of annual base salary (in the case of Mr. Becker), a pro-rated bonus for the then-current fiscal year based on his annual bonus for the fiscal year ended prior to his termination, an amount equal to one and one-half times the annual premium or cost paid by us for health, dental and vision insurance coverage for the executive and his eligible dependents in effect on the termination date and an amount equal to one and one-half times the annual premium or cost paid by us for disability and life insurance coverage for the executive in effect on the termination date.
The employment agreements with Mr. Aniszewski and Mr. Becker provide for higher severance payments in the event of termination by us without “cause” no more than ninety days before a change in control or on or after a change in control or upon resignation for “good reason” on or after a change in control. The definition of “change in control” under the employment agreements with Mr. Aniszewski and Mr. Becker is the same as the definition of “change in control” under the 2010 Equity Incentive Plan. In any such event, each of Mr. Aniszewski and Mr. Becker is entitled to receive any earned but unpaid compensation up to the date of termination and any benefits due under the terms of our employee benefit plans and, if the executive executes a general release of claims, all outstanding options, restricted shares and other equity awards shall be vested and exercisable as of the date of termination and outstanding options shall remain exercisable thereafter until their stated expiration date as if the executive’s employment had not terminated. Each executive shall also be entitled to receive, subject to the execution of a general release of claims, an amount equal to two times his base salary at the time of termination, an amount equal to two times the greater of (i) the highest annual bonus paid to him for the three fiscal years ended immediately before the date of termination or (ii) 75% of annual base salary (in the case of Mr. Aniszewski) or 50% of annual base salary (in the case of Mr. Becker), a pro-rated bonus for the then-current fiscal year based on his annual bonus for the fiscal year ended prior to his termination, an amount equal to two times the annual premium or cost paid by us for health, dental and vision insurance coverage for the executive and his eligible dependents in effect on the termination date and an amount equal to two times the annual premium or cost paid by us for disability and life insurance coverage for the executive in effect on the termination date.
Each employment agreement includes covenants that prohibit Mr. Aniszewski and Mr. Becker from disclosing confidential information about us except in connection with our business and affairs. Each employment agreement also provides that, during employment and for the one-year period following termination of employment, Mr. Aniszewski and Mr. Becker will not compete with us by working with, or making a material investment in, an entity that owns or proposes to own 25 or more hotels in the upscale or midscale without food and beverage hotel segments, solicit any of our employees to leave employment or interfere with our relationship with any of our customers or clients. The restrictive covenants that prohibit or restrict Mr. Aniszewski or Mr. Becker from being employed by, or providing services to, a competitor of our company following the termination of employment with us do not apply after a termination without cause or after the executive resigns with good reason as defined in the agreement.
Ryan A. Bertucci. Effective upon completion of this offering, we will enter into an employment agreement with Mr. Bertucci which will have an initial term of one year and will renew for one-year terms thereafter unless terminated by written notice delivered at least 30 days before the end of the then-current term. Mr. Bertucci’s employment agreement provides for an annual base salary of $220,000, subject to increase in the discretion of our board of directors or its compensation committee. The employment agreement entitles Mr. Bertucci to fringe benefits substantially similar to those afforded to the other executives, as described above (except that the employment agreement with Mr. Bertucci does not provide for the establishment of a medical reimbursement plan that provides supplemental health benefits).
109
Under his employment agreement, Mr. Bertucci is eligible to earn annual cash bonuses to the extent that prescribed individual and corporate goals established by the Committee are achieved. The individual and corporate goals established by the Committee will provide Mr. Bertucci the opportunity to earn an annual cash bonus of up to 50% of annual base salary, to the extent such goals are achieved.
Mr. Bertucci’s employment agreement provides for certain payments in the event his employment ends upon termination by us for “cause,” a resignation without “good reason,” death or disability or any reason other than a termination by us without “cause” or resignation with “good reason.” The definitions of “cause” and “good reason” in the employment agreement with Mr. Bertucci are the same as those in the employment agreements with the other executives, as described above. In any such event, the employment agreement with Mr. Bertucci provides for the payment of any earned but unpaid compensation up to the date of termination and any benefits due under the terms of any of our employee benefit plans.
Mr. Bertucci’s employment agreement provides for certain severance payments in the event his employment is terminated by us without “cause” or he resigns for “good reason.” In any such event, he would be entitled to receive any earned but unpaid compensation up to the date of termination and any benefits due under the terms of our employee benefit plans and, if he executes a general release of claims, any outstanding options, restricted shares and other equity awards shall be vested and exercisable as of the date of termination and outstanding options shall remain exercisable thereafter until their stated expiration date as if employment had not terminated. Mr. Bertucci shall also be entitled to receive, subject to the execution of a general release of claims, an amount equal to one times his base salary at the time of termination, an amount equal to one times the greater of (i) the highest annual bonus paid to him for the three fiscal years ended immediately before the date of termination or (ii) 50% of his annual base salary, a pro-rated bonus for the then-current fiscal year based on his annual bonus for the fiscal year ended prior to his termination, an amount equal to one times the annual premium or cost paid by us for health, dental and vision insurance coverage for the executive and his eligible dependents in effect on the termination date and an amount equal to one times the annual premium or cost paid by us for disability and life insurance coverage for the executive in effect on the termination date.
The employment agreement with Mr. Bertucci provides for higher severance payments in the event of termination by us without “cause” no more than ninety days before a change in control or on or after a change in control or upon resignation for “good reason” on or after a change in control. The definition of “change in control” under the employment agreement with Mr. Bertucci is the same as the definition of “change in control” under the 2010 Equity Incentive Plan. In any such event, Mr. Bertucci is entitled to receive any earned but unpaid compensation up to the date of termination and any benefits due under the terms of our employee benefit plans and, if he executes a general release of claims, all outstanding options, restricted shares and other equity awards shall be vested and exercisable as of the date of termination and outstanding options shall remain exercisable thereafter until their stated expiration date as if the executive’s employment had not terminated. Mr. Bertucci shall also be entitled to receive, subject to the execution of a general release of claims, an amount equal to two times his base salary at the time of termination, an amount equal to two times the greater of (i) the highest annual bonus paid to him for the three fiscal years ended immediately before the date of termination or (ii) 50% of his annual base salary, a pro-rated bonus for the then-current fiscal year based on his annual bonus for the fiscal year ended prior to his termination, an amount equal to two times the annual premium or cost paid by us for health, dental and vision insurance coverage for the executive and his eligible dependents in effect on the termination date and an amount equal to two times the annual premium or cost paid by us for disability and life insurance coverage for the executive in effect on the termination date.
Mr. Bertucci’s employment agreement includes covenants that prohibit him from disclosing confidential information about us except in connection with our business and affairs. The employment agreement with Mr. Bertucci also provides that, during his employment and for the one-year period following the termination of his employment, he will not compete with us by working with or making a material investment in an entity that owns or proposes to own 25 or more hotels in the upscale or midscale without food and beverage hotel segments, solicit any of our employees to leave employment or interfere with our relationship with any of our customers or clients. The restrictive covenants that prohibit or restrict him from being employed by, or providing services to, a competitor of our company following the termination of his employment with us do not apply after a termination without cause or after the executive resigns with good reason as defined in the agreement.
110
Potential Payments upon Termination or Change in Control
The following table and accompanying footnotes reflect the estimated potential amounts payable to Messrs. Boekelheide, Hansen, Aniszewski, Becker and Bertucci under their employment agreements and our compensation and benefit plans and arrangements in the event the executive’s employment is terminated under various scenarios, including involuntary termination without cause, voluntary termination, involuntary termination with cause, voluntary resignation with good reason, involuntary or good reason termination in connection with a change in control and termination due to death and disability. The amounts shown below are estimates of the amounts that would be paid to Messrs. Boekelheide, Hansen, Aniszewski, Becker and Bertucci upon termination of their employment assuming that such termination was effective upon completion of this offering. Actual amounts payable will depend upon compensation levels at the time of termination, the amount of future equity awards and other factors, and will likely be greater than amounts shown in this table.
111
| Payment in | Acceleration | |||||||||||||||||||
| Lieu of | and | |||||||||||||||||||
| Medical/Welfare | Continuation | |||||||||||||||||||
| Cash | Benefits | of | Total | |||||||||||||||||
| Severance | (present | Equity | Excise Tax | Termination | ||||||||||||||||
| Payment | value)(5) | Awards(6) | Gross-Up(7) | Benefits | ||||||||||||||||
Kerry W. Boekelheide(1)(2) | ||||||||||||||||||||
Involuntary termination without cause(3) | $ | 2,280,000 | $ | 79,200 | — | |||||||||||||||
| Voluntary termination or involuntary termination with cause | — | — | — | — | — | |||||||||||||||
| Change in control (no termination) | — | — | — | |||||||||||||||||
Involuntary or good reason termination in connection with change in control(4) | $ | 2,280,000 | $ | 79,200 | — | |||||||||||||||
| Death or disability | — | — | ||||||||||||||||||
Daniel P. Hansen(1)(2) | ||||||||||||||||||||
Involuntary termination without cause(3) | $ | 2,100,000 | $ | 79,200 | — | |||||||||||||||
| Voluntary termination or involuntary termination with cause | — | — | — | — | — | |||||||||||||||
| Change in control (no termination) | — | — | — | |||||||||||||||||
Involuntary or good reason termination in connection with change in control(4) | $ | 2,100,000 | $ | 79,200 | — | |||||||||||||||
| Death or disability | — | — | — | |||||||||||||||||
Craig J. Aniszewski(1)(2) | ||||||||||||||||||||
Involuntary termination without cause(3) | $ | 787,500 | $ | 39,600 | — | |||||||||||||||
| Voluntary termination or involuntary termination with cause | — | — | — | — | — | |||||||||||||||
| Change in control (no termination) | — | — | — | |||||||||||||||||
Involuntary or good reason termination in connection with change in control(4) | $ | 1,050,000 | $ | 52,800 | — | |||||||||||||||
| Death or disability | — | — | — | |||||||||||||||||
Stuart J. Becker(1)(2) | ||||||||||||||||||||
Involuntary termination without cause(3) | $ | 562,500 | $ | 9,000 | — | |||||||||||||||
| Voluntary termination or involuntary termination with cause | — | — | — | — | ||||||||||||||||
| Change in control (no termination) | — | — | — | |||||||||||||||||
Involuntary or good reason termination in connection with change in control(4) | $ | 750,000 | $ | 12,000 | — | |||||||||||||||
| Death or disability | — | — | — | |||||||||||||||||
Ryan A. Bertucci(1)(2) | ||||||||||||||||||||
Involuntary termination without cause(3) | $ | 330,000 | $ | 26,400 | — | |||||||||||||||
| Voluntary termination or involuntary termination with cause | — | — | — | |||||||||||||||||
| Change in control (no termination) | — | — | — | — | ||||||||||||||||
Involuntary or good reason termination in connection with change in control(4) | $ | 660,000 | $ | 52,800 | — | |||||||||||||||
| Death or disability | — | — | — | |||||||||||||||||
| (1) | The amounts shown in the table do not include accrued salary, earned but unpaid bonuses, accrued but unused vacation pay or the distribution of benefits from any tax-qualified retirement or 401(k) plan. Those amounts are payable to Messrs. Boekelheide, Hansen, Aniszewski, Becker and Bertucci upon any termination of employment, including an involuntary termination with cause and a resignation without good reason. | |
| (2) | A termination of employment due to death or disability entitles Messrs. Boekelheide, Hansen, Aniszewski, Becker and Bertucci to benefits under our life insurance and disability insurance plans. In addition, outstanding options immediately vest upon a termination of employment due to death or disability. | |
| (3) | Amounts calculated in accordance with provisions of the applicable employment agreement as disclosed in “—Employment Agreements.��� | |
| (4) | Amounts calculated in accordance with provisions of the applicable employment agreement as disclosed in “—Employment Agreements.” | |
| (5) | The amounts shown in this column are estimates of the cash payments to be made under the employment agreements based on the annual premiums to be paid by us for health care, life and disability insurance and other benefits expected to be provided to Messrs. Boekelheide, Hansen, Aniszewski, Becker and Bertucci. | |
| (6) | The amounts shown in this column represent the value, on the date of grant of the options that are expected to be granted to Messrs. Boekelheide, Hansen, Aniszewski, Becker and Bertucci upon completion of this offering. The values were computed in accordance with FASB ASC Topic 718 and |
112
| reflect (i) the number of shares for which the options are exercisable following the specified termination event (which is zero shares in the cases of voluntary termination and involuntary termination with cause and all of the option shares in other cases), (ii) the option exercise price, (iii) the period in which the option may be exercised following the specified termination event (which we assume, for purposes of this table, is five years in each case) and (iv) the assumed volatility of our common stock during the period in which the option remains exercisable. For more information on the value of these option awards and the assumptions used in arriving at the amounts disclosed, please see the footnotes to our pro forma financial statements beginning on page F-2 of this prospectus. | ||
| Amounts reflecting accelerated vesting of equity awards in the rows “Change in control (no termination)” and “Involuntary or good reason termination in connection with change in control” will be paid upon only one of the specified triggering events (not both) and will not be duplicated in the event that the executive incurs a qualifying termination following a change in control event that has previously resulted in acceleration. | ||
| (7) | The employment agreements with Messrs. Boekelheide, Hansen, Aniszewski, Becker and Bertucci do not provide an indemnification or gross-up payment for the parachute payment excise tax under Sections 280G and 4999 of the Code. The employment agreements instead provide that the severance and any other payments or benefits that are treated as parachute payments under the Code will be reduced to the maximum amount that can be paid without an excise tax liability. The parachute payments will not be reduced, however, if the executive will receive greater after-tax benefits by receiving the total or unreduced benefits (after taking into account any excise tax liability payable by the executive). The amounts shown in the table assume that Messrs. Boekelheide, Hansen, Aniszewski, Becker and Bertucci will receive the total or unreduced benefits. |
Severance Agreements
Effective upon completion of this offering, we will enter into severance agreements with Mr. Eng, our Vice President, General Counsel and Secretary, and Ms. Sorum, our Vice President, Controller and Chief Accounting Officer, that will provide for payments to these officers under various termination scenarios, each of which will have an initial term of three years and renew for one-year terms thereafter unless terminated in accordance with its terms. The form of severance agreement has been filed as an exhibit to the registration statement of which this prospectus forms a part.
Indemnification Agreements
Upon completion of this offering, we expect to enter into indemnification agreements with each of our directors and executive officers that provide for indemnification to the maximum extent permitted by Maryland law and advancements by us of certain expenses and costs relating to claims, suits or proceedings arising from their service to us.
2010 Equity Incentive Plan
Upon completion of this offering, our board of directors will have adopted, and our sole stockholder will have approved, an equity incentive plan, or the 2010 Equity Incentive Plan, to attract and retain independent directors, executive officers and other key employees and service providers, including officers and employees of our affiliates. The 2010 Equity Incentive Plan provides for the grant of options to purchase shares of common stock, stock awards, stock appreciation rights, performance units and other equity-based awards.
Administration of the 2010 Equity Incentive Plan
The 2010 Equity Incentive Plan will be administered by the compensation committee of our board of directors, except that the 2010 Equity Incentive Plan will be administered by our board of directors with respect to awards made to directors who are not employees. This summary uses the term “administrator” to refer to the compensation committee or our board of directors, as applicable. The administrator will approve all terms of awards under the 2010 Equity Incentive Plan. The administrator will also approve who will receive grants under the 2010 Equity Incentive Plan and the number of shares of common stock subject to each grant.
Eligibility
All of our employees and employees of our subsidiaries and affiliates, and employees of our operating partnership, are eligible to receive grants under the 2010 Equity Incentive Plan. In addition, our independent directors and individuals who perform services for us and our subsidiaries and affiliates, including individuals who perform services for our operating partnership, may receive grants under the 2010 Equity Incentive Plan.
113
Share Authorization
The number of shares of common stock that may be issued under the 2010 Equity Incentive Plan will equal the lesser of: (1) 1,844,217 shares; and (2) 8.5% of the total number of shares sold in this offering (including any shares issued pursuant to an exercise of the underwriters’ over-allotment option). In connection with stock splits, dividends, recapitalizations and certain other events, our board will make adjustments that it deems appropriate in the aggregate number of shares of common stock that may be issued under the 2010 Equity Incentive Plan and the terms of outstanding awards. If any options or stock appreciation rights terminate, expire or are canceled, forfeited, exchanged or surrendered without having been exercised or paid or if any stock awards, performance units or other equity-based awards are forfeited, the shares of common stock subject to such awards will again be available for purposes of the 2010 Equity Incentive Plan. Shares of common stock tendered or withheld to satisfy the exercise price or for tax withholding are not available for future grants under the 2010 Equity Incentive Plan. No awards under the 2010 Equity Incentive Plan were outstanding prior to completion of this offering. The initial grants described below will become effective upon completion of this offering.
Options
The 2010 Equity Incentive Plan authorizes the grant of incentive stock options (under Section 422 of the Code) and options that do not qualify as incentive stock options. The exercise price of each option will be determined by the administrator, provided that the price cannot be less than 100% of the fair market value of the shares of common stock on the date on which the option is granted (or 110% of the shares’ fair market value on the grant date in the case of an incentive stock option granted to an individual who is a “ten percent stockholder” under Sections 422 and 424 of the Code). The exercise price for any option is generally payable (i) in cash, (ii) by certified check, (iii) by the surrender of shares of common stock (or attestation of ownership of shares of common stock) with an aggregate fair market value on the date on which the option is exercised, equal to the exercise price, or (iv) by payment through a broker in accordance with procedures established by the Federal Reserve Board. The term of an option cannot exceed ten years from the date of grant (or five years in the case of an incentive stock option granted to a “ten percent stockholder”). Upon completion of this offering, we will grant options to purchase an aggregate of 940,000 shares of common stock to our named executive officers pursuant to the 2010 Equity Incentive Plan. These options will have an exercise price equal to the IPO price of the shares sold in this offering and will vest ratably on the first five anniversaries of the date of grant unless otherwise accelerated.
Stock Awards
The 2010 Equity Incentive Plan also provides for the grant of stock awards. A stock award is an award of shares of common stock that may be subject to restrictions on transferability and other restrictions as the administrator determines in its sole discretion on the date of grant. The restrictions, if any, may lapse over a specified period of time or through the satisfaction of conditions, in installments or otherwise, as the administrator may determine. Unless otherwise specified in the applicable award agreement, a participant who receives a stock award will have all of the rights of a stockholder as to those shares, including, without limitation, the right to vote the shares and the right to receive dividends or distributions on the shares. During the period, if any, when stock awards are non-transferable or forfeitable, (i) a participant is prohibited from selling, transferring, pledging, exchanging, hypothecating or otherwise disposing of his or her stock award shares, (ii) the company will retain custody of the certificates and (iii) a participant must deliver a stock power to the company for each stock award. Upon completion of this offering, we will grant an aggregate of 4,000 shares of common stock to our independent directors pursuant to the 2010 Equity Incentive Plan. These stock awards will be vested and transferable as of the date of grant.
Stock Appreciation Rights
The 2010 Equity Incentive Plan authorizes the grant of stock appreciation right. A stock appreciation right provides the recipient with the right to receive, upon exercise of the stock appreciation right, cash, shares of common stock or a combination of the two. The amount that the recipient will receive upon exercise of the stock appreciation right generally will equal the excess of the fair market value of the shares of common stock on the date of exercise over the shares’ fair market value on the date of grant. Stock appreciation rights will become exercisable in accordance with terms determined by the compensation committee. Stock appreciation rights may be granted in tandem with an option grant or as
114
independent grants. The term of a stock appreciation right cannot exceed ten years from the date of grant or five years in the case of a stock appreciation right granted in tandem with an incentive stock option awarded to a “ten percent stockholder.”
Performance Units
The 2010 Equity Incentive Plan also authorizes the grant of performance units. Performance units represent the participant’s right to receive an amount, based on the value of a specified number of shares of common stock, if performance goals established by the administrator are met. The administrator will determine the applicable performance period, the performance goals and such other conditions that apply to the performance unit. Performance goals may relate to our financial performance or the financial performance of our operating partnership, the participant’s performance or such other criteria determined by the administrator. If the performance goals are met, performance units will be paid in cash, shares of common stock or a combination thereof.
Incentive Awards
The 2010 Equity Incentive Plan also authorizes our compensation committee to make incentive awards. An incentive award entitles the participant to receive a payment if certain requirements are met. Our compensation committee will establish the requirements that must be met before an incentive award is earned and the requirements may be stated with reference to one or more performance measures or criteria prescribed by the compensation committee. A performance goal or objective may be expressed on an absolute basis or relative to the performance of one or more similarly situated companies or a published index and may be adjusted for unusual or non-recurring events, changes in applicable tax laws or accounting principles. An incentive award that is earned will be settled in a single payment which may be in cash, common stock or a combination of cash and common stock.
Other Equity-Based Awards; LTIP Units
The administrator may grant other types of stock-based awards as other equity-based awards under the 2010 Equity Incentive Plan, including long-term incentive plan, or LTIP, units. Other equity-based awards are payable in cash, shares of common stock or other equity, or a combination thereof, as determined by the administrator. The terms and conditions of other equity-based awards are determined by the administrator.
LTIP units are a special class of partnership interest in our operating partnership. Each LTIP unit awarded will be deemed equivalent to an award of one share of common stock under the 2010 Equity Incentive Plan, reducing the plan’s share authorization for other awards on a one-for-one basis. We will not receive a tax deduction for the value of any LTIP units granted to our employees. The vesting period for any LTIP units, if any, will be determined at the time of issuance. LTIP units, whether or not vested, will receive the same quarterly per unit distributions as OP units, which distributions will generally equal per share distributions on our shares of common stock. This treatment with respect to quarterly distributions is similar to the expected treatment of our stock awards, which will generally receive full dividends whether vested or not. Initially, LTIP units will not have full parity with OP units with respect to liquidating distributions. Under the terms of the LTIP units, our operating partnership will revalue its assets upon the occurrence of certain specified events, and any increase in our operating partnership’s valuation from the time of grant until such event will be allocated first to the holders of LTIP units to equalize the capital accounts of such holders with the capital accounts of OP unit holders. Upon equalization of the capital accounts of the holders of LTIP units with the other holders of OP units, the LTIP units will achieve full parity with OP units for all purposes, including with respect to liquidating distributions. If such parity is reached, vested LTIP units may be converted into an equal number of OP units at any time, and thereafter enjoy all the rights of OP units, including redemption/exchange rights. However, there are circumstances under which such parity would not be reached. Until and unless such parity is reached, the value that a holder of LTIP units will realize for a given number of vested LTIP units will be less than the value of an equal number of our shares of common stock.
We have no current plans to issue any LTIP units.
115
Dividend Equivalents
The administrator may grant dividend equivalents in connection with the grant of performance units and other equity-based awards. Dividend equivalents may be paid currently or accrued as contingent cash obligations (in which case they may be deemed to have been invested in shares of common stock) and may be payable in cash, shares of common stock or other property dividends declared on shares of common stock. The administrator will determine the terms of any dividend equivalents.
Change in Control
If we experience a change in control, the administrator may, at its discretion, provide that all outstanding options, stock appreciation rights, stock awards, performance units, incentive awards or other equity-based awards that are not exercised prior to the change in control will be assumed by the surviving entity, or will be replaced by a comparable substitute award of the same type as the original award and that has substantially equal value granted by the surviving entity. The administrator may also provide that all outstanding options and stock appreciation rights will be fully exercisable on the change in control, restrictions and conditions on outstanding stock awards will lapse upon the change in control and performance units, incentive awards or other equity-based awards will become earned in their entirety. The administrator may also provide that participants must surrender their outstanding options and stock appreciation rights, stock awards, performance units, incentive awards and other equity-based awards in exchange for a payment, in cash or shares of our common stock or other securities or consideration received by stockholders in the change in control transaction, equal to (i) the entire amount that can be earned under an incentive award, (ii) the value received by stockholders in the change in control transaction for each share subject to a stock award, performance unit or other equity-based award or (iii) in the case of options and stock appreciation rights, the amount by which that transaction value exceeds the exercise price.
In summary, a change in control under the 2010 Equity Incentive Plan occurs if:
| § | a person, entity or affiliated group (with certain exceptions) acquires, in a transaction or series of transactions, more than 50% of the total combined voting power of our outstanding securities; | |
| § | we merge into another entity unless the holders of our voting securities immediately prior to the merger have more than 50% of the combined voting power of the securities in the merged entity or its parent; |
| § | we sell or dispose of all or substantially all of our assets to any entity, more than 50% of the combined voting power and common stock of which is owned by our stockholders after the sale or disposition; or |
| § | during any period of two consecutive years individuals who, at the beginning of such period, constitute our board of directors together with any new directors (other than individuals who become directors in connection with certain transactions or election contests) cease for any reason to constitute a majority of our board of directors. |
The Code has special rules that apply to “parachute payments,” i.e., compensation or benefits the payment of which is contingent upon a change in control. If certain individuals receive parachute payments in excess of a safe harbor amount prescribed by the Code, the payor is denied a federal income tax deduction for a portion of the payments and the recipient must pay a 20% excise tax, in addition to income tax, on a portion of the payments.
If we experience a change in control, benefits provided under the 2010 Equity Incentive Plan could be treated as parachute payments. In that event, the 2010 Equity Incentive Plan provides that the plan benefits, and all other parachute payments provided under other plans and agreements, will be reduced to the safe harbor amount, i.e., the maximum amount that may be paid without excise tax liability or loss of deduction, if the reduction allows the recipient to receive greater after-tax benefits. The benefits under the 2010 Equity Incentive Plan and other plans and agreements will not be reduced, however, if the recipient will receive greater after-tax benefits (taking into account the 20% excise tax payable by the recipient) by receiving the total benefits. The 2010 Equity Incentive Plan also provides that these provisions do not apply to a participant who has an agreement with us providing that the individual is entitled to indemnification from us for the 20% excise tax.
116
Amendment; Termination
Our board of directors may amend or terminate the 2010 Equity Incentive Plan at any time, provided that no amendment may adversely impair the rights of participants under outstanding awards. Our stockholders must approve any amendment if such approval is required under applicable law or stock exchange requirements. Our stockholders also must approve any amendment that materially increases the benefits accruing to participants under the 2010 Equity Incentive Plan, materially increases the aggregate number of shares of common stock that may be issued under the 2010 Equity Incentive Plan (other than on account of stock dividends, stock splits, or other changes in capitalization as described above) or materially modifies the requirements as to eligibility for participation in the 2010 Equity Incentive Plan. Unless terminated sooner by our board of directors or extended with stockholder approval, the 2010 Equity Incentive Plan will terminate on the day before the tenth anniversary of the date our board of directors adopted the 2010 Equity Incentive Plan.
401(k) Plan
We may establish and maintain a retirement savings plan under section 401(k) of the Code to cover our eligible employees. The Code allows eligible employees to defer a portion of their compensation, within prescribed limits, on a pre-tax basis through contributions to the 401(k) plan. We may match employees’ annual contributions, within prescribed limits.
117
Investment Policies and Policies With Respect to Certain Activities
The following is a discussion of our investment policies and our policies with respect to certain other activities, including financing matters and conflicts of interest. These policies may be amended or revised from time to time at the discretion of our board of directors, without stockholder approval. Any change to any of these policies by our board of directors, however, would be made only after a thorough review and analysis of that change, in light of then-existing business and other circumstances, and then only if, in the exercise of its business judgment, our board of directors believes that it is advisable to do so in our and our stockholders’ best interests. We intend to disclose any changes in our investment policies in periodic reports that we file or furnish under the Exchange Act. We cannot assure you that our investment objectives will be attained.
Investments in Real Estate or Interests in Real Estate
We intend to conduct substantially all of our investment activities through our operating partnership and its subsidiaries. Our primary objective is to enhance stockholder value over time by generating strong risk-adjusted returns for our stockholders. We plan to invest principally in hotels located in the United States. We target upscale and midscale without food and beverage hotels that meet specific acquisition criteria and to a lesser extent smaller full-service hotels that may fall into the upper upscale or midscale with food and beverage segments. We also may selectively invest in loans secured by these types of hotels or ownership interests in entities owning these types of hotels to the extent the investment provides us with a clear path to acquiring the underlying real estate, and subject to the limitations imposed by reason of our qualification as a REIT. For a discussion of our hotels and our acquisition and other strategic objectives, see “Our Business and Properties.”
We intend to engage in future investment activities in a manner that is consistent with the requirements applicable to REITs for federal income tax purposes. We primarily expect to pursue our investment objectives through the ownership by our operating partnership of hotels, but we may also make equity investments in other entities, including joint ventures that own hotels. Our management team will identify and negotiate acquisition and other investment opportunities, subject to the approval by our board of directors. For information concerning the investing experience of these individuals, please see the section entitled “Management.”
We may enter into joint ventures from time to time, if we determine that doing so would be the most cost-effective and efficient means of raising capital. Equity investments may be subject to existing mortgage financing and other indebtedness or such financing or indebtedness may be incurred in connection with acquiring investments. Any such financing or indebtedness will have priority over our equity interest in such property. Investments are also subject to our policy not to be treated as an investment company under the Investment Company Act of 1940, as amended, or the 1940 Act.
We do not have a specific policy to acquire assets primarily for capital gain or primarily for income. From time to time, we may make investments that support our objectives but do not provide current cash flow. We believe investments that do not generate current cash flow may be, in certain instances, consistent with achieving sustainable long-term growth for our stockholders.
We do not have any specific policy as to the amount or percentage of our assets which will be invested in any specific asset, other than the tax rules applicable to REITs. Additionally, no limits have been set on the concentration of investments in any one geographic location, hotel type or franchise brand. We currently anticipate that our real estate investments will continue to be concentrated in upscale and midscale without food and beverage hotels. We anticipate that our real estate investments will continue to be diversified in terms of geographic market.
Investments in Real Estate Mortgages
While we will emphasize equity real estate investments in hotels, we may selectively acquire loans secured by hotel properties or entities that own hotel properties to the extent that those investments are consistent with our qualification as a REIT and provide us with a clear path to acquiring the underlying real estate. We do not intend to originate any secured or unsecured real estate loans or purchase any debt securities as a stand-alone, long-term investment, but, in limited circumstances, we may from time to time provide a short-term loan to a hotel owner as a means of securing an acquisition opportunity. The mortgages in which we may invest may be first-lien mortgages or subordinate mortgages secured by
118
hotels. The subordinated mezzanine loans in which we may invest may include mezzanine loans secured by a pledge of ownership interests in an entity owning a hotel or group of hotels. Investments in real estate mortgages and subordinated real estate loans are subject to the risk that one or more borrowers may default and that the collateral securing mortgages may not be sufficient or, in the case of subordinated mezzanine loans, available to enable us, to recover our full investment.
Investments in Securities or Interests in Entities Primarily Engaged in Real Estate Activities and Investments in Other Securities
Subject to the gross income and asset requirements required to qualify as a REIT, we may invest in securities of entities engaged in real estate activities or securities of other issuers, including for the purpose of exercising control over such entities. We do not currently have any policy limiting the types of entities in which we may invest or the proportion of assets to be so invested, whether through acquisition of an entity’s common stock, limited liability or partnership interests, interests in another REIT or entry into a joint venture. However, other than in the formation transactions, we do not presently intend to invest in these types of securities.
Purchase and Sale of Investments
We expect to invest in hotels primarily for generation of current income and long-term capital appreciation. Although we do not currently intend to sell any hotels, we may deliberately and strategically dispose of assets in the future and redeploy funds into new acquisitions and development opportunities that align with our strategic objectives. If market conditions are favorable, we may also engage in development opportunities by developing the land within our portfolio or acquiring land for development.
Lending Policies
We do not have a policy limiting our ability to make loans to other persons, although our ability to do so may be limited by applicable law, such as the Sarbanes-Oxley Act. Subject to tax rules applicable to REITs, we may make loans to unaffiliated third parties. For example, we may consider offering purchase money financing in connection with the disposition of assets in instances where the provision of that financing would increase the value to be received by us for the asset sold. We do not expect to engage in any significant lending in the future. We may choose to guarantee debt of certain joint ventures with third parties. Consideration for those guarantees may include, but is not limited to, fees, long-term management contracts, options to acquire additional ownership interests and promoted equity positions. Our board of directors may, in the future, adopt a formal lending policy without notice to or consent of our stockholders.
Issuance of Additional Securities
If our board of directors determines that obtaining additional capital would be advantageous to us, we may, without stockholder approval, issue debt or equity securities, including causing our operating partnership to issue additional OP units, retain earnings (subject to the REIT distribution requirements for federal income tax purposes) or pursue a combination of these methods. As long as our operating partnership is in existence, the proceeds of all equity capital raised by us will be contributed to our operating partnership in exchange for additional OP units, which will dilute the ownership interests of the other limited partners.
We may offer shares of our common stock, OP units, or other debt or equity securities in exchange for cash, real estate assets or other investment targets, and to repurchase or otherwise re-acquire shares of our common stock, OP units or other debt or equity securities. We may issue preferred stock from time to time, in one or more classes or series, as authorized by our board of directors without the need for stockholder approval. We have not adopted a specific policy governing the issuance of senior securities at this time. Summit Capital, which is owned and managed by our Executive Chairman, Mr. Boekelheide, may engage in the distribution and sale of securities of other issuers in private placements exempt from registration requirements under the Securities Act of 1933, as amended, or the Securities Act.
119
Repurchase of Our Securities
We may repurchase shares of our common stock or OP units from time to time. In addition, certain holders of OP units have the right, beginning 12 months after completion of the formation transactions, to require us to redeem their OP units in exchange for cash or, at our option, shares of common stock. See “Shares Eligible for Future Sale—Redemption/Exchange Rights.”
Reporting Policies
We intend to make available to our stockholders audited annual financial statements and annual reports. Upon completion of this offering, we will become subject to the information reporting requirements of the Exchange Act, pursuant to which we will file periodic reports, proxy statements and other information, including audited financial statements, with the SEC.
Policies with Respect to Certain Transactions
Upon completion of this offering and the formation transactions, we will adopt a written policy for the review and approval of related person transactions requiring disclosure under Item 404(a) of Regulation S-K, which will include our directors, officers, major stockholders and affiliates, including certain of their family members. For a discussion of our Related Person Transaction Policy, see “Certain Relationships and Related Party Transactions—Review and Approval of Future Transactions with Related Persons.” Under our bylaws, our directors and officers may have business interests and engage in business activities similar to, in addition to or in competition with those of or relating to our company.
120
Principal Stockholders
Immediately prior to the closing of this offering, we will have a total of 1,000 shares of common stock outstanding. We sold these shares to our Executive Chairman, Mr. Boekelheide in connection with our formation and initial capitalization for total consideration of $1,000. At the closing of this offering, we will repurchase these shares from Mr. Boekelheide for $1,000.
The following table sets forth the beneficial ownership of shares of our common stock and shares of common stock issuable upon redemption of OP units (without giving effect to the 12 month restriction on redemption applicable to OP units) immediately following completion of this offering and the formation transactions by (1) each of the executive officers named in the table appearing under the caption “Management—Summary Compensation Table,” (2) each of our directors, including persons who have agreed to become directors upon completion of this offering, (3) all of our executive officers and directors as a group and (4) each holder of five percent or more of our shares of common stock.
The SEC has defined “beneficial ownership” of a security to mean the possession, directly or indirectly, of voting power and/or investment power over such security. In computing the number of shares and OP units beneficially owned by a person and the percentage ownership of that person, shares of common stock subject to options or other rights held by that person that are exercisable or will become exercisable within 60 days after the date of this prospectus, are deemed outstanding, while such shares are not deemed outstanding for purposes of computing percentage ownership of any other person. Each person named in the table has sole voting and investment power with respect to all of the shares of common stock and OP units shown as beneficially owned by such person, except as otherwise set forth in the notes to the table. Unless otherwise indicated, the address of each named person is c/o Summit Hotel Properties, Inc., 2701 South Minnesota Avenue, Suite 6, Sioux Falls, South Dakota 57105.
| Number of Shares | Percentage of All | |||||||||||
| and OP Units | Percentage of All | Shares and OP Units | ||||||||||
Name of Beneficial Owner | Beneficially Owned | Shares(1) | Beneficially Owned(2) | |||||||||
Kerry W. Boekelheide(3) | 1,517,879 | – | – | |||||||||
Daniel P. Hansen(4) | – | – | – | |||||||||
Craig J. Aniszewski(5) | 4,105 | * | * | |||||||||
Stuart J. Becker(4) | – | – | – | |||||||||
Ryan A. Bertucci(4) | – | – | – | |||||||||
| Bjorn R. L. Hanson | 1,000(6 | ) | * | * | ||||||||
| David S. Kay | 1,000(6 | ) | * | * | ||||||||
| Thomas W. Storey | 1,000(6 | ) | * | * | ||||||||
| Wayne W. Wielgus | 1,000(6 | ) | * | * | ||||||||
| All directors and executive officers as a group (9 persons) | 1,525,984 | * | 5.3 | % | ||||||||
| * | Represents less than 1% |
| (1) | Assumes shares of our common stock are outstanding immediately following this offering. In addition, amounts for individuals assume that all OP units held by the person are redeemed for shares of our common stock, and amounts for all executive officers and directors as a group assume all OP units held by them are exchanged for shares of our common stock. The total number of shares of common stock outstanding used in calculating this percentage assumes that none of the OP units held by other persons are exchanged for shares of our common stock. |
| (2) | Assumes a total of shares of our common stock and 10,100,000 OP units, which OP units may redeemed for cash or, at our election, shares of our common stock as described in “Description of the Partnership Agreement,” are outstanding immediately following this offering. | |
| (3) | Upon completion of this offering, Mr. Boekelheide will not beneficially own any shares of our common stock, except in the form of OP units. Includes (i) 17,000 OP units to be issued to a revocable trust, the trustee and sole beneficiary of which is Mr. Boekelheide, in exchange for the trust’s membership interests in our predecessor; (ii) 1,109,164 OP units to be issued to The Summit Group in the merger in exchange for its membership interests in our predecessor; (iii) 74,829 OP units to be issued to The Summit Group in exchange for its Class B membership interest in Summit of Scottsdale; and (iv) an aggregate of 316,886 OP units to be issued to entities affiliated with Mr. Boekelheide other than The Summit Group, over which Mr. Boekelheide will share voting and investment power with individuals who are not affiliated with us. Excludes options to purchase 376,000 shares of our common stock at the IPO price, none of which has vested. |
| (4) | Does not reflect options to be granted to Messrs. Hansen, Becker and Bertucci to purchase an aggregate of 329,000 shares of our common stock at the IPO price, none of which has vested. |
| (5) | Upon completion of this offering, Mr. Aniszewski will not beneficially own any shares of our common stock, except in the form of OP units. Includes 4,105 OP units to be issued to Mr. Aniszewski in exchange for his Class B membership interests in our predecessor. Excludes options to purchase 235,000 shares of our common stock at the IPO price, none of which has vested. |
| (6) | We will grant 1,000 shares of common stock to each initial independent director upon completion of this offering. |
121
Certain Relationships and Related Party Transactions
Formation Transactions
On June 30, 2010, in connection with the initial capitalization of our company, we issued 1,000 shares of common stock to our Executive Chairman, Mr. Boekelheide, for total cash consideration of $1,000. The shares were issued in reliance on the exemption set forth in Section 4(2) of the Securities Act. Upon completion of this offering, we will repurchase these shares from Mr. Boekelheide for $1,000.
Some of our executive officers and directors have material interests in the formation transactions. Prior to completion of the formation transactions, these executive officers and directors have ownership interests in our predecessor. In addition, Mr. Boekelheide, through The Summit Group, holds a 36% Class B membership interest in Summit of Scottsdale. As part of the formation transactions, we will acquire these ownership interests by issuing OP units to the former members of those companies, including some of our executive officers and directors. The aggregate number and value of the OP units to be issued to our executive officers and directors in connection with the formation transactions is as follows:
| § | Mr. Boekelheide, our Executive Chairman, will receive an aggregate of 1,200,993 OP units, including: (1) 17,000 OP units to be issued to a revocable trust, the trustee and sole beneficiary of which is Mr. Boekelheide, in exchange for the trust’s Class A membership interests in our predecessor pursuant to the merger; (2) 1,109,164 OP units to be issued to The Summit Group pursuant to the merger; and (3) 74,829 OP units to be issued to The Summit Group in exchange for its 36% Class B membership interest in Summit of Scottsdale. These OP units will represent approximately % of our combined common stock and OP units outstanding upon completion of this offering, the concurrent private placement and the formation transactions and have a combined aggregate value of $ million based on the anticipated mid-point of the IPO price range shown on the cover of this prospectus. |
| § | Entities affiliated with Mr. Boekelheide, other than The Summit Group, will receive an aggregate of 316,886 OP units. Mr. Boekelheide will share voting and investment power over these OP units with individuals who are not affiliated with us. These OP units will represent approximately % of our combined common stock and OP units outstanding upon completion of this offering, the concurrent private placement and the formation transactions and have a combined aggregate value of $ million based on the anticipated mid-point of the IPO price range shown on the cover of this prospectus. |
| § | Mr. Aniszewski, our Executive Vice President and Chief Operating Officer, will receive an aggregate of 4,105 OP units in exchange for his Class B membership interest in our predecessor pursuant to the merger. These OP units will represent approximately % of our combined common stock and OP units outstanding upon completion of this offering, the concurrent private placement and the formation transactions and have a combined aggregate value of $ million based on the anticipated mid-point of the IPO price range shown on the cover of this prospectus. |
In addition to the OP units to be received in connection with the formation transactions, our executive officers will also benefit from the following:
| § | employment agreements that will provide for salary, bonus and other benefits, including severance benefits in the event of a termination of employment in certain circumstances (see “Management—Employment Agreements”); |
| § | options to purchase an aggregate of 940,000 shares of our common stock at the IPO price of the shares in this offering that will be granted to our named executive officers upon completion of this offering pursuant to the 2010 Equity Incentive Plan (see “Management—IPO Grants of Plan-Based Awards”); |
| § | agreements providing for indemnification by us for certain liabilities and expenses incurred as a result of actions brought, or threatened to be brought, against them as an officer and/or director of our company (see “Management—Indemnification Agreements” and “Certain Provisions of Maryland Law and of Our Charter and Bylaws”); and |
| § | redemption and registration rights under our operating partnership’s partnership agreement with respect to OP units to be issued in the formation transactions (see “Description of the Partnership Agreement”). |
Furthermore, in connection with the formation transactions, our operating partnership will offer to enter into tax protection agreements with a limited number of the members of our predecessor, including The Summit Group. See “Formation Transactions—Tax Protection Agreements.”
122
Cash Payment by Interstate to The Summit Group
In consideration for assigning to them the existing hotel management agreements with our predecessor, The Summit Group will receive a total cash payment from Interstate in the amount of $12.75 million, $11.0 million of which will be paid upon completion of this offering and $1.75 million of which will be paid on the third anniversary of the completion of this offering.
Related Party Transactions Between Our Predecessor and Its Affiliates Prior to the Formation Transactions
Our Executive Chairman, Mr. Boekelheide, is the sole owner of The Summit Group. Prior to completion of the formation transactions, The Summit Group held a 43.5% total ownership interest in our predecessor and it acted as our predecessor’s company manager. In addition, The Summit Group had the right to appoint six of the seven members of our predecessor’s board of managers. Prior to completion of the formation transactions, Mr. Boekelheide served as an executive officer and member of the board of managers of our predecessor. As a result, The Summit Group exercised substantial influence and control over our predecessor and its business and affairs.
For the year ended December 31, 2009 and the nine months ended September 30, 2010, our predecessor reimbursed $4.1 million and $3.1 million, respectively, of expenses incurred by The Summit Group in connection with the management of our predecessor and the management of our predecessor’s hotels. In addition, as of September 30, 2010, our predecessor had accounts payable to The Summit Group in the amount of approximately $437,000 relating to reimbursement of development expenses for acquired properties and certain management expenses.
Summit Capital, a registered broker-dealer, provided placement agent services to our predecessor in connection with private offerings of our predecessor’s securities. Our Executive Chairman, Mr. Boekelheide, is the sole owner and President of Summit Capital. For the year ended December 31, 2009 and the nine months ended September 30, 2010, our predecessor paid Summit Capital approximately $571,000 and $0, respectively, in commissions and fees related to placements of our predecessor’s securities.
From time to time in the past, our predecessor has selectively used an aircraft owned by an entity owned by Mr. Boekelheide, and we may use the aircraft going forward. Our predecessor historically paid the actual cost of such aircraft (fuel, pilot fees and an allocable share of maintenance and depreciation) and we expect to use the aircraft selectively on substantially the same terms.
Outside Business Interests
Following completion of this offering, Mr. Boekelheide and other key members of our senior management team, including Messrs. Hansen and Aniszewski, will continue to serve as executive officers of The Summit Group. We will reimburse The Summit Group for payments it makes on behalf of each of Messrs. Boekelheide, Hansen and Aniszewski for health care benefits provided under the Exec-U-Care program. The Summit Group will continue to manage one hotel that is not owned by us, a Comfort Suites located in Tucson, Arizona. Our employment agreement with Mr. Boekelheide requires him to devote a substantial portion of his business time and attention to our business and our employment agreements with our other executive officers require our executives to devote substantially all of their business time and attention to our business. Our employment agreements with our other executives do not include a prohibition on competing with our company. In addition, Mr. Boekelheide, as well as our Executive Vice President and Chief Financial Officer, Mr. Becker, and our Vice President of Acquisitions, Mr. Bertucci, will continue to serve as officers of Summit Green Tiger. Summit Green Tiger co-manages two private investment funds, which own a total of six multi-family properties. We will not compete with these funds for investment opportunities. These outside business interests may reduce the amount of time that Messrs. Boekelheide, Hansen, Aniszewski, Becker and Bertucci are able to devote to our business. We expect a limited amount of time will be dedicated to these funds as they are closed and the co-manager oversees the day-to-day operations and investments of these funds.
123
Review and Approval of Future Transactions with Related Persons
Upon completion of this offering and the formation transactions, we will adopt a written policy for the review and approval of related person transactions requiring disclosure under Item 404(a) of Regulation S-K. We expect this policy to provide that our nominating and corporate governance committee will be responsible for reviewing and approving or disapproving all interested transactions, meaning any transaction, arrangement or relationship in which (1) the amount involved may be expected to exceed $120,000 in any fiscal year, (2) our company or one of our subsidiaries will be a participant and (3) a related person has a direct or indirect material interest. A related person will be defined as an executive officer, director or nominee for election as director, or a greater than 5% beneficial owner of our common stock, or an immediate family member of the foregoing. The policy may deem certain interested transactions to be pre-approved.
124
Description of Capital Stock
The following is a summary of the material terms of our capital stock and certain terms of our charter and bylaws as we expect they will be at the time of completion of this offering and the formation transactions.
General
We are authorized to issue 600,000,000 shares of stock, consisting of 500,000,000 shares of common stock, $0.01 par value per share, and 100,000,000 shares of preferred stock, $0.01 par value per share. Our charter authorizes our board of directors, with the approval of a majority of the entire board and without any action on the part of our stockholders, to amend our charter to increase or decrease the aggregate number of authorized shares of stock or the number of authorized shares of stock of any class or series without stockholder approval. As of the date of this prospectus, we had 1,000 outstanding shares of common stock held by one record holder, Mr. Boekelheide, and no outstanding shares of preferred stock. Under Maryland law, stockholders generally are not liable for a corporation’s debts or obligations.
Common Stock
Subject to the preferential rights, if any, of holders of any other class or series of stock and to the provisions of our charter regarding restrictions on ownership and transfer of our stock, holders of our common stock:
| § | have the right to receive ratably any distributions from funds legally available therefor, when, as and if authorized by our board of directors and declared by us; and |
| § | are entitled to share ratably in the assets of our company legally available for distribution to the holders of our common stock in the event of our liquidation, dissolution or winding up of our affairs. |
There are generally no redemption, sinking fund, conversion, preemptive or appraisal rights with respect to our common stock.
Subject to the provisions of our charter regarding restrictions on ownership and transfer of our stock and except as may otherwise be specified in the terms of any class or series of stock, each outstanding share of our common stock entitles the holder to one vote on all matters submitted to a vote of stockholders, including the election of directors and, except as may be provided with respect to any other class or series of stock, the holders of such shares will possess the exclusive voting power. There is no cumulative voting in the election of our directors, and directors will be elected by a plurality of the votes cast in the election of directors. Consequently, at each annual meeting of stockholders, the holders of a majority of the outstanding shares of our common stock can elect all of the directors then standing for election, and the holders of the remaining shares will not be able to elect any directors.
Power to Reclassify and Issue Stock
Our board of directors may classify any unissued shares of preferred stock, and reclassify any unissued shares of common stock or any previously classified but unissued shares of preferred stock into other classes or series of stock, including one or more classes or series of stock that have priority over our common stock with respect to voting rights or distributions or upon liquidation, and authorize us to issue the newly classified shares. Prior to the issuance of shares of each class or series, our board of directors is required by the MGCL and our charter to set, subject to the provisions of our charter regarding the restrictions on ownership and transfer of our stock, the preferences, conversion or other rights, voting powers, restrictions, limitations as to dividends or other distributions, qualifications or terms or conditions of redemption for each such class or series. These actions can be taken without stockholder approval, unless stockholder approval is required by applicable law, the terms of any other class or series of our stock or the rules of any stock exchange or automated quotation system on which our stock may be then listed or quoted.
Power to Increase or Decrease Authorized Stock and Issue Additional Shares of Our Common and Preferred Stock
Our charter authorizes our board of directors, with the approval of a majority of the entire board, to amend our charter to increase or decrease the aggregate number of authorized shares of stock or the number of authorized shares of
125
stock of any class or series without stockholder approval. We believe that the power of our board of directors to increase or decrease the number of authorized shares of stock and to classify or reclassify unissued shares of our common stock or preferred stock and thereafter to cause us to issue such shares of stock will provide us with increased flexibility in structuring possible future financings and acquisitions and in meeting other needs which might arise. The additional classes or series, as well as the additional shares of stock, will be available for issuance without further action by our stockholders, unless such action is required by applicable law, the terms of any other class or series of stock or the rules of any stock exchange or automated quotation system on which our securities may be listed or traded. Although our board of directors does not intend to do so, it could authorize us to issue a class or series that could, depending upon the terms of the particular class or series, delay, defer or prevent a transaction or a change in control of our company that might involve a premium price for our stockholders or otherwise be in their best interests.
Restrictions on Ownership and Transfer
In order to qualify as a REIT under the Code, our shares of stock must be beneficially owned by 100 or more persons during at least 335 days of a taxable year of 12 months (other than the first year for which an election to be a REIT has been made) or during a proportionate part of a shorter taxable year. Also, not more than 50% of the value of our outstanding shares of capital stock may be owned, directly or indirectly, by five or fewer individuals (as defined in the Code to include certain entities) during the last half of a taxable year (other than the first year for which an election to be a REIT has been made).
Because our board of directors believes it is at present essential for us to qualify as a REIT, our charter, subject to certain exceptions, contains restrictions on the number of our shares of stock that a person may own. Our charter provides that, subject to certain exceptions, no person may beneficially or constructively own more than 9.8% in value or in number of shares, whichever is more restrictive, of the outstanding shares of any class or series of our capital stock, or the Ownership Limit.
Our charter also prohibits any person from:
| § | beneficially owning shares of our capital stock to the extent that such beneficial ownership would result in our being “closely held” within the meaning of Section 856(h) of the Code (without regard to whether the ownership interest is held during the last half of the taxable year); | |
| § | transferring shares of our capital stock to the extent that such transfer would result in our shares of capital stock being beneficially owned by fewer than 100 persons (determined under the principles of Section 856(a)(5) of the Code); | |
| § | beneficially or constructively owning shares of our capital stock to the extent such beneficial or constructive ownership would cause us to constructively own ten percent or more of the ownership interests in a tenant (other than a TRS) of our real property within the meaning of Section 856(d)(2)(B) of the Code; or | |
| § | beneficially or constructively owning or transferring shares of our capital stock if such beneficial or constructive ownership or transfer would otherwise cause us to fail to qualify as a REIT under the Code, including, but not limited to, as a result of any hotel management companies failing to qualify as an “eligible independent contractor” under the REIT rules. |
Our board of directors, in its sole discretion, may prospectively or retroactively exempt a person from certain of the limits described in the paragraph above and may establish or increase an excepted holder percentage limit for that person. The person seeking an exemption must provide to our board of directors any representations, covenants and undertakings that our board of directors may deem appropriate in order to conclude that granting the exemption will not cause us to lose our status as a REIT. Our board of directors may not grant an exemption to any person if that exemption would result in our failing to qualify as a REIT. Our board of directors may require a ruling from the IRS or an opinion of counsel, in either case in form and substance satisfactory to our board of directors, in its sole discretion, in order to determine or ensure our status as a REIT.
Any attempted transfer of shares of our capital stock which, if effective, would violate any of the restrictions described above will result in the number of shares of our capital stock causing the violation (rounded up to the nearest whole share) to be automatically transferred to a trust for the exclusive benefit of one or more charitable beneficiaries, except that any
126
transfer that results in the violation of the restriction relating to shares of our capital stock being beneficially owned by fewer than 100 persons will be void ab initio. In either case, the proposed transferee will not acquire any rights in those shares. The automatic transfer will be deemed to be effective as of the close of business on the business day prior to the date of the purported transfer or other event that results in the transfer to the trust. Shares held in the trust will be issued and outstanding shares. The proposed transferee will not benefit economically from ownership of any shares held in the trust, will have no rights to dividends or other distributions and will have no rights to vote or other rights attributable to the shares held in the trust. The trustee of the trust will have all voting rights and rights to dividends or other distributions with respect to shares held in the trust. These rights will be exercised for the exclusive benefit of the charitable beneficiary. Any dividend or other distribution paid prior to our discovery that shares have been transferred to the trust will be paid by the recipient to the trustee upon demand. Any dividend or other distribution authorized but unpaid will be paid when due to the trustee. Any dividend or other distribution paid to the trustee will be held in trust for the charitable beneficiary. Subject to Maryland law, the trustee will have the authority (i) to rescind as void any vote cast by the proposed transferee prior to our discovery that the shares have been transferred to the trust and (ii) to recast the vote in accordance with the desires of the trustee acting for the benefit of the charitable beneficiary. However, if we have already taken irreversible corporate action, then the trustee will not have the authority to rescind and recast the vote.
Within 20 days of receiving notice from us that shares of our stock have been transferred to the trust, the trustee will sell the shares to a person, designated by the trustee, whose ownership of the shares will not violate the above ownership and transfer limitations. Upon the sale, the interest of the charitable beneficiary in the shares sold will terminate and the trustee will distribute the net proceeds of the sale to the proposed transferee and to the charitable beneficiary as follows. The proposed transferee will receive the lesser of (i) the price paid by the proposed transferee for the shares or, if the proposed transferee did not give value for the shares in connection with the event causing the shares to be held in the trust (e.g., a gift, devise or other similar transaction), the market price (as defined in our charter) of the shares on the day of the event causing the shares to be held in the trust and (ii) the price per share received by the trustee (net of any commission and other expenses of sale) from the sale or other disposition of the shares. The trustee may reduce the amount payable to the proposed transferee by the amount of dividends or other distributions paid to the proposed transferee and owed by the proposed transferee to the trustee. Any net sale proceeds in excess of the amount payable to the proposed transferee will be paid immediately to the charitable beneficiary. If, prior to our discovery that our shares of our stock have been transferred to the trust, the shares are sold by the proposed transferee, then (i) the shares shall be deemed to have been sold on behalf of the trust and (ii) to the extent that the proposed transferee received an amount for the shares that exceeds the amount he or she was entitled to receive, the excess shall be paid to the trustee upon demand.
In addition, shares of our stock held in the trust will be deemed to have been offered for sale to us, or our designee, at a price per share equal to the lesser of (i) the price per share in the transaction that resulted in the transfer to the trust (or, in the case of a devise or gift, the market price at the time of the devise or gift) and (ii) the market price on the date we, or our designee, accept the offer, which we may reduce by the amount of dividends and distributions paid to the proposed transferee and owed by the proposed transferee to the trustee. We will have the right to accept the offer until the trustee has sold the shares. Upon a sale to us, the interest of the charitable beneficiary in the shares sold will terminate and the trustee will distribute the net proceeds of the sale to the proposed transferee.
If a transfer to a charitable trust, as described above, would be ineffective for any reason to prevent a violation of a restriction, the transfer that would have resulted in a violation will be void ab initio, and the proposed transferee shall acquire no rights in those shares.
Any certificate representing shares of our capital stock, and any notices delivered in lieu of certificates with respect to the issuance or transfer of uncertificated shares, will bear a legend referring to the restrictions described above.
Any person who acquires or attempts or intends to acquire beneficial or constructive ownership of shares of our capital stock that will or may violate any of the foregoing restrictions on transferability and ownership, or any person who would have owned shares of our capital stock that resulted in a transfer of shares to a charitable trust, is required to give written notice immediately to us, or in the case of a proposed or attempted transaction, to give at least 15 days’ prior written notice, and provide us with such other information as we may request in order to determine the effect of the transfer on our status as a REIT. The foregoing restrictions on transferability and ownership will not apply if our board of directors determines that it is no longer in our best interests to attempt to qualify, or to continue to qualify, as a REIT.
127
Every owner of more than 5% (or any lower percentage as required by the Code or the regulations promulgated thereunder) in number or value of the outstanding shares of our capital stock, within 30 days after the end of each taxable year, is required to give us written notice, stating his or her name and address, the number of shares of each class and series of shares of our capital stock that he or she beneficially owns and a description of the manner in which the shares are held. Each of these owners must provide us with additional information that we may request in order to determine the effect, if any, of his or her beneficial ownership on our status as a REIT and to ensure compliance with the ownership limits. In addition, each stockholder will upon demand be required to provide us with information that we may request in good faith in order to determine our status as a REIT and to comply with the requirements of any taxing authority or governmental authority or to determine our compliance.
These ownership limitations could delay, defer or prevent a transaction or a change in control that might involve a premium price for our shares of common stock or otherwise be in the best interest of our stockholders.
Stock Exchange Listing
We have applied to list our common stock on the NYSE under the symbol “INN.”
Transfer Agent and Registrar
The transfer agent and registrar for our shares of common stock is Wells Fargo Bank, National Association.
128
Shares Eligible for Future Sale
General
Upon completion of this offering, the concurrent private placement and the formation transactions, we expect to have outstanding shares of our common stock ( shares if the underwriters’ over-allotment option is exercised in full). Of these shares, the shares sold in this offering will be freely transferable without restriction or further registration under the Securities Act, subject to the restrictions on ownership and transfer set forth in our charter, except for any shares held by our “affiliates,” as that term is defined by Rule 144 under the Securities Act. The shares of our common stock purchased by an affiliate of IHG in the concurrent private placement will be, and shares of our common stock issued upon redemption of OP units may be, “restricted securities” within the meaning of Rule 144 under the Securities Act.
Prior to this offering, there has been no public market for our common stock. Trading of our common stock on the NYSE is expected to commence immediately following the completion of this offering and the formation transactions. No prediction can be made as to the effect, if any, that future sales of shares, or the availability of shares for future sale, will have on the market price prevailing from time to time. Sales of substantial amounts of our common stock (including shares issued upon the exchange of OP units or the exercise of options), or the perception that such sales occur, could adversely affect prevailing market prices of our common stock.
Rule 144
In general, under Rule 144, a person (or persons whose shares are aggregated) who is not an affiliate of ours and has not been one of our affiliates at any time during the three months preceding a sale, and who has beneficially owned the restricted securities proposed to be sold for at least one year, including the holding period of any prior owner other than an affiliate, is entitled to sell his or her securities without registration and without complying with the manner of sale, current public information, volume limitation or notice provisions of Rule 144. In addition, under Rule 144, once we have been subject to the reporting requirements of the Exchange Act for at least 90 days, a person (or persons whose securities are aggregated) who is not an affiliate of ours and has not been one of our affiliates at any time during the three months preceding a sale, may sell his or her securities without registration after only a six-month holding period, subject only to the continued availability of current public information about us. Any sales by affiliates under Rule 144, even after the applicable holding periods described above, are subject to requirements and or limitations with respect to volume, manner of sale, notice and the availability of current public information about us.
Redemption Rights and Registration Rights
In connection with the formation transactions, our operating partnership will issue an aggregate of 10,100,000 OP units to the former members of our predecessor and the former Class B and Class C members of Summit of Scottsdale. These OP units will be outstanding upon completion of this offering and the formation transactions. Beginning on or after the date which is 12 months after completion of the formation transactions, the limited partners of our operating partnership (other than us) have the right to require our operating partnership to redeem part or all of their OP units for cash or, at our election, shares of our common stock, based upon the market price of an equivalent number of shares of our common stock at the time of the redemption, subject to the ownership limits set forth in our charter. Limited partners of our operating partnership (other than us) will have registration rights with respect to these shares. These redemption and registration rights may result in 10,100,000 shares of our common stock becoming immediately saleable on the open market on or about the first anniversary of completion of this offering. We have also granted to the IHG affiliate purchasing shares of our common stock in the concurrent private placement certain registration rights with respect to those shares on terms that are substantially similar to those granted to the limited partners of our operating partnership. Accordingly, we will include the shares of common stock purchased by the IHG affiliate in the concurrent private placement in the first resale shelf registration statement we file covering the resale of shares of common stock issuable upon redemption of outstanding OP units. See “Description of the Partnership Agreement—Registration Rights” for more information.
129
Equity Grants and Incentive Plan
Prior to completion of this offering, we will adopt, and Mr. Boekelheide, as our sole stockholder, will approve, the 2010 Equity Incentive Plan. Key employees, directors and consultants are eligible to be granted stock options, stock appreciation rights, restricted stock, phantom shares, dividend equivalent rights and other equity-based awards under the 2010 Equity Incentive Plan. The lesser of (1) 1,844,217 shares of our common stock and (2) 8.5% of the total number of shares of our common stock sold in this offering (including any shares issued pursuant to the underwriters’ over-allotment option) will be authorized and reserved for issuance pursuant to the 2010 Equity Incentive Plan, subject to certain adjustments as set forth in the plan. Approximately 5% of these shares will be issued to our executive officers in the form of option awards and to our independent directors in the form of stock awards upon completion of this offering.
We anticipate that we will file a registration statement on Form S-8 with respect to the shares of our common stock issuable under the 2010 Equity Incentive Plan prior to completion of this offering. Shares of our common stock covered by this registration statement will be eligible for transfer or resale without restriction under the Securities Act unless held by affiliates.
Lock-Up Agreements
For a description of the lock-up agreement that our officers and directors and certain stockholders have agreed to enter into with the representative of the underwriters, see “Underwriting.”
The affiliate of IHG purchasing shares of our common stock in the concurrent private placement has agreed to enter into a lock-up agreement on terms that are substantially similar to those agreed to by our officers and directors and certain stockholders, except that the initial duration of the lock-up period will be one year following completion of the concurrent private placement. The IHG affiliate may transfer those shares to an affiliate so long as the recipient affiliate agrees in writing to be bound by the same restrictions. The underwriters will be third-party beneficiaries of the lock-up agreement between us and the affiliate of IHG purchasing shares of our common stock in the concurrent private placement.
130
Certain Provisions of Maryland Law and of Our Charter and Bylaws
Our Board of Directors
Our charter and bylaws provide that the number of directors of our company may be established, increased or decreased by our board of directors, but may not be less than the minimum number required under the MGCL, which is one, or more than fifteen. Our charter provides that, at such time as we become eligible to elect to be subject to Title 3, Subtitle 8 of the MGCL (which we expect will be upon completion of this offering) and subject to the rights of holders of one or more classes or series of preferred stock, any vacancy may be filled only by a majority of the remaining directors, even if the remaining directors do not constitute a quorum, and any director elected to fill a vacancy will serve for the full term of the directorship in which such vacancy occurred and until a successor is elected and qualifies.
Pursuant to our charter, each member of our board of directors is elected by our stockholders to serve until the next annual meeting of stockholders and until his or her successor is duly elected and qualifies. Holders of shares of our common stock will have no right to cumulative voting in the election of directors, and directors will be elected by a plurality of the votes cast in the election of directors. Consequently, at each annual meeting of stockholders, the holders of a majority of the shares of our common stock will be able to elect all of our directors.
Removal of Directors
Our charter provides that, subject to the rights of holders of one or more classes or series of preferred stock to elect or remove one or more directors, a director may be removed only for cause (as defined in our charter) and only by the affirmative vote of holders of shares entitled to cast at least two-thirds of the votes entitled to be cast generally in the election of directors. This provision, when coupled with the exclusive power of our board of directors to fill vacant directorships, may preclude stockholders from removing incumbent directors except for cause and by a substantial affirmative vote and filling the vacancies created by such removal with their own nominees.
Business Combinations
Under the MGCL, certain “business combinations” (including a merger, consolidation, share exchange or, in circumstances specified in the statute, an asset transfer or issuance or reclassification of equity securities) between a Maryland corporation and an interested stockholder (i.e., any person (other than the corporation or any subsidiary) who beneficially owns 10% or more of the voting power of the corporation’s outstanding voting stock after the date on which the corporation had 100 or more beneficial owners of its stock, or an affiliate or associate of the corporation who, at any time within the two-year period immediately prior to the date in question, was the beneficial owner of 10% or more of the voting power of the then outstanding stock of the corporation after the date on which the corporation had 100 or more beneficial owners of its stock) or an affiliate of an interested stockholder, are prohibited for five years after the most recent date on which the interested stockholder becomes an interested stockholder. Thereafter, any such business combination between the Maryland corporation and an interested stockholder generally must be recommended by the board of directors of such corporation and approved by the affirmative vote of at least (1) 80% of the votes entitled to be cast by holders of outstanding shares of voting stock of the corporation and (2) two-thirds of the votes entitled to be cast by holders of voting stock of the corporation other than shares held by the interested stockholder with whom (or with whose affiliate) the business combination is to be effected or held by an affiliate or associate of the interested stockholder, unless, among other conditions, the corporation’s common stockholders receive a minimum price (as defined in the MGCL) for their shares and the consideration is received in cash or in the same form as previously paid by the interested stockholder for its shares. A person is not an interested stockholder under the statute if the board of directors approved in advance the transaction by which the person otherwise would have become an interested stockholder. The board of directors may provide that its approval is subject to compliance, at or after the time of approval, with any terms and conditions determined by it.
As permitted by the MGCL, our board of directors has adopted a resolution exempting any business combination between us and any other person from the provisions of this statute, provided that the business combination is first approved by our board of directors (including a majority of directors who are not affiliates or associates of such persons). However, our board of directors may repeal or modify this resolution at any time in the future, in which case the applicable provisions of this statute will become applicable to business combinations between us and interested stockholders.
131
Control Share Acquisitions
The MGCL provides that “control shares” of a Maryland corporation acquired in a “control share acquisition” have no voting rights except to the extent approved by the affirmative vote of at least two-thirds of the votes entitled to be cast by stockholders entitled to vote generally in the election of directors, excluding votes cast by (1) the person who makes or proposes to make a control share acquisition, (2) an officer of the corporation or (3) an employee of the corporation who is also a director of the corporation. “Control shares” are voting shares of stock which, if aggregated with all other such shares of stock previously acquired by the acquirer or in respect of which the acquirer is able to exercise or direct the exercise of voting power (except solely by virtue of a revocable proxy), would entitle the acquirer to exercise voting power in electing directors within one of the following ranges of voting power: (1) one-tenth or more but less than one-third, (2) one-third or more but less than a majority or (3) a majority or more of all voting power. Control shares do not include shares the acquiring person is then entitled to vote as a result of having previously obtained stockholder approval. A “control share acquisition” means the acquisition of issued and outstanding control shares, subject to certain exceptions.
A person who has made or proposes to make a control share acquisition, upon satisfaction of certain conditions (including an undertaking to pay expenses), may compel the board of directors to call a special meeting of stockholders to be held within 50 days of demand to consider the voting rights of the shares. If no request for a meeting is made, the corporation may itself present the question at any stockholders meeting.
If voting rights are not approved at the meeting or if the acquiring person does not deliver an acquiring person statement as required by the statute, then, subject to certain conditions and limitations, the corporation may redeem any or all of the control shares (except those for which voting rights have previously been approved) for fair value determined, without regard to the absence of voting rights for the control shares, as of the date of the last control share acquisition by the acquirer or of any meeting of stockholders at which the voting rights of such shares are considered and not approved. If voting rights for control shares are approved at a stockholders meeting and the acquirer becomes entitled to vote a majority of the shares entitled to vote, all other stockholders may exercise appraisal rights. The fair value of the shares as determined for purposes of such appraisal rights may not be less than the highest price per share paid by the acquirer in the control share acquisition.
The control share acquisition statute does not apply to, among other things, (1) shares acquired in a merger, consolidation or share exchange if the corporation is a party to the transaction or (2) acquisitions approved or exempted by the charter or bylaws of the corporation.
Our bylaws contain a provision exempting from the control share acquisition statute any acquisition by any person of shares of our stock. There can be no assurance that such provision will not be amended or eliminated at any time in the future by our board of directors.
Subtitle 8
Subtitle 8 of Title 3 of the MGCL permits a Maryland corporation with a class of equity securities registered under the Exchange Act and at least three independent directors to elect to be subject, by provision in its charter or bylaws or a resolution of its board of directors and notwithstanding any contrary provision in the charter or bylaws, to any or all of five provisions of the MGCL which provide, respectively, that:
| § | the corporation’s board of directors will be divided into three classes; | |
| § | the affirmative vote of two-thirds of the votes cast in the election of directors generally is required to remove a director; | |
| § | the number of directors may be fixed only by vote of the directors; | |
| § | a vacancy on the board be filled only by the remaining directors and that directors elected to fill a vacancy will serve for the remainder of the full term of the class of directors in which the vacancy occurred; and | |
| § | the request of stockholders entitled to cast at least a majority of all the votes entitled to be cast at the meeting is required for stockholders to require the calling of a special meeting of stockholders. |
Without our having elected to be subject to Subtitle 8, our charter and bylaws already (1) require the affirmative vote of holders of shares entitled to cast at least two-thirds of all the votes entitled to be cast generally in the election of
132
directors to remove a director from our board of directors, (2) vest in our board of directors the exclusive power to fix the number of directors, by vote of a majority of the entire board and (3) require, unless called by our chairman, our president and chief executive officer or our board of directors, the request of stockholders entitled to cast not less than a majority of all the votes entitled to be cast at the meeting to call a special meeting. Our charter provides that, at such time as we become eligible to make the election provided for under Subtitle 8 (which we expect will be upon completion of this offering), vacancies on our board of directors may be filled only by the affirmative vote of a majority of the remaining directors then in office, and directors elected to fill a vacancy will serve for the full term of the directorship in which the vacancy occurred. Our board of directors is not currently classified. In the future, our board of directors may elect, without stockholder approval, to classify our board of directors or elect to be subject to any of the other provisions of Subtitle 8.
Meetings of Stockholders
Pursuant to our bylaws, an annual meeting of our stockholders for the purpose of the election of directors and the transaction of any business will be held on a date and at the time and place set by our board of directors. Each of our directors is elected by our stockholders to serve until the next annual meeting and until his or her successor is duly elected and qualifies under Maryland law. In addition, our chairman, our president and chief executive officer or our board of directors may call a special meeting of our stockholders. Subject to the provisions of our bylaws, a special meeting of our stockholders to act on any matter that may properly be considered by our stockholders will also be called by our secretary upon the written request of stockholders entitled to cast a majority of all the votes entitled to be cast at the meeting on such matter, accompanied by the information required by our bylaws. Our secretary will inform the requesting stockholders of the reasonably estimated cost of preparing and mailing the notice of meeting (including our proxy materials), and the requesting stockholder must pay such estimated cost before our secretary may prepare and mail the notice of the special meeting.
Amendments to Our Charter and Bylaws
Except for certain amendments related to the removal of directors and the restrictions on ownership and transfer of our stock (which must be declared advisable by our board of directors and approved by the affirmative vote of stockholders entitled to cast not less than two-thirds of all the votes entitled to be cast on the matter), our charter generally may be amended only if the amendment is declared advisable by our board of directors and approved by the affirmative vote of stockholders entitled to cast a majority of all of the votes entitled to be cast on the matter. Our board of directors, with the approval of a majority of the entire board, and without any action by our stockholders, may also amend our charter to increase or decrease the aggregate number of shares of stock or the number of shares of stock of any class or series we are authorized to issue.
Our board of directors has the exclusive power to adopt, alter or repeal any provision of our bylaws and to make new bylaws.
Extraordinary Transactions
Under the MGCL, a Maryland corporation generally cannot dissolve, merge, sell all or substantially all of its assets, engage in a share exchange or engage in similar transactions outside the ordinary course of business unless approved by the affirmative vote of stockholders entitled to cast at least two-thirds of the votes entitled to be cast on the matter unless a lesser percentage (but not less than a majority of all of the votes entitled to be cast on the matter) is set forth in the corporation’s charter. As permitted by the MGCL, our charter provides that any of these actions may be approved by the affirmative vote of stockholders entitled to cast a majority of all of the votes entitled to be cast on the matter. Many of our operating assets will be held by our subsidiaries, and these subsidiaries may be able to merger or sell all or substantially all of their assets without the approval of our stockholders.
Appraisal Rights
Our charter provides that our stockholders generally will not be entitled to exercise statutory appraisal rights.
133
Dissolution
Our dissolution must be declared advisable by a majority of our entire board of directors and approved by the affirmative vote of stockholders entitled to cast a majority of all of the votes entitled to be cast on the matter.
Advance Notice of Director Nominations and New Business
Our bylaws provide that, with respect to an annual meeting of stockholders, nominations of individuals for election to our board of directors and the proposal of other business to be considered by our stockholders at an annual meeting of stockholders may be made only (1) pursuant to our notice of the meeting, (2) by or at the direction of our board of directors or (3) by a stockholder who was a stockholder of record both at the time of giving of notice and at the time of the meeting, who is entitled to vote at the meeting on the election of the individual so nominated or such other business and who has complied with the advance notice procedures set forth in our bylaws, including a requirement to provide certain information about the stockholder and its affiliates and the nominee or business proposal, as applicable.
With respect to special meetings of stockholders, only the business specified in our notice of meeting may be brought before the meeting. Nominations of individuals for election to our board of directors may be made at a special meeting of stockholders at which directors are to be elected only (1) by or at the direction of our board of directors or (2) provided that the special meeting has been properly called in accordance with our bylaws for the purpose of electing directors, by a stockholder who is a stockholder of record both at the time of giving of notice and at the time of the meeting, who is entitled to vote at the meeting on the election of each individual so nominated and who has complied with the advance notice provisions set forth in our bylaws, including a requirement to provide certain information about the stockholder and its affiliates and the nominee.
Anti-Takeover Effect of Certain Provisions of Maryland Law and Our Charter and Bylaws
Our charter and bylaws and Maryland law contain provisions that may delay, defer or prevent a change in control or other transaction that might involve a premium price for our common stock or otherwise be in the best interests of our stockholders, including:
| § | supermajority vote and cause requirements for removal of directors; | |
| § | requirement that stockholders holding at least a majority of our outstanding common stock must act together to make a written request before our stockholders can require us to call a special meeting of stockholders; | |
| § | provisions that vacancies on our board of directors may be filled only by the remaining directors for the full term of the directorship in which the vacancy occurred; | |
| § | the power of our board to increase or decrease the aggregate number of authorized shares of stock or the number of shares of any class or series of stock; | |
| § | the power of our board of directors to cause us to issue additional shares of stock of any class or series and to fix the terms of one or more classes or series of stock without stockholder approval; | |
| § | the restrictions on ownership and transfer of our stock; and | |
| § | advance notice requirements for director nominations and stockholder proposals. |
Likewise, if the resolution opting out of the business combination provisions of the MGCL was repealed or the provision in the bylaws opting out of the control share acquisition provisions of the MGCL were rescinded, these provisions of the MGCL could have similar anti-takeover effects.
Limitation of Directors’ and Officers’ Liability and Indemnification
The MGCL permits a Maryland corporation to include in its charter a provision limiting the liability of its directors and officers to the corporation and its stockholders for money damages, except for liability resulting from (1) actual receipt of an improper benefit or profit in money, property or services or (2) active and deliberate dishonesty that is established by a final judgment and is material to the cause of action. Our charter contains a provision that eliminates such liability to the maximum extent permitted by Maryland law.
134
Our charter and bylaws provide for indemnification of our officers and directors against liabilities to the maximum extent permitted by the MGCL, as amended from time to time.
The MGCL requires a corporation (unless its charter provides otherwise, which our charter does not) to indemnify a director or officer who has been successful, on the merits or otherwise, in the defense of any proceeding to which he or she is made, or threatened to be made, a party by reason of his or her service in that capacity. The MGCL permits a corporation to indemnify its present and former directors and officers, among others, against judgments, penalties, fines, settlements and reasonable expenses actually incurred by them in connection with any proceeding to which they may be made, or threatened to be made, a party by reason of their service in those or other capacities unless it is established that:
| § | the act or omission of the director or officer was material to the matter giving rise to the proceeding and (1) was committed in bad faith or (2) was the result of active and deliberate dishonesty; | |
| § | the director or officer actually received an improper personal benefit in money, property or services; or | |
| § | in the case of any criminal proceeding, the director or officer had reasonable cause to believe that the act or omission was unlawful. |
However, under the MGCL, a Maryland corporation may not indemnify for an adverse judgment in a suit by or in the right of the corporation or for a judgment of liability on the basis that personal benefit was improperly received, unless in either case a court orders indemnification if it determines that the director or officer is fairly and reasonably entitled to indemnification, and then only for expenses. In addition, the MGCL permits a Maryland corporation to advance reasonable expenses to a director or officer upon its receipt of:
| § | a written affirmation by the director or officer of his or her good faith belief that he or she has met the standard of conduct necessary for indemnification by the corporation; and | |
| § | a written undertaking by the director or officer or on the director’s or officer’s behalf to repay the amount paid or reimbursed by the corporation if it is ultimately determined that the director or officer did not meet the standard of conduct. |
Our charter authorizes us, and our bylaws obligate us, to the maximum extent permitted by Maryland law in effect from time to time, to indemnify and, without requiring a preliminary determination of the ultimate entitlement to indemnification, pay or reimburse reasonable expenses in advance of final disposition of such a proceeding to:
| § | any present or former director or officer of our company who is made, or threatened to be made, a party to the proceeding by reason of his or her service in that capacity; or |
| § | any individual who, while a director or officer of our company and at our request, serves or has served as a director, officer, partner, trustee, member or manager of another corporation, real estate investment trust, limited liability company, partnership, joint venture, trust, employee benefit plan or other enterprise and who is made, or threatened to be made, a party to the proceeding by reason of his or her service in that capacity. |
Our charter and bylaws also permit us to indemnify and advance expenses to any individual who served our predecessor in any of the capacities described above and to any employee or agent of our company or our predecessor.
Upon completion of this offering, we intend to enter into indemnification agreements with each of our directors and executive officers that would provide for indemnification to the maximum extent permitted by Maryland law.
Insofar as the foregoing provisions permit indemnification of directors, officers or persons controlling us for liability arising under the Securities Act, we have been informed that in the opinion of the SEC, this indemnification is against public policy as expressed in the Securities Act and is therefore unenforceable.
REIT Qualification
Our charter provides that our board of directors may revoke or otherwise terminate our REIT election, without approval of our stockholders, if it determines that it is no longer in our best interests to attempt to qualify, or to continue to qualify, as a REIT.
135
Description of the Partnership Agreement
The following summarizes the material terms of the agreement of limited partnership of our operating partnership, a copy of which is an exhibit to the registration statement of which this prospectus is a part. See “Where You Can Find More Information.”
Management
We, through a wholly owned subsidiary, are the sole general partner of our operating partnership, a Delaware limited partnership. We will conduct substantially all of our operations and make substantially all of our investments through our operating partnership. Pursuant to the partnership agreement, the general partner will have full, exclusive and complete responsibility and discretion in the management and control of our operating partnership, including the ability to cause our operating partnership to enter into certain major transactions including acquisitions, dispositions, refinancings and selection of lessees, make distributions to partners and to cause changes in our operating partnership’s business activities.
Transferability of Interests
We may not engage in any merger, consolidation or other combination, or sale of all or substantially all of our assets in a transaction that results in a change in control of our company unless:
| § | we receive the consent of limited partners holding more than 50% of the partnership interests of the limited partners (other than those held by our company or our subsidiaries); | |
| § | as a result of such transaction, all limited partners (other than our company or our subsidiaries) will receive, or have the right to receive, for each partnership unit an amount of cash, securities or other property equal or substantially equivalent in value to the product of the conversion factor and the greatest amount of cash, securities or other property paid in the transaction to a holder of one of our shares of common stock, provided that if, in connection with the transaction, a purchase, tender or exchange offer shall have been made to and accepted by the holders of more than 50% of the outstanding common stock, each holder of partnership units (other than those held by our company or our subsidiaries) shall be given the option to exchange its partnership units for the greatest amount of cash, securities or other property that a limited partner would have received had it (A) exercised its redemption right (described below) and (B) sold, tendered or exchanged pursuant to the offer common stock received upon exercise of the redemption right immediately prior to the expiration of the offer; or | |
| § | we are the surviving entity in the transaction and either (A) our stockholders do not receive cash, securities or other property in the transaction or (B) all limited partners (other than our company or our subsidiaries) receive for each partnership unit an amount of cash, securities or other property equal or substantially equivalent in value to less than the greatest amount of cash, securities or other property received in the transaction by our stockholders. |
We also may merge with or into or consolidate with another entity if immediately after such merger or consolidation (i) substantially all of the assets of the successor or surviving entity, other than partnership units held by us, are contributed, directly or indirectly, to the partnership as a capital contribution in exchange for partnership units with a fair market value equal to the value of the assets so contributed as determined by the survivor in good faith and (ii) the survivor expressly agrees to assume all of our obligations under the partnership agreement, including those of the general partner, and the partnership agreement shall be amended after any such merger or consolidation so as to arrive at a new method of calculating the amounts payable upon exercise of the redemption right that approximates the existing method for such calculation as closely as reasonably possible.
We also may cause the general partner to (i) transfer all or any portion of its general partnership interest to (A) a wholly owned subsidiary or (B) a parent company, and following such transfer may withdraw as the general partner, and (ii) engage in a transaction required by law or by the rules of any national securities exchange or OTC interdealer quotation system on which our common stock is listed.
We, through a wholly owned subsidiary serving as the general partner, without the consent of the limited partners, may (i) merge or consolidate our operating partnership with or into any other domestic or foreign partnership, limited partnership, limited liability company or corporation or (ii) sell all or substantially all of the assets of our operating partnership in a transaction pursuant to which the limited partners (other than us or any of our subsidiaries) receive consideration as set forth above.
136
Capital Contributions
We will contribute, directly, to our operating partnership substantially all of the net proceeds of this offering and the concurrent private placement as a capital contribution in exchange for additional OP units. Upon completion of the formation transactions, this offering and the concurrent private placement and the contribution of the net proceeds of this offering and the concurrent private placement to our operating partnership, we will own an approximate % ( % if the underwriters exercise their over-allotment option in full) partnership interest in our operating partnership, including general and limited partnership interests directly. The partnership agreement provides that if our operating partnership requires additional funds at any time in excess of funds available to our operating partnership from borrowing or capital contributions, we may borrow such funds from a financial institution or other lender and lend such funds to our operating partnership on the same terms and conditions as are applicable to our borrowing of such funds. Under the partnership agreement, we are obligated to contribute the net proceeds of any future offering of shares as additional capital to our operating partnership. If we contribute additional capital to our operating partnership, we will receive additional partnership units and our percentage interest will be increased on a proportionate basis based upon the amount of such additional capital contributions and the value of our operating partnership at the time of such contributions. Conversely, the percentage interests of the limited partners will be decreased on a proportionate basis in the event of additional capital contributions by us. In addition, if we contribute additional capital to our operating partnership, the general partner will revalue the property of our operating partnership to its fair market value (as determined by the general partner) and the capital accounts of the partners will be adjusted to reflect the manner in which the unrealized gain or loss inherent in such property (that has not been reflected in the capital accounts previously) would be allocated among the partners under the terms of the partnership agreement if there were a taxable disposition of such property for its fair market value (as determined by the general partner) on the date of the revaluation. Our operating partnership may issue preferred partnership interests, in connection with acquisitions of property or otherwise, which could have priority over common partnership interests with respect to distributions from our operating partnership, including the partnership interests we own as the general partner.
Redemption Rights
Pursuant to the partnership agreement, limited partners, other than us, will receive redemption rights, which will enable them to cause our operating partnership to redeem their limited partnership interests in exchange for cash or, at our operating partnership’s option, shares of common stock on a one-for-one basis. Redemptions will generally occur only on the first day of each calendar quarter. Limited partners must submit an irrevocable notice to our operating partnership of the intention to be redeemed no less than 60 days prior to the redemption date, and each limited partner must submit for redemption at least 1,000 OP units or, if such limited partner holds less than 1,000 OP units, all the OP units owned by such limited partner. The number of shares of common stock issuable upon redemption of limited partnership interests held by limited partners may be adjusted upon the occurrence of certain events such as share dividends, share subdivisions or combinations. We expect to fund any cash redemptions out of available cash or borrowings. Notwithstanding the foregoing, a limited partner will not be entitled to exercise its redemption rights if the delivery of common stock to the redeeming limited partner would:
| § | result in any person owning, directly or indirectly, shares of common stock in excess of the share ownership limit in our charter; | |
| § | result in our being owned by fewer than 100 persons (determined without reference to any rules of attribution); | |
| § | result in our being “closely held” within the meaning of Section 856(h) of the Code; | |
| § | cause us to own, actually or constructively, 10% or more of the ownership interests in a tenant (other than a TRS) of ours, our operating partnership’s or a subsidiary partnership’s real property, within the meaning of Section 856(d)(2)(B) of the Code; | |
| § | cause us to fail to qualify as a REIT under the Code, including, but not limited to, as a result of any hotel management company failing to qualify as an eligible independent contractor under the Code; or | |
| § | cause the acquisition of common stock by such redeeming limited partner to be “integrated” with any other distribution of common stock for purposes of complying with the registration provisions of the Securities Act. |
The general partner may, in its sole and absolute discretion, waive any of these restrictions.
137
The partnership agreement will require that our operating partnership be operated in a manner that enables us to satisfy the requirements for being classified as a REIT, to avoid any federal income or excise tax liability imposed by the Code (other than any federal income tax liability associated with our retained capital gains) and to ensure that the partnership will not be classified as a “publicly traded partnership” taxable as a corporation under Section 7704 of the Code.
Partnership Expenses
In addition to the administrative and operating costs and expenses incurred by our operating partnership, our operating partnership generally will pay all of our administrative costs and expenses, including:
| § | all expenses relating to our continuity of existence and our subsidiaries’ operations; | |
| § | all expenses relating to offerings and registration of securities; | |
| § | all expenses associated with any repurchase by us of any securities; | |
| § | all expenses associated with the preparation and filing of any of our periodic or other reports and communications under federal, state or local laws or regulations; | |
| § | all expenses associated with our compliance with laws, rules and regulations promulgated by any regulatory body; | |
| § | all administrative costs and expenses, including salaries and other payments to directors, officers or employees; | |
| § | all expenses associated with any 401(k) plan, incentive plan, bonus plan or other plan providing compensation to our employees; | |
| § | all expenses incurred by us relating to any issuance or redemption of partnership interests; and | |
| § | all of our other operating or administrative costs incurred in the ordinary course of business on behalf of our operating partnership. |
These expenses, however, do not include any of our administrative and operating costs and expenses incurred that are attributable to hotel properties that, in the future, may be owned by us directly rather than by our operating partnership or its subsidiaries.
Fiduciary Responsibilities
Our directors and officers have duties under applicable Maryland law to manage us in a manner consistent with the best interests of our stockholders. At the same time, we, through our wholly owned subsidiary that serves as the general partner of our operating partnership, have fiduciary duties to manage our operating partnership in a manner beneficial to our operating partnership and its partners. Our duties, as general partner to our operating partnership and its limited partners, therefore, may come into conflict with the duties of our directors and officers to our stockholders. The partnership agreement provides that in the event of a conflict between the interests of our stockholders on the one hand and the limited partners of the operating partnership on the other hand, as general partner we will endeavor in good faith to resolve the conflict in a manner not adverse to either our stockholders or the limited partners; provided, however, that so long as we own a controlling interest in the operating partnership, any such conflict that we, in our sole and absolute discretion, determine cannot be resolved in a manner not adverse to either our stockholders or the limited partners shall be resolved in favor of our stockholders and we shall not be liable for monetary damages for losses sustained, liabilities incurred or benefits not derived by the limited partners in connection with such decisions.
Distributions
The partnership agreement will provide that our operating partnership will distribute cash from operations (including net sale or refinancing proceeds, but excluding net proceeds from the sale of our operating partnership’s property in connection with the liquidation of our operating partnership) at such time and in such amounts as determined by the general partner in its sole discretion, to us and the other limited partners in accordance with their respective percentage interests in our operating partnership.
138
Upon liquidation of our operating partnership, after payment of, or adequate provision for, debts and obligations of the partnership, including any partner loans, any remaining assets of the partnership will be distributed to us and the other limited partners with positive capital accounts in accordance with their respective positive capital account balances.
LTIP Units
LTIP units are a class of partnership units in our operating partnership and, if issued, will receive the same quarterly per-unit profit distributions as the other outstanding units in our operating partnership. We have no current plan to issue any LTIP units. LTIP units, if issued, will not have full parity with other outstanding units with respect to liquidating distributions. Generally, under the terms of the LTIP units, if issued, our operating partnership will revalue its assets upon the occurrence of certain specified events, and any increase in valuation from the last revaluation of our operating partnership assets until such event will be allocated first to the LTIP unit holders to equalize the capital accounts of such holders with the capital accounts of holders of our other outstanding partnership units. Upon equalization of the capital accounts of the LTIP unit holders with the capital accounts of the other holders of our OP units, the LTIP units will achieve full parity with our other OP units for all purposes, including with respect to liquidating distributions. If such parity is reached, vested LTIP units may be converted into an equal number of OP units at any time, and thereafter enjoy all the rights of such units, including redemption rights. However, there are circumstances under which such parity would not be reached. Until and unless such parity is reached, the value for a given number of vested LTIP units will be less than the value of an equal number of shares of our common stock.
Allocations
Profits and losses of the partnership (including depreciation and amortization deductions) for each fiscal year generally will be allocated to us and the other limited partners in accordance with the respective percentage interests in the partnership. All of the foregoing allocations are subject to compliance with the provisions of Sections 704(b) and 704(c) of the Code and Treasury regulations promulgated thereunder. To the extent Treasury regulations promulgated pursuant to Section 704(c) of the Code permit, the general partner shall have the authority to elect the method to be used by our operating partnership for allocating items with respect to (i) the difference between our proportionate share of our predecessor’s adjusted tax basis in excess of our portfolio and the proceeds of the offering that we will contribute to our operating partnership in exchange for partnership interests and (ii) contributed property acquired for limited partnership interests for which fair market value differs from the adjusted tax basis at the time of contribution. Any such election shall be binding on all partners. Upon the occurrence of certain specified events, our operating partnership will revalue its assets and any net increase in valuation will be allocated first to the LTIP units to equalize the capital accounts of such holders with the capital accounts of the holders of the other outstanding units in our operating partnership.
Registration Rights
We have granted those persons with a direct or indirect interest in the property entities who will receive OP units in the formation transactions certain registration rights with respect to the shares of our common stock that may be issued to them in connection with the exercise of the redemption rights under the partnership agreement.
Immediately following the date on which we become eligible to use a registration statement on Form S-3 for the registration of securities and subject to certain further conditions as set forth in our operating partnership’s partnership agreement, we will be obligated to file a shelf registration statement covering the issuance or resale of common stock received by limited partners upon redemption of their limited partnership interests. In furtherance of such registration rights, we have also agreed as follows:
| § | to use our reasonable best efforts to have the registration statement declared effective; | |
| § | to furnish to limited partners redeeming their limited partnership interests for our shares of common stock prospectuses, supplements, amendments, and such other documents reasonably requested by them; | |
| § | to register or qualify such shares under the securities or blue sky laws of such jurisdictions within the United States as the limited partners reasonably request; |
139
| § | to list shares of our common stock issued pursuant to the exercise of redemption rights on any securities exchange or national market system upon which our shares of common stock are then listed; and | |
| § | to indemnify limited partners exercising redemption rights against all losses caused by any untrue statement of a material fact contained in the registration statement, preliminary prospectus or prospectus or caused by any omission to state a material fact required to be stated or necessary to make the statements therein not misleading, except insofar as such losses are caused by any untrue statement or omission based upon information furnished to us by such limited partners. |
Notwithstanding the foregoing, we are not required to file more than two registration statements in any 12-month period and, as a condition to our obligations with respect to the registration rights of limited partners, each limited partner will agree:
| § | that no limited partner will offer or sell shares of our common stock that are issued upon redemption of their limited partnership interests until such shares have been included in an effective registration statement; | |
| § | that, if we determine in good faith that registration of shares for resale would require the disclosure of important information that we have a business purpose for preserving as confidential, the registration rights of each limited partner will be suspended until we notify such limited partners that suspension of their registration rights is no longer necessary (so long as we that do not suspend their rights for more than 180 days in any 12-month period); | |
| § | that if we propose an underwritten public offering, each limited partner will agree not to effect any offer, sale or distribution of our shares during the period commencing on the tenth day prior to the expected effective date of a registration statement filed with respect to the public offering or commencement date of a proposed offering and ending on the date specified by the managing underwriter for such offering; and | |
| § | to indemnify us and each of our officers, directors and controlling persons against all losses caused by any untrue statement or omission contained in (or omitted from) any registration statement based upon information furnished to us by such limited partner. |
Subject to certain exceptions, our operating partnership will pay all expenses in connection with the exercise of registration rights under our operating partnership’s partnership agreement.
We have also granted to the IHG affiliate purchasing shares of our common stock in the concurrent private placement certain registration rights with respect to those shares on terms that are substantially similar to those described above.
Amendments of the Partnership Agreement
The general partner, without the consent of the limited partners, may amend the partnership agreement in any respect; provided that the following amendments require the consent of limited partners holding more than 50% of the partnership interests of the limited partners (other than those held by us or our subsidiaries):
| § | any amendment affecting the operation of the conversion factor (for holders of LTIP units) or the redemption right (except as otherwise provided in the partnership agreement) in a manner that adversely affects the limited partners in any material respect; | |
| § | any amendment that would adversely affect the rights of the limited partners to receive the distributions payable to them under the partnership agreement, other than with respect to the issuance of additional partnership units pursuant to the partnership agreement; | |
| § | any amendment that would alter our operating partnership’s allocations of profit and loss to the limited partners, other than with respect to the issuance of additional OP units pursuant to the partnership agreement; or | |
| § | any amendment that would impose on the limited partners any obligation to make additional capital contributions to our operating partnership. |
140
Indemnification and Limitation of Liability
The limited partners of our operating partnership expressly acknowledge that the general partner of our operating partnership is acting for the benefit of our operating partnership, the limited partners (including us) and our stockholders collectively and that we are under no obligation to consider the separate interests of the limited partners (including, without limitation, the tax consequences to some or all of the limited partners) in deciding whether to cause our operating partnership to take, or decline to take, any actions. The partnership agreement provides that in the event of a conflict between the interests of our stockholders on the one hand, and the limited partners of our operating partnership on the other hand, the general partner will endeavor in good faith to resolve the conflict in a manner not adverse to either our stockholders or the limited partners, provided however, that so long as we own a controlling interest in our operating partnership, any such conflict that the general partner, in its sole and absolute discretion, determines cannot be resolved in a manner not adverse to either our stockholders or the limited partners will be resolved in favor of our stockholders, and neither the general partner nor our company will be liable for monetary damages for losses sustained, liabilities incurred or benefits not derived by the limited partners in connection with such decisions.
To the extent permitted by applicable law, the partnership agreement will provide for the indemnification of the general partner, and our officers, directors, employees, agents and any other persons we may designate from and against any and all claims arising from operations of our operating partnership in which any indemnitee may be involved, or is threatened to be involved, as a party or otherwise, unless it is established by a court of competent jurisdiction that:
| § | the act or omission of the indemnitee was material to the matter giving rise to the proceeding and either was committed in bad faith or was the result of active and deliberate dishonesty; | |
| § | the indemnitee actually received an improper personal benefit in money, property or services; or | |
| § | in the case of any criminal proceeding, the indemnitee had reasonable cause to believe that the act or omission was unlawful. |
Similarly, the general partner of our operating partnership, and our officers, directors, agents or employees, will not be liable for monetary damages to our operating partnership or the limited partners for losses sustained or liabilities incurred as a result of errors in judgment or mistakes of fact or law or of any act or omission so long as any such party acted in good faith.
Insofar as indemnification for liabilities arising under the Securities Act may be permitted to directors, officers or persons controlling our company pursuant to the foregoing provisions, we have been informed that in the opinion of the SEC such indemnification is against public policy as expressed in the Securities Act and is therefore unenforceable.
Term
Our operating partnership will continue indefinitely or until sooner dissolved upon:
| § | the bankruptcy, dissolution, removal or withdrawal of the general partner (unless the limited partners elect to continue the partnership); | |
| § | the passage of 90 days after the sale or other disposition of all or substantially all of the assets of the partnership; | |
| § | the redemption of all partnership units (other than those held by us, if any) unless we decide to continue the partnership by the admission of one or more general partners; or | |
| § | an election by us in our capacity as the general partner. |
Tax Matters
Our partnership agreement will provide that the sole general partner of our operating partnership will be the tax matters partner of our operating partnership and, as such, will have authority to handle tax audits and to make tax elections under the Code on behalf of our operating partnership.
141
Material Federal Income Tax Considerations
This section summarizes the material federal income tax considerations that you, as a stockholder, may consider relevant in connection with the purchase, ownership and disposition of our common shares. Hunton & Williams LLP has acted as our counsel, has reviewed this summary, and is of the opinion that the discussion contained herein is accurate in all material respects. Because this section is a summary, it does not address all aspects of taxation that may be relevant to particular stockholders in light of their personal investment or tax circumstances, or to certain types of stockholders that are subject to special treatment under the federal income tax laws, such as:
| § | insurance companies; | |
| § | tax-exempt organizations (except to the limited extent discussed in “—Taxation of Tax-Exempt Stockholders” below); | |
| § | financial institutions or broker-dealers; | |
| § | non-U.S. individuals, partnerships and foreign corporations (except to the limited extent discussed in “—Taxation of Non-U.S. Stockholders” below); | |
| § | U.S. expatriates; | |
| § | persons who mark-to-market our common stock; | |
| § | subchapter S corporations; | |
| § | U.S. stockholders (as defined below) whose functional currency is not the U.S. dollar; | |
| § | regulated investment companies and REITs; | |
| § | trusts and estates; | |
| § | holders who receive our common stock through the exercise of employee share options or otherwise as compensation; | |
| § | persons holding our common stock as part of a “straddle,” “hedge,” “conversion transaction,” “synthetic security” or other integrated investment; | |
| § | persons subject to the alternative minimum tax provisions of the Code; and | |
| § | persons holding our common stock through a partnership or similar pass-through entity. |
This summary assumes that stockholders hold stock as capital assets for federal income tax purposes, which generally means property held for investment.
The statements in this section are not intended to be, and should not be construed as, tax advice. The statements in this section are based on the Code, current, temporary and proposed Treasury regulations, the legislative history of the Code, current administrative interpretations and practices of the IRS, and court decisions. The reference to IRS interpretations and practices includes the IRS practices and policies endorsed in private letter rulings, which are not binding on the IRS except with respect to the taxpayer that receives the ruling. In each case, these sources are relied upon as they exist on the date of this discussion. Future legislation, Treasury regulations, administrative interpretations and court decisions could change current law or adversely affect existing interpretations of current law on which the information in this section is based. Any such change could apply retroactively. We have not received any rulings from the IRS concerning our qualification as a REIT. Accordingly, even if there is no change in the applicable law, no assurance can be provided that the statements made in the following discussion, which do not bind the IRS or the courts, will not be challenged by the IRS or will be sustained by a court if so challenged.
WE URGE YOU TO CONSULT YOUR OWN TAX ADVISOR REGARDING THE SPECIFIC TAX CONSEQUENCES TO YOU OF THE PURCHASE, OWNERSHIP AND SALE OF OUR COMMON STOCK AND OF OUR ELECTION TO BE TAXED AS A REIT. SPECIFICALLY, YOU ARE URGED TO CONSULT YOUR OWN TAX ADVISOR REGARDING THE FEDERAL, STATE, LOCAL, FOREIGN AND OTHER TAX CONSEQUENCES OF SUCH PURCHASE, OWNERSHIP, SALE AND ELECTION, AND REGARDING POTENTIAL CHANGES IN APPLICABLE TAX LAWS.
142
Taxation of Our Company
We have in effect an election to be taxed as a pass-through entity under subchapter S of the Code, but intend to revoke our S election prior to the closing of this offering. We intend to elect to be taxed as a REIT for federal income tax purposes commencing with our short taxable year ending December 31, 2010. We believe that, commencing with such short taxable year, we will be organized and will operate in such a manner as to qualify for taxation as a REIT under the federal income tax laws, and we intend to continue to operate in such a manner, but no assurances can be given that we will operate in a manner so as to qualify or remain qualified as a REIT. This section discusses the laws governing the federal income tax treatment of a REIT and its stockholders. These laws are highly technical and complex.
In connection with this offering, Hunton & Williams LLP is rendering an opinion that, commencing with our short taxable year ending on December 31, 2010, we will be organized in conformity with the requirements for qualification and taxation as a REIT under the federal income tax laws, and our proposed method of operations will enable us to satisfy the requirements for qualification and taxation as a REIT under the federal income tax laws for our short taxable year ending December 31, 2010 and subsequent taxable years. Investors should be aware that Hunton & Williams LLP’s opinion is based upon customary assumptions, will be conditioned upon certain representations made by us as to factual matters, including representations regarding the nature of our assets and the conduct of our business, is not binding upon the IRS, or any court, and speaks as of the date issued. In addition, Hunton & Williams LLP’s opinion will be based on existing federal income tax law governing qualification as a REIT, which is subject to change either prospectively or retroactively. Moreover, our qualification and taxation as a REIT depend upon our ability to meet on a continuing basis, through actual annual operating results, certain qualification tests set forth in the federal tax laws. Those qualification tests involve the percentage of income that we earn from specified sources, the percentage of our assets that falls within specified categories, the diversity of our stock ownership, and the percentage of our earnings that we distribute. Hunton & Williams LLP will not review our compliance with those tests on a continuing basis. Accordingly, no assurance can be given that our actual results of operations for any particular taxable year will satisfy such requirements. Hunton & Williams LLP’s opinion does not foreclose the possibility that we may have to use one or more of the REIT savings provisions described below, which would require us to pay an excise or penalty tax (which could be material) in order for us to maintain our REIT qualification. For a discussion of the tax consequences of our failure to qualify as a REIT, see “—Failure to Qualify.”
If we qualify as a REIT, we generally will not be subject to federal income tax on the taxable income that we distribute to our stockholders. The benefit of that tax treatment is that it avoids the “double taxation,” or taxation at both the corporate and stockholder levels, that generally results from owning stock in a corporation. However, we will be subject to federal tax in the following circumstances:
| § | We will pay federal income tax on any taxable income, including undistributed net capital gain, that we do not distribute to stockholders during, or within a specified time period after, the calendar year in which the income is earned. | |
| § | We may be subject to the “alternative minimum tax” on any items of tax preference including any deductions of net operating losses. | |
| § | We will pay income tax at the highest corporate rate on: |
| – | net income from the sale or other disposition of property acquired through foreclosure or after a default on a lease of the property (“foreclosure property”) that we hold primarily for sale to customers in the ordinary course of business, and | |
| – | other non-qualifying income from foreclosure property. |
| § | We will pay a 100% tax on net income from sales or other dispositions of property, other than foreclosure property, that we hold primarily for sale to customers in the ordinary course of business. | |
| § | If we fail to satisfy one or both of the 75% gross income test or the 95% gross income test, as described below under “—Gross Income Tests,” and nonetheless continue to qualify as a REIT because we meet other requirements, we will pay a 100% tax on the gross income attributable to the greater of the amount by which we fail the 75% gross income test or the 95% gross income test, in either case, multiplied by a fraction intended to reflect our profitability. |
143
| § | If we fail to distribute during a calendar year at least the sum of (1) 85% of our REIT ordinary income for the year, (2) 95% of our REIT capital gain net income for the year, and (3) any undistributed taxable income required to be distributed from earlier periods, we will pay a 4% nondeductible excise tax on the excess of the required distribution over the amount we actually distributed. | |
| § | We may elect to retain and pay income tax on our net long-term capital gain. In that case, a U.S. stockholder would be taxed on its proportionate share of our undistributed long-term capital gain (to the extent that we made a timely designation of such gain to the stockholders) and would receive a credit or refund for its proportionate share of the tax we paid. | |
| § | We will be subject to a 100% excise tax on transactions with a TRS that are not conducted on an arm’s-length basis. | |
| § | In the event of a failure of any of the asset tests, other than a de minimis failure of the 5% asset test or the 10% vote or value test, as described below under “—Asset Tests,” as long as the failure was due to reasonable cause and not to willful neglect, we file a description of each asset that caused such failure with the IRS, and we dispose of such assets or otherwise comply with the asset tests within six months after the last day of the quarter in which we identify such failure, we will pay a tax equal to the greater of $50,000 or the highest federal income tax rate then applicable to U.S. corporations (currently 35%) on the net income from the nonqualifying assets during the period in which we failed to satisfy the asset tests. | |
| § | In the event we fail to satisfy one or more requirements for REIT qualification, other than the gross income tests and the asset tests, and such failure is due to reasonable cause and not to willful neglect, we will be required to pay a penalty of $50,000 for each such failure. | |
| § | If we acquire any asset from a C corporation, or a corporation that generally is subject to full corporate-level tax, in a merger or other transaction in which we acquire a basis in the asset that is determined by reference either to the C corporation’s basis in the asset or to another asset, we will pay tax at the highest regular corporate rate applicable if we recognize gain on the sale or disposition of the asset during the 10-year period after we acquire the asset provided no election is made for the transaction to be taxable on a current basis. The amount of gain on which we will pay tax is the lesser of: |
| – | the amount of gain that we recognize at the time of the sale or disposition, and | |
| – | the amount of gain that we would have recognized if we had sold the asset at the time we acquired it. |
| § | We may be required to pay monetary penalties to the IRS in certain circumstances, including if we fail to meet record-keeping requirements intended to monitor our compliance with rules relating to the composition of a REIT’s stockholders, as described below in “—Recordkeeping Requirements.” | |
| § | The earnings of our lower-tier entities that are subchapter C corporations, including TRSs, will be subject to federal corporate income tax. |
In addition, notwithstanding our qualification as a REIT, we may also have to pay certain state and local income taxes, because not all states and localities treat REITs in the same manner that they are treated for federal income tax purposes. Moreover, as further described below, TRSs will be subject to federal, state and local corporate income tax on their taxable income.
Requirements for Qualification
A REIT is a corporation, trust or association that meets each of the following requirements:
| 1. | It is managed by one or more directors or trustees. | |
| 2. | Its beneficial ownership is evidenced by transferable shares, or by transferable certificates of beneficial interest. | |
| 3. | It would be taxable as a domestic corporation, but for the REIT provisions of the federal income tax laws. | |
| 4. | It is neither a financial institution nor an insurance company subject to special provisions of the federal income tax laws. |
144
| 5. | At least 100 persons are beneficial owners of its shares or ownership certificates. | |
| 6. | Not more than 50% in value of its outstanding shares or ownership certificates is owned, directly or indirectly, by five or fewer individuals, which the Code defines to include certain entities, during the last half of any taxable year. | |
| 7. | It elects to be a REIT, or has made such election for a previous taxable year, and satisfies all relevant filing and other administrative requirements established by the IRS that must be met to elect and maintain REIT status. | |
| 8. | It meets certain other qualification tests, described below, regarding the nature of its income and assets and the amount of its distributions to stockholders. | |
| 9. | It uses a calendar year for federal income tax purposes and complies with the recordkeeping requirements of the federal income tax laws. |
We must meet requirements 1 through 4, 7, 8 and 9 during our entire taxable year and must meet requirement 5 during at least 335 days of a taxable year of 12 months, or during a proportionate part of a taxable year of less than 12 months. Requirements 5 and 6 will apply to us beginning with our 2011 taxable year. If we comply with all the requirements for ascertaining the ownership of our outstanding stock in a taxable year and have no reason to know that we violated requirement 6, we will be deemed to have satisfied requirement 6 for that taxable year. For purposes of determining share ownership under requirement 6, an “individual” generally includes a supplemental unemployment compensation benefits plan, a private foundation, or a portion of a trust permanently set aside or used exclusively for charitable purposes. An “individual,” however, generally does not include a trust that is a qualified employee pension or profit sharing trust under the Code, and beneficiaries of such a trust will be treated as holding our stock in proportion to their actuarial interests in the trust for purposes of requirement 6.
Our charter provides restrictions regarding the transfer and ownership of our common stock. See “Description of Capital Stock—Restrictions on Ownership and Transfer.” We believe that we will issue sufficient common stock with sufficient diversity of ownership to allow us to satisfy requirements 5 and 6 above. The restrictions in our charter are intended (among other things) to assist us in continuing to satisfy requirements 5 and 6 described above. These restrictions, however, may not ensure that we will, in all cases, be able to satisfy such stock ownership requirements. If we fail to satisfy these stock ownership requirements, our qualification as a REIT may terminate.
Qualified REIT Subsidiaries. A corporation that is a “qualified REIT subsidiary” is not treated as a corporation separate from its parent REIT. All assets, liabilities, and items of income, deduction, and credit of a “qualified REIT subsidiary” are treated as assets, liabilities, and items of income, deduction, and credit of the REIT. A “qualified REIT subsidiary” is a corporation, other than a TRS, all of the stock of which is owned by the REIT. Thus, in applying the requirements described herein, any “qualified REIT subsidiary” that we own will be ignored, and all assets, liabilities, and items of income, deduction, and credit of such subsidiary will be treated as our assets, liabilities, and items of income, deduction, and credit.
Other Disregarded Entities and Partnerships. An unincorporated domestic entity, such as a partnership or limited liability company that has a single owner, generally is not treated as an entity separate from its parent for federal income tax purposes. An unincorporated domestic entity with two or more owners is generally treated as a partnership for federal income tax purposes. In the case of a REIT that is a partner in a partnership that has other partners, the REIT is treated as owning its proportionate share of the assets of the partnership and as earning its allocable share of the gross income of the partnership for purposes of the applicable REIT qualification tests. Our proportionate share for purposes of the 10% value test (see “—Asset Tests”) will be based on our proportionate interest in the equity interests and certain debt securities issued by the partnership. For all of the other asset and income tests, our proportionate share will be based on our proportionate interest in the capital interests in the partnership. Our proportionate share of the assets, liabilities, and items of income of any partnership, joint venture, or limited liability company that is treated as a partnership for federal income tax purposes in which we acquire an equity interest, directly or indirectly, will be treated as our assets and gross income for purposes of applying the various REIT qualification requirements.
Taxable REIT Subsidiaries. A REIT may own up to 100% of the capital stock of one or more TRSs. A TRS is a fully taxable corporation that may earn income that would not be qualifying income if earned directly by the parent REIT. The subsidiary and the REIT must jointly elect to treat the subsidiary as a TRS. A corporation of which a TRS directly or
145
indirectly owns more than 35% of the voting power or value of the stock will automatically be treated as a TRS. However, an entity will not qualify as a TRS if it directly or indirectly operates or manages a lodging or health care facility or, generally, provides to another person under a franchise, license, or otherwise, rights to any brand name under which any lodging facility or health care facility is operated, unless such rights are provided to an “eligible independent contractor” (as defined below under “—Gross Income Tests—Rents from Real Property”) to operate or manage a lodging facility or health care facility and such lodging facility or health care facility is either owned by the TRS or leased to the TRS by its parent REIT. Additionally, a TRS that employs individuals working at a qualified lodging facility located outside the United States will not be considered to operate or manage a qualified lodging facility as long as an “eligible independent contractor” is responsible for the daily supervision and direction of such individuals on behalf of the TRS pursuant to a management agreement or similar service contract.
We are not treated as holding the assets of a TRS or as receiving any income that the subsidiary earns. Rather, the stock issued by a TRS to us is an asset in our hands, and we treat the distributions paid to us from such taxable subsidiary, if any, as dividend income. This treatment can affect our compliance with the gross income and asset tests. Because we do not include the assets and income of TRSs in determining our compliance with the REIT requirements, we may use such entities to undertake indirectly activities that the REIT rules might otherwise preclude us from doing directly or through pass-through subsidiaries. Overall, no more than 25% of the value of a REIT’s assets may consist of stock or securities of one or more TRSs.
A TRS will pay income tax at regular corporate rates on any income that it earns. In addition, the TRS rules limit the deductibility of interest paid or accrued by a TRS to its parent REIT to assure that the TRS is subject to an appropriate level of corporate taxation. Further, the rules impose a 100% excise tax on transactions between a TRS and its parent REIT or the REIT’s tenants that are not conducted on an arm’s-length basis. We have formed Summit TRS and will form prior to completion of this offering Summit TRS II, whose wholly owned subsidiaries will be the lessees of our hotel properties. We will not be able to use income and gain recognized by Summit TRS to offset losses recognized by Summit TRS II, and vice versa, which may result in a higher tax liability than would be the case if all of our hotel properties were owned by TRS lessees of the same TRS. To reduce the risk of incurring a prohibited transaction tax, we may transfer some or all of our predecessor’s parcels of undeveloped land to Summit TRS or another TRS.
Gross Income Tests
We must satisfy two gross income tests annually to maintain our qualification as a REIT. First, at least 75% of our gross income for each taxable year must consist of defined types of income that we derive, directly or indirectly, from investments relating to real property or mortgages on real property or qualified temporary investment income. Qualifying income for purposes of that 75% gross income test generally includes:
| § | rents from real property; | |
| § | interest on debt secured by mortgages on real property, or on interests in real property; | |
| § | dividends or other distributions on, and gain from the sale of, shares in other REITs; | |
| § | gain from the sale of real estate assets; and | |
| § | income derived from the temporary investment in stock and debt investments purchased with the proceeds from the issuance of our stock or a public offering of our debt with a maturity date of at least five years and that we receive during the one-year period beginning on the date on which we received such new capital. |
Second, in general, at least 95% of our gross income for each taxable year must consist of income that is qualifying income for purposes of the 75% gross income test (except for income derived from the temporary investment of new capital), other types of interest and dividends, gain from the sale or disposition of stock or securities, or any combination of these. Gross income from our sale of property that we hold primarily for sale to customers in the ordinary course of business is excluded from both the numerator and the denominator in both gross income tests. In addition, income and gain from “hedging transactions” that we enter into to hedge indebtedness incurred or to be incurred to acquire or carry real estate assets and that are clearly and timely identified as such will be excluded from both the numerator and the denominator for purposes of the 75% and 95% gross income tests. In addition, certain foreign currency gains will be
146
excluded from gross income for purposes of one or both of the gross income tests. See “—Foreign Currency Gain” below. The following paragraphs discuss the specific application of the gross income tests to us.
Rents from Real Property. Rent that we receive from our real property will qualify as “rents from real property,” which is qualifying income for purposes of the 75% and 95% gross income tests, only if the following conditions are met:
| § | First, the rent must not be based, in whole or in part, on the income or profits of any person, but may be based on a fixed percentage or percentages of receipts or sales. | |
| § | Second, neither we nor a direct or indirect owner of 10% or more of our stock may own, actually or constructively, 10% or more of a tenant from whom we receive rent, other than a TRS. If the tenant is a TRS and the property is a “qualified lodging facility,” such TRS may not directly or indirectly operate or manage such property. Instead, the property must be operated on behalf of the TRS by a person who qualifies as an “independent contractor” and who is, or is related to a person who is, actively engaged in the trade or business of operating lodging facilities for any person unrelated to us and the TRS. | |
| § | Third, if the rent attributable to personal property leased in connection with a lease of real property is 15% or less of the total rent received under the lease, then the rent attributable to personal property will qualify as rents from real property. However, if the 15% threshold is exceeded, the rent attributable to personal property will not qualify as rents from real property. | |
| § | Fourth, we generally must not operate or manage our real property or furnish or render services to our tenants, other than certain customary services provided to tenants through an “independent contractor” who is adequately compensated and from whom we do not derive revenue. Furthermore, we may own up to 100% of the stock of a TRS which may provide customary and noncustomary services to our tenants without tainting our rental income for the related properties. We need not provide services through an “independent contractor” or a TRS, but instead may provide services directly to our tenants, if the services are “usually or customarily rendered” in connection with the rental of space for occupancy only and are not considered to be provided for the tenants’ convenience. In addition, we may provide a minimal amount of services not described in the prior sentence to the tenants of a property, other than through an independent contractor or a TRS, as long as our income from the services (valued at not less than 150% of our direct cost of performing such services) does not exceed 1% of our income from the related property. |
Our TRS lessees will lease from our operating partnership and its subsidiaries the land (or leasehold interest), buildings, improvements, furnishings and equipment comprising our hotel properties. In order for the rent paid under the leases to constitute “rents from real property,” the leases must be respected as true leases for federal income tax purposes and not treated as service contracts, joint ventures or some other type of arrangement. The determination of whether our leases are true leases depends on an analysis of all the surrounding facts and circumstances. In making such a determination, courts have considered a variety of factors, including the following:
| § | the intent of the parties; | |
| § | the form of the agreement; | |
| § | the degree of control over the property that is retained by the property owner (for example, whether the lessee has substantial control over the operation of the property or whether the lessee was required simply to use its best efforts to perform its obligations under the agreement); and | |
| § | the extent to which the property owner retains the risk of loss with respect to the property (for example, whether the lessee bears the risk of increases in operating expenses or the risk of damage to the property) or the potential for economic gain with respect to the property. |
In addition, the federal income tax law provides that a contract that purports to be a service contract or a partnership agreement is treated instead as a lease of property if the contract is properly treated as such, taking into account all relevant factors. Since the determination of whether a service contract should be treated as a lease is inherently factual, the presence or absence of any single factor may not be dispositive in every case.
147
We currently intend to structure our leases so that they qualify as true leases for federal income tax purposes. For example, with respect to each lease, we generally expect that:
| § | our operating partnership and the lessee will intend for their relationship to be that of a lessor and lessee, and such relationship will be documented by a lease agreement; | |
| § | the lessee will have the right to exclusive possession and use and quiet enjoyment of the hotels covered by the lease during the term of the lease; | |
| § | the lessee will bear the cost of, and will be responsible for, day-to-day maintenance and repair of the hotels other than the cost of certain capital expenditures, and will dictate through hotel managers that are eligible independent contractors, who will work for the lessee during the terms of the lease, and generally will dictate how the hotels will be operated and maintained; | |
| § | the lessee will bear all of the costs and expenses of operating the hotels, including the cost of any inventory used in their operation, during the term of the lease, other than real estate and personal property taxes and the cost of certain furniture, fixtures and equipment, and certain capital expenditures; | |
| § | the lessee will benefit from any savings and will bear the burdens of any increases in the costs of operating the hotels during the term of the lease; | |
| § | in the event of damage or destruction to a hotel, the lessee will be at economic risk because it will bear the economic burden of the loss in income from operation of the hotels subject to the right, in certain circumstances, to terminate the lease if the lessor does not restore the hotel to its prior condition; | |
| § | the lessee will generally indemnify the lessor against all liabilities imposed on the lessor during the term of the lease by reason of (A) injury to persons or damage to property occurring at the hotels or (B) the lessee’s use, management, maintenance or repair of the hotels; | |
| § | the lessee will be obligated to pay, at a minimum, substantial base rent for the period of use of the hotels under the lease; | |
| § | the lessee will stand to incur substantial losses or reap substantial gains depending on how successfully it, through the hotel managers, who work for the lessees during the terms of the leases, operates the hotels; | |
| § | we expect that each lease that we enter into, at the time we enter into it (or at any time that any such lease is subsequently renewed or extended) will enable the tenant to derive a meaningful profit, after expenses and taking into account the risks associated with the lease, from the operation of the hotels during the term of its leases; and | |
| § | upon termination of each lease, the applicable hotel will be expected to have a substantial remaining useful life and substantial remaining fair market value. |
Investors should be aware that there are no controlling Treasury regulations, published rulings or judicial decisions involving leases with terms substantially the same as our leases that discuss whether such leases constitute true leases for federal income tax purposes. If our leases are characterized as service contracts or partnership agreements, rather than as true leases, or disregarded altogether for tax purposes, part or all of the payments that our operating partnership and its subsidiaries receive from the TRS lessees would not be considered rent or may not otherwise satisfy the various requirements for qualification as “rents from real property.” In that case, we would not be able to satisfy either the 75% or 95% gross income test and, as a result, would lose our REIT status unless we qualify for relief, as described below under “—Failure to Satisfy Gross Income Tests.”
As described above, in order for the rent that we receive to constitute “rents from real property,” several other requirements must be satisfied. One requirement is that percentage rent must not be based in whole or in part on the income or profits of any person. Percentage rent, however, will qualify as “rents from real property” if it is based on percentages of receipts or sales and the percentages:
| § | are fixed at the time the percentage leases are entered into; |
148
| § | are not renegotiated during the term of the percentage leases in a manner that has the effect of basing percentage rent on income or profits; and | |
| § | conform with normal business practice. |
More generally, percentage rent will not qualify as “rents from real property” if, considering the leases and all the surrounding circumstances, the arrangement does not conform with normal business practice, but is in reality used as a means of basing the percentage rent on income or profits.
Second, we must not own, actually or constructively, 10% or more of the stock or the assets or net profits of any lessee (a “related party tenant”), other than a TRS. The constructive ownership rules generally provide that, if 10% or more in value of our stock is owned, directly or indirectly, by or for any person, we are considered as owning the stock owned, directly or indirectly, by or for such person. We anticipate that all of our hotels will be leased to TRSs. In addition, our charter prohibits transfers of our stock that would cause us to own actually or constructively, 10% or more of the ownership interests in any non-TRS lessee. Based on the foregoing, we should never own, actually or constructively, 10% or more of any lessee other than a TRS. However, because the constructive ownership rules are broad and it is not possible to monitor continually direct and indirect transfers of our stock, no absolute assurance can be given that such transfers or other events of which we have no knowledge will not cause us to own constructively 10% or more of a lessee (or a subtenant, in which case only rent attributable to the subtenant is disqualified) other than a TRS at some future date.
As described above, we may own up to 100% of the capital stock of one or more TRSs. A TRS is a fully taxable corporation that generally may engage in any business, including the provision of customary or noncustomary services to tenants of its parent REIT, except that a TRS may not directly or indirectly operate or manage any lodging facilities or health care facilities or provide rights to any brand name under which any lodging or health care facility is operated, unless such rights are provided to an “eligible independent contractor” to operate or manage a lodging or health care facility if such rights are held by the TRS as a franchisee, licensee, or in a similar capacity and such hotel is either owned by the TRS or leased to the TRS by its parent REIT. A TRS will not be considered to operate or manage a qualified lodging facility solely because the TRS directly or indirectly possesses a license, permit, or similar instrument enabling it to do so. Additionally, a TRS that employs individuals working at a qualified lodging facility outside the United States will not be considered to operate or manage a qualified lodging facility located outside of the United States, as long as an “eligible independent contractor” is responsible for the daily supervision and direction of such individuals on behalf of the TRS pursuant to a management agreement or similar service contract. However, rent that we receive from a TRS with respect to any property will qualify as “rents from real property” as long as the property is a “qualified lodging facility” and such property is operated on behalf of the TRS by a person from whom we derive no income who is adequately compensated, who does not, directly or through its stockholders, own more than 35% of our stock, taking into account certain ownership attribution rules, and who is, or is related to a person who is, actively engaged in the trade or business of operating “qualified lodging facilities” for any person unrelated to us and the TRS lessee (an “eligible independent contractor”). A “qualified lodging facility” is a hotel, motel, or other establishment more than one-half of the dwelling units in which are used on a transient basis, unless wagering activities are conducted at or in connection with such facility by any person who is engaged in the business of accepting wagers and who is legally authorized to engage in such business at or in connection with such facility. A “qualified lodging facility” includes customary amenities and facilities operated as part of, or associated with, the lodging facility as long as such amenities and facilities are customary for other properties of a comparable size and class owned by other unrelated owners.
Our TRS lessees will lease our hotel properties, which we believe will constitute qualified lodging facilities. Our TRS lessees will engage Interstate to operate our initial hotels on behalf of the TRS lessees. We believe that Interstate will qualify as an “eligible independent contractor.” Our TRS lessees may engage other hotel managers in the future. Our TRS lessees will only engage hotel managers that qualify as “eligible independent contractors.”
Third, the rent attributable to the personal property leased in connection with the lease of a hotel must not be greater than 15% of the total rent received under the lease. The rent attributable to the personal property contained in a hotel is the amount that bears the same ratio to total rent for the taxable year as the average of the fair market values of the personal property at the beginning and at the end of the taxable year bears to the average of the aggregate fair market values of both the real and personal property contained in the hotel at the beginning and at the end of such taxable year (the “personal property ratio”). To comply with this limitation, a TRS lessee may acquire furnishings, equipment and other personal property. With respect to each hotel in which the TRS lessee does not own the personal property, we believe
149
either that the personal property ratio will be less than 15% or that any rent attributable to excess personal property, when taken together with all of our other nonqualifying income, will not jeopardize our ability to qualify as a REIT. There can be no assurance, however, that the IRS would not challenge our calculation of a personal property ratio, or that a court would not uphold such assertion. If such a challenge were successfully asserted, we could fail to satisfy the 75% or 95% gross income test and thus potentially lose our REIT qualification.
Fourth, we generally cannot furnish or render services to the tenants of our hotels, or manage or operate our properties, other than through an independent contractor who is adequately compensated and from whom we do not derive or receive any income. Furthermore, our TRSs may provide customary and noncustomary services to our tenants without tainting our rental income from such properties. However, we need not provide services through an “independent contractor” or TRS but instead may provide services directly to our tenants, if the services are “usually or customarily rendered” in connection with the rental of space for occupancy only and are not considered to be provided for the tenants’ convenience. In addition, we may provide a minimal amount of “noncustomary” services to the tenants of a property, other than through an independent contractor or a TRS, as long as our income from the services does not exceed 1% of our income from the related property. We will not perform any services other than customary ones for our lessees, unless such services are provided through independent contractors or TRSs or would not otherwise jeopardize our tax status as a REIT.
If a portion of the rent that we receive from a hotel does not qualify as “rents from real property” because the rent attributable to personal property exceeds 15% of the total rent for a taxable year, the portion of the rent that is attributable to personal property will not be qualifying income for purposes of either the 75% or 95% gross income test. Thus, if such rent attributable to personal property, plus any other income that is nonqualifying income for purposes of the 95% gross income test, during a taxable year exceeds 5% of our gross income during the year, we would lose our REIT qualification. If, however, the rent from a particular hotel does not qualify as “rents from real property” because either (1) the percentage rent is considered based on the income or profits of the related lessee, (2) the lessee either is a related party tenant or fails to qualify for the exception to the related party tenant rule for qualifying TRSs or (3) we furnish noncustomary services to the tenants of the hotel, or manage or operate the hotel, other than through a qualifying independent contractor or a TRS, none of the rent from that hotel would qualify as “rents from real property.” In that case, we might lose our REIT qualification because we might be unable to satisfy either the 75% or 95% gross income test. In addition to the rent, the lessees will be required to pay certain additional charges. To the extent that such additional charges represent either (1) reimbursements of amounts that we are obligated to pay to third parties, such as a lessee’s proportionate share of a property’s operational or capital expenses, or (2) penalties for nonpayment or late payment of such amounts, such charges should qualify as “rents from real property.” However, to the extent that such charges do not qualify as “rents from real property,” they instead may be treated as interest that qualifies for the 95% gross income test, but not the 75% gross income test, or they may be treated as nonqualifying income for purposes of both gross income tests. We intend to structure our leases in a manner that will enable us to satisfy the REIT gross income tests.
Interest. The term “interest” generally does not include any amount received or accrued, directly or indirectly, if the determination of such amount depends in whole or in part on the income or profits of any person. However, interest generally includes the following:
| § | an amount that is based on a fixed percentage or percentages of receipts or sales; and | |
| § | an amount that is based on the income or profits of a debtor, as long as the debtor derives substantially all of its income from the real property securing the debt from leasing substantially all of its interest in the property, and only to the extent that the amounts received by the debtor would be qualifying “rents from real property” if received directly by a REIT. |
If a loan contains a provision that entitles a REIT to a percentage of the borrower’s gain upon the sale of the real property securing the loan or a percentage of the appreciation in the property’s value as of a specific date, income attributable to that loan provision will be treated as gain from the sale of the property securing the loan, which generally is qualifying income for purposes of both gross income tests.
We may selectively invest in mortgage debt when we believe our investment will allow us to acquire control of the related real estate. Interest on debt secured by a mortgage on real property or on interests in real property, including, for this purpose, discount points, prepayment penalties, loan assumption fees, and late payment charges that are not
150
compensation for services, generally is qualifying income for purposes of the 75% gross income test. However, if a loan is secured by real property and other property and the highest principal amount of a loan outstanding during a taxable year exceeds the fair market value of the real property securing the loan as of the date the REIT agreed to acquire the loan, then a portion of the interest income from such loan will not be qualifying income for purposes of the 75% gross income test, but will be qualifying income for purposes of the 95% gross income test. The portion of the interest income that will not be qualifying income for purposes of the 75% gross income test will be equal to the portion of the principal amount of the loan that is not secured by real property—that is, the amount by which the loan exceeds the value of the real estate that is security for the loan.
We may also selectively invest in mezzanine loans, which are loans secured by equity interests in an entity that directly or indirectly owns real property, rather than by a direct mortgage of the real property. IRS Revenue Procedure 2003-65 provides a safe harbor pursuant to which a mezzanine loan, if it meets each of the requirements contained in the Revenue Procedure, will be treated by the IRS as a real estate asset for purposes of the REIT asset tests described below, and interest derived from it will be treated as qualifying mortgage interest for purposes of the 75% gross income test. Although the Revenue Procedure provides a safe harbor on which taxpayers may rely, it does not prescribe rules of substantive tax law. Moreover, we anticipate that the mezzanine loans we will acquire typically will not meet all of the requirements for reliance on this safe harbor. We intend to invest in mezzanine loans in a manner that will enable us to continue to satisfy the gross income and asset tests.
Dividends. Our share of any dividends received from any corporation (including any TRS, but excluding any REIT) in which we own an equity interest will qualify for purposes of the 95% gross income test but not for purposes of the 75% gross income test. Our share of any dividends received from any other REIT in which we own an equity interest, if any, will be qualifying income for purposes of both gross income tests.
Prohibited Transactions. A REIT will incur a 100% tax on the net income (including foreign currency gain) derived from any sale or other disposition of property, other than foreclosure property, that the REIT holds primarily for sale to customers in the ordinary course of a trade or business. We believe that none of our assets will be held primarily for sale to customers and that a sale of any of our assets will not be in the ordinary course of our business. Whether a REIT holds an asset “primarily for sale to customers in the ordinary course of a trade or business” depends, however, on the facts and circumstances in effect from time to time, including those related to a particular asset. A safe harbor to the characterization of the sale of property by a REIT as a prohibited transaction and the 100% prohibited transaction tax is available if the following requirements are met:
| § | the REIT has held the property for not less than two years; | |
| § | the aggregate expenditures made by the REIT, or any partner of the REIT, during the two-year period preceding the date of the sale that are includable in the basis of the property do not exceed 30% of the selling price of the property; | |
| § | either (1) during the year in question, the REIT did not make more than seven sales of property other than foreclosure property or sales to which Section 1033 of the Code applies, (2) the aggregate adjusted bases of all such properties sold by the REIT during the year did not exceed 10% of the aggregate bases of all of the assets of the REIT at the beginning of the year or (3) the aggregate fair market value of all such properties sold by the REIT during the year did not exceed 10% of the aggregate fair market value of all of the assets of the REIT at the beginning of the year; | |
| § | in the case of property not acquired through foreclosure or lease termination, the REIT has held the property for at least two years for the production of rental income; and | |
| § | if the REIT has made more than seven sales of non-foreclosure property during the taxable year, substantially all of the marketing and development expenditures with respect to the property were made through an independent contractor from whom the REIT derives no income. |
We will attempt to comply with the terms of safe-harbor provision in the federal income tax laws prescribing when an asset sale will not be characterized as a prohibited transaction. We cannot assure you, however, that we can comply with the safe-harbor provision or that we will avoid owning property that may be characterized as property that we hold “primarily for sale to customers in the ordinary course of a trade or business.” The 100% tax will not apply to gains from
151
the sale of property that is held through a TRS or other taxable corporation, although such income will be taxed to the corporation at regular corporate income tax rates. To reduce the risk of incurring a prohibited transaction tax, we may transfer some or all of our predecessor’s parcels of undeveloped land to Summit TRS or another TRS.
Foreclosure Property. We will be subject to tax at the maximum corporate rate on any income from foreclosure property, which includes certain foreign currency gains and related deductions, other than income that otherwise would be qualifying income for purposes of the 75% gross income test, less expenses directly connected with the production of that income. However, gross income from foreclosure property will qualify under the 75% and 95% gross income tests. Foreclosure property is any real property, including interests in real property, and any personal property incident to such real property:
| § | that is acquired by a REIT as the result of the REIT having bid on such property at foreclosure, or having otherwise reduced such property to ownership or possession by agreement or process of law, after there was a default or default was imminent on a lease of such property or on indebtedness that such property secured; | |
| § | for which the related loan was acquired by the REIT at a time when the default was not imminent or anticipated; and | |
| § | for which the REIT makes a proper election to treat the property as foreclosure property. |
A REIT will not be considered to have foreclosed on a property where the REIT takes control of the property as a mortgagee-in-possession and cannot receive any profit or sustain any loss except as a creditor of the mortgagor. Property generally ceases to be foreclosure property at the end of the third taxable year following the taxable year in which the REIT acquired the property, or longer if an extension is granted by the Secretary of the Treasury. However, this grace period terminates and foreclosure property ceases to be foreclosure property on the first day:
| § | on which a lease is entered into for the property that, by its terms, will give rise to income that does not qualify for purposes of the 75% gross income test, or any amount is received or accrued, directly or indirectly, pursuant to a lease entered into on or after such day that will give rise to income that does not qualify for purposes of the 75% gross income test; | |
| § | on which any construction takes place on the property, other than completion of a building or any other improvement, where more than 10% of the construction was completed before default became imminent; or | |
| § | which is more than 90 days after the day on which the REIT acquired the property and the property is used in a trade or business which is conducted by the REIT, other than through an independent contractor from whom the REIT itself does not derive or receive any income. |
Hedging Transactions. From time to time, we or our operating partnership may enter into hedging transactions with respect to one or more of our assets or liabilities. Our hedging activities may include entering into interest rate swaps, caps, and floors, options to purchase such items, and futures and forward contracts. Income and gain from “hedging transactions” will be excluded from gross income for purposes of both the 75% and 95% gross income tests. A “hedging transaction” means either (1) any transaction entered into in the normal course of our or our operating partnership’s trade or business primarily to manage the risk of interest rate changes, price changes, or currency fluctuations with respect to borrowings made or to be made, or ordinary obligations incurred or to be incurred, to acquire or carry real estate assets and (2) any transaction entered into primarily to manage the risk of currency fluctuations with respect to any item of income or gain that would be qualifying income under the 75% or 95% gross income test (or any property which generates such income or gain). We are required to clearly identify any such hedging transaction before the close of the day on which it was acquired or entered into and to satisfy other identification requirements. We intend to structure any hedging transactions in a manner that does not jeopardize our qualification as a REIT.
Foreign Currency Gain. Certain foreign currency gains will be excluded from gross income for purposes of one or both of the gross income tests. “Real estate foreign exchange gain” will be excluded from gross income for purposes of the 75% and 95% gross income tests. Real estate foreign exchange gain generally includes foreign currency gain attributable to any item of income or gain that is qualifying income for purposes of the 75% gross income test, foreign currency gain attributable to the acquisition or ownership of (or becoming or being the obligor under) obligations secured by mortgages on real property or on interests in real property and certain foreign currency gain attributable to certain “qualified business units” of a REIT. “Passive foreign exchange gain” will be excluded from gross income for purposes of
152
the 95% gross income test. Passive foreign exchange gain generally includes real estate foreign exchange gain as described above, and also includes foreign currency gain attributable to any item of income or gain that is qualifying income for purposes of the 95% gross income test and foreign currency gain attributable to the acquisition or ownership of (or becoming or being the obligor under) obligations. These exclusions for real estate foreign exchange gain and passive foreign exchange gain do not apply to any certain foreign currency gain derived from dealing, or engaging in substantial and regular trading, in securities. Such gain is treated as nonqualifying income for purposes of both the 75% and 95% gross income tests.
Failure to Satisfy Gross Income Tests. We will have gross income from various sources, including the sources described in the preceding paragraphs, that fails to constitute qualifying income for purposes of one or both of the gross income tests. Taking into account our anticipated sources of non-qualifying income, however, we expect that our aggregate gross income will satisfy the 75% and 95% gross income tests applicable to REITs for each taxable year commencing with our first taxable year as a REIT. If we fail to satisfy one or both of the gross income tests for any taxable year, we nevertheless may qualify as a REIT for that year if we qualify for relief under certain provisions of the federal income tax laws. Those relief provisions are available if:
| § | our failure to meet those tests is due to reasonable cause and not to willful neglect; and | |
| § | following such failure for any taxable year, we file a schedule of the sources of our income in accordance with regulations prescribed by the Secretary of the U.S. Treasury. |
We cannot predict, however, whether in all circumstances we would qualify for the relief provisions. In addition, as discussed above in “—Taxation of Our Company,” even if the relief provisions apply, we would incur a 100% tax on the gross income attributable to the greater of the amount by which we fail the 75% gross income test or the 95% gross income test multiplied, in either case, by a fraction intended to reflect our profitability.
Asset Tests
To qualify as a REIT, we also must satisfy the following asset tests at the end of each quarter of each taxable year.
First, at least 75% of the value of our total assets must consist of:
| § | cash or cash items, including certain receivables and, in certain circumstances, foreign currencies; | |
| § | government securities; | |
| § | interests in real property, including leaseholds and options to acquire real property and leaseholds; | |
| § | interests in mortgage loans secured by real property; | |
| § | stock in other REITs; and | |
| § | investments in stock or debt instruments during the one-year period following our receipt of new capital that we raise through equity offerings or public offerings of debt with at least a five-year term. |
Second, of our investments not included in the 75% asset class, the value of our interest in any one issuer’s securities may not exceed 5% of the value of our total assets, or the 5% asset test.
Third, of our investments not included in the 75% asset class, we may not own more than 10% of the voting power or value of any one issuer’s outstanding securities, or the 10% vote or value test.
Fourth, no more than 25% of the value of our total assets may consist of the securities of one or more TRSs.
Fifth, no more than 25% of the value of our total assets may consist of the securities of TRSs and other non-TRS taxable subsidiaries and other assets that are not qualifying assets for purposes of the 75% asset test, or the 25% securities test.
For purposes of the 5% asset test and the 10% vote or value test, the term “securities” does not include stock in another REIT, equity or debt securities of a qualified REIT subsidiary or TRS, mortgage loans that constitute real estate
153
assets, or equity interests in a partnership. The term “securities,” however, generally includes debt securities issued by a partnership or another REIT, except that for purposes of the 10% value test, the term “securities” does not include:
| § | “Straight debt” securities, which is defined as a written unconditional promise to pay on demand or on a specified date a sum certain in money if (i) the debt is not convertible, directly or indirectly, into equity, and (ii) the interest rate and interest payment dates are not contingent on profits, the borrower’s discretion, or similar factors. “Straight debt” securities do not include any securities issued by a partnership or a corporation in which we or any controlled TRS (i.e., a TRS in which we own directly or indirectly more than 50% of the voting power or value of the stock) hold non-“straight debt” securities that have an aggregate value of more than 1% of the issuer’s outstanding securities. However, “straight debt” securities include debt subject to the following contingencies: |
| – | a contingency relating to the time of payment of interest or principal, as long as either (i) there is no change to the effective yield of the debt obligation, other than a change to the annual yield that does not exceed the greater of 0.25% or 5% of the annual yield, or (ii) neither the aggregate issue price nor the aggregate face amount of the issuer’s debt obligations held by us exceeds $1.0 million and no more than 12 months of unaccrued interest on the debt obligations can be required to be prepaid; and | |
| – | a contingency relating to the time or amount of payment upon a default or prepayment of a debt obligation, as long as the contingency is consistent with customary commercial practice; |
| § | Any loan to an individual or an estate; | |
| § | Any “section 467 rental agreement,” other than an agreement with a related party tenant; | |
| § | Any obligation to pay “rents from real property”; | |
| § | Certain securities issued by governmental entities; | |
| § | Any security issued by a REIT; | |
| § | Any debt instrument issued by an entity treated as a partnership for federal income tax purposes in which we are a partner to the extent of our proportionate interest in the equity and debt securities of the partnership; and | |
| § | Any debt instrument issued by an entity treated as a partnership for federal income tax purposes not described in the preceding bullet points if at least 75% of the partnership’s gross income, excluding income from prohibited transactions, is qualifying income for purposes of the 75% gross income test described above in “—Gross Income Tests.” |
For purposes of the 10% value test, our proportionate share of the assets of a partnership is our proportionate interest in any securities issued by the partnership, without regard to the securities described in the last two bullet points above.
As described above, we may selectively invest from time to time in mortgage debt and mezzanine loans. Mortgage loans will generally qualify as real estate assets for purposes of the 75% asset test to the extent that they are secured by real property. However, if a loan is secured by real property and other property and the highest principal amount of a loan outstanding during a taxable year exceeds the fair market value of the real property securing the loan as of the date we agreed to acquire the loan, then a portion of such loan likely will not be a qualifying real estate asset. Although the law on the matter is not entirely clear, it appears that the nonqualifying portion of the mortgage loan will be equal to the portion of the highest principal amount of the loan outstanding during the taxable year that exceeds the fair market value of the associated real property that is security for that loan.
Although we expect that our investments in mezzanine loans will generally be treated as real estate assets, we anticipate that the mezzanine loans in which we invest will not meet all the requirements of the safe harbor in IRS Revenue Procedure 2003-65. Thus, no assurance can be provided that the IRS will not challenge our treatment of mezzanine loans as real estate assets. We intend to invest in mezzanine loans in a manner that will enable us to continue to satisfy the asset and gross income test requirements.
154
We will monitor the status of our assets for purposes of the various asset tests and will manage our portfolio in order to comply at all times with such tests. If we fail to satisfy the asset tests at the end of a calendar quarter, we will not lose our REIT qualification if:
| § | we satisfied the asset tests at the end of the preceding calendar quarter; and | |
| § | the discrepancy between the value of our assets and the asset test requirements arose from changes in the market values of our assets and was not wholly or partly caused by the acquisition of one or more non-qualifying assets. |
If we did not satisfy the condition described in the second item, above, we still could avoid disqualification by eliminating any discrepancy within 30 days after the close of the calendar quarter in which it arose.
In the event that we violate the 5% asset test or the 10% vote or value test described above, we will not lose our REIT qualification if (1) the failure is de minimis (up to the lesser of 1% of our assets or $10.0 million) and (2) we dispose of assets or otherwise comply with the asset tests within six months after the last day of the quarter in which we identify such failure. In the event of a failure of any of the asset tests (other than de minimis failures described in the preceding sentence), as long as the failure was due to reasonable cause and not to willful neglect, we will not lose our REIT qualification if we (1) dispose of the assets causing the failure or otherwise comply with the asset tests within six months after the last day of the quarter in which we identify the failure, (2) we file a description of each asset causing the failure with the IRS and (3) pay a tax equal to the greater of $50,000 or the highest corporate tax rate multiplied by the net income from the nonqualifying assets during the period in which we failed to satisfy the asset tests.
We believe that the assets that we will hold will satisfy the foregoing asset test requirements. However, we will not obtain independent appraisals to support our conclusions as to the value of our assets and securities, or the real estate collateral for the mortgage or mezzanine loans that support our investments. Moreover, the values of some assets may not be susceptible to a precise determination. As a result, there can be no assurance that the IRS will not contend that our ownership of securities and other assets violates one or more of the asset tests applicable to REITs.
Distribution Requirements
Each taxable year, we must distribute dividends, other than capital gain dividends and deemed distributions of retained capital gain, to our stockholders in an aggregate amount at least equal to:
| § | the sum of |
| – | 90% of our “REIT taxable income,” computed without regard to the dividends paid deduction and our net capital gain or loss; and | |
| – | 90% of our after-tax net income, if any, from foreclosure property, minus |
| § | the excess of the sum of certain items of non-cash income over 5% of our “REIT taxable income.” |
We must pay such distributions in the taxable year to which they relate, or in the following taxable year if either (a) we declare the distribution before we timely file our federal income tax return for the year and pay the distribution on or before the first regular dividend payment date after such declaration or (b) we declare the distribution in October, November or December of the taxable year, payable to stockholders of record on a specified day in any such month, and we actually pay the dividend before the end of January of the following year. The distributions under clause (a) are taxable to the stockholders in the year in which paid, and the distributions in clause (b) are treated as paid on December 31st of the prior taxable year. In both instances, these distributions relate to our prior taxable year for purposes of the 90% distribution requirement.
We will pay federal income tax on taxable income, including net capital gain, that we do not distribute to stockholders. Furthermore, if we fail to distribute during a calendar year, or by the end of January following the calendar year in the case of distributions with declaration and record dates falling in the last three months of the calendar year, at least the sum of:
| § | 85% of our REIT ordinary income for such year, | |
| § | 95% of our REIT capital gain income for such year, and | |
| § | any undistributed taxable income from prior periods, |
155
we will incur a 4% nondeductible excise tax on the excess of such required distribution over the amounts we actually distribute.
We may elect to retain and pay income tax on the net long-term capital gain we receive in a taxable year. If we so elect, we will be treated as having distributed any such retained amount for purposes of the 4% nondeductible excise tax described above. We intend to make timely distributions sufficient to satisfy the annual distribution requirements and to avoid corporate income tax and the 4% nondeductible excise tax.
It is possible that, from time to time, we may experience timing differences between the actual receipt of income and actual payment of deductible expenses and the inclusion of that income and deduction of such expenses in arriving at our REIT taxable income. For example, we may not deduct recognized capital losses from our “REIT taxable income.” Further, it is possible that, from time to time, we may be allocated a share of net capital gain attributable to the sale of depreciated property that exceeds our allocable share of cash attributable to that sale. As a result of the foregoing, we may have less cash than is necessary to distribute taxable income sufficient to avoid corporate income tax and the excise tax imposed on certain undistributed income or even to meet the 90% distribution requirement. In such a situation, we may need to borrow funds or, if possible, pay taxable dividends of our stock or debt securities.
Pursuant to IRS Revenue Procedure 2010-12, the IRS has indicated that it will treat distributions from publicly traded REITs that are paid partly in cash and partly in stock as dividends that would satisfy the REIT annual distribution requirements and qualify for the dividends paid deduction for federal income tax purposes. In order to qualify for such treatment, IRS Revenue Procedure 2010-12 requires that at least 10% of the total distribution be payable in cash and that each stockholder have a right to elect to receive its entire distribution in cash. If too many stockholders elect to receive cash, each stockholder electing to receive cash must receive a proportionate share of the cash to be distributed (although no stockholder electing to receive cash may receive less than 10% of such stockholder’s distribution in cash). IRS Revenue Procedure 2010-12 applies to distributions declared on or before December 31, 2012 with respect to taxable years ending on or before December 31, 2011. We have no current intention of paying dividends in stock.
Under certain circumstances, we may be able to correct a failure to meet the distribution requirement for a year by paying “deficiency dividends” to our stockholders in a later year. We may include such deficiency dividends in our deduction for dividends paid for the earlier year. Although we may be able to avoid income tax on amounts distributed as deficiency dividends, we will be required to pay interest to the IRS based upon the amount of any deduction we take for deficiency dividends.
Recordkeeping Requirements
We must maintain certain records in order to qualify as a REIT. In addition, to avoid a monetary penalty, we must request on an annual basis information from our stockholders designed to disclose the actual ownership of our outstanding stock. We intend to comply with these requirements.
Failure to Qualify
If we fail to satisfy one or more requirements for REIT qualification, other than the gross income tests and the asset tests (for which the cure provisions are described above), we could avoid disqualification if our failure is due to reasonable cause and not to willful neglect and we pay a penalty of $50,000 for each such failure. In addition, there are relief provisions for a failure of the gross income tests and asset tests, as described in “—Gross Income Tests” and “—Asset Tests.”
If we fail to qualify as a REIT in any taxable year, and no relief provision applies, we would be subject to federal income tax and any applicable alternative minimum tax on our taxable income at regular corporate rates. In calculating our taxable income in a year in which we fail to qualify as a REIT, we would not be able to deduct amounts paid out to stockholders. In fact, we would not be required to distribute any amounts to stockholders in that year. In such event, to the extent of our current and accumulated earnings and profits, all distributions to stockholders would be taxable as dividend income. Subject to certain limitations, corporate stockholders might be eligible for the dividends received deduction and stockholders taxed at individual rates may be eligible for the reduced federal income tax rate of 15% through 2010 on such dividends. Unless we qualified for relief under specific statutory provisions, we also would be disqualified from
156
taxation as a REIT for the four taxable years following the year during which we ceased to qualify as a REIT. We cannot predict whether in all circumstances we would qualify for such statutory relief.
Taxation of Taxable U.S. Stockholders
As used herein, the term “U.S. stockholder” means a holder of shares of our common stock that for federal income tax purposes is:
| § | a citizen or resident of the United States; | |
| § | a corporation (including an entity treated as a corporation for federal income tax purposes) created or organized in or under the laws of the United States, any of its states or the District of Columbia; | |
| § | an estate whose income is subject to federal income taxation regardless of its source; or | |
| § | any trust if (1) a U.S. court is able to exercise primary supervision over the administration of such trust and one or more U.S. persons have the authority to control all substantial decisions of the trust or (2) it has a valid election in place to be treated as a U.S. person. |
If a partnership, entity or arrangement treated as a partnership for federal income tax purposes holds shares of our common stock, the federal income tax treatment of a partner in the partnership will generally depend on the status of the partner and the activities of the partnership. If you are a partner in a partnership holding shares of our common stock, you are urged to consult your tax advisor regarding the consequences of the ownership and disposition of our common stock by the partnership.
As long as we qualify as a REIT, a taxable U.S. stockholder must generally take into account as ordinary income distributions made out of our current or accumulated earnings and profits that we do not designate as capital gain dividends or retained long-term capital gain. A U.S. stockholder will not qualify for the dividends received deduction generally available to corporations. In addition, dividends paid to a U.S. stockholder generally will not qualify for the 15% tax rate for “qualified dividend income.” The maximum tax rate for qualified dividend income received by U.S. stockholders taxed at individual rates is 15% through 2010. The maximum tax rate on qualified dividend income is lower than the maximum tax rate on ordinary income, which is currently 35%. Qualified dividend income generally includes dividends paid to U.S. stockholders taxed at individual rates by domestic C corporations and certain qualified foreign corporations. Because we are not generally subject to federal income tax on the portion of our REIT taxable income distributed to our stockholders (see “—Taxation of Our Company” above), our dividends generally will not be eligible for the 15% rate on qualified dividend income. As a result, our ordinary REIT dividends will be taxed at the higher tax rate applicable to ordinary income. However, the 15% tax rate for qualified dividend income will apply to our ordinary REIT dividends (i) attributable to dividends received by us from non-REIT corporations, such as our TRS lessees, and (ii) to the extent attributable to income upon which we have paid corporate income tax (e.g., to the extent that we distribute less than 100% of our taxable income). In general, to qualify for the reduced tax rate on qualified dividend income, a U.S. stockholder must hold our common stock for more than 60 days during the 121-day period beginning on the date that is 60 days before the date on which our common stock becomes ex-dividend.
A U.S. stockholder generally will take into account as long-term capital gain any distributions that we designate as capital gain dividends without regard to the period for which the U.S. stockholder has held our common stock. We generally will designate our capital gain dividends as either 15% or 25% rate distributions. See “—Capital Gains and Losses.” A corporate U.S. stockholder, however, may be required to treat up to 20% of certain capital gain dividends as ordinary income.
We may elect to retain and pay income tax on the net long-term capital gain that we receive in a taxable year. In that case, to the extent that we designate such amount in a timely notice to such stockholder, a U.S. stockholder would be taxed on its proportionate share of our undistributed long-term capital gain. The U.S. stockholder would receive a credit for its proportionate share of the tax we paid. The U.S. stockholder would increase the basis in its common stock by the amount of its proportionate share of our undistributed long-term capital gain, minus its share of the tax we paid.
A U.S. stockholder will not incur tax on a distribution in excess of our current and accumulated earnings and profits if the distribution does not exceed the adjusted basis of the U.S. stockholder’s common stock. Instead, the distribution will reduce the adjusted basis of such shares of common stock. A U.S. stockholder will recognize a distribution in excess of
157
both our current and accumulated earnings and profits and the U.S. stockholder’s adjusted basis in his or her common stock as long-term capital gain, or short-term capital gain if the common stock has been held for one year or less, assuming the common stock is a capital asset in the hands of the U.S. stockholder. In addition, if we declare a distribution in October, November, or December of any year that is payable to a U.S. stockholder of record on a specified date in any such month, such distribution shall be treated as both paid by us and received by the U.S. stockholder on December 31 of such year, provided that we actually pay the distribution during January of the following calendar year.
Stockholders may not include in their individual income tax returns any of our net operating losses or capital losses. Instead, these losses are generally carried over by us for potential offset against our future income. Taxable distributions from us and gain from the disposition of our common stock will not be treated as passive activity income and, therefore, stockholders generally will not be able to apply any “passive activity losses,” such as losses from certain types of limited partnerships in which the stockholder is a limited partner, against such income. In addition, taxable distributions from us and gain from the disposition of our common stock generally will be treated as investment income for purposes of the investment interest limitations. We will notify stockholders after the close of our taxable year as to the portions of the distributions attributable to that year that constitute ordinary income, return of capital and capital gain.
For taxable years beginning after December 31, 2012, certain U.S. stockholders who are individuals, estates or trusts and whose income exceeds certain thresholds will be required to pay a 3.8% Medicare tax. The Medicare tax will apply to, among other things, dividends and other income derived from certain trades or business and net gains from the sale or other disposition of property subject to certain exceptions. Our dividends generally will be subject to the Medicare tax.
Taxation of U.S. Stockholders on the Disposition of Common Stock
A U.S. stockholder who is not a dealer in securities must generally treat any gain or loss realized upon a taxable disposition of our common stock as long-term capital gain or loss if the U.S. stockholder has held our common stock for more than one year and otherwise as short-term capital gain or loss. In general, a U.S. stockholder will realize gain or loss in an amount equal to the difference between the sum of the fair market value of any property and the amount of cash received in such disposition and the U.S. stockholder’s adjusted tax basis. A stockholder’s adjusted tax basis generally will equal the U.S. stockholder’s acquisition cost, increased by the excess of net capital gains deemed distributed to the U.S. stockholder (discussed above) less tax deemed paid on such gains and reduced by any returns of capital. However, a U.S. stockholder must treat any loss upon a sale or exchange of common stock held by such stockholder for six months or less as a long-term capital loss to the extent of capital gain dividends and any other actual or deemed distributions from us that such U.S. stockholder treats as long-term capital gain. All or a portion of any loss that a U.S. stockholder realizes upon a taxable disposition of our common stock may be disallowed if the U.S. stockholder purchases other common stock within 30 days before or after the disposition.
Capital Gains and Losses
A taxpayer generally must hold a capital asset for more than one year for gain or loss derived from its sale or exchange to be treated as long-term capital gain or loss. The highest marginal individual income tax rate currently is 35% (which rate, absent additional congressional action, will apply until December 31, 2010). The maximum tax rate on long-term capital gain applicable to taxpayers taxed at individual rates is 15% for sales and exchanges of assets held for more than one year occurring through December 31, 2010. The maximum tax rate on long-term capital gain from the sale or exchange of “Section 1250 property,” or depreciable real property, is 25%, which applies to the lesser of the total amount of the gain or the accumulated depreciation on the Section 1250 property. For taxable years beginning after December 31, 2012, certain U.S. stockholders who are individuals, estates or trusts and whose income exceeds certain thresholds will be required to pay a 3.8% Medicare tax on net gains from the sale or other disposition of property, such as our common stock, subject to certain exceptions.
With respect to distributions that we designate as capital gain dividends and any retained capital gain that we are deemed to distribute, we generally may designate whether such a distribution is taxable to our stockholders taxed at individual rates at a 15% or 25% rate. Thus, the tax rate differential between capital gain and ordinary income for those taxpayers may be significant. In addition, the characterization of income as capital gain or ordinary income may affect the deductibility of capital losses. A non-corporate taxpayer may deduct capital losses not offset by capital gains against its ordinary income only up to a maximum annual amount of $3,000. A non-corporate taxpayer may carry forward unused
158
capital losses indefinitely. A corporate taxpayer must pay tax on its net capital gain at ordinary corporate rates. A corporate taxpayer may deduct capital losses only to the extent of capital gains, with unused losses being carried back three years and forward five years.
Taxation of Tax-Exempt Stockholders
Tax-exempt entities, including qualified employee pension and profit sharing trusts and individual retirement accounts, generally are exempt from federal income taxation. However, they are subject to taxation on their unrelated business taxable income, or UBTI. Although many investments in real estate generate UBTI, the IRS has issued a ruling that dividend distributions from a REIT to an exempt employee pension trust do not constitute UBTI so long as the exempt employee pension trust does not otherwise use the shares of the REIT in an unrelated trade or business of the pension trust. Based on that ruling, amounts that we distribute to tax-exempt stockholders generally should not constitute UBTI. However, if a tax-exempt stockholder were to finance its acquisition of common stock with debt, a portion of the income that it receives from us would constitute UBTI pursuant to the “debt-financed property” rules. Moreover, social clubs, voluntary employee benefit associations, supplemental unemployment benefit trusts and qualified group legal services plans that are exempt from taxation under special provisions of the federal income tax laws are subject to different UBTI rules, which generally will require them to characterize distributions that they receive from us as UBTI. Finally, in certain circumstances, a qualified employee pension or profit sharing trust that owns more than 10% of our stock must treat a percentage of the dividends that it receives from us as UBTI. Such percentage is equal to the gross income we derive from an unrelated trade or business, determined as if we were a pension trust, divided by our total gross income for the year in which we pay the dividends. That rule applies to a pension trust holding more than 10% of our stock only if:
| § | the percentage of our dividends that the tax-exempt trust must treat as UBTI is at least 5%; | |
| § | we qualify as a REIT by reason of the modification of the rule requiring that no more than 50% of our stock be owned by five or fewer individuals that allows the beneficiaries of the pension trust to be treated as holding our stock in proportion to their actuarial interests in the pension trust; and | |
| § | either: |
| – | one pension trust owns more than 25% of the value of our stock; or | |
| – | a group of pension trusts individually holding more than 10% of the value of our stock collectively owns more than 50% of the value of our stock. |
Taxation of Non-U.S. Stockholders
The term “non-U.S. stockholder” means a holder of our common stock that is not a U.S. stockholder or a partnership (or entity treated as a partnership for federal income tax purposes). The rules governing federal income taxation of nonresident alien individuals, foreign corporations, foreign partnerships, and other foreign stockholders are complex. This section is only a summary of such rules. We urge non-U.S. stockholders to consult their own tax advisors to determine the impact of federal, state, and local income tax laws on the purchase, ownership and sale of our common stock, including any reporting requirements.
A non-U.S. stockholder that receives a distribution that is not attributable to gain from our sale or exchange of a “United States real property interest,” or USRPI, as defined below, and that we do not designate as a capital gain dividend or retained capital gain will recognize ordinary income to the extent that we pay such distribution out of our current or accumulated earnings and profits. A withholding tax equal to 30% of the gross amount of the distribution ordinarily will apply to such distribution unless an applicable tax treaty reduces or eliminates the tax. However, if a distribution is treated as effectively connected with the non-U.S. stockholder’s conduct of a U.S. trade or business (conducted through a U.S. permanent establishment, where applicable), the non-U.S. stockholder generally will be subject to federal income tax on the distribution at graduated rates, in the same manner as U.S. stockholders are taxed with respect to such distribution, and a non-U.S. stockholder that is a corporation also may be subject to the 30% branch profits tax with respect to that distribution. Except with respect to certain distributions attributable to the sale of USRPIs described below, we plan to
159
withhold U.S. income tax at the rate of 30% on the gross amount of any such distribution paid to a non-U.S. stockholder unless either:
| § | a lower treaty rate applies and the non-U.S. stockholder files an IRS Form W-8BEN evidencing eligibility for that reduced rate with us; or | |
| § | the non-U.S. stockholder files an IRS Form W-8ECI with us claiming that the distribution is effectively connected income. |
A non-U.S. stockholder will not incur tax on a distribution in excess of our current and accumulated earnings and profits if the excess portion of such distribution does not exceed the adjusted basis of its common stock. Instead, the excess portion of such distribution will reduce the adjusted basis of that common stock. A non-U.S. stockholder will be subject to tax on a distribution that exceeds both our current and accumulated earnings and profits and the adjusted basis of its common stock, if the non-U.S. stockholder otherwise would be subject to tax on gain from the sale or disposition of its common stock, as described below. Because we generally cannot determine at the time we make a distribution whether the distribution will exceed our current and accumulated earnings and profits, we normally will withhold tax on the entire amount of any distribution at the same rate as we would withhold on a dividend. However, a non-U.S. stockholder may claim a refund of amounts that we withhold if we later determine that a distribution in fact exceeded our current and accumulated earnings and profits. We must withhold 10% of any distribution that exceeds our current and accumulated earnings and profits. Consequently, although we intend to withhold at a rate of 30% on the entire amount of any distribution, to the extent that we do not do so, we will withhold at a rate of 10% on any portion of a distribution not subject to withholding at a rate of 30%.
For payments made after December 31, 2012, non-U.S. stockholders will be subject to U.S. withholding tax at a rate of 30% on our distributions and gain from the sale of our common stock, if certain disclosure requirements related to U.S. ownership are not satisfied. If payment of withholding taxes is required, non-U.S. stockholders that are otherwise eligible for an exemption from, or reduction of, U.S. withholding taxes with respect to such distributions and proceeds will be required to seek a refund from the IRS to obtain the benefit or such exemption or reduction.
For any year in which we qualify as a REIT, a non-U.S. stockholder will incur tax on distributions that are attributable to gain from our sale or exchange of a USRPI under the Foreign Investment in Real Property Act of 1980, or FIRPTA. A USRPI includes certain interests in real property and stock in certain corporations at least 50% of whose assets consist of USRPIs. Under FIRPTA, a non-U.S. stockholder is taxed on distributions attributable to gain from sales of USRPIs as if such gain were effectively connected with a U.S. business of the non-U.S. stockholder. A non-U.S. stockholder thus would be taxed on such a distribution at the normal capital gains rates applicable to U.S. stockholders, subject to applicable alternative minimum tax and a special alternative minimum tax in the case of a nonresident alien individual. A non-U.S. corporate stockholder not entitled to treaty relief or exemption also may be subject to the 30% branch profits tax on such a distribution. We would be required to withhold 35% of any distribution that we could designate as a capital gain dividend. A non-U.S. stockholder may receive a credit against its tax liability for the amount we withhold.
However, if our common stock is regularly traded on an established securities market in the United States, capital gain distributions on our common stock that are attributable to our sale of real property will be treated as ordinary dividends rather than as gain from the sale of a USRPI, as long as the non-U.S. stockholder did not own more than 5% of our common stock at any time during the one-year period preceding the distribution. As a result, non-U.S. stockholders generally will be subject to withholding tax on such capital gain distributions in the same manner as they are subject to withholding tax on ordinary dividends. We anticipate that our common stock will be regularly traded on an established securities market in the United States following this offering. If our common stock is not regularly traded on an established securities market in the United States or the non-U.S. stockholder owned more than 5% of our common stock at any time during the one-year period preceding the distribution, capital gain distributions that are attributable to our sale of real property would be subject to tax under FIRPTA, as described in the preceding paragraph. Moreover, if a non-U.S. stockholder disposes of our common stock during the 30-day period preceding the ex-dividend date of a dividend, and such non-U.S. stockholder (or a person related to such non-U.S. stockholder) acquires or enters into a contract or option to acquire our common stock within 61 days of the first day of the 30-day period described above, and any portion of such dividend payment would, but for the disposition, be treated as a USRPI capital gain to such non-U.S. stockholder, then such non-U.S. stockholder shall be treated as having USRPI capital gain in an amount that, but for the disposition, would have been treated as USRPI capital gain.
160
Although the law is not clear on the matter, it appears that amounts we designate as retained capital gains in respect of the common stock held by U.S. stockholders generally should be treated with respect to non-U.S. stockholders in the same manner as actual distributions by us of capital gain dividends. Under this approach, a non-U.S. stockholder would be able to offset as a credit against its federal income tax liability resulting from its proportionate share of the tax paid by us on such retained capital gains, and to receive from the IRS a refund to the extent of the non-U.S. stockholder’s proportionate share of such tax paid by us exceeds its actual federal income tax liability, provided that the non-U.S. stockholder furnishes required information to the IRS on a timely basis.
Non-U.S. stockholders could incur tax under FIRPTA with respect to gain realized upon a disposition of our common stock if we are a United States real property holding corporation during a specified testing period. If at least 50% of a REIT’s assets are USRPIs, then the REIT will be a United States real property holding corporation. We anticipate that we will be a United States real property holding corporation based on our investment strategy. However, if we are a United States real property holding corporation, a non-U.S. stockholder generally would not incur tax under FIRPTA on gain from the sale of our common stock if we are a “domestically controlled qualified investment entity.” A domestically controlled qualified investment entity includes a REIT in which, at all times during a specified testing period, less than 50% in value of its stock is held directly or indirectly by non-U.S. stockholders. We cannot assure you that this test will be met. If our common stock are regularly traded on an established securities market, an additional exception to the tax under FIRPTA will be available with respect to our common stock, even if we do not qualify as a domestically controlled qualified investment entity at the time the non-U.S. stockholder sells our common stock. Under that exception, the gain from such a sale by such a non-U.S. stockholder will not be subject to tax under FIRPTA if:
| § | our common stock is treated as being regularly traded under applicable Treasury regulations on an established securities market; and | |
| § | the non-U.S. stockholder owned, actually or constructively, 5% or less of our common stock at all times during a specified testing period. |
As noted above, we anticipate that our common stock will be regularly traded on an established securities market following this offering.
If the gain on the sale of our common stock were taxed under FIRPTA, a non-U.S. stockholder would be taxed on that gain in the same manner as U.S. stockholders, subject to applicable alternative minimum tax and a special alternative minimum tax in the case of nonresident alien individuals. Furthermore, a non-U.S. stockholder generally will incur tax on gain not subject to FIRPTA if:
| § | the gain is effectively connected with the non-U.S. stockholder’s U.S. trade or business, in which case the non-U.S. stockholder will be subject to the same treatment as U.S. stockholders with respect to such gain; or | |
| § | the non-U.S. stockholder is a nonresident alien individual who was present in the U.S. for 183 days or more during the taxable year and has a “tax home” in the United States, in which case the non-U.S. stockholder will incur a 30% tax on his or her capital gains. |
Information Reporting Requirements and Withholding
We will report to our stockholders and to the IRS the amount of distributions we pay during each calendar year, and the amount of tax we withhold, if any. Under the backup withholding rules, a stockholder may be subject to backup withholding at a rate of 28% with respect to distributions unless the holder:
| § | is a corporation (for payments made prior to January 1, 2011) or qualifies for certain other exempt categories and, when required, demonstrates this fact; or | |
| § | provides a taxpayer identification number, certifies as to no loss of exemption from backup withholding, and otherwise complies with the applicable requirements of the backup withholding rules. |
A stockholder who does not provide us with its correct taxpayer identification number also may be subject to penalties imposed by the IRS. Any amount paid as backup withholding will be creditable against the stockholder’s income tax liability. U.S. stockholders that hold our common stock through foreign accounts or intermediaries will be subject to U.S. withholding tax at a rate of 30% on dividends and proceeds of sale of our common stock paid after December 31,
161
2012 if certain disclosure requirements related to U.S. accounts are not satisfied. In addition, we may be required to withhold a portion of capital gain distributions to any stockholders who fail to certify their non-foreign status to us.
Backup withholding will generally not apply to payments of dividends made by us or our paying agents, in their capacities as such, to a non-U.S. stockholder provided that the non-U.S. stockholder furnishes to us or our paying agent the required certification as to its non-U.S. status, such as providing a valid IRS Form W-8BEN or W-8ECI, or certain other requirements are met. Notwithstanding the foregoing, backup withholding may apply if either we or our paying agent has actual knowledge, or reason to know, that the holder is a U.S. person that is not an exempt recipient. Payments of the net proceeds from a disposition or a redemption effected outside the U.S. by a non-U.S. stockholder made by or through a foreign office of a broker generally will not be subject to information reporting or backup withholding. However, information reporting (but not backup withholding) generally will apply to such a payment if the broker has certain connections with the U.S. unless the broker has documentary evidence in its records that the beneficial owner is a non-U.S. stockholder and specified conditions are met or an exemption is otherwise established. Payment of the net proceeds from a disposition by a non-U.S. stockholder of common stock made by or through the U.S. office of a broker is generally subject to information reporting and backup withholding unless the non-U.S. stockholder certifies under penalties of perjury that it is not a U.S. person and satisfies certain other requirements, or otherwise establishes an exemption from information reporting and backup withholding.
Backup withholding is not an additional tax. Any amounts withheld under the backup withholding rules may be refunded or credited against the stockholder’s federal income tax liability if certain required information is furnished to the IRS. Stockholders are urged consult their own tax advisors regarding application of backup withholding to them and the availability of, and procedure for obtaining an exemption from, backup withholding.
Other Tax Consequences
Tax Aspects of Our Investments in Our Operating Partnership and Subsidiary Partnerships
Substantially all of our investments are owned indirectly through our operating partnership, which will own the hotel properties either directly or through certain subsidiaries. The following discussion summarizes certain federal income tax considerations applicable to our direct or indirect investments in our operating partnership and any subsidiary partnerships or limited liability companies that we form or acquire (each individually a “Partnership” and, collectively, the “Partnerships”). The discussion does not cover state or local tax laws or any federal tax laws other than income tax laws.
Classification as Partnerships. We will be entitled to include in our income our distributive share of each Partnership’s income and to deduct our distributive share of each Partnership’s losses only if such Partnership is classified for federal income tax purposes as a partnership (or an entity that is disregarded for federal income tax purposes if the entity has only one owner or member) rather than as a corporation or an association taxable as a corporation. An unincorporated entity with at least two owners or members will be classified as a partnership, rather than as a corporation, for federal income tax purposes if it:
| § | is treated as a partnership under the Treasury regulations relating to entity classification (the “check-the-box regulations”); and | |
| § | is not a “publicly traded” partnership. |
Under the check-the-box regulations, an unincorporated entity with at least two owners or members may elect to be classified either as an association taxable as a corporation or as a partnership. If such an entity fails to make an election, it generally will be treated as a partnership (or an entity that is disregarded for federal income tax purposes if the entity has only one owner or member) for federal income tax purposes. Each Partnership intends to be classified as a partnership for federal income tax purposes, and no Partnership will elect to be treated as an association taxable as a corporation under the check-the-box regulations.
Although Hunton & Williams LLP is of the opinion that our operating partnership will be treated as a partnership, and not an association or publicly traded partnership taxable as a corporation, for federal income tax purposes. Investors should be aware, however, that advice of counsel is not binding upon the IRS, or any court. Therefore, no assurances can be given that our operating partnership will be treated as a partnership for federal income tax purposes. A publicly traded partnership is a partnership whose interests are traded on an established securities market or are readily tradable on a
162
secondary market or the substantial equivalent thereof. There is a risk that the right of a holder of OP units to redeem the units for our common stock could cause the OP units to be considered readily tradable on the substantial equivalent of a secondary market. A publicly traded partnership will not, however, be treated as a corporation for any taxable year if, for each taxable year beginning after December 31, 1987 in which it was classified as a publicly traded partnership, 90% or more of the partnership’s gross income for such year consists of certain passive-type income, including real property rents, gains from the sale or other disposition of real property, interest, and dividends (the “90% passive income exception”). Treasury regulations (the “PTP regulations”) provide limited safe harbors from the definition of a publicly traded partnership. Pursuant to one of those safe harbors (the “private placement exception”), interests in a partnership will not be treated as readily tradable on a secondary market or a substantial equivalent thereof if (1) all interests in the partnership were issued in a transaction or transactions that were not required to be registered under the Securities Act and (2) the partnership does not have more than 100 partners at any time during the partnership’s taxable years. Pursuant to another safe harbor (the “limited trading exception”), interests in a partnership will not be treated as readily traded on a secondary market or a substantial equivalent thereof if the sum of the percentage interests in the partnership capital or profits transferred during the taxable year of the partnership does not exceed two percent of the total interests in the partnership capital or profits, excluding certain “private transfers” and transfers made under certain redemption or repurchase agreements.
For tax purposes, our operating partnership will be treated as a continuation of our predecessor. We believe our predecessor has qualified for the limited trading exception in each of its prior taxable years, but has not qualified for the 90% passive income exception because its income primarily arose from the active business of operating hotels. During its 2010 taxable year, we anticipate that our operating partnership will qualify for the limited trading exception unless the IRS successfully contends that the payment of certain accrued and unpaid priority distributions on our predecessor’s Class A and Class A-1 membership interests in connection with the formation transactions is recharacterized as a “disguised sale” for federal income tax purposes. Although we have been advised by counsel that the payment of the accrued and unpaid priority returns in connection with the formation transactions should not be a “disguised sale,” no assurance can be given that the IRS will not successfully challenge that position, in which case we would not satisfy the limited trading exceptions. If treated as a publicly traded partnership, our operating partnership will not qualify for the 90% passive income exception during its 2010 taxable year because of the active hotel business income our predecessor earned in 2010 prior to the closing of this offering. However, during our operating partnership’s 2010 taxable year, no OP unit holder will be eligible to redeem OP units for cash or, at our election, our common stock. See “—Shares Eligible For Future Sale—Redemption/Exchange Rights.” Accordingly, even if our operating partnership does not qualify for the limited trading exception, we believe that our operating partnership will not be treated as a publicly traded partnership during its 2010 taxable year because interests in our operating partnership will not be readily tradable on a secondary market or the substantial equivalent thereof. Because we believe that our predecessor has not been classified as a publicly traded partnership in prior taxable years and our operating partnership will not be classified as a publicly traded partnership during its 2010 taxable year, we believe that the 90% passive income exception will be available to prevent our operating partnership from being taxed as a corporation should it be classified as a publicly traded partnership in taxable years after 2010. For taxable years after 2010, we believe that our operating partnership will have sufficient qualifying rental income to satisfy the 90% passive income exception and may qualify for the limited trading exception in certain years. We expect that any other Partnership that we form in the future will qualify for the private placement exception
We have not requested, and do not intend to request, a ruling from the IRS that our operating partnership will be classified as a partnership for federal income tax purposes. If for any reason our operating partnership were taxable as a corporation, rather than as a partnership, for federal income tax purposes, most, if not all, of the tax consequences described herein would be inapplicable. In particular, we would not qualify as a REIT unless we qualified for certain relief provisions, because the value of our ownership interest in our operating partnership would exceed 5% of our assets and we would be considered to hold more than 10% of the voting securities (and more than 10% of the value of the outstanding securities) of another corporation. See “—Gross Income Tests” and “—Asset Tests.” In addition, any change in our operating partnership’s status for tax purposes might be treated as a taxable event, in which case we might incur tax liability without any related cash distribution. See “—Distribution Requirements.” Further, items of income and deduction of our operating partnership would not pass through to its partners, and its partners would be treated as stockholders for tax purposes. Consequently, our operating partnership would be required to pay income tax at corporate rates on its net income, and distributions to its partners would constitute dividends that would not be deductible in computing our operating partnership’s taxable income.
163
Income Taxation of Partnerships and their Partners
Partners, Not the Partnerships, Subject to Tax. A partnership is not a taxable entity for federal income tax purposes. Rather, we are required to take into account our allocable share of each Partnership’s income, gains, losses, deductions, and credits for any taxable year of such Partnership ending within or with our taxable year, without regard to whether we have received or will receive any distribution from such Partnership.
Partnership Allocations. Although a partnership agreement generally will determine the allocation of income and losses among partners, such allocations will be disregarded for tax purposes if they do not comply with the provisions of the federal income tax laws governing partnership allocations. If an allocation is not recognized for federal income tax purposes, the item subject to the allocation will be reallocated in accordance with the partners’ interests in the partnership, which will be determined by taking into account all of the facts and circumstances relating to the economic arrangement of the partners with respect to such item. Each Partnership’s allocations of taxable income, gain, and loss are intended to comply with the requirements of the federal income tax laws governing partnership allocations.
Tax Allocations With Respect to Our Properties. Income, gain, loss, and deduction attributable to appreciated or depreciated property that is contributed to a partnership in exchange for an interest in the partnership must be allocated in a manner such that the contributing partner is charged with, or benefits from, respectively, the unrealized gain or unrealized loss associated with the property at the time of the contribution. When cash is contributed to a partnership in exchange for a partnership interest, such as our contribution of the proceeds of this offering to our operating partnership for OP units, similar rules apply to ensure that the existing partners in the partnership are charged with, or benefit from, respectively, the unrealized gain or unrealized loss associated with the partnership’s existing properties at the time of the cash contribution. In the case of a contribution of property, the amount of the unrealized gain or unrealized loss (“built-in gain” or “built-in loss”) is generally equal to the difference between the fair market value of the contributed property at the time of contribution and the adjusted tax basis of such property at the time of contribution (a “book-tax difference”). In the case of a contribution of cash, a book-tax difference may be created because the fair market value of the properties of the partnership on the date of the cash contribution may be higher or lower than the partnership’s adjusted tax basis in those properties. Any property purchased for cash initially will have an adjusted tax basis equal to its fair market value, resulting in no book-tax difference.
The contribution of the cash proceeds of this offering to our operating partnership is expected to create a book-tax difference. Furthermore, our operating partnership may admit partners in the future in exchange for a contribution of appreciated or depreciated property, resulting in book-tax differences and our operating partnership will succeed to the book-tax differences with respect to properties contributed to our predecessor. Allocations with respect to book-tax differences are solely for federal income tax purposes and do not affect the book capital accounts or other economic or legal arrangements among the partners. The U.S. Treasury Department has issued regulations requiring partnerships to use a “reasonable method” for allocating items with respect to which there is a book-tax difference and outlining several reasonable allocation methods. Under certain available methods, our operating partnership’s existing tax basis in our initial properties at the time we contribute the cash proceeds of this offering and the carryover basis in the hands of our operating partnership of properties contributed in the future (1) could cause us to be allocated lower amounts of depreciation deductions for tax purposes than would be allocated to us if all our properties were to have a tax basis equal to their fair market value at the time of the contribution of cash or property and (2) in the event of a sale of such properties, could cause us to be allocated taxable gain in excess of the economic or book gain allocated to us as a result of such sale, with a corresponding benefit to the existing or contributing partners, as the case may be. An allocation described in (2) above might cause us to recognize taxable income in excess of cash proceeds in the event of a sale or other disposition of property, which might adversely affect our ability to comply with the REIT distribution requirements and may result in a greater portion of our distributions being taxed as dividends. We have not yet decided what method will be used to account for book-tax differences caused by the contribution of the cash proceeds of this offering to our operating partnership or the future acquisition of properties by our operating partnership.
Basis in Partnership Interest. Our adjusted tax basis in our partnership interest in our operating partnership generally is equal to:
| § | the amount of cash and the basis of any other property contributed by us to our operating partnership; | |
| § | increased by our allocable share of our operating partnership’s income and our allocable share of indebtedness of our operating partnership; and |
164
| § | reduced, but not below zero, by our allocable share of our operating partnership’s loss and the amount of cash distributed to us, and by constructive distributions resulting from a reduction in our share of indebtedness of our operating partnership. |
If the allocation of our distributive share of our operating partnership’s loss would reduce the adjusted tax basis of our partnership interest below zero, the recognition of such loss will be deferred until such time as the recognition of such loss would not reduce our adjusted tax basis below zero. To the extent that our operating partnership’s distributions, or any decrease in our share of the indebtedness of our operating partnership, which is considered a constructive cash distribution to the partners, reduce our adjusted tax basis below zero, such distributions will constitute taxable income to us. Such distributions and constructive distributions normally will be characterized as long-term capital gain.
Depreciation Deductions Available to Our Operating Partnership. Our operating partnership’s tax basis in our initial properties will generally not be affected by the formation transactions and this offering. However, if the IRS successfully contends that the payment of certain accrued and unpaid priority returns on our predecessor’s Class A and Class A-1 membership interests in connection with the formation transactions is recharacterized as a “disguised sale” for federal income tax purposes, our basis in our operating partnership’s assets may be adjusted to account for the difference between the deemed purchase price of the interests we are treated as acquiring in the “disguised sale” and the proportionate share of our operating partnership’s basis in the assets that is attributable to such interests. Such adjustments will only impact tax allocations made to us. To the extent that our operating partnership acquires its hotels in exchange for cash, its initial basis in such hotels for federal income tax purposes generally was or will be equal to the purchase price paid by our operating partnership. Our operating partnership’s initial basis in hotels acquired in exchange for units in our operating partnership should be the same as the transferor’s basis in such hotels on the date of acquisition by our operating partnership. Although the law is not entirely clear, our operating partnership generally will depreciate such depreciable hotel property for federal income tax purposes over the same remaining useful lives and under the same methods used by the transferors. Our operating partnership’s tax depreciation deductions will be allocated among the partners in accordance with their respective interests in our operating partnership, except to the extent that our operating partnership is required under the federal income tax laws governing partnership allocations to use a method for allocating tax depreciation deductions that are attributable either to (1) properties held by our operating partnership at the time we contribute the cash proceeds of this offering to our operating partnership in exchange for OP units (except to the extent of the portion of the properties attributable to membership interests in our predecessor that we are treated as acquiring with the cash proceeds of the offering) or (2) properties contributed to our operating partnership in the future in exchange for OP units. Those special allocations could result in our receiving a disproportionate share of such deductions.
Sale of a Partnership’s Property
Generally, any gain realized by a Partnership on the sale of property held by the Partnership for more than one year will be long-term capital gain, except for any portion of such gain that is treated as depreciation or cost recovery recapture. Any gain or loss recognized by a Partnership on the disposition of contributed properties will be allocated first to the partners of the Partnership who contributed such properties to the extent of their built-in gain or loss on those properties for federal income tax purposes. The partners’ built-in gain or loss on such contributed properties will equal the difference between the partners’ proportionate share of the book value of those properties and the partners’ tax basis allocable to those properties at the time of the contribution, subject to certain adjustments. Any remaining gain or loss recognized by the Partnership on the disposition of the contributed properties, and any gain or loss recognized by the Partnership on the disposition of the other properties, will be allocated among the partners in accordance with their respective percentage interests in the Partnership.
Our share of any gain realized by a Partnership on the sale of any property held by the Partnership as inventory or other property held primarily for sale to customers in the ordinary course of the Partnership’s trade or business will be treated as income from a prohibited transaction that is subject to a 100% penalty tax. Such prohibited transaction income also may have an adverse effect upon our ability to satisfy the income tests for REIT status. See “—Gross Income Tests.” We do not presently intend to acquire or hold or to allow any Partnership to acquire or hold any property that represents inventory or other property held primarily for sale to customers in the ordinary course of our or such Partnership’s trade or business.
165
Sunset of Reduced Tax Rate Provisions
Several of the tax considerations described herein are subject to a sunset provision. The sunset provisions generally provide that for taxable years beginning after December 31, 2010, certain provisions that are currently in the Code will revert back to a prior version of those provisions. These provisions include provisions related to the reduced maximum income tax rate for long-term capital gains of 15% (rather than 20%) for taxpayers taxed at individual rates, the application of the 15% tax rate to qualified dividend income, and certain other tax rate provisions described herein. The impact of this reversion is not discussed herein. Consequently, prospective stockholders are urged to consult their own tax advisors regarding the effect of sunset provisions on an investment in our common stock.
State, Local and Foreign Taxes
We and/or you may be subject to taxation by various states, localities and foreign jurisdictions, including those in which we or a stockholder transacts business, owns property or resides. The state, local and foreign tax treatment may differ from the federal income tax treatment described above. Consequently, you are urged to consult your own tax advisors regarding the effect of state, local and foreign tax laws upon an investment in our common stock.
166
ERISA Considerations
A fiduciary of a pension, profit sharing, retirement or other employee benefit plan, or plan, subject to the Employee Retirement Income Security Act of 1974, as amended, or ERISA, should consider the fiduciary standards under ERISA in the context of the plan’s particular circumstances before authorizing an investment of a portion of that plan’s assets in the shares of common stock. Accordingly, the fiduciary should consider (i) whether the investment satisfies the diversification requirements of Section 404(a)(1)(C) of ERISA, (ii) whether the investment is in accordance with the documents and instruments governing the plan as required by Section 404(a)(1)(D) of ERISA and (iii) whether the investment is prudent under ERISA. In addition to the imposition of general fiduciary standards of investment prudence and diversification, ERISA, and the corresponding provisions of the Code, prohibit a wide range of transactions involving the assets of the plan and persons who have certain specified relationships to the plan (“parties in interest” within the meaning of ERISA, “disqualified persons” within the meaning of the Code). Thus, a plan fiduciary considering an investment in our shares of common stock also should consider whether the acquisition or the continued holding of the shares might constitute or give rise to a direct or indirect prohibited transaction that is not subject to an exemption issued by the Department of Labor, or the DOL. Similar restrictions apply to many governmental and foreign plans which are not subject to ERISA. Thus, those considering investing in the shares on behalf of these plans should consider whether the acquisition or the continued holding of the shares might violate any similar restrictions.
The DOL has issued final regulations, or the DOL Regulations, as to what constitutes assets of an employee benefit plan under ERISA. Under the DOL Regulations, if a plan acquires an equity interest in an entity, which interest is neither a “publicly offered security” nor a security issued by an investment company registered under the 1940 Act, the plan’s assets would include, for purposes of the fiduciary responsibility provision of ERISA, both the equity interest and an undivided interest in each of the entity’s underlying assets unless certain specified exceptions apply. The DOL Regulations define a publicly offered security as a security that is “widely held,” “freely transferable” and either part of a class of securities registered under the Exchange Act, or sold pursuant to an effective registration statement under the Securities Act (provided the securities are registered under the Exchange Act within 120 days after the end of the fiscal year of the issuer during which the public offering occurred). The shares are being sold in an offering registered under the Securities Act and will be registered under the Exchange Act.
The DOL Regulations provide that a security is “widely held” only if it is part of a class of securities that is owned by 100 or more investors independent of the issuer and of one another. A security will not fail to be “widely held” because the number of independent investors falls below 100 subsequent to the IPO as a result of events beyond the issuer’s control. We expect our shares of common stock to be “widely held” upon completion of this offering.
The DOL Regulations provide that whether a security is “freely transferable” is a factual question to be determined on the basis of all relevant facts and circumstances. The DOL Regulations further provide that when a security is part of an offering in which the minimum investment is $10,000 or less, as is the case with this offering, certain restrictions ordinarily will not, alone or in combination, affect the finding that the securities are “freely transferable.” We believe that the restrictions imposed under our charter on the transfer of our shares are limited to the restrictions on transfer generally permitted under the DOL Regulations and are not likely to result in the failure of the shares of common stock to be “freely transferable.” The DOL Regulations only establish a presumption in favor of the finding of free transferability, and, therefore, no assurance can be given that the DOL will not reach a contrary conclusion.
Assuming that the shares of common stock will be “widely held” and “freely transferable,” we believe that our shares of common stock will be publicly offered securities for purposes of the DOL Regulations and that our assets will not be deemed to be “plan assets” of any plan that invests in our shares of common stock.
Each holder of our shares of common stock will be deemed to have represented and agreed that its purchase and holding of those shares of common stock (or any interest therein) will not constitute or result in a non-exempt prohibited transaction under ERISA or Section 4975 of the Code.
167
Underwriting
We are offering the shares of our common stock described in this prospectus in an underwritten IPO in which Robert W. Baird & Co. Incorporated is acting as representative of the underwriters. We have entered into an underwriting agreement with Robert W. Baird & Co. Incorporated, acting as representative of the underwriters named below, with respect to the common stock being offered. Subject to the terms and conditions contained in the underwriting agreement, each underwriter has severally agreed to purchase the respective number of shares of our common stock set forth opposite its name below:
| Number of | ||||
| Shares | ||||
| Robert W. Baird & Co. Incorporated | ||||
| Total | ||||
The underwriting agreement provides that the underwriters are obligated to purchase all the shares of our common stock in the offering if any are purchased, other than those shares covered by the over-allotment option we describe below. We have granted to the underwriters a 30-day option to purchase up to additional shares from us at the IPO price less the underwriting discounts and commissions. The option may be exercised only to cover any over-allotments of our common stock. If any shares are purchased with this over-allotment option, the underwriters will purchase shares in approximately the same proportion as shown in the table above. If any additional shares of common stock are purchased, the underwriters will offer the additional shares on the same terms as those on which the shares are being offered.
Our common stock is being offered by the underwriters, subject to prior sale, when, as and if issued to and accepted by them, subject to approval of certain legal matters by counsel for the underwriters and the satisfaction of other conditions contained in the underwriting agreement, including:
| § | the representations and warranties made by us are true and agreements have been performed; | |
| § | there is no material adverse change in the financial markets or in our business; and | |
| § | we deliver customary closing documents. |
The underwriters propose to offer shares of our common stock directly to the public at the IPO price per share shown on the cover of this prospectus and to certain dealers at that price less a concession not in excess of $ per share. Any such dealers may resell shares to certain other brokers or dealers at a discount of up to $ per share from the IPO price per share. After this offering, the offering price and other selling terms may be changed by the underwriters. Sales of shares made outside of the United States may be made by affiliates of the underwriters. The representative has advised us that the underwriters do not intend to confirm discretionary sales in excess of 5% of the shares of our common stock offered in this offering.
The following table shows the per share and total underwriting discount and commissions that we will pay to the underwriters and the proceeds we will receive before expenses. These amounts are shown assuming both no exercise and full exercise of the underwriters’ option to purchase additional shares of our common stock.
| No Exercise | Full Exercise | |||||||
| Underwriting discount per share | $ | $ | ||||||
| Total underwriting discount | $ | $ | ||||||
| Proceeds to us (before expenses) | $ | $ | ||||||
We estimate that the total expenses of this offering, exclusive of underwriting discount and commissions, will be approximately $3.6 million, and are payable by us.
A prospectus in electronic format may be made available on the websites maintained by one or more underwriters, or selling group members, if any, participating in this offering. The underwriters may agree to allocate a number of shares to underwriters and selling group members for sale to their online brokerage account holders. Internet distributions will be allocated by the representatives to underwriters and selling group members that may make Internet distributions on the same basis as other allocations.
168
We have agreed to indemnify the underwriters, their affiliates, and persons who control the underwriters, against certain liabilities, including liabilities under the Securities Act, and if we are unable to provide this indemnification to contribute to payments that the underwriters may be required to make in respect of these liabilities.
We have agreed, for a period of 180 days after the date of the prospectus, without the prior written consent of the representative, directly or indirectly, not to (i) to issue, offer, pledge, sell, contract to sell, sell any option or contract to purchase, purchase any option or contract to sell, grant any option, right or warrant to purchase, lend, or otherwise transfer or dispose of, directly or indirectly, any shares of our common stock or any securities convertible into or exercisable or exchangeable for shares of our common stock, (ii) enter into any swap or other arrangement that transfers to another, in whole or in part, any of the economic consequences of ownership of our common stock, whether such transaction described in clauses (i) or (ii) above is to be settled by delivery of our common stock or such other securities, in cash or otherwise, (iii) file any registration statement with the SEC relating to the offering of any shares of our common stock or any securities convertible into or exercisable or exchangeable for shares of our common stock or (iv) publicly announce an intention to effect any transaction specified in clauses (i), (ii) or (iii) above. The restrictions contained in the preceding sentence shall not apply to (i) the shares offered pursuant to this prospectus, (ii) the grant of options to purchase shares of our common stock or other equity grants pursuant to our equity incentive plans (or the filing of a registration statement on Form S-8 to register shares of our common stock issuable under such plans) or (iii) the issuance of shares of our common stock upon exercise of an option outstanding on the date of the underwriting agreement of which the representatives have been advised in writing. Notwithstanding the foregoing, if (1) during the last 17 days of the 180-day restricted period we issue an earnings release or material news or a material event occurs or (2) prior to the expiration of the 180-day restricted period, we announce that we will release earnings results during the 16-day period beginning on the last day of the 180-day period, the restrictions imposed by this agreement shall continue to apply until the expiration of the 18-day period beginning on the issuance of the earnings release or the occurrence of the material news or material event.
Each of our directors and executive officers and certain stockholders have entered into lock-up letters with the representative pursuant to which they have agreed, for a period of 180 days after the date of the prospectus, without the prior written consent of the representative, directly or indirectly, not to (i) offer, pledge, sell, contract to sell, sell any option or contract to purchase, purchase any option or contract to sell, grant any option, right or warrant to purchase, lend, or otherwise transfer or dispose of, directly or indirectly, any shares of our common stock or any securities convertible into or exercisable or exchangeable for shares of our common stock, (ii) enter into any swap or other arrangement that transfers to another, in whole or in part, any of the economic consequences of ownership of our common stock, whether any such transaction described in clauses (i) or (ii) above is to be settled by delivery of shares of our common stock or such other securities, in cash or otherwise, (iii) file any registration statement with the SEC relating to the offering of any shares of our common stock or any securities convertible into or exercisable or exchangeable for shares of our common stock or (iv) publicly announce an intention to effect any transaction specified in clauses (i), (ii) or (iii) above. The restrictions contained in the preceding sentence shall not apply to (i) transactions relating to shares of our common stock or other securities acquired in open market transactions after completion of this offering, provided that no filing under Section 16(a) of the Exchange Act shall be required or shall be voluntarily made in connection with subsequent sales, (ii) transfers of shares of our common stock or any security convertible into shares of our common stock as a bona fide gift or (iii) transfers by will or intestate succession to such director, executive officer or stockholder’s family or to a trust, the beneficiaries of which are exclusively such director, executive officer or stockholder or members of such director, executive officer or stockholder’s family; provided that in the case of any transfer or distribution pursuant to clauses (ii) or (iii), each donee or distributee shall sign and deliver a lock-up letter substantially in the form of this letter and no filing under Section 16(a) of the Exchange Act reporting a reduction in beneficial ownership of shares of our common stock shall be required or shall be voluntarily made during the restricted period. Notwithstanding the foregoing, if (1) during the last 17 days of the 180-day restricted period we issue an earnings release or material news or a material event occurs or (2) prior to the expiration of the 180-day restricted period, we announce that we will release earnings results during the 16-day period beginning on the last day of the 180-day period, the restrictions imposed by this agreement shall continue to apply until the expiration of the 18-day period beginning on the issuance of the earnings release or the occurrence of the material news or material event.
We have applied to have our shares of common stock listed on the NYSE under the symbol “INN.” In order to meet the requirements for listing on that exchange, the underwriters have undertaken to sell a minimum number of shares to a minimum number of beneficial owners as required by the exchange.
169
Prior to this offering, there has been no public market for shares of our common stock. The IPO price was determined by negotiations between us and the representative. In determining the IPO price, we and the representatives considered a number of factors including:
| § | the information set forth in this prospectus and otherwise available to the representatives; |
| § | our prospects and the history and prospects for the industry in which we compete; | |
| § | an assessment of our management; | |
| § | our prospects for future earnings; | |
| § | the general condition of the securities markets at the time of this offering; | |
| § | the recent market prices of, and demand for, publicly traded shares of our common stock of generally comparable companies; and | |
| § | other factors deemed relevant by the representative and us. |
Neither we nor the underwriters can assure investors that an active trading market will develop for shares of our common stock, or that the shares will trade in the public market at or above the IPO price.
In connection with this offering, the underwriters may engage in stabilizing transactions, over-allotment transactions, syndicate covering transactions and penalty bids.
| § | Stabilizing transactions permit bids to purchase shares of our common stock so long as the stabilizing bids do not exceed a specified maximum, and are engaged in for the purpose of preventing or retarding a decline in the market price of the common stock while the offering is in progress. | |
| § | Over-allotment transactions involve sales by the underwriters of shares of our common stock in excess of the number of shares the underwriters are obligated to purchase. This creates a syndicate short position which may be either a covered short position or a naked short position. In a covered short position, the number of shares of our common stock over-allotted by the underwriters is not greater than the number of shares that they may purchase in the over-allotment option. In a naked short position, the number of shares involved is greater than the number of shares in the over-allotment option. The underwriters may close out any short position by exercising their over-allotment option and/or purchasing shares in the open market. | |
| § | Syndicate covering transactions involve purchases of common stock in the open market after the distribution has been completed in order to cover syndicate short positions. In determining the source of shares to close out the short position, the underwriters will consider, among other things, the price of shares available for purchase in the open market as compared with the price at which they may purchase shares through exercise of the over-allotment option. If the underwriters sell more shares than could be covered by exercise of the over-allotment option and, therefore, have a naked short position, the position can be closed out only by buying shares in the open market. A naked short position is more likely to be created if the underwriters are concerned that after pricing there could be downward pressure on the price of the shares in the open market that could adversely affect investors who purchase in the offering. | |
| § | Penalty bids permit the underwriters to reclaim a selling concession from a syndicate member when the common stock originally sold by that syndicate member is purchased in stabilizing or syndicate covering transactions to cover syndicate short positions. |
These stabilizing transactions, syndicate covering transactions and penalty bids may have the effect of raising or maintaining the market price of our common stock or preventing or retarding a decline in the market price of our common stock. As a result, the price of our common stock in the open market may be higher than it would otherwise be in the absence of these transactions. Neither we nor the underwriters make any representation or prediction as to the effect that the transactions described above may have on the price of our common stock. The underwriters are not required to engage in these activities. If these activities are commenced, they may be discontinued by the underwriters without notice at any time. These transactions may be effected on the NYSE, in the over-the-counter market or otherwise and, if commenced, may be discontinued at any time.
Robert W. Baird & Co. Incorporated, including some of its affiliates, has performed and expects to continue to perform financial advisory and investment banking services for us in the ordinary course of its businesses, and may have received, and may continue to receive, compensation for such services.
170
Other than in the United States, no action has been taken by us or the underwriters that would permit a public offering of the securities offered by this prospectus in any jurisdiction where action for that purpose is required. The securities offered by this prospectus may not be offered or sold, directly or indirectly, nor may this prospectus or any other offering material or advertisements in connection with the offer and sale of any such securities be distributed or published in any jurisdiction, except under circumstances that will result in compliance with the applicable rules and regulations of that jurisdiction. Persons into whose possession this prospectus comes are advised to inform themselves about and to observe any restrictions relating to the offering and the distribution of this prospectus. This prospectus does not constitute an offer to sell or a solicitation of an offer to buy any securities offered by this prospectus in any jurisdiction in which such an offer or a solicitation is unlawful.
This document is only being distributed to and is only directed at (i) persons who are outside the United Kingdom, (ii) to investment professionals falling within Article 19(5) of the Financial Services and Markets Act 2000 (Financial Promotion) Order 2005 (the “Order”) or (iii) high net worth entities, and other persons to whom it may lawfully be communicated, falling with Article 49(2)(a) to (d) of the Order (all such persons together being referred to as “relevant persons”). The securities are only available to, and any invitation, offer or agreement to subscribe, purchase or otherwise acquire such securities will be engaged in only with, relevant persons. Any person who is not a relevant person should not act or rely on this document or any of its contents.
In relation to each Member State of the European Economic Area which has implemented the Prospectus Directive (each, a “Relevant Member State”), from and including the date on which the European Union Prospectus Directive (the “EU Prospectus Directive”) is implemented in that Relevant Member State (the “Relevant Implementation Date”) an offer of securities described in this prospectus may not be made to the public in that Relevant Member State prior to the publication of a prospectus in relation to shares of our common stock which has been approved by the competent authority in that Relevant Member State or, where appropriate, approved in another Relevant Member State and notified to the competent authority in that Relevant Member State, all in accordance with the EU Prospectus Directive, except that it may, with effect from and including the Relevant Implementation Date, make an offer of shares of our common stock to the public in that Relevant Member State at any time:
| § | to legal entities which are authorized or regulated to operate in the financial markets or, if not so authorized or regulated, whose corporate purpose is solely to invest in securities; | |
| § | to any legal entity which has two or more of (1) an average of at least 250 employees during the last financial year; (2) a total balance sheet of more than €43,000,000 and (3) an annual net turnover of more than €50,000,000, as shown in its last annual or consolidated accounts; | |
| § | to fewer than 100 natural or legal persons (other than qualified investors as defined in the EU Prospectus Directive) subject to obtaining the prior consent of the book-running manager for any such offer; or | |
| § | in any other circumstances which do not require the publication by the issuer of a prospectus pursuant to Article 3 of the Prospectus Directive. |
For purposes of this provision, the expression an “offer of securities to the public” in relation to any securities in any Relevant Member State means the communication in any form and by any means of sufficient information on the terms of the offer and the securities to be offered so as to enable an investor to decide to purchase or subscribe for the securities, as the same may be varied in that Member State by any measure implementing the EU Prospectus Directive in that Member State and the expression EU Prospectus Directive means Directive 2003/71/EC and includes any relevant implementing measure in each Relevant Member State.
At our request, the underwriters have reserved for sale at the IPO price up to shares of common stock, or the directed shares, for employees, directors and other persons associated with us, including former members of our predecessor, who have expressed an interest in purchasing shares in this offering. The number of shares of common stock available for sale to the general public in this offering will be reduced to the extent these persons purchase the directed shares in the program. Any directed shares not so purchased will be offered by the underwriters to the general public on the same terms as the other shares. We have agreed to indemnify the underwriters against certain liabilities and expenses, including liabilities under the Securities Act, in connection with sales of the directed shares.
171
Experts
The consolidated balance sheet of Summit Hotel Properties, Inc. as of July 12, 2010 included in this prospectus has been audited by KPMG LLP, an independent registered public accounting firm. Such financial statement has been included in this prospectus in reliance upon the report of KPMG LLP, appearing elsewhere in this prospectus, and upon authority of said firm as experts in accounting and auditing.
The audited consolidated financial statements of Summit Hotel Properties, LLC as of and for the years ended December 31, 2009 and 2008 included in this prospectus have been audited by Eide Bailly LLP, an independent registered public accounting firm, as indicated in their report with respect thereto appearing elsewhere in this prospectus. In addition, Eide Bailly LLP also audited Summit Hotel Properties, LLC’s internal control over financial reporting as of December 31, 2009 as indicated in their report with respect thereto appearing elsewhere in this prospectus. Both reports have been incorporated by reference in reliance upon the authority of said firm as experts in accounting and auditing in giving said reports.
The audited consolidated financial statements of Summit Hotel Properties, LLC as of and for the year ended December 31, 2007 included in this prospectus have been audited by Gordon, Hughes & Banks, LLP, an independent registered public accounting firm, as indicated in their report with respect thereto. This report has been included in this prospectus in reliance upon the authority of said firm as experts in accounting and auditing in giving said reports.
Legal Matters
Certain legal matters in connection with this offering will be passed upon for us by Hunton & Williams LLP and for the underwriters by Hogan Lovells US LLP. Venable LLP will issue an opinion to us regarding certain matters of Maryland law, including the validity of the shares of common stock offered by this prospectus. Hunton & Williams LLP and Hogan Lovells US LLP may rely as to certain matters of Maryland law upon the opinion of Venable LLP.
Where You Can Find More Information
We have filed with the SEC a registration statement on Form S-11, including exhibits and schedules filed with this registration statement, under the Securities Act of 1933, as amended, with respect to our shares of common stock to be sold in this offering. This prospectus does not contain all of the information set forth in the registration statement and exhibits and schedules to the registration statement. For further information with respect to our company and our shares of common stock to be sold in this offering, reference is made to the registration statement, including the exhibits and schedules to the registration statement. Statements contained in this prospectus as to the contents of any contract or other document referred to in this prospectus are not necessarily complete and, where that contract is an exhibit to the registration statement, each statement is qualified in all respects by reference to the exhibit to which the reference relates. Copies of this registration statement, including the exhibits and schedules to this registration statement, may be examined without charge at the public reference room of the SEC, 100 F Street, N.E., Room 1580, Washington, DC 20549. Information about the operation of the public reference room may be obtained by calling the SEC at 1-800-SEC-0300. Copies of all or a portion of the registration statement can be obtained from the public reference room of the SEC upon payment of prescribed fees. Our SEC filings, including our registration statement, are also available to you on the SEC’s website at www.sec.gov.
As a result of this offering, we will become subject to the information and reporting requirements of the Securities Exchange Act of 1934, as amended, and will file periodic reports and proxy statements and will make available to our stockholders quarterly reports for the first three quarters of each fiscal year containing unaudited interim financial information.
Our operating partnership has filed a registration statement on Form S-4 that contains a proxy statement/prospectus relating to the merger of our predecessor with and into our operating partnership. Copies of our operating partnership’s registration statement, including the exhibits and schedules thereto, may be examined without charge at the public reference room of the SEC. Copies of all or a portion of our operating partnership’s registration statement can be obtained from the public reference room of the SEC upon payment of prescribed fees. Our operating partnership’s SEC filings, including its registration statement, are also available to you on the SEC’s website www.sec.gov.
172
INDEX TO FINANCIAL STATEMENTS
Summit Hotel Properties, Inc. | ||||
Unaudited Pro Forma Condensed Consolidated Financial Information: | ||||
| F-2 | ||||
| F-3 | ||||
| F-4 | ||||
| F-5 | ||||
Historical Financial Statements: | ||||
| F-10 | ||||
| F-11 | ||||
| F-12 | ||||
Summit Hotel Properties, LLC | ||||
Unaudited Condensed Consolidated Financial Information: | ||||
| F-13 | ||||
| F-14 | ||||
| F-15 | ||||
| F-16 | ||||
| F-18 | ||||
Historical Financial Statements: | ||||
| F-23 | ||||
| F-26 | ||||
| F-27 | ||||
| F-28 | ||||
| F-29 | ||||
| F-31 |
F-1
SUMMIT HOTEL PROPERTIES, INC.
UNAUDITED PRO FORMA CONDENSED CONSOLIDATED BALANCE SHEET
SEPTEMBER 30, 2010
UNAUDITED PRO FORMA CONDENSED CONSOLIDATED BALANCE SHEET
SEPTEMBER 30, 2010
| Pro Forma | ||||||||||||||||||||||||
| Summit Hotel | Reclassification | Reclassified | Pro Forma | Summit Hotel | ||||||||||||||||||||
| Properties, LLC(A) | Adjustments(B) | Subtotal | Offering(C) | Adjustments(D) | Properties, Inc. | |||||||||||||||||||
| (In thousands) | ||||||||||||||||||||||||
ASSETS | ||||||||||||||||||||||||
| Cash and cash equivalents | $ | 11,247 | $ | 11,247 | $ | 260,445 | $ | (235,856 | )(1)(2)(6) | $ | 35,836 | |||||||||||||
| Restricted cash | 2,556 | $ | 939 | 3,495 | 3,495 | |||||||||||||||||||
| Trade receivables | 4,773 | 4,773 | 4,773 | |||||||||||||||||||||
| Prepaid expenses and other | 3,530 | 3,530 | 3,530 | |||||||||||||||||||||
| Property and equipment, net | 454,983 | 454,983 | 454,983 | |||||||||||||||||||||
| Deferred charges and other assets, net | 4,671 | 4,671 | (385 | )(3) | 4,286 | |||||||||||||||||||
| Land held for sale | 23,242 | 23,242 | 23,242 | |||||||||||||||||||||
| Other assets | 4,028 | 4,028 | 4,028 | |||||||||||||||||||||
| Restricted cash | 939 | (939 | ) | — | — | |||||||||||||||||||
Total assets | $ | 509,969 | $ | 509,969 | $ | 534,173 | ||||||||||||||||||
LIABILITIES AND MEMBERS’/STOCKHOLDERS’ EQUITY | ||||||||||||||||||||||||
| Current portion of long-term debt | $ | 146,379 | $ | (146,379 | ) | $ | — | $ | — | |||||||||||||||
| Lines of credit | 19,993 | (19,993 | ) | — | — | |||||||||||||||||||
| Accounts payable | 1,291 | 1,291 | 1,291 | |||||||||||||||||||||
| Related party accounts payable | 437 | 437 | 437 | |||||||||||||||||||||
| Accrued expenses | 12,204 | 12,204 | 12,204 | |||||||||||||||||||||
| Mortgages and notes payable | 255,826 | 166,372 | 422,198 | $ | (223,773 | )(1) | 198,425 | |||||||||||||||||
Total liabilities | 436,130 | 436,130 | 212,357 | |||||||||||||||||||||
| Members’/Stockholders’ Equity: | ||||||||||||||||||||||||
| Members’ equity | 75,463 | 75,463 | (75,463 | )(4) | — | |||||||||||||||||||
| Stockholders’ equity | — | — | $ | 260,445 | (4,185 | )(1)(3)(5)(6) | 256,260 | |||||||||||||||||
| Noncontrolling interest | (1,624 | ) | (1,624 | ) | 67,180 | (4) | 65,556 | |||||||||||||||||
Total members’/stockholders’ equity | 73,839 | 73,839 | 321,816 | |||||||||||||||||||||
Total liabilities and members’/stockholders’ equity | $ | 509,969 | $ | 509,969 | $ | 534,173 | ||||||||||||||||||
See accompanying notes to unaudited pro forma condensed consolidated financial statements.
F-2
SUMMIT HOTEL PROPERTIES, INC.
UNAUDITED PRO FORMA CONDENSED CONSOLIDATED STATEMENTS OF OPERATIONS
FOR THE NINE MONTHS ENDED SEPTEMBER 30, 2010
UNAUDITED PRO FORMA CONDENSED CONSOLIDATED STATEMENTS OF OPERATIONS
FOR THE NINE MONTHS ENDED SEPTEMBER 30, 2010
| Pro Forma | ||||||||||||||||||||
| Summit Hotel | Reclassification | Reclassified | Pro Forma | Summit Hotel | ||||||||||||||||
| Properties, LLC(A) | Adjustments(B) | Subtotal | Adjustments | Properties, Inc. | ||||||||||||||||
| (In thousands, except per-share data) | ||||||||||||||||||||
REVENUE | ||||||||||||||||||||
| Room revenues | $ | 102,874 | $ | 102,874 | $ | 102,874 | ||||||||||||||
| Other hotel operations revenues | 1,939 | 1,939 | 1,939 | |||||||||||||||||
Total revenues | 104,813 | 104,813 | 104,813 | |||||||||||||||||
EXPENSES | ||||||||||||||||||||
| Hotel operating expenses: | ||||||||||||||||||||
| Direct hotel operations | 35,351 | $ | (35,351 | )(1) | — | — | ||||||||||||||
| Other hotel operating expenses | 14,056 | (14,056 | )(2) | — | — | |||||||||||||||
| General, selling and administrative | 18,810 | (18,810 | )(3) | — | — | |||||||||||||||
| Repairs and maintenance | 3,396 | (3,396 | )(4) | — | — | |||||||||||||||
| Rooms | — | 30,677 | (1) | 30,677 | 30,677 | |||||||||||||||
| Other direct | — | 13,068 | (2)(3)(4) | 13,068 | 13,068 | |||||||||||||||
| Other indirect | — | 27,278 | (1)(2)(3)(5) | 27,278 | $ | 1,114 | (C) | 28,392 | ||||||||||||
| Other | — | 460 | (3) | 460 | 460 | |||||||||||||||
| Total hotel operating expenses | 71,613 | 71,483 | 72,597 | |||||||||||||||||
| Depreciation and amortization | 20,328 | 20,328 | (234 | )(D) | 20,094 | |||||||||||||||
| Corporate general and administrative: | ||||||||||||||||||||
| Salaries and other compensation | — | — | 2,950 | (E) | 2,950 | |||||||||||||||
| Other | 1,381 | (E) | 1,381 | |||||||||||||||||
| Equity-based compensation | — | — | (F) | — | ||||||||||||||||
| Hotel property acquisition costs | — | 130 | (5) | 130 | 130 | |||||||||||||||
| Loss on impairment of assets | — | — | — | |||||||||||||||||
Total expenses | 91,941 | 91,941 | 97,152 | |||||||||||||||||
Income (loss) from operations | 12,872 | 12,872 | 7,661 | |||||||||||||||||
| Other income (expense): | ||||||||||||||||||||
| Interest income | 36 | 36 | 36 | |||||||||||||||||
| Interest expense | (19,520 | ) | (19,520 | ) | 11,750 | (G) | (7,770 | ) | ||||||||||||
| Loss on disposal of assets | (40 | ) | (40 | ) | (40 | ) | ||||||||||||||
Total other expense | (19,524 | ) | (19,524 | ) | (7,774 | ) | ||||||||||||||
Loss from continuing operations | (6,652 | ) | (6,652 | ) | (113 | ) | ||||||||||||||
Net loss before income taxes | (6,652 | ) | (6,652 | ) | (113 | ) | ||||||||||||||
| Income tax expense | (273 | ) | (273 | ) | (497 | )(H) | (770 | ) | ||||||||||||
Net loss | $ | (6,925 | ) | $ | (6,925 | ) | $ | (883 | ) | |||||||||||
| Net loss allocated to noncontrolling interests | $ | (309 | ) | |||||||||||||||||
| Net loss allocated to common stockholders | $ | (574 | ) | |||||||||||||||||
| Pro forma earnings per share: | ||||||||||||||||||||
| Basic | $ | |||||||||||||||||||
| Diluted | $ | |||||||||||||||||||
| Pro forma weighted-average number of shares: | ||||||||||||||||||||
| Basic | ||||||||||||||||||||
| Diluted | ||||||||||||||||||||
See accompanying notes to unaudited pro forma condensed consolidated financial statements.
F-3
SUMMIT HOTEL PROPERTIES, INC.
UNAUDITED PRO FORMA CONDENSED CONSOLIDATED STATEMENTS OF OPERATIONS
FOR THE YEAR ENDED DECEMBER 31, 2009
UNAUDITED PRO FORMA CONDENSED CONSOLIDATED STATEMENTS OF OPERATIONS
FOR THE YEAR ENDED DECEMBER 31, 2009
| Pro Forma | ||||||||||||||||||||
| Summit Hotel | Reclassification | Reclassified | Pro Forma | Summit Hotel | ||||||||||||||||
| Properties, LLC(A) | Adjustments(B) | Subtotal | Adjustments | Properties, Inc. | ||||||||||||||||
| (In thousands, except per-share data) | ||||||||||||||||||||
REVENUE | ||||||||||||||||||||
| Room revenues | $ | 118,960 | $ | 118,960 | $ | 118,960 | ||||||||||||||
| Other hotel operations revenues | 2,240 | 2,240 | 2,240 | |||||||||||||||||
Total revenues | 121,200 | 121,200 | 121,200 | |||||||||||||||||
EXPENSES | ||||||||||||||||||||
| Hotel operating expenses: | ||||||||||||||||||||
| Direct hotel operations | 42,071 | $ | (42,071 | )(1) | — | — | ||||||||||||||
| Other hotel operating expenses | 16,987 | (16,987 | )(2) | — | — | |||||||||||||||
| General, selling and administrative | 24,017 | (24,017 | )(3) | — | — | |||||||||||||||
| Repairs and maintenance | 6,152 | (6,152 | )(4) | — | — | |||||||||||||||
| Rooms | — | 36,720 | (1) | 36,720 | 36,720 | |||||||||||||||
| Other direct | — | 18,048 | (2)(3)(4) | 18,048 | 18,048 | |||||||||||||||
| Other indirect | — | 32,389 | (1)(2)(3)(5) | 32,389 | $ | 1,151 | (C) | 33,540 | ||||||||||||
| Other | — | 681 | (3) | 681 | 681 | |||||||||||||||
| Total hotel operating expenses | 89,227 | 87,838 | 88,989 | |||||||||||||||||
| Depreciation and amortization | 23,971 | 23,971 | (883 | )(D) | 23,088 | |||||||||||||||
| Corporate general and administrative: | ||||||||||||||||||||
| Salaries and other compensation | — | — | 3,933 | (E) | 3,933 | |||||||||||||||
| Equity-based compensation | — | — | (F) | |||||||||||||||||
| Other | — | — | 1,841 | (E) | 1,841 | |||||||||||||||
| Hotel property acquisition costs | — | 1,389 | (5) | 1,389 | 1,389 | |||||||||||||||
| Loss on impairment of assets | 7,506 | 7,506 | 7,506 | |||||||||||||||||
Total expenses | 120,704 | 120,704 | 126,746 | |||||||||||||||||
Income (loss) from operations | 496 | 496 | (5,546 | ) | ||||||||||||||||
| Other income (expense): | ||||||||||||||||||||
| Interest income | 50 | 50 | 50 | |||||||||||||||||
| Interest expense | (18,321 | ) | (18,321 | ) | 9,269 | (G) | (9,052 | ) | ||||||||||||
| Loss on disposal of assets | (4 | ) | (4 | ) | (4 | ) | ||||||||||||||
Total other expense | (18,275 | ) | (18,275 | ) | (9,006 | ) | ||||||||||||||
Loss from continuing operations | (17,779 | ) | (17,779 | ) | (14,552 | ) | ||||||||||||||
Income from discontinued operations | 1,465 | 1,465 | (1,465 | )(H) | — | |||||||||||||||
Net loss before income taxes | (16,314 | ) | (16,314 | ) | (14,552 | ) | ||||||||||||||
| Income tax expense | — | — | (840 | )(I) | (840 | ) | ||||||||||||||
Net loss | $ | (16,314 | ) | $ | (16,314 | ) | $ | (15,392 | ) | |||||||||||
| Net loss allocated to noncontrolling interest | $ | (5,387 | ) | |||||||||||||||||
| Net income (loss) allocated to common stockholders | $ | (10,005 | ) | |||||||||||||||||
| Pro forma earnings per share: | ||||||||||||||||||||
| Basic | $ | |||||||||||||||||||
| Diluted | $ | |||||||||||||||||||
| Pro forma weighted-average number of shares: | ||||||||||||||||||||
| Basic | ||||||||||||||||||||
| Diluted | ||||||||||||||||||||
See accompanying notes to unaudited pro forma condensed consolidated financial statements.
F-4
SUMMIT HOTEL PROPERTIES, INC.
(IN THOUSANDS, EXCEPT PER-SHARE AND OP UNIT DATA)
| 1. | Basis of Presentation |
The accompanying unaudited pro forma condensed consolidated financial statements are presented to reflect:
(i) the contribution of the net proceeds of the IPO of Summit Hotel Properties, Inc. (the “Company”) and a concurrent private placement in an amount of approximately $260,445, after the payment of the underwriting discount and after the payment of offering-related costs and expenses of approximately $3,620 in exchange for units of limited partnership interest in the Operating Partnership (“OP units”) that represent an approximate 65% partnership interest in the Operating Partnership, including the sole general partnership interest;
(ii) the contribution to Summit Hotel OP, LP (the “Operating Partnership”) of the Class B and Class C membership interests in Summit Group of Scottsdale, Arizona, LLC (“Summit of Scottsdale”) held by The Summit Group, Inc. (“The Summit Group”) and an unaffiliated third-party investor in exchange for an aggregate of 106,008 OP units; and
(iii) the merger of Summit Hotel Properties, LLC (the “Predecessor”) with and into the Operating Partnership, with the Predecessor as the acquiror for accounting purposes, and the issuance by the Operating Partnership of an aggregate of 9,993,992 OP units to the former Class A, Class A-1, Class B and Class C members of the Predecessor in exchange for their membership interests in the Predecessor; and
(iv) the repayment of approximately $223,773 of outstanding indebtedness and the payment of estimated costs and expenses of approximately $3,800 recognized in connection with the retirement of this indebtedness.
Following completion of the merger, the historical consolidated financial statements of the Predecessor will become the historical consolidated financial statements of the Company, and the assets and liabilities of the Company will be recorded at their respective historical carrying values as of the date of completion of the merger.
The unaudited pro forma balance sheet assumes each of these transactions occurred on September 30, 2010. The unaudited pro forma statements of operations and other operating data assumes each of these transactions occurred on January 1, 2009. The unaudited pro forma condensed consolidated balance sheet is presented for illustrative purposes only and is not necessarily indicative of what the actual financial position would have been had the transactions referred to above occurred on September 30, 2010, nor does it purport to represent the future financial position of the Company. The unaudited pro forma condensed consolidated statements of operations are presented for illustrative purposes only and are not necessarily indicative of what the actual results of operations would have been had the transactions referred to above occurred on January 1, 2009, nor does it purport to represent the future results of operations of the Company. In the opinion of management of the Company, all material adjustments to reflect the effects of the preceding transactions have been made.
| 2. | Adjustments to the Pro Forma Condensed Consolidated Balance Sheet as of September 30, 2010: |
(A) Represents the Predecessor’s unaudited condensed consolidated balance sheet as of September 30, 2010.
(B) Reflects the following adjustments to reclassify certain prior period amounts in the Predecessor’s historical balance sheet to the Company’s intended presentation:
| § | To reclassify restricted cash (current and noncurrent) into one account. | |
| § | To reclassify current maturities and notes payable into one account. |
F-5
SUMMIT HOTEL PROPERTIES, INC.
NOTES AND MANAGEMENT’S ASSUMPTIONS TO UNAUDITED PRO FORMA CONDENSED CONSOLIDATED FINANCIAL STATEMENTS — (Continued)
(C) Reflects the issuance of shares of common stock of the Company:
| Sale of shares of common stock at an IPO price of $ per share | $ | 270,500 | ||
| Underwriting discount | (18,935 | ) | ||
| Sale of shares of common stock at a private placement price of $ per share | 12,500 | |||
| Legal, accounting and other offering-related costs | (3,620 | ) | ||
| Net proceeds | $ | 260,445 | ||
(D) (1) Reflects the retirement of outstanding indebtedness being repaid with net proceeds from the Company’s IPO and concurrent private placement:
| First National Bank of Omaha/Acquisition Line of Credit | $ | 19,993 | ||
| First National Bank of Omaha/Line of Credit Pool One | 18,903 | |||
| Lehman Brothers Bank | 77,381 | |||
| Marshall & Ilsley Bank | 21,420 | |||
| Fortress Credit Corp. | 86,076 | |||
| Use of proceeds | $ | 223,773 | ||
(2) Reflects the payment, immediately prior to the merger, of priority distributions in the amount of approximately $8,283 to the Predecessor’s Class A and Class A-1 members accrued but unpaid through August 31, 2010, pursuant to the terms of the merger agreement between the Predecessor and the Operating Partnership.
(3) Reflects the write-off of deferred financing costs of approximately $385 associated with the retirement of certain indebtedness being repaid with net proceeds from the Company’s IPO and concurrent private placement. These expenditures will be a use of proceeds and are also included as an adjustment to stockholders’ equity.
(4) Reflects the reclassification of members’ equity of the Predecessor and the noncontrolling interests of the Predecessor into noncontrolling interests in the Operating Partnership attributable to the issuance of the 10,100,000 OP units being issued in the merger and the other formation transactions.
(5) Reflects the effects of the issuance of 4,000 shares of the Company’s common stock to its independent directors upon completion of the Company’s IPO.
(6) Reflects prepayment penalties and other fees of approximately $3,800 related to the retirement of certain indebtedness being repaid with net proceeds from the Company’s initial public offering and concurrent private placement.
| 3. | Adjustments to the Pro Forma Condensed Consolidated Statement of Operations for the Nine Months Ended September 30, 2010: |
(A) Represents the Predecessor’s unaudited condensed consolidated statement of operations for the nine months ended September 30, 2010.
F-6
SUMMIT HOTEL PROPERTIES, INC.
NOTES AND MANAGEMENT’S ASSUMPTIONS TO UNAUDITED PRO FORMA CONDENSED CONSOLIDATED FINANCIAL STATEMENTS — (Continued)
(B) Reflects the following adjustments to reclassify certain prior period amounts in the Predecessor’s historical statement of operations to the Company’s intended presentation:
(1) To reclassify: (a) $30,677 of direct hotel operations expense (wages, payroll taxes and benefits, linens, cleaning and guestroom supplies and complimentary breakfast) as rooms expense; and (b) $4,674 of direct hotel operations expense (franchise royalties) as other indirect expense.
(2) To reclassify (a) $6,431 of other hotel operating expense (utilities and telephone) as other direct expense; and (b) $7,625 of other hotel operating expense (property taxes, insurance and cable) as other indirect expense.
(3) To reclassify (a) $3,240 of general, selling and administrative expense (office supplies, advertising, miscellaneous operating expenses and bad debt expense) as other direct expenses; (b) $14,979 of general, selling and administrative expense (credit card/travel agent commissions, management company expense, management company legal and accounting fees and franchise fees) as indirect expenses; and (c) $460 of general, selling and administrative expense (ground rent and other expense) as other expense.
(4) To reclassify $3,396 of repairs and maintenance expense as other direct expenses.
(5) To reclassify $130 of other indirect expense (hotel startup costs) as hotel property acquisition costs.
(C) Reflects the elimination of accounting and management expense historically paid to The Summit Group under hotel management agreements and an adjustment to other indirect expense to reflect contractual payments under a new hotel management agreement to be entered into by the Company’s TRS lessees with Interstate upon completion of the Company’s IPO.
| Historical accounting expense reimbursement | $ | (480 | ) | |
| Historical management expense reimbursement | (2,400 | ) | ||
| Historical amounts paid to The Summit Group | (2,880 | ) | ||
| Base management fee under new hotel management agreement | 3,144 | |||
| Accounting expense reimbursement under new hotel management agreement | 850 | |||
| Incentive management fee payable under new hotel management agreement | — | |||
| Amounts payable to Interstate under new hotel management agreement | $ | 1,114 | ||
(D) Reflects the elimination of $234 of deferred financing cost amortization expense related to indebtedness being repaid with net proceeds from the Company’s IPO and concurrent private placement.
(E) Reflects the expected increase in general and administrative expenses as a result of becoming a publicly traded company. These expenses include, but are not limited to, incremental salaries, fees paid to the Company’s independent directors, directors’ and officers’ insurance and other compliance costs.
(F) Reflects $ of expense associated with the grant of an aggregate of 4,000 shares of common stock to the Company’s independent directors upon completion of the IPO and the grant of options to purchase an aggregate of 940,000 shares of common stock to the Company’s named executive officers upon completion of the IPO. The Company intends to calculate the grant date fair value of the stock options to be granted to certain executive offers upon completion of the Company’s IPO using a Black-Scholes option-pricing model. The stock options will vest ratably over a five-year period beginning on the first anniversary of the date of grant and will have an exercise price equal to the IPO price of the Company’s common stock. The assumptions used in the fair value determination of the stock options to be granted to the Company’s named executive officers are summarized as follows: (1) risk-free interest rate of % based on the 10-year U.S. Treasury rate as of , 2010; (2) expected volatility of % based on an analysis of a peer group of comparable entities; (3) expected dividend yield of %; (4) weighted-average expected life of 5 years; and (5) exercise price equal to the mid-point of the anticipated IPO price range set
F-7
SUMMIT HOTEL PROPERTIES, INC.
NOTES AND MANAGEMENT’S ASSUMPTIONS TO UNAUDITED PRO FORMA CONDENSED CONSOLIDATED FINANCIAL STATEMENTS — (Continued)
forth on the cover of this prospectus. The weighted-average grant date fair value of the stock options to be granted to certain executive officers is anticipated to be $ .
(G) Reflects a reduction of an aggregate of $11,750 in interest expense as a result of the repayment of indebtedness with net proceeds of the Company’s IPO.
(H) Reflects the adjustment to recognize income tax expense on the taxable income of Summit TRS and Summit TRS II, the Company’s taxable REIT subsidiaries upon completion of the Company’s IPO, assuming the Company had elected REIT status and the TRS leases were in place as of January 1, 2009.
| 4. | Adjustments to the Pro Forma Condensed Consolidated Statement of Operations for the Year Ended December 31, 2009: |
(A) Represents the Predecessor’s audited consolidated statement of operations for the year ended December 31, 2009.
(B) Reflects the following adjustments to reclassify certain prior period amounts in the Predecessor’s historical statement of operations to the Company’s intended presentation:
(1) To reclassify (a) $36,720 of direct hotel operations expense (wages, payroll taxes and benefits, linens, cleaning and guestroom supplies and complimentary breakfast) as rooms expense; and (b) $5,351 of direct hotel operations expense (franchise royalties) as other indirect expense.
(2) To reclassify (a) $7,642 of other hotel operating expense (utilities and telephone) as other direct expense; and (b) $9,345 of other hotel operating expense (property taxes, insurance and cable) as other indirect expense.
(3) To reclassify (a) $4,254 of general, selling and administrative expense (office supplies, advertising, miscellaneous operating expenses and bad debt expense) as other direct expenses; (b) $19,082 of general, selling and administrative expense (credit card/travel agent commissions, management company expenses, management company legal and accounting fees and franchise fees) as other indirect expenses; and (c) $681 of general, selling and administrative expense (ground rent and other expense) as other expense.
(4) To reclassify $6,152 of repairs and maintenance expense as other direct expenses.
(5) To reclassify $1,389 of other indirect expense (hotel startup costs) as hotel property acquisition costs.
(C) Reflects the elimination of accounting and management expense historically paid to The Summit Group under hotel management agreements and an adjustment to other indirect expense to reflect contractual payments under a new hotel management agreement to be entered into by the Company’s TRS lessees with Interstate upon completion of the IPO.
| Historical accounting expense reimbursement | $ | (589 | ) | |
| Historical management expense reimbursement | (3,029 | ) | ||
| Historical amounts paid to The Summit Group | (3,618 | ) | ||
| Base management fee under new hotel management agreement | 3,636 | |||
| Accounting expense reimbursement under new hotel management agreement | 1,133 | |||
| Incentive management fee payable under new hotel management agreement | — | |||
| Amounts payable to Interstate under new hotel management agreement | $ | 1,151 | ||
(D) Reflects the elimination of $883 of deferred financing cost amortization expense related to indebtedness being repaid with net proceeds from the Company’s IPO and concurrent private placement.
F-8
SUMMIT HOTEL PROPERTIES, INC.
NOTES AND MANAGEMENT’S ASSUMPTIONS TO UNAUDITED PRO FORMA CONDENSED CONSOLIDATED FINANCIAL STATEMENTS — (Continued)
(E) Reflects the expected increase in general and administrative expenses as a result of becoming a publicly traded company. These expenses include, but are not limited to, incremental salaries, fees paid to the Company’s independent directors, directors’ and officers’ insurance and other compliance costs.
(F) Reflects $ of expense associated with the grant of an aggregate of 4,000 shares of common stock to the Company’s independent directors upon completion of the IPO and the grant of options to purchase an aggregate of 940,000 shares of common stock to the Company’s named executive officers upon completion of the IPO. The Company intends to calculate the grant date fair value of the stock options to be granted to the Company’s named executive offers upon completion of the Company’s IPO using a Black-Scholes option-pricing model. The stock options will vest ratably over a five-year period beginning on the first anniversary of the date of grant and will have an exercise price equal to the IPO price of the Company’s common stock. The assumptions used in the fair value determination of the stock options to be granted to certain executive officers are summarized as follows: (1) risk-free interest rate of % based on the 10-year U.S. Treasury rate as of , 2010; (2) expected volatility of % based on an analysis of a peer group of comparable entities; (3) expected dividend yield of %; (4) weighted-average expected life of 5 years; and (5) exercise price equal to the mid-point of the anticipated IPO price range set forth on the cover of this prospectus. The weighted-average grant date fair value of the stock options to be granted to certain executive officers is anticipated to be $ .
(G) Reflects a reduction of an aggregate of $9,269 in interest expense as a result of the repayment of indebtedness with net proceeds of the Company’s IPO and concurrent private placement.
(H) To remove income from discontinued operations of $1,465 included in the Predecessor’s statement of operations for the year ended December 31, 2009.
(I) Reflects the adjustment to recognize income tax expense on the taxable income of Summit TRS and Summit TRS II, the Company’s taxable REIT subsidiaries upon completion of the Company’s IPO, assuming the Company had elected REIT status and the TRS leases were in place as of January 1, 2009.
F-9
REPORT OF INDEPENDENT REGISTERED PUBLIC ACCOUNTING FIRM
Stockholders and Board of Directors
Summit Hotel Properties, Inc.
We have audited the accompanying consolidated balance sheet of Summit Hotel Properties, Inc. (the “Company”) as of July 12, 2010. This consolidated financial statement is the responsibility of the Company’s management. Our responsibility is to express an opinion on this consolidated financial statement based on our audit.
We conducted our audit in accordance with the standards of the Public Company Accounting Oversight Board (United States). Those standards require that we plan and perform the audit to obtain reasonable assurance about whether the consolidated balance sheet is free of material misstatement. An audit of a balance sheet also includes examining, on a test basis, evidence supporting the amounts and disclosures in that balance sheet, assessing the accounting principles used and significant estimates made by management, as well as evaluating the overall balance sheet presentation. We believe that our audit of the consolidated balance sheet provides a reasonable basis for our opinion.
In our opinion, the consolidated balance sheet referred to above presents fairly, in all material respects, the financial position of Summit Hotel Properties, Inc. as of July 12, 2010 in conformity with U.S. generally accepted accounting principles.
/s/ KPMG LLP
Omaha, Nebraska
August 6, 2010
F-10
SUMMIT HOTEL PROPERTIES, INC.
(In thousands, except shares and par value)
| As of | As of | |||||||
| September 30, 2010 | July 12, 2010 | |||||||
| (Unaudited) | ||||||||
ASSETS | ||||||||
| Cash and total assets | $ | 1 | $ | 1 | ||||
LIABILITIES AND STOCKHOLDERS’ EQUITY | ||||||||
Liabilities | $ | — | $ | — | ||||
Stockholders’ Equity | ||||||||
| Common stock, par value $0.01 per share; 1,000 shares authorized, issued and outstanding | — | — | ||||||
| Additional paid in capital | 1 | 1 | ||||||
| Retained earnings | — | — | ||||||
| Total stockholders’ equity | 1 | 1 | ||||||
| Total liabilities and stockholders’ equity | $ | 1 | $ | 1 | ||||
See accompanying notes to consolidated balance sheets.
F-11
SUMMIT HOTEL PROPERTIES, INC.
| Note 1— | Organization and Summary of Significant Accounting Policies |
Summit Hotel Properties, Inc. (the “Company”) is a self-advised hotel investment company that was recently organized as a Maryland corporation to own, through both general and limited partner interests, Summit Hotel OP, LP (the “Operating Partnership”). The Operating Partnership’s initial portfolio will consist of 65 upscale and midscale without food and beverage hotels with a total of 6,533 guestrooms located in small, mid-sized and suburban markets throughout the United States in 19 states. All of the hotels will be leased to the Operating Partnership’s wholly owned taxable REIT subsidiaries, Summit Hotel TRS, Inc., a Delaware corporation, and Summit Hotel TRS II, Inc., a Delaware corporation to be formed prior to completion of the Company’s IPO (collectively, the “TRS Lessees”) and their wholly owned subsidiaries.
The Company intends to file a Registration Statement on Form S-11 with the Securities and Exchange Commission with respect to a proposed initial public offering of common stock (the “IPO”).
The Company has had no operations since its organization. Our formation transactions are designed to merge the business of the Summit Hotel Properties, LLC (the “Predecessor”) into the Operating Partnership, and its wholly owned subsidiaries, and to facilitate the IPO.
| Note 2— | Income Taxes |
We intend to elect and qualify as a real estate investment trust, or REIT, under Sections 856 and 859 of the Internal Revenue Code, as amended, commencing with the taxable year ending December 31, 2010. Under the Code, REITs are subject to numerous organizational and operational requirements, including a requirement to distribute at least 90% of their taxable income. In general, a REIT meeting those requirements will not be subject to federal income tax to the extent of the income it distributes. The Company may still be subject to state and local taxes on our income, property or net worth and to federal income tax on our undistributed income. Additionally, any income earned by TRS Lessees, taxable C-corporations, will be fully subject to federal, state and local corporate income tax. If the Company fails to qualify as a REIT, without the benefit of certain statutory relief provisions, the Company will be subject to federal income tax on its taxable income at regular corporate rates.
| Note 3— | Offering Costs |
In connection with this offering, affiliates of the Company have or will incur legal, accounting, and related costs, which will be reimbursed by the Company upon the consummation of this offering. Such costs will be deducted from the proceeds of this offering.
F-12
SUMMIT HOTEL PROPERTIES, LLC
SEPTEMBER 30, 2010
ASSETS | ||||
| CURRENT ASSETS | ||||
| Cash and cash equivalents | $ | 11,247,069 | ||
| Restricted cash | 2,556,224 | |||
| Trade receivables | 4,772,974 | |||
| Prepaid expenses and other | 3,529,906 | |||
| Total current assets | 22,106,173 | |||
| PROPERTY AND EQUIPMENT, NET | 454,982,656 | |||
| OTHER ASSETS | ||||
| Deferred charges and other assets, net | 4,670,836 | |||
| Land held for sale | 23,242,004 | |||
| Other noncurrent assets | 4,027,649 | |||
| Restricted cash | 939,465 | |||
| Total other assets | 32,879,954 | |||
| TOTAL ASSETS | $ | 509,968,783 | ||
| LIABILITIES AND MEMBERS’ EQUITY | ||||
| CURRENT LIABILITIES | ||||
| Current portion of long-term debt | $ | 146,378,800 | ||
| Lines of credit | 19,992,785 | |||
| Accounts payable | 1,290,568 | |||
| Related party accounts payable | 436,953 | |||
| Accrued expenses | 12,204,358 | |||
| Total current liabilities | 180,303,464 | |||
| LONG-TERM DEBT, NET OF CURRENT PORTION | 255,826,259 | |||
| COMMITMENTS AND CONTINGENCIES | ||||
| MEMBERS’ EQUITY | ||||
| Class A, 1,166.62 units issued and outstanding | 56,678,580 | |||
Class A-1, 437.83 units issued and outstanding | 33,589,994 | |||
| Class B, 81.36 units issued and outstanding | 1,294,277 | |||
| Class C, 173.60 units issued and outstanding | (16,099,328 | ) | ||
| Total Summit Hotel Properties, LLC members’ equity | 75,463,523 | |||
| Noncontrolling interest | (1,624,463 | ) | ||
| Total members’ equity | 73,839,060 | |||
| TOTAL LIABILITIES AND MEMBERS’ EQUITY | $ | 509,968,783 | ||
See accompanying note to unaudited condensed consolidated financial statements.
F-13
SUMMIT HOTEL PROPERTIES, LLC
FOR THE NINE MONTHS ENDED SEPTEMBER 30, 2010 AND 2009
| 2010 | 2009 | |||||||
| REVENUES | ||||||||
| Room revenues | $ | 102,874,263 | $ | 91,095,662 | ||||
| Other hotel operations revenues | 1,938,680 | 1,708,635 | ||||||
| 104,812,943 | 92,804,297 | |||||||
| COSTS AND EXPENSES | ||||||||
| Direct hotel operations | 35,351,300 | 31,415,257 | ||||||
| Other hotel operating expenses | 14,056,399 | 12,564,374 | ||||||
| General, selling and administrative | 18,810,080 | 17,861,695 | ||||||
| Repairs and maintenance | 3,395,690 | 5,048,783 | ||||||
| Depreciation and amortization | 20,327,601 | 16,984,804 | ||||||
| Loss on impairment of assets | — | 6,504,925 | ||||||
| 91,941,070 | 90,379,838 | |||||||
| INCOME FROM OPERATIONS | 12,871,873 | 2,424,459 | ||||||
| OTHER INCOME (EXPENSE) | ||||||||
| Interest income | 35,614 | 29,189 | ||||||
| Interest (expense) | (19,519,570 | ) | (12,639,306 | ) | ||||
| Gain (loss) on disposal of assets | (39,723 | ) | (4,335 | ) | ||||
| (19,523,679 | ) | (12,614,452 | ) | |||||
| INCOME (LOSS) FROM CONTINUING OPERATIONS | (6,651,806 | ) | (10,189,993 | ) | ||||
| INCOME (LOSS) FROM DISCONTINUED OPERATIONS | — | 1,464,808 | ||||||
| NET INCOME (LOSS) BEFORE INCOME TAXES | (6,651,806 | ) | (8,725,185 | ) | ||||
| STATE INCOME TAX (EXPENSE) | (273,185 | ) | (20,370 | ) | ||||
| NET INCOME (LOSS) | (6,924,991 | ) | (8,745,555 | ) | ||||
| NET INCOME (LOSS) ATTRIBUTABLE TO NONCONTROLLING INTEREST | — | 207,328 | ||||||
| NET INCOME (LOSS) ATTRIBUTABLE TO SUMMIT HOTEL PROPERTIES, LLC | $ | (6,924,991 | ) | $ | (8,952,883 | ) | ||
| BASIC AND DILUTED EARNINGS PER $100,000 CAPITAL UNIT | $ | (3,724.29 | ) | $ | (5,243.52 | ) | ||
| WEIGHTED AVERAGE NUMBER OF UNITS OUTSTANDING FOR CALCULATION OF BASIC AND DILUTED EARNINGS PER CAPITAL UNIT (based on $100,000 investment) | 1,859.41 | 1,707.42 | ||||||
See accompanying note to unaudited condensed consolidated financial statements.
F-14
SUMMIT HOTEL PROPERTIES, LLC
FOR THE NINE MONTHS ENDED SEPTEMBER 30, 2010
| Equity Attributable | ||||||||||||||||||||||||||||
| # of Capital | to Noncontrolling | |||||||||||||||||||||||||||
| Units | Class A | Class A-1 | Class B | Class C | Total | Interest | ||||||||||||||||||||||
BALANCES, JANUARY 1, 2010 | 1,859.41 | $ | 59,961,958 | $ | 34,244,056 | $ | 1,804,718 | $ | (13,086,957 | ) | $ | 82,923,775 | $ | (1,624,463 | ) | |||||||||||||
| Net income (loss) | — | (2,889,660 | ) | (512,519 | ) | (510,441 | ) | (3,012,371 | ) | (6,924,991 | ) | — | ||||||||||||||||
| Distributions to members | — | (393,718 | ) | (141,543 | ) | — | — | (535,261 | ) | — | ||||||||||||||||||
BALANCES, SEPTEMBER 30, 2010 | 1,859.41 | $ | 56,678,580 | $ | 33,589,994 | $ | 1,294,277 | $ | (16,099,328 | ) | $ | 75,463,523 | $ | (1,624,463 | ) | |||||||||||||
See accompanying note to unaudited condensed consolidated financial statements.
F-15
SUMMIT HOTEL PROPERTIES, LLC
FOR THE NINE MONTHS ENDED SEPTEMBER 30, 2010 AND 2009
| 2010 | 2009 | |||||||
| OPERATING ACTIVITIES | ||||||||
| Net income (loss) | $ | (6,924,991 | ) | $ | (8,745,555 | ) | ||
| Adjustments to reconcile net income to net cash from operating activities: | ||||||||
| Depreciation and amortization | 20,327,601 | 17,138,752 | ||||||
| Amortization of prepaid lease | 35,550 | — | ||||||
| Unsuccessful project costs | — | 1,065,840 | ||||||
| (Gain) loss on disposal of assets | 39,723 | (1,297,488 | ) | |||||
| Loss on impairment of assets | — | 6,504,925 | ||||||
| Changes in current assets and liabilities: | ||||||||
| Trade receivables | (2,164,776 | ) | (1,308,463 | ) | ||||
| Prepaid expenses and other | (2,113,426 | ) | 1,417,544 | |||||
| Accounts payable and related party accounts payable | 145,008 | (5,613,554 | ) | |||||
| Accrued expenses | 3,022,345 | 147,857 | ||||||
| Restricted cash released (funded) | (801,171 | ) | (699,681 | ) | ||||
| NET CASH PROVIDED BY (USED IN) OPERATING ACTIVITIES | 11,565,863 | 8,610,177 | ||||||
| INVESTING ACTIVITIES | ||||||||
| Land and hotel acquisitions and construction in progress | (1,191,422 | ) | (10,167,860 | ) | ||||
| Purchases of other property & equipment | (1,050,096 | ) | (9,809,112 | ) | ||||
| Proceeds from asset dispositions, net of closing costs | 10,980 | 207,814 | ||||||
| Restricted cash released (funded) | (608,275 | ) | 717,903 | |||||
| NET CASH PROVIDED BY (USED IN) INVESTING ACTIVITIES | (2,838,813 | ) | (19,051,255 | ) | ||||
| FINANCING ACTIVITIES | ||||||||
| Proceeds from issuance of long-term debt | 4,271,847 | — | ||||||
| Principal payments on long-term debt | (6,791,438 | ) | (5,185,186 | ) | ||||
| Financing fees on long-term debt | (1,199,196 | ) | (614,092 | ) | ||||
| Proceeds from issuance of notes payable and line of credit | — | 4,598,831 | ||||||
| Principal payments on notes payable and line of credit | (1,465,158 | ) | (276,329 | ) | ||||
| Proceeds from equity contributions | — | 12,385,707 | ||||||
| Distributions to members | (535,261 | ) | (8,999,279 | ) | ||||
| NET CASH PROVIDED BY (USED IN) FINANCING ACTIVITIES | (5,719,206 | ) | 1,909,652 | |||||
| NET CHANGE IN CASH AND CASH EQUIVALENTS | 3,007,844 | (8,531,426 | ) | |||||
| CASH AND CASH EQUIVALENTS BEGINNING OF PERIOD | 8,239,225 | 18,153,435 | ||||||
| CASH AND CASH EQUIVALENTS END OF PERIOD | $ | 11,247,069 | $ | 9,622,009 | ||||
See accompanying note to unaudited condensed consolidated financial statements.
F-16
SUMMIT HOTEL PROPERTIES, LLC
UNAUDITED CONDENSED CONSOLIDATED STATEMENTS OF CASH FLOWS
FOR THE NINE MONTHS ENDED SEPTEMBER 30, 2010 AND 2009
| 2010 | 2009 | |||||||
| SUPPLEMENTAL DISCLOSURE OF CASH FLOW INFORMATION: | ||||||||
| Cash payments for interest, net of the amounts capitalized below | $ | 19,069,854 | $ | 12,653,385 | ||||
| Interest capitalized | $ | — | $ | 2,786,468 | ||||
| Cash payments for state income taxes | $ | (3,726 | ) | $ | 512,810 | |||
| SUPPLEMENTAL DISCLOSURE OF NON-CASH FINANCIAL INFORMATION: | ||||||||
| Construction in progress financed through related party accounts payable | $ | — | $ | 1,098,940 | ||||
| Construction in progress financed through accounts payable | $ | — | $ | 5,130,917 | ||||
| Construction in progress financed through issuance of debt | $ | — | $ | 44,489,363 | ||||
| Issuance of long-term debt to refinance existing long-term debt | $ | — | $ | 8,440,000 | ||||
| Conversion of debt to equity | $ | — | $ | 3,449,150 | ||||
| Sale proceeds used to payoff long-term debt | $ | — | $ | 6,134,285 | ||||
See accompanying note to unaudited condensed consolidated financial statements.
F-17
SUMMIT HOTEL PROPERTIES, LLC
SEPTEMBER 30, 2010 AND 2009
| NOTE 1— | SELECTED SUPPLEMENTARY INFORMATION |
Basis of Presentation
The accompanying unaudited interim financial statements of Summit Hotel Properties, LLC (the “Company”) have been prepared pursuant to the rules and regulations of the Securities and Exchange Commission for reporting on interim periods. Accordingly, certain information and footnotes required by the accounting principles generally accepted in the United States for complete financial statements have been omitted. Interim results may not be indicative of fiscal year performance because of seasonal and other factors. These interim statements should be read in conjunction with the financial statements and notes thereto included in our Form 10-K filing for the year ended December 31, 2009. In management’s opinion, all adjustments made were normal and recurring in nature and were necessary for a fair statement of the results of the interim period. The December 31, 2009 balance sheet has been derived from the Company’s audited financial statements included in the Company’s annual report on Form 10-K for the year ended December 31, 2009.
The condensed consolidated financial statements include the accounts of the Company and Summit Group of Scottsdale, Arizona, LLC. The effects of all intercompany accounts and transactions have been eliminated. The Company is a Class A Member and receives a 10% priority distribution on their capital contribution before distributions to other classes. Class A members may also receive additional operating distributions based on their Sharing Ratio. These additional distributions are determined by the managing member and are based on excess cash from operations after normal operating expenses, loan payments, priority distributions, and reserves. Any income generated by the LLC is first allocated to Class A members up to the 10% priority return, therefore, there was no income allocated to the noncontrolling interest during the first three quarters of 2010.
Use of Estimates
The preparation of the condensed consolidated financial statements in conformity with accounting principles generally accepted in the United States of America requires management to make estimates and assumptions that affect the reported amounts of assets and liabilities at the date of the condensed consolidated financial statements and reported amounts of revenues and expenses during the reporting period. Actual results could differ from those estimates.
Reclassifications
Certain prior year amounts have been reclassified to conform with current year presentation.
Adopted Accounting Standards
In January 2010, the Financial Accounting Standards Board (FASB) issued an update (ASU No. 2010-06) to Accounting Standards Codification (ASC) 820, Fair Value Measurements and Disclosures, to improve disclosure requirements regarding transfers, classes of assets and liabilities, and inputs and valuation techniques. This update is effective for interim and annual reporting periods beginning after December 15, 2009. The Company adopted this ASC update on January 1, 2010, and it had no material impact on the consolidated financial statements.
In February 2010, the FASB issued an update (ASU No. 2010-09) to ASC 855, Subsequent Events, by removing the requirement for an SEC filer to disclose the date through which that filer had evaluated subsequent events. The Company has adopted this change and therefore has removed the related disclosure from the “Basis of Presentation.”
Future Adoption of Accounting Standards
Certain provisions of ASU No. 2010-06 to ASC 820, Fair Value Measurements and Disclosures, related to separate line items for all purchases, sales, issuances, and settlements of financial instruments valued using Level 3 are effective for fiscal years beginning after December 15, 2010. The Company does not believe that this adoption will have a material impact on the financial statements or disclosures.
F-18
SUMMIT HOTEL PROPERTIES, LLC
NOTE TO THE UNAUDITED CONDENSED CONSOLIDATED FINANCIAL STATEMENTS
SEPTEMBER 30, 2010 AND 2009 — (Continued)
Fair Value
The Company adopted the provisions of FASB ASC 820, Fair Value Measurements and Disclosures, effective January 1, 2008. FASB ASC 820 defines fair value, establishes a framework for measuring fair value and enhances disclosures about fair value measurements. Fair value is defined under generally accepted accounting principles as the price that would be received to sell an asset or paid to transfer a liability in an orderly transaction between market participants at the measurement date. Valuation techniques used to measure fair value, as required by Topic 820 of the FASB ASC, must maximize the use of observable inputs and minimize the use of unobservable inputs.
Our estimates of the fair value of financial instruments as of September 30, 2010, were determined using available market information and appropriate valuation methods, including discounted cash flow analysis. Considerable judgment is necessary to interpret market data and develop estimated fair value. The use of different market assumptions or estimation methods may have a material effect on the estimated fair value amounts.
The carrying amounts of cash and cash equivalents, restricted cash, receivables, accounts payable and other liabilities approximate fair value due to the short-term nature of these instruments.
As of September 30, 2010, the fair value of our consolidated mortgage and other secured and unsecured loans aggregates $408,800,880, compared to the aggregate carrying value of $422,197,844 on our condensed consolidated balance sheet. The Company estimates the fair value of its fixed rate debt by discounting the future cash flows of each instrument at estimated market rates consistent with the maturity of the debt obligation with similar terms.
Long-Lived Assets and Impairment
The Company applies the provisions of FASB ASC 360, Property Plant and Equipment, which addresses financial accounting and reporting for the impairment or disposal of long-lived assets. FASB ASC 360 requires a long-lived asset to be sold to be classified as “held for sale” in the period in which certain criteria are met, including that the sale of the asset within one year is probable and is recorded at the lower of its carrying amount or fair value less cost to sell. FASB ASC 360 also requires that the results of operations of a component of an entity that either has been disposed of or is classified as held for sale be reported in discontinued operations if the operations and cash flows of the component have been or will be eliminated from the Company’s ongoing operations.
The Company periodically reviews the carrying value of its long-term assets in relation to historical results, current business conditions and trends to identify potential situations in which the carrying value of assets may not be recoverable. If such reviews indicate that the carrying value of such assets may not be recoverable, the Company would estimate the undiscounted sum of the expected cash flows of such assets to determine if such sum is less than the carrying value of such assets to ascertain if an impairment exists. If an impairment exists, the Company would determine the fair value by using quoted market prices, if available for such assets, or if quoted market prices are not available, the Company would discount the expected future cash flows of such assets and adjust the carrying amount to fair value.
Assets Held for Sale
As a part of regular policy, the Company periodically reviews hotels based on established criteria such as age of hotel property, type of franchise associated with hotel property, and adverse economic and competitive conditions in the region surrounding the property to determine if any hotels should be classified as held for sale.
The Company performs a comprehensive review of its investment strategy and of its existing hotel portfolio to identify properties which the Company believes is either non-core or no longer complement the business as required by FASB ASC 360. The Company has committed to sell nine parcels of land that were originally purchased for development and thus, those parcels of land are recorded as assets held for sale as of September 30, 2010.
F-19
SUMMIT HOTEL PROPERTIES, LLC
NOTE TO THE UNAUDITED CONDENSED CONSOLIDATED FINANCIAL STATEMENTS
SEPTEMBER 30, 2010 AND 2009 — (Continued)
Assets held for sale at September 30, 2010 and December 31, 2009 are comprised of the following:
| 2010 | 2009 | |||||||
| Land | $ | 23,242,004 | $ | 12,226,320 | ||||
Discontinued Operations
The Company has reclassified its condensed consolidated financial statements of operations for the three and nine month periods ended September 30, 2009, as a result of implementing FASB ASC 360, to reflect discontinued operations of two consolidated hotel properties sold during the period, or to be sold pursuant to the plan for hotel dispositions. This classification has no impact on the Company’s net income or the net income per capital unit. The two hotel properties are located in St. Joseph, MO and Ellensburg, WA. These hotels were sold during 2009 for approximately $6,810,000.
Condensed financial information of the results of operations for these hotel properties included in discontinued operations for the three and nine month periods ended September 30, 2009 are as follows:
| Three Months Ended | Nine Months Ended | |||||||
| September 30, 2009 | September 30, 2009 | |||||||
| REVENUES | $ | 166,648 | $ | 1,133,690 | ||||
| COSTS AND EXPENSES | ||||||||
| Direct hotel operations | 50,254 | 348,065 | ||||||
| Other hotel operating expenses | 21,454 | 135,122 | ||||||
| General, selling and administrative | 69,093 | 258,495 | ||||||
| Repairs and maintenance | 3,143 | 36,091 | ||||||
| Depreciation and amortization | 61,442 | 153,948 | ||||||
| 205,386 | 931,721 | |||||||
| INCOME FROM OPERATIONS | (38,738 | ) | 201,969 | |||||
| OTHER INCOME (EXPENSE) | ||||||||
| Interest income | — | 116 | ||||||
| Interest expense | (3,935 | ) | (39,100 | ) | ||||
| Gain (loss) on disposal of assets | (293,063 | ) | 1,301,823 | |||||
| (296,998 | ) | 1,262,839 | ||||||
| INCOME (LOSS) FROM DISCONTINUED OPERATIONS | $ | (335,736 | ) | $ | 1,464,808 | |||
F-20
SUMMIT HOTEL PROPERTIES, LLC
NOTE TO THE UNAUDITED CONDENSED CONSOLIDATED FINANCIAL STATEMENTS
SEPTEMBER 30, 2010 AND 2009 — (Continued)
Acquisitions
The Company accounts for its acquisitions of hotels as a business combination under the acquisition method of accounting. Acquisition costs are expensed as incurred. The Company allocates the cost of the acquired entity to the assets acquired and liabilities assumed based upon their estimated fair values at the date of acquisition. To determine fair value of the various components acquired, the Company engages independent valuation consultants and other third-party real-estate appraisals as necessary. The Company allocates the cost of the acquired property based upon the relative fair values of the various components contained in the appraisals. The excess of the cost of the acquisition over the fair value will be assigned to intangible assets if the intangible asset is separable and if it arises from a contractual or other legal right. Any remaining excess of the cost of acquisition over fair values assigned to separable assets is recognized as goodwill.
Accrued Expenses
Accrued expenses at September 30, 2010 and December 31, 2009 are as follows:
| 2010 | 2009 | |||||||
| Accrued taxes | $ | 6,747,664 | $ | 5,238,690 | ||||
| Accrued salaries and benefits | 2,051,301 | 1,400,729 | ||||||
| Accrued interest | 1,753,715 | 1,303,999 | ||||||
| Other accrued expenses | 1,651,678 | 1,238,595 | ||||||
| $ | 12,204,358 | $ | 9,182,013 | |||||
Note Obligations
The Fortress Credit Corp. note with a current balance of $86,075,691 has a scheduled maturity date of March 5, 2011, so it has been included in the current maturities section of the condensed consolidated balance sheet. The renewed note has an interest rate of 30 day LIBOR plus 575 bps, plus a 3% capitalized spread. The interest rate at September 30, 2010 was 10.75%.
As of September 30, 2010, the Company has $166,371,585 of debt due in the next twelve months, of which $159,014,760 represents maturing debt and $7,356,825 represents other scheduled principal payments. We intend to pay scheduled principal payments with available cash flow from operations. In addition, we intend to either refinance or extend the terms of those debt instruments maturing in the next twelve months.
Related Parties
Pursuant to a management agreement, The Summit Group, Inc. (a related party through common ownership and management control) provides management and accounting services for the Company. The agreement provides for the Company to reimburse The Summit Group, Inc. for its actual overhead costs and expenses relating to the managing of the hotel properties. At no time are the reimbursed management expenses to exceed 4.5% of annual gross revenues. For the nine months ended September 30, 2010 and 2009, the Company reimbursed management expenses of $2,400,136 and $2,269,076, respectively. These expenses are located in the general, selling and administrative section of the condensed consolidated statement of operations.
The Company reimbursed accounting services of $479,748 and $443,125 for the nine months ended September 30, 2010 and 2009, respectively. The Company also reimbursed for maintenance and purchases services of $145,815 and $380,396 for the nine months ended September 30, 2010 and 2009, respectively. These expenses are located in the general, selling and administrative section of the condensed consolidated statements of operations.
As of September 30, 2010 and December 31, 2009, the Company had accounts payable to The Summit Group, Inc. for $436,953 and $494,248 relating to reimbursement of management and development expenses.
F-21
SUMMIT HOTEL PROPERTIES, LLC
NOTE TO THE UNAUDITED CONDENSED CONSOLIDATED FINANCIAL STATEMENTS
SEPTEMBER 30, 2010 AND 2009 — (Continued)
Recent Developments
On August 9, 2010, Summit Hotel OP, LP filed with the Securities and Exchange Commission (SEC) a Form S-4 seeking to register its securities and Summit Hotel Properties, Inc. filed with the SEC a Form S-11 seeking to register its securities. As described in these registration statements, upon receipt of proper approval from our members, and third parties whose approval may be required, we plan to merge with and into Summit Hotel OP, LP. Summit Hotel OP, LP will be the operating partnership for Summit Hotel Properties, Inc., a hotel real estate investment trust (REIT). Summit Hotel Properties, Inc. intends to list its stock with the New York Stock Exchange. If these transactions are approved and completed as described in the registration statements, the successor company will have improved access to capital through the public trading markets.
On October 22, 2010, the SEC declared effective the OP’s registration statement filed on Form S-4 which registers the securities that the OP will issue in the merger in exchange for the Company’s membership interests.
F-22
REPORT OF INDEPENDENT REGISTERED PUBLIC ACCOUNTING FIRM
The Board of Managers
Summit Hotel Properties, LLC
Sioux Falls, South Dakota
We have audited the accompanying consolidated balance sheets of Summit Hotel Properties, LLC (the “Company”) as of December 31, 2009 and 2008 and the related consolidated statements of operations, changes in members’ equity and cash flows for each of the years in the two-year period ended December 31, 2009. The Company’s management is responsible for these financial statements. Our responsibility is to express an opinion on these financial statements based on our audits.
We conducted our audits in accordance with the standards of the Public Company Accounting Oversight Board (United States). Those standards require that we plan and perform the audits to obtain reasonable assurance about whether the financial statements are free of material misstatement. An audit includes examining, on a test basis, evidence supporting the amounts and disclosures in the financial statements. An audit also includes assessing the accounting principles used and significant estimates made by management, as well as evaluating the overall financial statement presentation. We believe that our audits provide a reasonable basis for our opinion.
In our opinion, the financial statements referred to above present fairly, in all material respects, the consolidated financial position of Summit Hotel Properties, LLC as of December 31, 2009 and 2008, and the consolidated results of its operations and its cash flows for each of the years in the two-year period ended December 31, 2009 in conformity with accounting principles generally accepted in the United States of America.
As discussed in Note 21 of the accompanying notes to the financial statements, the financial statements for the year ended December 31, 2009 have been restated.
We also have audited, in accordance with the standards of the Public Company Accounting Oversight Board (United States), Summit Hotel Properties, LLC’s internal control over financial reporting as of December 31, 2009, based on criteria established in Internal Control—Integrated Framework issued by the Committee of Sponsoring Organizations of the Treadway Commission (COSO), and our report dated March 31, 2010, expressed an unqualified opinion on the Company’s internal control over financial reporting.
/s/ Eide Bailly LLP
Greenwood Village, Colorado
March 31, 2010 (except for Note 21
which is dated September 21, 2010)
which is dated September 21, 2010)
F-23
REPORT OF INDEPENDENT REGISTERED PUBLIC ACCOUNTING FIRM
The Board of Managers
Summit Hotel Properties, LLC
Sioux Falls, South Dakota
We have audited Summit Hotel Properties, LLC (the “Company”) internal control over financial reporting as of December 31, 2009, based on criteria established in Internal Control—Integrated Framework issued by the Committee of Sponsoring Organizations of the Treadway Commission (COSO). Summit Hotel Properties, LLC management is responsible for maintaining effective internal control over financial reporting and for its assessment of the effectiveness of internal control over financial reporting included in the accompanying Management’s Report on Internal Control Over Financial Reporting. Our responsibility is to express an opinion on the Company’s internal control over financial reporting based on our audit.
We conducted our audit in accordance with the standards of the Public Company Accounting Oversight Board (United States). Those standards require that we plan and perform the audit to obtain reasonable assurance about whether effective internal control over financial reporting was maintained in all material respects. Our audit of internal control over financial reporting included obtaining an understanding of internal control over financial reporting, assessing the risk that a material weakness exists, and testing and evaluating the design and operating effectiveness of internal control based on the assessed risk. Our audit also included performing such other procedures as we considered necessary in the circumstances. We believe that our audit provides a reasonable basis for our opinion.
A company’s internal control over financial reporting is a process designed to provide reasonable assurance regarding the reliability of financial reporting and the preparation of financial statements for external purposes in accordance with generally accepted accounting principles. A company’s internal control over financial reporting includes those policies and procedures that (1) pertain to the maintenance of records that, in reasonable detail, accurately and fairly reflect the transactions and dispositions of the assets of the company; (2) provide reasonable assurance that transactions are recorded as necessary to permit preparation of financial statements in accordance with generally accepted accounting principles, and that receipts and expenditures of the company are being made only in accordance with authorizations of management and directors of the company; and (3) provide reasonable assurance regarding prevention or timely detection of unauthorized acquisition, use, or disposition of the company’s assets that could have a material effect on the financial statements.
Because of its inherent limitations, internal control over financial reporting may not prevent or detect misstatements. Also, projections of any evaluation of effectiveness to future periods are subject to the risk that controls may become inadequate because of changes in conditions, or that the degree of compliance with the policies or procedures may deteriorate.
In our opinion, Summit Hotel Properties, LLC maintained, in all material respects, effective internal control over financial reporting as of December 31, 2009, based on criteria established in Internal Control—Integrated Framework issued by the Committee of Sponsoring Organizations of the Treadway Commission (COSO).
We have also audited, in accordance with the standards of the Public Company Accounting Oversight Board (United States), the consolidated balance sheets and the related consolidated statements of operations, members’ equity, and cash flows of Summit Hotel Properties, LLC, and our report dated March 31, 2010 and September 21, 2010 as to Note 21, expressed an unqualified opinion on those financial statements.
/s/ Eide Bailly LLP
Greenwood Village, Colorado
March 31, 2010
F-24
REPORT OF INDEPENDENT REGISTERED PUBLIC ACCOUNTING FIRM
The Board of Managers
Summit Hotel Properties, LLC
Sioux Falls, South Dakota
We have audited the accompanying consolidated statements of operations, changes in members’ equity and cash flows of Summit Hotel Properties, LLC (the “Company”) for the year ended December 31, 2007. These consolidated financial statements are the responsibility of the Company’s management. Our responsibility is to express an opinion on these consolidated financial statements based on our audit.
We conducted our audit in accordance with the standards of the Public Company Accounting Oversight Board (United States). Those standards require that we plan and perform the audit to obtain reasonable assurance about whether the consolidated financial statements are free of material misstatement. The Company is not required to have, nor were we engaged to perform, an audit of its internal control over financial reporting. Our audit included consideration of internal control over financial reporting as a basis for designing audit procedures that are appropriate in the circumstances, but not for the purpose of expressing an opinion on the effectiveness of the Company’s internal control over financial reporting. Accordingly, we express no such opinion. An audit includes examining, on a test basis, evidence supporting the amounts and disclosures in the consolidated financial statements, assessing the accounting principles used and significant estimates made by management, as well as evaluating the overall financial statement presentation. We believe that our audit provides a reasonable basis for our opinion.
In our opinion, the consolidated financial statements referred to above present fairly, in all material respects, the consolidated results of operations, changes in members’ equity and cash flows of Summit Hotel Properties, LLC for the year ended December 31, 2007 in conformity with accounting principles generally accepted in the United States of America.
/s/ Gordon, Hughes & Banks, LLP
Greenwood Village, Colorado
March 21, 2008
F-25
SUMMIT HOTEL PROPERTIES, LLC
DECEMBER 31, 2009 AND 2008
| 2009 | ||||||||
| (restated) | 2008 | |||||||
ASSETS | ||||||||
| CURRENT ASSETS | ||||||||
| Cash and cash equivalents | $ | 8,239,225 | $ | 18,153,435 | ||||
| Restricted cash | 1,755,053 | 1,679,027 | ||||||
| Trade receivables | 2,608,198 | 2,622,164 | ||||||
| Prepaid expenses and other | 1,416,480 | 2,170,955 | ||||||
| Total current assets | 14,018,956 | 24,625,581 | ||||||
| PROPERTY AND EQUIPMENT, NET | 482,767,601 | 461,894,270 | ||||||
| OTHER ASSETS | ||||||||
| Deferred charges and other assets, net | 4,828,185 | 5,664,796 | ||||||
| Land held for sale | 12,226,320 | — | ||||||
| Other noncurrent assets | 4,074,179 | — | ||||||
| Restricted cash | 331,190 | 2,570,374 | ||||||
| Total other assets | 21,459,874 | 8,235,170 | ||||||
| TOTAL ASSETS | $ | 518,246,431 | $ | 494,755,021 | ||||
| LIABILITIES AND MEMBERS’ EQUITY | ||||||||
| CURRENT LIABILITIES | ||||||||
| Current portion of long-term debt | $ | 134,370,900 | $ | 19,508,600 | ||||
| Lines of credit | 21,457,943 | 12,288,500 | ||||||
| Notes payable | — | 7,469,865 | ||||||
| Accounts payable | 1,088,265 | 3,770,908 | ||||||
| Related party accounts payable | 494,248 | 3,173,179 | ||||||
| Accrued expenses | 9,182,013 | 9,956,372 | ||||||
| Total current liabilities | 166,593,369 | 56,167,424 | ||||||
| LONG-TERM DEBT, NET OF CURRENT PORTION | 270,353,750 | 350,826,837 | ||||||
| COMMITMENTS AND CONTINGENCIES (NOTE 15) | ||||||||
| MEMBERS’ EQUITY | ||||||||
| Class A, 1,166.62 units issued and outstanding | 59,961,958 | 76,512,442 | ||||||
Class A-1, 437.83 & 196.50 units issued and outstanding, respectively | 34,244,056 | 15,855,756 | ||||||
| Class B, 81.36 units issued and outstanding | 1,804,718 | 3,007,247 | ||||||
| Class C, 173.60 units issued and outstanding | (13,086,957 | ) | (5,990,222 | ) | ||||
| Total Summit Hotel Properties, LLC members’ equity | 82,923,775 | 89,385,223 | ||||||
| Noncontrolling interest | (1,624,463 | ) | (1,624,463 | ) | ||||
| Total equity | 81,299,312 | 87,760,760 | ||||||
| TOTAL LIABILITIES AND MEMBERS’ EQUITY | $ | 518,246,431 | $ | 494,755,021 | ||||
The accompanying notes are an integral part of these consolidated financial statements.
F-26
SUMMIT HOTEL PROPERTIES, LLC
FOR THE YEARS ENDED DECEMBER 31, 2009, 2008 AND 2007
| 2009 | ||||||||||||
| (restated) | 2008 | 2007 | ||||||||||
| REVENUES | ||||||||||||
| Room revenues | $ | 118,959,822 | $ | 132,796,698 | $ | 112,043,997 | ||||||
| Other hotel operations revenues | 2,239,914 | 2,310,764 | 1,845,333 | |||||||||
| 121,199,736 | 135,107,462 | 113,889,330 | ||||||||||
| COSTS AND EXPENSES | ||||||||||||
| Direct hotel operations | 42,070,893 | 42,380,950 | 35,021,263 | |||||||||
| Other hotel operating expenses | 16,986,818 | 15,186,138 | 11,980,423 | |||||||||
| General, selling and administrative | 24,017,471 | 25,993,091 | 22,008,912 | |||||||||
| Repairs and maintenance | 6,151,474 | 8,008,854 | 10,404,860 | |||||||||
| Depreciation and amortization | 23,971,118 | 22,307,426 | 16,135,758 | |||||||||
| Loss on impairment of assets | 7,505,836 | — | — | |||||||||
| 120,703,610 | 113,876,459 | 95,551,216 | ||||||||||
| INCOME FROM OPERATIONS | 496,126 | 21,231,003 | 18,338,114 | |||||||||
| OTHER INCOME (EXPENSE) | ||||||||||||
| Interest income | 49,805 | 194,687 | 446,219 | |||||||||
| Interest (expense) | (18,320,736 | ) | (17,025,180 | ) | (14,214,151 | ) | ||||||
| Gain (loss) on disposal of assets | (4,335 | ) | (389,820 | ) | (651,948 | ) | ||||||
| (18,275,266 | ) | (17,220,313 | ) | (14,419,880 | ) | |||||||
| INCOME (LOSS) FROM CONTINUING OPERATIONS | (17,779,140 | ) | 4,010,690 | 3,918,234 | ||||||||
| INCOME (LOSS) FROM DISCONTINUED OPERATIONS | 1,464,808 | 10,278,595 | 11,587,145 | |||||||||
| NET INCOME (LOSS) BEFORE INCOME TAXES | (16,314,332 | ) | 14,289,285 | 15,505,379 | ||||||||
| STATE INCOME TAX (EXPENSE) | — | (826,300 | ) | (715,187 | ) | |||||||
| NET INCOME (LOSS) | (16,314,332 | ) | 13,462,985 | 14,790,192 | ||||||||
| NET INCOME (LOSS) ATTRIBUTABLE TO NONCONTROLLING INTEREST | — | 384,269 | 777,762 | |||||||||
| NET INCOME (LOSS) ATTRIBUTABLE TO SUMMIT HOTEL PROPERTIES, LLC | $ | (16,314,332 | ) | $ | 13,078,716 | $ | 14,012,430 | |||||
| BASIC AND DILUTED EARNINGS PER $100,000 CAPITAL UNIT | $ | (9,391.54 | ) | $ | 8,411.67 | $ | 9,012.19 | |||||
| WEIGHTED-AVERAGE NUMBER OF UNITS OUTSTANDING FOR CALCULATION OF BASIC AND DILUTED EARNINGS PER CAPITAL UNIT (based on $100,000 investment) | 1,737.13 | 1,554.83 | 1,554.83 | |||||||||
The accompanying notes are an integral part of these consolidated financial statements.
F-27
SUMMIT HOTEL PROPERTIES, LLC
FOR THE YEARS ENDED DECEMBER 31, 2009, 2008 AND 2007
| Equity | ||||||||||||||||||||||||||||
| # of | Attributable to | |||||||||||||||||||||||||||
| Capital | Noncontrolling | |||||||||||||||||||||||||||
| Units | Class A | Class A-1 | Class B | Class C | Total | Interest | ||||||||||||||||||||||
BALANCES, JANUARY 1, 2007 | 1,554.83 | $ | 88,253,669 | $ | 11,035,274 | $ | 4,972,353 | $ | 3,961,011 | $ | 108,222,307 | $ | (1,511,494 | ) | ||||||||||||||
| Net Income (Loss) | — | 11,214,409 | 1,165,504 | 259,939 | 1,372,578 | 14,012,430 | 777,762 | |||||||||||||||||||||
| Distributions to members | — | (16,575,137 | ) | (1,528,017 | ) | (1,124,079 | ) | (5,612,615 | ) | (24,839,848 | ) | (969,000 | ) | |||||||||||||||
BALANCES, DECEMBER 31, 2007 | 1,554.83 | $ | 82,892,941 | $ | 10,672,761 | $ | 4,108,213 | $ | (279,026 | ) | $ | 97,394,889 | $ | (1,702,732 | ) | |||||||||||||
Class A-1 units issued in private placement | 63.25 | 5,614,466 | 5,614,466 | |||||||||||||||||||||||||
| Net Income (Loss) | — | 10,785,507 | 1,136,502 | 184,178 | 972,529 | 13,078,716 | 384,269 | |||||||||||||||||||||
| Distributions to members | — | (17,166,006 | ) | (1,567,973 | ) | (1,285,144 | ) | (6,683,725 | ) | (26,702,848 | ) | (306,000 | ) | |||||||||||||||
BALANCES, DECEMBER 31, 2008 | 1,618.08 | $ | 76,512,442 | $ | 15,855,756 | $ | 3,007,247 | $ | (5,990,222 | ) | $ | 89,385,223 | $ | (1,624,463 | ) | |||||||||||||
Class A-1 units issued in private placement | 241.33 | 22,123,951 | 22,123,951 | |||||||||||||||||||||||||
| Net Income (Loss) (restated) | — | (6,807,644 | ) | (1,207,424 | ) | (1,202,529 | ) | (7,096,735 | ) | (16,314,332 | ) | — | ||||||||||||||||
| Distributions to members | — | (9,742,840 | ) | (2,528,227 | ) | — | — | (12,271,067 | ) | — | ||||||||||||||||||
BALANCES, DECEMBER 31, 2009 (restated) | 1,859.41 | $ | 59,961,958 | $ | 34,244,056 | $ | 1,804,718 | $ | (13,086,957 | ) | $ | 82,923,775 | $ | (1,624,463 | ) | |||||||||||||
The accompanying notes are an integral part of these consolidated financial statements.
F-28
SUMMIT HOTEL PROPERTIES, LLC
FOR THE YEARS ENDED DECEMBER 31, 2009, 2008 AND 2007
| 2009 | ||||||||||||
| (restated) | 2008 | 2007 | ||||||||||
| OPERATING ACTIVITIES | ||||||||||||
| Net income (loss) | $ | (16,314,332 | ) | $ | 13,078,716 | $ | 14,012,430 | |||||
| Adjustments to reconcile net income to net cash provided by operating activities: | ||||||||||||
| Depreciation and amortization | 24,125,066 | 23,027,566 | 18,887,126 | |||||||||
| Amortization of prepaid lease | 118,501 | — | — | |||||||||
| Unsuccessful project costs | 1,262,219 | — | — | |||||||||
| Noncontrolling interests in operations of consolidated LLC | — | 384,269 | 777,762 | |||||||||
| (Gain) loss on disposal of assets | (1,297,488 | ) | (8,604,779 | ) | (10,379,556 | ) | ||||||
| Loss on impairment of assets | 7,505,836 | — | — | |||||||||
| Changes in assets and liabilities: | ||||||||||||
| Trade receivables | 13,966 | 570,544 | (41,035 | ) | ||||||||
| Prepaid expenses and other assets | 315,891 | (307,109 | ) | (102,077 | ) | |||||||
| Accounts payable and related party accounts payable | (5,847,835 | ) | (1,656,286 | ) | 1,180,615 | |||||||
| Accrued expenses | (774,359 | ) | 316,909 | 1,601,614 | ||||||||
| NET CASH PROVIDED BY (USED IN) OPERATING ACTIVITIES | 9,107,465 | 26,809,830 | 25,936,879 | |||||||||
| INVESTING ACTIVITIES | ||||||||||||
| Land and hotel acquisitions and construction in progress | (14,810,896 | ) | (12,904,466 | ) | (3,841,941 | ) | ||||||
| Purchases of other property and equipment | (6,613,397 | ) | (6,628,779 | ) | (9,465,898 | ) | ||||||
| Proceeds from asset dispositions, net of closing costs | 207,814 | 23,584,638 | 35,581,012 | |||||||||
| Restricted cash released (funded) | 2,163,158 | (585,271 | ) | 164,348 | ||||||||
| NET CASH PROVIDED BY (USED IN) INVESTING ACTIVITIES | (19,053,321 | ) | 3,466,122 | 22,437,521 | ||||||||
| FINANCING ACTIVITIES | ||||||||||||
| Proceeds from issuance of long-term debt | 223,518 | 4,837,000 | 8,853,669 | |||||||||
| Principal payments on long-term debt | (6,890,949 | ) | (20,909,992 | ) | (22,932,344 | ) | ||||||
| Financing fees on long-term debt | (945,442 | ) | (942,405 | ) | (1,277,528 | ) | ||||||
| Proceeds from issuance of notes payable and line of credit | 4,860,000 | 18,510,867 | — | |||||||||
| Principal payments on notes payable and line of credit | (19,865 | ) | — | (7,432,397 | ) | |||||||
| Proceeds from equity contributions, net of commissions | 15,075,451 | 5,614,466 | — | |||||||||
| Distributions to members | (12,271,067 | ) | (26,702,848 | ) | (24,839,848 | ) | ||||||
| Distributions to noncontrolling interest | — | (306,000 | ) | (969,000 | ) | |||||||
| NET CASH PROVIDED BY (USED IN) FINANCING ACTIVITIES | 31,646 | (19,898,912 | ) | (48,597,448 | ) | |||||||
| NET CHANGE IN CASH AND CASH EQUIVALENTS | (9,914,210 | ) | 10,377,040 | (223,048 | ) | |||||||
| CASH AND CASH EQUIVALENTS AT BEGINNING OF YEAR | 18,153,435 | 7,776,395 | 7,999,443 | |||||||||
| CASH AND CASH EQUIVALENTS AT END OF YEAR | $ | 8,239,225 | $ | 18,153,435 | $ | 7,776,395 | ||||||
| SUPPLEMENTAL DISCLOSURE OF CASH FLOW INFORMATION: | ||||||||||||
| Cash payments for interest, net of the amounts capitalized below | $ | 17,810,544 | $ | 17,833,598 | $ | 15,867,060 | ||||||
| Interest capitalized | $ | 2,977,101 | $ | 3,829,267 | $ | 4,489,724 | ||||||
F-29
SUMMIT HOTEL PROPERTIES, LLC
CONSOLIDATED STATEMENTS OF CASH FLOWS — (Continued)
| 2009 | ||||||||||||
| (restated) | 2008 | 2007 | ||||||||||
| Cash payments for state income taxes | $ | 728,514 | $ | 781,081 | $ | 356,187 | ||||||
| SUPPLEMENTAL DISCLOSURE OF NON-CASH FINANCIAL INFORMATION: | ||||||||||||
| Acquisitions of hotel properties and land through issuance of debt | $ | — | $ | 16,447,237 | $ | 42,341,906 | ||||||
| Construction in progress financed through accounts payable | $ | 244,126 | $ | — | $ | — | ||||||
| Construction in progress financed through related party accounts payable | $ | 242,135 | $ | 2,600,260 | $ | 690,629 | ||||||
| Construction in progress financed through issuance of debt | $ | 51,098,872 | $ | 38,765,692 | $ | 78,752,652 | ||||||
| Conversion of construction in progress to other assets | $ | 4,149,379 | $ | — | $ | — | ||||||
| Issuance of long-term debt for short-term debt | $ | 7,450,000 | $ | 12,772,819 | $ | — | ||||||
| Issuance of long-term debt to refinance existing long-term debt | $ | 22,215,852 | $ | 11,073,070 | $ | 3,286,331 | ||||||
| Equity contributions used to pay down debt | $ | 7,048,500 | $ | — | $ | — | ||||||
| Financing costs funded through construction draws | $ | — | $ | 1,651,886 | $ | — | ||||||
| Sale proceeds used to pay down long-term debt | $ | 6,134,285 | $ | 4,215,362 | $ | — | ||||||
The accompanying notes are an integral part of these consolidated financial statements.
F-30
SUMMIT HOTEL PROPERTIES, LLC
DECEMBER 31, 2009, 2008 AND 2007
NOTE 1—PRINCIPAL ACTIVITY AND SIGNIFICANT ACCOUNTING POLICIES
Nature of Business
Summit Hotel Properties, LLC, “The Company”, (a South Dakota limited liability company) was organized on January 8, 2004, and is engaged in the business of developing, owning and operating hotel properties.
The Company has agreements for the use of various trade names, trademarks and service marks which include Country Inns & Suites By Carlson, Inc., Choice Hotels International, Hilton Hotel Corporation, InterContinental Hotels Group, Hyatt Hotel Corporation and Marriott International. The Company also owns and operates one independent non-franchised hotel. As of December 31, 2009, the Company owned and managed 65 hotels, representing approximately 6,533 rooms located in 19 states. As of December 31, 2008, the Company owned and managed 62 hotels, representing approximately 5,854 rooms located in 19 states. As of December 31, 2007, the Company owned and managed 64 hotels, representing approximately 5,863 rooms located in 19 states. The Company’s hotel properties are located throughout various regions of the United States. Hotels operating in any given region are potentially susceptible to adverse economic and competitive conditions as well as unique trends associated with that particular region. The potential adverse affect of such conditions on the Company’s business, financial position, and results of its operations is mitigated due to the diversified locations of the Company’s properties. The Company has only one operating segment.
Restatement
Certain December 31, 2009 amounts have been restated to correct an immaterial error (see Note 21).
Basis of Presentation and Consolidation
The Company is a 49% owner and the primary beneficiary of Summit Group of Scottsdale, AZ, LLC (“Scottsdale”), which qualifies as a variable interest entity. Accordingly, the financial position and results of operations and cash flows of Scottsdale have been included in the accompanying consolidated financial statements. The entity was formed for the purpose of purchasing two hotel properties in Scottsdale, AZ and its activities primarily relate to owning and operating those two hotel properties. As of December 31, 2009 and for the year then ended, Scottsdale had assets of $19,771,907, liabilities of $14,251,068, revenues of $5,848,427, and expenses of $5,825,455. As of December 31, 2008 and for the year then ended, Scottsdale had assets of $21,291,843, liabilities of $14,725,106, revenues of $8,871,475 and expenses of $7,049,137. As of December 31, 2007 and for the year then ended, Scottsdale had assets of $21,842,939, liabilities of $15,429,670, revenues of $10,062,022, and expenses of $7,468,129. Included in the consolidated assets are assets as of December 31, 2009 totaling $18,533,866 which represent collateral for obligations of Scottsdale. The Company’s maximum exposure to loss is $5,520,839. Apart from that amount, creditors and the beneficial holders of Scottsdale have no recourse to the assets or general credit of the Company. All significant intercompany balances and transactions have been eliminated in consolidation. The Company is a Class A Member and receives a 10% priority distribution on their capital contribution before distributions to other classes. Class A members may also receive additional operating distributions based on their Sharing Ratio. These additional distributions are determined by the managing member and are based on excess cash from operations after normal operating expenses, loan payments, priority distributions, and reserves. Any income generated by the LLC is first allocated to Class A members up to the 10% priority return.
The Company has adopted FASB Accounting Standards Codification (“ASC”) 810, Consolidation. Under Topic 810, variable interest entities (“VIEs”) are required to be consolidated by their primary beneficiaries if they do not effectively disperse risks among the parties involved. The primary beneficiary of a VIE is the party that absorbs a majority of the entity’s expected losses, receives a majority of its expected residual returns, or both, as a result of holding variable interests. In applying Topic 810, management has utilized available information and reasonable assumptions and estimates in evaluating whether an entity is a VIE and which party is the primary beneficiary. These assumptions and estimates are subjective and the use of different assumptions could result in different conclusions.
F-31
SUMMIT HOTEL PROPERTIES, LLC
NOTES TO CONSOLIDATED FINANCIAL STATEMENTS — (Continued)
Beginning on October 1, 2004, the Company considered its interest in Summit Group of Scottsdale, AZ, LLC, a VIE in which the Company is the primary beneficiary. As per the provisions of Topic 810, the Company’s interest in the VIE has been included in the accompanying consolidated financial statements.
The Company is the 100% owner of several special purpose entities which were established due to various lending requirements. These entities include Summit Hospitality I, LLC; Summit Hospitality II, LLC; Summit Hospitality III, LLC; Summit Hospitality IV, LLC; and Summit Hospitality V, LLC. All assets, liabilities, revenues, and expenses of these wholly owned subsidiaries are reflected on the financial statements.
The Company has evaluated all subsequent events through March 29, 2010, the date the financial statements were issued.
Use of Estimates
The preparation of financial statements in conformity with accounting principles generally accepted in the United States requires management to make estimates and assumptions that affect the amounts reported in the financial statements and accompanying notes. Actual results may differ from these estimates.
Cash and Cash Equivalents
The Company considers all highly liquid investments purchased with an original maturity of three months or less to be cash equivalents. At times, cash on deposit may exceed the federally insured limit. The Company maintains its cash with high credit quality financial institutions. Due to the financial institution crisis and economic downturn that occurred in the second half of 2008, management has assessed the risks of each of the financial institutions where the Company has deposits in excess of insured limits and believes the risk of loss to still be minimal.
Receivables and Credit Policies
Trade receivables are uncollateralized customer obligations resulting from the rental of hotel rooms and the sales of food, beverage, catering and banquet services due under normal trade terms requiring payment upon receipt of the invoice. Trade receivables are stated at the amount billed to the customer and do not accrue interest. Customer account balances with invoices dated over 60 days old are considered delinquent. Payments of trade receivables are allocated to the specific invoices identified on the customer’s remittance advice or, if unspecified, are applied to the earliest unpaid invoices.
The Company reviews the collectability of the receivables monthly. A provision for losses on receivables is determined on the basis of previous loss experience and current economic conditions. There were no material uncollectible receivables and no allowance for doubtful accounts recorded as of December 31, 2009 and 2008, respectively. The Company incurred bad debt expense of $88,125, $172,481, and $94,155 for 2009, 2008 and 2007, respectively.
Property and Equipment
Buildings and major improvements are recorded at cost and depreciated using the straight-line method over 27 to 40 years, the estimated useful lives of the assets. Hotel equipment, furniture and fixtures are recorded at cost and depreciated using the straight-line method over the estimated useful lives of the related assets of 2 to 15 years. Development costs and other overhead costs are allocated to building and equipment on a prorated basis. The Company periodically re-evaluates fixed asset lives based on current assessments of remaining utilization that may result in changes in estimated useful lives. Such changes are accounted for prospectively and will increase or decrease depreciation expense. Depreciation expense from continuing operations for the year ended December 31, 2009 and 2008 totaled $21,748,782 and $20,085,238, respectively. Expenditures that materially extend a property’s life are capitalized. These costs may include hotel refurbishment, renovation and remodeling expenditures. Normal maintenance and repair costs are expensed as incurred. When depreciable property is retired or disposed of, the related cost and accumulated depreciation is removed from the accounts and any gain or loss is reflected in current operations.
F-32
SUMMIT HOTEL PROPERTIES, LLC
NOTES TO CONSOLIDATED FINANCIAL STATEMENTS — (Continued)
Capitalized Development and Interest Costs
The Company capitalizes all hotel development costs and other direct overhead costs related to the purchase and construction of hotels. Additionally, the Company capitalizes the interest costs associated with constructing new hotels. Capitalized development, direct overhead and interest are depreciated over the estimated lives of the respective assets. Organization and start-up costs are expensed as incurred. For the years ended December 31, 2009, 2008 and 2007, the Company capitalized interest of $2,977,101, $3,829,267, and $4,489,724, respectively.
Assets Held for Sale
Properties are classified as other noncurrent assets when management determines that they are excess and intends to list them for sale. These assets are recorded at the lower of cost or fair value less costs to sell and consist of land only at December 31, 2009. Excess properties are classified as assets held for sale in current assets when they are under contract for sale, or otherwise probable that they will be sold within the next twelve months. There are no assets that fit this classification at December 31, 2009.
Long-Lived Assets and Impairment
The Company applies the provisions of FASB ASC 360, Property Plant and Equipment, which addresses financial accounting and reporting for the impairment or disposal of long-lived assets. FASB ASC 360 requires a long-lived asset to be sold to be classified as “held for sale” in the period in which certain criteria are met, including that the sale of the asset within one year is probable. FASB ASC 360 also requires that the results of operations of a component of an entity that either has been disposed of or is classified as held for sale be reported in discontinued operations if the operations and cash flows of the component have been or will be eliminated from the Company’s ongoing operations.
The Company periodically reviews the carrying value of its long-term assets in relation to historical results, current business conditions and trends to identify potential situations in which the carrying value of assets may not be recoverable. If such reviews indicate that the carrying value of such assets may not be recoverable, the Company would estimate the undiscounted sum of the expected cash flows of such assets to determine if such sum is less than the carrying value of such assets to ascertain if an impairment exists. If an impairment exists, the Company would determine the fair value by using quoted market prices, if available for such assets, or if quoted market prices are not available, the Company would discount the expected future cash flows of such assets.
During 2009, the Company has determined that six land parcels were deemed to be impaired and written down to their fair market value. The Company has also determined that the Courtyard hotel in Memphis, TN was deemed to be impaired and written down to its fair market value. Carrying value of the assets exceeded fair value by $7,505,836, with fair value being determined by reference to the estimated quoted market prices of such assets as defined in Level 3 Inputs as discussed under Fair Value and in Note 4. An impairment loss of that amount has been charged to operations in 2009 (see Note 21).
Deferred Charges
These assets are carried at cost and consist of deferred financing fees and initial franchise fees. Costs incurred in obtaining financing are capitalized and amortized on the straight-line method over the term of the related debt, which approximates the interest method. Initial franchise fees are capitalized and amortized over the term of the franchise agreement using the straight line method. Amortization expense from continuing operations for the year ended December 31, 2009 and 2008 totaled $2,222,336 and $2,439,178, respectively.
Restricted Cash
Restricted cash consists of certain funds maintained in escrow for property taxes, insurance and certain capital expenditures. Funds may be disbursed from the account upon proof of expenditures and approval from the lenders. See also Note 8.
F-33
SUMMIT HOTEL PROPERTIES, LLC
NOTES TO CONSOLIDATED FINANCIAL STATEMENTS — (Continued)
Income Taxes
Summit Hotel Properties, LLC is a limited liability company and, as such, all federal taxable income of the limited liability company flows through and is taxable to the members of the Company. The Company has adopted the provisions of FASB ASC 740, Income Taxes, on January 1, 2009. The implementation of this standard had no impact on the financial statements. As of both the date of adoption, and as of December 31, 2009, the unrecognized tax benefit accrual was zero.
The Company will recognize future accrued interest and penalties related to unrecognized tax benefits in income tax expense if incurred. The Company is no longer subject to Federal tax examinations by tax authorities for years before 2006.
The Company has elected to pay state income taxes at the Company level in all of the states in which it does business. The Company’s estimated state income tax expenses at current statutory rates were $0, $826,300, and $715,187, for the years ended December 31, 2009, 2008 and 2007, respectively.
Members’ Capital Contributions and Profit and Loss Allocations
The Company is organized as a limited liability company and can issue to its members Class A, Class A-1, Class B and Class C units.
Approximate sharing ratios are as follows:
| 2009 | 2008 | 2007 | ||||||||||
| Class A | 42 | % | 45 | % | 46 | % | ||||||
| Class A-1 | 7 | 4 | 3 | |||||||||
| Class B | 7 | 8 | 8 | |||||||||
| Class C | 44 | 43 | 43 | |||||||||
| 100 | % | 100 | % | 100 | % | |||||||
The limited liability company operating agreement provides that net profits are allocated to cover a 10% priority return to Class A members, 8% priority return to Class A-1 members, then the balance is allocated based on ownership of common membership units. Net losses are allocated to members based on ownership of common membership units.
Only Class A and A-1 members contribute capital. These members receive an 8-10% priority return on their capital contributions before distributions to other classes. Class A and A-1 members may also receive additional operating distributions based on their Sharing Ratio. These additional distributions are determined by the managing member and are based on excess cash from operations after normal operating expenses, loan payments, priority distributions, and reserves. Class A and A-1 members have voting rights on creation of new classes of membership, amendments to the Articles of Organization, and dissolution of the company. Class A and A-1 memberships are sold in units of $100,000 each. Class B members do not have voting rights and receive distributions in accordance with their Sharing Ratio after Class A and A-1 members have received their priority return. The Class C member is The Summit Group, Inc. (SGI), a related party. SGI has limited voting rights, in addition to the right to appoint members to the Board. SGI, however, has significant authority to manage the hotel properties and acts as the Company’s Manager. SGI receives distributions in accordance with its Sharing Ratio after Class A and A-1 members have received their priority return.
Costs paid for syndication are charged directly to equity against the proceeds raised. The Company’s operating agreement contains extensive restrictions on the transfer of membership interests. In addition, the transferability of membership interests is restricted by federal and state law. The membership interests may not be offered, sold, transferred, pledged, or hypothecated to any person without the consent of The Summit Group, Inc., a related party and 44% owner of the Company through its holding of 100% of the outstanding Class C units.
F-34
SUMMIT HOTEL PROPERTIES, LLC
NOTES TO CONSOLIDATED FINANCIAL STATEMENTS — (Continued)
Earnings per Capital Unit
For purposes of calculating basic earnings per capital unit, capital units issued by the Company are considered outstanding on the effective date of issue and are based on a $100,000 capital unit.
Noncontrolling Interests
Summit Group of Scottsdale, AZ, LLC has made distributions to noncontrolling members in excess of income allocations to those members. Their excess is reflected in the consolidated balance sheets.
Concentrations of Credit Risk
The Company grants credit to qualified customers generally without collateral, in the form of accounts receivable. The Company believes its risk of loss is minimal due to its periodic evaluations of the credit worthiness of the customers.
Advertising and Marketing Costs
The Company expenses all advertising and marketing costs as they are incurred. Total costs for the years ended December 31, 2009, 2008 and 2007 were $9,015,388, $9,588,243 and $8,647,625, respectively. Of this total cost, $880,534, $846,971 and $669,491, represented general advertising expense for 2009, 2008 and 2007, respectively, and $8,134,854, $8,741,272 and $7,978,134, represented national media fees required by the hotel franchise agreements for 2009, 2008 and 2007, respectively. These costs are reported as components of general, selling and administrative costs in the accompanying consolidated statements of operations.
Sales Taxes
The Company has customers in states and municipalities in which those governmental units impose a sales tax on certain sales. The Company collects those sales taxes from its customers and remits the entire amount to the various governmental units. The Company’s accounting policy is to exclude the tax collected and remitted from revenue and cost of revenue.
Revenue Recognition
The Company’s hotel revenues are derived from room rentals and other sources, such as charges to guests for long-distance telephone service, fax machine use, movie and vending commissions, meeting and banquet room revenue, restaurant and bar revenue, and parking and laundry services. The Company recognizes hotel revenue on a daily basis based on an agreed upon daily rate after the guest has stayed at one of its hotels for a day, used its lodging facilities and received related lodging services and amenities. The Company believes that the credit risk with respect to trade receivables is limited, because approximately 90% of the Company’s revenue is related to credit card transactions, which are typically reimbursed within 2-3 days. Reserves for any uncollectible accounts, if material, are established for accounts that age beyond a predetermined acceptable period. The Company had not recorded any such reserves at December 31, 2009 and 2008.
Adopted Accounting Standards
The Company follows accounting standards set by the Financial Accounting Standards Board, commonly referred to as the “FASB.” The FASB sets generally accepted accounting principles (GAAP) that we follow to ensure we consistently report our financial condition, results of operations, and cash flows. In June 2009, the FASB issued FASB ASC 105, Generally Accepted Accounting Principles, which establishes the FASB Accounting Standards Codification, sometimes referred to as the Codification or ASC, as the sole source of authoritative GAAP. The FASB finalized the Codification effective for periods ending on or after September 1, 2009. Prior FASB standards are no longer being issued by the FASB. Pursuant to the provisions of FASB ASC 105, the Company has updated references to GAAP in its financial statements
F-35
SUMMIT HOTEL PROPERTIES, LLC
NOTES TO CONSOLIDATED FINANCIAL STATEMENTS — (Continued)
issued for the years ended December 31, 2009 and 2008. The Codification will have no effect on the Company’s consolidated financial statements as it is for disclosure purposes only.
In January 2009, the Company adopted FASB ASC 810, Consolidation, which changes the accounting and reporting standards of noncontrolling interests (previously called minority interest) in consolidated financial statements. ASC 810 requires that equity attributable to noncontrolling interests be recognized in equity separate from that of the Company’s and that consolidated net income now includes the results of operations attributable to its noncontrolling interests. A reconciliation of noncontrolling interests from the beginning of the reporting period to the end is required either in the notes to the financial statements or as part of the consolidated statement of changes in equity, if presented. Further, this provision requires a separate schedule that shows the effects of any changes in the Company’s ownership interest in its subsidiaries on the Company’s equity. The effects on our consolidated financial statements include the reclassification of previously classified minority interest as noncontrolling interest in a subsidiary with no effect on net income or loss.
In January 2009, the Company adopted FASB ASC 805, Business Combinations, which includes the primary requirements as follows: (i) Upon initially obtaining control, the acquiring entity in a business combination must recognize 100% of the fair values of the acquired assets, including goodwill, and assumed liabilities, with only limited exceptions even if the acquirer has not acquired 100% of its target. As a consequence, the current step acquisition model will be eliminated. (ii) Contingent consideration arrangements will be fair valued at the acquisition date and included on that basis in the purchase price consideration. The concept of recognizing contingent consideration at a later date when the amount of that consideration is determinable beyond a reasonable doubt, will no longer be applicable. (iii) All transaction costs will be expensed as incurred. This ASC is effective for business combinations in which the acquisition date is on or after the first annual reporting period beginning on or after December 15, 2008. The adoption of this ASC did not have a material impact on the Company’s consolidated financial statements.
In January 2009, the Company adopted FASB ASC 815, Derivatives and Hedging, which is intended to improve financial reporting about derivative instruments and hedging activities by requiring enhanced disclosures to enable investors to better understand their effects on an entity’s financial position, financial performance, and cash flows. This ASC has had no impact on the consolidated financial statements as the Company does not have derivative instruments or hedging activities.
Future Adoption of Accounting Standards
In June 2009, the FASB issued an update to ASC 810, Consolidations, and changed the consolidation guidance applicable to a variable interest entity. Among other things, it requires a qualitative analysis to be performed in determining whether an enterprise is the primary beneficiary of a variable interest entity. FASB ASC 810 is effective for interim and annual reporting periods ending after November 15, 2009. The Company is currently evaluating the effect that ASC 810 will have on its consolidated financial statements.
Fair Value
Effective January 1, 2008, the Company adopted FASB ASC 820, Fair Value Measurements, which defines fair value, establishes a framework for measuring fair value in generally accepted accounting principles (GAAP), and expands disclosures about fair value measurements. FASB ASC 820 also establishes a fair value hierarchy that prioritizes the inputs to valuation techniques used to measure fair value. The hierarchy gives the highest priority to unadjusted quoted prices in active markets for identical assets or liabilities (Level 1) and lowest priority to unobservable inputs (Level 3). The three levels of the fair value hierarchy under Topic 820 are described below:
Level 1—Observable inputs that reflect quoted prices (unadjusted) for identical assets or liabilities in active markets.
Level 2—Inputs reflect quoted prices for identical assets or liabilities in markets that are not active; quoted prices for similar assets or liabilities in active markets; inputs other than quoted prices that are observable for the
F-36
SUMMIT HOTEL PROPERTIES, LLC
NOTES TO CONSOLIDATED FINANCIAL STATEMENTS — (Continued)
asset or the liability; or inputs that are derived principally from or corroborated by observable market data by correlation or other means.
Level 3—Unobservable inputs reflecting the Company’s own assumptions incorporated in valuation techniques used to determine fair value. These assumptions are required to be consistent with market participant assumptions that are reasonable available.
Our estimates of the fair value of financial instruments as of December 31, 2009 and 2008 were determined using available market information and appropriate valuation methods. Considerable judgment is necessary to interpret market data and develop estimated fair value. The use of different market assumptions or estimation methods may have a material effect on the estimated fair value amounts.
The Company’s financial instruments consist primarily of cash and cash equivalents, trade receivables, accounts payable, and debt obligations. The fair values of cash and cash equivalents, trade receivables, and accounts payable approximate their carrying values due to the short-term nature of these instruments. At December 31, 2009 and 2008, the Company’s long-term debt obligations consisted of fixed and variable rate debt that had a carrying value of $404,724,650 and $370,335,437, respectively, and a fair value, based on current market interest rates of $384,856,147 and $403,573,174, respectively. The Company has classified their long-term debt instruments as Level 2 in the hierarchy of FASB ASC 820 described above.
FASB issued an update to ASC 820 which the Company adopted effective January 1, 2009. This update requires that non-financial assets and non-financial liabilities be disclosed at fair value in the financial statements if these items occur regularly, such as in determining impairment loss or the value of assets held for sale as described below.
The following tables summarize the changes in fair value of our Level 3 non-financial assets for the year ended December 31, 2009 (See Note 4):
Fair Value Measurement of Non-Financial Assets Using Level 3 Inputs | ||||
| Beginning balance at January 1, 2009 | $ | 24,574,383 | ||
| Add current year additions | 37,415 | |||
| Less depreciation | (379,642 | ) | ||
| Less impairment | (7,505,836 | ) | ||
| Ending balance at December 31, 2009 | $ | 16,726,320 | ||
| Impairment for 2009 included in earnings attributable to the change in unrealized losses | $ | (7,505,836 | ) | |
The December 31, 2009 ending balance of $16,726,320 is composed of land held for sale with a fair value of $12,226,320 and the Memphis, TN Courtyard with a fair value of $4,500,000.
NOTE 2—PREPAID EXPENSES AND OTHER
Prepaid expenses and other at December 31, 2009 and 2008, are composed of the following:
| 2009 | 2008 | |||||||
| Prepaid insurance expense | $ | 781,144 | $ | 743,491 | ||||
| Other prepaid expense | 635,336 | 1,427,464 | ||||||
| $ | 1,416,480 | $ | 2,170,955 | |||||
F-37
SUMMIT HOTEL PROPERTIES, LLC
NOTES TO CONSOLIDATED FINANCIAL STATEMENTS — (Continued)
NOTE 3—PROPERTY AND EQUIPMENT
Property and equipment at December 31, 2009 and 2008 are composed of the following:
| 2009 | ||||||||
| (restated) | 2008 | |||||||
| Land | $ | 75,272,012 | $ | 90,014,168 | ||||
| Hotel buildings and improvements | 390,909,814 | 321,115,322 | ||||||
| Furniture, fixtures and equipment | 87,642,374 | 64,738,527 | ||||||
| Construction in progress | 8,551,354 | 45,387,313 | ||||||
| 562,375,554 | 521,255,330 | |||||||
| Less accumulated depreciation | 79,607,953 | 59,361,060 | ||||||
| $ | 482,767,601 | $ | 461,894,270 | |||||
The construction in progress asset accounts consist of 5 hotels under development which the Company anticipates will be constructed in 2011 and 2012. During 2007, the Company purchased land in Houston, TX for $1,864,000, San Antonio, TX for $10,420,000, Portland, OR for $3,650,000, El Paso, TX for $2,614,000 and Ft. Myers, FL for $3,307,500. Construction has been completed on one hotel in San Antonio, one in Ft. Myers, and two hotels in Portland. During 2008, the Company purchased land in Twin Falls, ID for $2,212,000, Spokane, WA for $1,730,000, and Missoula, MT for $1,379,000. Construction on one of the Twin Falls sites has been completed.
NOTE 4—ASSETS HELD FOR SALE
As a part of regular policy, the Company periodically reviews hotels based on established criteria such as age of hotel property, type of franchise associated with hotel property, and adverse economic and competitive conditions in the region surrounding the property.
During 2009, the Company completed a comprehensive review of its investment strategy and of its existing hotel portfolio to identify properties which the Company believes are either non-core or no longer complement the business as required by FASB ASC 360. As of December 31, 2009 and 2008, the Company had no hotels that met the Company’s criteria of held for sale classification. The Company has committed to sell six parcels of land that were originally purchased for development and thus, their net book value, as defined in Level 3 Inputs, is recorded as assets held for sale as of December 31, 2009.
Assets held for sale at December 31, 2009 and December 31, 2008 are composed of the following:
| 2009 | 2008 | |||||||
| Land | $ | 12,226,320 | $ | — | ||||
NOTE 5—OTHER NONCURRENT ASSETS
Other noncurrent assets at December 31, 2009 and 2008, are composed of the following:
| 2009 | 2008 | |||||||
| Prepaid land lease | $ | 3,635,595 | $ | — | ||||
| Seller financed notes receivable | 438,584 | $ | — | |||||
| $ | 4,074,179 | $ | — | |||||
F-38
SUMMIT HOTEL PROPERTIES, LLC
NOTES TO CONSOLIDATED FINANCIAL STATEMENTS — (Continued)
NOTE 6—DISCONTINUED OPERATIONS
The Company has reclassified its consolidated financial statements of operations for the years ended December 31, 2009, 2008 and 2007 and its consolidated balance sheets as of December 31, 2009 and 2008, as a result of implementing FASB ASC 360 to reflect discontinued operations of eleven consolidated hotel properties sold or to be sold during these periods pursuant to the plan for hotel dispositions. This reclassification has no impact on the Company’s net income or the net income per share. During 2007, the Company sold six hotel properties located in Coeur D’Alene, ID; Pueblo, CO; Lincoln, NE; Fenton, MO; and Detroit, MI for approximately $36,095,000 with net proceeds of $35,581,000. During 2008, the Company sold three hotel properties located in Lewiston, ID; Jackson, MS; and Overland Park, KS and two hotel properties located in Kennewick, WA for approximately $28,575,000 with net proceeds of $27,775,000. During 2009, the Company sold two hotel properties located in Ellensburg, WA and St. Joseph, MO for approximately $6,810,000 with net proceeds of $6,342,000.
Condensed financial information of the results of operations for these hotel properties included in discontinued operations are as follows:
| 2009 | 2008 | 2007 | ||||||||||
| REVENUES | $ | 1,133,690 | $ | 6,825,908 | $ | 20,859,130 | ||||||
| COSTS AND EXPENSES | ||||||||||||
| Direct hotel operations | 348,065 | 2,210,724 | 7,484,861 | |||||||||
| Other hotel operating expenses | 135,122 | 813,490 | 2,746,811 | |||||||||
| General, selling and administrative | 258,495 | 1,058,716 | 4,088,156 | |||||||||
| Repairs and maintenance | 36,091 | 199,290 | 1,096,351 | |||||||||
| Depreciation and amortization | 153,948 | 720,140 | 2,751,368 | |||||||||
| 931,721 | 5,002,360 | 18,167,547 | ||||||||||
| INCOME FROM OPERATIONS | 201,969 | 1,823,548 | 2,691,583 | |||||||||
| OTHER INCOME (EXPENSE) | ||||||||||||
| Interest income | 116 | 16,790 | (22,818 | ) | ||||||||
| Interest (expense) | (39,100 | ) | (556,342 | ) | (2,113,124 | ) | ||||||
| Gain (loss) on disposal of assets | 1,301,823 | 8,994,599 | 11,031,504 | |||||||||
| 1,262,839 | 8,455,047 | 8,895,562 | ||||||||||
| INCOME (LOSS) FROM DISCONTINUED OPERATIONS | $ | 1,464,808 | $ | 10,278,595 | $ | 11,587,145 | ||||||
NOTE 7—ACQUISITIONS
The Company applies the principles of FASB ASC 805, Business Combinations, in accounting for its acquisitions. The Company determines the cost of the acquired property based upon the fair value of assets distributed as consideration and the fair value of liabilities incurred. The cost of the acquired entity includes all direct costs of the business combination whereas indirect and general expenses are expensed as incurred. The Company allocates the cost of the acquired entity to the assets acquired and liabilities assumed based upon their estimated fair market values at the date of acquisition. To determine fair value of the various components acquired, the Company engages independent valuation consultants and other third-party real-estate appraisals as necessary. The Company allocates the cost of the acquired property based upon the relative fair values of the various components contained in the appraisals. In certain cases, the cost of the property acquired may be less than the fair value contained in the appraisals. In these cases, the Company reduces the fair values based upon the relative value of the components of the acquisition. The excess of the cost of the acquisition over the fair value will be assigned to intangible assets if the intangible asset is separable and if it arises from a contractual or other legal right. Any remaining excess of the cost of acquisition over fair values assigned to separable assets is recognized as goodwill. Further, many of the Company’s hotel acquisitions to date have been
F-39
SUMMIT HOTEL PROPERTIES, LLC
NOTES TO CONSOLIDATED FINANCIAL STATEMENTS — (Continued)
aggregated in accordance with Topic 805 and has resulted in an aggregated purchase price allocation. Since its inception, the Company’s acquisitions and subsequent purchase price allocations have resulted in no goodwill.
The Company’s strategy is to pursue the acquisition of additional hotels under the investment parameters established in the Company’s Operating Agreement. In accordance with this strategy, the Company has made the following acquisitions.
On October 30, 2008, the Company purchased a hotel property in Flagstaff, AZ for approximately $10,750,000. Essentially all of the assets purchased were allocated to property and equipment.
The following table illustrates the allocation of the respective purchase prices for each of the aggregated property purchases discussed above during 2009 and 2008:
| 2009 | 2008 | |||||||
| Current assets | $ | — | $ | — | ||||
| Property and equipment | — | 10,750,000 | ||||||
| Intangible assets | — | — | ||||||
| Total assets acquired | — | 10,750,000 | ||||||
| Current liabilities | — | — | ||||||
| Long-term debt | — | — | ||||||
| Total liabilities assumed | — | — | ||||||
| Net assets acquired | $ | — | 10,750,000 | |||||
NOTE 8—DEFERRED CHARGES AND OTHER ASSETS
Deferred charges and other assets at December 31, 2009 and 2008, are composed of the following:
| 2009 | 2008 | |||||||
| Initial franchise fees | $ | 2,596,042 | $ | 2,270,544 | ||||
| Deferred financing costs | 8,204,003 | 7,415,091 | ||||||
| 10,800,045 | 9,685,635 | |||||||
| Less accumulated amortization | 5,971,860 | 4,020,839 | ||||||
| Total | $ | 4,828,185 | $ | 5,664,796 | ||||
Future amortization expense is expected to be approximately:
| 2010 | $ | 1,542,341 | ||
| 2011 | 1,174,959 | |||
| 2012 | 672,118 | |||
| 2013 | 357,098 | |||
| 2014 | 300,868 | |||
| Thereafter | 780,801 | |||
| $ | 4,828,185 | |||
F-40
SUMMIT HOTEL PROPERTIES, LLC
NOTES TO CONSOLIDATED FINANCIAL STATEMENTS — (Continued)
NOTE 9—RESTRICTED CASH
| Property | FF&E | |||||||||||||||||||
Financing Lender | Taxes | Insurance | Reserves | 2009 | 2008 | |||||||||||||||
| Wells Fargo (Scottsdale) | $ | — | $ | — | $ | — | $ | — | $ | 1,556,520 | ||||||||||
| Wells Fargo (Lehman) | 641,402 | 625,694 | 331,190 | 1,598,286 | 1,954,937 | |||||||||||||||
| National Western Life | 31,178 | — | — | 31,178 | — | |||||||||||||||
| Capmark (ING) | 128,504 | — | — | 128,504 | 195,166 | |||||||||||||||
| Capmark (ING) | 145,061 | — | — | 145,061 | 501,778 | |||||||||||||||
| Capmark (ING) | 83,473 | — | — | 83,473 | 31,485 | |||||||||||||||
| Capmark (ING) | 99,741 | — | — | 99,741 | 9,515 | |||||||||||||||
| $ | 1,129,359 | $ | 625,694 | $ | 331,190 | $ | 2,086,243 | $ | 4,249,401 | |||||||||||
The Company has financing arrangements under which an agreed upon percentage of gross income is required to be deposited into a special reserve account for future replacements of furniture, fixtures and equipment. Some financing arrangements also include provisions that restricted cash must be maintained in escrow for property taxes and insurance. Funds may be disbursed from the account upon proof of expenditures and approval from the lender.
NOTE 10—ACCRUED EXPENSES
Accrued expenses at December 31, 2009 and 2008 are composed of the following:
| 2009 | 2008 | |||||||
| Accrued sales and other taxes | $ | 5,238,690 | $ | 5,910,209 | ||||
| Accrued salaries and benefits | 1,400,729 | 1,838,615 | ||||||
| Accrued interest | 1,303,999 | 1,109,577 | ||||||
| Other accrued expenses | 1,238,595 | 1,097,971 | ||||||
| $ | 9,182,013 | $ | 9,956,372 | |||||
F-41
SUMMIT HOTEL PROPERTIES, LLC
NOTES TO CONSOLIDATED FINANCIAL STATEMENTS — (Continued)
NOTE 11—DEBT OBLIGATIONS
The Company’s debt obligations at December 31, 2009 and 2008 are as follows:
| Interest | Maturity | |||||||||||||||||
Payee | Rate | Date | 2009 | 2008 | ||||||||||||||
| Lehman Brothers Bank | Fixed (5.4025)% | 1/11/2012 | $ | 78,980,016 | $ | 81,016,607 | ||||||||||||
| ING Investment Management | Fixed (5.60)% | 1/1/2012 | 30,088,766 | 31,211,603 | ||||||||||||||
| Fixed (6.10)% | 7/1/2012 | 30,416,427 | 31,445,191 | |||||||||||||||
| Fixed (6.61)% | 11/1/2013 | 6,412,683 | 6,578,270 | |||||||||||||||
| Fixed (6.34)% | 7/1/2012 | 8,122,717 | 8,319,000 | |||||||||||||||
| 75,040,593 | 77,554,064 | |||||||||||||||||
| National Western Life Insurance | (i | ) | Fixed (8.0)% | 1/1/2015 | 14,000,000 | — | ||||||||||||
| Chambers Bank | Fixed (6.5)% | 6/24/2010 | 1,669,020 | 1,742,534 | ||||||||||||||
| JP Morgan | Fixed (7.5)% | 11/11/2024 | — | 14,180,289 | ||||||||||||||
| Bank of the Ozarks | (h | ) | Variable (6.75% at 12/31/09) | 6/29/2012 | 5,794,427 | — | ||||||||||||
| MetaBank | (g | ) | Variable (5.0% at 12/31/09) | 4/1/2012 | 7,450,000 | — | ||||||||||||
| BNC National Bank | Fixed (5.01)% | 11/1/2013 | 5,910,962 | 6,092,607 | ||||||||||||||
| (f | ) | Variable (3.0% at 12/31/09 | 4/1/2016 | 5,755,882 | 2,041,373 | |||||||||||||
| and 3.0% at 12/31/08) | 11,666,844 | 8,133,980 | ||||||||||||||||
| M&I Bank | Variable (4.13% at 12/31/09 | 12/31/2010 | 9,895,727 | 9,895,727 | ||||||||||||||
| and 6.8% at 12/31/08) | 12/31/2010 | 11,524,451 | 11,524,451 | |||||||||||||||
| 21,420,178 | 21,420,178 | |||||||||||||||||
| General Electric Capital Corp. | Fixed (3.36%) | 12/1/2017 | 9,122,315 | 9,396,990 | ||||||||||||||
| Variable (2.05% at 12/31/09 | ||||||||||||||||||
| and 3.6% at 12/31/08) | 3/1/2019 | 11,300,000 | 9,557,647 | |||||||||||||||
| (c | ) | Variable (3.0% at 12/31/09 | 4/1/2014 | 11,400,000 | 9,887,995 | |||||||||||||
| and 4.4% at 12/31/08) | 31,822,315 | 28,842,632 | ||||||||||||||||
| Fortress Credit Corp. | (b | ) | Variable (5.98% at 12/31/09 | 3/5/2010 | 83,524,828 | 74,899,566 | ||||||||||||
| and 6.63% at 12/31/08) | ||||||||||||||||||
| First National Bank of Omaha | (a | ) | Variable (5.5% at 12/31/09 | 7/1/2010 | 20,400,000 | 24,400,000 | ||||||||||||
| and 3.03% at 12/31/08) | ||||||||||||||||||
| First National Bank of Omaha | (a | ) | Fixed (5.25)% | 7/1/2013 | 16,081,630 | 16,889,585 | ||||||||||||
| First National Bank of Omaha | (a | ) | Fixed (6.62)% | 4/1/2012 | — | 2,971,977 | ||||||||||||
| First National Bank of Omaha | Fixed (5.25)% | 2/1/2014 | 8,771,867 | 13,462,622 | ||||||||||||||
| Bank of Cascades | (d | ) | Variable (6.0% at 12/31/09 | 9/30/2011 | 12,445,888 | 1,862,974 | ||||||||||||
| and 6.0% at 12/31/08) | ||||||||||||||||||
| Compass Bank | (e | ) | Variable (4.5% at 12/31/09 | 5/17/2018 | 15,657,044 | 2,958,429 | ||||||||||||
| and 3.0% at 12/31/08) | ||||||||||||||||||
| Total long-term debt | 404,724,650 | 370,335,437 | ||||||||||||||||
| Less current portion | (134,370,900 | ) | (19,508,600 | ) | ||||||||||||||
| Total long-term debt, net of current portion | $ | 270,353,750 | $ | 350,826,837 | ||||||||||||||
| (a) | The Company has a credit pool agreement with the First National Bank of Omaha providing the Company with medium-term financing up to $35,000,000 on a revolving basis through June 2010. The agreement allows for two-year |
F-42
SUMMIT HOTEL PROPERTIES, LLC
NOTES TO CONSOLIDATED FINANCIAL STATEMENTS — (Continued)
| interest only notes and five-year amortizing notes, for which the term of an individual note can extend beyond the term of the agreement. Interest on unpaid principal is payable monthly at a rate LIBOR plus 4.0% and a floor of between 5.25% and 5.50%. The amount of credit available on this agreement to the Company was $0 at December 31, 2009. | ||
| (b) | On March 5, 2007, the Company closed on a loan with Fortress Credit Corporation to refinance the debt on several construction projects and provide equity for the acquisition, development and construction of additional real estate and hotel properties. The loan is in the amount of $99,700,000. The current balance on this note is $83,524,828 and carries a variable interest rate of 30-day LIBOR plus 575 basis points. The maturity date of the note is March 5, 2010. The amount of credit available on this loan was $16,175,172 at December 31, 2009. | |
| (c) | On February 29, 2008, the Company entered into a loan with General Electric Capital Corporation in the amount of $11,400,000 to fund the land acquisition and hotel construction located in San Antonio, TX. The loan carries a variable interest rate of 90 day LIBOR plus 225 basis points and matures in May 2014. The current balance is approximately $11,400,000. |
| (d) | On October 3, 2008, the Company entered into a loan with Bank of the Cascades in the amount of $13,270,000 to fund the land acquisition and hotel construction of the Residence Inn located in Portland, OR. The loan carries a variable interest rate of Prime, with a floor of 6%, and matures September 30, 2011. The current balance is approximately $12,445,888. The amount of credit available on this loan was approximately $824,000 at December 31, 2009. |
| (e) | On September 17, 2008, the Company entered into a loan with Compass Bank in the amount of $19,250,000 to fund the land acquisition and hotel construction of the Courtyard by Marriott located in Flagstaff, AZ. The loan carries a variable interest rate of Prime minus 25 basis points and matures May 17, 2018. The current balance is approximately $15,657,044. The amount of credit available on this loan was approximately $3,593,000 at December 31, 2009. |
| (f) | On October 1, 2008, the Company entered into a loan with BNC National Bank in the amount of $6,460,000 to fund the land acquisition and hotel construction of the Holiday Inn Express located in Twin Falls, ID. The loan carries a variable interest rate of Prime minus 25 basis points and matures April 1, 2016. The current balance is approximately $5,755,882. The amount of credit available on this loan was approximately $704,000 at December 31, 2009. |
| (g) | On March 10, 2009, the Company entered into a loan modification agreement with MetaBank in the amount of $7,450,000 on the Boise, ID Cambria Suites. The loan modification extended the maturity date to April 1, 2012. |
| (h) | On June 29, 2009, the Company entered into a loan with Bank of the Ozarks in the amount of $10,816,000 to fund the hotel construction located in Portland, OR. The loan carries a variable interest rate of 90 day LIBOR plus 400 basis points with a floor of 6.75% and matures on June 29, 2012. The current balance is approximately $5,794,427. The amount of credit available on this loan was approximately $4,778,000 at December 31, 2009. | |
| (i) | On December 9, 2009, the Company entered into two loans with National Western Life Insurance Company in the amounts of $8,650,000 and $5,350,000 to refinance the JP Morgan debt on the two Scottsdale, AZ hotels. The loans carry a fixed rate of 8.0% and mature on January 1, 2015. The current balance on the two notes is $14,000,000. |
Maturities of long-term debt for each of the next five years are estimated as follows:
| 2010 | $ | 134,370,900 | ||
| 2011 | 19,601,500 | |||
| 2012 | 147,401,500 | |||
| 2013 | 36,369,600 | |||
| 2014 | 28,574,200 | |||
| Thereafter | 38,406,950 | |||
| $ | 404,724,650 | |||
At December 31, 2009 and 2008, the Company owned 64 and 62 properties, respectively, that were pledged as collateral on various credit agreements, as well as accounts receivable and intangible assets. Some of the credit agreements were also guaranteed by the affiliated members of the Company and certain affiliated entities. Significant
F-43
SUMMIT HOTEL PROPERTIES, LLC
NOTES TO CONSOLIDATED FINANCIAL STATEMENTS — (Continued)
covenants in the credit agreements require the Company to maintain minimum debt service coverage ratios. The weighted-average interest rate for all borrowings was 5.40% and 5.01% at December 31, 2009 and 2008, respectively.
NOTE 12—LINES OF CREDIT AND NOTES PAYABLE
The Company has a line-of-credit agreement with the First National Bank of Omaha providing the Company with short-term financing up to $28,200,000 on a revolving basis. Interest on unpaid principal is payable monthly at a rate equal to LIBOR plus 4.0%, with a floor of 5.5%. The amount of outstanding on this line-of-credit was $21,457,943 and $12,288,500 at December 31, 2009 and 2008, respectively, which also represents the maximum amount of borrowings during the year. This line-of-credit is secured by a mortgage on the specific hotels financed.
NOTE 13—MEMBERS’ EQUITY
The Company was formed on January 8, 2004. As specified in the Company’s Operating Agreement, the Company has four classes of membership capital units authorized: Class A, A-1, B and C.
On October 21, 2008, the Company issued a “Confidential Private Placement Memorandum” (PPM) for the purpose of acquiring additional investors. The PPM offered up to $100,000,000 of Class A-1 membership units. For the period ended December 31, 2008, the Company issued 63.25 units in connection with this offering. The Company received proceeds of the offering (net of expenses) of $5,614,466. For the period ended December 31, 2009, the company issued 241.33 units in connection with this offering. The Company received proceeds of the offering (net of expenses) of $22,123,951. The offering closed on October 20, 2009.
NOTE 14—FRANCHISE AGREEMENTS
The Company operates hotels under franchise agreements with various hotel chains expiring through 2025. The franchise agreements are for 3-20 year terms. Under the franchise agreements, the Company pays royalties of 2.5% to 5.0% of room revenues and national advertising and media fees of 3% to 4% of total room revenues.
For the years ended December 31, 2009, 2008 and 2007, the Company incurred royalties of $5,402,948, $6,172,495 and $5,852,019, respectively, and advertising and national media fees of $8,134,854, $8,741,272 and $7,978,134, respectively.
The franchise agreements include restrictions on the transfer of the franchise licenses and the sale or lease of the hotel properties without prior written consent of the franchisor.
NOTE 15—BENEFIT PLANS
The Company has a qualified contributory retirement plan (the Plan), under Section 401(k) of the Internal Revenue Code which covers all full-time employees who meet certain eligibility requirements. Voluntary contributions may be made to the Plan by employees. Discretionary matching Company contributions of $69,385 and $68,543 were made in the years ended December 31, 2008 and 2007, respectively. The Plan was changed to a Safe Harbor Plan effective for the 2008 calendar year. This Plan requires a mandatory employer contribution. Therefore, the Company accrued $137,135 for employer contributions for the 2008 calendar year. The plan was converted back to a discretionary match during the fourth quarter 2009. Therefore, the employer contributions expense for the first three quarters of 2009 was $116,020.
NOTE 16—COMMITMENTS AND CONTINGENCIES
The Company leases land for two of its Ft. Smith properties under the terms of operating ground lease agreements expiring August 2022 and May 2030. The lease on the Ellensburg property was transferred with the sale of that hotel in 2009. The Company has options to renew the other leases for periods that range from 5-30 years. The Company has a prepaid land lease on the Portland hotels with a remaining balance of $3,635,595 on December 31, 2009. This lease
F-44
SUMMIT HOTEL PROPERTIES, LLC
NOTES TO CONSOLIDATED FINANCIAL STATEMENTS — (Continued)
expires in June 2084. Total rent expense for these leases for the years ended December 31, 2009, 2008 and 2007 was $321,916, $235,549 and $248,246, respectively.
Approximate future minimum rental payments for noncancelable operating leases in excess of one year are as follows:
| 2010 | $ | 237,475 | ||
| 2011 | 241,855 | |||
| 2012 | 246,366 | |||
| 2013 | 251,012 | |||
| 2014 | 255,798 | |||
| Thereafter | 6,994,127 | |||
| $ | 8,226,633 | |||
NOTE 17—RELATED PARTY TRANSACTIONS
Pursuant to a management agreement, The Summit Group, Inc. (a related party through common ownership and management control) provides management and accounting services for the Company. The agreement provides for the Company to reimburse The Summit Group, Inc. for its actual overhead costs and expenses relating to the managing of the hotel properties. At no time will the reimbursed management expenses exceed 4.5% of annual gross revenues. For the periods ended December 31, 2009, 2008 and 2007, the Company paid reimbursed management expenses of $2,894,078, $4,186,593 and $4,122,048, respectively, and reimbursed accounting services of $589,012, $626,685 and $637,448, respectively. The Company also reimbursed for maintenance and purchasing services of $530,457, $641,526 and $691,174, for the periods ended December 31, 2009, 2008 and 2007, respectively. At December 31, 2009 and 2008, the Company had accounts payable of $252,113 and $572,919, respectively, to The Summit Group, Inc. The Company cannot remove The Summit Group, Inc. as its manager except for cause as specified in the agreement.
As of December 31, 2009 and 2008, the Company had accounts payable to The Summit Group, Inc. for $242,135 and $2,600,260 relating to reimbursement and development expenses for 5 and 17 new hotel properties, respectively. The Company reimbursed The Summit Group, Inc. for development expenses in the amount of $1,300,000 and $1,995,000 for the years ended December 31, 2009 and 2008, respectively.
In 2008, the Company issued a private placement memorandum (PPM) for the purpose of acquiring additional investors. Summit Capital Partners, LLC (SCP), a related party through common ownership and management control, brokered securities related to the PPM for the company. For the year ended December 31, 2008, capital contributions of $6,325,000 (cash proceeds received net of expenses equaled $5,614,466) was raised with the assistance of SCP. Commission expense paid to SCP for the year ended December 31, 2008 was $206,625. For the year ended December 31, 2009, capital contributions of $24,133,000 (cash proceeds received net of expenses equaled $22,123,951) was raised with the assistance of SCP. Commission expense paid to SCP for the year ended December 31, 2009 was $570,600.
NOTE 18—SUBSEQUENT EVENTS
The Company and Fortress Credit Corp (“Fortress”) have agreed to the material terms of an extension of the Company’s loan with Fortress (“Fortress Loan”). In March 2007 the Company entered into the Fortress Loan, in the amount of $99.7 million and with a maturity date of March 5, 2010. To permit the parties to finalize the definitive documentation for the extension, Fortress has agreed to forbear from declaring a default or otherwise enforcing its rights under the Fortress Loan until April 5, 2010. The extension is anticipated to be for a period of one year, with an option for an additional six month extension contingent on meeting certain requirements.
F-45
SUMMIT HOTEL PROPERTIES, LLC
NOTES TO CONSOLIDATED FINANCIAL STATEMENTS — (Continued)
NOTE 19—SELECTED QUARTERLY FINANCIAL DATA (UNAUDITED)
Selected consolidated quarterly financial data (in thousands, except per unit amounts) for 2009, 2008 and 2007 is summarized below. The sum of the quarterly earnings (loss) per unit amounts may not equal the annual earnings per unit amounts due primarily to changes in the number of common units and common unit equivalents outstanding from quarter to quarter. The matters which affect the comparability of our quarterly results include seasonality.
| Three Months Ended | Year Ended | |||||||||||||||||||
| 3/31 | 6/30 | 9/30 | 12/31 | 12/31 | ||||||||||||||||
| 2009 (restated): | ||||||||||||||||||||
| Total revenue | $ | 29,301 | $ | 31,293 | $ | 32,211 | $ | 28,395 | $ | 121,200 | ||||||||||
| Net income (loss) from continuing operations before minority interests | (1,698 | ) | (1,619 | ) | (6,914 | ) | (7,548 | ) | (17,779 | ) | ||||||||||
| Less minority interests in operations of consolidated partnerships | (123 | ) | (63 | ) | 393 | (207 | ) | — | ||||||||||||
| Net income (loss) from continuing operations | (1,575 | ) | (1,556 | ) | (7,307 | ) | (7,341 | ) | (17,779 | ) | ||||||||||
| Discontinued operations | 104 | 1,697 | (336 | ) | — | 1,465 | ||||||||||||||
| Net income (loss) before income taxes | (1,471 | ) | 141 | (7,643 | ) | (7,341 | ) | (16,314 | ) | |||||||||||
| Less state income tax | — | — | (20 | ) | 20 | — | ||||||||||||||
| Net income (loss) | $ | (1,471 | ) | $ | 141 | $ | (7,623 | ) | $ | (7,361 | ) | $ | (16,314 | ) | ||||||
| Net income (loss) per unit: | $ | (893.99 | ) | $ | 82.31 | $ | (4,422.24 | ) | $ | (4,157.62 | ) | $ | (9,391.54 | ) | ||||||
| 2008: | ||||||||||||||||||||
| Total revenue | $ | 32,381 | $ | 35,556 | $ | 38,018 | $ | 29,152 | $ | 135,107 | ||||||||||
| Net income (loss) from continuing operations before minority interests | 459 | 2,688 | 5,337 | (4,473 | ) | 4,011 | ||||||||||||||
| Less minority interests in operations of consolidated partnerships | 244 | 73 | (158 | ) | 225 | 384 | ||||||||||||||
| Net income (loss) from continuing operations | 215 | 2,615 | 5,495 | (4,698 | ) | 3,627 | ||||||||||||||
| Discontinued operations | 290 | 1,751 | 8,048 | 189 | 10,278 | |||||||||||||||
| Net income (loss) before income taxes | 505 | 4,366 | 13,543 | (4,509 | ) | 13,905 | ||||||||||||||
| Less state income tax | — | 309 | 895 | (378 | ) | 826 | ||||||||||||||
| Net income (loss) | $ | 505 | $ | 4,057 | $ | 12,648 | $ | (4,131 | ) | $ | 13,079 | |||||||||
| Net income (loss) per unit: | $ | 324.79 | $ | 2,609.29 | $ | 8,134.65 | $ | (2,656.88 | ) | $ | 8,411.67 | |||||||||
| 2007: | ||||||||||||||||||||
| Total revenue | $ | 25,855 | $ | 29,105 | $ | 30,590 | $ | 28,339 | $ | 113,889 | ||||||||||
| Net income (loss) from continuing operations before minority interests | 2,624 | 875 | 2,919 | (2,500 | ) | 3,918 | ||||||||||||||
| Less minority interests in operations of consolidated partnerships | 333 | 219 | (107 | ) | 333 | 778 | ||||||||||||||
| Net income (loss) from continuing operations | 2,291 | 656 | 3,026 | (2,833 | ) | 3,140 | ||||||||||||||
| Discontinued operations | 6 | 3,561 | 2,076 | 5,944 | 11,587 | |||||||||||||||
| Net income (loss) before income taxes | 2,297 | 4,217 | 5,102 | 3,111 | 14,727 | |||||||||||||||
| Less state income tax | 72 | 411 | 298 | (66 | ) | 715 | ||||||||||||||
| Net income (loss) | $ | 2,225 | $ | 3,806 | $ | 4,804 | $ | 3,177 | $ | 14,012 | ||||||||||
| Net income (loss) per unit: | $ | 1,431.02 | $ | 2,447.86 | $ | 3,089.73 | $ | 2,043.31 | $ | 9,012.19 | ||||||||||
F-46
SUMMIT HOTEL PROPERTIES, LLC
NOTES TO CONSOLIDATED FINANCIAL STATEMENTS — (Continued)
NOTE 20—PRO FORMA FINANCIAL INFORMATION (UNAUDITED)
The following condensed pro forma financial information is presented as if the acquisitions discussed in Note 6 had been consummated as of the beginning of the period presented but is not necessarily indicative of what actual results of operations of the Company would have been assuming the acquisitions had been consummated at that time nor does it purport to represent the results of operations for future periods.
| For the Year Ended December 31: | ||||||||||||
| 2009 | ||||||||||||
| (restated) | 2008 | 2007 | ||||||||||
| Total revenue | $ | 121,199,736 | $ | 142,583,370 | $ | 136,638,460 | ||||||
| Net income before minority interests | (16,466,961 | ) | 12,984,433 | 14,040,192 | ||||||||
| Minority interests in operations of consolidated partnerships | — | 384,269 | 777,762 | |||||||||
| Net income | $ | (16,466,961 | ) | $ | 12,600,164 | $ | 13,262,430 | |||||
| Net income per unit: | $ | (9,479.41 | ) | $ | 8,103.89 | $ | 8,529.83 | |||||
NOTE 21—CORRECTION OF AN IMMATERIAL ERROR
As disclosed in the quarterly report on Form 10-Q of the Company, for the quarter ended March 31, 2010, the Company recorded an impairment charge of $1,173,100 to write down the carrying value of its Courtyard hotel in Memphis, TN to fair value. Management’s evaluation of impairment for this property as of December 31, 2009 indicated a potential impairment, however, management concluded at that time that the amount was not material to the 2009 financial statements. Subsequently, management concluded that the fair value at December 31, 2009 was not different from the fair value that was determined in the quarter ended March 31, 2010. Therefore, management believes the impairment charge should have been recorded in the quarter ended December 31, 2009. The effect of the error was to understate Loss on Impairment of Assets for the year ended December 31, 2009 and to overstate Property and Equipment, net at December 31, 2009.
The following is a summary of the effects of the correction on the Company’s consolidated balance sheet as of December 31, 2009 and the consolidated statement of operations, statement of cash flows, and statement of changes in members’ equity for the year ended December 31, 2009. This correction also affected sections of Notes 1, 3, 19 and 20.
| December 31, 2009 | ||||||||
| As Previously | As | |||||||
| Reported | Restated | |||||||
| Consolidated Balance Sheet | ||||||||
| Property and Equipment, net | $ | 483,940,701 | $ | 482,767,601 | ||||
| Total Assets | $ | 519,419,531 | $ | 518,246,431 | ||||
| Class A, 1,166.62 units | $ | 60,451,469 | $ | 59,961,958 | ||||
Class A-1, 437.83 & 196.50 units | 34,330,877 | 34,244,056 | ||||||
| Class B, 81.36 units | 1,891,187 | 1,804,718 | ||||||
| Class C, 173.60 units | (12,576,658 | ) | (13,086,957 | ) | ||||
| Total Summit Hotel Properties, LLC members’ equity | $ | 84,096,875 | $ | 82,923,775 | ||||
| Total Equity | $ | 82,472,412 | $ | 81,299,312 | ||||
| Total Liabilities and Members’ Equity | $ | 519,419,531 | $ | 518,246,431 | ||||
| Consolidated Statement of Operations | ||||||||
| Loss on impairment of assets | $ | 6,332,836 | $ | 7,505,836 | ||||
| Costs and expenses | 119,530,510 | 120,703,610 | ||||||
| Income from operations | 1,669,226 | 496,126 | ||||||
| Income (loss) from continuing operations | (16,606,040 | ) | (17,779,140 | ) | ||||
F-47
SUMMIT HOTEL PROPERTIES, LLC
NOTES TO CONSOLIDATED FINANCIAL STATEMENTS — (Continued)
| December 31, 2009 | ||||||||
| As Previously | As | |||||||
| Reported | Restated | |||||||
| Net income (loss) before income taxes | $ | (15,141,232 | ) | $ | (16,314,332 | ) | ||
| Net income (loss) | (15,141,232 | ) | (16,314,332 | ) | ||||
| Net loss attributable to Summit Hotel Properties, LLC | $ | (15,141,232 | ) | $ | (16,314,332 | ) | ||
| Basic and diluted loss per $100,000 capital unit | $ | (8,716.23 | ) | $ | (9,391.54 | ) | ||
| Consolidated Statement of Changes in Members’ Equity | ||||||||
| Net Income (Loss) | $ | (15,141,323 | ) | $ | (16,314,332 | ) | ||
| Class A | (6,318,133 | ) | (6,807,644 | ) | ||||
| Class A-1 | (1,120,603 | ) | (1,207,424 | ) | ||||
| Class B | (1,116,060 | ) | (1,202,529 | ) | ||||
| Class C | (6,586,436 | ) | (7,096,735 | ) | ||||
| Total Summit Hotel Properties, LLC members’ equity | $ | 84,096,875 | $ | 82,923,775 | ||||
| Class A | 60,451,469 | 59,961,958 | ||||||
| Class A-1 | 34,330,877 | 34,244,056 | ||||||
| Class B | 1,891,187 | 1,804,718 | ||||||
| Class C | (12,576,658 | ) | (13,086,957 | ) | ||||
| Consolidated Statement of Cash Flows Net income (loss) | $ | (15,141,232 | ) | $ | (16,314,332 | ) | ||
| Loss on impairment of assets | $ | 6,332,836 | $ | 7,505,836 | ||||
F-48

Shares of Common Stock
PROSPECTUS
Baird
, 2010
PART II. INFORMATION NOT REQUIRED IN PROSPECTUS
| Item 31. | Other Expenses of Issuance and Distribution. |
The following table sets forth the costs and expenses of the sale and distribution of the securities being registered, all of which are being borne by the Registrant.
| SEC registration fee | $ | 23,205 | ||
| FINRA filing fee | 33,045 | |||
| NYSE listing fee | ||||
| Printing and engraving fees | ||||
| Legal fees and expenses | ||||
| Accounting fees and expenses | ||||
| Transfer agent and registrar fees | ||||
| Director and officer liability insurance policy premium | ||||
| Miscellaneous Expenses | ||||
| Total | $ | |||
All expenses, except the SEC registration fee and FINRA filing fee, are estimated.
| Item 32. | Sales to Special Parties. |
On June 30, 2010, we issued 1,000 shares of common stock to our Executive Chairman, Mr. Boekelheide, in connection with the formation and initial capitalization of our company for an aggregate purchase price of $1,000. These shares were issued in reliance on the exemption set forth in Section 4(2) of the Securities Act. Upon completion of this offering, we will repurchase these shares from Mr. Boekelheide for $1,000.
| Item 33. | Recent Sales of Unregistered Securities. |
On June 30, 2010, we issued 1,000 shares of common stock to our Executive Chairman, Mr. Boekelheide, in connection with the formation and initial capitalization of our company for an aggregate purchase price of $1,000. These shares were issued in reliance on the exemption set forth in Section 4(2) of the Securities Act. Upon completion of this offering, we will repurchase these shares from Mr. Boekelheide for $1,000.
Concurrently with this offering, we will sell in a separate private placement to an affiliate of IHG $12.5 million in shares of our common stock (subject to a maximum investment of 4.9% of the total number of shares to be sold in this offering, excluding any shares sold pursuant to the underwriters’ over-allotment option) at a price per share equal to the IPO price per share less the underwriting discount. The shares will be sold to an affiliate of IHG in reliance on the exemption set forth in Section 4(2) of the Securities Act.
| Item 34. | Indemnification of Directors and Officers. |
The MGCL permits a Maryland corporation to include in its charter a provision limiting the liability of its directors and officer to the corporation and its stockholders for money damages, except for liability resulting from (1) actual receipt of an improper benefit or profit in money, property or services or (2) active and deliberate dishonesty that is established by a final judgment and is material to the cause of action. Our charter contains a provision that eliminates such liability to the maximum extent permitted by Maryland law.
The MGCL requires a corporation (unless its charter provides otherwise, which our charter does not) to indemnify a director or officer who has been successful, on the merits or otherwise, in the defense of any proceeding to which he or she is made, or threatened to be made, a party by reason of his or her service in that capacity. The MGCL permits a corporation to indemnify its present and former directors and officers, among others, against judgments, penalties, fines, settlements and reasonable expenses actually incurred by them in connection with any proceeding to which they may be
II-1
made, or threatened to be made, a party by reason of their service in those or other capacities unless it is established that:
| • | the act or omission of the director or officer was material to the matter giving rise to the proceeding and (1) was committed in bad faith or (2) was the result of active and deliberate dishonesty; | |
| • | the director or officer actually received an improper personal benefit in money, property or services; or | |
| • | in the case of any criminal proceeding, the director or officer had reasonable cause to believe that the act or omission was unlawful. |
However, under the MGCL, a Maryland corporation may not indemnify for an adverse judgment in a suit by or in the right of the corporation or for a judgment of liability on the basis that personal benefit was improperly received, unless in either case a court orders indemnification if it determines that the director or officer is fairly and reasonably entitled to indemnification, and then only for expenses. In addition, the MGCL permits a Maryland corporation to advance reasonable expenses to a director or officer upon its receipt of:
| • | a written affirmation by the director or officer of his or her good faith belief that he or she has met the standard of conduct necessary for indemnification by the corporation; and | |
| • | a written undertaking by the director or officer or on the director’s or officer’s behalf to repay the amount paid or reimbursed by the corporation if it is ultimately determined that the director or officer did not meet the standard of conduct. |
Our charter authorizes us and our bylaws obligate us, to the maximum extent permitted by Maryland law in effect from time to time, to indemnify and, without requiring a preliminary determination of the ultimate entitlement to indemnification, pay or reimburse reasonable expenses in advance of final disposition of such a proceeding to:
| • | any present or former director or officer of our company who is made, or threatened to be made, a party to the proceeding by reason of his or her service in that capacity; or |
| • | any individual who, while a director or officer of our company and at our request, serves or has served as a director, officer, partner, trustee, member or manager of another corporation, real estate investment trust, limited liability company, partnership, joint venture, trust, employee benefit plan or other enterprise and who is made, or threatened to be made, a party to the proceeding by reason of his or her service in that capacity. |
Our charter and bylaws also permit us to indemnify and advance expenses to any individual who served our predecessor in any of the capacities described above and to any employee or agent of our company or our predecessor.
Upon completion of this offering, we intend to enter into indemnification agreements with each of our directors and executive officer that would provide for indemnification to the maximum extent permitted by Maryland law.
Insofar as the foregoing provisions permit indemnification of directors, officer or persons controlling us for liability arising under the Securities Act, we have been informed that in the opinion of the SEC, this indemnification is against public policy as expressed in the Securities Act and is therefore unenforceable.
| Item 35. | Treatment of Proceeds from Stock Being Registered. |
None.
| Item 36. | Financial Statements and Exhibits. |
| (a) | Financial Statements. |
See page F-1 for an index of the financial statements included in this Registration Statement on Form S-11.
| (b) | Exhibits. |
The list of exhibits following the signature page of this Registration Statement on Form S-11 is incorporated herein by reference.
II-2
| Item 37. | Undertakings. |
(a) The undersigned registrant hereby undertakes to provide to the underwriters at the closing specified in the underwriting agreement certificates in such denominations and registered in such names as required by the underwriters to permit prompt delivery to each purchaser.
(b) Insofar as indemnification for liabilities arising under the Securities Act of 1933 may be permitted to directors, officers and controlling persons of the registrant pursuant to the foregoing provisions, or otherwise, the registrant has been advised that in the opinion of the Securities and Exchange Commission such indemnification is against public policy as expressed in the Act and is, therefore, unenforceable. In the event that a claim for indemnification against such liabilities (other than the payment by the registrant of expenses incurred or paid by a director, officer or controlling person of the registrant in the successful defense of any action, suit or proceeding) is asserted by such director, officer or controlling person in connection with the securities being registered, the registrant will, unless in the opinion of its counsel the matter has been settled by controlling precedent, submit to a court of appropriate jurisdiction the question whether such indemnification by it is against public policy as expressed in the Act and will be governed by the final adjudication of such issue.
(c) The undersigned Registrant hereby further undertakes that:
(1) For purposes of determining any liability under the Securities Act of 1933, the information omitted from the form of prospectus filed as part of this registration statement in reliance upon Rule 430A and contained in a form of prospectus filed by the Registrant pursuant to Rule 424(b)(1) or (4) or 497(h) under the Securities Act shall be deemed to be part of this registration statement as of the time it was declared effective.
(2) For the purpose of determining any liability under the Securities Act of 1933, each post-effective amendment that contains a form of prospectus shall be deemed to be a new registration statement relating to the securities offered therein, and the offering of such securities at that time shall be deemed to be the initial bona fide offering thereof.
II-3
SIGNATURES
Pursuant to the requirements of the Securities Act of 1933, the registrant certifies that it has reasonable grounds to believe that it meets all of the requirements for filing on Form S-11 and has duly caused this Amendment No. 3 to be signed on its behalf by the undersigned, thereunto duly authorized, in the City of Sioux Falls, State of South Dakota on December 2, 2010.
SUMMIT HOTEL PROPERTIES, INC.
| By: | /s/ Kerry W. Boekelheide |
Kerry W. Boekelheide,
Executive Chairman
Pursuant to the requirements of the Securities Act of 1933, this Registration Statement has been signed below by the following person in the capacities and on the dates indicated.
Signature | Title | Date | ||||
/s/ Kerry W. Boekelheide Kerry W. Boekelheide | Executive Chairman of the Board and Director | December 2, 2010 | ||||
/s/ Daniel P. Hansen Daniel P. Hansen | President and Chief Executive Officer and Director (principal executive officer) | December 2, 2010 | ||||
/s/ Stuart J. Becker Stuart J. Becker | Executive Vice President and Chief Financial Officer (principal financial officer) | December 2, 2010 | ||||
/s/ JoLynn M. Sorum JoLynn M. Sorum | Vice President, Controller and Chief Accounting Officer (principal accounting officer) | December 2, 2010 | ||||
II-4
EXHIBIT INDEX
| Exhibit | ||||
Number | Exhibit Description | |||
| 1 | .1* | Form of Underwriting Agreement | ||
| 3 | .1** | Form of Articles of Amendment and Restatement of Summit Hotel Properties, Inc. | ||
| 3 | .2** | Form of Amended and Restated Bylaws of Summit Hotel Properties, Inc. | ||
| 3 | .3** | Form of First Amended and Restated Agreement of Limited Partnership of Summit Hotel OP, LP (replaces Exhibit 3.3 previously filed by the Registrant on Form S-11 on September 23, 2009 (File No. 333-168685)) | ||
| 4 | .1** | Form of Common Stock Certificate | ||
| 5 | .1* | Opinion of Venable LLP regarding the validity of the securities being registered | ||
| 8 | .1* | Opinion of Hunton & Williams LLP regarding tax matters | ||
| 10 | .1** | Agreement and Plan of Merger, dated August 5, 2010, by and among Summit Hotel Properties, LLC and Summit Hotel OP, LP | ||
| 10 | .2(a)** | Contribution Agreement, dated August 5, 2010, by and between The Summit Group, Inc. and Summit Hotel OP, LP | ||
| 10 | .2(b)** | Contribution Agreement, dated August 5, 2010, by and between Summit Hotel OP, LP and Gary Tharaldson | ||
| 10 | .3** | Form of Hotel Management Agreement | ||
| 10 | .4** | Form of TRS Lease | ||
| 10 | .5** | Form of Summit Hotel Properties, Inc. 2010 Equity Incentive Plan | ||
| 10 | .6** | Form of Option Award Agreement | ||
| 10 | .7** | Form of Employment Agreement between Summit Hotel Properties, Inc. and Kerry W. Boekelheide | ||
| 10 | .8** | Form of Employment Agreement between Summit Hotel Properties, Inc. and Daniel P. Hansen | ||
| 10 | .9** | Form of Employment Agreement between Summit Hotel Properties, Inc. and Craig J. Aniszewski | ||
| 10 | .10** | Form of Employment Agreement between Summit Hotel Properties, Inc. and Stuart J. Becker | ||
| 10 | .11** | Form of Employment Agreement between Summit Hotel Properties, Inc. and Ryan A. Bertucci | ||
| 10 | .12** | Form of Severance Agreement between Summit Hotel Properties, Inc. and Christopher R. Eng | ||
| 10 | .13** | Form of Severance Agreement between Summit Hotel Properties, Inc. and JoLynn M. Sorum | ||
| 10 | .14** | Form of Indemnification Agreement between Summit Hotel Properties, Inc. and each of its Executive Officers and Directors (replaces Exhibit 10.14 previously filed by the Registrant on Form S-11 on September 23, 2010 (File No. 333-168686)) | ||
| 10 | .15** | Loan Agreement between Summit Hotel Properties, LLC and ING Life Insurance and Annuity Company dated December 23, 2005 | ||
| 10 | .16** | Loan Agreement between Summit Hotel Properties, LLC and ING Life Insurance and Annuity Company, dated June 15, 2006 | ||
| 10 | .17** | First Modification of Loan Agreement between Summit Hotel Properties, LLC and ING Life Insurance and Annuity Company, dated April 24, 2007 | ||
| 10 | .18** | Modification of Promissory Note and Loan Agreement between Summit Hotel Properties, LLC and ING Life Insurance and Annuity Company, dated November 28, 2007 | ||
| 10 | .19** | Loan Agreement between Summit Hotel Properties, LLC and General Electric Capital Corporation, dated April 30, 2007, for a loan in the amount of $9,500,000 | ||
| 10 | .20** | Loan Agreement between Summit Hotel Properties, LLC and General Electric Capital Corporation, dated August 15, 2007, for a loan in the amount of $11,300,000 | ||
| 10 | .21** | Loan Modification Agreement between Summit Hotel Properties, LLC and General Electric Capital Corporation ($11,300,000 loan), dated December 2008 | ||
| 10 | .22** | Loan Agreement between Summit Hospitality V, LLC and General Electric Capital Corporation, dated February 29, 2008, for a loan in the amount of $11,400,000 | ||
| 10 | .23** | Loan Agreement between Summit Hotel Properties, LLC and Compass Bank, dated September 17, 2008, for a loan in the amount of $19,250,000 | ||
| 10 | .24** | Form of Tax Protection Agreement | ||
| 10 | .25 | Stock Purchase Agreement, dated December 2, 2010, among Summit Hotel Properties, Inc., Summit Hotel OP, LP and Six Continents Limited | ||
| 10 | .26 | Sourcing Agreement, dated December 2, 2010, between InterContinental Hotels Group and Summit Hotel Properties, Inc. | ||
| 21 | .1** | List of Subsidiaries of Summit Hotel Properties, Inc. | ||
| 23 | .1 | Consent of KPMG LLP | ||
| 23 | .2 | Consent of Eide Bailly LLP | ||
| Exhibit | ||||
Number | Exhibit Description | |||
| 23 | .3 | Consent of Gordon, Hughes & Banks, LLP | ||
| 23 | .4* | Consent of Venable LLP (included in Exhibit 5.1) | ||
| 23 | .5* | Consent of Hunton & Williams LLP (included in Exhibit 8.1) | ||
| 99 | .1** | Consent of Bjorn R. L. Hanson to being named as a director | ||
| 99 | .2** | Consent of David S. Kay to being named as a director | ||
| 99 | .3** | Consent of Thomas W. Storey to being named as a director | ||
| 99 | .4** | Consent of Wayne W. Wielgus to being named as a director | ||
| * | To be filed by amendment. | |
| ** | Previously filed. |