Exhibit 99.2
E ARNINGS R ELEASE S UPPLEMENT F OURTH Q UARTER 2022 F EBRUARY 27, 2022
Table of Contents Section I Forward - Looking Statements and Non - GAAP Financial Measure Disclosures Section II Corporate Financial Schedules Section III Operating & Property - Level Schedules Section IV Capitalization and Debt Schedules Section VI Asset Listing 2

Forward - Looking Statements We make forward - looking statements in this presentation that are subject to risks and uncertainties . These forward - looking statements include information about possible or assumed future results of our business, financial condition, liquidity, results of operations, plans, and objectives . When we use the words “believe,” “expect,” “anticipate,” “estimate,” “plan,” “continue,” “intend,” “should,” “may,” or similar expressions, we intend to identify forward - looking statements . Statements regarding the following subjects, among others, may be forward - looking by their nature : • our ability to increase our dividend per share of common stock ; • the state of the U . S . economy generally or in specific geographic regions in which we operate, and the effect of general economic conditions on the lodging industry and our business in particular ; • market trends in our industry, interest rates, real estate values and the capital markets ; • our business and investment strategy and, particularly, our ability to identify and complete hotel acquisitions and dispositions ; • our projected operating results ; • actions and initiatives of the U . S . government and changes to U . S . government policies and the execution and impact of such actions, initiatives and policies ; • our ability to manage our relationships with our management companies and franchisors ; • our ability to maintain our existing and future financing arrangements ; • changes in the value of our properties ; • the impact of and changes in governmental regulations, tax law and rates, accounting guidance and similar matters ; • our ability to satisfy the requirements for qualification as a REIT under the U . S . Tax Code ; • our ability to repay or refinance our indebtedness as it matures or becomes callable by lenders ; • the availability of qualified personnel ; • our ability to make distributions to our stockholders in the future ; • the general volatility of the market price of our securities ; and • the degree and nature of our competition . Forward - looking statements are based on our beliefs, assumptions and expectations of our future performance, taking into account information currently available to us . You should not place undue reliance on these forward - looking statements . These beliefs, assumptions and expectations can change as a result of many possible events or factors, not all of which are known to us . These factors are discussed under “Item 1 A . Risk Factors” in our Annual Report on Form 10 - K for the year ended December 31 , 2022 , and in other documents we have filed with the Securities and Exchange Commission . If a change occurs, our business, financial condition, liquidity and results of operations may vary materially from those expressed in our forward - looking statements . Any forward - looking statement is effective only as of the date on which it is made . New risks and uncertainties arise over time, and it is not possible for us to predict those events or how they may affect us . Except as required by law we are not obligated to, and do not intend to, publicly update or revise any forward - looking statements, whether as a result of new information, future events or otherwise . Additionally, this presentation contains certain unaudited historical and pro forma information and metrics which are based or calculated from historical data that is maintained or produced by Summit or third parties . This presentation contain statistics and other data that may have been obtained from, or compiled from, information made available by third - parties . 3

Non - GAAP Financial Measures We disclose certain “non - GAAP financial measures,” which are measures of our historical financial performance . Non - GAAP financial measures are financial measures not prescribed by Generally Accepted Accounting Principles ("GAAP") . These measures are as follows : (i) Funds From Operations (“FFO”) and Adjusted Funds from Operations ("AFFO"), (ii) Earnings before Interest, Taxes, Depreciation and Amortization ("EBITDA"), Earnings before Interest, Taxes, Depreciation and Amortization for Real Estate (" EBITDA re ") and Adjusted EBITDA re (as described below) . We caution investors that amounts presented in accordance with our definitions of non - GAAP financial measures may not be comparable to similar measures disclosed by other companies, since not all companies calculate these non - GAAP financial measures in the same manner . Our non - GAAP financial measures should be considered along with, but not as alternatives to, net income (loss) as a measure of our operating performance . Our non - GAAP financial measures may include funds that may not be available for our discretionary use due to functional requirements to conserve funds for capital expenditures, property acquisitions, debt service obligations and other commitments and uncertainties . Although we believe that our non - GAAP financial measures can enhance the understanding of our financial condition and results of operations, these non - GAAP financial measures are not necessarily better indicators of any trend as compared to a comparable measure prescribed by GAAP such as net income (loss) . FFO and AFFO As defined by Nareit, FFO represents net income or loss (computed in accordance with GAAP), excluding preferred dividends, gains (or losses) from sales of real property, impairment losses on real estate assets, items classified by GAAP as extraordinary, the cumulative effect of changes in accounting principles, plus depreciation and amortization related to real estate assets, and adjustments for unconsolidated partnerships, and joint ventures . AFFO represents FFO excluding amortization of deferred financing costs, franchise fees, equity - based compensation expense, transaction costs, debt transaction costs, premiums on redemption of preferred shares, losses from net casualties, non - cash interest income and non - cash income tax related adjustments to our deferred tax asset . Unless otherwise indicated, we present FFO and AFFO applicable to our common shares and common units . We present FFO and AFFO because we consider FFO and AFFO an important supplemental measure of our operational performance and believe it is frequently used by securities analysts, investors and other interested parties in the evaluation of REITs, many of which present FFO and AFFO when reporting their results . FFO and AFFO are intended to exclude GAAP historical cost depreciation and amortization, which assumes that the value of real estate assets diminishes ratably over time . Historically, however, real estate values have risen or fallen with market conditions . Because FFO and AFFO exclude depreciation and amortization related to real estate assets, gains and losses from real property dispositions and impairment losses on real estate assets, and certain transaction costs related to lodging property acquisition activities and debt, FFO and AFFO provide performance measures that, when compared year over year, reflect the effect to operations from trends in occupancy, guestroom rates, operating costs, development activities and interest costs, providing perspective not immediately apparent from net income . Our computation of FFO differs slightly from the computation of Nareit - defined FFO related to the reporting of depreciation and amortization expense on assets at our corporate offices, which is de minimus . Our computation of FFO may also differ from the methodology for calculating FFO used by other equity REITs and, accordingly, may not be comparable to such other REITs . FFO and AFFO should not be considered as an alternative to net income (loss) (computed in accordance with GAAP) as an indicator of our liquidity, nor is it indicative of funds available to fund our cash needs, including our ability to pay dividends or make distributions . Where indicated in this Annual Report on Form 10 - K, FFO is based on our computation of FFO and not the computation of Nareit - defined FFO unless otherwise noted . 4
Non - GAAP Financial Measures (cont.) EBITDAre and Adjusted EBITDAre In September 2017 , Nareit proposed a standardized performance measure, called EBITDA re , which is based on EBITDA and is expected to provide additional relevant information about REITs as real estate companies in support of growing interest among generalist investors . The conclusion was reached that, while dedicated REIT investors have long been accustomed to utilizing the industry’s supplemental measures such as FFO and net operating income (“NOI”) to evaluate the investment quality of REITs as real estate companies, it would be helpful to generalist investors for REITs as real estate companies to also present EBITDA re as a more widely known and understood supplemental measure of performance . EBITDA re is intended to be a supplemental non - GAAP performance measure that is independent of a company’s capital structure and will provide a uniform basis for one measurement of the enterprise value of a company compared to other REITs . EBITDA re , as defined by Nareit, is calculated as EBITDA, excluding : (i) loss and gains on disposition of property and (ii) asset impairments, if any . We believe EBITDA re is useful to an investor in evaluating our operating performance because it provides investors with an indication of our ability to incur and service debt, to satisfy general operating expenses, to make capital expenditures and to fund other cash needs or reinvest cash into our business . We also believe it helps investors meaningfully evaluate and compare the results of our operations from period to period by removing the effect of our asset base (primarily depreciation and amortization) from our operating results . We make additional adjustments to EBITDA re when evaluating our performance because we believe that the exclusion of certain additional non - recurring or unusual items described below provides useful supplemental information to investors regarding our ongoing operating performance . We believe that the presentation of Adjusted EBITDA re , when combined with the primary GAAP presentation of net income, is useful to an investor in evaluating our operating performance because it provides investors with an indication of our ability to incur and service debt, to satisfy general operating expenses, to make capital expenditures and to fund other cash needs or reinvest cash into our business . We also believe it helps investors meaningfully evaluate and compare the results of our operations from period to period by removing the effect of our asset base (primarily depreciation and amortization) from our operating results . 5
Table of Contents Section I Forward - Looking Statements and Non - GAAP Financial Measure Disclosures Section II Corporate Financial Schedules Section III Operating & Property - Level Schedules Section IV Capitalization and Debt Schedules Section VI Asset Listing 6
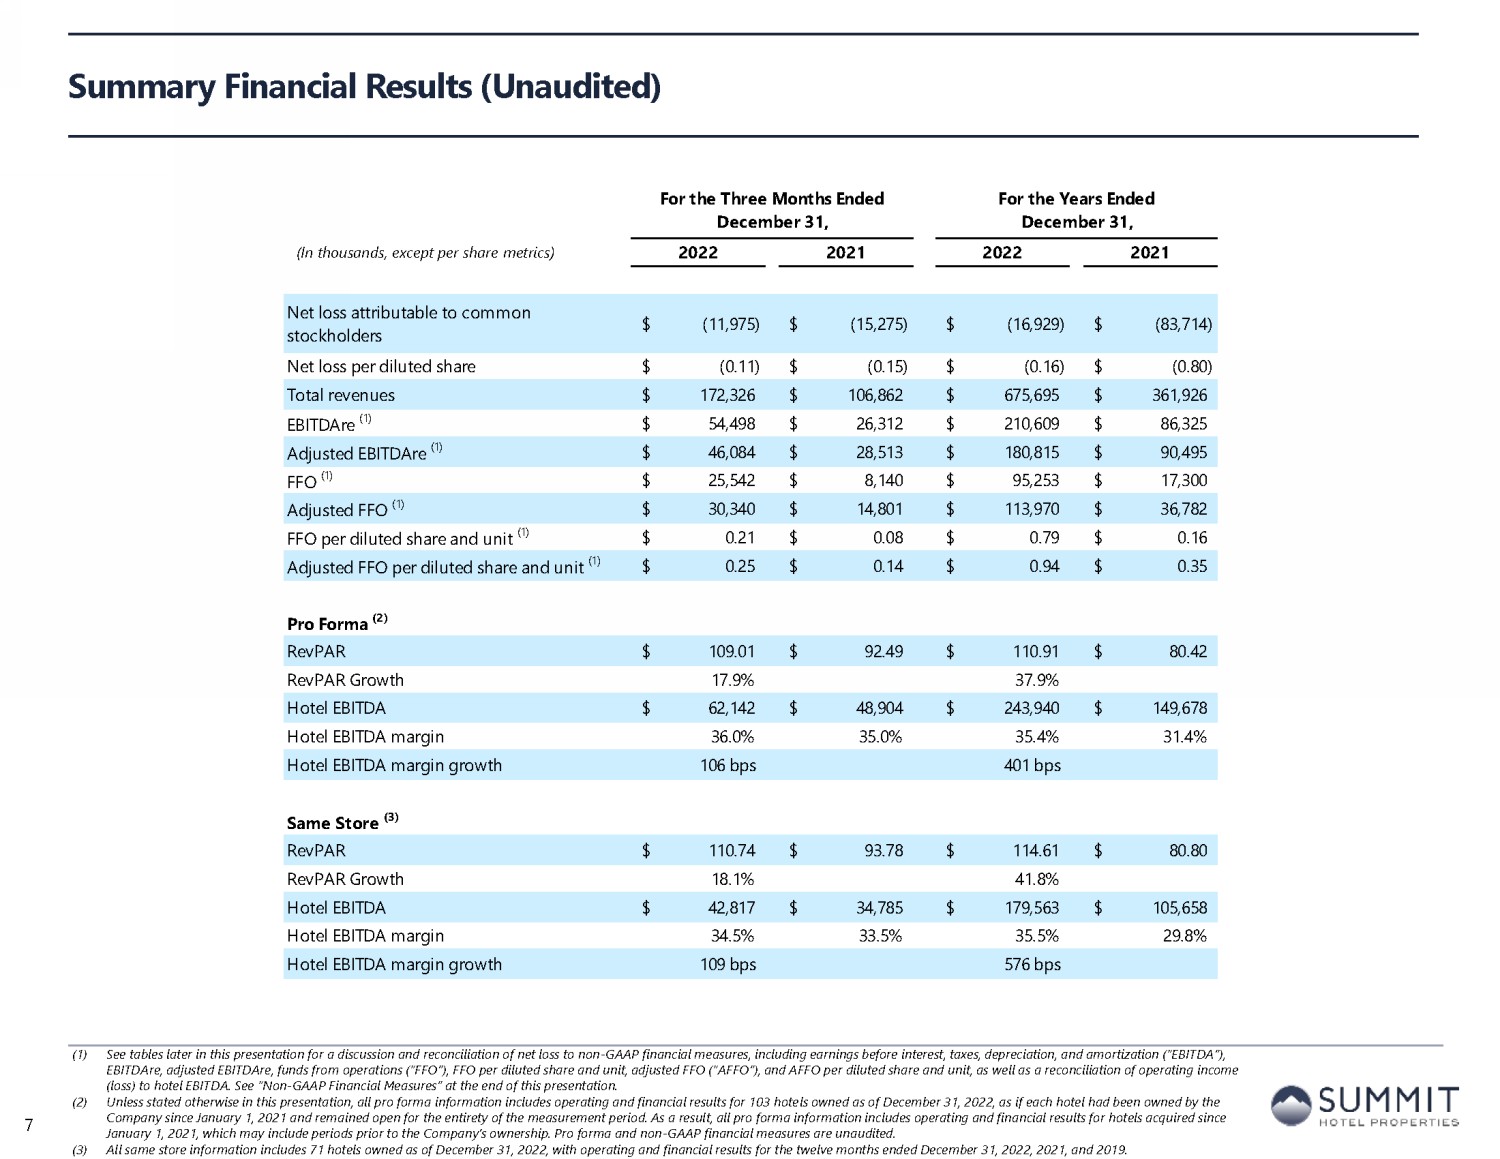
Summary Financial Results (1) See tables later in this presentation for a discussion and reconciliation of net loss to non - GAAP financial measures, including earnings before interest, taxes, depreciation, and amortization (“EBITDA”), EBITDAre, adjusted EBITDAre, funds from operations (“FFO”), FFO per diluted share and unit, adjusted FFO (“AFFO”), and AFFO p er diluted share and unit, as well as a reconciliation of operating income ( loss) to hotel EBITDA. See “Non - GAAP Financial Measures” at the end of this presentation. (2) Unless stated otherwise in this presentation, all pro forma information includes operating and financial results for 103 hote ls owned as of December 31, 2022, as if each hotel had been owned by the Company since January 1, 2021 and remained open for the entirety of the measurement period. As a result, all pro forma inform ati on includes operating and financial results for hotels acquired since January 1, 2021, which may include periods prior to the Company’s ownership. Pro forma and non - GAAP financial measures are unaud ited. (3) All same store information includes 71 hotels owned as of December 31, 2022, with operating and financial results for the twe lve months ended December 31, 2022, 2021, and 2019. (In thousands, except per share metrics) For the Three Months Ended December 31, For the Years Ended December 31, 2022 2021 2022 2021 (unaudited) Net loss attributable to common stockholders (11,975)$ (15,275)$ (16,929)$ (83,714)$ Net loss per diluted share (0.11)$ (0.15)$ (0.16)$ (0.80)$ Total revenues 172,326$ 106,862$ 675,695$ 361,926$ EBITDAre (1) 54,498$ 26,312$ 210,609$ 86,325$ Adjusted EBITDAre (1) 46,084$ 28,513$ 180,815$ 90,495$ FFO (1) 25,542$ 8,140$ 95,253$ 17,300$ Adjusted FFO (1) 30,340$ 14,801$ 113,970$ 36,782$ FFO per diluted share and unit (1) 0.21$ 0.08$ 0.79$ 0.16$ Adjusted FFO per diluted share and unit (1) 0.25$ 0.14$ 0.94$ 0.35$ Pro Forma (2) RevPAR 109.01$ 92.49$ 110.91$ 80.42$ RevPAR Growth 17.9% 37.9% Hotel EBITDA 62,142$ 48,904$ 243,940$ 149,678$ Hotel EBITDA margin 36.0% 35.0% 35.4% 31.4% Hotel EBITDA margin growth 106 bps 401 bps Same Store (3) RevPAR 110.74$ 93.78$ 114.61$ 80.80$ RevPAR Growth 18.1% 41.8% Hotel EBITDA 42,817$ 34,785$ 179,563$ 105,658$ Hotel EBITDA margin 34.5% 33.5% 35.5% 29.8% Hotel EBITDA margin growth 109 bps 576 bps 7
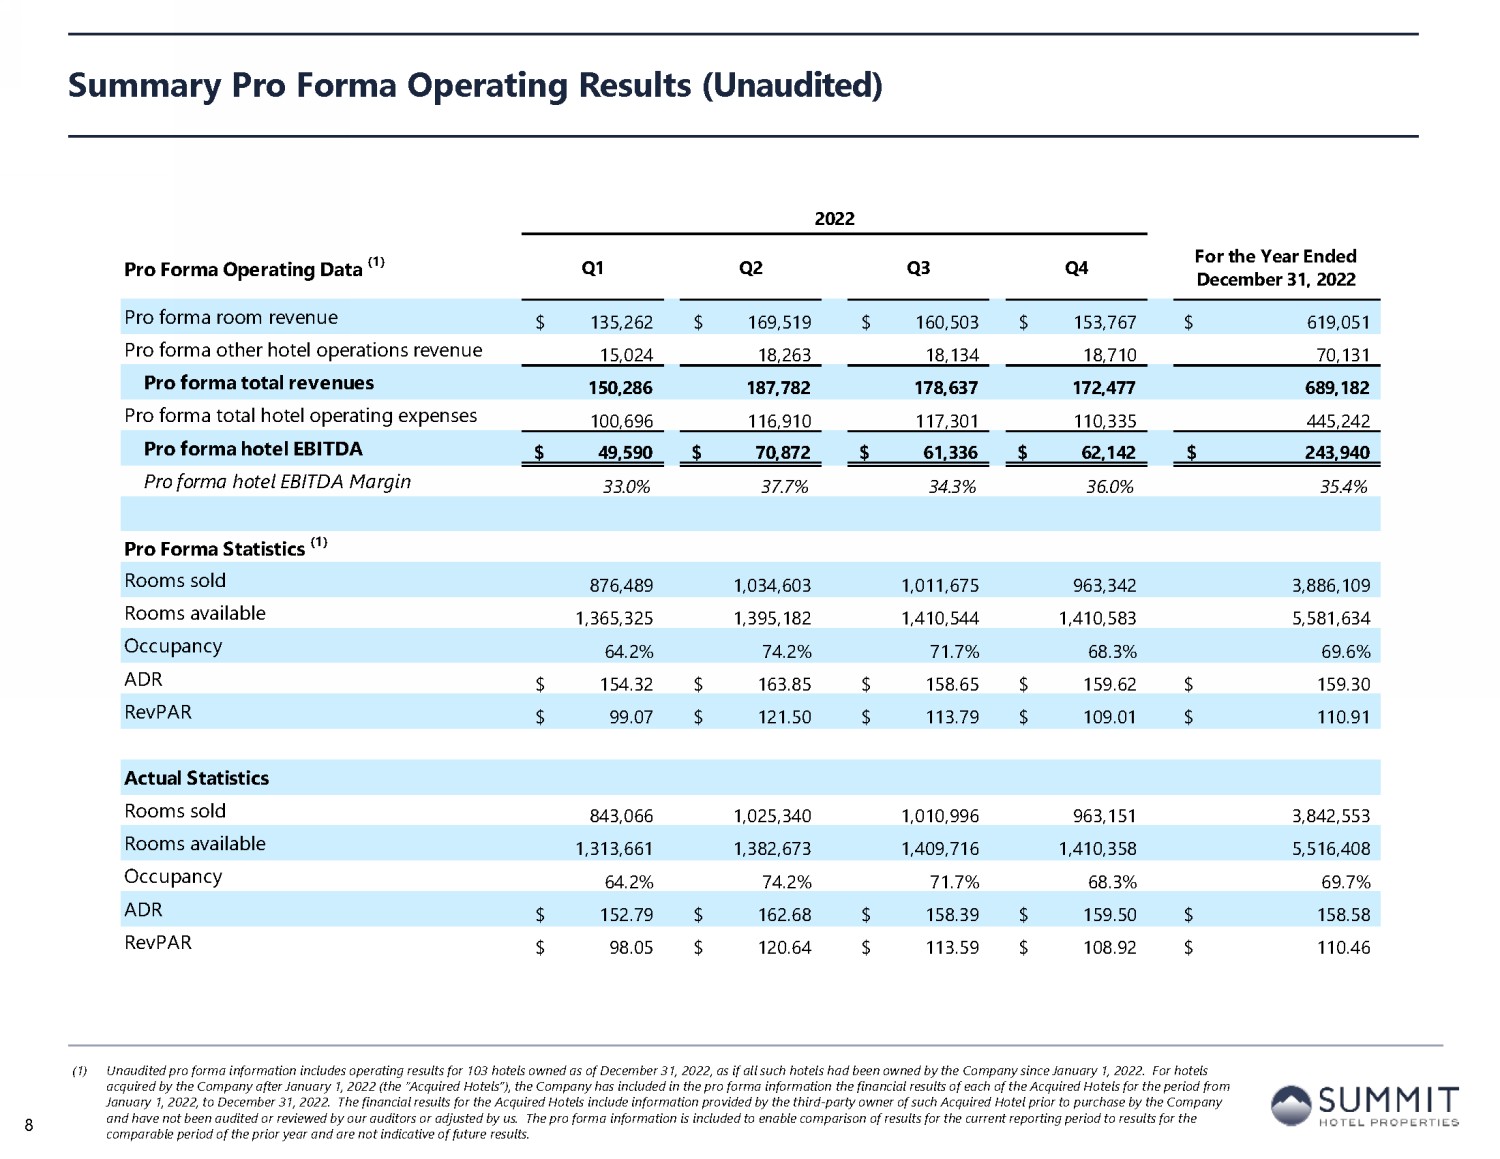
Summary Pro Forma Operating Results (1) Unaudited pro forma information includes operating results for 103 hotels owned as of December 31, 2022, as if all such hotel s h ad been owned by the Company since January 1, 2022. For hotels acquired by the Company after January 1, 2022 (the “Acquired Hotels”), the Company has included in the pro forma information the financial results of each of the Acquired Hotels for the period from January 1, 2022, to December 31, 2022. The financial results for the Acquired Hotels include information provided by the thi rd - party owner of such Acquired Hotel prior to purchase by the Company and have not been audited or reviewed by our auditors or adjusted by us. The pro forma information is included to enable com par ison of results for the current reporting period to results for the comparable period of the prior year and are not indicative of future results. 2022 Pro Forma Operating Data (1) Q1 Q2 Q3 Q4 Year Ended December 31, 2022 Pro forma room revenue 135,262$ 169,519$ 160,503$ 153,767$ 619,051$ Pro forma other hotel operations revenue 15,024 18,263 18,134 18,710 70,131 Pro forma total revenues 150,286 187,782 178,637 172,477 689,182 Pro forma total hotel operating expenses 100,696 116,910 117,301 110,335 445,242 Pro forma hotel EBITDA 49,590$ 70,872$ 61,336$ 62,142$ 243,940$ Pro forma hotel EBITDA Margin 33.0% 37.7% 34.3% 36.0% 35.4% Pro Forma Statistics (1) Rooms sold 876,489 1,034,603 1,011,675 963,342 3,886,109 Rooms available 1,365,325 1,395,182 1,410,544 1,410,583 5,581,634 Occupancy 64.2% 74.2% 71.7% 68.3% 69.6% ADR 154.32$ 163.85$ 158.65$ 159.62$ 159.30$ RevPAR 99.07$ 121.50$ 113.79$ 109.01$ 110.91$ Actual Statistics Rooms sold 843,066 1,025,340 1,010,996 963,151 3,842,553 Rooms available 1,313,661 1,382,673 1,409,716 1,410,358 5,516,408 Occupancy 64.2% 74.2% 71.7% 68.3% 69.7% ADR 152.79$ 162.68$ 158.39$ 159.50$ 158.58$ RevPAR 98.05$ 120.64$ 113.59$ 108.92$ 110.46$ 8
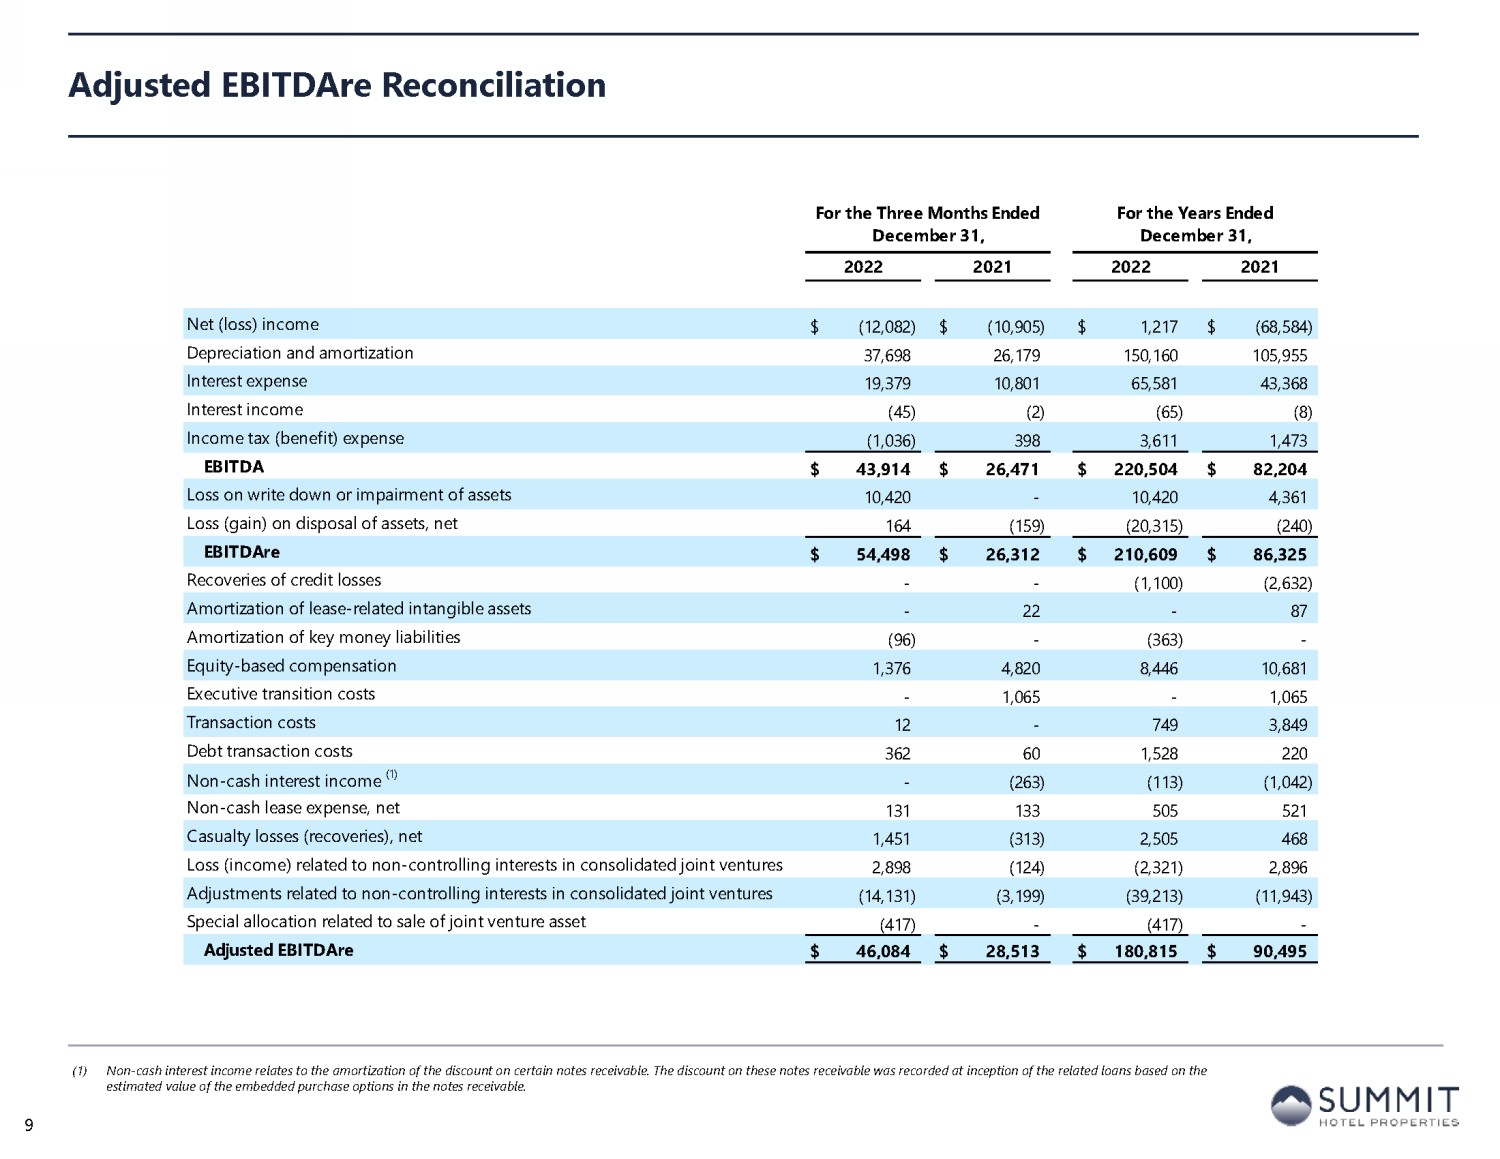
Adjusted EBITDAre Reconciliation (1) Non - cash interest income relates to the amortization of the discount on certain notes receivable. The discount on these notes re ceivable was recorded at inception of the related loans based on the estimated value of the embedded purchase options in the notes receivable. 9 For the Three Months Ended December 31, For the Years Ended December 31, 2022 2021 2022 2021 Net (loss) income (12,082)$ (10,905)$ 1,217$ (68,584)$ Depreciation and amortization 37,698 26,179 150,160 105,955 Interest expense 19,379 10,801 65,581 43,368 Interest income (45) (2) (65) (8) Income tax (benefit) expense (1,036) 398 3,611 1,473 EBITDA 43,914$ 26,471$ 220,504$ 82,204$ Loss on write down or impairment of assets 10,420 - 10,420 4,361 Loss (gain) on disposal of assets, net 164 (159) (20,315) (240) EBITDAre 54,498$ 26,312$ 210,609$ 86,325$ Recoveries of credit losses - - (1,100) (2,632) Amortization of lease-related intangible assets - 22 - 87 Amortization of key money liabilities (96) - (363) - Equity-based compensation 1,376 4,820 8,446 10,681 Executive transition costs - 1,065 - 1,065 Transaction costs 12 - 749 3,849 Debt transaction costs 362 60 1,528 220 Non-cash interest income (1) - (263) (113) (1,042) Non-cash lease expense, net 131 133 505 521 Casualty losses (recoveries), net 1,451 (313) 2,505 468 Loss (income) related to non-controlling interests in consolidated joint ventures 2,898 (124) (2,321) 2,896 Adjustments related to non-controlling interests in consolidated joint ventures (14,131) (3,199) (39,213) (11,943) Special allocation related to sale of joint venture asset (417) - (417) - Adjusted EBITDAre 46,084$ 28,513$ 180,815$ 90,495$
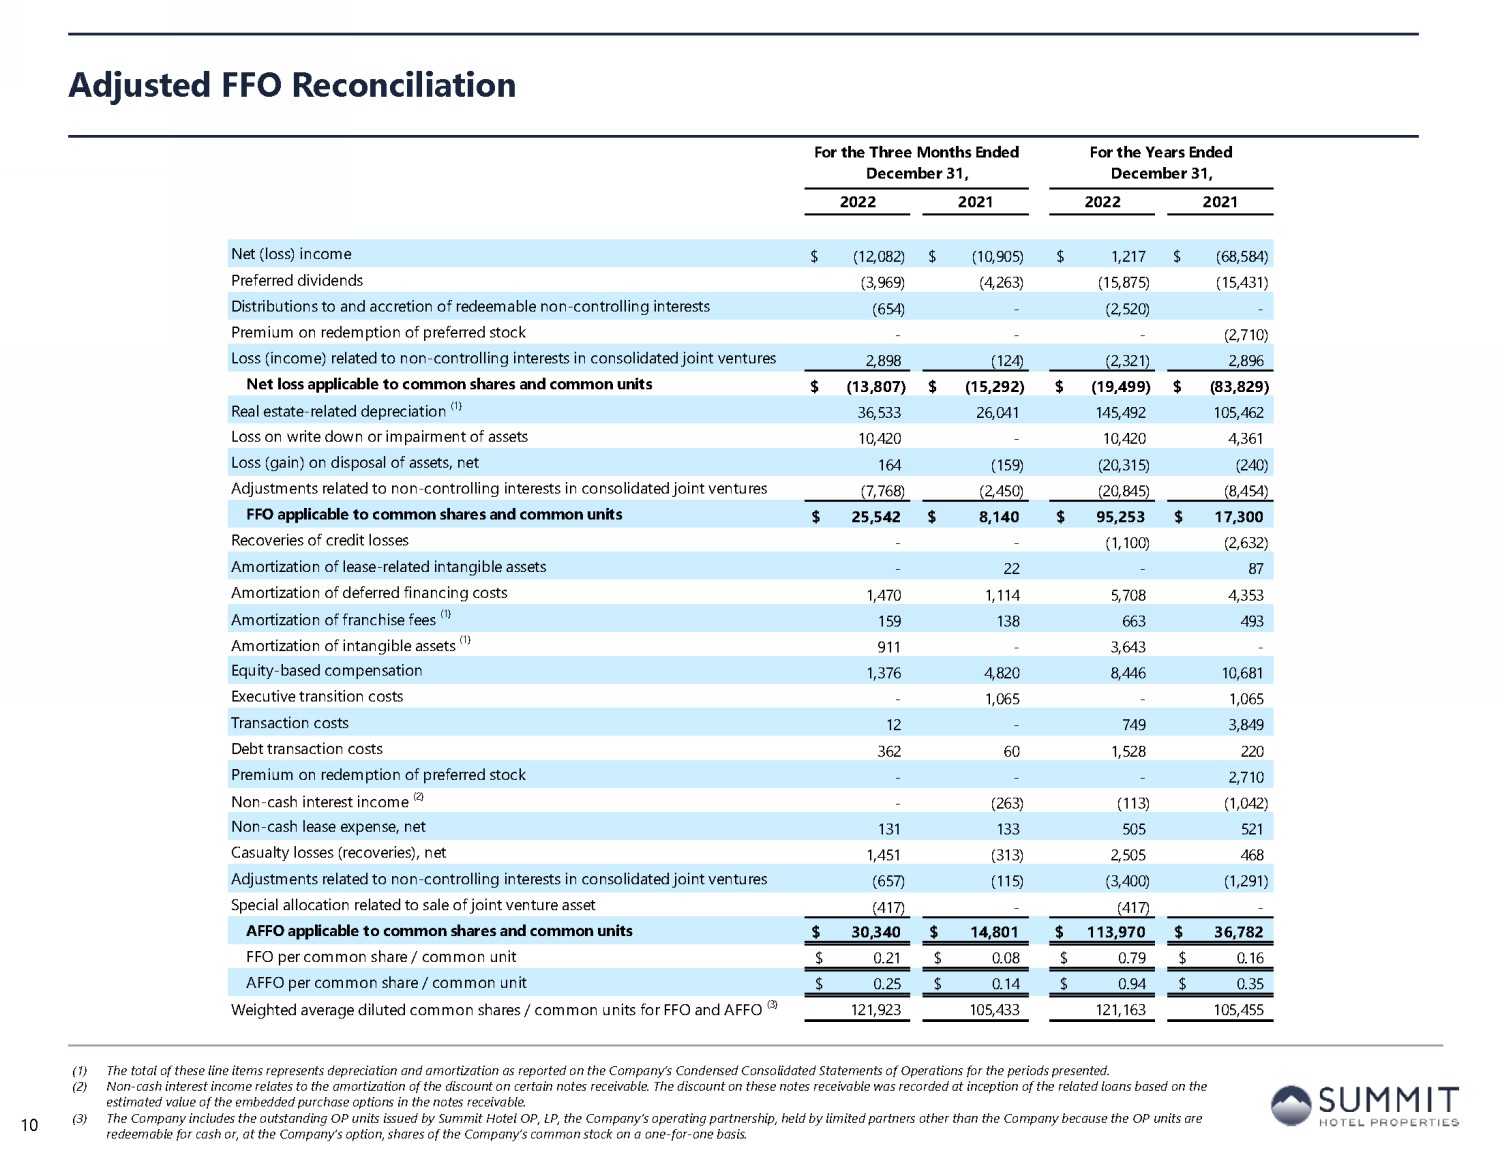
Adjusted FFO Reconciliation (1) The total of these line items represents depreciation and amortization as reported on the Company’s Condensed Consolidated St ate ments of Operations for the periods presented. (2) Non - cash interest income relates to the amortization of the discount on certain notes receivable. The discount on these notes re ceivable was recorded at inception of the related loans based on the estimated value of the embedded purchase options in the notes receivable. (3) The Company includes the outstanding OP units issued by Summit Hotel OP, LP, the Company’s operating partnership, held by lim ite d partners other than the Company because the OP units are redeemable for cash or, at the Company’s option, shares of the Company’s common stock on a one - for - one basis. 10 For the Three Months Ended December 31, For the Years Ended December 31, 2022 2021 2022 2021 Net (loss) income (12,082)$ (10,905)$ 1,217$ (68,584)$ Preferred dividends (3,969) (4,263) (15,875) (15,431) Distributions to and accretion of redeemable non-controlling interests (654) - (2,520) - Premium on redemption of preferred stock - - - (2,710) Loss (income) related to non-controlling interests in consolidated joint ventures 2,898 (124) (2,321) 2,896 Net loss applicable to common shares and common units (13,807)$ (15,292)$ (19,499)$ (83,829)$ Real estate-related depreciation (1) 36,533 26,041 145,492 105,462 Loss on write down or impairment of assets 10,420 - 10,420 4,361 Loss (gain) on disposal of assets, net 164 (159) (20,315) (240) Adjustments related to non-controlling interests in consolidated joint ventures (7,768) (2,450) (20,845) (8,454) FFO applicable to common shares and common units 25,542$ 8,140$ 95,253$ 17,300$ Recoveries of credit losses - - (1,100) (2,632) Amortization of lease-related intangible assets - 22 - 87 Amortization of deferred financing costs 1,470 1,114 5,708 4,353 Amortization of franchise fees (1) 159 138 663 493 Amortization of intangible assets (1) 911 - 3,643 - Equity-based compensation 1,376 4,820 8,446 10,681 Executive transition costs - 1,065 - 1,065 Transaction costs 12 - 749 3,849 Debt transaction costs 362 60 1,528 220 Premium on redemption of preferred stock - - - 2,710 Non-cash interest income (2) - (263) (113) (1,042) Non-cash lease expense, net 131 133 505 521 Casualty losses (recoveries), net 1,451 (313) 2,505 468 Adjustments related to non-controlling interests in consolidated joint ventures (657) (115) (3,400) (1,291) Special allocation related to sale of joint venture asset (417) - (417) - AFFO applicable to common shares and common units 30,340$ 14,801$ 113,970$ 36,782$ FFO per common share / common unit 0.21$ 0.08$ 0.79$ 0.16$ AFFO per common share / common unit 0.25$ 0.14$ 0.94$ 0.35$ Weighted average diluted common shares / common units for FFO and AFFO (3) 121,923 105,433 121,163 105,455
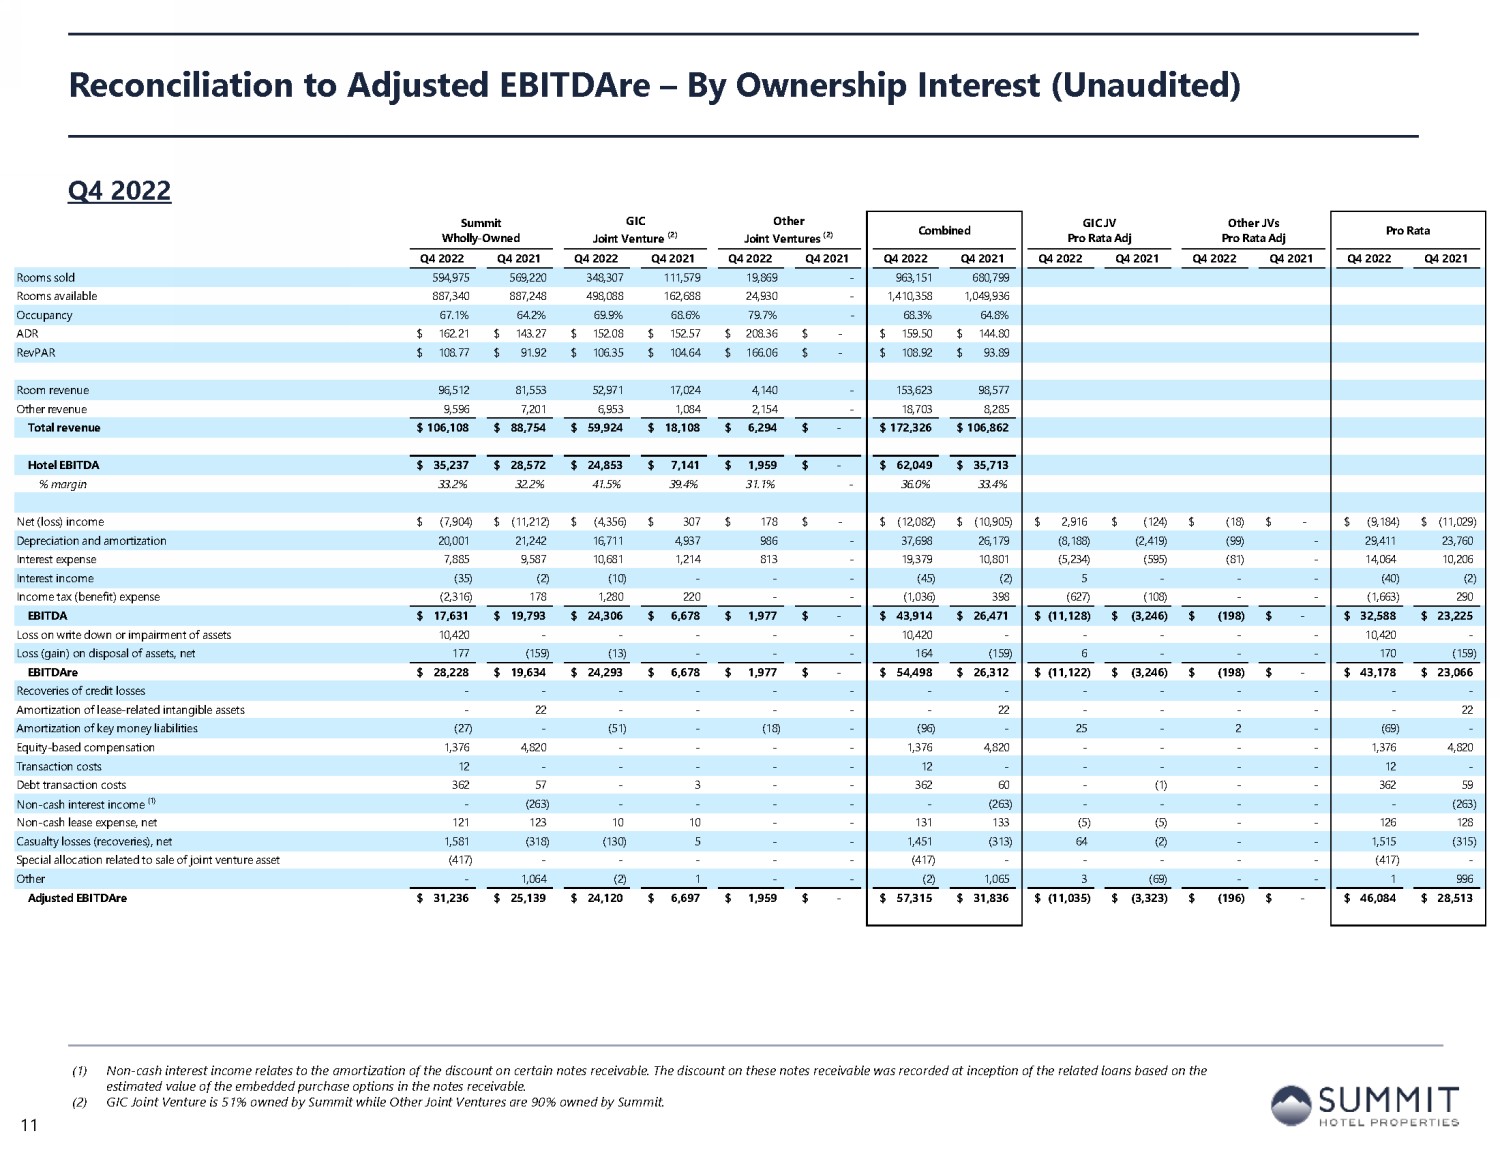
Reconciliation to Adjusted EBITDAre – By Ownership Interest Q4 2022 (1) Non - cash interest income relates to the amortization of the discount on certain notes receivable. The discount on these notes re ceivable was recorded at inception of the related loans based on the estimated value of the embedded purchase options in the notes receivable. (2) GIC Joint Venture is 51% owned by Summit while Other Joint Ventures are 90% owned by Summit. 11 Summit Wholly-Owned GIC Joint Venture (2) Other Joint Ventures (2) Consolidated GIC JV Pro Rata Adj Other JVs Pro Rata Adj Pro Rata SEC Filing - 10Q/K Q4 2022 Q4 2021 Q4 2022 Q4 2021 Q4 2022 Q4 2021 Q4 2022 Q4 2021 Q4 2022 Q4 2021 Q4 2022 Q4 2021 Q4 2022 Q4 2021 Rooms sold 594,975 569,220 348,307 111,579 19,869 - 963,151 680,799 Rooms available 887,340 887,248 498,088 162,688 24,930 - 1,410,358 1,049,936 Occupancy 67.1% 64.2% 69.9% 68.6% 79.7% - 68.3% 64.8% ADR 162.21$ 143.27$ 152.08$ 152.57$ 208.36$ -$ 159.50$ 144.80$ RevPAR 108.77$ 91.92$ 106.35$ 104.64$ 166.06$ -$ 108.92$ 93.89$ Room revenue 96,512 81,553 52,971 17,024 4,140 - 153,623 98,577 Other revenue 9,596 7,201 6,953 1,084 2,154 - 18,703 8,285 Total revenue 106,108$ 88,754$ 59,924$ 18,108$ 6,294$ -$ 172,326$ 106,862$ Hotel EBITDA 35,237$ 28,572$ 24,853$ 7,141$ 1,959$ -$ 62,049$ 35,713$ % margin 33.2% 32.2% 41.5% 39.4% 31.1% - 36.0% 33.4% Net (loss) income (7,904)$ (11,212)$ (4,356)$ 307$ 178$ -$ (12,082)$ (10,905)$ 2,916$ (124)$ (18)$ -$ (9,184)$ (11,029)$ Depreciation and amortization 20,001 21,242 16,711 4,937 986 - 37,698 26,179 (8,188) (2,419) (99) - 29,411 23,760 Interest expense 7,885 9,587 10,681 1,214 813 - 19,379 10,801 (5,234) (595) (81) - 14,064 10,206 Interest income (35) (2) (10) - - - (45) (2) 5 - - - (40) (2) Income tax benefit (expense) (2,316) 178 1,280 220 - - (1,036) 398 (627) (108) - - (1,663) 290 EBITDA 17,631$ 19,793$ 24,306$ 6,678$ 1,977$ -$ 43,914$ 26,471$ (11,128)$ (3,246)$ (198)$ -$ 32,588$ 23,225$ Loss on write down or impairment of assets 10,420 - - - - - 10,420 - - - - - 10,420 - Loss (gain) on disposal of assets, net 177 (159) (13) - - - 164 (159) 6 - - - 170 (159) EBITDAre 28,228$ 19,634$ 24,293$ 6,678$ 1,977$ -$ 54,498$ 26,312$ (11,122)$ (3,246)$ (198)$ -$ 43,178$ 23,066$ Recoveries of credit losses - - - - - - - - - - - - - - Amortization of lease-related intangible assets - 22 - - - - - 22 - - - - - 22 Amortization of key money liabilities (96) - (96) - - - - - (96) - Equity-based compensation 1,376 4,820 - - - - 1,376 4,820 - - - - 1,376 4,820 Transaction costs 12 - - - - - 12 - - - - - 12 - Debt transaction costs 362 57 - 3 - - 362 60 - (1) - - 362 59 Non-cash interest income (1) - (263) - - - - - (263) - - - - - (263) Non-cash lease expense, net 121 123 10 10 - - 131 133 (5) (5) - - 126 128 Casualty losses (recoveries), net 1,581 (318) (130) 5 - - 1,451 (313) 64 (2) - - 1,515 (315) Other 69 3,996 (53) 1 (18) - (2) 3,997 (389) (3,001) 2 - (389) 996 Adjusted EBITDAre 31,653$ 28,071$ 24,120$ 6,697$ 1,959$ -$ 57,732$ 34,768$ (11,452)$ (6,255)$ (196)$ -$ 46,084$ 28,513$
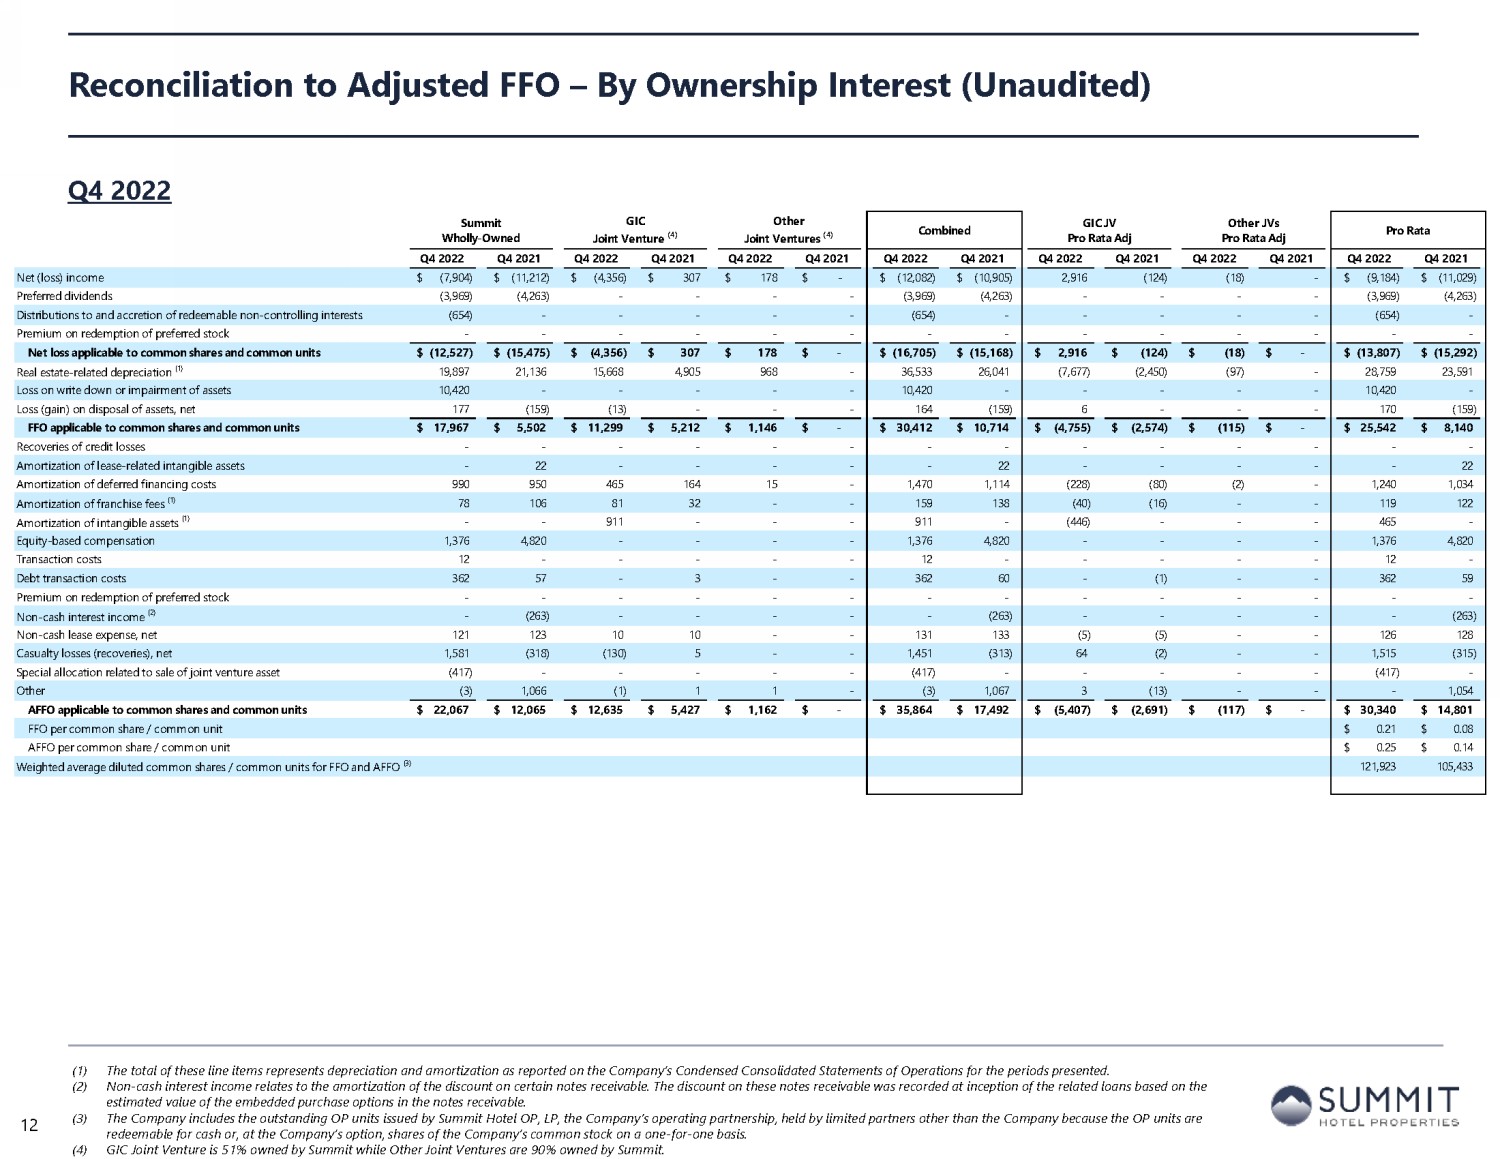
Summit Wholly-Owned GIC Joint Venture (4) Other Joint Ventures (4) Consolidated GIC JV Pro Rata Adj Other JVs Pro Rata Adj Pro Rata Q4 2022 Q4 2021 Q4 2022 Q4 2021 Q4 2022 Q4 2021 Q4 2022 Q4 2021 Q4 2022 Q4 2021 Q4 2022 Q4 2021 Q4 2022 Q4 2021 Net (loss) income (7,904)$ (11,212)$ (4,356)$ 307$ 178$ -$ (12,082)$ (10,905)$ 2,916 (124) (18) - (9,184)$ (11,029)$ Preferred dividends (3,969) (4,263) - - - - (3,969) (4,263) - - - - (3,969) (4,263) Distributions and accretion of redeemable non-controlling interests (654) - - - - - (654) - - - - - (654) - Premium on redemption of preferred stock - - - - - - - - - - - - - - Net loss applicable to common shares and common units (12,527)$ (15,475)$ (4,356)$ 307$ 178$ -$ (16,705)$ (15,168)$ 2,916$ (124)$ (18)$ -$ (13,807)$ (15,292)$ Real estate-related depreciation (1) 19,897 21,136 15,668 4,905 968 - 36,533 26,041 (7,677) (2,450) (97) - 28,759 23,591 Loss on impairment of assets 10,420 - - - - - 10,420 - - - - - 10,420 - Loss (gain) on disposal of assets, net 177 (159) (13) - - - 164 (159) 6 - - - 170 (159) FFO applicable to common shares and common units 17,967$ 5,502$ 11,299$ 5,212$ 1,146$ -$ 30,412$ 10,714$ (4,755)$ (2,574)$ (115)$ -$ 25,542$ 8,140$ Reversal of credit losses - - - - - - - - - - - - - - Amortization of lease-related intangible assets - 22 - - - - - 22 - - - - - 22 Amortization of deferred financing costs 990 950 465 164 15 - 1,470 1,114 (228) (80) (2) - 1,240 1,034 Amortization of franchise fees (1) 78 106 81 32 - - 159 138 (40) (16) - - 119 122 Amortization of intangible assets (1) - - 911 - - - 911 - (446) - - - 465 - Equity-based compensation 1,376 4,820 - - - - 1,376 4,820 - - - - 1,376 4,820 Transaction costs 12 - - - - - 12 - - - - - 12 - Debt transaction costs 362 57 - 3 - - 362 60 - (1) - - 362 59 Premium on redemption of preferred stock - - - - - - - - - - - - - - Non-cash interest income (2) - (263) - - - - - (263) - - - - - (263) Non-cash lease expense, net 121 123 10 10 - - 131 133 (5) (5) - - 126 128 Casualty losses (recoveries), net 1,581 (318) (130) 5 - - 1,451 (313) 64 (2) - - 1,515 (315) Other (3) 3,998 (1) 1 1 - (3) 3,999 (414) (2,945) - - (417) 1,054 AFFO applicable to common shares and common units 22,484$ 14,997$ 12,635$ 5,427$ 1,162$ -$ 36,281$ 20,424$ (5,824)$ (5,623)$ (117)$ -$ 30,340$ 14,801$ FFO per common share / common unit 0.21$ 0.08$ AFFO per common share / common unit 0.25$ 0.14$ Weighted average diluted common shares / common units for FFO and AFFO (3) 121,923 105,433 Reconciliation to Adjusted FFO – By Ownership Interest Q4 2022 (1) The total of these line items represents depreciation and amortization as reported on the Company’s Condensed Consolidated St ate ments of Operations for the periods presented. (2) Non - cash interest income relates to the amortization of the discount on certain notes receivable. The discount on these notes re ceivable was recorded at inception of the related loans based on the estimated value of the embedded purchase options in the notes receivable. (3) The Company includes the outstanding OP units issued by Summit Hotel OP, LP, the Company’s operating partnership, held by lim ite d partners other than the Company because the OP units are redeemable for cash or, at the Company’s option, shares of the Company’s common stock on a one - for - one basis. (4) GIC Joint Venture is 51% owned by Summit while Other Joint Ventures are 90% owned by Summit. 12
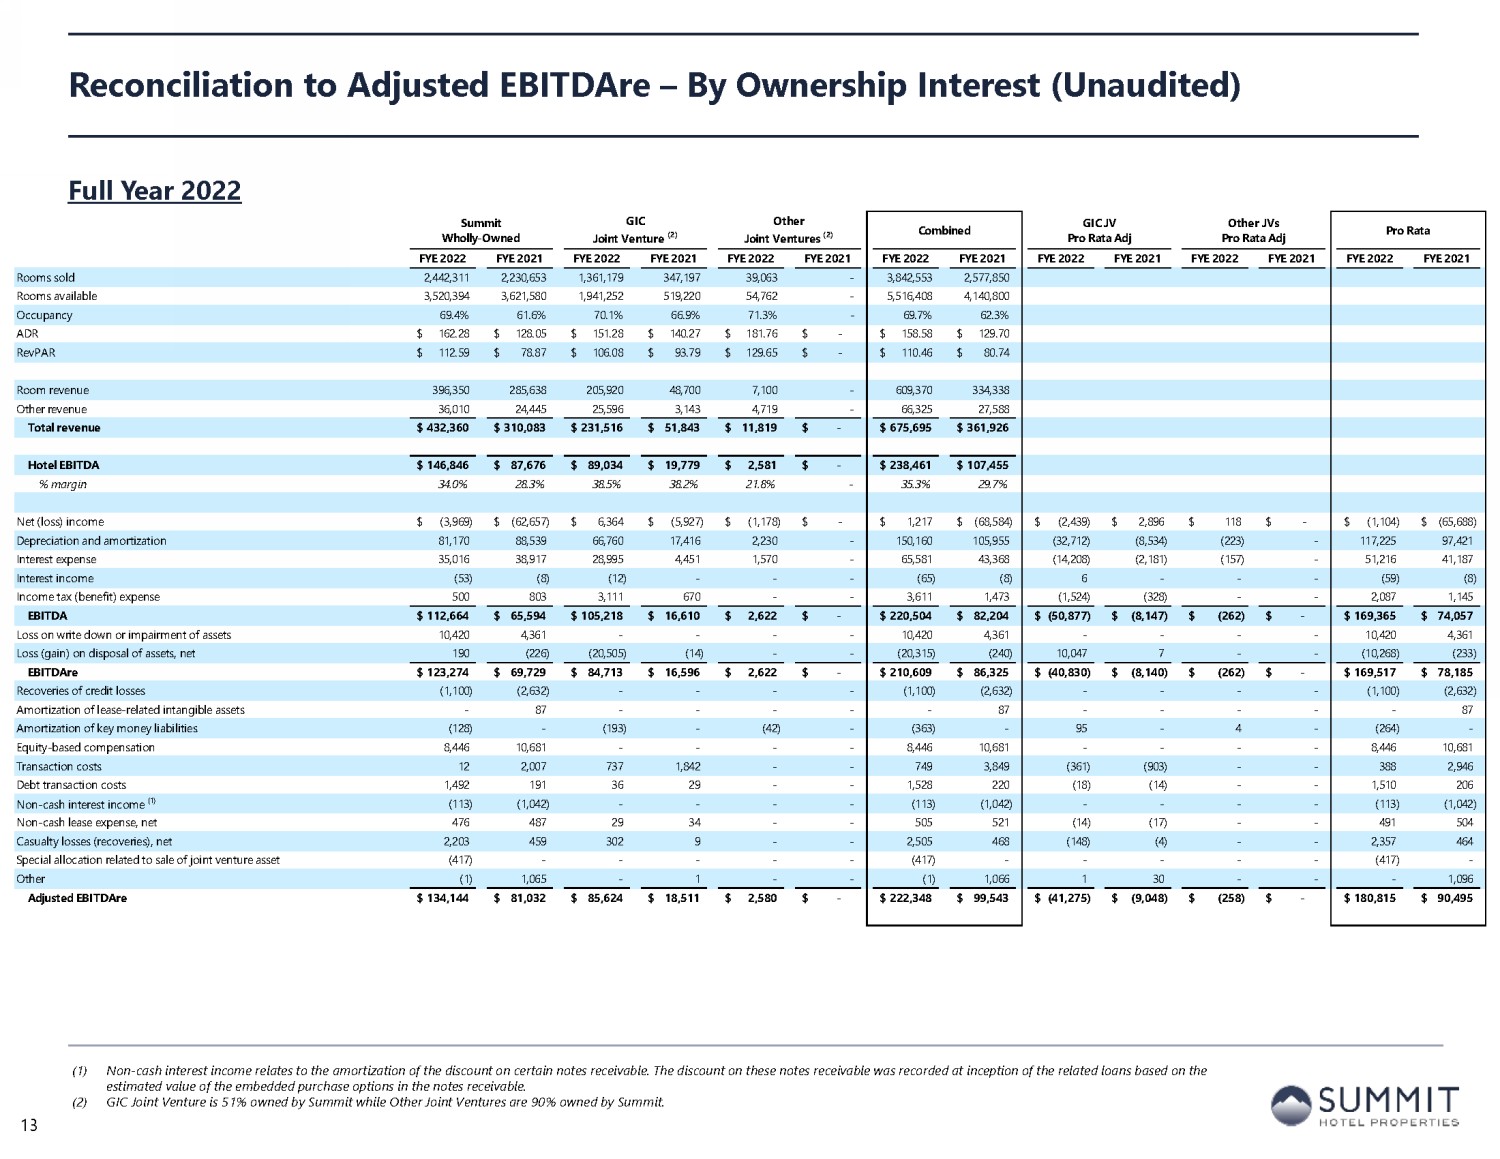
Reconciliation to Adjusted EBITDAre – By Ownership Interest Full Year 2022 (1) Non - cash interest income relates to the amortization of the discount on certain notes receivable. The discount on these notes re ceivable was recorded at inception of the related loans based on the estimated value of the embedded purchase options in the notes receivable. (2) GIC Joint Venture is 51% owned by Summit while Other Joint Ventures are 90% owned by Summit. 13 Summit Wholly-Owned GIC Joint Venture (2) Other Joint Ventures (2) Consolidated GIC JV Pro Rata Adj Other JVs Pro Rata Adj Pro Rata SEC Filing - 10Q/K FYE 2022 FYE 2021 FYE 2022 FYE 2021 FYE 2022 FYE 2021 FYE 2022 FYE 2021 FYE 2022 FYE 2021 FYE 2022 FYE 2021 FYE 2022 FYE 2021 Rooms sold 2,442,311 2,230,653 1,361,179 347,197 39,063 - 3,842,553 2,577,850 Rooms available 3,520,394 3,621,580 1,941,252 519,220 54,762 - 5,516,408 4,140,800 Occupancy 69.4% 61.6% 70.1% 66.9% 71.3% - 69.7% 62.3% ADR 162.28$ 128.05$ 151.28$ 140.27$ 181.76$ -$ 158.58$ 129.70$ RevPAR 112.59$ 78.87$ 106.08$ 93.79$ 129.65$ -$ 110.46$ 80.74$ Room revenue 396,350 285,638 205,920 48,700 7,100 - 609,370 334,338 Other revenue 36,010 24,445 25,596 3,143 4,719 - 66,325 27,588 Total revenue 432,360$ 310,083$ 231,516$ 51,843$ 11,819$ -$ 675,695$ 361,926$ Hotel EBITDA 146,846$ 87,676$ 89,034$ 19,779$ 2,581$ -$ 238,461$ 107,455$ % margin 34.0% 28.3% 38.5% 38.2% 21.8% - 35.3% 29.7% Net (loss) income (3,969)$ (62,657)$ 6,364$ (5,927)$ (1,178)$ -$ 1,217$ (68,584)$ (2,439)$ 2,896$ 118$ -$ (1,104)$ (65,688)$ Depreciation and amortization 81,170 88,539 66,760 17,416 2,230 - 150,160 105,955 (32,712) (8,534) (223) - 117,225 97,421 Interest expense 35,016 38,917 28,995 4,451 1,570 - 65,581 43,368 (14,208) (2,181) (157) - 51,216 41,187 Interest income (53) (8) (12) - - - (65) (8) 6 - - - (59) (8) Income tax benefit (expense) 500 803 3,111 670 - - 3,611 1,473 (1,524) (328) - - 2,087 1,145 EBITDA 112,664$ 65,594$ 105,218$ 16,610$ 2,622$ -$ 220,504$ 82,204$ (50,877)$ (8,147)$ (262)$ -$ 169,365$ 74,057$ Loss on write down or impairment of assets 10,420 4,361 - - - - 10,420 4,361 - - - - 10,420 4,361 Loss (gain) on disposal of assets, net 190 (226) (20,505) (14) - - (20,315) (240) 10,047 7 - - (10,268) (233) EBITDAre 123,274$ 69,729$ 84,713$ 16,596$ 2,622$ -$ 210,609$ 86,325$ (40,830)$ (8,140)$ (262)$ -$ 169,517$ 78,185$ Recoveries of credit losses (1,100) (2,632) - - - - (1,100) (2,632) - - - - (1,100) (2,632) Amortization of lease-related intangible assets - 87 - - - - - 87 - - - - - 87 Amortization of key money liabilities (363) - (363) - - - - - (363) - Equity-based compensation 8,446 10,681 - - - - 8,446 10,681 - - - - 8,446 10,681 Transaction costs 12 2,007 737 1,842 - - 749 3,849 (361) (903) - - 388 2,946 Debt transaction costs 1,492 191 36 29 - - 1,528 220 (18) (14) - - 1,510 206 Non-cash interest income (1) (113) (1,042) - - - - (113) (1,042) - - - - (113) (1,042) Non-cash lease expense, net 476 487 29 34 - - 505 521 (14) (17) - - 491 504 Casualty losses (recoveries), net 2,203 459 302 9 - - 2,505 468 (148) (4) - - 2,357 464 Other 234 3,997 (193) 1 (42) - (1) 3,998 (321) (2,902) 4 - (318) 1,096 Adjusted EBITDAre 134,561$ 83,964$ 85,624$ 18,511$ 2,580$ -$ 222,765$ 102,475$ (41,692)$ (11,980)$ (258)$ -$ 180,815$ 90,495$

Reconciliation to Adjusted FFO – By Ownership Interest Full Year 2022 (1) The total of these line items represents depreciation and amortization as reported on the Company’s Condensed Consolidated St ate ments of Operations for the periods presented. (2) Non - cash interest income relates to the amortization of the discount on certain notes receivable. The discount on these notes re ceivable was recorded at inception of the related loans based on the estimated value of the embedded purchase options in the notes receivable. (3) The Company includes the outstanding OP units issued by Summit Hotel OP, LP, the Company’s operating partnership, held by lim ite d partners other than the Company because the OP units are redeemable for cash or, at the Company’s option, shares of the Company’s common stock on a one - for - one basis. (4) GIC Joint Venture is 51% owned by Summit while Other Joint Ventures are 90% owned by Summit. 14 Summit Wholly-Owned GIC Joint Venture (4) Other Joint Ventures (4) Consolidated GIC JV Pro Rata Adj Other JVs Pro Rata Adj Pro Rata FYE 2022 FYE 2021 FYE 2022 FYE 2021 FYE 2022 FYE 2021 FYE 2022 FYE 2021 FYE 2022 FYE 2021 FYE 2022 FYE 2021 FYE 2022 FYE 2021 Net (loss) income (3,969)$ (62,657)$ 6,364$ (5,927)$ (1,178)$ -$ 1,217$ (68,584)$ (2,439) 2,896 118 - (1,104)$ (65,688)$ Preferred dividends (15,875) (15,431) - - - - (15,875) (15,431) - - - - (15,875) (15,431) Distributions and accretion of redeemable non-controlling interests (2,520) - - - - - (2,520) - - - - - (2,520) - Premium on redemption of preferred stock - (2,710) - - - - - (2,710) - - - - - (2,710) Net loss applicable to common shares and common units (22,364)$ (80,798)$ 6,364$ (5,927)$ (1,178)$ -$ (17,178)$ (86,725)$ (2,439)$ 2,896$ 118$ -$ (19,499)$ (83,829)$ Real estate-related depreciation (1) 80,705 88,149 62,599 17,313 2,188 - 145,492 105,462 (30,673) (8,461) (219) - 114,600 97,001 Loss on impairment of assets 10,420 4,361 - - - - 10,420 4,361 - - - - 10,420 4,361 Loss (gain) on disposal of assets, net 190 (226) (20,505) (14) - - (20,315) (240) 10,047 7 - - (10,268) (233) FFO applicable to common shares and common units 68,951$ 11,486$ 48,458$ 11,372$ 1,010$ -$ 118,419$ 22,858$ (23,065)$ (5,558)$ (101)$ -$ 95,253$ 17,300$ Reversal of credit losses (1,100) (2,632) - - - - (1,100) (2,632) - - - - (1,100) (2,632) Amortization of lease-related intangible assets - 87 - - - - - 87 - - - - - 87 Amortization of deferred financing costs 3,815 3,730 1,858 623 35 - 5,708 4,353 (910) (305) (4) - 4,794 4,048 Amortization of franchise fees (1) 338 389 325 104 - - 663 493 (159) (51) - - 504 442 Amortization of intangible assets (1) - - 3,643 - - - 3,643 - (1,785) - - - 1,858 - Equity-based compensation 8,446 10,681 - - - - 8,446 10,681 - - - - 8,446 10,681 Transaction costs 12 2,007 737 1,842 - - 749 3,849 (361) (903) - - 388 2,946 Debt transaction costs 1,492 191 36 29 - - 1,528 220 (18) (14) - - 1,510 206 Premium on redemption of preferred stock - (2,710) - - - - - (2,710) - - - - - (2,710) Non-cash interest income (2) (113) (1,042) - - - - (113) (1,042) - - - - (113) (1,042) Non-cash lease expense, net 476 487 29 34 - - 505 521 (14) (17) - - 491 504 Casualty losses (recoveries), net 2,203 459 302 9 - - 2,505 468 (148) (4) - - 2,357 464 Other (2) 3,997 - - - - (2) 3,997 (416) 2,491 - - (418) 6,488 AFFO applicable to common shares and common units 84,518$ 27,130$ 55,388$ 14,013$ 1,045$ -$ 140,951$ 41,143$ (26,876)$ (4,361)$ (105)$ -$ 113,970$ 36,782$ FFO per common share / common unit 0.79$ 0.16$ AFFO per common share / common unit 0.94$ 0.35$ Weighted average diluted common shares / common units for FFO and AFFO (3) 121,163 105,455

Full Year 2023 Outlook (1) All pro forma information includes operating and financial results for 103 hotels owned as of December 31, 2022, as if each h ote l had been owned by the Company since January 1, 2022 and will continue to be owned through the entire year ending December 31, 2023. As a result, the pro forma information includes operat ing and financial results for hotels acquired since January 1, 2022, which may include periods prior to the Company’s ownership. Pro forma and non - GAAP financial measures are unaudited. 15 FYE 2023 Outlook Low High Pro Forma RevPAR (1) 117.50$ 123.00$ Pro Forma RevPAR Growth (1) 6.00% 11.00% Adjusted EBITDAre 190,400$ 205,900$ Adjusted FFO 112,100$ 128,100$ Adjusted FFO per Diluted Unit 0.92$ 1.05$ Capital Expenditures, Pro Rata 60,000$ 80,000$

Table of Contents Section I Forward - Looking Statements and Non - GAAP Financial Measure Disclosures Section II Corporate Financial Schedules Section III Operating & Property - Level Schedules Section IV Capitalization and Debt Schedules Section VI Asset Listing 16
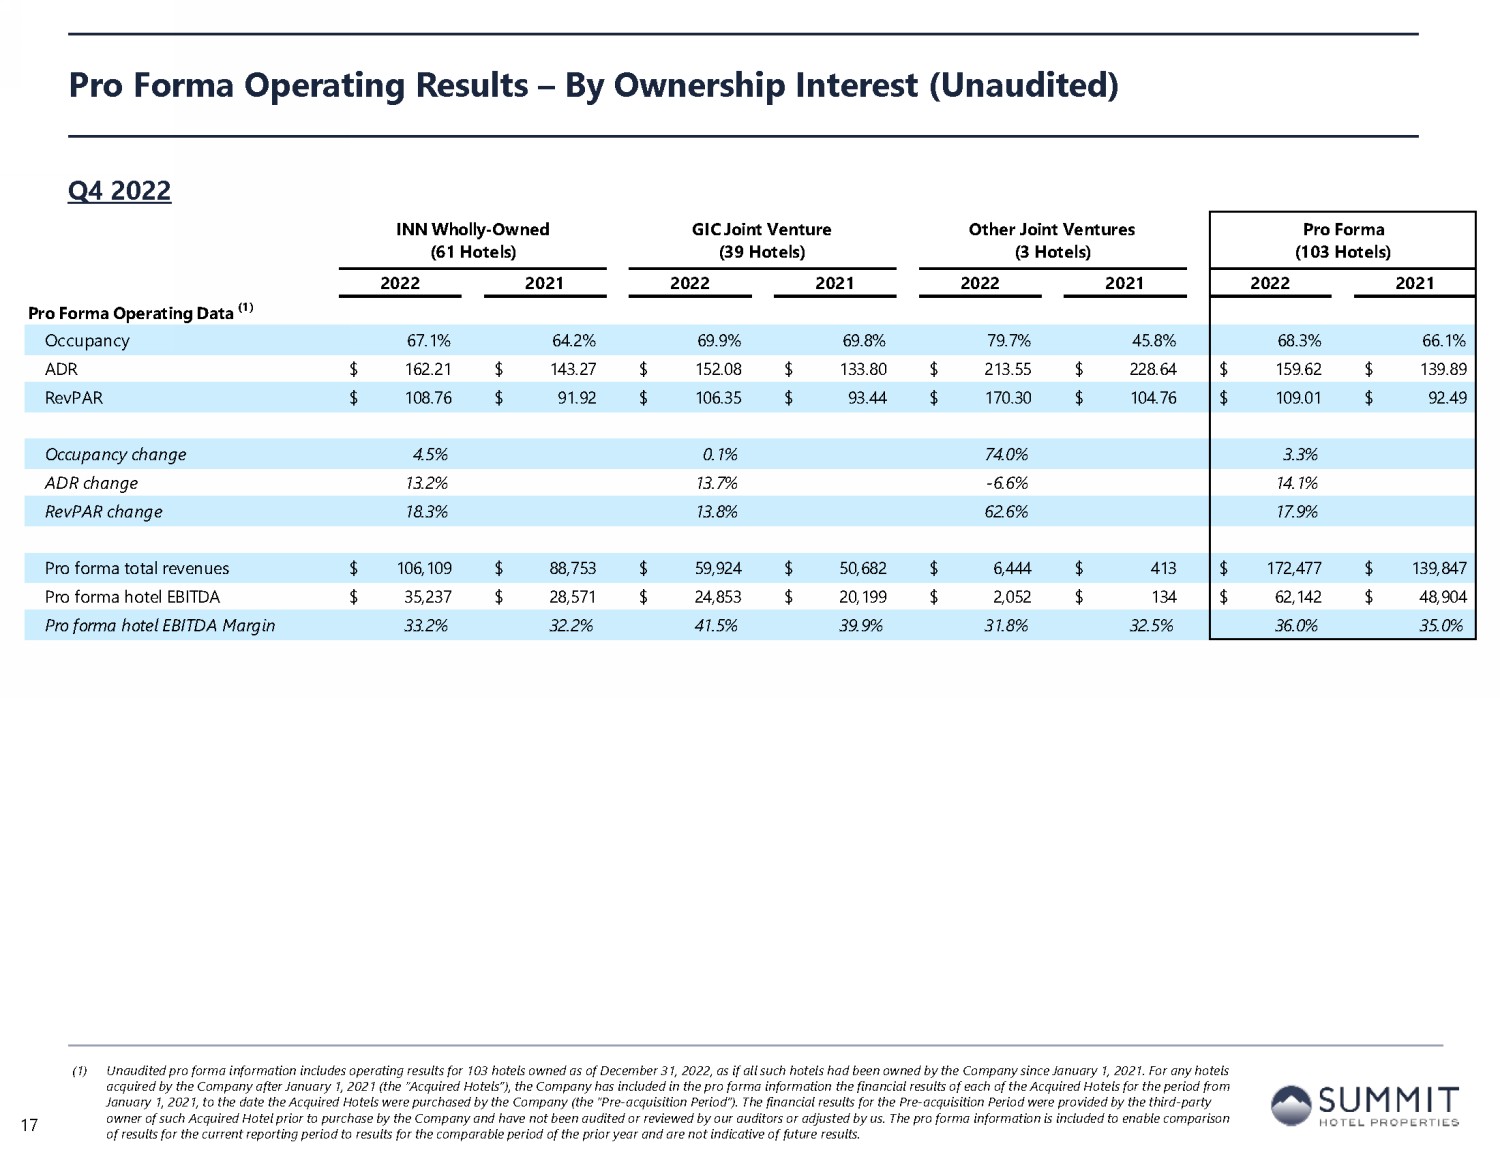
INN Wholly-Owned (61 Hotels) GIC Joint Venture (39 Hotels) Other Joint Ventures (3 Hotels) Pro Forma (103 Hotels) 2022 2021 2022 2021 2022 2021 2022 2021 Pro Forma Operating Data (1) Occupancy 67.1% 64.2% 69.9% 69.8% 79.7% 45.8% 68.3% 66.1% ADR 162.21$ 143.27$ 152.08$ 133.80$ 213.55$ 228.64$ 159.62$ 139.89$ RevPAR 108.76$ 91.92$ 106.35$ 93.44$ 170.30$ 104.76$ 109.01$ 92.49$ Occupancy change 4.5% 0.1% 74.0% 3.3% ADR change 13.2% 13.7% -6.6% 14.1% RevPAR change 18.3% 13.8% 62.6% 17.9% Pro forma total revenues 106,109$ 88,753$ 59,924$ 50,682$ 6,444$ 413$ 172,477$ 139,847$ Pro forma hotel EBITDA 35,237$ 28,571$ 24,853$ 20,199$ 2,052$ 134$ 62,142$ 48,904$ Pro forma hotel EBITDA Margin 33.2% 32.2% 41.5% 39.9% 31.8% 32.5% 36.0% 35.0% Pro Forma Operating Results – By Ownership Interest (1) Unaudited pro forma information includes operating results for 103 hotels owned as of December 31, 2022, as if all such hotel s h ad been owned by the Company since January 1, 2021. For any hotels acquired by the Company after January 1, 2021 (the “Acquired Hotels”), the Company has included in the pro forma information the financial results of each of the Acquired Hotels for the period from January 1, 2021, to the date the Acquired Hotels were purchased by the Company (the “Pre - acquisition Period”). The financial res ults for the Pre - acquisition Period were provided by the third - party owner of such Acquired Hotel prior to purchase by the Company and have not been audited or reviewed by our auditors or adjust ed by us. The pro forma information is included to enable comparison of results for the current reporting period to results for the comparable period of the prior year and are not indicative of fut ure results. Q4 2022 17
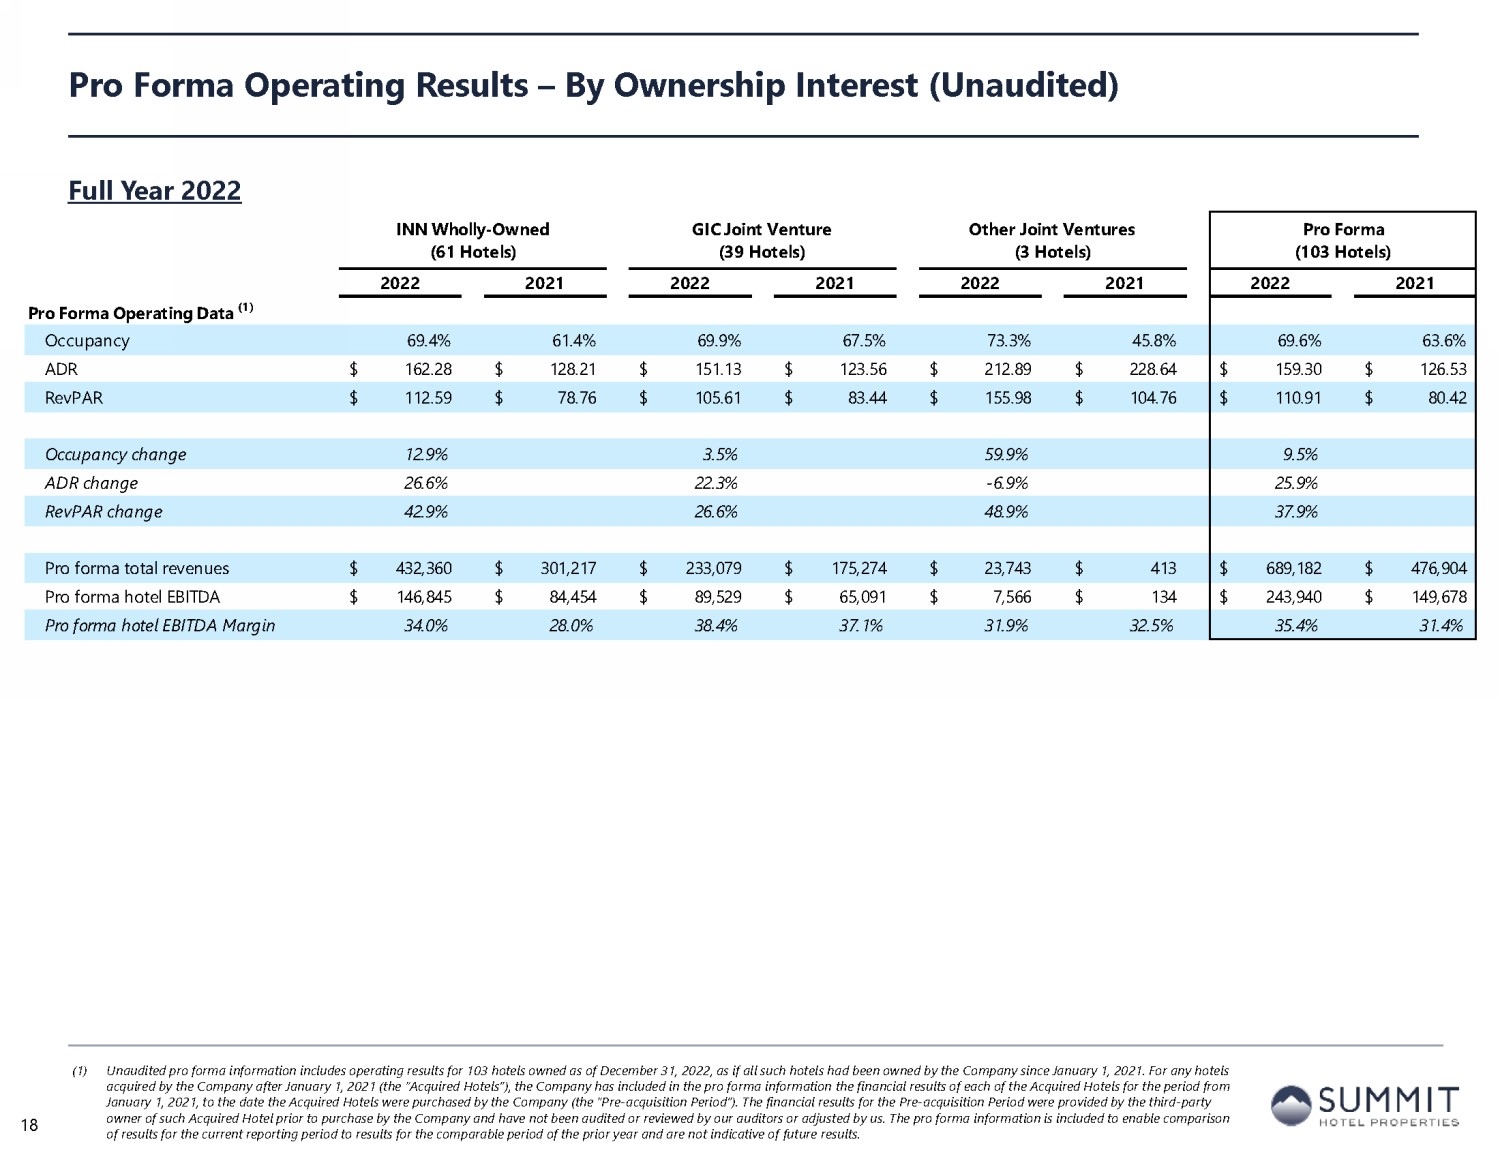
INN Wholly-Owned (61 Hotels) GIC Joint Venture (39 Hotels) Other Joint Ventures (3 Hotels) Pro Forma (103 Hotels) 2022 2021 2022 2021 2022 2021 2022 2021 Pro Forma Operating Data (1) Occupancy 69.4% 61.4% 69.9% 67.5% 73.3% 45.8% 69.6% 63.6% ADR 162.28$ 128.21$ 151.13$ 123.56$ 212.89$ 228.64$ 159.30$ 126.53$ RevPAR 112.59$ 78.76$ 105.61$ 83.44$ 155.98$ 104.76$ 110.91$ 80.42$ Occupancy change 12.9% 3.5% 59.9% 9.5% ADR change 26.6% 22.3% -6.9% 25.9% RevPAR change 42.9% 26.6% 48.9% 37.9% Pro forma total revenues 432,360$ 301,217$ 233,079$ 175,274$ 23,743$ 413$ 689,182$ 476,904$ Pro forma hotel EBITDA 146,845$ 84,454$ 89,529$ 65,091$ 7,566$ 134$ 243,940$ 149,678$ Pro forma hotel EBITDA Margin 34.0% 28.0% 38.4% 37.1% 31.9% 32.5% 35.4% 31.4% Pro Forma Operating Results – By Ownership Interest (1) Unaudited pro forma information includes operating results for 103 hotels owned as of December 31, 2022, as if all such hotel s h ad been owned by the Company since January 1, 2021. For any hotels acquired by the Company after January 1, 2021 (the “Acquired Hotels”), the Company has included in the pro forma information the financial results of each of the Acquired Hotels for the period from January 1, 2021, to the date the Acquired Hotels were purchased by the Company (the “Pre - acquisition Period”). The financial res ults for the Pre - acquisition Period were provided by the third - party owner of such Acquired Hotel prior to purchase by the Company and have not been audited or reviewed by our auditors or adjust ed by us. The pro forma information is included to enable comparison of results for the current reporting period to results for the comparable period of the prior year and are not indicative of fut ure results. Full Year 2022 18
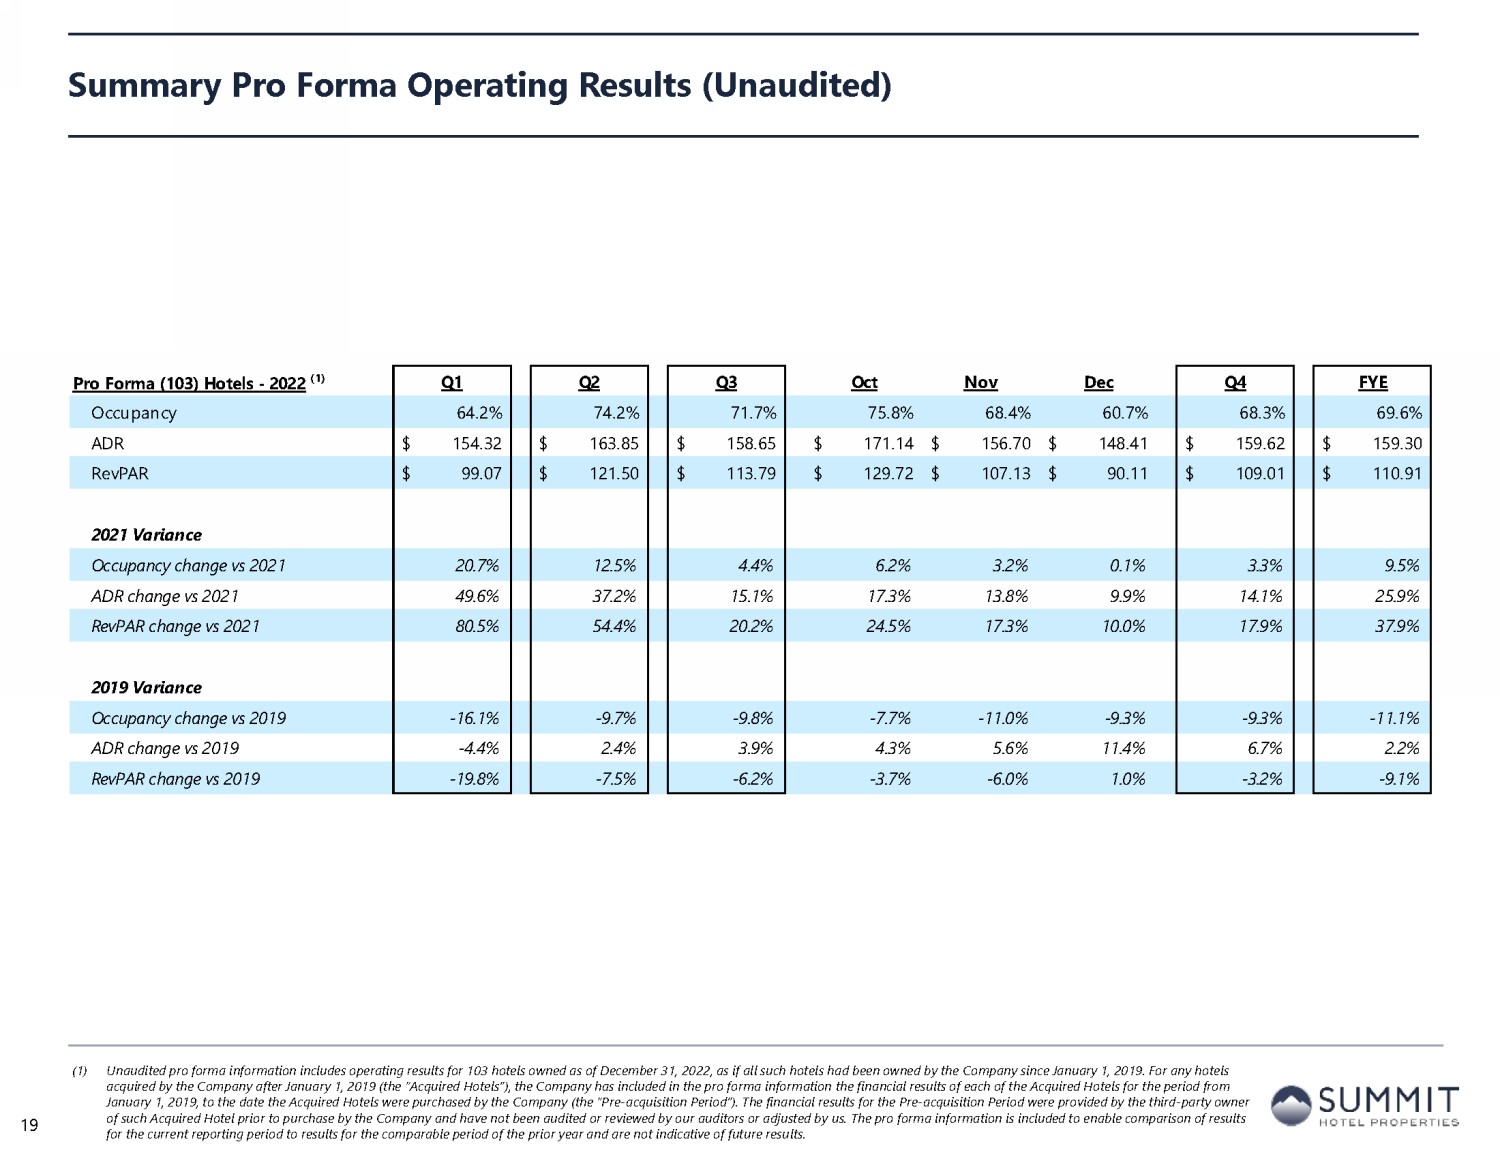
Summary Pro Forma Operating Results (1) Unaudited pro forma information includes operating results for 103 hotels owned as of December 31, 2022, as if all such hotel s h ad been owned by the Company since January 1, 2019. For any hotels acquired by the Company after January 1, 2019 (the “Acquired Hotels”), the Company has included in the pro forma information the financial results of each of the Acquired Hotels for the period from January 1, 2019, to the date the Acquired Hotels were purchased by the Company (the “Pre - acquisition Period”). The financial res ults for the Pre - acquisition Period were provided by the third - party owner of such Acquired Hotel prior to purchase by the Company and have not been audited or reviewed by our auditors or adjusted by us. The pro forma information is included to enable comparison of results for the current reporting period to results for the comparable period of the prior year and are not indicative of future resu lts . Pro Forma (103) Hotels - 2022 (1) Q1 Q2 Q3 Oct Nov Dec Q4 FYE Occupancy 64.2% 74.2% 71.7% 75.8% 68.4% 60.7% 68.3% 69.6% ADR 154.32$ 163.85$ 158.65$ 171.14$ 156.70$ 148.41$ 159.62$ 159.30$ RevPAR 99.07$ 121.50$ 113.79$ 129.72$ 107.13$ 90.11$ 109.01$ 110.91$ 2021 Variance Occupancy change vs 2021 20.7% 12.5% 4.4% 6.2% 3.2% 0.1% 3.3% 9.5% ADR change vs 2021 49.6% 37.2% 15.1% 17.3% 13.8% 9.9% 14.1% 25.9% RevPAR change vs 2021 80.5% 54.4% 20.2% 24.5% 17.3% 10.0% 17.9% 37.9% 2019 Variance Occupancy change vs 2019 -16.1% -9.7% -9.8% -7.7% -11.0% -9.3% -9.3% -11.1% ADR change vs 2019 -4.4% 2.4% 3.9% 4.3% 5.6% 11.4% 6.7% 2.2% RevPAR change vs 2019 -19.8% -7.5% -6.2% -3.7% -6.0% 1.0% -3.2% -9.1% 19
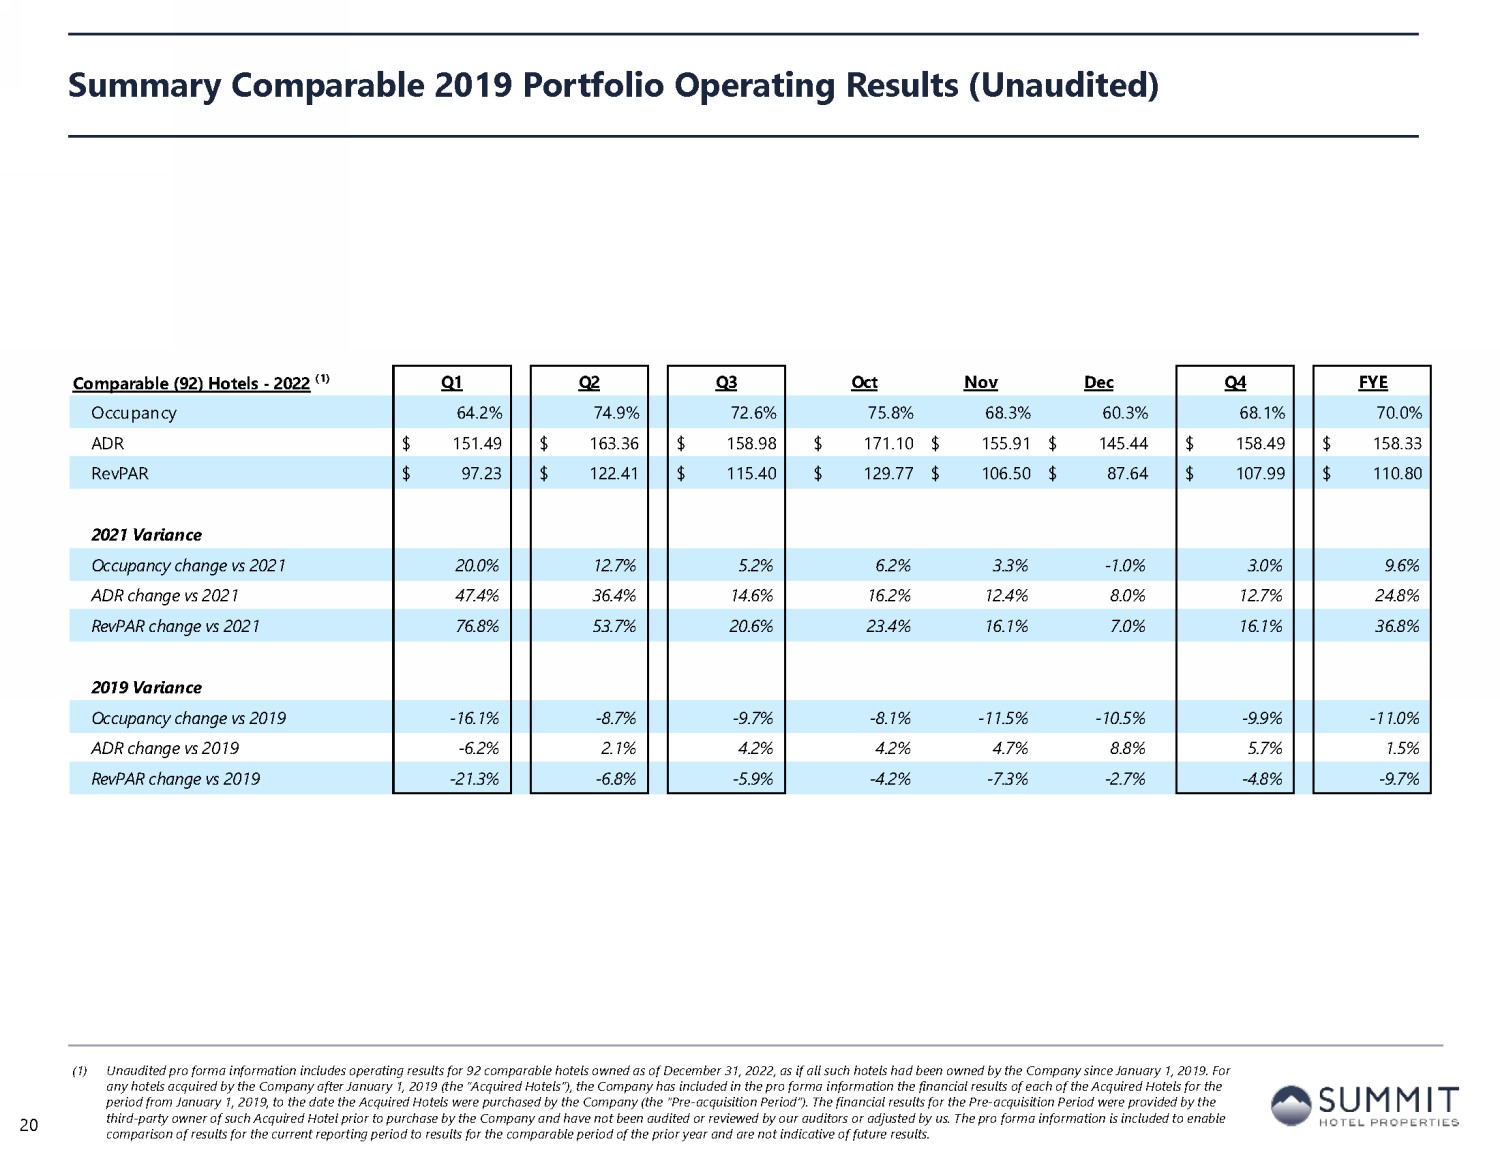
Summary Comparable 2019 Portfolio Operating Results (1) Unaudited pro forma information includes operating results for 92 comparable hotels owned as of December 31, 2022, as if all suc h hotels had been owned by the Company since January 1, 2019. For any hotels acquired by the Company after January 1, 2019 (the “Acquired Hotels”), the Company has included in the pro forma i nfo rmation the financial results of each of the Acquired Hotels for the period from January 1, 2019, to the date the Acquired Hotels were purchased by the Company (the “Pre - acquisition Period”). The f inancial results for the Pre - acquisition Period were provided by the third - party owner of such Acquired Hotel prior to purchase by the Company and have not been audited or reviewed by our auditors or adjusted by us. The pro forma information is included to enable comparison of results for the current reporting period to results for the comparable period of the prior year and are not ind ica tive of future results. Comparable (92) Hotels - 2022 (1) Q1 Q2 Q3 Oct Nov Dec Q4 FYE Occupancy 64.2% 74.9% 72.6% 75.8% 68.3% 60.3% 68.1% 70.0% ADR 151.49$ 163.36$ 158.98$ 171.10$ 155.91$ 145.44$ 158.49$ 158.33$ RevPAR 97.23$ 122.41$ 115.40$ 129.77$ 106.50$ 87.64$ 107.99$ 110.80$ 2021 Variance Occupancy change vs 2021 20.0% 12.7% 5.2% 6.2% 3.3% -1.0% 3.0% 9.6% ADR change vs 2021 47.4% 36.4% 14.6% 16.2% 12.4% 8.0% 12.7% 24.8% RevPAR change vs 2021 76.8% 53.7% 20.6% 23.4% 16.1% 7.0% 16.1% 36.8% 2019 Variance Occupancy change vs 2019 -16.1% -8.7% -9.7% -8.1% -11.5% -10.5% -9.9% -11.0% ADR change vs 2019 -6.2% 2.1% 4.2% 4.2% 4.7% 8.8% 5.7% 1.5% RevPAR change vs 2019 -21.3% -6.8% -5.9% -4.2% -7.3% -2.7% -4.8% -9.7% 20
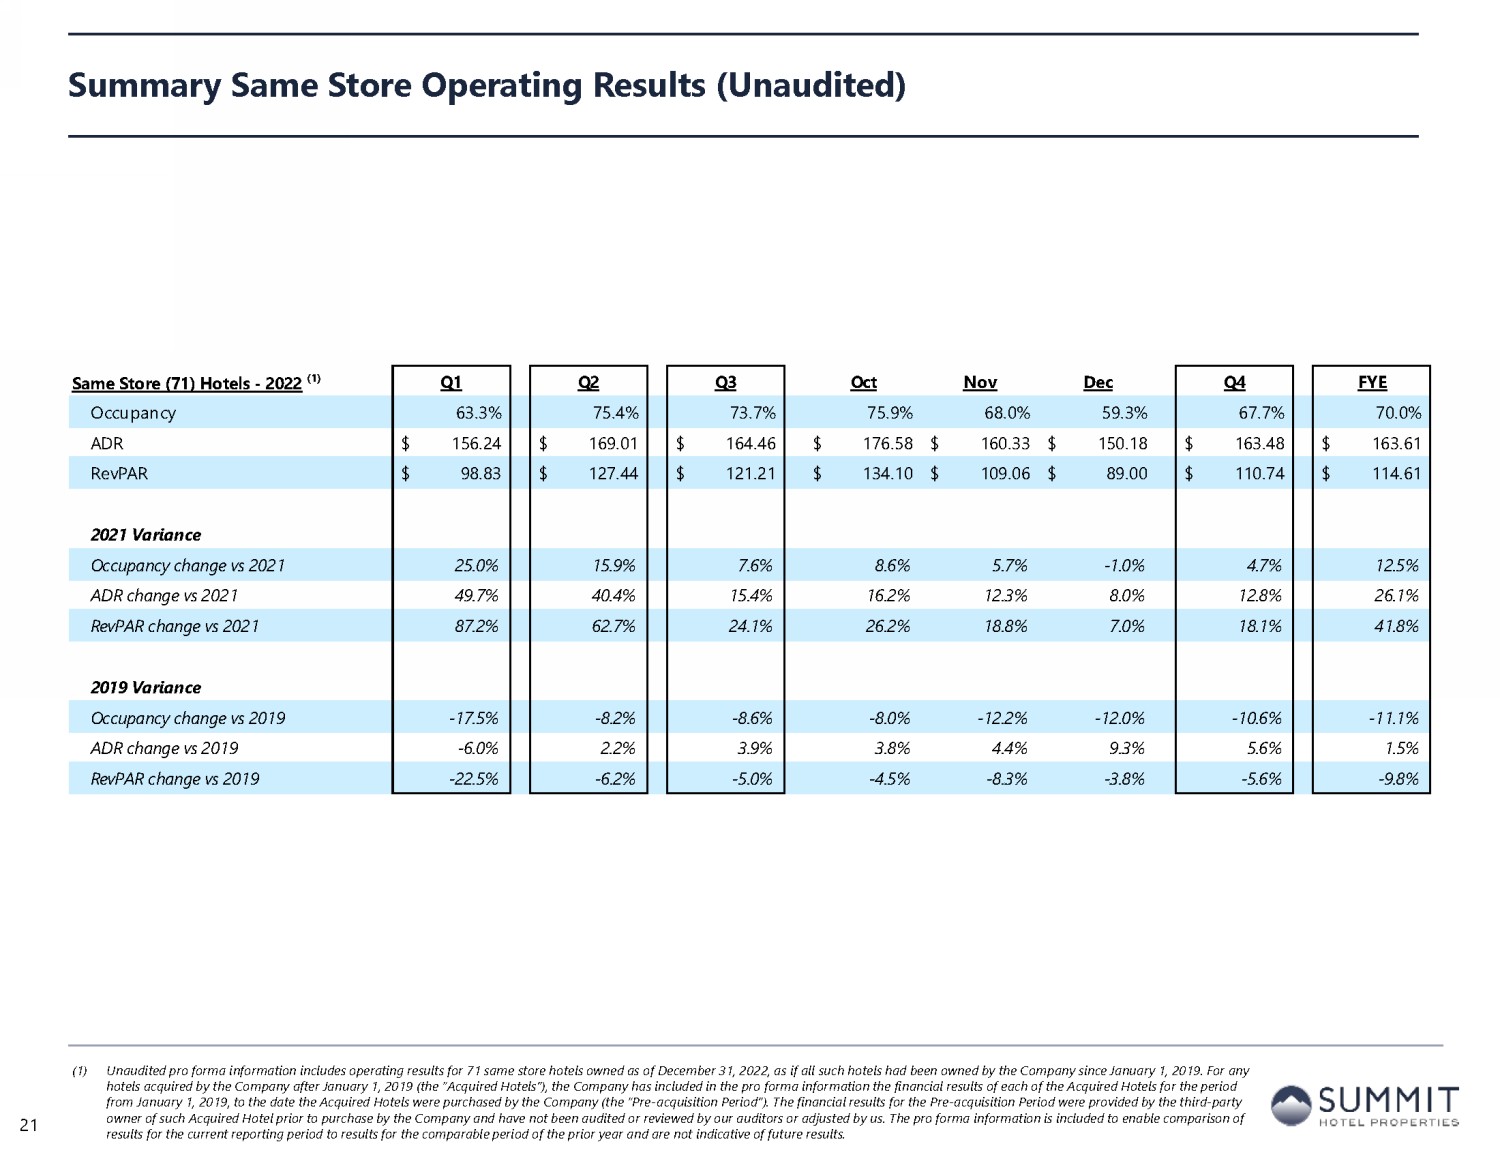
Summary Same Store Operating Results (1) Unaudited pro forma information includes operating results for 71 same store hotels owned as of December 31, 2022, as if all suc h hotels had been owned by the Company since January 1, 2019. For any hotels acquired by the Company after January 1, 2019 (the “Acquired Hotels”), the Company has included in the pro forma infor mat ion the financial results of each of the Acquired Hotels for the period from January 1, 2019, to the date the Acquired Hotels were purchased by the Company (the “Pre - acquisition Period”). The financia l results for the Pre - acquisition Period were provided by the third - party owner of such Acquired Hotel prior to purchase by the Company and have not been audited or reviewed by our auditors or adjust ed by us. The pro forma information is included to enable comparison of results for the current reporting period to results for the comparable period of the prior year and are not indicative of fut ure results. Same Store (71) Hotels - 2022 (1) Q1 Q2 Q3 Oct Nov Dec Q4 FYE Occupancy 64.0% 74.5% 72.2% 75.9% 68.2% 60.4% 68.2% 69.7% ADR 152.30$ 162.57$ 158.61$ 170.65$ 155.35$ 145.88$ 158.26$ 158.15$ RevPAR 97.46$ 121.10$ 114.50$ 129.53$ 106.02$ 88.15$ 107.92$ 110.29$ 2021 Variance Occupancy change vs 2021 20.3% 13.0% 5.1% 6.3% 3.0% -0.6% 3.1% 9.7% ADR change vs 2021 47.6% 36.2% 15.0% 16.9% 12.8% 8.4% 13.3% 25.0% RevPAR change vs 2021 77.6% 53.8% 20.9% 24.3% 16.2% 7.7% 16.7% 37.2% 2019 Variance Occupancy change vs 2019 -16.3% -9.3% -9.2% -7.6% -11.2% -9.7% -9.4% -10.9% ADR change vs 2019 -5.7% 1.6% 3.9% 4.0% 4.7% 9.5% 5.8% 1.5% RevPAR change vs 2019 -21.1% -7.8% -5.6% -3.8% -7.0% -1.2% -4.1% -9.7% 21
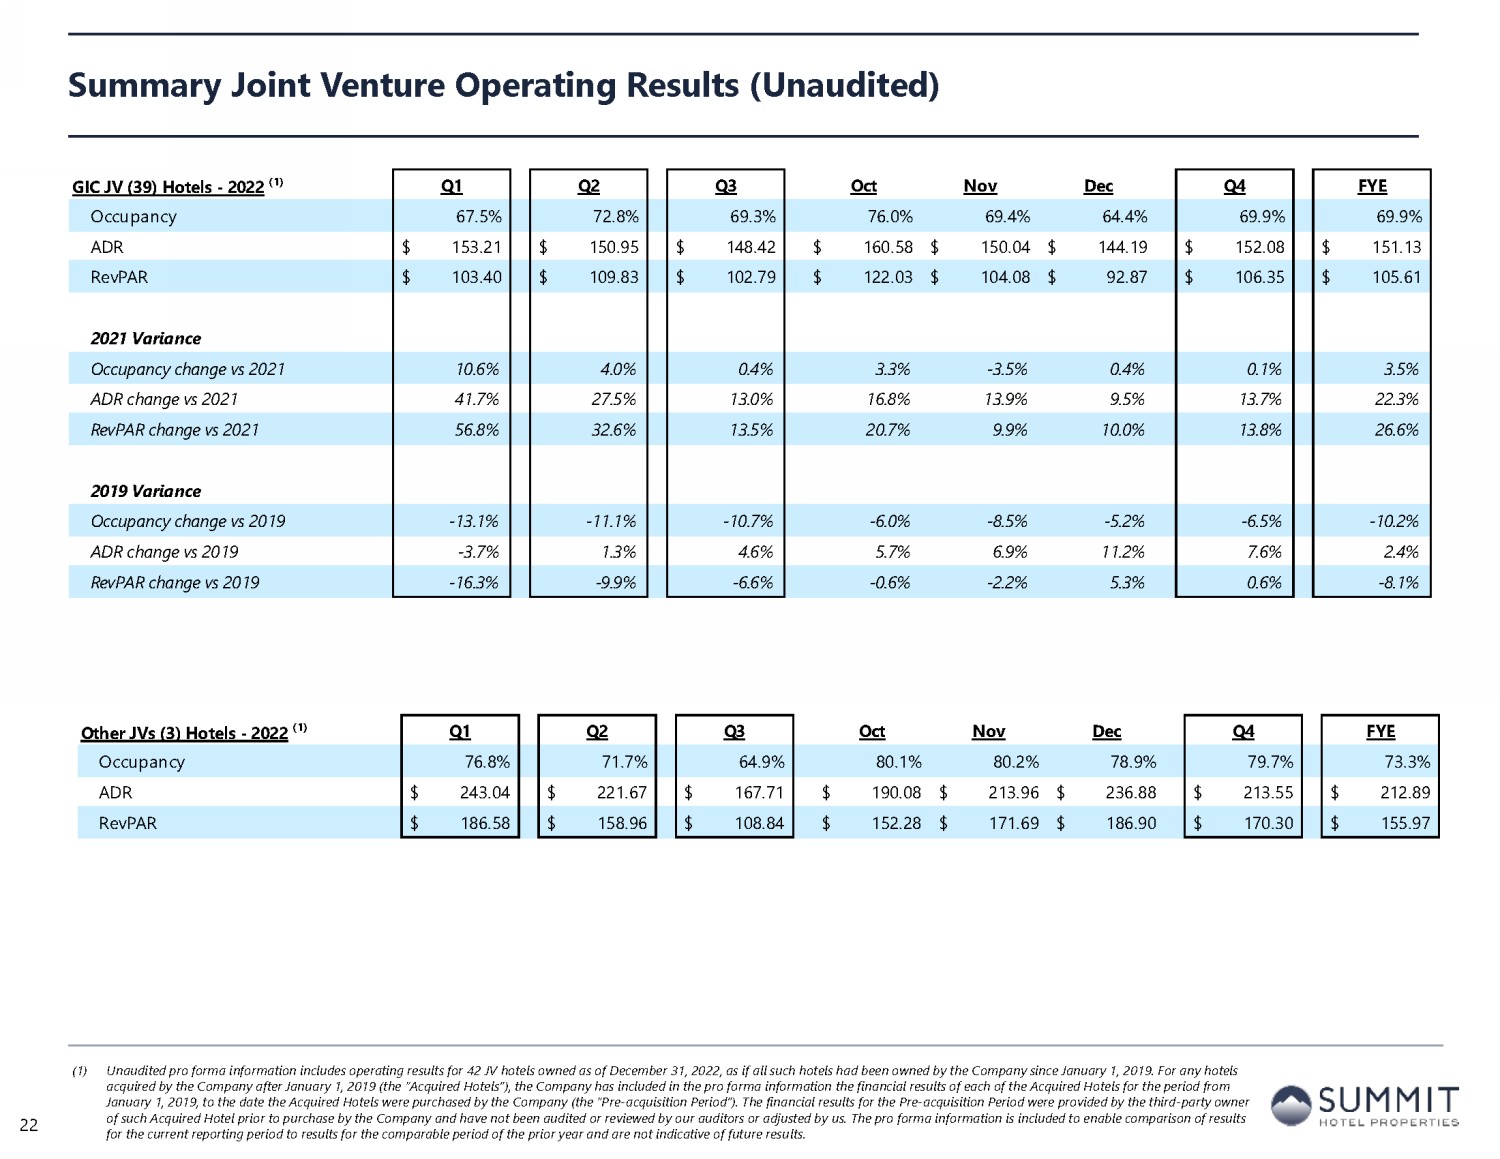
Summary Joint Venture Operating Results (1) Unaudited pro forma information includes operating results for 42 JV hotels owned as of December 31, 2022, as if all such hotels had been owned by the Company since January 1, 2019. For any h ot els acquired by the Company after January 1, 2019 (the “Acquired Hotels”), the Company has included in the pro forma information the financial results of each of the Acquired Hotels for the period from January 1, 2019, to the date the Acquired Hotels were purchased by the Company (the “Pre - acquisition Period”). The financial res ults for the Pre - acquisition Period were provided by the third - party owner of such Acquired Hotel prior to purchase by the Company and have not been audited or reviewed by our auditors or adjusted by us. The pro forma information is included to enable comparison of results for the current reporting period to results for the comparable period of the prior year and are not indicative of future resu lts . 22 GIC JV (39) Hotels - 2022 (1) Q1 Q2 Q3 Oct Nov Dec Q4 FYE Occupancy 67.5% 72.8% 69.3% 76.0% 69.4% 64.4% 69.9% 69.9% ADR 153.21$ 150.95$ 148.42$ 160.58$ 150.04$ 144.19$ 152.08$ 151.13$ RevPAR 103.40$ 109.83$ 102.79$ 122.03$ 104.08$ 92.87$ 106.35$ 105.61$ 2021 Variance Occupancy change vs 2021 10.6% 4.0% 0.4% 3.3% -3.5% 0.4% 0.1% 3.5% ADR change vs 2021 41.7% 27.5% 13.0% 16.8% 13.9% 9.5% 13.7% 22.3% RevPAR change vs 2021 56.8% 32.6% 13.5% 20.7% 9.9% 10.0% 13.8% 26.6% 2019 Variance Occupancy change vs 2019 -13.1% -11.1% -10.7% -6.0% -8.5% -5.2% -6.5% -10.2% ADR change vs 2019 -3.7% 1.3% 4.6% 5.7% 6.9% 11.2% 7.6% 2.4% RevPAR change vs 2019 -16.3% -9.9% -6.6% -0.6% -2.2% 5.3% 0.6% -8.1% Other JVs (3) Hotels - 2022 (1) Q1 Q2 Q3 Oct Nov Dec Q4 FYE Occupancy 76.8% 71.7% 64.9% 80.1% 80.2% 78.9% 79.7% 73.3% ADR 243.04$ 221.67$ 167.71$ 190.08$ 213.96$ 236.88$ 213.55$ 212.89$ RevPAR 186.58$ 158.96$ 108.84$ 152.28$ 171.69$ 186.90$ 170.30$ 155.97$ GIC JV (39) Hotels - 2022 (1) Q1 Q2 Q3 Oct Nov Dec Q4 FYE Occupancy 67.5% 72.8% 69.3% 76.0% 69.4% 64.4% 69.9% 69.9% ADR 153.21$ 150.95$ 148.42$ 160.58$ 150.04$ 144.19$ 152.08$ 151.13$ RevPAR 103.40$ 109.83$ 102.79$ 122.03$ 104.08$ 92.87$ 106.35$ 105.61$ 2021 Variance Occupancy change vs 2021 10.6% 4.0% 0.4% 3.3% -3.5% 0.4% 0.1% 3.5% ADR change vs 2021 41.7% 27.5% 13.0% 16.8% 13.9% 9.5% 13.7% 22.3% RevPAR change vs 2021 56.8% 32.6% 13.5% 20.7% 9.9% 10.0% 13.8% 26.6% 2019 Variance Occupancy change vs 2019 -13.1% -11.1% -10.7% -6.0% -8.5% -5.2% -6.5% -10.2% ADR change vs 2019 -3.7% 1.3% 4.6% 5.7% 6.9% 11.2% 7.6% 2.4% RevPAR change vs 2019 -16.3% -9.9% -6.6% -0.6% -2.2% 5.3% 0.6% -8.1% Other JVs (3) Hotels - 2022 (1) Q1 Q2 Q3 Oct Nov Dec Q4 FYE Occupancy 76.8% 71.7% 64.9% 80.1% 80.2% 78.9% 79.7% 73.3% ADR 243.04$ 221.67$ 167.71$ 190.08$ 213.96$ 236.88$ 213.55$ 212.89$ RevPAR 186.58$ 158.96$ 108.84$ 152.28$ 171.69$ 186.90$ 170.30$ 155.97$
Table of Contents Section I Forward - Looking Statements and Non - GAAP Financial Measure Disclosures Section II Corporate Financial Schedules Section III Operating & Property - Level Schedules Section IV Capitalization and Debt Schedules Section VI Asset Listing 23

Capitalization – Total Enterprise Value December 31, September 30, June 30, March 31, December 31, (in thousands, except per share data) 2022 2022 2022 2022 2021 Common Share Price & Dividends At quarter ended 7.22$ 6.72$ 7.27$ 9.96$ 9.76$ High during quarter ended 8.64$ 8.99$ 10.17$ 10.52$ 10.54$ Low during quarter ended 6.79$ 6.66$ 6.80$ 8.89$ 8.53$ Common dividends per share 0.04$ 0.04$ 0.04$ -$ -$ Common Shares & Units Common shares outstanding 106,902 106,896 106,899 107,065 106,341 Common units outstanding 15,977 15,989 15,989 15,989 125 Total common shares and units outstanding 122,878 122,885 122,888 123,054 106,466 Capitalization Market value of common equity at quarter end 887,182$ 825,790$ 893,399$ 1,225,620$ 1,039,106$ Liquidation value of preferred equity - 6.250% Series E 160,000 160,000 160,000 160,000 160,000 Liquidation value of preferred equity - 5.875% Series F 100,000 100,000 100,000 100,000 100,000 Liquidation value of preferred equity - 5.250% Series Z 50,000 50,000 50,000 50,000 - Consolidated total debt 1,463,124$ 1,481,147$ 1,537,082$ 1,496,640$ 1,081,316$ Less: consolidated total cash (51,255) (72,617) (109,999) (82,397) (64,485) Consolidated total enterprise value 2,609,051$ 2,544,320$ 2,630,482$ 2,949,863$ 2,315,937$ Noncontrolling interest in consolidated total debt - GIC JV (308,369) (308,399) (308,474) (280,817) (76,807) Noncontrolling interest in consolidated total debt - Other JVs (4,700) (4,700) (4,700) - - Noncontrolling interest in consolidated total cash - GIC JV 12,937 15,581 23,351 19,695 5,999 Noncontrolling interest in consolidated total cash - Other JVs 259 166 50 - - Pro rata total enterprise value 2,309,177$ 2,246,969$ 2,340,709$ 2,688,741$ 2,245,129$ 24
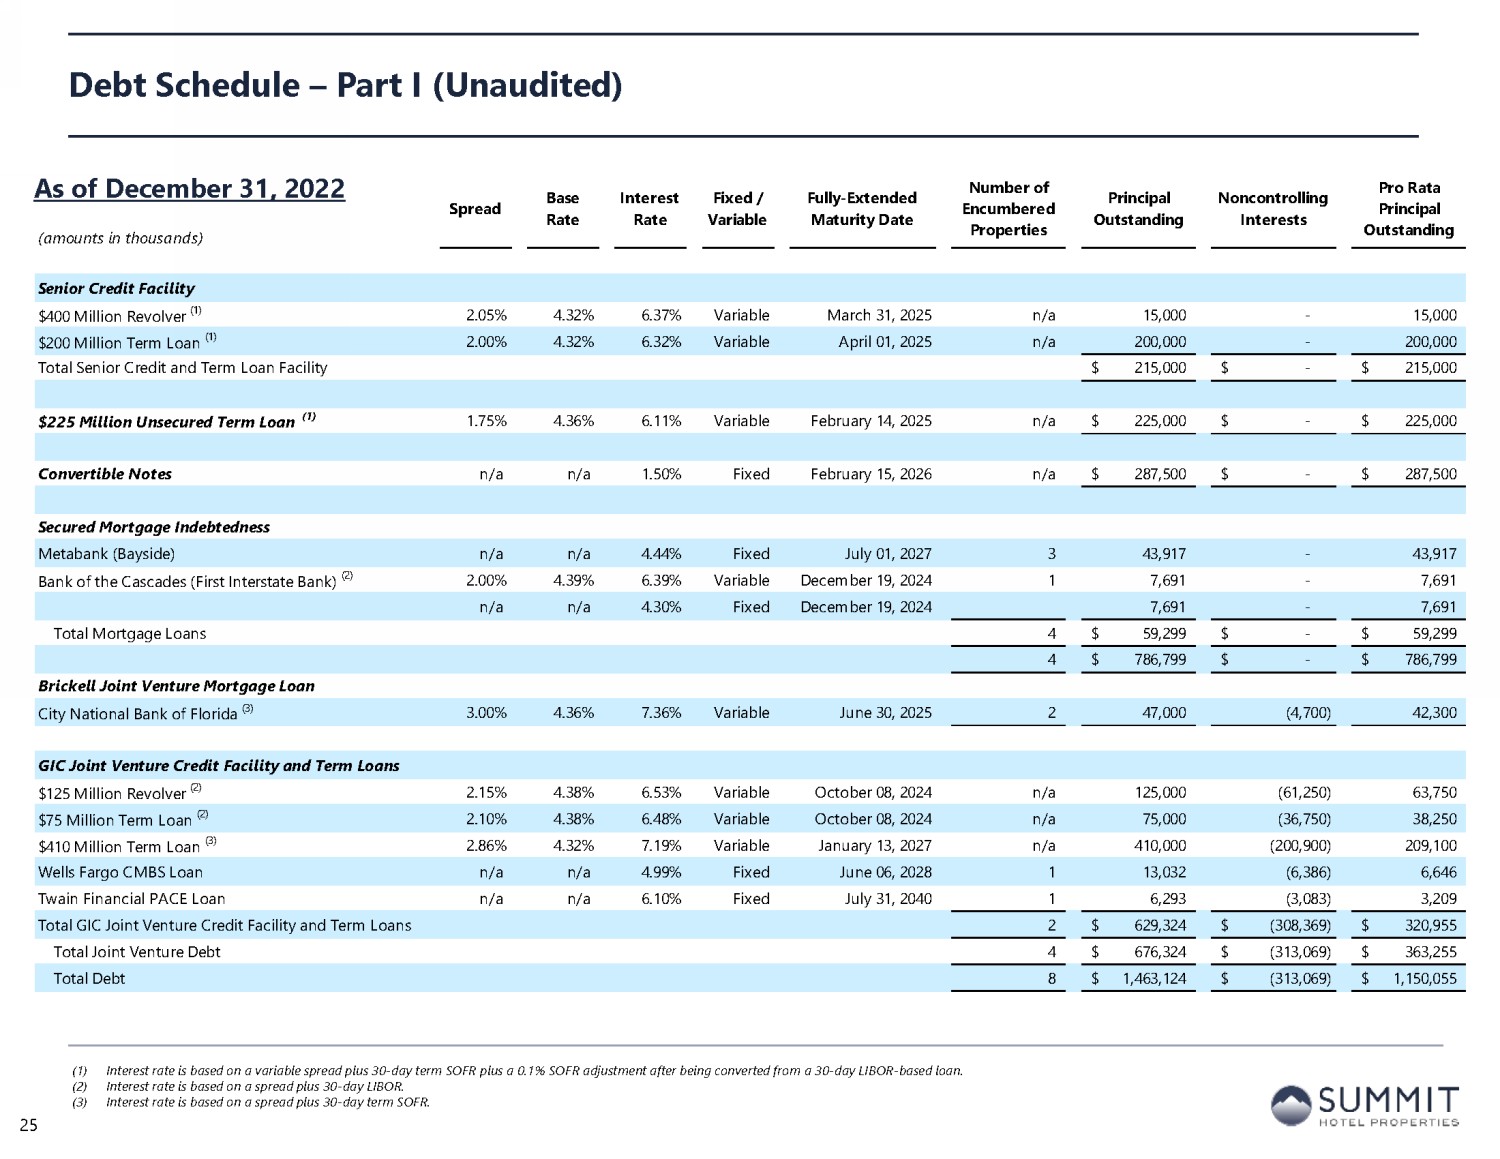
(amounts in thousands) Spread Base Rate Interest Rate Fixed / Variable Fully-Extended Maturity Date Number of Encumbered Properties Principal Outstanding Noncontrolling Interests Pro Rata Principal Outstanding Senior Credit Facility $400 Million Revolver (1) 2.05% 4.32% 6.37% Variable March 31, 2025 n/a 15,000 - 15,000 $200 Million Term Loan (1) 2.00% 4.32% 6.32% Variable April 01, 2025 n/a 200,000 - 200,000 Total Senior Credit and Term Loan Facility 215,000$ -$ 215,000$ $225 Million Unsecured Term Loan (1) 1.75% 4.36% 6.11% Variable February 14, 2025 n/a 225,000$ -$ 225,000$ Convertible Notes n/a n/a 1.50% Fixed February 15, 2026 n/a 287,500$ -$ 287,500$ Secured Mortgage Indebtedness Metabank (Bayside) n/a n/a 4.44% Fixed July 01, 2027 3 43,917 - 43,917 Bank of the Cascades (First Interstate Bank) (2) 2.00% 4.39% 6.39% Variable December 19, 2024 1 7,691 - 7,691 n/a n/a 4.30% Fixed December 19, 2024 7,691 - 7,691 Total Mortgage Loans 4 59,299$ -$ 59,299$ 4 786,799$ -$ 786,799$ Brickell Joint Venture Mortgage Loan City National Bank of Florida (3) 3.00% 4.36% 7.36% Variable June 30, 2025 2 47,000 (4,700) 42,300 GIC Joint Venture Credit Facility and Term Loans $125 Million Revolver (2) 2.15% 4.38% 6.53% Variable October 08, 2024 n/a 125,000 (61,250) 63,750 $75 Million Term Loan (2) 2.10% 4.38% 6.48% Variable October 08, 2024 n/a 75,000 (36,750) 38,250 $410 Million Term Loan (3) 2.86% 4.32% 7.19% Variable January 13, 2027 n/a 410,000 (200,900) 209,100 Wells Fargo CMBS Loan n/a n/a 4.99% Fixed June 06, 2028 1 13,032 (6,386) 6,646 Twain Financial PACE Loan n/a n/a 6.10% Fixed July 31, 2040 1 6,293 (3,083) 3,209 Total GIC Joint Venture Credit Facility and Term Loans 2 629,324$ (308,369)$ 320,955$ Total Joint Venture Debt 4 676,324$ (313,069)$ 363,255$ Total Debt 8 1,463,124$ (313,069)$ 1,150,055$ Debt Schedule – Part I (1) Interest rate is based on a variable spread plus 30 - day term SOFR plus a 0.1% SOFR adjustment after being converted from a 30 - da y LIBOR - based loan. (2) Interest rate is based on a spread plus 30 - day LIBOR. (3) Interest rate is based on a spread plus 30 - day term SOFR. As of December 31, 2022 25

Debt Schedule – Part II As of December 31, 2022 (amounts in thousands) Principal Amount Outstanding Fixed Debt Outstanding Variable Debt Outstanding Effective Interest Rate Total Debt 1,463,124$ 358,433$ 1,104,691$ 5.56% Noncontrolling Interests in Joint Ventures (313,069) (9,469) (303,600) Pro Rata Debt 1,150,055$ 348,964$ 801,091$ 5.19% % of Pro Rata Debt 100% 30% 70% Adjustment for Effective Swaps 0 400,000 (400,000) Pro Rata Debt Including Swaps 1,150,055$ 748,964$ 401,091$ 4.53% % of Pro Rata Debt Including Swaps 100% 65% 35% Interest Rate Swaps Notional Value Swap Rate Effective Date Maturity Date US Bank - 2017 - $100mm 100,000 1.9560% January 29, 2018 January 31, 2023 PNC Bank - 2017 - $100mm 100,000 1.9780% January 29, 2018 January 31, 2023 Regions - 2018 - $75mm 75,000 2.8570% September 28, 2018 September 30, 2024 Regions - 2018 - $125mm 125,000 2.9170% December 31, 2018 December 31, 2025 Current Swaps 400,000$ 2.4308% Capital One - 2022 - $100mm 100,000 2.6000% January 31, 2023 January 31, 2027 Regions - 2022 - $100mm 100,000 2.5625% January 31, 2023 January 31, 2029 New Swaps (Effective January 31st) 200,000$ 1.2906% 26
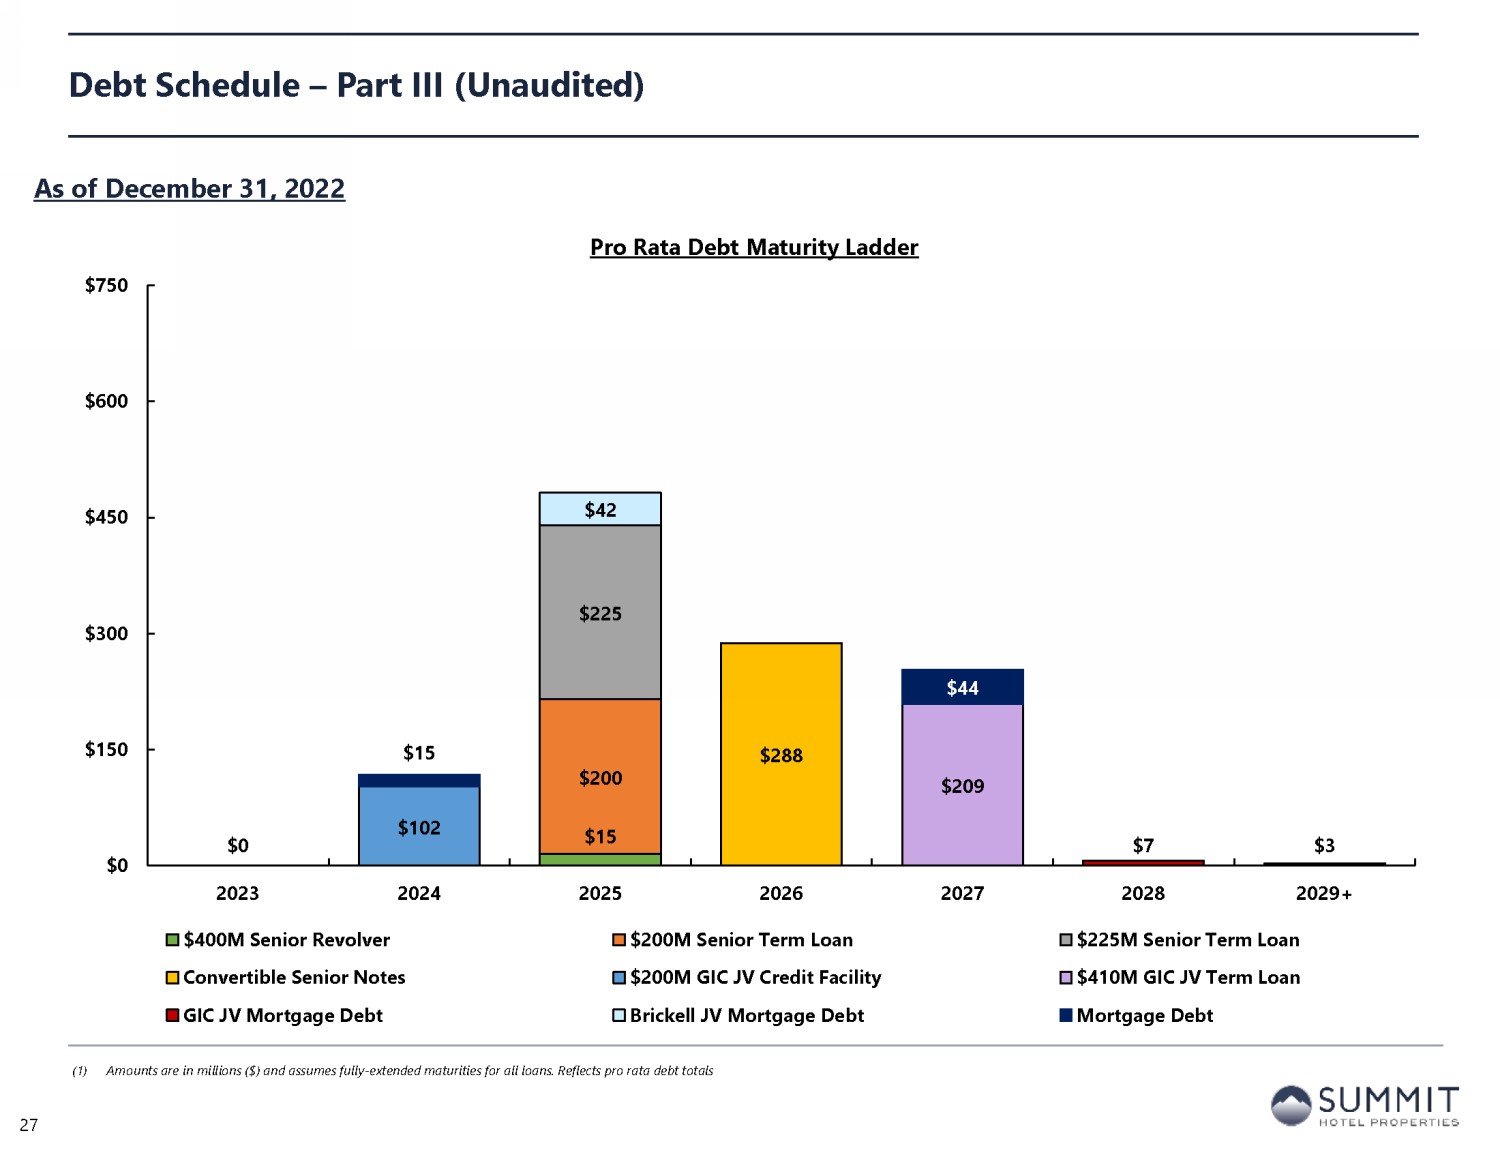
$15 $200 $225 $288 $0 $102 $209 $7 $3 $42 $15 $44 $0 $150 $300 $450 $600 $750 2023 2024 2025 2026 2027 2028 2029+ Pro Rata Debt Maturity Ladder $400M Senior Revolver $200M Senior Term Loan $225M Senior Term Loan Convertible Senior Notes $200M GIC JV Credit Facility $410M GIC JV Term Loan GIC JV Mortgage Debt Brickell JV Mortgage Debt Mortgage Debt Debt Schedule – Part III (1) Amounts are in millions ($) and assumes fully - extended maturities for all loans. Reflects pro rata debt totals 27 As of December 31, 2022
Table of Contents Section I Forward - Looking Statements and Non - GAAP Financial Measure Disclosures Section II Corporate Financial Schedules Section III Operating & Property - Level Schedules Section IV Capitalization and Debt Schedules Section VI Asset Listing 28
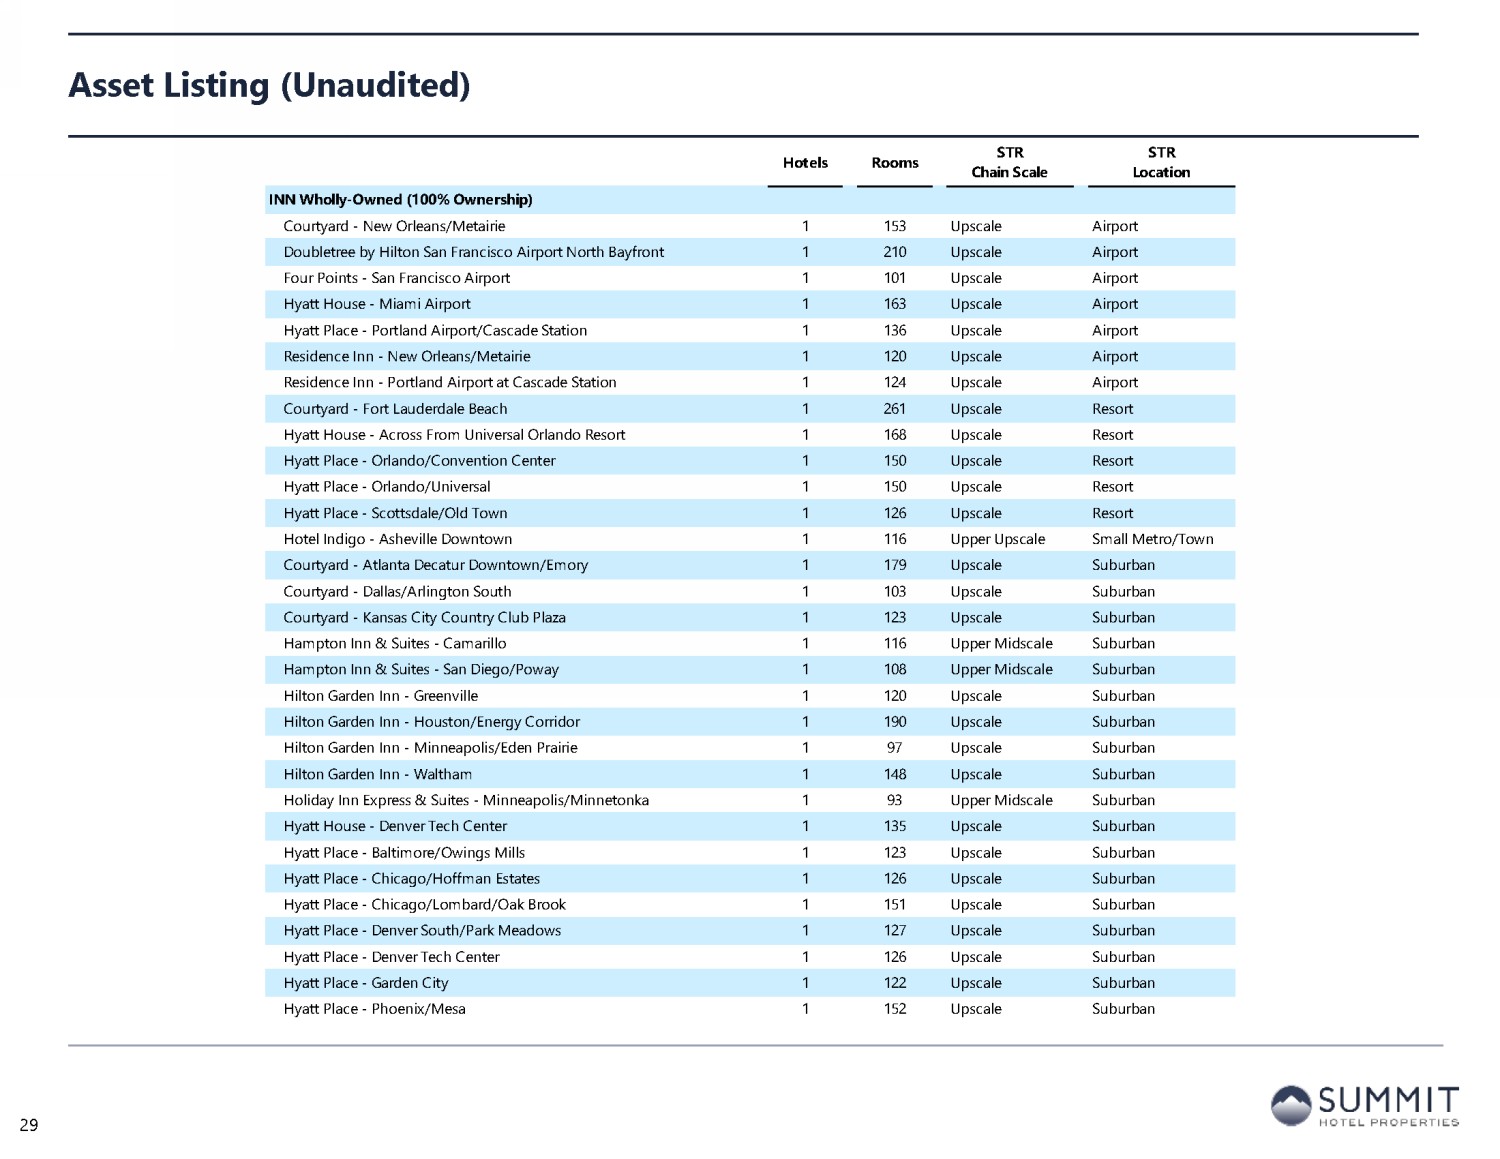
Asset Listing Hotels Rooms STR Chain Scale STR Location INN Wholly-Owned (100% Ownership) Courtyard - New Orleans/Metairie 1 153 Upscale Airport Doubletree by Hilton San Francisco Airport North Bayfront 1 210 Upscale Airport Four Points - San Francisco Airport 1 101 Upscale Airport Hyatt House - Miami Airport 1 163 Upscale Airport Hyatt Place - Portland Airport/Cascade Station 1 136 Upscale Airport Residence Inn - New Orleans/Metairie 1 120 Upscale Airport Residence Inn - Portland Airport at Cascade Station 1 124 Upscale Airport Courtyard - Fort Lauderdale Beach 1 261 Upscale Resort Hyatt House - Across From Universal Orlando Resort 1 168 Upscale Resort Hyatt Place - Orlando/Convention Center 1 150 Upscale Resort Hyatt Place - Orlando/Universal 1 150 Upscale Resort Hyatt Place - Scottsdale/Old Town 1 126 Upscale Resort Hotel Indigo - Asheville Downtown 1 116 Upper Upscale Small Metro/Town Courtyard - Atlanta Decatur Downtown/Emory 1 179 Upscale Suburban Courtyard - Dallas/Arlington South 1 103 Upscale Suburban Courtyard - Kansas City Country Club Plaza 1 123 Upscale Suburban Hampton Inn & Suites - Camarillo 1 116 Upper Midscale Suburban Hampton Inn & Suites - San Diego/Poway 1 108 Upper Midscale Suburban Hilton Garden Inn - Greenville 1 120 Upscale Suburban Hilton Garden Inn - Houston/Energy Corridor 1 190 Upscale Suburban Hilton Garden Inn - Minneapolis/Eden Prairie 1 97 Upscale Suburban Hilton Garden Inn - Waltham 1 148 Upscale Suburban Holiday Inn Express & Suites - Minneapolis/Minnetonka 1 93 Upper Midscale Suburban Hyatt House - Denver Tech Center 1 135 Upscale Suburban Hyatt Place - Baltimore/Owings Mills 1 123 Upscale Suburban Hyatt Place - Chicago/Hoffman Estates 1 126 Upscale Suburban Hyatt Place - Chicago/Lombard/Oak Brook 1 151 Upscale Suburban Hyatt Place - Denver South/Park Meadows 1 127 Upscale Suburban Hyatt Place - Denver Tech Center 1 126 Upscale Suburban Hyatt Place - Garden City 1 122 Upscale Suburban Hyatt Place - Phoenix/Mesa 1 152 Upscale Suburban 29
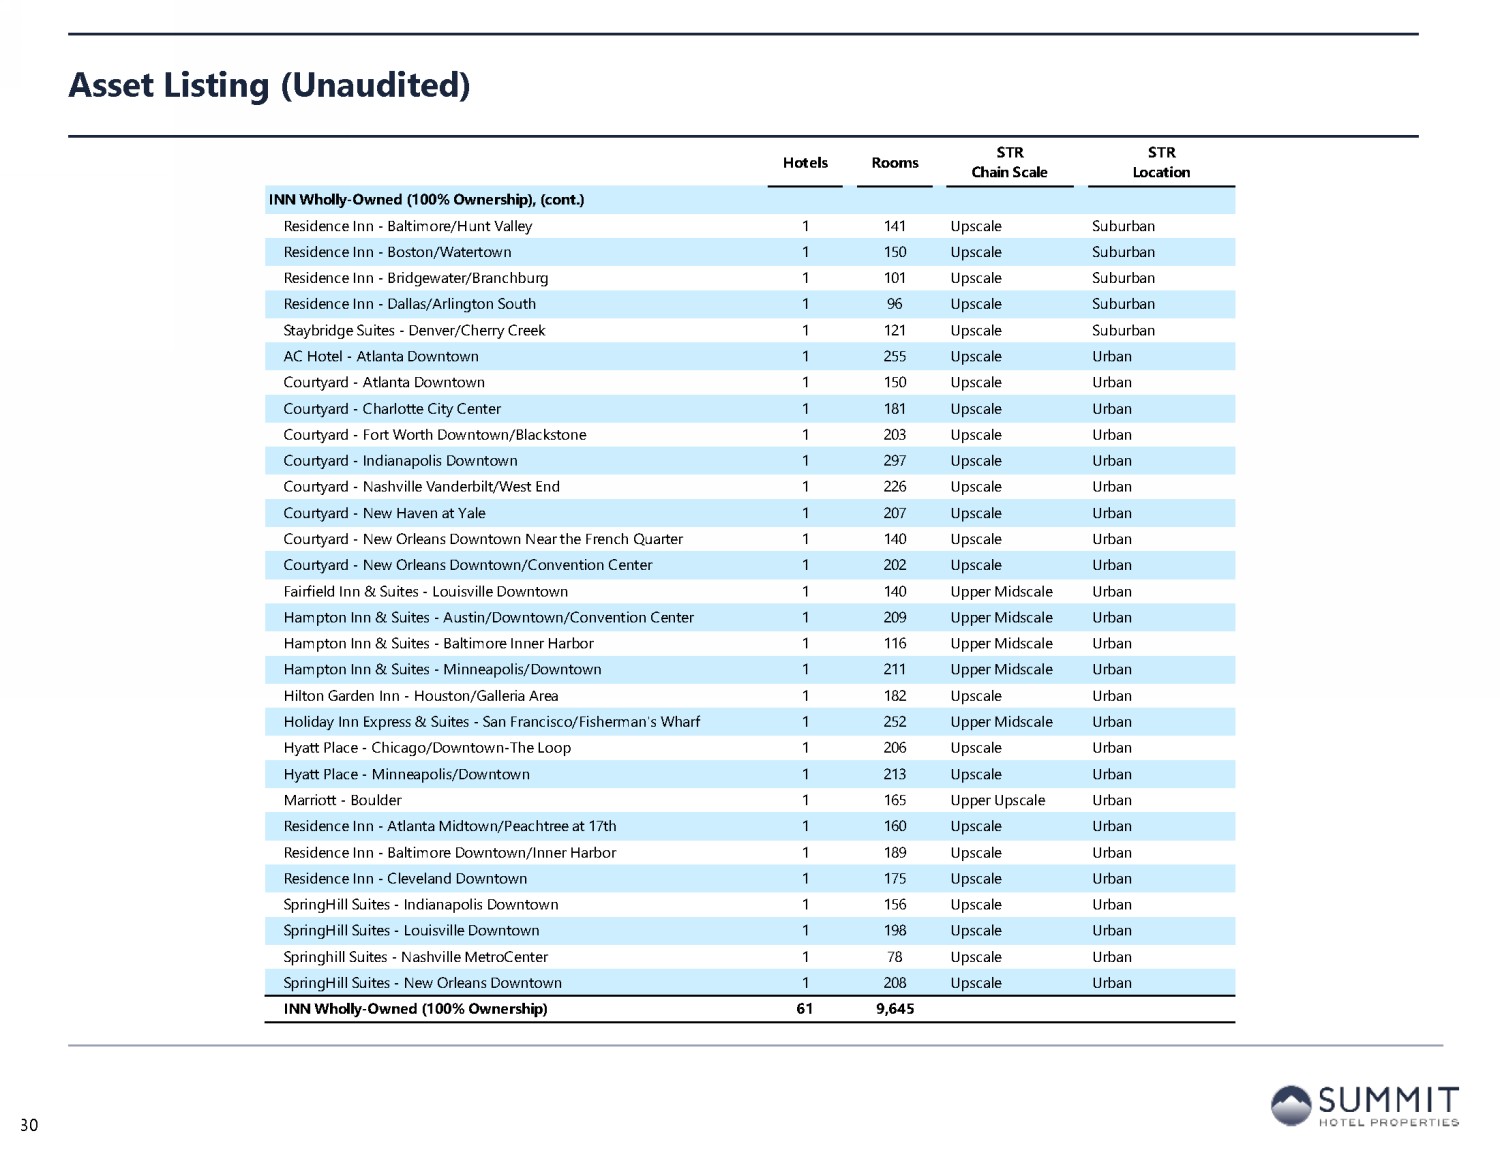
Asset Listing (cont.) Hotels Rooms STR Chain Scale STR Location INN Wholly-Owned (100% Ownership), (cont.) Residence Inn - Baltimore/Hunt Valley 1 141 Upscale Suburban Residence Inn - Boston/Watertown 1 150 Upscale Suburban Residence Inn - Bridgewater/Branchburg 1 101 Upscale Suburban Residence Inn - Dallas/Arlington South 1 96 Upscale Suburban Staybridge Suites - Denver/Cherry Creek 1 121 Upscale Suburban AC Hotel - Atlanta Downtown 1 255 Upscale Urban Courtyard - Atlanta Downtown 1 150 Upscale Urban Courtyard - Charlotte City Center 1 181 Upscale Urban Courtyard - Fort Worth Downtown/Blackstone 1 203 Upscale Urban Courtyard - Indianapolis Downtown 1 297 Upscale Urban Courtyard - Nashville Vanderbilt/West End 1 226 Upscale Urban Courtyard - New Haven at Yale 1 207 Upscale Urban Courtyard - New Orleans Downtown Near the French Quarter 1 140 Upscale Urban Courtyard - New Orleans Downtown/Convention Center 1 202 Upscale Urban Fairfield Inn & Suites - Louisville Downtown 1 140 Upper Midscale Urban Hampton Inn & Suites - Austin/Downtown/Convention Center 1 209 Upper Midscale Urban Hampton Inn & Suites - Baltimore Inner Harbor 1 116 Upper Midscale Urban Hampton Inn & Suites - Minneapolis/Downtown 1 211 Upper Midscale Urban Hilton Garden Inn - Houston/Galleria Area 1 182 Upscale Urban Holiday Inn Express & Suites - San Francisco/Fisherman's Wharf 1 252 Upper Midscale Urban Hyatt Place - Chicago/Downtown-The Loop 1 206 Upscale Urban Hyatt Place - Minneapolis/Downtown 1 213 Upscale Urban Marriott - Boulder 1 165 Upper Upscale Urban Residence Inn - Atlanta Midtown/Peachtree at 17th 1 160 Upscale Urban Residence Inn - Baltimore Downtown/Inner Harbor 1 189 Upscale Urban Residence Inn - Cleveland Downtown 1 175 Upscale Urban SpringHill Suites - Indianapolis Downtown 1 156 Upscale Urban SpringHill Suites - Louisville Downtown 1 198 Upscale Urban Springhill Suites - Nashville MetroCenter 1 78 Upscale Urban SpringHill Suites - New Orleans Downtown 1 208 Upscale Urban INN Wholly-Owned (100% Ownership) 61 9,645 30
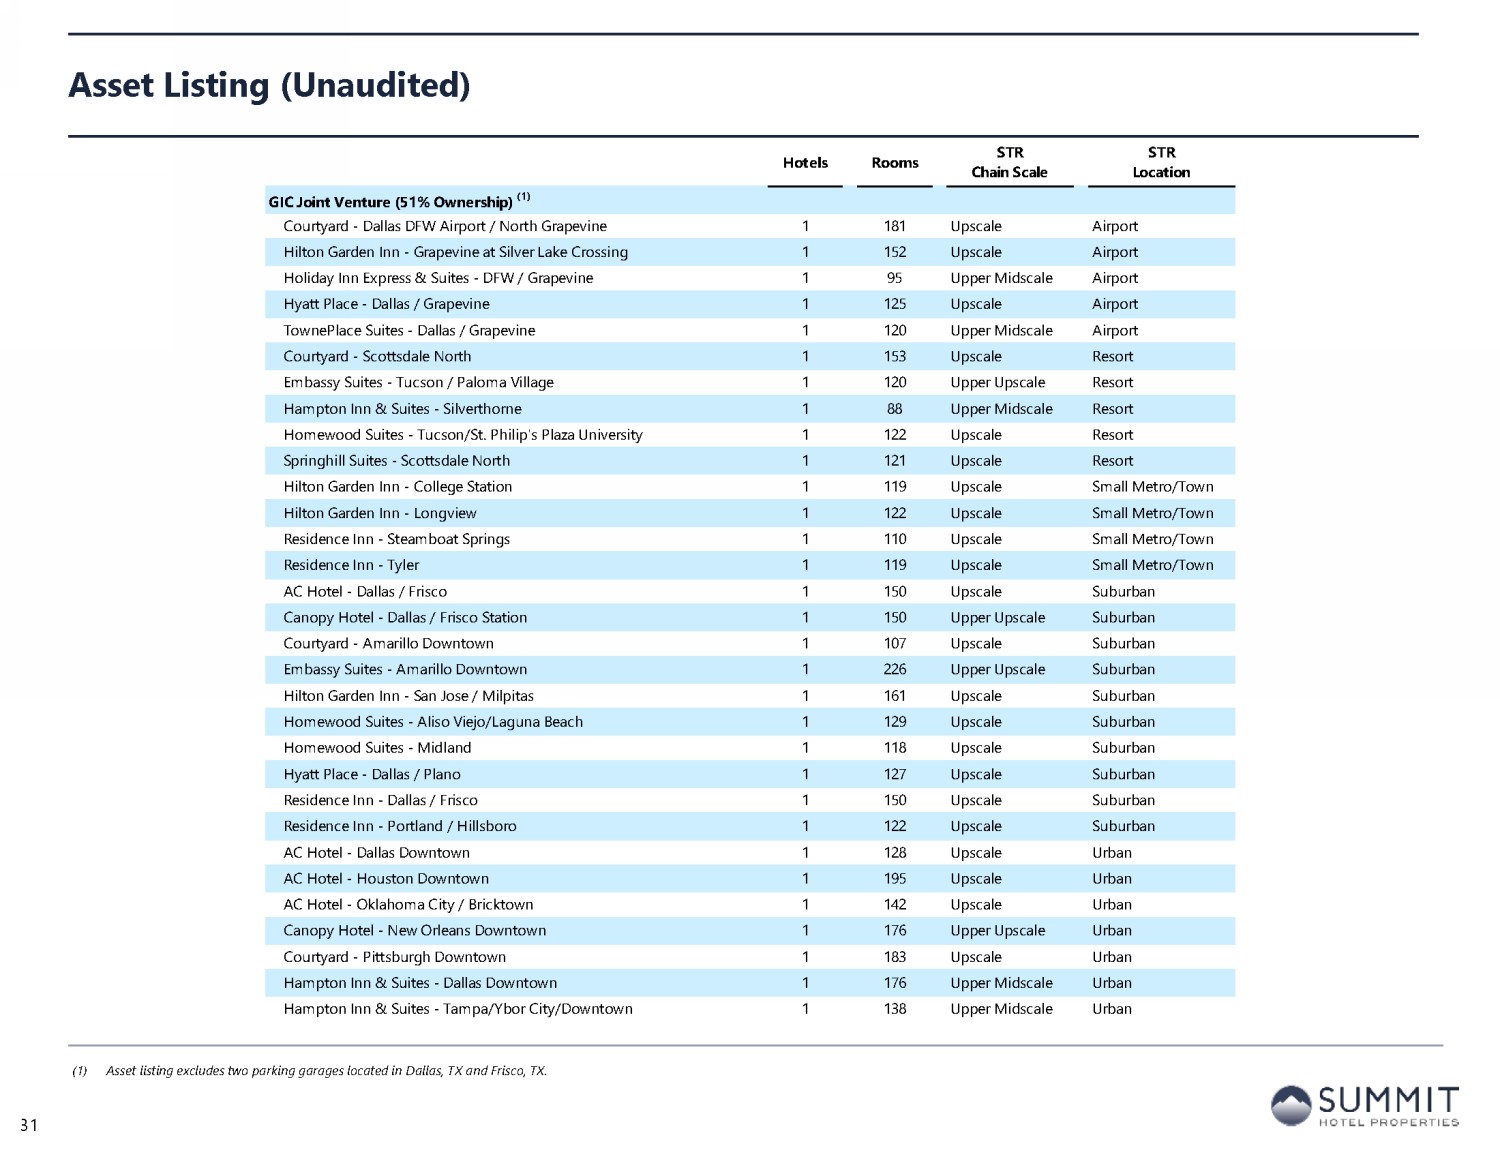
Asset Listing (cont.) Hotels Rooms STR Chain Scale STR Location GIC Joint Venture (51% Ownership) (1) Courtyard - Dallas DFW Airport / North Grapevine 1 181 Upscale Airport Hilton Garden Inn - Grapevine at Silver Lake Crossing 1 152 Upscale Airport Holiday Inn Express & Suites - DFW / Grapevine 1 95 Upper Midscale Airport Hyatt Place - Dallas / Grapevine 1 125 Upscale Airport TownePlace Suites - Dallas / Grapevine 1 120 Upper Midscale Airport Courtyard - Scottsdale North 1 153 Upscale Resort Embassy Suites - Tucson / Paloma Village 1 120 Upper Upscale Resort Hampton Inn & Suites - Silverthorne 1 88 Upper Midscale Resort Homewood Suites - Tucson/St. Philip's Plaza University 1 122 Upscale Resort Springhill Suites - Scottsdale North 1 121 Upscale Resort Hilton Garden Inn - College Station 1 119 Upscale Small Metro/Town Hilton Garden Inn - Longview 1 122 Upscale Small Metro/Town Residence Inn - Steamboat Springs 1 110 Upscale Small Metro/Town Residence Inn - Tyler 1 119 Upscale Small Metro/Town AC Hotel - Dallas / Frisco 1 150 Upscale Suburban Canopy Hotel - Dallas / Frisco Station 1 150 Upper Upscale Suburban Courtyard - Amarillo Downtown 1 107 Upscale Suburban Embassy Suites - Amarillo Downtown 1 226 Upper Upscale Suburban Hilton Garden Inn - San Jose / Milpitas 1 161 Upscale Suburban Homewood Suites - Aliso Viejo/Laguna Beach 1 129 Upscale Suburban Homewood Suites - Midland 1 118 Upscale Suburban Hyatt Place - Dallas / Plano 1 127 Upscale Suburban Residence Inn - Dallas / Frisco 1 150 Upscale Suburban Residence Inn - Portland / Hillsboro 1 122 Upscale Suburban AC Hotel - Dallas Downtown 1 128 Upscale Urban AC Hotel - Houston Downtown 1 195 Upscale Urban AC Hotel - Oklahoma City / Bricktown 1 142 Upscale Urban Canopy Hotel - New Orleans Downtown 1 176 Upper Upscale Urban Courtyard - Pittsburgh Downtown 1 183 Upscale Urban Hampton Inn & Suites - Dallas Downtown 1 176 Upper Midscale Urban Hampton Inn & Suites - Tampa/Ybor City/Downtown 1 138 Upper Midscale Urban (1) Asset listing excludes two parking garages located in Dallas, TX and Frisco, TX. 31

Asset Listing (cont.) (1) Asset listing excludes two parking garages located in Dallas, TX and Frisco, TX. Hotels Rooms STR Chain Scale STR Location GIC Joint Venture (51% Ownership) (1) Holiday Inn Express & Suites - Oklahoma City Downtown / Bricktown 1 124 Upper Midscale Urban Hyatt Place - Lubbock 1 125 Upscale Urban Hyatt Place - Oklahoma City / Bricktown 1 134 Upscale Urban Residence Inn - Dallas Downtown 1 121 Upscale Urban Residence Inn - Portland Downtown / Riverplace 1 258 Upscale Urban SpringHill Suites - Dallas Downtown 1 148 Upscale Urban SpringHill Suites - New Orleans Downtown / Canal Street 1 74 Upscale Urban TownePlace Suites - New Orleans Downtown / Canal Street 1 105 Upper Midscale Urban GIC Joint Venture (51% Ownership) (1) 39 5,414 Other Joint Ventures (90% Ownership) Onera - Fredericksburg 1 11 Upper Upscale Small Metro/Town AC Hotel - Miami Downtown / Brickell 1 156 Upscale Urban Element - Miami Downtown / Brickell 1 108 Upscale Urban Other Joint Ventures (90% Ownership) 3 275 Pro Forma 103 15,334 32
