Exhibit 99.1

December 10, 2020

Forward - Looking Statements Some of the statements contained in this presentation may constitute forward - looking statements within the meaning of the federa l securities laws. Forward - looking statements relate to expectations, projections, financial targets, plans and strategies, anticipated events or trends and similar expressions conc ern ing matters that are not historical facts. In some cases, you can identify forward - looking statements by the use of forward - looking terminology such as ''may,'' ''will,'' ''should,'' ''expec ts,'' ''intends,'' ''plans,'' ''anticipates,'' ''believes,'' ''estimates,'' ''predicts,'' or ''potential'' or the negative of these words and phrases or similar words or phrases that are predictions of or indicate future events or trends and which do not relate solely to historical matters. You can also identify forward - looking statements by discussions of strategy, plans or intentions. The forward - looking statements contained in this presentation reflect our current views about future events and are subject to n umerous known and unknown risks, uncertainties, assumptions and changes in circumstances that may cause actual results to differ significantly from those expressed or contem pla ted in any forward - looking statement. While forward - looking statements reflect our good faith projections, assumptions and expectations, they are not guarantees of future result s. Furthermore, we disclaim any obligation to publicly update or revise any forward - looking statement to reflect changes in underlying assumptions or factors, new information, data or method s, future events or other changes, except as required by applicable law. Factors that could cause our results to differ materially include, but are not limited to: (1) the impact of the COVID - 19 pandemic on the Company’s business, results of operations, and financial condition, including due to its principal and interest advance obligations on Fannie Mae and Ginnie Ma e loans it services, and the domestic economy, (2) general economic conditions and multifamily and commercial real estate market conditions, (3) regulatory and/or legislative c han ges to Freddie Mac, Fannie Mae or HUD, (4) our ability to retain and attract loan originators and other professionals, and (5) changes in federal government fiscal and monetary pol ici es, including any constraints or cuts in federal funds allocated to HUD for loan originations. For a further discussion of these and other factors that could cause future results to differ materially from those expressed or contemplated in any forward - looking statements, see the section titled ''Risk Factors" in our most recent Annual Report on Form 10 - K, as it may be updated or supplemented by our subseq uent Quarterly Reports on Form 10 - Q and other SEC filings. Such filings are available publicly on our Investor Relations web page at www.walkerdunlop.com . Non - GAAP Financial Measures To supplement our financial statements presented in accordance with GAAP, we use adjusted EBITDA, a non - GAAP financial measure. The presentation of adjusted EBITDA is not intended to be considered in isolation or as a substitute for, or superior to, the financial information prepared and present ed in accordance with GAAP. When analyzing our operating performance, readers should use adjusted EBITDA in addition to, and not as an alternative for, net income. Adjusted EBITDA re pre sents net income before income taxes, interest expense on our term loan facility, and amortization and depreciation, adjusted for provision (benefit) for credit losses net of write - offs, stock - based incentive compensation charges, and fair value of expected net cash flows from servicing, net. Additionally, adjusted EBITDA further includes or excludes other s ign ificant non - cash items that are not part of our ongoing operations. Because not all companies use identical calculations, our presentation of adjusted EBITDA may not be comparable t o s imilarly titled measures of other companies. Furthermore, adjusted EBITDA is not intended to be a measure of free cash flow for our management’s discretionary use, as it doe s not reflect certain cash requirements such as tax and debt service payments. The amounts shown for adjusted EBITDA may also differ from the amounts calculated under similarly tit led definitions in our debt instruments, which are further adjusted to reflect certain other cash and non - cash charges that are used to determine compliance with financial covenan ts. We use adjusted EBITDA to evaluate the operating performance of our business, for comparison with forecasts and strategic pla ns, and for benchmarking performance externally against competitors. We believe that this non - GAAP measure, when read in conjunction with our GAAP financials, provides useful i nformation to investors by offering: Ɣ the ability to make more meaningful period - to - period comparisons of our ongoing operating results; Ɣ the ability to better identify trends in our underlying business and perform related trend analyses; and Ɣ a better understanding of how management plans and measures our underlying business We believe that adjusted EBITDA has limitations in that it does not reflect all of the amounts associated with our results of op erations as determined in accordance with GAAP and that adjusted EBITDA should only be used to evaluate our results of operations in conjunction with net income.

Willy Walker Chairman & CEO

OUR MISSION IS TO BE THE PREMIER COMMERCIAL REAL ESTATE FINANCE COMPANY IN THE COUNTRY
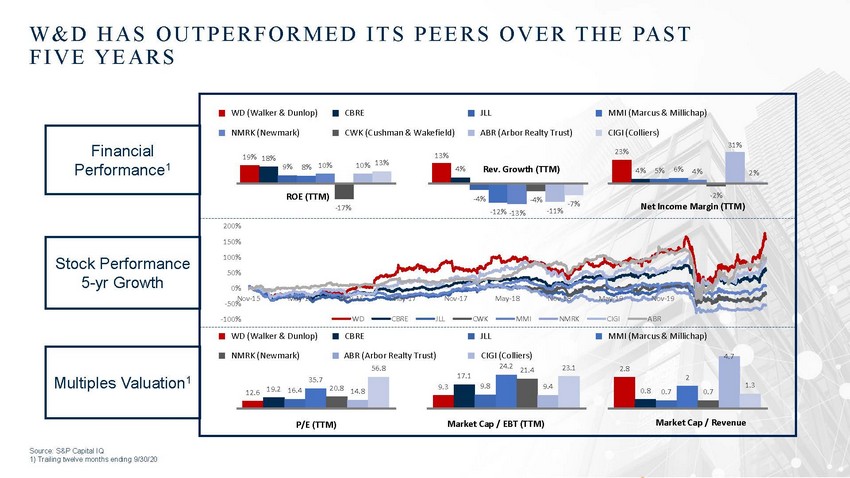
W & DH A S O U T P E R F O R M E D I T S P E E R S O V E RT H E PA S T F I V EY E A R S 13% Performance1 -7% Net Income Margin (TTM) -17% -11% -12% -13% 50% -50% 2 1) Trailing twelve months ending 9/30/20 WD (Walker & Dunlop)CBREJLLMMI (Marcus & Millichap) NMRK (Newmark)CWK (Cushman & Wakefield)ABR (Arbor Realty Trust)CIGI (Colliers) 31% 19% 18%13%23% 9%8% 10%10% ROE (TTM)-2% Financial 200% 150% 100% x 0% Nov-15May-16Nov-16May-17Nov-17May-18Nov-18May-19Nov-19May-20 -100%WDCBREJLLCWKMMINMRKCIGIABR Stock Performance 5-yr Growth WD (Walker & Dunlop)CBREJLLMMI (Marcus & Millichap) NMRK (Newmark)ABR (Arbor Realty Trust)CIGI (Colliers)4.7 56.824.2 21.423.1 20.8 14.8 P/E (TTM)Market Cap / EBT (TTM)Market Cap / Revenue Multiples Valuation1 17.1 9.4 9.3 9.8 35.7 12.6 19.2 16.4 2.8 1.3 0.80.7 0.7 4%Rev. Growth (TTM) -4% -4% 2% 4%5%6%4%
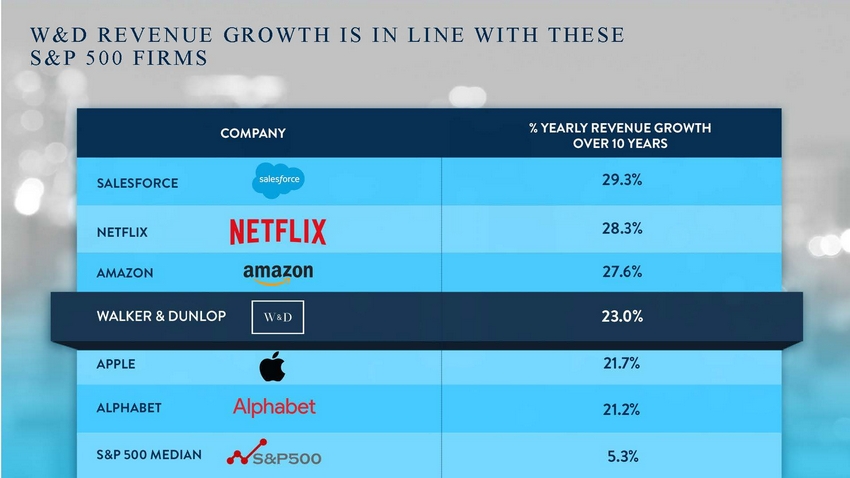
W&D REVENUE GROWTH IS IN LINE WITH THESE S&P 500 FIRMS OVER 10 YEARS 29.3% SALESFORCE NETFLIX amazon 28.3% NETFLIX 27.6% AMAZON 21.7% APPLE Alphabet 21.2% ALPHABET M &.PSOO 5.3% S&P 500 MEDIAN %YEARLY REVENUE GROWTH COMPANY
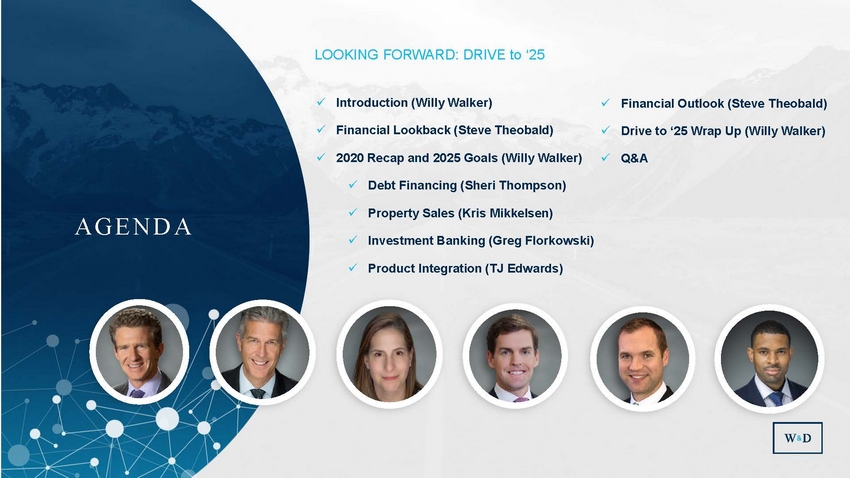
LOOKING FORWARD: DRIVE to ‘25 ✓ Introduction (Willy Walker) ✓ Financial Outlook (Steve Theobald) ✓ Financial Lookback (Steve Theobald) ✓ Drive to ‘25 Wrap Up (Willy Walker) ✓ 2020 Recap and 2025 Goals (Willy Walker) ✓ Q&A ✓ Debt Financing (Sheri Thompson) ✓ Property Sales (Kris Mikkelsen) A G E N D A ✓ Investment Banking (Greg Florkowski) ✓ Product Integration (TJ Edwards)

Steve Theobald EVP & Chief Financial Officer

2010 157 Employees 8 Offices

2020 950+ Employees 41 Offices Pictured: Employees at the 2019 All Company Retreat
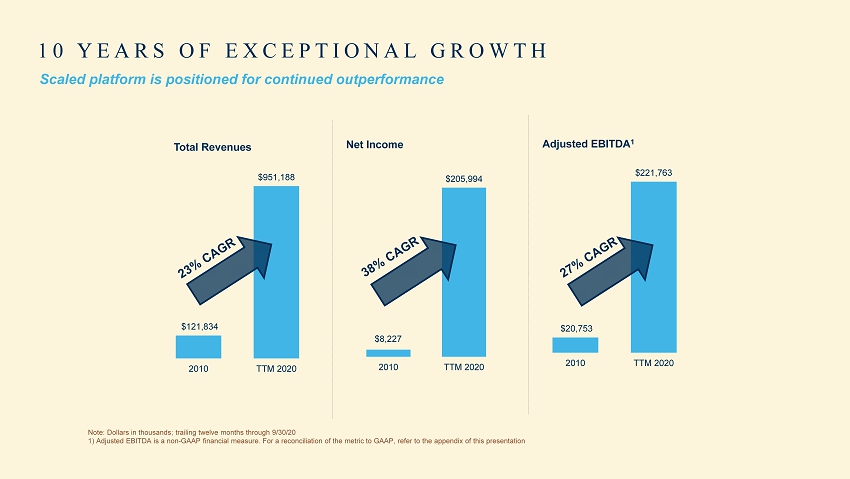
$8,227 $205,994 2010 TTM 2020 $20,753 $221,763 2010 TTM 2020 $121,834 $951,188 2010 TTM 2020 10 YEARS OF EXCEPTIONAL GROWTH Net Income Total Revenues Adjusted EBITDA 1 Note: Dollars in thousands; trailing twelve months through 9/30/20 1) Adjusted EBITDA is a non - GAAP financial measure. For a reconciliation of the metric to GAAP, refer to the appendix of this pr esentation Scaled platform is positioned for continued outperformance

VISION 2020 $1 BILLION IN ANNUAL REVENUES $8 B+ asset management platform $100 B+ servicing portfolio $30 B+ annual debt financing volume $8 B+ annual property sales volume
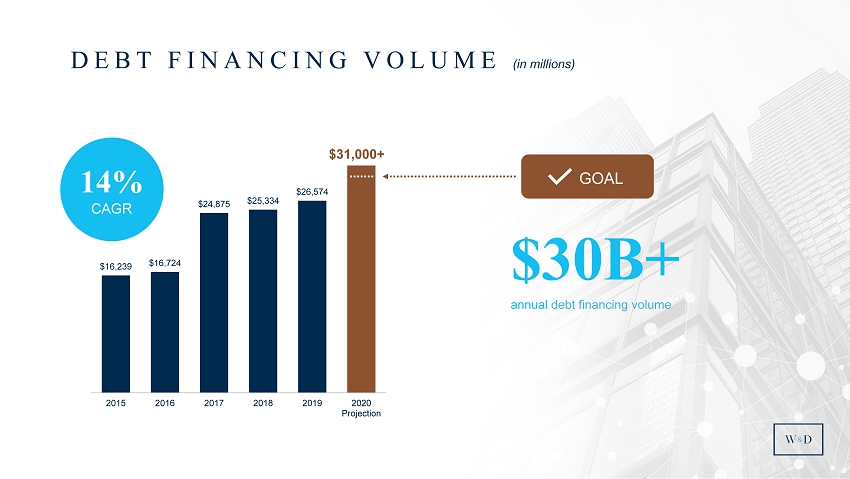
$30B+ annual debt financing volume $16,239 $16,724 $24,875 $25,334 $26,574 $31,000+ 2015 2016 2017 2018 2019 2020 Projection DEBT FINANCING VOLUME (in millions) 14% CAGR GOAL

$50,212 $63,081 $74,310 $85,689 $93,225 $105,000+ at December 31, 2015 at December 31, 2016 at December 31, 2017 at December 31, 2018 at December 31, 2019 Projected at December 31, 2020 SERVICING PORTFOLIO (in millions) 16% CAGR $100B+ servicing portfolio GOAL
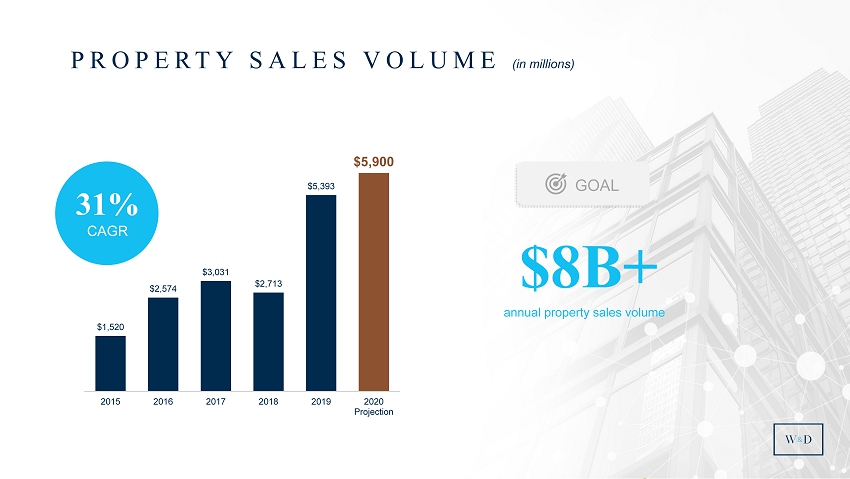
$8B+ annual property sales volume PROPERTY SALES VOLUME (in millions) 31 % CAGR GOAL $1,520 $2,574 $3,031 $2,713 $5,393 $5,900 2015 2016 2017 2018 2019 2020 Projection
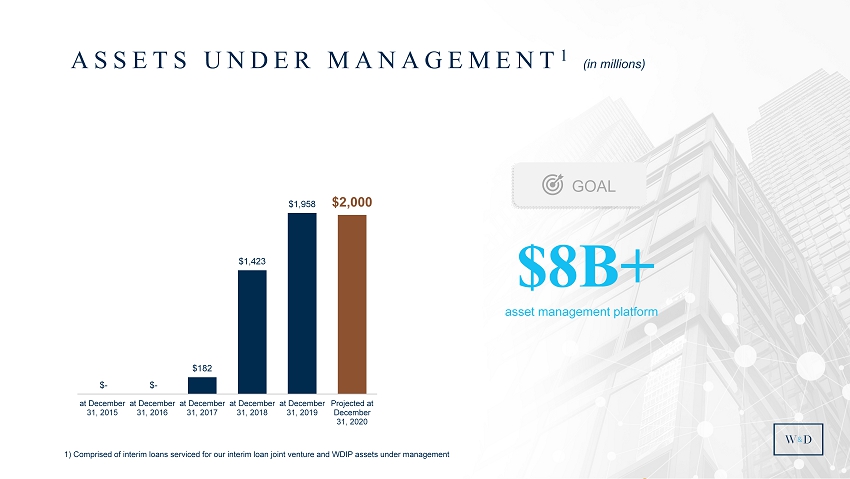
$8B+ asset management platform ASSETS UNDER MANAGEMENT 1 (in millions) GOAL $ - $ - $182 $1,423 $1,958 $2,000 at December 31, 2015 at December 31, 2016 at December 31, 2017 at December 31, 2018 at December 31, 2019 Projected at December 31, 2020 1) Comprised of interim loans serviced for our interim loan joint venture and WDIP assets under management
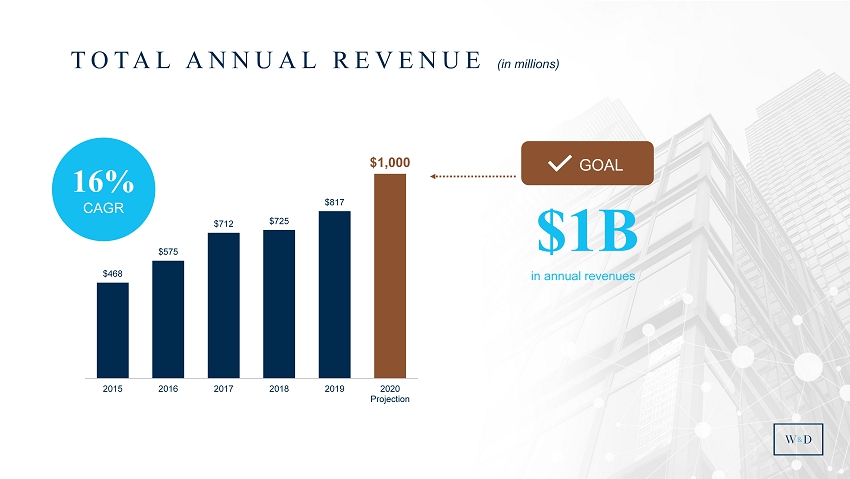
$1B in annual revenues TOTAL ANNUAL REVENUE (in millions) 16% CAGR $468 $575 $712 $725 $817 $1,000 2015 2016 2017 2018 2019 2020 Projection GOAL
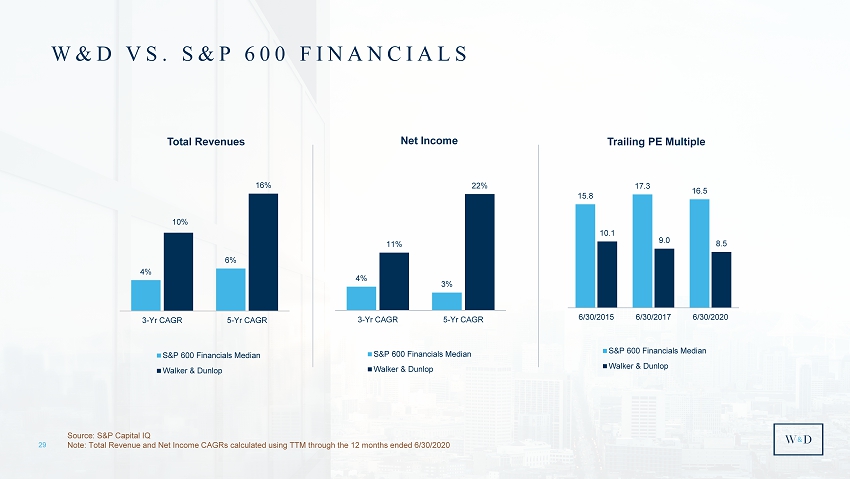
29 W&D VS. S&P 600 FINANCIALS Net Income Total Revenues Source: S&P Capital IQ Note: Total Revenue and Net Income CAGRs calculated using TTM through the 12 months ended 6/30/2020 Trailing PE Multiple 4% 6% 10% 16% 3-Yr CAGR 5-Yr CAGR S&P 600 Financials Median Walker & Dunlop 15.8 17.3 16.5 10.1 9.0 8.5 6/30/2015 6/30/2017 6/30/2020 S&P 600 Financials Median Walker & Dunlop 4% 3% 11% 22% 3-Yr CAGR 5-Yr CAGR S&P 600 Financials Median Walker & Dunlop

Willy Walker Chairman & CEO

PEOPLE BRAND TECHNOLOGY

Walker & Dunlop Corporate Overview | © 2018 Proprietary and Confidential


Willy - your webcasts have been “must see Zoom” for everyone in the industry over the past two plus months. They have been incredibly helpful and inspiring…your access to thought leaders has been no less than amazing and your approach is so in tune with what your clients, friends, the industry want to hear. Without ever promoting your great company during any of the webcasts, you have endeared yourself and Walker & Dunlop to tens of thousands of owners and investors. WHAT CLIENTS ARE SAYING “ JOHN MILLHAM PROMETHEUS REAL ESTATE GROUP, INC.

36

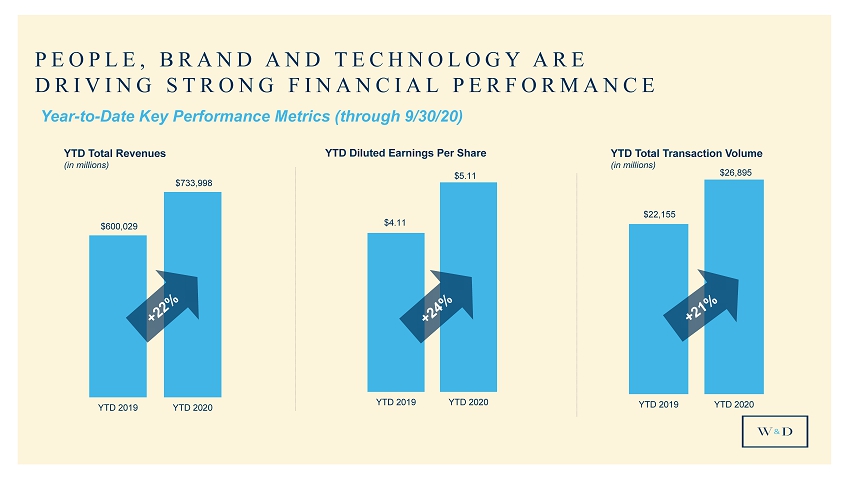
$22,155 $26,895 YTD 2019 YTD 2020 $600,029 $733,998 YTD 2019 YTD 2020 PEOPLE, BRAND AND TECHNOLOGY ARE DRIVING STRONG FINANCIAL PERFORMANCE YTD Diluted Earnings Per Share $4.11 $5.11 YTD 2019 YTD 2020 Year - to - Date Key Performance Metrics (through 9/30/20) YTD Total Revenues (in millions) YTD Total Transaction Volume (in millions)

$15 $21 2019 YTD 2020 1 ) Through 11/30/20 Combined Fannie, Freddie, and HUD Volume 1 (in billions) PEOPLE, BRAND AND TECHNOLOGY ARE DRIVING STRONG FINANCIAL PERFORMANCE
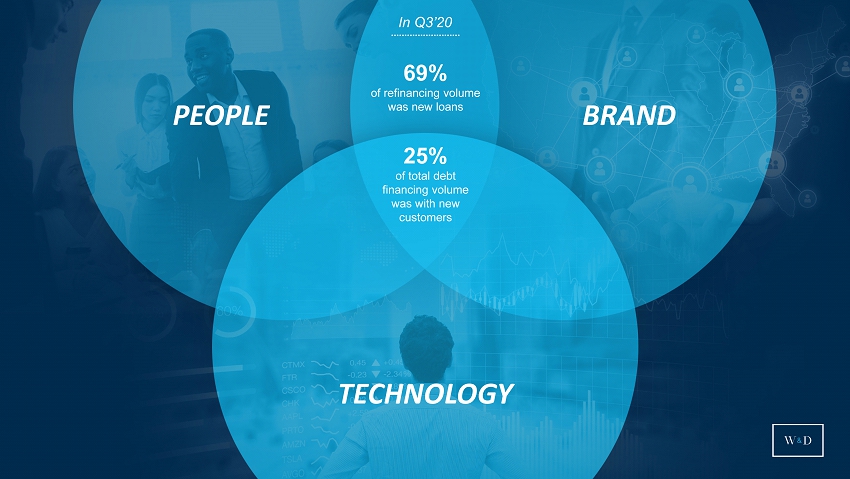
In Q3’20 69% of refinancing volume was new loans 25% of total debt financing volume was with new customers PEOPLE BRAND TECHNOLOGY

In Q4’20 1 68% of refinancing volume was new loans 31% of total debt financing volume was with new customers PEOPLE BRAND TECHNOLOGY 1) Through 12/8/20

WHERE WE ARE GOING GROW DEBT FINANCING VOLUME GROW PROPERTY SALES VOLUME ESTABLISH INVESTMENT BANKING CAPABILITIES ENVIRONMENTAL, SOCIAL AND GOVERNANCE $60B+ Origination Volume / $5B+ Small Balance Loans / $160B Servicing Portfolio $25B+ Sales Volume $10B+ Assets Under Management Double Diverse Leadership / Reduce Carbon Emission / Donate 1% of Pre - Tax Profits

ENVIRONMENTAL SOCIAL GOVERNANCE

GROW DEBT FINANCING

Sheri Thompson Executive Vice President, FHA Finance

DEBT FINANCING GROWTH $31+ Billion projected in 2020 $60+ Billion by 2025

MULTIFAMILY LENDING REMAINS A GROWING MARKET OVER THE NEXT FIVE YEARS Source (for historical and forecast origination volumes through 2022): Mortgage Bankers Association (MBA) Annual Originations Su mmation Report and MBA CREF Forecast Source (for 2023 - 2025 forecast origination volumes): W&D proprietary research and assumptions Total Multifamily Loan Originations (in billions) $173 $195 $250 $269 $285 $339 $364 $288 $305 $320 $359 $412 $439 2013 2014 2015 2016 2017 2018 2019 2020 Forecast 2021 Forecast 2022 Forecast 2023 Forecast 2024 Forecast 2025 Forecast
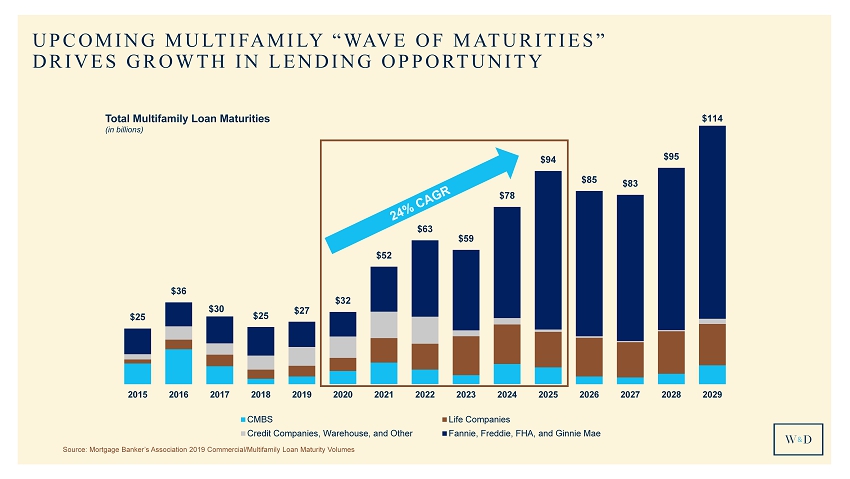
$25 $36 $30 $25 $27 $32 $52 $63 $59 $78 $94 $85 $83 $95 $114 2015 2016 2017 2018 2019 2020 2021 2022 2023 2024 2025 2026 2027 2028 2029 CMBS Life Companies Credit Companies, Warehouse, and Other Fannie, Freddie, FHA, and Ginnie Mae UPCOMING MULTIFAMILY “WAVE OF MATURITIES” DRIVES GROWTH IN LENDING OPPORTUNITY Source: Mortgage Banker’s Association 2019 Commercial/Multifamily Loan Maturity Volumes Total Multifamily Loan Maturities (in billions)

GOAL TO BECOME THE #1 LENDER IN THE UNITED STATES Top Multifamily Lenders Company Amount (millions) Number Avg. Size (millions) 1 JP Morgan Chase $ 22,739 6,638 $ 3.4 2 Wells Fargo $ 20,364 921 $ 22.1 3 CBRE $ 19,347 1,164 $ 16.6 4 Berkadia $ 17,785 898 $ 19.8 5 Walker & Dunlop $ 16,662 788 $ 21.1 6 Capital One $ 14,594 775 $ 18.8 7 KeyBank $ 12,145 544 $ 22.3 8 Greystone $ 10,812 928 $ 11.7 9 JLL $ 10,464 487 $ 21.5 10 Newmark Knight Frank $ 10,042 332 $ 30.2 Source: Mortgage Banker’s Association SMALL BALANCE LOANS INVESTMENT BANKING CAPABILITIES PROPERTY SALES
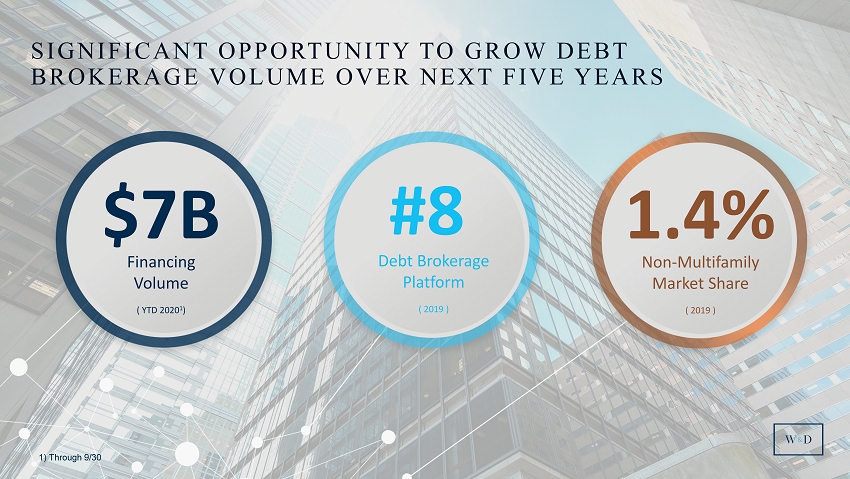
Financing Volume ( YTD 2020 1 ) Debt Brokerage Platform ( 2019 ) Non - Multifamily Market Share ( 2019 ) $7B #8 1.4% 1) Through 9/30 SIGNIFICANT OPPORTUNITY TO GROW DEBT BROKERAGE VOLUME OVER NEXT FIVE YEARS

59 TITLE HERE

PEOPLE BRAND TECHNOLOGY

GROW PROPERTY SALES

Kris Mikkelsen Executive Vice President, Investment Sales

Atlanta Austin Boston Chicago Columbus Dallas DC Ft. Lauderdale Jacksonville Los Angeles Miami Milwaukee Nashville Orlando Philadelphia Portland San Diego New York Tampa 1) Currently covers WDIS Seniors housing WDIS FOOTPRINT 1 Raleigh Charlotte
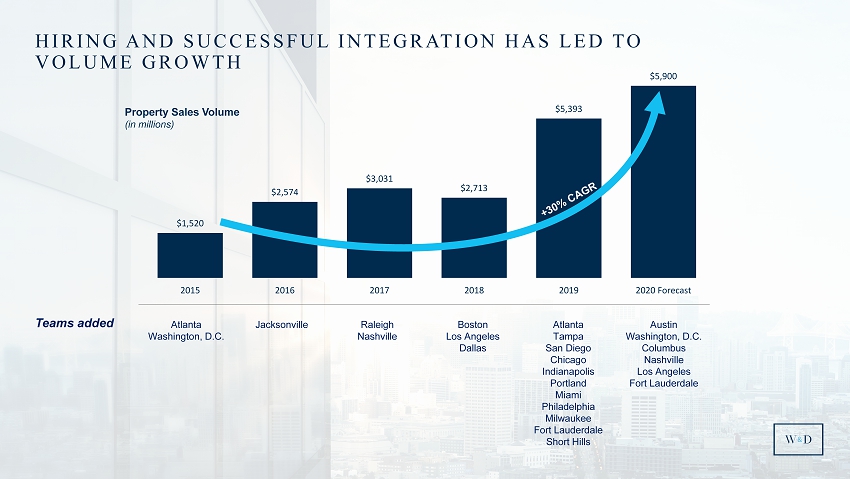
HIRING AND SUCCESSFUL INTEGRATION HAS LED TO VOLUME GROWTH Property Sales Volume (in millions) Teams added $1,520 $2,574 $3,031 $2,713 $5,393 $5,900 2015 2016 2017 2018 2019 2020 Forecast Atlanta Washington, D.C. Jacksonville Raleigh Nashville Boston Los Angeles Dallas Atlanta Tampa San Diego Chicago Indianapolis Portland Miami Philadelphia Milwaukee Fort Lauderdale Short Hills Austin Washington, D.C. Columbus Nashville Los Angeles Fort Lauderdale
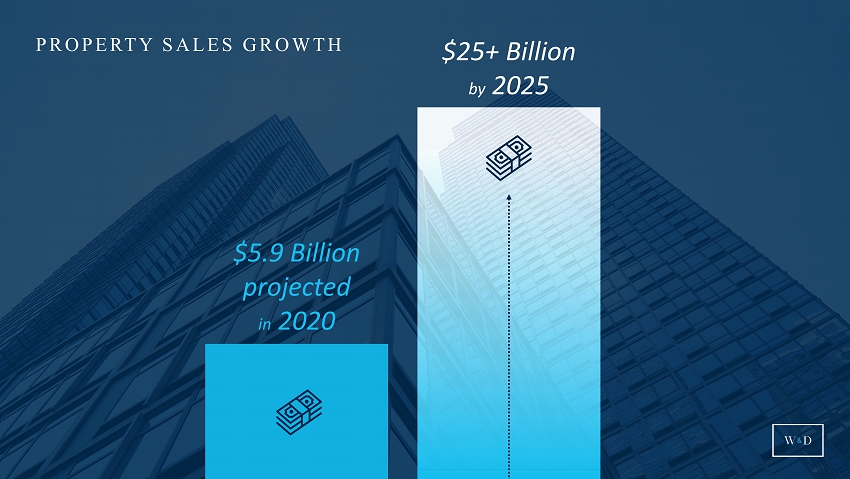
PROPERTY SALES GROWTH $ 5.9 Billion projected in 2020 $25+ Billion by 2025
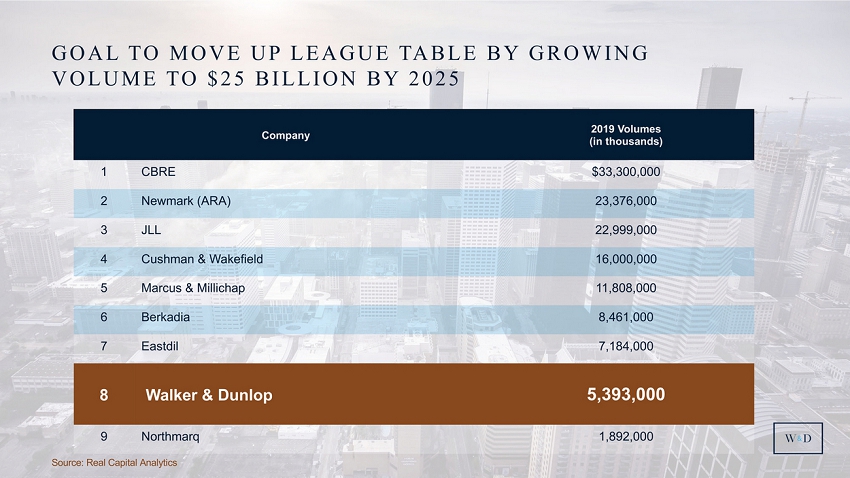
Company 2019 Volumes (in thousands) 1 CBRE $33,300,000 2 Newmark (ARA) 23,376,000 3 JLL 22,999,000 4 Cushman & Wakefield 16,000,000 5 Marcus & Millichap 11,808,000 6 Berkadia 8,461,000 7 Eastdil 7,184,000 8 Walker & Dunlop 5,393,000 9 Northmarq 1,892,000 GOAL TO MOVE UP LEAGUE TABLE BY GROWING VOLUME TO $25 BILLION BY 2025 Source: Real Capital Analytics
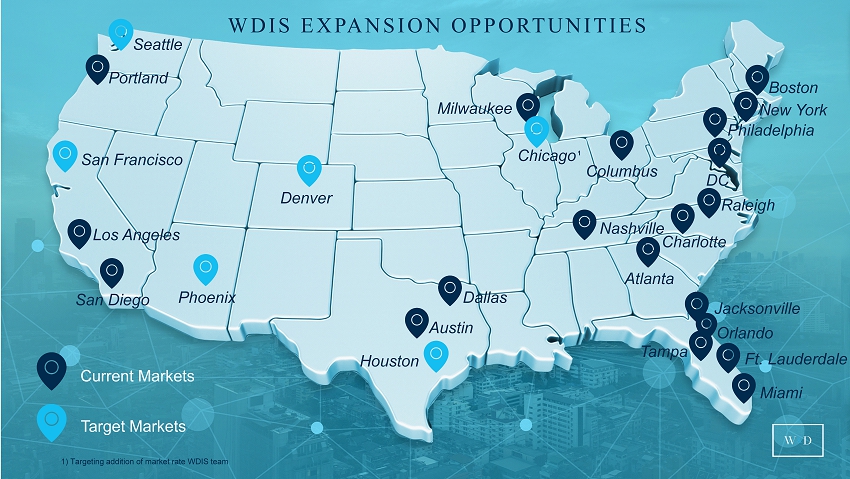
Target Markets Atlanta Austin Boston Chicago Columbus Dallas Houston DC Ft. Lauderdale Jacksonville Los Angeles Miami Milwaukee Nashville Orlando Philadelphia Portland San Diego New York Tampa Phoenix Denver Seattle San Francisco Current Markets 1) Targeting addition of market rate WDIS team 1 WDIS EXPANSION OPPORTUNITIES Raleigh Charlotte KD27

Affordable We have financed over $17B of affordable housing over past three years We will expand into affordable property sales to extend the role we play in building American communities Student Housing We have a best - in - class student housing financing platform, with 182,610 beds in servicing portfolio 1 We will build off this capability to establish property sales capabilities in this area of the market Built for Rent Homebuilders, single - family rental REITs, and conventional apartment developers are focusing on this space We plan to bring on a team with expertise in this area to assist our clients in navigating this market 1) Targeting addition of market team 1 1) At 9/30/20

of sales were tied to Debt in 2020 45% 1) Based on number of transactions through 9/30/2020 1
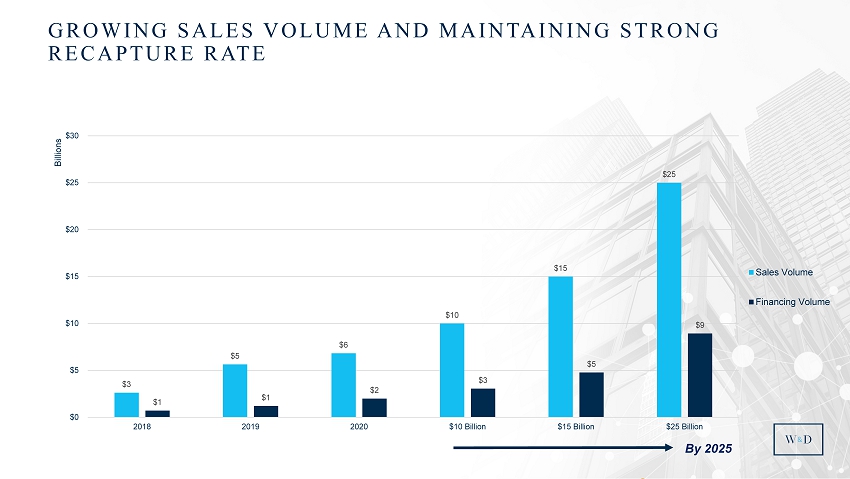
$3 $5 $6 $10 $15 $25 $1 $1 $2 $3 $5 $9 $0 $5 $10 $15 $20 $25 $30 2018 2019 2020 $10 Billion $15 Billion $25 Billion Billions Sales Volume Financing Volume GROWING SALES VOLUME AND MAINTAINING STRONG RECAPTURE RATE By 2025
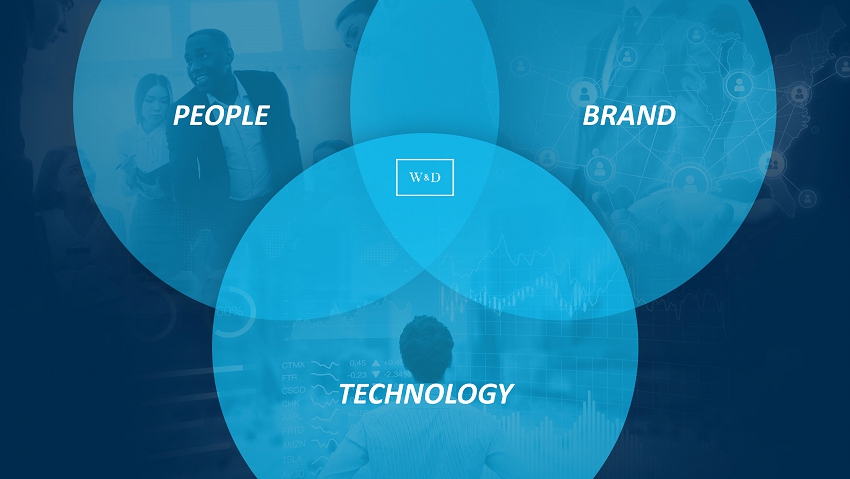
PEOPLE BRAND TECHNOLOGY

ESTABLISH INVESTMENT BANKING CAPABILITIES

CRE INVESTMENT BANKING Greg Florkowski Executive Vice President, Business Development
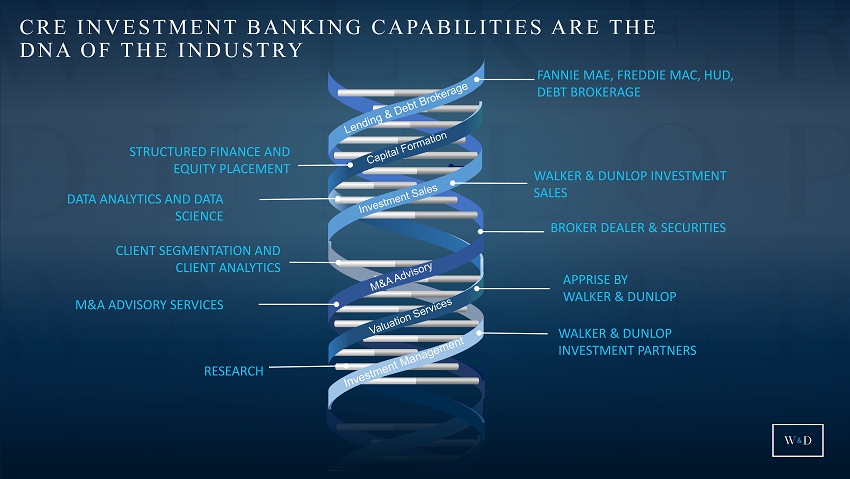
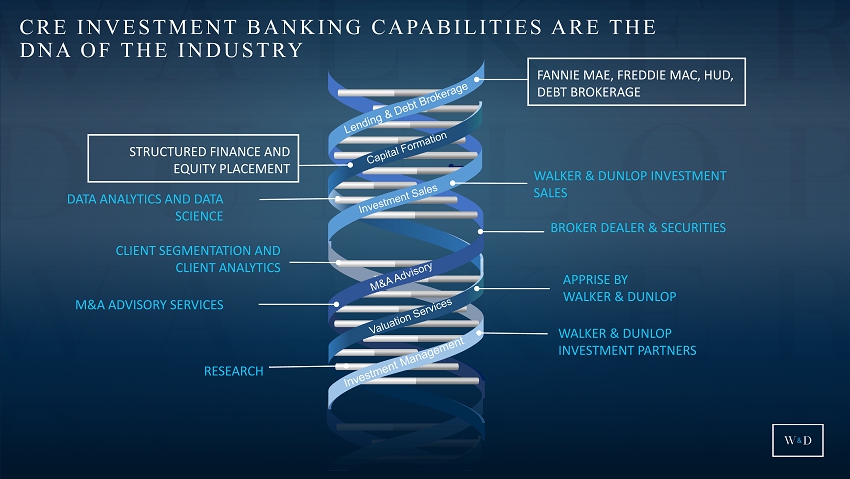
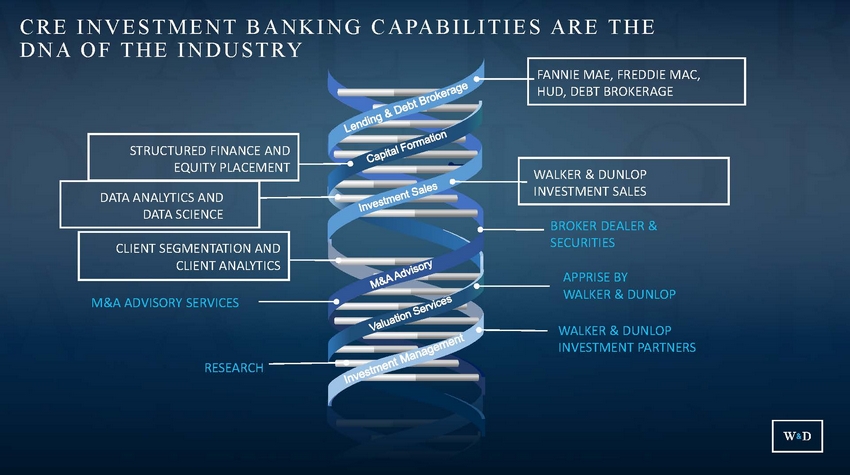
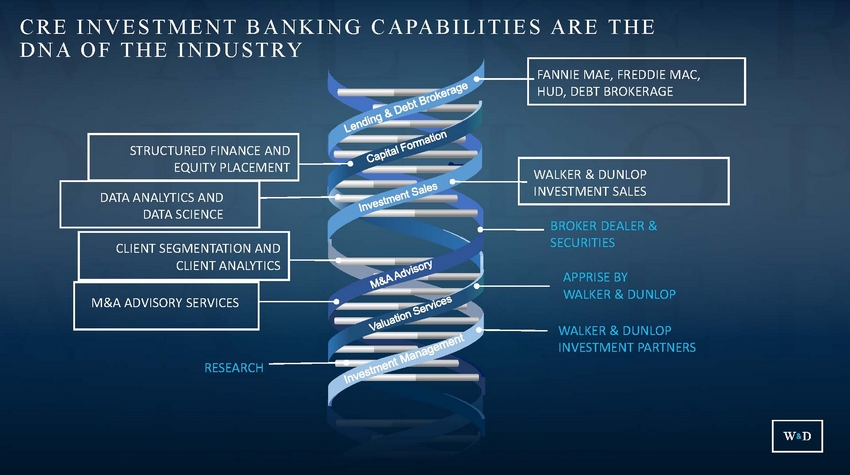
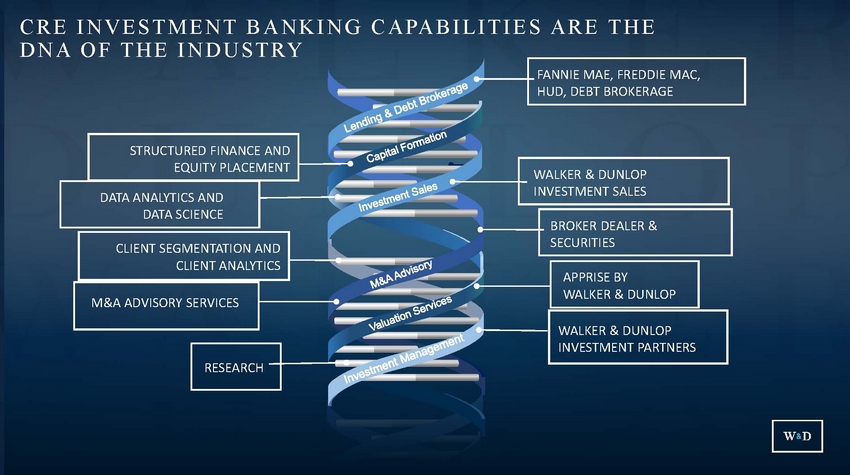
CLIENT SEGMENTATION AND CLIENT ANALYTICS APPRISE BY WALKER & DUNLOP M&A ADVISORY SERVICES . DATA ANALYTICS AND DATA SCIENCE WALKER & DUNLOP INVESTMENT PARTNERS RESEARCH BROKER DEALER & SECURITIES CRE INVESTMENT BANKING CAPABILITIES ARE THE DNA OF THE INDUSTRY FANNIE MAE, FREDDIE MAC, HUD, DEBT BROKERAGE STRUCTURED FINANCE AND EQUITY PLACEMENT WALKER & DUNLOP INVESTMENT SALES
CLIENT SEGMENTATION AND CLIENT ANALYTICS APPRISE BY WALKER & DUNLOP M&A ADVISORY SERVICES . DATA ANALYTICS AND DATA SCIENCE WALKER & DUNLOP INVESTMENT PARTNERS RESEARCH BROKER DEALER & SECURITIES CRE INVESTMENT BANKING CAPABILITIES ARE THE DNA OF THE INDUSTRY FANNIE MAE, FREDDIE MAC, HUD, DEBT BROKERAGE STRUCTURED FINANCE AND EQUITY PLACEMENT WALKER & DUNLOP INVESTMENT SALES

CLIENT SEGMENTATION AND CLIENT ANALYTICS APPRISE BY WALKER & DUNLOP M&A ADVISORY SERVICES . DATA ANALYTICS AND DATA SCIENCE WALKER & DUNLOP INVESTMENT PARTNERS RESEARCH BROKER DEALER & SECURITIES CRE INVESTMENT BANKING CAPABILITIES ARE THE DNA OF THE INDUSTRY FANNIE MAE, FREDDIE MAC, HUD, DEBT BROKERAGE STRUCTURED FINANCE AND EQUITY PLACEMENT WALKER & DUNLOP INVESTMENT SALES
C R E D N A I N V E S T M E N TB A N K I N G C A PA B I L I T I E S A R E T H E O F T H E I N D U S T R Y BROKER DEALER & SECURITIES APPRISE BY WALKER & DUNLOP M&A ADVISORY SERVICES . WALKER & DUNLOP INVESTMENT PARTNERS RESEARCH CLIENT SEGMENTATION AND CLIENT ANALYTICS WALKER & DUNLOP INVESTMENT SALES STRUCTURED FINANCE AND EQUITY PLACEMENT DATA ANALYTICS AND DATA SCIENCE FANNIE MAE, FREDDIE MAC, HUD, DEBT BROKERAGE
C R E D N A I N V E S T M E N TB A N K I N G C A PA B I L I T I E S A R E T H E O F T H E I N D U S T R Y BROKER DEALER & SECURITIES APPRISE BY WALKER & DUNLOP WALKER & DUNLOP INVESTMENT PARTNERS RESEARCH CLIENT SEGMENTATION AND CLIENT ANALYTICS M&A ADVISORY SERVICES . WALKER & DUNLOP INVESTMENT SALES STRUCTURED FINANCE AND EQUITY PLACEMENT DATA ANALYTICS AND DATA SCIENCE FANNIE MAE, FREDDIE MAC, HUD, DEBT BROKERAGE

C R E D N A I N V E S T M E N TB A N K I N G C A PA B I L I T I E S A R E T H E O F T H E I N D U S T R Y APPRISE BY WALKER & DUNLOP WALKER & DUNLOP INVESTMENT PARTNERS RESEARCH CLIENT SEGMENTATION AND CLIENT ANALYTICS M&A ADVISORY SERVICES . BROKER DEALER & SECURITIES WALKER & DUNLOP INVESTMENT SALES STRUCTURED FINANCE AND EQUITY PLACEMENT DATA ANALYTICS AND DATA SCIENCE FANNIE MAE, FREDDIE MAC, HUD, DEBT BROKERAGE

C R E D N A I N V E S T M E N TB A N K I N G C A PA B I L I T I E S A R E T H E O F T H E I N D U S T R Y WALKER & DUNLOP INVESTMENT PARTNERS RESEARCH APPRISE BY WALKER & DUNLOP CLIENT SEGMENTATION AND CLIENT ANALYTICS M&A ADVISORY SERVICES . BROKER DEALER & SECURITIES WALKER & DUNLOP INVESTMENT SALES STRUCTURED FINANCE AND EQUITY PLACEMENT DATA ANALYTICS AND DATA SCIENCE FANNIE MAE, FREDDIE MAC, HUD, DEBT BROKERAGE
C R EI N V E S T M E N TB A N K I N G C A PA B I L I T I E SA R ET H E D N AO FT H E I N D U S T R Y RESEARCH APPRISE BY WALKER & DUNLOP WALKER & DUNLOP INVESTMENT PARTNERS CLIENT SEGMENTATION AND CLIENT ANALYTICS M&A ADVISORY SERVICES . BROKER DEALER & SECURITIES WALKER & DUNLOP INVESTMENT SALES STRUCTURED FINANCE AND EQUITY PLACEMENT DATA ANALYTICS AND DATA SCIENCE FANNIE MAE, FREDDIE MAC, HUD, DEBT BROKERAGE
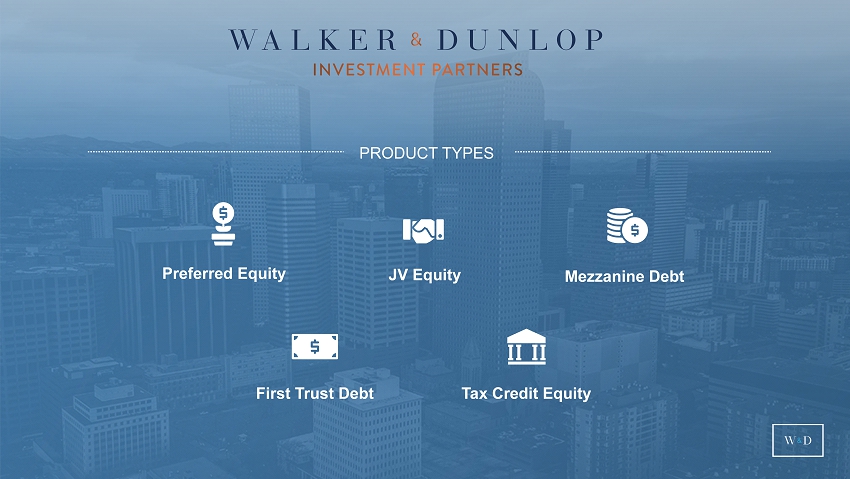
PRODUCT TYPES Preferred Equity JV Equity Mezzanine Debt Tax Credit Equity First Trust Debt
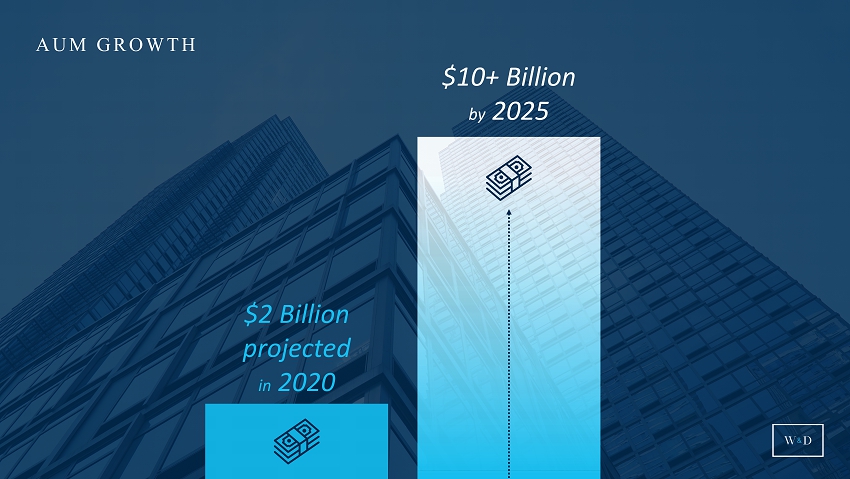
AUM GROWTH $2 Billion projected in 2020 $10+ Billion by 2025

PLATFORM INTEGRATION

INTEGRATION AND INNOVATION TJ Edwards Managing Director, Proprietary Capital
Walker & Dunlop Corporate Overview | © 2018 Proprietary and Confidential

M&A Advisory Debt Producer Investment Banker Sales Broker Appraiser Broker Dealer Loan Servicer Research Provider Connected Building Tech Provider Customer

MAXIMIZING SHARE OF A TRANSACTION APPRAISAL INVESTMENT SALES LP EQUITY EQUITY PLACEMENT AGENCY FINANCING PREFERRED EQUITY Effective collaboration allowed us to capture the lion’s share of fees from one deal

• A forward-looking database that allows our team to identify opportunities for our current customers, as well as owners and operators that we don’t service today • Enables us to ask the right questions to leverage the full bandwidth of our platform Regency Apartments • Beyond debt financing, we are also able to identify investment sales, preferred equity, and appraisal opportunities based on in depth portfolio conversations that result from using Galaxy Regency Apartments

Steve Theobald EVP & Chief Financial Officer
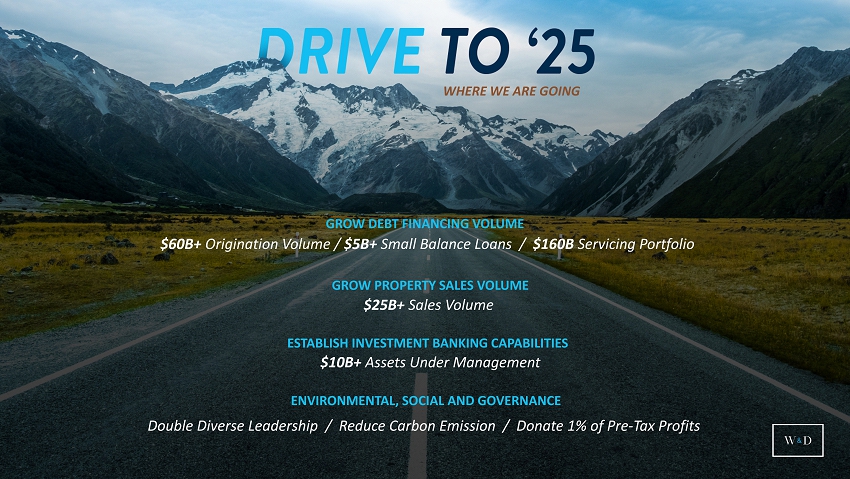
WHERE WE ARE GOING GROW DEBT FINANCING VOLUME GROW PROPERTY SALES VOLUME ESTABLISH INVESTMENT BANKING CAPABILITIES ENVIRONMENTAL, SOCIAL AND GOVERNANCE $60B+ Origination Volume / $5B+ Small Balance Loans / $160B Servicing Portfolio $25B+ Sales Volume $10B+ Assets Under Management Double Diverse Leadership / Reduce Carbon Emission / Donate 1% of Pre - Tax Profits

Total Revenues $1.7 to $2.0B BREAKDOWN OF TOTAL REVENUES $850 to $950 million from Debt Financing $150 to $200 million from Property Sales $425 to $450 million from Servicing $275 to $400 million from WDIP, Investment Banking, and Small Balance Lending
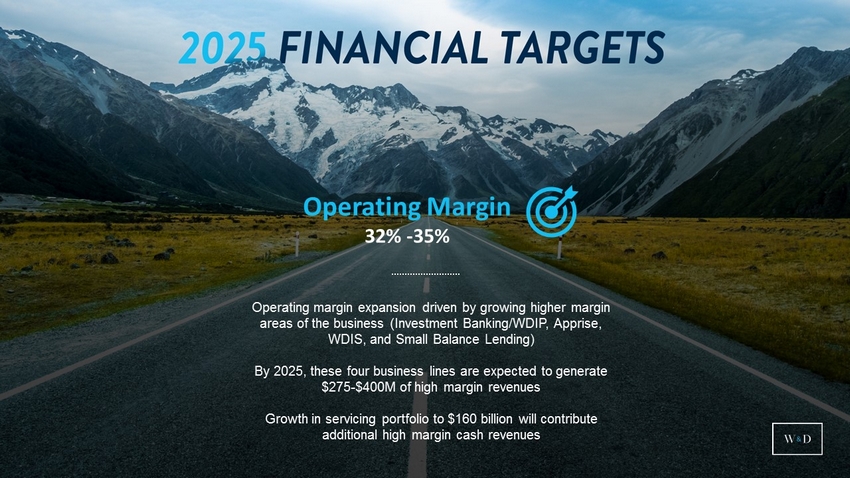
Operating Margin 32% - 35% Operating margin expansion driven by growth higher margin areas of the business (Investment Banking/WDIP, Apprise, WDIS, and Small Balance Lending) By 2025, these four business lines are expected to generate $ 275 - $400M of high margin revenues Growth in servicing portfolio to $160 billion will contribute additional high margin cash revenues

Diluted EPS $13.00 to $15.00 EPS target driven by strong revenue growth and operating efficiencies gained by our scale - driven business model
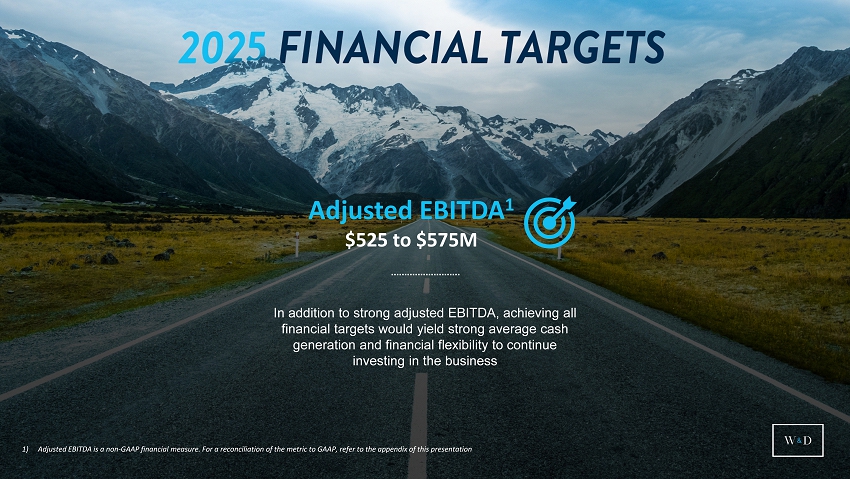
Adjusted EBITDA 1 $ 525 to $ 575M 1) Adjusted EBITDA is a non - GAAP financial measure. For a reconciliation of the metric to GAAP, refer to the appendix of this presentation In addition to strong adjusted EBITDA, achieving all financial targets would yield strong average cash generation and financial flexibility to continue investing in the business

PEOPLE BRAND TECHNOLOGY

Willy Walker Chairman & CEO

Q&A

APPENDIX

ADJUSTED EBITDA RECONCILIATION TO NET INCOME For the (in thousands) Quarter Ended September 30, 2020 Quarter Ended June 30, 2020 Quarter Ended March 31, 2020 Quarter Ended December 31, 2019 Year Ended December 31, 2010 Forecast Year Ending 2025 (Low End of Range Forecast Year Ending 2025 (High End of Range) Walker & Dunlop Net Income $53,190 $62,059 $47,829 $42,916 $8,227 TARGET: $415,140 TARGET: $488,400 Adjustments: Income tax expense 15,925 21,479 12,672 15,019 31,915 145,860 171,600 Interest expense 1,786 2,078 2,860 3,292 1,334 8,000 8,000 Amortization and depreciation 41,919 42,317 39,762 39,552 16,959 290,000 295,000 Provision (benefit) for credit losses 3,483 4,903 23,643 4,409 7,469 18,000 18,000 Net write - offs _ _ _ _ (2,148) _ _ Stock compensation expense 6,927 5,927 5,363 6,659 49 35,000 35,000 Gains attributable to mortgage servicing rights (1) (78,065) (90,369) (68,000) (47,771) (43,052) (387,000) (441,000) Unamortized issuance costs from early debt extinguishment _ _ _ _ _ _ _ Adjusted EBITDA $45,165 $48,394 $64,129 $64,076 $20,753 TARGET: $525,000 TARGET: $575,000 1) Represents the fair value of the expected net cash flows from servicing recognized at commitment, net of the expected guarant y o bligations