UNITED STATES
SECURITIES AND EXCHANGE COMMISSION
Washington, D.C. 20549
FORM N-CSR
CERTIFIED SHAREHOLDER REPORT OF REGISTERED MANAGEMENT
INVESTMENT COMPANIES
Investment Company Act file number 811-22452
| First Trust Series Fund | ||
| (Exact name of registrant as specified in charter) |
| 120 East Liberty Drive, Suite 400 | ||
| Wheaton, IL 60187 | ||
| (Address of principal executive offices) (Zip code) |
| W. Scott Jardine, Esq. | ||
| First Trust Portfolios L.P. | ||
| 120 East Liberty Drive, Suite 400 | ||
| Wheaton, IL 60187 | ||
| (Name and address of agent for service) |
Registrant's telephone number, including area code: (630) 765-8000
Date of fiscal year end: October 30
Date of reporting period: April 30, 2018
Form N-CSR is to be used by management investment companies to file reports with the Commission not later than 10 days after the transmission to stockholders of any report that is required to be transmitted to stockholders under Rule 30e-1 under the Investment Company Act of 1940 (17 CFR 270.30e-1). The Commission may use the information provided on Form N-CSR in its regulatory, disclosure review, inspection, and policymaking roles.
A registrant is required to disclose the information specified by Form N-CSR, and the Commission will make this information public. A registrant is not required to respond to the collection of information contained in Form N-CSR unless the Form displays a currently valid Office of Management and Budget (“OMB”) control number. Please direct comments concerning the accuracy of the information collection burden estimate and any suggestions for reducing the burden to Secretary, Securities and Exchange Commission, 100 F Street, NE, Washington, DC 20549. The OMB has reviewed this collection of information under the clearance requirements of 44 U.S.C. § 3507.
Item 1. Report to Stockholders.
The Report to Shareholders is attached herewith.


| 1 | |
| 2 | |
| 4 | |
| 5 | |
| 6 | |
| 12 | |
| 13 | |
| 14 | |
| 15 | |
| 20 | |
| 27 |
| • | The S&P 500® Index did something it had never previously done, finishing 2017 with 12 months of gains; |
| • | The Dow Jones Industrial Average achieved a milestone as well, closing above 24,000 for the first time ever on November 30; |
| • | The Nasdaq Composite set a record by having 11 months of gains in 2017 (June was the only down month, and by just 0.86%); and |
| • | The MSCI AC World Index (containing constituents from 47 countries) ended 2017 at an all-time high and was up 22% at year-end. |

| Fund Statistics | |
| First Trust Preferred Securities and Income Fund | Net Asset Value (NAV) |
| Class A (FPEAX) | $21.59 |
| Class C (FPECX) | $21.66 |
| Class F (FPEFX) | $21.82 |
| Class I (FPEIX) | $21.71 |
| Class R3 (FPERX) | $21.55 |
| Sector Allocation | % of Total Investments |
| Financials | 75.9% |
| Energy | 6.9 |
| Utilities | 5.4 |
| Consumer Staples | 4.9 |
| Real Estate | 2.8 |
| Industrials | 1.6 |
| Telecommunication Services | 1.1 |
| Consumer Discretionary | 1.0 |
| Materials | 0.4 |
| Total | 100.0% |
| Credit Quality(1) | % of Total Investments |
| A+ | 1.7% |
| A- | 2.4 |
| BBB+ | 12.3 |
| BBB | 11.4 |
| BBB- | 26.3 |
| BB+ | 22.9 |
| BB | 10.2 |
| BB- | 5.3 |
| B+ | 2.5 |
| B | 0.2 |
| Not Rated | 4.8 |
| Total | 100.0% |
| Top Ten Holdings | % of Total Investments |
| Liberty Mutual Group, Inc. | 2.0% |
| Bank of America Corp., Series DD | 1.9 |
| Enel S.p.A. | 1.9 |
| Farm Credit Bank Of Texas, Series 1 | 1.9 |
| Zions Bancorporation, Series J | 1.8 |
| Barclays PLC | 1.7 |
| Aquarius & Investments PLC for Swiss Reinsurance Co., Ltd. | 1.7 |
| Enbridge Energy Partners L.P. | 1.7 |
| Catlin Insurance Co., Ltd. | 1.6 |
| Wells Fargo & Co., Series K | 1.6 |
| Total | 17.8% |
| Dividend Distributions | Class A Shares | Class C Shares | Class F Shares | Class I Shares | Class R3 Shares |
| Current Monthly Distribution per Share(2) | $0.0954 | $0.0817 | $0.0972 | $0.1000 | $0.0909 |
| Current Distribution Rate on NAV(3) | 5.30% | 4.53% | 5.35% | 5.53% | 5.06% |
| (1) | The credit quality and ratings information presented above reflect the ratings assigned by one or more nationally recognized statistical rating organizations (NRSROs), including Standard & Poor’s Ratings Group, a division of the McGraw Hill Companies, Inc., Moody’s Investors Service, Inc., Fitch Ratings or a comparably rated NRSRO. For situations in which a security is rated by more than one NRSRO and the ratings are not equivalent, the highest rating is used. Sub-investment grade ratings are those rated BB+/Ba1 or lower. Investment grade ratings are those rated BBB-/Baa3 or higher. The credit ratings shown relate to the creditworthiness of the issuers of the underlying securities in the Fund, and not to the Fund or its shares. Credit ratings are subject to change. |
| (2) | Most recent distribution paid or declared through 4/30/2018. Subject to change in the future. |
| (3) | Distribution rates are calculated by annualizing the most recent distribution paid or declared through the report date and then dividing by NAV as of 4/30/2018. Subject to change in the future. |
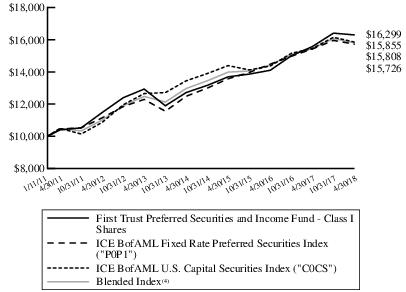
| Performance as of April 30, 2018 | ||||||||||||||||||||||||||||
| A Shares Inception 2/25/2011 | C Shares Inception 2/25/2011 | F Shares Inception 3/2/2011 | I Shares Inception 1/11/2011 | R3 Shares Inception 3/2/2011 | Blended Index* | P0P1* ICE BofAML Fixed Rate Preferred Securities Index | C0CS* ICE BofAML U.S. Capital Securities Index | |||||||||||||||||||||
| Cumulative Total Returns | w/o sales charge | w/max 4.50% sales charge | w/o sales charge | w/max 1.00% contingent deferred sales charge | w/o sales charge | w/o sales charges | w/o sales charges | w/o sales charges | w/o sales charges | w/o sales charges | ||||||||||||||||||
| 6 Months | (0.99)% | (5.45)% | (1.27)% | (2.24)% | (0.93)% | (0.77)% | (1.12)% | (1.64)% | (1.46)% | (1.84)% | ||||||||||||||||||
| 1 Year | 4.11% | (0.57)% | 3.47% | 2.47% | 4.36% | 4.59% | 3.81% | 2.31% | 1.98% | 2.62% | ||||||||||||||||||
| Average Annual Total Returns | ||||||||||||||||||||||||||||
| 5 Years | 4.43% | 3.47% | 3.68% | 3.68% | 4.55% | 4.74% | 4.14% | 4.85% | 5.06% | 4.62% | ||||||||||||||||||
| Since Inception | 6.53% | 5.84% | 5.77% | 5.77% | 6.70% | 6.92% | 6.16% | 6.48% | 6.40% | 6.52% | ||||||||||||||||||
| 30-Day SEC Yield(5) | 4.51% | 4.06% | 4.85% | 5.08% | 4.52% | N/A | N/A | N/A | ||||||||||||||||||||
| (4) | The Blended Index return is a 50/50 split between the ICE BofAML Fixed Rate Preferred Securities Index and ICE BofAML U.S. Capital Securities Index. |
| (5) | 30-day SEC yield is calculated by dividing the net investment income per share earned during the most recent 30-day period by the maximum offering price per share on the last day of the period. The reported SEC yields are subsidized. The subsidized yields reflect the waiver and/or a reimbursement of Fund expenses, which has the effect of lowering the Fund’s expense ratio and generating a higher yield. |
| Actual Expenses | Hypothetical (5% Return Before Expenses) | |||||||
| Beginning Account Value 11/1/2017 | Ending Account Value 4/30/2018 | Expenses Paid During Period 11/1/2017 - 4/30/2018 (a) | Beginning Account Value 11/1/2017 | Ending Account Value 4/30/2018 | Expenses Paid During Period 11/1/2017 - 4/30/2018 (a) | Annualized Expense Ratios (b) | ||
| Class A | $ 1,000.00 | $ 990.10 | $ 6.76 | $ 1,000.00 | $ 1,018.00 | $ 6.85 | 1.37% | |
| Class C | 1,000.00 | 987.30 | 10.00 | 1,000.00 | 1,014.73 | 10.14 | 2.03 | |
| Class F | 1,000.00 | 990.70 | 6.42 | 1,000.00 | 1,018.35 | 6.51 | 1.30 | |
| Class I | 1,000.00 | 992.30 | 5.04 | 1,000.00 | 1,019.74 | 5.11 | 1.02 | |
| Class R3 | 1,000.00 | 988.80 | 8.14 | 1,000.00 | 1,016.61 | 8.25 | 1.65 | |
| (a) | Expenses are equal to the annualized expense ratios as indicated in the table multiplied by the average account value over the period (November 1, 2017 through April 30, 2018), multiplied by 181/365 (to reflect the six-month period). |
| (b) | These expense ratios reflect expense caps. |
| Shares | Description | Stated Rate | Stated Maturity | Value | ||||
| $25 PAR PREFERRED SECURITIES – 16.6% | ||||||||
| Banks – 4.1% | ||||||||
| 30,000 | Citigroup Capital XIII, 3 Mo. LIBOR + 6.37% (a) | 8.73% | 10/30/40 | $803,700 | ||||
| 50,000 | Citigroup, Inc., Series K (b) | 6.88% | (c) | 1,376,000 | ||||
| 115,000 | GMAC Capital Trust I, Series 2, 3 Mo. LIBOR + 5.79% (a) | 7.62% | 02/15/40 | 3,057,850 | ||||
| 91,721 | People’s United Financial, Inc., Series A (b) | 5.63% | (c) | 2,352,644 | ||||
| 20,351 | Regions Financial Corp. (b) | 6.38% | (c) | 561,281 | ||||
| 36,120 | Valley National Bancorp, Series B (b) | 5.50% | (c) | 923,588 | ||||
| 54,369 | Wintrust Financial Corp., Series D (b) | 6.50% | (c) | 1,462,526 | ||||
| 10,537,589 | ||||||||
| Capital Markets – 3.9% | ||||||||
| 25,339 | Apollo Global Management, LLC, Series B | 6.38% | (c) | 613,204 | ||||
| 78,825 | Morgan Stanley, Series E (b) | 7.13% | (c) | 2,218,135 | ||||
| 40,579 | Morgan Stanley, Series F (b) | 6.88% | (c) | 1,115,923 | ||||
| 124,388 | Morgan Stanley, Series I (b) | 6.38% | (c) | 3,326,135 | ||||
| 105,359 | Morgan Stanley, Series K (b) | 5.85% | (c) | 2,702,458 | ||||
| 9,975,855 | ||||||||
| Diversified Telecommunication Services – 0.7% | ||||||||
| 49,010 | Qwest Corp. | 7.00% | 04/01/52 | 1,115,957 | ||||
| 25,260 | Qwest Corp. | 7.00% | 07/01/52 | 590,579 | ||||
| 1,706,536 | ||||||||
| Equity Real Estate Investment Trusts – 2.7% | ||||||||
| 23,626 | American Homes 4 Rent, Series E | 6.35% | (c) | 586,397 | ||||
| 1,061 | Colony NorthStar, Inc., Series D | 8.50% | (c) | 26,621 | ||||
| 49,976 | Colony NorthStar, Inc., Series E | 8.75% | (c) | 1,268,391 | ||||
| 37,305 | Colony NorthStar, Inc., Series H | 7.13% | (c) | 858,761 | ||||
| 25,000 | Farmland Partners, Inc., Series B, steps up 10/01/24 to 10.00% (d) | 6.00% | (c) | 621,875 | ||||
| 23,490 | Global Net Lease, Inc., Series A | 7.25% | (c) | 577,854 | ||||
| 15,000 | Urstadt Biddle Properties, Inc., Series H | 6.25% | (c) | 366,300 | ||||
| 102,470 | VEREIT, Inc., Series F | 6.70% | (c) | 2,579,170 | ||||
| 6,885,369 | ||||||||
| Food Products – 1.1% | ||||||||
| 93,791 | CHS, Inc., Series 2 (b) | 7.10% | (c) | 2,569,873 | ||||
| 726 | CHS, Inc., Series 3 (b) | 6.75% | (c) | 19,101 | ||||
| 5,676 | CHS, Inc., Series 4 | 7.50% | (c) | 156,431 | ||||
| 2,745,405 | ||||||||
| Insurance – 1.6% | ||||||||
| 4,822 | AmTrust Financial Services, Inc. | 7.25% | 06/15/55 | 113,799 | ||||
| 5,383 | AmTrust Financial Services, Inc. | 7.50% | 09/15/55 | 133,391 | ||||
| 50,000 | Aspen Insurance Holdings Ltd. (b) | 5.95% | (c) | 1,277,500 | ||||
| 50,000 | Delphi Financial Group, Inc., 3 Mo. LIBOR + 3.19% (a) | 5.03% | 05/15/37 | 1,150,000 | ||||
| 14,443 | National General Holdings Corp. | 7.63% | 09/15/55 | 361,292 | ||||
| 21,000 | Phoenix Cos., Inc. | 7.45% | 01/15/32 | 391,335 | ||||
| 28,961 | Reinsurance Group of America, Inc. (b) | 5.75% | 06/15/56 | 744,587 | ||||
| 4,171,904 | ||||||||
| Mortgage Real Estate Investment Trusts – 1.2% | ||||||||
| 25,000 | AGNC Investment Corp., Series C (b) | 7.00% | (c) | 637,500 | ||||
| 38,824 | Annaly Capital Management, Inc., Series F (b) | 6.95% | (c) | 977,977 | ||||
| 13,200 | Invesco Mortgage Capital, Inc., Series B (b) | 7.75% | (c) | 332,508 | ||||
| 23,000 | Two Harbors Investment Corp., Series B (b) | 7.63% | (c) | 575,000 | ||||
| Shares | Description | Stated Rate | Stated Maturity | Value | ||||
| $25 PAR PREFERRED SECURITIES (Continued) | ||||||||
| Mortgage Real Estate Investment Trusts (Continued) | ||||||||
| 25,000 | Two Harbors Investment Corp., Series C (b) | 7.25% | (c) | $599,250 | ||||
| 3,122,235 | ||||||||
| Multi-Utilities – 0.7% | ||||||||
| 40,000 | Integrys Holding, Inc. (b) | 6.00% | 08/01/73 | 1,035,000 | ||||
| 30,000 | Just Energy Group, Inc., Series A (b) | 8.50% | (c) | 693,600 | ||||
| 1,728,600 | ||||||||
| Oil, Gas & Consumable Fuels – 0.3% | ||||||||
| 17,738 | Enbridge, Inc., Series B (b) | 6.38% | 04/15/78 | 450,279 | ||||
| 10,000 | Energy Transfer Partners L.P., Series C (b) | 7.38% | (c) | 248,200 | ||||
| 698,479 | ||||||||
| Thrifts & Mortgage Finance – 0.3% | ||||||||
| 26,302 | New York Community Bancorp, Inc., Series A (b) | 6.38% | (c) | 711,995 | ||||
Total $25 Par Preferred Securities | 42,283,967 | |||||||
| (Cost $42,767,720) | ||||||||
| $100 PAR PREFERRED SECURITIES – 2.8% | ||||||||
| Banks – 2.7% | ||||||||
| 32,500 | CoBank ACB, Series F (b) (e) | 6.25% | (c) | 3,445,000 | ||||
| 27,000 | CoBank ACB, Series G (e) | 6.13% | (c) | 2,756,754 | ||||
| 5,500 | Farm Credit Bank Of Texas (b) (f) | 6.75% | (c) | 592,911 | ||||
| 6,794,665 | ||||||||
| Consumer Finance – 0.1% | ||||||||
| 5,130 | SLM Corp., Series B, 3 Mo. LIBOR + 1.70% (a) | 3.82% | (c) | 364,230 | ||||
Total $100 Par Preferred Securities | 7,158,895 | |||||||
| (Cost $6,634,735) | ||||||||
| $1,000 PAR PREFERRED SECURITIES – 4.3% | ||||||||
| Banks – 2.6% | ||||||||
| 443 | CoBank ACB, 3 Mo. LIBOR + 1.18% (a) (f) | 3.52% | (c) | 295,225 | ||||
| 4,000 | Farm Credit Bank Of Texas, Series 1 (e) | 10.00% | (c) | 4,720,000 | ||||
| 1,261 | Sovereign Real Estate Investment Trust (f) | 12.00% | (c) | 1,484,827 | ||||
| 6,500,052 | ||||||||
| Diversified Financial Services – 0.4% | ||||||||
| 500 | Compeer Financial ACA (b) (f) | 6.75% | (c) | 527,500 | ||||
| 500 | Kinder Morgan GP, Inc., 3 Mo. LIBOR + 3.90% (a) (f) | 5.77% | 08/18/57 | 469,305 | ||||
| 996,805 | ||||||||
| Insurance – 1.3% | ||||||||
| 3,400 | XLIT Ltd., Series D, 3 Mo. LIBOR + 3.12% (a) | 5.47% | (c) | 3,408,500 | ||||
Total $1,000 Par Preferred Securities | 10,905,357 | |||||||
| (Cost $10,858,507) | ||||||||
| Par Amount | Description | Stated Rate | Stated Maturity | Value | ||||
| CAPITAL PREFERRED SECURITIES – 73.8% | ||||||||
| Automobiles – 0.9% | ||||||||
| $2,400,000 | General Motors Financial Co., Inc., Series A (b) | 5.75% | (c) | 2,372,400 | ||||
| Banks – 35.0% | ||||||||
| 1,500,000 | Australia & New Zealand Banking Group Ltd. (b) (g) (h) | 6.75% | (c) | 1,603,125 | ||||
| Par Amount | Description | Stated Rate | Stated Maturity | Value | ||||
| CAPITAL PREFERRED SECURITIES (Continued) | ||||||||
| Banks (Continued) | ||||||||
| $1,400,000 | Banco Bilbao Vizcaya Argentaria S.A. (b) (h) | 6.13% | (c) | $1,356,670 | ||||
| 500,000 | Banco Mercantil del Norte S.A. (b) (g) (h) | 6.88% | (c) | 503,750 | ||||
| 1,000,000 | Banco Mercantil del Norte S.A. (b) (g) (h) | 7.63% | (c) | 1,036,250 | ||||
| 2,000,000 | Banco Santander S.A. (b) (h) | 6.38% | (c) | 2,031,660 | ||||
| 4,500,000 | Bank of America Corp., Series DD (b) | 6.30% | (c) | 4,775,400 | ||||
| 64,000 | Bank of America Corp., Series K, 3 Mo. LIBOR + 3.63% (a) | 5.99% | (c) | 64,400 | ||||
| 1,500,000 | Bank of America Corp., Series Z (b) | 6.50% | (c) | 1,591,875 | ||||
| 4,000,000 | Barclays PLC (b) (h) | 7.88% | (c) | 4,276,320 | ||||
| 939,000 | BNP Paribas S.A. (b) (g) (h) | 6.75% | (c) | 987,124 | ||||
| 1,987,000 | BNP Paribas S.A. (b) (g) (h) | 7.63% | (c) | 2,145,463 | ||||
| 1,000,000 | BPCE S.A. (b) (g) | 12.50% | (c) | 1,118,750 | ||||
| 1,850,000 | Citigroup, Inc., Series O (b) | 5.88% | (c) | 1,903,187 | ||||
| 680,000 | Citigroup, Inc., Series P (b) | 5.95% | (c) | 689,350 | ||||
| 1,250,000 | Citigroup, Inc., Series R (b) | 6.13% | (c) | 1,307,813 | ||||
| 262,000 | Citigroup, Inc., Series T (b) | 6.25% | (c) | 272,480 | ||||
| 1,600,000 | Citizens Financial Group, Inc. (b) | 5.50% | (c) | 1,644,000 | ||||
| 2,500,000 | CoBank ACB, Series I (b) (e) | 6.25% | (c) | 2,667,022 | ||||
| 1,000,000 | Cooperatieve Rabobank UA (b) (g) | 11.00% | (c) | 1,083,750 | ||||
| 753,000 | Cooperatieve Rabobank UA (b) | 11.00% | (c) | 816,064 | ||||
| 3,400,000 | Credit Agricole S.A. (b) (g) (h) | 7.88% | (c) | 3,697,500 | ||||
| 3,485,000 | Credit Agricole S.A. (b) (g) (h) | 8.13% | (c) | 3,968,457 | ||||
| 1,000,000 | Danske Bank A.S. (b) (h) | 6.13% | (c) | 1,015,000 | ||||
| 2,444,000 | HSBC Holdings PLC (b) (h) | 6.38% | (c) | 2,523,430 | ||||
| 800,000 | HSBC Holdings PLC (b) (h) | 6.88% | (c) | 850,000 | ||||
| 1,000,000 | ING Groep N.V. (b) (h) | 6.50% | (c) | 1,031,800 | ||||
| 3,000,000 | ING Groep N.V. (b) (h) | 6.88% | (c) | 3,172,875 | ||||
| 2,954,000 | Intesa Sanpaolo S.p.A. (b) (g) (h) | 7.70% | (c) | 3,138,625 | ||||
| 2,000,000 | JPMorgan Chase & Co., Series I, 3 Mo. LIBOR + 3.47% (a) | 5.83% | (c) | 2,017,500 | ||||
| 500,000 | JPMorgan Chase & Co., Series S (b) | 6.75% | (c) | 542,500 | ||||
| 1,000,000 | Lloyds Bank PLC (b) (g) | 12.00% | (c) | 1,273,061 | ||||
| 1,700,000 | Lloyds Banking Group PLC (b) (h) | 7.50% | (c) | 1,838,550 | ||||
| 640,000 | Nordea Bank AB (b) (h) | 6.13% | (c) | 659,200 | ||||
| 1,046,000 | Royal Bank of Scotland Group PLC (b) (h) | 7.50% | (c) | 1,101,177 | ||||
| 2,700,000 | Royal Bank of Scotland Group PLC (b) (h) | 8.00% | (c) | 2,959,875 | ||||
| 3,250,000 | Royal Bank of Scotland Group PLC (b) (h) | 8.63% | (c) | 3,566,875 | ||||
| 2,500,000 | Societe Generale S.A. (b) (g) (h) | 7.38% | (c) | 2,656,250 | ||||
| 2,250,000 | Societe Generale S.A. (b) (g) (h) | 7.88% | (c) | 2,444,062 | ||||
| 1,500,000 | Standard Chartered PLC (b) (g) (h) | 7.50% | (c) | 1,588,125 | ||||
| 2,250,000 | Standard Chartered PLC (b) (g) (h) | 7.75% | (c) | 2,401,875 | ||||
| 2,600,000 | UniCredit S.p.A. (b) (h) | 8.00% | (c) | 2,719,096 | ||||
| 2,000,000 | UniCredit S.p.A. (b) (g) | 5.86% | 06/19/32 | 2,006,366 | ||||
| 4,000,000 | Wells Fargo & Co., Series K, 3 Mo. LIBOR + 3.77% (a) | 5.89% | (c) | 4,050,000 | ||||
| 1,500,000 | Wells Fargo & Co., Series U (b) | 5.88% | (c) | 1,554,375 | ||||
| 4,000,000 | Zions Bancorporation, Series J (b) | 7.20% | (c) | 4,360,000 | ||||
| 89,011,027 | ||||||||
| Capital Markets – 3.4% | ||||||||
| 2,750,000 | Credit Suisse Group AG (b) (g) (h) | 7.50% | (c) | 2,987,215 | ||||
| 2,000,000 | E*TRADE Financial Corp., Series A (b) | 5.88% | (c) | 2,050,000 | ||||
| 1,000,000 | Goldman Sachs Group, Inc., Series M (b) | 5.38% | (c) | 1,023,750 | ||||
| 1,000,000 | UBS Group AG (b) (h) | 6.88% | (c) | 1,054,380 | ||||
| 400,000 | UBS Group AG (b) (h) | 7.00% | (c) | 428,647 | ||||
| 1,000,000 | UBS Group AG (b) (h) | 7.13% | (c) | 1,042,858 | ||||
| 8,586,850 | ||||||||
| Par Amount | Description | Stated Rate | Stated Maturity | Value | ||||
| CAPITAL PREFERRED SECURITIES (Continued) | ||||||||
| Diversified Financial Services – 0.4% | ||||||||
| $1,000,000 | Voya Financial, Inc. (b) | 5.65% | 05/15/53 | $1,021,500 | ||||
| Diversified Telecommunication Services – 0.4% | ||||||||
| 1,000,000 | Koninklijke KPN N.V. (b) | 7.00% | 03/28/73 | 1,082,500 | ||||
| Electric Utilities – 4.0% | ||||||||
| 3,500,000 | Emera, Inc., Series 16-A (b) | 6.75% | 06/15/76 | 3,804,500 | ||||
| 4,000,000 | Enel S.p.A. (b) (g) | 8.75% | 09/24/73 | 4,745,000 | ||||
| 1,000,000 | Southern (The) Co., Series B (b) | 5.50% | 03/15/57 | 1,033,926 | ||||
| 500,000 | Southern California Edison Co., Series E (b) | 6.25% | (c) | 530,000 | ||||
| 10,113,426 | ||||||||
| Energy Equipment & Services – 1.0% | ||||||||
| 2,500,000 | Transcanada Trust, Series 16-A (b) | 5.88% | 08/15/76 | 2,581,250 | ||||
| Food Products – 3.8% | ||||||||
| 1,300,000 | Dairy Farmers of America, Inc. (f) | 7.13% | (c) | 1,426,750 | ||||
| 3,000,000 | Land O’Lakes Capital Trust I (f) | 7.45% | 03/15/28 | 3,420,000 | ||||
| 1,200,000 | Land O’Lakes, Inc. (g) | 7.25% | (c) | 1,338,000 | ||||
| 3,000,000 | Land O’Lakes, Inc. (g) | 8.00% | (c) | 3,375,000 | ||||
| 9,559,750 | ||||||||
| Independent Power and Renewable Electricity Producers – 0.7% | ||||||||
| 1,575,000 | AES Gener S.A. (b) | 8.38% | 12/18/73 | 1,645,875 | ||||
| Insurance – 16.8% | ||||||||
| 1,500,000 | Aegon N.V. (b) | 5.50% | 04/11/48 | 1,494,330 | ||||
| 1,000,000 | AG Insurance S.A. (b) | 6.75% | (c) | 1,024,502 | ||||
| 625,000 | American International Group, Inc. Series A-9 (b) | 5.75% | 04/01/48 | 629,688 | ||||
| 4,200,000 | Aquarius & Investments PLC for Swiss Reinsurance Co., Ltd. (b) | 8.25% | (c) | 4,252,160 | ||||
| 200,000 | Asahi Mutual Life Insurance Co. (b) | 7.25% | (c) | 211,917 | ||||
| 1,700,000 | Assurant, Inc. (b) | 7.00% | 03/27/48 | 1,774,461 | ||||
| 1,515,000 | Assured Guaranty Municipal Holdings, Inc. (b) (g) | 6.40% | 12/15/66 | 1,522,575 | ||||
| 4,100,000 | Catlin Insurance Co., Ltd., 3 Mo. LIBOR + 2.98% (a) (g) | 5.33% | (c) | 4,084,625 | ||||
| 1,000,000 | CNP Assurances (b) | 6.88% | (c) | 1,031,750 | ||||
| 2,500,000 | CNP Assurances (b) | 7.50% | (c) | 2,539,462 | ||||
| 1,000,000 | Fortegra Financial Corp. (b) (f) | 8.50% | 10/15/57 | 1,012,500 | ||||
| 3,300,000 | Friends Life Holdings PLC (b) | 7.88% | (c) | 3,376,725 | ||||
| 1,000,000 | Fukoku Mutual Life Insurance Co. (b) | 6.50% | (c) | 1,110,000 | ||||
| 2,500,000 | La Mondiale SAM (b) | 7.63% | (c) | 2,582,187 | ||||
| 2,663,000 | Liberty Mutual Group, Inc. (g) | 7.80% | 03/15/37 | 3,228,887 | ||||
| 3,285,000 | Liberty Mutual Group, Inc. (b) | 10.75% | 06/15/58 | 5,067,112 | ||||
| 480,000 | Meiji Yasuda Life Insurance, Co. (b) (g) | 5.10% | 04/26/48 | 490,827 | ||||
| 194,000 | MetLife, Inc. (g) | 9.25% | 04/08/38 | 264,810 | ||||
| 977,000 | Mitsui Sumitomo Insurance Co., Ltd. (b) (g) | 7.00% | 03/15/72 | 1,079,341 | ||||
| 1,000,000 | Prudential Financial, Inc. (b) | 5.63% | 06/15/43 | 1,045,000 | ||||
| 2,000,000 | QBE Insurance Group, Ltd. (b) (g) | 7.50% | 11/24/43 | 2,236,760 | ||||
| 2,500,000 | QBE Insurance Group, Ltd. (b) | 6.75% | 12/02/44 | 2,672,775 | ||||
| 42,732,394 | ||||||||
| Metals & Mining – 0.4% | ||||||||
| 500,000 | BHP Billiton Finance USA Ltd. (b) (g) | 6.25% | 10/19/75 | 526,785 | ||||
| 500,000 | BHP Billiton Finance USA Ltd. (b) (g) | 6.75% | 10/19/75 | 557,375 | ||||
| 1,084,160 | ||||||||
| Oil, Gas & Consumable Fuels – 5.4% | ||||||||
| 1,180,000 | Andeavor Logistics L.P., Series A (b) | 6.88% | (c) | 1,201,682 | ||||
| Par Amount | Description | Stated Rate | Stated Maturity | Value | ||||
| CAPITAL PREFERRED SECURITIES (Continued) | ||||||||
| Oil, Gas & Consumable Fuels (Continued) | ||||||||
| $900,000 | DCP Midstream L.P., Series A (b) | 7.38% | (c) | $888,188 | ||||
| 4,231,400 | Enbridge Energy Partners L.P., 3 Mo. LIBOR + 3.80% (a) | 6.11% | 10/01/37 | 4,210,243 | ||||
| 1,400,000 | Enbridge, Inc. (b) | 5.50% | 07/15/77 | 1,305,500 | ||||
| 1,000,000 | Enbridge, Inc. (b) | 6.25% | 03/01/78 | 978,978 | ||||
| 500,000 | Enbridge, Inc., Series 16-A (b) | 6.00% | 01/15/77 | 488,125 | ||||
| 2,661,000 | Energy Transfer Partners L.P., 3 Mo. LIBOR + 3.02% (a) | 4.79% | 11/01/66 | 2,328,375 | ||||
| 900,000 | Energy Transfer Partners L.P., Series B (b) | 6.63% | (c) | 852,818 | ||||
| 1,500,000 | Enterprise Products Operating LLC, Series A, 3 Mo. LIBOR + 3.71% (a) | 5.48% | 08/01/66 | 1,507,815 | ||||
| 13,761,724 | ||||||||
| Transportation Infrastructure – 1.6% | ||||||||
| 3,720,000 | AerCap Global Aviation Trust (b) (g) | 6.50% | 06/15/45 | 3,961,800 | ||||
Total Capital Preferred Securities | 187,514,656 | |||||||
| (Cost $186,594,559) | ||||||||
| Principal Value | Description | Stated Coupon | Stated Maturity | Value | ||||
| CORPORATE BONDS AND NOTES – 0.4% | ||||||||
| Insurance – 0.4% | ||||||||
| 1,000,000 | AmTrust Financial Services, Inc. | 6.13% | 08/15/23 | 984,802 | ||||
| (Cost $995,554) | ||||||||
Total Investments – 97.9%(i) | 248,847,677 | |
| (Cost $247,851,075) | ||
Net Other Assets and Liabilities – 2.1% | 5,248,556 | |
Net Assets – 100.0% | $254,096,233 |
| (a) | Floating or variable rate security. |
| (b) | Fixed-to-floating or fixed-to-variable rate security. The interest rate shown reflects the fixed rate in effect at April 30, 2018. At a predetermined date, the fixed rate will change to a floating rate or a variable rate. |
| (c) | Perpetual maturity. |
| (d) | Step-up security. A security where the coupon increases or steps up at a predetermined date. |
| (e) | Pursuant to procedures adopted by the First Trust Series Fund’s (the “Trust”) Board of Trustees, this security has been determined to be illiquid by Stonebridge Advisors LLC ("Stonebridge"), the Fund’s sub-advisor. |
| (f) | This security, sold within the terms of a private placement memorandum, is exempt from registration upon resale under Rule 144A under the Securities Act of 1933, as amended (the “1933 Act”), and may be resold in transactions exempt from registration, normally to qualified institutional buyers (see Note 2C - Restricted Securities in the Notes to Financial Statements). |
| (g) | This security, sold within the terms of a private placement memorandum, is exempt from registration upon resale under Rule 144A under the 1933 Act, and may be resold in transactions exempt from registration, normally to qualified institutional buyers. Pursuant to procedures adopted by the Trust’s Board of Trustees, this security has been determined to be liquid by Stonebridge. Although market instability can result in periods of increased overall market illiquidity, liquidity for each security is determined based on security specific factors and assumptions, which require subjective judgment. At April 30, 2018, securities noted as such amounted to $62,051,533 or 24.4% of net assets. |
| (h) | This security is a contingent convertible capital security which may be subject to conversion into common stock of the issuer under certain circumstances. At April 30, 2018, securities noted as such amounted to $60,786,234 or 23.9% of net assets. Of these securities, 2.5% originated in emerging markets, and 97.5% originated in foreign markets. |
| (i) | Aggregate cost for financial reporting purposes approximates the aggregate cost for federal income tax purposes. As of April 30, 2018, the aggregate gross unrealized appreciation for all investments in which there was an excess of value over tax cost was $5,786,343 and the aggregate gross unrealized depreciation for all investments in which there was an excess of tax cost over value was $4,789,741. The net unrealized appreciation was $996,602. |
| Total Value at 4/30/2018 | Level 1 Quoted Prices | Level 2 Significant Observable Inputs | Level 3 Significant Unobservable Inputs | |
| $25 Par Preferred Securities: | ||||
Insurance | $ 4,171,904 | $ 2,630,569 | $ 1,541,335 | $ — |
Multi-Utilities | 1,728,600 | 693,600 | 1,035,000 | — |
Other industry categories* | 36,383,463 | 36,383,463 | — | — |
| $100 Par Preferred Securities: | ||||
Banks | 6,794,665 | — | 6,794,665 | — |
Consumer Finance | 364,230 | 364,230 | — | — |
$1,000 Par Preferred Securities* | 10,905,357 | — | 10,905,357 | — |
Capital Preferred Securities* | 187,514,656 | — | 187,514,656 | — |
Corporate Bonds and Notes* | 984,802 | — | 984,802 | — |
Total Investments | $ 248,847,677 | $ 40,071,862 | $ 208,775,815 | $— |
| * | See Portfolio of Investments for industry breakout. |
| ASSETS: | |
Investments, at value (Cost $247,851,075) | $ 248,847,677 |
Cash | 1,579,310 |
| Receivables: | |
Interest | 2,600,701 |
Fund shares sold | 2,410,256 |
Dividends | 29,303 |
Prepaid expenses | 30,921 |
Total Assets | 255,498,168 |
| LIABILITIES: | |
| Payables: | |
Fund shares repurchased | 974,556 |
Investment advisory fees | 163,087 |
Distributions | 95,457 |
12b-1 distribution and service fees | 62,045 |
Registration fees | 30,340 |
Audit and tax fees | 20,366 |
Administrative fees | 16,363 |
Legal fees | 15,876 |
Custodian fees | 7,040 |
Trustees’ fees and expenses | 3,656 |
Printing fees | 3,458 |
Transfer agent fees | 3,110 |
Commitment and administrative agency fees | 2,627 |
Financial reporting fees | 731 |
Other liabilities | 3,223 |
Total Liabilities | 1,401,935 |
NET ASSETS | $254,096,233 |
| NET ASSETS consist of: | |
Paid-in capital | $ 262,234,442 |
Par value | 117,192 |
Accumulated net investment income (loss) | 631,043 |
Accumulated net realized gain (loss) on investments | (9,883,046) |
Net unrealized appreciation (depreciation) on investments | 996,602 |
NET ASSETS | $254,096,233 |
| Maximum Offering Price Per Share: | |
| Class A Shares: | |
Net asset value and redemption price per share (Based on net assets of $39,254,351 and 1,817,864 shares of beneficial interest issued and outstanding) | $21.59 |
Maximum sales charge (4.50% of offering price) | 1.02 |
Maximum offering price to public | $22.61 |
| Class C Shares: | |
Net asset value and redemption price per share (Based on net assets of $63,895,041 and 2,950,208 shares of beneficial interest issued and outstanding) | $21.66 |
| Class F Shares: | |
F Net asset value and redemption price per share (Based on net assets of $7,197,559 and 329,831 shares of beneficial interest issued and outstanding) | $21.82 |
| Class I Shares: | |
Net asset value and redemption price per share (Based on net assets of $143,051,926 and 6,588,931 shares of beneficial interest issued and outstanding) | $21.71 |
| Class R3 Shares: | |
R3 Net asset value and redemption price per share (Based on net assets of $697,356 and 32,356 shares of beneficial interest issued and outstanding) | $21.55 |
| INVESTMENT INCOME: | ||
Interest | $ 6,207,294 | |
Dividends | 2,040,498 | |
Foreign withholding tax | 6,564 | |
Other | 2 | |
Total investment income | 8,254,358 | |
| EXPENSES: | ||
Investment advisory fees | 1,005,661 | |
| 12b-1 distribution and/or service fees: | ||
Class A | 48,671 | |
Class C | 322,180 | |
Class F | 5,383 | |
Class R3 | 1,775 | |
Transfer agent fees | 84,279 | |
Registration fees | 62,048 | |
Administrative fees | 53,426 | |
Custodian fees | 24,297 | |
Legal fees | 20,058 | |
Audit and tax fees | 16,463 | |
Printing fees | 14,624 | |
Commitment and administrative agency fees | 13,100 | |
Trustees’ fees and expenses | 8,899 | |
Financial reporting fees | 4,587 | |
Excise tax expense | 2,923 | |
Listing expense | 1,484 | |
Other | 12,804 | |
Total expenses | 1,702,662 | |
Fees waived and expenses reimbursed by the investment advisor | (13,664) | |
Net expenses | 1,688,998 | |
NET INVESTMENT INCOME (LOSS) | 6,565,360 | |
| NET REALIZED AND UNREALIZED GAIN (LOSS): | ||
Net realized gain (loss) on investments | (167,614) | |
Net change in unrealized appreciation (depreciation) on investments | (8,904,387) | |
NET REALIZED AND UNREALIZED GAIN (LOSS) | (9,072,001) | |
NET INCREASE (DECREASE) IN NET ASSETS RESULTING FROM OPERATIONS | $(2,506,641) | |
| Six Months Ended 4/30/2018 (Unaudited) | Year Ended 10/31/2017 | ||
| OPERATIONS: | |||
Net investment income (loss) | $ 6,565,360 | $ 11,315,181 | |
Net realized gain (loss) | (167,614) | 2,374,196 | |
Net change in unrealized appreciation (depreciation) | (8,904,387) | 5,842,618 | |
Net increase (decrease) in net assets resulting from operations | (2,506,641) | 19,531,995 | |
| DISTRIBUTIONS TO SHAREHOLDERS FROM NET INVESTMENT INCOME: | |||
Class A Shares | (1,019,822) | (2,021,236) | |
Class C Shares | (1,437,739) | (2,466,076) | |
Class F Shares | (189,290) | (405,856) | |
Class I Shares | (3,826,943) | (6,495,243) | |
Class R3 Shares | (17,718) | (34,204) | |
Total distributions to shareholders | (6,491,512) | (11,422,615) | |
| CAPITAL TRANSACTIONS: | |||
Proceeds from shares sold | 54,362,280 | 120,198,101 | |
Proceeds from shares reinvested | 5,946,402 | 10,184,046 | |
Cost of shares redeemed | (50,495,226) | (83,818,787) | |
Net increase (decrease) in net assets resulting from capital transactions | 9,813,456 | 46,563,360 | |
Total increase (decrease) in net assets | 815,303 | 54,672,740 | |
| NET ASSETS: | |||
Beginning of period | 253,280,930 | 198,608,190 | |
End of period | $254,096,233 | $253,280,930 | |
Accumulated net investment income (loss) at end of period | $631,043 | $557,195 |
| Six Months Ended 4/30/2018 (Unaudited) | Year Ended October 31, | ||||||||||
| 2017 | 2016 | 2015 | 2014 | 2013 | |||||||
| Class A Shares | |||||||||||
Net asset value, beginning of period | $ 22.39 | $ 21.63 | $ 21.13 | $ 21.20 | $ 20.27 | $ 22.42 | |||||
| Income from investment operations: | |||||||||||
Net investment income (loss) | 0.57 (a) | 1.11 (a) | 1.16 (a) | 1.18 (a) | 1.14 (a) | 0.98 (a) | |||||
Net realized and unrealized gain (loss) | (0.80) | 0.80 | 0.49 | (0.13) | 0.91 | (1.91) | |||||
Total from investment operations | (0.23) | 1.91 | 1.65 | 1.05 | 2.05 | (0.93) | |||||
| Distributions paid to shareholders from: | |||||||||||
Net investment income | (0.57) | (1.15) | (1.15) | (1.12) | (1.09) | (0.98) | |||||
Net realized gain | — | — | — | — | — | (0.09) | |||||
Return of capital | — | — | — | — | (0.03) | (0.15) | |||||
Total distributions | (0.57) | (1.15) | (1.15) | (1.12) | (1.12) | (1.22) | |||||
Net asset value, end of period | $21.59 | $22.39 | $21.63 | $21.13 | $21.20 | $20.27 | |||||
Total return (b) | (0.99)% | 9.05% | 8.09% | 5.05% | 10.35% | (4.36)% | |||||
| Ratios to average net assets/supplemental data: | |||||||||||
Net assets, end of period (in 000’s) | $ 39,254 | $ 39,063 | $ 35,468 | $ 28,585 | $ 32,874 | $ 90,286 | |||||
Ratio of total expenses to average net assets | 1.37% (c) | 1.36% | 1.51% (d) | 1.50% (d) | 1.40% | 1.44% | |||||
Ratio of net expenses to average net assets | 1.37% (c) | 1.36% | 1.41% (d) | 1.41% (d) | 1.40% | 1.40% | |||||
Ratio of net investment income (loss) to average net assets | 5.19% (c) | 5.11% | 5.50% | 5.55% | 5.47% | 4.52% | |||||
Portfolio turnover rate | 17% | 44% | 71% | 123% | 170% | 60% | |||||
| (a) | Based on average shares outstanding. |
| (b) | Assumes reinvestment of all distributions for the period and does not include payment of the maximum sales charge of 4.50% or contingent deferred sales charge (CDSC). On purchases of $1 million or more, a CDSC of 1% may be imposed on certain redemptions made within twelve months of purchase. If the sales charges were included, total returns would be lower. These returns include Rule 12b-1 service fees of 0.25% and do not reflect the deduction of taxes that a shareholder would pay on Fund distributions or the redemption of Fund shares. The total returns would have been lower if certain fees had not been waived and expenses reimbursed by the investment advisor. Total return is calculated for the time period presented and is not annualized for periods of less than one year |
| (c) | Annualized. |
| (d) | For the years ended October 31, 2016 and 2015, ratios reflect excise tax of 0.01% and 0.01%, respectively, which are not included in the expense cap. |
| Six Months Ended 4/30/2018 (Unaudited) | Year Ended October 31, | ||||||||||
| 2017 | 2016 | 2015 | 2014 | 2013 | |||||||
| Class C Shares | |||||||||||
Net asset value, beginning of period | $ 22.44 | $ 21.67 | $ 21.17 | $ 21.24 | $ 20.30 | $ 22.45 | |||||
| Income from investment operations: | |||||||||||
Net investment income (loss) | 0.50 (a) | 0.96 (a) | 1.01 (a) | 1.02 (a) | 0.99 (a) | 0.83 (a) | |||||
Net realized and unrealized gain (loss) | (0.79) | 0.79 | 0.48 | (0.13) | 0.91 | (1.93) | |||||
Total from investment operations | (0.29) | 1.75 | 1.49 | 0.89 | 1.90 | (1.10) | |||||
| Distributions paid to shareholders from: | |||||||||||
Net investment income | (0.49) | (0.98) | (0.99) | (0.96) | (0.94) | (0.84) | |||||
Net realized gain | — | — | — | — | — | (0.08) | |||||
Return of capital | — | — | — | — | (0.02) | (0.13) | |||||
Total distributions | (0.49) | (0.98) | (0.99) | (0.96) | (0.96) | (1.05) | |||||
Net asset value, end of period | $21.66 | $22.44 | $21.67 | $21.17 | $21.24 | $20.30 | |||||
Total return (b) | (1.27)% | 8.27% | 7.27% | 4.26% | 9.56% | (5.03)% | |||||
| Ratios to average net assets/supplemental data: | |||||||||||
Net assets, end of period (in 000’s) | $ 63,895 | $ 64,462 | $ 51,004 | $ 45,093 | $ 45,248 | $ 55,376 | |||||
Ratio of total expenses to average net assets | 2.03% (c) | 2.06% | 2.17% (d) | 2.16% (d) | 2.18% | 2.17% | |||||
Ratio of net expenses to average net assets | 2.03% (c) | 2.06% | 2.16% (d) | 2.16% (d) | 2.15% | 2.15% | |||||
Ratio of net investment income (loss) to average net assets | 4.53% (c) | 4.41% | 4.76% | 4.79% | 4.75% | 3.81% | |||||
Portfolio turnover rate | 17% | 44% | 71% | 123% | 170% | 60% | |||||
| (a) | Based on average shares outstanding. |
| (b) | Assumes reinvestment of all distributions for the period and does not include payment of the maximum CDSC of 1%, charged on certain redemptions made within one year of purchase. If the sales charge was included, total returns would be lower. These returns include combined Rule 12b-1 distribution and service fees of 1% and do not reflect the deduction of taxes that a shareholder would pay on Fund distributions or the redemption of Fund shares. The total returns would have been lower if certain fees had not been waived and expenses reimbursed by the investment advisor. Total return is calculated for the time period presented and is not annualized for periods of less than one year. |
| (c) | Annualized. |
| (d) | For the years ended October 31, 2016 and 2015, ratios reflect excise tax of 0.01% and 0.01%, respectively, which are not included in the expense cap. |
| Six Months Ended 4/30/2018 (Unaudited) | Year Ended October 31, | ||||||||||
| 2017 | 2016 | 2015 | 2014 | 2013 | |||||||
| Class F Shares | |||||||||||
Net asset value, beginning of period | $ 22.62 | $ 21.82 | $ 21.31 | $ 21.37 | $ 20.42 | $ 22.59 | |||||
| Income from investment operations: | |||||||||||
Net investment income (loss) | 0.58 (a) | 1.13 (a) | 1.18 (a) | 1.23 (a) | 1.18 (a) | 1.02 (a) | |||||
Net realized and unrealized gain (loss) | (0.80) | 0.84 | 0.50 | (0.15) | 0.91 | (1.95) | |||||
Total from investment operations: | (0.22) | 1.97 | 1.68 | 1.08 | 2.09 | (0.93) | |||||
| Distributions paid to shareholders from: | |||||||||||
Net investment income | (0.58) | (1.17) | (1.17) | (1.14) | (1.11) | (1.01) | |||||
Net realized gain | — | — | — | — | — | (0.08) | |||||
Return of capital | — | — | — | — | (0.03) | (0.15) | |||||
Total Distributions paid to shareholders from: | (0.58) | (1.17) | (1.17) | (1.14) | (1.14) | (1.24) | |||||
Net asset value, end of period | $21.82 | $22.62 | $21.82 | $21.31 | $21.37 | $20.42 | |||||
Total return (b) | (0.93)% | 9.27% | 8.18% | 5.16% | 10.48% | (4.32)% | |||||
| Ratios to average net assets/supplemental data: | |||||||||||
Net assets, end of period (in 000’s) | $ 7,198 | $ 7,339 | $ 5,025 | $ 2,501 | $ 2,617 | $ 3,735 | |||||
Ratio of total expenses to average net assets | 1.43% (c) | 1.39% | 1.70% (d) | 1.92% | 1.81% | 1.58% | |||||
Ratio of net expenses to average net assets | 1.30% (c) | 1.30% | 1.31% (d) | 1.30% | 1.30% | 1.30% | |||||
Ratio of net investment income (loss) to average net assets | 5.26% (c) | 5.11% | 5.55% | 5.70% | 5.64% | 4.63% | |||||
Portfolio turnover rate | 17% | 44% | 71% | 123% | 170% | 60% | |||||
| (a) | Based on average shares outstanding. |
| (b) | Assumes reinvestment of all distributions for the period. These returns include Rule 12b-1 service fees of 0.15% and do not reflect the deduction of taxes that a shareholder would pay on Fund distributions or the redemption of Fund shares. The total returns would have been lower if certain fees had not been waived and expenses reimbursed by the investment advisor. Total return is calculated for the time period presented and is not annualized for periods of less than one year. |
| (c) | Annualized. |
| (d) | For the year ended October 31, 2016, ratios reflect excise tax of 0.01%, which is not included in the expense cap. |
| Six Months Ended 4/30/2018 (Unaudited) | Year Ended October 31, | ||||||||||
| 2017 | 2016 | 2015 | 2014 | 2013 | |||||||
| Class I Shares | |||||||||||
Net asset value, beginning of period | $ 22.49 | $ 21.71 | $ 21.21 | $ 21.27 | $ 20.33 | $ 22.47 | |||||
| Income from investment operations: | |||||||||||
Net investment income (loss) | 0.61 (a) | 1.20 (a) | 1.22 (a) | 1.23 (a) | 1.20 (a) | 1.04 (a) | |||||
Net realized and unrealized gain (loss) | (0.79) | 0.78 | 0.48 | (0.12) | 0.91 | (1.91) | |||||
Total from investment operations | (0.18) | 1.98 | 1.70 | 1.11 | 2.11 | (0.87) | |||||
| Distributions paid to shareholders from: | |||||||||||
Net investment income | (0.60) | (1.20) | (1.20) | (1.17) | (1.14) | (1.03) | |||||
Net realized gain | — | — | — | — | — | (0.09) | |||||
Return of capital | — | — | — | — | (0.03) | (0.15) | |||||
Total distributions | (0.60) | (1.20) | (1.20) | (1.17) | (1.17) | (1.27) | |||||
Net asset value, end of period | $21.71 | $22.49 | $21.71 | $21.21 | $21.27 | $20.33 | |||||
Total return (b) | (0.77)% | 9.39% | 8.33% | 5.35% | 10.65% | (4.06)% | |||||
| Ratios to average net assets/supplemental data: | |||||||||||
Net assets, end of period (in 000’s) | $ 143,052 | $ 141,661 | $ 106,393 | $ 86,412 | $ 71,094 | $ 58,700 | |||||
Ratio of total expenses to average net assets | 1.02% (c) | 0.99% | 1.16% (d) | 1.16% (d) | 1.15% | 1.23% | |||||
Ratio of net expenses to average net assets | 1.02% (c) | 0.99% | 1.16% (d) | 1.16% (d) | 1.15% | 1.15% | |||||
Ratio of net investment income (loss) to average net assets | 5.55% (c) | 5.49% | 5.74% | 5.80% | 5.74% | 4.79% | |||||
Portfolio turnover rate | 17% | 44% | 71% | 123% | 170% | 60% | |||||
| (a) | Based on average shares outstanding. |
| (b) | Assumes reinvestment of all distributions for the period. These returns do not reflect the deduction of taxes that a shareholder would pay on Fund distributions or the redemption of Fund shares. The total returns would have been lower if certain fees had not been waived and expenses reimbursed by the investment advisor. Total return is calculated for the time period presented and is not annualized for periods of less than one year. |
| (c) | Annualized. |
| (d) | For the years ended October 31, 2016 and 2015, ratios reflect excise tax of 0.01% and 0.01%, respectively, which are not included in the expense cap. |
| Six Months Ended 4/30/2018 (Unaudited) | Year Ended October 31, | ||||||||||
| 2017 | 2016 | 2015 | 2014 | 2013 | |||||||
| Class R3 Shares | |||||||||||
Net asset value, beginning of period | $ 22.35 | $ 21.61 | $ 21.13 | $ 21.20 | $ 20.26 | $ 22.41 | |||||
| Income from investment operations: | |||||||||||
Net investment income (loss) | 0.54 (a) | 1.05 (a) | 1.11 (a) | 1.13 (a) | 1.09 (a) | 0.93 (a) | |||||
Net realized and unrealized gain (loss) | (0.80) | 0.78 | 0.47 | (0.14) | 0.92 | (1.92) | |||||
Total from investment operations: | (0.26) | 1.83 | 1.58 | 0.99 | 2.01 | (0.99) | |||||
| Distributions paid to shareholders from: | |||||||||||
Net investment income | (0.54) | (1.09) | (1.10) | (1.06) | (1.04) | (0.92) | |||||
Net realized gain | — | — | — | — | — | (0.10) | |||||
Return of capital | — | — | — | — | (0.03) | (0.14) | |||||
Total Distributions paid to shareholders from: | (0.54) | (1.09) | (1.10) | (1.06) | (1.07) | (1.16) | |||||
Net asset value, end of period | $21.55 | $22.35 | $21.61 | $21.13 | $21.20 | $20.26 | |||||
Total return (b) | (1.12)% | 8.70% | 7.73% | 4.79% | 10.14% | (4.61)% | |||||
| Ratios to average net assets/supplemental data: | |||||||||||
Net assets, end of period (in 000’s) | $ 697 | $ 756 | $ 717 | $ 357 | $ 401 | $ 478 | |||||
Ratio of total expenses to average net assets | 4.23% (c) | 4.29% | 7.42% (d) | 6.56% (d) | 5.74% | 4.87% | |||||
Ratio of net expenses to average net assets | 1.65% (c) | 1.65% | 1.66% (d) | 1.66% (d) | 1.65% | 1.65% | |||||
Ratio of net investment income (loss) to average net assets | 4.92% (c) | 4.83% | 5.25% | 5.30% | 5.25% | 4.25% | |||||
Portfolio turnover rate | 17% | 44% | 71% | 123% | 170% | 60% | |||||
| (a) | Based on average shares outstanding. |
| (b) | Assumes reinvestment of all distributions for the period. These returns include combined Rule 12b-1 distribution and service fees of 0.50%, and do not reflect the deduction of taxes that a shareholder would pay on Fund distributions or the redemption of Fund shares. The total returns would have been lower if certain fees had not been waived and expenses reimbursed by the investment advisor. Total return is calculated for the time period presented and is not annualized for periods of less than one year. |
| (c) | Annualized. |
| (d) | For the years ended October 31, 2016 and 2015, ratios reflect excise tax of 0.01% and 0.01%, respectively, which are not included in the expense cap. |
| 1) | benchmark yields; |
| 2) | reported trades; |
| 3) | broker/dealer quotes; |
| 4) | issuer spreads; |
| 5) | benchmark securities; |
| 6) | bids and offers; and |
| 7) | reference data including market research publications. |
| 1) | the credit conditions in the relevant market and changes thereto; |
| 2) | the liquidity conditions in the relevant market and changes thereto; |
| 3) | the interest rate conditions in the relevant market and changes thereto (such as significant changes in interest rates); |
| 4) | issuer-specific conditions (such as significant credit deterioration); and |
| 5) | any other market-based data the Advisor’s Pricing Committee considers relevant. In this regard, the Advisor’s Pricing Committee may use last-obtained market-based data to assist it when valuing portfolio securities using amortized cost. |
| 1) | the type of security; |
| 2) | the size of the holding; |
| 3) | the initial cost of the security; |
| 4) | transactions in comparable securities; |
| 5) | price quotes from dealers and/or third-party pricing services; |
| 6) | relationships among various securities; |
| 7) | information obtained by contacting the issuer, analysts, or the appropriate stock exchange; |
| 8) | an analysis of the issuer’s financial statements; and |
| 9) | the existence of merger proposals or tender offers that might affect the value of the security. |
| 1) | the value of similar foreign securities traded on other foreign markets; |
| 2) | ADR trading of similar securities; |
| 3) | closed-end fund trading of similar securities; |
| 4) | foreign currency exchange activity; |
| 5) | the trading prices of financial products that are tied to baskets of foreign securities; |
| 6) | factors relating to the event that precipitated the pricing problem; |
| 7) | whether the event is likely to recur; and |
| 8) | whether the effects of the event are isolated or whether they affect entire markets, countries or regions. |
| • | Level 1 – Level 1 inputs are quoted prices in active markets for identical investments. An active market is a market in which transactions for the investment occur with sufficient frequency and volume to provide pricing information on an ongoing basis. |
| • | Level 2 – Level 2 inputs are observable inputs, either directly or indirectly, and include the following: |
| o | Quoted prices for similar investments in active markets. |
| o | Quoted prices for identical or similar investments in markets that are non-active. A non-active market is a market where there are few transactions for the investment, the prices are not current, or price quotations vary substantially either over time or among market makers, or in which little information is released publicly. |
| o | Inputs other than quoted prices that are observable for the investment (for example, interest rates and yield curves observable at commonly quoted intervals, volatilities, prepayment speeds, loss severities, credit risks, and default rates). |
| o | Inputs that are derived principally from or corroborated by observable market data by correlation or other means. |
| • | Level 3 – Level 3 inputs are unobservable inputs. Unobservable inputs may reflect the reporting entity’s own assumptions about the assumptions that market participants would use in pricing the investment. |
| Security | Acquisition Date | Principal Values/Shares | Price | Carrying Cost | Value | % of Net Assets | ||
| CoBank ACB, 3.52% | 3/29/18 | 443 | $666.42 | $300,133 | $295,225 | 0.12% | ||
| Compeer Financial ACA, 6.75% | 7/31/15 | 500 | 1,055.00 | 526,250 | 527,500 | 0.21 | ||
| Dairy Farmers of America, Inc., 7.13% | 9/15/16-10/4/16 | $1,300,000 | 109.75 | 1,316,875 | 1,426,750 | 0.56 | ||
| Farm Credit Bank Of Texas, 6.75% | 12/8/15-12/18/15 | 5,500 | 107.80 | 568,000 | 592,911 | 0.23 | ||
| Fortegra Financial Corp., 8.50%, 10/15/57 | 10/12/17 | $1,000,000 | 101.25 | 1,000,000 | 1,012,500 | 0.40 | ||
| Kinder Morgan GP, Inc., 5.75%, 08/18/57 | 6/20/17 | 500 | 938.61 | 457,500 | 469,305 | 0.19 | ||
| Land O’Lakes Capital Trust I, 7.45%, 03/15/28 | 6/6/14-3/20/15 | $3,000,000 | 114.00 | 3,076,048 | 3,420,000 | 1.35 | ||
| Sovereign Real Estate Investment Trust, 12.00% | 2/5/15-3/22/16 | 1,261 | 1,177.50 | 1,657,802 | 1,484,827 | 0.58 | ||
| $8,902,608 | $9,229,018 | 3.64% |
| Distributions paid from: | |
Ordinary income | $11,422,615 |
Capital gains | — |
Return of capital | — |
Undistributed ordinary income | $314,507 |
Undistributed capital gains | — |
Total undistributed earnings | 314,507 |
Accumulated capital and other losses | (9,486,416) |
Net unrealized appreciation (depreciation) | 9,914,661 |
Total accumulated earnings (losses) | 742,752 |
Other | — |
Paid-in capital | 252,538,178 |
Total net assets | $253,280,930 |
| Expenses Subject to Recovery | ||||||||||
| Advisory Fee Waiver | Expense Reimbursement | Year Ended October 31, 2016 | Year Ended October 31, 2017 | Six Months Ended April 30, 2018 | Total | |||||
| $ 13,664 | $ — | $ 70,141 | $ 25,178 | $ 13,664 | $ 108,983 | |||||
| Six Months Ended April 30, 2018 | Year Ended October 31, 2017 | ||||||
| Shares | Value | Shares | Value | ||||
| Sales: | |||||||
| Class A | 381,530 | $ 8,385,880 | 808,030 | $ 17,542,282 | |||
| Class C | 337,670 | 7,482,671 | 861,323 | 18,937,718 | |||
| Class F | 90,477 | 2,019,961 | 763,726 | 16,970,043 | |||
| Class I | 1,648,821 | 36,471,768 | 3,048,690 | 66,600,847 | |||
| Class R3 | 91 | 2,000 | 6,624 | 147,211 | |||
| Total Sales | 2,458,589 | $ 54,362,280 | 5,488,393 | $ 120,198,101 | |||
| Dividend Reinvestment: | |||||||
| Class A | 33,685 | $ 740,043 | 66,513 | $ 1,454,350 | |||
| Class C | 59,951 | 1,320,738 | 102,559 | 2,247,327 | |||
| Class F | 7,567 | 168,106 | 16,322 | 361,622 | |||
| Class I | 167,831 | 3,706,728 | 277,790 | 6,100,484 | |||
| Class R3 | 492 | 10,787 | 931 | 20,263 | |||
| Total Dividend Reinvestment | 269,526 | $ 5,946,402 | 464,115 | $ 10,184,046 | |||
| Redemptions: | |||||||
| Class A | (342,262) | $ (7,512,146) | (769,383) | $ (16,786,204) | |||
| Class C | (319,893) | (7,056,165) | (444,954) | (9,686,681) | |||
| Class F | (92,640) | (2,073,987) | (685,918) | (15,315,364) | |||
| Class I | (1,525,641) | (33,807,428) | (1,929,595) | (41,878,505) | |||
| Class R3 | (2,047) | (45,500) | (6,941) | (152,033) | |||
| Total Redemptions | (2,282,483) | $ (50,495,226) | (3,836,791) | $ (83,818,787) | |||

FUND ACCOUNTANT &
CUSTODIAN
PUBLIC ACCOUNTING FIRM


Small Cap Value Fund

| 1 | |
| 2 | |
| 4 | |
| 5 | |
| 6 | |
| 8 | |
| 9 | |
| 10 | |
| 11 | |
| 14 | |
| 19 |
| • | The S&P 500® Index did something it had never previously done, finishing 2017 with 12 months of gains; |
| • | The Dow Jones Industrial Average achieved a milestone as well, closing above 24,000 for the first time ever on November 30; |
| • | The Nasdaq Composite set a record by having 11 months of gains in 2017 (June was the only down month, and by just 0.86%); and |
| • | The MSCI AC World Index (containing constituents from 47 countries) ended 2017 at an all-time high and was up 22% at year-end. |

| Fund Statistics | |
| First Trust/Confluence Small Cap Value Fund | Net Asset Value (NAV) |
| Class A (FOVAX) | $33.90 |
| Class C (FOVCX) | $30.65 |
| Class I (FOVIX) | $34.53 |
| Sector Allocation | % of Total Investments |
| Industrials | 23.3% |
| Health Care | 19.1 |
| Real Estate | 14.2 |
| Financials | 14.1 |
| Consumer Discretionary | 10.3 |
| Information Technology | 10.3 |
| Consumer Staples | 5.5 |
| Materials | 3.2 |
| Total | 100.0% |
| Top Ten Holdings | % of Total Investments |
| Boston Beer (The) Co., Inc., Class A | 5.5% |
| Movado Group, Inc. | 4.3 |
| Morningstar, Inc. | 4.3 |
| Rayonier, Inc. | 4.1 |
| Thermon Group Holdings, Inc. | 3.9 |
| RMR Group (The), Inc., Class A | 3.8 |
| Allied Motion Technologies, Inc. | 3.8 |
| Halyard Health, Inc. | 3.6 |
| Veritex Holdings, Inc. | 3.5 |
| Monotype Imaging Holdings, Inc. | 3.4 |
| Total | 40.2% |
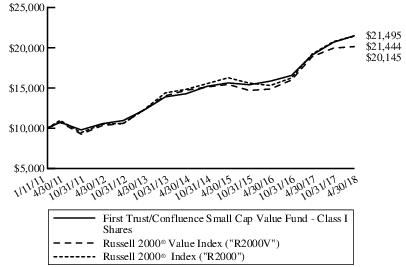
| Performance as of April 30, 2018 | |||||||||||||||||||
| Class A Inception 2/24/2011 | Class C Inception 3/2/2011 | Class I Inception 1/11/2011 | R2000V* | R2000 | |||||||||||||||
| Cumulative Total Returns | w/o sales charge | w/max 5.50% sales charge | w/o sales charge | w/max 1.00% contingent deferred sales charge | w/o sales charge | w/o sales charges | w/o sales charges | ||||||||||||
| 6 Months | 3.92% | -1.80% | 3.48% | 2.50% | 3.94% | 0.94% | 3.27% | ||||||||||||
| 1 Year | 12.85% | 6.65% | 12.05% | 11.05% | 12.50% | 6.53% | 11.54% | ||||||||||||
| Average Annual Total Returns | |||||||||||||||||||
| 5 Years | 11.79% | 10.53% | 10.86% | 10.86% | 11.89% | 10.36% | 11.74% | ||||||||||||
| Since Inception | 10.88% | 10.01% | 9.45% | 9.45% | 11.06% | 10.07% | 11.02% | ||||||||||||
| Actual Expenses | Hypothetical (5% Return Before Expenses) | |||||||||||||
| Beginning Account Value 11/1/2017 | Ending Account Value 4/30/2018 | Expenses Paid During Period 11/1/2017 - 4/30/2018 (a) | Beginning Account Value 11/1/2017 | Ending Account Value 4/30/2018 | Expenses Paid During Period 11/1/2017 - 4/30/2018 (a) | Annualized Expense Ratios (b) | ||||||||
| Class A | $ 1,000.00 | $ 1,039.20 | $ 8.09 | $ 1,000.00 | $ 1,016.86 | $ 8.00 | 1.60% | |||||||
| Class C | 1,000.00 | 1,034.80 | 11.86 | 1,000.00 | 1,013.14 | 11.73 | 2.35 | |||||||
| Class I | 1,000.00 | 1,039.40 | 6.83 | 1,000.00 | 1,018.10 | 6.76 | 1.35 | |||||||
| (a) | Expenses are equal to the annualized expense ratios as indicated in the table multiplied by the average account value over the period (November 1, 2017 through April 30, 2018), multiplied by 181/365 (to reflect the six-month period). |
| (b) | These expense ratios reflect expense caps. |
| Shares | Description | Value | ||
| COMMON STOCKS – 82.8% | ||||
| Air Freight & Logistics – 2.7% | ||||
| 10,022 | Forward Air Corp. | $541,088 | ||
| Banks – 6.0% | ||||
| 7,934 | Bank of Marin Bancorp. | 575,612 | ||
| 21,369 | Veritex Holdings, Inc. (a) | 613,717 | ||
| 1,189,329 | ||||
| Beverages – 4.9% | ||||
| 4,272 | Boston Beer (The) Co., Inc., Class A (a) | 957,569 | ||
| Capital Markets – 3.8% | ||||
| 6,892 | Morningstar, Inc. | 748,333 | ||
| Chemicals – 2.9% | ||||
| 13,690 | Innophos Holdings, Inc. | 566,492 | ||
| Electrical Equipment – 6.8% | ||||
| 16,688 | Allied Motion Technologies, Inc. | 665,351 | ||
| 29,638 | Thermon Group Holdings, Inc. (a) | 675,450 | ||
| 1,340,801 | ||||
| Electronic Equipment, Instruments & Components – 2.9% | ||||
| 11,204 | MTS Systems Corp. | 569,163 | ||
| Health Care Equipment & Supplies – 8.7% | ||||
| 13,364 | Halyard Health, Inc. (a) | 633,053 | ||
| 16,269 | Natus Medical, Inc. (a) | 537,690 | ||
| 14,941 | Varex Imaging Corp. (a) | 537,727 | ||
| 1,708,470 | ||||
| Health Care Providers & Services – 2.9% | ||||
| 24,555 | Patterson Cos., Inc. | 571,640 | ||
| Hotels, Restaurants & Leisure – 2.7% | ||||
| 45,153 | Potbelly Corp. (a) | 539,578 | ||
| Industrial Conglomerates – 2.5% | ||||
| 13,405 | Raven Industries, Inc. | 490,623 | ||
| Insurance – 2.7% | ||||
| 19,490 | Brown & Brown, Inc. | 530,713 | ||
| IT Services – 3.3% | ||||
| 1,272 | Gartner, Inc. (a) | 154,281 | ||
| 12,076 | Luxoft Holding, Inc. (a) | 487,266 | ||
| 641,547 | ||||
| Life Sciences Tools & Services – 5.4% | ||||
| 3,527 | Bio-Techne Corp. | 532,260 | ||
| Shares | Description | Value | ||
| Life Sciences Tools & Services (Continued) | ||||
| 10,219 | Cambrex Corp. (a) | $541,096 | ||
| 1,073,356 | ||||
| Machinery – 7.7% | ||||
| 8,844 | Astec Industries, Inc. | 491,373 | ||
| 4,050 | Graco, Inc. | 178,159 | ||
| 3,436 | John Bean Technologies Corp. | 370,229 | ||
| 4,126 | RBC Bearings, Inc. (a) | 480,184 | ||
| 1,519,945 | ||||
| Professional Services – 1.0% | ||||
| 2,198 | Exponent, Inc. | 189,907 | ||
| Real Estate Management & Development – 6.4% | ||||
| 10,893 | RE/MAX Holdings, Inc., Class A | 589,856 | ||
| 8,949 | RMR Group (The), Inc., Class A | 665,806 | ||
| 1,255,662 | ||||
| Software – 3.0% | ||||
| 26,964 | Monotype Imaging Holdings, Inc. | 597,253 | ||
| Textiles, Apparel & Luxury Goods – 6.5% | ||||
| 17,398 | Culp, Inc. | 514,111 | ||
| 19,174 | Movado Group, Inc. | 756,414 | ||
| 1,270,525 | ||||
| Total Common Stocks | 16,301,994 | |||
| (Cost $13,890,282) | ||||
| REAL ESTATE INVESTMENT TRUSTS – 6.3% | ||||
| Equity Real Estate Investment Trusts – 6.3% | ||||
| 30,008 | Gladstone Commercial Corp. | 520,339 | ||
| 19,288 | Rayonier, Inc. | 717,321 | ||
| Total Real Estate Investment Trusts | 1,237,660 | |||
| (Cost $1,067,210) | ||||
| Total Investments – 89.1% | 17,539,654 | |||
| (Cost $14,957,492) (b) | ||||
| Net Other Assets and Liabilities – 10.9% | 2,149,842 | |||
| Net Assets – 100.0% | $19,689,496 | |||
| (a) | Non-income producing security. |
| (b) | Aggregate cost for financial reporting purposes approximates the aggregate cost for federal income tax purposes. As of April 30, 2018, the aggregate gross unrealized appreciation for all investments in which there was an excess of value over tax cost was $3,115,221 and the aggregate gross unrealized depreciation for all investments in which there was an excess of tax cost over value was $533,059. The net unrealized appreciation was $2,582,162. |
| Total Value at 4/30/2018 | Level 1 Quoted Prices | Level 2 Significant Observable Inputs | Level 3 Significant Unobservable Inputs | |
| Common Stocks* | $ 16,301,994 | $ 16,301,994 | $ — | $ — |
| Real Estate Investment Trusts* | 1,237,660 | 1,237,660 | — | — |
| Total Investments | $ 17,539,654 | $ 17,539,654 | $— | $— |
| * | See Portfolio of Investments for industry breakout. |
| ASSETS: | |
Investments, at value (Cost $14,957,492) | $ 17,539,654 |
Cash | 2,174,403 |
| Receivables: | |
Fund shares sold | 20,330 |
From Investment Advisor | 10,452 |
Dividends | 2,774 |
Prepaid expenses | 16,318 |
Total Assets | 19,763,931 |
| LIABILITIES: | |
| Payables: | |
Fund shares repurchased | 21,754 |
Audit and tax fees | 21,537 |
Administrative fees | 8,535 |
Transfer agent fees | 5,549 |
12b-1 distribution and service fees | 4,667 |
Commitment and administrative agency fees | 2,586 |
Printing fees | 2,147 |
Trustees’ fees and expenses | 1,776 |
Legal fees | 1,650 |
Registration fees | 1,282 |
Custodian fees | 1,267 |
Financial reporting fees | 731 |
Other liabilities | 954 |
Total Liabilities | 74,435 |
NET ASSETS | $19,689,496 |
| NET ASSETS consist of: | |
Paid-in capital | $ 16,474,007 |
Par value | 5,887 |
Accumulated net investment income (loss) | (35,566) |
Accumulated net realized gain (loss) on investments | 663,006 |
Net unrealized appreciation (depreciation) on investments | 2,582,162 |
NET ASSETS | $19,689,496 |
| Maximum Offering Price Per Share: | |
| Class A Shares: | |
Net asset value and redemption price per share (Based on net assets of $6,256,213 and 184,554 shares of beneficial interest issued and outstanding) | $33.90 |
Maximum sales charge (5.50% of offering price) | 1.97 |
Maximum offering price to public | $35.87 |
| Class C Shares: | |
Net asset value and redemption price per share (Based on net assets of $4,105,237 and 133,932 shares of beneficial interest issued and outstanding) | $30.65 |
| Class I Shares: | |
Net asset value and redemption price per share (Based on net assets of $9,328,046 and 270,178 shares of beneficial interest issued and outstanding) | $34.53 |
| INVESTMENT INCOME: | ||
Dividends | $ 102,094 | |
Interest | 7,322 | |
Total investment income | 109,416 | |
| EXPENSES: | ||
Investment advisory fees | 89,872 | |
Transfer agent fees | 33,925 | |
| 12b-1 distribution and/or service fees: | ||
Class A | 7,474 | |
Class C | 19,538 | |
Administrative fees | 26,035 | |
Registration fees | 25,705 | |
Audit and tax fees | 15,855 | |
Commitment and administrative agency fees | 11,511 | |
Printing fees | 8,388 | |
Trustees’ fees and expenses | 8,165 | |
Financial reporting fees | 4,587 | |
Custodian fees | 2,173 | |
Legal fees | 1,906 | |
Listing expense | 891 | |
Other | 768 | |
Total expenses | 256,793 | |
Fees waived and expenses reimbursed by the investment advisor | (108,448) | |
Net expenses | 148,345 | |
NET INVESTMENT INCOME (LOSS) | (38,929) | |
| NET REALIZED AND UNREALIZED GAIN (LOSS): | ||
Net realized gain (loss) on investments | 664,155 | |
Net change in unrealized appreciation (depreciation) on investments | 109,860 | |
NET REALIZED AND UNREALIZED GAIN (LOSS) | 774,015 | |
NET INCREASE (DECREASE) IN NET ASSETS RESULTING FROM OPERATIONS | $ 735,086 | |
| Six Months Ended 4/30/2018 (Unaudited) | Year Ended 10/31/2017 | ||
| OPERATIONS: | |||
Net investment income (loss) | $ (38,929) | $ (84,938) | |
Net realized gain (loss) | 664,155 | 1,061,171 | |
Net change in unrealized appreciation (depreciation) | 109,860 | 1,828,856 | |
Net increase (decrease) in net assets resulting from operations | 735,086 | 2,805,089 | |
| DISTRIBUTIONS TO SHAREHOLDERS FROM NET REALIZED GAIN: | |||
Class A Shares | (328,598) | (58,496) | |
Class C Shares | (234,993) | (47,722) | |
Class I Shares | (407,096) | (34,235) | |
Total distributions to shareholders | (970,687) | (140,453) | |
| CAPITAL TRANSACTIONS: | |||
Proceeds from shares sold | 4,701,365 | 8,490,868 | |
Proceeds from shares reinvested | 912,306 | 123,849 | |
Cost of shares redeemed | (2,579,393) | (3,494,346) | |
Net increase (decrease) in net assets resulting from capital transactions | 3,034,278 | 5,120,371 | |
Total increase (decrease) in net assets | 2,798,677 | 7,785,007 | |
| NET ASSETS: | |||
Beginning of period | 16,890,819 | 9,105,812 | |
End of period | $19,689,496 | $16,890,819 | |
Accumulated net investment income (loss) at end of period | $(35,566) | $3,363 |
| Six Months Ended 4/30/2018 (Unaudited) | Year Ended October 31, | ||||||||||
| 2017 | 2016 | 2015 | 2014 | 2013 | |||||||
| Class A Shares | |||||||||||
Net asset value, beginning of period | $ 34.48 | $ 27.81 | $ 26.34 | $ 28.03 | $ 26.77 | $ 21.58 | |||||
| Income from investment operations: | |||||||||||
Net investment income (loss) (a) | (0.07) | (0.16) | (0.10) | 0.04 | 0.00 (b) | 0.10 | |||||
Net realized and unrealized gain (loss) | 1.42 | 7.20 | 1.97 | 0.31 | 2.39 | 5.46 | |||||
Total from investment operations | 1.35 | 7.04 | 1.87 | 0.35 | 2.39 | 5.56 | |||||
| Distributions paid to shareholders from: | |||||||||||
Net investment income | — | — | — | — | — | (0.27) | |||||
Net realized gain | (1.93) | (0.37) | (0.40) | (2.04) | (1.13) | (0.10) | |||||
Total distributions | (1.93) | (0.37) | (0.40) | (2.04) | (1.13) | (0.37) | |||||
Net asset value, end of period | $33.90 | $34.48 | $27.81 | $26.34 | $28.03 | $26.77 | |||||
Total return (c) | 3.92% | 25.53% | 7.22% | 1.22% | 9.23% | 26.16% | |||||
| Ratios to average net assets/supplemental data: | |||||||||||
Net assets, end of period (in 000’s) | $ 6,256 | $ 5,656 | $ 3,767 | $ 1,413 | $ 1,144 | $ 1,288 | |||||
Ratio of total expenses to average net assets | 2.83% (d) | 3.56% | 5.69% | 7.61% | 8.65% | 11.29% | |||||
Ratio of net expenses to average net assets | 1.60% (d) | 1.60% | 1.61% (e) | 1.60% | 1.60% | 1.60% | |||||
Ratio of net investment income (loss) to average net assets | (0.39)% (d) | (0.50)% | (0.38)% | 0.16% | 0.00% (f) | 0.42% | |||||
Portfolio turnover rate | 12% | 28% | 15% | 17% | 39% | 31% | |||||
| (a) | Per share amounts have been calculated using the average shares method. |
| (b) | Amount represents less than $0.01 per share. |
| (c) | Assumes reinvestment of all distributions for the period and does not include payment of the maximum sales charge of 5.50% or contingent deferred sales charge (CDSC). On purchases of $1 million or more, a CDSC of 1% may be imposed on certain redemptions made within twelve months of purchase. If the sales charges were included, total returns would be lower. These returns include Rule 12b-1 service fees of 0.25% and do not reflect the deduction of taxes that a shareholder would pay on Fund distributions or the redemption of Fund shares. The total returns would have been lower if certain fees had not been waived and expenses reimbursed by the investment advisor. Total return is calculated for the time period presented and is not annualized for periods of less than one year. |
| (d) | Annualized. |
| (e) | Includes excise tax. If this excise tax was not included, the expense ratio would have been 1.60%. |
| (f) | Amount is less than 0.01%. |
| Six Months Ended 4/30/2018 (Unaudited) | Year Ended October 31, | ||||||||||
| 2017 | 2016 | 2015 | 2014 | 2013 | |||||||
| Class C Shares | |||||||||||
Net asset value, beginning of period | $ 31.47 | $ 25.61 | $ 24.51 | $ 26.44 | $ 25.51 | $ 20.59 | |||||
| Income from investment operations: | |||||||||||
Net investment income (loss) (a) | (0.17) | (0.36) | (0.28) | (0.14) | (0.19) | (0.10) | |||||
Net realized and unrealized gain (loss) | 1.28 | 6.59 | 1.78 | 0.25 | 2.25 | 5.23 | |||||
Total from investment operations | 1.11 | 6.23 | 1.50 | 0.11 | 2.06 | 5.13 | |||||
| Distributions paid to shareholders from: | |||||||||||
Net investment income | — | — | — | — | — | (0.11) | |||||
Net realized gain | (1.93) | (0.37) | (0.40) | (2.04) | (1.13) | (0.10) | |||||
Total distributions | (1.93) | (0.37) | (0.40) | (2.04) | (1.13) | (0.21) | |||||
Net asset value, end of period | $30.65 | $31.47 | $25.61 | $24.51 | $26.44 | $25.51 | |||||
Total return (b) | 3.48% | 24.58% | 6.28% | 0.33% | 8.36% | 25.11% | |||||
| Ratios to average net assets/supplemental data: | |||||||||||
Net assets, end of period (in 000’s) | $ 4,105 | $ 3,962 | $ 3,237 | $ 2,247 | $ 1,977 | $ 1,956 | |||||
Ratio of total expenses to average net assets | 3.80% (c) | 4.45% | 6.28% | 7.93% | 8.81% | 10.45% | |||||
Ratio of net expenses to average net assets | 2.35% (c) | 2.35% | 2.36% (d) | 2.35% | 2.35% | 2.35% | |||||
Ratio of net investment income (loss) to average net assets | (1.14)% (c) | (1.25)% | (1.12)% | (0.57)% | (0.73)% | (0.43)% | |||||
Portfolio turnover rate | 12% | 28% | 15% | 17% | 39% | 31% | |||||
| (a) | Per share amounts have been calculated using the average shares method. |
| (b) | Assumes reinvestment of all distributions for the period and does not include payment of the maximum CDSC of 1%, charged on certain redemptions made within one year of purchase. If the sales charge was included, total returns would be lower. These returns include combined Rule 12b-1 distribution and service fees of 1% and do not reflect the deduction of taxes that a shareholder would pay on Fund distributions or the redemption of Fund shares. The total returns would have been lower if certain fees had not been waived and expenses reimbursed by the investment advisor. Total return is calculated for the time period presented and is not annualized for periods of less than one year. |
| (c) | Annualized. |
| (d) | Includes excise tax. If this excise tax was not included, the expense ratio would have been 2.35%. |
| Six Months Ended 4/30/2018 (Unaudited) | Year Ended October 31, | ||||||||||
| 2017 | 2016 | 2015 | 2014 | 2013 | |||||||
| Class I Shares | |||||||||||
Net asset value, beginning of period | $ 35.07 | $ 28.40 | $ 26.84 | $ 28.52 | $ 27.15 | $ 21.81 | |||||
| Income from investment operations: | |||||||||||
Net investment income (loss) (a) | (0.02) | (0.09) | (0.05) | 0.10 | 0.08 | 0.16 | |||||
Net realized and unrealized gain (loss) | 1.41 | 7.13 | 2.01 | 0.26 | 2.42 | 5.60 | |||||
Total from investment operations | 1.39 | 7.04 | 1.96 | 0.36 | 2.50 | 5.76 | |||||
| Distributions paid to shareholders from: | |||||||||||
Net investment income | — | — | — | — | — | (0.32) | |||||
Net realized gain | (1.93) | (0.37) | (0.40) | (2.04) | (1.13) | (0.10) | |||||
Total distributions | (1.93) | (0.37) | (0.40) | (2.04) | (1.13) | (0.42) | |||||
Net asset value, end of period | $34.53 | $35.07 | $28.40 | $26.84 | $28.52 | $27.15 | |||||
Total return (b) | 3.94% | 24.99% | 7.46% | 1.23% | 9.51% | 26.85% | |||||
| Ratios to average net assets/supplemental data: | |||||||||||
Net assets, end of period (in 000’s) | $ 9,328 | $ 7,273 | $ 2,101 | $ 813 | $ 592 | $ 276 | |||||
Ratio of total expenses to average net assets | 2.43% (c) | 3.22% | 5.63% | 8.46% | 11.05% | 17.52% | |||||
Ratio of net expenses to average net assets | 1.35% (c) | 1.35% | 1.35% | 1.35% | 1.35% | 1.35% | |||||
Ratio of net investment income (loss) to average net assets | (0.12)% (c) | (0.28)% | (0.16)% | 0.38% | 0.28% | 0.66% | |||||
Portfolio turnover rate | 12% | 28% | 15% | 17% | 39% | 31% | |||||
| (a) | Per share amounts have been calculated using the average shares method. |
| (b) | Assumes reinvestment of all distributions for the period. These returns do not reflect the deduction of taxes that a shareholder would pay on Fund distributions or the redemption of Fund shares. The total returns would have been lower if certain fees had not been waived and expenses reimbursed by the investment advisor. Total return is calculated for the time period presented and is not annualized for periods of less than one year. |
| (c) | Annualized. |
| 1) | the type of security; |
| 2) | the size of the holding; |
| 3) | the initial cost of the security; |
| 4) | transactions in comparable securities; |
| 5) | price quotes from dealers and/or third-party pricing services; |
| 6) | relationships among various securities; |
| 7) | information obtained by contacting the issuer, analysts, or the appropriate stock exchange; |
| 8) | an analysis of the issuer’s financial statements; and |
| 9) | the existence of merger proposals or tender offers that might affect the value of the security. |
| • | Level 1 – Level 1 inputs are quoted prices in active markets for identical investments. An active market is a market in which transactions for the investment occur with sufficient frequency and volume to provide pricing information on an ongoing basis. |
| • | Level 2 – Level 2 inputs are observable inputs, either directly or indirectly, and include the following: |
| o | Quoted prices for similar investments in active markets. |
| o | Quoted prices for identical or similar investments in markets that are non-active. A non-active market is a market where there are few transactions for the investment, the prices are not current, or price quotations vary substantially either over time or among market makers, or in which little information is released publicly. |
| o | Inputs other than quoted prices that are observable for the investment (for example, interest rates and yield curves observable at commonly quoted intervals, volatilities, prepayment speeds, loss severities, credit risks, and default rates). |
| o | Inputs that are derived principally from or corroborated by observable market data by correlation or other means. |
| • | Level 3 – Level 3 inputs are unobservable inputs. Unobservable inputs may reflect the reporting entity’s own assumptions about the assumptions that market participants would use in pricing the investment. |
| Distributions paid from: | |
Ordinary income | $38,034 |
Capital gains | 102,419 |
Return of capital | — |
Undistributed ordinary income | $247,428 |
Undistributed capital gains | 722,110 |
Total undistributed earnings | 969,538 |
Accumulated capital and other losses | — |
Net unrealized appreciation (depreciation) | 2,475,665 |
Total accumulated earnings (losses) | 3,445,203 |
Other | — |
Paid-in capital | 13,445,616 |
Total net assets | $16,890,819 |
| Expenses Subject to Recovery | ||||||||||||
| Advisory Fee Waiver | Expense Reimbursement | Year Ended October 31, 2015 | Year Ended October 31, 2016 | Year Ended October 31, 2017 | Six Months Ended April 30, 2018 | Total | ||||||
| $ 89,872 | $ 18,576 | $ 137,072 | $ 247,943 | $ 262,436 | $ 108,448 | $ 755,899 | ||||||
| Six Months Ended April 30, 2018 | Year Ended October 31, 2017 | ||||||
| Shares | Value | Shares | Value | ||||
| Sales: | |||||||
| Class A | 30,212 | $ 1,027,213 | 83,953 | $ 2,640,636 | |||
| Class C | 25,963 | 788,750 | 27,393 | 779,701 | |||
| Class I | 85,922 | 2,885,402 | 158,422 | 5,070,531 | |||
| Total Sales | 142,097 | $ 4,701,365 | 269,768 | $ 8,490,868 | |||
| Dividend Reinvestment: | |||||||
| Class A | 8,807 | $ 299,176 | 1,525 | $ 45,810 | |||
| Class C | 7,113 | 219,210 | 1,621 | 44,739 | |||
| Class I | 11,385 | 393,920 | 1,086 | 33,300 | |||
| Total Dividend Reinvestment | 27,305 | $ 912,306 | 4,232 | $ 123,849 | |||
| Redemptions: | |||||||
| Class A | (18,507) | $ (629,531) | (56,930) | $ (1,779,700) | |||
| Class C | (25,040) | (771,828) | (29,546) | (854,770) | |||
| Class I | (34,538) | (1,178,034) | (26,091) | (859,876) | |||
| Total Redemptions | (78,085) | $ (2,579,393) | (112,567) | $ (3,494,346) | |||

FUND ACCOUNTANT &
CUSTODIAN
PUBLIC ACCOUNTING FIRM


High Income Fund
| 1 | |
| 2 | |
| 4 | |
| 5 | |
| 6 | |
| 20 | |
| 21 | |
| 22 | |
| 23 | |
| 26 | |
| 32 |
| • | The S&P 500® Index did something it had never previously done, finishing 2017 with 12 months of gains; |
| • | The Dow Jones Industrial Average achieved a milestone as well, closing above 24,000 for the first time ever on November 30; |
| • | The Nasdaq Composite set a record by having 11 months of gains in 2017 (June was the only down month, and by just 0.86%); and |
| • | The MSCI AC World Index (containing constituents from 47 countries) ended 2017 at an all-time high and was up 22% at year-end. |

| Fund Statistics | |
| First Trust Short Duration High Income Fund | Net Asset Value (NAV) |
| Class A (FDHAX) | $19.77 |
| Class C (FDHCX) | $19.75 |
| Class I (FDHIX) | $19.78 |
| Credit Quality(1) | % of Senior Loans and Other Debt Securities(2) |
| BBB+ | 0.4% |
| BBB- | 3.8 |
| BB+ | 4.0 |
| BB | 8.2 |
| BB- | 14.3 |
| B+ | 23.1 |
| B | 19.8 |
| B- | 17.4 |
| CCC+ | 5.0 |
| CCC | 2.4 |
| CCC- | 0.7 |
| D | 0.4 |
| Not Rated | 0.5 |
| Total | 100.0% |
| Top Ten Issuers | % of Senior Loans and Other Securities(2) |
| BMC Software Finance, Inc. | 2.7% |
| Tenet Healthcare Corp. | 2.7% |
| Amaya Holdings B.V. | 2.6% |
| Valeant Pharmaceuticals International, Inc. | 2.4% |
| ClubCorp Club Operations, Inc. | 2.3% |
| Caesars Resorts Collection | 2.2% |
| Reynolds Group Holdings, Inc. | 1.9% |
| Endo Pharmaceuticals Holdings, Inc. | 1.9% |
| Portillo’s Holdings LLC | 1.8% |
| BJ’s Wholesale Club, Inc. | 1.7% |
| Total | 22.2% |
| Industry Classification | % of Senior Loans and Other Securities(2) |
| Health Care Providers & Services | 17.3% |
| Hotels, Restaurants & Leisure | 14.5 |
| Software | 11.2 |
| Pharmaceuticals | 8.7 |
| Media | 5.7 |
| Life Sciences Tools & Services | 3.7 |
| Food & Staples Retailing | 3.6 |
| Insurance | 3.3 |
| Professional Services | 3.2 |
| Diversified Telecommunication Services | 3.1 |
| Diversified Financial Services | 3.0 |
| Containers & Packaging | 2.7 |
| Health Care Equipment & Supplies | 1.8 |
| Commercial Services & Supplies | 1.7 |
| Oil, Gas & Consumable Fuels | 1.7 |
| Wireless Telecommunication Services | 1.6 |
| Building Products | 1.6 |
| Food Products | 1.5 |
| Specialty Retail | 1.4 |
| Capital Markets | 1.1 |
| Auto Components | 1.1 |
| Electric Utilities | 0.9 |
| Diversified Consumer Services | 0.8 |
| Industrial Conglomerates | 0.8 |
| Metals & Mining | 0.7 |
| Technology Hardware, Storage & Peripherals | 0.7 |
| Equity Real Estate Investment Trusts | 0.6 |
| Chemicals | 0.5 |
| Road & Rail | 0.4 |
| Aerospace & Defense | 0.3 |
| Automobiles | 0.3 |
| Real Estate Management & Development | 0.2 |
| Machinery | 0.1 |
| Trading Companies & Distributors | 0.1 |
| IT Services | 0.1 |
| Consumer Finance | 0.0* |
| Construction & Engineering | 0.0* |
| Independent Power and Renewable Electricity Producers | 0.0* |
| Construction Materials | 0.0* |
| Total | 100.0% |
| * | Amount is less than 0.1%. |
| Dividend Distributions | A Shares | C Shares | I Shares |
| Current Monthly Distribution per Share(3) | $0.0759 | $0.0635 | $0.0800 |
| Current Distribution Rate on NAV(4) | 4.61% | 3.86% | 4.85% |
| (1) | The ratings are by Standard & Poor’s. A credit rating is an assessment provided by a nationally recognized statistical rating organization (NRSRO) of the creditworthiness of an issuer with respect to its debt obligations. Ratings are measured on a scale that generally ranges from AAA (highest) to D (lowest). Investment grade is defined as those issuers that have a long-term credit rating of BBB- or higher. The credit ratings shown relate to the creditworthiness of the issuers of the underlying securities in the Fund, and not the Fund or its shares. Credit ratings are subject to change. |
| (2) | Percentages are based on long-term positions. Money market funds are excluded. |
| (3) | Most recent distribution paid or declared through 4/30/2018. Subject to change in the future. |
| (4) | Distribution rates are calculated by annualizing the most recent distribution paid or declared through the report date and then dividing by NAV as of 4/30/2018. Subject to change in the future. |
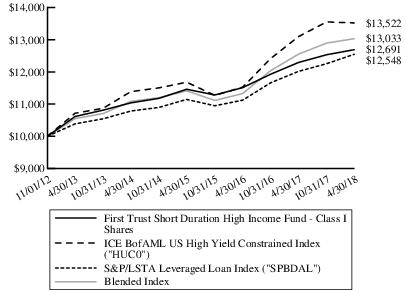
| Performance as of April 30, 2018 | ||||||||||||||||||||||
| A Shares Inception 11/1/2012 | C Shares Inception 11/1/2012 | I Shares Inception 11/1/2012 | Blended Index* | HUC0* | SPBDAL* | |||||||||||||||||
| Cumulative Total Returns | w/o sales charge | w/max 3.50% sales charge | w/o sales charge | w/max 1.00% contingent deferred sales charge | w/o sales charge | w/o sales charges | w/o sales charges | w/o sales charges | ||||||||||||||
| 6 Months | 1.14% | (2.42)% | 0.77% | (0.22)% | 1.32% | 1.07% | (0.23)% | 2.39% | ||||||||||||||
| 1 Year | 2.99% | (0.62)% | 2.22% | 1.24% | 3.30% | 3.85% | 3.25% | 4.43% | ||||||||||||||
| Average Annual Total Returns | ||||||||||||||||||||||
| 5 Years | 3.37% | 2.64% | 2.59% | 2.59% | 3.64% | 4.33% | 4.77% | 3.86% | ||||||||||||||
| Since Inception | 4.17% | 3.49% | 3.39% | 3.39% | 4.43% | 4.94% | 5.65% | 4.22% | ||||||||||||||
| 30-Day SEC Yield(6) | 3.84% | 3.23% | 4.23% | N/A | N/A | N/A | ||||||||||||||||
| (5) | The Blended Index return is a 50/50 split between the ICE BofAML US High Yield Constrained Index and the S&P/LSTA Leveraged Loan Index returns. |
| (6) | 30-day SEC yield is calculated by dividing the net investment income per share earned during the most recent 30-day period by the maximum offering price per share on the last day of the period. The reported SEC yields are subsidized. The subsidized yields reflect the waiver and/or a reimbursement of Fund expenses, which has the effect of lowering the Fund’s expense ratio and generating a higher yield. |
| Actual Expenses | Hypothetical (5% Return Before Expenses) | ||||||||
| Beginning Account Value 11/1/2017 | Ending Account Value 4/30/2018 | Expenses Paid During Period 11/1/2017 - 4/30/2018 (a) | Beginning Account Value 11/1/2017 | Ending Account Value 4/30/2018 | Expenses Paid During Period 11/1/2017 - 4/30/2018 (a) | Annualized Expense Ratios (b) | |||
| Class A | $ 1,000.00 | $ 1,018.30 | $ 5.86 | $ 1,000.00 | $ 1,018.99 | $ 5.86 | 1.17% | ||
| Class C | 1,000.00 | 1,014.50 | 9.59 | 1,000.00 | 1,015.27 | 9.59 | 1.92 | ||
| Class I | 1,000.00 | 1,019.60 | 4.61 | 1,000.00 | 1,020.23 | 4.61 | 0.92 | ||
| (a) | Expenses are equal to the annualized expense ratios as indicated in the table multiplied by the average account value over the period (November 1, 2017 through April 30, 2018), multiplied by 181/365 (to reflect the six-month period). |
| (b) | These expense ratios reflect expense caps. |
| Principal Value | Description | Rate (a) | Stated Maturity (b) | Value | ||||
| SENIOR FLOATING-RATE LOAN INTERESTS – 67.5% | ||||||||
| Aerospace & Defense – 0.2% | ||||||||
| $507,536 | Transdigm, Inc., Term Loan F, 3 Mo. LIBOR + 2.75%, 0.00% Floor | 5.05% | 06/09/23 | $509,556 | ||||
| Alternative Carriers – 0.5% | ||||||||
| 1,000,000 | Level 3 Financing, Inc., Tranche B 2024 Term Loan, 1 Mo. LIBOR + 2.25%, 0.00% Floor | 4.15% | 02/22/24 | 1,004,170 | ||||
| Application Software – 4.2% | ||||||||
| 923,502 | CCC Information Resources, Inc., Term Loan B, 1 Mo. LIBOR + 3.00%, 1.00% Floor | 4.91% | 03/31/24 | 927,925 | ||||
| 403,229 | Hyland Software, Inc., Term-3 Loans, 3 Mo. PRIME + 2.25%, 0.00% Floor | 7.00% | 07/01/22 | 406,508 | ||||
| 583,796 | Informatica Corp. (Ithacalux S.A.R.L), Term Loan B, 1 Mo. LIBOR + 3.25%, 0.00% Floor | 5.15% | 08/06/22 | 587,719 | ||||
| 2,051,273 | JDA Software Group (RP Crown Parent, Inc.), Term Loan B, 3 Mo. LIBOR + 2.75%, 1.00% Floor | 4.65% | 10/12/23 | 2,063,232 | ||||
| 902,897 | Kronos, Inc., Term Loan B, 2 Mo. LIBOR + 3.00%, 0.00% Floor | 4.88% | 11/01/23 | 910,536 | ||||
| 188,030 | LANDesk Software, Inc., Term Loan B, 1 Mo. LIBOR + 4.25%, 0.00% Floor | 6.16% | 01/18/24 | 185,068 | ||||
| 113,939 | Micro Focus International (MA Finance LLC), MA Finance TLB3, 1 Mo. LIBOR + 2.75%, 0.00% Floor | 4.65% | 06/21/24 | 113,541 | ||||
| 769,461 | Micro Focus International (MA Finance LLC), Seattle Spinco TLB, 1 Mo. LIBOR + 2.75%, 1.00% Floor | 4.65% | 06/21/24 | 766,767 | ||||
| 169,950 | Mitchell International, Inc., Delayed Draw Term Loan (c) | 3.25% (d) | 11/30/24 | 169,845 | ||||
| 2,107,383 | Mitchell International, Inc., Term Loan B, 1 Mo. LIBOR + 3.25%, 0.00% Floor | 5.15% | 11/30/24 | 2,106,076 | ||||
| 340,286 | Qlik Technologies (Project Alpha Intermediate Holdings, Inc.), Term Loan B, 6 Mo. LIBOR + 3.50%, 0.00% Floor | 5.99% | 04/26/24 | 339,010 | ||||
| 8,576,227 | ||||||||
| Asset Management & Custody Banks – 0.6% | ||||||||
| 357,300 | First Eagle Investment Management, Term Loan B, 3 Mo. LIBOR + 3.00%, 0.75% Floor | 5.30% | 12/01/22 | 360,205 | ||||
| 397,320 | HarbourVest Partners L.P., Term Loan B, 3 Mo. LIBOR + 2.25%, 0.00% Floor | 4.55% | 02/28/25 | 397,153 | ||||
| 477,946 | Victory Capital Holdings (VCH Holdings LLC), Term Loan B, 3 Mo. LIBOR + 2.75%, 0.00% Floor | 5.05% | 02/15/25 | 481,531 | ||||
| 1,238,889 | ||||||||
| Auto Parts & Equipment – 1.1% | ||||||||
| 1,777,760 | Gates Global LLC, Term Loan B, 3 Mo. LIBOR + 2.75%, 1.00% Floor | 5.05% | 03/31/24 | 1,787,164 | ||||
| 388,743 | Tower Automotive Holdings USA LLC, Term Loan B, 1 Mo. LIBOR + 2.75%, 1.50% Floor | 4.69% | 03/06/24 | 389,715 | ||||
| 2,176,879 | ||||||||
| Broadcasting – 0.1% | ||||||||
| 44,109 | Cumulus Media Holdings, Inc., Term Loan, 1 Mo. LIBOR + 3.25%, 1.25% Floor (e) | 5.16% | 12/23/20 | 37,184 | ||||
| 251,255 | Tribune Media Co., Extended Term Loan C, 1 Mo. LIBOR + 3.00%, 0.75% Floor | 4.90% | 01/27/24 | 251,569 | ||||
| 20,159 | Tribune Media Co., Term B Loan, 1 Mo. LIBOR + 3.00%, 0.75% Floor | 4.90% | 12/27/20 | 20,159 | ||||
| 308,912 | ||||||||
| Principal Value | Description | Rate (a) | Stated Maturity (b) | Value | ||||
| SENIOR FLOATING-RATE LOAN INTERESTS (Continued) | ||||||||
| Building Products – 1.1% | ||||||||
| $86,913 | Beacon Roofing Supply, Term Loan B, 2 Mo. LIBOR + 2.25%, 0.00% Floor | 4.13% | 01/02/25 | $87,379 | ||||
| 2,250,874 | Quikrete Holdings, Inc., Term Loan B, 1 Mo. LIBOR + 2.75%, 0.00% Floor | 4.65% | 11/15/23 | 2,259,315 | ||||
| 2,346,694 | ||||||||
| Cable & Satellite – 0.2% | ||||||||
| 380,357 | Cablevision Systems Corp. (CSC Holdings, Inc.), New Term Loan B, 1 Mo. LIBOR + 2.50%, 0.00% Floor | 4.40% | 01/31/26 | 380,357 | ||||
| 130,000 | Virgin Media Finance PLC, Term Loan K, 1 Mo. LIBOR + 2.50%, 0.00% Floor | 4.40% | 01/15/26 | 130,555 | ||||
| 510,912 | ||||||||
| Casinos & Gaming – 6.5% | ||||||||
| 5,101,689 | Amaya Holdings B.V., Term Loan B, 3 Mo. LIBOR + 3.00%, 0.00% Floor | 5.32% | 03/28/25 | 5,118,065 | ||||
| 134,064 | Aristocrat Technologies, Incremental 2024 Term Loan, 3 Mo. LIBOR + 2.00%, 0.00% Floor | 4.36% | 09/30/24 | 134,734 | ||||
| 4,389,000 | Caesars Resort Collection LLC, Term Loan B, 1 Mo. LIBOR + 2.75%, 0.00% Floor | 4.65% | 12/22/24 | 4,423,761 | ||||
| 738,374 | Golden Nugget, Term Loan B, 2 Mo. LIBOR + 2.75%, 0.75% Floor | 4.65% | 10/04/23 | 744,310 | ||||
| 515,636 | MGM Growth Properties Operating Partnership L.P., Term Loan B, 1 Mo. LIBOR + 2.00%, 0.00% Floor | 3.90% | 03/31/25 | 518,297 | ||||
| 217,093 | Penn National Gaming, Inc., Term Loan B, 1 Mo. LIBOR + 2.50%, 0.75% Floor | 4.40% | 01/19/24 | 218,721 | ||||
| 764,211 | Station Casinos, Inc., Term Loan B, 1 Mo. LIBOR + 2.50%, 0.75% Floor | 4.41% | 06/08/23 | 766,519 | ||||
| 1,486,119 | VICI Properties (Caesars), Term Loan B, 1 Mo. LIBOR + 2.00%, 0.00% Floor | 3.90% | 12/31/24 | 1,491,276 | ||||
| 13,415,683 | ||||||||
| Coal & Consumable Fuels – 0.2% | ||||||||
| 231,309 | Arch Coal, Inc., Term Loan, 1 Mo. LIBOR + 2.75%, 1.00% Floor | 4.65% | 03/07/24 | 231,092 | ||||
| 126,760 | Peabody Energy Corp., Term Loan, 1 Mo. LIBOR + 2.75%, 0.00% Floor | 4.65% | 03/31/25 | 126,973 | ||||
| 358,065 | ||||||||
| Commercial Printing – 0.2% | ||||||||
| 378,669 | Multi-Color Corp., Term Loan B, 1 Mo. LIBOR + 2.25%, 0.00% Floor | 4.15% | 11/01/24 | 380,248 | ||||
| Construction & Engineering – 0.0% | ||||||||
| 73,074 | Pike Electric, Inc., Term Loan B, 1 Mo. LIBOR + 3.50%, 1.00% Floor | 5.41% | 03/31/25 | 73,957 | ||||
| Diversified Chemicals – 0.1% | ||||||||
| 183,750 | Ineos US Finance LLC, Term Loan B, 1 Mo. LIBOR + 2.00%, 0.00% Floor | 3.90% | 03/31/24 | 184,235 | ||||
| Diversified Support Services – 0.9% | ||||||||
| 1,714,312 | Brickman Group Holdings, Inc, Initial Term Loan (First Lien), 1 Mo. LIBOR + 3.00%, 1.00% Floor | 4.89% | 12/18/20 | 1,723,107 | ||||
| 179,641 | Brickman Group Holdings, Inc, Second Lien Term Loan, 1 Mo. LIBOR + 6.50%, 1.00% Floor | 8.39% | 12/18/21 | 180,538 | ||||
| 1,903,645 | ||||||||
| Principal Value | Description | Rate (a) | Stated Maturity (b) | Value | ||||
| SENIOR FLOATING-RATE LOAN INTERESTS (Continued) | ||||||||
| Electric Utilities – 0.7% | ||||||||
| $748,854 | Dayton Power & Light Co., Term Loan B, 3 Mo. LIBOR + 2.00%, 0.75% Floor | 3.91% | 08/24/22 | $751,977 | ||||
| 768,056 | Vistra Energy Corp. (TXU), Term Loan B-2, 2 Mo. LIBOR + 2.25%, 0.00% Floor | 4.15% | 12/14/23 | 772,856 | ||||
| 1,524,833 | ||||||||
| Environmental & Facilities Services – 0.5% | ||||||||
| 250,000 | Servicemaster Company LLC, Tranche C Term Loan, 1 Mo. LIBOR + 2.50%, 0.00% Floor | 4.40% | 11/02/23 | 251,563 | ||||
| 680,733 | WTG Holdings III Corp. (EWT Holdings III Corp.), Term Loan B, 3 Mo. LIBOR + 3.00%, 0.00% Floor | 5.30% | 12/31/24 | 685,273 | ||||
| 936,836 | ||||||||
| Food Distributors – 0.3% | ||||||||
| 247,500 | TKC Holdings, Inc., Term Loan B, 1 Mo. LIBOR + 4.25%, 0.00% Floor | 6.16% | 01/31/23 | 249,418 | ||||
| 294,750 | US Foods, Inc., Term Loan B, 1 Mo. LIBOR + 2.50%, 0.00% Floor | 4.40% | 06/27/23 | 297,255 | ||||
| 546,673 | ||||||||
| Food Retail – 1.4% | ||||||||
| 949,607 | Albertson’s LLC, Term Loan B5, 3 Mo. LIBOR + 3.00%, 0.75% Floor | 5.29% | 12/21/22 | 941,896 | ||||
| 2,050,757 | Albertson’s LLC, Term Loan B6, 3 Mo. LIBOR + 3.00%, 0.75% Floor | 4.96% | 06/22/23 | 2,027,686 | ||||
| 2,969,582 | ||||||||
| Health Care Equipment – 0.6% | ||||||||
| 1,140,568 | DJO Finance LLC (ReAble Therapeutics Finance LLC), Initial Term Loan , 3 Mo. LIBOR + 3.25%, 1.00% Floor | 5.56% | 06/08/20 | 1,145,199 | ||||
| 99,250 | Kinetic Concepts, Inc. (Acelity L.P., Inc.), Term Loan B, 3 Mo. LIBOR + 3.25%, 1.00% Floor | 5.55% | 01/31/24 | 99,845 | ||||
| 1,245,044 | ||||||||
| Health Care Facilities – 1.9% | ||||||||
| 195,393 | Acadia Healthcare Co., Inc., Term Loan B3, 1 Mo. LIBOR + 2.50%, 0.00% Floor | 4.40% | 02/11/22 | 197,185 | ||||
| 119,267 | Acadia Healthcare Co., Inc., Term Loan B4, 1 Mo. LIBOR + 2.50%, 0.00% Floor | 4.40% | 02/16/23 | 120,360 | ||||
| 1,772,701 | CHS/Community Health Systems, Inc., Incremental 2021 Term H Loan, 2 Mo. LIBOR + 3.25%, 1.00% Floor | 5.23% | 01/27/21 | 1,718,049 | ||||
| 209,466 | CHS/Community Health Systems, Inc., Term Loan G, 2 Mo. LIBOR + 3.00%, 1.00% Floor | 4.98% | 12/06/19 | 205,997 | ||||
| 508,777 | Concentra, Inc. (MJ Acquisition Corp.), Term Loan B, 3 Mo. LIBOR + 2.75%, 1.00% Floor | 4.53% | 06/01/22 | 513,015 | ||||
| 864,350 | Kindred Healthcare, Inc., New Term Loan, 3 Mo. LIBOR + 3.50%, 1.00% Floor | 5.88% | 04/09/21 | 865,431 | ||||
| 237,453 | National Veterinary Associates (NVA Holdings, Inc.), Term Loan B3, 3 Mo. LIBOR + 2.75%, 1.00% Floor | 5.05% | 01/29/25 | 238,343 | ||||
| 3,858,380 | ||||||||
| Health Care Services – 5.5% | ||||||||
| 941,711 | 21st Century Oncology, Tranche B Term Loan, 3 Mo. LIBOR + 6.13%, 1.00% Floor | 8.48% | 01/16/23 | 903,101 | ||||
| 62,244 | Air Medical Group, 2018 New Term Loan, 1 Mo. LIBOR + 4.25%, 1.00% Floor | 6.15% | 03/14/25 | 62,893 | ||||
| Principal Value | Description | Rate (a) | Stated Maturity (b) | Value | ||||
| SENIOR FLOATING-RATE LOAN INTERESTS (Continued) | ||||||||
| Health Care Services (Continued) | ||||||||
| $98,255 | Air Medical Group Holdings, Inc., Term Loan B, 1 Mo. LIBOR + 3.25%, 1.00% Floor | 5.13% | 04/28/22 | $98,697 | ||||
| 820,619 | Air Methods Corp. (ASP AMC Intermediate Holdings, Inc.), Term Loan B, 3 Mo. LIBOR + 3.50%, 1.00% Floor | 5.80% | 04/30/24 | 822,925 | ||||
| 419,409 | CHG Healthcare Services, Inc., Term Loan, 2 Mo. LIBOR + 3.00%, 1.00% Floor | 5.06% | 06/07/23 | 422,731 | ||||
| 1,101,605 | Curo Health Services Holdings, Inc., Term Loan B, 3 Mo. LIBOR + 4.00%, 1.00% Floor | 5.81% | 02/05/22 | 1,104,359 | ||||
| 1,121,651 | DuPage Medical Group (Midwest Physician), Term Loan B, 1 Mo. LIBOR + 2.75%, 0.75% Floor | 4.65% | 08/15/24 | 1,121,651 | ||||
| 894,560 | Envision Healthcare Corp., Term Loan B, 1 Mo. LIBOR + 3.00%, 1.00% Floor | 4.91% | 12/01/23 | 897,467 | ||||
| 244,447 | ExamWorks Group, Inc., Term Loan B, 1 Mo. LIBOR + 3.25%, 0.00% Floor | 5.15% | 07/27/23 | 246,280 | ||||
| 1,287,271 | Healogics, Inc. (CDRH Parent, Inc.), Initial Term Loan (First Lien), 3 Mo. LIBOR + 4.25%, 0.00% Floor | 6.28% | 07/01/21 | 1,149,701 | ||||
| 1,023,429 | Surgery Centers Holdings, Inc., Term Loan B, 1 Mo. LIBOR + 3.25%, 0.00% Floor | 5.16% | 08/31/24 | 1,025,025 | ||||
| 2,031,059 | Team Health, Inc., Term Loan B, 1 Mo. LIBOR + 2.75%, 0.00% Floor | 4.65% | 02/06/24 | 1,965,049 | ||||
| 1,513,276 | U.S. Renal Care, Inc., Term Loan B, 3 Mo. LIBOR + 4.25%, 1.00% Floor | 6.55% | 12/30/22 | 1,505,709 | ||||
| 11,325,588 | ||||||||
| Health Care Technology – 0.5% | ||||||||
| 991,787 | Change Healthcare Holdings, Inc., Term Loan B, 1 Mo. LIBOR + 2.75%, 1.00% Floor | 4.65% | 03/01/24 | 995,506 | ||||
| Hotels, Resorts & Cruise Lines – 0.3% | ||||||||
| 579,871 | Wyndham Hotels & Resorts, Term Loan B, 1 Mo. LIBOR + 1.75%, 0.00% Floor | 3.73% | 03/28/25 | 584,151 | ||||
| Household Appliances – 0.5% | ||||||||
| 63,140 | Traeger Grills, Delayed Draw Term Loan (c) | 4.25% (d) | 09/25/24 | 63,456 | ||||
| 546,766 | Traeger Grills, Incremental Term Loan , 1 Mo. LIBOR + 4.25%, 1.00% Floor | 6.15% | 09/25/24 | 549,500 | ||||
| 401,510 | Traeger Grills, Term Loan B, 1 Mo. LIBOR + 4.25%, 1.00% Floor | 6.15% | 09/25/24 | 403,517 | ||||
| 1,016,473 | ||||||||
| Human Resource & Employment Services – 0.2% | ||||||||
| 425,357 | Tempo Acquisition, Term Loan B, 1 Mo. LIBOR + 3.00%, 0.00% Floor | 4.90% | 05/01/24 | 427,663 | ||||
| Hypermarkets & Super Centers – 1.7% | ||||||||
| 3,027,041 | BJ’s Wholesale Club, Inc., 1st Lien Term Loan, 1 Mo. LIBOR + 3.50%, 1.00% Floor | 5.39% | 01/31/24 | 3,038,696 | ||||
| 363,261 | BJ’s Wholesale Club, Inc., 2nd Lien Term Loan, 1 Mo. LIBOR + 7.50%, 1.00% Floor | 9.39% | 02/03/25 | 366,439 | ||||
| 3,405,135 | ||||||||
| Industrial Conglomerates – 0.7% | ||||||||
| 1,502,604 | Gardner Denver, Inc., Term Loan B, 3 Mo. LIBOR + 2.75%, 0.00% Floor | 5.05% | 07/30/24 | 1,510,688 | ||||
| Insurance Brokers – 3.2% | ||||||||
| 1,647,641 | Amwins Group LLC,, Term Loan B (First Lien), 1 Mo. LIBOR + 2.75%, 1.00% Floor | 4.64%-4.65% | 01/31/24 | 1,657,329 | ||||
| Principal Value | Description | Rate (a) | Stated Maturity (b) | Value | ||||
| SENIOR FLOATING-RATE LOAN INTERESTS (Continued) | ||||||||
| Insurance Brokers (Continued) | ||||||||
| $2,473,125 | HUB International Ltd., Term Loan B, 2 Mo. LIBOR + 3.00%, 0.00% Floor | 5.36% | 04/25/25 | $2,487,543 | ||||
| 750,106 | National Financial Partners Corp., Term Loan B, 1 Mo. LIBOR + 3.00%, 0.00% Floor | 4.90% | 01/06/24 | 753,077 | ||||
| 1,618,990 | USI, Inc. (Compass Investors, Inc.), Term Loan B, 3 Mo. LIBOR + 3.00%, 0.00% Floor | 5.30% | 05/15/24 | 1,624,381 | ||||
| 6,522,330 | ||||||||
| Integrated Telecommunication Services – 1.6% | ||||||||
| 2,692,589 | Century Link (Qwest), Term Loan B, 1 Mo. LIBOR + 2.75%, 0.00% Floor | 4.65% | 01/31/25 | 2,651,069 | ||||
| 554,254 | Numericable U.S. LLC (Altice France S.A.), Term Loan B12, 3 Mo. LIBOR + 3.00%, 0.00% Floor | 5.35% | 01/06/26 | 545,508 | ||||
| 3,196,577 | ||||||||
| Leisure Facilities – 1.9% | ||||||||
| 2,456,004 | ClubCorp Club Operations, Term Loan B, 2 Mo. LIBOR + 2.75%, 0.00% Floor | 4.89% | 09/18/24 | 2,460,622 | ||||
| 1,368,039 | Planet Fitness Holdings LLC, 2016 Term Loans, 3 Mo. LIBOR + 2.75%, 1.00% Floor | 5.05% | 03/31/21 | 1,377,451 | ||||
| 3,838,073 | ||||||||
| Life Sciences Tools & Services – 2.3% | ||||||||
| 253,875 | Immucor, Inc., Term Loan B (First Lien), 3 Mo. LIBOR + 5.00%, 0.00% Floor | 7.30% | 07/30/21 | 259,269 | ||||
| 1,040,149 | Ortho-Clinical Diagnostics, Inc. (Crimson Merger Sub, Inc.), Initial Term Loan, 1 Mo. LIBOR + 3.75%, 0.00% Floor | 5.65% | 06/30/21 | 1,046,650 | ||||
| 543,915 | Parexel (West Street Merger), Term Loan B, 1 Mo. LIBOR + 2.75%, 0.00% Floor | 4.65% | 09/27/24 | 545,618 | ||||
| 962,240 | Pharmaceutical Product Development, Inc., Term Loan B, 3 Mo. LIBOR + 2.50%, 1.00% Floor | 4.80% | 08/18/22 | 967,157 | ||||
| 1,895,707 | Sterigenics International (STHI Intermediate Holding Corp.), Term Loan B, 1 Mo. LIBOR + 3.00%, 0.00% Floor | 4.90% | 05/15/22 | 1,905,186 | ||||
| 4,723,880 | ||||||||
| Managed Health Care – 1.2% | ||||||||
| 1,186,756 | Davis Vision (Wink Holdco, Inc.), Initial Term Loan, 1 Mo. LIBOR + 3.00%, 1.00% Floor | 4.90% | 12/02/24 | 1,181,938 | ||||
| 1,359,866 | MultiPlan, Inc. (MPH Acquisition Holdings LLC), Term Loan B, 3 Mo. LIBOR + 2.75%, 1.00% Floor | 5.05% | 06/07/23 | 1,366,475 | ||||
| 2,548,413 | ||||||||
| Metal & Glass Containers – 0.5% | ||||||||
| 971,399 | Berlin Packaging LLC, Term Loan B, 1 Mo. LIBOR + 3.25%, 1.00% Floor | 5.14% | 10/01/21 | 972,205 | ||||
| 75,308 | Crown Holdings, Term Loan B, 3 Mo. LIBOR + 2.00%, 0.00% Floor | 4.31% | 01/19/25 | 75,921 | ||||
| 1,048,126 | ||||||||
| Movies & Entertainment – 0.6% | ||||||||
| 760,000 | Cineworld Group PLC (Crown), Term Loan B, 1 Mo. LIBOR + 2.50%, 0.00% Floor | 4.40% | 02/05/25 | 758,814 | ||||
| 444,386 | Creative Artists Agency LLC (CAA Holdings LLC), Term Loan B, 1 Mo. LIBOR + 3.00%, 0.00% Floor | 4.90% | 02/15/24 | 447,164 | ||||
| 1,205,978 | ||||||||
| Principal Value | Description | Rate (a) | Stated Maturity (b) | Value | ||||
| SENIOR FLOATING-RATE LOAN INTERESTS (Continued) | ||||||||
| Oil & Gas Exploration & Production – 0.0% | ||||||||
| $66,667 | Ascent Resources - Marcellus LLC, EXIT Term Loan B, 3 Mo. PRIME + 5.50%, 1.00% Floor | 10.25% | 03/30/23 | $66,667 | ||||
| Other Diversified Financial Services – 2.9% | ||||||||
| 2,930,821 | AlixPartners LLP, Term Loan B, 3 Mo. LIBOR + 2.75%, 0.00% Floor | 5.05% | 04/04/24 | 2,943,189 | ||||
| 2,035,581 | Duff & Phelps Corp. (Deerfield Dakota), Restatement Term Loan, 3 Mo. LIBOR + 3.25%, 1.00% Floor | 5.55% | 02/13/25 | 2,037,270 | ||||
| 179,101 | iPayment, Inc., Term Loan B, 6 Mo. LIBOR + 5.00%, 1.00% Floor | 6.62% | 04/11/23 | 179,773 | ||||
| 786,000 | Wex, Inc., Term Loan B, 1 Mo. LIBOR + 2.25%, 0.00% Floor | 4.15% | 07/01/23 | 790,692 | ||||
| 5,950,924 | ||||||||
| Packaged Foods & Meats – 1.0% | ||||||||
| 500,082 | Hostess Brands LLC (HB Holdings), Term Loan B, 1 Mo. LIBOR + 2.25%, 0.75% Floor | 4.15% | 08/03/22 | 503,707 | ||||
| 1,651,387 | Post Holdings, Inc., Term Loan B, 1 Mo. LIBOR + 2.00%, 0.00% Floor | 3.90% | 05/24/24 | 1,658,472 | ||||
| 2,162,179 | ||||||||
| Paper Packaging – 1.7% | ||||||||
| 3,452,575 | Reynolds Group Holdings, Inc., U.S. Term Loan, 1 Mo. LIBOR + 2.75%, 0.00% Floor | 4.65% | 02/05/23 | 3,474,153 | ||||
| Pharmaceuticals – 5.5% | ||||||||
| 330,206 | Akorn, Inc., Loan, 1 Mo. LIBOR + 4.25%, 1.00% Floor | 6.19% | 04/16/21 | 323,602 | ||||
| 1,628,353 | Amneal Pharmaceuticals LLC, Term Loan B, 1 Mo. LIBOR + 3.50%, 1.00% Floor | 5.40% | 11/01/19 | 1,633,108 | ||||
| 1,116,035 | Catalent Pharma Solutions, Inc., Term Loan B, 2 Mo. LIBOR + 2.25%, 1.00% Floor | 4.15% | 05/20/24 | 1,120,399 | ||||
| 1,345,028 | Concordia Healthcare Corp., Initial Dollar Term Loan, 1 Mo. LIBOR + 4.25%, 1.00% Floor (e) | 6.15% | 10/21/21 | 1,215,111 | ||||
| 1,834,200 | Endo LLC, Term Loan B, 1 Mo. LIBOR + 4.25%, 0.75% Floor | 6.19% | 04/29/24 | 1,822,736 | ||||
| 498,741 | Grifols Worldwide Operation, Term Loan B, 1 Mo. LIBOR + 2.25%, 0.00% Floor | 3.99% | 01/31/25 | 501,234 | ||||
| 2,167,134 | Horizon Pharma, Inc., Term Loan B, 1 Mo. LIBOR + 3.25%, 1.00% Floor | 5.19% | 03/29/24 | 2,182,477 | ||||
| 242,718 | Mallinckrodt International Finance S.A., 2018 Incremental Term Loan, 1 Mo. LIBOR + 3.00%, 0.75% Floor | 4.82% | 02/24/25 | 242,233 | ||||
| 242,718 | Mallinckrodt International Finance S.A., Term Loan B, 6 Mo. LIBOR + 2.75%, 0.75% Floor | 5.20% | 09/24/24 | 240,595 | ||||
| 2,105,129 | Valeant Pharmaceuticals International, Inc., Series F-1, Tranche B Term Loan, 1 Mo. LIBOR + 3.50%, 0.75% Floor | 5.39% | 04/01/22 | 2,127,507 | ||||
| 11,409,002 | ||||||||
| Research & Consulting Services – 2.8% | ||||||||
| 1,476,680 | Acosta, Inc.,, Term Loan B, 1 Mo. LIBOR + 3.25%, 1.00% Floor | 5.15% | 09/26/21 | 1,204,203 | ||||
| 2,067,460 | Advantage Sales & Marketing, Inc., Initial Term Loan (First Lien), 1 Mo. LIBOR + 3.25%, 1.00% Floor | 5.15% | 07/23/21 | 1,974,859 | ||||
| 957,588 | Advantage Sales & Marketing, Inc., Term Loan B2, 1 Mo. LIBOR + 3.25%, 1.00% Floor | 5.15% | 07/23/21 | 915,243 | ||||
| 1,683,000 | Information Resources, Inc., Term Loan B, 3 Mo. LIBOR + 4.25%, 1.00% Floor | 6.19% | 01/18/24 | 1,696,144 | ||||
| 5,790,449 | ||||||||
| Principal Value | Description | Rate (a) | Stated Maturity (b) | Value | ||||
| SENIOR FLOATING-RATE LOAN INTERESTS (Continued) | ||||||||
| Restaurants – 1.8% | ||||||||
| $152,400 | IRB Holding Corporation (Arby’s), Term Loan B, 2 Mo. LIBOR + 3.25%, 1.00% Floor | 5.25% | 01/18/25 | $154,020 | ||||
| 1,000,000 | Portillo’s Holdings LLC, Second Lien Term Loan, 3 Mo. LIBOR + 8.00%, 1.00% Floor | 10.30% | 08/15/22 | 1,000,000 | ||||
| 2,561,901 | Portillo’s Holdings LLC, Term B Loan (First Lien), 3 Mo. LIBOR + 4.50%, 1.00% Floor | 6.80% | 08/02/21 | 2,581,116 | ||||
| 3,735,136 | ||||||||
| Retail REITs – 0.6% | ||||||||
| 1,134,594 | Capital Automotive LLC, 2nd Lien Term Loan, 1 Mo. LIBOR + 6.00%, 1.00% Floor | 7.91% | 03/24/25 | 1,145,940 | ||||
| Security & Alarm Services – 0.3% | ||||||||
| 537,316 | Garda World Security Corp., Term Loan B, 3 Mo. LIBOR + 3.50%, 1.00% Floor | 5.51% | 05/26/24 | 542,689 | ||||
| Specialized Consumer Services – 0.8% | ||||||||
| 250,000 | Asurion LLC, Term Loan (Second Lien), 1 Mo. LIBOR + 6.00%, 0.00% Floor | 7.90% | 07/31/25 | 256,750 | ||||
| 265,397 | Asurion LLC, Term Loan B4, 1 Mo. LIBOR + 2.75%, 1.00% Floor | 4.65% | 08/04/22 | 267,098 | ||||
| 1,042,714 | Asurion LLC, Term Loan B6, 1 Mo. LIBOR + 2.75%, 0.00% Floor | 4.65% | 11/03/23 | 1,049,888 | ||||
| 1,573,736 | ||||||||
| Specialized Finance – 0.1% | ||||||||
| 111,750 | Alliant Holdings, Term Loan B, 4 Mo. LIBOR + 3.00%, 0.00% Floor | 4.93% | 05/15/25 | 112,349 | ||||
| Specialty Chemicals – 0.4% | ||||||||
| 708,221 | H.B. Fuller Co., Term Loan B, 1 Mo. LIBOR + 2.00%, 0.00% Floor | 3.90% | 10/20/24 | 710,119 | ||||
| 75,432 | Platform Specialty Products Corp. (fka: Macdermid, Inc.), Term Loan B6, 1 Mo. LIBOR + 3.00%, 1.00% Floor | 4.90% | 06/07/23 | 75,922 | ||||
| 786,041 | ||||||||
| Specialty Stores – 0.7% | ||||||||
| 679,626 | Party City Holdings, Inc., Term Loan B, 2 Mo. LIBOR + 2.75%, 1.00% Floor | 4.75% | 08/19/22 | 683,452 | ||||
| 969,505 | Toys "R" US-Delaware, Inc., Term B-2 Loan, 3 Mo. PRIME + 2.75%, 1.50% Floor (e) (f) | 7.25% | 05/25/18 | 358,717 | ||||
| 745,923 | Toys "R" US-Delaware, Inc., Term B-4 Loan, 3 Mo. PRIME + 7.75%, 1.00% Floor (e) (f) | 12.25% | 04/25/20 | 329,004 | ||||
| 166,667 | Toys "R" US-Delaware, Inc., Term Loan B-3, 3 Mo. PRIME + 2.75%, 1.50% Floor (e) (f) | 7.25% | 05/25/18 | 61,667 | ||||
| 1,432,840 | ||||||||
| Systems Software – 6.1% | ||||||||
| 340,688 | Applied Systems, Inc., 1st Lien Term Loan, 3 Mo. LIBOR + 3.25%, 1.00% Floor | 5.55% | 09/13/24 | 343,563 | ||||
| 234,945 | Applied Systems, Inc., 2nd Lien Term Loan, 3 Mo. LIBOR + 7.00%, 1.00% Floor | 9.30% | 09/13/25 | 242,228 | ||||
| 829,437 | Avast Software B.V. (Sybil Software LLC), Term Loan B, 3 Mo. LIBOR + 2.75%, 1.00% Floor | 5.05% | 09/30/23 | 833,352 | ||||
| 4,736,465 | BMC Software Finance, Inc., Term Loan B, 1 Mo. LIBOR + 3.25%, 0.00% Floor | 5.15% | 09/10/22 | 4,752,521 | ||||
| 2,400,783 | Compuware Corp., Term Loan B3, 1 Mo. LIBOR + 3.50%, 1.00% Floor | 5.40% | 12/15/21 | 2,428,993 | ||||
| Principal Value | Description | Rate (a) | Stated Maturity (b) | Value | ||||
| SENIOR FLOATING-RATE LOAN INTERESTS (Continued) | ||||||||
| Systems Software (Continued) | ||||||||
| $768,405 | Misys Financial Software Ltd. (Almonde, Inc.), Term Loan B, 3 Mo. LIBOR + 3.50%, 1.00% Floor | 5.48% | 06/13/24 | $767,622 | ||||
| 245,638 | Riverbed Technology, Inc., Term Loan B, 1 Mo. LIBOR + 3.25%, 0.00% Floor | 5.16% | 04/24/22 | 244,513 | ||||
| 1,274,033 | SS&C European Holdings, S.A.R.L, Term Loan B-3, 1 Mo. LIBOR + 2.50%, 0.00% Floor | 4.40% | 03/15/25 | 1,281,995 | ||||
| 471,379 | SS&C European Holdings, S.A.R.L, Term Loan B-4, 1 Mo. LIBOR + 2.50%, 0.00% Floor | 4.40% | 03/15/25 | 474,325 | ||||
| 1,263,336 | Vertafore, Inc., Term Loan B, 1 Mo. LIBOR + 3.25%, 1.00% Floor | 5.15% | 06/30/23 | 1,272,812 | ||||
| 12,641,924 | ||||||||
| Technology Hardware, Storage & Peripherals – 0.4% | ||||||||
| 768,070 | Dell, Inc. (Diamond 1 Finance Corp.), Term Loan B, 1 Mo. LIBOR + 2.00%, 0.75% Floor | 3.91% | 09/07/23 | 770,228 | ||||
| Wireless Telecommunication Services – 0.4% | ||||||||
| 760,000 | SBA Communications Corp., Term Loan B, 2 Mo. LIBOR + 2.00%, 0.00% Floor | 3.90% | 04/11/25 | 761,794 | ||||
Total Senior Floating-Rate Loan Interests | 138,774,052 | |||||||
| (Cost $140,104,699) | ||||||||
| Principal Value | Description | Stated Coupon | Stated Maturity | Value | ||||
| CORPORATE BONDS AND NOTES – 25.3% | ||||||||
| Aerospace & Defense – 0.0% | ||||||||
| 36,000 | BBA US Holdings, Inc. (g) | 5.38% | 05/01/26 | 36,291 | ||||
| Agricultural Products – 0.1% | ||||||||
| 150,000 | Lamb Weston Holdings, Inc. (g) | 4.63% | 11/01/24 | 149,438 | ||||
| Application Software – 0.2% | ||||||||
| 464,000 | RP Crown Parent LLC (g) | 7.38% | 10/15/24 | 482,560 | ||||
| Automotive Retail – 0.1% | ||||||||
| 155,000 | KAR Auction Services, Inc. (g) | 5.13% | 06/01/25 | 150,738 | ||||
| Broadcasting – 2.5% | ||||||||
| 986,000 | Gray Television, Inc. (g) | 5.13% | 10/15/24 | 942,862 | ||||
| 2,478,000 | Nexstar Broadcasting, Inc. (g) | 5.63% | 08/01/24 | 2,447,025 | ||||
| 1,488,000 | Sinclair Television Group, Inc. (g) | 5.63% | 08/01/24 | 1,476,840 | ||||
| 264,000 | Sinclair Television Group, Inc. (g) | 5.88% | 03/15/26 | 261,690 | ||||
| 5,128,417 | ||||||||
| Building Products – 0.4% | ||||||||
| 500,000 | Cemex Finance LLC (g) | 6.00% | 04/01/24 | 515,250 | ||||
| 70,000 | Standard Industries, Inc. (g) | 5.38% | 11/15/24 | 71,269 | ||||
| 176,000 | Standard Industries, Inc. (g) | 5.00% | 02/15/27 | 170,088 | ||||
| 756,607 | ||||||||
| Cable & Satellite – 0.9% | ||||||||
| 1,553,000 | Altice US Finance I Corp. (g) | 5.50% | 05/15/26 | 1,521,940 | ||||
| 200,000 | Cequel Communications Holdings I LLC/Cequel Capital Corp. (g) | 7.50% | 04/01/28 | 203,750 | ||||
| 131,000 | CSC Holdings LLC (g) | 5.50% | 04/15/27 | 126,061 | ||||
| 1,851,751 | ||||||||
| Casinos & Gaming – 1.7% | ||||||||
| 68,000 | Caesars Resort Collection LLC/CRC Finco, Inc. (g) | 5.25% | 10/15/25 | 65,110 | ||||
| Principal Value | Description | Stated Coupon | Stated Maturity | Value | ||||
| CORPORATE BONDS AND NOTES (Continued) | ||||||||
| Casinos & Gaming (Continued) | ||||||||
| $387,000 | Eldorado Resorts, Inc. | 6.00% | 04/01/25 | $385,549 | ||||
| 1,000,000 | MGM Resorts International | 6.00% | 03/15/23 | 1,048,750 | ||||
| 459,000 | Penn National Gaming, Inc. (g) | 5.63% | 01/15/27 | 440,640 | ||||
| 669,000 | Scientific Games International, Inc. (g) | 5.00% | 10/15/25 | 647,893 | ||||
| 969,000 | Station Casinos LLC (g) | 5.00% | 10/01/25 | 930,240 | ||||
| 3,518,182 | ||||||||
| Computer & Electronics Retail – 0.1% | ||||||||
| 100,000 | Energizer Holdings, Inc. (g) | 5.50% | 06/15/25 | 99,500 | ||||
| Construction Materials – 0.0% | ||||||||
| 16,000 | Summit Materials LLC/Summit Materials Finance Corp. (g) | 5.13% | 06/01/25 | 15,560 | ||||
| Consumer Finance – 0.0% | ||||||||
| 79,000 | FirstCash Financial Services, Inc. (g) | 5.38% | 06/01/24 | 80,580 | ||||
| Diversified Real Estate Activities – 0.2% | ||||||||
| 355,000 | TRI Pointe Group, Inc./TRI Pointe Homes, Inc. | 5.88% | 06/15/24 | 361,656 | ||||
| Environmental & Facilities Services – 0.0% | ||||||||
| 52,000 | Wrangler Buyer Corp. (g) | 6.00% | 10/01/25 | 51,480 | ||||
| Food Retail – 0.1% | ||||||||
| 270,000 | Albertson’s LLC | 5.75% | 03/15/25 | 236,588 | ||||
| Health Care Equipment – 1.2% | ||||||||
| 2,050,000 | DJO Finance LLC/DJO Finance Corp. (g) | 8.13% | 06/15/21 | 2,062,812 | ||||
| 300,000 | Hill-Rom Holdings, Inc. (g) | 5.75% | 09/01/23 | 311,250 | ||||
| 2,374,062 | ||||||||
| Health Care Facilities – 5.6% | ||||||||
| 1,130,000 | Encompass Health Corp. | 5.75% | 11/01/24 | 1,154,013 | ||||
| 100,000 | HCA, Inc. | 5.88% | 05/01/23 | 104,500 | ||||
| 375,000 | HCA, Inc. | 5.38% | 02/01/25 | 374,063 | ||||
| 270,000 | HCA, Inc. | 5.88% | 02/15/26 | 274,050 | ||||
| 1,250,000 | Kindred Healthcare, Inc. | 8.00% | 01/15/20 | 1,345,312 | ||||
| 500,000 | Kindred Healthcare, Inc. | 6.38% | 04/15/22 | 515,625 | ||||
| 2,357,000 | Select Medical Corp. | 6.38% | 06/01/21 | 2,395,301 | ||||
| 500,000 | Tenet Healthcare Corp. | 6.75% | 02/01/20 | 516,875 | ||||
| 1,231,000 | Tenet Healthcare Corp. (g) | 7.50% | 01/01/22 | 1,301,782 | ||||
| 3,339,000 | Tenet Healthcare Corp. | 8.13% | 04/01/22 | 3,489,255 | ||||
| 11,470,776 | ||||||||
| Health Care Services – 0.7% | ||||||||
| 270,000 | Davita, Inc. | 5.13% | 07/15/24 | 262,069 | ||||
| 487,000 | DaVita, Inc. | 5.00% | 05/01/25 | 462,747 | ||||
| 600,000 | Envision Healthcare Corp. | 5.63% | 07/15/22 | 604,500 | ||||
| 83,000 | Mednax, Inc. (g) | 5.25% | 12/01/23 | 82,585 | ||||
| 1,411,901 | ||||||||
| Health Care Technology – 0.6% | ||||||||
| 1,222,000 | Change Healthcare Holdings LLC/Change Healthcare Finance, Inc. (g) | 5.75% | 03/01/25 | 1,199,087 | ||||
| Hotels, Resorts & Cruise Lines – 0.1% | ||||||||
| 160,000 | Hilton Worldwide Finance LLC/Hilton Worldwide Finance Corp. | 4.63% | 04/01/25 | 155,568 | ||||
| Independent Power Producers & Energy Traders – 0.0% | ||||||||
| 62,000 | Calpine Corp. | 5.50% | 02/01/24 | 57,118 | ||||
| Principal Value | Description | Stated Coupon | Stated Maturity | Value | ||||
| CORPORATE BONDS AND NOTES (Continued) | ||||||||
| Industrial Machinery – 0.1% | ||||||||
| $142,000 | SPX Flow, Inc. (g) | 5.63% | 08/15/24 | $144,485 | ||||
| 142,000 | SPX Flow, Inc. (g) | 5.88% | 08/15/26 | 145,550 | ||||
| 290,035 | ||||||||
| Insurance Brokers – 0.0% | ||||||||
| 14,000 | HUB International Ltd. (g) | 7.00% | 05/01/26 | 14,053 | ||||
| Integrated Telecommunication Services – 1.0% | ||||||||
| 1,000,000 | Frontier Communications Corp. | 8.13% | 10/01/18 | 1,015,000 | ||||
| 970,000 | Zayo Group LLC/Zayo Capital, Inc. (g) | 5.75% | 01/15/27 | 965,519 | ||||
| 1,980,519 | ||||||||
| Investment Banking & Brokerage – 0.5% | ||||||||
| 1,050,000 | LPL Holdings, Inc. (g) | 5.75% | 09/15/25 | 1,021,125 | ||||
| IT Consulting & Other Services – 0.1% | ||||||||
| 176,000 | Gartner, Inc. (g) | 5.13% | 04/01/25 | 176,827 | ||||
| Leisure Facilities – 1.1% | ||||||||
| 2,250,000 | Constellation Merger Sub, Inc. (g) | 8.50% | 09/15/25 | 2,205,000 | ||||
| Life Sciences Tools & Services – 1.2% | ||||||||
| 151,000 | inVentiv Group Holdings, Inc./inVentiv Health, Inc./inVentiv Health Clinical, Inc. (g) | 7.50% | 10/01/24 | 161,192 | ||||
| 200,000 | IQVIA, Inc. (g) | 5.00% | 10/15/26 | 198,000 | ||||
| 914,000 | Jaguar Holding Co. II/Pharmaceutical Product Development LLC (g) | 6.38% | 08/01/23 | 927,710 | ||||
| 1,150,000 | Ortho-Clinical Diagnostics, Inc./Ortho-Clinical Diagnostics S.A. (g) | 6.63% | 05/15/22 | 1,144,250 | ||||
| 75,000 | West Street Merger Sub, Inc. (g) | 6.38% | 09/01/25 | 74,063 | ||||
| 2,505,215 | ||||||||
| Managed Health Care – 0.8% | ||||||||
| 100,000 | Centene Corp. | 5.63% | 02/15/21 | 102,875 | ||||
| 170,000 | Centene Corp. | 6.13% | 02/15/24 | 178,500 | ||||
| 1,000,000 | MPH Acquisition Holdings LLC (g) | 7.13% | 06/01/24 | 1,022,500 | ||||
| 282,000 | Polaris Intermediate Corp. (g) (h) | 8.50% | 12/01/22 | 286,935 | ||||
| 140,000 | Wellcare Health Plans, Inc. | 5.25% | 04/01/25 | 141,064 | ||||
| 1,731,874 | ||||||||
| Metal & Glass Containers – 0.1% | ||||||||
| 100,000 | Owens-Brockway Glass Container, Inc. (g) | 5.88% | 08/15/23 | 102,625 | ||||
| Movies & Entertainment – 0.8% | ||||||||
| 1,355,000 | AMC Entertainment Holdings, Inc. | 5.75% | 06/15/25 | 1,319,431 | ||||
| 227,000 | Cinemark USA, Inc. | 4.88% | 06/01/23 | 225,298 | ||||
| 137,000 | Live Nation Entertainment, Inc. (g) | 5.63% | 03/15/26 | 137,000 | ||||
| 1,681,729 | ||||||||
| Oil & Gas Exploration & Production – 1.0% | ||||||||
| 200,000 | Murphy Oil Corp. | 6.88% | 08/15/24 | 212,250 | ||||
| 625,000 | Sanchez Energy Corp. | 6.13% | 01/15/23 | 454,500 | ||||
| 1,379,000 | Tallgrass Energy Partners LP/Tallgrass Energy Finance Corp. (g) | 5.50% | 09/15/24 | 1,406,580 | ||||
| 2,073,330 | ||||||||
| Oil & Gas Refining & Marketing – 0.0% | ||||||||
| 75,000 | Murphy Oil USA, Inc. | 5.63% | 05/01/27 | 74,906 | ||||
| Principal Value | Description | Stated Coupon | Stated Maturity | Value | ||||
| CORPORATE BONDS AND NOTES (Continued) | ||||||||
| Oil & Gas Storage & Transportation – 0.3% | ||||||||
| $500,000 | Crestwood Midstream Partners L.P./Crestwood Midstream Finance Corp. | 5.75% | 04/01/25 | $498,125 | ||||
| 151,000 | Holly Energy Partners L.P./Holly Energy Finance Corp. (g) | 6.00% | 08/01/24 | 152,132 | ||||
| 650,257 | ||||||||
| Packaged Foods & Meats – 0.2% | ||||||||
| 390,000 | B&G Foods, Inc. | 5.25% | 04/01/25 | 357,825 | ||||
| 68,000 | Post Holdings, Inc. (g) | 5.00% | 08/15/26 | 63,920 | ||||
| 421,745 | ||||||||
| Paper Packaging – 0.2% | ||||||||
| 399,000 | Reynolds Group Issuer, Inc./Reynolds Group Issuer LLC/Reynolds Group Issuer Lu. (g) | 7.00% | 07/15/24 | 416,207 | ||||
| Pharmaceuticals – 1.0% | ||||||||
| 152,000 | Eagle Holdings Co. II LLC (g) (i) | 7.63% | 05/15/22 | 154,280 | ||||
| 2,335,000 | Endo Finance LLC & Endo Finco, Inc. (g) | 7.25% | 01/15/22 | 1,990,587 | ||||
| 2,144,867 | ||||||||
| Real Estate Services – 0.0% | ||||||||
| 22,000 | Realogy Group LLC/Realogy Co-Issuer Corp. (g) | 4.88% | 06/01/23 | 21,374 | ||||
| Restaurants – 0.0% | ||||||||
| 66,000 | IRB Holding Corp. (g) | 6.75% | 02/15/26 | 63,855 | ||||
| Specialty Chemicals – 0.1% | ||||||||
| 100,000 | Valvoline, Inc. | 5.50% | 07/15/24 | 102,750 | ||||
| Systems Software – 0.3% | ||||||||
| 625,000 | BMC Software Finance, Inc. (g) | 8.13% | 07/15/21 | 626,563 | ||||
| 16,000 | Symantec Corp. (g) | 5.00% | 04/15/25 | 16,113 | ||||
| 642,676 | ||||||||
| Technology Hardware, Storage & Peripherals – 0.3% | ||||||||
| 500,000 | Dell International LLC/EMC Corp. (g) | 7.13% | 06/15/24 | 532,975 | ||||
| 135,000 | Dell International LLC/EMC Corp. (g) | 6.02% | 06/15/26 | 143,398 | ||||
| 676,373 | ||||||||
| Trading Companies & Distributors – 0.1% | ||||||||
| 250,000 | Ashtead Capital, Inc. (g) | 4.13% | 08/15/25 | 237,812 | ||||
| Trucking – 0.4% | ||||||||
| 600,000 | Avis Budget Car Rental LLC/Avis Budget Finance, Inc. (g) | 5.13% | 06/01/22 | 599,250 | ||||
| 125,000 | Avis Budget Car Rental LLC/Avis Budget Finance, Inc. | 5.50% | 04/01/23 | 124,219 | ||||
| 723,469 | ||||||||
| Wireless Telecommunication Services – 1.2% | ||||||||
| 38,000 | SBA Communications Corp. (g) | 4.00% | 10/01/22 | 36,385 | ||||
| 990,000 | SBA Communications Corp. | 4.88% | 09/01/24 | 954,113 | ||||
| 501,000 | Sprint Communications, Inc. (g) | 9.00% | 11/15/18 | 515,717 | ||||
| 500,000 | Sprint Communications, Inc. | 7.00% | 08/15/20 | 528,185 | ||||
| 200,000 | T-Mobile USA, Inc. | 6.00% | 03/01/23 | 207,750 | ||||
| 170,000 | T-Mobile USA, Inc. | 5.13% | 04/15/25 | 171,700 | ||||
| 67,000 | T-Mobile USA, Inc. | 4.50% | 02/01/26 | 64,571 | ||||
| 2,478,421 | ||||||||
Total Corporate Bonds and Notes | 52,024,904 | |||||||
| (Cost $52,651,464) | ||||||||
| Principal Value | Description | Stated Coupon | Stated Maturity | Value | ||||
| FOREIGN CORPORATE BONDS AND NOTES – 4.2% | ||||||||
| Aluminum – 0.7% | ||||||||
| $250,000 | Alcoa Nederland Holding B.V. (g) | 6.75% | 09/30/24 | $269,377 | ||||
| 1,121,000 | Alcoa Nederland Holding B.V. (g) | 7.00% | 09/30/26 | 1,227,495 | ||||
| 1,496,872 | ||||||||
| Automobile Manufacturers – 0.3% | ||||||||
| 500,000 | Fiat Chrysler Automobiles N.V. | 5.25% | 04/15/23 | 520,625 | ||||
| Cable & Satellite – 0.3% | ||||||||
| 250,000 | Virgin Media Finance PLC (g) | 6.00% | 10/15/24 | 245,938 | ||||
| 351,000 | Ziggo Secured Finance B.V. (g) | 5.50% | 01/15/27 | 331,695 | ||||
| 577,633 | ||||||||
| Casinos & Gaming – 0.1% | ||||||||
| 327,000 | Melco Resorts Finance Ltd. (g) | 4.88% | 06/06/25 | 306,897 | ||||
| Packaged Foods & Meats – 0.1% | ||||||||
| 224,000 | JBS USA LUX S.A./JBS USA Finance, Inc. (g) | 5.88% | 07/15/24 | 218,120 | ||||
| Pharmaceuticals – 2.0% | ||||||||
| 180,000 | Concordia International Corp. (e) (g) | 9.00% | 04/01/22 | 164,700 | ||||
| 1,000,000 | Mallinckrodt International Finance S.A./Mallinckrodt CB LLC (g) | 5.75% | 08/01/22 | 837,500 | ||||
| 250,000 | Mallinckrodt International Finance S.A./Mallinckrodt CB LLC (g) | 5.63% | 10/15/23 | 196,875 | ||||
| 250,000 | Mallinckrodt International Finance S.A./Mallinckrodt CB LLC (g) | 5.50% | 04/15/25 | 189,219 | ||||
| 2,429,000 | Valeant Pharmaceuticals International, Inc. (g) | 6.75% | 08/15/21 | 2,453,290 | ||||
| 193,000 | Valeant Pharmaceuticals International, Inc. (g) | 5.50% | 11/01/25 | 192,758 | ||||
| 4,034,342 | ||||||||
| Research & Consulting Services – 0.1% | ||||||||
| 80,000 | IHS Markit Ltd. (g) | 4.75% | 02/15/25 | 80,608 | ||||
| 157,000 | Nielsen Co. Luxembourg (The) SARL (g) | 5.00% | 02/01/25 | 155,038 | ||||
| 235,646 | ||||||||
| Restaurants – 0.6% | ||||||||
| 1,303,000 | 1011778 BC ULC/New Red Finance, Inc. (g) | 5.00% | 10/15/25 | 1,260,249 | ||||
Total Foreign Corporate Bonds and Notes | 8,650,384 | |||||||
| (Cost $8,935,570) | ||||||||
| Shares | Description | Value | ||
| COMMON STOCKS – 0.2% | ||||
| Electric Utilities – 0.1% | ||||
| 14,134 | Vistra Energy Corp. (j) | 322,962 | ||
| Oil & Gas Exploration & Production – 0.1% | ||||
| 47,894 | Ascent Resources - Marcellus LLC Class A Common Shares (j) | 159,391 | ||
Total Common Stocks | 482,353 | |||
| (Cost $372,110) | ||||
| RIGHTS – 0.0% | ||||
| Electric Utilities – 0.0% | ||||
| 14,134 | Vistra Energy Corp. (j) | 9,724 | ||
| 22,964 | Vistra Energy Corp. Claim (j) (k) (l) | 0 | ||
| 9,724 | ||||
| Life Sciences Tools & Services – 0.0% | ||||
| 1 | New Millennium Holdco, Inc., Corporate Claim Trust (j) (k) (l) (m) | 0 | ||
| Shares | Description | Value | ||
| RIGHTS (Continued) | ||||
| Life Sciences Tools & Services (Continued) | ||||
| 1 | New Millennium Holdco, Inc., Lender Claim Trust (j) (k) (l) (m) | $0 | ||
| 0 | ||||
Total Rights | 9,724 | |||
| (Cost $23,700) | ||||
| WARRANTS – 0.0% | ||||
| Oil & Gas Exploration & Production – 0.0% | ||||
| 12,400 | Ascent Resources - Marcellus LLC First Lien Warrants (j) | 930 | ||
| (Cost $1,240) | ||||
| MONEY MARKET FUNDS – 6.7% | ||||
| 13,651,725 | Morgan Stanley Institutional Liquidity Fund - Treasury Portfolio - Institutional Class - 1.59% (n) | 13,651,725 | ||
| (Cost $13,651,725) | ||||
Total Investments – 103.9% | 213,594,072 | |||
| (Cost $215,740,508) (o) | ||||
Net Other Assets and Liabilities – (3.9)% | (7,949,906) | |||
Net Assets – 100.0% | $205,644,166 | |||
| (a) | Senior Floating-Rate Loan Interests (“Senior Loans”) in which the Fund invests pay interest at rates which are periodically predetermined by reference to a base lending rate plus a premium. These base lending rates are generally (i) the lending rate offered by one or more major European banks, such as the LIBOR, (ii) the prime rate offered by one or more United States banks or (iii) the certificate of deposit rate. Certain Senior Loans are subject to a LIBOR floor that establishes a minimum LIBOR rate. |
| (b) | Senior Loans generally are subject to mandatory and/or optional prepayment. As a result, the actual remaining maturity of Senior Loans may be substantially less than the stated maturities shown. |
| (c) | Delayed Draw Loan (See Note 2C - Unfunded Loan Commitments in the Notes to Financial Statements). |
| (d) | Represents commitment fee rate on unfunded loan commitment. The commitment fee rate steps up at predetermined time intervals. |
| (e) | This issuer has filed for protection in federal bankruptcy court. |
| (f) | This issuer is in default and interest is not being accrued by the Fund nor paid by the issuer. |
| (g) | This security, sold within the terms of a private placement memorandum, is exempt from registration upon resale under Rule 144A under the Securities Act of 1933, as amended (the “1933 Act”), and may be resold in transactions exempt from registration, normally to qualified institutional buyers. Pursuant to procedures adopted by the Trust’s Board of Trustees, this security has been determined to be liquid by First Trust Advisors L.P. (“Advisor”). Although market instability can result in periods of increased overall market illiquidity, liquidity for each security is determined based on security specific factors and assumptions, which require subjective judgment. At April 30, 2018, securities noted as such amounted to $39,678,062 or 19.3% of net assets. |
| (h) | These notes are Senior Payment-in-kind (“PIK”) Toggle Notes whereby the issuer may, at its option, elect to pay interest on the notes (1) entirely in cash or (2) entirely in PIK interest. Interest paid in cash will accrue on the notes at a rate of 8.50% per annum (“Cash Interest Rate”) and PIK interest will accrue on the notes at a rate per annum equal to the Cash Interest Rate plus 75 basis points. The first payment is scheduled for June 1, 2018. |
| (i) | These notes are Senior PIK Toggle Notes whereby the issuer may, at its option, elect to pay interest on the notes (1) entirely in cash or (2) entirely in PIK interest. Interest paid in cash will accrue on the notes at a rate of 7.63% per annum (“Cash Interest Rate”) and PIK interest will accrue on the notes at a rate per annum equal to the Cash Interest Rate plus 75 basis points. For the six months ended April 30, 2018, this security paid all of its interest in cash. |
| (j) | Non-income producing security. |
| (k) | This security is fair valued by the Advisor’s Pricing Committee in accordance with procedures adopted by the Trust’s Board of Trustees, and in accordance with the provisions of the Investment Company Act of 1940, as amended. At April 30, 2018, securities noted as such are valued at $0 or 0.0% of net assets. |
| (l) | This security’s value was determined using significant unobservable inputs (see Note 2A-Portfolio Valuation in the Notes to Financial Statements). |
| (m) | Pursuant to procedures adopted by the Trust’s Board of Trustees, this security has been determined to be illiquid by the Advisor. |
| (n) | Rate shown reflects yield as of April 30, 2018. |
| (o) | Aggregate cost for financial reporting purposes approximates the aggregate cost for federal income tax purposes. As of April 30, 2018, the aggregate gross unrealized appreciation for all investments in which there was an excess of value over tax cost was $1,246,756 and the aggregate gross unrealized depreciation for all investments in which there was an excess of tax cost over value was $3,393,192. The net unrealized depreciation was $2,146,436. |
| LIBOR | London Interbank Offered Rate |
| USD | United States Dollar |
| Total Value at 4/30/2018 | Level 1 Quoted Prices | Level 2 Significant Observable Inputs | Level 3 Significant Unobservable Inputs | |
Senior Floating-Rate Loan Interests* | $ 138,774,052 | $ — | $ 138,774,052 | $ — |
Corporate Bonds and Notes* | 52,024,904 | — | 52,024,904 | — |
Foreign Corporate Bonds and Notes* | 8,650,384 | — | 8,650,384 | — |
| Common Stocks: | ||||
Electric Utilities | 322,962 | 322,962 | — | — |
Oil & Gas Exploration & Production | 159,391 | — | 159,391 | — |
| Rights: | ||||
Electric Utilities | 9,724 | — | 9,724 | —** |
Life Sciences Tools & Services | —** | — | — | —** |
Warrants* | 930 | — | 930 | — |
Money Market Funds | 13,651,725 | 13,651,725 | — | — |
Total Investments | $ 213,594,072 | $ 13,974,687 | $ 199,619,385 | $—** |
| * | See Portfolio of Investments for industry breakout. |
| ** | Investment is valued at $0. |
| Beginning Balance at October 31, 2017 | |
| Rights | $—** |
| Net Realized Gain (Loss) | — |
| Net Change in Unrealized Appreciation/Depreciation | |
| Structured Notes | — |
| Purchases | — |
| Sales | — |
| Transfers In | — |
| Transfers Out | — |
| Ending Balance at April 30, 2018 | |
| Rights | —** |
| Total Level 3 holdings | $—** |
| **Investment is valued at $0. |
| ASSETS: | |
Investments, at value (Cost $215,740,508) | $ 213,594,072 |
Cash | 36,314 |
| Receivables: | |
Interest | 1,289,766 |
Investment securities sold | 1,100,295 |
Fund shares sold | 228,770 |
Prepaid expenses | 2,102 |
Total Assets | 216,251,319 |
| LIABILITIES: | |
| Payables: | |
Investment securities purchased | 9,585,795 |
Fund shares repurchased | 417,001 |
Unfunded loan commitments | 233,301 |
Distributions | 121,662 |
Investment advisory fees | 109,845 |
Audit and tax fees | 32,895 |
12b-1 distribution and service fees | 28,603 |
Administrative fees | 17,715 |
Printing fees | 17,418 |
Custodian fees | 12,372 |
Registration fees | 11,406 |
Transfer agent fees | 10,331 |
Commitment fees | 3,955 |
Legal fees | 1,892 |
Trustees’ fees and expenses | 1,452 |
Financial reporting fees | 771 |
Other liabilities | 739 |
Total Liabilities | 10,607,153 |
NET ASSETS | $205,644,166 |
| NET ASSETS consist of: | |
Paid-in capital | $ 213,685,411 |
Par value | 103,776 |
Accumulated net investment income (loss) | (619,345) |
Accumulated net realized gain (loss) on investments | (5,379,240) |
Net unrealized appreciation (depreciation) on investments | (2,146,436) |
NET ASSETS | $205,644,166 |
| Class A Shares: | |
Net asset value and redemption price per share (Based on net assets of $45,254,841 and 2,283,355 shares of beneficial interest issued and outstanding) | $19.77 |
Maximum sales charge (3.50% of offering price) | 0.72 |
Maximum offering price to public | $20.49 |
| Class C Shares: | |
Net asset value and redemption price per share (Based on net assets of $23,550,248 and 1,190,153 shares of beneficial interest issued and outstanding) | $19.75 |
| Class I Shares: | |
Net asset value and redemption price per share (Based on net assets of $136,839,077 and 6,904,082 shares of beneficial interest issued and outstanding) | $19.78 |
| INVESTMENT INCOME: | ||
Interest | $ 5,497,013 | |
Other | 51,124 | |
Total investment income | 5,548,137 | |
| EXPENSES: | ||
Investment advisory fees | 663,708 | |
| 12b-1 distribution and/or service fees: | ||
Class A | 58,232 | |
Class C | 116,444 | |
Transfer agent fees | 58,810 | |
Registration fees | 35,361 | |
Administrative fees | 32,565 | |
Audit and tax fees | 28,994 | |
Printing fees | 26,075 | |
Commitment fees | 24,144 | |
Custodian fees | 23,501 | |
Expenses previously waived or reimbursed | 11,894 | |
Legal fees | 10,006 | |
Trustees’ fees and expenses | 8,257 | |
Financial reporting fees | 4,625 | |
Other | 10,688 | |
Total expenses | 1,113,304 | |
NET INVESTMENT INCOME (LOSS) | 4,434,833 | |
| NET REALIZED AND UNREALIZED GAIN (LOSS): | ||
Net realized gain (loss) on investments | (564,906) | |
Net change in unrealized appreciation (depreciation) on investments | (1,560,945) | |
NET REALIZED AND UNREALIZED GAIN (LOSS) | (2,125,851) | |
NET INCREASE (DECREASE) IN NET ASSETS RESULTING FROM OPERATIONS | $ 2,308,982 | |
| Six Months Ended 4/30/2018 (Unaudited) | Year Ended 10/31/2017 | ||
| OPERATIONS: | |||
Net investment income (loss) | $ 4,434,833 | $ 9,139,471 | |
Net realized gain (loss) | (564,906) | (886,874) | |
Net change in unrealized appreciation (depreciation) | (1,560,945) | 2,626,918 | |
Net increase (decrease) in net assets resulting from operations | 2,308,982 | 10,879,515 | |
| DISTRIBUTIONS TO SHAREHOLDERS FROM NET INVESTMENT INCOME: | |||
Class A Shares | (1,077,203) | (3,326,443) | |
Class C Shares | (450,981) | (883,245) | |
Class I Shares | (3,276,604) | (6,255,088) | |
Total distributions to shareholders | (4,804,788) | (10,464,776) | |
| CAPITAL TRANSACTIONS: | |||
Proceeds from shares sold | 40,713,409 | 132,141,172 | |
Proceeds from shares reinvested | 4,097,139 | 8,836,368 | |
Cost of shares redeemed | (72,541,345) | (97,646,017) | |
Net increase (decrease) in net assets resulting from capital transactions | (27,730,797) | 43,331,523 | |
Total increase (decrease) in net assets | (30,226,603) | 43,746,262 | |
| NET ASSETS: | |||
Beginning of period | 235,870,769 | 192,124,507 | |
End of period | $205,644,166 | $235,870,769 | |
Accumulated net investment income (loss) at end of period | $(619,345) | $(249,390) |
| Six Months Ended 4/30/2018 (Unaudited) | Year Ended October 31, | Period Ended 10/31/2013 (a) | |||||||||
| 2017 | 2016 | 2015 | 2014 | ||||||||
| Class A Shares | |||||||||||
Net asset value, beginning of period | $ 20.00 | $ 19.97 | $ 19.83 | $ 20.54 | $ 20.68 | $ 20.00 | |||||
| Income from investment operations: | |||||||||||
Net investment income (loss) (b) | 0.42 | 0.79 | 0.87 | 0.90 | 0.76 | 0.65 | |||||
Net realized and unrealized gain (loss) | (0.19) | 0.15 | 0.18 | (0.77) | (0.12) | 0.90 | |||||
Total from investment operations | 0.23 | 0.94 | 1.05 | 0.13 | 0.64 | 1.55 | |||||
| Distributions paid to shareholders from: | |||||||||||
Net investment income | (0.46) | (0.91) | (0.91) | (0.80) | (0.78) | (0.70) | |||||
Net realized gain | — | — | — | (0.04) | — | — | |||||
Return of capital | — | — | — | — | — | (0.17) | |||||
Total distributions | (0.46) | (0.91) | (0.91) | (0.84) | (0.78) | (0.87) | |||||
Net asset value, end of period | $19.77 | $20.00 | $19.97 | $19.83 | $20.54 | $20.68 | |||||
Total return (c) | 1.14% | 4.79% | 5.47% | 0.63% | 3.14% | 7.87% (d) | |||||
| Ratios to average net assets/supplemental data: | |||||||||||
Net assets, end of period (in 000’s) | $ 45,255 | $ 72,462 | $ 55,640 | $ 53,433 | $ 53,304 | $ 44,819 | |||||
Ratio of total expenses to average net assets | 1.17% (e) | 1.21% | 1.27% | 1.26% | 1.38% | 1.54% (e) | |||||
Ratio of net expenses to average net assets | 1.16% (e) | 1.26% (f) | 1.27% (f) | 1.25% | 1.25% | 1.25% (e) | |||||
Ratio of net investment income (loss) to average net assets | 4.26% (e) | 3.96% | 4.44% | 4.43% | 3.68% | 3.20% (e) | |||||
Portfolio turnover rate | 49% | 100% | 62% | 58% | 109% | 89% | |||||
| (a) | Class A Shares were initially seeded and commenced operations on November 1, 2012. |
| (b) | Based on average shares outstanding. |
| (c) | Assumes reinvestment of all distributions for the period and does not include payment of the maximum sales charge of 3.50% or contingent deferred sales charge (CDSC). On purchases of $1 million or more, a CDSC of 1% may be imposed on certain redemptions made within twelve months of purchase. If the sales charges were included, total returns would be lower. These returns include Rule 12b-1 service fees of 0.25% and do not reflect the deduction of taxes that a shareholder would pay on Fund distributions or the redemption of Fund shares. The total returns would have been lower if certain fees had not been waived and expenses reimbursed by the investment advisor. Total return is calculated for the time period presented and is not annualized for periods of less than one year. |
| (d) | The Fund received a payment from First Trust Advisors L.P. (the "Advisor") in the amount of $1,079 in connection with a trade error. The payment from the Advisor represents less than $0.01 per share and had no effect on the total return of the Class A Shares. |
| (e) | Annualized. |
| (f) | Includes excise tax. If this excise tax expense was not included, the net expense ratio would have been 1.25%. |
| Six Months Ended 4/30/2018 (Unaudited) | Year Ended October 31, | Period Ended 10/31/2013 (a) | |||||||||
| 2017 | 2016 | 2015 | 2014 | ||||||||
| Class C Shares | |||||||||||
| Income from investment operations: | |||||||||||
Net investment income (loss) (b) | 0.35 | 0.64 | 0.72 | 0.75 | 0.60 | 0.50 | |||||
Net realized and unrealized gain (loss) | (0.20) | 0.15 | 0.18 | (0.77) | (0.11) | 0.89 | |||||
Total from investment operations | 0.15 | 0.79 | 0.90 | (0.02) | 0.49 | 1.39 | |||||
| Distributions paid to shareholders from: | |||||||||||
Net investment income | (0.38) | (0.76) | (0.76) | (0.65) | (0.63) | (0.59) | |||||
Net realized gain | — | — | — | (0.04) | — | — | |||||
Return of capital | — | — | — | — | — | (0.14) | |||||
Total distributions | (0.38) | (0.76) | (0.76) | (0.69) | (0.63) | (0.73) | |||||
Net asset value, end of period | $19.75 | $19.98 | $19.95 | $19.81 | $20.52 | $20.66 | |||||
Total return (c) | 0.77% | 4.01% | 4.69% | (0.12)% | 2.38% | 7.04% (d) | |||||
| Ratios to average net assets/supplemental data: | |||||||||||
Net assets, end of period (in 000’s) | $ 23,550 | $ 24,393 | $ 23,841 | $ 25,213 | $ 24,531 | $ 13,522 | |||||
Ratio of total expenses to average net assets | 1.92% (e) | 1.96% | 2.02% | 2.01% | 2.13% | 2.29% (e) | |||||
Ratio of net expenses to average net assets | 1.91% (e) | 2.01% (f) | 2.02% (f) | 2.00% | 2.00% | 2.00% (e) | |||||
Ratio of net investment income (loss) to average net assets | 3.52% (e) | 3.20% | 3.70% | 3.68% | 2.93% | 2.45% (e) | |||||
Portfolio turnover rate | 49% | 100% | 62% | 58% | 109% | 89% | |||||
| (a) | Class C Shares were initially seeded and commenced operations on November 1, 2012. |
| (b) | Based on average shares outstanding. |
| (c) | Assumes reinvestment of all distributions for the period and does not include payment of the maximum CDSC of 1%, charged on certain redemptions made within one year of purchase. If the sales charge was included, total returns would be lower. These returns include combined Rule 12b-1 distribution and service fees of 1% and do not reflect the deduction of taxes that a shareholder would pay on Fund distributions or the redemption of Fund shares. The total returns would have been lower if certain fees had not been waived and expenses reimbursed by the investment advisor. Total return is calculated for the time period presented and is not annualized for periods of less than one year. |
| (d) | The Fund received a payment from First Trust Advisors L.P. (the "Advisor") in the amount of $1,079 in connection with a trade error. The payment from the Advisor represents less than $0.01 per share and had no effect on the total return of the Class C Shares. |
| (e) | Annualized. |
| (f) | Includes excise tax. If this excise tax expense was not included, the net expense ratio would have been 2.00%. |
| Six Months Ended 4/30/2018 (Unaudited) | Year Ended October 31, | Period Ended 10/31/2013 (a) | |||||||||
| 2017 | 2016 | 2015 | 2014 | ||||||||
| Class I Shares | |||||||||||
Net asset value, beginning of period | $ 20.00 | $ 19.97 | $ 19.83 | $ 20.54 | $ 20.68 | $ 20.00 | |||||
| Income from investment operations: | |||||||||||
Net investment income (loss) (b) | 0.45 | 0.85 | 0.92 | 0.95 | 0.81 | 0.70 | |||||
Net realized and unrealized gain (loss) | (0.19) | 0.14 | 0.18 | (0.77) | (0.12) | 0.90 | |||||
Total from investment operations | 0.26 | 0.99 | 1.10 | 0.18 | 0.69 | 1.60 | |||||
| Distributions paid to shareholders from: | |||||||||||
Net investment income | (0.48) | (0.96) | (0.96) | (0.85) | (0.83) | (0.74) | |||||
Net realized gain | — | — | — | (0.04) | — | — | |||||
Return of capital | — | — | — | — | — | (0.18) | |||||
Total distributions | (0.48) | (0.96) | (0.96) | (0.89) | (0.83) | (0.92) | |||||
Net asset value, end of period | $19.78 | $20.00 | $19.97 | $19.83 | $20.54 | $20.68 | |||||
Total return (c) | 1.32% | 5.06% | 5.74% | 0.88% | 3.40% | 8.11% (d) | |||||
| Ratios to average net assets/supplemental data: | |||||||||||
Net assets, end of period (in 000’s) | $ 136,839 | $ 139,015 | $ 112,644 | $ 103,655 | $ 103,033 | $ 43,395 | |||||
Ratio of total expenses to average net assets | 0.92% (e) | 0.96% | 1.02% | 1.01% | 1.13% | 1.29% (e) | |||||
Ratio of net expenses to average net assets | 0.91% (e) | 1.01% (f) | 1.02% (f) | 1.00% | 1.00% | 1.00% (e) | |||||
Ratio of net investment income (loss) to average net assets | 4.52% (e) | 4.21% | 4.69% | 4.68% | 3.93% | 3.45% (e) | |||||
Portfolio turnover rate | 49% | 100% | 62% | 58% | 109% | 89% | |||||
| (a) | Class I Shares were initially seeded and commenced operations on November 1, 2012. |
| (b) | Based on average shares outstanding. |
| (c) | Assumes reinvestment of all distributions for the period. These returns do not reflect the deduction of taxes that a shareholder would pay on Fund distributions or the redemption of Fund shares. The total returns would have been lower if certain fees had not been waived and expenses reimbursed by the investment advisor. Total return is calculated for the time period presented and is not annualized for periods of less than one year. |
| (d) | The Fund received a payment from First Trust Advisors L.P. (the "Advisor") in the amount of $1,079 in connection with a trade error. The payment from the Advisor represents less than $0.01 per share and had no effect on the total return of the Class I Shares. |
| (e) | Annualized. |
| (f) | Includes excise tax. If this excise tax expense was not included, the net expense ratio would have been 1.00%. |
| (1) | The terms “security” and “securities” used throughout the Notes to Financial Statements include Senior Loans. |
| Fixed income and other debt securities having a remaining maturity of sixty days or less when purchased are fair valued at cost adjusted for amortization of premiums and accretion of discounts (amortized cost), provided the Advisor’s Pricing Committee has determined that the use of amortized cost is an appropriate reflection of fair value given market and issuer-specific conditions existing at the time of the determination. Factors that may be considered in determining the appropriateness of the use of amortized cost include, but are not limited to, the following: |
| 1) | the credit conditions in the relevant market and changes thereto; |
| 2) | the liquidity conditions in the relevant market and changes thereto; |
| 3) | the interest rate conditions in the relevant market and changes thereto (such as significant changes in interest rates); |
| 4) | issuer-specific conditions (such as significant credit deterioration); and |
| 5) | any other market-based data the Advisor’s Pricing Committee considers relevant. In this regard, the Advisor’s Pricing Committee may use last-obtained market-based data to assist it when valuing portfolio securities using amortized cost. |
| 1) | benchmark yields; |
| 2) | reported trades; |
| 3) | broker/dealer quotes; |
| 4) | issuer spreads; |
| 5) | benchmark securities; |
| 6) | bids and offers; and |
| 7) | reference data including market research publications. |
| 1) | the fundamental business data relating to the borrower/issuer; |
| 2) | an evaluation of the forces which influence the market in which these securities are purchased and sold; |
| 3) | the type, size and cost of a security; |
| 4) | the financial statements of the borrower/issuer; |
| 5) | the credit quality and cash flow of the borrower/issuer, based on the Advisor’s or external analysis; |
| 6) | the information as to any transactions in or offers for the security; |
| 7) | the price and extent of public trading in similar securities (or equity securities) of the issuer/borrower, or comparable companies; |
| 8) | the coupon payments; |
| 9) | the quality, value and salability of collateral, if any, securing the security; |
| 10) | the business prospects of the borrower/issuer, including any ability to obtain money or resources from a parent or affiliate and an assessment of the borrower’s/issuer’s management; |
| 11) | the prospects for the borrower’s/issuer’s industry, and multiples (of earnings and/or cash flows) being paid for similar businesses in that industry; |
| 12) | the borrower’s/issuer’s competitive position within the industry; |
| 13) | the borrower’s/issuer’s ability to access additional liquidity through public and/or private markets; and |
| 14) | other relevant factors. |
| • | Level 1 – Level 1 inputs are quoted prices in active markets for identical investments. An active market is a market in which transactions for the investment occur with sufficient frequency and volume to provide pricing information on an ongoing basis. |
| • | Level 2 – Level 2 inputs are observable inputs, either directly or indirectly, and include the following: |
| o | Quoted prices for similar investments in active markets. |
| o | Quoted prices for identical or similar investments in markets that are non-active. A non-active market is a market where there are few transactions for the investment, the prices are not current, or price quotations vary substantially either over time or among market makers, or in which little information is released publicly. |
| o | Inputs other than quoted prices that are observable for the investment (for example, interest rates and yield curves observable at commonly quoted intervals, volatilities, prepayment speeds, loss severities, credit risks, and default rates). |
| o | Inputs that are derived principally from or corroborated by observable market data by correlation or other means. |
| • | Level 3 – Level 3 inputs are unobservable inputs. Unobservable inputs may reflect the reporting entity’s own assumptions about the assumptions that market participants would use in pricing the investment. |
| Distributions paid from: | |
Ordinary income | $10,464,776 |
Capital gains | — |
Return of capital | — |
Undistributed ordinary income | $270,341 |
Undistributed capital gains | — |
Total undistributed earnings | 270,341 |
Accumulated capital and other losses | (4,814,306) |
Net unrealized appreciation (depreciation) | (1,025,202) |
Total accumulated earnings (losses) | (5,569,167) |
Other | (80,048) |
Paid-in capital | 241,519,984 |
Total net assets | $235,870,769 |
| Six Months Ended April 30, 2018 | Year Ended October 31, 2017 | ||||||
| Shares | Value | Shares | Value | ||||
| Sales: | |||||||
| Class A | 369,840 | $ 7,338,081 | 2,166,955 | $ 43,330,998 | |||
| Class C | 146,022 | 2,896,586 | 319,712 | 6,399,722 | |||
| Class I | 1,535,251 | 30,478,742 | 4,110,531 | 82,410,452 | |||
| Total Sales | 2,051,113 | $ 40,713,409 | 6,597,198 | $ 132,141,172 | |||
| Dividend Reinvestment: | |||||||
| Class A | 47,766 | $ 947,718 | 131,419 | $ 2,634,908 | |||
| Class C | 19,771 | 391,884 | 38,599 | 772,980 | |||
| Class I | 138,957 | 2,757,537 | 270,729 | 5,428,480 | |||
| Total Dividend Reinvestment | 206,494 | $ 4,097,139 | 440,747 | $ 8,836,368 | |||
| Six Months Ended April 30, 2018 | Year Ended October 31, 2017 | ||||||
| Shares | Value | Shares | Value | ||||
| Redemptions: | |||||||
| Class A | (1,751,784) | $ (34,823,255) | (1,461,890) | (29,289,205) | |||
| Class C | (194,556) | (3,862,738) | (332,438) | (6,639,313) | |||
| Class I | (1,704,841) | (33,855,352) | (3,071,873) | (61,717,499) | |||
| Total Redemptions | (3,651,181) | $ (72,541,345) | (4,866,201) | $ (97,646,017) | |||

FUND ACCOUNTANT, AND
CUSTODIAN
PUBLIC ACCOUNTING FIRM


| 1 | |
| 2 | |
| 4 | |
| 5 | |
| 6 | |
| 8 | |
| 9 | |
| 10 | |
| 11 | |
| 14 | |
| 19 |
| • | The S&P 500® Index did something it had never previously done, finishing 2017 with 12 months of gains; |
| • | The Dow Jones Industrial Average achieved a milestone as well, closing above 24,000 for the first time ever on November 30; |
| • | The Nasdaq Composite set a record by having 11 months of gains in 2017 (June was the only down month, and by just 0.86%); and |
| • | The MSCI AC World Index (containing constituents from 47 countries) ended 2017 at an all-time high and was up 22% at year-end. |

| Fund Statistics | |
| First Trust AQA® Equity Fund | Net Asset Value (NAV) |
| Class A (AQAAX) | $27.54 |
| Class C (AQACX) | $27.05 |
| Class I (AQAIX) | $27.48 |
| Sector Allocation | % of Total Investments |
| Consumer Discretionary | 25.4% |
| Industrials | 22.8 |
| Information Technology | 18.8 |
| Financials | 12.2 |
| Health Care | 12.1 |
| Consumer Staples | 3.1 |
| Materials | 2.9 |
| Energy | 2.7 |
| Total | 100.0% |
| Top Ten Holdings | % of Total Investments |
| ABIOMED, Inc. | 6.5% |
| MSCI, Inc. | 4.3 |
| Cognex Corp. | 4.0 |
| Boyd Gaming Corp. | 3.8 |
| Saia, Inc. | 3.7 |
| Callaway Golf Co. | 3.6 |
| KB Home | 3.6 |
| Trex Co., Inc. | 3.6 |
| Monolithic Power Systems, Inc. | 3.5 |
| Cognizant Technology Solutions Corp., Class A | 3.4 |
| Total | 40.0% |
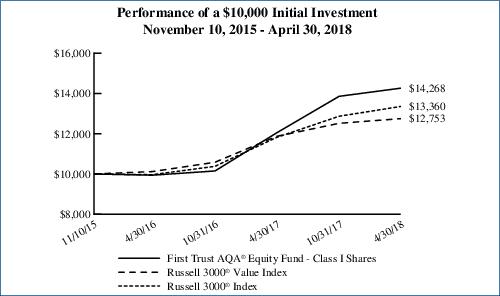
| Performance as of April 30, 2018 | |||||||||||||||||||
| Class A Inception 11/10/2015 | Class C Inception 11/10/2015 | Class I Inception 11/10/2015 | Russell 3000® Value Index* | Russell 3000® Index* | |||||||||||||||
| Cumulative Total Returns | w/o sales charge | w/max 5.50% sales charge | w/o sales charge | w/max 1.00% contingent deferred sales charge | w/o sales charge | w/o sales charges | w/o sales charges | ||||||||||||
| 6 Months | 2.80% | -2.86% | 2.39% | 1.39% | 2.92% | 1.86% | 3.79% | ||||||||||||
| 1 Year | 18.23% | 11.72% | 17.30% | 16.30% | 18.48% | 7.42% | 13.05% | ||||||||||||
| Average Annual Total Returns | |||||||||||||||||||
| Since Inception | 15.60% | 12.98% | 14.76% | 14.76% | 15.48% | 10.36% | 12.45% | ||||||||||||
| Actual Expenses | Hypothetical (5% Return Before Expenses) | |||||||||||||
| Beginning Account Value 11/1/2017 | Ending Account Value 4/30/2018 | Expenses Paid During Period 11/1/2017 - 4/30/2018 (a) | Beginning Account Value 11/1/2017 | Ending Account Value 4/30/2018 | Expenses Paid During Period 11/1/2017 - 4/30/2018 (a) | Annualized Expense Ratios (b) | ||||||||
| Class A | $ 1,000.00 | $ 1,028.00 | $ 8.05 | $ 1,000.00 | $ 1,016.86 | $ 8.00 | 1.60% | |||||||
| Class C | 1,000.00 | 1,023.90 | 11.79 | 1,000.00 | 1,013.14 | 11.73 | 2.35 | |||||||
| Class I | 1,000.00 | 1,029.20 | 6.79 | 1,000.00 | 1,018.10 | 6.76 | 1.35 | |||||||
| (a) | Expenses are equal to the annualized expense ratios as indicated in the table multiplied by the average account value over the period (November 1, 2017 through April 30, 2018), multiplied by 181/365 (to reflect the six-month period). |
| (b) | These expense ratios reflect expense caps. |
| Shares | Description | Value | ||
| COMMON STOCKS – 94.8% | ||||
| Airlines – 6.6% | ||||
| 13,469 | Delta Air Lines, Inc. | $703,351 | ||
| 32,141 | Hawaiian Holdings, Inc. | 1,324,209 | ||
| 15,839 | Southwest Airlines Co. | 836,775 | ||
| 2,864,335 | ||||
| Building Products – 3.4% | ||||
| 14,030 | Trex Co., Inc. (a) | 1,457,436 | ||
| Capital Markets – 9.8% | ||||
| 4,639 | Affiliated Managers Group, Inc. | 764,785 | ||
| 19,900 | Janus Henderson Group PLC | 628,641 | ||
| 11,739 | MSCI, Inc. | 1,758,854 | ||
| 101,380 | WisdomTree Investments, Inc. | 1,071,587 | ||
| 4,223,867 | ||||
| Communications Equipment – 2.6% | ||||
| 13,586 | Applied Optoelectronics, Inc. (a) | 434,209 | ||
| 26,291 | Ciena Corp. (a) | 676,993 | ||
| 1,111,202 | ||||
| Electronic Equipment, Instruments & Components – 3.8% | ||||
| 35,234 | Cognex Corp. | 1,629,572 | ||
| Food Products – 1.4% | ||||
| 12,280 | Cal-Maine Foods, Inc. (a) | 598,036 | ||
| Health Care Equipment & Supplies – 9.7% | ||||
| 8,867 | ABIOMED, Inc. (a) | 2,668,524 | ||
| 14,344 | Hologic, Inc. (a) | 556,404 | ||
| 10,687 | Masimo Corp. (a) | 958,944 | ||
| 4,183,872 | ||||
| Healthcare Providers & Services – 1.8% | ||||
| 7,982 | HCA Healthcare, Inc. | 764,197 | ||
| Hotels, Restaurants & Leisure – 8.3% | ||||
| 23,973 | BJ’s Restaurants, Inc. | 1,338,892 | ||
| 46,796 | Boyd Gaming Corp. | 1,554,095 | ||
| 16,123 | Dave & Buster’s Entertainment, Inc. (a) | 685,066 | ||
| 3,578,053 | ||||
| Household Durables – 6.1% | ||||
| 54,901 | KB Home | 1,457,622 | ||
| 28,244 | Toll Brothers, Inc. | 1,190,767 | ||
| 2,648,389 | ||||
| Internet Software & Services – 2.0% | ||||
| 4,930 | Facebook, Inc., Class A (a) | 847,960 | ||
| Shares | Description | Value | ||
| IT Services – 4.3% | ||||
| 2,477 | Alliance Data Systems Corp. | $502,955 | ||
| 16,827 | Cognizant Technology Solutions Corp., Class A | 1,376,785 | ||
| 1,879,740 | ||||
| Leisure Products – 4.6% | ||||
| 84,657 | Callaway Golf Co. | 1,461,180 | ||
| 36,355 | Nautilus, Inc. (a) | 528,965 | ||
| 1,990,145 | ||||
| Machinery – 5.3% | ||||
| 29,449 | Trinity Industries, Inc. | 938,540 | ||
| 68,352 | Wabash National Corp. | 1,371,141 | ||
| 2,309,681 | ||||
| Oil, Gas & Consumable Fuels – 2.5% | ||||
| 9,982 | Valero Energy Corp. | 1,107,303 | ||
| Paper & Forest Products – 2.8% | ||||
| 16,088 | Boise Cascade Co. | 669,261 | ||
| 18,798 | Louisiana-Pacific Corp. | 532,547 | ||
| 1,201,808 | ||||
| Road & Rail – 6.3% | ||||
| 9,179 | Old Dominion Freight Line, Inc. | 1,228,701 | ||
| 22,664 | Saia, Inc. (a) | 1,496,957 | ||
| 2,725,658 | ||||
| Semiconductors & Semiconductor Equipment – 3.3% | ||||
| 12,206 | Monolithic Power Systems, Inc. | 1,429,323 | ||
| Software – 1.9% | ||||
| 57,685 | TiVo Corp. | 816,243 | ||
| Specialty Retail – 0.5% | ||||
| 11,986 | Bed Bath & Beyond, Inc. | 209,276 | ||
| Textiles, Apparel & Luxury Goods – 4.5% | ||||
| 23,363 | Skechers U.S.A., Inc., Class A (a) | 665,846 | ||
| 27,010 | Steven Madden Ltd. | 1,303,232 | ||
| 1,969,078 | ||||
| Thrifts & Mortgage Finance – 1.8% | ||||
| 13,562 | Walker & Dunlop, Inc. | 774,526 | ||
| Shares | Description | Value | ||
| COMMON STOCKS (Continued) | ||||
| Tobacco – 1.5% | ||||
| 11,967 | Altria Group, Inc. | $671,468 | ||
| Total Investments – 94.8% | 40,991,168 | |||
| (Cost $32,305,773) (b) | ||||
| Net Other Assets and Liabilities – 5.2% | 2,242,503 | |||
| Net Assets – 100.0% | $43,233,671 | |||
| (a) | Non-income producing security. |
| (b) | Aggregate cost for financial reporting purposes approximates the aggregate cost for federal income tax purposes. As of April 30, 2018, the aggregate gross unrealized appreciation for all investments in which there was an excess of value over tax cost was $10,158,752 and the aggregate gross unrealized depreciation for all investments in which there was an excess of tax cost over value was $1,473,357. The net unrealized appreciation was $8,685,395. |
| Total Value at 4/30/2018 | Level 1 Quoted Prices | Level 2 Significant Observable Inputs | Level 3 Significant Unobservable Inputs | |
| Common Stocks* | $ 40,991,168 | $ 40,991,168 | $ — | $ — |
| * | See Portfolio of Investments for industry breakout. |
| ASSETS: | |
Investments, at value (Cost $32,305,773) | $ 40,991,168 |
Cash | 2,314,091 |
Fund shares sold receivable | 59,526 |
Prepaid expenses | 22,239 |
Total Assets | 43,387,024 |
| LIABILITIES: | |
| Payables: | |
Fund shares repurchased | 62,611 |
Investment advisory fees | 20,690 |
12b-1 distribution and service fees | 19,212 |
Audit and tax fees | 17,652 |
Administrative fees | 8,715 |
Printing fees | 8,700 |
Transfer agent fees | 8,131 |
Registration fees | 2,129 |
Commitment fees | 1,787 |
Financial reporting fees | 1,036 |
Trustees’ fees and expenses | 1,002 |
Legal fees | 818 |
Custodian fees | 284 |
Other liabilities | 586 |
Total Liabilities | 153,353 |
NET ASSETS | $43,233,671 |
| NET ASSETS consist of: | |
Paid-in capital | $ 31,990,840 |
Par value | 15,812 |
Accumulated net investment income (loss) | (216,258) |
Accumulated net realized gain (loss) on investments | 2,757,882 |
Net unrealized appreciation (depreciation) on investments | 8,685,395 |
NET ASSETS | $43,233,671 |
| Maximum Offering Price Per Share: | |
| Class A Shares: | |
Net asset value and redemption price per share (Based on net assets of $23,986,011 and 870,880 shares of beneficial interest issued and outstanding) | $27.54 |
Maximum sales charge (5.50% of offering price) | 1.60 |
Maximum offering price to public | $29.14 |
| Class C Shares: | |
Net asset value and redemption price per share (Based on net assets of $16,976,322 and 627,667 shares of beneficial interest issued and outstanding) | $27.05 |
| Class I Shares: | |
Net asset value and redemption price per share (Based on net assets of $2,271,338 and 82,666 shares of beneficial interest issued and outstanding) | $27.48 |
| INVESTMENT INCOME: | ||
Dividends | $ 198,127 | |
Interest | 5,746 | |
Total investment income | 203,873 | |
| EXPENSES: | ||
Investment advisory fees | 222,256 | |
| 12b-1 distribution and/or service fees: | ||
Class A | 29,478 | |
Class C | 90,588 | |
Transfer agent fees | 47,355 | |
Registration fees | 27,511 | |
Administrative fees | 26,035 | |
Audit and tax fees | 13,931 | |
Printing fees | 11,699 | |
Commitment and agency fees | 10,691 | |
Legal fees | 9,817 | |
Trustees’ fees and expenses | 7,448 | |
Financial reporting fees | 4,891 | |
Custodian fees | 2,223 | |
Listing expense | 891 | |
Other | 1,760 | |
Total expenses | 506,574 | |
Fees waived by the investment advisor | (86,443) | |
Net expenses | 420,131 | |
NET INVESTMENT INCOME (LOSS) | (216,258) | |
| NET REALIZED AND UNREALIZED GAIN (LOSS): | ||
Net realized gain (loss) on investments | 2,765,050 | |
Net change in unrealized appreciation (depreciation) on investments | (1,381,449) | |
NET REALIZED AND UNREALIZED GAIN (LOSS) | 1,383,601 | |
NET INCREASE (DECREASE) IN NET ASSETS RESULTING FROM OPERATIONS | $ 1,167,343 | |
| Six Months Ended 4/30/2018 (Unaudited) | Year Ended 10/31/2017 | ||
| OPERATIONS: | |||
Net investment income (loss) | $ (216,258) | $ (324,217) | |
Net realized gain (loss) | 2,765,050 | 1,500,421 | |
Net change in unrealized appreciation (depreciation) | (1,381,449) | 9,308,457 | |
Net increase (decrease) in net assets resulting from operations | 1,167,343 | 10,484,661 | |
| DISTRIBUTIONS TO SHAREHOLDERS FROM NET REALIZED GAIN: | |||
Class A Shares | (598,812) | (136,704) | |
Class C Shares | (501,248) | (175,390) | |
Class I Shares | (81,020) | (34,397) | |
Total distributions to shareholders | (1,181,080) | (346,491) | |
| CAPITAL TRANSACTIONS: | |||
Proceeds from shares sold | 6,706,014 | 17,450,833 | |
Proceeds from shares reinvested | 1,133,188 | 335,557 | |
Cost of shares redeemed | (8,088,326) | (9,871,258) | |
Net increase (decrease) in net assets resulting from capital transactions | (249,124) | 7,915,132 | |
Total increase (decrease) in net assets | (262,861) | 18,053,302 | |
| NET ASSETS: | |||
Beginning of period | 43,496,532 | 25,443,230 | |
End of period | $43,233,671 | $43,496,532 | |
Accumulated net investment income (loss) at end of period | $(216,258) | $— |
| Class A Shares | Six Months Ended 4/30/2018 (Unaudited) | Year Ended 10/31/2017 | Period Ended 10/31/2016 (a) | ||
Net asset value, beginning of period | $ 27.51 | $ 20.42 | $ 20.00 | ||
| Income from investment operations: | |||||
Net investment income (loss) (b) | (0.10) | (0.14) | (0.08) | ||
Net realized and unrealized gain (loss) | 0.89 | 7.50 | 0.50 | ||
Total from investment operations | 0.79 | 7.36 | 0.42 | ||
| Distributions paid to shareholders from: | |||||
Net realized gain | (0.76) | (0.27) | — | ||
Net asset value, end of period | $27.54 | $27.51 | $20.42 | ||
Total return (c) | 2.80% | 36.26% | 2.10% | ||
| Ratios to average net assets/supplemental data: | |||||
Net assets, end of period (in 000’s) | $ 23,986 | $ 22,117 | $ 10,527 | ||
Ratio of total expenses to average net assets | 1.93% (d) | 1.91% | 2.65% (d) | ||
Ratio of net expenses to average net assets | 1.60% (d) | 1.60% | 1.60% (d) | ||
Ratio of net investment income (loss) to average net assets | (0.68)% (d) | (0.58)% | (0.42)% (d) | ||
Portfolio turnover rate | 21% | 38% | 57% |
| (a) | Class A Shares were initially seeded on November 9, 2015 and commenced operations on November 10, 2015. |
| (b) | Based on average shares outstanding. |
| (c) | Assumes reinvestment of all distributions for the period and does not include payment of the maximum sales charge of 5.50% or contingent deferred sales charge (CDSC). On purchases of $1 million or more, a CDSC of 1% may be imposed on certain redemptions made within twelve months of purchase. If the sales charges were included, total returns would be lower. These returns include Rule 12b-1 service fees of 0.25% and do not reflect the deduction of taxes that a shareholder would pay on Fund distributions or the redemption of Fund shares. The total returns would have been lower if certain fees had not been waived and expenses reimbursed by the investment advisor. Total return is calculated for the time period presented and is not annualized for periods of less than one year. |
| (d) | Annualized. |
| Class C Shares | Six Months Ended 4/30/2018 (Unaudited) | Year Ended 10/31/2017 | Period Ended 10/31/2016 (a) | ||
Net asset value, beginning of period | $ 27.13 | $ 20.29 | $ 20.00 | ||
| Income from investment operations: | |||||
Net investment income (loss) (b) | (0.20) | (0.31) | (0.23) | ||
Net realized and unrealized gain (loss) | 0.88 | 7.42 | 0.52 | ||
Total from investment operations | 0.68 | 7.11 | 0.29 | ||
| Distributions paid to shareholders from: | |||||
Net realized gain | (0.76) | (0.27) | — | ||
Net asset value, end of period | $27.05 | $27.13 | $20.29 | ||
Total return (c) | 2.39% | 35.25% | 1.45% | ||
| Ratios to average net assets/supplemental data: | |||||
Net assets, end of period (in 000’s) | $ 16,976 | $ 18,370 | $ 12,416 | ||
Ratio of total expenses to average net assets | 2.73% (d) | 2.72% | 3.48% (d) | ||
Ratio of net expenses to average net assets | 2.35% (d) | 2.35% | 2.35% (d) | ||
Ratio of net investment income (loss) to average net assets | (1.43)% (d) | (1.31)% | (1.17)% (d) | ||
Portfolio turnover rate | 21% | 38% | 57% |
| (a) | Class C Shares were initially seeded on November 9, 2015 and commenced operations on November 10, 2015. |
| (b) | Based on average shares outstanding. |
| (c) | Assumes reinvestment of all distributions for the period and does not include payment of the maximum CDSC of 1%, charged on certain redemptions made within one year of purchase. If the sales charge was included, total returns would be lower. These returns include combined Rule 12b-1 distribution and service fees of 1% and do not reflect the deduction of taxes that a shareholder would pay on Fund distributions or the redemption of Fund shares. The total returns would have been lower if certain fees had not been waived and expenses reimbursed by the investment advisor. Total return is calculated for the time period presented and is not annualized for periods of less than one year. |
| (d) | Annualized. |
| Class I Shares | Six Months Ended 4/30/2018 (Unaudited) | Year Ended 10/31/2017 | Period Ended 10/31/2016 (a) | ||
Net asset value, beginning of period | $ 27.42 | $ 20.30 | $ 20.00 | ||
| Income from investment operations: | |||||
Net investment income (loss) (b) | (0.06) | (0.07) | (0.03) | ||
Net realized and unrealized gain (loss) | 0.88 | 7.46 | 0.33 | ||
Total from investment operations | 0.82 | 7.39 | 0.30 | ||
| Distributions paid to shareholders from: | |||||
Net realized gain | (0.76) | (0.27) | — | ||
Net asset value, end of period | $27.48 | $27.42 | $20.30 | ||
Total return (c) | 2.92% | 36.58% | 1.50% | ||
| Ratios to average net assets/supplemental data: | |||||
Net assets, end of period (in 000’s) | $ 2,271 | $ 3,010 | $ 2,500 | ||
Ratio of total expenses to average net assets | 2.29% (d) | 2.22% | 3.08% (d) | ||
Ratio of net expenses to average net assets | 1.35% (d) | 1.35% | 1.35% (d) | ||
Ratio of net investment income (loss) to average net assets | (0.43)% (d) | (0.31)% | (0.15)% (d) | ||
Portfolio turnover rate | 21% | 38% | 57% |
| (a) | Class I Shares were initially seeded on November 9, 2015 and commenced operations on November 10, 2015. |
| (b) | Based on average shares outstanding. |
| (c) | Assumes reinvestment of all distributions for the period. These returns do not reflect the deduction of taxes that a shareholder would pay on Fund distributions or the redemption of Fund shares. The total returns would have been lower if certain fees had not been waived and expenses reimbursed by the investment advisor. Total return is calculated for the time period presented and is not annualized for periods of less than one year. |
| (d) | Annualized. |
| 1) | the type of security; |
| 2) | the size of the holding; |
| 3) | the initial cost of the security; |
| 4) | transactions in comparable securities; |
| 5) | price quotes from dealers and/or third-party pricing services; |
| 6) | relationships among various securities; |
| 7) | information obtained by contacting the issuer, analysts, or the appropriate stock exchange; |
| 8) | an analysis of the issuer’s financial statements; and |
| 9) | the existence of merger proposals or tender offers that might affect the value of the security. |
| • | Level 1 – Level 1 inputs are quoted prices in active markets for identical investments. An active market is a market in which transactions for the investment occur with sufficient frequency and volume to provide pricing information on an ongoing basis. |
| • | Level 2 – Level 2 inputs are observable inputs, either directly or indirectly, and include the following: |
| o | Quoted prices for similar investments in active markets. |
| o | Quoted prices for identical or similar investments in markets that are non-active. A non-active market is a market where there are few transactions for the investment, the prices are not current, or price quotations vary substantially either over time or among market makers, or in which little information is released publicly. |
| o | Inputs other than quoted prices that are observable for the investment (for example, interest rates and yield curves observable at commonly quoted intervals, volatilities, prepayment speeds, loss severities, credit risks, and default rates). |
| o | Inputs that are derived principally from or corroborated by observable market data by correlation or other means. |
| • | Level 3 – Level 3 inputs are unobservable inputs. Unobservable inputs may reflect the reporting entity’s own assumptions about the assumptions that market participants would use in pricing the investment. |
| Distributions paid from: | |
Ordinary income | $346,491 |
Capital gains | — |
Return of capital | — |
Undistributed ordinary income | $187,157 |
Undistributed capital gains | 1,000,853 |
Total undistributed earnings | 1,188,010 |
Accumulated capital and other losses | — |
Net unrealized appreciation (depreciation) | 10,052,746 |
Total accumulated earnings (losses) | 11,240,756 |
Other | — |
Paid-in capital | 32,255,776 |
Total net assets | $43,496,532 |
| Expenses Subject to Recovery | ||||||||||
| Advisory Fee Waiver | Expense Reimbursement | Period Ended October 31, 2016 | Year Ended October 31, 2017 | Six Months Ended April 30, 2018 | Total | |||||
| $ 86,443 | $ — | $ 183,866 | $ 136,315 | $ 86,443 | $ 406,624 | |||||
| Six Months Ended April 30, 2018 | Year Ended October 31, 2017 | ||||||
| Shares | Value | Shares | Value | ||||
| Sales: | |||||||
| Class A | 187,834 | $ 5,311,730 | 462,184 | $ 11,181,772 | |||
| Class C | 42,968 | 1,188,572 | 251,766 | 5,835,596 | |||
| Class I | 7,296 | 205,712 | 18,828 | 433,465 | |||
| Total Sales | 238,098 | $ 6,706,014 | 732,778 | $ 17,450,833 | |||
| Dividend Reinvestment: | |||||||
| Class A | 20,407 | $ 576,285 | 5,645 | $ 132,534 | |||
| Class C | 17,168 | 477,449 | 7,273 | 169,472 | |||
| Class I | 2,822 | 79,454 | 1,437 | 33,551 | |||
| Total Dividend Reinvestment | 40,397 | $ 1,133,188 | 14,355 | $ 335,557 | |||
| Redemptions: | |||||||
| Class A | (141,290) | $ (3,964,803) | (179,401) | $ (4,388,385) | |||
| Class C | (109,535) | (3,050,252) | (193,883) | (4,691,632) | |||
| Class I | (37,235) | (1,073,271) | (33,649) | (791,241) | |||
| Total Redemptions | (288,060) | $ (8,088,326) | (406,933) | $ (9,871,258) | |||

FUND ACCOUNTANT &
CUSTODIAN
PUBLIC ACCOUNTING FIRM
Item 2. Code of Ethics.
Not applicable.
Item 3. Audit Committee Financial Expert.
Not applicable.
Item 4. Principal Accountant Fees and Services.
Not applicable.
Item 5. Audit Committee of Listed registrants.
Not applicable.
Item 6. Investments.
| (a) | Schedule of Investments in securities of unaffiliated issuers as of the close of the reporting period is included as part of the report to shareholders filed under Item 1 of this form. |
| (b) | Not applicable. |
Item 7. Disclosure of Proxy Voting Policies and Procedures for Closed-End Management Investment Companies.
Not applicable.
Item 8. Portfolio Managers of Closed-End Management Investment Companies.
Not applicable.
Item 9. Purchases of Equity Securities by Closed-End Management Investment Company and Affiliated Purchasers.
Not applicable.
Item 10. Submission of Matters to a Vote of Security Holders.
Not applicable.
Item 11. Controls and Procedures.
| (a) | The registrant’s principal executive and principal financial officers, or persons performing similar functions, have concluded that the registrant’s disclosure controls and procedures (as defined in Rule 30a-3(c) under the Investment Company Act of 1940, as amended (the “1940 Act”) (17 CFR 270.30a-3(c))) are effective, as of a date within 90 days of the filing date of the report that includes the disclosure required by this paragraph, based on their evaluation of these controls and procedures required by Rule 30a-3(b) under the 1940 Act (17 CFR 270.30a-3(b)) and Rules 13a-15(b) or 15d-15(b) under the Securities Exchange Act of 1934, as amended (17 CFR 240.13a-15(b) or 240.15d-15(b)). |
| (b) | There were no changes in the registrant’s internal control over financial reporting (as defined in Rule 30a-3(d) under the 1940 Act (17 CFR 270.30a-3(d)) that occurred during the period covered by this report that has materially affected, or is reasonably likely to materially affect, the registrant’s internal control over financial reporting. |
Item 12. Disclosure of Securities Lending Activities for Closed-End Management Investment Companies.
Not applicable.
Item 13. Exhibits.
| (a)(1) | Not applicable. |
| (a)(2) | Certifications pursuant to Rule 30a-2(a) under the 1940 Act and Section 302 of the Sarbanes-Oxley Act of 2002 are attached hereto. |
| (a)(3) | Not applicable. |
| (a)(4) | Not applicable. |
| (b) | Certifications pursuant to Rule 30a-2(b) under the 1940 Act and Section 906 of the Sarbanes- Oxley Act of 2002 are attached hereto. |
SIGNATURES
Pursuant to the requirements of the Securities Exchange Act of 1934 and the Investment Company Act of 1940, the registrant has duly caused this report to be signed on its behalf by the undersigned, thereunto duly authorized.
| (registrant) | First Trust Series Fund |
| By (Signature and Title)* | /s/ James M. Dykas | |
| James M. Dykas, President and Chief Executive Officer (principal executive officer) |
| Date: | July 9, 2018 |
Pursuant to the requirements of the Securities Exchange Act of 1934 and the Investment Company Act of 1940, this report has been signed below by the following persons on behalf of the registrant and in the capacities and on the dates indicated.
| By (Signature and Title)* | /s/ James M. Dykas | |
| James M. Dykas, President and Chief Executive Officer (principal executive officer) |
| Date: | July 9, 2018 |
| By (Signature and Title)* | /s/ Donald P. Swade | |
| Donald P. Swade, Treasurer, Chief Financial Officer and Chief Accounting Officer (principal financial officer) |
| Date: | July 9, 2018 |
* Print the name and title of each signing officer under his or her signature.