Exhibit (C)(4)

Private & Confidential [***] indicates information has been omitted on the basis of a confidential treatment request pursuant to Rule 24b - 2 of the Securities Exchange Act of 1934, as amended. This information has been filed separately with the Securities and Exchange Commission. Project Cheetah Special Committee Materials for Discussion June 26, 2024
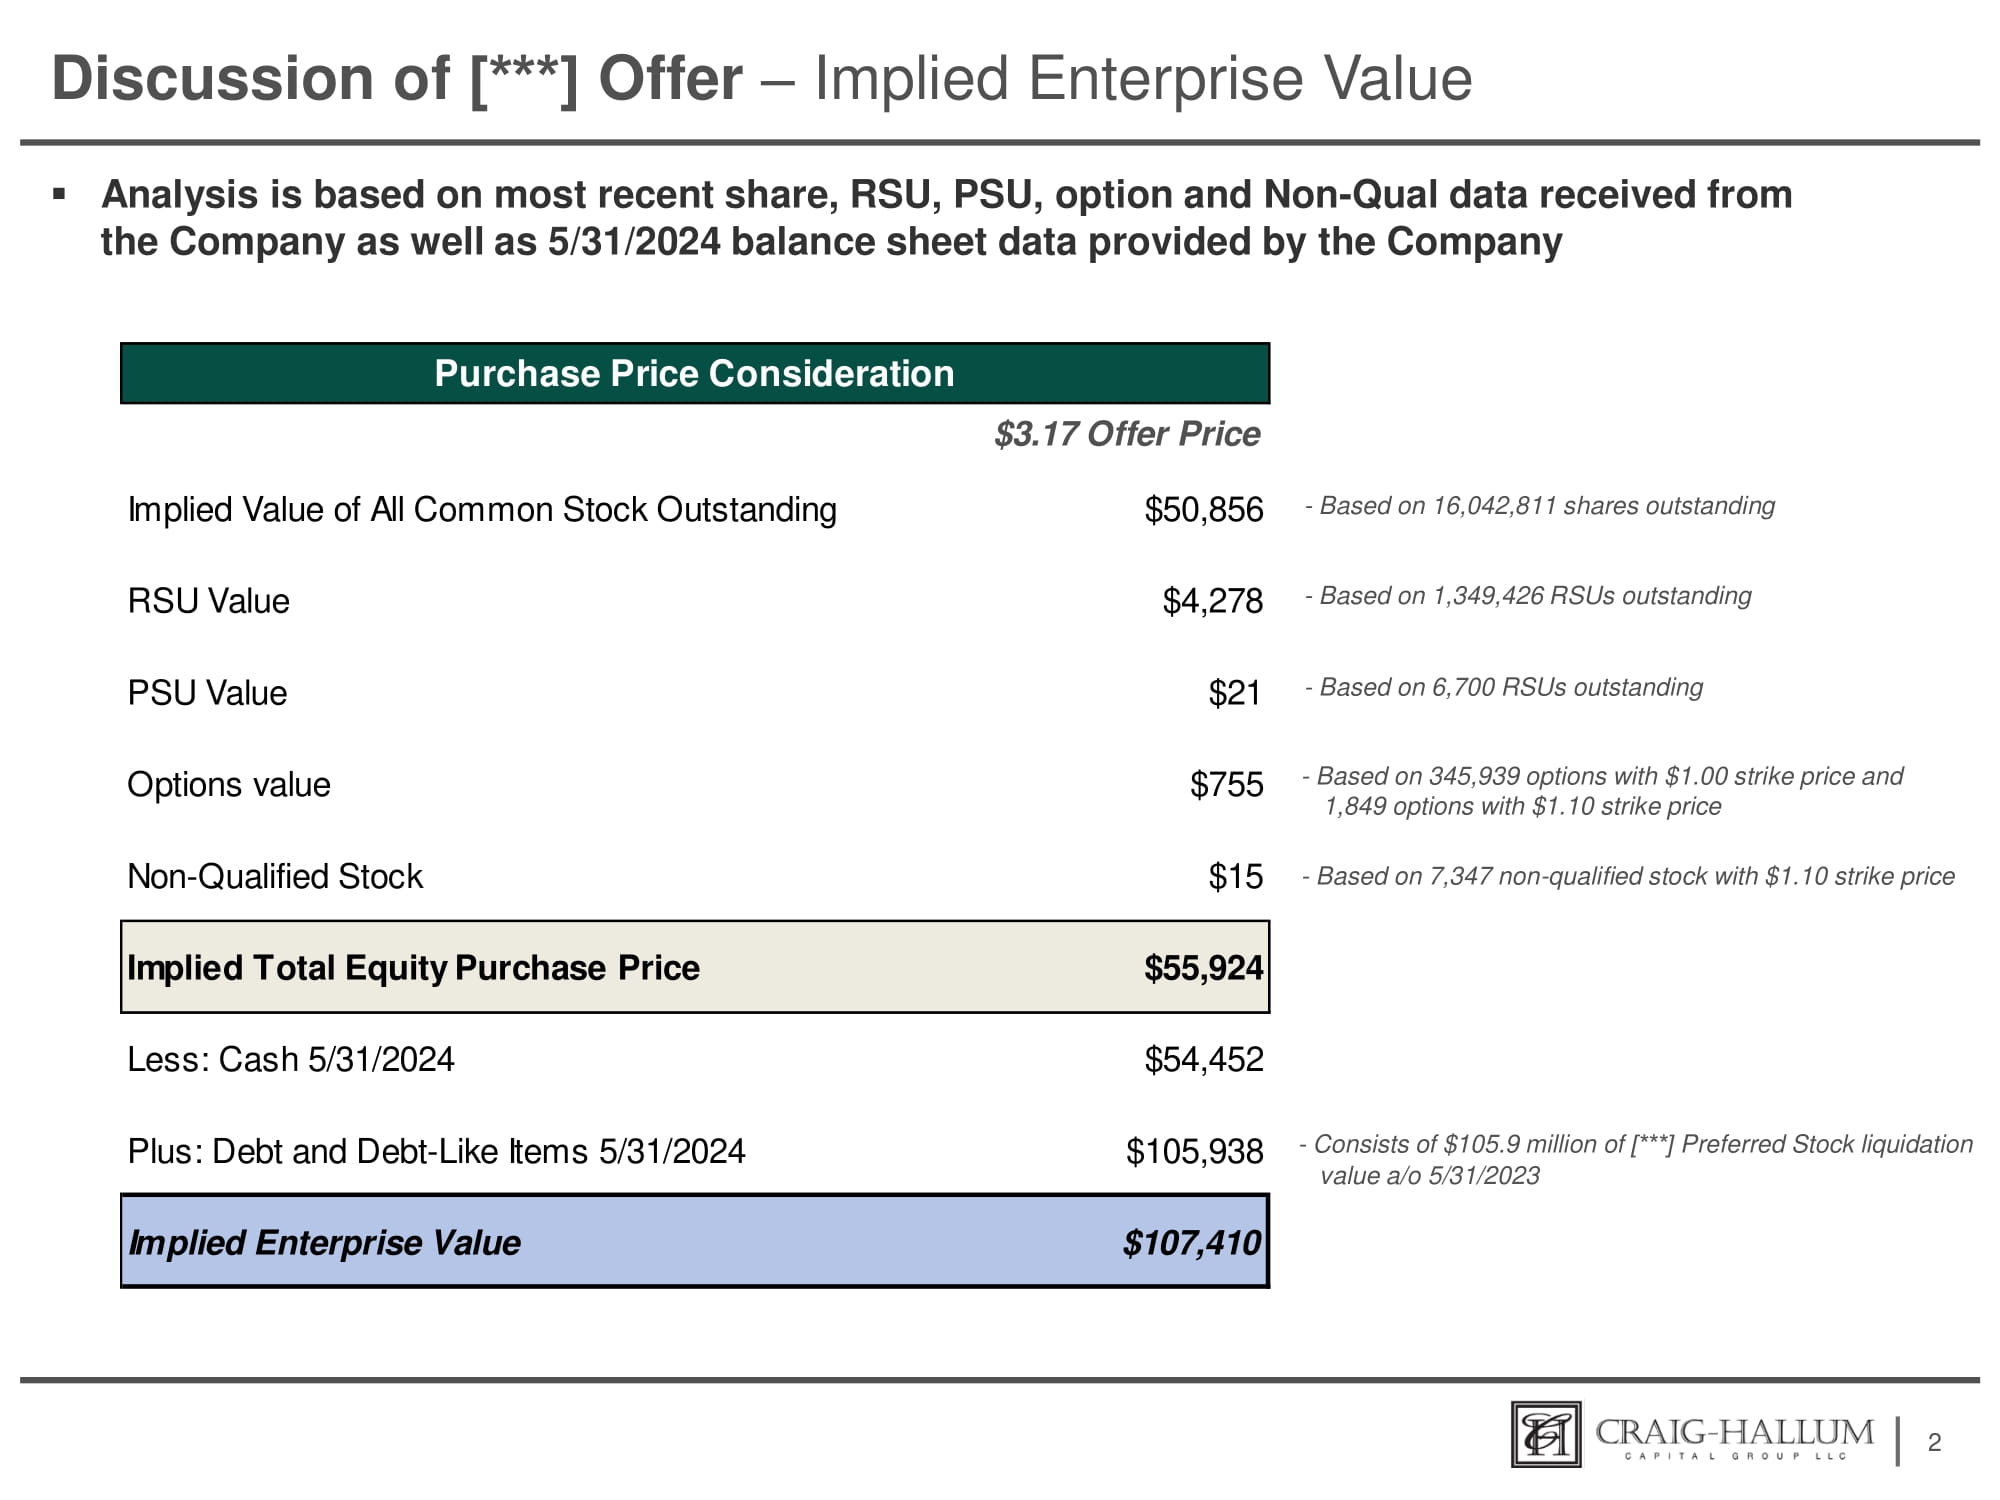
Discussion of [***] Offer – Implied Enterprise Value ▪ Analysis is based on most recent share, RSU, PSU, option and Non - Qual data received from the Company as well as 5/31/2024 balance sheet data provided by the Company 2 - Based on 16,042,811 shares outstanding - Based on 1,349,426 RSUs outstanding - Based on 6,700 RSUs outstanding - Based on 345,939 options with $1.00 strike price and 1,849 options with $1.10 strike price - Based on 7,347 non - qualified stock with $1.10 strike price - Consists of $105.9 million of [***] Preferred Stock liquidation value a/o 5/31/2023 Purchase Price Consideration $3.17 Offer Price $50,856 Implied Value of All Common Stock Outstanding $4,278 RSU Value $21 PSU Value $755 Options value $15 Non - Qualified Stock $55,924 Implied Total Equity Purchase Price $54,452 Less: Cash 5/31/2024 $105,938 Plus: Debt and Debt - Like Items 5/31/2024 $107,410 Implied Enterprise Value
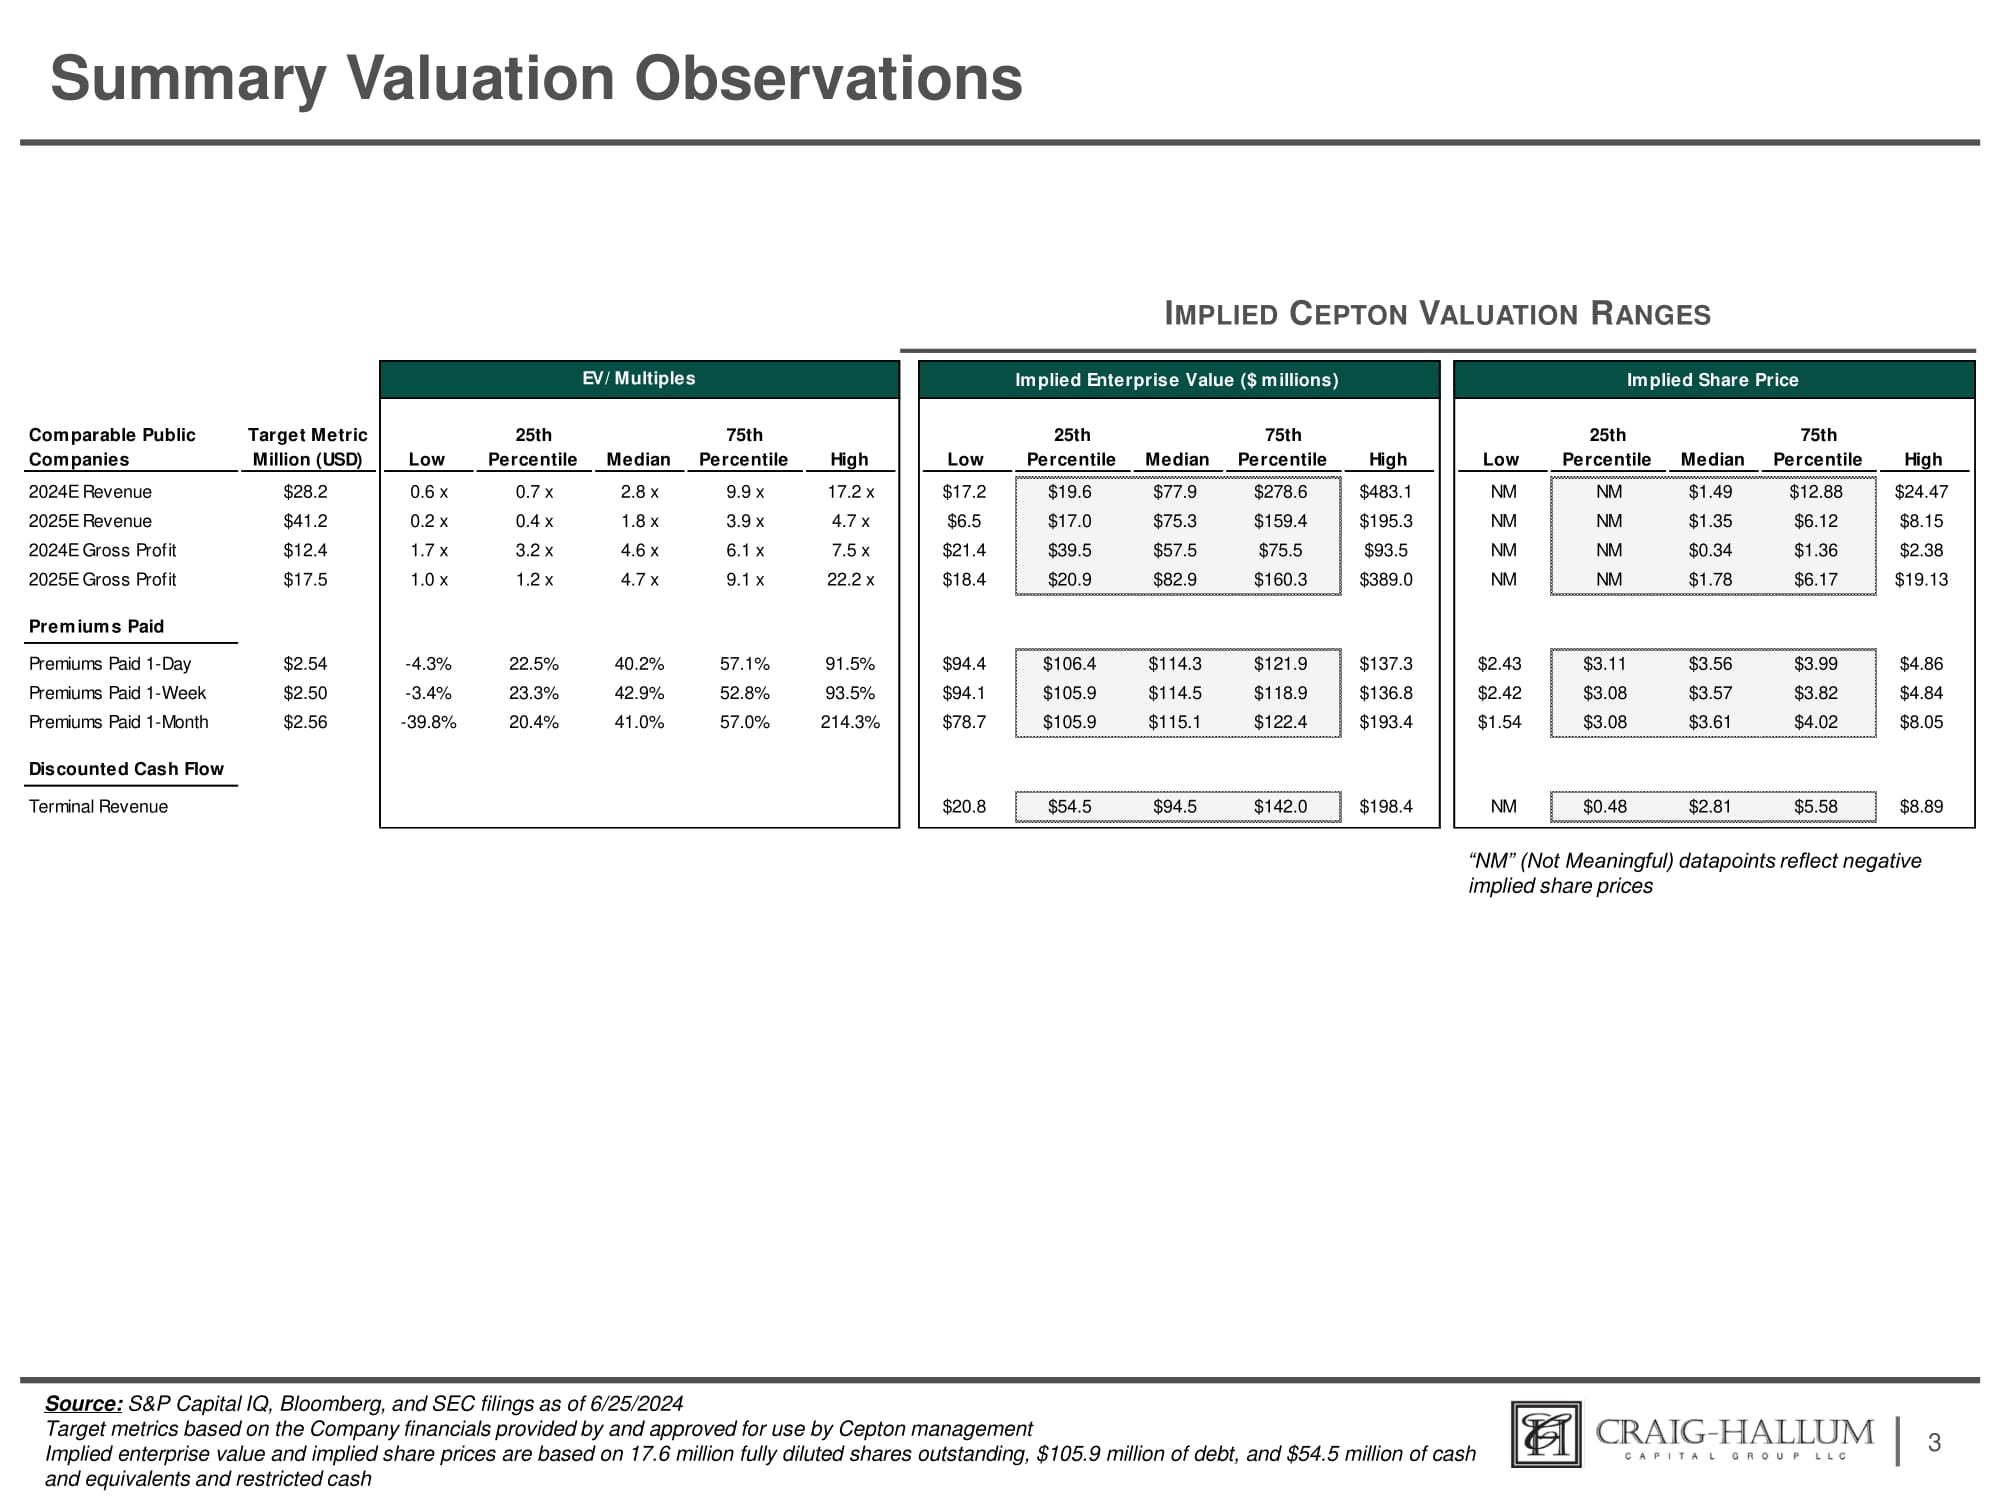
Summary Valuation Observations 3 I MPLIED C EPTON V ALUATION R ANGES Source: S&P Capital IQ, Bloomberg, and SEC filings as of 6/25/2024 Target metrics based on the Company financials provided by and approved for use by Cepton management Implied enterprise value and implied share prices are based on 17.6 million fully diluted shares outstanding, $105.9 million of debt, and $54.5 million of cash and equivalents and restricted cash “NM” (Not Meaningful) datapoints reflect negative implied share prices Comparable Public Companies Target Metric Million (USD) 25th 75th Low Percentile Median Percentile High 2024E Revenue 2025E Revenue 2024E Gross Profit 2025E Gross Profit $28.2 $41.2 $12.4 $17.5 0.6 x 0.2 x 1.7 x 1.0 x 0.7 x 0.4 x 3.2 x 1.2 x 2.8 x 1.8 x 4.6 x 4.7 x 9.9 x 3.9 x 6.1 x 9.1 x 17.2 x 4.7 x 7.5 x 22.2 x Premiums Paid Premiums Paid 1 - Day Premiums Paid 1 - Week Premiums Paid 1 - Month $2.54 $2.50 $2.56 - 4.3% 22.5% 40.2% 57.1% 91.5% - 3.4% 23.3% 42.9% 52.8% 93.5% - 39.8% 20.4% 41.0% 57.0% 214.3% Discounted Cash Flow Terminal Revenue Implied Enterprise Value ($ millions) 25th 75th Low Percentile Median Percentile High $483.1 $195.3 $93.5 $389.0 $19.6 $77.9 $278.6 $17.0 $75.3 $159.4 $39.5 $57.5 $75.5 $20.9 $82.9 $160.3 $17.2 $6.5 $21.4 $18.4 $94.4 $106.4 $114.3 $121.9 $137.3 $94.1 $105.9 $114.5 $118.9 $136.8 $78.7 $105.9 $115.1 $122.4 $193.4 $198.4 $54.5 $94.5 $142.0 $20.8 Implied Share Price High 75th Percentile Median 25th Percentile Low $24.47 $12.88 $1.49 NM NM $8.15 $6.12 $1.35 NM NM $2.38 $1.36 $0.34 NM NM $19.13 $6.17 $1.78 NM NM $4.86 $4.84 $8.05 $3.99 $3.82 $4.02 $3.56 $3.57 $3.61 $3.11 $3.08 $3.08 $2.43 $2.42 $1.54 $8.89 $5.58 $2.81 $0.48 NM EV/ Multiples
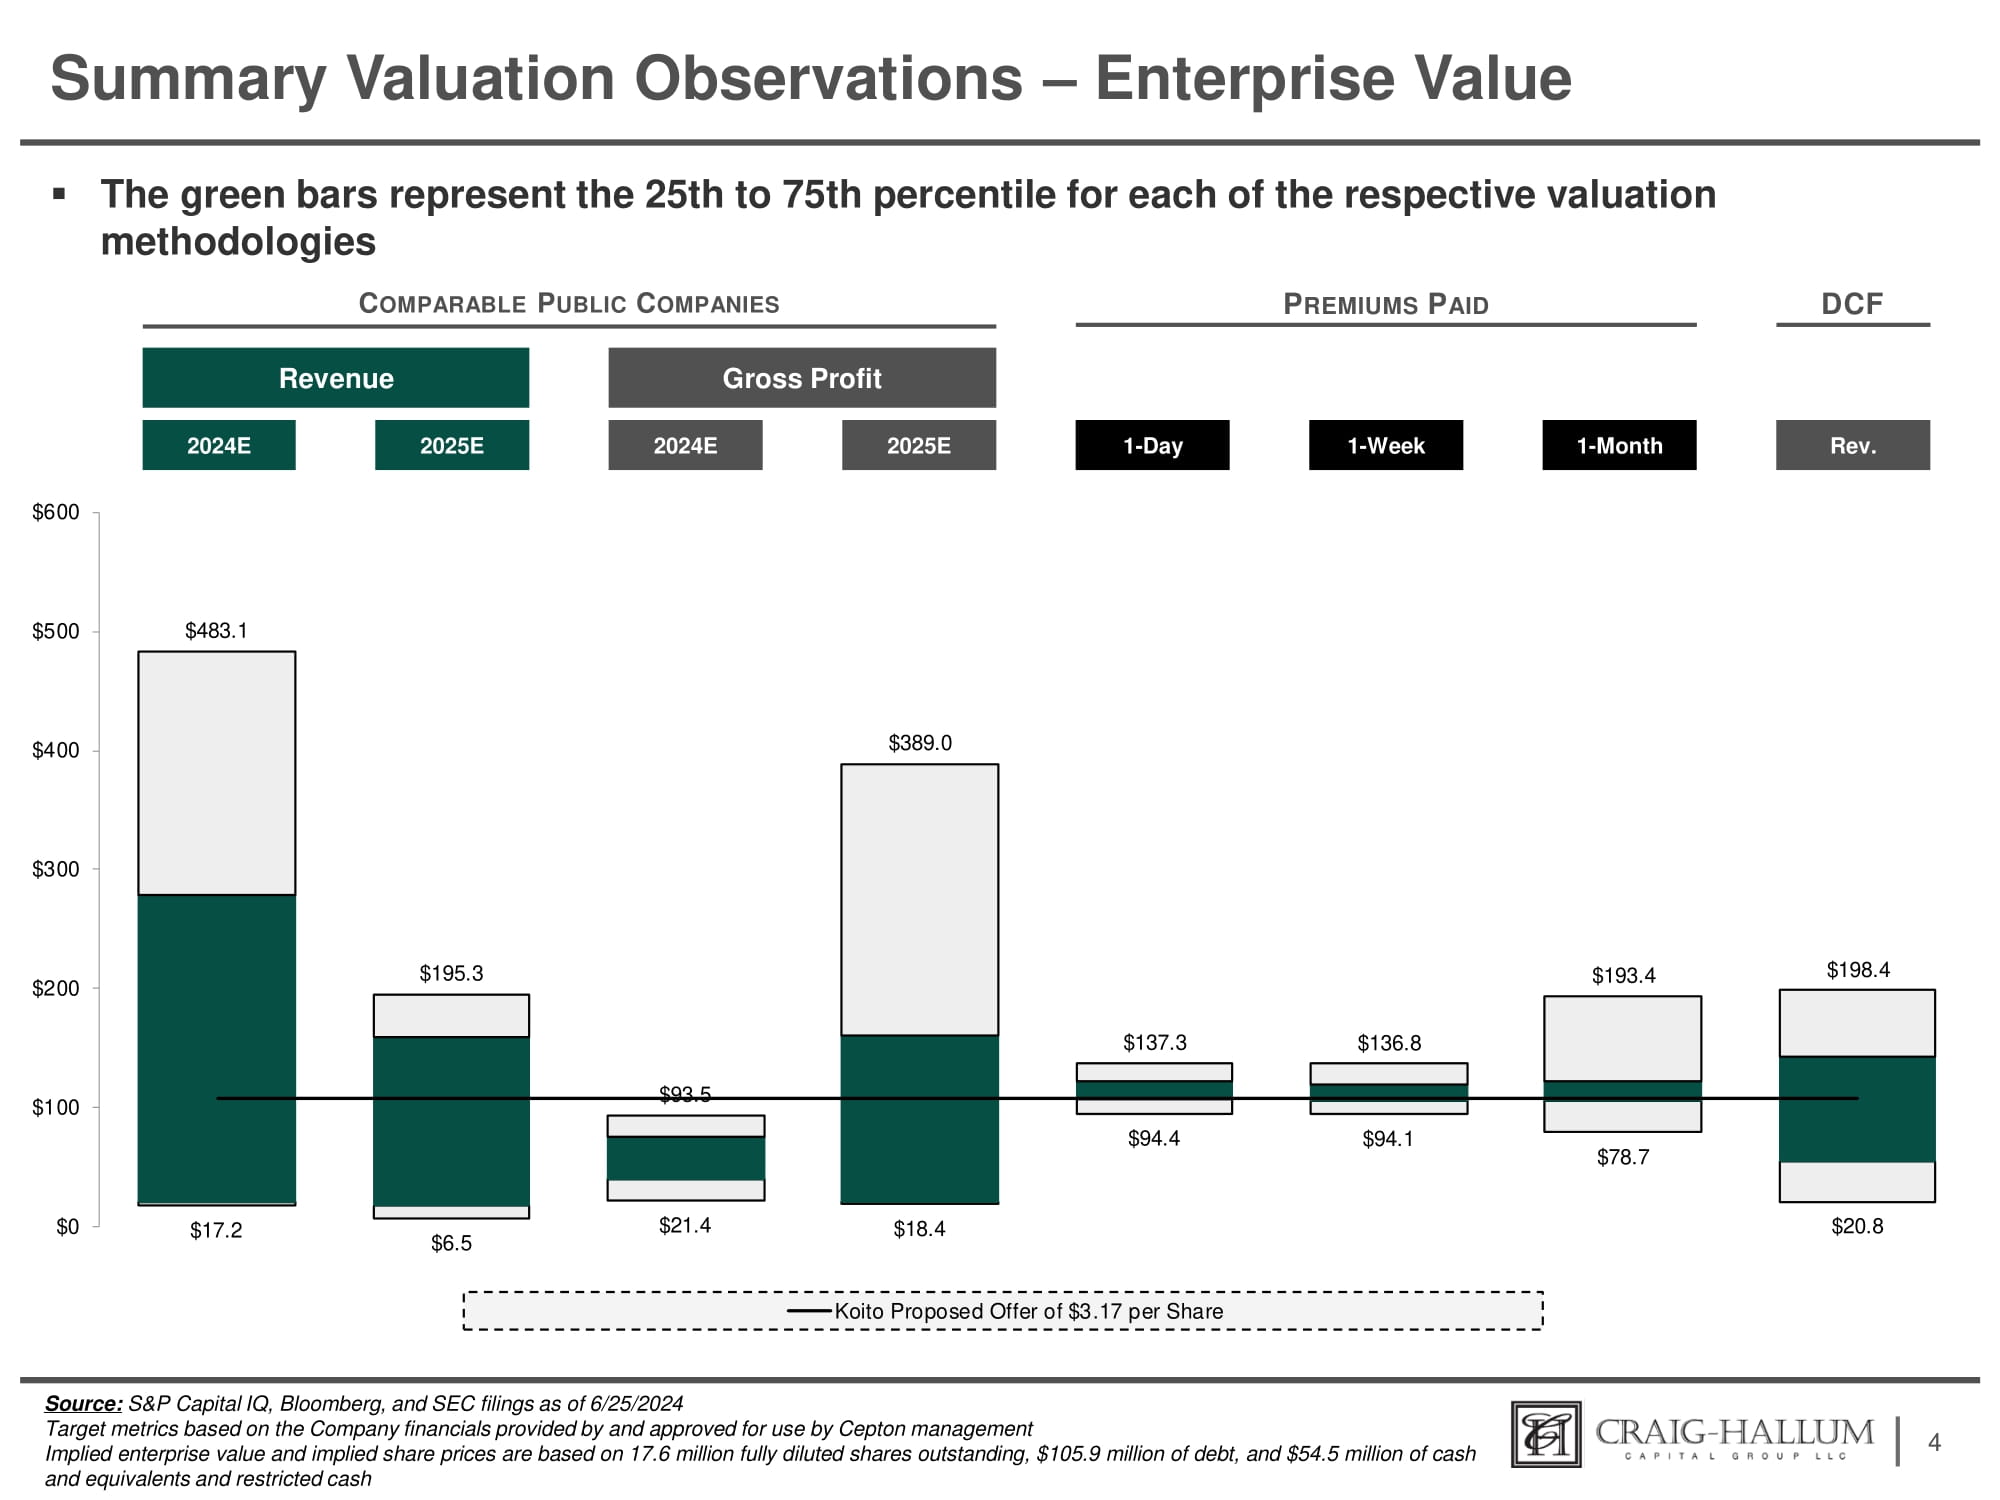
Summary Valuation Observations – Enterprise Value ▪ The green bars represent the 25th to 75th percentile for each of the respective valuation methodologies C OMPARABLE P UBLIC C OMPANIES P REMIUMS P AID 4 Revenue 2024E 2025E Gross Profit 2024E 2025E DCF Rev. 1 - Day 1 - Month 1 - Week Source: S&P Capital IQ, Bloomberg, and SEC filings as of 6/25/2024 Target metrics based on the Company financials provided by and approved for use by Cepton management Implied enterprise value and implied share prices are based on 17.6 million fully diluted shares outstanding, $105.9 million of debt, and $54.5 million of cash and equivalents and restricted cash $17.2 $6.5 $21.4 $18.4 $94.4 $94.1 $78.7 $20.8 $483.1 $195.3 $93.5 $389.0 $137.3 $136.8 $193.4 $198.4 $0 $100 $200 $300 $400 $500 $600 Koito Proposed Offer of $3.17 per Share
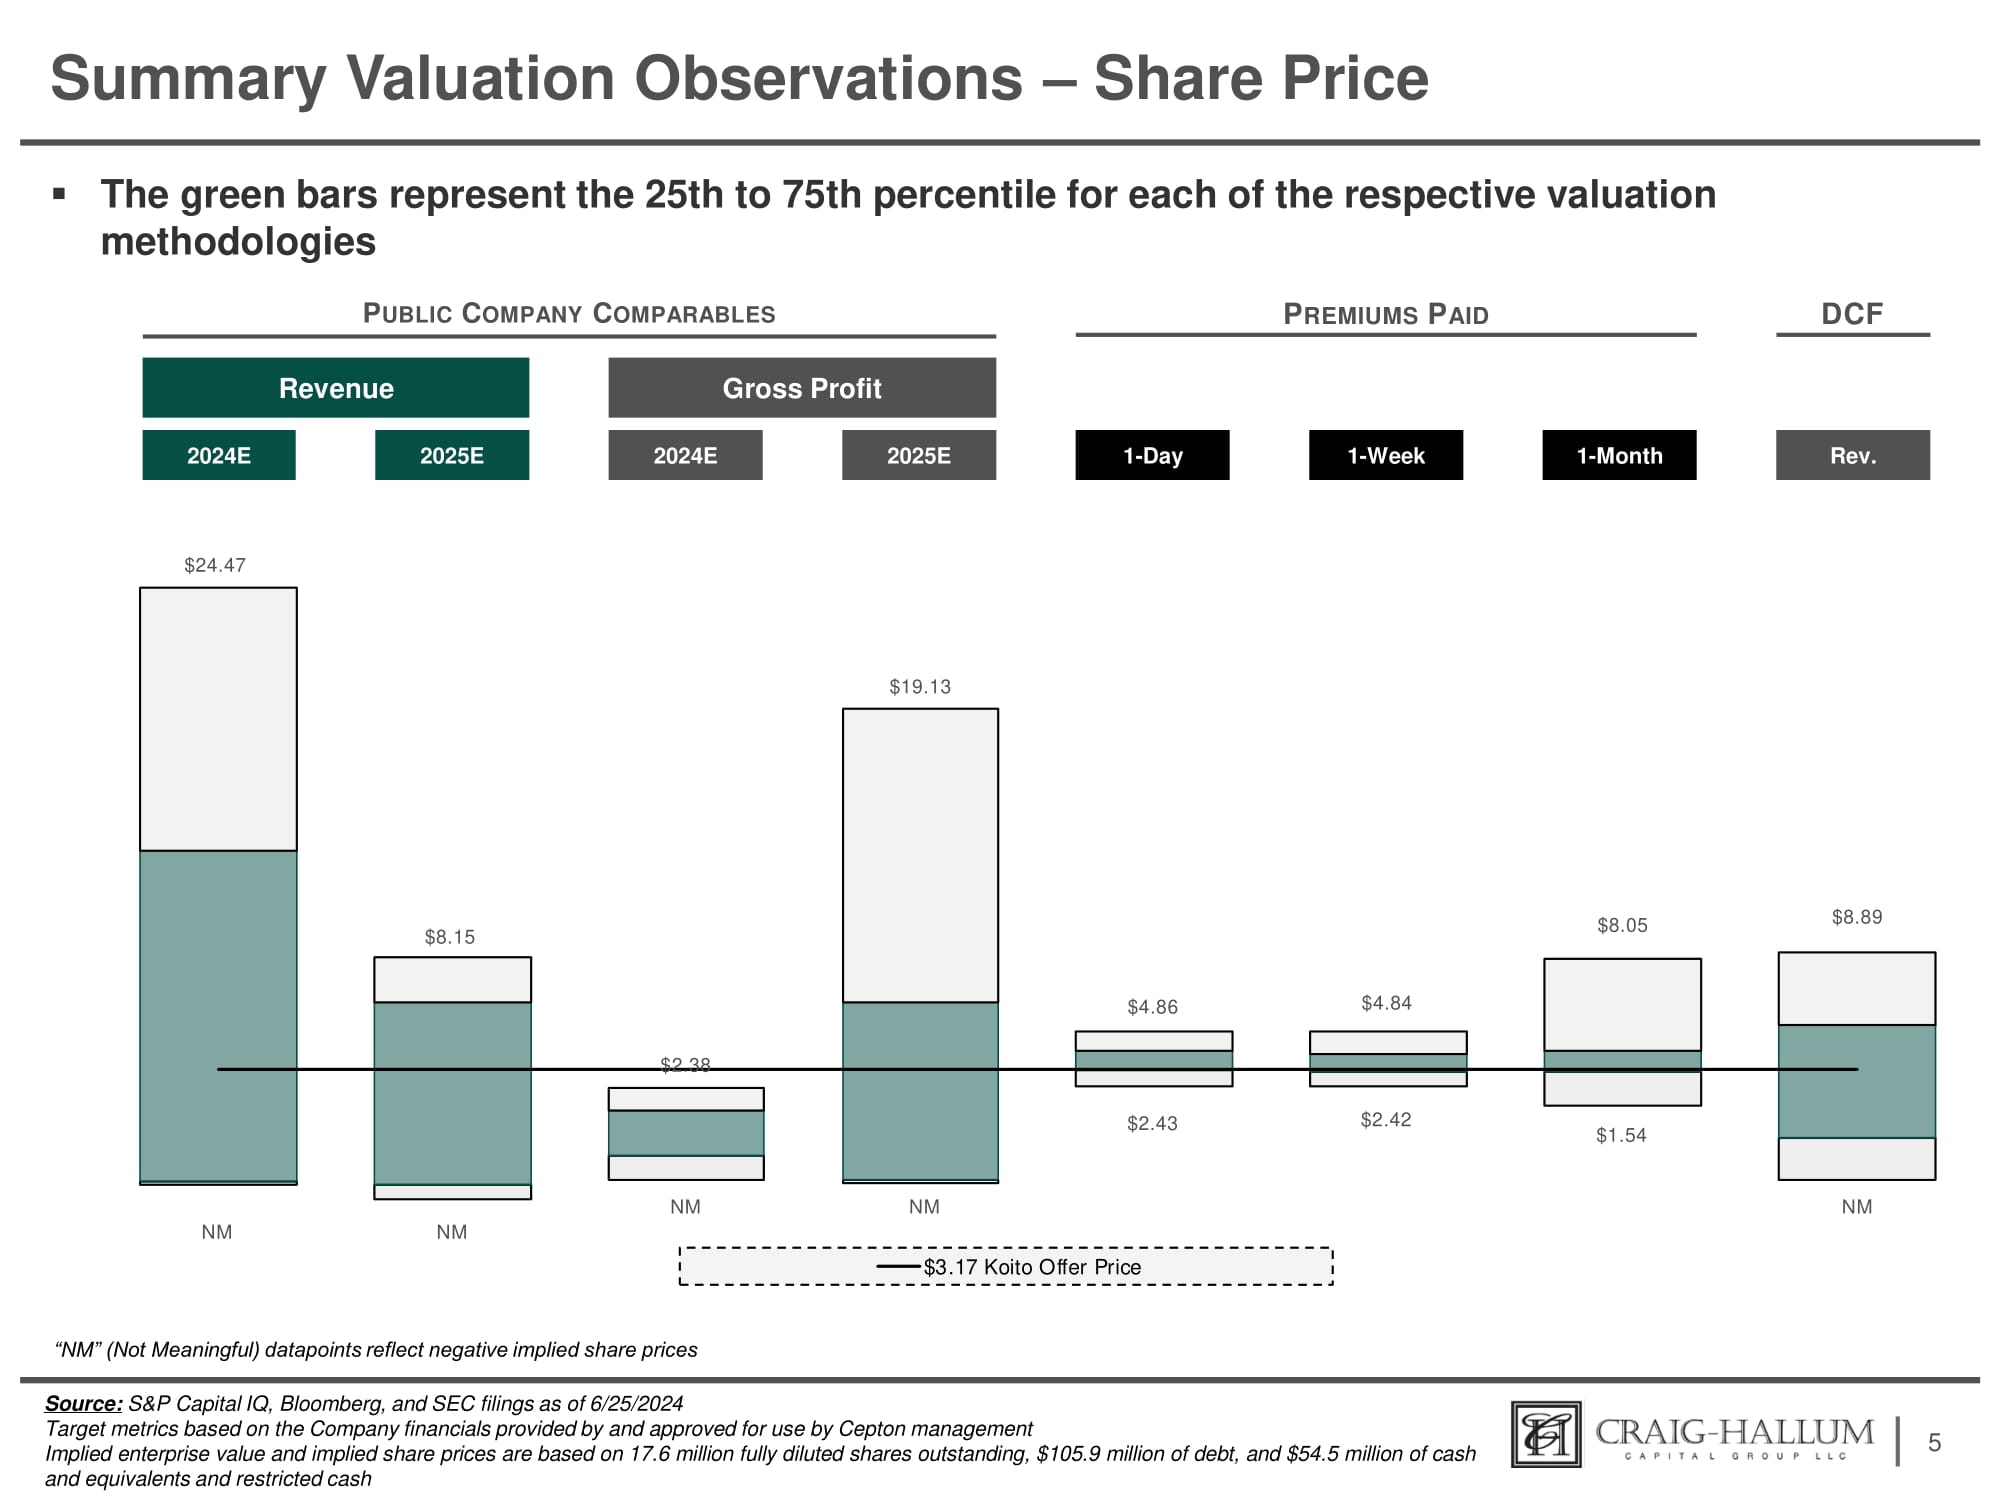
$3.17 Koito Offer Price Summary Valuation Observations – Share Price ▪ The green bars represent the 25th to 75th percentile for each of the respective valuation methodologies P UBLIC C OMPANY C OMPARABLES P REMIUMS P AID 5 Revenue 2024E 2025E Gross Profit 2024E 2025E DCF Rev. 1 - Day 1 - Month 1 - Week NM NM NM NM NM $2.43 $2.42 $1.54 $24.47 $8.15 $2.38 $19.13 $8.89 $4.86 $4.84 $8.05 Source: S&P Capital IQ, Bloomberg, and SEC filings as of 6/25/2024 Target metrics based on the Company financials provided by and approved for use by Cepton management Implied enterprise value and implied share prices are based on 17.6 million fully diluted shares outstanding, $105.9 million of debt, and $54.5 million of cash and equivalents and restricted cash “NM” (Not Meaningful) datapoints reflect negative implied share prices
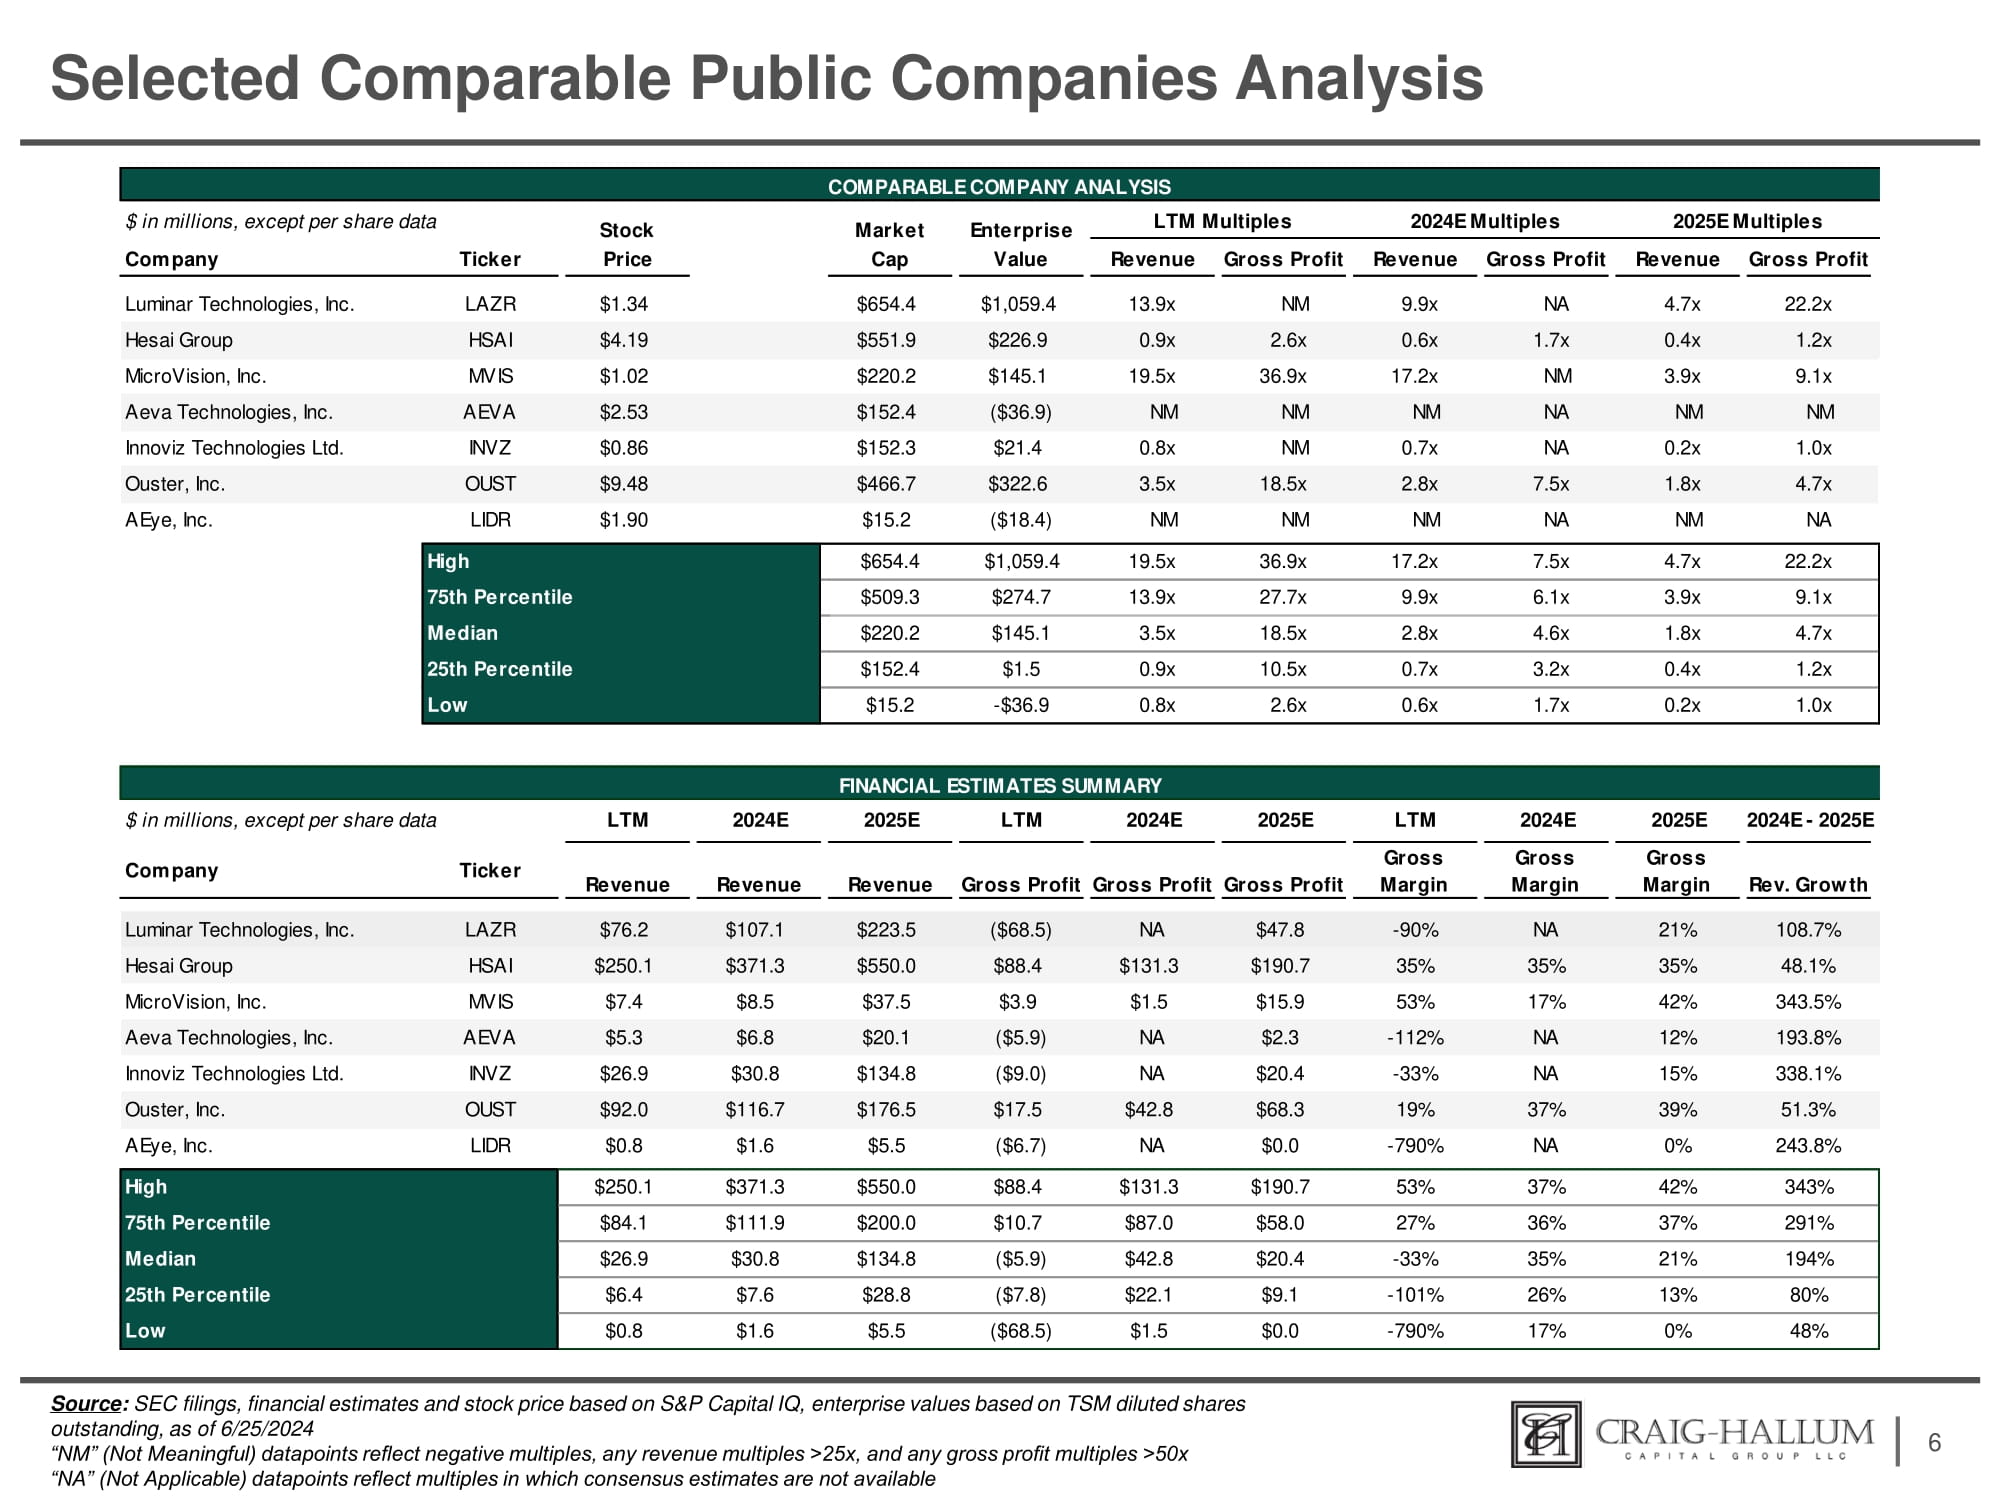
Selected Comparable Public Companies Analysis 6 Source : SEC filings, financial estimates and stock price based on S&P Capital IQ, enterprise values based on TSM diluted shares outstanding, as of 6/25/2024 “NM” (Not Meaningful) datapoints reflect negative multiples, any revenue multiples >25x, and any gross profit multiples >50x “NA” (Not Applicable) datapoints reflect multiples in which consensus estimates are not available Gross Profit Revenue Gross Profit Revenue Gross Profit Revenue Value Cap Price Ticker Company 22.2x 4.7x NA 9.9x NM 13.9x $1,059.4 $654.4 $1.34 LAZR Luminar Technologies, Inc. 1.2x 0.4x 1.7x 0.6x 2.6x 0.9x $226.9 $551.9 $4.19 HSAI Hesai Group 9.1x 3.9x NM 17.2x 36.9x 19.5x $145.1 $220.2 $1.02 MVIS MicroVision, Inc. NM NM NA NM NM NM ($36.9) $152.4 $2.53 AEVA Aeva Technologies, Inc. 1.0x 0.2x NA 0.7x NM 0.8x $21.4 $152.3 $0.86 INVZ Innoviz Technologies Ltd. 4.7x 1.8x 7.5x 2.8x 18.5x 3.5x $322.6 $466.7 $9.48 OUST Ouster, Inc. NA NM NA NM NM NM ($18.4) $15.2 $1.90 LIDR AEye, Inc. 22.2x 4.7x 7.5x 17.2x 36.9x 19.5x $1,059.4 $654.4 High 9.1x 3.9x 6.1x 9.9x 27.7x 13.9x $274.7 $509.3 75th Percentile 4.7x 1.8x 4.6x 2.8x 18.5x 3.5x $145.1 $220.2 Median 1.2x 0.4x 3.2x 0.7x 10.5x 0.9x $1.5 $152.4 25th Percentile 1.0x 0.2x 1.7x 0.6x 2.6x 0.8x - $36.9 $15.2 Low 108.7% 21% NA - 90% $47.8 NA ($68.5) $223.5 $107.1 $76.2 LAZR Luminar Technologies, Inc. 48.1% 35% 35% 35% $190.7 $131.3 $88.4 $550.0 $371.3 $250.1 HSAI Hesai Group 343.5% 42% 17% 53% $15.9 $1.5 $3.9 $37.5 $8.5 $7.4 MVIS MicroVision, Inc. 193.8% 12% NA - 112% $2.3 NA ($5.9) $20.1 $6.8 $5.3 AEVA Aeva Technologies, Inc. 338.1% 15% NA - 33% $20.4 NA ($9.0) $134.8 $30.8 $26.9 INVZ Innoviz Technologies Ltd. 51.3% 39% 37% 19% $68.3 $42.8 $17.5 $176.5 $116.7 $92.0 OUST Ouster, Inc. 243.8% 0% NA - 790% $0.0 NA ($6.7) $5.5 $1.6 $0.8 LIDR AEye, Inc. 343% 42% 37% 53% $190.7 $131.3 $88.4 $550.0 $371.3 $250.1 High 291% 37% 36% 27% $58.0 $87.0 $10.7 $200.0 $111.9 $84.1 75th Percentile 194% 21% 35% - 33% $20.4 $42.8 ($5.9) $134.8 $30.8 $26.9 Median 80% 13% 26% - 101% $9.1 $22.1 ($7.8) $28.8 $7.6 $6.4 25th Percentile 48% 0% 17% - 790% $0.0 $1.5 ($68.5) $5.5 $1.6 $0.8 Low COMPARABLE COMPANY ANALYSIS $ in millions, except per share data LTM Multiples 2024E Multiples 2025E Multiples FINANCIAL ESTIMATES SUMMARY 2024E - 2025E 2025E 2024E LTM 2025E 2024E LTM 2025E 2024E LTM $ in millions, except per share data Gross Gross Gross Company Ticker Revenue Revenue Revenue Gross Profit Gross Profit Gross Profit Margin Margin Margin Rev. Grow th Stock Market Enterprise
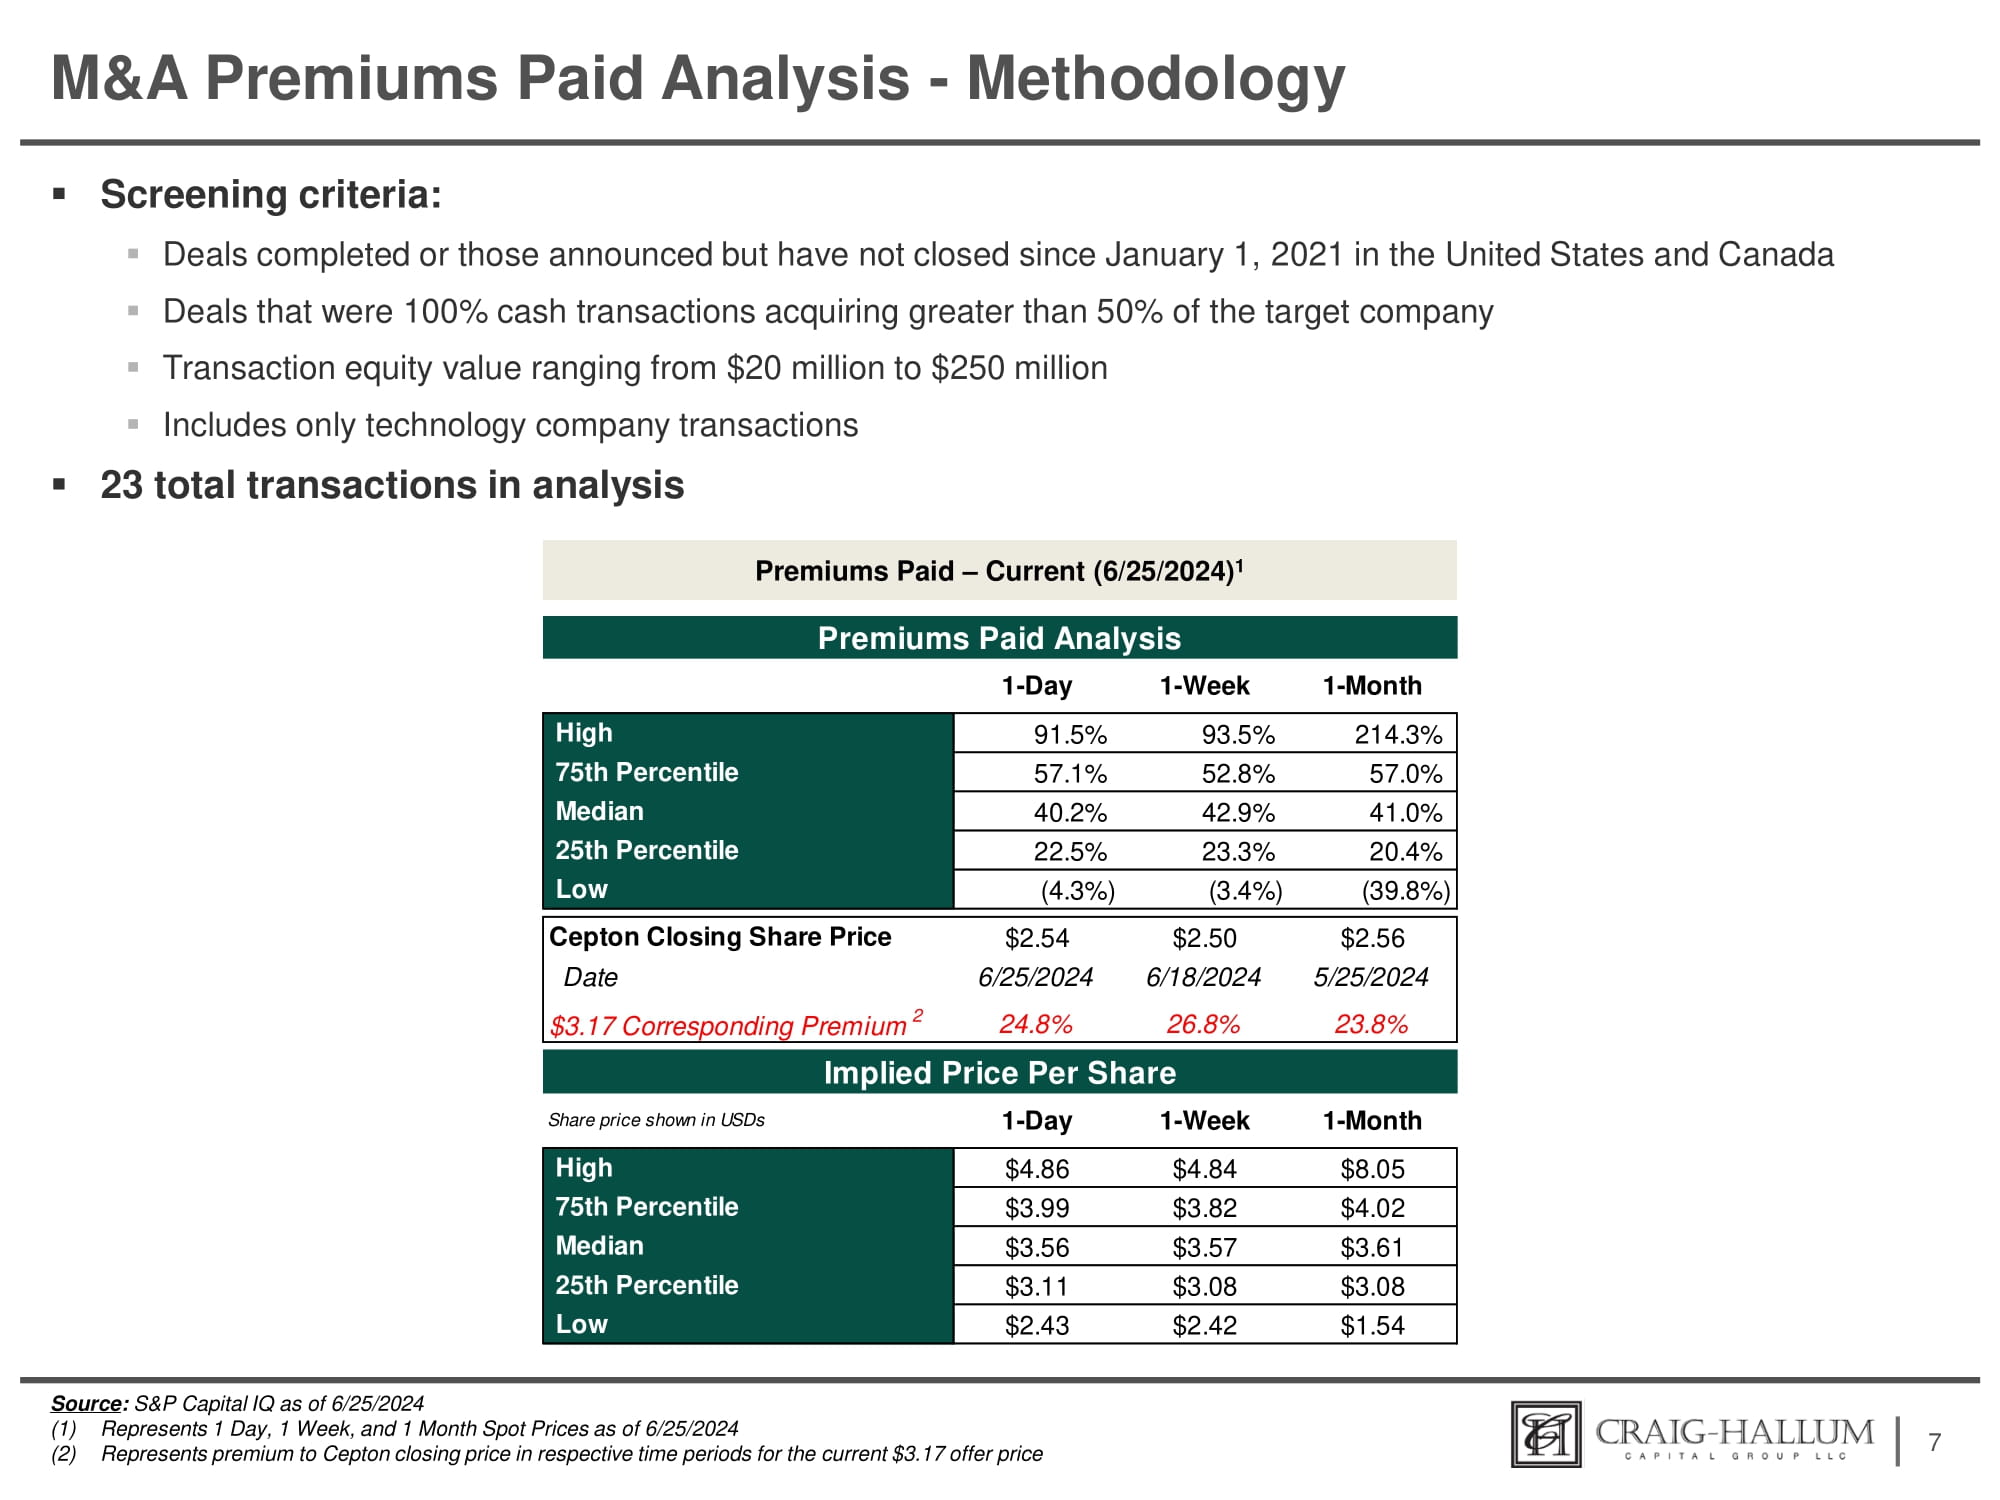
M&A Premiums Paid Analysis - Methodology ▪ Screening criteria: ▪ Deals completed or those announced but have not closed since January 1, 2021 in the United States and Canada ▪ Deals that were 100% cash transactions acquiring greater than 50% of the target company ▪ Transaction equity value ranging from $20 million to $250 million ▪ Includes only technology company transactions ▪ 23 total transactions in analysis 7 Source : S&P Capital IQ as of 6/25/2024 (1) Represents 1 Day, 1 Week, and 1 Month Spot Prices as of 6/25/2024 (2) Represents premium to Cepton closing price in respective time periods for the current $3.17 offer price Premiums Paid – Current (6/25/2024) 1 214.3% 93.5% 91.5% High 57.0% 52.8% 57.1% 75th Percentile 41.0% 42.9% 40.2% Median 20.4% 23.3% 22.5% 25th Percentile (39.8%) (3.4%) (4.3%) Low $2.56 5/25/2024 $2.50 6/18/2024 $2.54 6/25/2024 Cepton Closing Share Price Date 23.8% 26.8% 24.8% $3.17 Corresponding Premium 2 Implied Price Per Share $8.05 $4.84 $4.86 High $4.02 $3.82 $3.99 75th Percentile $3.61 $3.57 $3.56 Median $3.08 $3.08 $3.11 25th Percentile $1.54 $2.42 $2.43 Low Premiums Paid Analysis 1 - Day 1 - Week 1 - Month Share price shown in USDs 1 - Day 1 - Week 1 - Month
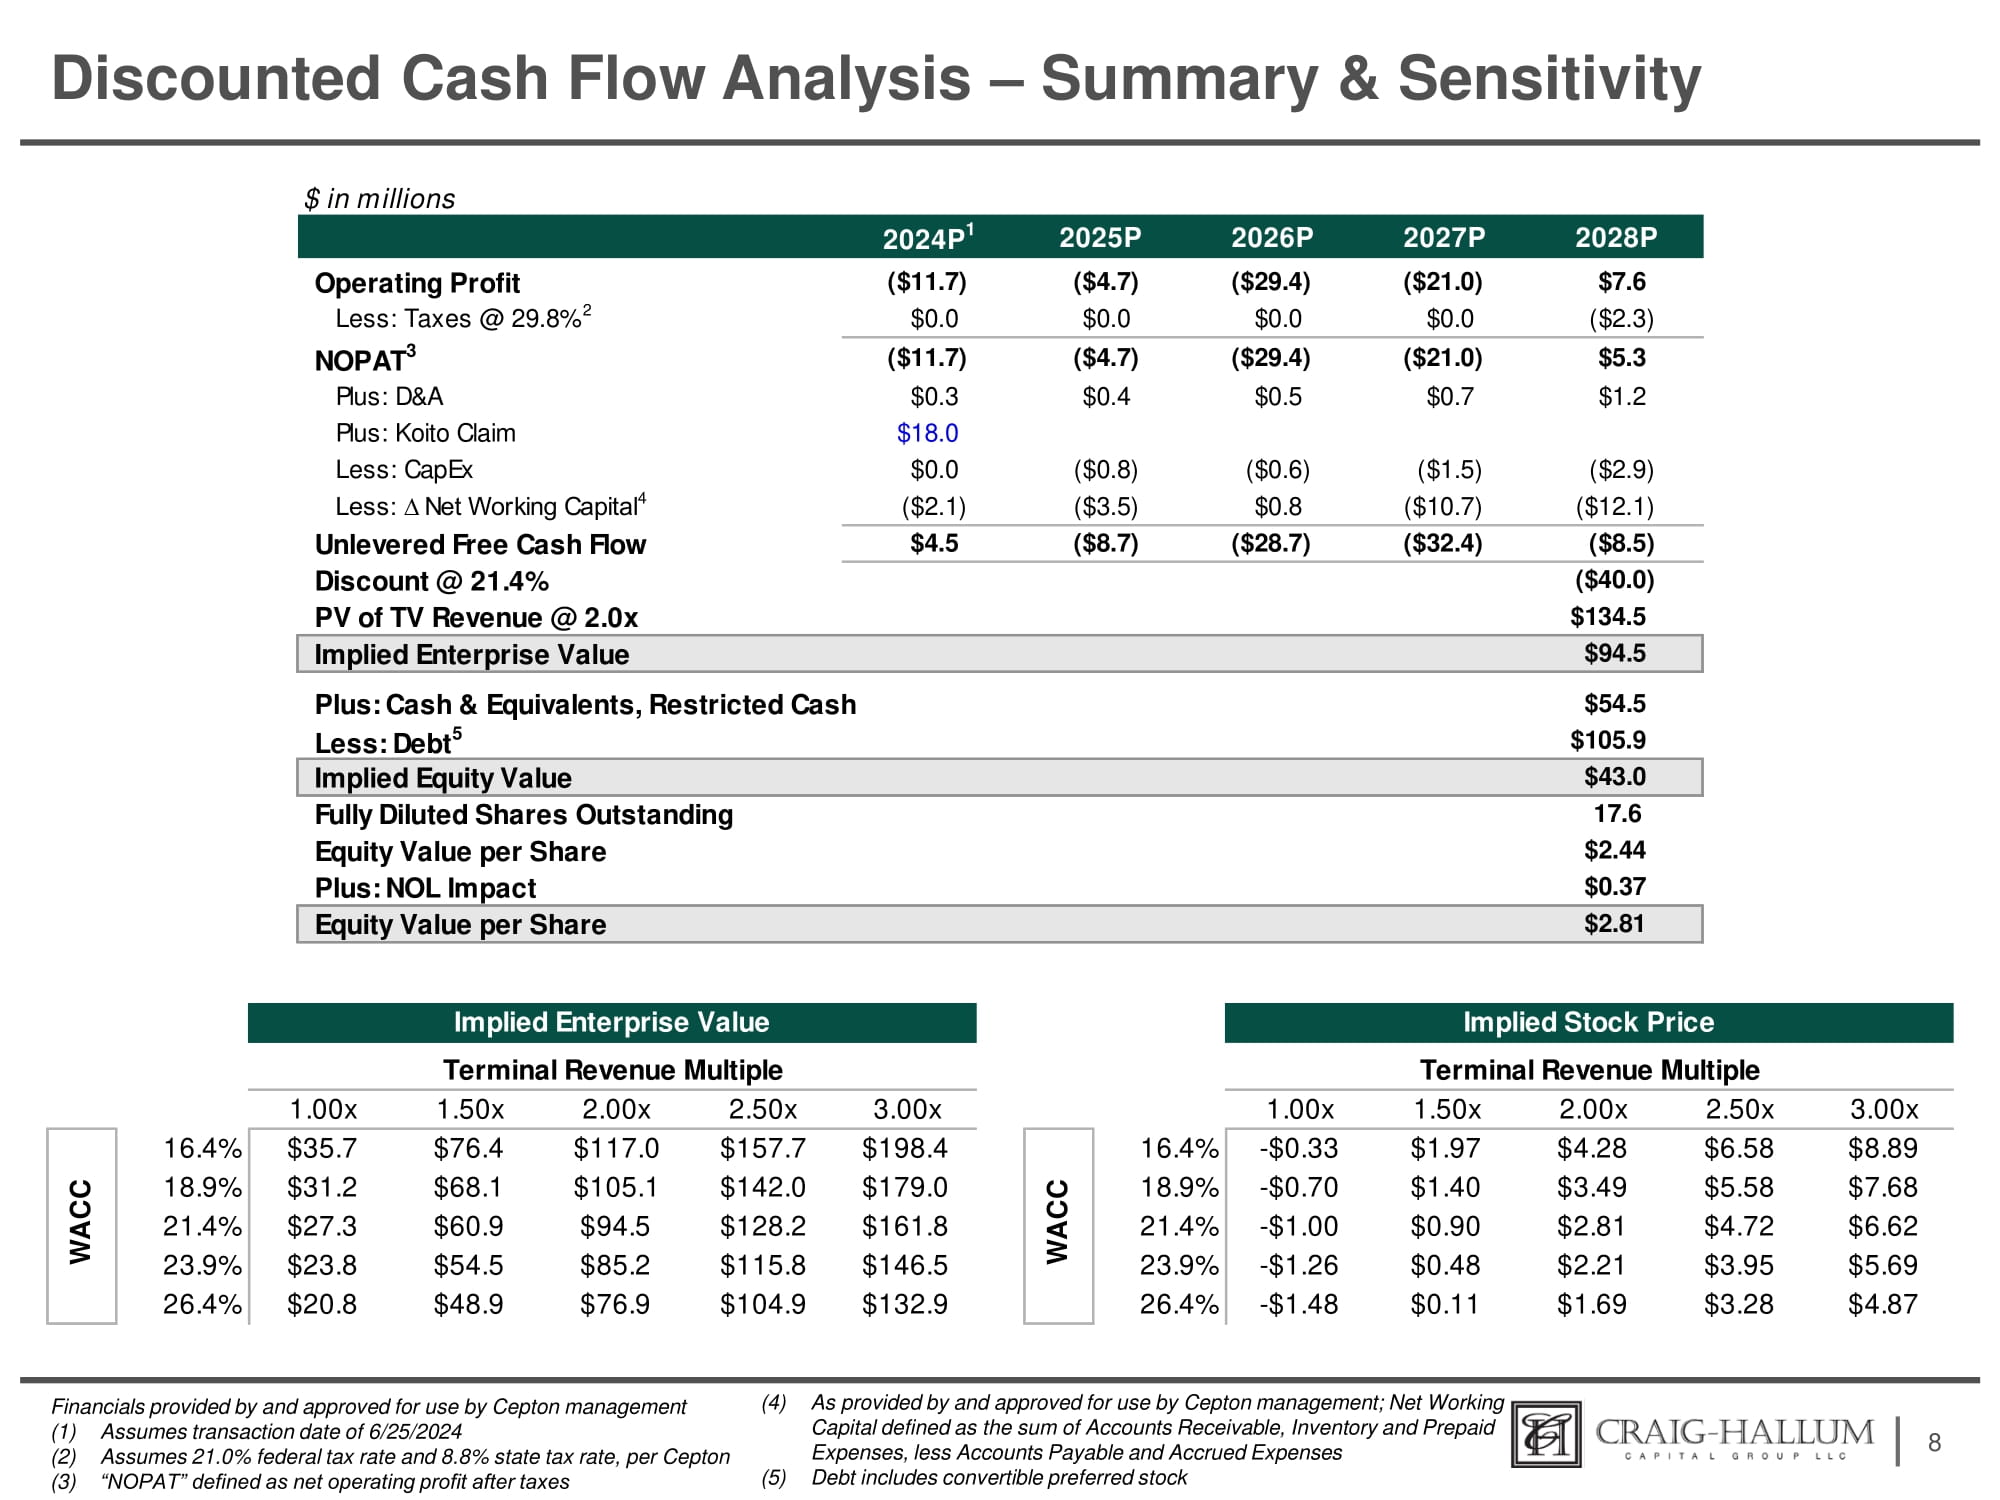
Discounted Cash Flow Analysis – Summary & Sensitivity 8 Financials provided by and approved for use by Cepton management (1) Assumes transaction date of 6/25/2024 (2) Assumes 21.0% federal tax rate and 8.8% state tax rate, per Cepton (3) “NOPAT” defined as net operating profit after taxes (4) As provided by and approved for use by Cepton management; Net Working Capital defined as the sum of Accounts Receivable, Inventory and Prepaid Expenses, less Accounts Payable and Accrued Expenses (5) Debt includes convertible preferred stock $ in millions 2028P 2027P 2026P 2025P 2024P 1 $7.6 ($21.0) ($29.4) ($4.7) ($11.7) Operating Profit ($2.3) $0.0 $0.0 $0.0 $0.0 Less: Taxes @ 29.8% 2 $5.3 ($21.0) ($29.4) ($4.7) ($11.7) NOPAT 3 $1.2 $0.7 $0.5 $0.4 $0.3 Plus: D&A $18.0 Plus: Koito Claim ($2.9) ($1.5) ($0.6) ($0.8) $0.0 Less: CapEx ($12.1) ($10.7) $0.8 ($3.5) ($2.1) Less: ∆ Net Working Capital 4 ($8.5) ($32.4) ($28.7) ($8.7) $4.5 Unlevered Free Cash Flow ($40.0) Discount @ 21.4% $134.5 PV of TV Revenue @ 2.0x $94.5 Implied Enterprise Value $54.5 Plus: Cash & Equivalents, Restricted Cash $105.9 Less: Debt 5 $43.0 Implied Equity Value 17.6 Fully Diluted Shares Outstanding $2.44 Equity Value per Share $0.37 Plus: NOL Impact $2.81 Equity Value per Share 3.00x 2.50x 2.00x 1.50x 1.00x 3.00x 2.50x 2.00x 1.50x 1.00x $8.89 $6.58 $4.28 $1.97 - $0.33 16.4% $198.4 $157.7 $117.0 $76.4 $35.7 16.4% $7.68 $5.58 $3.49 $1.40 - $0.70 18.9% C $179.0 $142.0 $105.1 $68.1 $31.2 18.9% $6.62 $4.72 $2.81 $0.90 - $1.00 21.4% A C $161.8 $128.2 $94.5 $60.9 $27.3 21.4% $5.69 $3.95 $2.21 $0.48 - $1.26 23.9% W $146.5 $115.8 $85.2 $54.5 $23.8 23.9% $4.87 $3.28 $1.69 $0.11 - $1.48 26.4% $132.9 $104.9 $76.9 $48.9 $20.8 26.4% Implied Enterprise Value Terminal Revenue Multiple WACC Implied Stock Price Terminal Revenue Multiple
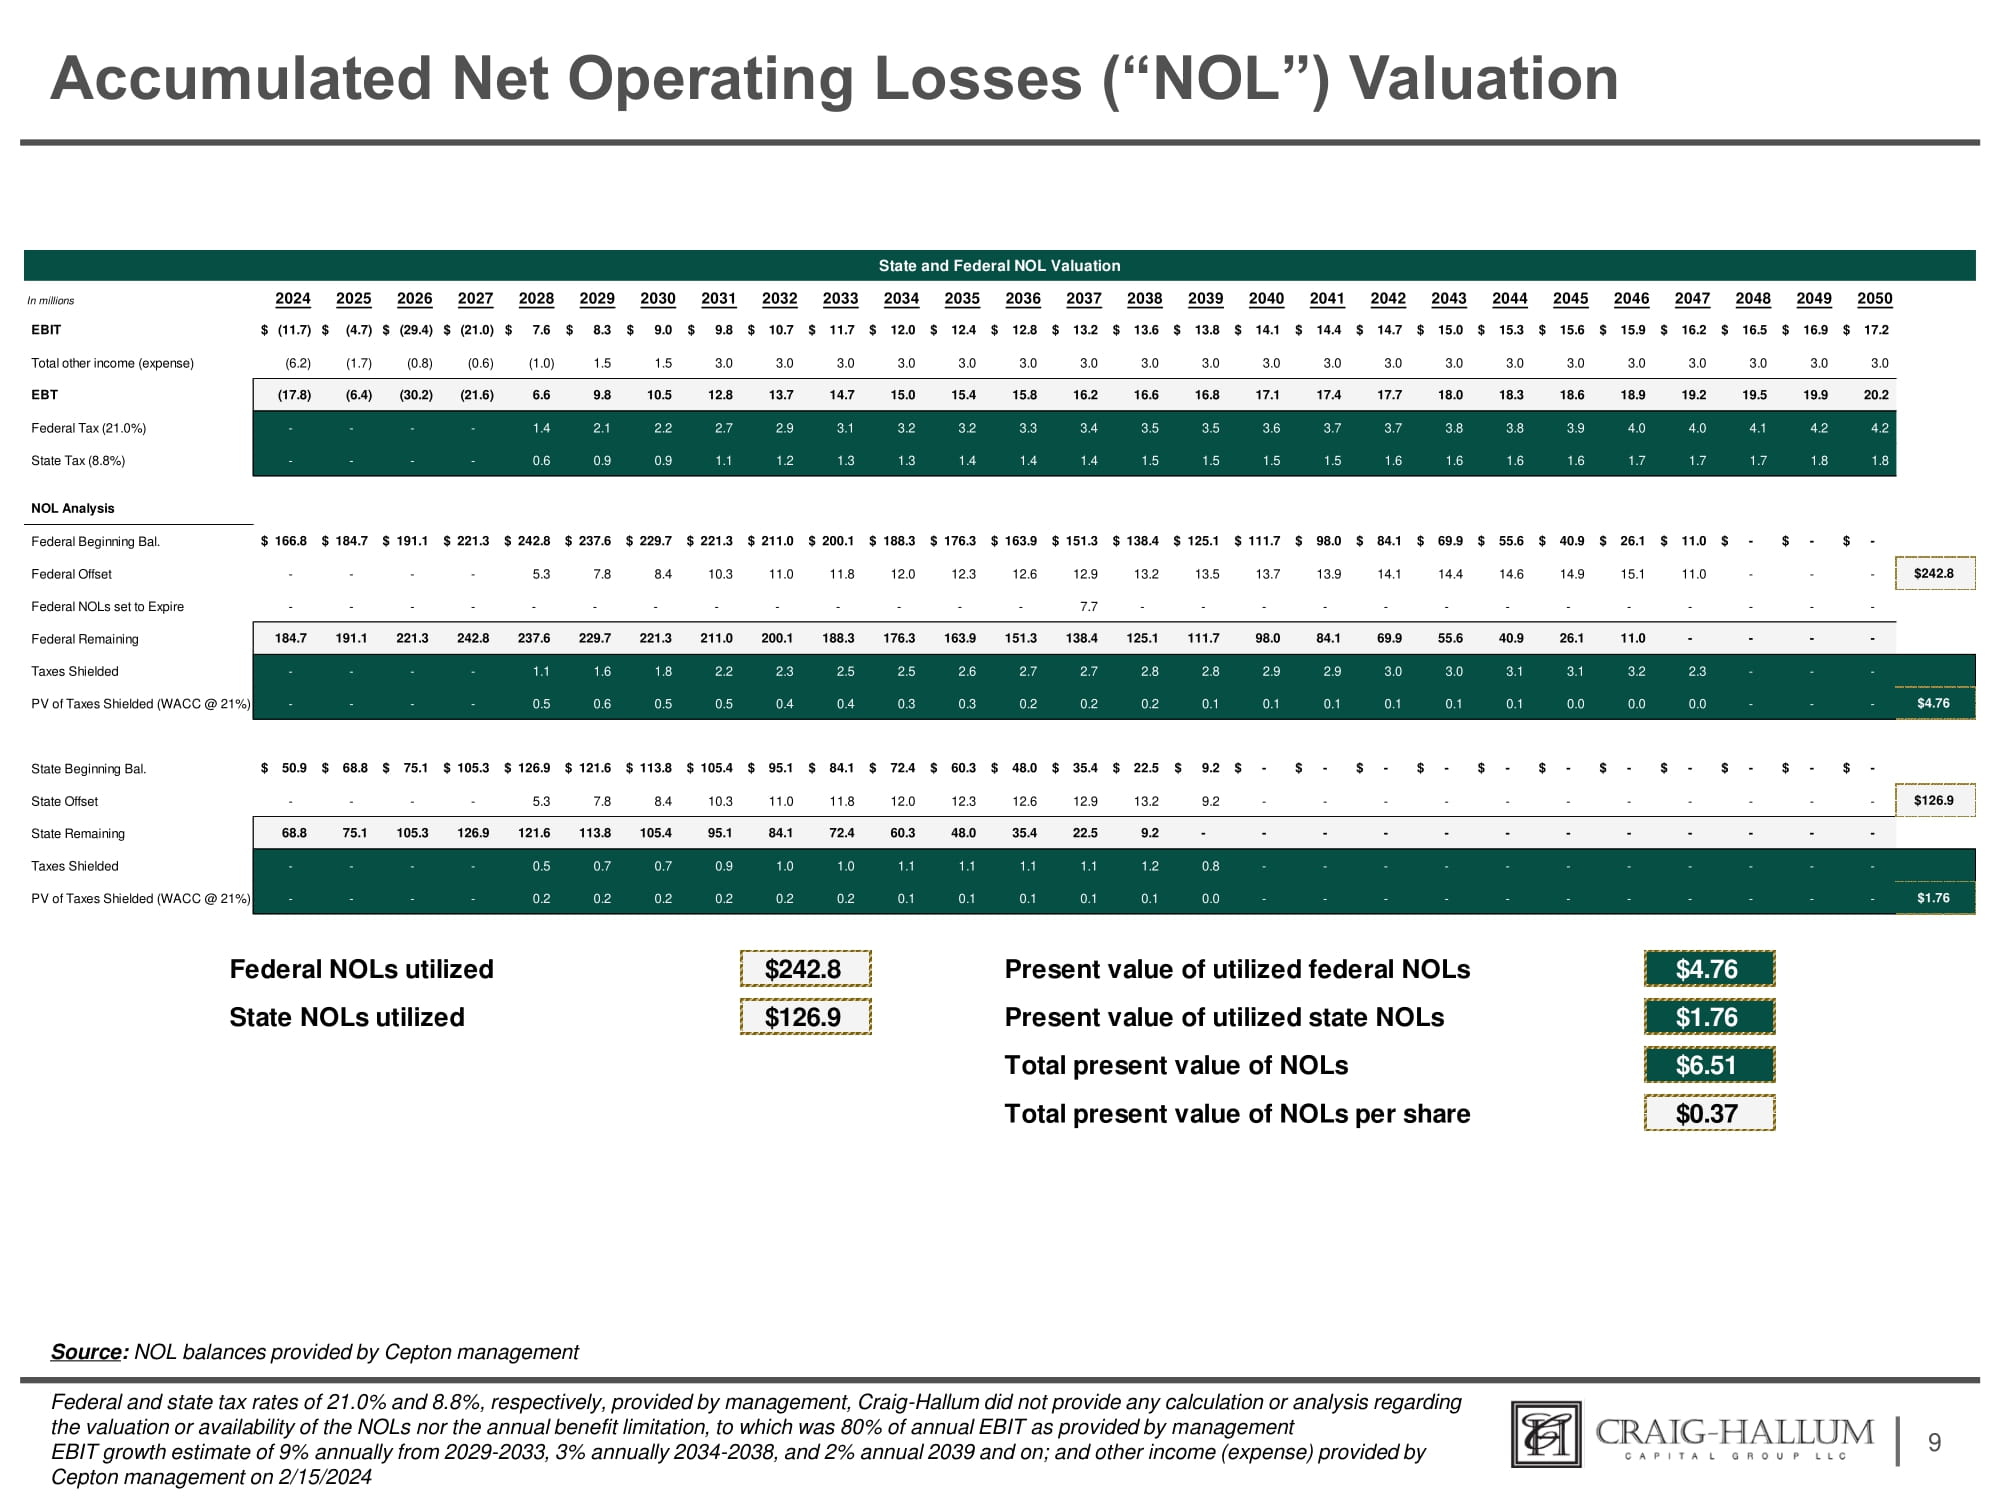
Accumulated Net Operating Losses (“NOL”) Valuation 9 Source : NOL balances provided by Cepton management Federal and state tax rates of 21.0% and 8.8%, respectively, provided by management, Craig - Hallum did not provide any calculation or analysis regarding the valuation or availability of the NOLs nor the annual benefit limitation, to which was 80% of annual EBIT as provided by management EBIT growth estimate of 9% annually from 2029 - 2033, 3% annually 2034 - 2038, and 2% annual 2039 and on; and other income (expense) provided by Cepton management on 2/15/2024 $ - $ - $ - $ - $ - $ - $ - $ - $ - $ - $ - $ 9.2 $ 22.5 $ 35.4 $ 48.0 $ 60.3 $ 72.4 $ 84.1 $ 95.1 $ 105.4 $ 113.8 $ 121.6 $ 126.9 $ 105.3 $ 75.1 $ 68.8 $ 50.9 State Beginning Bal. - - - - - - - - - - 9.2 13.2 12.9 12.6 12.3 12.0 11.8 11.0 10.3 8.4 7.8 5.3 - - - - State Offset - - - - - - - - - - - 9.2 22.5 35.4 48.0 60.3 72.4 84.1 95.1 105.4 113.8 121.6 126.9 105.3 75.1 68.8 State Remaining - - - - - - - - - - 0.8 1.2 1.1 1.1 1.1 1.1 1.0 1.0 0.9 0.7 0.7 0.5 - - - - Taxes Shielded - - - - - - - - - - 0.0 0.1 0.1 0.1 0.1 0.1 0.2 0.2 0.2 0.2 0.2 0.2 - - - - PV of Taxes Shielded (WACC @ 21%) State and Federal NOL Valuation In millions 2024 2025 2026 2027 2028 2029 2030 2031 2032 2033 2034 2035 2036 2037 2038 2039 2040 2041 2042 2043 2044 2045 2046 2047 2048 2049 2050 $ (11.7) $ (4.7) $ (29.4) $ (21.0) $ 7.6 $ 8.3 $ 9.0 $ 9.8 $ 10.7 $ 11.7 $ 12.0 $ 12.4 $ 12.8 $ 13.2 $ 13.6 $ 13.8 $ 14.1 $ 14.4 $ 14.7 $ 15.0 $ 15.3 $ 15.6 $ 15.9 $ 16.2 $ 16.5 $ 16.9 $ 17.2 EBIT Total other income (expense) EBT Federal Tax (21.0%) State Tax (8.8%) NOL Analysis Federal Beginning Bal. Federal Offset 3.0 3.0 3.0 3.0 3.0 3.0 3.0 3.0 3.0 3.0 3.0 3.0 3.0 3.0 3.0 3.0 3.0 3.0 3.0 3.0 1.5 1.5 (6.2) (1.7) (0.8) (0.6) (1.0) 20.2 19.9 19.5 19.2 18.9 18.6 18.3 18.0 17.7 17.4 17.1 16.8 16.6 16.2 15.8 15.4 15.0 14.7 13.7 12.8 10.5 9.8 6.6 (21.6) (30.2) (6.4) (17.8) 4.2 4.2 4.1 4.0 4.0 3.9 3.8 3.8 3.7 3.7 3.6 3.5 3.5 3.4 3.3 3.2 3.2 3.1 2.9 2.7 2.2 2.1 1.4 - - - - 1.8 1.8 1.7 1.7 1.7 1.6 1.6 1.6 1.6 1.5 1.5 1.5 1.5 1.4 1.4 1.4 1.3 1.3 1.2 1.1 0.9 0.9 0.6 - - - - $ - $ - $ - $ 11.0 $ 26.1 $ 40.9 $ 55.6 $ 69.9 $ 84.1 $ 98.0 $ 111.7 $ 125.1 $ 138.4 $ 151.3 $ 163.9 $ 176.3 $ 188.3 $ 200.1 $ 211.0 $ 221.3 $ 229.7 $ 237.6 $ 166.8 $ 184.7 $ 191.1 $ 221.3 $ 242.8 $242.8 - - - 11.0 15.1 14.9 14.6 14.4 14.1 13.9 13.7 13.5 13.2 12.9 12.6 12.3 12.0 11.8 11.0 10.3 8.4 7.8 - - - - 5.3 Federal NOLs set to Expire - - - - - - - - - - - - - 7.7 - - - - - - - - - - - - - Federal Remaining Taxes Shielded PV of Taxes Shielded (WACC @ 21%) - - - - 11.0 26.1 40.9 55.6 69.9 84.1 98.0 111.7 125.1 138.4 151.3 163.9 176.3 188.3 200.1 211.0 221.3 229.7 237.6 242.8 221.3 191.1 184.7 - - - 2.3 3.2 3.1 3.1 3.0 3.0 2.9 2.9 2.8 2.8 2.7 2.7 2.6 2.5 2.5 2.3 2.2 1.8 1.6 1.1 - - - - $4.76 - - - 0.0 0.0 0.0 0.1 0.1 0.1 0.1 0.1 0.1 0.2 0.2 0.2 0.3 0.3 0.4 0.4 0.5 0.5 0.6 0.5 - - - - Federal NOLs utilized State NOLs utilized $242.8 Present value of utilized federal NOLs Present value of utilized state NOLs Total present value of NOLs Total present value of NOLs per share $4.76 $126.9 $1.76 $6.51 $0.37

Private & Confidential Appendix 10
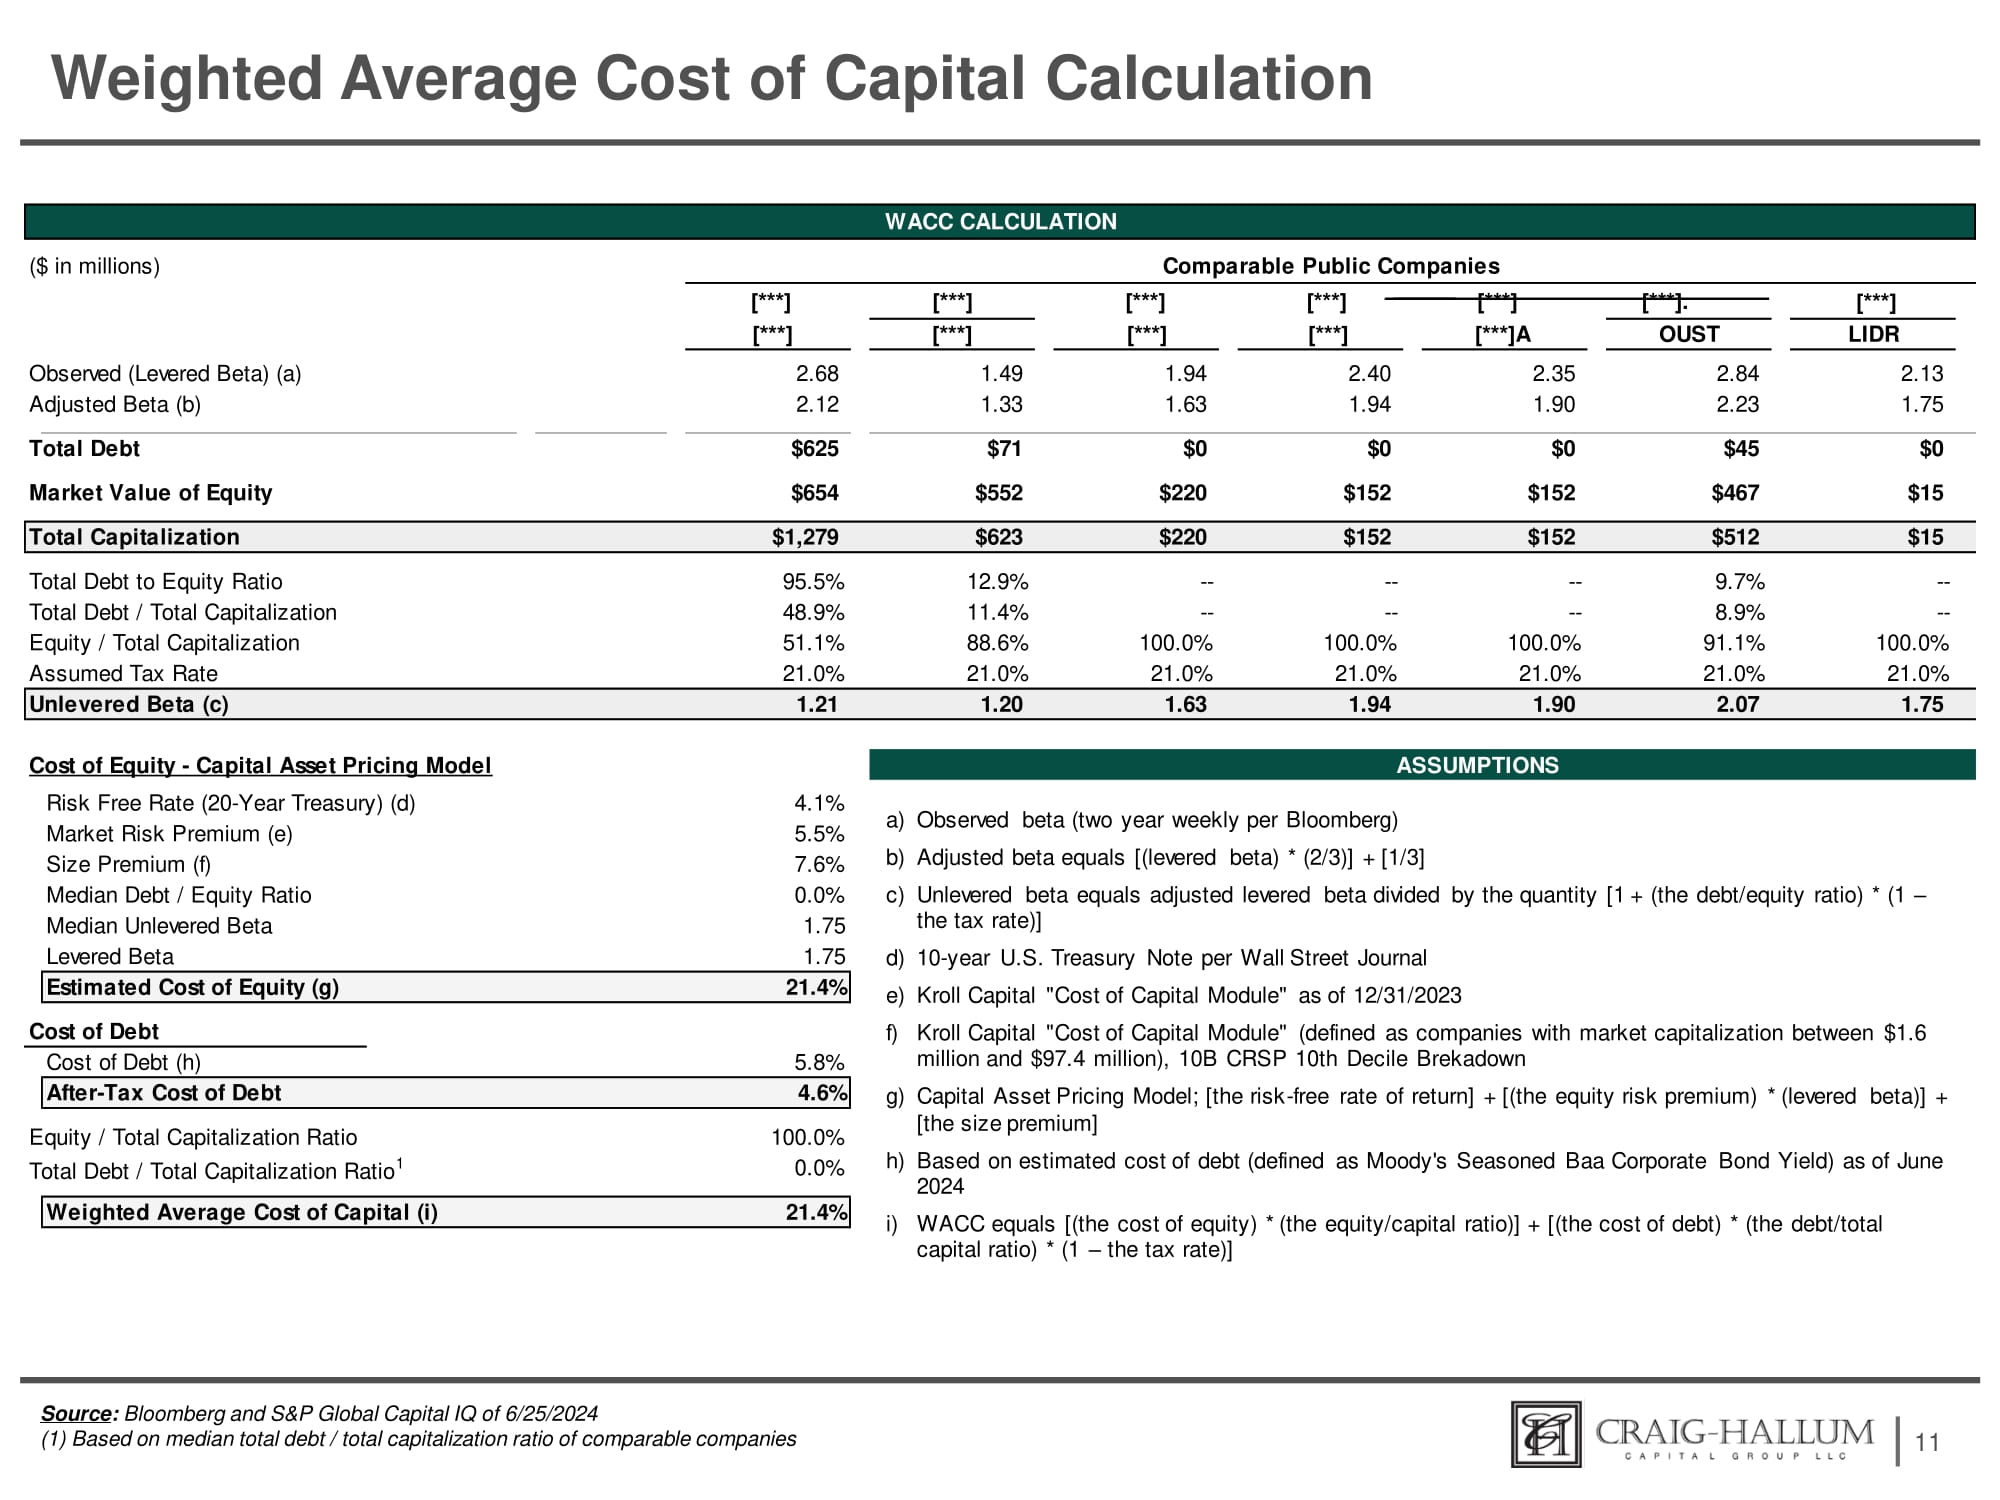
Weighted Average Cost of Capital Calculation 11 Source : Bloomberg and S&P Global Capital IQ of 6/25/2024 (1) Based on median total debt / total capitalization ratio of comparable companies LIDR OUST [***]A [***] [***] [***] [***] 2.13 2.84 2.35 2.40 1.94 1.49 2.68 Observed (Levered Beta) (a) 1.75 2.23 1.90 1.94 1.63 1.33 2.12 Adjusted Beta (b) $0 $45 $0 $0 $0 $71 $625 Total Debt $15 $467 $152 $152 $220 $552 $654 Market Value of Equity $15 $512 $152 $152 $220 $623 $1,279 Total Capitalization - - 9.7% - - - - - - 12.9% 95.5% Total Debt to Equity Ratio - - 8.9% - - - - - - 11.4% 48.9% Total Debt / Total Capitalization 100.0% 91.1% 100.0% 100.0% 100.0% 88.6% 51.1% Equity / Total Capitalization 21.0% 21.0% 21.0% 21.0% 21.0% 21.0% 21.0% Assumed Tax Rate 1.75 2.07 1.90 1.94 1.63 1.20 1.21 Unlevered Beta (c) WACC CALCULATION ($ in millions) Comparable Public Companies [***] [***] [***] [***] [***] [***]. [***] Cost of Equity - Capital Asset Pricing Model Risk Free Rate (20 - Year Treasury) (d) Market Risk Premium (e) Size Premium (f) Median Debt / Equity Ratio Median Unlevered Beta Levered Beta ASSUMPTIONS 4.1% 5.5% 7.6% 0.0% 1.75 1.75 Estimated Cost of Equity (g) 21.4% Cost of Debt Cost of Debt (h) 5.8% After - Tax Cost of Debt 4.6% 100.0% Equity / Total Capitalization Ratio 0.0% Total Debt / Total Capitalization Ratio 1 21.4% Weighted Average Cost of Capital (i) a) Observed beta (two year weekly per Bloomberg) b) Adjusted beta equals [(levered beta) * (2/3)] + [1/3] c) Unlevered beta equals adjusted levered beta divided by the quantity [1 + (the debt/equity ratio) * (1 – the tax rate)] d) 10 - year U.S. Treasury Note per Wall Street Journal e) Kroll Capital "Cost of Capital Module" as of 12/31/2023 f) Kroll Capital "Cost of Capital Module" (defined as companies with market capitalization between $1.6 million and $97.4 million), 10B CRSP 10th Decile Brekadown g) Capital Asset Pricing Model; [the risk - free rate of return] + [(the equity risk premium) * (levered beta)] + [the size premium] h) Based on estimated cost of debt (defined as Moody's Seasoned Baa Corporate Bond Yield) as of June 2024 i) WACC equals [(the cost of equity) * (the equity/capital ratio)] + [(the cost of debt) * (the debt/total capital ratio) * (1 – the tax rate)]

- 80.0% - 60.0% - 40.0% - 20.0% 20.0% 0.0% 40.0% 60.0% 80.0% 100.0% 120.0% 12/19/2023 12/26/2023 1/2/2024 1/9/2024 1/16/2024 1/23/2024 1/30/2024 2/6/2024 2/13/2024 2/20/2024 2/27/2024 3/5/2024 3/12/2024 3/19/2024 3/26/2024 4/2/2024 4/9/2024 4/16/2024 4/23/2024 4/30/2024 5/7/2024 5/14/2024 5/21/2024 5/28/2024 6/4/2024 6/11/2024 6/18/2024 6/25/2024 MVIS AEVA INVZ LAZR LIDR OUST HSAI CPTN Summary Stock Comparison 12 AEVA: (32.7%) CPTN: (15.9%) HSAI: (52.8%) LAZR: (60.8%) INVZ: (67.5%) MVIS: (63.3%) OUST: 37.4% LIDR: (10.0%) December 21 st , 2023: Koito 13D/A filed January 3 rd , 2024: AEVA announces OEM win February 13th, 2024: Special Committee discussion regarding Offer Price Change Since 12/19/2023 Change Since 2/13/2024 AEVA: (46.3%) CPTN: (3.8%) HSAI: 4.2% LAZR: (47.0%) INVZ: (45.6%) MVIS: (57.5%) OUST: 79.2% LIDR: 46.2% Median: (24.7%) Median: (42.8%) Source : S&P Capital IQ as of market close on 6/25/2024 March 21st, 2024: 8 - K announcing series production award for top global trucking OEM