united states
securities and exchange commission
washington, d.c. 20549
form n-csr
certified shareholder report of registered management
investment companies
Investment Company Act file number 811-22447
Equinox Funds Trust
(Exact name of registrant as specified in charter)
17605 Wright Street Omaha, Nebraska 68130
(Address of Principal executive offices) (Zip code)
James Ash, Gemini Fund Services, LLC.
80 Arkay Drive, Suite 110, Hauppauge, NY 11788
(Name and address of agent for service)
Registrant's telephone number, including area code: 631-470-2619
Date of fiscal year end: 3/31
Date of reporting period: 3/31/17
Item 1. Reports to Stockholders.
| EQUINOX SYSTEMATICA MACRO FUND |
| |
| |
| |
| |
| |
| CLASS I SHARES: EBCIX |
| |
| |
| |
| |
| |
| ANNUAL REPORT |
| |
| MARCH 31, 2017 |
| |
| |
| |
| |
| |
| |
| 1-888-643-3431 |
| |
| WWW.EQUINOXFUNDS.COM |
| |
| |
| |
| |
This report and the financial statements contained herein are submitted for the general information of shareholders and are not authorized for distribution to prospective investors unless preceded or accompanied by an effective prospectus. Nothing herein contained is to be considered an offer to buy shares of the Equinox Systematica Macro Fund. Such offering is made only by prospectus, which includes details as to offering price and other material information.
Distributed by Northern Lights Distributors, LLC
Member FINRA
This Page Intentionally Left Blank
Equinox Systematica Macro Fund:
Annual Letter to Shareholders for the Year Ended March 31, 2017
The Equinox Systematica Macro Fund (the “Fund”) was launched on the Equinox Alternative Strategy Platform on June 17, 2014 with an initial NAV of $10.00 per share.
The Fund’s investment objective is to seek long-term capital appreciation, which it pursues by investing in a combination of (i) derivative instruments such as swap agreements that provide exposure to a managed futures program1 directed by Systematica Investments Limited (the “Systematica Program”);2 and (ii) a fixed-income portfolio. The Fund’s fixed income investments are held in the form of cash, cash equivalents and short-dated (less than one year) U.S. Treasury securities.
The Systematica Program is a systematic global macro futures trading program that utilizes both trend-following and non-trend strategies. It targets roughly equal risk allocations across (i) trend strategies, (ii) enhanced carry strategies, and (iii) sector-specific enhancer or “alpha” strategies. This multi-strategy approach results in returns that tend to have low correlations not only to traditional asset classes such as bonds and equities and alternative strategies other than managed futures, but even to most other managed futures trading programs, including many that are predominantly trend-following.
Performance of the Fund: April 1, 2016 to March 31, 2017
| 1 | “Managed Futures Program” generally is a trading program that a CTA uses to guide its investments in futures, forwards, options or spot contracts. Please see the Fund’s Prospectus for a detailed description of the Fund’s investment strategy. |
| 2 | Systematica Investments Limited, in its capacity as general partner of Systematica Investments LP (“Systematica”), is a commodity trading advisor (“CTA”) registered with the U.S. Commodity Futures Trading Commission. Prior to January 1, 2015, the Systematica Program was known as the BlueCrest Program and was run by Leda Braga and her team of investment professionals who now control and manage Systematica. BlueCrest Capital Management Limited, an investment advisory firm, held a minority interest in Systematica and its affiliates. BlueCrest Capital Management Limited, acting solely in its capacity as general partner of BlueCrest Capital Management LP, was the previous investment manager to Systematica’s clients, and as of January 1, 2015, Systematica’s clients assigned their investment management agreements to and appointed Systematica as their investment manager. As the Fund launched while the Systematica team was at BlueCrest Capital Management Limited, the Fund included “BlueCrest” in its name. However, as of January 1, 2015, BlueCrest Capital Management Limited and its affiliates do not manage the Systematica Program, and the use of “BlueCrest” in the name of the Fund should not imply or indicate otherwise. |
Please refer to the section entitled “Definitions of Terms and Indices,” which can be found at the end of this letter, for additional information on bolded terms.
| | 4/1/16—3/31/17 | | Since Inception |
| Name | Cumulative Return | | Cumulative Return | Std. Deviation |
| | | | | (Annualized) |
| Equinox Systematica Macro Fund | | | | |
| – Class I (Ticker: EBCIX) | -13.47% | | 0.49% | 11.92% |
| | | | | |
| S&P 500® Total Return Index | 17.17% | | 29.03% | 10.82% |
| | | | | |
| Barclay BTOP50 ® Index | -8.16% | | 3.93% | 7.81% |
Performance displayed represents past performance, which is not a guarantee of future results. Total returns reflect the reinvestment of all dividends.
Returns of the Fund’s Class I shares are shown in the table above, for the last fiscal year and also since the Fund’s inception. As of March 31, 2017, the Fund had negative performance for the past year but is still slightly positive since inception.
RISK EXPOSURES (VaR) BY SECTOR
As of 3/31/2017
| | Equity | Interest | Agricultural | | | |
| Currencies | Indices | Rates | Commodities | Energy | Metals | Total |
| 18% | 37% | 12% | 10% | 20% | 3% | 100% |
The Fund’s risk exposure is diversified across six sectors. As of March 31, 2017, measured in terms of Value-at-Risk or VaR, Equity Indices (37%) represented the largest exposure, followed by Energy (20%), Currencies (18%), Interest Rates (12%), Agricultural Commodities (10%) and Metals (3%). It is worth noting that the Systematica Program has long-term target risk exposures to various sectors. The actual sector risk exposures, which we show above, may vary significantly over time, as they are functions of the signals generated by the program’s trading models: when trends abound in markets, whether up-trends or down-trends, actual gross sector risk exposures will tend to be high.
PERFORMANCE ATTRIBUTION BY SECTOR
(4/1/2016 to 3/31/2017)
Please refer to the section entitled “Definitions of Terms and Indices,” which can be found at the end of this letter, for additional information on bolded terms.
| | Equity | Interest | Agricultural | | | |
| Currencies | Indices | Rates | Commodities | Energy | Metals | Total |
| 0.96% | 6.24% | -5.26% | -2.36% | -9.78% | -3.28% | -13.47% |
In terms of performance attribution, as shown above, Equity Indices was only the sector that had a significant positive contribution to performance, while Currencies made a smaller contribution. Energy led the detractors, followed by Interest Rates, Metals, and Agricultural Commodities.
Fund Commentary
Unlike the previous fiscal year, this year proved to be quite an unfavorable climate for the strategies employed by the Fund. While equity markets continued to make new highs, leading to profitable long positions, and some gains were made from currency positions, trend reversals in fixed-income and energy detracted significantly from performance. Metals and agricultural commodities contributed further losses, albeit smaller.
April 2016 saw a continuation of some of the trend reversals witnessed towards the end of the first quarter. Equities experienced some very volatile moves in Europe, mainly led by a continuation of the short squeeze in the oil exploration and production space and the mining sector which both saw significant gains over the month. These sharp moves did not lend well to existing longer-term trends. In fixed income, yields rose across the space for the most part, but again witnessed very choppy trading and sharp reversals of longer-term trends with UK gilts, US treasuries and German government bonds yields all rising. In the absence of any real fundamental reason or change in oil market supply dynamics, both Brent and WTI continued to rally back to more favorable prices for producers, putting extreme pressure on short positions. These three sectors did most of the damage during the month. Fixed-income was the only sector that was slightly positive for the month, as the Fund posted one of its worst months ever.
Please refer to the section entitled “Definitions of Terms and Indices,” which can be found at the end of this letter, for additional information on bolded terms.
Negative performance continued into May, although it was not as dismal a month as April. Throughout the month, aggressive trading ranges occurred in many of the major asset classes. For example, European equities traded within a 4% range with rapid daily swings, only to break the range and trade higher towards the end of the month. The VIX Index continued to languish at the lows of the year despite high intraday volatility. Various government bonds saw large swings within short periods of time. FX markets were volatile at times over the month for specific currencies; however, for the most part the US Dollar regained some lost ground. The energy complex was one of the least volatile sectors on the month, with crude eventually trading at the “psychological threshold” of $50 for the first time in 2016. Agricultural commodities were the only sector to post positive returns.
June turned out to be the bright spot of the quarter. The UK’s “Brexit” referendum dominated news headlines. With market complacency in the days preceding the vote, the pound traded 7% higher and general levels of volatility became slightly depressed across major risk assets. This squeeze on risk assets laid the groundwork for an explosion of volatility in the early overnight trading sessions, especially for the pound and equities in particular. Equities across Europe and the US were gapping up to 10% lower while the pound plummeted 12% after briefly touching $1.50 against the US Dollar only hours before news of the referendum result. Perhaps surprisingly, even with the UK’s political uncertainty post-referendum, volatility remained subdued. Sterling is slowly recovering after its post-“Brexit” plunge and the FTSE 100 Index, which has a large percentage of USD-earning companies, has benefited in nominal terms from the depreciation of the pound and was the only equity index trading positive on the year. Still, confusion and a sense of the unknown were clearly evident across major markets. The Fund benefitted from some of these large moves, enough for fixed income, agricultural commodities, and currencies to compensate for the losses from the equities and energy sectors.
Equities continued to recover at the beginning of July following the initial sell-off after the UK’s decision to leave the EU in June. However, this was to be short lived and transitioned into a
Please refer to the section entitled “Definitions of Terms and Indices,” which can be found at the end of this letter, for additional information on bolded terms.
sideways trading month for most assets. US equities barely made a dent on a tight trading range while European equities had positive returns. US treasuries finished as they started the month, as did the US Dollar. Despite the end of month weakness in the US Dollar, it was the energy complex that suffered a bit more of a directional bias, with oil trending consistently lower throughout July. Central banks gave verbal assurances to calm markets and the Bank of Japan announced a modest expansion of its monetary easing program to a very underwhelming reaction from the market. The Yen also started and finished at similar levels by the end of July. Currencies and agricultural commodities contributed small losses, but they were easily offset by the large gains in the other sectors.
Unfortunately, performance took a turn for the worse in August. The month started off with very strong non-farm payroll numbers, at the high end of expectations along with a slightly higher revision for July. The US Dollar moved higher and also took the equity market with it. The euphoria was short-lived however, as the market proceeded to settle into a very dull grind for almost the rest of the month. The US Dollar gave up its gains and more after conflicting comments from the Federal Open Market Committee (FOMC) members regarding rate rises. Markets began reacting to any comment or headline emanating from various Fed members regarding the timing of the next (if any) rate rise. While there was a relatively strong equity market throughout August, it was the energy complex that really benefitted from the US Dollar depreciation. Oil broke out sharply from its $40-$49 range. Unfortunately, this led to poor performance in the energy sector. There were some strong trend reversals in fixed income as well, leading to negative performance overall.
Matters only worsened in September, as volatility spiked. The European Central Bank (“ECB”) did not lengthen its quantitative easing program, sending equities into a tailspin. Global equity markets took a sharp nosedive of almost 4% over 36 hours. The selloff was across the board, led by equity markets, but followed with bond yields moving higher and the relative safe haven of the USD experiencing inflows. Equity markets regained half of these losses almost as quickly as they shed them and most indices finished around the unchanged mark by the end of the
Please refer to the section entitled “Definitions of Terms and Indices,” which can be found at the end of this letter, for additional information on bolded terms.
month. The Organization of the Petroleum Exporting Countries’ (OPEC) meeting provided an outcome of agreeing to production quotas at a later date. Oil rallied but struggled to gain any real upside momentum. Towards the end of the month, rumors circulated regarding the financial health of certain European banks which caused another panic for the banking sector. Faced with aggressive trend reversals and risk off reactions, the Fund put up its worst month of the period, with negative contributions from all sectors.
Although not as bad as September, poor performance continued in October. Some slightly better global macro data seen in Europe aligned with the notion that Hillary Clinton was leading the race for the White House kept risk assets relatively steady throughout the month. In addition, headlines coming from OPEC nations also managed to keep oil hovering above the psychological $50 level. However, most of these notions started to unravel as Draghi took no action regarding the extension of the QE program. Next, Donald Trump closed the gap in opinion polls, sending most risk assets into a decline towards the end of the month. Additionally, in the UK, a ruling stopped Theresa May from invoking Article 50 without parliamentary approval, further lengthening the uncertainty of the outcome of Brexit. Poor performance in all sectors except the foreign exchange market (FX) led to another negative month. A risk-off mentality prevailed across the majority of asset classes towards the end of the month, which hurt most sectors.
November was unique in that the main focus was not on central bankers. Donald Trump winning the US presidential election and the way in which risk assets reacted took many by surprise. There was an initial bout of volatility on the night of the actual election when Trump was gaining strength; however, by the time the US cash market opened the next day, US equities were lifted to new highs. Elsewhere, OPEC came to an agreement to limit production to circa 32.5 million barrels per day (mbpd), a cut of approximately 1.2m barrels. However, this cut and the excitement leading up to the meeting resulted in huge volatility in the energy space especially in the last few days of November. Commodities saw further volatility with a strong bid coming in for base metals throughout the whole month.
Please refer to the section entitled “Definitions of Terms and Indices,” which can be found at the end of this letter, for additional information on bolded terms.
The portfolio achieved a small positive contribution from agricultural commodities, but losses in all other sectors, with energy and fixed income leading the way, resulted in negative performance overall.
December was the month investors had been waiting for all year. After 11 months of “jawboning” and speculation, the Federal Open Markets Committee (FOMC) finally raised the base rate by another 25 basis points (bps), delivering the first interest rate rise since December 2015, and only the second hike in a decade. Most asset classes reacted as expected, the US Dollar continued to strengthen, and countries with low-to-negative rates currencies suffered. US equities stalled after the tremendous gains in November. Elsewhere around the globe, equities played catch-up with the US and most European and Asian bourses saw gains. Following the OPEC agreement in November, the energies complex continued to gain traction in the face of a stronger US Dollar, with some weakness in the base metals sector, while precious metals held their own after recent losses. Bonds continued to see yields rise throughout December, but notably—despite the Fed rate hike—yields in the US did not rise as much as they had in the previous month. In Europe, the European Central Bank (ECB) manipulated its QE program by reducing the monthly purchases amount while extending the duration for which it plans to do so, thereby enlarging the program by another €60 billion. Equity indices performed well enough to overcome negative contributions from all the other sectors, leading to the first positive month of performance, albeit small, since July.
2017 had an unusually quiet start to the year for most markets, in anticipation of the new administration. Once Donald Trump was inaugurated, assets began to unfreeze and showed some movement towards the end of the month. It appeared that some nervous long USD investors decided to trim back exposure, as January saw some weakness and a reversal of December’s attempted breakout. US Equities traded at new highs as the volatility index (VIX) hit new lows. European equities had little movement for most of January, only to spike higher with no noticeable reason, as did Asia, towards the end of the month. Bond yields in Europe mostly rose, as did yields in the US, but less than they did in Q4 2016. In commodities, energies
Please refer to the section entitled “Definitions of Terms and Indices,” which can be found at the end of this letter, for additional information on bolded terms.
traded sideways for the majority of the month. The thoughts of an OPEC-induced squeeze began to fade and be replaced by “hope” of a squeeze due to the potential change in the geopolitical space in coming months. January ended slightly negative, despite yet another good month for equities.
During February, equity volatility continued to oscillate at multi-year lows while US equities crept higher. There were only four instances in February where the S&P 500® (SPX) closed lower than the previous day’s close, and then by no more than 10bps. Global equities followed, with bond proxy stocks (utilities, healthcare and consumer staples) being the top performers globally. Despite this bid under the “boring” names, the impending initial public offering (IPO) of Snapchat and its fluctuating valuation range soon diverted the market’s attention. Concerns that led to a rise in bond yields in January were calmed in Europe as investors became more comfortable with the elections in France, and European yields traded lower throughout the month. Bonds on the shorter end of the curve reached record lows, with German two-year yields almost touching –1%. The energy market valiantly battled oversupply concerns with record long positioning across the curve in oil and related products. It was a bad month for natural gas around the globe, as US natural gas was weighed down by better weather conditions. Metals, especially the base complex, remain elevated in the market mainly due to Trump’s touted infrastructure spending plans. In the FX market, the focus on the USD continued, but there was mainly sideways trading for the greenback after a poor couple of months. The Fund succeeded in eking out a positive month on the back of the equity index and currency sectors.
March saw one of the first big tests for Trump. His attempts to lay the groundwork to repeal the Affordable Care Act taught him his first frustrating lesson in politics. The rash attempt to force through amendments was not received well, and the proposed bill had to be ignominiously withdrawn. Markets now await and speculate how his presidency is likely to play out for the foreseeable future. Elsewhere, there was a big move lower in the energy complex under the weight of large inventory builds and some apparent dissension in the ranks of OPEC.
Please refer to the section entitled “Definitions of Terms and Indices,” which can be found at the end of this letter, for additional information on bolded terms.
The U.S. Federal Reserve also played a part with a another 25bps hike in the base rate, a move that had already been priced in, so much so that the US Dollar weakened almost immediately. Prime Minister Theresa May delivered on her promise to invoke Article 50 and formally set in the official countdown for Brexit. The markets now await the upcoming debate between both sides of the camp. The ECB Bank took no action as inflation picked up slightly in the Eurozone but hovers around the target rate. Equities and currencies once again lifted the Fund to its best month since July 2016, and brought the year to a more optimistic close.
Outlook
More than eight years into the current equity bull market run, many market professionals continue to worry that prevailing lofty equity valuations may not be sustainable for much longer. So far, they have been proven wrong, and the election of Trump appears to have made the markets even more optimistic than the fundamentals might justify. Likewise, forecasters who have been predicting higher interest rates for at least three years have also been off the mark, as the secular upward trend in bonds showed some signs of reversing when the Fed started hiking, but has stalled of late. While all asset classes do inevitably go through cycles, it is increasingly clear that investors and pundits alike are inept at predicting the future accurately, and attempts to tactically time markets usually end up detracting from performance. Managed futures programs, by contrast, tend to be “reactive” and generally do not seek to predict trends or call market tops and bottoms, which is one of the factors that has been credited for the long-term historical track record of the asset class.
Although the Fund has been in operation only for a fairly short period, Systematica’s trading programs have track records that date back several years. These types of programs have historically offered useful diversification benefits, along with what we believe are attractive risk-adjusted long-term returns over multiple market cycles. In our opinion, the Fund and the managed futures asset class could continue to offer these potential benefits in the future. The macro environment is still challenging and the outlook for markets remains fraught with
Please refer to the section entitled “Definitions of Terms and Indices,” which can be found at the end of this letter, for additional information on bolded terms.
uncertainty. Some of the risks we perceive on the horizon for the coming year include: the uncertainties pertaining to the Trump administration’s policies regarding healthcare, fiscal policy, the environment, education, tax reform, trade, and immigration, and international relations and diplomacy. Geopolitical tensions are on the rise in many parts of the world, including the aftermath of Brexit, elections in France and Germany, escalation in Syria and North Korea, etc. Globally, the economy appears to be stabilizing, and perhaps even picking up some steam. Given these uncertainties, market volatility could quickly increase.
We continue to believe that, by accepting some drawdown risk—and managed futures drawdowns have historically rarely been very deep, although they have at times dragged out painfully, as was the case in 2011-2013—investors have been compensated with a positive risk premium over time, a core hypothesis of most managed futures strategies. Over full cycles, which include trend expansion followed by reversals, the asset class has displayed the potential to provide absolute positive returns. While this is obviously not the case during every single cycle, the Systematica program strives to implement efficient risk management techniques that aim to protect gains and mitigate losses during difficult periods; based on historical experience, we believe this may yield positive risk-adjusted performance over the long run.
Difficult market conditions, the challenging climate of economic and geopolitical uncertainty, and the unpredictable nature of financial markets—all these pose serious questions for investors and investment professionals. As always, we encourage investors to focus on holding portfolios that contain a strategic mix of traditional assets and alternative asset classes, appropriate for their long-term goals. Well-balanced portfolios may display lower volatility, while also affording opportunities for potential long-term growth. We believe that the Fund could play an important role in such a portfolio.
Please refer to the section entitled “Definitions of Terms and Indices,” which can be found at the end of this letter, for additional information on bolded terms.
Definitions of Terms and Indices
Article 50 of the Treaty on European Union is a part of European Union law that sets out the process by which member states may withdraw from the European Union.
Alpha is a measure of performance on a risk-adjusted basis. Alpha takes the volatility (price risk) of a fund and compares its risk-adjusted performance to a benchmark index. The excess return of the fund relative to the return of the benchmark index is a fund’s alpha.
Brexit is a commonly used term for the United Kingdom’s planned withdrawal from the European Union.
A drawdown is the peak-to-trough decline during a specific record period of an investment, fund or commodity. A drawdown is usually quoted as the percentage between the peak and the trough. Max drawdown refers to the greatest drawdown in the programs history.
Derivative contract is a financial contract which derives its value from the performance of another entity such as an asset, index, or interest rate, called the “underlying.” Derivatives are one of the three main categories of financial instruments, the other two being equities (i.e. stocks) and debt (i.e. bonds and mortgages).
Enhanced carry strategies aim to benefit from diversified carry signals while seeking to mitigate drawdowns through a dynamic risk management approach.
The Federal Open Market Committee (FOMC) is charged under United States law with overseeing the nation’s open market operations.
The Financial Times Stock Exchange (FTSE) 100 Index is a share index of the 100 companies listed on the London Stock Exchange with the highest market capitalization.
Long is the buying of a security such as a stock, commodity or currency with the expectation that the asset will rise in value.
Risk-adjusted performance is a concept that refines an investment’s return by measuring how much risk is involved in producing that return, which is generally expressed as a number or rating. Risk-adjusted returns are applied to individual securities and investment funds and portfolios.
Sector specific strategies invest in a specific sector of the economy, such as energy or utilities. They come in many different flavors and can vary substantially in market capitalization, investment objective (i.e. growth and/or income) and class of securities within the portfolio.
Short position is a position whereby an investor sells borrowed securities in anticipation of a price decline and is required to return an equal number of shares at some point in the future.
A swap is an agreement between two parties to exchange sequences of cash flows for a set period of time. Usually, at the time the contract is initiated, at least one of these series of cash flows is determined by a random or uncertain variable, such as an interest rate, foreign exchange rate, equity price, or commodity price.
A Trend-following strategy seeks to capitalize on momentum or price trends across global asset classes by taking either long or short positions, as a trend is underway. Price trends are created when investors are slow to act on new information or sell prematurely and hold on to losing investments to long. Price trends continue when investors continue to buy and investment that is going up in price or sell an investment that is going down in price.
Value at risk (VaR) is a statistical technique used to measure and quantify the level of financial risk within a firm or investment portfolio over a specific time-frame.
VIX® Index is a forward-looking measure of equity market volatility. Since its introduction, VIX has been considered by many to be the world’s premier barometer of investor sentiment and market volatility.
5375-NLD-05/10/2017
Equinox Systematica Macro Fund
PORTFOLIO REVIEW (Unaudited)
March 31, 2017
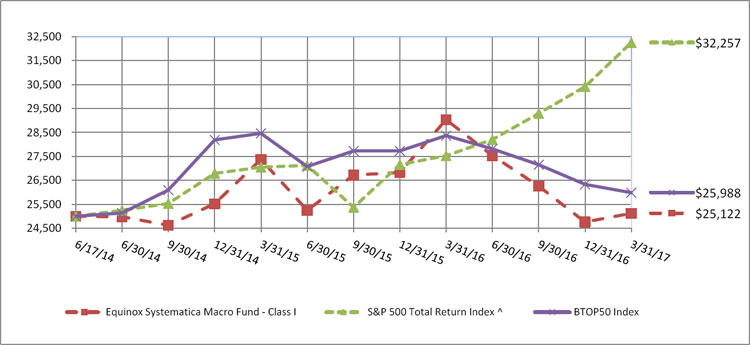
The Fund’s performance figures* for the periods ended March 31, 2017, as compared to its benchmark:
| | | | Since Inception ** - |
| | | 1 Year | March 31, 2017 |
| Equinox Systematica Macro Fund | | | |
| Class I | | (13.47)% | 0.17% |
| BTOP50 Index *** | | (8.14)% | 1.40% |
| S&P 500 Total Return Index ^ | | 17.17% | 9.58% |
| * | The performance data quoted is historical. The performance comparison includes reinvestment of all dividends and capital gains. Past performance is no guarantee of future results. Current performance may be higher or lower than the performance data quoted. The principal value and investment return of an investment will fluctuate so that your shares, when redeemed, may be worth more or less than their original cost. The returns shown do not reflect the deduction of taxes that a shareholder would pay on portfolio distributions or on the redemptions of portfolio shares. Performance figures for periods greater than one year are annualized. The returns would have been lower had the Advisor not waived its fees or reimbursed a portion of the Fund’s expenses. Per the fee table in the Fund’s prospectus dated August 1, 2016, the Fund’s “Total Annual Fund Operating Expenses” and “Total Annual Fund Operating Expenses (after Fee Waiver and/or Expense Reimbursement)” are 0.95% and 0.79%, respectively, of the Fund’s average daily net assets. These expenses may differ from the actual expenses incurred by the Fund for the period covered by this report. Additional information regarding the Fund’s expense ratios is available in the Financial Highlights. For performance information current to the most recent month-end please call 1-888-643-3431. |
| ** | Commencement of operations is June 17, 2014. |
| ^ | The S&P 500 Total Return Index is a widely accepted, unmanaged index of U.S. stock market performance which does not take into account charges, fees and other expenses. Investors cannot invest directly in an index. |
| *** | The Barclay BTOP50 Index (“BTOP50 Index”) seeks to replicate the overall composition of the managed futures industry with regard to trading style and overall market exposure. The BTOP50 Index employs a top-down approach in selecting its constituents. The largest investable trading advisor programs, as measured by assets under management, are selected for inclusion in the BTOP50 Index. In each calendar year the selected trading advisors represent, in aggregate, no less than 50% of the investable assets of the Barclay CTA Universe. For 2017, there are 20 funds in the BTOP50 Index. Investors cannot invest directly in an index. |
Comparison of the Change in Value of a $25,000 Investment
| Holdings by Asset Class | | % of Net Assets | |
| Other Assets Less Liabilities | | | 100.0 | % |
| | | | 100.0 | % |
Please refer to the Consolidated Portfolio of Investments in this Annual Report for a detail of the Fund’s holdings. The value of the Fund’s derivative positions that provide exposure to a managed futures program is included in “other assets less liabilities.” See the accompanying notes for more information on the impact of the Fund’s derivative positions on the financial statements.
Equinox Systematica Macro Fund
CONSOLIDATED PORTFOLIO OF INVESTMENTS
March 31, 2017
| | | Fair Value | |
| TOTAL INVESTMENTS - 0.0% (Cost $0) (a) | | $ | — | |
| OTHER ASSETS LESS LIABILITIES - NET - 100.0% | | | 3,806,334 | |
| TOTAL NET ASSETS - 100.0% | | $ | 3,806,334 | |
| (a) | Represents cost for financial reporting purposes. Aggregate cost for federal tax purposes is $0. |
| | | Unrealized | |
| | | Depreciation | |
| SWAP CONTRACT + | | | | |
| | | | | |
| Total return swap with Morgan Stanley & Co. International plc. The swap provides exposure to the total returns of the Systematic Macro Program of Systematica Investments LP (“Systematica”) calculated on a daily basis with reference to a customized reference index that is proprietary to Morgan Stanley. The reference index is comprised at any given time of trading positions selected by Systematica that include over-the-counter foreign exchange and currency option transactions and exchange traded futures and options in relation to any commodity, metal, financial instrument, currency, interest rate or index traded on certain exchanges. These fees are subject to fluctuation depending on prevailing interest rates and the degree to which such over-the-counter derivatives are employed. Under the terms of the swap, Equinox has the ability to periodically adjust the notional level of the swap. The swap was effective on June 23, 2014 and will remain effective until June 18, 2019 unless earlier terminated. In addition, the swap provides for a fee of 0.30% plus 1 month LIBOR, accrued on the notional value of the swap and payable to Morgan Stanley & Co. International plc. At March 31, 2017, the reference index of the swap was diversified among the following sectors: agricultural commodities (10%), energy (20%) metals (3%), equity indices (37%), currencies (18%), and interest rates (12%). These sector allocation percentages are unaudited. (Notional Value $3,634,858) | | $ | (9,983 | ) |
| Total Net Unrealized Depreciation on Swap Contract | | $ | (9,983 | ) |
| + | All or a portion of this investment is a holding of Equinox BlueCrest Systematic Macro Fund Limited. |
See accompanying notes to consolidated financial statements.
Equinox Systematica Macro Fund
CONSOLIDATED STATEMENT OF ASSETS AND LIABILITIES
March 31, 2017
| ASSETS | | | | |
| Investment securities: | | | | |
| At cost | | $ | — | |
| At fair value | | $ | — | |
| Cash | | | 3,026,929 | |
| Cash pledged to broker * | | | 809,500 | |
| Receivable due from Advisor | | | 33,733 | |
| Prepaid expenses & other assets | | | 11,187 | |
| TOTAL ASSETS | | | 3,881,349 | |
| | | | | |
| LIABILITIES | | | | |
| Unrealized depreciation on swap contract | | | 9,983 | |
| Audit fees payable | | | 33,602 | |
| Printing fees payable | | | 12,447 | |
| Custody fees payable | | | 2,256 | |
| Payable to related parties | | | 14,034 | |
| Accrued expenses and other liabilities | | | 2,693 | |
| TOTAL LIABILITIES | | | 75,015 | |
| NET ASSETS | | $ | 3,806,334 | |
| | | | | |
| Net Assets Consist Of: | | | | |
| Paid in capital | | $ | 10,829,538 | |
| Accumulated net investment loss | | | (8,880,825 | ) |
| Accumulated net realized gain from investments and swap contract | | | 1,867,604 | |
| Net unrealized depreciation on swap contract | | | (9,983 | ) |
| NET ASSETS | | $ | 3,806,334 | |
| | | | | |
| Net Asset Value Per Share: | | | | |
| Class I Shares: | | | | |
| Net Assets | | $ | 3,806,334 | |
| Shares of beneficial interest outstanding ($0 par value, unlimited shares authorized) | | | 457,639 | |
| Net asset value (Net Assets ÷ Shares Outstanding), offering price and redemption price per share | | $ | 8.32 | |
| * | All of this balance has been pledged as collateral for swap contract. |
See accompanying notes to consolidated financial statements.
Equinox Systematica Macro Fund
CONSOLIDATED STATEMENT OF OPERATIONS
For the Year Ended March 31, 2017
| INVESTMENT INCOME | | | |
| Interest | | $ | 119,763 | |
| | | | | |
| EXPENSES | | | | |
| Investment advisory fees | | | 232,218 | |
| Administrative services fees | | | 29,608 | |
| Printing and postage expenses | | | 35,752 | |
| Registration fees | | | 34,531 | |
| Accounting services fees | | | 33,335 | |
| Audit fees | | | 34,128 | |
| Transfer agent fees | | | 11,546 | |
| Legal fees | | | 28,685 | |
| Custodian fees | | | 8,482 | |
| Compliance officer fees | | | 13,994 | |
| Insurance expense | | | 9,184 | |
| Non 12b-1 shareholder services fee | | | 3,566 | |
| Trustees fees and expenses | | | 640 | |
| Other expenses | | | 2,177 | |
| TOTAL EXPENSES | | | 477,846 | |
| | | | | |
| Less: Fees waived by the Advisor | | | (193,078 | ) |
| | | | | |
| NET EXPENSES | | | 284,768 | |
| NET INVESTMENT LOSS | | | (165,005 | ) |
| | | | | |
| REALIZED AND UNREALIZED GAIN/(LOSS) ON INVESTMENTS | | | | |
| Net realized gain/(loss) on: | | | | |
| Investments | | | 21,568 | |
| Swap contract | | | (6,267,585 | ) |
| | | | (6,246,017 | ) |
| | | | | |
| Net change in unrealized depreciation on: | | | | |
| Investments | | | (12,627 | ) |
| Swap contract | | | (730,890 | ) |
| | | | (743,517 | ) |
| | | | | |
| NET REALIZED AND UNREALIZED LOSS ON INVESTMENTS | | | (6,989,534 | ) |
| | | | | |
| NET DECREASE IN NET ASSETS RESULTING FROM OPERATIONS | | $ | (7,154,539 | ) |
See accompanying notes to consolidated financial statements.
Equinox Systematica Macro Fund
CONSOLIDATED STATEMENTS OF CHANGES IN NET ASSETS
| | | Year Ended | | | Year Ended | |
| | | March 31, | | | March 31, | |
| | | 2017 | | | 2016 | |
| FROM OPERATIONS | | | | | | | | |
| Net investment loss | | $ | (165,005 | ) | | $ | (352,895 | ) |
| Net realized gain/(loss) on investments and swap contract | | | (6,246,017 | ) | | | 3,068,115 | |
| Net change in unrealized appreciation/(depreciation) on investments and swap contract | | | (743,517 | ) | | | 747,760 | |
| Net increase/(decrease) in net assets resulting from operations | | | (7,154,539 | ) | | | 3,462,980 | |
| | | | | | | | | |
| DISTRIBUTIONS TO SHAREHOLDERS | | | | | | | | |
| From net realized gains | | | (7,425 | ) | | | — | |
| From net investment income | | | (3,452,690 | ) | | | (4,764,798 | ) |
| From distributions to shareholders | | | (3,460,115 | ) | | | (4,764,798 | ) |
| | | | | | | | | |
| FROM SHARES OF BENEFICIAL INTEREST | | | | | | | | |
| Proceeds from shares sold | | | 30,225,691 | | | | 24,936,708 | |
| Net asset value of shares issued in reinvestment of distributions | | | 2,298,496 | | | | 3,387,072 | |
| Payments for shares redeemed | | | (99,844,519 | ) | | | (1,668,216 | ) |
| Net increase/(decrease) in net assets from shares of beneficial interest | | | (67,320,332 | ) | | | 26,655,564 | |
| | | | | | | | | |
| TOTAL INCREASE/(DECREASE) IN NET ASSETS | | | (77,934,986 | ) | | | 25,353,746 | |
| | | | | | | | | |
| NET ASSETS | | | | | | | | |
| Beginning of Period | | | 81,741,320 | | | | 56,387,574 | |
| End of Period* | | $ | 3,806,334 | | | $ | 81,741,320 | |
| *Includes accumulated net investment loss of: | | $ | (8,880,825 | ) | | $ | (5,403,443 | ) |
| | | | | | | | | |
| SHARE ACTIVITY | | | | | | | | |
| Class I: | | | | | | | | |
| Shares Sold | | | 3,080,203 | | | | 2,343,449 | |
| Shares Reinvested | | | 279,283 | | | | 339,726 | |
| Shares Redeemed | | | (10,577,888 | ) | | | (158,833 | ) |
| Net increase/(decrease) in shares of beneficial interest outstanding | | | (7,218,402 | ) | | | 2,524,342 | |
See accompanying notes to consolidated financial statements.
Equinox Systematica Macro Fund
CONSOLIDATED FINANCIAL HIGHLIGHTS
Per Share Data and Ratios for a Share of Beneficial Interest Outstanding Throughout Each Period
| | | Class I | |
| | | Year Ended | | | Year Ended | | | Period Ended | |
| | | March 31, | | | March 31, | | | March 31, | |
| | | 2017 | | | 2016 | | | 2015 (1) | |
| Net asset value, beginning of period | | $ | 10.65 | | | $ | 10.95 | | | $ | 10.00 | |
| Activity from investment operations: | | | | | | | | | | | | |
| Net investment loss (2) | | | (0.05 | ) | | | (0.06 | ) | | | (0.06 | ) |
| Net realized and unrealized gain/(loss) on investments and swap contract | | | (1.40 | ) | | | 0.66 | | | | 1.01 | |
| Total from investment operations | | | (1.45 | ) | | | 0.60 | | | | 0.95 | |
| Less distributions from: | | | | | | | | | | | | |
| Net investment income | | | (0.88 | ) | | | (0.90 | ) | | | — | |
| Net realized gains | | | (0.00 | ) (5) | | | — | | | | — | |
| Total distributions | | | (0.88 | ) | | | (0.90 | ) | | | — | |
| Net asset value, end of period | | $ | 8.32 | | | $ | 10.65 | | | $ | 10.95 | |
| Total return (3) | | | (13.47 | )% | | | 6.06 | % | | | 9.50 | % |
| Net assets, at end of period (000’s) | | $ | 3,806 | | | $ | 81,741 | | | $ | 56,388 | |
| Ratio of net expenses to average net assets (4) | | | 0.79 | % | | | 0.79 | % | | | 0.79 | % (6) |
| Ratio of net investment loss to average net assets | | | (0.46 | )% | | | (0.61 | )% | | | (0.72 | )% (6) |
| Portfolio Turnover Rate | | | 0 | % | | | 0 | % | | | 0 | % (7) |
| (1) | The Equinox Systematica Macro Fund commenced operations on June 17, 2014. |
| (2) | Per share amounts calculated using the average shares method, which more appropriately presents the per share data for the period. |
| (3) | Total returns are historical and assume changes in share price and reinvestment of dividends and distributions. Had the Advisor not waived or reimbursed the Fund’s expenses, the returns would have been lower. Total returns for periods of less than one year are not annualized. |
| (4) | Represents the ratio of expenses to average net assets net of fee waivers and/or expense reimbursements by the Advisor. Had these waivers not been in place, the expense ratio would have been: | | | 1.33 | % | | | 0.95 | % | | | 1.09% (6) | |
| (5) | Amount represents less than $0.005. |
See accompanying notes to consolidated financial statements.
Equinox Systematica Macro Fund
NOTES TO CONSOLIDATED FINANCIAL STATEMENTS
March 31, 2017
The Equinox Systematica Macro Fund (the “Fund”) is a non-diversified series of shares of beneficial interest of Equinox Funds Trust (the “Trust”), a statutory trust organized under the laws of the State of Delaware on June 2, 2010, and is registered under the Investment Company Act of 1940, as amended (the “1940 Act”), as an open-end management investment company. The Fund began operations on June 17, 2014. The Fund currently offers Class I (“Institutional”) Shares that are offered at net asset value. The investment objective of the Fund is to achieve long term capital appreciation.
| 2. | SIGNIFICANT ACCOUNTING POLICIES |
The following is a summary of significant accounting policies followed by the Fund in preparation of its consolidated financial statements. The policies are in conformity with accounting principles generally accepted in the United States of America (“GAAP”). The preparation of the consolidated financial statements requires management to make estimates and assumptions that affect the reported amounts of assets and liabilities and disclosure of contingent assets and liabilities at the date of the consolidated financial statements and the reported amounts of income and expenses for the period. Actual results could differ from those estimates. The Fund is an investment company and accordingly follows the investment company accounting and reporting guidance of the Financial Accounting Standards Board (“FASB”) Accounting Standard Codification Topic 946 “Financial Services – Investment Companies” including FASB Accounting Standard Update ASU 2013-08.
Security Valuation – Securities, including exchange traded funds, listed on an exchange are valued at the last reported sale price at the close of the regular trading session of the exchange on the business day the value is being determined, or in the case of securities listed on NASDAQ at the NASDAQ Official Closing Price (“NOCP”). In the absence of a sale such securities shall be valued at the mean between the current bid and ask prices on the primary exchange on the day of valuation. Debt securities (other than short-term obligations) are valued each day by an independent pricing service approved by the Board of Trustees (the “Board”) using methods which include current market quotations from a major market maker in the securities and based on methods which include the consideration of yields or prices of securities of comparable quality, coupon, maturity and type. Short-term debt obligations having 60 days or less remaining until maturity, at time of purchase, may be valued at amortized cost. Investments in open-end investment companies are valued at net asset value. Investments in swap contracts are reported at fair value based on daily price reporting from the swap counterparty.
The Fund may hold securities, such as private investments, interests in commodity pools, other non-traded securities or temporarily illiquid securities, for which market quotations are not readily available or are determined to be unreliable. These securities will be valued using the “fair value” procedures approved by the Board. The Board has delegated execution of these procedures to a fair value team composed of one or more representatives from each of the (i) Trust, (ii) administrator, and (iii) Advisor. The team may also enlist third party consultants such as a valuation specialist at a public accounting firm, valuation consultant or financial officer of a security issuer on an as-needed basis to
Equinox Systematica Macro Fund
NOTES TO CONSOLIDATED FINANCIAL STATEMENTS (Continued)
March 31, 2017
assist in determining a security-specific fair value. The Board reviews and ratifies the execution of this process and the resultant fair value prices at least quarterly to assure the process produces reliable results.
Fair Valuation Process – As noted above, the fair value team is composed of one or more representatives from each of the (i) Trust, (ii) administrator, and (iii) Advisor. The applicable investments are valued collectively via inputs from each of these groups. For example, fair value determinations are required for the following securities: (i) securities for which market quotations are insufficient or not readily available on a particular business day (including securities for which there is a short and temporary lapse in the provision of a price by the regular pricing source), (ii) securities for which, in the judgment of the Advisor, the prices or values available do not represent the fair value of the instrument. Factors which may cause the Advisor to make such a judgment include, but are not limited to, the following: only a bid price or an asked price is available; the spread between bid and asked prices is substantial; the frequency of sales; the thinness of the market; the size of reported trades; and actions of the securities markets, such as the suspension or limitation of trading; (iii) securities determined to be illiquid; and (iv) securities with respect to which an event that will affect the value thereof has occurred (a “significant event”) since the closing prices were established on the principal exchange on which they are traded, but prior to a Fund’s calculation of its net asset value. Specifically, interests in commodity pools or managed futures pools are valued on a daily basis by reference to the closing market prices of each futures contract or other asset held by a pool, as adjusted for pool expenses. Restricted or illiquid securities, such as private investments or non-traded securities are valued via inputs from the Advisor based upon the current bid for the security from two or more independent dealers or other parties reasonably familiar with the facts and circumstances of the security (who should take into consideration all relevant factors as may be appropriate under the circumstances). If the Advisor is unable to obtain a current bid from such independent dealers or other independent parties, the fair value team shall determine the fair value of such security using the following factors: (i) the type of security; (ii) the cost at date of purchase; (iii) the size and nature of the Fund’s holdings; (iv) the discount from market value of unrestricted securities of the same class at the time of purchase and subsequent thereto; (v) information as to any transactions or offers with respect to the security; (vi) the nature and duration of restrictions on disposition of the security and the existence of any registration rights; (vii) how the yield of the security compares to similar securities of companies of similar or equal creditworthiness; (viii) the level of recent trades of similar or comparable securities; (ix) the liquidity characteristics of the security; (x) current market conditions; and (xi) the market value of any securities into which the security is convertible or exchangeable.
The Fund utilizes various methods to measure the fair value of all of its investments on a recurring basis. GAAP establishes a hierarchy that prioritizes inputs to valuation methods. The three levels of input are:
Level 1 – Unadjusted quoted prices in active markets for identical assets and liabilities that the Fund has the ability to access.
Level 2 – Observable inputs other than quoted prices included in Level 1 that are observable for the asset or liability, either directly or indirectly. These inputs may include quoted prices for the identical
Equinox Systematica Macro Fund
NOTES TO CONSOLIDATED FINANCIAL STATEMENTS (Continued)
March 31, 2017
instrument in an inactive market, prices for similar instruments, interest rates, prepayment speeds, credit risk, yield curves, default rates and similar data.
Level 3 – Unobservable inputs for the asset or liability, to the extent relevant observable inputs are not available, representing the Fund’s own assumptions about the assumptions a market participant would use in valuing the asset or liability, and would be based on the best information available.
The availability of observable inputs can vary from security to security and is affected by a wide variety of factors, including, for example, the type of security, whether the security is new and not yet established in the marketplace, the liquidity of markets, and other characteristics particular to the security. To the extent that valuation is based on models or inputs that are less observable or unobservable in the market, the determination of fair value requires more judgment. Accordingly, the degree of judgment exercised in determining fair value is greatest for instruments categorized in Level 3.
The inputs used to measure fair value may fall into different levels of the fair value hierarchy. In such cases, for disclosure purposes, the level in the fair value hierarchy within which the fair value measurement falls in its entirety, is determined based on the lowest level input that is significant to the fair value measurement in its entirety.
The inputs or methodology used for valuing securities are not necessarily an indication of the risk associated with investing in those securities. The following tables summarize the inputs used as of March 31, 2017 for the Fund’s assets and liabilities measured at fair value:
| Liabilities | | Level 1 | | | Level 2 | | | Level 3 | | | Total | |
| Swap Contract | | $ | — | | | $ | 9,983 | | | $ | — | | | $ | 9,983 | |
| Total | | $ | — | | | $ | 9,983 | | | $ | — | | | $ | 9,983 | |
There were no transfers between Level 1 and Level 2 during the period. The Fund did not hold any Level 3 securities during the period.
See Consolidated Portfolio of Investments for more information related to the Fund’s investments.
Consolidation of Subsidiaries – The Consolidated Financial Statements of the Fund include the accounts of Equinox BlueCrest Systematic Macro Fund Limited (“EBCS-CFC”), a wholly-owned and controlled foreign corporation (“CFC”). All inter-company accounts and transactions have been eliminated in consolidation.
The Fund may invest up to 25% of its total assets in a CFC which acts as an investment vehicle in order to effect certain investments consistent with the Fund’s investment objectives and policies.
EBCS-CFC utilizes a total return swap with Morgan Stanley, that provides exposure to the total returns of the Systematic Macro Program of Systematica Investments LP (the “Systematica Program”) to facilitate the Fund’s pursuit of its investment objective. In accordance with its investment objective
Equinox Systematica Macro Fund
NOTES TO CONSOLIDATED FINANCIAL STATEMENTS (Continued)
March 31, 2017
and through its exposure to the aforementioned Systematica Program, the Fund may have increased or decreased exposure to one or more of the risk factors including, with respect to the Systematica Program, swap agreements, defined in the Principal Investment Risks section of the Fund’s prospectus.
A summary of the Fund’s investments in the EBCS-CFC is as follows:
| | | | % Of the Fund’s |
| | Inception Date of | EBCS-CFC Net Assets at | Total Net Assets at |
| | EBCS-CFC | March 31, 2017 | March 31, 2017 |
| EBCS-CFC | 6/18/2014 | $ 799,517 | 21.00% |
For tax purposes, EBCS-CFC is an exempted Cayman Islands investment company. EBCS-CFC has received an undertaking from the Government of the Cayman Islands exempting it from all local income, profits and capital gains taxes. No such taxes are levied in the Cayman Islands at the present time. For U.S. income tax purposes, EBCS-CFC is a CFC and as such is not subject to U.S. income tax. However, as a wholly-owned CFC, EBCS-CFC’s net income and capital gains, to the extent of its earnings and profits, will be included each year in the Fund’s investment company taxable income.
Market Risk – Market risk is the risk that changes in interest rates, foreign exchange rates or equity prices will affect the positions held by the Fund. The Fund is exposed to market risk on financial instruments that are valued at market prices as disclosed in the consolidated portfolio of investments. The prices of derivative instruments, including options, forwards and futures prices, can be highly volatile. Price movements of derivative contracts in which the Fund’s assets may be invested are influenced by, among other things, interest rates, changing supply and demand relationships, trade, fiscal, monetary and exchange control programs and policies of governments, and national and international political and economic events and policies. The Fund is exposed to market risk on derivative contracts in that the Fund may not be able to readily dispose of its holdings when it chooses and also that the price obtained on disposal is below that at which the investment is included in Fund’s consolidated financial statements. All financial instruments are recognized at fair value, and all changes in market conditions directly affect net income. The Fund’s investments in derivative instruments are exposed to market risk and are disclosed in the consolidated portfolio of investments.
Credit Risk – Credit risk relates to the ability of the issuer to meet interest and principal payments, or both, as they come due. In general, lower-grade, higher-yield bonds are subject to credit risk to a greater extent than lower-yield, higher-quality bonds.
Counterparty Risk – Counterparty risk, including swap counterparty risk, is the risk that the counterparty to a financial instrument will cause a financial loss for the Fund by failing to discharge an obligation. A concentration of counterparty risk exists in that part of the Fund’s cash is held at the broker. The Fund could be unable to recover assets held at the broker, including assets directly traceable to the Fund, in the event of the broker’s bankruptcy. The Fund does not anticipate any material losses as a result of this concentration.
Equinox Systematica Macro Fund
NOTES TO CONSOLIDATED FINANCIAL STATEMENTS (Continued)
March 31, 2017
Security Transactions and Related Income – Security transactions are accounted for on trade date basis. Interest income is recognized on an accrual basis. Discounts are accreted and premiums are amortized on securities purchased over the lives of the respective securities. Dividend income is recorded on the ex-dividend date. Realized gains or losses from sales of securities are determined by comparing the identified cost of the security lot sold with the net sales proceeds.
Dividends and Distributions to Shareholders – Dividends from net investment income, if any, are declared and paid at least annually. Distributable net realized capital gains, if any, are declared and distributed annually. Dividends from net investment income and distributions from net realized gains are determined in accordance with federal income tax regulations, which may differ from GAAP. These “book/tax” differences are considered either temporary (i.e., deferred losses, capital loss carry forwards) or permanent in nature. To the extent these differences are permanent in nature, such amounts are reclassified within the composition of net assets based on their federal tax-basis treatment; temporary differences do not require reclassification. Dividends and distributions to shareholders are recorded on ex-dividend date.
Cash and Cash Equivalents – Cash and cash equivalents include cash and overnight investments in interest-bearing demand deposits with a financial institution with original maturities of three months or less. The Fund maintains deposits with a financial institution in an amount that is in excess of federally insured limits.
Federal Income Taxes – The Fund intends to continue to comply with the requirements of the Internal Revenue Code of 1986, as amended, applicable to regulated investment companies and to distribute all of its taxable income to its shareholders. Therefore, no provision for Federal income tax is required. The Fund recognizes the tax benefits of uncertain tax positions only where the position is “more likely than not” to be sustained assuming examination by tax authorities. Management has analyzed the Fund’s tax positions and has concluded that no liability for unrecognized tax benefits should be recorded related to uncertain tax positions taken on returns filed for open tax years ended 2015 and 2016, or expected to be taken in the Fund’s 2017 year-end tax returns. The Fund identifies its major tax jurisdictions as U.S. Federal, Colorado and foreign jurisdictions where the Fund makes significant investments; however the Fund is not aware of any tax positions for which it is reasonably possible that the total amounts of unrecognized tax benefits will change materially in the next twelve months.
Allocation of Expenses – Expenses incurred by the Trust that do not relate to a specific fund of the Trust are allocated to the individual funds based on each fund’s relative net assets or another appropriate basis. Expenses specifically attributable to a particular Fund in the Trust are borne by that Fund. Other expenses are allocated to each Fund based on its net assets in relation to the total net assets of all the applicable Funds in the Trust or another reasonable basis.
Swap Agreements – The Fund is subject to equity price risk, interest rate risk and/or commodity risk in the normal course of pursuing its investment objective. The Fund may enter into various swap transactions for investment purposes or to manage interest rate, equity, foreign exchange (currency),
Equinox Systematica Macro Fund
NOTES TO CONSOLIDATED FINANCIAL STATEMENTS (Continued)
March 31, 2017
or credit risk. Currently, the Fund, through EBCS-CFC, utilizes a total return swap with Morgan Stanley, that provides exposure to the total returns of the Systematica Program. These total return swaps are two-party contracts entered into primarily to exchange the returns (or differentials in rates of returns) earned or realized on particular pre-determined investments or instruments.
The gross returns exchanged or “swapped” between parties are calculated with respect to a notional amount, i.e., the return on or increase in value of a particular dollar amount invested at a particular interest rate, in a particular foreign currency, or in a “basket” of securities representing a particular index or market segment. Changes in the value of swap agreements are recognized as unrealized gains or losses in the Consolidated Statement of Operations by “marking to market” on a daily basis to reflect the value of the swap agreement at the end of each trading day. A liquidation payment received or made at the termination of the swap agreement is recorded as a realized gain or loss on the Consolidated Statement of Operations. The swap settles weekly and these settlements are recorded as realized gains or losses on the trade date. Realized gains and losses from a decrease in the notional value of the swap are recognized on the trade date. Entering into these agreements involves, to varying degrees, lack of liquidity and elements of credit, market, and counterparty risk in excess of amounts recognized on the Consolidated Statement of Assets and Liabilities. The Fund’s maximum risk of loss from counterparty credit risk is the discounted net value of the cash flows to be received from the counterparty over the contract’s remaining life, to the extent that that amount is positive.
EBCS-CFC maintains cash equal to at least 20% of the notional value of the swap, as collateral to secure its obligations under the swap. The cash maintained as collateral is recorded as cash held at broker on the Consolidated Statement of Assets and Liabilities. As of March 31, 2017, the notional value of the swap was $3,634,858. Entering into these agreements involves, to varying degrees, lack of liquidity and elements of credit, market, and counterparty risk in excess of amounts recognized on the Consolidated Statement of Assets and Liabilities. In order to maintain prudent risk exposure to the counterparty, the Advisor will reduce exposure to the counterparty whenever that exposure exceeds 5% of the net assets of the Fund for a period of one week or such lesser time as the Advisor may determine. If the Advisor determines that the counterparty presents an imprudent risk, the swap may be terminated in its entirety. For the year ended March 31, 2017, the net change in unrealized depreciation on the swap contract was $730,890. For the year ended March 31, 2017, the Fund had a net realized loss of $6,267,585 from the swap contract.
Impact of Derivatives on the Consolidated Statement of Assets and Liabilities and Consolidated Statement of Operations
The following is a summary of the location of derivative investments on the Fund’s Consolidated Statement of Assets and Liabilities as of March 31, 2017:
| Location on the Consolidated Statement of Assets and Liabilities |
| Derivatives Investment Type | Asset Derivatives |
| Equity/Currency/ Interest Rate Contracts | Unrealized depreciation on swap contract |
Equinox Systematica Macro Fund
NOTES TO CONSOLIDATED FINANCIAL STATEMENTS (Continued)
March 31, 2017
Fair Values of Derivative Instruments as of March 31, 2017:
| | | Liability Derivatives | |
| Contract Type/ | | | | | |
| Primary Risk Exposure | | Balance Sheet Location | | Fair Value | |
| Mixed; interest rate, equity and foreign exchange contracts: | | Unrealized depreciation on swap contract | | | | |
| | | Net Assets - Net Unrealized Depreciation on swap contract | | $ | 9,983 | |
| Total | | | | $ | 9,983 | |
The effect of Derivative Instruments on the Consolidated Statement of Operations for the year ended March 31, 2017:
| | | | | | | | Change in | |
| | | | | | | | Unrealized | |
| Contract Type/ | | Location of Loss On | | Realized Loss | | | Depreciation | |
| Primary Risk Exposure | | Derivatives | | Derivatives | | | on Derivatives | |
| | | | | | | | | |
| Mixed; interest rate, equity and foreign exchange contracts: | | Net realized loss on swap contract | | $ | (6,267,585 | ) | | | | |
| | | Net change in unrealized depreciation on swap contract | | | | | | $ | (730,890 | ) |
| | | | | | | | | | | |
| Total | | | | $ | (6,267,585 | ) | | $ | (730,890 | ) |
The notional value of the derivative instruments outstanding as of March 31, 2017 as disclosed in the Consolidated Portfolio of Investments and the amounts of realized gains and losses and changes in unrealized depreciation on derivative instruments during the period as disclosed above and within the Consolidated Statement of Operations serve as indicators of the volume of derivative activity for the Fund.
Offsetting of Financial Assets and Derivative Assets
It is the Fund’s policy to recognize a net asset or liability equal to the unrealized appreciation/ (depreciation) of swap contracts. During the year ended March 31, 2017, the Fund is subject to a master netting arrangement for the swaps. The following table shows additional information regarding the offsetting of assets and liabilities at March 31, 2017.
Equinox Systematica Macro Fund
NOTES TO CONSOLIDATED FINANCIAL STATEMENTS (Continued)
March 31, 2017
| Liabilities: | | | | | | | | | | | Gross Amounts Not Offset in the
Consolidated Statement of Assets &
Liabilities | | | | |
| Description | | Gross Amounts
of Recognized
Liabilities | | | Gross Amounts
Offset in the
Consolidated
Statement of
Assets & Liabilities | | | Net Amounts of
Liabilities Presented
in the Consolidated
Statement of Assets
& Liabilities | | | Financial
Instruments (2) | | | Cash Collateral
Pledged | | | Net Amount | |
| Unrealized Depreciation on Swap Contract | | $ | 9,983 | (1) | | $ | — | | | $ | 9,983 | | | $ | — | | | $ | 9,983 | (3) | | $ | — | |
| Total | | $ | 9,983 | | | $ | — | | | $ | 9,983 | | | $ | — | | | $ | 9,983 | | | $ | — | |
| (1) | Unrealized depreciation as presented in the Consolidated Portfolio of Investments. |
| (2) | Amounts relate to master netting agreements and collateral agreements (for example, ISDA) which have been determined by the Fund to be legally enforceable in the event of default and where certain other criteria are met in accordance with applicable offsetting accounting guidance. |
| (3) | The table above does not include additional cash collateral pledged to the counterparty. Cash pledged to broker as collateral as of March 31, 2017 was $809,500. |
The Fund may mitigate credit risk with respect to OTC derivative counterparties through credit support annexes included with International Swaps and Derivatives Association, Inc. (“ISDA”) Master Agreements or other master netting agreements which are the standard contracts governing most derivative transactions between the Fund and its counterparties. These agreements may allow the Fund and a counterparty to offset certain derivative instruments’ payables and/or receivables against each other and/or with collateral, which is generally held by the Fund’s custodian. To the extent amounts due to the Fund from a counterparty are not fully collateralized contractually or otherwise, the Fund bears the risk of loss from counterparty non-performance.
Indemnification – The Trust indemnifies its officers and trustees for certain liabilities that may arise from the performance of their duties to the Trust. Additionally, in the normal course of business, the Fund enters into contracts that contain a variety of representations and warranties and which provide general indemnities. The Fund’s maximum exposure under these arrangements is unknown, as this would involve future claims that may be made against the Fund that have not yet occurred. However, based on experience, the risk of loss due to these warranties and indemnities appears to be remote.
| 3. | INVESTMENT TRANSACTIONS |
For the year ended March 31, 2017, there were no purchases or sales of portfolio securities, other than short-term investments and U.S. government securities.
Equinox Systematica Macro Fund
NOTES TO CONSOLIDATED FINANCIAL STATEMENTS (Continued)
March 31, 2017
| 4. | INVESTMENT ADVISORY AGREEMENT AND TRANSACTIONS WITH RELATED PARTIES |
Equinox Institutional Asset Management, LP (“EIAM”) serves as the investment adviser for the Fund. Pursuant to an Investment Advisory Agreement with the Trust on behalf of the Fund, the Advisor, under the oversight of the Board, directs the daily operations of the Fund and supervises the performance of administrative and professional services provided by others. As compensation for its services and the related expenses borne by the Advisor, the Fund pays the Advisor a management fee, computed and accrued daily and paid monthly, at an annual rate of 0.64% of the Fund’s average daily net assets. For the year ended March 31, 2017, the Fund incurred advisory fees of $232,218.
The Advisor has contractually agreed to reduce its advisory fee and/or reimburse certain expenses of the Fund, to ensure that the Fund’s total annual operating expenses, excluding (i) taxes, (ii) interest, (iii) extraordinary items, (iv) “Acquired Fund Fees and Expenses,” (v) any expenses of the subsidiary including trading company expenses, (vi) any class specific fees and expenses, and (vii) brokerage commissions, do not exceed, on an annual basis, 0.79% of the Fund’s average daily net assets. The Advisor has contractually agreed to reduce its fees and/or reimburse expenses of the Fund until at least July 31, 2017. This agreement may be terminated only by the Fund’s Board of Trustees on 60 days’ written notice to the Advisor. The Advisor shall be entitled to recover, subject to approval by the Board of Trustees of the Trust, such waived or reimbursed amounts for a period of up to three (3) years from the year in which the Adviser reduced its compensation and/or assumed expenses for the Fund. The Advisor is permitted to seek reimbursement from the Fund, subject to certain limitations, for fees it waived and Fund expenses it paid to the extent the total annual fund operating expenses do not exceed the limits described above or any lesser limits in effect at the time of reimbursement. No recoupment by the Advisor will occur unless the Fund’s operating expenses are below the expense limitation amount. The Advisor may seek reimbursement only for expenses waived or paid by it during the three fiscal years prior to such reimbursement; provided, however, that such expenses may only be reimbursed to the extent they were waived or paid after the date of the Expense Limitation Agreement (or any similar agreement). The Advisor is permitted to seek reimbursement from the Fund, subject to contract limitations, for fees it waived and expenses it paid to the extent the total annual fund operating expenses do not exceed the limits described above or any lesser limits in effect at the time of reimbursement. The Board may terminate this expense reimbursement arrangement at any time.
Pursuant to the Expense Limitation Agreement, the following amounts are subject to recapture by the Fund by the following dates:
| 3/31/2018 | | $119,792 |
| 3/31/2019 | | $94,441 |
| 3/31/2020 | | $174,199 |
The Distributor of the Fund is Northern Lights Distributors, LLC (the “Distributor”). The Trust, on behalf of the Fund, has adopted the Trust’s Distribution and Shareholder Servicing Plan pursuant to Rule 12b-1 under the Investment Company Act of 1940, as amended (the “Plan”), to pay for certain distribution activities and shareholder services. During the year ended March 31, 2017, the Fund did
Equinox Systematica Macro Fund
NOTES TO CONSOLIDATED FINANCIAL STATEMENTS (Continued)
March 31, 2017
not pay distribution related charges pursuant to the Plan.
In addition, certain affiliates of the Distributor provide services to the Fund as follows:
Gemini Fund Services, LLC (“GFS”), an affiliate of the Distributor, provides administration, fund accounting, and transfer agent services to the Trust. Pursuant to separate servicing agreements with GFS, the Fund pays GFS customary fees for providing administration, fund accounting and transfer agency services to the Fund.
Northern Lights Compliance Services, LLC (“NLCS”), an affiliate of GFS and the Distributor, provides a Chief Compliance Officer to the Trust, as well as related compliance services, pursuant to a consulting agreement between NLCS and the Trust. Under the terms of such agreement, NLCS receives customary fees from the Fund.
BluGiant, LLC (“BluGiant”), an affiliate of GFS and the Distributor, provides EDGAR conversion and filing services as well as print management services for the Fund on an ad-hoc basis. For the provision of these services, BluGiant receives customary fees from the Fund.
| 5. | DISTRIBUTIONS TO SHAREHOLDERS AND TAX COMPONENTS OF CAPITAL |
The tax character of Fund distributions paid for the years ended March 31, 2017 and March 31, 2016 was as follows:
| | | Fiscal Year Ended
March 31, 2017 | | | Fiscal Year Ended
March 31, 2016 | |
| Ordinary Income | | $ | 3,460,115 | | | $ | 4,764,798 | |
| Long-Term Capital Gain | | | — | | | | — | |
| Return of Capital | | | — | | | | — | |
| | | $ | 3,460,115 | | | $ | 4,764,798 | |
As of March 31, 2017, the components of accumulated earnings/(deficit) on a tax basis were as follows:
| Undistributed | | | Undistributed | | | Post October Loss | | | Capital Loss | | | Other | | | Unrealized | | | Total | |
| Ordinary | | | Long-Term | | | and | | | Carry | | | Book/Tax | | | Appreciation/ | | | Accumulated | |
| Income | | | Gains | | | Late Year Loss | | | Forwards | | | Differences | | | (Depreciation) | | | Earnings/( Deficits) | |
| $ | — | | | $ | — | | | $ | (24,729 | ) | | $ | — | | | $ | (6,998,475 | ) | | $ | — | | | $ | (7,023,204 | ) |
The difference between book basis and tax basis accumulated net investment losses, accumulated net realized gains, and unrealized appreciation (depreciation) from investments is primarily attributable to the tax adjustments relating to the Fund’s holding in Equinox BlueCrest CFC.
Late year losses incurred after December 31 within the fiscal year are deemed to arise on the first business day of the following fiscal year for tax purposes. The Fund incurred and elected to defer such late year losses of $24,729.
Equinox Systematica Macro Fund
NOTES TO CONSOLIDATED FINANCIAL STATEMENTS (Continued)
March 31, 2017
Permanent book and tax differences, primarily attributable to the book/tax basis treatment of net operating losses and short-term capital gains, and the reclassification of Fund distributions, resulted in reclassifications for the Fund for the fiscal year ended March 31, 2017 as follows:
| Paid | | | Undistributed | | | Accumulated | |
| In | | | Net Investment | | | Net Realized | |
| Capital | | | Income | | | Loss | |
| $ | (132,705 | ) | | $ | 140,313 | | | $ | (7,608 | ) |
| 6. | NEW ACCOUNTING PRONOUNCEMENT |
On October 13, 2016 the Securities and Exchange Commission amended existing rules intended to modernize reporting and disclosure of information. These amendments relate to Regulation S-X which sets forth the form and content of financial statements. At this time, management is evaluating the implications of adopting these amendments and their impact on the financial statements and accompanying notes.
Subsequent events after the date of the Consolidated Statement of Assets and Liabilities have been evaluated through the date the consolidated financial statements were issued. Management has concluded that there is no impact requiring adjustment or disclosure in the financial statements.
Report of Independent Registered Public Accounting Firm
To the Board of Trustees of Equinox Funds Trust
and the Shareholders of Equinox Systematica Macro Fund
We have audited the accompanying consolidated statement of assets and liabilities, including the consolidated portfolio of investments, of Equinox Systematica Macro Fund (the Fund), a series of Equinox Funds Trust, as of March 31, 2017, and the related consolidated statement of operations for the year then ended, the consolidated statements of changes in net assets for each of the two years in the period then ended, and the financial highlights for each of the two years in the period then ended and for the period from June 17, 2014 (commencement of operations) through March 31, 2015. These financial statements and financial highlights are the responsibility of the Fund’s management. Our responsibility is to express an opinion on these financial statements and financial highlights based on our audits.
We conducted our audits in accordance with the standards of the Public Company Accounting Oversight Board (United States). Those standards require that we plan and perform the audit to obtain reasonable assurance about whether the financial statements and financial highlights are free from material misstatement. The Fund is not required to have, nor were we engaged to perform, an audit of its internal control over financial reporting. Our audits included consideration of internal control over financial reporting as a basis for designing audit procedures that are appropriate in the circumstances, but not for the purpose of expressing an opinion on the effectiveness of the Fund’s internal control over financial reporting. Accordingly, we express no such opinion. An audit also includes examining, on a test basis, evidence supporting the amounts and disclosures in the financial statements. Our procedures included confirmation of investments owned as of March 31, 2017, by correspondence with the custodian and broker. An audit also includes assessing the accounting principles used and significant estimates made by management, as well as evaluating the overall financial statement presentation. We believe that our audits provide a reasonable basis for our opinion.
In our opinion, the consolidated financial statements and financial highlights referred to above present fairly, in all material respects, the financial position of Equinox Systematica Macro Fund as of March 31, 2017, and the results of their operations for the year then ended, the changes in their net assets for each of the two years in the period then ended, and the financial highlights for each of the two years in the period then ended and for the period from June 17, 2014 (commencement of operations) through March 31, 2015 in conformity with accounting principles generally accepted in the United States of America.
/s/ RSM US LLP
Denver, Colorado
May 30, 2017
Equinox Systematica Macro Fund
EXPENSE EXAMPLES (Unaudited)
March 31, 2017
As a shareholder of the Fund, you incur ongoing costs, including management fees and other Fund expenses. This example is intended to help you understand your ongoing costs (in dollars) of investing in the Fund and to compare these costs with the ongoing costs of investing in other mutual funds.
The example is based on an investment of $1,000 invested at the beginning of the period and held for the entire period from October 1, 2016 through March 31, 2017.
Actual Expenses
The “Actual” expenses line in the table below provides information about actual account values and actual expenses. You may use the information below, together with the amount you invested, to estimate the expenses that you paid over the period. Simply divide your account value by $1,000 (for example, an $8,600 account value divided by $1,000 = 8.6), then multiply the result by the number in the table under the heading entitled “Expenses Paid During Period” to estimate the expenses you paid on your account during this period.
Hypothetical Example for Comparison Purposes
The “Hypothetical” line in the table below provides information about hypothetical account values and hypothetical expenses based on the Fund’s actual expense ratio and an assumed rate of return of 5% per year before expenses, which is not the Fund’s actual return. The hypothetical account values and expenses may not be used to estimate the actual ending account balances or expenses you paid for the period. You may use this information to compare this 5% hypothetical example with the 5% hypothetical examples that appear in the shareholder reports of other funds.
Please note that the expenses shown in the table are meant to highlight your ongoing costs only and do not reflect any transactional costs, such as sales charges (loads), or redemption fees. Therefore, the table is useful in comparing ongoing costs only, and will not help you determine the relative total costs of owning different funds. In addition, if these transactional costs were included, your costs would have been higher.
| | | Ending | | |
| | Beginning | Account | Expenses Paid | Annualized |
| | Account Value | Value | During Period* | Expense |
| Actual | 10-1-16 | 3-31-17 | 10-1-16 to 3-31-17 | Ratio |
| Class I | $ 1,000.00 | $ 956.90 | $ 3.85 | 0.79% |
| | | | | |
| | | Ending | | |
| Hypothetical | Beginning | Account | Expenses Paid | Annualized |
| (5% return before expenses) | Account Value | Value | During Period* | Expense |
| | 10-1-16 | 3-31-17 | 10-1-16 to 3-31-17 | Ratio |
| Class I | $ 1,000.00 | $ 1,020.99 | $ 3.98 | 0.79% |
| * | Expenses are equal to the average account value over the period, multiplied by the Fund’s annualized expense ratio, multiplied by the number of days in the period (182) divided by the number of days in the fiscal year (365). |
Equinox Systematica Macro Fund
SUPPLEMENTAL INFORMATION (Unaudited)
March 31, 2017
Approval of Investment Advisory Agreement
Approval of Continuation of Investment Advisory Agreement between Equinox
Institutional Asset Management and Equinox Funds Trust on behalf of Systematica Macro Fund.
At a meeting held on November 17, 2016 (the “Meeting”), the Board of Trustees (the “Board” or the “Trustees”) of Equinox Funds Trust (the “Trust”), including a majority of the Trustees who are not “interested persons” within the meaning of Section 2(a)(19) of the Investment Company Act of 1940, as amended (the “1940 Act”) (the “Independent Trustees”), unanimously approved the continuation of the advisory agreement between Equinox Institutional Asset Management (“EIAM” or the “Advisor”) and the Trust (the “Agreement”) on behalf of Systematica Macro Fund (the “Fund”). At the Meeting, the Board considered the continuation of the Agreement with respect to the Fund for an additional one year period.
In determining whether to approve the Agreement, the Trustees considered information provided by the Advisor in accordance with Section 15(c) of the 1940 Act regarding: (i) services performed for the Fund, (ii) the size and qualifications of the portfolio management staff, (iii) any potential or actual material conflicts of interest which may arise in connection with EIAM’s management of the Fund, (iv) investment performance, (v) the capitalization and financial condition of EIAM, (vi) a comparison of the advisory fee charged by EIAM to the Fund and the expense ratio of the Fund to the advisory fees and expense ratios of comparable funds, (vii) brokerage selection procedures (including soft dollar arrangements, if any), (viii) the procedures for allocating investment opportunities between the Fund and other clients, (ix) results of any regulatory examination, including any recommendations or deficiencies noted, (x) any litigation, investigation or administrative proceeding which may have a material impact on EIAM’s ability to service the Fund, (xi) EIAM’s internal program for ensuring compliance with the Fund’s investment objectives, policies and practices (including codes of ethics), federal securities laws and other regulatory requirements, (xii) EIAM’s proxy voting policies, and (xii) details regarding, and quantification of, any fee sharing arrangements with respect to the distribution of shares of the Fund. The Trustees also considered information provided by EIAM regarding the advisory fees and an analysis of these fees in relation to the delivery of services to the Fund, the costs of providing such services and the profitability of the firm in general and as a result of the fees received from the Fund. The Trustees noted the reports provided to the Board and discussions with representatives of the Advisor at the Board meetings throughout the year covering matters such as the relative performance of the Fund; compliance with the investment objectives, policies, strategies and limitations for the Fund; the compliance of management personnel with the applicable code of ethics; and the adherence to the Trust’s pricing procedures as established by the Board. The Trustees noted their receipt of the memorandum from legal counsel regarding the legal standard applicable to their review of the Agreement.
Equinox Systematica Macro Fund
SUPPLEMENTAL INFORMATION (Unaudited)(Continued)
March 31, 2017
In addition to the information provided by EIAM as described above, the Trustees also considered all other factors they believed to be relevant to evaluating the Agreement with respect to the Fund. In their deliberations, the Trustees did not identify any particular information that was controlling, and different Trustees may have attributed different weights to the various factors. However, the Trustees determined that the overall arrangements between the Fund and EIAM, including the advisory fees, are fair and reasonable in light of the services performed, expenses incurred and such other matters as the Trustees considered relevant. The Trustees considered that the advisory fees paid by the Fund, taking into account any applicable fee limitations, represent reasonable compensation to EIAM in light of the services provided, the costs to EIAM of providing those services, economies of scale, and the fees and other expenses paid by similar funds and such other matters that the Board considered relevant in the exercise of their reasonable judgment.
The Trustees’ evaluation of the services provided by EIAM took into account the Trustees’ knowledge and familiarity gained as Board members, including the scope and quality of EIAM’s investment management capabilities in selecting managed futures programs, allocating assets across various managed futures programs, and managing certain types of assets in-house (e.g., fixed income securities and derivatives), and its compliance responsibilities. The Trustees considered EIAM’s personnel and the depth of EIAM’s personnel who possess the experience to provide investment management services to the Fund. Based on the information provided by EIAM, the Trustees concluded that (i) the nature, extent and quality of the services provided by EIAM are appropriate and consistent with the terms of the Agreement including the advisory fee, (ii) the Fund is likely to benefit from the continued receipt of EIAM’s services under the Agreement, and (iii) EIAM has sufficient personnel, with the appropriate education and experience, to serve the Fund effectively and has demonstrated its continuing ability to attract and retain qualified personnel.
The Board considered the overall investment performance of EIAM and the Fund. The Trustees reviewed performance information for the Fund for the one year period ended September 30, 2016, including a comparison to the Barclays BTOP50 Index (“Index”). The Trustees also reviewed comparable performance information for the one year period ended September 30, 2016 of three other investment companies, managed by other investment advisers and employing a managed futures strategy that were identified by EIAM as comparable to the Fund (“Peer Funds”). The Trustees also reviewed the EIAM’s commentary regarding the performance data and the various factors contributing to the Fund’s shorter-term performance, noting that longer-term performance was not available. The Trustees noted that the Fund outperformed the Index for the year ended September 30, 2016. The Trustees further noted that the Fund outperformed two of the Peer Funds and underperformed one of the Peer Funds for the year ended September 30, 2016.
Equinox Systematica Macro Fund
SUPPLEMENTAL INFORMATION (Unaudited)(Continued)
March 31, 2017
The Trustees considered explanations provided by EIAM regarding the various factors contributing to the Fund’s relative performance, including, among other things, differences in the Fund’s investment strategy, volatility targets and portfolio construction in comparison to the Peer Funds. The Board discussed with EIAM the reasons behind the Fund’s results and, in the case of the Fund’s underperformance of a single Peer Fund or Index for the one year period ended September 30, 2016, the Trustees considered other factors that supported the continuation of the Agreement, including the following: (i) that EIAM’s investment decisions, such as security selection and sector allocation, attributing to such underperformance were reasonable and consistent with the Fund’s investment objective and policies; and (ii) that the Fund had a limited history of investment performance. Taking note of EIAM’s discussion of (i) the various factors contributing to the Fund’s performance and (ii) its continuing commitment to the Fund’s current investment strategy, respectively, the Independent Trustees concluded that the recent investment performance of the Fund was satisfactory.
The Trustees considered the advisory fees paid to EIAM, the total expenses of the Funds, and EIAM’s commitment to continue to waive its advisory fees and/or reimburse Fund expenses in order to maintain a cap on Fund operating expenses. The Trustees considered the rate of the investment advisory fee and other expenses paid by the Fund under the Agreement as compared to those of representative comparable funds managed by EIAM and other investment advisers. The Trustees also discussed the limitations of the comparative expense information of the Fund, given the potential varying nature, extent and quality of the services provided by the advisers of the Peer Funds. The Trustees noted that the investment advisory fee for the Fund was lower than the range of contractual advisory fees for the Peer Funds, as indicated in materials prepared for the Board by EIAM, based on information contained in various publicly available documents. The Trustees noted that EIAM waived a portion of its advisory fee with respect to the Fund in order to maintain a cap on Fund operating expenses. The Trustees concluded that the advisory fees and services provided by EIAM are consistent with those of other advisers which manage mutual funds with investment objectives, strategies and policies similar to those of the Fund based on the information provided at the Meeting. The Trustees concluded that the estimated investment advisory fees to be paid by the Fund to EIAM were fair and reasonable.
The Trustees also considered (i) the costs of the services provided by EIAM, (ii) the compensation and benefits received by EIAM in providing services to the Fund, and (iii) its profitability. The Trustees noted that the level of profitability of EIAM is an appropriate factor to consider in providing service to the Fund, and the Trustees should be satisfied that EIAM’s profits are sufficient to continue as healthy, ongoing concerns generally, and as investment adviser of the Fund, specifically. Based on the information provided, the Trustees concluded that EIAM’s estimated fees and profits (if any) expected to be derived from its relationship with the Trust in light of the Fund’s expenses, are reasonable in relation to the nature and quality of the services to be provided, taking into account the fees charged by other advisers for managing comparable mutual funds with similar strategies. In so concluding, the Trustees noted that EIAM has contractually agreed to waive the fee it receives from the Fund in an amount equal to the management fee paid to EIAM by the Fund’s wholly-owned subsidiary. The Trustees also concluded that the overall expense ratio of the Fund is reasonable, taking into account the projected growth and size of the Fund, the quality of services to be provided by EIAM and the expense limitations agreed to by EIAM.
Equinox Systematica Macro Fund
SUPPLEMENTAL INFORMATION (Unaudited)(Continued)
March 31, 2017
The Trustees considered the extent to which economies of scale would be realized relative to fee levels as the Fund grows, and whether the advisory fee levels reflect these economies of scale for the benefit of shareholders. The Board determined that economies of scale may be achieved at higher asset levels for the Fund for the benefit of Fund shareholders.
The Trustees determined to approve the continuation of the Agreement for an additional one year period. In approving the continuation of the Agreement, the Board considered all factors it deemed relevant and the information presented to the Board by EIAM. In arriving at its decision, the Board did not identify any single factor as being of paramount importance and each member of the Board gave varying weights to each factor according to his own judgment. The Board determined that the continuation of the Agreement would be in the best interests of the Fund and its shareholders.
Equinox Systematica Macro Fund
SUPPLEMENTAL INFORMATION (Unaudited)(Continued)
March 31, 2017
The following tables present certain information regarding the Board of Trustees and officers of the Trust. Each person listed under “Interested Trustees” below is an “interested person” of the Trust, the Advisor, or Distributor, within the meaning of the 1940 Act. Each person who is not an “interested person” of the Trust, the Advisor or the Distributor within the meaning of the 1940 Act is referred to as an “Independent Trustee” and is listed under such heading below. Unless otherwise noted, the address of each Trustee and Officer is 17605 Wright Street, Suite 2, Omaha, NE 68130.
The Statement of Additional Information for the Fund contains additional information about the Trustees and is available without charge, upon request, by calling 1-888-643-3431.
Independent Trustees
Name and Year of
Birth | Position(s)
Held/Term
of Office* | Principal Occupation
During the Last Five Years | Number of
Portfolios in Fund
Complex**
Overseen by
Trustee | Other Directorships*** held by
Trustee During Last Five Years |
David P. Demuth
9/1945 | Trustee
Since
December
2010 | Consultant, CFO Consulting Partners, LLC (since May 2004). | 8 | None |
Kevin R. Green
7/1954 | Trustee
Since
December
2010 | CEO of TripleTree Holdings, LLC an Investment Bank, Advisory and Principal Investing business (since 1997). | 8 | Director of BlueCross BlueShield of Minnesota (healthcare services). |
Jay Moorin
7/1951 | Trustee
Since
December
2010 | Managing Partner, ProQuest Management, LLC from September (since 1998). | 8 | None |
Interested Trustee
Name and Year of
Birth | Position(s)
Held/Term
of Office* | Principal Occupation
During the Past Five Years | Number of
Portfolios in Fund
Complex**
Overseen by
Trustee | Other Directorships*** held by
Trustee During Last Five Years |
Robert J. Enck
9/1962 | Chairman,
Trustee,
President
and
Principal
Executive
Officer
Since
December
2010 | President and Chief Executive Officer, Equinox Institutional Asset Management, LP (since 2015); President and Chief Executive Officer, Equinox Fund Management, LLC (since 2007). | 8 | Executive Committee Member of The Frontier Fund (commodity pool). |
Equinox Systematica Macro Fund
SUPPLEMENTAL INFORMATION (Unaudited)(Continued)
March 31, 2017
Executive Officers
Name and Year of
Birth | Position(s)
Held/Term
of Office* | Principal Occupation
During the Past Five Years | Number of
Portfolios in Fund
Complex**
Overseen by
Trustee | Other Directorships*** held by
Trustee During Past Five
Years |
Laura Latella
4/1958 | Treasurer,
Principal
Financial
Officer and
Secretary
Since
November
1, 2016 | Chief Administrative Officer, Equinox Institutional Asset Management, LP (since May 2016); Consultant, Equinox Institutional Asset Management, LP (January 2016 – April 2016); Treasurer, CFO, Principal, 6800 Capital, LLC (May 1994 – January 2016). | N/A | N/A |
Laura Szalyga
3/1978 | Assistant
Treasurer
since
August 2014 | Vice President (since 2015) and Assistant Vice President (2011 to 2015) of Fund Administration, Gemini Fund Services, LLC; Assistant Vice President of Fund Administration, BNY Mellon (2004-2011). | N/A | N/A |
Emile R.
Molineaux
9/1962 | Chief
Compliance
Officer and
Anti-
Money
Laundering
Officer
Since
December
2010 | General Counsel, CCO and Senior Vice President, Gemini Fund Services, LLC (2003-2011); CCO of Various clients of Northern Lights Compliance Services, LLC, (Secretary 2003-2011 and Senior Compliance Officer since 2011) | N/A | N/A |
| * | Each Trustee and Officer shall serve until death, resignation or removal. |
| ** | The term “Fund Complex” refers to the Equinox Funds Trust. |
| *** | Directorships are held in a company with a class of securities registered pursuant to section 12 of the Securities Exchange Act or subject to the requirements of section 15(d) of the Securities Exchange Act or a company registered as an investment company under the 1940 Act. |
PRIVACY NOTICE
Rev. August 2011
| FACTS | WHAT DOES EQUINOX FUNDS TRUST DO WITH YOUR PERSONAL INFORMATION? |
| | |
| Why? | Financial companies choose how they share your personal information. Federal law gives consumers the right to limit some but not all sharing. Federal law also requires us to tell you how we collect, share, and protect your personal information. Please read this notice carefully to understand what we do. |
| | |
| What? | The types of personal information we collect and share depend on the product or service you have with us. This information can include: |
| | ■ Social Security number ■ Assets ■ Retirement Assets ■ Transaction History ■ Checking Account Information | ■ Purchase History ■ Account Balances ■ Account Transactions ■ Wire Transfer Instructions |
| | |
| | When you are no longer our customer, we continue to share your information as described in this notice. |
| | |
| How? | All financial companies need to share customers’ personal information to run their everyday business. In the section below, we list the reasons financial companies can share their customers’ personal information; the reasons Equinox Funds Trust chooses to share; and whether you can limit this sharing. |
| Reasons we can share your personal information | Does Equinox
Funds Trust
share? | Can you limit this sharing? |
For our everyday business purposes – such as to process your transactions, maintain your account(s), respond to court orders and legal investigations, or report to credit bureaus | Yes | No |
For our marketing purposes – to offer our products and services to you | No | We don’t share |
| For joint marketing with other financial companies | No | We don’t share |
For our affiliates’ everyday business purposes – information about your transactions and experiences | No | We don’t share |
For our affiliates’ everyday business purposes – information about your creditworthiness | No | We don’t share |
| For nonaffiliates to market to you | No | We don’t share |
| Questions? | Call 1-888-643-3431 |
Rev. August 2011
| Who we are |
| Who is providing this notice? | Equinox Funds Trust |
| What we do |
| How does Equinox Funds Trust protect my personal information? | To protect your personal information from unauthorized access and use, we use security measures that comply with federal law. These measures include computer safeguards and secured files and buildings. Our service providers are held accountable for adhering to strict policies and procedures to prevent any misuse of your nonpublic personal information. |
| How does Equinox Funds Trust collect my personal information? | We collect your personal information, for example, when you ■ Open an account ■ Provide account information ■ Give us your contact information ■ Make deposits or withdrawals from your account ■ Make a wire transfer ■ Tell us where to send the money ■ Tells us who receives the money ■ Show your government-issued ID ■ Show your driver’s license We also collect your personal information from other companies. |
| Why can’t I limit all sharing? | Federal law gives you the right to limit only ■ Sharing for affiliates’ everyday business purposes – information about your creditworthiness ■ Affiliates from using your information to market to you ■ Sharing for nonaffiliates to market to you State laws and individual companies may give you additional rights to limit sharing. |
| Definitions |
| Affiliates | Companies related by common ownership or control. They can be financial and nonfinancial companies. ■ Equinox Funds Trust does not share with our affiliates. |
| Nonaffiliates | Companies not related by common ownership or control. They can be financial and nonfinancial companies ■ Equinox Funds Trust does not share with nonaffiliates so they can market to you. |
| Joint marketing | A formal agreement between nonaffiliated financial companies that together market financial products or services to you. ■ Equinox Funds Trust doesn’t jointly market. |
This Page Intentionally Left Blank
This Page Intentionally Left Blank
PROXY VOTING POLICY
Information regarding how the Funds voted proxies relating to portfolio securities for the most recent period ended June 30 as well as a description of the policies and procedures that the Funds use to determine how to vote proxies is available without charge, upon request, by calling 1-888-643-3431 or by referring to the Securities and Exchange Commission’s (“SEC”) website at http://www.sec.gov.
PORTFOLIO HOLDINGS
The Funds file their complete schedules of portfolio holdings with the SEC for the first and third quarters of each fiscal year on Form N-Q. Form N-Q is available on the SEC’s website at http://www.sec.gov and may be reviewed and copied at the SEC’s Public Reference Room in Washington, DC (1-800-SEC-0330). The information on Form N-Q is available without charge, upon request, by calling 1-888-643-3431.
| |
| |
| INVESTMENT ADVISOR |
| Equinox Institutional Asset Management, LP |
| 47 Hulfish Street, Suite 510 |
| Princeton, NJ 08542 |
| |
| ADMINISTRATOR |
| Gemini Fund Services, LLC |
| 80 Arkay Drive, Suite 110 |
| Hauppauge, New York 11788 |
| Item 2. | Code of Ethics. (a) As of the end of the period covered by this report, the registrant has adopted a code of ethics that applies to the registrant's Principal executive officer, Principal financial officer, Principal accounting officer or controller, or persons performing similar functions, regardless of whether these individuals are employed by the registrant or a third party. |
(b) For purposes of this item, “code of ethics” means written standards that are reasonably designed to deter wrongdoing and to promote:
| (1) | Honest and ethical conduct, including the ethical handling of actual or apparent conflicts of interest between personal and professional relationships; |
| (2) | Full, fair, accurate, timely, and understandable disclosure in reports and documents that a registrant files with, or submits to, the Commission and in other public communications made by the registrant; |
(3) Compliance with applicable governmental laws, rules, and regulations;
| (4) | The prompt internal reporting of violations of the code to an appropriate person or persons identified in the code; and |
(5) Accountability for adherence to the code.
(c) Amendments: During the period covered by the report, there have not been any amendments to the provisions of the code of ethics.
(d) Waivers: During the period covered by the report, the registrant has not granted any express or implicit waivers from the provisions of the code of ethics.
(e) The Code of Ethics is not posted on Registrant’ website.
(f) A copy of the Code of Ethics is attached as an exhibit.
| Item 3. | Audit Committee Financial Expert. (a)(1)ii The board of directors of the fund has determined that the fund does not have an audit committee financial expert serving on its audit committee. |
(a)(2) Not applicable.
(a)(3) In this regard, no member of the audit committee was identified as having all of the required technical attributes identified in instruction 2 (b) to item 3 of Form N-CSR to qualify as an “audit committee financial expert,” whether through the type of specialized education or experience required by that instruction. At this time, the board believes the experience provided by each member of the audit committee collectively offers the fund adequate oversight by its audit committee given the fund’s level of financial complexity. The board will from time to time reexamine such belief.
Item 4. Principal Accountant Fees and Services.
2017 - $26,000
2016 - $30,000
2015 - $30,000
2017 - None
2016 - None
2015 - None
2017 - $8,250
2016 - $8,000
2015 - $8,000
Preparation of Federal & State income tax returns, assistance with calculation of required income, capital gain and excise distributions and preparation of Federal excise tax returns.
2017 - None
2016 - None
2015 - None
| (e) | (1) Audit Committee’s Pre-Approval Policies |
The registrant’s Audit Committee is required to pre-approve all audit services and, when appropriate, any non-audit services (including audit-related, tax and all other services) to the registrant. The registrant’s Audit Committee also is required to pre-approve, when appropriate, any non-audit services (including audit-related, tax and all other services) to its adviser, or any entity controlling, controlled by or under common control with the adviser that provides ongoing services to the registrant, to the extent that the services may be determined to have an impact on the operations or financial reporting of the registrant. Services are reviewed on an engagement by engagement basis by the Audit Committee.
| (2) | There were no services described in each of paragraphs (b) through (d) of this Item that were approved by the audit committee pursuant to paragraph (c)(7)(i)(C) of Rule 2-01 of Regulation S-X. |
| (f) | During the audit of registrant's financial statements for the most recent fiscal year, less than 50 percent of the hours expended on the Principal accountant's engagement were attributed to work performed by persons other than the Principal accountant's full-time, permanent employees. |
| (g) | The aggregate non-audit fees billed by the registrant's accountant for services rendered to the registrant, and rendered to the registrant's investment adviser (not including any sub-adviser whose role is primarily portfolio management and is subcontracted with or overseen by another investment adviser), and any entity controlling, controlled by, or under common control with the adviser that provides ongoing services to the registrant for each of the last two fiscal years of the registrant: |
2017 - None
2016 - None
2015 - None
| (h) | The registrant’s audit committee of the board of trustees has considered whether the provision of non-audit services that were rendered to the registrant’s investment adviser, and any entity controlling, controlled by, or under common control with the investment adviser that provides ongoing services to the registrant that were not pre-approved pursuant to paragraph (c)(7)(ii) of Rule 2-01 of Regulation S-X is compatible with maintaining the Principal accountant’s independence. No such services were rendered. |
Item 5. Audit Committee of Listed Companies. Not applicable to open-end investment companies.
Item 6. Schedule of Investments. See Item 1.
Item 7. Disclosure of Proxy Voting Policies and Procedures for Closed-End Funds. Not applicable to open-end investment companies.
Item 8. Portfolio Managers of Closed-End Management Investment Companies. Not applicable to open-end investment companies.
Item 9. Purchases of Equity Securities by Closed-End Funds. Not applicable to open-end investment companies.
Item 10. Submission of Matters to a Vote of Security Holders. None
Item 11. Controls and Procedures.
(a) Based on an evaluation of the Registrant’s disclosure controls and procedures as of a date within 90 days of filing date of this Form N-CSR, the Principal executive officer and Principal financial officer of the Registrant have concluded that the disclosure controls and procedures of the Registrant are reasonably designed to ensure that the information required in filings on Form N-CSR is recorded, processed, summarized, and reported by the filing date, including that information required to be disclosed is accumulated and communicated to the Registrant’s management, including the Registrant’s Principal executive officer and Principal financial officer, as appropriate to allow timely decisions regarding required disclosure.
(b) There were no significant changes in the Registrant’s internal control over financial reporting that occurred during the Registrant’s last fiscal half-year that have materially affected, or are reasonably likely to materially affect, the Registrant’s internal control over financial reporting.
Item 12. Exhibits.
(a)(1) Code of Ethics is filed herewith.
(a)(2) Certifications required by Section 302 of the Sarbanes-Oxley Act of 2002 (and Item 11(a)(2) of Form N-CSR) are filed herewith.
(a)(3) Not applicable for open-end investment companies.
(b) Certifications required by Section 906 of the Sarbanes-Oxley Act of 2002 (and Item 11(b) of Form N-CSR) are filed herewith.
SIGNATURES
Pursuant to the requirements of the Securities Exchange Act of 1934 and the Investment Company Act of 1940, the registrant has duly caused this report to be signed on its behalf by the undersigned, thereunto duly authorized.
(Registrant) Equinox Funds Trust
By (Signature and Title)
/s/ Robert J. Enck
Robert J. Enck, Principal Executive Officer
Date 6/7/17
Pursuant to the requirements of the Securities Exchange Act of 1934 and the Investment Company Act of 1940, this report has been signed below by the following persons on behalf of the registrant and in the capacities and on the dates indicated.
By (Signature and Title)
/s/ Robert J. Enck
Robert J. Enck, Principal Executive Officer
Date 6/7/17
By (Signature and Title)
/s/ Laura Latella
Laura Latella, Principal Financial Officer
Date 6/7/17