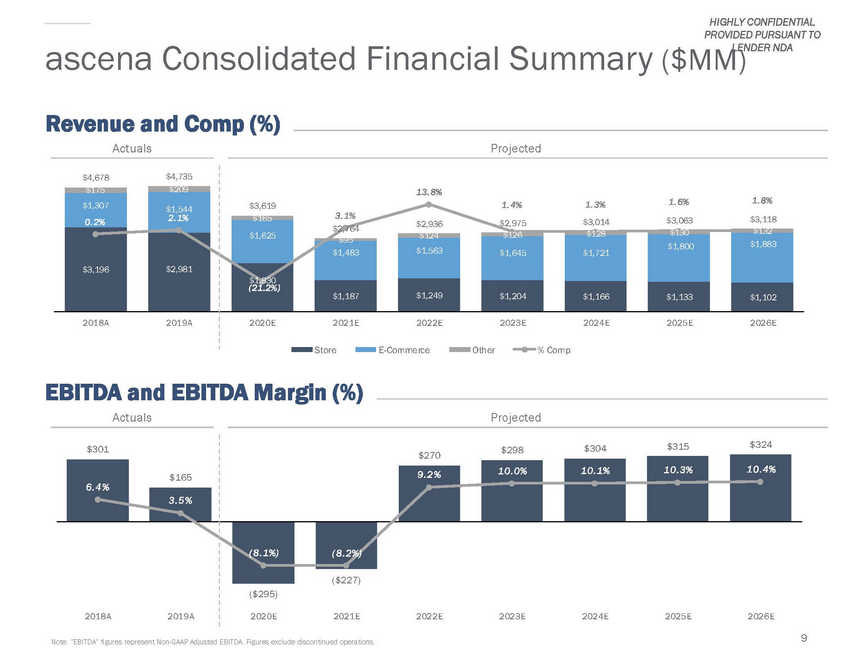
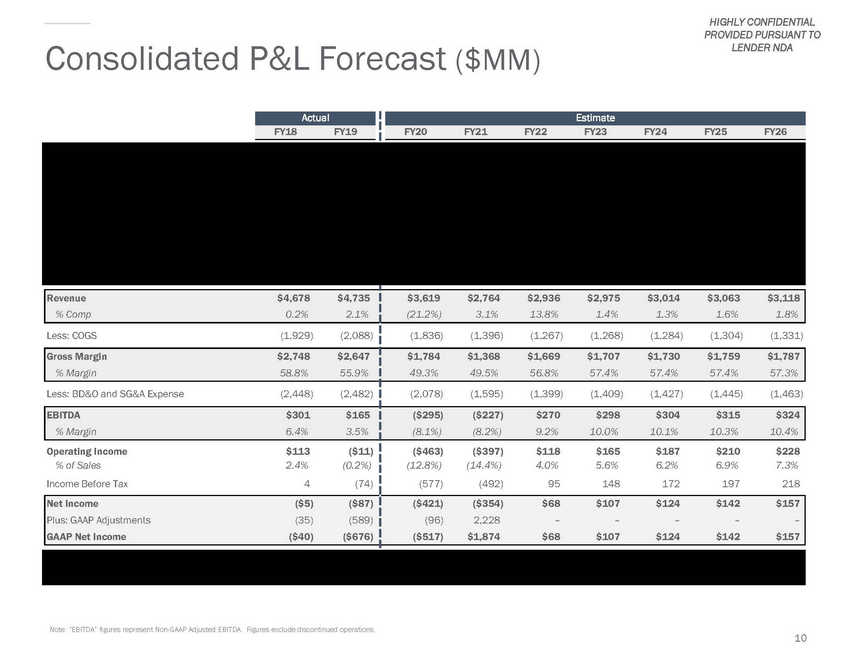
 | HIGHLY CONFIDENTIAL PROVIDED PURSUANT TO LENDER NDA Consolidated P&L Forecast ($MM) Note: “EBITDA” figures represent Non-GAAP Adjusted EBITDA. Figures exclude discontinued operations. 10 Net Store Sales $3,196 $2,981 $1,830 $1,187 $1,249 $1,204 $1,166 $1,133 $1,102 % of Sales 68.3% 63.0% 50.6% 42.9% 42.5% 40.5% 38.7% 37.0% 35.4% % Comp(5.0%) (4.8%) (35.6%) 23.2% 26.5% (3.6%) (3.2%) (2.8%) (2.7%) E-Commerce Sales, Net1,307 1,544 1,625 1,483 1,563 1,645 1,721 1,800 1,883 % of Sales 27.9% 32.6% 44.9% 53.6% 53.2% 55.3% 57.1% 58.8% 60.4% % Comp15.1% 18.1% 5.2% (8.7%) 5.4% 5.3% 4.6% 4.6% 4.6% Other(1) 175 209 165 95 124 126 128 130 132 % of Sales 3.7% 4.4% 4.6% 3.4% 4.2% 4.2% 4.2% 4.2% 4.2% Revenue $4,678 $4,735 % Comp0.2% 2.1% $3,619 $2,764 $2,936 $2,975 $3,014 $3,063 $3,118 (21.2%) 3.1% 13.8% 1.4% 1.3% 1.6% 1.8% Less: COGS (1,929) (2,088) (1,836) (1,396) (1,267) (1,268) (1,284) (1,304) (1,331) Gross Margin $2,748 $2,647 % Margin 58.8% 55.9% $1,784 $1,368 $1,669 $1,707 $1,730 $1,759 $1,787 49.3% 49.5% 56.8% 57.4% 57.4% 57.4% 57.3% Less: BD&O and SG&A Expense (2,448) (2,482) (2,078) (1,595) (1,399) (1,409) (1,427) (1,445) (1,463) EBITDA $301 $165 % Margin 6.4% 3.5% ($295) ($227) $270 $298 $304 $315 $324 (8.1%) (8.2%) 9.2% 10.0% 10.1% 10.3% 10.4% Operating Income $113 ($11) % of Sales 2.4% (0.2%) Income Before Tax 4 (74) ($463) ($397) $118 $165 $187 $210 $228 (12.8%) (14.4%) 4.0% 5.6% 6.2% 6.9% 7.3% (577) (492) 95 148 172 197 218 Net Income ($5) ($87) Plus: GAAP Adjustments (35) (589) GAAP Net Income ($40) ($676) ($421) ($354) $68 $107 $124 $142 $157 (96) 2,228 – – – – – ($517) $1,874 $68 $107 $124 $142 $157 Memo: Store Count 2,920 2,829 2,658 1,207 1,207 1,207 1,207 1,207 1,207 Memo: E-Commerce Penetration 29% 34% 44% 56% 56% 58% 60% 61% 63% Estimate FY20 FY21 FY22 FY23 FY24 FY25 FY26 Actual FY18 FY19 |