15 th Annual ICR XChange Conference January 16, 2013 David Jaffe President & CEO

2

Forward Looking Statements This presentation contains forward - looking statements within the meaning of the Private Securities Litigation Reform Act of 1995 . Forward - looking statements involve known and unknown risks and uncertainties, which may cause our actual results in future periods to differ materially from our forecasted results . Detailed information concerning those risks and uncertainties are readily available in our most recent Annual Report on Form 10 - K and Quarterly Report on Form 10 - Q which have been filed with the U . S . Securities and Exchange Commission . Non - GAAP Financial Measures Where indicated, certain financial information herein has been presented on a non - GAAP basis . This basis adjusts for items that management believes are not indicative of the Company’s underlying operating performance . Reference should be made to the Company’s annual earnings releases for all periods for the nature of such adjustments and for a reconciliation of such non - GAAP measures to the Company’s financial results prepared in accordance with GAAP . 3
Our Vision “Serve our shareholders and create value by becoming a family of leading retail concepts with $10 billion in sales and top tier profitability.” Our Mission “Making people feel good about themselves.” 4
Investor Highlights 5 • Diversified portfolio • Significant growth opportunities • Shared Services leverages overhead & drives synergies • Strong Balance Sheet & Cash Flow • Future opportunities
CHRS Transaction Overview • Reasonable valuation • Conservative financing • Plan for each division • Valuable assets 6
CHRS Transaction Benefits • Two niche brands • Transfer Fashion Bug sales • Overhead reduction • Synergies • Best practices • Talent acquisition & retention 7
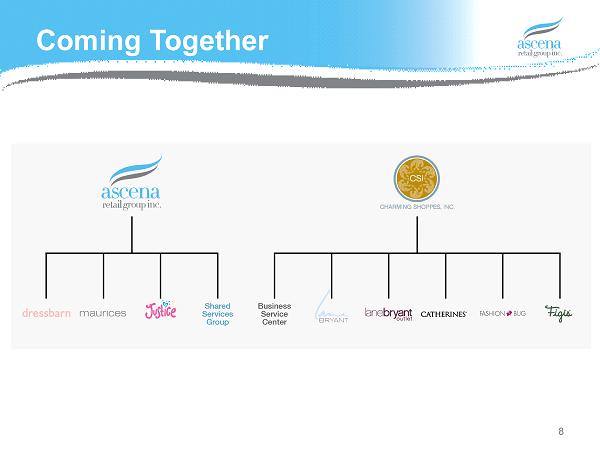
Coming Together 8
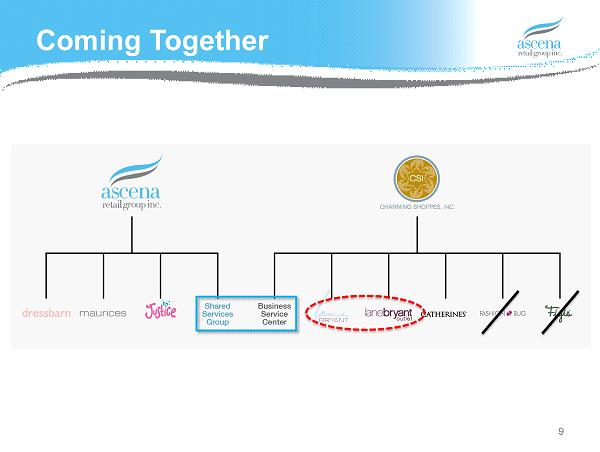
Coming Together 9
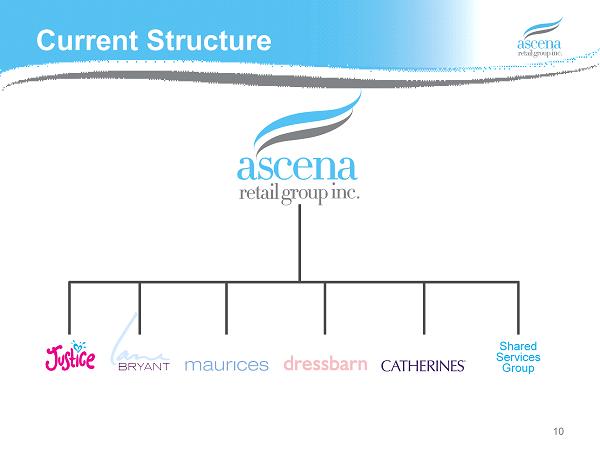
Current Structure 10 Shared Services Group
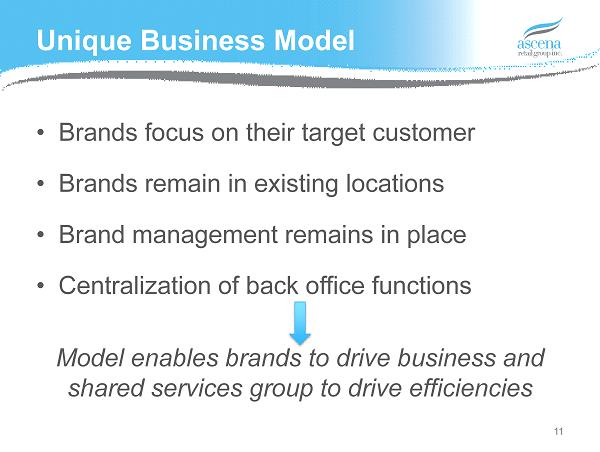
Unique Business Model • Brands focus on their target customer • Brands remain in existing locations • Brand management remains in place • Centralization of back office functions Model enables brands to drive business and shared services group to drive efficiencies 11
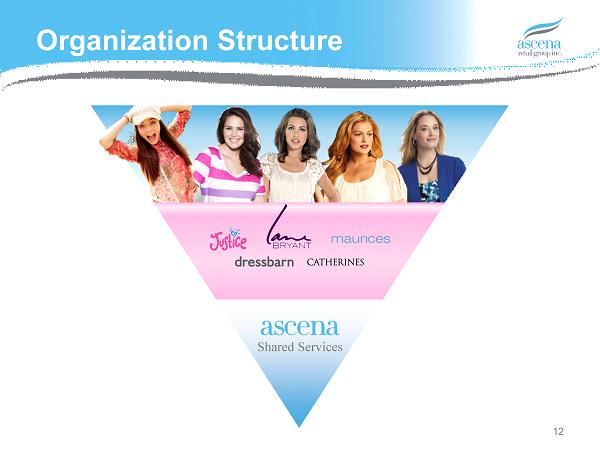
Shared Services Organization Structure 12
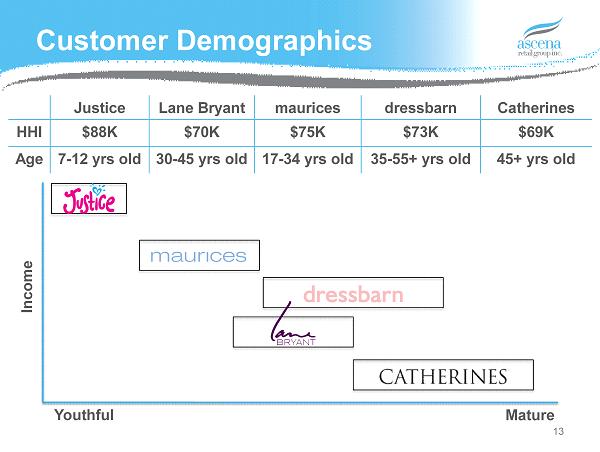
Justice Lane Bryant maurices dressbarn Catherines HHI $88K $70K $75K $73K $69K Age 7 - 12 yrs old 30 - 45 yrs old 17 - 34 yrs old 35 - 55+ yrs old 45+ yrs old Customer Demographics 13 Youthful Mature Income
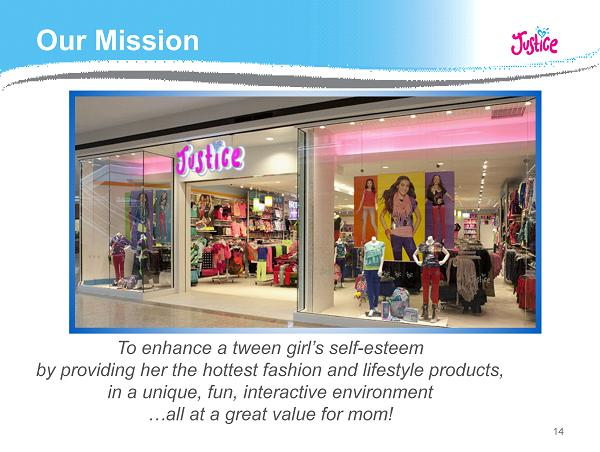
Our Mission 14 To enhance a tween girl’s self - esteem by providing her the hottest fashion and lifestyle products, in a unique, fun, interactive environment …all at a great value for mom!
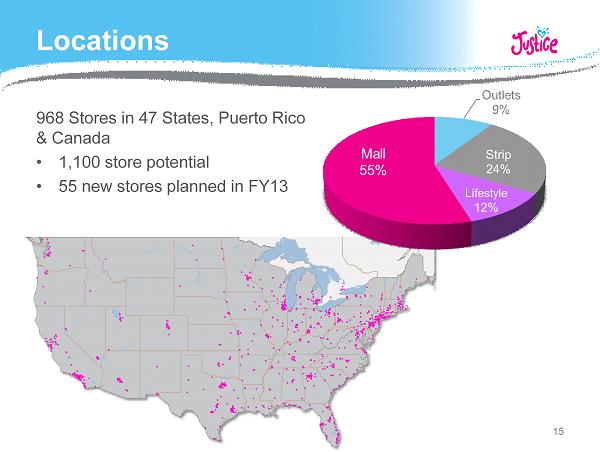
Locations 968 Stores in 47 States, Puerto Rico & Canada • 1,100 store potential • 55 new stores planned in FY13 15
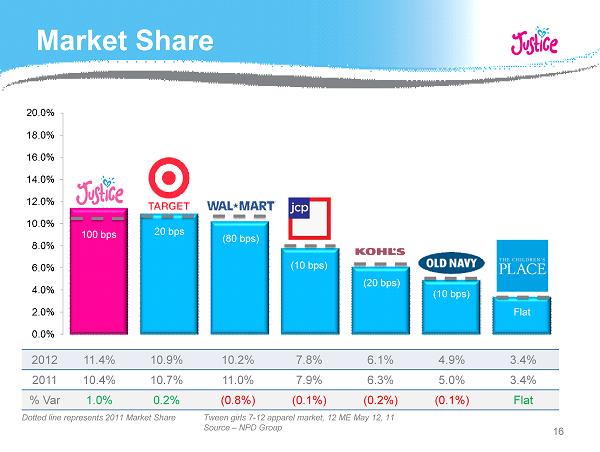
Market Share 16 Tween girls 7 - 12 apparel market, 12 ME May 12, 11 Source – NPD Group Dotted line represents 2011 Market Share 2012 11.4% 10.9% 10.2% 7.8% 6.1% 4.9% 3.4% 2011 10.4% 10.7% 11.0% 7.9% 6.3% 5.0% 3.4% % Var 1.0% 0.2% (0.8%) (0.1%) (0.2%) (0.1%) Flat 100 bps 20 bps (80 bps) (10 bps) (20 bps) (10 bps) Flat
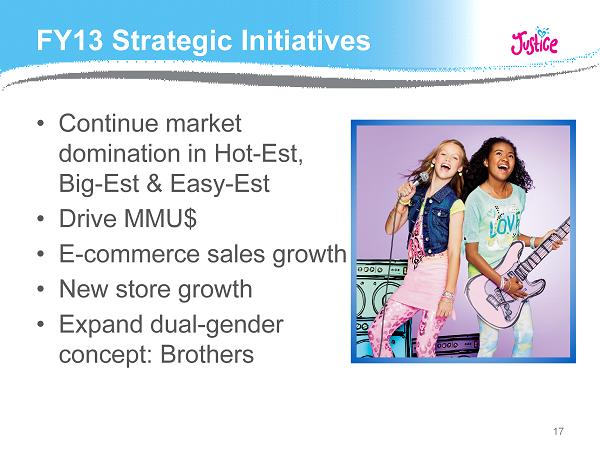
FY13 Strategic Initiatives • Continue market domination in Hot - Est, Big - Est & Easy - Est • Drive MMU$ • E - commerce sales growth • New store growth • Expand dual - gender concept: Brothers 17
Growth Drivers • Comp sales • New stores • E - commerce • Brothers expansion 18
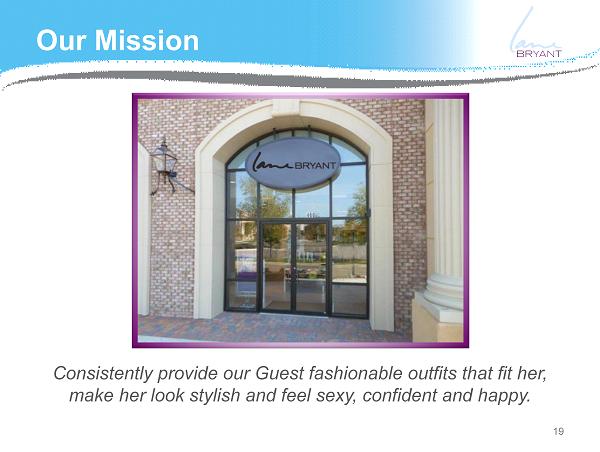
Our Mission 19 Consistently provide our Guest fashionable outfits that fit her, make her look stylish and feel sexy, confident and happy.
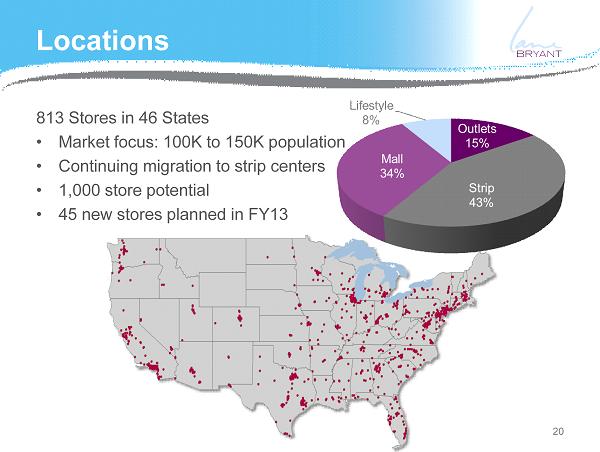
Locations 20 813 Stores in 46 States • Market focus: 100K to 150K population • Continuing migration to strip centers • 1,000 store potential • 45 new stores planned in FY13
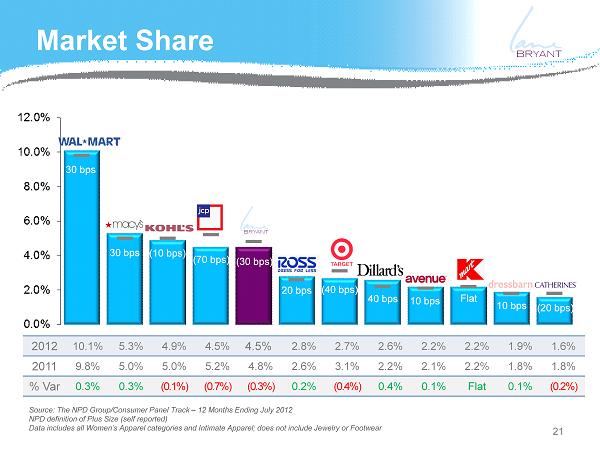
Market Share Source: The NPD Group/Consumer Panel Track – 12 Months Ending July 2012 NPD definition of Plus Size (self reported) Data includes all Women’s Apparel categories and Intimate Apparel; does not include Jewelry or Footwear 30 bps 30 bps (10 bps) (70 bps) (30 bps) 20 bps (40 bps) 40 bps 10 bps Flat 10 bps (20 bps) 2012 10.1% 5.3% 4.9% 4.5% 4.5% 2.8% 2.7% 2.6% 2.2% 2.2% 1.9% 1.6% 2011 9.8% 5.0% 5.0% 5.2% 4.8% 2.6% 3.1% 2.2% 2.1% 2.2% 1.8% 1.8% % Var 0.3% 0.3% (0.1%) (0.7%) (0.3%) 0.2% (0.4%) 0.4% 0.1% Flat 0.1% (0.2%) 21
FY13 Strategic Initiatives • Launched comprehensive rebranding • Reposition the fleet • Drive multi - channel growth • Improve inventory productivity 22
Growth Drivers • Store relocation and expansion • E - commerce • Merchandise mix refinement • Tighter inventory, markdown management 23
Simply the best hometown specialty store. 24 Our Mission
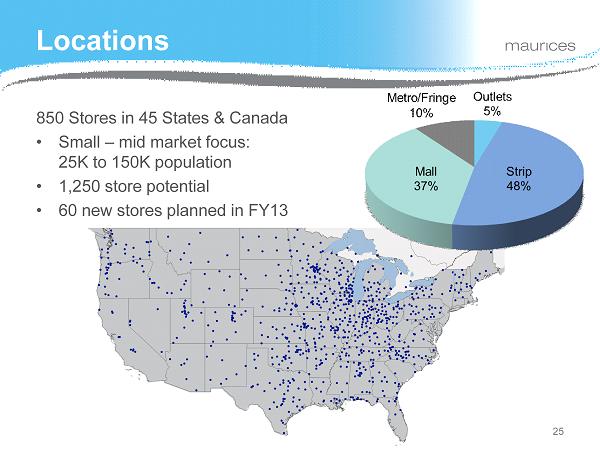
Locations 850 Stores in 45 States & Canada • Small – mid market focus: 25K to 150K population • 1,250 store potential • 60 new stores planned in FY13 25
FY13 Strategic Initiatives • Open new stores • Grow e - commerce • Consistency in merchandise offering • Increase direct sourced product • Refine markdown management • Customer acquisition and retention 26
Growth Drivers • Comp sales • New stores – Domestic – Canada • E - commerce • Develop sourcing 27
Our Mission 28 28 Inspiring women to look and feel beautiful.
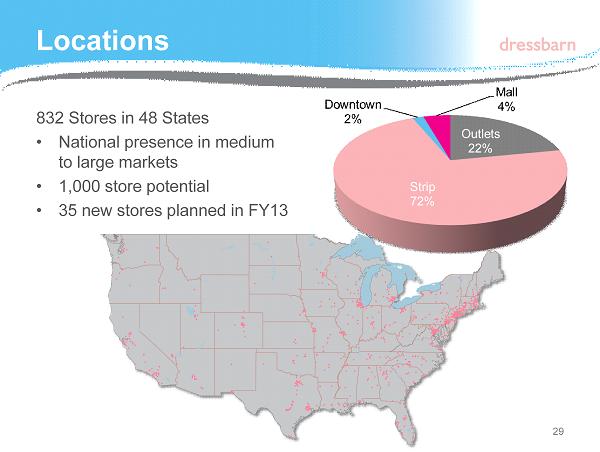
Locations 832 Stores in 48 States • National presence in medium to large markets • 1,000 store potential • 35 new stores planned in FY13 29
FY13 Strategic Initiatives • Hot - Est in fashion for our target customer • Store experience • Marketing strategy • Accelerating growth • Talent 30
Growth Drivers • Sales growth – Comp stores – E - commerce expansion – New store openings • Margin Expansion – Design – Greater depth per SKU – Merchandise enhancements – Differentiating service 31
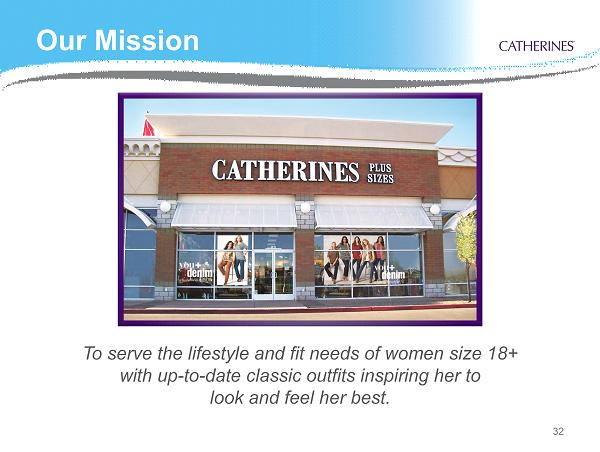
Our Mission 32 To serve the lifestyle and fit needs of women size 18+ with up - to - date classic outfits inspiring her to look and feel her best.
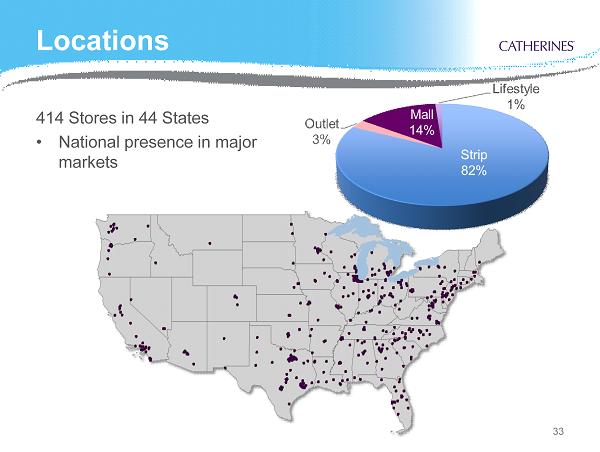
Locations 414 Stores in 44 States • National presence in major markets 33
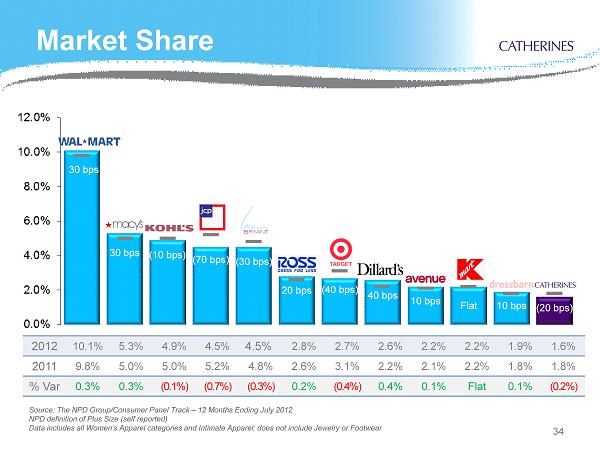
Market Share 34 Source: The NPD Group/Consumer Panel Track – 12 Months Ending July 2012 NPD definition of Plus Size (self reported) Data includes all Women’s Apparel categories and Intimate Apparel; does not include Jewelry or Footwear 30 bps 30 bps (10 bps) (70 bps) (30 bps) 20 bps (40 bps) 40 bps 10 bps Flat 10 bps (20 bps) 2012 10.1% 5.3% 4.9% 4.5% 4.5% 2.8% 2.7% 2.6% 2.2% 2.2% 1.9% 1.6% 2011 9.8% 5.0% 5.0% 5.2% 4.8% 2.6% 3.1% 2.2% 2.1% 2.2% 1.8% 1.8% % Var 0.3% 0.3% (0.1%) (0.7%) (0.3%) 0.2% (0.4%) 0.4% 0.1% Flat 0.1% (0.2%)
FY13 Strategic Initiatives • Drive multi - channel growth • Improve inventory productivity • Increase direct - sourced product penetration • Optimize marketing mix • Streamline marketing events & campaigns • Leverage CRM database 35
Growth Drivers • E - commerce • Merchandise mix refinement • Greater penetration of direct - sourced product • Tighter inventory, markdown management 36
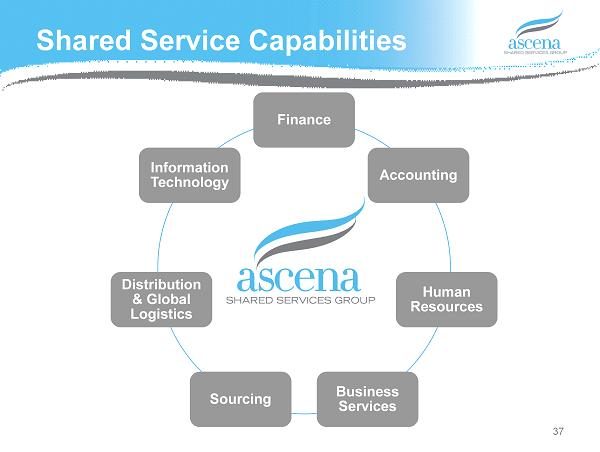
Finance Accounting Human Resources Business Services Sourcing Distribution & Global Logistics Information Technology Shared Service Capabilities 37
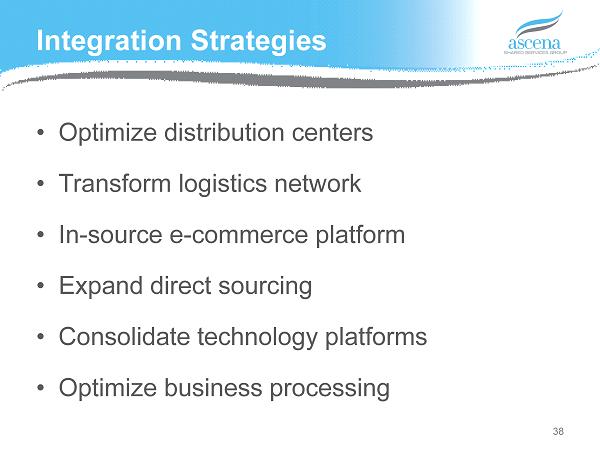
Integration Strategies • Optimize distribution centers • Transform logistics network • In - source e - commerce platform • Expand direct sourcing • Consolidate technology platforms • Optimize business processing 38
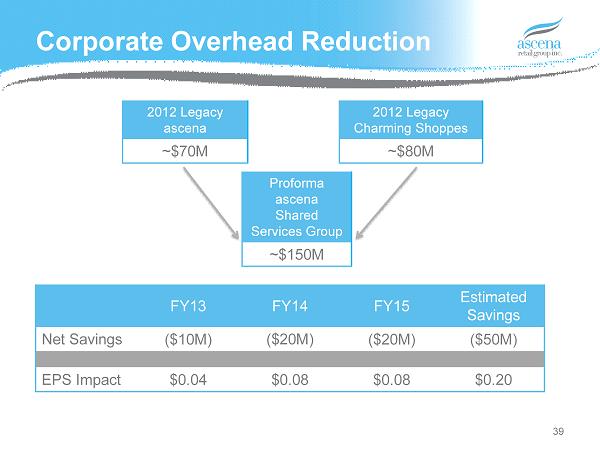
Corporate Overhead Reduction 39 FY13 FY14 FY15 Estimated Savings Net Savings ($10M) ($20M) ($20M) ($50M) EPS Impact $0.04 $0.08 $0.08 $0.20 2012 Legacy ascena ~$70M 2012 Legacy Charming Shoppes ~$80M Proforma ascena Shared Services Group ~$150M
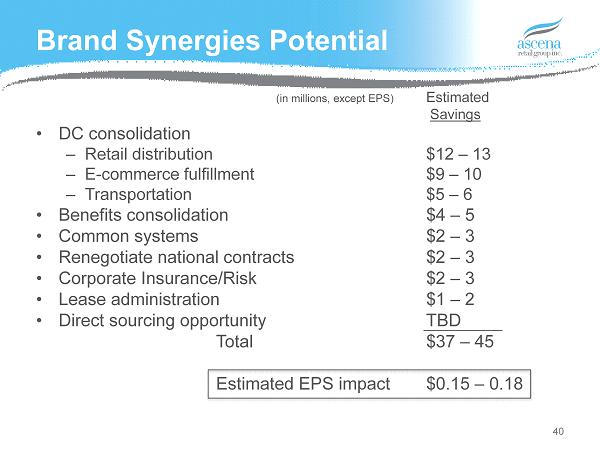
Brand Synergies Potential (in millions, except EPS) Estimated Savings • DC consolidation – Retail distribution $12 – 13 – E - commerce fulfillment $9 – 10 – Transportation $5 – 6 • Benefits consolidation $4 – 5 • Common systems $2 – 3 • Renegotiate national contracts $2 – 3 • Corporate Insurance/Risk $2 – 3 • Lease administration $1 – 2 • Direct sourcing opportunity TBD Total $37 – 45 Estimated EPS impact $0.15 – 0.18 40
Financials
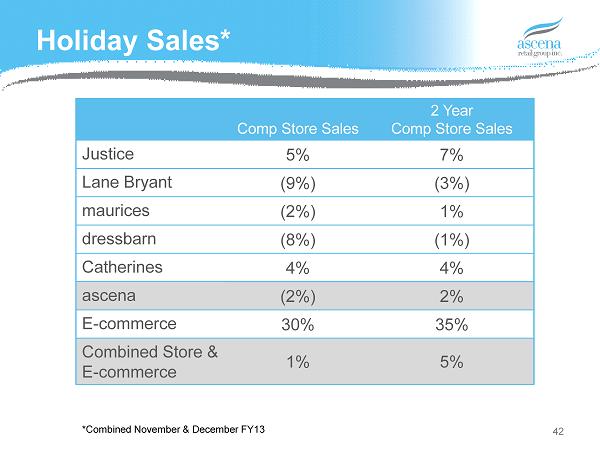
Holiday Sales* 42 Comp Store Sales 2 Year Comp Store Sales Justice 5% 7% Lane Bryant (9%) (3%) maurices (2%) 1% dressbarn (8%) (1%) Catherines 4% 4% ascena (2%) 2% E - commerce 30% 35% Combined Store & E - commerce 1% 5% *Combined November & December FY13
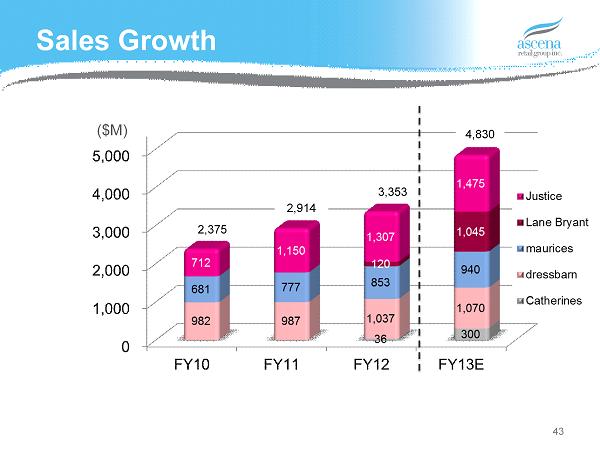
Sales Growth 43 ($M) 2,914 3,353 4,830 2,375
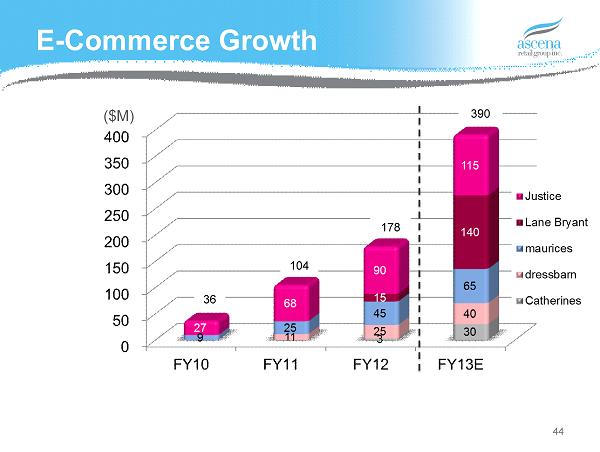
E - Commerce Growth 44 ($M) 104 178 390 36
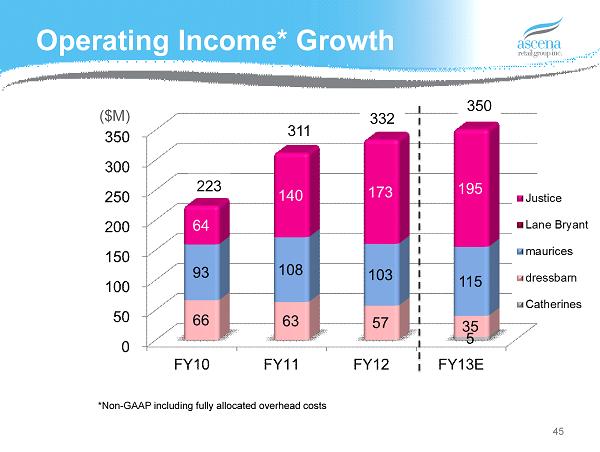
Operating Income* Growth 45 311 332 350 *Non - GAAP including fully allocated overhead costs ($M) 223
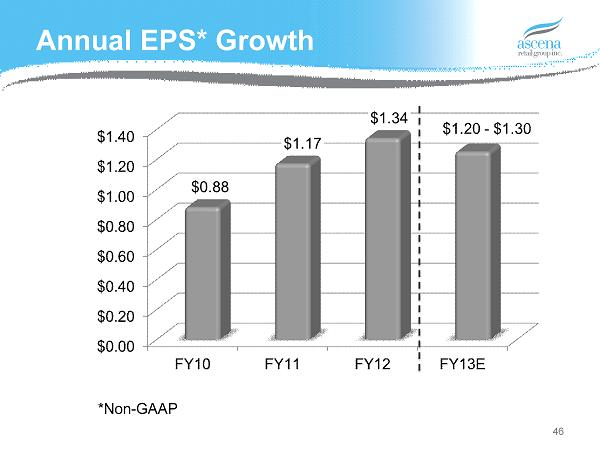
Annual EPS* Growth 46 *Non - GAAP
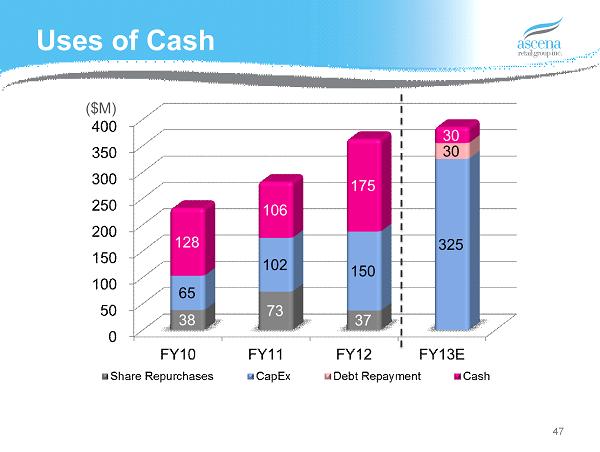
Uses of Cash 47 ($M)
Long - term Economic Model • Sales annual growth rate of 8% to 10% • Operating income % of sales of 12%+ • EPS annual growth rate of 10%+ 48

Investor Highlights 49 • Diversified portfolio • Significant growth opportunities • Shared Services leverages overhead & drives synergies • Strong Balance Sheet & Cash Flow • Future opportunities