UNITED STATES
SECURITIES AND EXCHANGE COMMISSION
Washington, D.C. 20549
FORM N-CSR
CERTIFIED SHAREHOLDER REPORT OF REGISTERED MANAGEMENT
INVESTMENT COMPANIES
Investment Company Act file number 811-22468
Ashmore Funds
(Exact name of registrant as specified in charter)
c/o Ashmore Investment Management Limited
61 Aldwych
London WC2B 4AE
England
(Address of principal executive offices) (Zip code)
Corporation Service Company
84 State Street
Boston, MA 20109
(Name and address of agent for service)
Registrant’s telephone number, including area code: 011-44-20-3077-6000
Date of fiscal year end: October 31
Date of reporting period: April 30, 2012
Item 1. Reports to Stockholders.
ASHMORE FUNDS
SEMI ANNUAL FINANCIAL STATEMENTS
April 30, 2012

(THIS PAGE INTENTIONALLY LEFT BLANK)
ASHMORE FUNDS
TABLE OF CONTENTS
This material is authorized for use only when preceded or accompanied by the current Ashmore Funds prospectuses. Investors should consider the investment objectives, risks, charges and expenses of these Funds carefully before investing. This and other information is contained in the Funds’ prospectus. Please read the prospectus carefully before you invest or send money.
A Fund’s past performance is not necessarily an indication of how the Fund will perform in the future.
An investment in a Fund is not a deposit of a bank and is not guaranteed or insured by the Federal Deposit Insurance Corporation or any other government agency. It is possible to lose money on investments in the Funds.
ASHMORE FUNDS
INVESTMENT MANAGERS REPORT
For the period November 1, 2011 to April 30, 2012
Overview
The European sovereign debt crisis played a critical role in the performance of emerging markets assets over the course of the reporting period. Two high stakes EU summits were held in the fourth quarter of 2011 (one in October and the other in December) which were designed to seek a political and policy roadmap to deal with both current and potential debt challenges. Neither summit managed to convince the market that a decisive solution to the Eurozone debt crisis (such as larger fiscal transfers or debt mutualisation) was getting nearer.
At the start of the reporting period, much of the Eurozone crisis was centred on Greece (although Ireland and Portugal both accepted external assistance). In August however, fears spread to Spain and Italy, leading to aggressive fiscal consolidation measures - and ultimately to changes in governments in both Greece and Italy. The focus then shifted to Greece’s slippage against its fiscal and economic targets. Discussions about a second financial aid package for Greece, agreed at the European Union summit in October, enshrined the principle of a large haircut on the Greek government debt held by private sector investors. These discussions, and market pressure on French banks, highlighted the under-capitalisation of European banks in general and led to a de-facto credit freeze in European credit markets in November.
To address this, coordinated central bank action was taken by the US Federal Reserve, the Bank of Canada, the Bank of England, the Bank of Japan, the European Central Bank and the Swiss National Bank. This coordinated action was designed to support economic activity and increase the supply of credit to households and businesses.
In December, markets started a three month rally as sentiment turned following a series of positive events. Firstly, EU leaders agreed in principle to a new fiscal pact for the Eurozone nations. Secondly, the European Central Bank offered three year unlimited repo financing lines (the three year Long Term Refinancing Operation) thus establishing itself as a lender of last resort. Whilst this reduced the tail risk for further bank defaults, it did not reduce the risks of a Eurozone recession. Thirdly, data from the US started to turn positive with all major indicators suggesting that the US was on track for a slow and steady recovery. However, by the end of the first quarter of 2012, this positive sentiment started to change as US data failed to live up to the hype and the Eurozone started to make headlines again.
In contrast to developed markets, where growth halved year on year in 2011 to 1.6%, emerging market economies registered robust economic growth averaging 6.2%. Emerging markets policy makers met a marked slowdown in the fourth quarter of 2011 with a mix of interest rate cuts and administrative measures aimed at stimulating economic growth. Brazil and Turkey for example were notable in using a combination of rate cuts and exchange rate manipulation. China, having reduced growth targets from 8% to 7.5% for 2012, cut the bank reserve ratio requirement to increase liquidity in the market. Most emerging markets countries have further ammunition should conditions deteriorate further – this is not the case for their developed world counterparts.
2
ASHMORE FUNDS
INVESTMENT MANAGERS REPORT
Portfolio Overview
Ashmore Emerging Markets Corporate Debt Fund
Corporate bonds in emerging markets are typically issued by vertically integrated companies operating in fast growing economies and industries. These companies are often characterised by low levels of leverage or borrowings. Over the six month reporting period, performance in the Fund has been strong with the asset class rallying particularly well in the first quarter of 2012. High yield investments outperformed their investment grade counterparts overall. Issuance in the emerging markets corporate space was strong with over $89bn issued in the first quarter of 2012, far surpassing the $73.4bn record set in the first quarter of 2011. Regionally, Asia accounted for the largest portion of issuance, followed by Latin America and the Europe, Middle East and Africa (EMEA) region. Performance over the period was driven by exposure to China, Brazil and Mexico. Chinese names recovered particularly well, having been sold off in the third quarter of 2011 on the back of growth concerns and a general spike in risk aversion. The one noteworthy detractor was Kazakhstan where BTAS, a bank, announced that it was restructuring its bonds having failed to pay its coupon within the grace period. We believe that emerging markets corporate bonds are well positioned for growth given the dynamics of the asset class but naturally, credit selection will be critical within the Fund.
Ashmore Emerging Markets Local Currency Bond Fund
The Emerging Markets Local Currency Bond Fund provides exposure to global emerging markets local currency bonds. Investments are mainly in emerging market transferable securities, by and large debt and other local currency denominated instruments, issued by sovereigns and quasi-sovereigns. Performance over the reporting period was strong from a broad base of contributions including Russia which was one of the top performers. Russian markets sold off in the build-up to the election in 2012, but following Putin’s victory, transition to power was swift and fears of large scale protests similar to those experienced in the Middle East were largely unfounded. The Rouble was also well supported by the price of oil. Other key country contributors were Brazil and Mexico. By the end of the reporting period the Fund had positioned itself with an overweight to Latin America and Asia and an underweight to Eastern Europe. The Fund’s portfolio will continue to be managed on a top-down macro basis with a medium to long term investment horizon. Bouts of risk aversion may lead to periods of negative performance but this could provide an opportunity for the fund to add exposure to certain countries at deflated prices, providing that their fundamentals have not deteriorated. We believe that emerging markets local currency bonds offer the same compelling long term investor case as local currencies themselves.
Ashmore Emerging Markets Local Currency Fund
The Emerging Markets Local Currency Fund invests mainly in short-dated emerging markets local currency denominated instruments including local currency sovereign, quasi-sovereign and corporate bonds. The period under review saw a marked change in performance: November and December 2011 saw local currencies retreat, whereas the first quarter of 2012 yielded strong results for local currency assets. During both periods, performance was fundamentally driven by sentiment in the developed world; in that investors typically unwound local currency positions when concerns over the Eurozone increased (repatriating assets back to the US Dollar), and, as US data and optimism over global growth improved at the beginning of 2012, investors started to reallocate assets back to local currencies. Our view is that the fundamentals in the emerging markets haven’t deteriorated and the long term structural case for local currencies remains compelling; as global rebalancing gathers momentum, we expect emerging market currencies to strengthen versus developed world currencies.
Ashmore Emerging Markets Sovereign Debt Fund
The Emerging Markets Sovereign Debt Fund typically invests in instruments issued by emerging market sovereigns and quasi-sovereigns denominated in US Dollars. The asset class typically trades at a spread over US Treasuries, so any volatility in the US market will have an impact on external sovereign debt. The Fund delivered strong performance over the reporting period which was driven by good performance from a broad range of countries, particularly higher beta credits. Venezuela, Russia and Brazil were the largest country exposures over the period and Venezuela was one of the best performers in the period.
3
ASHMORE FUNDS
INVESTMENT MANAGERS REPORT
Ashmore Emerging Markets Total Return Fund
The Emerging Markets Total Return Fund targets total returns through a highly diversified portfolio of emerging markets fixed income securities. Investments are mainly in sovereign, quasi-sovereign and corporate bonds including local currency denominated bonds and emerging markets local currencies. The Fund is managed actively both across and within the themes and as such, exposure by theme can vary quite significantly on a month by month basis. At the start of the reporting period the Fund had its largest weighting in the External Debt and Local Currency themes. In December 2011, as data from the US started to improve and investors gained confidence, the Fund started to increase its exposure to both local currencies and local currency debt. This trend was reversed towards the end of the period as investors became increasingly negative about the hopes of a strong US recovery and as Eurozone concerns returned to the headlines. Over the period, exposure to corporate bonds remained fairly static. As mentioned above, our view is that the structural case for emerging market corporate bonds is strong and we are keen to buy into value.
Ashmore Emerging Markets Equity Fund
Emerging markets equities experienced modest gains over the period despite declines through November and December 2011. Smaller equity markets such as Egypt, Colombia and Thailand drove performance, while Morocco was the only MSCI EM Index constituent that ended in negative territory for the reporting period. Both an underweight allocation to Poland and an overweight to Korea contributed positively to Fund performance. Stock selection in Russia, Mexico and China added value, while stock picks in Brazil lagged. Indicators point to a brighter second half in 2012. These include economists’ upgrade of gross domestic product in both emerging markets and the U.S., and concerted efforts by central governments to get their economies moving through both fiscal and monetary policies. We believe that valuations in emerging markets remain compelling and are at a significant discount to historical levels.
Ashmore Emerging Markets Small-Cap Equity Fund
Emerging markets small cap equities rebounded in the first quarter of 2012, following an underperformance during the latter part of 2011, and ended the period by outperforming their larger peers for the 2012 year to date. The smaller markets of Turkey, Egypt and Thailand led the advance for the small cap markets, while Hungary and Korea ended in negative territory for the reporting period. Confidence in Brazil and caution in Korea were both positive contributors for the Fund. Stock selection in the Philippines, Korea and Taiwan added value, while picks in Mexico and Brazil lagged. The emerging markets domestic story remains consistent, with both inflation and interest rates declining. With a brighter outlook for the second half of 2012, small cap companies may benefit from a cyclical upturn in many economies around the world. Improved liquidity, lower cost of capital, and a pickup in domestic demand are all positive indicators for smaller companies.
Ashmore Investment Management Limited
This commentary may include statements that constitute “forward-looking statements” under the U.S. securities laws. Forward-looking statements include, among other things, projections, estimates, and information about possible or future results related to the Funds and market or regulatory developments. The views expressed above are not guarantees of future performance or economic results and involve certain risks, uncertainties and assumptions that could cause actual outcomes and results to differ materially from the views expressed herein. The views expressed above are those of Ashmore Investment Management Limited as of the date indicated and are subject to change at any time based upon economic, market, or other conditions and Ashmore Investment Management Limited undertakes no obligation to update the views expressed herein. Any discussions of specific securities or markets should not be considered a recommendation to buy or sell or invest in those securities or markets. The views expressed above may not be relied upon as investment advice or as an indication of the Funds’ trading intent. Information about the Funds’ holdings, asset allocation or country diversification is historical and is not an indication of future portfolio composition, which may vary. Direct investment in any index is not possible. The performance of any index mentioned in this commentary has not been adjusted for ongoing management, distribution and operating expenses applicable to mutual fund investments. In addition, the returns do not reflect certain charges that an investor in the Funds may pay. If these additional fees were reflected, performance would have been lower.
4
IMPORTANT INFORMATION ABOUT THE FUNDS
The following disclosure provides important information regarding each Fund’s Average Annual Total Return table and Cumulative Returns chart, which appears on each Fund’s individual page in this report (the “Shareholder Report” or “Report”). Please refer to this information when reviewing the table and chart for a Fund.
On each individual Fund Summary page in this Report, the Average Annual Total Return table and Cumulative Returns chart measure performance assuming that all dividend and capital gain distributions were reinvested. Returns do not reflect the deduction of taxes that a shareholder would pay on (i) Fund distributions or (ii) the redemption of Fund shares. The Cumulative Returns Chart reflects only Institutional Class performance. Performance for Class A and Class C shares is typically lower than Institutional Class performance due to the lower expenses paid by Institutional Class shares. Except for the load-waived performance for the Class A and C shares of each Fund (as applicable), performance shown is net of fees and expenses. The load-waived performance for Class A and Class C shares does not reflect the sales charges shareholders of those classes may pay in connection with a purchase or redemption of Class A and Class C shares. The load-waived performance of those share classes is relevant only to shareholders who purchase Class A or Class C shares on a load-waived basis. The figures in the line graph are calculated at net asset value and assume the investment of $1,000,000 at the end of the month that the Institutional Class of the Fund commenced operations. Each Fund measures its performance against a broad-based securities market index (“benchmark index”). Each benchmark index does not take into account fees, expenses or taxes.
For periods prior to the inception date of the Class A and Class C shares (if applicable), performance information shown is based on the performance of the Fund’s Institutional Class shares, adjusted to reflect the distribution and/or service fees and other expenses paid by the Class A and Class C shares, respectively.
A Fund’s past performance, before and after taxes, is not necessarily an indication of how the Fund will perform in the future.
An investment in a Fund is not a deposit of a bank and is not guaranteed or insured by the Federal Deposit Insurance Corporation or any other government agency. It is possible to lose money on investments in the Funds.
The following disclosure provides important information regarding each Fund’s Expense Example, which appears on each Fund’s individual page in this Shareholder Report. Please refer to this information when reviewing the Expense Example for a Fund.
EXPENSE EXAMPLE
Fund Expenses
As a shareholder of the Funds, you incur two types of costs: (1) transaction costs, including sales charges (loads) on purchase payments; redemption fees; and exchange fees; and (2) ongoing costs, including management fees; distribution (12b-1) fees; and other Fund expenses. This Example is intended to help you understand your ongoing costs (in dollars) of investing in the Funds and to compare these costs with the ongoing costs of investing in other mutual funds. The Example is based on an investment of $1,000 invested at the beginning of the period and held for the entire period, from November 1, 2011 or the inception date (if later), through to April 30, 2012.
Actual Expenses
The information in the table under the heading “Actual Performance” provides information based on actual performance and actual expenses. You may use the information in these columns, together with the amount you invested, to estimate the expenses that you paid over the period. Simply divide your account value by $1,000 (for example, an $8,600 account value divided by $1,000 = $8.60), then multiply the result by the number in the appropriate column for your share class, in the row titled “Expenses Paid” to estimate the expenses you paid on your account during this period.
5
IMPORTANT INFORMATION ABOUT THE FUNDS (CONTINUED)
Hypothetical Example for Comparison Purposes
The information in the table under the heading “Hypothetical Performance” provides information about hypothetical account values and hypothetical expenses based on the Fund’s actual expense ratio and an assumed rate of return of 5% per year before expenses, which is not the Fund’s actual return. The hypothetical account values and expenses may not be used to estimate the actual ending account balance or expenses you paid for the period. You may use this information to compare the ongoing costs of investing in the Fund and other funds. To do so, compare this 5% hypothetical example with the 5% hypothetical examples that appear in the shareholder reports of the other funds.
Please note that the expenses shown in the table are meant to highlight your ongoing costs only and do not reflect any transactional costs, such as sales charges (loads), redemption fees, or exchange fees. Therefore, the information under the heading “Hypothetical Performance” is useful in comparing ongoing costs only, and will not help you determine the relative total costs of owning different funds. In addition, if these transactional costs were included, your costs would have been higher.
6
Ashmore Emerging Markets Corporate Debt Fund
Ashmore Emerging Markets Corporate Debt Fund is an open-end U.S. mutual fund. The Fund seeks to achieve its objective by investing principally in debt instruments of Corporate issuers, which may be denominated in any currency, including the local currency of the issuer.
Please refer to page 5 herein for an explanation of the information presented below in the Average Annual Total Return Table and Cumulative Return chart.
| | | | | | |
| Average Annual Total Return For The Period Ended April 30, 2012 | | 6 Months | | 1 Year | | Since Inception |
| | | | December 8, 2010 |
| | | |
Ashmore Emerging Markets Corporate Debt Fund Institutional Class | | 6.35% | | 0.85% | | 4.72% |
| | | |
Ashmore Emerging Markets Corporate Debt Fund Retail Class A (load-waived)* | | 6.20% | | 0.59%** | | 4.45% |
| | | |
Ashmore Emerging Markets Corporate Debt Fund Retail Class A (unadjusted)* | | 1.95% | | -3.43%** | | 1.44%*** |
| | | |
Ashmore Emerging Markets Corporate Debt Fund Retail Class C (load-waived)* | | 5.82% | | -0.14%** | | 3.69% |
| | | |
Ashmore Emerging Markets Corporate Debt Fund Retail Class C (unadjusted)* | | 4.75% | | -1.14%** | | 2.95%*** |
| | | |
JP Morgan CEMBI BD**** | | 5.13% | | 5.30% | | 6.04% |
| | | | | | | | | | |
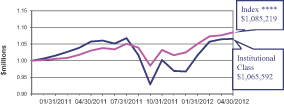
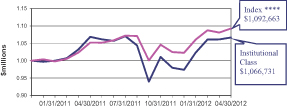
| Cumulative Returns Through April 30, 2012 (% of NAV) | | | | | | Top 5 Country Exposures as of April 30, 2012 (% of NAV) | |
| | | | |
| | | | | | United Arab Emirates | | | 11.72 | % |
| | | | | China | | | 10.91 | % |
| | | | | Brazil | | | 10.48 | % |
| | | | | Mexico | | | 9.63 | % |
| | | | | Poland | | | 5.22 | % |
| | | | | Source: Ashmore. Top 5 country exposure based on aggregate allocation to investment instruments related to countries shown above | |
| | | | |
$1,000,000 invested at the beginning of the first full month following the inception of the Institutional Class. The minimum initial investment amount for Institutional Class, Shares is $1,000,000. The minimum initial investment amount for Retail Shares Classes A and C is $1,000.
All Fund returns are net of fees and expenses, except for the load-waived return information for Class A and Class C shares. Performance calculations assume that all dividend and capital gain distributions were reinvested.
*For periods prior to the inception date of the Class A and Class C shares, performance information shown is based on the performance of the Fund’s Institutional Class shares, adjusted to reflect the distribution and/or service fees and other expenses paid by the Class A and Class C shares, respectively.
** Total return is calculated based on since inception of 05/12/2011.
*** Unadjusted Performance accounts for a maximum sales load of 4% for Class A shares and maximum deferred sales charge of 1% for Class C shares.
****The index for the Fund is the JP Morgan Corporate Emerging Markets Bond Index Broad Diversified.
Past performance does not guarantee future results. The performance data quoted represents past performance and current returns may be lower or higher. The investment return and net asset value will fluctuate so that an investor’s shares, when redeemed, may be worth more or less than the original cost. To obtain performance information current to the most recent month-end, please visit www.ashmoregroup.com. Periods greater than one year are annualised. Changes in rates of exchange between currencies may cause the value of investments to decrease or increase. The Fund’s performance will fluctuate over long and short term periods.
Please refer to page 5 herein for an explanation of the Expense Example information presented below.
| | | | | | | | | | | | | | |
| | | Expense Example |
| | | | | | | | | | | | | | |
| | | Actual Performance | | | | Hypothetical Performance |
| | | Institutional | | | | | | | | Institutional | | | | |
| | Class | | Class A | | Class C | | | | Class | | Class A | | Class C |
| | | | | | | |
Beginning Account Value
(11/01/2011) | | $1,000.00 | | $1,000.00 | | $1,000.00 | | | | $1,000.00 | | $1,000.00 | | $1,000.00 |
| | | | | | | |
Ending Account Value
(04/30/2012) | | $1,063.50 | | $1,062.00 | | $1,058.20 | | | | $1,019.05 | | $1,017.65 | | $1,013.92 |
| | | | | | | |
| Expense Ratio | | 1.17% | | 1.45% | | 2.20% | | | | 1.17% | | 1.45% | | 2.20% |
| | | | | | | |
| Expenses Paid† | | $6.00 | | $7.43 | | $11.26 | | | | $5.87 | | $7.27 | | $11.02 |
† Expenses are equal to the Fund’s annualized expenses ratio multiplied by the average account value over the period, multiplied by 182/366 (to reflect the one-half year period) Hypothetical expenses are based on the Fund’s actual annualized expense ratios and assumed rate of 5 percent per year before expenses.
Unaudited
|
Share Class Information Institutional Class Launch Date: December 8, 2010 Minimum Initial Investment:
$1,000,000 ISIN: US044825049 CUSIP: 044820504 BLOOMBERG: AEMCDBT US Retail Class A Launch Date: May 12, 2011 Minimum Initial Investment:
$1,000 ISIN: US0448206039 CUSIP: 044820603 BLOOMBERG: AEMCDBA US Retail Class C Launch Date: May 12, 2011 Minimum Initial Investment:
$1,000 ISIN: US0448207029 CUSIP: 044820702 BLOOMBERG: AEMCDBC US All sources are Ashmore unless
otherwise indicated |
7
Ashmore Emerging Markets Local Currency Bond Fund
Ashmore Emerging Markets Local Currency Bond Fund is an open-end U.S. mutual fund. The Fund seeks to achieve its objective by investing principally in debt instruments of Sovereign and Quasi-Sovereign issuers of Emerging Market Countries that are denominated in the local currency of the issuer.
Please refer to page 5 herein for an explanation of the information presented below in the Average Annual Total Return Table and Cumulative Return chart.
| | | | | | |
| Average Annual Total Return For The Period Ended April 30, 2012 | | 6 Months | | 1 Year | | Since Inception December 8, 2010 |
| | | |
| | | |
Ashmore Emerging Markets Local Currency Bond Fund Institutional Class | | 4.05% | | -2.08% | | 5.36% |
| | | |
Ashmore Emerging Markets Local Currency Bond Fund Retail Class A (load-waived)* | | 3.98% | | -2.24%** | | 5.14% |
| | | |
Ashmore Emerging Markets Local Currency Bond Fund Retail Class A (unadjusted)* | | -0.18% | | -6.15%** | | 2.10%*** |
| | | |
Ashmore Emerging Markets Local Currency Bond Fund Retail Class C (load-waived)* | | 3.60% | | -3.05%** | | 4.30% |
| | | |
Ashmore Emerging Markets Local Currency Bond Fund Retail Class C (unadjusted)* | | 2.56% | | -4.01%** | | 3.55%*** |
| | | |
JP Morgan GBI-EM GD**** | | 4.05% | | -0.28% | | 6.57% |
| | | | | | | | | | |
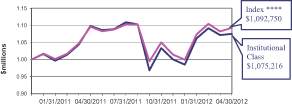
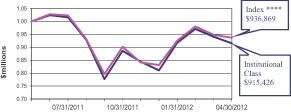
Cumulative Returns Through April 30, 2012 (% of net assets) | | | | | | Top 5 Country Exposures as of April 30, 2012 (% of NAV) | |
| | | | |
| | | | | | Mexico | | | 18.06 | % |
| | | | | Brazil | | | 11.96 | % |
| | | | | Russia | | | 11.23 | % |
| | | | | Malaysia | | | 10.27 | % |
| | | | | Thailand | | | 10.00 | % |
| | | | | Source: Ashmore. Top 5 country exposure based on aggregate allocation to investment instruments related to countries shown above | |
| | | | |
$1,000,000 invested at the beginning of the first full month following the inception of the Institutional Class. The minimum initial investment amount for Institutional Class, Shares is $1,000,000. The minimum initial investment amount for Retail Shares Classes A and C is $1,000.
All Fund returns are net of fees and expenses, except for the load-waived return information for Class A and Class C shares. calculations assume that all dividend and capital gain distributions were reinvested.
*For periods prior to the inception date of the Class A and Class C shares, performance information shown is based on the performance of the Fund’s Institutional Class shares, adjusted to reflect the distribution and/or service fees and other expenses paid by the Class A and Class C shares, respectively.
** Total return is calculated based on since inception of 05/12/2011.
*** Unadjusted Performance accounts for a maximum sales load of 4% for Class A shares and maximum deferred sales charge of 1% for Class C shares.
****The index for the Fund is the JP Morgan Global Bond Index — Emerging Markets Global Diversified.
Past performance does not guarantee future results. The performance data quoted represents past performance and current returns may be lower or higher. The investment return and net asset value will fluctuate so that an investor’s shares, when redeemed, may be worth more or less than the original cost. To obtain performance information current to the most recent month-end, please visit www.ashmoregroup.com. Periods greater than one year are annualised. Changes in rates of exchange between currencies may cause the value of investments to decrease or increase. The Fund’s performance will fluctuate over long and short term periods.
Please refer to page 5 herein for an explanation of the Expense Example information presented below.
| | | | | | | | | | | | | | | | | | | | | | | | | | |
| | | Expense Example | |
| | | | | | | | | | | | | | | | | | | | | | | | | | |
| | | Actual Performance | | | | | Hypothetical Performance | |
| | | Institutional | | | | | | | | | | | Institutional | | | | | | | |
| | | Class | | | | Class A | | | | Class C | | | | | | Class | | | | Class A | | | | Class C | |
| | | | | | | |
Beginning Account Value
(11/01/2011) | | | $1,000.00 | | | | $1,000.00 | | | | $1,000.00 | | | | | | $1,000.00 | | | | $1,000.00 | | | | $1,000.00 | |
| | | | | | | |
Ending Account Value
(04/30/2012) | | | $1,040.50 | | | | $1,039.80 | | | | $1,036.00 | | | | | | $1,020.04 | | | | $1,018.65 | | | | $1,014.92 | |
| | | | | | | |
| Expense Ratio | | | 0.97% | | | | 1.25% | | | | 2.00% | | | | | | 0.97% | | | | 1.25% | | | | 2.00% | |
| | | | | | | |
| Expenses Paid† | | | $4.92 | | | | $6.34 | | | | $10.12 | | | | | | $4.87 | | | | $6.27 | | | | $10.02 | |
† Expenses are equal to the Fund’s annualized expenses ratio multiplied by the average account value over the period, multiplied by 182/366 (to reflect the one-half year period) Hypothetical expenses are based on the Fund’s actual annualized expense ratios and assumed rate of 5 per cent per year before expenses.
Unaudited
|
Share Class Information Institutional Class Launch Date: December 8, 2010 Minimum Initial Investment:
$1,000,000 ISIN: US0448202079 CUSIP: 044820207 BLOOMBERG: ELBIX US TICKER: ELBIX Retail Class A Launch Date: May 12, 2011 Minimum Initial Investment: $1,000 ISIN: US0448208761 CUSIP: 044820876 BLOOMBERG: ELBAX US TICKER: ELBAX Retail Class C Launch Date: May 12, 2011 Minimum Initial Investment: $1,000 ISIN: US0448208688 CUSIP: 044820868 BLOOMBERG: ELBCX US TICKER: ELBCX All sources are Ashmore unless otherwise indicated |
8
Ashmore Emerging Markets Local Currency Fund
Ashmore Emerging Markets Local Currency Fund is an open-end U.S. mutual fund. The Fund seeks to achieve its objective by investing principally in derivatives and other instruments that mature in less than one year (“short-dated instruments”) and provide investment exposure to local currencies of Emerging Market Countries. The Fund also has the flexibility to invest in longer-dated derivative instruments. The Fund may also invest in debt instruments of any maturity issued by Sovereigns and Quasi-Sovereigns and denominated in the local currency of the issuer.
Please refer to page 5 herein for an explanation of the information presented below in the Average Annual Total Return Table and Cumulative Return chart.
| | | | | | |
| Average Annual Total Return For The Period Ended April 30, 2012 | | 6 Months | | 1 Year | | Since Inception December 8, 2010 |
| | | |
| | | |
Ashmore Emerging Markets Local Currency Fund Institutional Class | | 0.96% | | -7.28% | | 0.60% |
| | | |
Ashmore Emerging Markets Local Currency Fund Retail Class A (load-waived)* | | 0.75% | | -7.76%** | | 0.24% |
| | | |
Ashmore Emerging Markets Local Currency Fund Retail Class A (unadjusted)* | | -3.27% | | -11.45%** | | -2.72%*** |
| | | |
Ashmore Emerging Markets Local Currency Fund Retail Class C (load-waived)* | | 0.45% | | -8.34%** | | -0.49% |
| | | |
Ashmore Emerging Markets Local Currency Fund Retail Class C (unadjusted)* | | -0.56% | | -9.26%** | | -1.20%*** |
| | | |
JP Morgan ELMI+**** | | 1.28% | | -6.02% | | 1.43% |
| | | | | | | | | | |
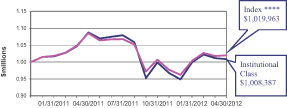
Cumulative Returns Through April 30, 2012 (% of net assets) | | | | | | Top 5 Country Exposures as of April 30, 2012 (% of NAV) | |
| | | | |
| | | | | | Mexico | | | 18.19 | % |
| | | | | Singapore | | | 10.54 | % |
| | | | | Poland | | | 7.14 | % |
| | | | | India | | | 5.93 | % |
| | | | | Thailand | | | 5.67 | % |
| | | | | Source: Ashmore. Top 5 country exposure based on aggregate allocation to investment instruments related to countries shown above | |
| | | | |
$1,000,000 invested at the beginning of the first full month following the inception of the Institutional Class. The minimum initial investment amount for Institutional Class, Shares is $1,000,000. The minimum initial investment amount for Retail Shares Classes A and C is $1,000.
All Fund returns are net of fees and expenses, except for the load-waived return information for Class A and Class C shares. Performance calculations assume that all dividend and capital gain distributions were reinvested.
*For periods prior to the inception date of the Class A and Class C shares, performance information shown is based on the performance of the Fund’s Institutional Class shares, adjusted to reflect the distribution and/or service fees and other expenses paid by the Class A and Class C shares, respectively.
** Total return is calculated based on since inception of 05/12/2011.
*** Unadjusted Performance accounts for a maximum sales load of 4% for Class A shares and maximum deferred sales charge of 1% for Class C shares.
****The index for the Fund is the JP Morgan Emerging Local Markets Index Plus.
Past performance does not guarantee future results. The performance data quoted represents past performance and current returns may be lower or higher. The investment return and net asset value will fluctuate so that an investor’s shares, when redeemed, may be worth more or less than the original cost. To obtain performance information current to the most recent month-end, please visit www.ashmoregroup.com. Periods greater than one year are annualised. Changes in rates of exchange between currencies may cause the value of investments to decrease or increase. The Fund’s performance will fluctuate over long and short term periods.
Please refer to page 5 herein for an explanation of the Expense Example information presented below.
| | | | | | | | | | | | | | | | | | | | | | | | | | |
| | | Expense Example | |
| | | | | | | | | | | | | | | | | | | | | | | | | | |
| | | Actual Performance | | | | | Hypothetical Performance | |
| | | Institutional | | | | | | | | | | | Institutional | | | | | | | |
| | | Class | | | | Class A | | | | Class C | | | | | | Class | | | | Class A | | | | Class C | |
| | | | | | | |
Beginning Account Value
(11/01/2011) | | | $1,000.00 | | | | $1,000.00 | | | | $1,000.00 | | | | | | $1,000.00 | | | | $1,000.00 | | | | $1,000.00 | |
| | | | | | | |
Ending Account Value
(04/30/2012) | | | $1,009.60 | | | | $1,007.50 | | | | $1,004.50 | | | | | | $1,020.54 | | | | $1,019.20 | | | | $1,015.42 | |
| | | | | | | |
| Expense Ratio | | | 0.87% | | | | 1.15% | | | | 1.90% | | | | | | 0.87% | | | | 1.15% | | | | 1.90% | |
| | | | | | | |
| Expenses Paid† | | | $4.35 | | | | $5.74 | | | | $9.47 | | | | | | $4.37 | | | | $5.79 | | | | $9.52 | |
† Expenses are equal to the Fund’s annualized expenses ratio multiplied by the average account value over the period, multiplied by 182/366 (to reflect the one-half year period) Hypothetical expenses are based on the Fund’s actual annualized expense ratios and assumed rate of 5 percent per year before expenses.
Unaudited
|
Share Class Information Institutional Class Launch Date: December 8, 2010 Minimum Initial Investment:
$1,000,000 ISIN: US0448201089 CUSIP: 044820108 BLOOMBERG: ECYIX US TICKER: ECYIX Retail Class A Launch Date: May 12, 2011 Minimum Initial Investment: $1,000 ISIN: US0448208019 CUSIP: 044820 801 BLOOMBERG: ECYAX US TICKER: ECYAX Retail Class C Launch Date: May 12, 2011 Minimum Initial Investment: $1,000 ISIN: US0448208845 CUSIP: 044820 884 BLOOMBERG: ECYCX US TICKER: ECYCX All sources are Ashmore unless otherwise indicated |
9
Ashmore Emerging Markets Sovereign Debt Fund
The Ashmore Emerging Markets Sovereign Debt Fund is an open-end U.S. mutual fund. The Fund seeks to achieve its objective by investing principally in debt instruments of Sovereign and Quasi-Sovereign issuers of Emerging Market Countries that are denominated in any Hard Currency.
Please refer to page 5 herein for an explanation of the information presented below in the Average Annual Total Return Table and Cumulative Return chart.
| | | | | | |
| Average Annual Total Return For The Period Ended April 30, 2012 | | 6 Months | | 1 Year | | Since Inception |
| | | | December 8, 2010 |
| | | |
Ashmore Emerging Markets Sovereign Debt Fund Institutional Class | | 6.52% | | 10.14% | | 7.75% |
| | | |
Ashmore Emerging Markets Sovereign Debt Fund Retail Class A (load-waived)* | | 6.33% | | 9.65%** | | 7.31% |
| | | |
Ashmore Emerging Markets Sovereign Debt Fund Retail Class A (unadjusted)* | | 2.07% | | 5.26%** | | 4.21%*** |
| | | |
Ashmore Emerging Markets Sovereign Debt Fund Retail Class C (load-waived)* | | 5.99% | | 8.90%** | | 6.55% |
| | | |
Ashmore Emerging Markets Sovereign Debt Fund Retail Class C (unadjusted)* | | 4.94% | | 7.81%** | | 5.79%*** |
| | | |
JP Morgan EMBI GD**** | | 6.20% | | 11.20% | | 9.02% |
| | | | | | | | | | |
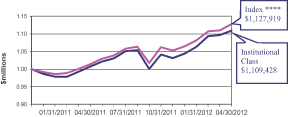
| Cumulative Returns Through April 30, 2012 (% of net assets) | | | | | | Top 5 Country Exposures as of April 30, 2012 (% of NAV) | |
| | | | |
| | | | | | Venezuela | | | 8.13 | % |
| | | | | Russia | | | 8.12 | % |
| | | | | Brazil | | | 7.86 | % |
| | | | | Mexico | | | 7.02 | % |
| | | | | Philippines | | | 6.55 | % |
| | | | | Source: Ashmore. Top 5 country exposure based on aggregate allocation to investment instruments related to countries shown above | |
| | | | |
$1,000,000 invested at the beginning of the first full month following the inception of the Institutional Class. The minimum initial investment amount for Institutional Class, Shares is $1,000,000. The minimum initial investment amount for Retail Shares Classes A and C is $1,000.
All Fund returns are net of fees and expenses, except for the load-waived return information for Class A and Class C shares. Performance calculations assume that all dividend and capital gain distributions were reinvested.
*For periods prior to the inception date of the Class A and Class C shares, performance information shown is based on the performance of the Fund’s Institutional Class shares, adjusted to reflect the distribution and/or service fees and other expenses paid by the Class A and Class C shares, respectively.
** Total return is calculated based on since inception of 05/12/2011.
*** Unadjusted Performance accounts for a maximum sales load of 4% for Class A shares and maximum deferred sales charge of 1% for Class C shares.
****The index for the Fund is the JP Morgan Emerging Markets Bond Index Global Diversified.
Past performance does not guarantee future results. The performance data quoted represents past performance and current returns may be lower or higher. The investment return and net asset value will fluctuate so that an investor’s shares, when redeemed, may be worth more or less than the original cost. To obtain performance information current to the most recent month-end, please visit www.ashmoregroup.com. Periods greater than one year are annualised. Changes in rates of exchange between currencies may cause the value of investments to decrease or increase. The Fund’s performance will fluctuate over long and short term periods.
Please refer to page 5 herein for an explanation of the Expense Example information presented below.
| | | | | | | | | | | | | | |
| | | Expense Example |
| | | | | | | | | | | | | | |
| | | Actual Performance | | | | Hypothetical Performance |
| | | Institutional | | | | | | | | Institutional | | | | |
| | Class | | Class A | | Class C | | | | Class | | Class A | | Class C |
| | | | | | | |
Beginning Account Value
(11/01/2011) | | $1,000.00 | | $1,000.00 | | $1,000.00 | | | | $1,000.00 | | $1,000.00 | | $1,000.00 |
| | | | | | | |
Ending Account Value
(04/30/2012) | | $1,065.20 | | $1,063.30 | | $1,059.90 | | | | $1,020.29 | | $1,018.90 | | $1,015.17 |
| | | | | | | |
| Expense Ratio | | 0.92% | | 1.20% | | 1.95% | | | | 0.92% | | 1.20% | | 1.95% |
| | | | | | | |
| Expenses Paid† | | $4.72 | | $6.16 | | $9.99 | | | | $4.62 | | $6.02 | | $9.77 |
† Expenses are equal to the Fund’s annualized expenses ratio multiplied by the average account value over the period, multiplied by 182/366 (to reflect the one-half year period) Hypothetical expenses are based on the Fund’s actual annualized expense ratios and assumed rate of 5 percent per year before expenses.
Unaudited
|
Share Class Information Institutional Class Launch Date: December 8, 2010 Minimum Initial Investment:
$1,000,000 ISIN: US0448203069 CUSIP: 044820306 BLOOMBERG: AEMSOVD US Retail Class A Launch Date: May 12, 2011 Minimum Initial Investment:
$1,000 ISIN: US0448208506 CUSIP: 044820850 BLOOMBERG: EAMSODA US Retail Class C Launch Date: May 12, 2011 Minimum Initial Investment:
$1,000 ISIN: US0448208431 CUSIP: 044820843 BLOOMBERG: AEMSODC US All sources are Ashmore unless
otherwise indicated |
10
Ashmore Emerging Markets Total Return Fund
The Ashmore Emerging Markets Total Return Fund is a daily dealing U.S. mutual fund. The Fund seeks to achieve its objective by investing principally in debt instruments of Sovereign, Quasi-Sovereign, and Corporate issuers, which may be denominated in any currency, including the local currency of the issuer.
Please refer to page 5 herein for an explanation of the information presented below in the Average Annual Total Return Table and Cumulative Return chart.
| | | | | | |
| Average Annual Total Return For The Period Ended April 30, 2012 | | 6 Months | | 1 Year | | Since Inception December 8, 2010 |
| | | |
| | | |
Ashmore Emerging Markets Total Return Fund Institutional Class | | 5.55% | | -0.11% | | 4.79% |
| | | |
Ashmore Emerging Markets Total Return Fund Retail Class A (load-waived)* | | 5.34% | | -0.40%** | | 4.49% |
| | | |
Ashmore Emerging Markets Total Return Fund Retail Class A (unadjusted)* | | 1.11% | | -4.38%** | | 1.48%*** |
| | | |
Ashmore Emerging Markets Total Return Fund Retail Class C (load-waived)* | | 5.00% | | -1.15%** | | 3.71% |
| | | |
Ashmore Emerging Markets Total Return Fund Retail Class C (unadjusted)* | | 3.94% | | -2.14%** | | 2.96%*** |
| | | |
50/25/25 Composite Benchmark**** | | 4.47% | | 3.86% | | 6.55% |
| | | | | | | | | | |
Cumulative Returns Through April 30, 2012 (% of net assets) | | | | | | Top 5 Country Exposures as of April 30, 2012 (% of NAV) | |
| | | | |
| | | | | | Brazil | | | 11.55 | % |
| | | | | Mexico | | | 8.10 | % |
| | | | | Russia | | | 6.28 | % |
| | | | | United Arab Emirates | | | 5.89 | % |
| | | | | China | | | 5.06 | % |
| | | | | Source: Ashmore. Top 5 country exposure based on aggregate allocation to investment instruments related to countries shown above | |
| | | | |
$1,000,000 invested at the beginning of the first full month following the inception of the Institutional Class. The minimum initial investment amount for Institutional Class, Shares is $1,000,000. The minimum initial investment amount for Retail Shares Classes A and C is $1,000.
All Fund returns are net of fees and expenses, except for the load-waived return information for Class A and Class C shares. Performance calculations assume that all dividend and capital gain distributions were reinvested.
*For periods prior to the inception date of the Class A and Class C shares, performance information shown is based on the performance of the Fund’s Institutional Class shares, adjusted to reflect the distribution and/or service fees and other expenses paid by the Class A and Class C shares, respectively.
** Total return is calculated based on since inception of 05/12/2011.
*** Unadjusted Performance accounts for a maximum sales load of 4% for Class A shares and maximum deferred sales charge of 1% for Class C shares.
****The index for the Fund is 50% JP Morgan Emerging Markets Bond Index, 25% JP Morgan Emerging Local Markets Index +, 25% JPMorgan Global Bond Index-Emerging Markets Global Diversified.
Past performance does not guarantee future results. The performance data quoted represents past performance and current returns may be lower or higher. The investment return and net asset value will fluctuate so that an investor’s shares, when redeemed, may be worth more or less than the original cost. To obtain performance information current to the most recent month-end, please visit www.ashmoregroup.com. Periods greater than one year are annualised. Changes in rates of exchange between currencies may cause the value of investments to decrease or increase. The Fund’s performance will fluctuate over long and short term periods.
Please refer to page 5 herein for an explanation of the Expense Example information presented below.
| | | | | | | | | | | | | | | | | | | | | | | | | | |
| | | Expense Example | |
| | | | | | | | | | | | | | | | | | | | | | | | | | |
| | | Actual Performance | | | | | Hypothetical Performance | |
| | | Institutional | | | | | | | | | | | Institutional | | | | | | | |
| | | Class | | | | Class A | | | | Class C | | | | | | Class | | | | Class A | | | | Class C | |
| | | | | | | |
Beginning Account Value
(11/01/2011) | | | $1,000.00 | | | | $1,000.00 | | | | $1,000.00 | | | | | | $1,000.00 | | | | $1,000.00 | | | | $1,000.00 | |
| | | | | | | |
Ending Account Value
(04/30/2012) | | | $1,055.50 | | | | $1,053.40 | | | | $1,050.00 | | | | | | $1,019.79 | | | | $1,018.40 | | | | $1,014.67 | |
| | | | | | | |
| Expense Ratio | | | 1.02% | | | | 1.30% | | | | 2.05% | | | | | | 1.02% | | | | 1.30% | | | | 2.05% | |
| | | | | | | |
| Expenses Paid† | | | $5.21 | | | | $6.64 | | | | $10.45 | | | | | | $5.12 | | | | $6.52 | | | | $10.27 | |
† Expenses are equal to the Fund’s annualized expenses ratio multiplied by the average account value over the period, multiplied by 182/366 (to reflect the one-half year period) Hypothetical expenses are based on the Fund’s actual annualized expense ratios and assumed rate of 5 per cent per year before expenses.
Unaudited
|
Share Class Information Institutional Class Launch Date: December 8, 2010 Minimum Initial Investment:
$1,000,000 ISIN: US0448204059 CUSIP: 044820405 BLOOMBERG: EMKIX US TICKER: EMKIX Retail Class A Launch Date: May 12, 2011 Minimum Initial Investment: $1,000 ISIN: US0448208357 CUSIP: 044820835 BLOOMBERG: EMKAX US TICKER: EMKAX Retail Class C Launch Date: May 12, 2011 Minimum Initial Investment: $1,000 ISIN: US0448208274 CUSIP: 044820827 BLOOMBERG: EMKCX US TICKER: EMKCX All sources are Ashmore unless otherwise indicated |
11
Ashmore Emerging Markets Equity Fund
Ashmore Emerging Markets Equity Fund is an open-end U.S. mutual fund. The Fund seeks to achieve its objective by investing principally in equity securities and equity-related investments of Emerging Market issuers which may be denominated in any currency, including the local currency of the issuer.
Please refer to page 5 herein for an explanation of the information presented below in the Average Annual Total Return Table and Cumulative Return chart.
| | | | |
| Average Annual Total Return For The Period Ended April 30, 2012 | | 6 Months | | Since Inception |
| | | June 22, 2011 |
| | |
Ashmore Emerging Markets Equity Fund Institutional Class | | 3.29% | | -8.46% |
| | |
Ashmore Emerging Markets Equity Fund Retail Class A (load-waived)* | | -5.09%** | | -8.87% |
| | |
Ashmore Emerging Markets Equity Fund Retail Class A (unadjusted)* | | -5.76%** | | -12.52%*** |
| | |
MSCI EM NET**** | | 3.93% | | -6.32% |
| | | | | | | | |
Cumulative Returns Through April 30, 2012 (% of net assets) | | | | Top 5 Country Exposures as of April 30, 2012 (% of NAV) | |
| | | |
| | | | China | | | 19.95 | % |
| | | | South Korea | | | 18.63 | % |
| | | | Brazil | | | 16.41 | % |
| | | | Taiwan | | | 10.95 | % |
| | | | Russia | | | 8.39 | % |
| | | | | | | | |
| | | | Source: Ashmore. Top 5 country exposure based on aggregate allocation to investment instruments related to countries shown above | |
| | | |
$1,000,000 invested at the beginning of the first full month following the inception of the Institutional Class. The minimum initial investment amount for Institutional Class, Shares is $1,000,000. The minimum initial investment amount for Retail Shares Class A is $1,000.
All Fund returns are net of fees and expenses. except for the load-waived return information for Class A shares. Performance calculations assume that all dividend and capital gain distributions were reinvested.
*For periods prior to the inception date of the Class A shares, performance information shown is based on the performance of the Fund’s Institutional Class shares, adjusted to reflect the distribution and/or service fees and other expenses paid by the Class A shares.
**Total return is calculated based on since inception of 02/27/2012
***Unadjusted Performance accounts for a maximum sales load of 4% for Class A shares.
****The index for the Fund is the Morgan Stanley Capital Index Emerging Markets Net.
Past performance does not guarantee future results. The performance data quoted represents past performance and current returns may be lower or higher. The investment return and net asset value will fluctuate so that an investor’s shares, when redeemed, may be worth more or less than the original cost. To obtain performance information current to the most recent month-end, please visit www.ashmoregroup.com. Periods greater than one year are annualised. Changes in rates of exchange between currencies may cause the value of investments to decrease or increase. The Fund has been in existence for less than one year; cumulative performance may not be indicative of the Fund’s long-term potential. The Fund’s performance will fluctuate over long and short term periods.
| | | | | | | | | | |
| | | Expense Example |
| | | | | | | | | | |
| | | |
| | | Actual Performance | | | | Hypothetical Performance |
| | | Institutional | | | | | | Institutional | | |
| | Class | | Class A | | | | Class | | Class A |
| | | | | |
Beginning Account Value*
(11/01/2011) | | $1,000.00 | | $1,000.00 | | | | $1,000.00 | | $1,000.00 |
| | | | | |
Ending Account Value
(04/30/2012) | | $1,032.90 | | $949.10 | | | | $1,019.05 | | $1,006.21 |
| | | | | |
| Expense Ratio | | 1.17% | | 1.45% | | | | 1.17% | | 1.45% |
| | | | | |
| Expenses Paid† | | $5.91 | | $2.47 | | | | $5.87 | | $2.54 |
* Beginning account value for Institutional Class dated 11/01/2011. Beginning account value for Class A dated 02/27/2012.
† Expenses are equal to the Fund’s annualized expenses ratio multiplied by the average account value over the period, multiplied by 182/366 for Institutional Class (to reflect the one-half year period) and 64/366 for Class A (to reflect the period since inception date of 2/27/2012 for Class A shores). The Fund’s Class A hypothetical expenses reflect an amount as if the class has been in operation for the entire fiscal half year. Hypothetical expenses are based on the Fund’s actual annualized expense ratios and assumed rate of 5 per cent per year before expenses.
Unaudited
|
Share Class Information Institutional Class Launch Date: June 22, 2011 Minimum Initial Investment:
$1,000,000 ISIN: US0448208191 CUSIP: 044820819 BLOOMBERG: ASEMEIN US Retail Class A Launch Date: February 27, 2012 Minimum Initial Investment:
$1,000 ISIN: US0448207771 CUSIP: 044820777 TICKER: EMEAX All sources are Ashmore unless otherwise indicated |
12
Ashmore Emerging Markets Small-Cap Equity Fund
Ashmore Emerging Markets Small-Cap Equity Fund is an open-end U.S. mutual fund. The Fund seeks to achieve its objective by investing principally in equity securities and equity-related investments of Small-Capitalization Emerging Market Issuers, which may be denominated in any currency, including the local currency of the issuer. The Fund currently defines a Small-Capitalization issuer as an issuer with a market capitalization of $2 billion or less at the time of investment.
Please refer to page 5 herein for an explanation of the information presented below in the Average Annual Total Return Table and Cumulative Return chart.
| | | | |
| Average Annual Total Return For The Period Ended April 30, 2012 | | 6 Months | | Since Inception |
| | | October 4, 2011 |
| | |
Ashmore Emerging Markets Small-Cap Equity Fund Institutional Class | | 5.93% | | 22.67% |
| | |
Ashmore Emerging Markets Small-Cap Equity Fund Retail Class A (load-waived)* | | 1.60%** | | 22.49% |
| | |
Ashmore Emerging Markets Small-Cap Equity Fund Retail Class A (unadjusted)* | | 0.62%** | | 17.59%*** |
| | |
MSCI EM Small Cap NET**** | | 3.58% | | 16.96% |
| | | | | | | | |
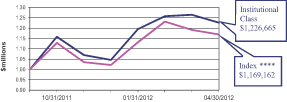
Cumulative Returns Through April 30, 2012 (% of net assets) | | | | Top 5 Country Exposures as of April 30, 2012 (% of NAV) | |
| | | |
| | | | China | | | 23.95 | % |
| | | | South Korea | | | 14.59 | % |
| | | | Brazil | | | 14.02 | % |
| | | | Taiwan | | | 11.89 | % |
| | | | India | | | 8.10 | % |
| | | | Source: Ashmore. Top 5 country exposure based on aggregate allocation to investment instruments related to countries shown above | |
| | | |
$1,000,000 invested at the beginning of the first full month following the inception of the Institutional Class. The minimum initial investment amount for Institutional Class, Shares is $1,000,000. The minimum initial investment amount for Retail Shares Class A is $1,000.
All Fund returns are net of fees and expenses except for the load-waived return information for Class A shares. Performance calculations assume that all dividend and capital gain distributions were reinvested.
*For periods prior to the inception date of the Class A shares, performance information shown is based on the performance of the Fund’s Institutional Class shares, adjusted to reflect the distribution and/or service fees and other expenses paid by the Class A shares.
** Total return is calculated based on since inception of 02/01/2012
*** Unadjusted Performance accounts for a maximum sales load of 4% for Class A shares.
****The index for the Fund is the Morgan Stanley Capital Index Emerging Markets Small-Cap
Past performance does not guarantee future results. The performance data quoted represents past performance and current returns may be lower or higher. The investment return and net asset value will fluctuate so that an investor’s shares, when redeemed, may be worth more or less than the original cost. To obtain performance information current to the most recent month-end, please visit www.ashmoregroup.com. Periods greater than one year are annualised. Changes in rates of exchange between currencies may cause the value of investments to decrease or increase. The Fund has been in existence for less than one year; cumulative performance may not be indicative of the Fund’s long-term potential. The Fund’s performance will fluctuate over long and short term periods.
| | | | | | | | | | |
| | | Expense Example |
| | | | | | | | | | |
| | |
| | | Actual Performance | | Hypothetical Performance |
| | | Institutional | | | | | | Institutional | | |
| | Class | | Class A | | | | Class | | Class A |
| | | | | |
Beginning Account Value*
(11/01/2011) | | $1,000.00 | | $1,000.00 | | | | $1,000.00 | | $1,000.00 |
| | | | | |
Ending Account Value
(04/30/2012) | | $1,059.30 | | $1,016.00 | | | | $1,017.30 | | $1,007.78 |
| | | | | |
| Expense Ratio | | 1.52% | | 1.80% | | | | 1.52% | | 1.80% |
| | | | | |
| Expenses Paid† | | $7.78 | | $4.41 | | | | $7.62 | | $4.39 |
* Beginning account value for Institutional Class dated 11/01/2011. Beginning account value for Class A dated 02/01/2012.
† Expenses are equal to the Fund’s annualized expenses ratio multiplied by the average account value over the period, multiplied by 182/366 for Institutional Class (to reflect the one-half year period) and 89/366 for Class A (to reflect the period since inception date of 2/1/2012 for Class A shares). The Fund’s Class A hypothetical expenses reflect an amount as if the class has been in operation for the entire fiscal half year. Hypothetical expenses are based on the Fund’s actual annualized expense ratios and assumed rate of 5 per cent per year before expenses.
Unaudited
|
Share Class Information Institutional Class Launch Date: October 4, 2011 Minimum Initial Investment:
$1,000,000 ISIN: US0448201162 CUSIP: 044820116 Retail Class A Launch Date: February 1, 2012 Minimum Initial Investment:
$1,000 ISIN: US0448207938 CUSIP: 044820793 TICKER: ESSAX
All sources are Ashmore unless otherwise indicated |
13
ASHMORE FUNDS
STATEMENTS OF ASSETS AND LIABILITIES
As of April 30, 2012 (Unaudited)
| | | | | | | | | | |
| | | Ashmore Emerging Markets Corporate Debt Fund | | Ashmore Emerging Markets Local Currency Bond Fund |
ASSETS: | | | | | | | | | | |
Investments in securities, at value | | | $ | 13,750,307 | | | | $ | 63,744,478 | |
Investments in fully funded total return swaps, at value | | | | — | | | | | 5,343,704 | |
Cash | | | | 509,181 | | | | | 5,583,520 | |
Foreign currency, at value | | | | 1,390 | | | | | 75,661 | |
Unrealized appreciation on interest rate swap contracts | | | | — | | | | | 346,911 | |
Unrealized appreciation on forward foreign currency exchange contracts | | | | 225 | | | | | 511,304 | |
Receivable for securities and currencies sold | | | | — | | | | | 2,549,885 | |
Receivable for fund shares sold | | | | — | | | | | 218,952 | |
Receivable from Investment Manager | | | | 16,478 | | | | | 23,552 | |
Interest and dividends receivable | | | | 243,439 | | | | | 906,809 | |
Tax reclaims receivable | | | | — | | | | | 8,149 | |
Other assets | | | | 18,792 | | | | | 24,244 | |
Total Assets | | | | 14,539,812 | | | | | 79,337,169 | |
LIABILITIES: | | | | | | | | | | |
Unrealized depreciation on interest rate swap contracts | | | | — | | | | | — | |
Unrealized depreciation on forward foreign currency exchange contracts | | | | 12,300 | | | | | 468,444 | |
Payable for securities and currencies purchased | | | | 200,000 | | | | | 11,211,505 | |
Payable for when-issued securities | | | | — | | | | | — | |
Redemptions payable | | | | — | | | | | — | |
Distributions payable | | | | 18,163 | | | | | 49,340 | |
Investment Manager fee payable | | | | 13,708 | | | | | 53,742 | |
Trustees’ fees payable | | | | 1,214 | | | | | 1,214 | |
Variation margin payable | | | | — | | | | | 781 | |
Other liabilities | | | | 67,735 | | | | | 81,985 | |
Total Liabilities | | | | 313,120 | | | | | 11,867,011 | |
Net Assets | | | $ | 14,226,692 | | | | $ | 67,470,158 | |
NET ASSETS: | | | | | | | | | | |
Paid in capital | | | $ | 14,683,091 | | | | $ | 66,844,434 | |
Undistributed (distributions in excess of) net investment income (loss) | | | | 31,231 | | | | | (383,792 | ) |
Accumulated net realized gain (loss) | | | | 122,928 | | | | | (147,995 | ) |
Net unrealized appreciation (depreciation) | | | | (610,558 | ) | | | | 1,157,511 | |
Net Assets | | | $ | 14,226,692 | | | | $ | 67,470,158 | |
| | | | | | | | | | | |
Net Assets: | | | | | | | | | | |
Class A | | | $ | 1,003 | | | | $ | 291,931 | |
Class C | | | | 996 | | | | | 994 | |
Institutional Class | | | | 14,224,693 | | | | | 67,177,233 | |
| | | | | | | | | | | |
Shares Issued and Outstanding (no par value, unlimited shares authorized): | | | | | | | | | | |
Class A | | | | 109 | | | | | 30,285 | |
Class C | | | | 108 | | | | | 103 | |
Institutional Class | | | | 1,484,396 | | | | | 6,733,675 | |
| | | | | | | | | | | |
Net Asset Value and Redemption Price Per Share (Net Asset Per Share Outstanding): | | | | | | | | | | |
Class A | | | $ | 9.23 | | | | $ | 9.64 | |
Class C | | | | 9.23 | | | | | 9.63 | |
Institutional Class | | | | 9.58 | | | | | 9.98 | |
Cost of Investments in securities | | | $ | 14,348,280 | | | | $ | 63,286,299 | |
Cost of Investments in fully funded total return swaps | | | $ | — | | | | $ | 5,006,652 | |
Cost of Foreign currency held | | | $ | 1,385 | | | | $ | 59,241 | |
See accompanying notes to the financial statements.
14
| | | | | | | | | | | | | | | | | | | | | | | |
Ashmore Emerging Markets Local Currency Fund | | Ashmore Emerging Markets Sovereign Debt Fund | | Ashmore Emerging Markets Total Return Fund | | Ashmore Emerging Markets Equity Fund | | Ashmore Emerging Markets Small-Cap Equity Fund |
| | | | | | | | | | | | | | | | | | | | | | | | |
| | $ | 45,701,099 | | | | $ | 31,634,721 | | | | $ | 167,570,617 | | | | $ | 8,993,780 | | | | $ | 12,279,535 | |
| | | — | | | | | — | | | | | 847,903 | | | | | — | | | | | — | |
| | | 13,758,579 | | | | | 668,151 | | | | | 5,969,668 | | | | | 136,431 | | | | | 133,091 | |
| | | 37 | | | | | 11 | | | | | 19,940 | | | | | 23,202 | | | | | 8,411 | |
| | | — | | | | | — | | | | | 128,968 | | | | | — | | | | | — | |
| | | 628,272 | | | | | — | | | | | 668,445 | | | | | — | | | | | — | |
| | | 7,223 | | | | | — | | | | | 9,668 | | | | | 67,050 | | | | | — | |
| | | — | | | | | — | | | | | — | | | | | — | | | | | — | |
| | | 19,099 | | | | | 18,271 | | | | | 28,301 | | | | | 20,520 | | | | | 21,141 | |
| | | 913 | | | | | 469,291 | | | | | 2,282,175 | | | | | 14,685 | | | | | 6,788 | |
| | | — | | | | | — | | | | | — | | | | | — | | | | | — | |
| | | 25,885 | | | | | 20,381 | | | | | 36,604 | | | | | 25,528 | | | | | 23,231 | |
| | | 60,141,107 | | | | | 32,810,826 | | | | | 177,562,289 | | | | | 9,281,196 | | | | | 12,472,197 | |
| | | | | | | | | | | | | | | | | | | | | | | | |
| | | — | | | | | — | | | | | 3,643 | | | | | — | | | | | — | |
| | | 483,123 | | | | | 762 | | | | | 362,873 | | | | | — | | | | | — | |
| | | 284,149 | | | | | 198,944 | | | | | 18,569,391 | | | | | 82,099 | | | | | — | |
| | | — | | | | | — | | | | | 197,262 | | | | | — | | | | | — | |
| | | — | | | | | — | | | | | 3,520 | | | | | — | | | | | — | |
| | | — | | | | | 24,399 | | | | | 123,083 | | | | | — | | | | | — | |
| | | 41,487 | | | | | 24,068 | | | | | 129,323 | | | | | 8,702 | | | | | 15,371 | |
| | | 1,214 | | | | | 1,214 | | | | | 1,214 | | | | | 1,214 | | | | | 1,333 | |
| | | — | | | | | 6,875 | | | | | 14,594 | | | | | — | | | | | — | |
| | | 71,867 | | | | | 67,328 | | | | | 92,606 | | | | | 53,773 | | | | | 91,614 | |
| | | 881,840 | | | | | 323,590 | | | | | 19,497,509 | | | | | 145,788 | | | | | 108,318 | |
| | $ | 59,259,267 | | | | $ | 32,487,236 | | | | $ | 158,064,780 | | | | $ | 9,135,408 | | | | $ | 12,363,879 | |
| | | | | | | | | | | | | | | | | | | | | | | | |
| | $ | 58,234,137 | | | | $ | 31,054,257 | | | | $ | 158,151,062 | | | | $ | 10,052,651 | | | | $ | 10,135,177 | |
| | | 5,694 | | | | | (23,556 | ) | | | | 147,263 | | | | | 12,118 | | | | | (17,596 | ) |
| | | 928,342 | | | | | 84,583 | | | | | (300,439 | ) | | | | (1,034,242 | ) | | | | 1,029,209 | |
| | | 91,094 | | | | | 1,371,952 | | | | | 66,894 | | | | | 104,881 | | | | | 1,217,089 | |
| | $ | 59,259,267 | | | | $ | 32,487,236 | | | | $ | 158,064,780 | | | | $ | 9,135,408 | | | | $ | 12,363,879 | |
| | | | | | | | | | | | | | | | | | | | | | | | |
| | | | | | | | | | | | | | | | | | | | | | | | |
| | $ | 946 | | | | $ | 1,087 | | | | $ | 616,546 | | | | $ | 949 | | | | $ | 98,033 | |
| | | 940 | | | | | 1,079 | | | | | 999 | | | | | — | | | | | — | |
| | | 59,257,381 | | | | | 32,485,070 | | | | | 157,447,235 | | | | | 9,134,459 | | | | | 12,265,846 | |
| | | | | | | | | | | | | | | | | | | | | | | | |
| | | | | | | | | | | | | | | | | | | | | | | | |
| | | 100 | | | | | 104 | | | | | 64,087 | | | | | 100 | | | | | 9,653 | |
| | | 100 | | | | | 104 | | | | | 104 | | | | | — | | | | | — | |
| | | 6,278,986 | | | | | 3,125,292 | | | | | 16,134,726 | | | | | 1,006,477 | | | | | 1,003,639 | |
| | | | | | | | | | | | | | | | | | | | | | | | |
| | | | | | | | | | | | | | | | | | | | | | | | |
| | $ | 9.44 | | | | $ | 10.43 | | | | $ | 9.62 | | | | $ | 9.49 | | | | $ | 10.16 | |
| | | 9.38 | | | | | 10.43 | | | | | 9.61 | | | | | — | | | | | — | |
| | | 9.44 | | | | | 10.39 | | | | | 9.76 | | | | | 9.08 | | | | | 12.22 | |
| | $ | 45,754,545 | | | | $ | 30,083,284 | | | | $ | 167,454,009 | | | | $ | 8,888,882 | | | | $ | 11,062,429 | |
| | $ | — | | | | $ | — | | | | $ | 939,404 | | | | $ | — | | | | $ | — | |
| | $ | 37 | | | | $ | 11 | | | | $ | 20,809 | | | | $ | 23,029 | | | | $ | 8,314 | |
See accompanying notes to the financial statements.
15
ASHMORE FUNDS
STATEMENTS OF OPERATIONS
For the Six Months Ended April 30, 2012 (Unaudited)
| | | | | | | | | | |
| | | Ashmore Emerging Markets Corporate Debt Fund | | Ashmore Emerging Markets Local Currency Bond Fund |
INVESTMENT INCOME: | | | | | | | | | | |
Interest, net of foreign tax withholdings* | | | $ | 584,641 | | | | $ | 1,434,761 | |
Dividends, net of foreign tax withholdings* | | | | — | | | | | — | |
Total Income | | | | 584,641 | | | | | 1,434,761 | |
EXPENSES: | | | | | | | | | | |
Investment Manager fees | | | | 72,874 | | | | | 299,077 | |
Administration fees | | | | 2,535 | | | | | 12,593 | |
Custody fees | | | | 2,218 | | | | | 17,315 | |
Professional fees | | | | 45,783 | | | | | 45,783 | |
Trustees’ fees | | | | 12,497 | | | | | 12,497 | |
Offering expenses and registration fees | | | | 18,717 | | | | | 20,666 | |
Insurance fees | | | | 4,995 | | | | | 4,995 | |
Printing fees | | | | 7,085 | | | | | 7,085 | |
Transfer agent fees - Institutional Class | | | | 359 | | | | | 359 | |
Distribution fees - Class A | | | | 1 | | | | | 354 | |
Distribution fees - Class C | | | | 5 | | | | | 5 | |
Other | | | | 5,010 | | | | | 6,827 | |
Total Expenses | | | | 172,079 | | | | | 427,556 | |
Less expenses reimbursed by the Investment Manager | | | | (97,931 | ) | | | | (122,439 | ) |
Net Expenses | | | | 74,148 | | | | | 305,117 | |
Net Investment Income (Loss) | | | | 510,493 | | | | | 1,129,644 | |
NET REALIZED AND UNREALIZED GAINS (LOSSES): | | | | | | | | | | |
NET REALIZED GAIN (LOSS) ON: | | | | | | | | | | |
Investments in securities | | | | 81,925 | | | | | (752,534 | ) |
Forward foreign currency exchange contracts | | | | 42,423 | | | | | 268,907 | |
Futures contracts | | | | — | | | | | (10 | ) |
Interest rate swap contracts | | | | — | | | | | 247,819 | |
Foreign exchange transactions | | | | (1,420 | ) | | | | 114,649 | |
NET CHANGE IN UNREALIZED APPRECIATION (DEPRECIATION) ON: | | | | | | | | | | |
Investments in securities | | | | 171,083 | | | | | 1,428,516 | |
Forward foreign currency exchange contracts | | | | 34,947 | | | | | (79,436 | ) |
Futures contracts | | | | — | | | | | (42,103 | ) |
Investments in fully funded total return swaps | | | | — | | | | | (42,178 | ) |
Interest rate swap contracts | | | | — | | | | | (17,041 | ) |
Foreign exchange translations | | | | 326 | | | | | 41,940 | |
Net Realized and Unrealized Gains (Losses) | | | | 329,284 | | | | | 1,168,529 | |
Net Increase in Net Assets Resulting from Operations | | | $ | 839,777 | | | | $ | 2,298,173 | |
* Foreign tax withholdings | | | $ | 674 | | | | $ | — | |
See accompanying notes to the financial statements.
16
| | | | | | | | | | | | | | | | | | | | | | | |
Ashmore Emerging Markets Local Currency Fund | | Ashmore Emerging Markets Sovereign Debt Fund | | Ashmore Emerging Markets Total Return Fund | | Ashmore Emerging Markets Equity Fund | | Ashmore Emerging Markets Small-Cap Equity Fund |
| | | | | | | | | | | | | | | | | | | | | | | | |
| | $ | 40,046 | | | | $ | 873,628 | | | | $ | 4,035,686 | | | | $ | 33 | | | | $ | — | |
| | | — | | | | | — | | | | | — | | | | | 65,404 | | | | | 72,060 | |
| | | 40,046 | | | | | 873,628 | | | | | 4,035,686 | | | | | 65,437 | | | | | 72,060 | |
| | | | | | | | | | | | | | | | | | | | | | | | |
| | | 210,884 | | | | | 139,757 | | | | | 630,673 | | | | | 51,178 | | | | | 87,572 | |
| | | 9,924 | | | | | 6,211 | | | | | 25,227 | | | | | 1,780 | | | | | 2,335 | |
| | | 8,684 | | | | | 5,435 | | | | | 25,227 | | | | | 2,003 | | | | | 2,627 | |
| | | 45,784 | | | | | 45,784 | | | | | 45,784 | | | | | 45,711 | | | | | 48,241 | |
| | | 12,497 | | | | | 12,497 | | | | | 12,497 | | | | | 12,497 | | | | | 12,438 | |
| | | 19,287 | | | | | 19,387 | | | | | 25,182 | | | | | 44,039 | | | | | 43,077 | |
| | | 4,995 | | | | | 4,995 | | | | | 4,995 | | | | | 5,211 | | | | | 5,087 | |
| | | 7,085 | | | | | 7,085 | | | | | 6,428 | | | | | 7,032 | | | | | 6,647 | |
| | | 359 | | | | | 359 | | | | | 359 | | | | | 359 | | | | | 359 | |
| | | 1 | | | | | 1 | | | | | 706 | | | | | — | | | | | 61 | |
| | | 5 | | | | | 5 | | | | | 5 | | | | | — | | | | | — | |
| | | 5,581 | | | | | 7,323 | | | | | 9,788 | | | | | 5,459 | | | | | 5,281 | |
| | | 325,086 | | | | | 248,839 | | | | | 786,871 | | | | | 175,269 | | | | | 213,725 | |
| | | (109,233 | ) | | | | (105,970 | ) | | | | (143,665 | ) | | | | (123,221 | ) | | | | (125,003 | ) |
| | | 215,853 | | | | | 142,869 | | | | | 643,206 | | | | | 52,048 | | | | | 88,722 | |
| | | (175,807 | ) | | | | 730,759 | | | | | 3,392,480 | | | | | 13,389 | | | | | (16,662 | ) |
| | | | | | | | | | | | | | | | | | | | | | | | |
| | | | | | | | | | | | | | | | | | | | | | | | |
| | | (218,487 | ) | | | | 86,625 | | | | | (953,275 | ) | | | | (172,928 | ) | | | | 1,044,120 | |
| | | 1,151,982 | | | | | 9,089 | | | | | 808,611 | | | | | 179 | | | | | (146 | ) |
| | | — | | | | | (103 | ) | | | | (218 | ) | | | | — | | | | | — | |
| | | — | | | | | — | | | | | 177,616 | | | | | — | | | | | — | |
| | | (739 | ) | | | | — | | | | | 31,491 | | | | | (695 | ) | | | | (9,483 | ) |
| | | | | | | | | | | | | | | | | | | | | | | | |
| | | 200,760 | | | | | 1,352,203 | | | | | 4,120,184 | | | | | 446,703 | | | | | (325,944 | ) |
| | | 499,638 | | | | | (262 | ) | | | | 530,683 | | | | | — | | | | | — | |
| | | — | | | | | (178,728 | ) | | | | (378,815 | ) | | | | — | | | | | — | |
| | | — | | | | | — | | | | | (33,123 | ) | | | | — | | | | | — | |
| | | — | | | | | — | | | | | 4,769 | | | | | — | | | | | — | |
| | | (609 | ) | | | | (15 | ) | | | | 3,873 | | | | | (606 | ) | | | | (4 | ) |
| | | 1,632,545 | | | | | 1,268,809 | | | | | 4,311,796 | | | | | 272,653 | | | | | 708,543 | |
| | $ | 1,456,738 | | | | $ | 1,999,568 | | | | $ | 7,704,276 | | | | $ | 286,042 | | | | $ | 691,881 | |
| | $ | — | | | | $ | 358 | | | | $ | 14,831 | | | | $ | 5,761 | | | | $ | 2,539 | |
See accompanying notes to the financial statements.
17
ASHMORE FUNDS
STATEMENTS OF CHANGES IN NET ASSETS
For the Six Months Ended April 30, 2012 (Unaudited) and the Fiscal Period Ended October 31, 2011
| | | | | | | | | | | | | | | | |
| | | Ashmore Emerging Markets Corporate Debt Fund | | | Ashmore Emerging Markets Local Currency Bond Fund | |
| | | 2012 | | | 20111 | | | 2012 | | | 20111 | |
INCREASE (DECREASE) IN NET ASSETS FROM: OPERATIONS: | | | | | | | | | | | | | | | | |
Net investment income (loss) | | $ | 510,493 | | | $ | 710,945 | | | $ | 1,129,644 | | | $ | 1,282,157 | |
Net realized gain (loss) | | | 122,928 | | | | 64,793 | | | | (121,169 | ) | | | (121,063 | ) |
Net change in unrealized appreciation (depreciation) | | | 206,356 | | | | (816,914 | ) | | | 1,289,698 | | | | (132,187 | ) |
Net Increase (Decrease) in Net Assets Resulting from Operations | | | 839,777 | | | | (41,176 | ) | | | 2,298,173 | | | | 1,028,907 | |
| | | | |
DISTRIBUTIONS TO CLASS A SHAREHOLDERS: | | | | | | | | | | | | | | | | |
From net investment income | | | (37 | ) | | | (37 | ) | | | (4,856 | ) | | | (416 | ) |
From net realized gain | | | (5 | ) | | | — | | | | — | | | | — | |
Tax return of capital | | | — | | | | — | | | | — | | | | (272 | ) |
| | | | | | | | | | | | | | | | |
Total distributions to Class A shareholders | | | (42 | ) | | | (37 | ) | | | (4,856 | ) | | | (688 | ) |
DISTRIBUTIONS TO CLASS C SHAREHOLDERS: | | | | | | | | | | | | | | | | |
From net investment income | | | (33 | ) | | | (34 | ) | | | (13 | ) | | | (11 | ) |
From net realized gain | | | (5 | ) | | | — | | | | — | | | | — | |
Tax return of capital | | | — | | | | — | | | | — | | | | (8 | ) |
| | | | | | | | | | | | | | | | |
Total distributions to Class C shareholders | | | (38 | ) | | | (34 | ) | | | (13 | ) | | | (19 | ) |
DISTRIBUTIONS TO INSTITUTIONAL CLASS SHAREHOLDERS: | | | | | | | | | | | | | | | | |
From net investment income | | | (510,481 | ) | | | (678,055 | ) | | | (1,164,541 | ) | | | (1,531,519 | ) |
From net realized gain | | | (66,313 | ) | | | — | | | | — | | | | — | |
Tax return of capital | | | — | | | | — | | | | — | | | | (1,033,846 | ) |
| | | | | | | | | | | | | | | | |
Total distributions to Institutional Class shareholders | | | (576,794 | ) | | | (678,055 | ) | | | (1,164,541 | ) | | | (2,565,365 | ) |
| | | | |
FUND SHARE TRANSACTIONS: | | | | | | | | | | | | | | | | |
Net increase in net assets resulting from Class A share transactions | | | 53 | | | | 1,025 | | | | 23 | | | | 301,326 | |
Net increase in net assets resulting from Class C share transactions | | | 49 | | | | 1,023 | | | | 19 | | | | 1,014 | |
Net increase in net assets resulting from Institutional Class share transactions | | | 2,137,422 | | | | 12,543,519 | | | | 3,524,835 | | | | 64,051,343 | |
| | | | | | | | | | | | | | | | |
| | | | |
Net increase in net assets resulting from Fund share transactions | | | 2,137,524 | | | | 12,545,567 | | | | 3,524,877 | | | | 64,353,683 | |
| | | | |
| | | | | | | | | | | | | | | | |
Total Increase in Net Assets | | | 2,400,427 | | | | 11,826,265 | | | | 4,653,640 | | | | 62,816,518 | |
| | | | |
NET ASSETS: | | | | | | | | | | | | | | | | |
Net assets at the beginning of the period | | | 11,826,265 | | | | — | | | | 62,816,518 | | | | — | |
| | | | |
| | | | | | | | | | | | | | | | |
Net assets at the end of the period | | $ | 14,226,692 | | | $ | 11,826,265 | | | $ | 67,470,158 | | | $ | 62,816,518 | |
Undistributed (Distributions in excess of) Net Investment Income (Loss) | | $ | 31,231 | | | $ | 31,289 | | | $ | (383,792 | ) | | $ | (344,026 | ) |
| 1 | The Fund was initially capitalized on November 19, 2010 and it commenced investment operations on December 8, 2010. |
| 2 | The Fund commenced investment operations on June 22, 2011. |
| 3 | The Fund commenced investment operations on October 4, 2011. |
See accompanying notes to the financial statements.
18
| | | | | | | | | | | | | | | | | | | | | | | | | | | | | | | | | | | | | | |
Ashmore Emerging Markets Local Currency Fund | | | Ashmore Emerging Markets Sovereign Debt Fund | | | Ashmore Emerging Markets Total Return Fund | | | Ashmore Emerging Markets Equity Fund | | | Ashmore Emerging Markets Small-Cap Fund | |
| 2012 | | | 20111 | | | 2012 | | | 20111 | | | 2012 | | | 20111 | | | 2012 | | | 20112 | | | 2012 | | | 20113 | |
| | | | | | | | | | | | | | | | | | | | | | | | | | | | | | | | | | | | | | | |
| $ | (175,807) | | | $ | (97,551 | ) | | $ | 730,759 | | | $ | 416,196 | | | $ | 3,392,480 | | | $ | 2,451,239 | | | $ | 13,389 | | | $ | 53,026 | | | $ | (16,662 | ) $ | | | (6,872 | ) |
| | 932,756 | | | | (2,408,355 | ) | | | 95,611 | | | | (5,401 | ) | | | 64,225 | | | | (1,490,657 | ) | | | (173,444 | ) | | | (851,017 | ) | | | 1,034,491 | | | | 40,246 | |
| | 699,789 | | | | (608,695 | ) | | | 1,173,198 | | | | 198,754 | | | | 4,247,571 | | | | (4,180,677 | ) | | | 446,097 | | | | (341,216 | ) | | | (325,948 | ) | | | 1,543,037 | |
| | 1,456,738 | | | | (3,114,601 | ) | | | 1,999,568 | | | | 609,549 | | | | 7,704,276 | | | | (3,220,095 | ) | | | 286,042 | | | | (1,139,207 | ) | | | 691,881 | | | | 1,576,411 | |
| | | | | | | | | | | | | | | | | | | | | | | | | | | | | | | | | | | | | | | |
| | — | | | | — | | | | (23 | ) | | | (19 | ) | | | (14,493 | ) | | | (3,827 | ) | | | — | | | | — | | | | — | | | | — | |
| | — | | | | — | | | | — | | | | — | | | | — | | | | — | | | | — | | | | — | | | | — | | | | — | |
| | — | | | | (2 | ) | | | — | | | | — | | | | — | | | | (3,858 | ) | | | — | | | | — | | | | — | | | | — | |
| | | | | | | | | | | | | | | | | | | | | | | | | | | | | | | | | | | | | | |
| | — | | | | (2 | ) | | | (23 | ) | | | (19 | ) | | | (14,493 | ) | | | (7,685 | ) | | | — | | | | — | | | | — | | | | — | |
| | | | | | | | | | | | | | | | | | | | | | | | | | | | | | | | | | | | | | | |
| | — | | | | — | | | | (20 | ) | | | (16 | ) | | | (21 | ) | | | (8 | ) | | | — | | | | — | | | | — | | | | — | |
| | — | | | | — | | | | — | | | | — | | | | — | | | | — | | | | — | | | | — | | | | — | | | | — | |
| | — | | | | (1 | ) | | | — | | | | — | | | | — | | | | (8 | ) | | | — | | | | — | | | | — | | | | — | |
| | | | | | | | | | | | | | | | | | | | | | | | | | | | | | | | | | | | | | |
| | — | | | | (1 | ) | | | (20 | ) | | | (16 | ) | | | (21 | ) | | | (16 | ) | | | — | | | | — | | | | — | | | | — | |
| | | | | | | | | | | | | | | | | | | | | | | | | | | | | | | | | | | | | | | |
| | | | | | | | | | | | | | | | | | | | | | | | | | | | | | | | | | | | | | | |
| | — | | | | — | | | | (748,119 | ) | | | (427,941 | ) | | | (3,386,526 | ) | | | (1,165,588 | ) | | | (17,603 | ) | | | (46,475 | ) | | | (934 | ) | | | — | |
| | — | | | | — | | | | — | | | | — | | | | — | | | | — | | | | — | | | | — | | | | (38,656 | ) | | | — | |
| | — | | | | (948,700 | ) | | | — | | | | — | | | | — | | | | (1,259,791 | ) | | | — | | | | — | | | | — | | | | — | |
| | | | | | | | | | | | | | | | | | | | | | | | | | | | | | | | | | | | | | |
| | — | | | | (948,700 | ) | | | (748,119 | ) | | | (427,941 | ) | | | (3,386,526 | ) | | | (2,425,379 | ) | | | (17,603 | ) | | | (46,475 | ) | | | (39,590 | ) | | | — | |
| | | | | | | | | | |
| | | | | | | | | | | | | | | | | | | | | | | | | | | | | | | | | | | | | | | |
| | 1 | | | | 1,001 | | | | 28 | | | | 1,013 | | | | 89,195 | | | | 544,481 | | | | 1,000 | | | | — | | | | 96,525 | | | | — | |
| | — | | | | 1,001 | | | | 24 | | | | 1,011 | | | | 26 | | | | 1,011 | | | | — | | | | — | | | | — | | | | — | |
| | 34,158,113 | | | | 27,705,717 | | | | 700,959 | | | | 30,351,222 | | | | 51,215,846 | | | | 107,564,160 | | | | 17,824 | | | | 10,033,827 | | | | 38,652 | | | | 10,000,000 | |
| | | | | | | | | | | | | | | | | | | | | | | | | | | | | | | | | | | | | | |
| | | | | | | | | | |
| | 34,158,114 | | | | 27,707,719 | | | | 701,011 | | | | 30,353,246 | | | | 51,305,067 | | | | 108,109,652 | | | | 18,824 | | | | 10,033,827 | | | | 135,177 | | | | 10,000,000 | |
| | 35,614,852 | | | | 23,644,415 | | | | 1,952,417 | | | | 30,534,819 | | | | 55,608,303 | | | | 102,456,477 | | | | 287,263 | | | | 8,848,145 | | | | 787,468 | | | | 11,576,411 | |
| | | | | | | | | | |
| | | | | | | | | | | | | | | | | | | | | | | | | | | | | | | | | | | | | | | |
| | 23,644,415 | | | | — | | | | 30,534,819 | | | | — | | | | 102,456,477 | | | | — | | | | 8,848,145 | | | | — | | | | 11,576,411 | | | | — | |
| | | | | | | | | | |
| | | | | | | | | | | | | | | | | | | | | | | | | | | | | | | | | | | | | | | |
| $ | 59,259,267 | | | $ | 23,644,415 | | | $ | 32,487,236 | | | $ | 30,534,819 | | | $ | 158,064,780 | | | $ | 102,456,477 | | | $ | 9,135,408 | | | $ | 8,848,145 | | | $ | 12,363,879 | | | $ | 11,576,411 | |
| $ | 5,694 | | | $ | 181,501 | | | $ | (23,556 | ) | | $ | (6,153 | ) | | $ | 147,263 | | | $ | 155,823 | | | $ | 12,118 | | | $ | 16,332 | | | $ | (17,596 | ) $ | | | — | |
See accompanying notes to the financial statements.
19
ASHMORE FUNDS
FINANCIAL HIGHLIGHTS
For the Six Months Ended April 30, 2012 (Unaudited) and the Fiscal Period Ended October 31, 2011
Ashmore Emerging Markets Corporate Debt Fund
| | | | | | | | | | | | | | | | | | | | | | | | |
| | | Class A | | | Class C | | | Institutional Class | |
| | | 2012 | | | 20111 | | | 2012 | | | 20111 | | | 2012 | | | 20112 | |
| | | | | | |
Net asset value at beginning of period | | | $ 9.09 | | | | $ 10.00 | | | | $ 9.09 | | | | $ 10.00 | | | | $ 9.43 | | | | $ 10.00 | |
| | | | | | |
Income/(loss) from investment operations: | | | | | | | | | | | | | | | | | | | | | | | | |
Net investment income3 | | | 0.35 | | | | 0.32 | | | | 0.32 | | | | 0.28 | | | | 0.37 | | | | 0.63 | |
Net realized and unrealized gain (loss) | | | 0.19 | | | | (0.86) | | | | 0.19 | | | | (0.86) | | | | 0.21 | | | | (0.60) | |
| | | | | | | | | | | | | | | | | | | | | | | | |
Total from investment operations | | | 0.54 | | | | (0.54) | | | | 0.51 | | | | (0.58) | | | | 0.58 | | | | 0.03 | |
| | | | | | |
Less distributions: | | | | | | | | | | | | | | | | | | | | | | | | |
| | | | | | |
From net investment income | | | (0.35) | | | | (0.37) | | | | (0.32) | | | | (0.33) | | | | (0.38) | | | | (0.60) | |
From net realized gain | | | (0.05) | | | | — | | | | (0.05) | | | | — | | | | (0.05) | | | | — | |
| | | | | | | | | | | | | | | | | | | | | | | | |
| | | | | | |
Total distributions | | | (0.40) | | | | (0.37) | | | | (0.37) | | | | (0.33) | | | | (0.43) | | | | (0.60) | |
| | | | | | | | | | | | | | | | | | | | | | | | |
Net asset value at end of period | | | $ 9.23 | | | | $ 9.09 | | | | $ 9.23 | | | | $ 9.09 | | | | $ 9.58 | | | | $ 9.43 | |
| | | | | | | | | | | | | | | | | | | | | | | | |
| | | | | | |
Total return4 | | | 6.20% | | | | (5.44%) | | | | 5.82% | | | | (5.78%) | | | | 6.35% | | | | 0.27% | |
| | | | | | |
Portfolio turnover rate5 | | | 23% | | | | 22% | | | | 23% | | | | 22% | | | | 23% | | | | 22% | |
| | | | | | |
Net assets, end of period (in thousands) | | | $ 1 | | | | $ 1 | | | | $ 1 | | | | $ 1 | | | | $ 14,225 | | | | $ 11,824 | |
| | | | | | |
Ratios to average net assets:6 | | | | | | | | | | | | | | | | | | | | | | | | |
Total expenses to average net assets: | | | | | | | | | | | | | | | | | | | | | | | | |
Total expenses before reimbursements | | | 2.95% | | | | 4.36% | | | | 3.71% | | | | 5.12% | | | | 2.72% | | | | 3.78% | |
Total expenses after reimbursements | | | 1.45% | | | | 1.45% | | | | 2.20% | | | | 2.20% | | | | 1.17% | | | | 1.17% | |
| | | | | | |
Net investment income to average net assets: | | | | | | | | | | | | | | | | | | | | | | | | |
Net investment income before reimbursements | | | 6.34% | | | | 4.35% | | | | 5.60% | | | | 3.59% | | | | 6.51% | | | | 4.60% | |
Net investment income after reimbursements | | | 7.84% | | | | 7.26% | | | | 7.11% | | | | 6.51% | | | | 8.06% | | | | 7.21% | |
| 1 | Class A and Class C commenced investment operations on May 12, 2011. |
| 2 | The Institutional Class commenced investment operations on December 8, 2010. |
| 3 | Per share amounts are based on average number of shares outstanding during the period. |
| 4 | Assumes investment at net asset value at the beginning of the period, reinvestment of all distributions at net asset value on distribution date, and a complete redemption of the investment at net asset value at the end of the period excluding the impact of sales charges. Total return is not annualized for periods less than one year. |
| 5 | The portfolio turnover rate is calculated by dividing the lesser of cost of purchases or proceeds from sales of long term portfolio securities by the monthly average of the value of the long term portfolio securities. Portfolio turnover is not annualized for periods less than one year. |
| 6 | Annualized for periods less than one year. |
See accompanying notes to the financial statements.
20
ASHMORE FUNDS
FINANCIAL HIGHLIGHTS
For the Six Months Ended April 30, 2012 (Unaudited) and the Fiscal Period Ended October 31, 2011
Ashmore Emerging Markets Local Currency Bond Fund
| | | | | | | | | | | | | | | | | | | | | | | | |
| | | Class A | | | Class C | | | Institutional Class | |
| | | 2012 | | | 20111 | | | 2012 | | | 20111 | | | 2012 | | | 20112 | |
| | | | | | |
Net asset value at beginning of period | | | $ 9.43 | | | | $ 10.00 | | | | $ 9.43 | | | | $ 10.00 | | | | $ 9.76 | | | | $ 10.00 | |
| | | | | | |
Income/(loss) from investment operations: | | | | | | | | | | | | | | | | | | | | | | | | |
Net investment income3 | | | 0.15 | | | | 0.13 | | | | 0.12 | | | | 0.13 | | | | 0.18 | | | | 0.29 | |
Net realized and unrealized gain (loss) | | | 0.22 | | | | (0.48) | | | | 0.21 | | | | (0.51) | | | | 0.22 | | | | 0.06 | |
| | | | | | | | | | | | | | | | | | | | | | | | |
Total from investment operations | | | 0.37 | | | | (0.35) | | | | 0.33 | | | | (0.38) | | | | 0.40 | | | | 0.35 | |
| | | | | | |
Less distributions: | | | | | | | | | | | | | | | | | | | | | | | | |
| | | | | | |
From net investment income | | | (0.16) | | | | (0.13) | | | | (0.13) | | | | (0.11) | | | | (0.18) | | | | (0.35) | |
Tax return of capital | | | — | | | | (0.09) | | | | — | | | | (0.08) | | | | — | | | | (0.24) | |
| | | | | | | | | | | | | | | | | | | | | | | | |
| | | | | | |
Total distributions | | | (0.16) | | | | (0.22) | | | | (0.13) | | | | (0.19) | | | | (0.18) | | | | (0.59) | |
| | | | | | | | | | | | | | | | | | | | | | | | |
Net asset value at end of period | | | $ 9.64 | | | | $ 9.43 | | | | $ 9.63 | | | | $ 9.43 | | | | $ 9.98 | | | | $ 9.76 | |
| | | | | | | | | | | | | | | | | | | | | | | | |
| | | | | | |
Total return4 | | | 3.98% | | | | (3.60%) | | | | 3.60% | | | | (4.01%) | | | | 4.05% | | | | 3.35% | |
| | | | | | |
Portfolio turnover rate5 | | | 48% | | | | 31% | | | | 48% | | | | 31% | | | | 48% | | | | 31% | |
| | | | | | |
Net assets, end of period (in thousands) | | | $ 292 | | | | $ 286 | | | | $ 1 | | | | $ 1 | | | | $ 67,177 | | | | $ 62,530 | |
| | | | | | |
Ratios to average net assets:6 | | | | | | | | | | | | | | | | | | | | | | | | |
Total expenses to average net assets: | | | | | | | | | | | | | | | | | | | | | | | | |
Total expenses before reimbursements | | | 1.61% | | | | 1.99% | | | | 2.54% | | | | 2.87% | | | | 1.36% | | | | 1.70% | |
Total expenses after reimbursements | | | 1.25% | | | | 1.25% | | | | 2.00% | | | | 2.00% | | | | 0.97% | | | | 0.97% | |
| | | | | | |
Net investment income to average net assets: | | | | | | | | | | | | | | | | | | | | | | | | |
Net investment income before reimbursements | | | 2.67% | | | | 2.34% | | | | 1.85% | | | | 1.87% | | | | 2.91% | | | | 2.55% | |
Net investment income after reimbursements | | | 3.03% | | | | 3.08% | | | | 2.39% | | | | 2.74% | | | | 3.30% | | | | 3.28% | |
| 1 | Class A and Class C commenced investment operations on May 12, 2011. |
| 2 | The Institutional Class commenced investment operations on December 8, 2010. |
| 3 | Per share amounts are based on average number of shares outstanding during the period. |
| 4 | Assumes investment at net asset value at the beginning of the period, reinvestment of all distributions at net asset value on distribution date, and a complete redemption of the investment at net asset value at the end of the period excluding the impact of sales charges. Total return is not annualized for periods less than one year. |
| 5 | The portfolio turnover rate is calculated by dividing the lesser of cost of purchases or proceeds from sales of long term portfolio securities, including fully funded total return swaps, by the monthly average of the value of the long term portfolio securities. Portfolio turnover is not annualized for periods less than one year. |
| 6 | Annualized for periods less than one year. |
See accompanying notes to the financial statements.
21
ASHMORE FUNDS
FINANCIAL HIGHLIGHTS
For the Six Months Ended April 30, 2012 (Unaudited) and the Fiscal Period Ended October 31, 2011
Ashmore Emerging Markets Local Currency Fund
| | | | | | | | | | | | | | | | | | | | | | | | |
| | | Class A | | | Class C | | | Institutional Class | |
| | | 2012 | | | 20111 | | | 2012 | | | 20111 | | | 2012 | | | 20112 | |
| | | | | | |
Net asset value at beginning of period | | | $ 9.38 | | | | $ 10.00 | | | | $ 9.35 | | | | $ 10.00 | | | | $ 9.35 | | | | $ 10.00 | |
| | | | | | |
Income/(loss) from investment operations: | | | | | | | | | | | | | | | | | | | | | | | | |
Net investment loss3 | | | (0.05) | | | | (0.03) | | | | (0.09) | | | | (0.06) | | | | (0.03) | | | | (0.04) | |
Net realized and unrealized gain (loss) | | | 0.11 | | | | (0.57) | | | | 0.12 | | | | (0.58) | | | | 0.12 | | | | 0.06 | |
| | | | | | | | | | | | | | | | | | | | | | | | |
Total from investment operations | | | 0.06 | | | | (0.60) | | | | 0.03 | | | | (0.64) | | | | 0.09 | | | | 0.02 | |
| | | | | | |
Less distributions: | | | | | | | | | | | | | | | | | | | | | | | | |
| | | | | | |
From net investment income | | | — 4 | | | | — | | | | — 4 | | | | — | | | | — 4 | | | | — | |
Tax return of capital | | | — | | | | (0.02) | | | | — | | | | (0.01) | | | | — | | | | (0.67) | |
| | | | | | | | | | | | | | | | | | | | | | | | |
| | | | | | |
Total distributions | | | — | | | | (0.02) | | | | — | | | | (0.01) | | | | — | | | | (0.67) | |
| | | | | | | | | | | | | | | | | | | | | | | | |
Net asset value at end of period | | | $ 9.44 | | | | $ 9.38 | | | | $ 9.38 | | | | $ 9.35 | | | | $ 9.44 | | | | $ 9.35 | |
| | | | | | | | | | | | | | | | | | | | | | | | |
| | | | | | |
Total return5 | | | 0.75% | | | | (6.12%) | | | | 0.45% | | | | (6.46%) | | | | 0.96% | | | | (0.12%) | |
| | | | | | |
Portfolio turnover rate6 | | | 22% | | | | 37% | | | | 22% | | | | 37% | | | | 22% | | | | 37% | |
| | | | | | |
Net assets, end of period (in thousands) | | | $ 1 | | | | $ 1 | | | | $ 1 | | | | $ 1 | | | | $ 59,257 | | | | $ 23,643 | |
| | | | | | |
Ratios to average net assets:7 | | | | | | | | | | | | | | | | | | | | | | | | |
Total expenses to average net assets: | | | | | | | | | | | | | | | | | | | | | | | | |
Total expenses before reimbursements | | | 1.51% | | | | 2.17% | | | | 2.27% | | | | 2.90% | | | | 1.31% | | | | 2.03% | |
Total expenses after reimbursements | | | 1.15% | | | | 1.15% | | | | 1.90% | | | | 1.90% | | | | 0.87% | | | | 0.87% | |
| | | | | | |
Net investment loss to average net assets: | | | | | | | | | | | | | | | | | | | | | | | | |
Net investment loss before reimbursements | | | (1.43%) | | | | (1.60%) | | | | (2.19%) | | | | (2.33%) | | | | (1.15%) | | | | (1.58%) | |
Net investment loss after reimbursements | | | (1.07%) | | | | (0.58%) | | | | (1.82%) | | | | (1.33%) | | | | (0.71%) | | | | (0.42%) | |
| 1 | Class A and Class C commenced investment operations on May 12, 2011. |
| 2 | The Institutional Class commenced investment operations on December 8, 2010. |
| 3 | Per share amounts are based on average number of shares outstanding during the period. |
| 4 | Amount is less than $0.005 per share. |
| 5 | Assumes investment at net asset value at the beginning of the period, reinvestment of all distributions at net asset value on distribution date, and a complete redemption of the investment at net asset value at the end of the period excluding the impact of sales charges. Total return is not annualized for periods less than one year. |
| 6 | The portfolio turnover rate is calculated by dividing the lesser of cost of purchases or proceeds from sales of long term portfolio securities by the monthly average of the value of the long term portfolio securities. Portfolio turnover is not annualized for periods less than one year. |
| 7 | Annualized for periods less than one year. |
See accompanying notes to the financial statements.
22
ASHMORE FUNDS
FINANCIAL HIGHLIGHTS
For the Six Months Ended April 30, 2012 (Unaudited) and the Fiscal Period Ended October 31, 2011
Ashmore Emerging Markets Sovereign Debt Fund
| | | | | | | | | | | | | | | | | | | | | | | | |
| | | Class A | | | Class C | | | Institutional Class | |
| | | 2012 | | | 20111 | | | 2012 | | | 20111 | | | 2012 | | | 20112 | |
| | | | | | |
Net asset value at beginning of period | | | $ 10.04 | | | | $ 10.00 | | | | $ 10.04 | | | | $ 10.00 | | | | $ 9.99 | | | | $ 10.00 | |
| | | | | | |
Income from investment operations: | | | | | | | | | | | | | | | | | | | | | | | | |
Net investment income3 | | | 0.21 | | | | 0.19 | | | | 0.18 | | | | 0.15 | | | | 0.23 | | | | 0.40 | |
Net realized and unrealized gain | | | 0.40 | | | | 0.04 | | | | 0.40 | | | | 0.05 | | | | 0.41 | | | | — | |
| | | | | | | | | | | | | | | | | | | | | | | | |
Total from investment operations | | | 0.61 | | | | 0.23 | | | | 0.58 | | | | 0.20 | | | | 0.64 | | | | 0.40 | |
| | | | | | |
Less distributions: | | | | | | | | | | | | | | | | | | | | | | | | |
| | | | | | |
From net investment income | | | (0.22) | | | | (0.19) | | | | (0.19) | | | | (0.16) | | | | (0.24) | | | | (0.41) | |
| | | | | | | | | | | | | | | | | | | | | | | | |
| | | | | | |
Total distributions | | | (0.22) | | | | (0.19) | | | | (0.19) | | | | (0.16) | | | | (0.24) | | | | (0.41) | |
| | | | | | | | | | | | | | | | | | | | | | | | |
Net asset value at end of period | | | $ 10.43 | | | | $ 10.04 | | | | $ 10.43 | | | | $ 10.04 | | | | $ 10.39 | | | | $ 9.99 | |
| | | | | | | | | | | | | | | | | | | | | | | | |
| | | | | | |
Total return4 | | | 6.33% | | | | 2.26% | | | | 5.99% | | | | 1.90% | | | | 6.52% | | | | 4.15% | |
| | | | | | |
Portfolio turnover rate5 | | | 8% | | | | 9% | | | | 8% | | | | 9% | | | | 8% | | | | 9% | |
| | | | | | |
Net assets, end of period (in thousands) | | | $ 1 | | | | $ 1 | | | | $ 1 | | | | $ 1 | | | | $ 32,485 | | | | $ 30,533 | |
| | | | | | |
Ratios to average net assets:6 | | | | | | | | | | | | | | | | | | | | | | | | |
Total expenses to average net assets: | | | | | | | | | | | | | | | | | | | | | | | | |
Total expenses before reimbursements | | | 2.01% | | | | 4.61% | | | | 2.77% | | | | 5.35% | | | | 1.60% | | | | 3.63% | |
Total expenses after reimbursements | | | 1.20% | | | | 1.20% | | | | 1.95% | | | | 1.95% | | | | 0.92% | | | | 0.92% | |
| | | | | | |
Net investment income/(loss) to average net assets: | | | | | | | | | | | | | | | | | | | | | | | | |
Net investment income (loss) before reimbursements | | | 3.53% | | | | 0.57% | | | | 2.83% | | | | (0.18%) | | | | 4.03% | | | | 1.74% | |
Net investment income after reimbursements | | | 4.34% | | | | 3.98% | | | | 3.65% | | | | 3.22% | | | | 4.71% | | | | 4.45% | |
| 1 | Class A and Class C commenced investment operations on May 12, 2011. |
| 2 | The Institutional Class commenced investment operations on December 8, 2010. |
| 3 | Per share amounts are based on average number of shares outstanding during the period. |
| 4 | Assumes investment at net asset value at the beginning of the period, reinvestment of all distributions at net asset value on distribution date, and a complete redemption of the investment at net asset value at the end of the period excluding the impact of sales charges. Total return is not annualized for periods less than one year. |
| 5 | The portfolio turnover rate is calculated by dividing the lesser of cost of purchases or proceeds from sales of long term portfolio securities by the monthly average of the value of the long term portfolio securities. Portfolio turnover is not annualized for periods less than one year. |
| 6 | Annualized for periods less than one year. |
See accompanying notes to the financial statements.
23
ASHMORE FUNDS
FINANCIAL HIGHLIGHTS
For the Six Months Ended April 30, 2012 (Unaudited) and the Fiscal Period Ended October 31, 2011
Ashmore Emerging Markets Total Return Fund
| | | | | | | | | | | | | | | | | | | | | | | | |
| | | Class A | | | Class C | | | Institutional Class | |
| | | 2012 | | | 20111 | | | 2012 | | | 20111 | | | 2012 | | | 20112 | |
| | | | | | |
Net asset value at beginning of period | | | $ 9.37 | | | | $ 10.00 | | | | $ 9.36 | | | | $ 10.00 | | | | $ 9.50 | | | | $ 10.00 | |
| | | | | | |
Income/(loss) from investment operations: | | | | | | | | | | | | | | | | | | | | | | | | |
Net investment income3 | | | 0.24 | | | | 0.22 | | | | 0.20 | | | | 0.19 | | | | 0.24 | | | | 0.46 | |
Net realized and unrealized gain (loss) | | | 0.25 | | | | (0.66) | | | | 0.26 | | | | (0.66) | | | | 0.28 | | | | (0.34) | |
| | | | | | | | | | | | | | | | | | | | | | | | |
Total from investment operations | | | 0.49 | | | | (0.44) | | | | 0.46 | | | | (0.47) | | | | 0.52 | | | | 0.12 | |
| | | | | | |
Less distributions: | | | | | | | | | | | | | | | | | | | | | | | | |
| | | | | | |
From net investment income | | | (0.24) | | | | (0.09) | | | | (0.21) | | | | (0.08) | | | | (0.26) | | | | (0.29) | |
Tax return of capital | | | — | | | | (0.10) | | | | — | | | | (0.09) | | | | — | | | | (0.33) | |
| | | | | | | | | | | | | | | | | | | | | | | | |
| | | | | | |
Total distributions | | | (0.24) | | | | (0.19) | | | | (0.21) | | | | (0.17) | | | | (0.26) | | | | (0.62) | |
| | | | | | | | | | | | | | | | | | | | | | | | |
Net asset value at end of period | | | $ 9.62 | | | | $ 9.37 | | | | $ 9.61 | | | | $ 9.36 | | | | $ 9.76 | | | | $ 9.50 | |
| | | | | | | | | | | | | | | | | | | | | | | | |
| | | | | | |
Total return4 | | | 5.34% | | | | (4.40%) | | | | 5.00% | | | | (4.79%) | | | | 5.55% | | | | 1.11% | |
| | | | | | |
Portfolio turnover rate5 | | | 16% | | | | 39% | | | | 16% | | | | 39% | | | | 16% | | | | 39% | |
| | | | | | |
Net assets, end of period (in thousands) | | | $ 617 | | | | $ 509 | | | | $ 1 | | | | $ 1 | | | | $ 157,447 | | | | $ 101,947 | |
| | | | | | |
Ratios to average net assets:6 | | | | | | | | | | | | | | | | | | | | | | | | |
Total expenses to average net assets: | | | | | | | | | | | | | | | | | | | | | | | | |
Total expenses before reimbursements | | | 1.50% | | | | 1.75% | | | | 2.15% | | | | 2.82% | | | | 1.25% | | | | 1.63% | |
Total expenses after reimbursements | | | 1.30% | | | | 1.30% | | | | 2.05% | | | | 2.05% | | | | 1.02% | | | | 1.02% | |
| | | | | | |
Net investment income to average net assets: | | | | | | | | | | | | | | | | | | | | | | | | |
Net investment income before reimbursements | | | 4.93% | | | | 4.21% | | | | 4.38% | | | | 3.32% | | | | 5.15% | | | | 4.63% | |
Net investment income after reimbursements | | | 5.13% | | | | 4.66% | | | | 4.48% | | | | 4.09% | | | | 5.38% | | | | 5.24% | |
| 1 | Class A and Class C commenced investment operations on May 12, 2011. |
| 2 | The Institutional Class commenced investment operations on December 8, 2010. |
| 3 | Per share amounts are based on average number of shares outstanding during the period. |
| 4 | Assumes investment at net asset value at the beginning of the period, reinvestment of all distributions at net asset value on distribution date, and a complete redemption of the investment at net asset value at the end of the period excluding the impact of sales charges. Total return is not annualized for periods less than one year. |
| 5 | The portfolio turnover rate is calculated by dividing the lesser of cost of purchases or proceeds from sales of long term portfolio securities, including fully funded total return swaps, by the monthly average of the value of the long term portfolio securities. Portfolio turnover is not annualized for periods less than one year. |
| 6 | Annualized for periods less than one year. |
See accompanying notes to the financial statements.
24
ASHMORE FUNDS
FINANCIAL HIGHLIGHTS
For the Six Months Ended April 30, 2012 (Unaudited) and the Fiscal Period Ended October 31, 2011
Ashmore Emerging Markets Equity Fund
| | | | | | | | | | | | |
| | | Class A | | | Institutional Class | |
| | | 20121 | | | 2012 | | | 20112 | |
| | | |
Net asset value at beginning of period | | | $ 10.00 | | | | $ 8.81 | | | | $ 10.00 | |
| | | |
Income/(loss) from investment operations: | | | | | | | | | | | | |
Net investment income3 | | | — 4 | | | | 0.01 | | | | 0.05 | |
Net realized and unrealized gain (loss) | | | (0.51) | | | | 0.28 | | | | (1.19) | |
| | | | | | | | | | | | |
Total from investment operations | | | (0.51) | | | | 0.29 | | | | (1.14) | |
| | | |
Less distributions: | | | | | | | | | | | | |
| | | |
From net investment income | | | — 4 | | | | (0.02) | | | | (0.05) | |
| | | | | | | | | | | | |
| | | |
Total distributions | | | — | | | | (0.02) | | | | (0.05) | |
| | | | | | | | | | | | |
Net asset value at end of period | | | $ 9.49 | | | | $ 9.08 | | | | $ 8.81 | |
| | | | | | | | | | | | |
| | | |
Total return5 | | | (5.09)% | | | | 3.29% | | | | (11.37)% | |
| | | |
Portfolio turnover rate6 | | | 55% | | | | 55% | | | | 75% | |
| | | |
Net assets, end of period (in thousands) | | | $ 1 | | | | $ 9,134 | | | | $ 8,848 | |
| | | |
Ratios to average net assets:7 | | | | | | | | | | | | |
Total expenses to average net assets: | | | | | | | | | | | | |
Total expenses before reimbursements | | | 3.99% | | | | 3.94% | | | | 5.34% | |
Total expenses after reimbursements | | | 1.45% | | | | 1.17% | | | | 1.17% | |
| | | |
Net investment income/(loss) to average net assets: | | | | | | | | | | | | |
Net investment loss before reimbursements | | | (1.92%) | | | | (2.47)% | | | | (2.55)% | |
Net investment income after reimbursements | | | 0.62% | | | | 0.30% | | | | 1.62% | |
| 1 | Class A commenced investment operations on February 27, 2012. |
| 2 | The Institutional Class commenced investment operations on June 22, 2011. |
| 3 | Per share amounts are based on average number of shares outstanding during the period. |
| 4 | Amount is less than $0.005 per share. |
| 5 | Assumes investment at net asset value at the beginning of the period, reinvestment of all distributions at net asset value on distribution date, and a complete redemption of the investment at net asset value at the end of the period excluding the impact of sales charges. Total return is not annualized for periods less than one year. |
| 6 | The portfolio turnover rate is calculated by dividing the lesser of cost of purchases or proceeds from sales of long term portfolio securities by the monthly average of the value of the long term portfolio securities. Portfolio turnover is not annualized for periods less than one year. |
| 7 | Annualized for periods less than one year. |
See accompanying notes to the financial statements.
25
ASHMORE FUNDS
FINANCIAL HIGHLIGHTS
For the Six Months Ended April 30, 2012 (Unaudited) and the Fiscal Period Ended October 31, 2011
Ashmore Emerging Markets Small-Cap Equity Fund
| | | | | | | | | | | | |
| | | Class A | | | Institutional Class | |
| | | 20121 | | | 2012 | | | 20112 | |
| | | |
Net asset value at beginning of period | | | $ 10.00 | | | | $ 11.58 | | | | $ 10.00 | |
| | | |
Income/(loss) from investment operations: | | | | | | | | | | | | |
Net investment loss3 | | | (0.01) | | | | (0.02) | | | | (0.01) | |
Net realized and unrealized gain | | | 0.17 | | | | 0.70 | | | | 1.59 | |
| | | | | | | | | | | | |
Total from investment operations | | | 0.16 | | | | 0.68 | | | | 1.58 | |
| | | |
Less distributions: | | | | | | | | | | | | |
| | | |
From net investment income | | | — | | | | — 4 | | | | — | |
From net realized gain | | | — | | | | (0.04) | | | | — | |
| | | | | | | | | | | | |
| | | |
Total distributions | | | — | | | | (0.04) | | | | — | |
| | | | | | | | | | | | |
Net asset value at end of period | | | $ 10.16 | | | | $ 12.22 | | | | $ 11.58 | |
| | | | | | | | | | | | |
| | | |
Total return5 | | | 1.60% | | | | 5.93% | | | | 15.80% | |
| | | |
Portfolio turnover rate6 | | | 55% | | | | 55% | | | | 20% | |
| | | |
Net assets, end of period (in thousands) | | | $ 98 | | | | $ 12,266 | | | | $ 11,576 | |
| | | |
Ratios to average net assets:7 | | | | | | | | | | | | |
Total expenses to average net assets: | | | | | | | | | | | | |
Total expenses before reimbursements | | | 3.80% | | | | 3.66% | | | | 15.42% | |
Total expenses after reimbursements | | | 1.80% | | | | 1.52% | | | | 1.52% | |
| | | |
Net investment loss to average net assets: | | | | | | | | | | | | |
Net investment loss before reimbursements | | | (2.47%) | | | | (2.43%) | | | | (14.76%) | |
Net investment loss after reimbursements | | | (0.47%) | | | | (0.29%) | | | | (0.86%) | |
| 1 | Class A commenced investment operations on February 1, 2012. |
| 2 | The Institutional Class commenced investment operations on October 4, 2011. |
| 3 | Per share amounts are based on average number of shares outstanding during the period. |
| 4 | Amount is less than $0.005 per share. |
| 5 | Assumes investment at net asset value at the beginning of the period, reinvestment of all distributions at net asset value on distribution date, and a complete redemption of the investment at net asset value at the end of the period excluding the impact of sales charges. Total return is not annualized for periods less than one year. |
| 6 | The portfolio turnover rate is calculated by dividing the lesser of cost of purchases or proceeds from sales of long term portfolio securities by the monthly average of the value of the long term portfolio securities. Portfolio turnover is not annualized for periods less than one year. |
| 7 | Annualized for periods less than one year. |
See accompanying notes to the financial statements.
26
ASHMORE EMERGING MARKETS CORPORATE DEBT FUND
SCHEDULE OF INVESTMENTS
As of April 30, 2012 (Unaudited)
| | | | | | | | | | | | | | |
| | | Currency(1) | | Par | | | Value | | | % of Net Assets | |
Debt Securities | | | | | | | | | | | | | | |
| | | | |
Argentina (Cost $195,434) | | | | | | | | | | | | | | |
WPE International Cooperatief U.A. 10.375%, 09/30/2020(2) | | | | | 200,000 | | | $ | 175,000 | | | | 1.23 | |
| | | | | | | | | 175,000 | | | | 1.23 | |
Barbados (Cost $107,017) | | | | | | | | | | | | | | |
Columbus International, Inc. 11.500%, 11/20/2014 | | | | | 100,000 | | | | 108,062 | | | | 0.76 | |
| | | | | | | | | 108,062 | | | | 0.76 | |
Brazil (Cost $1,478,187) | | | | | | | | | | | | | | |
Cia Energetica de Sao Paulo 9.750%, 01/15/2015 | | BRL | | | 250,000 | | | | 195,442 | | | | 1.37 | |
Itau Unibanco Holding S.A. 10.500%, 11/23/2015(2) | | BRL | | | 200,000 | | | | 115,362 | | | | 0.81 | |
Itau Unibanco Holding S.A. 5.650%, 03/19/2022(2) | | | | | 200,000 | | | | 201,124 | | | | 1.41 | |
JBS Finance II Ltd. 8.250%, 01/29/2018 | | | | | 100,000 | | | | 97,777 | | | | 0.69 | |
Marfrig Holding Europe B.V. 8.375%, 05/09/2018 | | | | | 200,000 | | | | 172,894 | | | | 1.22 | |
Marfrig Overseas Ltd. 9.500%, 05/04/2020 | | | | | 100,000 | | | | 87,347 | | | | 0.62 | |
Minerva Luxembourg S.A. 12.250%, 02/10/2022(2) | | | | | 200,000 | | | | 213,000 | | | | 1.50 | |
Oi S.A. 9.750%, 09/15/2016(2) | | BRL | | | 300,000 | | | | 165,297 | | | | 1.16 | |
OSX 3 Leasing BV 9.250%, 03/20/2015(2) | | | | | 100,000 | | | | 104,000 | | | | 0.73 | |
Rearden G Holdings EINS GmbH 7.875%, 03/30/2020 | | | | | 100,000 | | | | 105,419 | | | | 0.74 | |
| | | | | | | | | 1,457,662 | | | | 10.25 | |
Chile (Cost $495,652) | | | | | | | | | | | | | | |
Automotores Gildemeister S.A. 8.250%, 05/24/2021(2) | | | | | 100,000 | | | | 106,000 | | | | 0.75 | |
Banco Santander Chile 6.500%, 09/22/2020 | | CLP | | | 50,000,000 | | | | 97,918 | | | | 0.69 | |
Inversiones Alsacia S.A. 8.000%, 08/18/2018(2) | | | | | 144,828 | | | | 141,207 | | | | 0.99 | |
Inversiones CMPC S.A. 4.500%, 04/25/2022(2) | | | | | 150,000 | | | | 149,329 | | | | 1.05 | |
| | | | | | | | | 494,454 | | | | 3.48 | |
China (Cost $1,608,200) | | | | | | | | | | | | | | |
Central China Real Estate Ltd. 12.250%, 10/20/2015(2) | | | | | 100,000 | | | | 101,750 | | | | 0.71 | |
China Forestry Holdings Co. Ltd. 10.250%, 11/17/2015 | | | | | 60,000 | | | | 27,000 | | | | 0.19 | |
China Liansu Group Holdings Ltd. 7.875%, 05/13/2016 | | | | | 200,000 | | | | 189,500 | | | | 1.33 | |
China Oriental Group Co. Ltd. 7.000%, 11/17/2017(2) | | | | | 100,000 | | | | 82,250 | | | | 0.58 | |
China Shanshui Cement Group Ltd. 10.500%, 04/27/2017(2) | | | | | 200,000 | | | | 202,250 | | | | 1.42 | |
Country Garden Holdings Co. Ltd. 11.250%, 04/22/2017 | | | | | 100,000 | | | | 100,750 | | | | 0.71 | |
Country Garden Holdings Co. Ltd. 11.125%, 02/23/2018 | | | | | 200,000 | | | | 201,000 | | | | 1.41 | |
Evergrande Real Estate Group Ltd. 13.000%, 01/27/2015 | | | | | 100,000 | | | | 100,500 | | | | 0.71 | |
Hidili Industry International Development Ltd. 8.625%, 11/04/2015(2) | | | | | 100,000 | | | | 85,250 | | | | 0.60 | |
Hyva Global B.V. 8.625%, 03/24/2016(2) | | | | | 200,000 | | | | 168,000 | | | | 1.18 | |
Shimao Property Holdings Ltd. 9.650%, 08/03/2017 | | | | | 100,000 | | | | 88,417 | | | | 0.62 | |
Sino-Forest Corp. 5.000%, 08/01/2013(2)(3) | | | | | 14,000 | | | | 3,657 | | | | 0.03 | |
Sino-Forest Corp. 10.250%, 07/28/2014(3) | | | | | 62,000 | | | | 16,430 | | | | 0.12 | |
Sino-Forest Corp. 10.250%, 07/28/2014(2)(3) | | | | | 20,000 | | | | 5,400 | | | | 0.04 | |
Sino-Forest Corp. 4.250%, 12/15/2016(2)(3) | | | | | 53,000 | | | | 14,178 | | | | 0.10 | |
Sino-Forest Corp. 6.250%, 10/21/2017(3) | | | | | 120,000 | | | | 31,800 | | | | 0.22 | |
Sino-Forest Corp. 6.250%, 10/21/2017(2)(3) | | | | | 32,000 | | | | 8,680 | | | | 0.06 | |
| | | | | | | | | 1,426,812 | | | | 10.03 | |
Colombia (Cost $72,267) | | | | | | | | | | | | | | |
Emgesa S.A. ESP 8.750%, 01/25/2021 | | COP | | | 125,000,000 | | | | 78,920 | | | | 0.55 | |
| | | | | | | | | 78,920 | | | | 0.55 | |
Croatia (Cost $114,081) | | | | | | | | | | | | | | |
Zagrebacki Holding D.O.O. 5.500%, 07/10/2017 | | EUR | | | 100,000 | | | | 109,210 | | | | 0.77 | |
| | | | | | | | | 109,210 | | | | 0.77 | |
See accompanying notes to the financial statements.
27
ASHMORE EMERGING MARKETS CORPORATE DEBT FUND
SCHEDULE OF INVESTMENTS (CONTINUED)
As of April 30, 2012 (Unaudited)
| | | | | | | | | | | | | | |
| | | Currency(1) | | Par | | | Value | | | % of Net
Assets | |
Czech Republic (Cost $135,837) | | | | | | | | | | | | | | |
Central European Media Enterprises Ltd. 11.625%, 09/15/2016 | | EUR | | | 100,000 | | | $ | 124,268 | | | | 0.87 | |
| | | | | | | | | 124,268 | | | | 0.87 | |
Hong Kong (Cost $210,927) | | | | | | | | | | | | | | |
Agile Property Holdings Ltd. 8.875%, 04/28/2017 | | | | | 100,000 | | | | 96,250 | | | | 0.68 | |
Bank of East Asia Ltd. 8.500%, 11/29/2049 | | | | | 100,000 | | | | 100,986 | | | | 0.71 | |
| | | | | | | | | 197,236 | | | | 1.39 | |
Hungary (Cost $123,447) | | | | | | | | | | | | | | |
MOL Hungarian Oil and Gas PLC 5.875%, 04/20/2017 | | EUR | | | 100,000 | | | | 121,763 | | | | 0.86 | |
| | | | | | | | | 121,763 | | | | 0.86 | |
India (Cost $483,418) | | | | | | | | | | | | | | |
ICICI Bank Ltd. 5.750%, 11/16/2020(2) | | | | | 100,000 | | | | 98,575 | | | | 0.69 | |
Jaiprakash Associates Ltd. 0.000%, 09/12/2012(4) | | | | | 100,000 | | | | 140,240 | | | | 0.99 | |
Reliance Holdings USA, Inc. 6.250%, 10/19/2040(2) | | | | | 250,000 | | | | 230,265 | | | | 1.62 | |
| | | | | | | | | 469,080 | | | | 3.30 | |
Indonesia (Cost $520,240) | | | | | | | | | | | | | | |
Berau Capital Resources Pte Ltd. 12.500%, 07/08/2015 | | | | | 200,000 | | | | 224,500 | | | | 1.58 | |
Berau Coal Energy Tbk PT 7.250%, 03/13/2017(2) | | | | | 200,000 | | | | 199,500 | | | | 1.40 | |
GT 2005 Bonds B.V., FRN 6.000%, 07/21/2014 | | | | | 100,000 | | | | 97,868 | | | | 0.69 | |
| | | | | | | | | 521,868 | | | | 3.67 | |
Israel (Cost $413,658) | | | | | | | | | | | | | | |
Israel Electric Corp. Ltd. 6.700%, 02/10/2017(2) | | | | | 200,000 | | | | 207,000 | | | | 1.45 | |
Israel Electric Corp. Ltd. 7.250%, 01/15/2019 | | | | | 200,000 | | | | 203,000 | | | | 1.43 | |
| | | | | | | | | 410,000 | | | | 2.88 | |
Jamaica (Cost $314,863) | | | | | | | | | | | | | | |
Digicel Group Ltd. 8.875%, 01/15/2015 | | | | | 200,000 | | | | 201,322 | | | | 1.42 | |
Digicel Group Ltd. 10.500%, 04/15/2018 | | | | | 100,000 | | | | 109,750 | | | | 0.77 | |
| | | | | | | | | 311,072 | | | | 2.19 | |
Kazakhstan (Cost $895,523) | | | | | | | | | | | | | | |
ATF Bank JSC 9.000%, 05/11/2016 | | | | | 100,000 | | | | 96,500 | | | | 0.68 | |
BTA Bank JSC 10.750%, 07/01/2018(3) | | | | | 200,000 | | | | 39,500 | | | | 0.28 | |
BTA Bank JSC 0.000%, 06/30/2020(4) | | | | | 200,000 | | | | 17,750 | | | | 0.12 | |
BTA Bank JSC 7.200%, 07/01/2025(3) | | | | | 300,000 | | | | 12,000 | | | | 0.08 | |
Kazkommertsbank JSC 8.500%, 04/16/2013 | | | | | 200,000 | | | | 200,000 | | | | 1.41 | |
Zhaikmunai LLP 10.500%, 10/19/2015(2) | | | | | 150,000 | | | | 155,250 | | | | 1.09 | |
| | | | | | | | | 521,000 | | | | 3.66 | |
Kuwait (Cost $105,623) | | | | | | | | | | | | | | |
Kuwait Projects Co. 9.375%, 07/15/2020 | | | | | 100,000 | | | | 110,350 | | | | 0.78 | |
| | | | | | | | | 110,350 | | | | 0.78 | |
Mexico (Cost $1,339,812) | | | | | | | | | | | | | | |
Cemex Espana Luxembourg 9.250%, 05/12/2020 | | | | | 100,000 | | | | 90,127 | | | | 0.63 | |
Cemex S.A.B. de C.V., FRN 5.470%, 09/30/2015 | | | | | 300,000 | | | | 267,000 | | | | 1.88 | |
Cemex S.A.B. de C.V. 9.000%, 01/11/2018(2) | | | | | 100,000 | | | | 93,750 | | | | 0.66 | |
Corp. GEO S.A.B. de C.V. 8.875%, 03/27/2022(2) | | | | | 200,000 | | | | 204,584 | | | | 1.44 | |
Desarrolladora Homex S.A.B. de C.V. 9.750%, 03/25/2020(2) | | | | | 100,000 | | | | 104,588 | | | | 0.73 | |
Grupo Papelero Scribe S.A. de C.V. 8.875%, 04/07/2020 | | | | | 100,000 | | | | 83,824 | | | | 0.59 | |
Grupo Televisa S.A.B. 8.500%, 03/11/2032 | | | | | 100,000 | | | | 135,486 | | | | 0.95 | |
RDS Ultra-Deepwater Ltd. 11.875%, 03/15/2017 | | | | | 100,000 | | | | 109,625 | | | | 0.77 | |
Urbi Desarrollos Urbanos S.A.B. de C.V. 9.750%, 02/03/2022(2) | | | | | 250,000 | | | | 261,188 | | | | 1.84 | |
| | | | | | | | | 1,350,172 | | | | 9.49 | |
See accompanying notes to the financial statements.
28
ASHMORE EMERGING MARKETS CORPORATE DEBT FUND
SCHEDULE OF INVESTMENTS (CONTINUED)
As of April 30, 2012 (Unaudited)
| | | | | | | | | | | | | | |
| | | Currency(1) | | Par | | | Value | | | % of Net
Assets | |
Nigeria (Cost $398,473) | | | | | | | | | | | | | | |
Afren PLC 11.500%, 02/01/2016(2) | | | | | 200,000 | | | $ | 216,500 | | | | 1.52 | |
Afren PLC 10.250%, 04/08/2019(2) | | | | | 200,000 | | | | 209,500 | | | | 1.47 | |
| | | | | | | | | 426,000 | | | | 2.99 | |
Panama (Cost $200,000) | | | | | | | | | | | | | | |
Sable International Finance Ltd. 8.750%, 02/01/2020(2) | | | | | 200,000 | | | | 212,500 | | | | 1.49 | |
| | | | | | | | | 212,500 | | | | 1.49 | |
Paraguay (Cost $350,000) | | | | | | | | | | | | | | |
Banco Bilbao Vizcaya Argentaria Paraguay S.A. 9.750%, 02/11/2016(2) | | | | | 150,000 | | | | 158,812 | | | | 1.12 | |
Mongolian Mining Corp. 8.875%, 03/29/2017(2) | | | | | 200,000 | | | | 199,250 | | | | 1.40 | |
| | | | | | | | | 358,062 | | | | 2.52 | |
Peru (Cost $104,318) | | | | | | | | | | | | | | |
Southern Copper Corp. 6.750%, 04/16/2040 | | | | | 100,000 | | | | 110,206 | | | | 0.77 | |
| | | | | | | | | 110,206 | | | | 0.77 | |
Philippines (Cost $114,547) | | | | | | | | | | | | | | |
Petron Corp. 7.000%, 11/10/2017 | | PHP | | | 5,000,000 | | | | 119,390 | | | | 0.84 | |
| | | | | | | | | 119,390 | | | | 0.84 | |
Poland (Cost $729,844) | | | | | | | | | | | | | | |
CEDC Finance Corp. International, Inc. 8.875%, 12/01/2016 | | EUR | | | 100,000 | | | | 103,253 | | | | 0.73 | |
Eileme 2 AB 11.625%, 01/31/2020(2) | | | | | 200,000 | | | | 205,500 | | | | 1.44 | |
Eileme 2 AB 11.750%, 01/31/2020 | | EUR | | | 100,000 | | | | 133,699 | | | | 0.94 | |
TVN Finance Corp. II AB 10.750%, 11/15/2017 | | EUR | | | 200,000 | | | | 275,672 | | | | 1.94 | |
| | | | | | | | | 718,124 | | | | 5.05 | |
Qatar (Cost $102,200) | | | | | | | | | | | | | | |
Nakilat, Inc. 6.267%, 12/31/2033 | | | | | 97,024 | | | | 105,766 | | | | 0.74 | |
| | | | | | | | | 105,766 | | | | 0.74 | |
Russian Federation (Cost $408,951) | | | | | | | | | | | | | | |
Evraz Group S.A. 9.500%, 04/24/2018 | | | | | 100,000 | | | | 108,875 | | | | 0.76 | |
Vimpel Communications Via VIP Finance Ireland Ltd. OJSC 7.748%, 02/02/2021(2) | | | | | 200,000 | | | | 198,522 | | | | 1.40 | |
VTB Bank OJSC Via VTB Capital S.A. 6.551%, 10/13/2020 | | | | | 100,000 | | | | 100,875 | | | | 0.71 | |
| | | | | | | | | 408,272 | | | | 2.87 | |
Saudi Arabia (Cost $196,412) | | | | | | | | | | | | | | |
Dar Al-Arkan International Sukuk Co., FRN 2.717%, 07/16/2012 | | | | | 200,000 | | | | 194,000 | | | | 1.36 | |
| | | | | | | | | 194,000 | | | | 1.36 | |
Singapore (Cost $200,000) | | | | | | | | | | | | | | |
MMI International Ltd. 8.000%, 03/01/2017(2) | | | | | 200,000 | | | | 207,000 | | | | 1.45 | |
| | | | | | | | | 207,000 | | | | 1.45 | |
South Africa (Cost $575,866) | | | | | | | | | | | | | | |
Edcon Pty Ltd., FRN 4.126%, 06/15/2014 | | EUR | | | 150,000 | | | | 175,004 | | | | 1.23 | |
Edcon Pty Ltd. 9.500%, 03/01/2018(2) | | | | | 150,000 | | | | 135,562 | | | | 0.95 | |
Foodcorp Pty Ltd. 8.750%, 03/01/2018 | | EUR | | | 100,000 | | | | 132,045 | | | | 0.93 | |
Standard Bank PLC 8.125%, 12/02/2019 | | | | | 100,000 | | | | 110,000 | | | | 0.77 | |
| | | | | | | | | 552,611 | | | | 3.88 | |
South Korea (Cost $299,562) | | | | | | | | | | | | | | |
Korea Gas Corp. 6.250%, 01/20/2042(2) | | | | | 200,000 | | | | 228,510 | | | | 1.61 | |
Shinhan Bank 6.819%, 09/20/2036 | | | | | 100,000 | | | | 102,558 | | | | 0.72 | |
| | | | | | | | | 331,068 | | | | 2.33 | |
Ukraine (Cost $401,657) | | | | | | | | | | | | | | |
MHP S.A. 10.250%, 04/29/2015 | | | | | 200,000 | | | | 195,000 | | | | 1.37 | |
See accompanying notes to the financial statements.
29
ASHMORE EMERGING MARKETS CORPORATE DEBT FUND
SCHEDULE OF INVESTMENTS (CONTINUED)
As of April 30, 2012 (Unaudited)
| | | | | | | | | | | | | | |
| | | Currency(1) | | Par | | | Value | | | % of Net
Assets | |
Ukraine - (continued) | | | | | | | | | | | | | | |
Privatbank CJSC Via UK SPV Credit Finance PLC 9.375%, 09/23/2015 | | | | | 200,000 | | | $ | 175,500 | | | | 1.23 | |
| | | | | | | | | 370,500 | | | | 2.60 | |
United Arab Emirates (Cost $1,652,264) | | | | | | | | | | | | | | |
Atlantic Finance Ltd. 10.750%, 05/27/2014 | | | | | 100,000 | | | | 109,500 | | | | 0.77 | |
Dana Gas Sukuk Ltd. 7.500%, 10/31/2012 | | | | | 200,000 | | | | 152,776 | | | | 1.07 | |
DP World Ltd. 6.850%, 07/02/2037 | | | | | 100,000 | | | | 96,000 | | | | 0.68 | |
Dubai Holding Commercial Operations MTN Ltd. 4.750%, 01/30/2014 | | EUR | | | 300,000 | | | | 368,335 | | | | 2.59 | |
Dubai Holding Commercial Operations MTN Ltd. 6.000%, 02/01/2017 | | GBP | | | 200,000 | | | | 269,399 | | | | 1.89 | |
Dubai Sukuk Centre Ltd., FRN 0.849%, 06/13/2012 | | | | | 400,000 | | | | 390,500 | | | | 2.75 | |
Jafz Sukuk Ltd., FRN 2.991%, 11/27/2012 | | AED | | | 1,000,000 | | | | 263,369 | | | | 1.85 | |
| | | | | | | | | 1,649,879 | | | | 11.60 | |
Total Debt Securities (Cost $14,348,280) | | | | | | | | | 13,750,307 | | | | 96.65 | |
| | | | |
Total Investments (Total Cost $14,348,280) | | | | | | | | | 13,750,307 | | | | 96.65 | |
| | | | |
Other Assets Less Liabilities (See Statements of Assets and Liabilities for further detail) | | | | | | | | | 476,385 | | | | 3.35 | |
| | | | |
Net Assets | | | | | | | | $ | 14,226,692 | | | | 100.00 | |
| (1) | Par values are stated in United States Dollars unless otherwise noted below. |
| (2) | All or a portion of this security is designated as 144A. |
| (3) | Issuer has defaulted on terms of debt obligation. |
Percentages shown are based on net assets.
At April 30, 2012, the Ashmore Emerging Markets Corporate Debt Fund had outstanding forward foreign currency exchange contracts as follows:
| | | | | | | | | | | | | | | | | | |
Settlement
Date | | Counterparty | | Currency Buy | | Currency Buy Amount
(Local
Currency) | | | Currency Sell | | Currency Sell Amount (Local Currency) | | | Unrealized Gain/(Loss) | |
05/21/2012 | | Barclays Wholesale GTS | | Euro | | | 89,654 | | | United States Dollar | | | 118,461 | | | | $225 | |
05/21/2012 | | HSBC | | United States Dollar | | | 263,843 | | | British Pound | | | 165,377 | | | | (4,507) | |
05/21/2012 | | Barclays Wholesale GTS | | United States Dollar | | | 832,101 | | | Euro | | | 631,097 | | | | (3,361) | |
05/21/2012 | | Union Bank of Switzerland | | United States Dollar | | | 832,171 | | | Euro | | | 631,097 | | | | (3,292) | |
05/25/2012 | | Barclays Wholesale GTS | | United States Dollar | | | 122,443 | | | Philippine Peso | | | 5,228,920 | | | | (1,140) | |
| | | | | | | | | | | | | | | | | | |
Total | | | | | | | | | | | | | | | | | $(12,075) | |
| | | | | | | | | | | | | | | | | | |
See accompanying notes to the financial statements.
30
ASHMORE EMERGING MARKETS CORPORATE DEBT FUND
SCHEDULE OF INVESTMENTS (CONTINUED)
As of April 30, 2012 (Unaudited)
The inputs or methodologies used for valuing securities are not necessarily an indication of the risks associated with investing in those securities and other financial instruments, if any. See note 4 in the Notes to Financial Statements for more information regarding pricing inputs and valuation techniques. The following is a summary of the inputs used in valuing the Ashmore Emerging Markets Corporate Debt Fund’s investments and other financial instruments, which are carried at fair value, as of April 30, 2012:
| | | | | | | | | | | | | | | | |
| | | Level 1 | | | Level 2 | | | Level 3 | | | Total | |
Investments | | | | | | | | | | | | | | | | |
Assets: | | | | | | | | | | | | | | | | |
Corporate Bonds | | | $— | | | $ | 12,659,514 | | | | $— | | | $ | 12,659,514 | |
Corporate Convertible Bonds | | | — | | | | 158,075 | | | | — | | | | 158,075 | |
Financial Certificates | | | — | | | | 737,276 | | | | — | | | | 737,276 | |
Index Linked Corporate Bonds | | | — | | | | 195,442 | | | | — | | | | 195,442 | |
Total Investments | | | $— | | | $ | 13,750,307 | | | | $— | | | $ | 13,750,307 | |
| | | | |
Other Financial Instruments | | | | | | | | | | | | | | | | |
Assets: | | | | | | | | | | | | | | | | |
Forward Foreign Currency Exchange Contracts | | | $— | | | $ | 225 | | | | $— | | | $ | 225 | |
Liabilities: | | | | | | | | | | | | | | | | |
Forward Foreign Currency Exchange Contracts | | | — | | | | (12,300 | ) | | | — | | | | (12,300 | ) |
Total Other Financial Instruments | | | $— | | | $ | (12,075 | ) | | | $— | | | $ | (12,075 | ) |
The Fund discloses significant transfers between levels based on valuations at the end of each reporting period. At April 30, 2012 there were no significant transfers between Level 1 and Level 2 based on levels assigned to the securities on October 31, 2011. U.S. Generally Accepted Accounting Principles (“U.S. GAAP”) provides additional guidance for estimating fair value when the volume and level of activity for the asset or liability have significantly decreased as well as guidance on identifying circumstances that indicate when a transaction is not orderly.
The following is a summary of the fair values of the Fund’s derivative instruments categorized by risk exposure*:
Fair Values of Financial Derivative Instruments on the Statements of Assets and Liabilities as of April 30, 2012:
| | | | |
| | | Derivatives Not Accounted
for as Hedging Instruments | |
| | | Foreign Exchange | |
Assets: | | | | |
Unrealized Appreciation on Forward Foreign Currency Exchange Contracts | | | $ 225 | |
| |
Liabilities: | | | | |
Unrealized Depreciation on Forward Foreign Currency Exchange Contracts | | | $ (12,300) | |
See accompanying notes to the financial statements.
31
ASHMORE EMERGING MARKETS CORPORATE DEBT FUND
SCHEDULE OF INVESTMENTS (CONTINUED)
As of April 30, 2012 (Unaudited)
The Effect of Financial Derivative Instruments on the Statements of Operations for the Period Ended April 30, 2012:
| | | | |
| | | Derivatives Not Accounted
for as Hedging Instruments | |
| | Foreign Exchange | |
Realized Gain on Derivatives Recognized resulting from Operations: | | | | |
Net Realized Gain on Forward Foreign Currency Exchange Contracts | | | $ 42,423 | |
| |
Net Change in Unrealized Appreciation on Derivatives Recognized resulting from Operations: | | | | |
Net Change in Unrealized Appreciation on Forward Foreign Currency Exchange Contracts | | | $ 34,947 | |
| * | See note 9 in the Notes to Financial Statements for additional information. |
See accompanying notes to the financial statements.
32
ASHMORE EMERGING MARKETS LOCAL CURRENCY BOND FUND
SCHEDULE OF INVESTMENTS
As of April 30, 2012 (Unaudited)
| | | | | | | | | | | | | | |
| | | Currency(1) | | Par | | | Value | | | % of Net
Assets | |
Debt Securities | | | | | | | | | | | | | | |
| | | | |
Brazil (Cost $5,715,032) | | | | | | | | | | | | | | |
Brazil (Fed Rep of) 8.500%, 01/05/2024 | | BRL | | | 3,040,000 | | | $ | 1,626,735 | | | | 2.41 | |
Brazil Notas do Tesouro Nacional Serie B 6.000%, 08/15/2020 | | BRL | | | 1,180,000 | | | | 1,474,885 | | | | 2.19 | |
Brazil Notas do Tesouro Nacional Serie F 10.000%, 01/01/2014 | | BRL | | | 1,500,000 | | | | 798,622 | | | | 1.18 | |
Brazil Notas do Tesouro Nacional Serie F 10.000%, 01/01/2017 | | BRL | | | 1,830,000 | | | | 954,449 | | | | 1.41 | |
Brazil Notas do Tesouro Nacional Serie F 10.000%, 01/01/2021 | | BRL | | | 1,210,000 | | | | 610,883 | | | | 0.91 | |
| | | | | | | | | 5,465,574 | | | | 8.10 | |
Chile (Cost $290,705) | | | | | | | | | | | | | | |
Chile (Rep of) 5.500%, 08/05/2020 | | CLP | | | 131,000,000 | | | | 282,187 | | | | 0.42 | |
| | | | | | | | | 282,187 | | | | 0.42 | |
China (Cost $307,702) | | | | | | | | | | | | | | |
Sinochem Offshore Capital Co. Ltd. 1.800%, 01/18/2014 | | CNY | | | 2,000,000 | | | | 306,941 | | | | 0.45 | |
| | | | | | | | | 306,941 | | | | 0.45 | |
Colombia (Cost $2,468,904) | | | | | | | | | | | | | | |
Colombia (Rep of) 12.000%, 10/22/2015 | | COP | | | 1,406,000,000 | | | | 998,771 | | | | 1.48 | |
Colombia (Rep of) 7.750%, 04/14/2021 | | COP | | | 1,941,000,000 | | | | 1,361,050 | | | | 2.02 | |
Colombia (Rep of) 9.850%, 06/28/2027 | | COP | | | 586,000,000 | | | | 491,791 | | | | 0.73 | |
| | | | | | | | | 2,851,612 | | | | 4.23 | |
Malaysia (Cost $2,574,642) | | | | | | | | | | | | | | |
Malaysia (Rep of) 4.262%, 09/15/2016 | | MYR | | | 1,800,000 | | | | 619,287 | | | | 0.92 | |
Malaysia (Rep of) 4.378%, 11/29/2019 | | MYR | | | 2,039,000 | | | | 711,317 | | | | 1.05 | |
Malaysia (Rep of) 4.160%, 07/15/2021 | | MYR | | | 2,630,000 | | | | 907,237 | | | | 1.34 | |
Malaysia (Rep of) 4.392%, 04/15/2026 | | MYR | | | 400,000 | | | | 138,644 | | | | 0.21 | |
Malaysia (Rep of) 4.498%, 04/15/2030 | | MYR | | | 835,000 | | | | 289,280 | | | | 0.43 | |
| | | | | | | | | 2,665,765 | | | | 3.95 | |
Mexico (Cost $6,757,813) | | | | | | | | | | | | | | |
Mexican Bonos 9.000%, 06/20/2013 | | MXN | | | 1,550,000 | | | | 124,815 | | | | 0.18 | |
Mexican Bonos 7.000%, 06/19/2014 | | MXN | | | 10,210,000 | | | | 821,200 | | | | 1.22 | |
Mexican Bonos 9.500%, 12/18/2014 | | MXN | | | 7,980,000 | | | | 684,130 | | | | 1.01 | |
Mexican Bonos 7.750%, 12/14/2017 | | MXN | | | 5,500,000 | | | | 471,062 | | | | 0.70 | |
Mexican Bonos 8.000%, 06/11/2020 | | MXN | | | 13,640,000 | | | | 1,189,289 | | | | 1.76 | |
Mexican Bonos 6.500%, 06/10/2021 | | MXN | | | 1,880,000 | | | | 148,428 | | | | 0.22 | |
Mexican Bonos 10.000%, 12/05/2024 | | MXN | | | 4,780,000 | | | | 484,342 | | | | 0.72 | |
Mexican Bonos 7.500%, 06/03/2027 | | MXN | | | 12,400,000 | | | | 1,018,065 | | | | 1.51 | |
Mexican Bonos 8.500%, 05/31/2029 | | MXN | | | 4,800,000 | | | | 426,838 | | | | 0.63 | |
Mexican Bonos 7.750%, 05/29/2031 | | MXN | | | 1,700,000 | | | | 139,146 | | | | 0.21 | |
Mexican Bonos 10.000%, 11/20/2036 | | MXN | | | 8,850,000 | | | | 881,165 | | | | 1.31 | |
Mexican Bonos 8.500%, 11/18/2038 | | MXN | | | 4,600,000 | | | | 399,071 | | | | 0.59 | |
| | | | | | | | | 6,787,551 | | | | 10.06 | |
Nigeria (Cost $324,946) | | | | | | | | | | | | | | |
Nigeria Treasury Bill 16.085%, 03/28/2013(2) | | NGN | | | 40,000,000 | | | | 223,499 | | | | 0.33 | |
Nigeria Treasury Bill 17.034%, 04/04/2013(2) | | NGN | | | 3,000,000 | | | | 16,719 | | | | 0.03 | |
Nigeria Treasury Bill 17.025%, 04/11/2013(2) | | NGN | | | 16,000,000 | | | | 88,357 | | | | 0.13 | |
| | | | | | | | | 328,575 | | | | 0.49 | |
Peru (Cost $909,844) | | | | | | | | | | | | | | |
Peru (Rep of) 8.600%, 08/12/2017 | | PEN | | | 420,000 | | | | 189,398 | | | | 0.28 | |
Peru (Rep of) 8.600%, 08/12/2017(3) | | PEN | | | 290,000 | | | | 130,765 | | | | 0.19 | |
See accompanying notes to the financial statements.
33
ASHMORE EMERGING MARKETS LOCAL CURRENCY BOND FUND
SCHEDULE OF INVESTMENTS (CONTINUED)
As of April 30, 2012 (Unaudited)
| | | | | | | | | | | | | | |
| | | Currency(1) | | Par | | | Value | | | % of Net
Assets | |
Peru - (continued) | | | | | | | | | | | | | | |
Peru (Rep of) 7.840%, 08/12/2020 | | PEN | | | 465,000 | | | $ | 207,852 | | | | 0.31 | |
Peru (Rep of) 7.840%, 08/12/2020(3) | | PEN | | | 314,000 | | | | 140,066 | | | | 0.21 | |
Peru (Rep of) 8.200%, 08/12/2026 | | PEN | | | 387,000 | | | | 183,413 | | | | 0.27 | |
Peru (Rep of) 6.950%, 08/12/2031 | | PEN | | | 410,000 | | | | 172,728 | | | | 0.26 | |
| | | | | | | | | 1,024,222 | | | | 1.52 | |
Philippines (Cost $533,304) | | | | | | | | | | | | | | |
Philippines (Rep of) 4.950%, 01/15/2021 | | PHP | | | 15,000,000 | | | | 369,419 | | | | 0.55 | |
Philippines (Rep of) 6.250%, 01/14/2036 | | PHP | | | 10,000,000 | | | | 250,423 | | | | 0.37 | |
| | | | | | | | | 619,842 | | | | 0.92 | |
Poland (Cost $2,714,828) | | | | | | | | | | | | | | |
Poland (Rep of) 5.304%, 07/25/2013(2) | | PLN | | | 1,730,000 | | | | 519,033 | | | | 0.77 | |
Poland (Rep of) 4.606%, 01/25/2014(2) | | PLN | | | 3,259,000 | | | | 955,231 | | | | 1.42 | |
Poland (Rep of) 6.250%, 10/24/2015 | | PLN | | | 430,000 | | | | 142,924 | | | | 0.21 | |
Poland (Rep of) 4.750%, 10/25/2016 | | PLN | | | 1,680,000 | | | | 530,005 | | | | 0.78 | |
Poland (Rep of) 5.750%, 09/23/2022 | | PLN | | | 1,540,000 | | | | 500,294 | | | | 0.74 | |
| | | | | | | | | 2,647,487 | | | | 3.92 | |
Russian Federation (Cost $7,401,392) | | | | | | | | | | | | | | |
Russian Federal Bond - OFZ 7.100%, 03/13/2014 | | RUB | | | 31,970,000 | | | | 1,096,721 | | | | 1.62 | |
Russian Federal Bond - OFZ 8.100%, 11/26/2014 | | RUB | | | 12,100,000 | | | | 423,734 | | | | 0.63 | |
Russian Federal Bond - OFZ 11.200%, 12/17/2014 | | RUB | | | 12,925,000 | | | | 486,935 | | | | 0.72 | |
Russian Federal Bond - OFZ 6.880%, 07/15/2015 | | RUB | | | 5,150,000 | | | | 174,829 | | | | 0.26 | |
Russian Federal Bond - OFZ 7.350%, 01/20/2016 | | RUB | | | 12,590,000 | | | | 431,253 | | | | 0.64 | |
Russian Federal Bond - OFZ 6.900%, 08/03/2016 | | RUB | | | 20,590,000 | | | | 691,968 | | | | 1.03 | |
Russian Federal Bond - OFZ 7.400%, 06/14/2017 | | RUB | | | 56,570,000 | | | | 1,919,438 | | | | 2.84 | |
Russian Federal Bond - OFZ 7.500%, 03/15/2018 | | RUB | | | 36,620,000 | | | | 1,243,151 | | | | 1.84 | |
Russian Federal Bond - OFZ 7.500%, 02/27/2019 | | RUB | | | 15,800,000 | | | | 533,002 | | | | 0.79 | |
Russian Federal Bond - OFZ 7.600%, 04/14/2021 | | RUB | | | 14,000,000 | | | | 469,545 | | | | 0.70 | |
| | | | | | | | | 7,470,576 | | | | 11.07 | |
South Africa (Cost $6,267,267) | | | | | | | | | | | | | | |
South Africa (Rep of) 13.500%, 09/15/2015 | | ZAR | | | 4,050,250 | | | | 630,002 | | | | 0.93 | |
South Africa (Rep of) 8.250%, 09/15/2017 | | ZAR | | | 5,730,000 | | | | 777,685 | | | | 1.15 | |
South Africa (Rep of) 8.000%, 12/21/2018 | | ZAR | | | 9,210,000 | | | | 1,227,799 | | | | 1.82 | |
South Africa (Rep of) 7.250%, 01/15/2020 | | ZAR | | | 7,026,200 | | | | 887,648 | | | | 1.32 | |
South Africa (Rep of) 6.750%, 03/31/2021 | | ZAR | | | 8,020,000 | | | | 971,813 | | | | 1.44 | |
South Africa (Rep of) 10.500%, 12/21/2026 | | ZAR | | | 9,100,000 | | | | 1,400,845 | | | | 2.08 | |
South Africa (Rep of) 7.000%, 02/28/2031 | | ZAR | | | 1,700,000 | | | | 186,667 | | | | 0.28 | |
| | | | | | | | | 6,082,459 | | | | 9.02 | |
Thailand (Cost $2,314,274) | | | | | | | | | | | | | | |
Thailand (Rep of) 5.125%, 03/13/2018 | | THB | | | 13,100,000 | | | | 457,152 | | | | 0.68 | |
Thailand (Rep of) 3.875%, 06/13/2019 | | THB | | | 7,000,000 | | | | 229,015 | | | | 0.34 | |
Thailand (Rep of) 1.200%, 07/14/2021 | | THB | | | 20,000,000 | | | | 665,814 | | | | 0.99 | |
Thailand (Rep of) 3.650%, 12/17/2021 | | THB | | | 13,000,000 | | | | 416,958 | | | | 0.62 | |
Thailand (Rep of) 5.500%, 03/13/2023 | | THB | | | 8,900,000 | | | | 327,553 | | | | 0.48 | |
Thailand (Rep of) 4.750%, 12/20/2024 | | THB | | | 5,280,000 | | | | 184,702 | | | | 0.27 | |
| | | | | | | | | 2,281,194 | | | | 3.38 | |
Turkey (Cost $3,202,316) | | | | | | | | | | | | | | |
Turkey (Rep of) 9.887%, 11/07/2012(2) | | TRY | | | 1,168,300 | | | | 633,796 | | | | 0.94 | |
Turkey (Rep of) 16.000%, 08/28/2013 | | TRY | | | 488,000 | | | | 300,538 | | | | 0.44 | |
Turkey (Rep of) 9.000%, 05/21/2014 | | TRY | | | 1,267,000 | | | | 1,020,759 | | | | 1.51 | |
Turkey (Rep of) 10.500%, 01/15/2020 | | TRY | | | 1,250,000 | | | | 766,974 | | | | 1.14 | |
Turkey (Rep of) 4.000%, 04/01/2020 | | TRY | | | 741,000 | | | | 509,937 | | | | 0.76 | |
| | | | | | | | | 3,232,004 | | | | 4.79 | |
Uruguay (Cost $1,503,330) | | | | | | | | | | | | | | |
Uruguay (Rep of) 5.000%, 09/14/2018 | | UYU | | | 7,200,000 | | | | 642,777 | | | | 0.95 | |
See accompanying notes to the financial statements.
34
ASHMORE EMERGING MARKETS LOCAL CURRENCY BOND FUND
SCHEDULE OF INVESTMENTS (CONTINUED)
As of April 30, 2012 (Unaudited)
| | | | | | | | | | | | | | |
| | | Currency(1) | | Par | | | Value | | | % of Net
Assets | |
Uruguay - (continued) | | | | | | | | | | | | | | |
Uruguay (Rep of) 4.250%, 04/05/2027 | | UYU | | | 4,399,000 | | | $ | 360,135 | | | | 0.54 | |
Uruguay (Rep of) 4.375%, 12/15/2028 | | UYU | | | 6,150,000 | | | | 369,456 | | | | 0.55 | |
Uruguay (Rep of) 3.700%, 06/26/2037 | | UYU | | | 1,970,000 | | | | 146,900 | | | | 0.22 | |
Uruguay Notas del Tesoro 9.000%, 01/27/2014 | | UYU | | | 1,800,000 | | | | 90,228 | | | | 0.13 | |
Uruguay Notas del Tesoro 3.250%, 01/27/2019 | | UYU | | | 700,000 | | | | 88,993 | | | | 0.13 | |
| | | | | | | | | 1,698,489 | | | | 2.52 | |
Total Debt Securities (Cost $43,286,299) | | | | | | | | | 43,744,478 | | | | 64.84 | |
| | | | |
Short-Term Investments | | | | | | | | | | | | | | |
UBS London FX- Insight, Time Deposit 0.120%, 04/30/2012 | | | | | 10,000,000 | | | | 10,000,000 | | | | 14.82 | |
UBS London FX- Insight, Time Deposit 0.080%, 05/02/2012 | | | | | 10,000,000 | | | | 10,000,000 | | | | 14.82 | |
Total Short-Term Investments (Cost $20,000,000) | | | | | | | | | 20,000,000 | | | | 29.64 | |
| | | | |
Fully Funded Total Return Swaps | | | | | | | | | | | | | | |
| | | | |
India (Cost $682,100) | | | | | | | | | | | | | | |
India (Rep of), Issued by HSBC, 7.490%, 04/16/2017 | | INR | | | 4,960,000 | | | | 90,263 | | | | 0.13 | |
India (Rep of), Issued by HSBC, 7.830%, 04/11/2018 | | INR | | | 15,440,000 | | | | 282,137 | | | | 0.42 | |
India (Rep of), Issued by HSBC, 9.150%, 11/14/2024 | | INR | | | 11,000,000 | | | | 215,304 | | | | 0.32 | |
| | | | | | | | | 587,704 | | | | 0.87 | |
Indonesia (Cost $4,324,552) | | | | | | | | | | | | | | |
Indonesia (Rep of), Issued by Barclays, 9.500%, 07/15/2031 | | IDR | | | 2,932,000,000 | | | | 410,306 | | | | 0.61 | |
Indonesia (Rep of), Issued by Credit Suisse, 9.500%, 06/15/2015 | | IDR | | | 1,500,000,000 | | | | 185,391 | | | | 0.27 | |
Indonesia (Rep of), Issued by Credit Suisse, 8.375%, 09/15/2026 | | IDR | | | 2,100,000,000 | | | | 267,601 | | | | 0.40 | |
Indonesia (Rep of), Issued by Deutsche Bank, 12.800%, 06/15/2021 | | IDR | | | 6,452,000,000 | | | | 1,034,515 | | | | 1.53 | |
Indonesia (Rep of), Issued by Deutsche Bank, 9.500%, 07/15/2031 | | IDR | | | 1,500,000,000 | | | | 209,911 | | | | 0.31 | |
Indonesia (Rep of), Issued by HSBC, 11.000%, 11/15/2020 | | IDR | | | 3,100,000,000 | | | | 451,523 | | | | 0.67 | |
Indonesia (Rep of), Issued by HSBC, 10.500%, 08/15/2030 | | IDR | | | 2,180,000,000 | | | | 327,602 | | | | 0.49 | |
Indonesia (Rep of), Issued by HSBC, 9.500%, 07/15/2031 | | IDR | | | 1,500,000,000 | | | | 209,911 | | | | 0.31 | |
Indonesia (Rep of), Issued by Standard Chartered, 11.500%, 09/15/2019 | | IDR | | | 7,936,000,000 | | | | 1,153,740 | | | | 1.71 | |
Indonesia (Rep of), Issued by Standard Chartered, 8.375%, 09/15/2026 | | IDR | | | 2,100,000,000 | | | | 267,601 | | | | 0.40 | |
Indonesia (Rep of), Issued by Standard Chartered, 9.500%, 07/15/2031 | | IDR | | | 1,700,000,000 | | | | 237,899 | | | | 0.35 | |
| | | | | | | | | 4,756,000 | | | | 7.05 | |
Total Fully Funded Total Return Swaps (Cost $5,006,652) | | | | | | | | | 5,343,704 | | | | 7.92 | |
| | | | |
Total Investments (Total Cost $68,292,951) | | | | | | | | | 69,088,182 | | | | 102.40 | |
| | |
Liabilities Less Other Assets (See Statements of Assets and Liabilities
for further detail) | | | | (1,618,024 | ) | | | (2.40 | ) |
| | | | |
Net Assets | | | | | | | | $ | 67,470,158 | | | | 100.00 | |
See accompanying notes to the financial statements.
35
ASHMORE EMERGING MARKETS LOCAL CURRENCY BOND FUND
SCHEDULE OF INVESTMENTS (CONTINUED)
As of April 30, 2012 (Unaudited)
| (1) | Par values are stated in United States Dollars unless otherwise noted below. |
| (2) | Zero coupon bond reflects effective yield on the date of purchase. |
| (3) | All or a portion of this security is designated as 144A. |
Percentages shown are based on net assets.
At April 30, 2012, the Ashmore Emerging Markets Local Currency Bond Fund had open futures contracts as follows:
| | | | | | | | | | | | |
| Futures Contracts | | Number of
Contracts | | Notional
Value | | | Settlement
Month | | Unrealized
Gain/(Loss) | |
Short | | | | | | | | | | | | |
U.S. Treasury Bonds | | (5) | | $ | 789,063 | | | June 2012 | | $ | (42,103 | ) |
| | | | | | | | | | | | |
At April 30, 2012, the Ashmore Emerging Markets Local Currency Bond Fund had outstanding forward foreign currency exchange contracts as follows:
| | | | | | | | | | | | | | | | | | |
Settlement
Date | | Counterparty | | Currency Buy | | Currency
Buy Amount
(Local
Currency) | | | Currency Sell | | Currency Sell Amount
(Local
Currency) | | | Unrealized
Gain/(Loss) | |
05/03/2012 | | Barclays Wholesale GTS | | Brazilian Real | | | 348,612 | | | United States Dollar | | | 190,000 | | | | $(7,237 | ) |
05/03/2012 | | Barclays Wholesale GTS | | Brazilian Real | | | 959,109 | | | United States Dollar | | | 520,000 | | | | (17,179 | ) |
05/03/2012 | | Barclays Wholesale GTS | | Brazilian Real | | | 350,000 | | | United States Dollar | | | 190,166 | | | | (6,675 | ) |
05/03/2012 | | Barclays Wholesale GTS | | Brazilian Real | | | 240,201 | | | United States Dollar | | | 130,000 | | | | (4,073 | ) |
05/03/2012 | | Barclays Wholesale GTS | | Brazilian Real | | | 490,000 | | | United States Dollar | | | 262,242 | | | | (5,356 | ) |
05/03/2012 | | Barclays Wholesale GTS | | United States Dollar | | | 850,000 | | | Brazilian Real | | | 1,607,920 | | | | 7,035 | |
05/03/2012 | | Barclays Wholesale GTS | | United States Dollar | | | 207,668 | | | Brazilian Real | | | 390,001 | | | | 3,207 | |
05/03/2012 | | HSBC | | United States Dollar | | | 207,337 | | | Brazilian Real | | | 390,001 | | | | 2,876 | |
05/10/2012 | | Bank of America Los Angeles | | Russian Rouble | | | 33,700,000 | | | United States Dollar | | | 1,052,089 | | | | 92,906 | |
05/10/2012 | | Barclays Wholesale GTS | | United States Dollar | | | 817,944 | | | Russian Rouble | | | 24,139,585 | | | | (2,226 | ) |
05/14/2012 | | Standard Chartered London | | Indian Rupee | | | 36,635,588 | | | United States Dollar | | | 710,956 | | | | (18,229 | ) |
05/14/2012 | | Barclays Wholesale GTS | | Russian Rouble | | | 53,823,640 | | | United States Dollar | | | 1,780,000 | | | | 47,508 | |
05/14/2012 | | Union Bank of Switzerland | | Russian Rouble | | | 5,895,640 | | | United States Dollar | | | 198,975 | | | | 1,203 | |
05/14/2012 | | HSBC | | United States Dollar | | | 439,887 | | | Russian Rouble | | | 13,072,333 | | | | (3,966 | ) |
05/14/2012 | | Union Bank of Switzerland | | United States Dollar | | | 340,000 | | | Russian Rouble | | | 10,055,500 | | | | (1,421 | ) |
05/14/2012 | | Union Bank of Switzerland | | United States Dollar | | | 1,370,000 | | | Russian Rouble | | | 40,454,593 | | | | (3,580 | ) |
05/18/2012 | | Bank of America Los Angeles | | Chilean Peso | | | 97,910,012 | | | United States Dollar | | | 200,327 | | | | 1,732 | |
05/18/2012 | | Morgan Stanley & Co. International | | Chilean Peso | | | 97,910,013 | | | United States Dollar | | | 200,923 | | | | 1,136 | |
05/18/2012 | | Union Bank of Switzerland | | Chilean Peso | | | 72,922,500 | | | United States Dollar | | | 150,000 | | | | 492 | |
05/18/2012 | | Barclays Wholesale GTS | | Mexican Peso | | | 26,077,743 | | | United States Dollar | | | 2,021,530 | | | | (23,321 | ) |
05/18/2012 | | Citibank London | | Mexican Peso | | | 1,171,107 | | | United States Dollar | | | 90,000 | | | | (264 | ) |
05/18/2012 | | Deutsche Bank London | | Mexican Peso | | | 347,130 | | | United States Dollar | | | 26,681 | | | | (82 | ) |
05/18/2012 | | Deutsche Bank London | | United States Dollar | | | 320,000 | | | Colombian Peso | | | 574,694,400 | | | | (5,886 | ) |
05/21/2012 | | Deutsche Bank London | | Thai Baht | | | 3,081,500 | | | United States Dollar | | | 100,000 | | | | 98 | |
05/21/2012 | | Union Bank of Switzerland | | Thai Baht | | | 33,379,824 | | | United States Dollar | | | 1,076,769 | | | | 7,522 | |
05/21/2012 | | Chase Manhattan Bank London | | United States Dollar | | | 86,781 | | | Malaysian Ringgit | | | 267,173 | | | | (1,364 | ) |
05/21/2012 | | HSBC | | United States Dollar | | | 195,417 | | | Thai Baht | | | 6,032,514 | | | | (540 | ) |
05/25/2012 | | Barclays Wholesale GTS | | United States Dollar | | | 288,097 | | | Philippine Peso | | | 12,303,188 | | | | (2,683 | ) |
05/29/2012 | | Bank of America Los Angeles | | Russian Rouble | | | 6,020,167 | | | United States Dollar | | | 199,528 | | | | 4,370 | |
05/30/2012 | | Bank of America Los Angeles | | Russian Rouble | | | 8,009,550 | | | United States Dollar | | | 270,000 | | | | 1,232 | |
05/30/2012 | | Chase Manhattan Bank London | | United States Dollar | | | 392,289 | | | Russian Rouble | | | 11,574,101 | | | | 349 | |
05/31/2012 | | Chase Manhattan Bank London | | Hungarian Forint | | | 289,149,201 | | | United States Dollar | | | 1,314,852 | | | | 13,154 | |
05/31/2012 | | Barclays Wholesale GTS | | Polish Zloty | | | 1,970,032 | | | United States Dollar | | | 632,476 | | | | (9,891 | ) |
05/31/2012 | | Bank of America Los Angeles | | United States Dollar | | | 1,760,406 | | | Czech Koruna | | | 33,365,412 | | | | (9,937 | ) |
06/04/2012 | | Deutsche Bank London | | Brazilian Real | | | 3,174,990 | | | United States Dollar | | | 1,817,916 | | | | (164,987 | ) |
06/04/2012 | | Deutsche Bank London | | Brazilian Real | | | 322,575 | | | United States Dollar | | | 170,000 | | | | (2,065 | ) |
06/12/2012 | | Barclays Wholesale GTS | | Indonesian Rupiah | | | 4,316,440,818 | | | United States Dollar | | | 468,567 | | | | (1,010 | ) |
See accompanying notes to the financial statements.
36
ASHMORE EMERGING MARKETS LOCAL CURRENCY BOND FUND
SCHEDULE OF INVESTMENTS (CONTINUED)
As of April 30, 2012 (Unaudited)
| | | | | | | | | | | | | | | | | | |
Settlement Date | | Counterparty | | Currency Buy | | Currency Buy Amount (Local
Currency) | | | Currency Sell | | Currency Sell Amount
(Local
Currency) | | | Unrealized Gain/(Loss) | |
06/21/2012 | | Union Bank of Switzerland | | Thai Baht | | | 40,087,033 | | | United States Dollar | | | 1,305,341 | | | | $(5,288 | ) |
06/22/2012 | | Banco Santander New York | | Mexican Peso | | | 13,815,279 | | | United States Dollar | | | 1,039,329 | | | | 15,922 | |
06/22/2012 | | Barclays Wholesale GTS | | Mexican Peso | | | 24,344,150 | | | United States Dollar | | | 1,850,000 | | | | 9,477 | |
06/22/2012 | | Deutsche Bank London | | United States Dollar | | | 971,822 | | | Peruvian Nuevo Sol | | | 2,588,935 | | | | (7,983 | ) |
06/29/2012 | | Bank of America Los Angeles | | Hungarian Forint | | | 348,090,750 | | | United States Dollar | | | 1,590,000 | | | | 2,527 | |
06/29/2012 | | Union Bank of Switzerland | | Hungarian Forint | | | 254,789,202 | | | United States Dollar | | | 1,112,131 | | | | 53,538 | |
06/29/2012 | | Chase Manhattan Bank London | | Polish Zloty | | | 6,980,867 | | | United States Dollar | | | 2,189,286 | | | | 9,603 | |
06/29/2012 | | Barclays Wholesale GTS | | South African Rand | | | 8,171,069 | | | United States Dollar | | | 1,049,699 | | | | (7,810 | ) |
06/29/2012 | | Deutsche Bank London | | South African Rand | | | 1,243,537 | | | United States Dollar | | | 160,000 | | | | (1,437 | ) |
06/29/2012 | | Deutsche Bank London | | United States Dollar | | | 2,124,519 | | | Euro | | | 1,592,533 | | | | 15,878 | |
06/29/2012 | | Citibank London | | United States Dollar | | | 445,010 | | | South African Rand | | | 3,519,047 | | | | (3,702 | ) |
07/03/2012 | | Deutsche Bank London | | Brazilian Real | | | 1,119,292 | | | United States Dollar | | | 602,418 | | | | (22,455 | ) |
07/03/2012 | | HSBC | | Brazilian Real | | | 1,119,292 | | | United States Dollar | | | 603,620 | | | | (23,658 | ) |
07/03/2012 | | Citibank London | | United States Dollar | | | 1,093,884 | | | Brazilian Real | | | 2,038,672 | | | | 37,544 | |
07/18/2012 | | Chase Manhattan Bank London | | Malaysian Ringgit | | | 6,143,584 | | | United States Dollar | | | 2,015,281 | | | | 3,716 | |
07/18/2012 | | Standard Chartered London | | Malaysian Ringgit | | | 7,071,235 | | | United States Dollar | | | 2,296,452 | | | | 27,404 | |
07/18/2012 | | Bank of America Los Angeles | | Thai Baht | | | 23,645,932 | | | United States Dollar | | | 760,075 | | | | 5,639 | |
07/19/2012 | | Union Bank of Switzerland | | Korean Won | | | 2,941,531,101 | | | United States Dollar | | | 2,574,419 | | | | 26,995 | |
07/25/2012 | | Deutsche Bank London | | Turkish Lira | | | 4,147,073 | | | United States Dollar | | | 2,311,240 | | | | 6,603 | |
07/25/2012 | | HSBC | | Turkish Lira | | | 196,867 | | | United States Dollar | | | 110,000 | | | | 31 | |
07/25/2012 | | HSBC | | United States Dollar | | | 1,430,051 | | | Turkish Lira | | | 2,610,915 | | | | (29,218 | ) |
07/26/2012 | | Bank of America Los Angeles | | United States Dollar | | | 1,420,000 | | | Russian Rouble | | | 42,140,346 | | | | 4,265 | |
08/02/2012 | | Barclays Wholesale GTS | | Brazilian Real | | | 390,001 | | | United States Dollar | | | 204,296 | | | | (3,323 | ) |
08/02/2012 | | HSBC | | Brazilian Real | | | 390,001 | | | United States Dollar | | | 203,954 | | | | (2,981 | ) |
08/13/2012 | | Citibank London | | Colombian Peso | | | 540,480,000 | | | United States Dollar | | | 302,451 | | | | 2,289 | |
08/13/2012 | | Citibank London | | United States Dollar | | | 476,609 | | | Colombian Peso | | | 860,160,000 | | | | (8,378 | ) |
08/21/2012 | | Standard Chartered London | | Thai Baht | | | 43,479,584 | | | United States Dollar | | | 1,403,473 | | | | 2,127 | |
08/24/2012 | | Bank of America Los Angeles | | Colombian Peso | | | 73,380,000 | | | United States Dollar | | | 40,697 | | | | 615 | |
08/24/2012 | | Chase Manhattan Bank London | | Colombian Peso | | | 744,000,000 | | | United States Dollar | | | 415,468 | | | | 3,392 | |
08/24/2012 | | Bank of America Los Angeles | | United States Dollar | | | 477,933 | | | Colombian Peso | | | 860,160,000 | | | | (6,323 | ) |
08/28/2012 | | Union Bank of Switzerland | | Colombian Peso | | | 1,239,930,000 | | | United States Dollar | | | 690,000 | | | | 7,678 | |
09/26/2012 | | HSBC | | Russian Rouble | | | 21,798,967 | | | United States Dollar | | | 637,397 | | | | 88,322 | |
09/26/2012 | | HSBC | | United States Dollar | | | 615,923 | | | Russian Rouble | | | 18,740,686 | | | | (7,981 | ) |
04/15/2013 | | HSBC | | Chinese Offshore Yuan | | | 4,273,930 | | | United States Dollar | | | 670,000 | | | | 42 | |
04/15/2013 | | HSBC | | Chinese Offshore Yuan | | | 4,280,295 | | | United States Dollar | | | 670,000 | | | | 1,040 | |
05/02/2013 | | Standard Chartered London | | Chinese Offshore Yuan | | | 8,562,600 | | | United States Dollar | | | 1,340,000 | | | | 1,837 | |
04/13/2015 | | HSBC | | United States Dollar | | | 670,000 | | | Chinese Offshore Yuan | | | 4,330,210 | | | | (8,583 | ) |
04/13/2015 | | HSBC | | United States Dollar | | | 670,000 | | | Chinese Offshore Yuan | | | 4,343,945 | | | | (10,736 | ) |
05/04/2015 | | Standard Chartered London | | United States Dollar | | | 1,340,000 | | | Chinese Offshore Yuan | | | 8,720,720 | | | | (26,616 | ) |
| | | | | | | | | | | | | | | | | | |
Total | | | | | | | | | | | | | | | | | $42,860 | |
| | | | | | | | | | | | | | | | | | |
At April 30, 2012, the Ashmore Emerging Markets Local Currency Bond Fund had the following interest rate swap contracts outstanding:
| | | | | | | | | | | | | | |
Pay Rate Index/ Pay Rate | | Receive Rate/
Receive Rate Index | | Notional
Amount | | | Expiration
Date | | Unrealized
Gain/(Loss) | | Counterparty |
Brazil CETIP Interbank Deposit Rate | | 9.968% | | BRL | | | 1,712,245 | | | 01/02/2013 | | $40,665 | | HSBC |
Brazil CETIP Interbank Deposit Rate | | 9.735% | | | | | 838,750 | | | 01/02/2014 | | 7,937 | | Morgan
Stanley |
Brazil CETIP Interbank Deposit Rate | | 9.730% | | | | | 3,017,429 | | | 01/02/2014 | | 28,414 | | HSBC |
Brazil CETIP Interbank Deposit Rate | | 9.725% | | | | | 4,081,108 | | | 01/02/2014 | | 38,241 | | HSBC |
See accompanying notes to the financial statements.
37
ASHMORE EMERGING MARKETS LOCAL CURRENCY BOND FUND
SCHEDULE OF INVESTMENTS (CONTINUED)
As of April 30, 2012 (Unaudited)
| | | | | | | | | | | | | | |
Pay Rate Index/ Pay Rate | | Receive Rate/
Receive Rate Index | | | | Notional
Amount | | | Expiration
Date | | Unrealized
Gain/(Loss) | | Counterparty |
Brazil CETIP Interbank | | | | | | | | | | | | | | |
Deposit Rate | | 10.340% | | | | | 1,122,402 | | | 01/02/2014 | | $16,063 | | HSBC |
| | Czech Interbank Offered | | | | | | | | | | | | Morgan |
1.730% | | Rates 6 Months | | CZK | | | 28,100,000 | | | 03/13/2017 | | 3,236 | | Stanley |
| | Czech Interbank Offered | | | | | | | | | | | | Morgan |
1.755% | | Rates 6 Months | | | | | 28,200,000 | | | 03/15/2017 | | 1,391 | | Stanley |
Mexico Interbank | | | | | | | | | | | | | | Barclays |
TIIE 28 Day Rate | | 6.515% | | MXN | | | 48,000,000 | | | 07/01/2016 | | 174,648 | | Capital |
Mexico Interbank | | | | | | | | | | | | | | Barclays |
TIIE 28 Day Rate | | 5.890% | | | | | 7,300,000 | | | 09/27/2016 | | 12,101 | | Capital |
South Africa Johannesburg | | | | | | | | | | | | | | Barclays |
Interbank Agreed Rate 3 Month | | 7.580% | | ZAR | | | 2,000,000 | | | 12/08/2017 | | 8,600 | | Capital |
South Africa Johannesburg | | | | | | | | | | | | | | Barclays |
Interbank Agreed Rate 3 Month | | 7.400% | | | | | 1,380,000 | | | 01/04/2018 | | 4,062 | | Capital |
South Africa Johannesburg | | | | | | | | | | | | | | Barclays |
Interbank Agreed Rate 3 Month | | 7.700% | | | | | 1,850,000 | | | 12/08/2018 | | 8,018 | | Capital |
South Africa Johannesburg | | | | | | | | | | | | | | Barclays |
Interbank Agreed Rate 3 Month | | 7.72% | | | | | 450,000 | | | 12/17/2018 | | 1,982 | | Capital |
South Africa Johannesburg | | | | | | | | | | | | | | Barclays |
Interbank Agreed Rate 3 Month | | 7.630% | | | | | 430,000 | | | 12/31/2018 | | 1,553 | | Capital |
| | | | | | | | | | | | | | |
| | | | | | | | | | | | $346,911 | | |
| | | | | | | | | | | | | | |
See accompanying notes to the financial statements.
38
ASHMORE EMERGING MARKETS LOCAL CURRENCY BOND FUND
SCHEDULE OF INVESTMENTS (CONTINUED)
As of April 30, 2012 (Unaudited)
The inputs or methodologies used for valuing securities are not necessarily an indication of the risks associated with investing in those securities and other financial instruments, if any. See note 4 in the Notes to Financial Statements for more information regarding pricing inputs and valuation techniques. The following is a summary of the inputs used in valuing the Ashmore Emerging Markets Local Currency Bond Fund’s investments and other financial instruments, which are carried at fair value, as of April 30, 2012:
| | | | | | | | | | | | | | | | |
| | | Level 1 | | | Level 2 | | | Level 3 | | | Total | |
Investments | | | | | | | | | | | | | | | | |
Assets: | | | | | | | | | | | | | | | | |
Corporate Bonds | | $ | — | | | $ | 306,941 | | | $ | — | | | $ | 306,941 | |
Government Bonds | | | — | | | | 38,246,873 | | | | — | | | | 38,246,873 | |
Index Linked Government Bonds | | | — | | | | 5,190,664 | | | | — | | | | 5,190,664 | |
Fully Funded Total Return Swaps | | | — | | | | 5,343,704 | | | | — | | | | 5,343,704 | |
Short-Term Investments | | | — | | | | 20,000,000 | | | | — | | | | 20,000,000 | |
| |
Total Investments | | $ | — | | | $ | 69,088,182 | | | $ | — | | | $ | 69,088,182 | |
| |
| | | | |
Other Financial Instruments | | | | | | | | | | | | | | | | |
Assets: | | | | | | | | | | | | | | | | |
Forward Foreign Currency Exchange Contracts | | $ | — | | | $ | 511,304 | | | $ | — | | | $ | 511,304 | |
Interest Rate Swap Contracts | | | — | | | | 346,911 | | | | — | | | | 346,911 | |
Liabilities: | | | | | | | | | | | | | | | | |
Forward Foreign Currency Exchange Contracts | | | — | | | | (468,444 | ) | | | — | | | | (468,444 | ) |
Futures Contracts | | | (42,103 | ) | | | — | | | | — | | | | (42,103 | ) |
| |
Total Other Financial Instruments | | $ | (42,103 | ) | | $ | 389,771 | | | $ | — | | | $ | 347,668 | |
| |
The Fund discloses significant transfers between levels based on valuations at the end of each reporting period. At April 30, 2012 there were no significant transfers between Level 1 and Level 2 based on levels assigned to the securities on October 31, 2011. U.S. GAAP provides additional guidance for estimating fair value when the volume and level of activity for the asset or liability have significantly decreased as well as guidance on identifying circumstances that indicate when a transaction is not orderly.
See accompanying notes to the financial statements.
39
ASHMORE EMERGING MARKETS LOCAL CURRENCY BOND FUND
SCHEDULE OF INVESTMENTS (CONTINUED)
As of April 30, 2012 (Unaudited)
The following is a summary of the fair values of the Fund’s derivative instruments categorized by risk exposure* :
Fair Values of Financial Derivative Instruments on the Statements of Assets and Liabilities as of April 30, 2012:
| | | | | | | | |
| | | Derivatives Not Accounted for as
Hedging Instruments | |
| | | Foreign Exchange | | | Fixed Income/ Interest Rate | |
Assets: | | | | | | | | |
Unrealized Appreciation on Interest Rate Swap Contracts | | $ | — | | | $ | 346,911 | |
Unrealized Appreciation on Forward Foreign Currency Exchange Contracts | | | 511,304 | | | | — | |
| | | | |
| | $ | 511,304 | | | $ | 346,911 | |
| | | | |
| | |
Liabilities: | | | | | | | | |
Unrealized Depreciation on Forward Foreign Currency Exchange Contracts | | $ | (468,444 | ) | | $ | — | |
Variation Margin Payable(1) | | | — | | | | (781 | ) |
| | | | |
| | $ | (468,444 | ) | | $ | (781 | ) |
| | | | |
| (1) | Only current day’s variation margin is reported within the Statements of Assets and Liabilities. The variation margin is included in the open futures cumulative appreciation/(depreciation) of $(42,103). |
The Effect of Financial Derivative Instruments on the Statements of Operations for the Period Ended April 30, 2012:
| | | | | | | | |
| | | Derivatives Not Accounted for as
Hedging Instruments | |
| | | Foreign Exchange | | | Fixed Income/ Interest Rate | |
Realized Gain (Loss) on Derivatives Recognized resulting from Operations: | | | | | | | | |
Net Realized Gain on Forward Foreign Currency Exchange Contracts | | $ | 268,907 | | | $ | — | |
Net Realized Gain on Interest Rate Swap Contracts | | | — | | | | 247,819 | |
Net Realized Loss on Futures Contracts | | | — | | | | (10 | ) |
| | | | |
| | $ | 268,907 | | | $ | 247,809 | |
| | | | |
| | |
Net Change in Unrealized Appreciation (Depreciation) on Derivatives Recognized resulting from Operations: | | | | | | | | |
Net Change in Unrealized Depreciation on Forward Foreign Currency Exchange Contracts | | $ | (79,436 | ) | | $ | — | |
Net Change in Unrealized Appreciation on Interest Rate Swap Contracts | | | — | | | | (17,041 | ) |
Net Change in Unrealized Depreciation on Futures Contracts | | | — | | | | (42,103 | ) |
| | | | |
| | $ | (79,436 | ) | | $ | (59,144 | ) |
| | | | |
| * | See note 9 in the Notes to Financial Statements for additional information. |
See accompanying notes to the financial statements.
40
ASHMORE EMERGING MARKETS LOCAL CURRENCY FUND
SCHEDULE OF INVESTMENTS
As of April 30, 2012 (Unaudited)
| | | | | | | | | | | | | | |
| | | Currency(1) | | Par | | | Value | | | % of Net Assets | |
Debt Securities | | | | | | | | | | | | | | |
| | | | |
Nigeria (Cost $276,317) | | | | | | | | | | | | | | |
Nigeria Treasury Bill 16.085%, 03/28/2013(2) | | NGN | | | 50,000,000 | | | | $ 279,374 | | | | 0.47 | |
| | | | | | | | | 279,374 | | | | 0.47 | |
Turkey (Cost $486,684) | | | | | | | | | | | | | | |
Turkey (Rep of) 9.200%, 11/07/2012(2) | | TRY | | | 793,100 | | | | 430,252 | | | | 0.73 | |
| | | | | | | | | 430,252 | | | | 0.73 | |
Total Debt Securities (Cost $763,001) | | | | | | | | | 709,626 | | | | 1.20 | |
| | | | |
Short-Term Investments | | | | | | | | | | | | | | |
Abbey National Treasury Service, Time Deposit 0.290%, 05/25/2012 | | | | | 8,000,000 | | | | 8,000,000 | | | | 13.50 | |
ABN Amro Bank Jersey, Time Deposit 0.200%, 05/04/2012 | | | | | 8,000,000 | | | | 8,000,000 | | | | 13.50 | |
National Bank of Abu Dhabi, Time Deposit 0.130%, 05/04/2012 | | | | | 8,000,000 | | | | 8,000,000 | | | | 13.50 | |
Qatar National Bank, Time Deposit 0.100%, 05/08/2012 | | | | | 8,000,000 | | | | 8,000,000 | | | | 13.50 | |
Riyad Bank London, Time Deposit 0.150%, 05/03/2012 | | | | | 8,000,000 | | | | 8,000,000 | | | | 13.50 | |
UBS A.G. - London, Certificate Deposit 0.000%, 08/31/2012 | | | | | 5,000,000 | | | | 4,991,473 | | | | 8.42 | |
Total Short-Term Investments (Cost $44,991,544) | | | | | | | | | 44,991,473 | | | | 75.92 | |
| | | | |
Total Investments (Total Cost $45,754,545) | | | | | | | | | 45,701,099 | | | | 77.12 | |
| | | | |
Other Assets Less Liabilities (See Statements of Assets and Liabilities for further detail) | | | | | 13,558,168 | | | | 22.88 | | | | | |
| | | | |
Net Assets | | | | | | | | | $59,259,267 | | | | 100.00 | |
| (1) | Par values are stated in United States Dollars unless otherwise noted below. |
| (2) | Zero coupon bond reflects effective yield on the date of purchase. |
Percentages shown are based on net assets.
See accompanying notes to the financial statements.
41
ASHMORE EMERGING MARKETS LOCAL CURRENCY FUND
SCHEDULE OF INVESTMENTS (CONTINUED)
As of April 30, 2012 (Unaudited)
At April 30, 2012, the Ashmore Emerging Markets Local Currency Fund had outstanding forward foreign currency exchange contracts as follows:
| | | | | | | | | | | | | | | | | | |
Settlement
Date | | Counterparty | | Currency Buy | | Currency Buy Amount (Local Currency) | | | Currency Sell | | Currency Sell Amount (Local Currency) | | | Unrealized Gain/(Loss) | |
05/03/2012 | | Barclays Wholesale GTS | | Brazilian Real | | | 256,872 | | | United States Dollar | | | 140,000 | | | | $(5,332 | ) |
05/03/2012 | | Barclays Wholesale GTS | | Brazilian Real | | | 703,900 | | | United States Dollar | | | 374,814 | | | | (5,788 | ) |
05/03/2012 | | HSBC | | Brazilian Real | | | 703,898 | | | United States Dollar | | | 374,215 | | | | (5,191 | ) |
05/03/2012 | | Barclays Wholesale GTS | | United States Dollar | | | 880,000 | | | Brazilian Real | | | 1,664,670 | | | | 7,282 | |
05/10/2012 | | Bank of America Los Angeles | | Russian Rouble | | | 13,400,000 | | | United States Dollar | | | 418,338 | | | | 36,942 | |
05/14/2012 | | Chase Manhattan Bank London | | Indian Rupee | | | 32,773,200 | | | United States Dollar | | | 620,000 | | | | (305 | ) |
05/14/2012 | | Standard Chartered London | | Indian Rupee | | | 153,407,846 | | | United States Dollar | | | 2,977,059 | | | | (76,333 | ) |
05/14/2012 | | Barclays Wholesale GTS | | Russian Rouble | | | 38,704,640 | | | United States Dollar | | | 1,280,000 | | | | 34,163 | |
05/14/2012 | | Deutsche Bank London | | Russian Rouble | | | 16,952,551 | | | United States Dollar | | | 580,000 | | | | (4,399 | ) |
05/14/2012 | | Bank of America Los Angeles | | Taiwan Dollar | | | 49,801,974 | | | United States Dollar | | | 1,691,184 | | | | 13,976 | |
05/14/2012 | | Chase Manhattan Bank London | | Taiwan Dollar | | | 12,238,800 | | | United States Dollar | | | 420,000 | | | | (958 | ) |
05/14/2012 | | Union Bank of Switzerland - London | | United States Dollar | | | 390,000 | | | Russian Rouble | | | 11,534,250 | | | | (1,630 | ) |
05/14/2012 | | Union Bank of Switzerland - London | | United States Dollar | | | 1,360,000 | | | Russian Rouble | | | 40,159,304 | | | | (3,554 | ) |
05/18/2012 | | Bank of America Los Angeles | | Chilean Peso | | | 490,585,953 | | | United States Dollar | | | 1,003,756 | | | | 8,681 | |
05/18/2012 | | Morgan Stanley & Co. International | | Chilean Peso | | | 490,585,954 | | | United States Dollar | | | 1,006,743 | | | | 5,694 | |
05/18/2012 | | Barclays Wholesale GTS | | Mexican Peso | | | 67,413,606 | | | United States Dollar | | | 5,225,861 | | | | (60,286 | ) |
05/18/2012 | | Union Bank of Switzerland - London | | United States Dollar | | | 180,000 | | | Chilean Peso | | | 87,507,000 | | | | (591 | ) |
05/18/2012 | | Deutsche Bank London | | United States Dollar | | | 40,000 | | | Colombian Peso | | | 71,836,800 | | | | (736 | ) |
05/18/2012 | | Morgan Stanley & Co. International | | United States Dollar | | | 180,000 | | | Colombian Peso | | | 318,330,000 | | | | (512 | ) |
05/18/2012 | | Citibank London | | United States Dollar | | | 230,000 | | | Mexican Peso | | | 2,992,829 | | | | 674 | |
05/21/2012 | | Bank of America Los Angeles | | Malaysian Ringgit | | | 363,420 | | | United States Dollar | | | 120,000 | | | | (102 | ) |
05/21/2012 | | Deutsche Bank London | | Thai Baht | | | 8,011,900 | | | United States Dollar | | | 260,000 | | | | 254 | |
05/21/2012 | | Union Bank of Switzerland - London | | Thai Baht | | | 15,034,495 | | | United States Dollar | | | 484,984 | | | | 3,388 | |
05/21/2012 | | Chase Manhattan Bank London | | United States Dollar | | | 440,929 | | | Malaysian Ringgit | | | 1,357,489 | | | | (6,929 | ) |
05/24/2012 | | Citibank London | | Malaysian Ringgit | | | 3,406,568 | | | United States Dollar | | | 1,116,432 | | | | 7,207 | |
05/25/2012 | | Barclays Wholesale GTS | | Philippine Peso | | | 52,495,393 | | | United States Dollar | | | 1,229,256 | | | | 11,448 | |
05/25/2012 | | Barclays Wholesale GTS | | United States Dollar | | | 50,000 | | | Philippine Peso | | | 2,110,500 | | | | 119 | |
05/29/2012 | | Bank of America Los Angeles | | Russian Rouble | | | 5,766,043 | | | United States Dollar | | | 191,106 | | | | 4,186 | |
05/30/2012 | | Chase Manhattan Bank London | | Russian Rouble | | | 69,518,249 | | | United States Dollar | | | 2,356,231 | | | | (2,094 | ) |
05/30/2012 | | HSBC | | Russian Rouble | | | 20,077,000 | | | United States Dollar | | | 680,000 | | | | (121 | ) |
05/31/2012 | | Bank of America Los Angeles | | Czech Koruna | | | 56,101,152 | | | United States Dollar | | | 2,959,975 | | | | 16,708 | |
05/31/2012 | | Chase Manhattan Bank London | | Hungarian Forint | | | 243,096,639 | | | United States Dollar | | | 1,105,437 | | | | 11,059 | |
05/31/2012 | | Citibank London | | Israeili Shekel | | | 6,797,139 | | | United States Dollar | | | 1,810,012 | | | | (7,450 | ) |
05/31/2012 | | Union Bank of Switzerland - London | | Polish Zloty | | | 284,635 | | | United States Dollar | | | 90,000 | | | | (47 | ) |
05/31/2012 | | Union Bank of Switzerland - London | | Romanian Leu | | | 332,714 | | | United States Dollar | | | 100,000 | | | | (1,033 | ) |
05/31/2012 | | Citibank London | | Singapore Dollar | | | 3,758,307 | | | United States Dollar | | | 2,973,297 | | | | 63,812 | |
05/31/2012 | | Bank of America Los Angeles | | United States Dollar | | | 360,000 | | | Czech Koruna | | | 6,777,803 | | | | 375 | |
05/31/2012 | | Citibank London | | United States Dollar | | | 120,000 | | | Israeili Shekel | | | 451,770 | | | | 193 | |
05/31/2012 | | Barclays Wholesale GTS | | United States Dollar | | | 2,758,358 | | | Polish Zloty | | | 8,591,712 | | | | 43,135 | |
05/31/2012 | | Deutsche Bank London | | United States Dollar | | | 620,000 | | | Polish Zloty | | | 1,962,288 | | | | (138 | ) |
06/04/2012 | | Deutsche Bank London | | Brazilian Real | | | 1,992,808 | | | United States Dollar | | | 1,141,029 | | | | (103,556 | ) |
06/04/2012 | | Deutsche Bank London | | Brazilian Real | | | 341,550 | | | United States Dollar | | | 180,000 | | | | (2,186 | ) |
06/04/2012 | | Morgan Stanley & Co. International | | Brazilian Real | | | 189,700 | | | United States Dollar | | | 100,000 | | | | (1,240 | ) |
06/12/2012 | | Barclays Wholesale GTS | | Indonesian Rupiah | | | 1,196,650,000 | | | United States Dollar | | | 130,000 | | | | (379 | ) |
06/21/2012 | | Union Bank of Switzerland - London | | Thai Baht | | | 17,498,803 | | | United States Dollar | | | 569,808 | | | | (2,308 | ) |
06/22/2012 | | Banco Santander New York | | Mexican Peso | | | 54,250,745 | | | United States Dollar | | | 4,081,305 | | | | 62,524 | |
06/22/2012 | | Barclays Wholesale GTS | | Mexican Peso | | | 22,238,710 | | | United States Dollar | | | 1,690,000 | | | | 8,657 | |
06/29/2012 | | Bank of America Los Angeles | | Hungarian Forint | | | 216,735,750 | | | United States Dollar | | | 990,000 | | | | 1,573 | |
06/29/2012 | | Union Bank of Switzerland - London | | Hungarian Forint | | | 225,463,839 | | | United States Dollar | | | 984,129 | | | | 47,376 | |
06/29/2012 | | Chase Manhattan Bank London | | Polish Zloty | | | 23,765,474 | | | United States Dollar | | | 7,453,146 | | | | 32,691 | |
06/29/2012 | | Citibank London | | Romanian Leu | | | 6,049,590 | | | United States Dollar | | | 1,816,421 | | | | (11,785 | ) |
06/29/2012 | | Bank of America Los Angeles | | Singapore Dollar | | | 4,028,657 | | | United States Dollar | | | 3,226,539 | | | | 29,270 | |
06/29/2012 | | Deutsche Bank London | | United States Dollar | | | 1,971,195 | | | Euro | | | 1,477,602 | | | | 14,732 | |
06/29/2012 | | HSBC | | United States Dollar | | | 200,000 | | | Romanian Leu | | | 670,173 | | | | 83 | |
06/29/2012 | | Bank of America Los Angeles | | United States Dollar | | | 40,000 | | | Singapore Dollar | | | 49,462 | | | | 26 | |
06/29/2012 | | Barclays Wholesale GTS | | United States Dollar | | | 230,000 | | | South African Rand | | | 1,796,829 | | | | 887 | |
See accompanying notes to the financial statements.
42
ASHMORE EMERGING MARKETS LOCAL CURRENCY FUND
SCHEDULE OF INVESTMENTS (CONTINUED)
As of April 30, 2012 (Unaudited)
| | | | | | | | | | | | | | | | | | | | |
| | | | | | | Currency | | | | | Currency | | | | | | |
| | | | | | | Buy Amount | | | | | Sell Amount | | | | | | |
| Settlement | | | | | | (Local | | | | | (Local | | | Unrealized | | | |
| Date | | Counterparty | | Currency Buy | | Currency) | | | Currency Sell | | Currency) | | | Gain/(Loss) | | | |
06/29/2012 | | Deutsche Bank London | | United States Dollar | | | 210,000 | | | South African Rand | | | 1,632,143 | | | | $ 1,886 | | | |
06/29/2012 | | Barclays Wholesale GTS | | South African Rand | | | 24,192,204 | | | United States Dollar | | | 3,107,860 | | | | (23,123 | ) | | |
07/03/2012 | | Deutsche Bank London | | Brazilian Real | | | 2,293,785 | | | United States Dollar | | | 1,234,545 | | | | (46,018 | ) | | |
07/03/2012 | | HSBC | | Brazilian Real | | | 2,293,785 | | | United States Dollar | | | 1,237,009 | | | | (48,482 | ) | | |
07/03/2012 | | Citibank London | | United States Dollar | | | 228,621 | | | Brazilian Real | | | 426,081 | | | | 7,847 | | | |
07/18/2012 | | Chase Manhattan Bank London | | Malaysian Ringgit | | | 495,639 | | | United States Dollar | | | 162,585 | | | | 300 | | | |
07/18/2012 | | Standard Chartered London | | Malaysian Ringgit | | | 367,680 | | | United States Dollar | | | 119,408 | | | | 1,425 | | | |
07/18/2012 | | Bank of America Los Angeles | | Thai Baht | | | 43,763,275 | | | United States Dollar | | | 1,406,727 | | | | 10,436 | | | |
07/19/2012 | | Union Bank of Switzerland - London | | Korean Won | | | 2,803,632,215 | | | United States Dollar | | | 2,453,730 | | | | 25,729 | | | |
07/19/2012 | | Union Bank of Switzerland - London | | Korean Won | | | 136,230,000 | | | United States Dollar | | | 120,000 | | | | 478 | | | |
07/25/2012 | | Barclays Wholesale GTS | | Turkish Lira | | | 197,281 | | | United States Dollar | | | 110,000 | | | | 263 | | | |
07/25/2012 | | HSBC | | Turkish Lira | | | 4,729,404 | | | United States Dollar | | | 2,590,390 | | | | 52,925 | | | |
07/25/2012 | | HSBC | | United States Dollar | | | 720,000 | | | Turkish Lira | | | 1,288,584 | | | | (204 | ) | | |
07/26/2012 | | Bank of America Los Angeles | | United States Dollar | | | 1,250,000 | | | Russian Rouble | | | 37,095,375 | | | | 3,754 | | | |
08/02/2012 | | Barclays Wholesale GTS | | United States Dollar | | | 368,727 | | | Brazilian Real | | | 703,900 | | | | 5,998 | | | |
08/02/2012 | | HSBC | | United States Dollar | | | 368,109 | | | Brazilian Real | | | 703,898 | | | | 5,381 | | | |
08/03/2012 | | Barclays Wholesale GTS | | Chinese Yuan Renminbi | | | 17,429,400 | | | United States Dollar | | | 2,760,000 | | | | 2,099 | | | |
08/13/2012 | | Citibank London | | Colombian Peso | | | 503,280,000 | | | United States Dollar | | | 281,634 | | | | 2,132 | | | |
08/13/2012 | | Citibank London | | United States Dollar | | | 650,373 | | | Colombian Peso | | | 1,173,760,000 | | | | (11,432 | ) | | |
08/21/2012 | | Standard Chartered London | | Thai Baht | | | 19,583,494 | | | United States Dollar | | | 632,133 | | | | 958 | | | |
08/24/2012 | | Bank of America Los Angeles | | Colombian Peso | | | 2,568,620,400 | | | United States Dollar | | | 1,424,558 | | | | 21,534 | | | |
08/24/2012 | | Chase Manhattan Bank London | | Colombian Peso | | | 692,000,000 | | | United States Dollar | | | 386,430 | | | | 3,155 | | | |
08/24/2012 | | Bank of America Los Angeles | | United States Dollar | | | 652,179 | | | Colombian Peso | | | 1,173,760,000 | | | | (8,629 | ) | | |
08/28/2012 | | Union Bank of Switzerland - London | | Colombian Peso | | | 1,203,990,000 | | | United States Dollar | | | 670,000 | | | | 7,455 | | | |
08/28/2012 | | HSBC | | Malaysian Ringgit | | | 1,381,295 | | | United States Dollar | | | 451,625 | | | | 1,261 | | | |
09/26/2012 | | HSBC | | Russian Rouble | | | 884,632 | | | United States Dollar | | | 25,866 | | | | 3,584 | | | |
04/15/2013 | | HSBC | | Chinese Offshore Yuan | | | 3,763,610 | | | United States Dollar | | | 590,000 | | | | 37 | | | |
04/15/2013 | | HSBC | | Chinese Offshore Yuan | | | 3,769,215 | | | United States Dollar | | | 590,000 | | | | 916 | | | |
05/02/2013 | | Standard Chartered London | | Chinese Offshore Yuan | | | 7,476,300 | | | United States Dollar | | | 1,170,000 | | | | 1,604 | | | |
04/13/2015 | | HSBC | | United States Dollar | | | 590,000 | | | Chinese Offshore Yuan | | | 3,813,170 | | | | (7,558 | ) | | |
04/13/2015 | | HSBC | | United States Dollar | | | 590,000 | | | Chinese Offshore Yuan | | | 3,825,265 | | | | (9,454 | ) | | |
05/04/2015 | | Standard Chartered London | | United States Dollar | | | 1,170,000 | | | Chinese Offshore Yuan | | | 7,614,360 | | | | (23,240 | ) | | |
| | | | | | | | | | | | | | | | | | | | |
Total | | | | | | | | | | | | | | | | | $145,149 | | | |
| | | | | | | | | | | | | | | | | | | | |
The inputs or methodologies used for valuing securities are not necessarily an indication of the risks associated with investing in those securities and other financial instruments, if any. See note 4 in the Notes to Financial Statements for more information regarding pricing inputs and valuation techniques. The following is a summary of the inputs used in valuing the Ashmore Emerging Markets Local Currency Fund’s investments and other financial instruments, which are carried at fair value, as of April 30, 2012:
| | | | | | | | | | | | | | | | |
| | | Level 1 | | | Level 2 | | | Level 3 | | | Total | |
Investments | | | | | | | | | | | | | | | | |
Assets: | | | | | | | | | | | | | | | | |
Government Bonds | | | $— | | | | $ 709,626 | | | | $— | | | | $ 709,626 | |
Short-Term Investments | | | — | | | | 44,991,473 | | | | — | | | | 44,991,473 | |
Total Investments | | | $— | | | | $45,701,099 | | | | $— | | | | $45,701,099 | |
| | | | |
Other Financial Instruments | | | | | | | | | | | | | | | | |
Assets: | | | | | | | | | | | | | | | | |
Forward Foreign Currency Exchange Contracts | | | $— | | | | $ 628,272 | | | | $— | | | | $ 628,272 | |
Liabilities: | | | | | | | | | | | | | | | | |
Forward Foreign Currency Exchange Contracts | | | — | | | | (483,123 | ) | | | — | | | | (483,123 | ) |
Total Other Financial Instruments | | | $— | | | | $ 145,149 | | | | $— | | | | $ 145,149 | |
See accompanying notes to the financial statements.
43
ASHMORE EMERGING MARKETS LOCAL CURRENCY FUND
SCHEDULE OF INVESTMENTS (CONTINUED)
As of April 30, 2012 (Unaudited)
The Fund discloses significant transfers between levels based on valuations at the end of each reporting period. At April 30, 2012 there were no significant transfers between Level 1 and Level 2 based on levels assigned to the securities on October 31, 2011. U.S. GAAP provides additional guidance for estimating fair value when the volume and level of activity for the asset or liability have significantly decreased as well as guidance on identifying circumstances that indicate when a transaction is not orderly.
The following is a summary of the fair values of the Fund’s derivative instruments categorized by risk exposure* :
Fair Values of Financial Derivative Instruments on the Statements of Assets and Liabilities as of April 30, 2012:
| | |
| | | Derivatives Not Accounted |
| | | for as Hedging Instruments |
| | | Foreign Exchange |
Assets: | | |
Unrealized Appreciation on Forward Foreign Currency Exchange Contracts | | $ 628,272 |
Liabilities: | | |
Unrealized Depreciation on Forward Foreign Currency Exchange Contracts | | $ (483,123) |
The Effect of Financial Derivative Instruments on the Statements of Operations for the Period Ended April 30, 2012:
| | |
| | | Derivatives Not Accounted |
| | | for as Hedging Instruments |
| | | Foreign Exchange |
Realized Gain on Derivatives Recognized resulting from Operations: | | |
Net Realized Gain on Forward Foreign Currency Exchange Contracts | | $ 1,151,982 |
| |
Net Change in Unrealized Appreciation on Derivatives Recognized resulting from Operations: | | |
Net Change in Unrealized Appreciation on Forward Foreign Currency Exchange Contracts | | $ 499,638 |
* See note 9 in the Notes to Financial Statements for additional information.
See accompanying notes to the financial statements.
44
ASHMORE EMERGING MARKETS SOVEREIGN DEBT FUND
SCHEDULE OF INVESTMENTS
As of April 30, 2012 (Unaudited)
| | | | | | | | | | | | | | |
| | | | | | | | | | | % of Net | |
| | | Currency(1) | | Par | | | Value | | | Assets | |
Debt Securities | | | | | | | | | | | | | | |
| | | | |
Argentina (Cost $595,077) | | | | | | | | | | | | | | |
Argentina (Rep of) 8.750%, 06/02/2017 | | | | | 95,000 | | | $ | 87,637 | | | | 0.27 | |
Argentina (Rep of) 8.280%, 12/31/2033 | | | | | 211,409 | | | | 146,559 | | | | 0.45 | |
Argentina Boden Bonds, FRN 0.785%, 08/03/2012 | | | | | 810,000 | | | | 98,289 | | | | 0.30 | |
Argentina Boden Bonds 7.000%, 10/03/2015 | | | | | 255,000 | | | | 225,879 | | | | 0.70 | |
| | | | | | | | | 558,364 | | | | 1.72 | |
Belarus (Cost $349,865) | | | | | | | | | | | | | | |
Belarus (Rep of) 8.750%, 08/03/2015 | | | | | 200,000 | | | | 186,750 | | | | 0.57 | |
Belarus (Rep of) 8.950%, 01/26/2018 | | | | | 200,000 | | | | 185,000 | | | | 0.57 | |
| | | | | | | | | 371,750 | | | | 1.14 | |
Brazil (Cost $2,376,719) | | | | | | | | | | | | | | |
Banco Nacional de Desenvolvimento Economico e Social | | | | | 140,000 | | | | 165,487 | | | | 0.51 | |
6.500%, 06/10/2019 | | | | | | | | | | | | | | |
Banco Nacional de Desenvolvimento Economico e Social | | | | | 100,000 | | | | 112,286 | | | | 0.34 | |
5.500%, 07/12/2020 | | | | | | | | | | | | | | |
Brazil (Fed Rep of) 6.000%, 01/17/2017 | | | | | 100,000 | | | | 118,950 | | | | 0.37 | |
Brazil (Fed Rep of) 5.875%, 01/15/2019 | | | | | 100,000 | | | | 120,500 | | | | 0.37 | |
Brazil (Fed Rep of) 4.875%, 01/22/2021 | | | | | 390,000 | | | | 447,720 | | | | 1.38 | |
Brazil (Fed Rep of) 8.875%, 04/15/2024 | | | | | 70,000 | | | | 107,625 | | | | 0.33 | |
Brazil (Fed Rep of) 10.125%, 05/15/2027 | | | | | 140,000 | | | | 235,900 | | | | 0.72 | |
Brazil (Fed Rep of) 8.250%, 01/20/2034 | | | | | 210,000 | | | | 323,925 | | | | 1.00 | |
Brazil (Fed Rep of) 7.125%, 01/20/2037 | | | | | 275,000 | | | | 387,063 | | | | 1.19 | |
Brazil (Fed Rep of) 5.625%, 01/07/2041 | | | | | 420,000 | | | | 499,800 | | | | 1.54 | |
| | | | | | | | | 2,519,256 | | | | 7.75 | |
Chile (Cost $418,122) | | | | | | | | | | | | | | |
Banco del Estado de Chile 4.125%, 10/07/2020 | | | | | 110,000 | | | | 113,768 | | | | 0.35 | |
Chile (Rep of) 3.250%, 09/14/2021 | | | | | 100,000 | | | | 104,083 | | | | 0.32 | |
Empresa Nacional del Petroleo 5.250%, 08/10/2020 | | | | | 200,000 | | | | 213,878 | | | | 0.66 | |
| | | | | | | | | 431,729 | | | | 1.33 | |
China (Cost $336,627) | | | | | | | | | | | | | | |
Sinochem Overseas Capital Co. Ltd. 4.500%, 11/12/2020 | | | | | 330,000 | | | | 324,721 | | | | 1.00 | |
| | | | | | | | | 324,721 | | | | 1.00 | |
Colombia (Cost $1,602,986) | | | | | | | | | | | | | | |
Colombia (Rep of) 7.375%, 01/27/2017 | | | | | 260,000 | | | | 321,750 | | | | 0.99 | |
Colombia (Rep of) 7.375%, 03/18/2019 | | | | | 260,000 | | | | 337,350 | | | | 1.04 | |
Colombia (Rep of) 11.750%, 02/25/2020 | | | | | 90,000 | | | | 143,550 | | | | 0.44 | |
Colombia (Rep of) 4.375%, 07/12/2021 | | | | | 200,000 | | | | 221,000 | | | | 0.68 | |
Colombia (Rep of) 8.125%, 05/21/2024 | | | | | 120,000 | | | | 171,000 | | | | 0.53 | |
Colombia (Rep of) 7.375%, 09/18/2037 | | | | | 100,000 | | | | 143,750 | | | | 0.44 | |
Colombia (Rep of) 6.125%, 01/18/2041 | | | | | 300,000 | | | | 378,750 | | | | 1.17 | |
| | | | | | | | | 1,717,150 | | | | 5.29 | |
Croatia (Cost $323,321) | | | | | | | | | | | | | | |
Croatia (Rep of) 6.250%, 04/27/2017(2) | | | | | 200,000 | | | | 202,306 | | | | 0.62 | |
Croatia (Rep of) 6.625%, 07/14/2020 | | | | | 130,000 | | | | 130,000 | | | | 0.40 | |
| | | | | | | | | 332,306 | | | | 1.02 | |
Dominican Republic (Cost $211,311) | | | | | | | | | | | | | | |
Dominican (Rep of) 7.500%, 05/06/2021 | | | | | 200,000 | | | | 210,000 | | | | 0.65 | |
| | | | | | | | | 210,000 | | | | 0.65 | |
Ecuador (Cost $100,000) | | | | | | | | | | | | | | |
Ecuador (Rep of) 9.375%, 12/15/2015 | | | | | 100,000 | | | | 101,500 | | | | 0.31 | |
| | | | | | | | | 101,500 | | | | 0.31 | |
See accompanying notes to the financial statements.
45
ASHMORE EMERGING MARKETS SOVEREIGN DEBT FUND
SCHEDULE OF INVESTMENTS (CONTINUED)
As of April 30, 2012 (Unaudited)
| | | | | | | | | | | | | | |
| | | Currency(1) | | Par | | | Value | | | % of Net Assets | |
Egypt (Cost $339,375) | | | | | | | | | | | | | | |
Egypt (Rep of) 5.750%, 04/29/2020 | | | | | 140,000 | | | $ | 129,150 | | | | 0.40 | |
Egypt (Rep of) 6.875%, 04/30/2040 | | | | | 100,000 | | | | 85,000 | | | | 0.26 | |
Nile Finance Ltd. 5.250%, 08/05/2015 | | | | | 100,000 | | | | 96,250 | | | | 0.30 | |
| | | | | | | | | 310,400 | | | | 0.96 | |
El Salvador (Cost $373,081) | | | | | | | | | | | | | | |
El Salvador (Rep of) 7.375%, 12/01/2019 | | | | | 100,000 | | | | 109,000 | | | | 0.33 | |
El Salvador (Rep of) 8.250%, 04/10/2032 | | | | | 100,000 | | | | 109,500 | | | | 0.34 | |
El Salvador (Rep of) 7.650%, 06/15/2035 | | | | | 150,000 | | | | 154,500 | | | | 0.48 | |
| | | | | | | | | 373,000 | | | | 1.15 | |
Ghana (Cost $109,745) | | | | | | | | | | | | | | |
Ghana (Rep of) 8.500%, 10/04/2017 | | | | | 100,000 | | | | 113,750 | | | | 0.35 | |
| | | | | | | | | 113,750 | | | | 0.35 | |
Hungary (Cost $282,771) | | | | | | | | | | | | | | |
Hungary (Rep of) 6.250%, 01/29/2020 | | | | | 100,000 | | | | 95,750 | | | | 0.29 | |
Hungary (Rep of) 6.375%, 03/29/2021 | | | | | 110,000 | | | | 105,600 | | | | 0.33 | |
Hungary (Rep of) 7.625%, 03/29/2041 | | | | | 74,000 | | | | 70,115 | | | | 0.22 | |
| | | | | | | | | 271,465 | | | | 0.84 | |
Indonesia (Cost $1,950,852) | | | | | | | | | | | | | | |
Indonesia (Rep of) 10.375%, 05/04/2014 | | | | | 120,000 | | | | 138,900 | | | | 0.43 | |
Indonesia (Rep of) 7.500%, 01/15/2016 | | | | | 150,000 | | | | 174,375 | | | | 0.54 | |
Indonesia (Rep of) 6.875%, 01/17/2018 | | | | | 130,000 | | | | 153,400 | | | | 0.47 | |
Indonesia (Rep of) 11.625%, 03/04/2019 | | | | | 100,000 | | | | 147,750 | | | | 0.45 | |
Indonesia (Rep of) 5.875%, 03/13/2020 | | | | | 150,000 | | | | 171,000 | | | | 0.53 | |
Indonesia (Rep of) 4.875%, 05/05/2021 | | | | | 200,000 | | | | 215,000 | | | | 0.66 | |
Indonesia (Rep of) 8.500%, 10/12/2035 | | | | | 250,000 | | | | 363,750 | | | | 1.12 | |
Indonesia (Rep of) 7.750%, 01/17/2038 | | | | | 200,000 | | | | 271,250 | | | | 0.83 | |
Majapahit Holding B.V. 7.750%, 10/17/2016 | | | | | 100,000 | | | | 115,000 | | | | 0.35 | |
Majapahit Holding B.V. 8.000%, 08/07/2019 | | | | | 110,000 | | | | 132,275 | | | | 0.41 | |
Majapahit Holding B.V. 7.750%, 01/20/2020 | | | | | 100,000 | | | | 118,750 | | | | 0.37 | |
| | | | | | | | | 2,001,450 | | | | 6.16 | |
Iraq (Cost $551,697) | | | | | | | | | | | | | | |
Iraq (Rep of) 5.800%, 01/15/2028 | | | | | 640,000 | | | | 533,600 | | | | 1.64 | |
| | | | | | | | | 533,600 | | | | 1.64 | |
Ivory Coast (Cost $299,340) | | | | | | | | | | | | | | |
Ivory Coast (Rep of) 2.450%, 12/31/2032(3) | | | | | 570,000 | | | | 389,738 | | | | 1.20 | |
| | | | | | | | | 389,738 | | | | 1.20 | |
Jordan (Cost $202,758) | | | | | | | | | | | | | | |
Jordan (Rep of) 3.875%, 11/12/2015 | | | | | 210,000 | | | | 205,275 | | | | 0.63 | |
| | | | | | | | | 205,275 | | | | 0.63 | |
Kazakhstan (Cost $1,140,069) | | | | | | | | | | | | | | |
Development Bank of Kazakhstan JSC 5.500%, 12/20/2015 | | | | | 200,000 | | | | 214,000 | | | | 0.66 | |
Kazakhstan Temir Zholy Finance B.V. 6.375%, 10/06/2020 | | | | | 200,000 | | | | 221,500 | | | | 0.68 | |
Kazatomprom Natsionalnaya Atomnaya Kompaniya A.O. 6.250%, 05/20/2015 | | | | | 100,000 | | | | 108,000 | | | | 0.33 | |
KazMunayGas National Co. 11.750%, 01/23/2015 | | | | | 150,000 | | | | 181,875 | | | | 0.56 | |
KazMunayGas National Co. 9.125%, 07/02/2018 | | | | | 130,000 | | | | 161,688 | | | | 0.50 | |
KazMunayGas National Co. 7.000%, 05/05/2020 | | | | | 70,000 | | | | 80,150 | | | | 0.25 | |
KazMunayGas National Co. 6.375%, 04/09/2021 | | | | | 210,000 | | | | 233,362 | | | | 0.72 | |
| | | | | | | | | 1,200,575 | | | | 3.70 | |
Lebanon (Cost $757,191) | | | | | | | | | | | | | | |
Lebanon (Rep of) 6.375%, 03/09/2020 | | | | | 310,000 | | | | 327,825 | | | | 1.01 | |
Lebanon (Rep of) 6.100%, 10/04/2022 | | | | | 325,000 | | | | 330,688 | | | | 1.02 | |
See accompanying notes to the financial statements.
46
ASHMORE EMERGING MARKETS SOVEREIGN DEBT FUND
SCHEDULE OF INVESTMENTS (CONTINUED)
As of April 30, 2012 (Unaudited)
| | | | | | | | | | | | | | |
| | | | | | | | | | | % of Net | |
| | | Currency(1) | | Par | | | Value | | | Assets | |
Lebanon - (continued) | | | | | | | | | | | | | | |
Lebanon (Rep of) 6.600%, 11/27/2026 | | | | | 100,000 | | | $ | 102,250 | | | | 0.31 | |
| | | | | | | | | 760,763 | | | | 2.34 | |
Lithuania (Cost $831,311) | | | | | | | | | | | | | | |
Lithuania (Rep of) 5.125%, 09/14/2017 | | | | | 100,000 | | | | 104,125 | | | | 0.32 | |
Lithuania (Rep of) 7.375%, 02/11/2020 | | | | | 290,000 | | | | 339,880 | | | | 1.04 | |
Lithuania (Rep of) 6.125%, 03/09/2021 | | | | | 200,000 | | | | 216,750 | | | | 0.67 | |
Lithuania (Rep of) 6.625%, 02/01/2022(2) | | | | | 200,000 | | | | 224,360 | | | | 0.69 | |
| | | | | | | | | 885,115 | | | | 2.72 | |
Malaysia (Cost $555,526) | | | | | | | | | | | | | | |
Petronas Capital Ltd. 5.250%, 08/12/2019 | | | | | 260,000 | | | | 295,601 | | | | 0.91 | |
Wakala Global Sukuk Bhd. 4.646%, 07/06/2021 | | | | | 250,000 | | | | 274,875 | | | | 0.85 | |
| | | | | | | | | 570,476 | | | | 1.76 | |
Mexico (Cost $2,105,817) | | | | | | | | | | | | | | |
Comision Federal de Electricidad 5.750%, 02/14/2042(2) | | | | | 200,000 | | | | 204,894 | | | | 0.63 | |
Mexico (Rep of) 5.625%, 01/15/2017 | | | | | 154,000 | | | | 179,795 | | | | 0.55 | |
Mexico (Rep of) 5.950%, 03/19/2019 | | | | | 120,000 | | | | 146,220 | | | | 0.45 | |
Mexico (Rep of) 5.125%, 01/15/2020 | | | | | 320,000 | | | | 374,080 | | | | 1.15 | |
Mexico (Rep of) 3.625%, 03/15/2022 | | | | | 70,000 | | | | 73,185 | | | | 0.22 | |
Mexico (Rep of) 8.300%, 08/15/2031 | | | | | 170,000 | | | | 258,825 | | | | 0.80 | |
Mexico (Rep of) 6.750%, 09/27/2034 | | | | | 195,000 | | | | 260,325 | | | | 0.80 | |
Mexico (Rep of) 6.050%, 01/11/2040 | | | | | 306,000 | | | | 382,500 | | | | 1.18 | |
Pemex Project Funding Master Trust 5.750%, 03/01/2018 | | | | | 60,000 | | | | 68,400 | | | | 0.21 | |
Petroleos Mexicanos 8.000%, 05/03/2019 | | | | | 100,000 | | | | 127,000 | | | | 0.39 | |
Petroleos Mexicanos 6.000%, 03/05/2020 | | | | | 40,000 | | | | 46,000 | | | | 0.14 | |
Petroleos Mexicanos 6.500%, 06/02/2041(2) | | | | | 100,000 | | | | 116,066 | | | | 0.36 | |
Petroleos Mexicanos 6.500%, 06/02/2041 | | | | | 16,000 | | | | 18,560 | | | | 0.06 | |
| | | | | | | | | 2,255,850 | | | | 6.94 | |
Morocco (Cost $202,136) | | | | | | | | | | | | | | |
Morocco (Rep of) 4.500%, 10/05/2020 | | EUR | | | 160,000 | | | | 198,599 | | | | 0.61 | |
| | | | | | | | | 198,599 | | | | 0.61 | |
Pakistan (Cost $123,001) | | | | | | | | | | | | | | |
Pakistan (Rep of) 7.125%, 03/31/2016 | | | | | 150,000 | | | | 127,500 | | | | 0.39 | |
| | | | | | | | | 127,500 | | | | 0.39 | |
Panama (Cost $496,335) | | | | | | | | | | | | | | |
Panama (Rep of) 7.250%, 03/15/2015 | | | | | 90,000 | | | | 104,400 | | | | 0.32 | |
Panama (Rep of) 8.875%, 09/30/2027 | | | | | 90,000 | | | | 140,850 | | | | 0.44 | |
Panama (Rep of) 9.375%, 04/01/2029 | | | | | 90,000 | | | | 147,150 | | | | 0.45 | |
Panama (Rep of) 6.700%, 01/26/2036 | | | | | 105,000 | | | | 140,700 | | | | 0.43 | |
| | | | | | | | | 533,100 | | | | 1.64 | |
Peru (Cost $611,150) | | | | | | | | | | | | | | |
Peru (Rep of) 8.375%, 05/03/2016 | | | | | 50,000 | | | | 62,250 | | | | 0.19 | |
Peru (Rep of) 7.125%, 03/30/2019 | | | | | 100,000 | | | | 128,000 | | | | 0.39 | |
Peru (Rep of) 7.350%, 07/21/2025 | | | | | 150,000 | | | | 207,000 | | | | 0.64 | |
Peru (Rep of) 8.750%, 11/21/2033 | | | | | 164,000 | | | | 261,580 | | | | 0.81 | |
| | | | | | | | | 658,830 | | | | 2.03 | |
Philippines (Cost $1,980,188) | | | | | | | | | | | | | | |
Philippine (Rep of) 8.375%, 06/17/2019 | | | | | 250,000 | | | | 333,438 | | | | 1.03 | |
Philippine (Rep of) 4.000%, 01/15/2021 | | | | | 250,000 | | | | 263,125 | | | | 0.81 | |
Philippine (Rep of) 10.625%, 03/16/2025 | | | | | 140,000 | | | | 227,500 | | | | 0.70 | |
Philippine (Rep of) 5.500%, 03/30/2026 | | | | | 200,000 | | | | 229,250 | | | | 0.70 | |
Philippine (Rep of) 9.500%, 02/02/2030 | | | | | 220,000 | | | | 349,800 | | | | 1.08 | |
Philippine (Rep of) 7.750%, 01/14/2031 | | | | | 230,000 | | | | 320,275 | | | | 0.99 | |
Philippine (Rep of) 6.375%, 10/23/2034 | | | | | 100,000 | | | | 124,125 | | | | 0.38 | |
See accompanying notes to the financial statements.
47
ASHMORE EMERGING MARKETS SOVEREIGN DEBT FUND
SCHEDULE OF INVESTMENTS (CONTINUED)
As of April 30, 2012 (Unaudited)
| | | | | | | | | | | | | | |
| | | Currency(1) | | Par | | | Value | | | % of Net Assets | |
Philippines - (continued) | | | | | | | | | | | | | | |
Power Sector Assets & Liabilities Management Corp. 7.390%, 12/02/2024 | | | | | 200,000 | | | | $ 252,750 | | | | 0.78 | |
| | | | | | | | | 2,100,263 | | | | 6.47 | |
Poland (Cost $390,981) | | | | | | | | | | | | | | |
Poland (Rep of) 6.375%, 07/15/2019 | | | | | 210,000 | | | | 246,488 | | | | 0.76 | |
Poland (Rep of) 5.000%, 03/23/2022 | | | | | 150,000 | | | | 160,312 | | | | 0.49 | |
| | | | | | | | | 406,800 | | | | 1.25 | |
Qatar (Cost $124,238) | | | | | | | | | | | | | | |
Qatar (Rep of) 6.400%, 01/20/2040 | | | | | 100,000 | | | | 120,750 | | | | 0.37 | |
| | | | | | | | | 120,750 | | | | 0.37 | |
Romania (Cost $100,632) | | | | | | | | | | | | | | |
Romania (Rep of) 6.750%, 02/07/2022(2) | | | | | 100,000 | | | | 104,953 | | | | 0.32 | |
| | | | | | | | | 104,953 | | | | 0.32 | |
Russian Federation (Cost $2,495,735) | | | | | | | | | | | | | | |
Russian Agricultural Bank OJSC Via RSHB Capital S.A. 7.750%, 05/29/2018 | | | | | 100,000 | | | | 113,125 | | | | 0.35 | |
Russian Foreign Bond - Eurobond 5.000%, 04/29/2020 | | | | | 100,000 | | | | 108,250 | | | | 0.33 | |
Russian Foreign Bond - Eurobond 12.750%, 06/24/2028 | | | | | 120,000 | | | | 217,350 | | | | 0.67 | |
Russian Foreign Bond - Eurobond 7.500%, 03/31/2030 | | | | | 776,825 | | | | 932,190 | | | | 2.87 | |
Russian Foreign Bond - Eurobond 5.625%, 04/04/2042(2) | | | | | 200,000 | | | | 211,284 | | | | 0.65 | |
Vnesheconombank Via VEB Finance PLC 5.450%, 11/22/2017 | | | | | 100,000 | | | | 104,500 | | | | 0.32 | |
Vnesheconombank Via VEB Finance PLC 6.902%, 07/09/2020 | | | | | 690,000 | | | | 759,000 | | | | 2.34 | |
Vnesheconombank Via VEB Finance PLC 6.800%, 11/22/2025 | | | | | 150,000 | | | | 159,375 | | | | 0.49 | |
| | | | | | | | | 2,605,074 | | | | 8.02 | |
Serbia (Cost $197,879) | | | | | | | | | | | | | | |
Serbia (Rep of) 7.250%, 09/28/2021(2) | | | | | 200,000 | | | | 210,250 | | | | 0.65 | |
| | | | | | | | | 210,250 | | | | 0.65 | |
South Africa (Cost $452,433) | | | | | | | | | | | | | | |
South Africa (Rep of) 6.875%, 05/27/2019 | | | | | 120,000 | | | | 147,000 | | | | 0.45 | |
South Africa (Rep of) 5.500%, 03/09/2020 | | | | | 150,000 | | | | 170,812 | | | | 0.53 | |
South Africa (Rep of) 5.875%, 05/30/2022 | | | | | 130,000 | | | | 150,800 | | | | 0.46 | |
| | | | | | | | | 468,612 | | | | 1.44 | |
Sri Lanka (Cost $310,901) | | | | | | | | | | | | | | |
Sri Lanka (Rep of) 7.400%, 01/22/2015 | | | | | 100,000 | | | | 106,620 | | | | 0.33 | |
Sri Lanka (Rep of) 6.250%, 07/27/2021 | | | | | 200,000 | | | | 202,750 | | | | 0.62 | |
| | | | | | | | | 309,370 | | | | 0.95 | |
Tunisia (Cost $36,471) | | | | | | | | | | | | | | |
Banque Centrale de Tunisie S.A. 8.250%, 09/19/2027 | | | | | 30,000 | | | | 35,925 | | | | 0.11 | |
| | | | | | | | | 35,925 | | | | 0.11 | |
Turkey (Cost $1,757,908) | | | | | | | | | | | | | | |
Turkey (Rep of) 7.250%, 03/15/2015 | | | | | 80,000 | | | | 89,300 | | | | 0.28 | |
Turkey (Rep of) 7.000%, 09/26/2016 | | | | | 130,000 | | | | 148,038 | | | | 0.46 | |
Turkey (Rep of) 7.500%, 07/14/2017 | | | | | 100,000 | | | | 117,000 | | | | 0.36 | |
Turkey (Rep of) 6.750%, 04/03/2018 | | | | | 260,000 | | | | 296,400 | | | | 0.91 | |
Turkey (Rep of) 7.000%, 03/11/2019 | | | | | 100,000 | | | | 116,250 | | | | 0.36 | |
Turkey (Rep of) 7.500%, 11/07/2019 | | | | | 100,000 | | | | 120,000 | | | | 0.37 | |
Turkey (Rep of) 5.625%, 03/30/2021 | | | | | 100,000 | | | | 107,625 | | | | 0.33 | |
Turkey (Rep of) 7.375%, 02/05/2025 | | | | | 250,000 | | | | 300,000 | | | | 0.92 | |
Turkey (Rep of) 11.875%, 01/15/2030 | | | | | 40,000 | | | | 69,100 | | | | 0.21 | |
Turkey (Rep of) 8.000%, 02/14/2034 | | | | | 110,000 | | | | 140,112 | | | | 0.43 | |
See accompanying notes to the financial statements.
48
ASHMORE EMERGING MARKETS SOVEREIGN DEBT FUND
SCHEDULE OF INVESTMENTS (CONTINUED)
As of April 30, 2012 (Unaudited)
| | | | | | | | | | | | | | |
| | | Currency(1) | | Par | | | Value | | | % of Net Assets | |
Turkey - (continued) | | | | | | | | | | | | | | |
Turkey (Rep of) 6.875%, 03/17/2036 | | | | | 114,000 | | | | $ 129,248 | | | | 0.40 | |
Turkey (Rep of) 7.250%, 03/05/2038 | | | | | 40,000 | | | | 47,650 | | | | 0.15 | |
Turkey (Rep of) 6.750%, 05/30/2040 | | | | | 100,000 | | | | 111,375 | | | | 0.34 | |
| | | | | | | | | 1,792,098 | | | | 5.52 | |
Ukraine (Cost $921,052) | | | | | | | | | | | | | | |
Financing of Infrastructure Projects State Enterprise 8.375%, 11/03/2017(2) | | | | | 150,000 | | | | 126,563 | | | | 0.39 | |
National JSC Naftogaz of Ukraine 9.500%, 09/30/2014 | | | | | 110,000 | | | | 108,212 | | | | 0.33 | |
Ukraine (Rep of) 6.875%, 09/23/2015 | | | | | 320,000 | | | | 302,000 | | | | 0.93 | |
Ukraine (Rep of) 6.580%, 11/21/2016 | | | | | 100,000 | | | | 91,750 | | | | 0.28 | |
Ukreximbank Via Biz Finance PLC 8.375%, 04/27/2015 | | | | | 260,000 | | | | 241,800 | | | | 0.75 | |
| | | | | | | | | 870,325 | | | | 2.68 | |
United Arab Emirates (Cost $708,913) | | | | | | | | | | | | | | |
Dubai DOF Sukuk Ltd. 6.396%, 11/03/2014 | | | | | 250,000 | | | | 263,750 | | | | 0.81 | |
Emirate of Dubai (Rep of) 7.750%, 10/05/2020 | | | | | 450,000 | | | | 498,937 | | | | 1.54 | |
| | | | | | | | | 762,687 | | | | 2.35 | |
Uruguay (Cost $937,853) | | | | | | | | | | | | | | |
Uruguay (Rep of) 8.000%, 11/18/2022 | | | | | 333,000 | | | | 460,372 | | | | 1.42 | |
Uruguay (Rep of) 6.875%, 09/28/2025 | | | | | 91,000 | | | | 118,300 | | | | 0.36 | |
Uruguay (Rep of) 7.875%, 01/15/2033 | | | | | 232,000 | | | | 328,280 | | | | 1.01 | |
Uruguay (Rep of) 7.625%, 03/21/2036 | | | | | 56,000 | | | | 78,680 | | | | 0.24 | |
| | | | | | | | | 985,632 | | | | 3.03 | |
Venezuela (Cost $2,124,490) | | | | | | | | | | | | | | |
Petroleos de Venezuela S.A. 5.250%, 04/12/2017 | | | | | 100,000 | | | | 78,750 | | | | 0.24 | |
Petroleos de Venezuela S.A. 12.750%, 02/17/2022 | | | | | 75,000 | | | | 76,800 | | | | 0.24 | |
Petroleos de Venezuela S.A. 5.375%, 04/12/2027 | | | | | 310,000 | | | | 192,200 | | | | 0.59 | |
Petroleos de Venezuela S.A. 5.500%, 04/12/2037 | | | | | 140,000 | | | | 85,050 | | | | 0.26 | |
Venezuela (Rep of) 8.500%, 10/08/2014 | | | | | 50,000 | | | | 50,750 | | | | 0.16 | |
Venezuela (Rep of) 5.750%, 02/26/2016 | | | | | 70,000 | | | | 63,175 | | | | 0.20 | |
Venezuela (Rep of) 7.750%, 10/13/2019 | | | | | 140,000 | | | | 121,100 | | | | 0.37 | |
Venezuela (Rep of) 6.000%, 12/09/2020 | | | | | 70,000 | | | | 52,850 | | | | 0.16 | |
Venezuela (Rep of) 12.750%, 08/23/2022 | | | | | 415,000 | | | | 448,200 | | | | 1.38 | |
Venezuela (Rep of) 9.000%, 05/07/2023 | | | | | 180,000 | | | | 156,600 | | | | 0.48 | |
Venezuela (Rep of) 8.250%, 10/13/2024 | | | | | 210,000 | | | | 172,200 | | | | 0.53 | |
Venezuela (Rep of) 7.650%, 04/21/2025 | | | | | 75,000 | | | | 58,125 | | | | 0.18 | |
Venezuela (Rep of) 11.750%, 10/21/2026 | | | | | 190,000 | | | | 190,950 | | | | 0.59 | |
Venezuela (Rep of) 9.250%, 09/15/2027 | | | | | 160,000 | | | | 141,600 | | | | 0.44 | |
Venezuela (Rep of) 9.250%, 05/07/2028 | | | | | 185,000 | | | | 157,250 | | | | 0.48 | |
Venezuela (Rep of) 11.950%, 08/05/2031 | | | | | 455,000 | | | | 457,275 | | | | 1.41 | |
Venezuela (Rep of) 9.375%, 01/13/2034 | | | | | 104,000 | | | | 88,920 | | | | 0.27 | |
| | | | | | | | | 2,591,795 | | | | 7.98 | |
Vietnam (Cost $297,427) | | | | | | | | | | | | | | |
Vietnam (Rep of) 6.875%, 01/15/2016 | | | | | 100,000 | | | | 108,250 | | | | 0.34 | |
Vietnam (Rep of) 6.750%, 01/29/2020 | | | | | 190,000 | | | | 205,675 | | | | 0.63 | |
| | | | | | | | | 313,925 | | | | 0.97 | |
Total Debt Securities (Cost $30,083,284) | | | | | | | | | 31,634,721 | | | | 97.38 | |
| | | | |
Total Investments (Total Cost $30,083,284) | | | | | | | | | 31,634,721 | | | | 97.38 | |
| | | | |
Other Assets Less Liabilities (See Statements of Assets and Liabilities for further detail) | | | | | | | | | 852,515 | | | | 2.62 | |
| | | | |
Net Assets | | | | | | | | | $32,487,236 | | | | 100.00 | |
See accompanying notes to the financial statements.
49
ASHMORE EMERGING MARKETS SOVEREIGN DEBT FUND
SCHEDULE OF INVESTMENTS (CONTINUED)
As of April 30, 2012 (Unaudited)
| (1) | Par values are stated in United States Dollars unless otherwise noted below. |
| (2) | All or a portion of this security is designated as 144A. |
| (3) | Issuer has defaulted on terms of debt obligation. |
Percentages shown are based on net assets.
At April 30, 2012, the Ashmore Emerging Markets Sovereign Debt Fund had open futures contracts as follows:
| | | | | | | | | | | | | | | | | | | | |
Futures Contracts | | | | | | Number of
Contracts | | | Notional
Value | | | Settlement
Month | | | Unrealized
Gain/(Loss) | |
Short | | | | | | | | | | | | | | | | | | | | |
U.S. Treasury Bonds | | | | | | | (12 | ) | | $ | 1,893,720 | | | | June 2012 | | | $ | (72,602 | ) |
U.S. Treasury Notes | | | | | | | (40 | ) | | | 5,291,200 | | | | June 2012 | | | | (106,126 | ) |
| | | | | | | | | | | | | | | | | | | | |
Total | | | | | | | | | | | | | | | | | | $ | (178,728 | ) |
| | | | | | | | | | | | | | | | | | | | |
At April 30, 2012, the Ashmore Emerging Markets Sovereign Debt Fund had outstanding forward foreign currency exchange contracts as follows:
| | | | | | | | | | | | | | | | | | | | |
Settlement Date | | Counterparty | | Currency Buy | | | Currency Buy Amount (Local Currency) | | | Currency Sell | | Currency Sell Amount
(Local Currency) | | | Unrealized Gain/(Loss) | |
05/21/2012 | | Barclays Wholesale GTS | | | United States Dollar | | | | 95,366 | | | Euro | | | 72,330 | | | $ | (385 | ) |
05/21/2012 | | Union Bank of Switzerland-London | | | United States Dollar | | | | 95,374 | | | Euro | | | 72,330 | | | | (377 | ) |
| | | | | | | | | | | | | | | | | | | | |
Total | | | | | | | | | | | | | | | | | | $ | (762 | ) |
| | | | | | | | | | | | | | | | | | | | |
The inputs or methodologies used for valuing securities are not necessarily an indication of the risks associated with investing in those securities and other financial instruments, if any. See note 4 in the Notes to Financial Statements for more information regarding pricing inputs and valuation techniques. The following is a summary of the inputs used in valuing the Ashmore Emerging Markets Sovereign Debt Fund’s investments and other financial instruments, which are carried at fair value, as of April 30, 2012:
| | | | | | | | | | | | | | | | |
| | | Level 1 | | | Level 2 | | | Level 3 | | | Total | |
Investments | | | | | | | | | | | | | | | | |
Assets: | | | | | | | | | | | | | | | | |
Corporate Bonds | | $ | — | | | $ | 5,042,151 | | | $ | — | | | $ | 5,042,151 | |
Government Agencies | | | — | | | | 966,686 | | | | — | | | | 966,686 | |
Government Bonds | | | — | | | | 25,087,259 | | | | — | | | | 25,087,259 | |
Financial Certificates | | | — | | | | 538,625 | | | | — | | | | 538,625 | |
Total Investments | | $ | — | | | $ | 31,634,721 | | | $ | — | | | $ | 31,634,721 | |
| | | | |
Other Financial Instruments | | | | | | | | | | | | | | | | |
Liabilities: | | | | | | | | | | | | | | | | |
Forward Foreign Currency Exchange Contracts | | $ | — | | | $ | (762 | ) | | $ | — | | | $ | (762 | ) |
Futures Contracts | | | (178,728 | ) | | | — | | | | — | | | | (178,728 | ) |
Total Other Financial Instruments | | $ | (178,728 | ) | | $ | (762 | ) | | $ | — | | | $ | (179,490 | ) |
The Fund discloses significant transfers between levels based on valuations at the end of each reporting period. At April 30, 2012 there were no significant transfers between Level 1 and Level 2 based on levels assigned to the securities on October 31, 2011. U.S. GAAP provides additional guidance for estimating fair value when the volume and level of activity for the asset or liability have significantly decreased as well as guidance on identifying circumstances that indicate when a transaction is not orderly.
See accompanying notes to the financial statements.
50
ASHMORE EMERGING MARKETS SOVEREIGN DEBT FUND
SCHEDULE OF INVESTMENTS (CONTINUED)
As of April 30, 2012 (Unaudited)
The following is a summary of the fair values of the Fund’s derivative instruments categorized by risk exposure*:
Fair Values of Financial Derivative Instruments on the Statements of Assets and Liabilities as of April 30, 2012:
| | | | | | | | |
| | | Derivatives Not Accounted for as
Hedging Instruments | |
| | | Foreign Exchange | | | Fixed Income/ Interest Rate | |
Liabilities: | | | | | | | | |
Unrealized Depreciation on Forward Foreign Currency Exchange Contracts | | $ | (762 | ) | | $ | — | |
Variation Margin Payable(1) | | | — | | | | (6,875 | ) |
| | | | | | | | |
| | $ | (762 | ) | | $ | (6,875 | ) |
| | | | | | | | |
| (1) | Only current day’s variation margin is reported within the Statements of Assets and Liabilities. The variation margin is included in the open futures cumulative appreciation/(depreciation) of $(178,728). |
The Effect of Financial Derivative Instruments on the Statements of Operations for the Period Ended April 30, 2012:
| | | | | | | | |
| | | Derivatives Not Accounted for as
Hedging Instruments | |
| | | Foreign Exchange | | | Fixed Income/
Interest Rate | |
| Realized Gain (Loss) on Derivatives Recognized resulting from Operations: | | | | | | | | |
Net Realized Gain on Forward Foreign Currency Exchange Contracts | | $ | 9,089 | | | $ | — | |
Net Realized Loss on Futures Contracts | | | — | | | | (103 | ) |
| | | | | | | | |
| | $ | 9,089 | | | $ | (103 | ) |
| | | | | | | | |
| | |
Net Change in Unrealized Depreciation on Derivatives Recognized resulting from Operations: | | | | | | | | |
Net Change in Unrealized Depreciation on Forward Foreign Currency Exchange Contracts | | $ | (262 | ) | | $ | — | |
Net Change in Unrealized Depreciation on Futures Contracts | | | — | | | | (178,728 | ) |
| | | | | | | | |
| | $ | (262 | ) | | $ | (178,728 | ) |
| | | | | | | | |
| * | See note 9 in the Notes to Financial Statements for additional information. |
See accompanying notes to the financial statements.
51
ASHMORE EMERGING MARKETS TOTAL RETURN FUND
SCHEDULE OF INVESTMENTS
As of April 30, 2012 (Unaudited)
| | | | | | | | | | | | | | |
| | | Currency(1) | | Par | | | Value | | | % of Net
Assets | |
Debt Securities | | | | | | | | | | | | | | |
| | | | |
Argentina (Cost $4,211,967) | | | | | | | | | | | | | | |
Arcos Dorados Holdings, Inc. 10.250%, 07/13/2016(2) | | BRL | | | 800,000 | | | $ | 434,383 | | | | 0.27 | |
Arcos Dorados Holdings, Inc. 10.250%, 07/13/2016 | | BRL | | | 550,000 | | | | 297,098 | | | | 0.19 | |
Argentina Boden Bonos, FRN 0.785%, 08/03/2012 | | | | | 1,510,000 | | | | 183,230 | | | | 0.11 | |
Argentina Boden Bonos 7.000%, 10/03/2015 | | | | | 530,000 | | | | 472,983 | | | | 0.30 | |
Argentine (Rep of) 8.750%, 06/02/2017 | | | | | 98,000 | | | | 90,405 | | | | 0.06 | |
Argentine (Rep of) 8.280%, 12/31/2033 | | | | | 493,510 | | | | 342,122 | | | | 0.22 | |
WPE International Cooperatief UA | | | | | 1,700,000 | | | | 1,457,427 | | | | 0.92 | |
10.375%, 09/30/2020 | | | | | | | | | | | | | | |
WPE International Cooperatief UA | | | | | 500,000 | | | | 437,500 | | | | 0.28 | |
10.375%, 09/30/2020(2) | | | | | | | | | | | | | | |
| | | | | | | | | 3,715,148 | | | | 2.35 | |
Bahrain (Cost $97,851) | | | | | | | | | | | | | | |
Bahrain (Rep of) 5.500%, 03/31/2020 | | | | | 100,000 | | | | 98,750 | | | | 0.06 | |
| | | | | | | | | 98,750 | | | | 0.06 | |
Barbados (Cost $1,033,114) | | | | | | | | | | | | | | |
Columbus International, Inc. 11.500%, 11/20/2014 | | | | | 950,000 | | | | 1,026,589 | | | | 0.65 | |
| | | | | | | | | 1,026,589 | | | | 0.65 | |
Belarus (Cost $819,996) | | | | | | | | | | | | | | |
Belarus (Rep of) 8.750%, 08/03/2015 | | | | | 470,000 | | | | 438,862 | | | | 0.28 | |
Belarus (Rep of) 8.950%, 01/26/2018 | | | | | 450,000 | | | | 416,250 | | | | 0.26 | |
| | | | | | | | | 855,112 | | | | 0.54 | |
Brazil (Cost $17,888,656) | | | | | | | | | | | | | | |
Banco Nacional de Desenvolvimento Economico e Social | | | | | 450,000 | | | | 531,922 | | | | 0.34 | |
6.500%, 06/10/2019 | | | | | | | | | | | | | | |
Banco Nacional de Desenvolvimento Economico e Social | | | | | 250,000 | | | | 280,715 | | | | 0.18 | |
5.500%, 07/12/2020 | | | | | | | | | | | | | | |
Banco Votorantim S.A. 6.250%, 05/16/2016(2) | | BRL | | | 2,000,000 | | | | 1,134,869 | | | | 0.72 | |
Banco Votorantim S.A. 6.250%, 05/16/2016 | | BRL | | | 800,000 | | | | 488,322 | | | | 0.31 | |
Braskem Finance Ltd. 5.750%, 04/15/2021 | | | | | 500,000 | | | | 520,455 | | | | 0.33 | |
Braskem Finance Ltd. 5.750%, 04/15/2021(2) | | | | | 200,000 | | | | 208,176 | | | | 0.13 | |
Brazil (Fed Rep of) 6.000%, 01/17/2017 | | | | | 100,000 | | | | 118,950 | | | | 0.07 | |
Brazil (Fed Rep of) 5.875%, 01/15/2019 | | | | | 300,000 | | | | 361,500 | | | | 0.23 | |
Brazil (Fed Rep of) 4.875%, 01/22/2021 | | | | | 880,000 | | | | 1,010,240 | | | | 0.64 | |
Brazil (Fed Rep of) 8.875%, 04/15/2024 | | | | | 160,000 | | | | 246,000 | | | | 0.16 | |
Brazil (Fed Rep of) 10.125%, 05/15/2027 | | | | | 330,000 | | | | 556,050 | | | | 0.35 | |
Brazil (Fed Rep of) 8.250%, 01/20/2034 | | | | | 440,000 | | | | 678,700 | | | | 0.43 | |
Brazil (Fed Rep of) 7.125%, 01/20/2037 | | | | | 560,000 | | | | 788,200 | | | | 0.50 | |
Brazil (Fed Rep of) 5.625%, 01/07/2041 | | | | | 890,000 | | | | 1,059,100 | | | | 0.67 | |
Brazil Notas do Tesouro Nacional, Serie B | | BRL | | | 1,390,000 | | | | 1,745,311 | | | | 1.10 | |
6.000%, 08/15/2020 | | | | | | | | | | | | | | |
Brazil Notas do Tesouro Nacional, Serie F | | BRL | | | 1,840,000 | | | | 987,318 | | | | 0.62 | |
10.000%, 01/01/2014 | | | | | | | | | | | | | | |
Brazil Notas do Tesouro Nacional, Serie F | | BRL | | | 2,590,000 | | | | 1,363,175 | | | | 0.86 | |
10.000%, 01/01/2017 | | | | | | | | | | | | | | |
Itau Unibanco Holding S.A. 10.500%, 11/23/2015 | | BRL | | | 1,090,000 | | | | 628,725 | | | | 0.40 | |
Itau Unibanco Holding S.A. 10.500%, 11/23/2015(2) | | BRL | | | 400,000 | | | | 230,725 | | | | 0.15 | |
JBS Finance II Ltd. 8.250%, 01/29/2018 | �� | | | | 500,000 | | | | 488,885 | | | | 0.31 | |
Marfrig Holding Europe B.V. 8.375%, 05/09/2018 | | | | | 1,450,000 | | | | 1,253,482 | | | | 0.79 | |
Marfrig Overseas Ltd. 9.500%, 05/04/2020 | | | | | 200,000 | | | | 174,694 | | | | 0.11 | |
Minerva Luxembourg S.A. 12.250%, 02/10/2022(2) | | | | | 250,000 | | | | 266,250 | | | | 0.17 | |
See accompanying notes to the financial statements.
52
ASHMORE EMERGING MARKETS TOTAL RETURN FUND
SCHEDULE OF INVESTMENTS (CONTINUED)
As of April 30, 2012 (Unaudited)
| | | | | | | | | | | | | | |
| | | Currency(1) | | Par | | | Value | | | % of Net
Assets | |
Brazil - (continued) | | | | | | | | | | | | | | |
Oi S.A. 9.750%, 09/15/2016(2) | | BRL | | | 3,400,000 | | | $ | 1,873,367 | | | | 1.18 | |
Oi S.A. 9.750%, 09/15/2016 | | BRL | | | 700,000 | | | | 389,527 | | | | 0.25 | |
Oi S.A. 5.750%, 02/10/2022(2) | | | | | 250,000 | | | | 256,292 | | | | 0.16 | |
OSX 3 Leasing BV 9.250%, 03/20/2015(2) | | | | | 100,000 | | | | 104,000 | | | | 0.07 | |
| | | | | | | | | 17,744,950 | | | | 11.23 | |
Chile (Cost $2,970,151) | | | | | | | | | | | | | | |
Banco del Estado de Chile 4.125%, 10/07/2020 | | | | | 340,000 | | | | 351,645 | | | | 0.22 | |
Banco Santander Chile 6.500%, 09/22/2020 | | CLP | | | 470,000,000 | | | | 920,429 | | | | 0.58 | |
Chile (Rep of) 3.250%, 09/14/2021 | | | | | 100,000 | | | | 104,083 | | | | 0.07 | |
Corp. Nacional del Cobre de Chile 3.750%, 11/04/2020 | | | | | 200,000 | | | | 208,574 | | | | 0.13 | |
Corp. Nacional del Cobre de Chile 3.875%, 11/03/2021(2) | | | | | 200,000 | | | | 208,226 | | | | 0.13 | |
Empresa Nacional del Petroleo 6.250%, 07/08/2019 | | | | | 300,000 | | | | 341,454 | | | | 0.22 | |
Empresa Nacional del Petroleo 5.250%, 08/10/2020 | | | | | 250,000 | | | | 267,347 | | | | 0.17 | |
Inversiones Alsacia S.A. 8.000%, 08/18/2018 | | | | | 482,759 | | | | 469,657 | | | | 0.30 | |
Inversiones Alsacia S.A. 8.000%, 08/18/2018(2) | | | | | 144,828 | | | | 141,207 | | | | 0.09 | |
| | | | | | | | | 3,012,622 | | | | 1.91 | |
China (Cost $5,779,698) | | | | | | | | | | | | | | |
Central China Real Estate Ltd. 12.250%, 10/20/2015 | | | | | 650,000 | | | | 658,125 | | | | 0.42 | |
Central China Real Estate Ltd. 12.250%, 10/20/2015(2) | | | | | 200,000 | | | | 203,500 | | | | 0.13 | |
China Shanshui Cement Group Ltd. 10.500%, 04/27/2017(2) | | | | | 300,000 | | | | 303,375 | | | | 0.19 | |
Evergrande Real Estate Group Ltd. 13.000%, 01/27/2015 | | | | | 1,050,000 | | | | 1,055,250 | | | | 0.67 | |
Hyva Global B.V. 8.625%, 03/24/2016 | | | | | 700,000 | | | | 589,869 | | | | 0.37 | |
Hyva Global B.V. 8.625%, 03/24/2016(2) | | | | | 200,000 | | | | 168,000 | | | | 0.11 | |
Shimao Property Holdings Ltd. 9.650%, 08/03/2017 | | | | | 400,000 | | | | 353,668 | | | | 0.22 | |
Sinochem Offshore Capital Co. Ltd. 1.800%, 01/18/2014 | | CNY | | | 6,000,000 | | | | 920,823 | | | | 0.58 | |
Sinochem Overseas Capital Co. Ltd. 4.500%, 11/12/2020 | | | | | 450,000 | | | | 442,802 | | | | 0.28 | |
Sinochem Overseas Capital Co. Ltd. 4.500%, 11/12/2020(2) | | | | | 100,000 | | | | 98,351 | | | | 0.06 | |
Sinochem Overseas Capital Co. Ltd. 6.300%, 11/12/2040 | | | | | 470,000 | | | | 466,910 | | | | 0.30 | |
Sino-Forest Corp. 5.000%, 08/01/2013(2)(3) | | | | | 76,000 | | | | 19,855 | | | | 0.01 | |
Sino-Forest Corp. 10.250%, 07/28/2014(3) | | | | | 226,000 | | | | 59,890 | | | | 0.04 | |
Sino-Forest Corp. 10.250%, 07/28/2014(2)(3) | | | | | 30,000 | | | | 8,100 | | | | 0.01 | |
Sino-Forest Corp. 4.250%, 12/15/2016(2)(3) | | | | | 174,000 | | | | 46,545 | | | | 0.03 | |
Sino-Forest Corp. 4.250%, 12/15/2016(3) | | | | | 10,000 | | | | 2,675 | | | | — | |
Sino-Forest Corp. 6.250%, 10/21/2017(3) | | | | | 400,000 | | | | 106,000 | | | | 0.07 | |
Sino-Forest Corp. 6.250%, 10/21/2017(2)(3) | | | | | 28,000 | | | | 7,595 | | | | — | |
| | | | | | | | | 5,511,333 | | | | 3.49 | |
Colombia (Cost $4,805,587) | | | | | | | | | | | | | | |
Colombia (Rep of) 12.000%, 10/22/2015 | | COP | | | 1,211,000,000 | | | | 860,250 | | | | 0.55 | |
Colombia (Rep of) 7.375%, 01/27/2017 | | | | | 540,000 | | | | 668,250 | | | | 0.42 | |
Colombia (Rep of) 7.375%, 03/18/2019 | | | | | 540,000 | | | | 700,650 | | | | 0.44 | |
Colombia (Rep of) 11.750%, 02/25/2020 | | | | | 330,000 | | | | 526,350 | | | | 0.33 | |
Colombia (Rep of) 4.375%, 07/12/2021 | | | | | 200,000 | | | | 221,000 | | | | 0.14 | |
Colombia (Rep of) 8.125%, 05/21/2024 | | | | | 330,000 | | | | 470,250 | | | | 0.30 | |
Colombia (Rep of) 7.375%, 09/18/2037 | | | | | 340,000 | | | | 488,750 | | | | 0.31 | |
Colombia (Rep of) 6.125%, 01/18/2041 | | | | | 490,000 | | | | 618,625 | | | | 0.39 | |
Emgesa S.A. ESP 8.750%, 01/25/2021 | | COP | | | 830,000,000 | | | | 524,026 | | | | 0.33 | |
| | | | | | | | | 5,078,151 | | | | 3.21 | |
Croatia (Cost $758,288) | | | | | | | | | | | | | | |
Croatia (Rep of) 6.250%, 04/27/2017(2) | | | | | 250,000 | | | | 252,883 | | | | 0.16 | |
Croatia (Rep of) 6.750%, 11/05/2019 | | | | | 100,000 | | | | 101,250 | | | | 0.06 | |
Croatia (Rep of) 6.625%, 07/14/2020 | | | | | 200,000 | | | | 200,000 | | | | 0.13 | |
Croatia (Rep of) 6.375%, 03/24/2021 | | | | | 200,000 | | | | 196,500 | | | | 0.12 | |
| | | | | | | | | 750,633 | | | | 0.47 | |
See accompanying notes to the financial statements.
53
ASHMORE EMERGING MARKETS TOTAL RETURN FUND
SCHEDULE OF INVESTMENTS (CONTINUED)
As of April 30, 2012 (Unaudited)
| | | | | | | | | | | | | | |
| | | Currency(1) | | Par | | | Value | | | % of Net
Assets | |
Czech Republic (Cost $720,121) | | | | | | | | | | | | | | |
Central European Media Enterprises Ltd., FRN 3.313%, 05/15/2014 | | EUR | | | 200,000 | | | $ | 225,714 | | | | 0.14 | |
Central European Media Enterprises Ltd. 11.625%, 09/15/2016 | | EUR | | | 350,000 | | | | 434,936 | | | | 0.28 | |
| | | | | | | | | 660,650 | | | | 0.42 | |
Dominican Republic (Cost $417,552) | | | | | | | | | | | | | | |
Dominican (Rep of) 7.500%, 05/06/2021 | | | | | 300,000 | | | | 315,000 | | | | 0.20 | |
Dominican (Rep of) 7.500%, 05/06/2021(2) | | | | | 100,000 | | | | 105,183 | | | | 0.07 | |
| | | | | | | | | 420,183 | | | | 0.27 | |
Ecuador (Cost $201,565) | | | | | | | | | | | | | | |
Ecuador (Rep of) 9.375%, 12/15/2015 | | | | | 200,000 | | | | 203,000 | | | | 0.13 | |
| | | | | | | | | 203,000 | | | | 0.13 | |
Egypt (Cost $406,597) | | | | | | | | | | | | | | |
Egypt (Rep of) 5.750%, 04/29/2020 | | | | | 200,000 | | | | 184,500 | | | | 0.12 | |
Nile Finance Ltd. 5.250%, 08/05/2015 | | | | | 200,000 | | | | 192,500 | | | | 0.12 | |
| | | | | | | | | 377,000 | | | | 0.24 | |
El Salvador (Cost $1,812,905) | | | | | | | | | | | | | | |
El Salvador (Rep of) 7.375%, 12/01/2019 | | | | | 100,000 | | | | 109,000 | | | | 0.07 | |
El Salvador (Rep of) 8.250%, 04/10/2032 | | | | | 80,000 | | | | 87,600 | | | | 0.06 | |
El Salvador (Rep of) 7.650%, 06/15/2035 | | | | | 305,000 | | | | 314,150 | | | | 0.20 | |
El Salvador (Rep of) 7.625%, 02/01/2041 | | | | | 300,000 | | | | 303,750 | | | | 0.19 | |
Telemovil Finance Co. Ltd. 8.000%, 10/01/2017 | | | | | 650,000 | | | | 666,101 | | | | 0.42 | |
Telemovil Finance Co. Ltd. 8.000%, 10/01/2017(2) | | | | | 300,000 | | | | 307,500 | | | | 0.19 | |
| | | | | | | | | 1,788,101 | | | | 1.13 | |
Georgia (Cost $413,891) | | | | | | | | | | | | | | |
Georgia (Rep of) 6.875%, 04/12/2021 | | | | | 400,000 | | | | 434,000 | | | | 0.27 | |
| | | | | | | | | 434,000 | | | | 0.27 | |
Ghana (Cost $221,400) | | | | | | | | | | | | | | |
Ghana (Rep of) 8.500%, 10/04/2017 | | | | | 200,000 | | | | 227,500 | | | | 0.14 | |
| | | | | | | | | 227,500 | | | | 0.14 | |
Hungary (Cost $634,610) | | | | | | | | | | | | | | |
Hungary (Rep of) 6.250%, 01/29/2020 | | | | | 260,000 | | | | 248,950 | | | | 0.16 | |
Hungary (Rep of) 6.375%, 03/29/2021 | | | | | 280,000 | | | | 268,800 | | | | 0.17 | |
Hungary (Rep of) 7.625%, 03/29/2041 | | | | | 90,000 | | | | 85,275 | | | | 0.05 | |
| | | | | | | | | 603,025 | | | | 0.38 | |
India (Cost $684,945) | | | | | | | | | | | | | | |
ICICI Bank Ltd. 5.750%, 11/16/2020 | | | | | 500,000 | | | | 492,850 | | | | 0.31 | |
ICICI Bank Ltd. 5.750%, 11/16/2020(2) | | | | | 200,000 | | | | 197,150 | | | | 0.13 | |
| | | | | | | | | 690,000 | | | | 0.44 | |
Indonesia (Cost $5,756,318) | | | | | | | | | | | | | | |
Berau Capital Resources Pte Ltd. 12.500%, 07/08/2015 | | | | | 400,000 | | | | 449,000 | | | | 0.28 | |
Berau Coal Energy Tbk PT 7.250%, 03/13/2017(2) | | | | | 200,000 | | | | 199,500 | | | | 0.13 | |
GT 2005 Bonds B.V., FRN 6.000%, 07/21/2014 | | | | | 800,000 | | | | 782,944 | | | | 0.50 | |
Indonesia (Rep of) 6.750%, 03/10/2014 | | | | | 65,000 | | | | 70,200 | | | | 0.04 | |
Indonesia (Rep of) 10.375%, 05/04/2014 | | | | | 200,000 | | | | 231,500 | | | | 0.15 | |
Indonesia (Rep of) 7.500%, 01/15/2016 | | | | | 250,000 | | | | 290,625 | | | | 0.18 | |
Indonesia (Rep of) 6.875%, 01/17/2018 | | | | | 500,000 | | | | 590,000 | | | | 0.37 | |
Indonesia (Rep of) 11.625%, 03/04/2019 | | | | | 150,000 | | | | 221,625 | | | | 0.14 | |
Indonesia (Rep of) 5.875%, 03/13/2020 | | | | | 350,000 | | | | 399,000 | | | | 0.25 | |
Indonesia (Rep of) 4.875%, 05/05/2021 | | | | | 400,000 | | | | 430,000 | | | | 0.27 | |
Indonesia (Rep of) 8.500%, 10/12/2035 | | | | | 540,000 | | | | 785,700 | | | | 0.50 | |
Indonesia (Rep of) 6.625%, 02/17/2037 | | | | | 200,000 | | | | 241,000 | | | | 0.15 | |
Indonesia (Rep of) 7.750%, 01/17/2038 | | | | | 300,000 | | | | 406,875 | | | | 0.26 | |
See accompanying notes to the financial statements.
54
ASHMORE EMERGING MARKETS TOTAL RETURN FUND
SCHEDULE OF INVESTMENTS (CONTINUED)
As of April 30, 2012 (Unaudited)
| | | | | | | | | | | | | | |
| | | Currency(1) | | Par | | | Value | | | % of Net
Assets | |
Indonesia - (continued) | | | | | | | | | | | | | | |
Majapahit Holding B.V. 7.750%, 10/17/2016 | | | | | 200,000 | | | $ | 230,000 | | | | 0.15 | |
Majapahit Holding B.V. 8.000%, 08/07/2019 | | | | | 200,000 | | | | 240,500 | | | | 0.15 | |
Majapahit Holding B.V. 7.750%, 01/20/2020 | | | | | 100,000 | | | | 118,750 | | | | 0.08 | |
Pertamina Persero PT 6.000%, 05/03/2042(2)(4) | | | | | 200,000 | | | | 196,426 | | | | 0.12 | |
| | | | | | | | | 5,883,645 | | | | 3.72 | |
Iraq (Cost $1,417,769) | | | | | | | | | | | | | | |
Iraq (Rep of) 5.800%, 01/15/2028 | | | | | 1,570,000 | | | | 1,308,988 | | | | 0.83 | |
| | | | | | | | | 1,308,988 | | | | 0.83 | |
Israel (Cost $250,000) | | | | | | | | | | | | | | |
Israel Electric Corp. Ltd. 6.700%, 02/10/2017(2) | | | | | 250,000 | | | | 258,750 | | | | 0.16 | |
| | | | | | | | | 258,750 | | | | 0.16 | |
Ivory Coast (Cost $730,620) | | | | | | | | | | | | | | |
Ivory Coast (Rep of) 2.450%, 12/31/2032(3) | | | | | 1,350,000 | | | | 923,063 | | | | 0.58 | |
| | | | | | | | | 923,063 | | | | 0.58 | |
Jamaica (Cost $1,167,382) | | | | | | | | | | | | | | |
Digicel Group Ltd. 8.875%, 01/15/2015 | | | | | 1,150,000 | | | | 1,157,602 | | | | 0.73 | |
| | | | | | | | | 1,157,602 | | | | 0.73 | |
Jordan (Cost $386,731) | | | | | | | | | | | | | | |
Jordan (Rep of) 3.875%, 11/12/2015 | | | | | 400,000 | | | | 391,000 | | | | 0.25 | |
| | | | | | | | | 391,000 | | | | 0.25 | |
Kazakhstan (Cost $6,499,329) | | | | | | | | | | | | | | |
BTA Bank JSC 10.750%, 07/01/2018(3) | | | | | 2,050,000 | | | | 404,875 | | | | 0.26 | |
BTA Bank JSC 0.000%, 06/30/2020(5) | | | | | 900,000 | | | | 79,875 | | | | 0.05 | |
BTA Bank JSC 7.200%, 07/01/2025(3) | | | | | 1,400,000 | | | | 56,000 | | | | 0.03 | |
Development Bank of Kazakhstan JSC 5.500%, 12/20/2015 | | | | | 200,000 | | | | 214,000 | | | | 0.13 | |
Kazakhstan Temir Zholy Finance B.V. 6.375%, 10/06/2020 | | | | | 200,000 | | | | 221,500 | | | | 0.14 | |
Kazatomprom Natsionalnaya Atomnaya Kompaniya AO 6.250%, 05/20/2015 | | | | | 250,000 | | | | 270,000 | | | | 0.17 | |
KazMunayGas National Co. 8.375%, 07/02/2013 | | | | | 110,000 | | | | 116,188 | | | | 0.07 | |
KazMunayGas National Co. 11.750%, 01/23/2015 | | | | | 300,000 | | | | 363,750 | | | | 0.23 | |
KazMunayGas National Co. 9.125%, 07/02/2018 | | | | | 490,000 | | | | 609,438 | | | | 0.39 | |
KazMunayGas National Co. 7.000%, 05/05/2020 | | | | | 470,000 | | | | 538,150 | | | | 0.34 | |
KazMunayGas National Co. 6.375%, 04/09/2021 | | | | | 450,000 | | | | 500,062 | | | | 0.32 | |
Zhaikmunai LLP 10.500%, 10/19/2015(2) | | | | | 1,450,000 | | | | 1,500,750 | | | | 0.95 | |
| | | | | | | | | 4,874,588 | | | | 3.08 | |
Kuwait (Cost $221,062) | | | | | | | | | | | | | | |
Kuwait Projects Co. 9.375%, 07/15/2020 | | | | | 200,000 | | | | 220,700 | | | | 0.14 | |
| | | | | | | | | 220,700 | | | | 0.14 | |
Lebanon (Cost $1,910,670) | | | | | | | | | | | | | | |
Lebanon (Rep of) 5.150%, 11/12/2018 | | | | | 150,000 | | | | 150,000 | | | | 0.10 | |
Lebanon (Rep of) 6.375%, 03/09/2020 | | | | | 545,000 | | | | 576,338 | | | | 0.36 | |
Lebanon (Rep of) 8.250%, 04/12/2021 | | | | | 150,000 | | | | 177,000 | | | | 0.11 | |
Lebanon (Rep of) 6.100%, 10/04/2022 | | | | | 775,000 | | | | 788,562 | | | | 0.50 | |
Lebanon (Rep of) 6.600%, 11/27/2026 | | | | | 230,000 | | | | 235,175 | | | | 0.15 | |
| | | | | | | | | 1,927,075 | | | | 1.22 | |
Lithuania (Cost $1,659,905) | | | | | | | | | | | | | | |
Lithuania (Rep of) 5.125%, 09/14/2017 | | | | | 260,000 | | | | 270,725 | | | | 0.17 | |
Lithuania (Rep of) 7.375%, 02/11/2020 | | | | | 670,000 | | | | 785,240 | | | | 0.49 | |
Lithuania (Rep of) 6.125%, 03/09/2021 | | | | | 360,000 | | | | 390,150 | | | | 0.25 | |
Lithuania (Rep of) 6.625%, 02/01/2022(2) | | | | | 250,000 | | | | 280,450 | | | | 0.18 | |
| | | | | | | | | 1,726,565 | | | | 1.09 | |
Malaysia (Cost $1,215,609) | | | | | | | | | | | | | | |
Petronas Capital Ltd. 5.250%, 08/12/2019 | | | | | 640,000 | | | | 727,634 | | | | 0.46 | |
See accompanying notes to the financial statements.
55
ASHMORE EMERGING MARKETS TOTAL RETURN FUND
SCHEDULE OF INVESTMENTS (CONTINUED)
As of April 30, 2012 (Unaudited)
| | | | | | | | | | | | | | |
| | | Currency(1) | | Par | | | Value | | | % of Net
Assets | |
Malaysia - (continued) | | | | | | | | | | | | | | |
Petronas Capital Ltd. 7.875%, 05/22/2022 | | | | | 200,000 | | | $ | 272,880 | | | | 0.17 | |
Wakala Global Sukuk Bhd. 4.646%, 07/06/2021(2) | | | | | 250,000 | | | | 274,392 | | | | 0.18 | |
| | | | | | | | | 1,274,906 | | | | 0.81 | |
Mexico (Cost $12,260,889) | | | | | | | | | | | | | | |
Cemex Espana Luxembourg 9.250%, 05/12/2020 | | | | | 1,220,000 | | | | 1,099,549 | | | | 0.69 | |
Cemex S.A.B. de C.V. 9.000%, 01/11/2018 | | | | | 1,150,000 | | | | 1,073,249 | | | | 0.68 | |
Cemex S.A.B. de C.V. 9.000%, 01/11/2018(2) | | | | | 100,000 | | | | 93,750 | | | | 0.06 | |
Comision Federal de Electricidad 4.875%, 05/26/2021(2) | | | | | 200,000 | | | | 214,648 | | | | 0.14 | |
Comision Federal de Electricidad 5.750%, 02/14/2042(2) | | | | | 200,000 | | | | 204,894 | | | | 0.13 | |
Corp. GEO S.A.B. de C.V. 8.875%, 03/27/2022(2) | | | | | 200,000 | | | | 204,584 | | | | 0.13 | |
Desarrolladora Homex S.A.B. de C.V. 9.750%, 03/25/2020(2) | | | | | 300,000 | | | | 313,764 | | | | 0.20 | |
Grupo Papelero Scribe S.A. de C.V. 8.875%, 04/07/2020 | | | | | 200,000 | | | | 167,648 | | | | 0.11 | |
Mexican Bonos 9.500%, 12/18/2014 | | MXN | | | 19,000,000 | | | | 1,628,880 | | | | 1.03 | |
Mexican Bonos 8.000%, 12/17/2015 | | MXN | | | 6,340,000 | | | | 535,433 | | | | 0.34 | |
Mexican Bonos 7.250%, 12/15/2016 | | MXN | | | 13,300,000 | | | | 1,107,556 | | | | 0.70 | |
Mexican Bonos 8.000%, 06/11/2020 | | MXN | | | 13,300,000 | | | | 1,159,644 | | | | 0.73 | |
Mexico (Rep of) 5.625%, 01/15/2017 | | | | | 428,000 | | | | 499,690 | | | | 0.32 | |
Mexico (Rep of) 5.950%, 03/19/2019 | | | | | 286,000 | | | | 348,491 | | | | 0.22 | |
Mexico (Rep of) 5.125%, 01/15/2020 | | | | | 630,000 | | | | 736,470 | | | | 0.47 | |
Mexico (Rep of) 3.625%, 03/15/2022 | | | | | 206,000 | | | | 215,373 | | | | 0.14 | |
Mexico (Rep of) 8.300%, 08/15/2031 | | | | | 270,000 | | | | 411,075 | | | | 0.26 | |
Mexico (Rep of) 6.750%, 09/27/2034 | | | | | 330,000 | | | | 440,550 | | | | 0.28 | |
Mexico (Rep of) 6.050%, 01/11/2040 | | | | | 840,000 | | | | 1,050,000 | | | | 0.66 | |
Pemex Project Funding Master Trust 5.750%, 03/01/2018 | | | | | 102,000 | | | | 116,280 | | | | 0.07 | |
Petroleos Mexicanos 8.000%, 05/03/2019 | | | | | 140,000 | | | | 177,800 | | | | 0.11 | |
Petroleos Mexicanos 6.000%, 03/05/2020 | | | | | 150,000 | | | | 172,500 | | | | 0.11 | |
Petroleos Mexicanos 6.500%, 06/02/2041(2) | | | | | 130,000 | | | | 150,886 | | | | 0.09 | |
Petroleos Mexicanos 6.500%, 06/02/2041 | | | | | 122,000 | | | | 141,520 | | | | 0.09 | |
Urbi Desarrollos Urbanos S.A.B. de C.V. 9.750%, 02/03/2022(2) | | | | | 250,000 | | | | 261,188 | | | | 0.16 | |
| | | | | | | | | 12,525,422 | | | | 7.92 | |
Morocco (Cost $392,531) | | | | | | | | | | | | | | |
Morocco (Kingdom of) 4.500%, 10/05/2020 | | EUR | | | 300,000 | | | | 372,374 | | | | 0.24 | |
| | | | | | | | | 372,374 | | | | 0.24 | |
Nigeria (Cost $2,118,204) | | | | | | | | | | | | | | |
Afren PLC 11.500%, 02/01/2016 | | | | | 800,000 | | | | 866,384 | | | | 0.55 | |
Afren PLC 11.500%, 02/01/2016(2) | | | | | 600,000 | | | | 649,500 | | | | 0.41 | |
Afren PLC 10.250%, 04/08/2019(2) | | | | | 200,000 | | | | 209,500 | | | | 0.13 | |
Nigeria (Fed Rep of) 6.750%, 01/28/2021 | | | | | 200,000 | | | | 219,000 | | | | 0.14 | |
Nigeria Treasury Bill 16.085%, 03/28/2013(6) | | NGN | | | 30,000,000 | | | | 167,624 | | | | 0.11 | |
Nigeria Treasury Bill 17.034%, 04/04/2013(6) | | NGN | | | 2,000,000 | | | | 11,146 | | | | 0.01 | |
Nigeria Treasury Bill 17.025%, 04/11/2013(6) | | NGN | | | 13,000,000 | | | | 71,790 | | | | 0.04 | |
| | | | | | | | | 2,194,944 | | | | 1.39 | |
Pakistan (Cost $308,566) | | | | | | | | | | | | | | |
Pakistan (Rep of) 7.125%, 03/31/2016 | | | | | 350,000 | | | | 297,500 | | | | 0.19 | |
| | | | | | | | | 297,500 | | | | 0.19 | |
Panama (Cost $1,299,711) | | | | | | | | | | | | | | |
Panama (Rep of) 7.250%, 03/15/2015 | | | | | 170,000 | | | | 197,200 | | | | 0.12 | |
Panama (Rep of) 8.875%, 09/30/2027 | | | | | 160,000 | | | | 250,400 | | | | 0.16 | |
Panama (Rep of) 9.375%, 04/01/2029 | | | | | 220,000 | | | | 359,700 | | | | 0.23 | |
Panama (Rep of) 6.700%, 01/26/2036 | | | | | 280,000 | | | | 375,200 | | | | 0.24 | |
See accompanying notes to the financial statements.
56
ASHMORE EMERGING MARKETS TOTAL RETURN FUND
SCHEDULE OF INVESTMENTS (CONTINUED)
As of April 30, 2012 (Unaudited)
| | | | | | | | | | | | | | |
| | | Currency(1) | | Par | | | Value | | | % of Net
Assets | |
Panama - (continued) | | | | | | | | | | | | | | |
Sable International Finance Ltd. 8.750%, 02/01/2020(2) | | | | | 200,000 | | | $ | 212,500 | | | | 0.13 | |
| | | | | | | | | 1,395,000 | | | | 0.88 | |
Paraguay (Cost $737,722) | | | | | | | | | | | | | | |
Banco Bilbao Vizcaya Argentaria Paraguay S.A.
9.750%, 02/11/2016(2) | | | | | 500,000 | | | | 529,375 | | | | 0.33 | |
Mongolian Mining Corp. 8.875%, 03/29/2017(2) | | | | | 200,000 | | | | 199,250 | | | | 0.13 | |
| | | | | | | | | 728,625 | | | | 0.46 | |
Peru (Cost $1,767,549) | | | | | | | | | | | | | | |
Banco Internacional del Peru SAA 5.750%, 10/07/2020 | | | | | 200,000 | | | | 204,344 | | | | 0.13 | |
Peru (Rep of) 8.375%, 05/03/2016 | | | | | 240,000 | | | | 298,800 | | | | 0.19 | |
Peru (Rep of) 7.125%, 03/30/2019 | | | | | 110,000 | | | | 140,800 | | | | 0.09 | |
Peru (Rep of) 7.350%, 07/21/2025 | | | | | 360,000 | | | | 496,800 | | | | 0.31 | |
Peru (Rep of) 8.750%, 11/21/2033 | | | | | 358,000 | | | | 571,010 | | | | 0.36 | |
Southern Copper Corp. 6.750%, 04/16/2040 | | | | | 200,000 | | | | 220,412 | | | | 0.14 | |
| | | | | | | | | 1,932,166 | | | | 1.22 | |
Philippines (Cost $4,260,649) | | | | | | | | | | | | | | |
Philippines (Rep of) 8.375%, 06/17/2019 | | | | | 280,000 | | | | 373,450 | | | | 0.24 | |
Philippines (Rep of) 4.000%, 01/15/2021 | | | | | 500,000 | | | | 526,250 | | | | 0.33 | |
Philippines (Rep of) 7.500%, 09/25/2024 | | | | | 100,000 | | | | 130,000 | | | | 0.08 | |
Philippines (Rep of) 10.625%, 03/16/2025 | | | | | 330,000 | | | | 536,250 | | | | 0.34 | |
Philippines (Rep of) 5.500%, 03/30/2026 | | | | | 400,000 | | | | 458,500 | | | | 0.29 | |
Philippines (Rep of) 9.500%, 02/02/2030 | | | | | 440,000 | | | | 699,600 | | | | 0.44 | |
Philippines (Rep of) 7.750%, 01/14/2031 | | | | | 450,000 | | | | 626,625 | | | | 0.40 | |
Philippines (Rep of) 6.375%, 10/23/2034 | | | | | 400,000 | | | | 496,500 | | | | 0.32 | |
Power Sector Assets & Liabilities Management Corp.
7.390%, 12/02/2024 | | | | | 530,000 | | | | 669,788 | | | | 0.42 | |
| | | | | | | | | 4,516,963 | | | | 2.86 | |
Poland (Cost $2,951,870) | | | | | | | | | | | | | | |
Eileme 2 AB 11.625%, 01/31/2020(2) | | | | | 650,000 | | | | 667,875 | | | | 0.42 | |
Poland (Rep of) 6.375%, 07/15/2019 | | | | | 450,000 | | | | 528,187 | | | | 0.34 | |
Poland (Rep of) 5.000%, 03/23/2022 | | | | | 330,000 | | | | 352,688 | | | | 0.22 | |
TVN Finance Corp. II AB 10.750%, 11/15/2017 | | EUR | | | 950,000 | | | | 1,309,442 | | | | 0.83 | |
| | | | | | | | | 2,858,192 | | | | 1.81 | |
Qatar (Cost $2,102,904) | | | | | | | | | | | | | | |
CBQ Finance Ltd. 7.500%, 11/18/2019 | | | | | 700,000 | | | | 822,500 | | | | 0.52 | |
Nakilat, Inc. 6.067%, 12/31/2033 | | | | | 400,000 | | | | 433,940 | | | | 0.28 | |
Nakilat, Inc. 6.267%, 12/31/2033 | | | | | 194,048 | | | | 211,531 | | | | 0.13 | |
Qatar (Rep of) 6.400%, 01/20/2040 | | | | | 600,000 | | | | 724,500 | | | | 0.46 | |
| | | | | | | | | 2,192,471 | | | | 1.39 | |
Romania (Cost $284,380) | | | | | | | | | | | | | | |
Romania (Rep of) 6.750%, 02/07/2022(2) | | | | | 280,000 | | | | 293,868 | | | | 0.19 | |
| | | | | | | | | 293,868 | | | | 0.19 | |
Russian Federation (Cost $8,220,999) | | | | | | | | | | | | | | |
Russian Agricultural Bank OJSC Via RSHB Capital S.A.
9.000%, 06/11/2014 | | | | | 100,000 | | | | 111,375 | | | | 0.07 | |
Russian Agricultural Bank OJSC Via RSHB Capital S.A.
7.750%, 05/29/2018 | | | | | 100,000 | | | | 113,125 | | | | 0.07 | |
Russian Federal Bond - OFZ 7.100%, 03/13/2014 | | RUB | | | 7,700,000 | | | | 264,146 | | | | 0.17 | |
Russian Federal Bond - OFZ 7.500%, 03/15/2018 | | RUB | | | 13,100,000 | | | | 444,710 | | | | 0.28 | |
Russian Federal Bond - OFZ 7.600%, 04/14/2021 | | RUB | | | 2,000,000 | | | | 67,078 | | | | 0.04 | |
Russian Foreign Bond - Eurobond 5.000%, 04/29/2020 | | | | | 400,000 | | | | 433,000 | | | | 0.27 | |
Russian Foreign Bond - Eurobond 12.750%, 06/24/2028 | | | | | 180,000 | | | | 326,025 | | | | 0.21 | |
Russian Foreign Bond - Eurobond 7.500%, 03/31/2030 | | | | | 1,606,780 | | | | 1,928,136 | | | | 1.22 | |
See accompanying notes to the financial statements.
57
ASHMORE EMERGING MARKETS TOTAL RETURN FUND
SCHEDULE OF INVESTMENTS (CONTINUED)
As of April 30, 2012 (Unaudited)
| | | | | | | | | | | | | | |
| | | Currency(1) | | Par | | | Value | | | % of Net
Assets | |
Russian Federation - (continued) | | | | | | | | | | | | | | |
Russian Foreign Bond - Eurobond 5.625%, 04/04/2042(2) | | | | | 400,000 | | | $ | 422,568 | | | | 0.27 | |
Vimpel Communications Via VIP Finance Ireland Ltd. OJSC
7.748%, 02/02/2021 | | | | | 2,350,000 | | | | 2,332,375 | | | | 1.47 | |
Vimpel Communications Via VIP Finance Ireland Ltd. OJSC
7.748%, 02/02/2021(2) | | | | | 400,000 | | | | 397,044 | | | | 0.25 | |
Vnesheconombank Via VEB Finance PLC 5.450%, 11/22/2017 | | | | | 200,000 | | | | 209,000 | | | | 0.13 | |
Vnesheconombank Via VEB Finance PLC 6.902%, 07/09/2020 | | | | | 1,000,000 | | | | 1,100,000 | | | | 0.70 | |
Vnesheconombank Via VEB Finance PLC 6.800%, 11/22/2025 | | | | | 250,000 | | | | 265,625 | | | | 0.17 | |
| | | | | | | | | 8,414,207 | | | | 5.32 | |
Saudi Arabia (Cost $540,347) | | | | | | | | | | | | | | |
Dar Al-Arkan International Sukuk Co., FRN 2.717%, 07/16/2012 | | | | | 550,000 | | | | 533,500 | | | | 0.34 | |
| | | | | | | | | 533,500 | | | | 0.34 | |
Senegal (Cost $206,133) | | | | | | | | | | | | | | |
Senegal (Rep of) 8.750%, 05/13/2021 | | | | | 200,000 | | | | 216,500 | | | | 0.14 | |
| | | | | | | | | 216,500 | | | | 0.14 | |
Serbia (Cost $196,668) | | | | | | | | | | | | | | |
Serbia (Rep of) 7.250%, 09/28/2021(2) | | | | | 200,000 | | | | 210,250 | | | | 0.13 | |
| | | | | | | | | 210,250 | | | | 0.13 | |
Singapore (Cost $200,000) | | | | | | | | | | | | | | |
MMI International Ltd. 8.000%, 03/01/2017(2) | | | | | 200,000 | | | | 207,000 | | | | 0.13 | |
| | | | | | | | | 207,000 | | | | 0.13 | |
South Africa (Cost $2,037,958) | | | | | | | | | | | | | | |
Edcon Pty Ltd. 9.500%, 03/01/2018(2) | | | | | 550,000 | | | | 497,062 | | | | 0.31 | |
Edcon Pty Ltd. 9.500%, 03/01/2018 | | EUR | | | 250,000 | | | | 297,018 | | | | 0.19 | |
South Africa (Rep of) 6.875%, 05/27/2019 | | | | | 450,000 | | | | 551,250 | | | | 0.35 | |
South Africa (Rep of) 5.500%, 03/09/2020 | | | | | 200,000 | | | | 227,750 | | | | 0.14 | |
South Africa (Rep of) 6.750%, 03/31/2021 | | ZAR | | | 1,500,000 | | | | 181,760 | | | | 0.12 | |
South Africa (Rep of) 5.875%, 05/30/2022 | | | | | 250,000 | | | | 290,000 | | | | 0.18 | |
| | | | | | | | | 2,044,840 | | | | 1.29 | |
South Korea (Cost $775,251) | | | | | | | | | | | | | | |
Korea (Rep of) 7.125%, 04/16/2019 | | | | | 110,000 | | | | 138,361 | | | | 0.09 | |
Woori Bank Co. Ltd. 6.208%, 05/02/2037 | | | | | 650,000 | | | | 646,750 | | | | 0.41 | |
| | | | | | | | | 785,111 | | | | 0.50 | |
Sri Lanka (Cost $620,037) | | | | | | | | | | | | | | |
Sri Lanka (Rep of) 7.400%, 01/22/2015 | | | | | 300,000 | | | | 319,860 | | | | 0.20 | |
Sri Lanka (Rep of) 6.250%, 10/04/2020 | | | | | 100,000 | | | | 102,000 | | | | 0.07 | |
Sri Lanka (Rep of) 6.250%, 07/27/2021 | | | | | 200,000 | | | | 202,750 | | | | 0.13 | |
| | | | | | | | | 624,610 | | | | 0.40 | |
Thailand (Cost $144,694) | | | | | | | | | | | | | | |
Thailand Government Bond 1.200%, 07/14/2021 | | THB | | | 4,300,000 | | | | 143,150 | | | | 0.09 | |
| | | | | | | | | 143,150 | | | | 0.09 | |
Tunisia (Cost $59,848) | | | | | | | | | | | | | | |
Banque Centrale de Tunisie S.A. 8.250%, 09/19/2027 | | | | | 50,000 | | | | 59,875 | | | | 0.04 | |
| | | | | | | | | 59,875 | | | | 0.04 | |
Turkey (Cost $8,518,226) | | | | | | | | | | | | | | |
Turkey (Rep of) 9.237%, 11/07/2012(6) | | TRY | | | 4,600,000 | | | | 2,495,473 | | | | 1.58 | |
Turkey (Rep of) 10.486%, 07/17/2013(6) | | TRY | | | 5,014,000 | | | | 2,558,654 | | | | 1.62 | |
Turkey (Rep of) 7.250%, 03/15/2015 | | | | | 150,000 | | | | 167,437 | | | | 0.10 | |
See accompanying notes to the financial statements.
58
ASHMORE EMERGING MARKETS TOTAL RETURN FUND
SCHEDULE OF INVESTMENTS (CONTINUED)
As of April 30, 2012 (Unaudited)
| | | | | | | | | | | | | | |
| | | Currency(1) | | Par | | | Value | | | % of Net
Assets | |
Turkey - (continued) | | | | | | | | | | | | | | |
Turkey (Rep of) 7.000%, 09/26/2016 | | | | | 300,000 | | | $ | 341,625 | | | | 0.22 | |
Turkey (Rep of) 7.500%, 07/14/2017 | | | | | 230,000 | | | | 269,100 | | | | 0.17 | |
Turkey (Rep of) 6.750%, 04/03/2018 | | | | | 660,000 | | | | 752,400 | | | | 0.48 | |
Turkey (Rep of) 7.000%, 03/11/2019 | | | | | 100,000 | | | | 116,250 | | | | 0.07 | |
Turkey (Rep of) 7.500%, 11/07/2019 | | | | | 100,000 | | | | 120,000 | | | | 0.07 | |
Turkey (Rep of) 7.000%, 06/05/2020 | | | | | 65,000 | | | | 75,969 | | | | 0.05 | |
Turkey (Rep of) 5.625%, 03/30/2021 | | | | | 100,000 | | | | 107,625 | | | | 0.07 | |
Turkey (Rep of) 7.375%, 02/05/2025 | | | | | 440,000 | | | | 528,000 | | | | 0.33 | |
Turkey (Rep of) 11.875%, 01/15/2030 | | | | | 70,000 | | | | 120,925 | | | | 0.08 | |
Turkey (Rep of) 8.000%, 02/14/2034 | | | | | 220,000 | | | | 280,225 | | | | 0.18 | |
Turkey (Rep of) 6.875%, 03/17/2036 | | | | | 340,000 | | | | 385,475 | | | | 0.24 | |
Turkey (Rep of) 7.250%, 03/05/2038 | | | | | 50,000 | | | | 59,562 | | | | 0.04 | |
Turkey (Rep of) 6.750%, 05/30/2040 | | | | | 200,000 | | | | 222,750 | | | | 0.14 | |
| | | | | | | | | 8,601,470 | | | | 5.44 | |
Ukraine (Cost $3,413,440) | | | | | | | | | | | | | | |
Ferrexpo Finance PLC 7.875%, 04/07/2016 | | | | | 1,000,000 | | | | 932,500 | | | | 0.59 | |
Financing of Infrastrucural Projects State Enterprise
8.375%, 11/03/2017(2) | | | | | 100,000 | | | | 84,375 | | | | 0.05 | |
National JSC Naftogaz of Ukraine 9.500%, 09/30/2014 | | | | | 295,000 | | | | 290,206 | | | | 0.18 | |
Oschadbank Via SSB #1 PLC 8.250%, 03/10/2016 | | | | | 200,000 | | | | 175,000 | | | | 0.11 | |
Privatbank CJSC Via UK SPV Credit Finance PLC
9.375%, 09/23/2015 | | | | | 200,000 | | | | 175,500 | | | | 0.11 | |
Ukraine (Rep of) 7.650%, 06/11/2013 | | | | | 150,000 | | | | 148,312 | | | | 0.09 | |
Ukraine (Rep of) 6.875%, 09/23/2015 | | | | | 490,000 | | | | 462,438 | | | | 0.29 | |
Ukraine (Rep of) 6.250%, 06/17/2016 | | | | | 200,000 | | | | 183,500 | | | | 0.12 | |
Ukraine (Rep of) 6.580%, 11/21/2016 | | | | | 250,000 | | | | 229,375 | | | | 0.15 | |
Ukreximbank Via Biz Finance PLC 8.375%, 04/27/2015 | | | | | 590,000 | | | | 548,700 | | | | 0.35 | |
| | | | | | | | | 3,229,906 | | | | 2.04 | |
United Arab Emirates (Cost $9,203,779) | | | | | | | | | | | | | | |
Atlantic Finance Ltd. 10.750%, 05/27/2014 | | | | | 1,250,000 | | | | 1,368,750 | | | | 0.87 | |
Dubai DOF Sukuk Ltd. 6.396%, 11/03/2014 | | | | | 350,000 | | | | 369,250 | | | | 0.23 | |
Dubai Holding Commercial Operations MTN Ltd.
4.750%, 01/30/2014 | | EUR | | | 1,600,000 | | | | 1,964,453 | | | | 1.24 | |
Dubai Holding Commercial Operations MTN Ltd.
6.000%, 02/01/2017 | | GBP | | | 400,000 | | | | 538,799 | | | | 0.34 | |
Dubai Sukuk Centre Ltd., FRN 0.849%, 06/13/2012 | | | | | 1,450,000 | | | | 1,415,562 | | | | 0.90 | |
Emirate of Dubai (Rep of) 6.700%, 10/05/2015 | | | | | 210,000 | | | | 224,700 | | | | 0.14 | |
Emirate of Dubai (Rep of) 7.750%, 10/05/2020 | | | | | 920,000 | | | | 1,020,050 | | | | 0.65 | |
Jafz Sukuk Ltd., FRN 2.991%, 11/27/2012 | | AED | | | 8,600,000 | | | | 2,264,971 | | | | 1.43 | |
| | | | | | | | | 9,166,535 | | | | 5.80 | |
Uruguay (Cost $4,209,437) | | | | | | | | | | | | | | |
Uruguay (Rep of) 5.000%, 09/14/2018 | | UYU | | | 13,210,000 | | | | 1,179,317 | | | | 0.75 | |
Uruguay (Rep of) 8.000%, 11/18/2022 | | | | | 736,000 | | | | 1,017,520 | | | | 0.64 | |
Uruguay (Rep of) 6.875%, 09/28/2025 | | | | | 174,000 | | | | 226,200 | | | | 0.14 | |
Uruguay (Rep of) 4.250%, 04/05/2027 | | UYU | | | 4,500,000 | | | | 368,404 | | | | 0.23 | |
Uruguay (Rep of) 4.375%, 12/15/2028 | | UYU | | | 7,970,000 | | | | 478,792 | | | | 0.30 | |
Uruguay (Rep of) 7.875%, 01/15/2033 | | | | | 541,000 | | | | 765,515 | | | | 0.49 | |
Uruguay (Rep of) 7.625%, 03/21/2036 | | | | | 115,000 | | | | 161,575 | | | | 0.10 | |
Uruguay (Rep of) 3.700%, 06/26/2037 | | UYU | | | 3,730,000 | | | | 278,140 | | | | 0.18 | |
Uruguay Notas del Tesoro 9.000%, 01/27/2014 | | UYU | | | 100,000 | | | | 5,013 | | | | — | |
Uruguay Notas del Tesoro 3.250%, 01/27/2019 | | UYU | | | 100,000 | | | | 12,713 | | | | 0.01 | |
| | | | | | | | | 4,493,189 | | | | 2.84 | |
See accompanying notes to the financial statements.
59
ASHMORE EMERGING MARKETS TOTAL RETURN FUND
SCHEDULE OF INVESTMENTS (CONTINUED)
As of April 30, 2012 (Unaudited)
| | | | | | | | | | | | | | |
| | | Currency(1) | | Par | | | Value | | | % of Net
Assets | |
Venezuela (Cost $4,999,818) | | | | | | | | | | | | | | |
Petroleos de Venezuela S.A. 5.250%, 04/12/2017 | | | | | 240,000 | | | $ | 189,000 | | | | 0.12 | |
Petroleos de Venezuela S.A. 12.750%, 02/17/2022 | | | | | 150,000 | | | | 153,600 | | | | 0.10 | |
Petroleos de Venezuela S.A. 5.375%, 04/12/2027 | | | | | 760,000 | | | | 471,200 | | | | 0.30 | |
Petroleos de Venezuela S.A. 5.500%, 04/12/2037 | | | | | 370,000 | | | | 224,775 | | | | 0.14 | |
Venezuela (Rep of) 8.500%, 10/08/2014 | | | | | 170,000 | | | | 172,550 | | | | 0.11 | |
Venezuela (Rep of) 7.750%, 10/13/2019 | | | | | 340,000 | | | | 294,100 | | | | 0.18 | |
Venezuela (Rep of) 6.000%, 12/09/2020 | | | | | 100,000 | | | | 75,500 | | | | 0.05 | |
Venezuela (Rep of) 12.750%, 08/23/2022 | | | | | 700,000 | | | | 756,000 | | | | 0.48 | |
Venezuela (Rep of) 9.000%, 05/07/2023 | | | | | 270,000 | | | | 234,900 | | | | 0.15 | |
Venezuela (Rep of) 8.250%, 10/13/2024 | | | | | 500,000 | | | | 410,000 | | | | 0.26 | |
Venezuela (Rep of) 7.650%, 04/21/2025 | | | | | 430,000 | | | | 333,250 | | | | 0.21 | |
Venezuela (Rep of) 11.750%, 10/21/2026 | | | | | 690,000 | | | | 693,450 | | | | 0.44 | |
Venezuela (Rep of) 9.250%, 09/15/2027 | | | | | 380,000 | | | | 336,300 | | | | 0.21 | |
Venezuela (Rep of) 9.250%, 05/07/2028 | | | | | 430,000 | | | | 365,500 | | | | 0.23 | |
Venezuela (Rep of) 11.950%, 08/05/2031 | | | | | 980,000 | | | | 984,900 | | | | 0.62 | |
Venezuela (Rep of) 9.375%, 01/13/2034 | | | | | 179,000 | | | | 153,045 | | | | 0.10 | |
| | | | | | | | | 5,848,070 | | | | 3.70 | |
Vietnam (Cost $528,110) | | | | | | | | | | | | | | |
Vietnam (Rep of) 6.875%, 01/15/2016 | | | | | 200,000 | | | | 216,500 | | | | 0.14 | |
Vietnam (Rep of) 6.750%, 01/29/2020 | | | | | 300,000 | | | | 324,750 | | | | 0.20 | |
| | | | | | | | | 541,250 | | | | 0.34 | |
Total Debt Securities (Cost $137,454,009) | | | | | | | | | 137,570,617 | | | | 87.03 | |
| | | | |
Short-Term Investments | | | | | | | | | | | | | | |
| | | |
UBS London FX- Insight, Time Deposit 0.120%, 04/30/2012 | | | 15,000,000 | | | | 15,000,000 | | | | 9.49 | |
UBS London FX- Insight, Time Deposit 0.080%, 05/02/2012 | | | | | 15,000,000 | | | | 15,000,000 | | | | 9.49 | |
| | | | |
Total Short-Term Investments (Cost $30,000,000) | | | | | | | | | 30,000,000 | | | | 18.98 | |
| | | | |
Fully Funded Total Return Swaps | | | | | | | | | | | | | | |
| | | | |
India (Cost $939,404) | | | | | | | | | | | | | | |
India Government Bond, Issued by HSBC 7.490% 04/16/2017 | | INR | | | 1,130,000 | | | | 20,564 | | | | 0.01 | |
India Government Bond, Issued by HSBC 7.830% 04/11/2018 | | INR | | | 11,700,000 | | | | 213,795 | | | | 0.14 | |
India Government Bond, Issued by HSBC 9.150% 11/14/2024 | | INR | | | 14,000,000 | | | | 274,023 | | | | 0.17 | |
Rural Electrification Corp. Ltd., Issued by HSBC 9.350% 10/19/2016 | | INR | | | 18,000,000 | | | | 339,521 | | | | 0.22 | |
| | | | | | | | | 847,903 | | | | 0.54 | |
Total Fully Funded Total Return Swaps (Cost $939,404) | | | | | | | | | 847,903 | | | | 0.54 | |
| | | | |
Total Investments (Total Cost $168,393,413) | | | | | | | | | 168,418,520 | | | | 106.55 | |
| | | |
Liabilities Less Other Assets (See Statements of Assets and Liabilities
for further detail) | | | | | | | (10,353,740 | ) | | | (6.55 | ) |
| | | | |
Net Assets | | | | | | | | $ | 158,064,780 | | | | 100.00 | |
See accompanying notes to the financial statements.
60
ASHMORE EMERGING MARKETS TOTAL RETURN FUND
SCHEDULE OF INVESTMENTS (CONTINUED)
As of April 30, 2012 (Unaudited)
| (1) | Par values are stated in United States Dollars unless otherwise noted below. |
| (2) | All or a portion of this security is designated as 144A. |
| (3) | Issuer has defaulted on terms of debt obligation. |
| (6) | Zero coupon bond reflects effective yield on the date of purchase. |
Percentages shown are based on net assets.
At April 30, 2012, the Ashmore Emerging Markets Total Return Fund had open futures contracts as follows:
| | | | | | | | | | | | | | |
| Futures Contracts | | Number
Contracts | | | Notional
Value | | | Settlement
Month | | Unrealized
Appreciation/
(Depreciation) | |
Short | | | | | | | | | | | | | | |
Ten Year U.S. Treaury Note | | | (83 | ) | | | 10,979,344 | | | June 2012 | | $ | (218,855 | ) |
U.S. Treasury Bonds | | | (27 | ) | | | 4,260,938 | | | June 2012 | | | (159,960 | ) |
| | | | | | | | | | | | | | |
Total | | | | | | | | | | | | $ | (378,815 | ) |
| | | | | | | | | | | | | | |
At April 30, 2012, the Ashmore Emerging Markets Total Return Fund had outstanding forward foreign currency exchange contracts as follows:
| | | | | | | | | | | | | | | | | | |
Settlement
Date | | Counterparty | | Currency Buy | | Currency
Buy Amount
(Local
Currency) | | | Currency Sell | | Currency
Sell Amount
(Local
Currency) | | | Unrealized
Gain/(Loss) | |
05/03/2012 | | Barclays Wholesale GTS | | Brazilian Real | | | 940,252 | | | United States Dollar | | | 500,667 | | | | $(7,731) | |
05/03/2012 | | HSBC | | Brazilian Real | | | 940,252 | | | United States Dollar | | | 499,868 | | | | (6,933) | |
05/03/2012 | | Barclays Wholesale GTS | | United States Dollar | | | 790,000 | | | Brazilian Real | | | 1,494,419 | | | | 6,538 | |
05/03/2012 | | Barclays Wholesale GTS | | United States Dollar | | | 210,000 | | | Brazilian Real | | | 386,085 | | | | 7,592 | |
05/04/2012 | | Banco Santander New York | | United States Dollar | | | 1,188,586 | | | Mexican Peso | | | 15,474,799 | | | | 1,192 | |
05/10/2012 | | Bank of America Los Angeles | | Russian Rouble | | | 1,700,000 | | | United States Dollar | | | 53,073 | | | | 4,687 | |
05/14/2012 | | Chase Manhattan Bank London | | Indian Rupee | | | 27,487,200 | | | United States Dollar | | | 520,000 | | | | (256) | |
05/14/2012 | | Standard Chartered London | | Indian Rupee | | | 92,701,954 | | | United States Dollar | | | 1,798,990 | | | | (46,127) | |
05/14/2012 | | Barclays Wholesale GTS | | Russian Rouble | | | 37,495,120 | | | United States Dollar | | | 1,240,000 | | | | 33,095 | |
05/14/2012 | | Bank of America Los Angeles | | Taiwan Dollar | | | 45,463,209 | | | United States Dollar | | | 1,543,847 | | | | 12,759 | |
05/14/2012 | | Chase Manhattan Bank London | | Taiwan Dollar | | | 9,907,600 | | | United States Dollar | | | 340,000 | | | | (776) | |
05/14/2012 | | Barclays Wholesale GTS | | United States Dollar | | | 170,000 | | | Indian Rupee | | | 8,814,500 | | | | 3,330 | |
05/14/2012 | | Deutsche Bank London | | United States Dollar | | | 240,000 | | | Russian Rouble | | | 7,014,849 | | | | 1,821 | |
05/14/2012 | | HSBC | | United States Dollar | | | 220,000 | | | Russian Rouble | | | 6,573,600 | | | | (3,198) | |
05/14/2012 | | Union Bank of Switzerland - London | | United States Dollar | | | 1,160,000 | | | Russian Rouble | | | 34,253,524 | | | | (3,031) | |
05/14/2012 | | Union Bank of Switzerland - London | | United States Dollar | | | 280,000 | | | Russian Rouble | | | 8,281,000 | | | | (1,170) | |
05/14/2012 | | Chase Manhattan Bank London | | United States Dollar | | | 110,000 | | | Taiwan Dollar | | | 3,245,000 | | | | (1,105) | |
05/18/2012 | | Bank of America Los Angeles | | Chilean Peso | | | 209,392,799 | | | United States Dollar | | | 428,425 | | | | 3,705 | |
05/18/2012 | | Morgan Stanley & Co International | | Chilean Peso | | | 145,787,799 | | | United States Dollar | | | 299,175 | | | | 1,692 | |
05/18/2012 | | Barclays Wholesale GTS | | Mexican Peso | | | 48,366,315 | | | United States Dollar | | | 3,749,327 | | | | (43,253) | |
05/18/2012 | | Deutsche Bank London | | United States Dollar | | | 310,000 | | | Colombian Peso | | | 556,735,200 | | | | (5,702) | |
05/18/2012 | | Morgan Stanley & Co International | | United States Dollar | | | 160,000 | | | Colombian Peso | | | 282,960,000 | | | | (455) | |
05/18/2012 | | Deutsche Bank London | | United States Dollar | | | 560,000 | | | Mexican Peso | | | 7,371,196 | | | | (4,819) | |
05/18/2012 | | Deutsche Bank London | | United States Dollar | | | 567,234 | | | Mexican Peso | | | 7,380,000 | | | | 1,741 | |
05/18/2012 | | Union Bank of Switzerland - London | | United States Dollar | | | 601,886 | | | Mexican Peso | | | 7,830,000 | | | | 1,912 | |
05/21/2012 | | Morgan Stanley & Co International | | British Pound | | | 84,194 | | | United States Dollar | | | 135,196 | | | | 1,422 | |
05/21/2012 | | Barclays Wholesale GTS | | Euro | | | 89,654 | | | United States Dollar | | | 118,470 | | | | 216 | |
05/21/2012 | | Barclays Wholesale GTS | | Euro | | | 375,930 | | | United States Dollar | | | 492,101 | | | | 5,564 | |
05/21/2012 | | Bank of America Los Angeles | | Malaysian Ringgit | | | 242,280 | | | United States Dollar | | | 80,000 | | | | (68) | |
05/21/2012 | | Deutsche Bank London | | Thai Baht | | | 5,546,700 | | | United States Dollar | | | 180,000 | | | | 176 | |
05/21/2012 | | Union Bank of Switzerland - London | | Thai Baht | | | 13,423,065 | | | United States Dollar | | | 433,002 | | | | 3,025 | |
05/21/2012 | | HSBC | | United States Dollar | | | 677,815 | | | British Pound | | | 424,855 | | | | (11,578) | |
See accompanying notes to the financial statements.
61
ASHMORE EMERGING MARKETS TOTAL RETURN FUND
SCHEDULE OF INVESTMENTS (CONTINUED)
As of April 30, 2012 (Unaudited)
| | | | | | | | | | | | | | | | |
| | | | | | | Currency | | | | Currency | | | | |
| | | | | | | Buy Amount | | | | Sell Amount | | | | |
| Settlement | | | | Currency | | (Local | | Currency | | (Local | | | Unrealized | |
| Date | | Counterparty | | Buy | | Currency) | | Sell | | Currency) | | | Gain/(Loss) | |
05/21/2012 | | Barclays Wholesale GTS | | United States Dollar | | 2,541,656 | | Euro | | | 1,927,688 | | | | $(10,266 | ) |
05/21/2012 | | Union Bank of Switzerland - London | | United States Dollar | | 2,541,868 | | Euro | | | 1,927,688 | | | | (10,054 | ) |
05/21/2012 | | Chase Manhattan Bank London | | United States Dollar | | 75,532 | | Malaysian Ringgit | | | 232,540 | | | | (1,187 | ) |
05/21/2012 | | Chase Manhattan Bank London | | United States Dollar | | 190,000 | | Thai Baht | | | 5,897,600 | | | | (1,574 | ) |
05/21/2012 | | HSBC | | United States Dollar | | 144,878 | | Thai Baht | | | 4,472,381 | | | | (400 | ) |
05/24/2012 | | Citibank London | | Malaysian Ringgit | | 3,441,069 | | United States Dollar | | | 1,127,739 | | | | 7,279 | |
05/25/2012 | | Barclays Wholesale GTS | | Philippine Peso | | 44,921,209 | | United States Dollar | | | 1,051,896 | | | | 9,796 | |
05/25/2012 | | Barclays Wholesale GTS | | United States Dollar | | 60,000 | | Philippine Peso | | | 2,532,600 | | | | 143 | |
05/29/2012 | | Bank of America Los Angeles | | Russian Rouble | | 723,744 | | United States Dollar | | | 23,987 | | | | 525 | |
05/30/2012 | | Bank of America Los Angeles | | Russian Rouble | | 296,650 | | United States Dollar | | | 10,000 | | | | 46 | |
05/30/2012 | | Chase Manhattan Bank London | | Russian Rouble | | 97,344,351 | | United States Dollar | | | 3,299,361 | | | | (2,933 | ) |
05/30/2012 | | HSBC | | Russian Rouble | | 16,238,750 | | United States Dollar | | | 550,000 | | | | (98 | ) |
05/30/2012 | | CSFB Global Foreign Exchange London | | United States Dollar | | 781,209 | | Russian Rouble | | | 23,018,321 | | | | 1,726 | |
05/31/2012 | | Bank of America Los Angeles | | Czech Koruna | | 47,810,376 | | United States Dollar | | | 2,522,542 | | | | 14,239 | |
05/31/2012 | | Chase Manhattan Bank London | | Hungarian Forint | | 315,789,199 | | United States Dollar | | | 1,435,993 | | | | 14,366 | |
05/31/2012 | | Citibank London | | Israeili Shekel | | 5,767,666 | | United States Dollar | | | 1,535,874 | | | | (6,321 | ) |
05/31/2012 | | Barclays Wholesale GTS | | Polish Zloty | | 821,571 | | United States Dollar | | | 263,764 | | | | (4,125 | ) |
05/31/2012 | | Citibank London | | Singapore Dollar | | 4,418,541 | | United States Dollar | | | 3,495,626 | | | | 75,022 | |
05/31/2012 | | Bank of America Los Angeles | | United States Dollar | | 340,000 | | Czech Koruna | | | 6,401,258 | | | | 354 | |
05/31/2012 | | Citibank London | | United States Dollar | | 120,000 | | Israeili Shekel | | | 451,770 | | | | 193 | |
05/31/2012 | | Deutsche Bank London | | United States Dollar | | 520,000 | | Polish Zloty | | | 1,645,790 | | | | (116 | ) |
06/04/2012 | | Deutsche Bank London | | Brazilian Real | | 761,512 | | United States Dollar | | | 436,022 | | | | (39,572 | ) |
06/12/2012 | | Barclays Wholesale GTS | | Indonesian Rupiah | | 1,012,550,000 | | United States Dollar | | | 110,000 | | | | (321 | ) |
06/21/2012 | | Union Bank of Switzerland - London | | Thai Baht | | 21,169,583 | | United States Dollar | | | 689,338 | | | | (2,793 | ) |
06/22/2012 | | Banco Santander New York | | Mexican Peso | | 33,976,511 | | United States Dollar | | | 2,556,066 | | | | 39,158 | |
06/22/2012 | | Barclays Wholesale GTS | | Mexican Peso | | 17,633,060 | | United States Dollar | | | 1,340,000 | | | | 6,864 | |
06/29/2012 | | HSBC | | Euro | | 83,986 | | United States Dollar | | | 110,000 | | | | 1,205 | |
06/29/2012 | | Bank of America Los Angeles | | Hungarian Forint | | 181,707,750 | | United States Dollar | | | 830,000 | | | | 1,319 | |
06/29/2012 | | Union Bank of Switzerland - London | | Hungarian Forint | | 84,294,189 | | United States Dollar | | | 367,936 | | | | 17,713 | |
06/29/2012 | | Chase Manhattan Bank London | | Polish Zloty | | 12,150,033 | | United States Dollar | | | 3,810,400 | | | | 16,713 | |
06/29/2012 | | Citibank London | | Romanian Leu | | 5,382,796 | | United States Dollar | | | 1,616,213 | | | | (10,486 | ) |
06/29/2012 | | Bank of America Los Angeles | | Singapore Dollar | | 2,313,484 | | United States Dollar | | | 1,852,862 | | | | 16,808 | |
06/29/2012 | | Barclays Wholesale GTS | | South African Rand | | 25,892,225 | | United States Dollar | | | 3,326,254 | | | | (24,748 | ) |
06/29/2012 | | Deutsche Bank London | | United States Dollar | | 1,786,092 | | Euro | | | 1,338,849 | | | | 13,348 | |
06/29/2012 | | HSBC | | United States Dollar | | 170,000 | | Romanian Leu | | | 569,647 | | | | 70 | |
06/29/2012 | | Bank of America Los Angeles | | United States Dollar | | 190,000 | | Singapore Dollar | | | 234,946 | | | | 125 | |
06/29/2012 | | Barclays Wholesale GTS | | United States Dollar | | 230,000 | | South African Rand | | | 1,796,829 | | | | 887 | |
06/29/2012 | | Barclays Wholesale GTS | | United States Dollar | | 510,000 | | South African Rand | | | 3,926,133 | | | | 9,381 | |
06/29/2012 | | Citibank London | | United States Dollar | | 177,718 | | South African Rand | | | 1,405,357 | | | | (1,479 | ) |
06/29/2012 | | Deutsche Bank London | | United States Dollar | | 167,872 | | South African Rand | | | 1,360,000 | | | | (5,541 | ) |
06/29/2012 | | Deutsche Bank London | | United States Dollar | | 180,000 | | South African Rand | | | 1,398,979 | | | | 1,617 | |
07/03/2012 | | Citibank London | | United States Dollar | | 3,352,718 | | Brazilian Real | | | 6,248,461 | | | | 115,073 | |
07/03/2012 | | Deutsche Bank London | | United States Dollar | | 1,918,786 | | Brazilian Real | | | 3,565,105 | | | | 71,524 | |
07/03/2012 | | HSBC | | United States Dollar | | 1,922,615 | | Brazilian Real | | | 3,565,105 | | | | 75,353 | |
07/18/2012 | | Standard Chartered London | | Malaysian Ringgit | | 285,420 | | United States Dollar | | | 92,693 | | | | 1,106 | |
07/18/2012 | | Bank of America Los Angeles | | Thai Baht | | 35,460,450 | | United States Dollar | | | 1,139,841 | | | | 8,456 | |
07/18/2012 | | Chase Manhattan Bank London | | United States Dollar | | 90,000 | | Malaysian Ringgit | | | 279,045 | | | | (1,704 | ) |
07/19/2012 | | Union Bank of Switzerland - London | | Korean Won | | 113,525,000 | | United States Dollar | | | 100,000 | | | | 399 | |
07/19/2012 | | Union Bank of Switzerland - London | | Korean Won | | 2,404,624,789 | | United States Dollar | | | 2,104,520 | | | | 22,067 | |
07/25/2012 | | HSBC | | United States Dollar | | 2,287,367 | | Turkish Lira | | | 4,176,161 | | | | (46,734 | ) |
07/25/2012 | | HSBC | | United States Dollar | | 650,000 | | Turkish Lira | | | 1,163,305 | | | | (184 | ) |
07/26/2012 | | Bank of America Los Angeles | | United States Dollar | | 1,120,000 | | Russian Rouble | | | 33,237,456 | | | | 3,364 | |
08/02/2012 | | Barclays Wholesale GTS | | United States Dollar | | 492,536 | | Brazilian Real | | | 940,252 | | | | 8,012 | |
08/02/2012 | | HSBC | | United States Dollar | | 491,712 | | Brazilian Real | | | 940,252 | | | | 7,188 | |
08/03/2012 | | Barclays Wholesale GTS | | Chinese Yuan Renminbi | | 14,903,400 | | United States Dollar | | | 2,360,000 | | | | 1,795 | |
08/13/2012 | | Citibank London | | United States Dollar | | 594,254 | | Colombian Peso | | | 1,072,480,000 | | | | (10,446 | ) |
08/13/2012 | | Citibank London | | Colombian Peso | | 467,880,000 | | United States Dollar | | | 261,824 | | | | 1,982 | |
08/21/2012 | | Standard Chartered London | | Thai Baht | | 17,484,492 | | United States Dollar | | | 564,380 | | | | 855 | |
08/24/2012 | | Bank of America Los Angeles | | Colombian Peso | | 54,148,132 | | United States Dollar | | | 30,031 | | | | 454 | |
See accompanying notes to the financial statements.
62
ASHMORE EMERGING MARKETS TOTAL RETURN FUND
SCHEDULE OF INVESTMENTS (CONTINUED)
As of April 30, 2012 (Unaudited)
| | | | | | | | | | | | | | |
| | | | | | | Currency | | | | Currency | | | |
| | | | | | | Buy Amount | | | | Sell Amount | | | |
| Settlement | | | | Currency | | (Local | | Currency | | (Local | | Unrealized | |
| Date | | Counterparty | | Buy | | Currency) | | Sell | | Currency) | | Gain/(Loss) | |
08/24/2012 | | Chase Manhattan Bank London | | Colombian Peso | | 644,000,000 | | United States Dollar | | 359,626 | | $ | 2,936 | |
08/24/2012 | | Bank of America Los Angeles | | United States Dollar | | 595,905 | | Colombian Peso | | 1,072,480,000 | | | (7,884 | ) |
08/28/2012 | | Union Bank of Switzerland - London | | Colombian Peso | | 1,168,050,000 | | United States Dollar | | 650,000 | | | 7,233 | |
08/28/2012 | | HSBC | | Malaysian Ringgit | | 435,030 | | United States Dollar | | 142,236 | | | 397 | |
04/15/2013 | | HSBC | | Chinese Offshore Yuan | | 3,508,450 | | United States Dollar | | 550,000 | | | 35 | |
04/15/2013 | | HSBC | | Chinese Offshore Yuan | | 3,513,675 | | United States Dollar | | 550,000 | | | 853 | |
04/13/2015 | | HSBC | | United States Dollar | | 550,000 | | Chinese Offshore Yuan | | 3,565,925 | | | (8,813 | ) |
04/13/2015 | | HSBC | | United States Dollar | | 550,000 | | Chinese Offshore Yuan | | 3,554,650 | | | (7,046 | ) |
05/04/2015 | | Standard Chartered London | | United States Dollar | | 1,100,000 | | Chinese Offshore Yuan | | 7,158,800 | | | (21,847 | ) |
| | | | | | | | | | | | | | |
Total | | | | | | | | | | | | $ | 305,572 | |
| | | | | | | | | | | | | | |
At April 30, 2012, the Ashmore Emerging Markets Total Return Fund had the following interest rate swap contracts outstanding:
| | | | | | | | | | | | | | | | | | |
Pay Rate Index/
Pay Rate | | Receive Rate/
Receive Rate Index | | | | | Notional
Amount | | | Expiration
Date | | | Unrealized Gains/(Losses) | | Counterparty |
Brazil CETIP Interbank | | | | | | | | | | | | | | | | | | |
Deposit Rate | | 9.725% | | | BRL | | | | 8,570,326 | | | | 01/02/2014 | | | $80,308 | | HSBC |
Brazil CETIP Interbank | | | | | | | | | | | | | | | | | | |
Deposit Rate | | 9.730% | | | BRL | | | | 2,155,307 | | | | 01/02/2014 | | | 20,295 | | HSBC |
Brazil CETIP Interbank | | | | | | | | | | | | | | | | | | |
Deposit Rate | | 11.180% | | | BRL | | | | 1,089,611 | | | | 01/02/2014 | | | 25,877 | | Morgan Stanley |
1.730% | | Czech Interbank Offered Rates 6 Month | | | CZK | | | | 14,900,000 | | | | 03/13/2017 | | | 1,716 | | Morgan Stanley |
1.755% | | Czech Interbank Offered Rates 6 Month | | | CZK | | | | 14,900,000 | | | | 03/15/2017 | | | 772 | | Morgan Stanley |
Klibor Interbank | | | | | | | | | | | | | | | | | | |
Deposit Rate | | 3.190% | | | MYR | | | | 2,384,375 | | | | 03/01/2022 | | | (3,643) | | Morgan Stanley |
| | | | | | | | | | | | | | | | | | |
| | | | | | | | | | | | | | | | $125,325 | | |
| | | | | | | | | | | | | | | | | | |
See accompanying notes to the financial statements.
63
ASHMORE EMERGING MARKETS TOTAL RETURN FUND
SCHEDULE OF INVESTMENTS (CONTINUED)
As of April 30, 2012 (Unaudited)
The inputs or methodologies used for valuing securities are not necessarily an indication of the risks associated with investing in those securities and other financial instruments, if any. See note 4 in the Notes to Financial Statements for more information regarding pricing inputs and valuation techniques. The following is a summary of the inputs used in valuing the Ashmore Emerging Markets Total Return Fund’s investments and other financial instruments, which are carried at fair value, as of April 30, 2012:
| | | | | | | | | | | | | | | | |
| | | Level 1 | | | Level 2 | | | Level 3 | | | Total | |
Investments | | | | | | | | | | | | | | | | |
Assets: | | | | | | | | | | | | | | | | |
Corporate Bonds | | $ | — | | | $ | 58,589,652 | | | $ | — | | | $ | 58,589,652 | |
Corporate Convertible Bonds | | | — | | | | 69,075 | | | | — | | | | 69,075 | |
Government Agencies | | | — | | | | 2,133,955 | | | | — | | | | 2,133,955 | |
Government Bonds | | | — | | | | 69,503,795 | | | | — | | | | 69,503,795 | |
Financial Certificates | | | — | | | | 2,592,705 | | | | — | | | | 2,592,705 | |
Index Linked Corporate Bonds | | | — | | | | 488,321 | | | | — | | | | 488,321 | |
Index Linked Government Bonds | | | — | | | | 4,193,114 | | | | — | | | | 4,193,114 | |
Fully Funded Total Return Swaps | | | — | | | | 847,903 | | | | — | | | | 847,903 | |
Short-Term Investments | | | — | | | | 30,000,000 | | | | — | | | | 30,000,000 | |
Total Investments | | $ | — | | | $ | 168,418,520 | | | $ | — | | | $ | 168,418,520 | |
| | | | |
Other Financial Instruments | | | | | | | | | | | | | | | | |
Assets: | | | | | | | | | | | | | | | | |
Forward Foreign Currency Exchange Contracts | | $ | — | | | $ | 668,445 | | | $ | — | | | $ | 668,445 | |
Interest Rate Swap Contracts | | | — | | | | 128,968 | | | | — | | | | 128,968 | |
Liabilities: | | | | | | | | | | | | | | | | |
Forward Foreign Currency Exchange Contracts | | | — | | | | (362,873 | ) | | | — | | | | (362,873 | ) |
Futures Contracts | | | (378,815 | ) | | | — | | | | — | | | | (378,815 | ) |
Interest Rate Swap Contracts | | | — | | | | (3,643 | ) | | | — | | | | (3,643 | ) |
Total Other Financial Instruments | | $ | (378,815 | ) | | $ | 430,897 | | | $ | — | | | $ | 52,082 | |
The Fund discloses significant transfers between levels based on valuations at the end of each reporting period. At April 30, 2012 there were no significant transfers between Level 1 and Level 2 based on levels assigned to the securities on October 31, 2011. U.S. GAAP provides additional guidance for estimating fair value when the volume and level of activity for the asset or liability have significantly decreased as well as guidance on identifying circumstances that indicate when a transaction is not orderly.
See accompanying notes to the financial statements.
64
ASHMORE EMERGING MARKETS TOTAL RETURN FUND
SCHEDULE OF INVESTMENTS (CONTINUED)
As of April 30, 2012 (Unaudited)
The following is a summary of the fair values of the Fund’s derivative instruments categorized by risk exposure*:
Fair Values of Financial Derivative Instruments on the Statements of Assets and Liabilities as of April 30, 2012:
| | | | | | | | |
| | | Derivatives Not Accounted for as | |
| | | Hedging Instruments | |
| | | Foreign | | | Fixed Income/ | |
| | | Exchange | | | Interest Rate | |
Assets: | | | | | | | | |
Unrealized Appreciation on Interest Rate Swap Contracts | | $ | — | | | $ | 128,968 | |
Unrealized Appreciation on Forward Foreign Currency Exchange Contracts | | | 668,445 | | | | — | |
| | | | |
| | $ | 668,445 | | | $ | 128,968 | |
| | | | |
| | |
Liabilities: | | | | | | | | |
Unrealized Depreciation on Interest Rate Swap Contracts | | $ | — | | | $ | (3,643 | ) |
Unrealized Depreciation on Forward Foreign Currency Exchange Contracts | | | (362,873 | ) | | | — | |
Variation Margin Payable(1) | | | — | | | | (14,594 | ) |
| | | | |
| | $ | (362,873 | ) | | $ | (18,237 | ) |
| | | | |
| (1) | Only current day’s variation margin is reported within the Statements of Assets and Liabilities. The variation margin is included in the open futures cumulative appreciation/(depreciation) of $(378,815). |
The Effect of Financial Derivative Instruments on the Statements of Operations for the Period Ended April 30, 2012:
| | | | | | | | |
| | | Derivatives Not Accounted for as | |
| | | Hedging Instruments | |
| | | Foreign | | | Fixed Income/ | |
| | | Exchange | | | Interest Rate | |
Realized Gain/(Loss) on Derivatives Recognized resulting from Operations: | | | | | | | | |
Net Realized Gain on Forward Foreign Currency Exchange Contracts | | $ | 808,611 | | | $ | — | |
Net Realized Loss on Futures Contracts | | | | | | | (218 | ) |
Net Realized Gain on Interest Rate Swap Contracts | | | — | | | | 177,616 | |
| | | | |
| | $ | 808,611 | | | $ | 177,398 | |
| | | | |
| | |
Net Change in Unrealized Appreciation/(Depreciation) on Derivatives Recognized resulting from Operations: | | | | | | | | |
Net Change in Unrealized Appreciation on Forward Foreign | | | | | | | | |
Currency Exchange Contracts | | $ | 530,683 | | | $ | — | |
Net Change in Unrealized Depreciation on Futures Contracts | | | — | | | | (378,815 | ) |
Net Change in Unrealized Appreciation on Interest Rate Swap Contracts | | | — | | | | 4,769 | |
| | | | |
| | $ | 530,683 | | | $ | (374,046 | ) |
| | | | |
* See note 9 in the Notes to Financial Statements for additional information.
See accompanying notes to the financial statements.
65
ASHMORE EMERGING MARKETS EQUITY FUND
SCHEDULE OF INVESTMENTS
As of April 30, 2012 (Unaudited)
| | | | | | | | | | | | | | |
| | | | | | | | | | | % of Net | |
| | | Currency(1) | | Shares | | | Value | | | Assets | |
Common Stock | | | | | | | | | | | | | | |
| | | | |
Brazil (Cost $1,302,058) | | | | | | | | | | | | | | |
Banco do Brasil S.A. | | BRL | | | 12,000 | | | $ | 148,446 | | | | 1.63 | |
Banco Santander Brasil S.A. | | BRL | | | 3,600 | | | | 29,349 | | | | 0.32 | |
BRF - Brasil Foods S.A. | | BRL | | | 3,200 | | | | 58,505 | | | | 0.64 | |
Cia Hering | | BRL | | | 1,200 | | | | 29,777 | | | | 0.33 | |
Cosan Ltd., Class A | | | | | 3,100 | | | | 42,904 | | | | 0.47 | |
Duratex S.A. | | BRL | | | 5,800 | | | | 34,079 | | | | 0.37 | |
EcoRodovias Infraestrutura e Logistica S.A. | | BRL | | | 5,900 | | | | 49,215 | | | | 0.54 | |
Estacio Participacoes S.A. | | BRL | | | 2,900 | | | | 36,209 | | | | 0.40 | |
Even Construtora e Incorporadora S.A. | | BRL | | | 9,100 | | | | 34,039 | | | | 0.37 | |
Hypermarcas S.A. | | BRL | | | 2,608 | | | | 16,733 | | | | 0.18 | |
Iochpe-Maxion S.A. | | BRL | | | 1,700 | | | | 29,494 | | | | 0.32 | |
Lojas Renner S.A. | | BRL | | | 1,800 | | | | 57,858 | | | | 0.63 | |
OGX Petroleo e Gas Participacoes S.A. | | BRL | | | 5,500 | | | | 38,174 | | | | 0.42 | |
PDG Realty S.A. Empreendimentos e Participacoes | | BRL | | | 13,900 | | | | 32,815 | | | | 0.36 | |
Petroleo Brasileiro S.A. ADR | | | | | 10,756 | | | | 253,196 | | | | 2.77 | |
Vale S.A. | | BRL | | | 4,600 | | | | 102,804 | | | | 1.13 | |
Vale S.A. ADR | | | | | 8,000 | | | | 177,600 | | | | 1.94 | |
| | | | | | | | | 1,171,197 | | | | 12.82 | |
Chile (Cost $42,851) | | | | | | | | | | | | | | |
Cia Cervecerias Unidas S.A. ADR | | | | | 144 | | | | 10,313 | | | | 0.11 | |
Cia Sud Americana de Vapores S.A. | | CLP | | | 95,000 | | | | 11,167 | | | | 0.12 | |
Empresas CMPC S.A. | | CLP | | | 3,954 | | | | 16,258 | | | | 0.18 | |
Forus S.A. | | CLP | | | 1,085 | | | | 5,032 | | | | 0.06 | |
| | | | | | | | | 42,770 | | | | 0.47 | |
China (Cost $1,677,317) | | | | | | | | | | | | | | |
AAC Technologies Holdings, Inc. | | HKD | | | 30,000 | | | | 88,546 | | | | 0.97 | |
Baidu, Inc. ADR | | | | | 700 | | | | 92,890 | | | | 1.02 | |
Belle International Holdings Ltd. | | HKD | | | 55,000 | | | | 107,893 | | | | 1.18 | |
China Merchants Bank Co. Ltd., Class H | | HKD | | | 120,000 | | | | 260,458 | | | | 2.85 | |
China Modern Dairy Holdings Ltd. | | HKD | | | 346,000 | | | | 98,556 | | | | 1.08 | |
China Pacific Insurance Group Co. Ltd., Class H | | HKD | | | 19,200 | | | | 62,733 | | | | 0.69 | |
China Shenhua Energy Co. Ltd., Class H | | HKD | | | 28,000 | | | | 124,326 | | | | 1.36 | |
CNOOC Ltd. | | HKD | | | 123,000 | | | | 262,214 | | | | 2.87 | |
Industrial & Commercial Bank of China, Class H | | HKD | | | 363,000 | | | | 242,354 | | | | 2.65 | |
Mindray Medical International Ltd. ADR | | | | | 3,000 | | | | 98,280 | | | | 1.07 | |
New Oriental Education & Technology Group ADR | | | | | 3,000 | | | | 80,190 | | | | 0.88 | |
Ping An Insurance Group Co., Class H | | HKD | | | 24,500 | | | | 204,939 | | | | 2.24 | |
| | | | | | | | | 1,723,379 | | | | 18.86 | |
Colombia (Cost $29,127) | | | | | | | | | | | | | | |
Pacific Rubiales Energy Corp. | | CAD | | | 971 | | | | 27,856 | | | | 0.31 | |
| | | | | | | | | 27,856 | | | | 0.31 | |
Hong Kong (Cost $283,293) | | | | | | | | | | | | | | |
AIA Group Ltd. | | HKD | | | 27,400 | | | | 97,471 | | | | 1.07 | |
ASM Pacific Technology Ltd. | | HKD | | | 7,300 | | | | 98,887 | | | | 1.08 | |
Samsonite International S.A. | | HKD | | | 54,000 | | | | 104,678 | | | | 1.15 | |
| | | | | | | | | 301,036 | | | | 3.30 | |
India (Cost $277,038) | | | | | | | | | | | | | | |
HDFC Bank Ltd. ADR | | | | | 1,600 | | | | 54,928 | | | | 0.60 | |
ICICI Bank Ltd. ADR | | | | | 2,300 | | | | 77,947 | | | | 0.85 | |
Infosys Ltd. ADR | | | | | 1,100 | | | | 52,085 | | | | 0.57 | |
Sterlite Industries India Ltd. ADR | | | | | 6,000 | | | | 49,140 | | | | 0.54 | |
| | | | | | | | | 234,100 | | | | 2.56 | |
See accompanying notes to the financial statements.
66
ASHMORE EMERGING MARKETS EQUITY FUND
SCHEDULE OF INVESTMENTS (CONTINUED)
As of April 30, 2012 (Unaudited)
| | | | | | | | | | | | | | |
| | | Currency(1) | | Shares | | | Value | | | % of Net
Assets | |
Indonesia (Cost $169,462) | | | | | | | | | | | | | | |
Bank Mandiri Persero Tbk PT | | IDR | | | 47,500 | | | $ | 38,242 | | | | 0.42 | |
Harum Energy Tbk PT | | IDR | | | 15,000 | | | | 11,669 | | | | 0.13 | |
Indomobil Sukses Internasional Tbk PT | | IDR | | | 18,000 | | | | 34,761 | | | | 0.38 | |
Perusahaan Gas Negara Persero Tbk PT | | IDR | | | 128,000 | | | | 46,652 | | | | 0.51 | |
Semen Gresik Persero Tbk PT | | IDR | | | 26,000 | | | | 34,369 | | | | 0.38 | |
Tambang Batubara Bukit Asam Persero Tbk PT | | IDR | | | 2,000 | | | | 4,015 | | | | 0.04 | |
| | | | | | | | | 169,708 | | | | 1.86 | |
Malaysia (Cost $123,333) | | | | | | | | | | | | | | |
DRB-Hicom Bhd | | MYR | | | 91,600 | | | | 77,179 | | | | 0.85 | |
Sime Darby Bhd | | MYR | | | 10,900 | | | | 35,079 | | | | 0.38 | |
| | | | | | | | | 112,258 | | | | 1.23 | |
Mexico (Cost $404,573) | | | | | | | | | | | | | | |
Alfa S.A.B. de C.V., Class A | | MXN | | | 2,877 | | | | 41,066 | | | | 0.45 | |
Alpek S.A.B. de C.V. | | MXN | | | 6,493 | | | | 14,364 | | | | 0.16 | |
America Movil S.A.B. de C.V. ADR, Series L | | | | | 1,800 | | | | 47,970 | | | | 0.52 | |
Desarrolladora Homex S.A.B. de C.V. ADR | | | | | 4,000 | | | | 67,240 | | | | 0.74 | |
Fomento Economico Mexicano S.A.B. de C.V. ADR | | | | | 700 | | | | 56,882 | | | | 0.62 | |
Grupo Financiero Banorte S.A.B. de C.V., Class O | | MXN | | | 14,000 | | | | 67,821 | | | | 0.74 | |
Grupo Mexico S.A.B. de C.V., Series B | | MXN | | | 20,046 | | | | 61,842 | | | | 0.68 | |
Ternium S.A. ADR | | | | | 2,893 | | | | 68,622 | | | | 0.75 | |
| | | | | | | | | 425,807 | | | | 4.66 | |
Peru (Cost $62,756) | | | | | | | | | | | | | | |
Cia de Minas Buenaventura S.A. ADR | | | | | 1,515 | | | | 62,524 | | | | 0.68 | |
| | | | | | | | | 62,524 | | | | 0.68 | |
Philippines (Cost $37,870) | | | | | | | | | | | | | | |
Metropolitan Bank & Trust | | PHP | | | 7,500 | | | | 16,233 | | | | 0.18 | |
Petron Corp. | | PHP | | | 101,100 | | | | 25,569 | | | | 0.28 | |
| | | | | | | | | 41,802 | | | | 0.46 | |
Russia (Cost $26,659) | | | | | | | | | | | | | | |
Evraz PLC | | GBP | | | 4,111 | | | | 24,645 | | | | 0.27 | |
| | | | | | | | | 24,645 | | | | 0.27 | |
Russian Federation (Cost $568,808) | | | | | | | | | | | | | | |
Gazprom OAO ADR | | | | | 20,273 | | | | 233,950 | | | | 2.56 | |
Lukoil OAO ADR | | | | | 2,788 | | | | 171,044 | | | | 1.87 | |
Sberbank of Russia ADR | | | | | 9,048 | | | | 117,172 | | | | 1.29 | |
VimpelCom Ltd. ADR | | | | | 3,064 | | | | 31,222 | | | | 0.34 | |
| | | | | | | | | 553,388 | | | | 6.06 | |
South Africa (Cost $222,798) | | | | | | | | | | | | | | |
Anglo American PLC | | GBP | | | 658 | | | | 25,287 | | | | 0.28 | |
Harmony Gold Mining Co. Ltd. ADR | | | | | 2,300 | | | | 22,310 | | | | 0.25 | |
Imperial Holdings Ltd. | | ZAR | | | 2,028 | | | | 44,030 | | | | 0.48 | |
Investec Ltd. | | ZAR | | | 5,631 | | | | 32,320 | | | | 0.35 | |
Murray & Roberts Holdings Ltd. | | ZAR | | | 15,528 | | | | 57,094 | | | | 0.63 | |
Sasol Ltd. | | ZAR | | | 600 | | | | 28,503 | | | | 0.31 | |
Steinhoff International Holdings Ltd. | | ZAR | | | 12,116 | | | | 44,190 | | | | 0.48 | |
| | | | | | | | | 253,734 | | | | 2.78 | |
South Korea (Cost $1,094,695) | | | | | | | | | | | | | | |
Doosan Infracore Co. Ltd. | | KRW | | | 2,720 | | | | 50,904 | | | | 0.56 | |
E-Mart Co. Ltd. | | KRW | | | 307 | | | | 72,938 | | | | 0.80 | |
GS Engineering & Construction Corp. | | KRW | | | 601 | | | | 44,831 | | | | 0.49 | |
Hyundai Heavy Industries Co. Ltd. | | KRW | | | 230 | | | | 57,595 | | | | 0.63 | |
Hyundai Mobis | | KRW | | | 386 | | | | 105,028 | | | | 1.15 | |
Hyundai Motor Co. | | KRW | | | 1,269 | | | | 301,495 | | | | 3.30 | |
Korean Reinsurance Co. | | KRW | | | 3,101 | | | | 37,590 | | | | 0.41 | |
See accompanying notes to the financial statements.
67
ASHMORE EMERGING MARKETS EQUITY FUND
SCHEDULE OF INVESTMENTS (CONTINUED)
As of April 30, 2012 (Unaudited)
| | | | | | | | | | | | | | |
| | | Currency(1) | | Shares | | | Value | | | % of Net
Assets | |
South Korea - (continued) | | | | | | | | | | | | | | |
LG Chem Ltd. | | KRW | | | 263 | | | $ | 66,208 | | | | 0.73 | |
NHN Corp. | | KRW | | | 193 | | | | 43,719 | | | | 0.48 | |
POSCO | | KRW | | | 155 | | | | 51,501 | | | | 0.56 | |
Samsung Engineering Co. Ltd. | | KRW | | | 396 | | | | 75,337 | | | | 0.82 | |
Samsung Heavy Industries Co. Ltd. | | KRW | | | 2,940 | | | | 108,482 | | | | 1.19 | |
Shinhan Financial Group Co. Ltd. | | KRW | | | 1,260 | | | | 44,039 | | | | 0.48 | |
SK Hynix, Inc. | | KRW | | | 3,180 | | | | 78,929 | | | | 0.86 | |
| | | | | | | | | 1,138,596 | | | | 12.46 | |
Taiwan (Cost $964,289) | | | | | | | | | | | | | | |
Catcher Technology Co. Ltd. | | TWD | | | 13,000 | | | | 83,229 | | | | 0.91 | |
Cathay Financial Holding Co. Ltd. | | TWD | | | 21,000 | | | | 22,216 | | | | 0.24 | |
Chinatrust Financial Holding Co. Ltd. | | TWD | | | 108,297 | | | | 69,149 | | | | 0.76 | |
Chroma ATE, Inc. | | TWD | | | 11,000 | | | | 25,082 | | | | 0.27 | |
Delta Electronics, Inc. | | TWD | | | 36,000 | | | | 106,982 | | | | 1.17 | |
Dynapack International Technology Corp. | | TWD | | | 4,000 | | | | 20,542 | | | | 0.23 | |
Formosa Plastics Corp. | | TWD | | | 17,000 | | | | 48,308 | | | | 0.53 | |
Hon Hai Precision Industry Co. Ltd. | | TWD | | | 60,000 | | | | 189,808 | | | | 2.08 | |
HTC Corp. | | TWD | | | 2,000 | | | | 30,334 | | | | 0.33 | |
Kinsus Interconnect Technology Corp. | | TWD | | | 5,000 | | | | 15,714 | | | | 0.17 | |
MediaTek, Inc. | | TWD | | | 6,000 | | | | 51,971 | | | | 0.57 | |
Taiwan Fertilizer Co. Ltd. | | TWD | | | 12,000 | | | | 28,759 | | | | 0.31 | |
Taiwan Semiconductors Manufacturing Co. Ltd. | | TWD | | | 73,000 | | | | 216,937 | | | | 2.37 | |
TPK Holding Co. Ltd. | | TWD | | | 1,824 | | | | 22,481 | | | | 0.25 | |
Tripod Technology Corp. | | TWD | | | 17,000 | | | | 50,054 | | | | 0.55 | |
Wan Hai Lines Ltd. | | TWD | | | 34,000 | | | | 17,228 | | | | 0.19 | |
| | | | | | | | | 998,794 | | | | 10.93 | |
Thailand (Cost $131,887) | | | | | | | | | | | | | | |
Banpu PCL (Registered) | | THB | | | 3,000 | | | | 54,240 | | | | 0.59 | |
Kasikornbank PCL (Registered) | | THB | | | 4,600 | | | | 24,382 | | | | 0.27 | |
PTT Exploration & Production PCL (Registered) | | THB | | | 3,700 | | | | 21,417 | | | | 0.23 | |
Siam Cement PCL (Registered) | | THB | | | 3,200 | | | | 43,496 | | | | 0.48 | |
| | | | | | | | | 143,535 | | | | 1.57 | |
Turkey (Cost $94,774) | | | | | | | | | | | | | | |
Arcelik A/S | | TRY | | | 4,218 | | | | 18,486 | | | | 0.20 | |
Koza Anadolu Metal Madencilik Isletmeleri A/S | | TRY | | | 11,095 | | | | 21,724 | | | | 0.24 | |
Turkiye Garanti Bankasi A/S | | TRY | | | 10,669 | | | | 39,229 | | | | 0.43 | |
Turkiye Vakiflar Bankasi Tao, Class D | | TRY | | | 11,205 | | | | 20,090 | | | | 0.22 | |
| | | | | | | | | 99,529 | | | | 1.09 | |
Total Common Stock (Cost $7,513,588) | | | | | | | | | 7,524,658 | | | | 82.37 | |
| | | | |
Preferred Stock | | | | | | | | | | | | | | |
| | | | |
Brazil (Cost $376,799) | | | | | | | | | | | | | | |
Braskem S.A. ADR | | | | | 4,700 | | | | 69,090 | | | | 0.76 | |
Cia Energetica de Minas Gerais | | BRL | | | 2,375 | | | | 47,073 | | | | 0.51 | |
Itau Unibanco Holding S.A. ADR | | | | | 10,570 | | | | 165,843 | | | | 1.81 | |
Suzano Papel e Celulose S.A. | | BRL | | | 9,600 | | | | 36,262 | | | | 0.40 | |
| | | | | | | | | 318,268 | | | | 3.48 | |
South Korea (Cost $414,798) | | | | | | | | | | | | | | |
Samsung Electronics Co. Ltd. GDR(2) | | | | | 1,556 | | | | 556,931 | | | | 6.10 | |
| | | | | | | | | 556,931 | | | | 6.10 | |
Total Preferred Stock (Cost $791,597) | | | | | | | | | 875,199 | | | | 9.58 | |
See accompanying notes to the financial statements.
68
ASHMORE EMERGING MARKETS EQUITY FUND
SCHEDULE OF INVESTMENTS (CONTINUED)
As of April 30, 2012 (Unaudited)
| | | | | | | | | | | | |
| Currency(1) | | Shares | | | Value | | | % of Net
Assets | |
Equity-Linked Securities | | | | | | | | | | | | |
| | | |
India (Cost $418,369) | | | | | | | | | | | | |
Axis Bank Ltd., Issued by Merrill Lynch International(2) | | | 3,280 | | | $ | 68,828 | | | | 0.75 | |
Bharti Airtel Ltd., Issued by Merrill Lynch International | | | 8,289 | | | | 48,805 | | | | 0.53 | |
DLF Ltd., Issued by Merrill Lynch International | | | 9,921 | | | | 35,161 | | | | 0.39 | |
Jaiprakash Associates Ltd., Issued by Merrill Lynch International(2) | | | 39,418 | | | | 55,875 | | | | 0.61 | |
Maruti Suzuki India Ltd., Issued by Merrill Lynch International | | | 2,509 | | | | 65,269 | | | | 0.72 | |
Strides Arcolab Ltd., Issued by CLSA Financial Products | | | 6,498 | | | | 82,915 | | | | 0.91 | |
Wipro Ltd., Issued by CLSA Financial Products(2) | | | 6,351 | | | | 48,786 | | | | 0.53 | |
| | | | | | | 405,639 | | | | 4.44 | |
Russian Federation (Cost $165,328) | | | | | | | | | | | | |
Sberbank of Russia, Issued by HSBC Bank PLC | | | 80,484 | | | | 188,284 | | | | 2.06 | |
| | | | | | | 188,284 | | | | 2.06 | |
Total Equity-Linked Securities (Cost $583,697) | | | | | | | 593,923 | | | | 6.50 | |
| | | |
Total Investments (Total Cost $8,888,882) | | | | | | | 8,993,780 | | | | 98.45 | |
| | | |
Other Assets Less Liabilities (See Statements of Assets and Liabilities for further detail) | | | | | | | 141,628 | | | | 1.55 | |
| | | |
Net Assets | | | | | | $ | 9,135,408 | | | | 100.00 | |
| (1) | Par values are stated in United States Dollars unless otherwise noted below. |
| (2) | All or a portion of this security is designated as 144A. |
Percentages shown are based on net assets.
See accompanying notes to the financial statements.
69
ASHMORE EMERGING MARKETS EQUITY FUND
SCHEDULE OF INVESTMENTS (CONTINUED)
As of April 30, 2012 (Unaudited)
At April 30, 2012, the industry sectors for the Ashmore Emerging Markets Equity Fund were:
| | | | |
| | | Percentage of | |
| |
| Industry | | Net Assets | |
Consumer Discretionary | | | 13.6 | |
Consumer Staples | | | 3.9 | |
Energy | | | 13.7 | |
Financials | | | 23.7 | |
Health Care | | | 2.0 | |
Industrials | | | 7.2 | |
Information Technology | | | 20.3 | |
Materials | | | 11.6 | |
Telecommunication Services | | | 1.4 | |
Utilities | | | 1.0 | |
Total Investments | | | 98.4 | |
Other Assets Less Liabilities | | | 1.6 | |
Net Assets | | | 100.0 | |
| | |
The inputs or methodologies used for valuing securities are not necessarily an indication of the risks associated with investing in those securities and other financial instruments, if any. See note 4 in the Notes to Financial Statements for more information regarding pricing inputs and valuation techniques. The following is a summary of the inputs used in valuing the Ashmore Emerging Markets Equity Fund’s investments and other financial instruments, as of April 30, 2012.
| | | | | | | | | | | | | | | | |
| | | Level 1 | | | Level 2 | | | Level 3 | | | Total | |
Investments | | | | | | | | | | | | | | | | |
Assets: | | | | | | | | | | | | | | | | |
Common Stocks | | | | | | | | | | | | | | | | |
Brazil | | $ | 1,141,848 | | | $ | — | | | | $— | | | $ | 1,141,848 | |
Canada | | | 27,856 | | | | — | | | | — | | | | 27,856 | |
Chile | | | 42,770 | | | | — | | | | — | | | | 42,770 | |
China | | | 1,723,379 | | | | — | | | | — | | | | 1,723,379 | |
Hong Kong | | | 301,036 | | | | — | | | | — | | | | 301,036 | |
India | | | 234,100 | | | | — | | | | — | | | | 234,100 | |
Indonesia | | | 169,708 | | | | — | | | | — | | | | 169,708 | |
Malaysia | | | 112,258 | | | | — | | | | — | | | | 112,258 | |
Mexico | | | 357,185 | | | | — | | | | — | | | | 357,185 | |
Netherlands | | | 68,622 | | | | — | | | | — | | | | 68,622 | |
Peru | | | 62,524 | | | | — | | | | — | | | | 62,524 | |
Philippines | | | 41,802 | | | | — | | | | — | | | | 41,802 | |
Russian Federation | | | 553,388 | | | | — | | | | — | | | | 553,388 | |
South Africa | | | 253,734 | | | | — | | | | — | | | | 253,734 | |
South Korea | | | 1,138,596 | | | | — | | | | — | | | | 1,138,596 | |
Spain | | | 29,349 | | | | — | | | | — | | | | 29,349 | |
Taiwan | | | 998,794 | | | | — | | | | — | | | | 998,794 | |
Thailand | | | 143,535 | | | | — | | | | — | | | | 143,535 | |
Turkey | | | 99,529 | | | | — | | | | — | | | | 99,529 | |
United Kingdom | | | 24,645 | | | | — | | | | — | | | | 24,645 | |
Preferred Stock | | | | | | | | | | | | | | | | |
Brazil | | | 318,268 | | | | — | | | | — | | | | 318,268 | |
South Korea | | | — | | | | 556,931 | | | | — | | | | 556,931 | |
Equity - Linked Securities | | | | | | | | | | | | | | | | |
India | | | — | | | | 405,639 | | | | — | | | | 405,639 | |
Russian Federation | | | — | | | | 188,284 | | | | — | | | | 188,284 | |
Total Investments | | $ | 7,842,926 | | | $ | 1,150,854 | | | | $— | | | $ | 8,993,780 | |
See accompanying notes to the financial statements.
70
ASHMORE EMERGING MARKETS EQUITY FUND
SCHEDULE OF INVESTMENTS (CONTINUED)
As of April 30, 2012 (Unaudited)
At October 31, 2011, for certain foreign equity securities, the Ashmore Emerging Markets Equity Fund’s fair value trigger was met as a result of the monitoring of events impacting the value of securities after the closing of the exchange on which the securities principally trade, but before the calculation of the daily net asset value, resulting in certain securities being classified as Level 2. Since the fair value trigger was not met at April 30, 2012, these securities were transferred to Level 1. The fair value of the securities transferred from Level 2 to Level 1, using the April 30, 2012 fair value, was $4,421,270.
The following is a summary of the fair values of the Fund’s derivative instruments categorized by risk exposure*:
The Effect of Financial Derivative Instruments on the Statements of Operations for the Period Ended April 30, 2012:
| | | | |
| | | Derivatives Not Accounted
for as Hedging Instruments | |
| | | Foreign Exchange | |
Realized Gain on Derivatives Recognized resulting from Operations: | | | | |
Net Realized Gain on Forward Foreign Currency Exchange Contracts | | | $ 179 | |
* See note 9 in the Notes to Financial Statements for additional information.
See accompanying notes to the financial statements.
71
ASHMORE EMERGING MARKETS SMALL-CAP EQUITY FUND
SCHEDULE OF INVESTMENTS
As of April 30, 2012 (Unaudited)
| | | | | | | | | | | | | | |
| | | | | | | | | | | % of Net | |
| | | Currency(1) | | Shares | | | Value | | | Assets | |
Common Stock | | | | | | | | | | | | | | |
| | | | |
Brazil (Cost $1,086,922) | | | | | | | | | | | | | | |
Brazil Pharma S.A. | | BRL | | | 20,000 | | | $ | 115,416 | | | | 0.93 | |
Brookfield Incorporacoes S.A. | | BRL | | | 21,400 | | | | 56,358 | | | | 0.46 | |
Cia de Locacao das Americas | | BRL | | | 4,491 | | | | 21,723 | | | | 0.18 | |
Cia Hering | | BRL | | | 4,600 | | | | 114,146 | | | | 0.92 | |
Duratex S.A. | | BRL | | | 5,900 | | | | 34,667 | | | | 0.28 | |
Estacio Participacoes S.A. | | BRL | | | 11,400 | | | | 142,339 | | | | 1.15 | |
Even Construtora e Incorporadora S.A. | | BRL | | | 28,100 | | | | 105,109 | | | | 0.85 | |
Iochpe-Maxion S.A. | | BRL | | | 8,200 | | | | 142,263 | | | | 1.15 | |
Mahle-Metal Leve S.A. Industria e Comercio | | BRL | | | 4,600 | | | | 149,862 | | | | 1.21 | |
Marisa Lojas S.A. | | BRL | | | 9,800 | | | | 115,935 | | | | 0.94 | |
OGX Petroleo e Gas Participacoes S.A. | | BRL | | | 3,900 | | | | 27,069 | | | | 0.22 | |
Sonae Sierra Brasil S.A. | | BRL | | | 3,900 | | | | 62,403 | | | | 0.50 | |
Tegma Gestao Logistica | | BRL | | | 8,600 | | | | 130,840 | | | | 1.06 | |
| | | | | | | | | 1,218,130 | | | | 9.85 | |
Chile (Cost $130,022) | | | | | | | | | | | | | | |
Parque Arauco S.A. | | CLP | | | 65,403 | | | | 127,073 | | | | 1.03 | |
| | | | | | | | | 127,073 | | | | 1.03 | |
China (Cost $2,170,280) | | | | | | | | | | | | | | |
3SBio, Inc. ADR | | | | | 17,800 | | | | 232,824 | | | | 1.88 | |
China Automation Group Ltd. | | HKD | | | 866,000 | | | | 238,861 | | | | 1.93 | |
China High Precision Automation Group Ltd. | | HKD | | | 642,000 | | | | 166,631 | | | | 1.35 | |
Chinasoft International Ltd. | | HKD | | | 770,000 | | | | 215,360 | | | | 1.74 | |
Focus Media Holding Ltd. ADR | | | | | 5,400 | | | | 129,006 | | | | 1.04 | |
Greatview Aseptic Packaging Co. Ltd. | | HKD | | | 669,000 | | | | 365,600 | | | | 2.96 | |
Hollysys Automation Technologies Ltd. | | | | | 28,647 | | | | 284,465 | | | | 2.30 | |
Intime Department Store Group Co. Ltd. | | HKD | | | 148,500 | | | | 187,572 | | | | 1.52 | |
MIE Holdings Corp. | | HKD | | | 500,000 | | | | 163,688 | | | | 1.33 | |
Minth Group Ltd. | | HKD | | | 218,000 | | | | 276,200 | | | | 2.24 | |
Sinovac Biotech Ltd. | | | | | 40,200 | | | | 86,832 | | | | 0.70 | |
SouFun Holdings Ltd. ADR | | | | | 12,000 | | | | 216,720 | | | | 1.75 | |
| | | | | | | | | 2,563,759 | | | | 20.74 | |
Colombia (Cost $179,370) | | | | | | | | | | | | | | |
Galway Resources Ltd. | | CAD | | | 46,500 | | | | 58,368 | | | | 0.47 | |
Pacific Rubiales Energy Corp. | | CAD | | | 1,287 | | | | 36,922 | | | | 0.30 | |
Petrominerales Ltd. | | CAD | | | 4,885 | | | | 71,456 | | | | 0.58 | |
| | | | | | | | | 166,746 | | | | 1.35 | |
Hong Kong (Cost $378,114) | | | | | | | | | | | | | | |
Ports Design Ltd. | | HKD | | | 94,000 | | | | 138,117 | | | | 1.12 | |
Trinity Ltd. | | HKD | | | 312,000 | | | | 260,984 | | | | 2.11 | |
| | | | | | | | | 399,101 | | | | 3.23 | |
Indonesia (Cost $286,807) | | | | | | | | | | | | | | |
AKR Corporindo Tbk PT | | IDR | | | 160,000 | | | | 71,806 | | | | 0.58 | |
Berlian Laju Tanker Tbk PT | | IDR | | | 4,428,000 | | | | 70,818 | | | | 0.57 | |
Perusahaan Perkebunan London Sumatra Indonesia Tbk PT | | IDR | | | 532,500 | | | | 169,459 | | | | 1.37 | |
| | | | | | | | | 312,083 | | | | 2.52 | |
Malaysia (Cost $542,256) | | | | | | | | | | | | | | |
DRB-Hicom Bhd. | | MYR | | | 272,200 | | | | 229,347 | | | | 1.85 | |
KNM Group Bhd. | | MYR | | | 262,900 | | | | 72,534 | | | | 0.59 | |
Wah Seong Corp. Bhd. | | MYR | | | 298,800 | | | | 200,420 | | | | 1.62 | |
| | | | | | | | | 502,301 | | | | 4.06 | |
See accompanying notes to the financial statements.
72
ASHMORE EMERGING MARKETS SMALL-CAP EQUITY FUND
SCHEDULE OF INVESTMENTS (CONTINUED)
As of April 30, 2012 (Unaudited)
| | | | | | | | | | | | | | |
| | | | | | | | | | | % of Net | |
| | | Currency(1) | | Shares | | | Value | | | Assets | |
Mexico (Cost $731,969) | | | | | | | | | | | | | | |
Corp. GEO S.A.B. de C.V., Series B | | MXN | | | 81,100 | | | $ | 108,134 | | | | 0.87 | |
Desarrolladora Homex S.A.B. de C.V. ADR | | | | | 12,031 | | | | 202,241 | | | | 1.64 | |
Grupo KUO S.A.B. de C.V., Series B | | MXN | | | 150,000 | | | | 287,854 | | | | 2.33 | |
Industrias CH S.A.B. de C.V., Series B | | MXN | | | 34,300 | | | | 155,525 | | | | 1.26 | |
TV Azteca S.A.B. de C.V., Series CPO | | MXN | | | 164,000 | | | | 106,501 | | | | 0.86 | |
| | | | | | | | | 860,255 | | | | 6.96 | |
Philippines (Cost $341,141) | | | | | | | | | | | | | | |
Megaworld Corp. | | PHP | | | 5,289,000 | | | | 271,786 | | | | 2.20 | |
Oriental Peninsula Resources Group, Inc. | | PHP | | | 2,065,000 | | | | 388,760 | | | | 3.14 | |
| | | | | | | | | 660,546 | | | | 5.34 | |
South Africa (Cost $193,848) | | | | | | | | | | | | | | |
JD Group Ltd. | | ZAR | | | 20,753 | | | | 129,711 | | | | 1.05 | |
Wilson Bayly Holmes-Ovcan Ltd. | | ZAR | | | 7,700 | | | | 134,626 | | | | 1.09 | |
| | | | | | | | | 264,337 | | | | 2.14 | |
South Korea (Cost $513,314) | | | | | | | | | | | | | | |
Hyundai Department Store Co. Ltd. | | KRW | | | 1,321 | | | | 186,439 | | | | 1.51 | |
LIG Insurance Co. Ltd. | | KRW | | | 5,490 | | | | 114,160 | | | | 0.92 | |
Nexen Tire Corp. | | KRW | | | 12,490 | | | | 209,986 | | | | 1.70 | |
| | | | | | | | | 510,585 | | | | 4.13 | |
Taiwan (Cost $1,567,933) | | | | | | | | | | | | | | |
Catcher Technology Co. Ltd. | | TWD | | | 62,000 | | | | 396,939 | | | | 3.21 | |
China Life Insurance Co. Ltd. | | TWD | | | 193,000 | | | | 172,460 | | | | 1.39 | |
Shin Zu Shing Co. Ltd. | | TWD | | | 52,000 | | | | 137,974 | | | | 1.12 | |
Simplo Technology Co. Ltd. | | TWD | | | 35,000 | | | | 269,613 | | | | 2.18 | |
Tainan Spinning Co. Ltd. | | TWD | | | 300,000 | | | | 127,874 | | | | 1.03 | |
Tripod Technology Corp. | | TWD | | | 80,000 | | | | 235,548 | | | | 1.91 | |
TXC Corp. | | TWD | | | 83,000 | | | | 123,753 | | | | 1.00 | |
| | | | | | | | | 1,464,161 | | | | 11.84 | |
Thailand (Cost $210,883) | | | | | | | | | | | | | | |
Dynasty Ceramic PCL (Registered) | | THB | | | 58,600 | | | | 121,479 | | | | 0.98 | |
Supalai PCL (Registered) | | THB | | | 293,100 | | | | 156,309 | | | | 1.27 | |
| | | | | | | | | 277,788 | | | | 2.25 | |
Total Common Stock (Cost $8,332,859) | | | | | | | | | 9,326,865 | | | | 75.44 | |
| | | | |
Preferred Stock | | | | | | | | | | | | | | |
| | | | |
Brazil (Cost $533,335) | | | | | | | | | | | | | | |
Banco ABC Brasil S.A. | | BRL | | | 36,400 | | | | 227,244 | | | | 1.84 | |
Itau Unibanco Holding S.A. ADR | | | | | 4,274 | | | | 67,059 | | | | 0.54 | |
Randon Participacoes S.A. | | BRL | | | 13,700 | | | | 72,591 | | | | 0.59 | |
Saraiva S.A. Livreiros Editores | | BRL | | | 4,200 | | | | 50,656 | | | | 0.41 | |
Suzano Papel e Celulose S.A., Class A | | BRL | | | 22,599 | | | | 85,362 | | | | 0.69 | |
| | | | | | | | | 502,912 | | | | 4.07 | |
Total Preferred Stock (Cost $533,335) | | | | | | | | | 502,912 | | | | 4.07 | |
See accompanying notes to the financial statements.
73
ASHMORE EMERGING MARKETS SMALL-CAP EQUITY FUND
SCHEDULE OF INVESTMENTS (CONTINUED)
As of April 30, 2012 (Unaudited)
| | | | | | | | | | | | | | |
| | | | | | | | | | | % of Net | |
| | | | |
| | | Currency(1) | | Shares | | | Value | | | Assets | |
Equity-Linked Securities | | | | | | | | | | | | | | |
| | | | |
India (Cost $958,807) | | | | | | | | | | | | | | |
Dewan Housing Finance Corp. Ltd., Issued by Citigroup Global Markets Hold(2) | | | | | 25,469 | | | $ | 105,416 | | | | 0.85 | |
HT Media Ltd., Issued by Citigroup Global Markets Hold | | | | | 33,857 | | | | 81,257 | | | | 0.66 | |
India Cements Ltd., Issued by Merrill Lynch International & Co. | | | | | 122,102 | | | | 194,497 | | | | 1.57 | |
Indian Bank, Issued by Merrill Lynch International & Co. | | | | | 57,925 | | | | 241,379 | | | | 1.95 | |
Strides Arcolab Ltd., Issued by Merrill Lynch International & Co. | | | | | 29,339 | | | | 374,339 | | | | 3.03 | |
| | | | | | | | | 996,888 | | | | 8.06 | |
South Korea (Cost $1,091,353) | | | | | | | | | | | | | | |
Gamevil, Inc., Issued by HSBC Bank PLC | | | | | 3,392 | | | | 196,594 | | | | 1.59 | |
Hana Tour Service, Inc., Issued by JP Morgan Structured Products | | | | | 6,557 | | | | 269,296 | | | | 2.18 | |
Hyundai Development Co., Issued by Goldman Sachs International | | | | | 6,960 | | | | 149,640 | | | | 1.21 | |
Korean Reinsurance Co., Issued by JP Morgan Structured Products | | | | | 17,411 | | | | 209,981 | | | | 1.70 | |
MegaStudy Co. Ltd., Issued by HSBC Bank PLC | | | | | 800 | | | | 74,611 | | | | 0.60 | |
Modetour Network, Inc., Issued by JP Morgan Structured Products | | | | | 4,723 | | | | 135,975 | | | | 1.10 | |
Youngone Corp., Issued by Goldman Sachs International | | | | | 12,060 | | | | 263,041 | | | | 2.13 | |
| | | | | | | | | 1,299,138 | | | | 10.51 | |
Turkey (Cost $96,017) | | | | | | | | | | | | | | |
Anadolu Cam Sanayii A.S., Issued by Royal Bank of Scotland PLC | | | | | 57,595 | | | | 93,880 | | | | 0.76 | |
| | | | | | | | | 93,880 | | | | 0.76 | |
United Arab Emirates (Cost $50,058) | | | | | | | | | | | | | | |
Drake & Scull International, Issued by Royal Bank of Scotland PLC | | | | | 228,993 | | | | 59,852 | | | | 0.48 | |
| | | | | | | | | 59,852 | | | | 0.48 | |
Total Equity-Linked Securities (Cost $2,196,235) | | | | | | | | | 2,449,758 | | | | 19.81 | |
| | | | |
Total Investments (Total Cost $11,062,429) | | | | | | | | | 12,279,535 | | | | 99.32 | |
Other Assets Less Liabilities (See Statements of Assets and Liabilities for further detail) | | | | | | | | | 84,344 | | | | 0.68 | |
Net Assets | | | | | | | | $ | 12,363,879 | | | | 100.00 | |
| (1) | Par values are stated in United States Dollars unless otherwise noted below. |
| (2) | All or a portion of this security is designated as 144A. |
Percentages shown are based on net assets.
See accompanying notes to the financial statements.
74
ASHMORE EMERGING MARKETS SMALL-CAP EQUITY FUND
SCHEDULE OF INVESTMENTS (CONTINUED)
As of April 30, 2012 (Unaudited)
At April 30, 2012, the industry sectors for the Ashmore Emerging Markets Small-Cap Equity Fund were:
| | | | |
| Industry | | Percentage of
Net Assets | |
Consumer Discretionary | | | 31.2 | |
Consumer Staples | | | 2.3 | |
Energy | | | 4.6 | |
Financials | | | 14.2 | |
Health Care | | | 5.6 | |
Industrials | | | 13.3 | |
Information Technology | | | 17.0 | |
Materials | | | 11.1 | |
Total Investments | | | 99.3 | |
Other Assets Less Liabilities | | | 0.7 | |
Net Assets | | | 100.0 | |
| | |
The inputs or methodologies used for valuing securities are not necessarily an indication of the risks associated with investing in those securities and other financial instruments, if any. See note 4 in the Notes to Financial Statements for more information regarding pricing inputs and valuation techniques. The following is a summary of the inputs used in valuing the Ashmore Emerging Markets Small-Cap Equity Fund’s investments, as of April 30, 2012:
| | | | | | | | | | | | | | | | |
| | | Level 1 | | | Level 2 | | | Level 3 | | | Total | |
Investments | | | | | | | | | | | | | | | | |
Assets: | | | | | | | | | | | | | | | | |
Common Stocks | | | | | | | | | | | | | | | | |
Brazil | | $ | 1,218,130 | | | $ | — | | | $ | — | | | $ | 1,218,130 | |
Canada | | | 36,922 | | | | — | | | | — | | | | 36,922 | |
Chile | | | 127,073 | | | | — | | | | — | | | | 127,073 | |
China | | | 2,397,128 | | | | — | | | | 166,631 | | | | 2,563,759 | |
Colombia | | | 129,824 | | | | — | | | | — | | | | 129,824 | |
Hong Kong | | | 399,101 | | | | — | | | | — | | | | 399,101 | |
Indonesia | | | 241,265 | | | | — | | | | 70,818 | | | | 312,083 | |
Malaysia | | | 502,301 | | | | — | | | | — | | | | 502,301 | |
Mexico | | | 572,401 | | | | 287,854 | | | | — | | | | 860,255 | |
Philippines | | | 660,546 | | | | — | | | | — | | | | 660,546 | |
South Africa | | | 264,337 | | | | — | | | | — | | | | 264,337 | |
South Korea | | | 510,585 | | | | — | | | | — | | | | 510,585 | |
Taiwan | | | 1,464,161 | | | | — | | | | — | | | | 1,464,161 | |
Thailand | | | 277,788 | | | | — | | | | — | | | | 277,788 | |
Preferred Stocks | | | | | | | | | | | | | | | | |
Brazil | | | 502,912 | | | | — | | | | — | | | | 502,912 | |
Equity - Linked Securities | | | | | | | | | | | | | | | | |
India | | | — | | | | 996,888 | | | | — | | | | 996,888 | |
South Korea | | | — | | | | 1,299,138 | | | | — | | | | 1,299,138 | |
Turkey | | | — | | | | 93,880 | | | | — | | | | 93,880 | |
United Arab Emirates | | | — | | | | 59,852 | | | | — | | | | 59,852 | |
Total Investments | | $ | 9,304,474 | | | $ | 2,737,612 | | | $ | 237,449 | | | $ | 12,279,535 | |
At October 31, 2011, for certain foreign equity securities, the Ashmore Emerging Markets Small-Cap Equity Fund’s fair value trigger was met as a result of the monitoring of events impacting the value of securities after the closing of the exchange on which the securities principally trade, but before the calculation of the daily net asset value, resulting in certain securities being classified as Level 2. Since the fair value trigger was not met for these securities at April 30, 2012, these securities were transferred to Level 1. The fair value of the securities transferred from Level 2 to Level 1, using the April 30, 2012 fair value, was $3,465,674.
See accompanying notes to the financial statements.
75
ASHMORE EMERGING MARKETS SMALL-CAP EQUITY FUND
SCHEDULE OF INVESTMENTS (CONTINUED)
As of April 30, 2012 (Unaudited)
The following is a reconcilation of investments in which significant unobservable inputs (Level 3) were used for the Fund during the period ending April 30, 2012:
| | | | | | | | | | | | | | | | | | | | | | | | | | | | | | | | | | | | |
Category and Subcategory | | Beginning
Balance at 10/31/2011 | | | Purchases | | | Sales | | | Realized
Gains | | | Realized
Losses | | | Change in
Unrealized
Appreciation/
(Depreciation) | | | Transfer
into
Level 3 | | | Transfer
out of
Level 3 | | | Ending
Balance at
4/30/2012 | |
Investments, at value | | | | | | | | | | | | | | | | | | | | | | | | | | | | | | | | | | | | |
Common Stock | | $ | — | | | $ | — | | | $ | — | | | $ | — | | | $ | — | | | $ | — | | | $ | 237,449 | | | $ | — | | | $ | 237,449 | |
Total | | $ | — | | | $ | — | | | $ | — | | | $ | — | | | $ | — | | | $ | — | | | $ | 237,449 | | | $ | — | | | $ | 237,449 | |
The following is a summary of the fair values of the Fund’s derivative instruments categorized by risk exposure*:
The Effect of Financial Derivative Instruments on the Statements of Operations for the Period Ended April 30, 2012:
| | | | |
| | | Derivatives Not Accounted | |
| | | for as Hedging Instruments | |
| | | Foreign Exchange | |
Realized Loss on Derivatives Recognized resulting from Operations: | | | | |
Net Realized Loss on Forward Foreign Currency Exchange Contracts | | | $ (146) | |
* See note 9 in the Notes to Financial Statements for additional information.
See accompanying notes to the financial statements.
76
ASHMORE FUNDS
NOTES TO FINANCIAL STATEMENTS
As of April 30, 2012 (Unaudited)
1. Organization
Ashmore Funds (the “Trust”) is a Massachusetts business trust organized under the laws of The Commonwealth of Massachusetts on August 6, 2010 (inception date) and is registered under the Investment Company Act of 1940, as amended (the “Investment Company Act” or “1940 Act”), as an open-end investment management company. The Trust includes seven funds as of April 30, 2012, each with its own investment objective. The Ashmore Emerging Markets Corporate Debt, Ashmore Emerging Markets Local Currency Bond Fund, Ashmore Emerging Markets Local Currency Fund, Ashmore Emerging Markets Sovereign Debt Fund, Ashmore Emerging Markets Total Return Fund, Ashmore Emerging Markets Equity Fund and Ashmore Emerging Markets Small-Cap Equity Fund (each a “Fund” and collectively, the “Funds”) are separate investment funds of the Trust. Each of the Funds, except Ashmore Emerging Markets Equity Fund and Ashmore Emerging Markets Small-Cap Equity Fund, are non-diversified. Non-diversified funds may invest a relatively large portion of their net assets in a single issuer or a small number of issuers in comparison to a fund that is “diversified.” Each of the Funds is presented herein.
On December 8, 2010, the Ashmore Emerging Markets Corporate Debt Fund, Ashmore Emerging Markets Local Currency Bond Fund, Ashmore Emerging Markets Local Currency Fund, Ashmore Emerging Markets Sovereign Debt Fund and Ashmore Emerging Markets Total Return Fund commenced investment operations. From August 6, 2010 through December 7, 2010, these five Funds did not have any operations other than those actions relating to organizational matters, including the sale of 2,000 shares of each of these five Funds for cash in the amount of $10.00 per share, or $20,000 for each of these five Funds. Effective May 12, 2011, Ashmore Emerging Markets Corporate Debt Fund, Ashmore Emerging Markets Local Currency Bond Fund, Ashmore Emerging Markets Local Currency Fund, Ashmore Emerging Markets Sovereign Debt Fund and Ashmore Emerging Markets Total Return Fund began to offer Class A and C shares (“Retail Shares”). On June 22, 2011, the Ashmore Emerging Markets Equity Fund – Institutional Class commenced investment operations. On October 4, 2011, the Ashmore Emerging Markets Small-Cap Equity Fund – Institutional Class commenced investment operations. On September 30, 2011, the Ashmore Emerging Markets Equity Fund and Ashmore Emerging Markets Small-Cap Equity Fund launched Class A and C shares, however, Class C shares were not seeded during the reporting period. Class A shares for the Ashmore Emerging Markets Equity Fund and Ashmore Emerging Markets Small-Cap Equity Fund were offered on February 27, 2012 and February 1, 2012, respectively.
Ashmore Investment Management Limited (“Ashmore” or the “Investment Manager” or “AIML”) serves as investment manager to the Funds. The Investment Manager has retained Ashmore EMM, L.L.C. (the “Subadviser”) to manage the investment portfolios of Ashmore Emerging Markets Equity Fund and Ashmore Emerging Markets Small-Cap Equity Fund. The Subadviser is responsible for managing the investment of the Funds’ assets, subject to the general oversight and supervision of the Investment Manager and the Board. Ashmore Investment Management (US) Corporation (“AIMUS”) is the principal underwriter of shares of the Funds. AIMUS is an affiliate of the Investment Manager. The Northern Trust Company (“Northern Trust”) serves as the administrator, custodian and transfer agent of the Funds.
2. Significant accounting policies
The significant accounting policies adopted and consistently followed in the preparation of the Funds’ financial statements are set out below:
(a) Basis of preparation
The financial statements have been prepared in accordance with accounting principles generally accepted in the United States of America (“U.S. GAAP”).
77
ASHMORE FUNDS
NOTES TO FINANCIAL STATEMENTS (CONTINUED)
As of April 30, 2012 (Unaudited)
(b) Use of estimates
The preparation of financial statements in accordance with U.S. GAAP requires management to make estimates and assumptions that affect the reported amounts of assets and liabilities and the disclosure of contingent assets and liabilities at the date of the financial statements and the reported amounts of revenues and expenses during the reporting period. Actual results could differ from these estimates. These financial statements contain all adjustments which are, in the opinion of the Board, necessary to portray a fair statement of the period presented. Such adjustments are normal and recurring in nature. Valuation models used to determine the fair value of unlisted derivative instruments may require the use of a number of assumptions.
(c) Determination of Net Asset Value
The net asset value (“NAV”) of a Fund’s shares is calculated at the close of regular trading (normally 4:00 p.m. Eastern time) (the “NYSE Close”) on each day that the New York Stock Exchange (“NYSE”) is open for regular trading.
(d) Investment valuation
For the purposes of calculating NAV, portfolio securities and other assets for which market quotations are readily available are valued at market value. Market values for various types of securities and other instruments are generally determined on the basis of closing prices or the last reported sales prices on an exchange or other market, or if no sales are reported, based on quotes or other market information obtained from a quotation reporting system, established market makers, or pricing services. Domestic and foreign debt securities where the close of trading does not coincide with the NYSE close and non-exchange traded derivatives are normally valued on the basis of quotes obtained from brokers and dealers or pricing services using data reflecting the earlier closing of the principal markets for those securities. Prices obtained from independent pricing services are based on information provided by market makers or estimates of market values obtained from yield data relating to investments or securities with similar characteristics. Certain debt securities purchased on a delayed delivery basis are marked-to-market daily until settlement at the forward settlement date. Short-term investments having a maturity of 60 days or less are generally valued at amortized cost. Exchange traded options, futures and options on futures are valued at the settlement price determined by the relevant exchange. With respect to any portion of a Fund’s assets that are invested in one or more open-ended investment management companies, a Fund’s NAV will be calculated based upon the NAVs of such investments. The prospectuses for these open-end investment management companies explain the circumstances under which those companies will use fair value pricing and the effects of using fair value pricing.
If the Investment Manager believes a non-U.S. (foreign) security’s value has materially changed after the close of the security’s primary exchange or principal market but before the NYSE Close, the security will be valued at fair value based on procedures approved by the Board of Trustees of the Trust, (the “Board”). A Fund may determine the fair value of investments based on information provided by pricing services and other third-party vendors, which may recommend fair value prices or adjustments with reference to other securities, indices or assets. The Funds may use fair value pricing more frequently for foreign securities or assets because, amongst other things, many foreign markets close well before the NAV of the Funds’ shares is next calculated. In considering whether fair value pricing is required and in determining fair values, the Investment Manager may, amongst other things, consider significant events (which may be considered to include changes in the value of U.S. securities or securities indices) that occur after the close of the relevant market and before the NYSE Close. A Fund may utilize modeling tools provided by third-party vendors to determine the fair values of non-U.S. securities. Foreign exchanges may permit trading in foreign securities on days when the Trust is not open for business, which may result in the values of a Fund’s portfolio investments being affected when you are unable to buy, sell or exchange shares of the Fund.
For the purposes of calculating NAV, the Funds normally use pricing data for domestic equity securities received shortly after the NYSE Close and do not normally take into account trading, clearances or settlements
78
ASHMORE FUNDS
NOTES TO FINANCIAL STATEMENTS (CONTINUED)
As of April 30, 2012 (Unaudited)
that take place after the NYSE Close. Domestic fixed income and non-U.S. securities are normally priced using data reflecting the earlier closing of the principal markets for those securities, subject to possible fair value adjustments. Information that becomes known to a Fund or its agents after NAV has been calculated on a particular day will not generally be used to retroactively adjust the price of a security or NAV determined earlier that day.
Investments initially valued in currencies other than the U.S. dollar are converted to the U.S. dollar using exchange rates obtained from pricing services. Foreign exchange rates are calculated as of 4:00 p.m. Eastern time on each day that the NYSE is open for regular trading. As a result, the NAV of a Fund’s shares may be affected by changes in the value of currencies in relation to the U.S. dollar. The value of securities traded in markets outside the United States or denominated in currencies other than the U.S. dollar may be affected significantly on a day that the NYSE is closed and an investor is not able to purchase, redeem or exchange shares of the Funds. Securities and other assets for which market quotations are not readily available are valued at fair value as determined in good faith by the Board or persons acting at their direction. The Board has adopted methods for valuing securities and other assets in circumstances where market quotes are not readily available, and has delegated to the Investment Manager and the Subadviser, as applicable, the responsibility for applying the valuation methods. For instance, certain securities or investments for which market quotes are not readily available may be valued, pursuant to guidelines approved by the Board.
In the event that market quotes are not readily available, and the security or asset cannot be valued pursuant to one of the Board’s approved valuation methods, the fair value of the security or asset will be determined in good faith by the Board, generally based upon recommendations provided by the Investment Manager and the Subadviser, as applicable. Market quotes are considered not readily available in circumstances where there is an absence of current or reliable market-based data (e.g., trade information, bid/asked information, broker quotes), including where events occur after the close of the relevant market, but prior to a Fund’s NAV calculation time, that materially affect the values of a Fund’s securities or assets. In addition, market quotes are considered not readily available when, due to extraordinary circumstances, the exchanges or markets on which the securities trade do not open for trading for the entire day and no other market prices are available. A Fund may also determine that market quotations are not readily available due to events relating to a single issuer (e.g., corporate actions or announcements) or events relating to multiple issuers (e.g., governmental actions or natural disasters). The Board has delegated to the Investment Manager and the Subadviser, as applicable, the responsibility for monitoring significant events that may materially affect the values of a Fund’s securities or assets and for determining whether the value of the applicable securities or assets should be re-evaluated in light of such significant events.
When a Fund uses fair value pricing to determine the NAV of its shares, securities will not be priced on the basis of quotes from the primary market in which they are traded, but rather may be priced by another method that the Board or persons acting at its direction believe accurately reflects fair value. Fair value pricing may require subjective determinations about the value of a security or asset. While the Funds’ policies are intended to result in the calculation of a Fund’s NAV that fairly reflects security and asset values as of the time of pricing, the Funds cannot ensure that fair values determined by the Board or persons acting at their direction would accurately reflect the price that a Fund could obtain for a security or asset if it were to dispose of that security as of the time of pricing (for instance, in a forced or distressed sale). The prices used by a Fund may differ from the value that would be realized if the securities were sold. Also, the use of fair value pricing may not always result in adjustments to the prices of securities or other assets held by the Fund for purposes of calculating the NAV of the Fund’s shares.
(e) Investment transactions, income and expenses
Investment transactions are recorded at the trade date. The Funds determine the gain or loss realized from investment transactions using an identified cost basis method. Interest income is recognized on an accrual basis and includes the amortization of premiums and the accretion of discounts using the effective yield method.
79
ASHMORE FUNDS
NOTES TO FINANCIAL STATEMENTS (CONTINUED)
As of April 30, 2012 (Unaudited)
Dividend income is recognized on the ex-dividend date. Dividends from foreign securities are recorded on the ex-dividend date, or as soon as such information is available.
Expenses are recorded on an accruals basis. Each Fund is charged for those expenses that are directly attributable to that Fund. Certain expenses arising in connection with a class of shares are charged to that class of shares. Expenses incurred which do not specifically relate to an individual Fund are allocated amongst all the Funds in the Trust in proportion to each Fund’s relative net assets.
(f) Fully funded total return swaps
Each Fund is subject to market risk in the normal course of pursuing its investment objectives. Certain Funds enter into fully funded total return swaps (“TRS”) to manage their exposure to the market, certain sectors of the market or a particular security or reference asset, or to create exposure to certain investments to which they would otherwise not be exposed. TRS contracts involve the exchange by a Fund and a counterparty of their respective commitments to pay or receive a net amount based on the change in the fair value of a particular security or index and a specified notional amount.
Where a Fund enters into a TRS transaction with a swap counterparty, pursuant to which the Fund makes an initial payment equal to the estimated value of an emerging market debt security, loan or other financial instrument, the TRS are considered investments for financial statement purposes and are accounted for using the same policies as would apply to the underlying assets they represent. Aside from the market risk of the underlying securities, there is a risk of default by the counterparty to the transaction.
(g) Equity-Linked Securities
Certain Funds may purchase equity-linked securities, also known as participation notes. Equity-linked securities are primarily used by the Funds as an alternate means to efficiently and effectively access what is generally an emerging securities market. A Fund deposits cash with its custodian (or broker) in an amount near or equal to the selling price of the underlying security, in exchange for an equity linked security. Upon sale, the Fund receives cash from the broker or custodian, equal to the value of the underlying security. Aside from the market risk of the underlying securities, there is a risk of default by the counterparty to the transaction. In the event of insolvency of the counterparty, a Fund might be unable to obtain its expected benefit. In addition, while the Funds will seek to enter into such transactions only with parties that are capable of entering into closing transactions with a Fund, there can be no assurance that a Fund will be able to close out such a transaction with the counterparty or obtain an offsetting position with any counterparty, at time prior to the end of the term of the underlying agreement.
(h) Organizational and Offering Costs
Organization costs were recognized as expenses as incurred and consisted of costs incurred to establish the Trust and enable it legally to do business. These expenses were paid by the Funds, and the Investment Manager has agreed to reimburse the Funds for these expenses, subject to potential recovery (see Note 10).
Offering costs include legal fees regarding the preparation of the initial registration statement. Offering costs are amortized over twelve months from the commencement of operations on a straight-line basis.
3. Principal risks
In the normal course of business the Funds trade financial instruments and enter into financial transactions where a risk of potential loss exists due to, amongst other things, changes in the market (market risk), or the failure or inability of the other party to a transaction to perform (credit and counterparty risk). See below for a summary description of select principal risks, some of which may not apply to a particular Fund. For more information, please see the Funds’ prospectuses.
80
ASHMORE FUNDS
NOTES TO FINANCIAL STATEMENTS (CONTINUED)
As of April 30, 2012 (Unaudited)
Convertible Securities Risk
Securities that are convertible into preferred or common stocks are subject to the risks of both debt and equity securities and the risk of changes in value at a different rate than the underlying stocks. Convertible securities, particularly high-yield or junk bonds, are subject to greater levels of credit and liquidity risk, may be speculative and may decline in value due to changes in interest rates or an issuer’s or counterparty’s deterioration or default.
Counterparty and Third Party Risk
Transactions involving a counterparty to a derivative or other instrument, or a third party responsible for servicing the instrument, are subject to the credit risk of the counterparty or third party, and to the counterparty’s or third party’s ability to perform in accordance with the terms of the transaction.
Credit Risk
The Funds could lose money if the issuer or guarantor of a debt security or other instrument is unable or unwilling to meet its financial obligations, and the lack of ability, or perceived lack of ability, of the issuer to make timely payments of interest and/or principal will negatively affect the value of the security or instrument.
Currency Management Strategies Risk
Currency management strategies, including the use of forward currency contracts and other derivatives, may substantially change the Funds’ exposure to currencies and currency exchange rates and could result in losses to the Funds if currencies do not perform as the Investment Manager anticipates.
Currency Risk
Foreign (non-U.S.) currencies may decline in value relative to the U.S. dollar and adversely affect the value of the Funds’ investments in foreign currencies, securities denominated in foreign currencies or derivatives that provide exposure to foreign currencies.
Derivatives Risk
Investing in derivative instruments may be considered risky and involves correlation, documentation, interest rate, leverage, liquidity, market, management repetition and valuation risks and the risk of losing more than the principal amount invested.
Emerging Markets Risk
Compared to foreign developed markets, investing in emerging markets may involve heightened volatility, greater political, regulatory, legal and economic uncertainties, less liquidity, dependence on particular commodities or international aid, high levels of inflation, greater custody risk, and certain special risks associated with smaller companies.
Equity Securities Risk
Equity securities may react more strongly to changes in an issuer’s financial condition or prospects than other securities of the same issuer.
Focused Investment Risk
Focusing a fund’s investments in a limited number of issuers, sectors or industries increases risk and the volatility of the value of a fund’s shares. The Funds may be particularly susceptible to economic, political, regulatory or other events affecting the issuers, sectors or industries due to the extent that it focuses its investments.
Foreign Investment Risk
Investments in foreign (non-U.S.) issuers, directly or through the use of depositary receipts, may be negatively affected by adverse political, regulatory, economic, market or other developments affecting issuers located in foreign countries, currency exchange rates or regulations, or foreign withholding taxes. Investing in foreign securities may result in the Funds experiencing more rapid and extreme changes in value than a fund that invests exclusively in the securities of U.S. issuers.
81
ASHMORE FUNDS
NOTES TO FINANCIAL STATEMENTS (CONTINUED)
As of April 30, 2012 (Unaudited)
Geographic Focus Risk
The Funds may be particularly susceptible to economic, political or regulatory events affecting those countries or regions in which the Funds focus their investments.
High Yield Risk
Below investment grade securities and unrated securities of similar credit quality (commonly known as “high yield” securities or “junk bonds”) are subject to greater levels of credit and liquidity risks than higher quality securities, and are considered predominantly speculative with respect to the issuer’s continuing ability to make principal and interest payments.
Inflation/Deflation Risk
The value of the Funds’ investments may decline as inflation reduces the value of money; conversely, if deflation reduces prices throughout the economy, there may be an adverse effect on the creditworthiness of issuers in whose securities the Funds invest and an increase in the likelihood of issuer defaults.
Interest Rate Risk
Debt and other securities and instruments may decline in value due to changes in interest rates, the extended duration of principal payments at below-market interest rates, and/or prepayment.
Investments in Pooled Vehicles Risk
Investing in another investment company or pooled vehicle subjects the Funds to that company’s risks, and, in general, to a pro rata portion of that company’s fees and expenses in addition to fees and expenses charged by the Funds.
IPO Risk
Securities offered in initial public offerings (IPOs) are subject to many of the same risks of investing in small companies and often to a heightened degree, their values may be highly volatile, they may have no trading history and information about the issuer may have been available for only limited periods.
Issuer Non-Diversification Risk
The Ashmore Emerging Markets Corporate Debt Fund, Ashmore Emerging Markets Local Currency Bond Fund, Ashmore Emerging Markets Local Currency Fund, Ashmore Emerging Markets Sovereign Debt Fund and the Ashmore Emerging Markets Total Return Fund are “non-diversified” and are therefore more susceptible to the risks of focusing investments in a small number of issuers, industries or foreign currencies, as well as the risks of a single economic, political or regulatory occurrence, than funds that are “diversified”.
Issuer Risk
The value of a security or instrument may decline for reasons directly related to the issuer, such as management performance, financial leverage and reduced demand for the issuer’s goods or services.
Large Shareholder Risk
Shareholders of the Funds, such as institutional investors, may disrupt the efficient management of the Funds’ operations by purchasing or redeeming Fund shares in large amounts.
Leverage Risk
The use of leverage, including through borrowings, derivatives and reverse repurchase agreements, will increase the volatility of the Funds’ investment portfolio and magnify the Funds’ investment losses or gains.
82
ASHMORE FUNDS
NOTES TO FINANCIAL STATEMENTS (CONTINUED)
As of April 30, 2012 (Unaudited)
Limited Operating History Risk
The Funds have a limited operating history for investors to evaluate and may not achieve the desired asset levels to maximize investment and operational efficiencies.
Liquidity Risk
Illiquid securities and other instruments may be highly volatile, difficult to value, and difficult to sell or close out at favorable prices or times.
Management Risk
The Funds’ investment returns depend on the ability of the Investment Manager to manage the Funds’ portfolio successfully; there is a risk that the Investment Manager may be incorrect in its analysis of economic trends, currencies, countries, industries, companies, and the relative attractiveness of asset classes or other matters.
Market Risk
The value of securities and instruments owned by the Funds may rise and fall, sometimes rapidly or unpredictably, due to factors affecting securities markets generally or particular industries or geographic areas.
Mortgage-Backed and Asset-Backed Risk
Payments on underlying assets, including mortgages or other obligations, may be delayed, prepaid, subordinated or defaulted on. Rising interest rates tend to extend the duration of these securities, making them more sensitive to changes in interest rates.
Over-the-Counter Risk
Securities and derivatives traded in over-the-counter markets may trade less frequently and in limited volumes and thus exhibit more volatility and liquidity risk. The prices paid by the Funds in over-the-counter transactions may include an undisclosed dealer markup.
Portfolio Turnover Risk
If the Funds frequently trade their securities, this will increase transaction costs, may result in taxable capital gains, and may reduce the Funds’ investment performance.
Small and Mid-Sized Companies Risk
Investments in securities issued by small and mid-sized companies tend to be more vulnerable to adverse developments than larger companies, and may present increased volatility and liquidity risk.
Valuation Risk
Certain securities and instruments may be difficult to value, and to the extent the Funds sell a security or instrument at a price lower than that used to value the security, their net asset value will be adversely affected.
4. Fair value measurements
U.S. GAAP includes a topic which establishes a hierarchy for NAV determination purposes in which various inputs are used in determining the value of each Fund’s assets or liabilities. This topic defines fair value as the price that the Fund would receive upon selling an investment in a timely transaction to an independent buyer in the principal or most advantageous market of the investment. This topic establishes a three-tier hierarchy to maximize the use of observable market data and minimize the use of unobservable inputs and to establish classification of fair value measurements for disclosure purposes. Inputs may be observable or unobservable and refer broadly to the assumptions that market participants would use in pricing the asset or liability including assumptions about risk. Such risks include the inherent risk in a particular valuation technique which is used to measure fair value. This may include the pricing model and/or the inputs to the pricing model used in the valuation technique. Observable inputs are inputs that reflect the assumptions market participants would use in pricing the asset or liability developed based on market data obtained from sources independent of the reporting entity. Unobservable inputs are inputs that reflect the reporting entity’s own assumptions about the
83
ASHMORE FUNDS
NOTES TO FINANCIAL STATEMENTS (CONTINUED)
As of April 30, 2012 (Unaudited)
assumptions market participants would use in pricing the asset or liability, developed based on the best information available in the circumstances. The three-tier hierarchy of inputs is summarized in the three broad levels listed below.
| | • | | Level 1 – Inputs using unadjusted quoted prices in active markets or exchanges for identical assets and liabilities. |
| | • | | Level 2 – Significant other observable inputs, which may include, but are not limited to, quoted prices for similar assets or liabilities in markets that are active, quoted prices for identical or similar assets or liabilities in markets that are not active, inputs other than quoted prices that are observable for the assets or liabilities (such as interest rates, yield curves, volatilities, prepayment speeds, loss severities, credit risks and default rates) or other market corroborated inputs. |
| | • | | Level 3 – Significant unobservable inputs based on the best information available in the circumstances, to the extent observable inputs are not available, which may include assumptions made by the Board or persons acting at their discretion that are used in determining the fair market value of investments. |
Fixed income securities including corporate, convertible and municipal bonds and notes, U.S. government agency securities, U.S. treasury obligations, sovereign issues, bank loans, convertible preferred securities and non-U.S. bonds are normally valued based on evaluations provided by pricing service providers that use broker dealer quotations, reported trades or valuation estimates from their internal pricing models. The service providers’ internal models use inputs that are observable such as issuer details, interest rates, yield curves, prepayment speeds, credit risks/spreads, default rates and quoted prices for similar assets. Securities that use similar valuation techniques and inputs to those described above are categorized as Level 2 of the fair value hierarchy.
Fixed income securities purchased on a delayed-delivery basis are marked to market daily until their settlement at the forward settlement date and are categorized as Level 2 of the fair value hierarchy.
Common stocks, exchange-traded funds and financial derivative instruments, such as futures contracts or options contracts that are traded on a national securities exchange, are stated at the last reported sale or settlement price on the day of valuation. To the extent these securities are actively traded and valuation adjustments are not applied, they are categorized as Level 1 of the fair value hierarchy. Valuation adjustments may be applied to certain securities that are solely traded on a foreign exchange to account for the market movement between the close of the foreign market and the close of the NYSE. These securities are valued using pricing service providers that consider the correlation of the trading patterns of the foreign security to the intraday trading in the U.S. markets for investments. Securities using these valuation adjustments are categorized as Level 2 of the fair value hierarchy. Preferred securities, equity linked notes and other equities traded on inactive markets or valued by reference to similar instruments are also categorized as Level 2 of the fair value hierarchy.
Investments in registered open-end investment management companies will be valued based upon the NAVs of such investments and are categorized as Level 1 of the fair value hierarchy. Investments in privately held investment funds will be valued based upon the NAVs of such investments and are categorized as Level 2 of the fair value hierarchy.
Short-term investments having a maturity of 60 days or less are generally valued at amortized cost which approximates fair market value. These investments are categorized as Level 2 of the fair value hierarchy. Over-the-counter financial derivative instruments, such as foreign currency contracts, options contracts, or swaps agreements, derive their value from underlying asset prices, indices, reference rates, and other inputs or a combination of these factors. These contracts are normally valued on the basis of broker dealer quotations or pricing service providers. Depending on the product and the terms of the transaction, the value of the financial
84
ASHMORE FUNDS
NOTES TO FINANCIAL STATEMENTS (CONTINUED)
As of April 30, 2012 (Unaudited)
derivative contracts can be estimated by a pricing service provider using a series of techniques, including simulation pricing models. The pricing models use inputs that are observed from actively quoted markets such as issuer details, indices, spreads, interest rates, curves, dividends and exchange rates. Financial derivatives that use similar valuation techniques and inputs as described above are categorized as Level 2 of the fair value hierarchy.
Investments and derivatives classified within Level 3 have significant unobservable inputs, as they trade infrequently or not at all. Level 3 instruments may include private equity and real estate investments, certain loan agreements, less-liquid corporate debt securities (including distressed debt instruments) and certain collateralized debt obligations. Also included in this category are options, government and sovereign obligations, government agency securities and corporate bonds for which independent broker prices are used and information relating to the inputs of the price models is currently unavailable.
5. Capital share transactions
Transactions in Class A shares for the period ended April 30, 2012, were as follows:
| | | | | | | | | | | | | | | | | | | | | | | | | | | | | | | | |
| Fund | | Shares Sold | | | Proceeds
from Shares
Sold | | | Shares from
Reinvested
Distributions | | | Proceeds
from
Reinvestment
of
Distributions | | | Shares
Redeemed | | | Payments
for Shares
Redeemed | | | Net
Increase
in Shares | | | Net
Increase in Net Assets | |
Ashmore Emerging Markets Corporate Debt Fund | | | - | | | $ | - | | | | 6 | | | $ | 53 | | | | - | | | $ | - | | | | 6 | | | $ | 53 | |
Ashmore Emerging Markets Local Currency Bond Fund | | | - | | | | - | | | | 2 | | | | 23 | | | | - | | | | - | | | | 2 | | | | 23 | |
Ashmore Emerging Markets Local Currency Fund | | | - | | | | - | | | | - | | | | 1 | | | | - | | | | - | | | | - | | | | 1 | |
Ashmore Emerging Markets Sovereign Debt Fund | | | - | | | | - | | | | 3 | | | | 28 | | | | - | | | | - | | | | 3 | | | | 28 | |
Ashmore Emerging Markets Total Return Fund | | | 8,231 | | | | 74,686 | | | | 1,564 | | | | 14,509 | | | | - | | | | - | | | | 9,795 | | | | 89,195 | |
Ashmore Emerging Markets Equity Fund | | | 100 | | | | 1,000 | | | | - | | | | - | | | | - | | | | - | | | | 100 | | | | 1,000 | |
Ashmore Emerging Markets Small-Cap Equity Fund | | | 9,653 | | | | 96,525 | | | | - | | | | - | | | | - | | | | - | | | | 9,653 | | | | 96,525 | |
85
ASHMORE FUNDS
NOTES TO FINANCIAL STATEMENTS (CONTINUED)
As of April 30, 2012 (Unaudited)
Transactions in Class C shares for the period ended April 30, 2012, were as follows:
| | | | | | | | | | | | | | | | | | | | | | | | | | | | | | | | |
| Fund | | Shares Sold | | | Proceeds
from Shares
Sold | | | Shares from
Reinvested
Distributions | | | Proceeds from
Reinvestment
of
Distributions | | | Shares
Redeemed | | | Payments
for Shares
Redeemed | | | Net
Increase
in Shares | | | Net
Increase in Net Assets | |
Ashmore Emerging Markets Corporate Debt Fund | | | - | | | $ | - | | | | 6 | | | $ | 49 | | | | - | | | $ | - | | | | 6 | | | $ | 49 | |
Ashmore Emerging Markets Local Currency Bond Fund | | | - | | | | - | | | | 2 | | | | 19 | | | | - | | | | - | | | | 2 | | | | 19 | |
Ashmore Emerging Markets Local Currency Fund | | | - | | | | - | | | | - | | | | - | | | | - | | | | - | | | | - | | | | - | |
Ashmore Emerging Markets Sovereign Debt Fund | | | - | | | | - | | | | 3 | | | | 24 | | | | - | | | | - | | | | 3 | | | | 24 | |
Ashmore Emerging Markets Total Return Fund | | | - | | | | - | | | | 3 | | | | 26 | | | | - | | | | - | | | | 3 | | | | 26 | |
Transactions in Institutional Class shares for the period ended April 30, 2012, were as follows:
| | | | | | | | | | | | | | | | | | | | | | | | | | | | | | | | |
| Fund | | Shares Sold | | | Proceeds
from Shares
Sold | | | Shares from
Reinvested
Distributions | | | Proceeds from
Reinvestment
of Distributions | | | Shares
Redeemed | | | Payments
for Shares
Redeemed | | | Net
Increase
in Shares | | | Net
Increase in
Net Assets | |
Ashmore Emerging Markets Corporate Debt Fund | | | 189,354 | | | $ | 1,760,000 | | | | 51,474 | | | $ | 477,422 | | | | (10,341) | | | $ | (100,000) | | | | 230,487 | | | $ | 2,137,422 | |
Ashmore Emerging Markets Local Currency Bond Fund | | | 722,103 | | | | 7,183,222 | | | | 71,000 | | | | 689,276 | | | | (464,356) | | | | (4,347,663) | | | | 328,747 | | | | 3,524,835 | |
Ashmore Emerging Markets Local Currency Fund | | | 3,796,546 | | | | 34,578,320 | | | | - | | | | 1 | | | | (44,846) | | | | (420,208) | | | | 3,751,700 | | | | 34,158,113 | |
Ashmore Emerging Markets Sovereign Debt Fund | | | - | | | | - | | | | 69,463 | | | | 700,959 | | | | - | | | | - | | | | 69,463 | | | | 700,959 | |
Ashmore Emerging Markets Total Return Fund | | | 5,449,711 | | | | 51,710,001 | | | | 320,087 | | | | 3,017,544 | | | | (362,612) | | | | (3,511,699) | | | | 5,407,186 | | | | 51,215,846 | |
Ashmore Emerging Markets Equity Fund | | | 524 | | | | 5,000 | | | | 1,571 | | | | 12,824 | | | | - | | | | - | | | | 2,095 | | | | 17,824 | |
Ashmore Emerging Markets Small-Cap Equity Fund | | | 394 | | | | 5,000 | | | | 3,245 | | | | 33,652 | | | | - | | | | - | | | | 3,639 | | | | 38,652 | |
86
ASHMORE FUNDS
NOTES TO FINANCIAL STATEMENTS (CONTINUED)
As of April 30, 2012 (Unaudited)
Capital shares
Class A or Class C shares are issued at the Fund’s relevant NAV per share plus any applicable sales charge for Class A shares. Institutional Class shares are issued at the Fund’s relevant NAV per share without a sales charge. Shares confer upon the holders the right to receive notice of and attend, speak and vote at general meetings of the Funds. The shares confer upon the holders the right to any or all dividends or distributions which the Trustees in their sole discretion may from time to time resolve to make or declare.
6. Investment transactions
For the period ended April 30, 2012, the aggregate costs of purchases and proceeds from sales of investments (including fully funded TRS and excluding short-term investments) for the Funds were as follows:
| | | | | | | | |
Fund | | Purchases | | | Sales | |
Ashmore Emerging Markets Corporate Debt Fund | | $ | 5,107,375 | | | $ | 2,841,773 | |
Ashmore Emerging Markets Local Currency Bond Fund | | | 27,944,610 | | | | 21,721,510 | |
Ashmore Emerging Markets Local Currency Fund | | | 1,410,687 | | | | 191,483 | |
Ashmore Emerging Markets Sovereign Debt Fund | | | 3,249,478 | | | | 2,570,773 | |
Ashmore Emerging Markets Total Return Fund | | | 60,393,609 | | | | 18,917,657 | |
Ashmore Emerging Markets Equity Fund | | | 4,841,415 | | | | 4,846,829 | |
Ashmore Emerging Markets Small-Cap Equity Fund | | | 6,453,133 | | | | 6,412,235 | |
7. Federal income taxes
No provision for U.S. federal income taxes has been made since each Fund’s policy is to comply with the requirements of Subchapter M of the Internal Revenue Code of 1986, as amended, applicable to regulated investment companies, and to distribute, each year, substantially all of its taxable income and capital gains to its shareholders.
At October 31, 2011, the capital loss carryforwards for U.S. federal income tax purposes and their respective years of expiration were as follows:
| | | | |
| Fund | | October 31, 2019 | |
| Ashmore Emerging Markets Corporate Debt Fund | | $ | - | |
| Ashmore Emerging Markets Local Currency Bond Fund | | | - | |
| Ashmore Emerging Markets Local Currency Fund | | | (4,413 | ) |
| Ashmore Emerging Markets Sovereign Debt Fund | | | (9,443 | ) |
| Ashmore Emerging Markets Total Return Fund | | | (189,216 | ) |
The Regulated Investment Company Modernization Act of 2010 (the “Act”) was enacted on December 22, 2010. The Act makes changes to several tax rules affecting the Funds. In general, the provisions of the Act are effective for the Funds’ fiscal year ending October 31, 2012. Although the Act provides several benefits, including the unlimited carryover of future capital losses, there may be a greater likelihood that all, or a portion of a Fund’s pre-enactment capital loss carryovers may expire without being utilized, due to the fact that post-enactment capital losses are utilized before pre-enactment capital loss carryovers.
87
ASHMORE FUNDS
NOTES TO FINANCIAL STATEMENTS (CONTINUED)
As of April 30, 2012 (Unaudited)
The following Fund launched after the enactment date of December 22, 2010, and therefore such Fund’s capital loss carryforward does not expire.
| | | | |
| Fund | | Short-Term
Capital Loss
Carryforward at
October 31, 2011 | |
Ashmore Emerging Markets Equity Fund | | $ | (763,427 | ) |
The Funds in the above two tables may offset future capital gains with these capital loss carryforwards.
The Funds are subject to the provisions of the Financial Accounting Standards Board (“FASB”) Accounting Standards Codification (“ASC”) Topic 740-10, Income Taxes. This standard provides guidance as to how uncertain tax positions should be recognized, measured, presented and disclosed in the Funds’ financial statements. The Funds recognize the tax benefits of uncertain tax positions only where the position is more-likely-than-not (i.e. greater than 50-percent) to be sustained assuming examination by a tax authority based on the technical merits of the position. In evaluating whether a tax position has met the recognition threshold, the Funds must presume that the position will be examined by the appropriate taxing authority that has full knowledge of all relevant information. A tax position that meets the more-likely-than-not recognition threshold is measured to determine the amount of benefit to recognize in the Funds’ financial statements. Income tax and related interest and penalties would be recognized by the Funds as tax expense in the statement of operations if the tax positions were deemed not to meet the more-likely-than- not threshold. The Funds analyze all open tax years for all major taxing jurisdictions. Open tax years are those that are open to examination by taxing authorities, as defined by the Statute of Limitations in each jurisdiction. The Funds have no examinations by tax authorities in progress. Management has analyzed the Funds’ tax positions, and has concluded that no liability for unrecognized tax benefits should be recorded related to uncertain tax positions. Further, Management is not aware of any tax positions for which it is reasonably possible that the total amounts of unrecognized tax benefits will significantly change in the next twelve months.
The taxable character of distributions paid during the fiscal period ended October 31, 2011, were as follows:
| | | | | | | | | | | | | | | | |
| | | Distributions From | | | | |
| Fund | | Ordinary
Income | | | Long-Term
Capital Gains | | | Return of Capital | | | Total Distributions Paid | |
Ashmore Emerging Markets Corporate Debt Fund | | $ | 660,384 | | | $ | - | | | $ | - | | | $ | 660,384 | |
Ashmore Emerging Markets Local Currency Bond Fund | | | 1,481,344 | | | | - | | | | 1,034,126 | | | | 2,515,470 | |
Ashmore Emerging Markets Local Currency Fund | | | - | | | | - | | | | 948,703 | | | | 948,703 | |
Ashmore Emerging Markets Sovereign Debt Fund | | | 413,236 | | | | - | | | | - | | | | 413,236 | |
Ashmore Emerging Markets Total Return Fund | | | 1,070,336 | | | | - | | | | 1,263,657 | | | | 2,333,993 | |
Ashmore Emerging Markets Equity Fund | | | 46,475 | | | | - | | | | - | | | | 46,475 | |
Ashmore Emerging Markets Small-Cap Equity Fund | | | - | | | | - | | | | - | | | | - | |
Tax determination of fiscal 2012 distributions will be made at the Funds’ tax year end.
88
ASHMORE FUNDS
NOTES TO FINANCIAL STATEMENTS (CONTINUED)
As of April 30, 2012 (Unaudited)
At April 30, 2012, for U.S. federal income tax purposes, gross unrealized appreciation, gross unrealized depreciation, net unrealized appreciation/(depreciation) on investments in securities (including the effects of foreign currency translation) and the cost basis of investments were as follows:
| | | | | | | | | | | | | | | | |
| Fund | | Cost Basis of
Investments | | | Unrealized
Appreciation | | | Unrealized
Depreciation | | | Net Unrealized
Appreciation
(Depreciation)
on Investments | |
Ashmore Emerging Markets Corporate Debt Fund | | $ | 14,348,281 | | | $ | 300,920 | | | $ | (898,893 | ) | | $ | (597,973 | ) |
Ashmore Emerging Markets Local Currency Bond Fund | | | 68,298,413 | | | | 1,660,792 | | | | (871,023 | ) | | | 789,769 | |
Ashmore Emerging Markets Local Currency Fund | | | 45,754,545 | | | | 3,058 | | | | (56,504 | ) | | | (53,446 | ) |
Ashmore Emerging Markets Sovereign Debt Fund | | | 30,084,670 | | | | 1,729,877 | | | | (179,826 | ) | | | 1,550,051 | |
Ashmore Emerging Markets Total Return Fund | | | 168,604,398 | | | | 4,458,555 | | | | (4,644,433 | ) | | | (185,878 | ) |
Ashmore Emerging Markets Equity Fund | | | 9,002,538 | | | | 645,608 | | | | (654,366 | ) | | | 8,758 | |
Ashmore Emerging Markets Small-Cap Equity Fund | | | 11,067,711 | | | | 1,755,068 | | | | (543,244 | ) | | | 1,211,824 | |
The difference between book basis and tax basis net unrealized appreciation or depreciation is attributable primarily to the tax deferral of losses on wash sales.
8. Distributions to shareholders
The Ashmore Emerging Markets Corporate Debt Fund, Ashmore Emerging Markets Local Currency Bond Fund, Ashmore Emerging Markets Local Currency Fund, Ashmore Emerging Markets Sovereign Debt Fund and Ashmore Emerging Markets Total Return Fund declare distributions of their net investment income daily and pay such distributions monthly. The Ashmore Emerging Markets Equity Fund and Ashmore Emerging Markets Small-Cap Equity Fund declare and pay distributions of their net investment income at least quarterly.
Distributions of net realized capital gains, if any, are declared and paid at least annually. The Funds may also make a special distribution to comply with federal tax requirements. Income dividends and capital gains distributions determined in accordance with federal income tax regulations may differ from U.S. GAAP. Differences between tax regulations and U.S. GAAP may change the fiscal period in which income and capital items are recognized for tax and U.S. GAAP purposes. Examples of events that give rise to timing differences include wash sales, straddles and capital loss carryforwards. Further, the character of investment income and capital gains may be different for certain transactions under the two methods of accounting. Examples of characterization differences include the treatment of foreign currency transactions and swap transactions. As a result, income dividends and capital gain distributions declared during a fiscal period for federal tax purposes may differ significantly from the net investment income and realized capital gain reported on each Fund’s financial statements presented under U.S. GAAP. In general, to the extent that any differences which are permanent in nature result in over distributions to shareholders, the amount of the over distribution may be reported as return of capital. Temporary differences do not require reclassification. See Note 7 for further details.
9. Derivative instruments and hedging activities
FASB ASC Topic 815-10 (“Topic 815-10”), Disclosures about Derivative Instruments and Hedging Activities, improves financial reporting about derivative instruments by requiring enhanced disclosures to enable investors to better understand how and why the Funds use derivative instruments, how these derivative instruments are accounted for and their effects on the Funds’ financial position and results of operations.
89
ASHMORE FUNDS
NOTES TO FINANCIAL STATEMENTS (CONTINUED)
As of April 30, 2012 (Unaudited)
None of the derivatives held in the Funds have been designated as hedging instruments under Topic 815-10. A discussion of the strategies for these derivatives and their counterparty credit risk can be found below.
In accordance with Topic 815-10, the Funds record their trading-related derivative activities on a fair value basis (as described in Note 4). Fair values represent the amount at which the instrument could be exchanged in a current transaction between willing parties, other than in a forced or liquidation sale.
The following disclosures contain information on how and why the Funds use derivative financial instruments; the credit-risk-related contingent features in certain derivative financial instruments; and how derivative financial instruments affect the Funds’ financial position, results of operations and cash flows. The location and fair value of these instruments on the Statements of Assets and Liabilities and the realized, and changes in unrealized, gains and losses on the Statements of Operations, are included in a table in the Schedules of Investments and categorized by type of financial derivative contract.
(a) Options
Each Fund is subject to market risk in the normal course of pursuing its investment objectives. The Funds may enter into options to speculate on the price movements of the financial instrument underlying the option, for use as an economic hedge against certain equity positions held in a Fund’s portfolio holdings or for other investment purposes. Option contracts give a Fund the right, but not the obligation, to buy or sell within a limited time, a financial instrument, commodity or currency at a contracted price that may also be settled in cash, based on differentials between specified indices or prices.
Options written obligate a Fund to buy or sell within a limited time, a financial instrument, commodity or currency at a contracted price that may also be settled in cash, based on differentials between specified indices or prices. Options written by a Fund may expose a Fund to the market risk of an unfavorable change in the financial instrument underlying the written option.
A Fund is exposed to counterparty risk from the potential that a seller of an option contract does not sell or purchase the underlying asset as agreed under the terms of the option contract. The maximum risk of loss from counterparty risk to a Fund holding a put or call option is generally the fair value of the contracts and the premiums paid to purchase its open option contracts. The risk of loss on call options sold by the Funds is potentially unlimited. A Fund considers the credit risk of the intermediary counterparties to its option transactions in evaluating potential credit risk.
Gains and losses associated with the valuation of options are recognized at fair value as the net change in unrealized appreciation/(depreciation) on investments in securities in the Statements of Operations. The premium on purchased put options exercised is subtracted from the proceeds of the sale of the underlying security or foreign currency in determining the realized gain or loss. The premium on purchased call options exercised is added to the cost of the securities or foreign currency purchased. Premiums paid on the purchase of options that expire unexercised are recorded as realized losses and are reflected in net realized gain/(loss) on investments in securities in the Statements of Operations.
As of April 30, 2012, there were no options held in the Funds.
(b) Forward foreign currency exchange contracts
A forward foreign exchange contract involves an obligation to purchase or sell a specific currency at a future date at a price set at the time the contract is made. The Funds may enter into forward foreign currency exchange contracts in connection with settling planned purchases or sales of securities, as part of an investment strategy to protect against uncertainty in the level of future foreign exchange rates in the purchase and sale of securities, or to gain exposure to foreign currencies. All forward foreign currency exchange contracts are valued daily at the applicable exchange rates. Any resulting unrealized gains or losses are recorded in net change in unrealized appreciation/(depreciation) on forward foreign currency exchange contracts in the Statements of Operations. A Fund records realized gains or losses at the time the forward
90
ASHMORE FUNDS
NOTES TO FINANCIAL STATEMENTS (CONTINUED)
As of April 30, 2012 (Unaudited)
foreign exchange contract is offset by entering into a closing transaction with the same counterparty or is extinguished by delivery of the currency. Realized gains or losses, if any, are included in net realized gain/(loss) on forward foreign exchange contracts in the Statements of Operations.
Risks arise upon entering into these contracts from the potential inability of counterparties to meet the terms of their contracts and from unanticipated movements in the value of a foreign currency relative to the U.S. dollar. The contractual amounts of forward foreign currency exchange contracts do not necessarily represent the amounts potentially subject to risk. The measurement of the risks associated with these instruments is meaningful only when all related and offsetting transactions are considered. The Funds bear market risk from changes in foreign currency exchange rates and credit risk if the counterparty fails to perform. Further information on the impact of these positions on the Funds’ financial statements can be found in Note 11.
For the period ended April 30, 2012, the Ashmore Emerging Markets Corporate Debt Fund, Ashmore Emerging Markets Local Currency Bond Fund, Ashmore Emerging Markets Local Currency Fund, Ashmore Emerging Markets Sovereign Debt Fund, Ashmore Emerging Markets Total Return Fund, Ashmore Emerging Markets Equity Fund and Ashmore Emerging Markets Small-Cap Equity Fund had an average contract notional exposure of $4,197,066, $215,202,721, $173,400,667, $77,832, $100,258,065, $112,077, and $5,126, respectively, related to forward foreign currency exchange contracts.
(c) Futures contracts
During the reporting period, certain Funds entered into long (short) futures contracts for hedging purposes. Futures contracts obligate the buyer to take and the seller to make delivery at a future date of a specified quantity of a financial instrument or an amount of cash based on the value of securities indices, commodities or the fair value in U.S. dollars of a foreign currency.
The Funds’ participation in the futures markets involves certain risks, including the imperfect correlation between movements in the price of the futures contracts and movements in the price of the securities hedged or used for cover. Risks may arise from the potential inability of a counterparty to meet the terms of the contract. Credit risk is mitigated to the extent that the exchange on which a particular futures contract is traded assumes the risk of a counterparty defaulting on its obligations under the contract.
At the time the Funds enter into a futures contract, the Funds deposit and maintain as collateral an initial margin with the broker, as required by the exchange on which the transaction is effected. Pursuant to the contract, the Funds agree to receive from or pay to the broker an amount of cash equal to the fluctuation in the value of the contract. Such receipts or payments are determined by the rules of the futures exchange and are known as variation margin. When the contract is closed, the Funds record a realized gain or loss equal to the difference between the value of the contract at the time it was opened and the time it was closed. This amount is included in net realized gain or loss on futures contracts in the Statement of Operations. Any unrealized gains or losses on open futures contracts are included in net change in unrealized appreciation (depreciation) on futures contracts in the Statement of Operations.
For the period ended April 30, 2012, the Ashmore Emerging Markets Local Currency Bond, Ashmore Emerging Markets Sovereign Debt and Ashmore Emerging Markets Total Return Funds had an average notional long (short) exposure of $(124,493), $(1,167,712), and $(2,476,911), respectively, related to futures contracts.
(d) Interest rate swaps
During the reporting period, certain Funds entered into interest rate swaps, which are arrangements between two parties to exchange cash flows based on a notional principal amount, to manage the Funds’ exposure to interest rates. Interest rate swaps are marked to market daily and the change in fair value, if any, is recorded as unrealized gain or loss. Payments made or received are recorded as part of realized gains and losses. Certain Funds could be exposed to credit or market risk due to unfavorable changes in the fluctuation of interest rates or if the counterparty defaults on its obligations to perform.
91
ASHMORE FUNDS
NOTES TO FINANCIAL STATEMENTS (CONTINUED)
As of April 30, 2012 (Unaudited)
Interest rate swaps are recorded at their fair value. The fair value is based on quoted market prices or prices obtained from a third party provider at the date of the Statements of Assets and Liabilities, without any deduction for estimated future selling costs. The periodic payments on the swap agreements entered into by the Funds are reflected in the Statement of Operations within net realized gain/(loss) on interest rate swap contracts. Unrealized gains are reported as an asset and unrealized losses are reported as a liability in the Statements of Assets and Liabilities. Changes in the fair value are reflected in the Statements of Operations within net change in unrealized appreciation/(depreciation) on interest rate swap contracts in the period in which they occur.
For the period ended April 30, 2012, the Ashmore Emerging Markets Local Currency Bond and Ashmore Emerging Markets Total Return Funds had an average notional exposure of $10,675,668 and $12,525,287, respectively, related to interest rate swap contracts.
10. Related parties
Investment management fees
The Trust has an Investment Management Agreement (the “Agreement”) with the Investment Manager, with whom certain officers and directors of the Trust are affiliated, to furnish investment management services to the Funds. Under the terms of the Agreement, the Trust, on behalf of the Funds, compensates the Investment Manager for its investment management services at the following rates, based on each Fund’s average daily net assets:
| | | | |
Fund | | | Rate | |
Ashmore Emerging Markets Corporate Debt Fund | | | 1.15% | |
Ashmore Emerging Markets Local Currency Bond Fund | | | 0.95% | |
Ashmore Emerging Markets Local Currency Fund | | | 0.85% | |
Ashmore Emerging Markets Sovereign Debt Fund | | | 0.90% | |
Ashmore Emerging Markets Total Return Fund | | | 1.00% | |
Ashmore Emerging Markets Equity Fund | | | 1.15% | |
Ashmore Emerging Markets Small-Cap Equity Fund | | | 1.50% | |
The Investment Manager has contractually agreed to waive its fees or reimburse each Fund for other expenses until February 28, 2013, to the extent that total operating expenses (other than acquired fund fees and expenses, interest expenses, taxes, extraordinary expenses and certain credits and offset arrangements) for each class of shares of each Fund exceed the rates in the table below, based on each Fund’s average daily net assets. The expense limitation arrangement may be terminated by the Board at any time.
92
ASHMORE FUNDS
NOTES TO FINANCIAL STATEMENTS (CONTINUED)
As of April 30, 2012 (Unaudited)
| | | | | | |
Fund | | Class A | | Class C | | Institutional
Class |
Ashmore Emerging Markets Corporate Debt Fund | | 1.45% | | 2.20% | | 1.17% |
Ashmore Emerging Markets Local Currency Bond Fund | | 1.25% | | 2.00% | | 0.97% |
Ashmore Emerging Markets Local Currency Fund | | 1.15% | | 1.90% | | 0.87% |
Ashmore Emerging Markets Sovereign Debt Fund | | 1.20% | | 1.95% | | 0.92% |
Ashmore Emerging Markets Total Return Fund | | 1.30% | | 2.05% | | 1.02% |
Ashmore Emerging Markets Equity Fund | | 1.45% | | — | | 1.17% |
Ashmore Emerging Markets Small-Cap Equity Fund | | 1.80% | | — | | 1.52% |
Any such waiver or reimbursement is subject to the Investment Manager’s right to recover amounts waived or reimbursed to the extent actual fees and expenses for a future fiscal period are less than each Fund’s expense limitation cap, provided, however, that the Investment Manager shall only be entitled to recover such amounts waived or reimbursed during the previous three fiscal years. The total accumulated amount subject to recovery in future years is $386,157 for Ashmore Emerging Markets Corporate Debt Fund, $440,235 for Ashmore Emerging Markets Local Currency Bond Fund, $410,456 for Ashmore Emerging Markets Local Currency Fund, $390,168 for Ashmore Emerging Markets Sovereign Debt Fund, $458,081 for Ashmore Emerging Markets Total Return Fund, $259,342 for Ashmore Emerging Markets Equity Fund and $236,467 for Ashmore Emerging Markets Small-Cap Equity Fund.
Subadviser fees
For the services provided, the Investment Manager pays the Subadviser at the following rates, based on each Fund’s average daily net assets:
| | |
Fund | | Institutional
Class |
Ashmore Emerging Markets Equity Fund | | 0.92% |
Ashmore Emerging Markets Small-Cap Equity Fund | | 1.20% |
Distribution fees
The Funds have adopted Amended Plans of Distribution and Servicing Fees pursuant to Rule 12b-1 under the 1940 Act (“Distribution and Servicing Fee Plans”). Under the Distribution and Servicing Fee Plans, each of the Funds may pay fees to the distributor on an ongoing basis as compensation for the services the distributor renders and the expenses it bears in connection with the sale and distribution of Fund shares (“distribution fees”) and/or in connection with personal services rendered to Fund shareholders and the maintenance of shareholder accounts (“servicing fees”). Class A and C shares each have a separate 12b-1 Plan. Class A shares pay only servicing fees. Class C shares pay both distribution and servicing fees. The following table lists the maximum annual rates at which the distribution and/or servicing fees may be paid under each 12b-1 Plan (calculated as a percentage of a Fund’s average daily net assets attributable to the particular class of shares):
| | | | |
| | | Servicing Fee | | Distribution Fee |
Class A shares | | 0.25% | | None |
Class C shares | | 0.25% | | 0.75% |
93
ASHMORE FUNDS
NOTES TO FINANCIAL STATEMENTS (CONTINUED)
As of April 30, 2012 (Unaudited)
Investor Ownership
On November 19, 2010, Ashmore Emerging Markets Corporate Debt Fund, Ashmore Emerging Markets Local Currency Bond Fund, Ashmore Emerging Markets Local Currency Fund, Ashmore Emerging Markets Sovereign Debt Fund and Ashmore Emerging Markets Total Return Fund were seeded. On June 22, 2011, Ashmore Emerging Markets Equity Fund was seeded. On October 4, 2011, Ashmore Emerging Markets Small-Cap Equity Fund was seeded. Each of the Funds was seeded by Ashmore Investments UK Limited, the parent of the Investment Manager. Ashmore Investments UK Limited seeded each Fund with $10 million, except the Ashmore Emerging Markets Total Return Fund, which was seeded with $20 million.
As of April 30, 2012, Ashmore Investments UK Limited owned the following percentages of outstanding shares of each Fund:
| | |
Fund | | Institutional
Class |
Ashmore Emerging Markets Corporate Debt Fund | | 73.72% |
Ashmore Emerging Markets Local Currency Bond Fund | | 15.88% |
Ashmore Emerging Markets Local Currency Fund | | 16.85% |
Ashmore Emerging Markets Sovereign Debt Fund | | 33.81% |
Ashmore Emerging Markets Total Return Fund | | 11.12% |
Ashmore Emerging Markets Equity Fund | | 68.02% |
Ashmore Emerging Markets Small-Cap Equity Fund | | 99.96% |
In addition to the Ashmore Investments UK Limited ownership, shown in the table above, the following Funds had other investors owning greater than 5% of the outstanding shares of such Funds: one investor owned 100.00% of the outstanding shares of the Ashmore Emerging Markets Corporate Debt Fund - Class A and Class C, one investor owned 10.78% of the outstanding shares of the Ashmore Emerging Markets Corporate Debt Fund - Institutional Class, one investor owned 100.00% of the outstanding shares of the Ashmore Emerging Markets Local Currency Fund - Class A and Class C, three investors each owned 43.66%, 9.75% and 8.60%, respectively, of the outstanding shares of the Ashmore Emerging Markets Local Currency Fund - Institutional Class, one investor owned 99.66% of the outstanding shares of the Ashmore Emerging Markets Local Currency Bond Fund - Class A, one investor owned 100.00% of the outstanding shares of the Ashmore Emerging Markets Local Currency Bond Fund - Class C, three investors each owned 36.95%, 31.33% and 12.61%, respectively, of the outstanding shares of the Ashmore Emerging Markets Local Currency Bond Fund - Institutional Class, one investor owned 100.00% of the outstanding shares of the Ashmore Emerging Markets Sovereign Debt Fund - Class A and Class C, one investor owned 66.19% of the outstanding shares of the Ashmore Emerging Markets Sovereign Debt Fund - Institutional Class, two investors each owned 87.99% and 10.25%, respectively, of the outstanding shares of the Ashmore Emerging Markets Total Return Fund - Class A, one investor owned 100.00% of the outstanding shares of the Ashmore Emerging Markets Total Return Fund - Class C, four investors each owned 48.10%, 12.82%, 9.17% and 8.08%, respectively, of the outstanding shares of the Ashmore Emerging Markets Total Return Fund – Institutional Class, one investor owned 100.00% of the outstanding shares of the Ashmore Emerging Markets Equity Fund - Class A, three investors owned 16.91%, 10.02% and 5.01%, respectively, of the outstanding shares of the Ashmore Emerging Markets Equity Fund – Institutional Class, and one investor owned 100.00% of the outstanding shares of the Ashmore Emerging Markets Small-Cap Equity Fund - Class A.
94
ASHMORE FUNDS
NOTES TO FINANCIAL STATEMENTS (CONTINUED)
As of April 30, 2012 (Unaudited)
11. Financial instruments with off-balance sheet risk and concentration of credit risk
Derivative financial instruments may result in off-balance sheet market and credit risk. Market risk is the possibility that future changes in market price may make a financial instrument less valuable. If the markets should move against one or more positions that the Funds hold, the Funds could incur losses greater than the unrealized amounts recorded in the Statements of Assets and Liabilities.
Credit risk is the risk that the counterparty will default and fail to fulfill the terms of the agreement.
Derivative risk exposures are discussed in Note 9.
12. Recent accounting pronouncements
On May 12, 2011, the FASB issued ASU No. 2011-04, Fair Value Measurement: Amendments to Achieve Common Fair Value Measurement and Disclosure Requirements in U.S. GAAP and IFRSs (“ASU 2011-04”), modifying ASC 820. At the same time, the International Accounting Standards Board (“IASB”) issued International Financial Reporting Standard (“IFRS”) 13, Fair Value Measurement. The objective of the FASB and IASB is the convergence of their guidance on fair value measurements and disclosures. Specifically, ASU 2011-04 requires reporting entities to disclose 1) the amounts of and reasons for any transfers between Level 1 and Level 2, and 2) for Level 3 fair value measurements: a) quantitative information about significant unobservable inputs used, b) a description of the valuation procedures used by the reporting entity, and c) a narrative description of the sensitivity of the fair value measurement to changes in unobservable inputs if a change in those inputs might result in a significantly higher or lower fair value measurement. The effective date of ASU 2011-04 is for interim and annual periods beginning after December 15, 2011. At this time, the Funds’ management is evaluating the implications of this requirement and the impact it will have on the Funds’ financial statement disclosures.
In December 2011, the FASB issued ASU No. 2011-11, Disclosures about Offsetting Assets and Liabilities (“ASU 2011-11”). These disclosure requirements are intended to help investors and other financial statement users to better assess the effect or potential effect of offsetting arrangements on a company’s financial position. They also improve transparency in the reporting of how companies mitigate credit risk, including the disclosure of related collateral pledged or received. In addition, ASU 2011-11 facilitates comparison between those reporting entities that prepare their financial statements on the basis of U.S. GAAP and those reporting entities that prepare their financial statements on the basis of IFRS. Specifically, ASU 2011-11 requires reporting entities to disclose 1) both gross and net information about both instruments and transactions eligible for offset in the financial statements and 2) to disclose instruments and transactions subject to an agreement similar to a master netting agreement. The effective date of ASU 2011-11 is for interim and annual periods beginning on or after January 1, 2013. At this time, the Funds’ management is evaluating the implications of this requirement and the impact it will have on the Funds’ financial statement disclosures.
13. Subsequent events
Management has evaluated subsequent events for the Funds through the date the financial statements were issued, and has concluded that there are no recognized or non-recognized subsequent events relevant for financial statement disclosure.
95
ASHMORE FUNDS
FOR MORE INFORMATION
As of April 30, 2012
PORTFOLIO HOLDINGS
The Ashmore Funds files their complete schedule of portfolio holdings with the Securities and Exchange Commission (“SEC”) for the first and third quarters of each fiscal year on Form N-Q. The Funds’ Forms N-Q are available on the SEC’s Web site at www.sec.gov. You may also review and obtain copies at the SEC’s Public Reference Room in Washington D.C. Information about the Public Reference Room may be obtained by calling 800-SEC-0330.
PROXY VOTING
Ashmore Funds’ Proxy Voting Policies and Procedures and each Fund’s portfolio securities voting record for the most recent 12-month period ended June 30 are available upon request and without charge by visiting the Ashmore Funds’ Web site at www.ashmoregroup.com or the SEC’s Web site at www.sec.gov or by calling 866-876-8294.
96
ASHMORE FUNDS
PRIVACY POLICY
We consider customer privacy to be a fundamental aspect of our relationships with shareholders and are committed to maintaining the confidentiality, integrity and security of our current, prospective and former shareholders’ personal information. To ensure our shareholders’ privacy, we have developed policies that are designed to protect this confidentiality, while allowing shareholders’ needs to be served.
Obtaining Personal Information In the course of providing shareholders with products and services, we may obtain non-public personal information about shareholders, which may come from sources such as account applications and other forms, from other written, electronic or verbal correspondence, from shareholder transactions, from a shareholder’s brokerage or financial advisory firm, financial adviser or consultant, and/or from information captured on our internet web sites.
Respecting Your Privacy As a matter of policy, we do not disclose any personal or account information provided by shareholders or gathered by us to non-affiliated third parties, except as required for our everyday business purposes, such as to process transactions or service a shareholder’s account, or as otherwise permitted by law. As is common in the industry, non-affiliated companies may from time to time be used to provide certain services, such as preparing and mailing prospectuses, reports, account statements and other information, and gathering shareholder proxies. We may also retain non-affiliated financial services providers to market our shares or products and we may enter into joint-marketing arrangements with them and other financial companies. We may also retain marketing and research service firms to conduct research on shareholder satisfaction. These companies may have access to a shareholder’s personal and account information, but are permitted to use this information solely to provide the specific service or as otherwise permitted by law. We may also provide a shareholder’s personal and account information to their respective brokerage or financial advisory firm, Custodian, and/or to their financial advisor or consultant.
Sharing Information with Third Parties We reserve the right to disclose or report personal information to non-affiliated third parties where we believe in good faith that disclosure is required under law to cooperate with regulators or law enforcement authorities, to protect our rights or property or upon reasonable request by any investee entity in which a shareholder has chosen to invest. Of course, we may also share your information with your consent.
Sharing Information with Affiliates We may share shareholder information with our affiliates in connection with our affiliates’ everyday business purposes, such as servicing a shareholder’s account, but our affiliates may not use this information to market products and services to you except in conformance with applicable laws or regulations. The information we share includes information about our experiences and transactions with a shareholder and may include, for example, a shareholder’s participation in one of the Funds or in other investment programs, a shareholder’s ownership of certain types of accounts, or other data about a shareholder’s transactions or accounts. Our affiliates, in turn, are not permitted to share shareholder information with non-affiliated entities, except as required or permitted by law.
Procedures to Safeguard Private Information We take seriously the obligation to safeguard shareholder non-public personal information. In addition to this policy, we have also implemented procedures that are designed to restrict access to a shareholder’s non-public personal information only to internal personnel who need to know that information in order to provide products or services to such shareholders. In addition, we have physical, electronic, and procedural safeguards in place to guard a shareholder’s non-public personal information.
Disposal of Confidential Records We will dispose of records, if any, that are knowingly derived from data received from a consumer reporting agency regarding a shareholder that is an individual in a manner that ensures the confidentiality of the data is maintained. Such records include, among other things, copies of consumer reports and notes of conversations with individuals at consumer reporting agencies.
97
ASHMORE FUNDS
OTHER INFORMATION
Administrator, Custodian and Transfer Agent
The Northern Trust Company
50 South LaSalle Street
Chicago, Illinois 60603
312-630-6000
Investment Manager
Ashmore Investment Management Limited
61 Aldwych
London WC2B 4AE
United Kingdom
44-20-3077-6000
Subadviser for Ashmore Emerging Markets Equity Fund
and Ashmore Emerging Markets Small-Cap Equity Fund
Ashmore EMM, LLC
1001 19th Street North, 17th Floor
Arlington, Virginia 22209-1722
Distributor
Ashmore Investment Management (US) Corporation
122 East 42nd Street
New York, New York 10168
212-661-0061
Legal Counsel
Ropes & Gray LLP
Prudential Tower
800 Boylston Street
Boston, Massachusetts 02199
617-951-7000
98
Item 2. Code of Ethics.
Not applicable for this reporting period.
Item 3. Audit Committee Financial Expert.
Not applicable for this reporting period.
Item 4. Principal Accountant Fees and Services.
Not applicable for this reporting period.
Item 5. Audit Committee of Listed Registrants.
Not applicable.
Item 6. Investments.
| (a) | The registrant has elected to include the schedule of investments in securities of unaffiliated issuers as part of the report to shareholders filed under Item 1 of this report on Form N-CSR. |
Item 7. Disclosure of Proxy Voting Policies and Procedures for Closed-End Management Investment Companies.
Not applicable.
Item 8. Portfolio Managers of Closed-End Management Investment Companies.
Not applicable.
Item 9. Purchases of Equity Securities by Closed-End Management Investment Company and Affiliated Purchasers.
Not applicable.
Item 10. Submission of Matters to a Vote of Security Holders.
There have been no material changes to the procedures by which shareholders may recommend nominees to the registrant’s Board of Trustees.
Item 11. Controls and Procedures.
| (a) | The registrant’s principal executive and principal financial officers, or persons performing similar functions, have concluded that the registrant’s disclosure controls and procedures (as defined in Rule 30a-3(c) under the Investment Company Act of 1940, as amended (the “1940 Act”)) are effective, based on the evaluation of these controls and procedures required by Rule 30a-3(b) under the 1940 Act and Rules 13a-15(b) or 15d-15(b) under the Securities Exchange Act of 1934 as of a date within 90 days of the filing date of this report. |
| (b) | There were no changes in the registrant’s internal control over financial reporting (as defined in Rule 30a-3(d) under the 1940 Act) that occurred during the second fiscal quarter of the period covered by this report that have materially affected, or are reasonably likely to materially affect, the registrant’s internal control over financial reporting. |
Item 12. Exhibits.
| | |
| (a)(1) | | Not applicable for this reporting period. |
| | |
| (a)(2) | | Exhibit 99.CERT: Certifications pursuant to Section 302 of the Sarbanes-Oxley Act of 2002. |
| | |
| (b) | | Exhibit 99.906 CERT: Certifications pursuant to Section 906 of the Sarbanes-Oxley Act of 2002. |
SIGNATURES
Pursuant to the requirements of the Securities Exchange Act of 1934 and the Investment Company Act of 1940, the registrant has duly caused this report to be signed on its behalf by the undersigned, thereunto duly authorized.
| | |
| Ashmore Funds |
| |
| By | | /s/ George Grunebaum |
| | George Grunebaum, President and Chief Executive Officer |
| | (Principal Executive Officer) |
Date: July 6, 2012
Pursuant to the requirements of the Securities Exchange Act of 1934 and the Investment Company Act of 1940, this report has been signed below by the following persons on behalf of the registrant and in the capacities and on the dates indicated.
| | |
| By | | /s/ George Grunebaum |
| | George Grunebaum, President and Chief Executive Officer |
| | (Principal Executive Officer) |
Date: July 6, 2012
| | |
| By | | /s/ Chris Tsutsui |
| | Chris Tsutsui, Treasurer |
| | (Principal Financial and Accounting Officer) |
Date: July 6, 2012