Exhibit 99.2
1 Cleansing Materials November 18, 2024
2 Disc l aimer By attending this presentation or otherwise viewing this presentation, or by reading the presentation slides or by accepting delivery of this document, you agree to be bound by the following limitations. This document andthe information contained herein (the “Material”) are being made available on a strictly confidentialbasis in accordance with the terms of the confidentiality agreement dated August 7, 2024 (the “Confidentiality Agreement”) between Spi rit Airlines, Inc. (the “Company”) andcertain members of the Ad Hoc Group of holders of Loyalty Notes issued by the Company. Certain portions of the Ma terial constitute “Confidential Information” pursuant to the Confidentiality Agreement and may not be reproduced or redistrib uted, in whole or in part, to any other person, including, without limitation, by email or any other means of electronic communication, to the extent set forth in the Confidentiality Agreement. The Material includes certain information regarding the Company andits affiliates that has not been publicly disclosed. You are reminded of your obligations under the Confidentiality Agreement (i) not to disclose such information (or the fact of this presentation and the related discussions) to any person outside your organization or to others within your organization to the extent required by the Confidentiality Agreement and except as permitted by the Confidentiality Agreement. No representation or warranty, express or implied, is made as to the accuracy or completeness of such informationand nothing contained herein is, or shall be relied upon as, a representation, whether as to the past, the present or the future. These materials were designed for use by specific persons familiar with the business and affairs of the Company. These materials are not intended to provide the sole basis for evaluating, andshould not be considered a recommendation with respect to, any transaction or other matter. All information included in these materials is subject to material change in all respects. This presentation does not constitute an offer to sell or a solicitation of an offer to buy any securities, nor shall there be any sale of securities in any jurisdiction in which such offer, solicitation or sale would be unlawful prior to the registration or qualification of such securities under the securities law of any such jurisdiction. Securities may not be offered or sold in the United States absent registration with the Securities and Exchange Commission (the “SEC'') or an exemption from such registration. Under no circumstances is this presentation or the information contained herein to be construed as a prospectus, offering memorandum, advertisement or commitment to arrange any financing for any transaction, and neither any part of this written or oral presentation nor any information or statement contained herein or therein shall form the basis of or be relied upon in connection with any contract or commitment whatsoever. No legally binding obligations will be created, implied, or inferred until definitive agreements with respect to the potential transaction, if any, are executed and delivered by all parties thereto. Without limiting the foregoing, until that event, no agr eement shall exist and there shall be no obligations whatsoever based on such things as extended negotiations, “handshakes,” oral understandings, or courses of conduct (including reliance and changes of position). In making any future investment decision, you must rely on your own examination of the Company, including the merits and risks involved. This presentation should not be construed as financial, legal, tax, accounting, investment or other advice or a recommendation with respect to any potential investment. You should consult your own advisors as needed to make any potential investment decision and determine whether it is legally permitted to make such an investment under applicable legal investment, securities or similar laws or regulations. Forward - Looking Statements in this presentation and certain oral statements made from time to time by representatives of the Company contain various forward - looking statements within the meaning of Section 27A of the Securities Act of 1933, as amended (the Securities Act), and Section 21E of the Securities Exchange Act of 1934, as amended (the Exchange Act) which are subject to the “safe harbor” crea ted by those sections. Forward - looking statements are based on our management’s beliefs and assumptions and on information currentl y available to our management. All statements other than statements of historical facts are “forward - looking statements” for purposes of these prov isions. In some cases, you can identify forward - looking statements by terms such as “may,” “will,” “should,” “could,” “would,” “expect,” “plan,” “anticipate,” “believe,” “estimate,” “project,” “predict,” “potential,” and similar expressions intended to identify forward - looking statements. Forward - looking statements include statements regarding the Company’s intentions and expectations regarding revenues, cash le vels, capacity and passenger demand, additional financing, capital spending, operating costs and expenses, pre - tax income, pre - tax margin, taxes, hiring and furloughs, aircraft deliveries, stakeholders, negotiations and settlement with Pratt & Whitney regarding neo engine availability issues, resolving outstanding indebtedness, vendors and government support. Such forward - looking statements are subject to risks, uncertainties and other important factors that could cause actual results and the timing of certain events to differ materially from future results expressed or implied by such forward - looking statements. Factors include, among others, results of operations andfinancial condition, the competitive environment in our industry, our ability to keep costs low and the impact of worldwide economic conditions, including the impact of economic cycles or downturns on customer travel behavior and other factors, as described in the Company’s filings with the Securities and Exchan ge Commission, including the detailed factors discussed under the heading “Risk Factors” in the Company’s Annual Report on Form 10 - K for the fiscal year ended December 31, 2023, as supplemented in the Company's Quarterly Report on Form 10 - Q for the fiscal quarters ended March 31, 2024 and June 30, 2024. Furthermore, such forward - looking statements speak only as of the date of this presentation. Except as required by law, we undertake no obligation to update any forward - looking statements to reflect events or circumstances after the date of such statements. Risks or uncertainties (i) that are not currently known to us, (ii) that we currently deem to be immaterial, or (iii) that could apply to any company, could also materially adversely affect our business, financial condition, or future results. Additional information concerning certain factors is contained in the Company's Securities and Exchange Commissionfilings, including but not limited to the Company's Annual Report on Form 10 - K, Quarterly Reports on Form 10 - Q, and Current Reports on Form 8 - K. We have presented certain financial and other informationas of or for the year ended December 31, 2019 given the extraordinary impact of the COVID - 19 pandemic on our business in fiscal 2020. We believe that this information provides investors with better information regarding our business performance under normal operating and market conditions. All forward - looking statements attributable to us or persons acting on our behalf are expressly qualified in their entirety by the cautionary statements set forth or referred to above. Forward - looking statements speak only as of the date of this presentation. You should not put undue reliance on any forward - looking statements. Non - GAAP Financial Information: The Company has used non - GAAP financial measures in this presentation, including Adjusted EBITDAR, Adjusted EBITDAR Margin, Adjusted CASM and CASM ex Fuel. Adjusted financial measures refer to financial information adjusted to exclude from financial measures prepared in accordance with accounting principles generally accepted in the United States ("GAAP") items identified in this presentation. The Company believes that the presentation of adjusted financial results provides additional informationon comparisons between periods including underlying trends of its business by excluding certain items that affect overall comparability. The non - GAAP financial measures contained herein have limitations as analytical tools and should not be considered in isolation or in lieu of an analysis of our results as reported under U.S. GAAP. These non - GAAP measures should be evaluated only on a supplementary basis in connection with our U.S. GAAP results, including those reported in our consolidated financial statements and related notes thereto contained in our Annual Report on Form 10 - K for the years ended December 31, 2023, December 31, 2022 and December 31, 2021.

3 Spirit Overview Industry Overview Project Bravo Appendi x 1 Executive Summary 2 3 4 Table of Contents

4 Executive Leadership Team EXPERIENCED MANAGEMENT TEAM WITH DEEP AIRLINE INDUSTRY EXPERTISE Rana Ghosh Senior VP & CTO Rocky Wiggins Senior VP & CIO Matthew Klein Executive VP & CCO John Bendoraitis Executive VP & COO Fred Cromer Executive VP & CFO Thomas Canfield Senior VP & GC Ted Christie President & CEO • Spirit’s Senior VP, GC and Secretary since October 2007 • Prior to Spirit, worked as general counsel or board member at telecom, defense and space companies • 16+ years of industry experience • Spirit’s Senior VP and Chief Transformation Officer • Prior to this position, since 2015, served as VP of Omnichannel, Ancillary Revenue and Guest Care and as Head of e - Commerce • 8+ years of industry experience • Spirit’s Senior VP & Chief Information Officer since September 2016 • Prior experience at WestJet, Sun Country, AirTran and US Airways • 44+ years of travel industry experience • Spirit’s Executive VP & Chief Commercial Officer since December 2019 • Prior to this position, since 2016, served as Spirit’s Senior VP & Chief Commercial Officer • Previously held roles at several other airlines, including AirTran and US Airways • 29+ years of industry experience • Spirit’s Executive VP & Chief Operating Officer since December 2017 • Prior to this position, since 2013 , served as Spirit’s Senior VP and Chief Operating Officer • Prior experience at Frontier Airlines, Comair and Compass Airlines • 18+ years of industry experience • Spirit’s Executive VP & CFO since July 2024 • Prior to Spirit, worked as CEO and CFO of Xwing • Prior experience at Bombardier, International Lease Finance Corporation and ExpressJet Airlines • 31+ years of industry experience • Spirit’s CEO since January 2019 • Prior to this position, Ted served as Spirit’s President and, since 2012, as CFO • Prior experience at Pinnacle Airlines and Frontier Airlines • 21+ years of industry experience Supported by a highly experienced operational team

5 Situation Overview • Spirit Airlines, Inc. (“Spirit” or the “Company”) is the seventh largest carrier in the United States with a core customer base of domestic leisure and VFR (1) travelers and operations in the largest U.S. metro markets and several large U.S. and LATAM leisure markets • In 2023, Spirit generated $5.4 billion in Net Revenue and $316 million in Adj. EBITDAR (2) , with approximately 300,000 departures • In March 2023, the Department of Justice sued to block the Company’s proposed merger with JetBlue citing the potentially anticompetitive nature of the transaction. In January 2024, a federal court permanently enjoined the proposed merger. Spirit and JetBlue mutually agreed to terminate their merger agreement in March 2024. • Since mid - 2023, Spirit has spent significant time preparing its plan for a standalone business in the absence of a merger • In the post - pandemic period, and since the initial agreement of the JetBlue merger in July 2022, the U.S. airline industry has seen material change as a result of shifting customer demand and operating headwinds – The supply of low - fare offerings from non - ULCC carriers has materially increased alongside a shift in demand for more ‘premium leisure’ offerings – Business travel through 2023 had not fully returned to pre - COVID volumes increasing capacity for leisure travel – Inflationary headwinds have driven increases in unit costs for all airlines, disproportionately affecting margins for low - fare carriers – OEM production issues and equipment recalls (e.g., ongoing 737 MAX revisions and delivery deferrals, Pratt & Whitney powder metal defects, etc.) have introduced significant capacity constraints and downtime for U.S. carriers • In light of these market dynamics, Spirit has embarked upon a comprehensive strategic transformation to improve the Company’s financial profile and re - align its business model to adapt to the revised customer and competitive landscape, referred to herein as “ Project Bravo ” • Several key steps have already been taken or are being evaluated to bolster the Company’s liquidity as part of Project Bravo, with an estimated 2024 benefit of greater than $1 billion; key actions include: (i) January sale - leasebacks, (ii) JetBlue termination fee, (iii) reduced PDP commitments, (iv) agreement with Pratt & Whitney for GTF issues (v) direct lease and PDP transactions and (vi) continued evaluation of normal course asset financing Source: Company filings Notes: (1) Visiting friends and relatives; (2) Adj. EBITDAR is a non - GAAP measure

6 Introducing Project Bravo Spirit has embarked on a comprehensive turnaround initiative, which has the goal of re - aligning Spirit’s business model to evolved customer needs, while maintaining Spirit’s significant unit cost advantage Ensure sufficient capital is available to invest in Project Bravo Reallocation of working capital from growth to product/brand enhancements Liquidity Enhancements Maintain Industry Cost Advantage Realign labor force and infrastructure to match current level of capacity production Minimal impact to industry leading unit cost structure Gue st Experience Pivot network to support improved operational reliability and supply / demand balance in new “Focus” markets N e t w o r k Enhancements Evolve the legacy ULCC product to compete more broadly with OAs, enhancing each guest touchpoint to address changing consumer preferences Comm u n i c a t i o n Pl a n Revamp marketing efforts in light of transformation; improve public brand image to match operational reality and value proposition
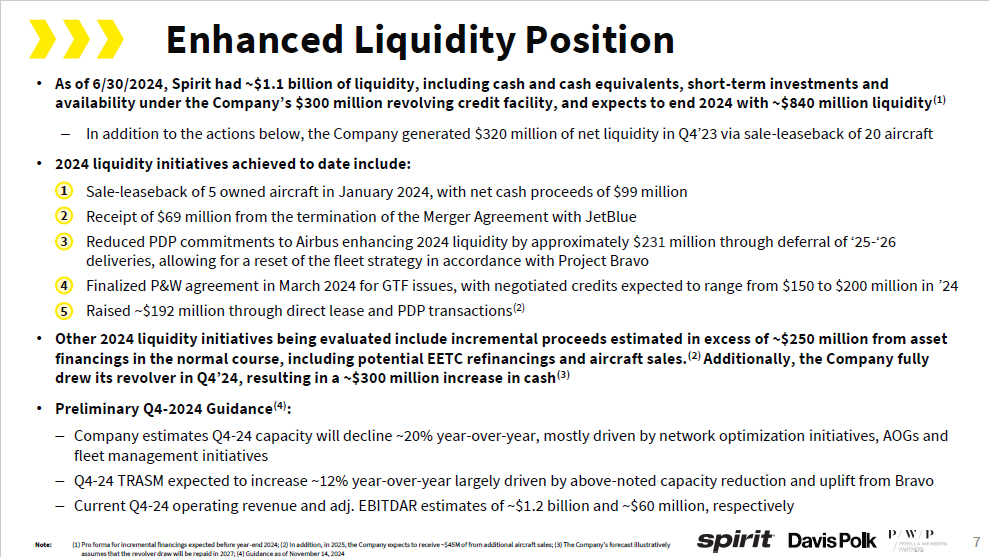
7 • As of 6/30/2024, Spirit had ~$1.1 billion of liquidity, including cash and cash equivalents, short - term investments and availability under the Company’s $300 million revolving credit facility, and expects to end 2024 with ~$840 million liquidity (1) – In addition to the actions below, the Company generated $320 million of net liquidity in Q4’23 via sale - leaseback of 20 aircraft • 2024 liquidity initiatives achieved to date include: Sale - leaseback of 5 owned aircraft in January 2024, with net cash proceeds of $99 million Receipt of $69 million from the termination of the Merger Agreement with JetBlue 1 – 2 – N o te: (1) Pro forma for incremental financings expected before year - end 2024; (2) In addition, in 2025, the Company expects to receive ~$45M of from additional aircraft sales; (3) The Company’s forecast illustratively assumes that the revolver draw will be repaid in 2027; (4) Guidance as of November 14, 2024 3 – Reduced PDP commitments to Airbus enhancing 2024 liquidity by approximately $ 231 million through deferral of ‘25 - ‘26 deliveries, allowing for a reset of the fleet strategy in accordance with Project Bravo 4 – Finalized P&W agreement in March 2024 for GTF issues, with negotiated credits expected to range from $150 to $200 million in ’24 5 – Raised ~$192 million through direct lease and PDP transactions (2) • Other 2024 liquidity initiatives being evaluated include incremental proceeds estimated in excess of ~$250 million from asset financings in the normal course, including potential EETC refinancings and aircraft sales. (2) Additionally, the Company fully drew its revolver in Q4’24, resulting in a ~$300 million increase in cash (3) • Preliminary Q4 - 2024 Guidance (4) : – Company estimates Q4 - 24 capacity will decline ~20% year - over - year, mostly driven by network optimization initiatives, AOGs and fleet management initiatives – Q4 - 24 TRASM expected to increase ~12% year - over - year largely driven by above - noted capacity reduction and uplift from Bravo – Current Q4 - 24 operating revenue and adj. EBITDAR estimates of ~$1.2 billion and ~$60 million, respectively Enhanced Liquidity Position
8 Spirit Overview Industry Overview Project Bravo Appendi x 1 Executive Summary 2 3 4 Table of Contents

9 All Airbus Fleet (Among Youngest in Industry) Strong Operational Reliability Nationwide Network with Valuable Real Estate in High Volume Airports Flexibility to Mitigate Impacts of Industry Headwinds Among the Lowest Unit Costs in Industry Enhanced Liquidity Provides Buffer While Executing on Road to Profitability 1 2 Compelling Value Proposition for VFR and Leisure Customers 3 4 5 7 6 Key Credit Strengths

10 56.1B Available Seat Miles 7.8% Growth (YoY) • Seventh largest carrier in the United States, offering low fares to value - conscious customers • Broad, largely domestic network focused on point - to - point flying for cost efficiency and operational flexibility • Large domestic network; service to 24 of the top 25 U.S. metros and many large U.S. leisure markets • Leisure / VFR customer base All - Airbus Fleet is One of Youngest in Industry Company Overview 313 Markets Served by 83 Airports Across the U . S . , the Caribbean and Latin America ( 2 ) Nearly 800 Daily Flights (2) 201 A320 Family Aircraft (1) Spirit is a Leading, Low - Cost U.S. Airline $5.1B Revenue 7.1% Decrease YoY 7.23¢ Adj. CASMx Among Industry Leaders Key Strategic Priorities Pivot network to improve operational reliability and supply / demand balance Enhance guest touchpoints to address changing consumer preferences, negative image Repair balance sheet and find solution for near - dated maturities Revamp marketing efforts and value proposition in light of business transformation 5.6 Years Average Fleet Age (2) KEY LTM Q2 - 24 FINANCIAL STATS Operational Highlights N o te: (1) As of 6/30/2024; excludes A319ceo aircraft that will exit fleet by Spring 2025 (2) As of 3/31/2024; fleet age excludes A319ceos set to exit fleet

11 Everyday Low Fares Flights To and From Top Destinations and Major Airports Young Fleet with Stylish Interiors Excellent and Reliable Service Spirit’s Core Value Proposition: Spirit offers a compelling value proposition, combining strong reliability metrics with low fares and differentiated service levels across all markets served Focus on the VFR & Leisure Customer

12 Seat density Point - to - Point itineraries Very low overhead costs Operate uniform A320 family fleet Fly young, fuel efficient aircraft How Spirit Keeps Costs Down Aircraft utilization
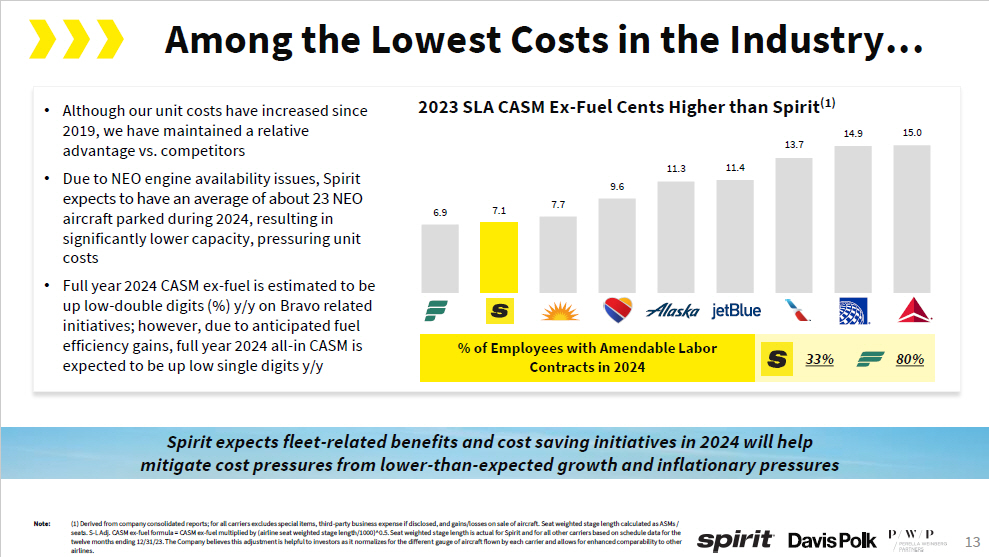
13 Among the Lowest Costs in the Industry… • Although our unit costs have increased since 2019, we have maintained a relative advantage vs. competitors • Due to NEO engine availability issues, Spirit expects to have an average of about 23 NEO aircraft parked during 2024, resulting in significantly lower capacity, pressuring unit costs • Full year 2024 CASM ex - fuel is estimated to be up low - double digits (%) y/y on Bravo related initiatives; however, due to anticipated fuel efficiency gains, full year 2024 all - in CASM is expected to be up low single digits y/y 2023 SLA CASM Ex - Fuel Cents Higher than Spirit (1) Spirit expects fleet - related benefits and cost saving initiatives in 2024 will help mitigate cost pressures from lower - than - expected growth and inflationary pressures 6 . 9 7 . 1 7 . 7 9 . 6 11 .3 11 . 4 13 . 7 14 . 9 15 . 0 % of Employees with Amendable Labor Contracts in 2024 33% 80% N o t e: ( 1 ) Derived from company consolidated reports ; for all carriers excludes special items, third - party business expense if disclosed, and gains/losses on sale of aircraft . Seat weighted stage length calculated as ASMs / seats . S - L Adj . CASM ex - fuel formula = CASM ex - fuel multiplied by (airline seat weighted stage length/ 1000 )^ 0 . 5 . Seat weighted stage length is actual for Spirit and for all other carriers based on schedule data for the twelve months ending 12 / 31 / 23 . The Company believes this adjustment is helpful to investors as it normalizes for the different gauge of aircraft flown by each carrier and allows for enhanced comparability to other airlines .
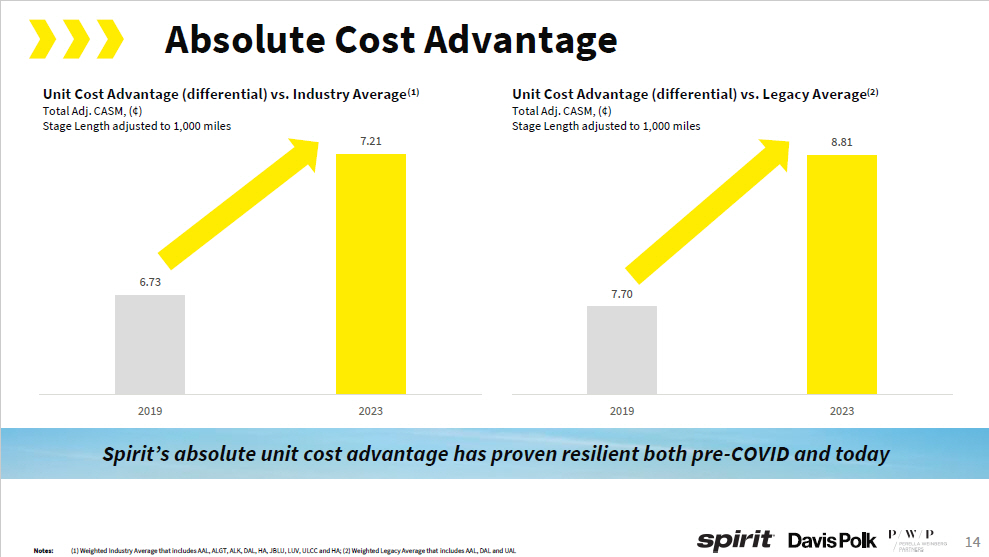
14 Absolute Cost Advantage 7 . 7 0 Unit Cost Advantage (differential) vs. Legacy Average (2) Total Adj. CASM, (¢) Stage Length adjusted to 1,000 miles 8.81 6 . 7 3 Unit Cost Advantage (differential) vs. Industry Average (1) Total Adj. CASM, (¢) Stage Length adjusted to 1,000 miles 7.21 2019 2023 2019 2023 Spirit’s absolute unit cost advantage has proven resilient both pre - COVID and today N o te s : (1) Weighted Industry Average that includes AAL, ALGT, ALK, DAL, HA, JBLU, LUV, ULCC and HA; (2) Weighted Legacy Average that includes AAL, DAL and UAL

15 5 . 6 4.0 11 . 0 12 . 3 12 . 8 12 . 9 14 . 8 15 . 0 15 . 5 16 . 0 Current Fleet Summary – 201 Total Aircraft (1) Premier single - aisle jetliner with short - to - medium - haul capabilities Seating capacity: 182 Seating configuration: 176 Y / 8 BFS Average age: 9.5 years (2) Airbus A320ceo (64) Core aircraft in Spirit’s fleet with industry - leading fuel efficiency Seating capacity: 182 Seating configuration: 176 Y / 8 BFS Average age: 2.8 years (2) Airbus A320neo (91) Largest aircraft for high density routes Seating capacity: 228 Seating configuration: 220 Y / 8 BFS Average age: 7.2 years (2) Airbus A321ceo (30) Largest aircraft for high density routes Seating capacity: 235 Seating configuration: 227 Y / 8 BFS Average age: 0.5 years (2) Airbus A321neo (16) Among the Youngest Fleets in the U.S. (3) Young Uniform Fleet Drives Low Costs • Uniformity allows Spirit to interchange aircraft and flight crews based on route demand and capacity without incurring significant additional costs • Young uniform fleet of A320 family aircraft maximizes cost effective use of facilities while reducing maintenance costs • Higher fuel efficiency for young aircraft lowers operating costs, further enhanced by new A321neo aircraft deliveries in 2024 • Retiring remaining 9 A319 aircraft out of the fleet by 2025 (Average Fleet Age) Young Uniform Airbus Fleet N o te s : (1) As of 6/30/2024; Y = Standard seat; BFS = Big Front Seat; fleet summary excludes A319ceo aircraft that will exit fleet by Spring 2025; (2) Age as of 3/31/2024; (3) All carriers except Spirit based on public filings as of 12/31/2023; Spirit age shown as of 3/31/2024 excluding A319s set to exit the fleet (4) Forecast aircraft at end of period of 202 in 2024, 196 in 2025, 196 in 2026, 209 in 2027 and 208 in 2028; forecasted average AOGs of 20 in 2024, 41 in 2025, 43 in 2026, 32 in 2027 and 22 in 2028
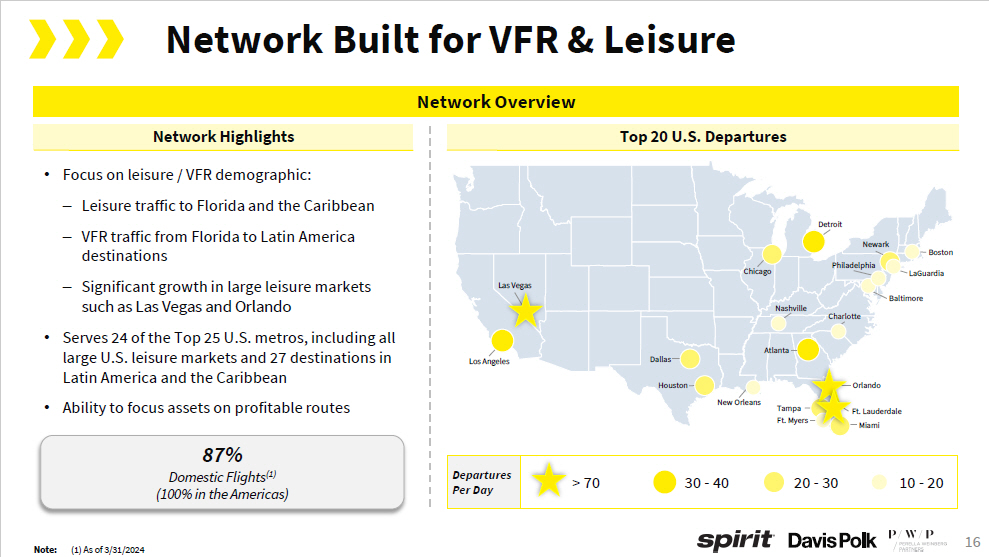
16 87% Domestic Flights (1) (100% in the Americas) Network Built for VFR & Leisure • Focus on leisure / VFR demographic: – Leisure traffic to Florida and the Caribbean – VFR traffic from Florida to Latin America destinations – Significant growth in large leisure markets such as Las Vegas and Orlando • Serves 24 of the Top 25 U . S . metros, including all large U . S . leisure markets and 27 destinations in Latin America and the Caribbean • Ability to focus assets on profitable routes Network Overview Top 20 U.S. Departures Network Highlights 10 - 20 20 - 30 30 - 40 > 70 D e p a r t ures Per Day Las Vegas Los Angeles D a ll a s H o ust on Atlanta N ash vi ll e C h i c a g o C h a r l otte De t r o it O r l a n d o Ft. Lauderdale Miami New Orleans Tampa Ft. Myers B oston Ne wa r k LaGuardia Philadelphia B a l t i m o r e Note: (1) As of 3/31/2024
17 Spirit Overview Industry Overview Project Bravo Appendi x 1 Executive Summary 2 3 4 Table of Contents

18 A S Ms : $58 . 0 $53 . 7 $52 . 8 U.S. Airline Industry Overview Fiscal - Year 2023 Total Revenue | $ in Billions Today, the U.S. airline industry is comprised of nine providers segmented into three distinct operator categories based on fleet size, domestic and international coverage and pricing dynamics $26 . 1 $10 . 4 $9 . 6 $5 . 4 $3 . 6 $2 . 5 277.7B 291.3B 272.0B 68.5B 68.5B 170.3B Legacy Carriers Value Carriers Ultra Low - Cost Carriers 55 . 7 B 37 . 8 B 18 . 8 B Source: Company filings
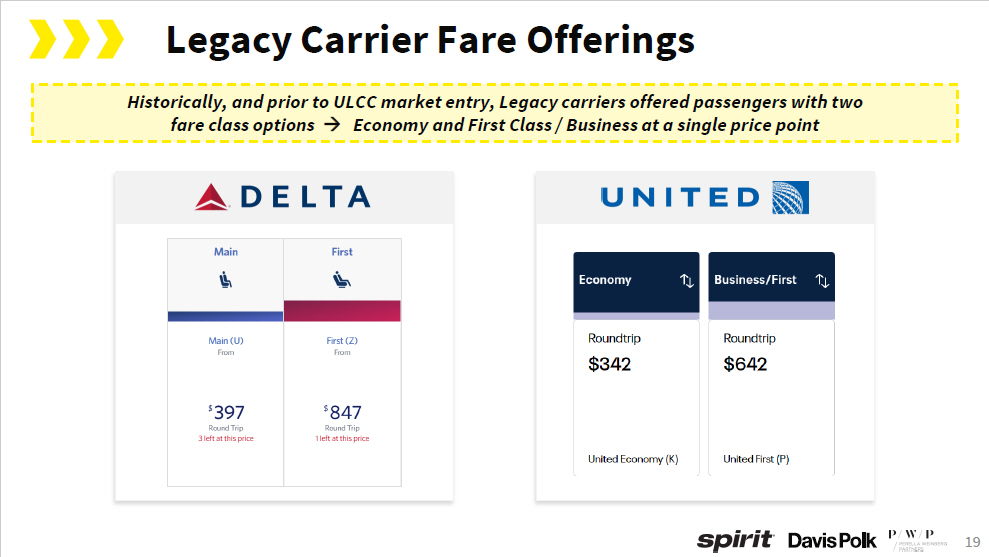
19 Legacy Carrier Fare Offerings Historically, and prior to ULCC market entry, Legacy carriers offered passengers with two fare class options Economy and First Class / Business at a single price point

20 Bundle Offering 2 Bags 3 Seats 4 Flight Availability 1 Spirit’s Unbundled Economy Product • In 2007, Spirit was the first carrier to unbundle the economy product creating a new low base fare offering for price conscious customers with the optionality to purchase ancillary features (e.g., seat selection, on - board amenities, luggage, etc.) for an added fee • In response to market success of ultra low - cost carriers, the ULCC category continued to expand and take market share from Legacy and Value carriers
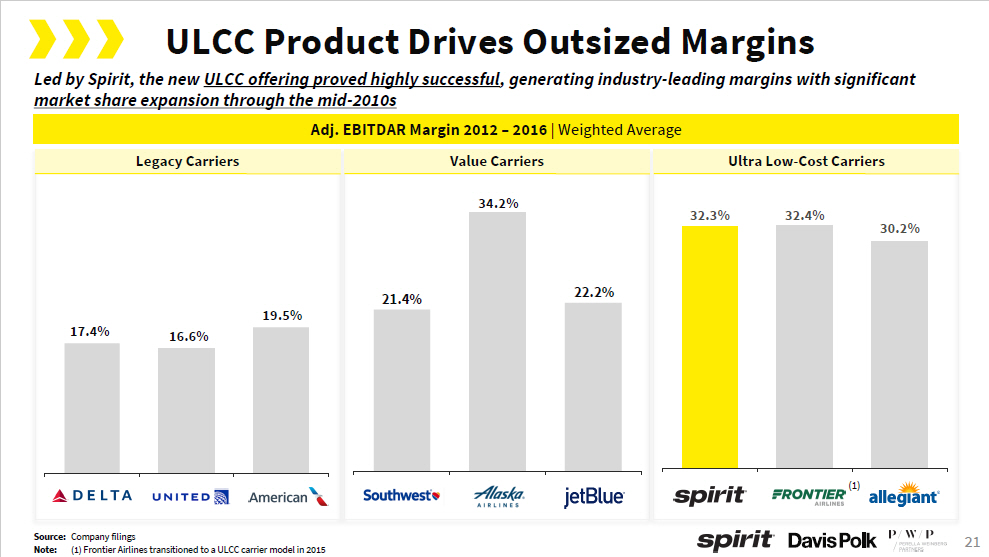
21 ULCC Product Drives Outsized Margins Adj. EBITDAR Margin 2012 – 2016 | Weighted Average Led by Spirit, the new ULCC offering proved highly successful , generating industry - leading margins with significant market share expansion through the mid - 2010s Ultra Low - Cost Carriers Value Carriers Legacy Carriers 32.4% 32.3% 34.2% 30.2% 22.2% 21.4% 19.5% 16.6% 17.4% (1) Source: Company filings Note: (1) Frontier Airlines transitioned to a ULCC carrier model in 2015

22 Market Response to ULCC Market Entry • In 2017, in response to financial pressure from ULCC’s, Legacy carriers revised their business model to bifurcate passenger o fferings into a wider range of fare classes, including an unbundled basic economy offering to match ULCCs • “Value” carriers began to offer a similar suite of unbundled fare classes to mirror larger carrier product offerings Legacy Carriers Value Carriers

23 Adj. EBITDAR Margin 2017 – 2019 | Weighted Average Non - ULCC’s disaggregation of product and class offering to competing directly with ULCCs on base fare began to erode Spirit’s comparative margin advantage Ultra Low - Cost Carriers Margin Advantage Shifts Legacy Carriers Value Carriers The introduction of ‘basic’ and ‘premium’ economy allowed OAs to regain market share from ULCCs with opportunity for up - sell not available under the ULCC model 2.2% 19.6 % (0.3)% 16.4% (2.9)% 16.5% (0.4)% 20.9% ( 12 . 5 ) % 21.7% (3.2)% 18.9% (6.9)% 25 . 4 % (2.3)% 30.2% ( 4 . 4 ) % 25.8% M a rg in increa se since 2012 - 2016 Margin decrease since 2012 - 2016 Source: Company filings

24 COVID Generates Lasting Customer Preference for Premium Leisure Products The COVID pandemic resulted in significant losses across the industry, which is still largely recovering today. Premium leisure demand soared which, in combination with unbundled fare competition, allowed Legacy and Value carriers to compete for an even greater portion of basic economy share “ …what we’ve seen, is the people who got used to it for purpose of travel and now leisure which has been the accelerating part coming out of COVID, they’re buying the premium products.” - Glen Hauenstein, Delta Airlines Dec. 23 “… and that is one of the reasons for the great execution in the quarter, is that we see corporate rebounds in, but we see the desire for premium products by leisure customers continue to be strong.” – Andrew Nocella, United Airlines 1Q24 “ …but we’ve continued to see strength in premium cabin style fares. Our total premium seats across the system are up about 5% year - over - year. Our total premium revenues were up about 15% year - over - year.” – Vasu Raja, American Airlines 2Q23 “ The pandemic clearly created a boom in premium leisure demand that we see today, and these passengers often purchase an upgraded experience. – Andrew Nocella, United Airlines 2Q23

25 Post - COVID Results Favor Legacy Carriers Adj. EBITDAR Margin 2022 – 2023 | Weighted Average Legacy Carriers Value Carriers Ultra Low - Cost Carriers 14 . 6 % 17 . 9 % Margin advantage has re - shifted to favor Legacy and Value carriers that enjoy optionality to attract price - conscious customers while responding to premium leisure demand From 2019 to 2023 a major shift in the domestic market occurred, with ULCC margin profile further contracting (3.0)% 14.4% (6.4)% 13.1% (3.0)% 13.6% ( 10 . 7 ) % 10.6% ( 24 . 5 ) % 7.8% ( 19 . 6 ) % ( 15 . 5 ) % 6.7% ( 18 . 8 ) % 13.6% ( 12 . 3 ) % Margin decrease since 2012 - 2016 Source: Company filings
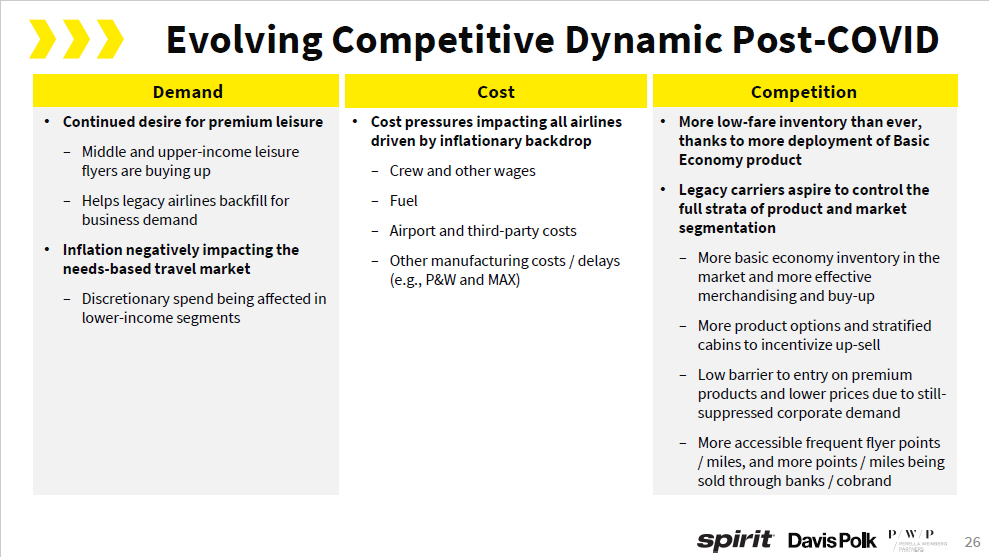
26 Evolving Competitive Dynamic Post - COVID Competition Cost Demand • More low - fare inventory than ever, thanks to more deployment of Basic Economy product • Legacy carriers aspire to control the full strata of product and market segmentation – More basic economy inventory in the market and more effective merchandising and buy - up – More product options and stratified cabins to incentivize up - sell – Low barrier to entry on premium products and lower prices due to still - suppressed corporate demand – More accessible frequent flyer points / miles, and more points / miles being sold through banks / cobrand • Cost pressures impacting all airlines driven by inflationary backdrop – Crew and other wages – Fuel – Airport and third - party costs – Other manufacturing costs / delays (e.g., P&W and MAX) • Continued desire for premium leisure – Middle and upper - income leisure flyers are buying up – Helps legacy airlines backfill for business demand • Inflation negatively impacting the needs - based travel market – Discretionary spend being affected in lower - income segments
27 Spirit Overview Industry Overview Project Bravo Appendi x 1 Executive Summary 2 3 4 Table of Contents
Project Bravo: Comprehensive Transformation Plan

Business Transformation Pressures on the ULCC Model Spirit currently offers the equivalent to a Basic Economy ticket and competes primarily on price Lack of an offering to product - compete across a broader customer set (no real product enticement) Product Brand, product offerings, policies and purchasing process viewed negatively except for those who do not buy ancillaries and/or value the Big Front Seat Opportunity to improve brand / reputation insofar as perception is superior among Spirit fliers vs. non fliers Reputation damaged by past operational issues and high - friction business model Negative Se n t i ment Revenue optimization is elusive given inability to control mix of ancillary vs. fare paid by the passenger Challenge attracting new customers in mature markets ; value proposition in new markets is hampered by touchpoint friction Comm e r c i a l Model Price competition introduced by OAs with higher overall margins means that competitors can more easily enter our market and compete, with Premium Economy subsidizing low Basic Economy fares offered below variable cost This has undermined the ULCC model; few levers are left to reduce cost Cost The Project Bravo Plan x Network pivots to improve operational reliability and supply / demand balance in “Focus” markets x Introduction of premium leisure product x Significant product enhancements to build customer loyalty (e.g., potential Wi - Fi or F&B offering) x Improving Guest Experience to drive greater value and brand perception while maintaining low costs x Reimagined Spirit brand with sufficient marketing to drive Guest engagement x Maintain cost advantage Become the #1 Value Airline in America 29

30 Project Bravo Execution Enhance each guest touchpoint to address changing consumer preferences and brand image Revamp value proposition in light of business transformation Guest Experien ce Comm u n ica t ion Plan Maintain Industry Cost Advantage Realign labor force and infrastructure to match current level of capacity production Minimal impact to industry leading unit cost structure Pivot network to improve operational reliability and supply / demand balance in “Focus” markets Network E n han cements
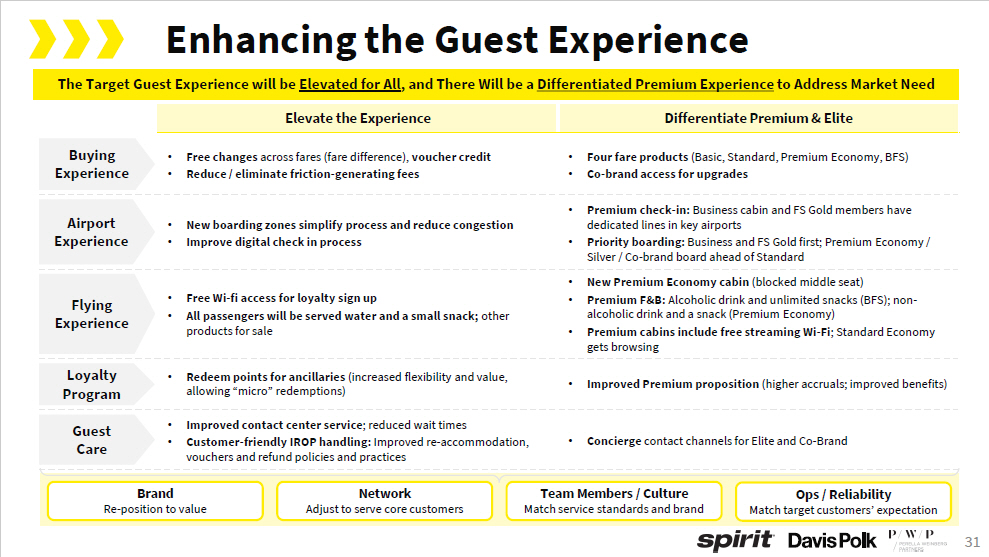
31 Enhancing the Guest Experience The Target Guest Experience will be Elevated for All , and There Will be a Differentiated Premium Experience to Address Market Need Differentiate Premium & Elite Elevate the Experience • Four fare products (Basic, Standard, Premium Economy, BFS) • Co - brand access for upgrades • Free changes across fares (fare difference), voucher credit • Reduce / eliminate friction - generating fees Buying E x per i ence • Premium check - in: Business cabin and FS Gold members have dedicated lines in key airports • Priority boarding: Business and FS Gold first; Premium Economy / Silver / Co - brand board ahead of Standard • New boarding zones simplify process and reduce congestion • Improve digital check in process Airport Experience • New Premium Economy cabin (blocked middle seat) • Premium F&B: Alcoholic drink and unlimited snacks (BFS); non - alcoholic drink and a snack (Premium Economy) • Premium cabins include free streaming Wi - Fi ; Standard Economy gets browsing • Free Wi - fi access for loyalty sign up • All passengers will be served water and a small snack; other products for sale Flying E x per i ence • Improved Premium proposition (higher accruals; improved benefits) • Redeem points for ancillaries (increased flexibility and value, allowing “micro” redemptions) Loyalty P r ogr a m • Concierge contact channels for Elite and Co - Brand • Improved contact center service ; reduced wait times • Customer - friendly IROP handling: Improved re - accommodation, vouchers and refund policies and practices Guest Care Brand Re - position to value Network Adjust to serve core customers Team Members / Culture Match service standards and brand Ops / Reliability Match target customers’ expectation

32 Basic Standard Premium Big Front Seat For purchase Standard selection Stretch seating BFS selection Seat Regular Regular Regular Priority Check - In Final Standard 2 nd Priority 1 st Priority Boarding Not allowed Included Included Included Carry - On For purchase For purchase Included Included Checked Bag Water & small snack Water & small snack Non - alc. drink, sm. snack service Included (any bev / snack) F&B For purchase or loyalty sign up Included (Brow s i ng) Included (S t ream i ng) Included (S t ream i ng) Wi - Fi Available Seat Power Fare difference only Change Refund to 12 - month credit shell Refundability Basic earning & SQPs Standard earning & SQPs Better earning & SQPs Highest earning & SQPs Loyalty Target Expanded Guest Experience

33 9 . 6 ¢ 10 . 9 ¢ (2.8¢ ) 3.0¢ 0.3¢ 0.6¢ 0.1¢ 2023 TRASM Ancillaries Value Carrier / Fare Uplift Network & Pricing C o - B r a n d & Loyalty Other (e.g., P a r t n e r s h i p s ) Pro Forma Run - Rate TRASM The Journey to Becoming the #1 Value Carrier Requires Execution across Pricing, Network, and Marketing Initiatives 1 2 3 4 5 Includes base fare increase and bundling (legacy ancillary) of new product classes Shift away from ancillary fees to fare Bravo Adjusted 2023 TRASM (1) N o te: (1) Assumes full run - rate Bravo revenue impact on 2023 TRASM

34 Summary of TRASM Assumptions TRASM Assumptions Commercial Levers (2.8¢) • Bravo achieves a fare premium of 55% as markets are moderately receptive to the new product (willing to pay more than today, but less than full fare shift potential) • Spirit aligns with the benchmark for value carrier ancillaries (~10% of pax revenues) • PUFs continue to be charged as part of base fare 1 Ancillaries 3.0¢ 2 Fare Uplift 0.3¢ • Spirit redeploys ~25 aircraft to value seeker markets, achieving relevance and pricing premium • Estimated based on increasing share by ~12.5pp in value seeker markets 3 Network & Pricing 0.6¢ • Spirit more - than - doubles its co - brand and loyalty revenues compared to today but remains below value carrier benchmarks (~6% vs. ~2% today. vs. 9%+ for value carrier of similar scale) 4 Co - Brand & Loyalty 0.1¢ • Initiates codeshare agreement with moderately strong partner , resulting in 0.9% of revenue uplift (aligned with median benchmarks) 5 Other (e.g., Partnerships) +1.3¢ Total Unit Revenue Uplift (1) ~$700M Implied Revenue Impact Based on 2023 ASMs N o te: (1) Additive to FY23 fare revenues only (ancillary uplift is not additive to FY23 ancillaries)

Commentary • Transforming guest experience may result in a ~3.8% increase in CASMx – Key incremental expenses to include marketing campaign, Wi - Fi, catering, ground handling, and other product enhancement related charges • Irrespective of Bravo, unit costs expected to increase due to heightened labor expense, among other factors • Pro forma for Bravo, CASM and CASMx to still reside well - below Legacy carriers and LCCs, maintaining Spirit’s cost advantaged status 35 2023 Actual vs. 2025 Target ( Excl. Bravo ) vs. 2025 Target ( Incl. Bravo ) Adj. CASM ex - fuel, (¢); Stage Length adjusted to 1,000 miles 15.0¢ 14.9¢ 13.7¢ 11.4¢ 11.3¢ 9.6¢ ( 1 ) 8.3¢ 8.5¢ Bravo (2025 Target) 7.7¢ 7.1¢ (2023A) 6.9¢ Bravo Modestly Increases CASMx but Maintains Company Advantage N o te: (1) 2025 Target (Excl. Bravo) and 2025 Target (Incl. Bravo) illustratively shown based on same ASMs)

36 Implementation Timeline • Waived change and cancel fees • Standard checked bag weight increase to 50 lbs. • Credit shell extension to 12 mo. • Voucher extension to 12mo., applied to full fare • Reduced / simplified fees • New fare family offering and supporting changes: – Premium "blocked middle seat" – Premium check - in lane (5 stations) – New F&B offerings – Wi - Fi, bags including with some fares – Revised boarding process to recognize premium / loyalty – Loyalty program changes • Launch Bravo brand with campaign • Improved Guest Care support • Revised digital flow across booking / Guest experience • Loyalty / co - brand program updates • Expanded premium check - in experience (top 20 + stations) • Upgraded kiosk / bag drop functionality • Future Saver $ Club strategy • Revised Premium Y cabin (pitch vs . blocked middle) based on cost / demand • In - seat power • Interior changes (bins, lighting) • Network / partner code - share changes 2025 Onward Phase 3 & Beyond Rest of 2024 Phase 2 August 2024 Phase 1 June 2024 Phase 0: Accelerated Launch Marketing Blitz Ongoing efforts to improve operations reliability metrics, the overall guest experience, and value in the loyalty program

37 The New Spirit Model Market Share Our Revised Offering will Move from Price - Conscious Guests to Upmarket Segments with Higher Engagement & Willingness to Pay Value Seekers Market Size Spirit Target Market Share Spirit Current Market Share Spirit Average QSI 14 . 0 % 0.57 0.45 0.35 550 600 650 $ in billions, network - wide as of 4Q 2022 – 3Q 2023 Strategic shift away from low - Enhanced offering targets meaningful expansion into margin fare groups 4.94 higher - dollar fare groups (less than $200) 4.67 3.65 3.82 2.63 2.02 1.99 0.48 50 100 150 200 250 300 350 400 Fare Group ($) 60 . 0% 5 0 . 0% 4 0 . 0% 30 . 0% 20 . 0% 1.21 0 . 84 10 . 0% - % 500 450

38 The New Spirit Model (Cont’d) Spirit estimates it could earn ~13% more revenue per passenger if it is able to successfully rebrand as a higher value carrier in its current markets Revenue per Passenger | 2023 USD, Domestic Segments, Length - of - Haul Neutral $219 $221 $200 $186 $171 $162 $145 $138 $121 $122 Bravo 9.5¢ 9.6¢ 10.9¢ 13.8¢ 15.3¢ 14.0¢ 15.2¢ 18.4¢ 19.0¢ 21.3¢ T R AS M Source: PlaneStats/Form 41, distance - adjusted to 1,000 miles; includes ‘excess bag’, ‘res cxl fees’, and ‘misc rev’ categories

39 Eliminate Unproductive Markets 1 – Nine cities exited or suspended since September 2023 – Carry out strategic retreat from network cities where capacity has outpaced demand Increased “Less than Daily” Flying 3 – Number of “less than daily” routes has increased nearly 70% since April 2023; allows for route expansion at a lower - risk Maximize “Out and Back” Flying 4 – Maintained 70%+ out and back since implementation in April 2022 – Allows for enhanced recovery opportunities with neither aircraft nor crew being “trapped” out of position following disruption Network Enhancements Seasonalized Day / Week Flying 5 – Operate routes during peak seasons when profitability is substantial while limiting or fully removing capacity in off - peak / shoulder periods Drive Higher TRASM through Partnerships 6 – Code - Sharing: sell unique O&Ds using Spirit code but operated by both Spirit and partner airlines – Explore joint ventures and alliances Shift Capacity to Align w/ Current Market Dynamics 2 – Capacity shifted towards more attractive demand / pricing cities – 60+ new routes added while 40 routes exited vs April 2023 Aligning the network to better match the changed market dynamics presents opportunity for significant expansion in Spirit’s existing Loyalty offering to a new customer base

Comprehensive Network Realignment Overview • Redeploy 20 - 30 aircraft (~ 10 - 15 % of fleet) from cities with lowest revenue performance • Relocate aircraft to top value seeker cities in different regions to gain relevance (targeting 50% seat share) – Start with FLL given consistent, high demand during the winter season (i.e., ~4 months from day 1) and highest existing relevance level – Further deployment to additional focus cities in different regions once fleet capacity rebounds (post Q1 ’26) • Achieve stronger pricing power (generally 5 - 10%) in these new cities with market relevance Spirit’s top 5 cities by seats flown in ’23 6 0 % 4 0 % 2 0 % 0% F LL MCO D F W LAS LAX Illustrative revenue run rate timeline % of revenue potential achieved from routes 100% 80% Assume new FLL routes start 4 - 6 months post announcement 0 1 2 3 4 5 6 7 8 9 10 11 12 13 14 15 16 17 18 Months from “Day 1” 40 F LL Add’l waves of redeployment will be paced by fleet growth post Q1‘26 Current Network Network Realignment Maximize value and minimize risk by realigning the fleet for growth in new focus cities • Redeployment of aircraft, with focus on mid - size value - seeking cities • Identification of target markets is in process • Launch in new markets will be phased in and re - evaluated throughout lifecycle to adjust strategies

41 Loyalty Could Drive ~4 - 9% Revenue Uplift (1) • Loyalty programs contribute 10% to 23% of revenue for other airlines • JetBlue earned 8.6% in total revenues from its Co - Brand and Loyalty programs in 2012, when it was a similar size to Spirit today • Today, Loyalty contributes significantly less to Spirit’s top line (~2%) , though potential exists to achieve up to 9% uplift with a targeted redesign • Free Spirit has features that are competitive with other programs in some aspects , but has been disadvantaged both by Spirit’s product, network, limited partnerships (air and non - air) and co - brand offering Commentary Recognized Loyalty Revenue as a % of Revenue % of Reported Total Revenues excl. C argo, all FY’23 except J etBlue “2012” Loyalty passenger revenue Other loyalty revenue (2) 8.6% 2.0% (2012) 22 . 1 % 16 . 5 % 8 . 1% 10.7% 12.2% 12.6% 6 . 4% 4.4% 5.7% 5.6% 14 . 0% 10 . 2% 6.3% 6.5% 6.9% Source: Company press releases, SEC fillings, Oliver Wyman analysis Notes: (1) Assumes other Bravo infrastructure (e.g., network, guest experience) in - place; (2) Other loyalty revenue includes credit card renumeration, marketing, advertising, and co - brand
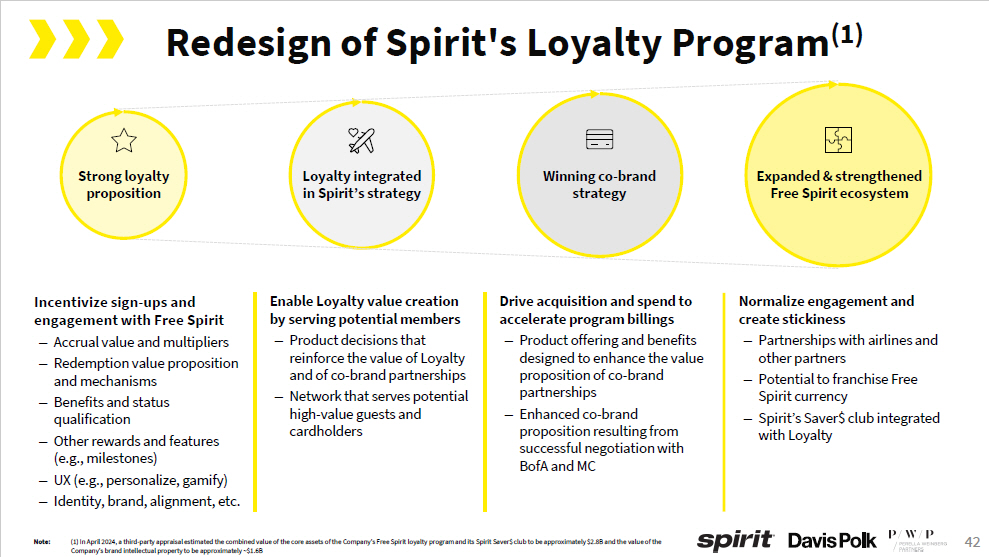
42 Redesign of Spirit's Loyalty Program (1) Loyalty integrated in Spirit’s strategy Strong loyalty proposition Winning co - brand strategy Expanded & strengthened Free Spirit ecosystem Drive acquisition and spend to accelerate program billings – Product offering and benefits designed to enhance the value proposition of co - brand partnerships – Enhanced co - brand proposition resulting from successful negotiation with BofA and MC Enable Loyalty value creation by serving potential members – Product decisions that reinforce the value of Loyalty and of co - brand partnerships – Network that serves potential high - value guests and cardholders Incentivize sign - ups and engagement with Free Spirit – Accrual value and multipliers – Redemption value proposition and mechanisms – Benefits and status qualification – Other rewards and features (e.g., milestones) – UX (e.g., personalize, gamify) – Identity, brand, alignment, etc. Normalize engagement and create stickiness – Partnerships with airlines and other partners – Potential to franchise Free Spirit currency – Spirit’s Saver$ club integrated with Loyalty N o te: (1) In April 2024, a third - party appraisal estimated the combined value of the core assets of the Company’s Free Spirit loyalty program and its Spirit Saver$ club to be approximately $2.8B and the value of the Company’s brand intellectual property to be approximately ~$1.6B
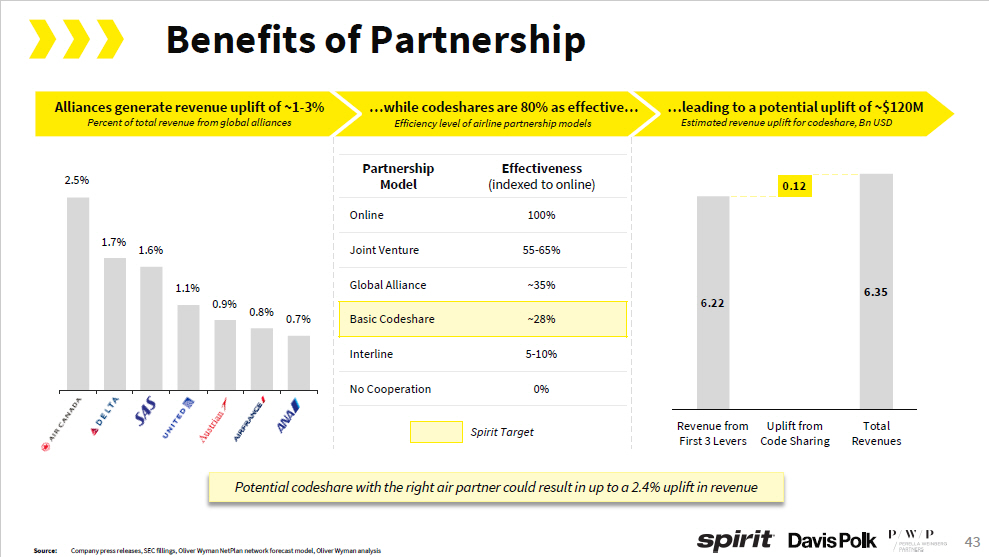
43 Benefits of Partnership …leading to a potential uplift of ~$120M Estimated revenue uplift for codeshare, Bn USD …while codeshares are 80% as effective… Efficiency level of airline partnership models Alliances generate revenue uplift of ~1 - 3% Percent of total revenue from global alliances Potential codeshare with the right air partner could result in up to a 2.4% uplift in revenue 2 . 5 % 1 . 7 % 1 . 6 % 1 . 1 % 0 . 9 % 0 . 8 % 0 . 7 % Effectiveness (indexed to online) P art n ership Model 100% Online 55 - 65% Joint Venture ~35% Global Alliance ~28% Basic Codeshare 5 - 10% Interline 0% Spirit Target No Cooperation Source: Company press releases, SEC fillings, Oliver Wyman NetPlan network forecast model, Oliver Wyman analysis
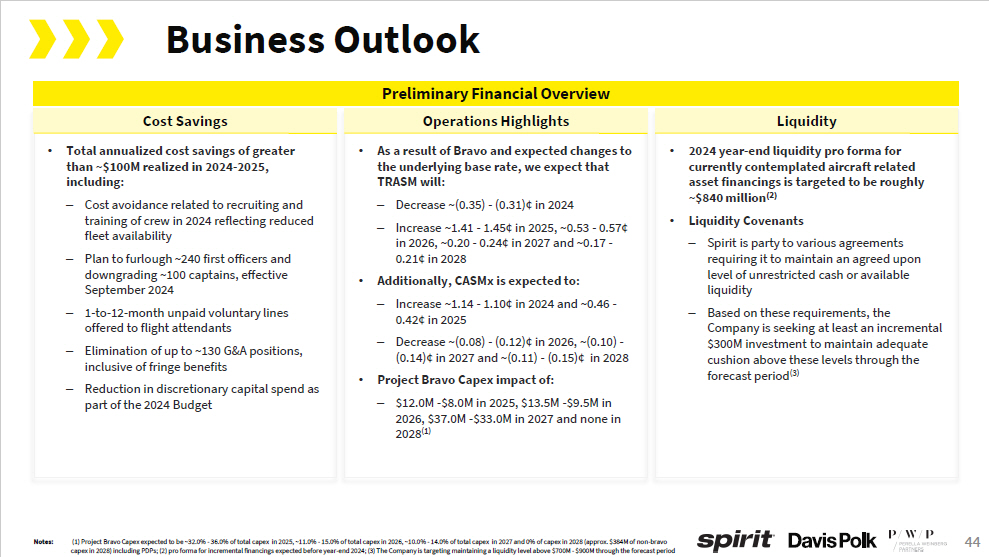
44 Business Outlook Preliminary Financial Overview Liquidity Operations Highlights • As a result of Bravo and expected changes to the underlying base rate, we expect that TRASM will: – Decrease ~(0.35) - (0.31)¢ in 2024 – Increase ~1.41 - 1.45¢ in 2025, ~0.53 - 0.57¢ in 2026, ~0.20 - 0.24¢ in 2027 and ~0.17 - 0.21¢ in 2028 • Additionally, CASMx is expected to: – Increase ~1.14 - 1.10¢ in 2024 and ~0.46 - 0.42¢ in 2025 – Decrease ~(0.08) - (0.12)¢ in 2026, ~(0.10) - (0.14)¢ in 2027 and ~(0.11) - (0.15)¢ in 2028 • Project Bravo Capex impact of: – $12.0M - $8.0M in 2025, $13.5M - $9.5M in 2026, $37.0M - $33.0M in 2027 and none in 2028 (1) Cost Savings • 2024 year - end liquidity pro forma for currently contemplated aircraft related asset financings is targeted to be roughly ~$840 million (2) • Liquidity Covenants – Spirit is party to various agreements requiring it to maintain an agreed upon level of unrestricted cash or available liquidity – Based on these requirements, the Company is seeking at least an incremental $300M investment to maintain adequate cushion above these levels through the forecast period (3) • Total annualized cost savings of greater than ~$100M realized in 2024 - 2025, including: – Cost avoidance related to recruiting and training of crew in 2024 reflecting reduced fleet availability – Plan to furlough ~ 240 first officers and downgrading ~ 100 captains, effective September 2024 – 1 - to - 12 - month unpaid voluntary lines offered to flight attendants – Elimination of up to ~130 G&A positions, inclusive of fringe benefits – Reduction in discretionary capital spend as part of the 2024 Budget N o te s : (1) Project Bravo Capex expected to be ~32.0% - 36.0% of total capex in 2025, ~11.0% - 15.0% of total capex in 2026, ~10.0% - 14.0% of total capex in 2027 and 0% of capex in 2028 (approx. $384M of non - bravo capex in 2028) including PDPs; (2) pro forma for incremental financings expected before year - end 2024; (3) The Company is targeting maintaining a liquidity level above $700M - $900M through the forecast period

Appendix: Other Company Information

46 11 . 1 11 . 5 11 . 3 10 . 8 10 . 0 10 . 0 9 . 9 Utilization and Seat Density Benchmarking 3 .3 2 .5 FY2023 Aircraft Block Hours Per Day (1) Avg. Rev. Departures / Day 4.1 3.3 4.1 3.4 5.0 3.4 2.7 A319 A320 A321/neo 0 NA NA 30 30 30 30 28 30 31 30 32 28 30 28 NA 31 31 30 32 28 28 Leading Asset Utilization Among U.S. Airline Peers… …With High Seat Density Supported by Single Economy Class Number of Seats by Aircraft Type 132 128 186 162 157 200 200 194 Economy Pitch Number of Seats 156 145 150 150 186 182 190 240 235 NA Source: Publicly available information, U.S. DoT Form 41 data Note: (1) Reflects ramp - to - ramp aircraft block hours for all system flying; Excludes regional carrier flying for Delta, American, United and Alaska

47 Historical P&L | 2019 - 2023 N o t e s : (1) Fuel cost per ASM is estimated to be 2.79¢ in 2024, 2.47¢ in 2025, 2.44¢ in 2026, 2.36¢ in 2027 and 2.30¢ in 2028. Such estimates are based on current expected fuel costs, which may fluctuate or be materially different over time; (2) Based on current fleet composition and order book as of Q2 2024, annual P&L aircraft rent (incl. supplemental rent) is estimated to grow 41.2% in 2024, 11.3% in 2025, 3.9% in 2026, 9.7% in 2027, 4.2% in 2028; (3) Due to impact of AOGs from P&W settlement and increased ground time to account for higher check bag volumes, ASMs are estimated to: decrease 5.7% to 3.7% in 2024 and 14.4% to 12.4% in 2025 before increasing 3.5% to 5.5% in 2026, 9.4% to 11.4% in 2027 and 9.1% to 11.1% in 2028 201 9 202 0 202 1 202 2 202 3 Summary of Historical Financial Performance 2023 2022 2021 2020 2019 $5 , 36 3 $5 , 06 8 $3 , 23 1 $1 , 81 0 $3 , 83 1 Operating Revenue ( 1,821) ( 1,930) ( 914) ( 431) ( 993) ( - ) Aircraft Fuel (1) ( 1,617) ( 1,251) ( 1,065) ( 910) ( 865) ( - ) Salaries, Wages & Benefits ( 381) ( 282) ( 247) ( 196) ( 183) ( - ) Aircraft Rent (2) ( 2,039) ( 2,204) ( 1,062) ( 781) ( 1,288) ( - ) Other Operating Expenses ( $496 ) ( $599 ) ( $57 ) ( $508 ) $501 EBIT 430 780 ( 79) ( 25) 243 (+) D&A & Other Adjustments ( $65 ) $181 ( $136 ) ( $533 ) $744 Adj. EBITDA 381 282 247 196 183 (+) Rent Expense $316 $463 $110 ( $336 ) $927 Adj. EBITDAR 5 . 9 % 9 . 1 % 3 . 4 % ( 18 . 6 %) 24 . 2 % % Margin 55 , 665 , 56 1 48 , 567 , 97 8 40 , 749 , 33 4 27 , 718 , 38 7 41 , 783 , 00 1 ASMs (000s) (3) 81 . 3 % 81 . 9 % 78 . 8 % 69 . 7 % 84 . 4 % Load Factor 9 . 6 ¢ 10 . 4 ¢ 7 . 9 ¢ 6 . 5 ¢ 9 . 2 ¢ TRASM (cents) 10 . 3 ¢ 10 . 7 ¢ 9 . 0 ¢ 9 . 5 ¢ 7 . 9 ¢ Adj. CASM 7 . 1 ¢ 6 . 7 ¢ 6 . 7 ¢ 7 . 9 ¢ 5 . 6 ¢ Adj. CASM (ex. Fuel)
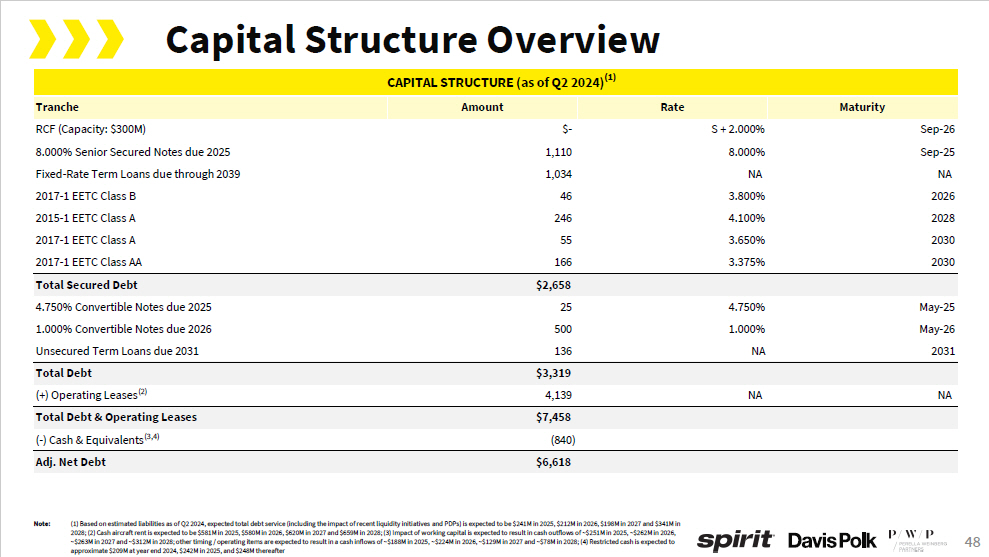
48 2023 - 2023 - 2023 - 2023 - CAPITAL STRUCTURE (as of Q2 2024) (1) Maturity Rate Amount Tranche Se p - 26 S + 2.000% $ - RCF (Capacity: $300M) Se p - 25 8.000% 1,110 8.000% Senior Secured Notes due 2025 NA NA 1,034 Fixed - Rate Term Loans due through 2039 2026 3.800% 46 2017 - 1 EETC Class B 2028 4.100% 246 2015 - 1 EETC Class A 2030 3.650% 55 2017 - 1 EETC Class A 2030 3.375% 166 2017 - 1 EETC Class AA $2 , 65 8 Total Secured Debt M ay - 25 4.750% 25 4.750% Convertible Notes due 2025 M ay - 26 1.000% 500 1.000% Convertible Notes due 2026 2031 NA 136 Unsecured Term Loans due 2031 $3 , 31 9 Total Debt NA NA 4,139 (+) Operating Leases (2) $7 , 45 8 Total Debt & Operating Leases ( 840) ( - ) Cash & Equivalents (3,4) $6 , 61 8 Adj. Net Debt Capital Structure Overview N o t e: (1) Based on estimated liabilities as of Q2 2024, expected total debt service (including the impact of recent liquidity initiatives and PDPs) is expected to be $241M in 2025, $212M in 2026, $198M in 2027 and $341M in 2028; (2) Cash aircraft rent is expected to be $581M in 2025, $580M in 2026, $620M in 2027 and $659M in 2028; (3) Impact of working capital is expected to result in cash outflows of ~$251M in 2025, ~$262M in 2026, ~$263M in 2027 and ~$312M in 2028; other timing / operating items are expected to result in a cash inflows of ~$188M in 2025, ~$224M in 2026, ~$129M in 2027 and ~$78M in 2028; (4) Restricted cash is expected to approximate $209M at year end 2024, $242M in 2025, and $248M thereafter
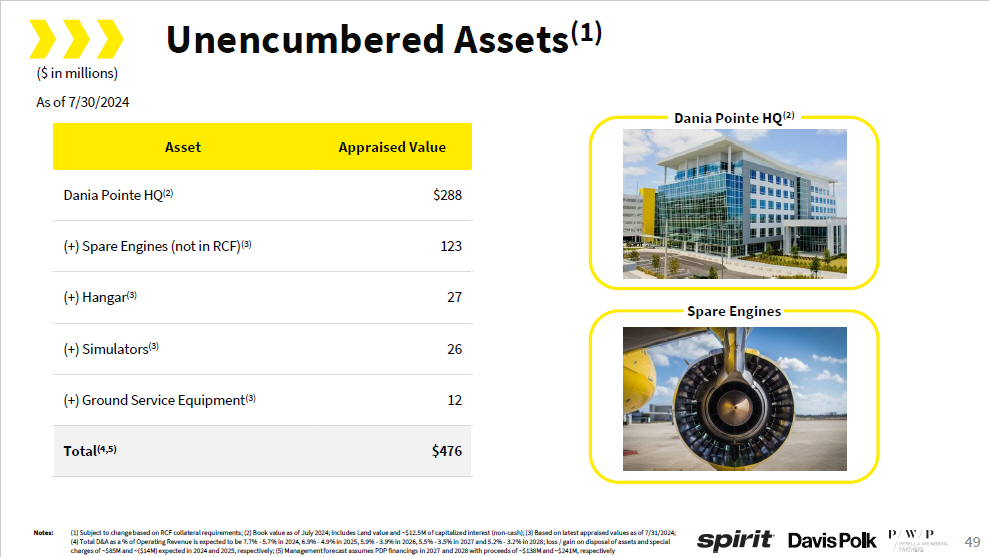
49 Unencumbered Assets (1) ($ in millions) As of 7/30/2024 Appraised Value Asset $288 Dania Pointe HQ (2) 123 (+) Spare Engines (not in RCF) (3) 27 (+) Hangar (3) 26 (+) Simulators (3) 12 (+) Ground Service Equipment (3) $476 Total (4,5) Dania Pointe HQ (2) Spare Engines N o te s : (1) Subject to change based on RCF collateral requirements; (2) Book value as of July 2024; includes Land value and ~$12.5M of capitalized interest (non - cash); (3) Based on latest appraised values as of 7/31/2024; (4) Total D&A as a % of Operating Revenue is expected to be 7.7% - 5.7% in 2024, 6.9% - 4.9% in 2025, 5.9% - 3.9% in 2026, 5.5% - 3.5% in 2027 and 5.2% - 3.2% in 2028; loss / gain on disposal of assets and special charges of ~$85M and ~($14M) expected in 2024 and 2025, respectively; (5) Management forecast assumes PDP financings in 2027 and 2028 with proceeds of ~$138M and ~$241M, respectively

50 Organizational Structure Spirit Airlines, Inc. Spirit IP Cayman Ltd. Spirit Loyalty Cayman Ltd. Brand IP Assets C o l le c t i on Account R e ser ve Account Loyalty IP Assets C o l le c t i on Account Senior Secured Notes Security Interest C o - Is suers G u ar an t or Spirit Finance Cayman 1 Ltd. Spirit Finance Cayman 2 Ltd. Transfer of certain of Spirit's Brand Intellectual Property via Contribution Agreements N o n - L o yal t y N o n - L o yal t y IP License IP Royalties Co - Branded Credit Card Agreement Spirit Saver$ Club Agreements Co - Brand Credit Card Revenues Loyalty IP License Transfer of Loyalty IP via C o n t r i but i on Agreements Saver$ Fare Club Revenues (Deposited by Spirit) 100% 100% 100% Interest and Principal Interest and Principal 100% Co - Branded Credit Card Contract Spirt Saver$ Club Membership Convertible Notes

Appendix: DS Projections
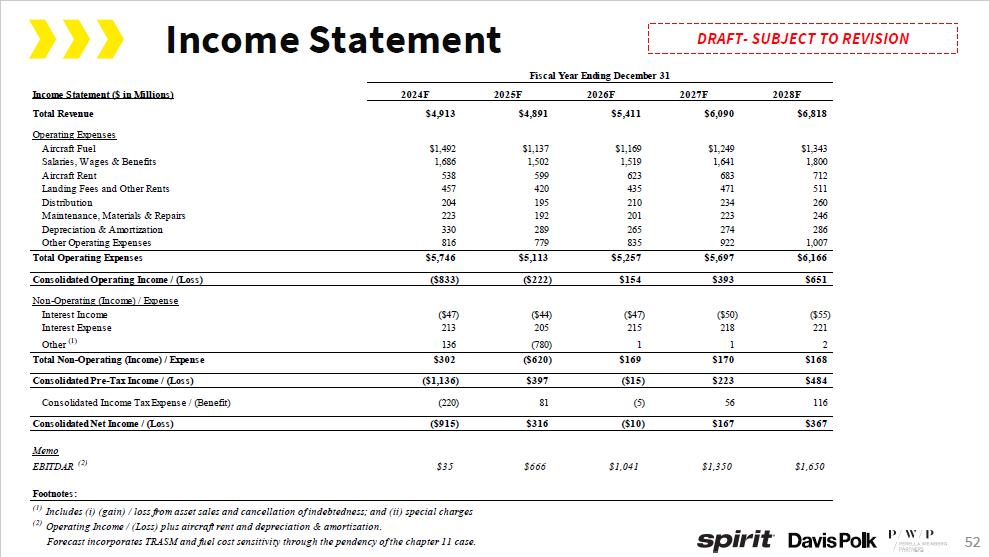
52 Income Statement DRAFT - SUBJECT TO REVISION Income Statement ($ in Millions) $6 , 81 8 $6 , 09 0 $5,411 $4 , 89 1 $4 , 91 3 Total Revenue $1 , 34 3 $1 , 24 9 $1,169 $1 , 13 7 $1 , 49 2 Operating Expenses Aircraft Fuel 1 , 80 0 1 , 64 1 1,519 1 , 50 2 1 , 68 6 Salaries, Wages & Benefits 712 683 623 599 538 Aircraft Rent 511 471 435 420 457 Landing Fees and Other Rents 260 234 210 195 204 Distribution 246 223 201 192 223 Maintenance, Materials & Repairs 286 274 265 289 330 Depreciation & Amortization 1 , 00 7 922 835 779 816 Other Operating Expenses $6 , 16 6 $5 , 69 7 $5,257 $5 , 11 3 $5 , 74 6 Total Operating Expenses $651 $393 $154 ( $222 ) ( $833 ) Consolidated Operating Income / (Loss) ( $55 ) ( $50 ) ( $47 ) ( $44 ) ( $47 ) Non - Operating (Income) / Expense Interest Income 221 218 215 205 213 Interest Expense 2 1 1 ( 780 ) 136 Other (1) $168 $170 $169 ( $620 ) $302 Total Non - Operating (Income) / Expense $484 $223 ( $15 ) $397 ( $1 , 136 ) Consolidated Pre - Tax Income / (Loss) 116 56 ( 5 ) 81 ( 220 ) Consolidated Income Tax Expense / (Benefit) $367 $167 ( $10 ) $316 ( $915 ) Consolidated Net Income / (Loss) Memo Fiscal Year Ending December 31 2024F 2025F 2026F 2027F 2028F EBITDAR ( 2) $35 $666 $1 , 04 1 $1 , 35 0 $1 , 65 0 Footnotes: ( 1) Includes (i) (gain) / loss from asset sales and cancellation of indebtedness; and (ii) special charges ( 2) Operating Income / (Loss) plus aircraft rent and depreciation & amortization. Forecast incorporates TRASM and fuel cost sensitivity through the pendency of the chapter 11 case.

2028F 2027F 2026F 2025F 2024F Balance Sheet ($ in Millions) $1 , 32 5 $1,040 $777 $640 $935 Current Assets Cash & Short - Term Investments 248 248 248 222 197 Restricted Cash 232 226 213 205 200 Accounts Receivable 406 376 335 311 319 Other Current Assets $2 , 21 2 $1,890 $1 , 57 3 $1,379 $1 , 65 1 Total Current Assets $2 , 58 1 $2,611 $2 , 64 6 $2,735 $2 , 99 1 Non - Current Assets Property, Plant & Equipment, net 6 , 35 2 5,401 4 , 60 9 4,859 5 , 00 7 Other Assets $11 , 14 6 $9,901 $8 , 82 8 $8,973 $9 , 64 8 Total Assets $52 $48 $38 $36 $37 Current Liabilities Accounts Payable 578 550 533 509 494 Air Traffic Liability 593 589 496 469 494 Other Current Liabilities $1 , 22 3 $1,187 $1 , 06 6 $1,014 $1 , 02 5 Total Current Liabilities $982 $944 $907 $871 -- Non - Current Liabilities Exit Financing 1 , 45 9 1,401 1 , 30 9 1,348 3 , 62 1 Funded Debt and Finance Leases 6 , 09 2 5,358 4 , 71 1 4,905 4 , 84 2 Other Liabilities $9 , 75 7 $8,890 $7 , 99 4 $8,138 $9 , 48 8 Total Liabilities ( $92 ) ( $459 ) ( $626 ) ( $616 ) ( $932 ) Stockholders' Equity Accumulated Earnings / (Deficit) 1 , 56 2 1,552 1 , 54 2 1,533 1 , 17 4 APIC / New Equity ( 81 ) ( 81 ) ( 81 ) ( 81 ) ( 81 ) Other $1 , 38 9 $1,011 $834 $835 $161 Total Stockholders' Equity $11 , 14 6 $9,901 $8 , 82 8 $8,973 $9 , 64 8 Total Liabilities & Stockholders' Equity 53 Balance Sheet DRAFT - SUBJECT TO REVISION Fiscal Year Ending December 31

54 Cash Flow Statement DRAFT - SUBJECT TO REVISION Fiscal Year Ending December 31 2028F 2027F 2026F 2025F 2024F Cash Flow Statement ($ in Millions) $367 $167 ( $10 ) $316 ($915) Net Income 286 274 265 289 330 Depreciation & Amortization ( 219 ) ( 126 ) ( 45 ) ( 69 ) 204 Changes in Other Working Capital -- -- -- ( 14 ) 50 Gain / (Loss) on Disposal of Assets 179 147 84 ( 654 ) ( 157 ) Other $613 $462 $293 ( $132 ) ($489) Operating Cash Flows ( $146 ) ( $139 ) ( $84 ) ( $69 ) ($167) Capital Expenditures ( 237 ) ( 149 ) ( 4 ) 40 12 PDP (Payments) / Refunds, Net -- -- -- 183 327 Proceeds from Sale of Assets -- -- -- -- -- Other ($384) ( $288 ) ( $88 ) $153 $172 Investing Cash Flows $241 $138 -- $1 , 03 3 $600 Debt Issuance ( 185 ) ( 49 ) ( 42 ) ( 1 , 673 ) ( 253 ) Debt (Payment) -- -- -- 350 -- Proceeds from Equity Raise ( 1 ) ( 1 ) ( 1 ) ( 0 ) ( 0 ) Other $56 $89 ( $42 ) ( $291 ) $346 Financing Cash Flow $285 $263 $163 ( $270 ) $30 Increase / (Decrease) in Cash $1,171 $908 $745 $1 , 01 4 $985 Beginning Cash (Restricted and Unrestricted) 1,456 1 , 17 1 908 745 1,014 Ending Cash (Restricted and Unrestricted) ( 248 ) ( 248 ) ( 248 ) ( 222 ) ( 197 ) Less: Restricted Cash 117 117 117 117 117 Plus: Short - Term Investments $1,325 $1,040 $777 $640 $935 Ending Cash (Unrestricted Cash and ST Investments)
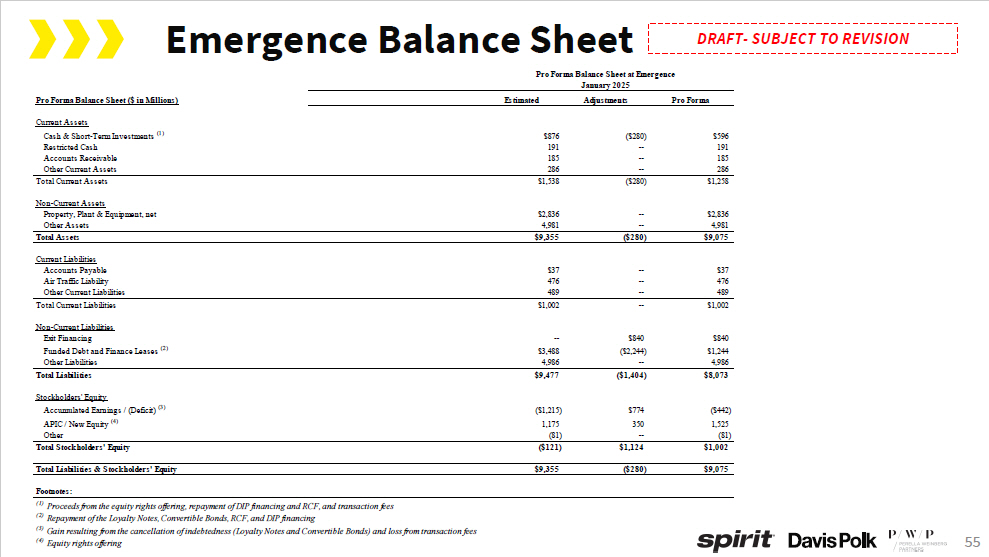
55 Emergence Balance Sheet DRAFT - SUBJECT TO REVISION Pro Forma Balance Sheet ($ in Millions) Pro Forma Balance Sheet at Emergence January 2025 Estimated Adjustments Pro Forma Current Assets $596 ( $280 ) $876 Cash & Short - Term Investments (1) 191 -- 191 Restricted Cash 185 -- 185 Accounts Receivable 286 -- 286 Other Current Assets $1 , 25 8 ( $280 ) $1 , 53 8 Total Current Assets $2 , 83 6 -- $2 , 83 6 Non - Current Assets Property, Plant & Equipment, net 4 , 98 1 -- 4 , 98 1 Other Assets $9 , 07 5 ( $280 ) $9 , 35 5 Total Assets $37 -- $37 Current Liabilities Accounts Payable 476 -- 476 Air Traffic Liability 489 -- 489 Other Current Liabilities $1 , 00 2 -- $1 , 00 2 Total Current Liabilities $840 $840 -- Non - Current Liabilities Exit Financing $1 , 24 4 ( $2 , 244 ) $3 , 48 8 Funded Debt and Finance Leases (2) 4 , 98 6 -- 4 , 98 6 Other Liabilities $8 , 07 3 ( $1 , 404 ) $9 , 47 7 Total Liabilities Stockholders' Equity ( $442 ) $774 ( $1 , 215 ) Accumulated Earnings / (Deficit) (3) 1 , 52 5 350 1 , 17 5 APIC / New Equity (4) ( 81 ) -- ( 81 ) Other $1 , 00 2 $1 , 12 4 Total Stockholders' Equity ($121) $9 , 07 5 ( $280 ) Total Liabilities & Stockholders' Equity $9,355 Footnotes: ( 1) Proceeds from the equity rights offering, repayment of DIP financing and RCF, and transaction fees ( 2) Repayment of the Loyalty Notes, Convertible Bonds, RCF, and DIP financing ( 3) Gain resulting from the cancellation of indebtedness (Loyalty Notes and Convertible Bonds) and loss from transaction fees ( 4) Equity rights offering

sp ir i t ®