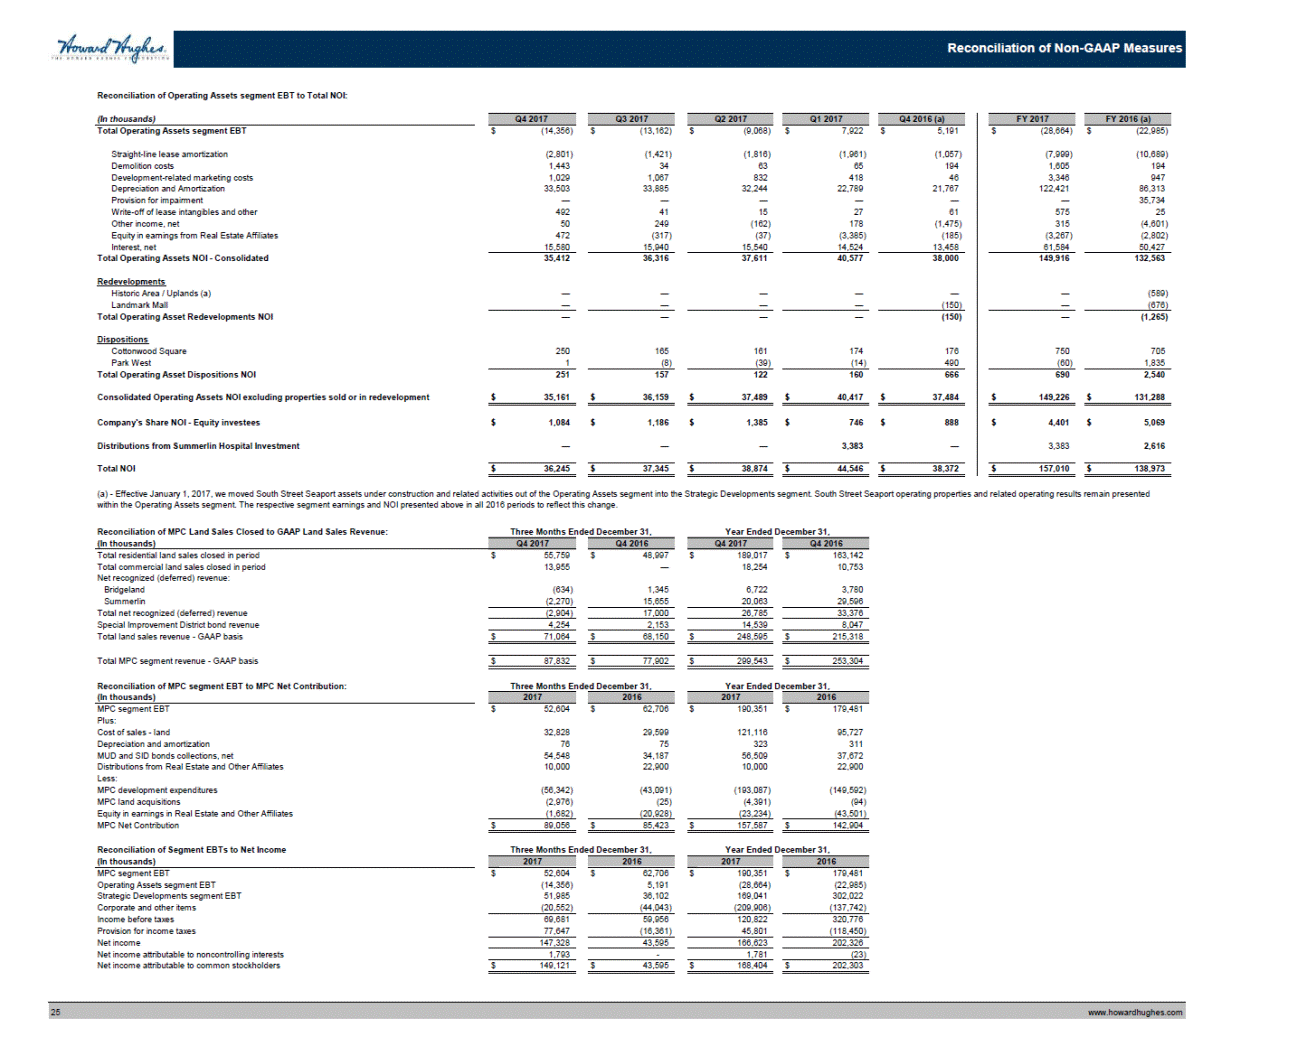
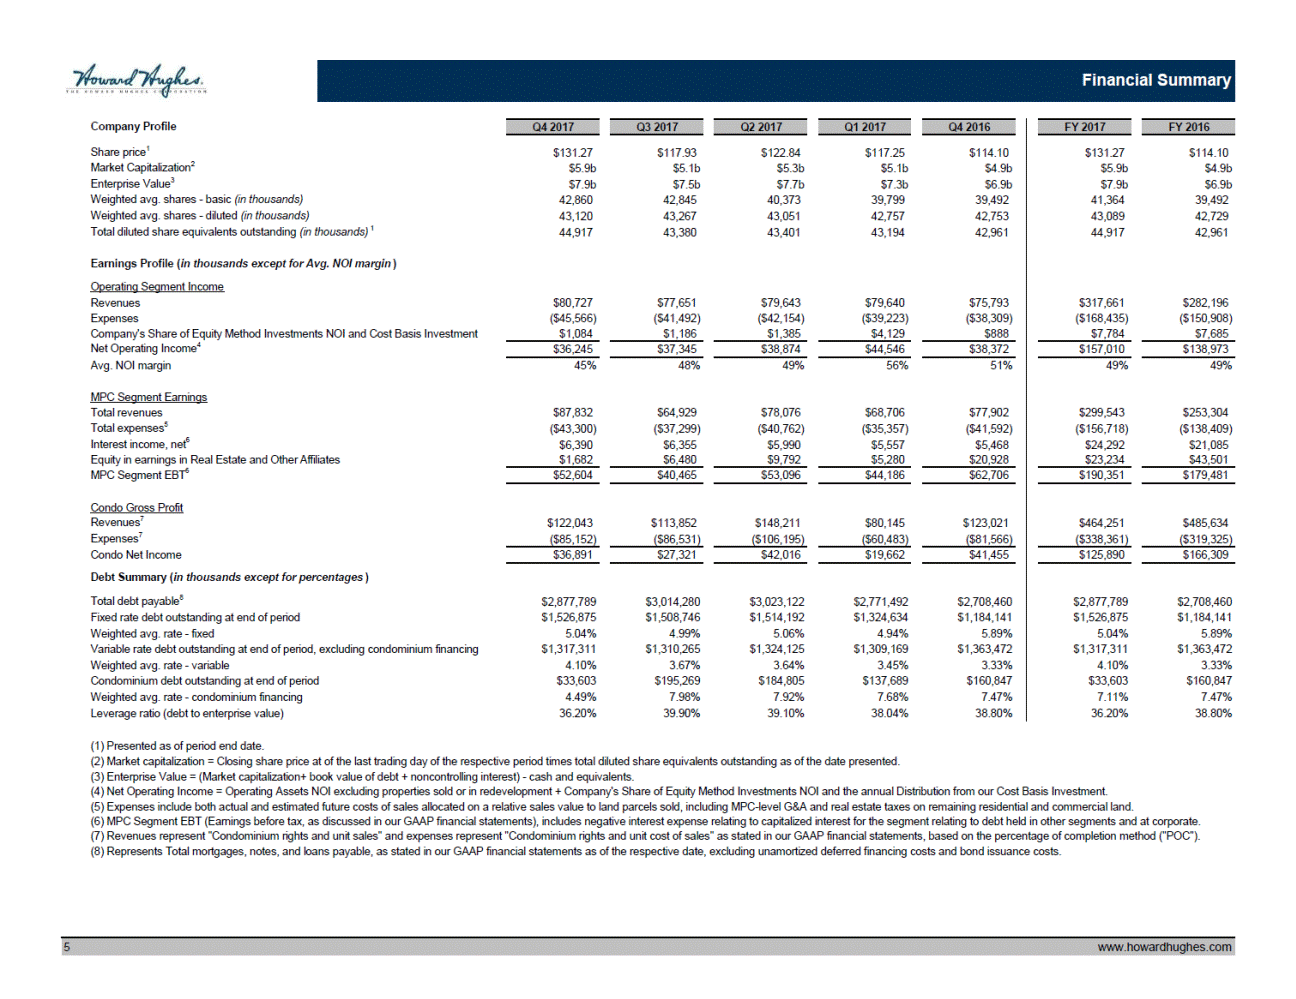
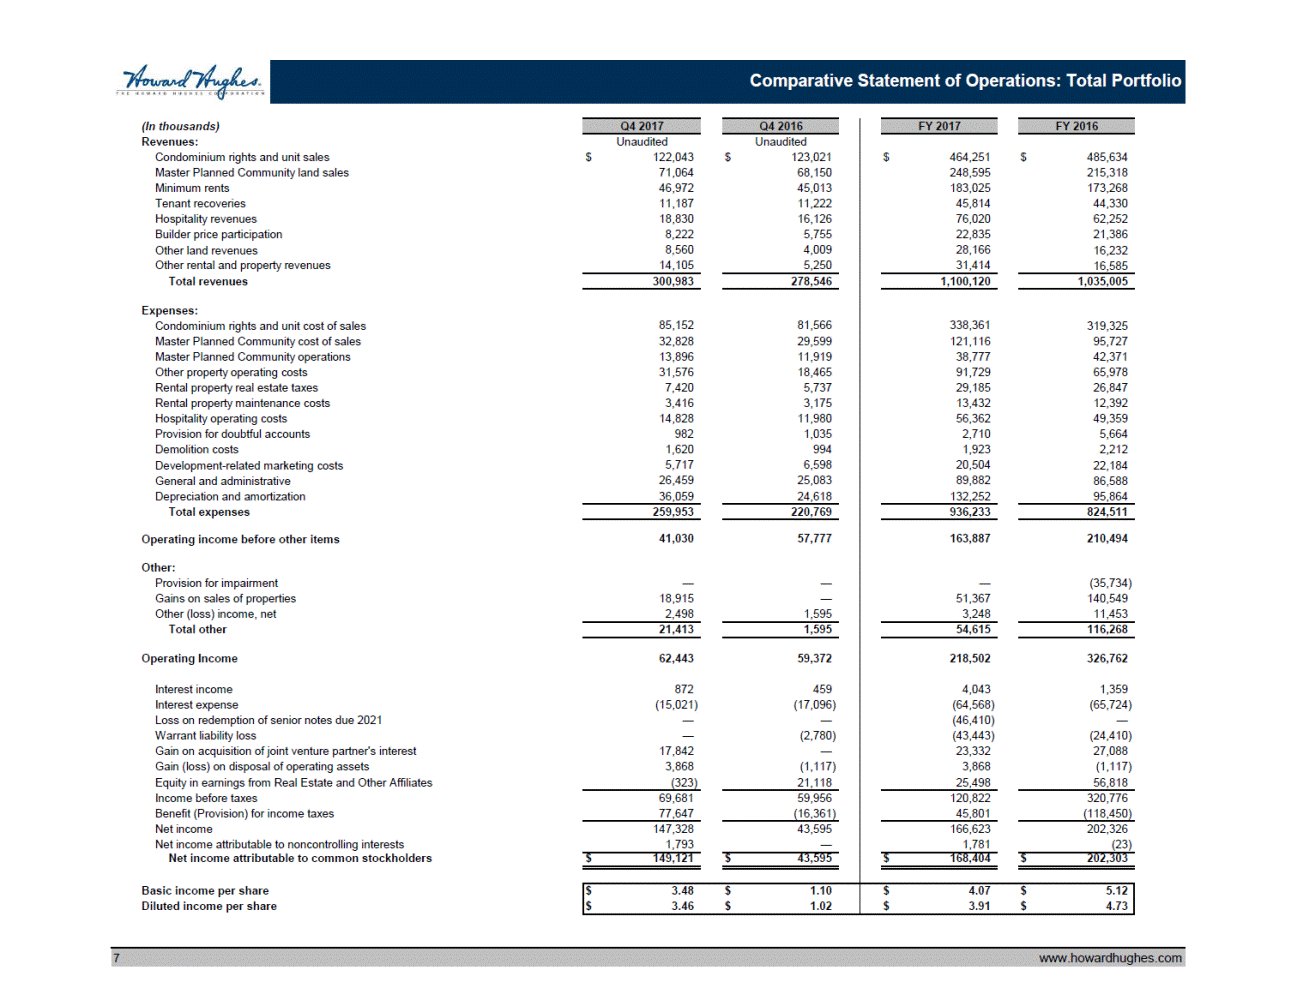
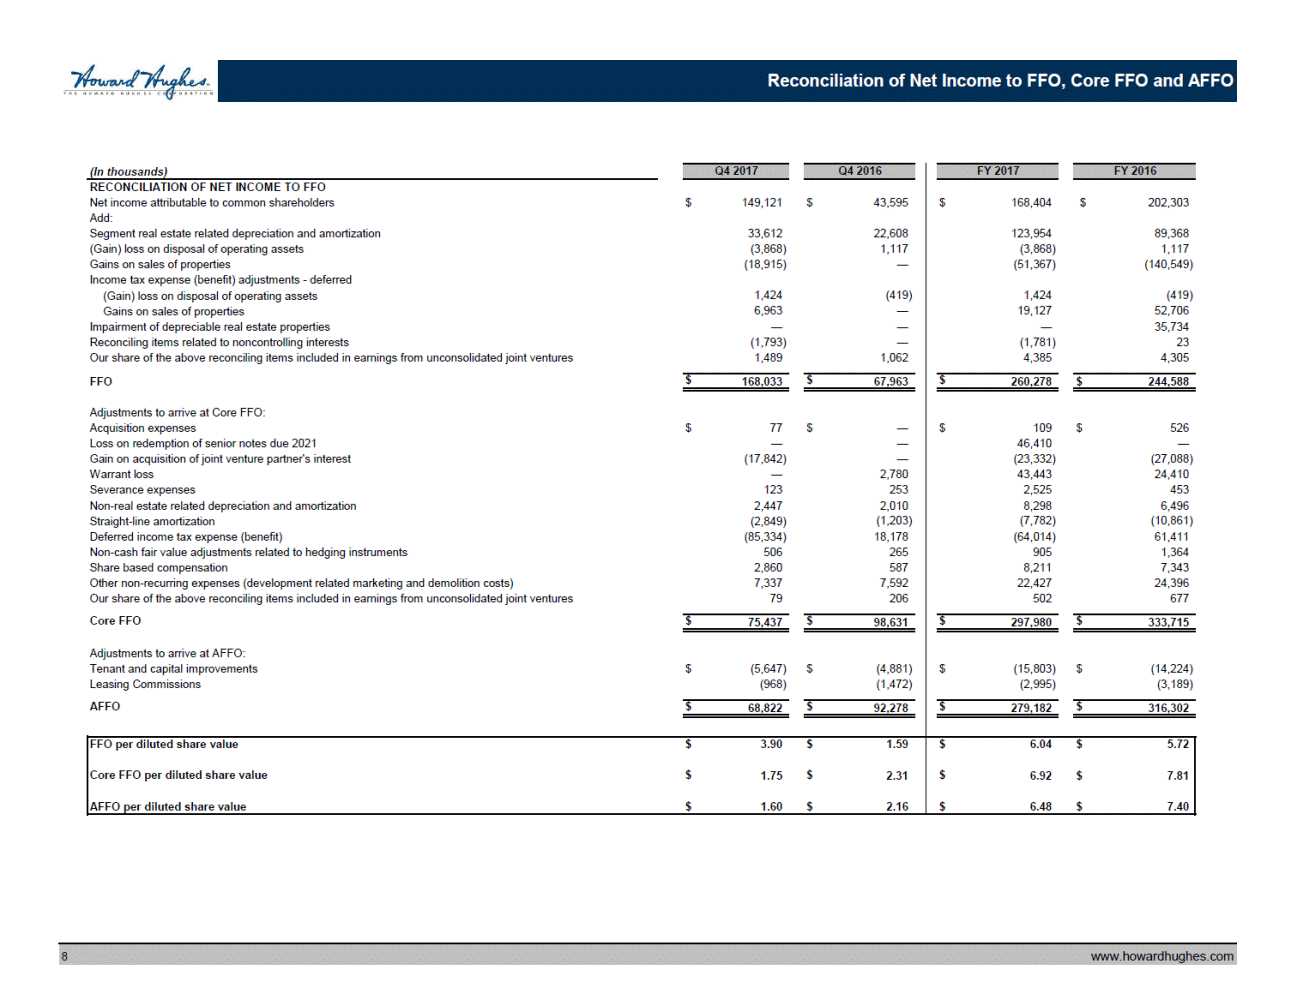
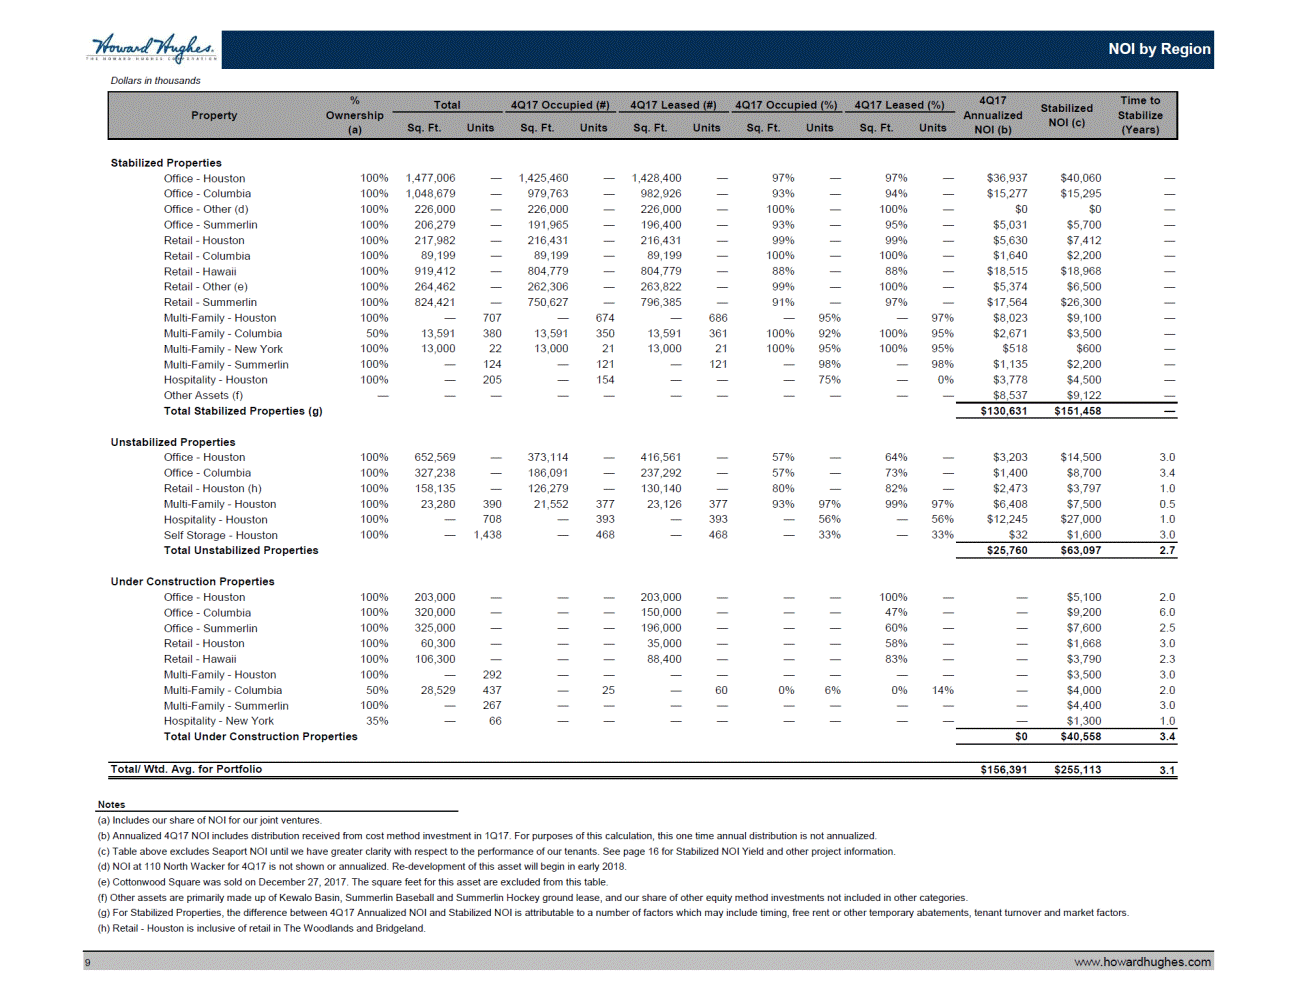
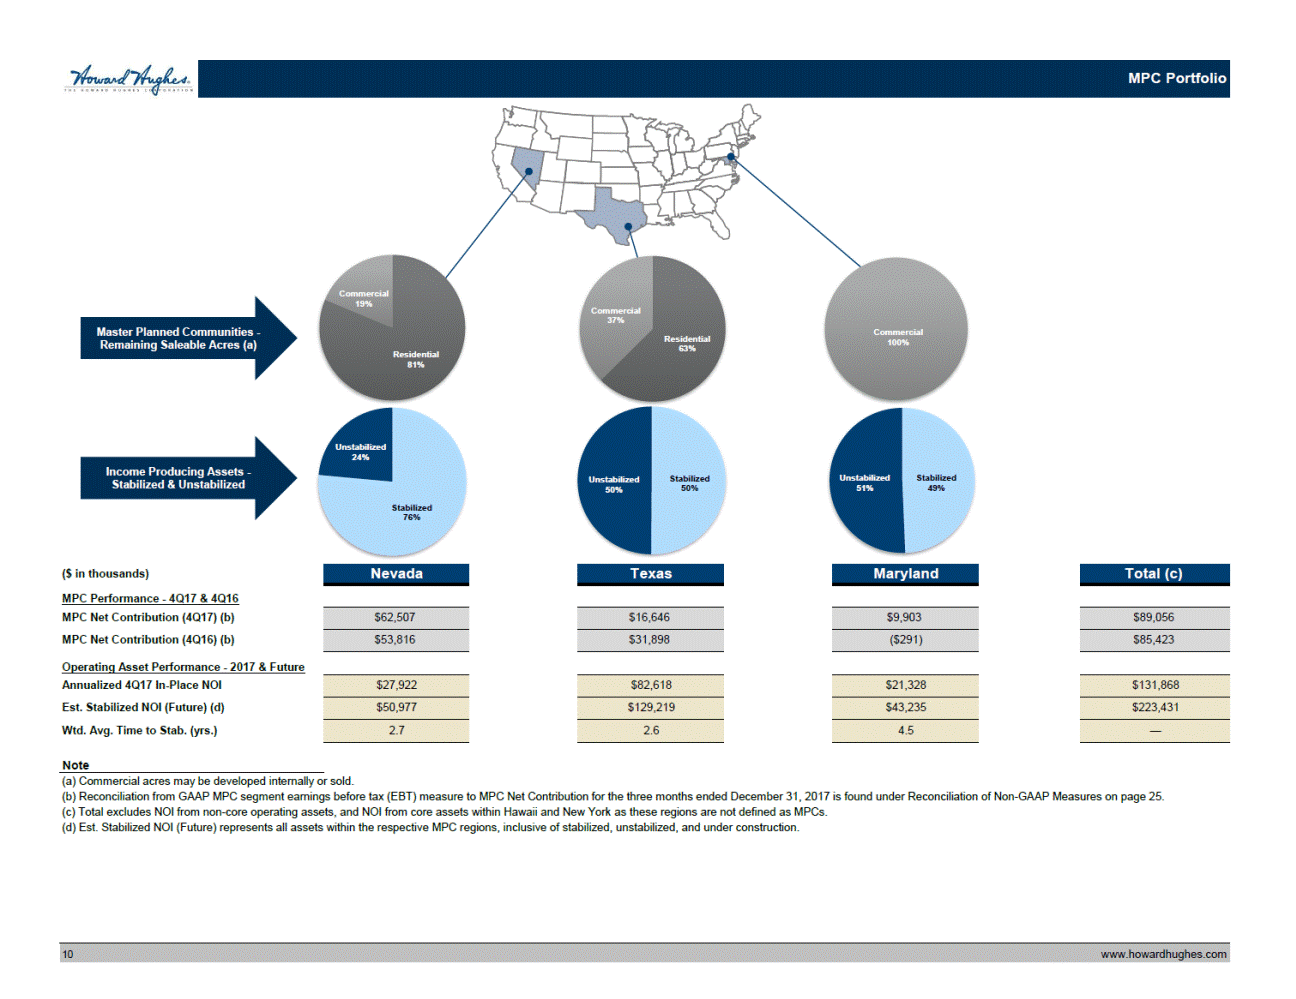
Reconciliation of Operating Assets segment EBT to Total NOI: (In thousands) Total Operating Assets segment EBT $ (14,356) $ (13,162) $ (9,068) $ 7,922 $ 5,191 $ (28,664) $ (22,985) Straight-line lease amortization Demolition costs Development-related marketing costs Depreciation and Amortization Provision for impairment Write-off of lease intangibles and other Other income, net Equity in earnings from Real Estate Affiliates Interest, net Total Operating Assets NOI - Consolidated (2,801) 1,443 1,029 33,503 — 492 50 472 15,580 (1,421) 34 1,067 33,885 — 41 249 (317) 15,940 (1,816) 63 832 32,244 — 15 (162) (37) 15,540 (1,961) 65 418 22,789 — 27 178 (3,385) 14,524 (1,057) 194 46 21,767 — 61 (1,475) (185) 13,458 (7,999) 1,605 3,346 122,421 — 575 315 (3,267) 61,584 (10,689) 194 947 86,313 35,734 25 (4,601) (2,802) 50,427 35,412 36,316 37,611 40,577 38,000 149,916 132,563 Redevelopments Historic Area / Uplands (a) Landmark Mall Total Operating Asset Redevelopments NOI — — — — — — — — — (150) — — (589) (676) — — — — (150) — (1,265) Dispositions Cottonwood Square Park West Total Operating Asset Dispositions NOI 250 1 165 (8) 161 (39) 174 (14) 176 490 750 (60) 705 1,835 251 157 122 160 666 690 2,540 Consolidated Operating Assets NOI excluding properties sold or in redevelopment $ 35,161 $ 36,159 $ 37,489 $ 40,417 $ 37,484 $ 149,226 $ 131,288 Company's Share NOI - Equity investees $ 1,084 $ 1,186 $ 1,385 $ 746 $ 888 $ 4,401 $ 5,069 Distributions from Summerlin Hospital Investment — — — 3,383 — 3,383 2,616 Total NOI $ 36,245 $ 37,345 $ 38,874 $ 44,546 $ 38,372 $ 157,010 $ 138,973 (a) - Effective January 1, 2017, we moved South Street Seaport assets under construction and related activities out of the Operating Assets segment into the Strategic Developments segment. South Street Seaport operating properties and related operating results remain presented within the Operating Assets segment. The respective segment earnings and NOI presented above in all 2016 periods to reflect this change. Reconciliation of MPC Land Sales Closed to GAAP Land Sales Revenue: Three Months Ended December 31, Year Ended December 31, Total residential land sales closed in period Total commercial land sales closed in period Net recognized (deferred) revenue: Bridgeland Summerlin Total net recognized (deferred) revenue Special Improvement District bond revenue Total land sales revenue - GAAP basis $ 55,759 13,955 $ 48,997 — $ 189,017 18,254 $ 163,142 10,753 (634) (2,270) 1,345 15,655 6,722 20,063 3,780 29,596 (2,904) 17,000 26,785 33,376 4,254 2,153 14,539 8,047 $ 71,064 $ 68,150 $ 248,595 $ 215,318 Total MPC segment revenue - GAAP basis $ 87,832 $ 77,902 $ 299,543 $ 253,304 Reconciliation of MPC segment EBT to MPC Net Contribution: (In thousands) Three Months Ended December 31, Year Ended December 31, MPC segment EBT Plus: Cost of sales - land Depreciation and amortization MUD and SID bonds collections, net Distributions from Real Estate and Other Affiliates Less: MPC development expenditures MPC land acquisitions Equity in earnings in Real Estate and Other Affiliates MPC Net Contribution $ 52,604 $ 62,706 $ 190,351 $ 179,481 32,828 76 54,548 10,000 29,599 75 34,187 22,900 121,116 323 56,509 10,000 95,727 311 37,672 22,900 (56,342) (2,976) (1,682) (43,091) (25) (20,928) (193,087) (4,391) (23,234) (149,592) (94) (43,501) $ 89,056 $ 85,423 $ 157,587 $ 142,904 Reconciliation of Segment EBTs to Net Income (In thousands) Three Months Ended December 31, Year Ended December 31, MPC segment EBT Operating Assets segment EBT Strategic Developments segment EBT Corporate and other items Income before taxes Provision for income taxes Net income Net income attributable to noncontrolling interests Net income attributable to common stockholders $ 52,604 (14,356) 51,985 (20,552) $ 62,706 5,191 36,102 (44,043) $ 190,351 (28,664) 169,041 (209,906) $ 179,481 (22,985) 302,022 (137,742) 69,681 77,647 59,956 (16,361) 120,822 45,801 320,776 (118,450) 147,328 43,595 166,623 202,326 1,793 - 1,781 (23) $ 149,121 $ 43,595 $ 168,404 $ 202,303 25www.howardhughes.com 2016 2017 2016 2017 2016 2017 2016 2017 Q4 2016 Q4 2017 Q4 2016 (In thousands) Q4 2017 FY 2016 (a) FY 2017 Q4 2016 (a) Q1 2017 Q2 2017 Q3 2017 Q4 2017 Reconciliation of Non-GAAP Measures
