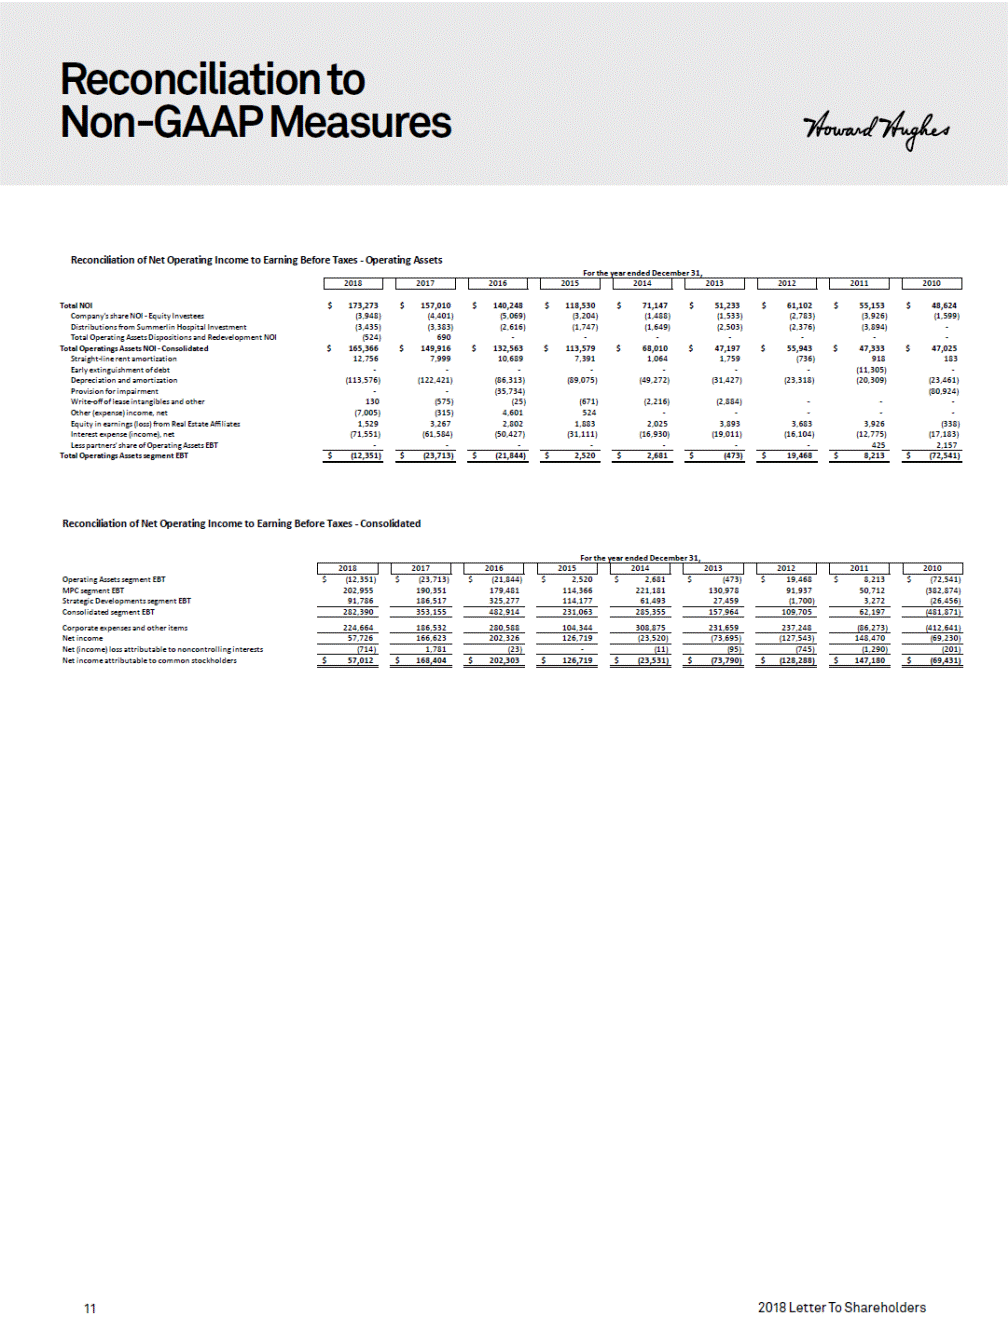
Reconciliation to Non-GAAP Measures Reconciliation of Net Operating Income to Earning Before Taxes - Operating Assets For the year ended December 31, Total NOI Company's share NOI - Equity Investees Distributions from Summerlin Hospital Investment Total Operating Assets Dispositions and Redevelopment NOI Total Operatings Assets NOI - Consolidated Straight-line rent amortization Early extinguishment of debt Depreciation and amortization Provision for impairment Write-off of lease intangibles and other Other (expense) income, net Equity in earnings (loss) from Real Estate Affiliates Interest expense (income), net Less partners' share of Operating Assets EBT Total Operatings Assets segment EBT $ 173,273 (3,948) (3,435) (524) 165,366 12,756 - (113,576) - 130 (7,005) 1,529 (71,551) - $ 157,010 (4,401) (3,383) 690 149,916 7,999 - (122,421) - (575) (315) 3,267 (61,584) - $ 140,248 (5,069) (2,616) - 132,563 10,689 - (86,313) (35,734) (25) 4,601 2,802 (50,427) - $ 118,530 (3,204) (1,747) - 113,579 7,391 - (89,075) $ 71,147 (1,488) (1,649) - 68,010 1,064 - (49,272) $ 51,233 (1,533) (2,503) - 47,197 1,759 - (31,427) $ 61,102 (2,783) (2,376) - 55,943 (736) - (23,318) $ 55,153 (3,926) (3,894) - 47,333 918 (11,305) (20,309) $ 48,624 (1,599) - - 47,025 183 - (23,461) (80,924) - - (338) (17,183) 2,157 $ $ $ $ $ $ $ $ $ (671) 524 1,883 (31,111) - (2,216) - 2,025 (16,930) - (2,884) - 3,893 (19,011) - - - 3,683 (16,104) - - - 3,926 (12,775) 425 $ (12,351) $ (23,713) $ (21,844) $ 2,520 $ 2,681 $ (473) $ 19,468 $ 8,213 $ (72,541) Reconciliation of Net Operating Income to Earning Before Taxes - Consolidated For the year ended December 31, Operating Assets segment EBT MPC segment EBT Strategic Developments segment EBT Consolidated segment EBT Corporate expenses and other items Net income Net (income) loss attributable to noncontrolling interests Net income attributable to common stockholders $ (12,351) 202,955 91,786 $ (23,713) 190,351 186,517 $ (21,844) 179,481 325,277 $ 2,520 114,366 114,177 $ 2,681 221,181 61,493 $ (473) 130,978 27,459 $ 19,468 91,937 (1,700) $ 8,213 50,712 3,272 $ (72,541) (382,874) (26,456) 282,390 353,155 482,914 231,063 285,355 157,964 109,705 62,197 (481,871) 224,664 186,532 280,588 104,344 308,875 231,659 237,248 (86,273) (412,641) 57,726 166,623 202,326 126,719 (23,520) (73,695) (127,543) 148,470 (69,230) (714) 1,781 (23) - (11) (95) (745) (1,290) (201) $ 57,012 $ 168,404 $ 202,303 $ 126,719 $ (23,531) $ (73,790) $ (128,288) $ 147,180 $ (69,431) 2018 Letter To Shareholders 11 2018 2017 2016 2015 2014 2013 2012 2011 2010 2018 2017 2016 2015 2014 2013 2012 2011 2010