Exhibit 99.6
| Broker Opinion of Value Portfolio | Multiple US Locations October 4, 2010 Realty Trust, Inc. |
| DISCLAIMER Disclaimer All information contained herein is from sources deemed reliable; however, no representation or warranty is made as to the accuracy thereof. This is not an appraisal and Jones Lang LaSalle is not an MAI designated appraiser. This Opinion of Value represents only the opinion of Jones Lang LaSalle as to the value of the properties, subject to the assumptions and qualifications set forth herein. Jones Lang LaSalle is not licensed to perform real property appraisals. The Opinion of Value set forth herein is specifically qualified by, and based solely upon, the relevant facts, circumstances, and market conditions that exist as of the date hereof. |
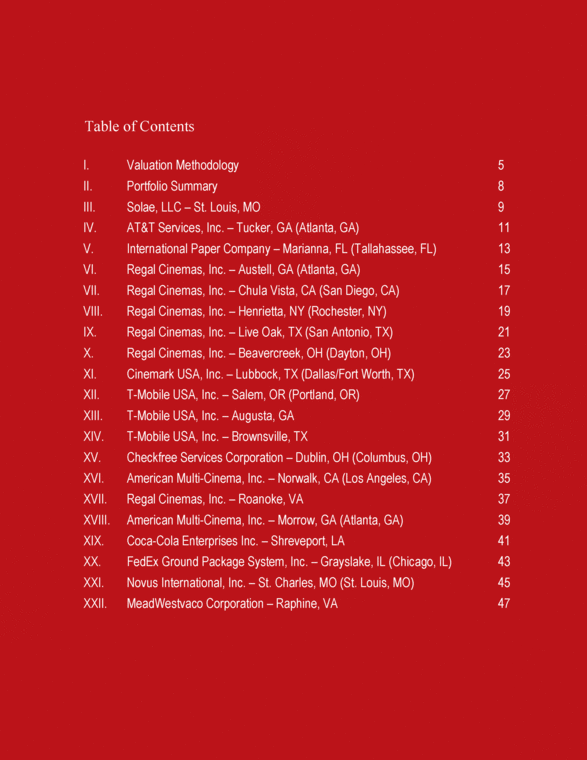
| Table of Contents Valuation Methodology 5 Portfolio Summary 8 Solae, LLC – St. Louis, MO 9 AT&T Services, Inc. – Tucker, GA (Atlanta, GA) 11 International Paper Company – Marianna, FL (Tallahassee, FL) 13 Regal Cinemas, Inc. – Austell, GA (Atlanta, GA) 15 Regal Cinemas, Inc. – Chula Vista, CA (San Diego, CA) 17 Regal Cinemas, Inc. – Henrietta, NY (Rochester, NY) 19 Regal Cinemas, Inc. – Live Oak, TX (San Antonio, TX) 21 Regal Cinemas, Inc. – Beavercreek, OH (Dayton, OH) 23 Cinemark USA, Inc. – Lubbock, TX (Dallas/Fort Worth, TX) 25 T-Mobile USA, Inc. – Salem, OR (Portland, OR) 27 T-Mobile USA, Inc. – Augusta, GA 29 T-Mobile USA, Inc. – Brownsville, TX 31 Checkfree Services Corporation – Dublin, OH (Columbus, OH) 33 American Multi-Cinema, Inc. – Norwalk, CA (Los Angeles, CA) 35 Regal Cinemas, Inc. – Roanoke, VA 37 American Multi-Cinema, Inc. – Morrow, GA (Atlanta, GA) 39 Coca-Cola Enterprises Inc. – Shreveport, LA 41 FedEx Ground Package System, Inc. – Grayslake, IL (Chicago, IL) 43 Novus International, Inc. – St. Charles, MO (St. Louis, MO) 45 MeadWestvaco Corporation – Raphine, VA 47 I. II. III. IV. V. VI. VII. VIII. IX. X. XI. XII. XIV. XV. XVI. XVII. XVIII. XIV. XV. XVI. XVII. XVIII. XIX. XX. XXI. XXII. |
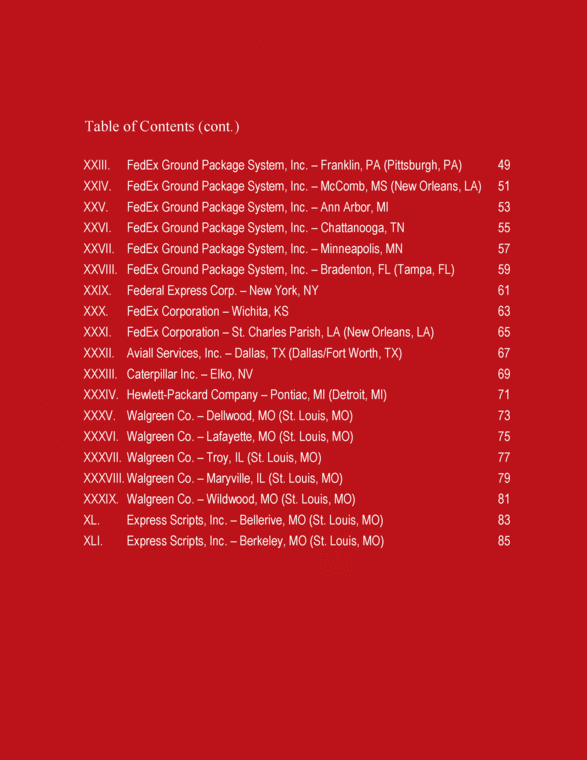
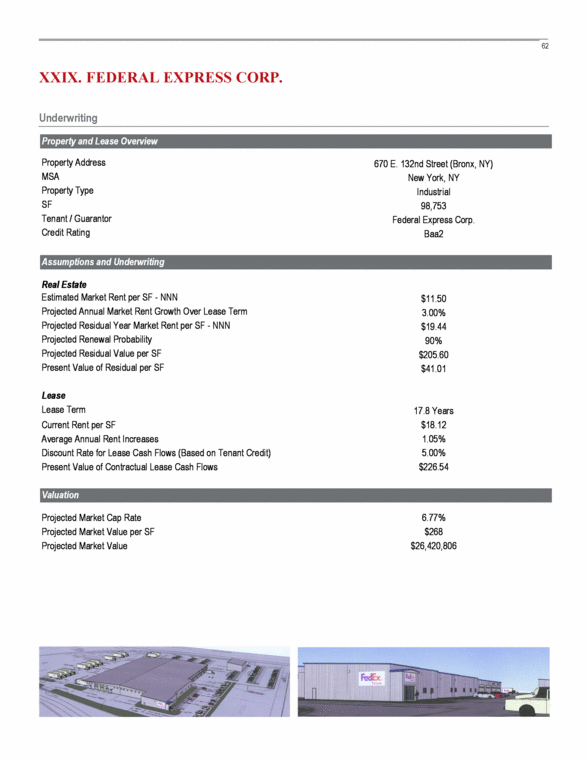
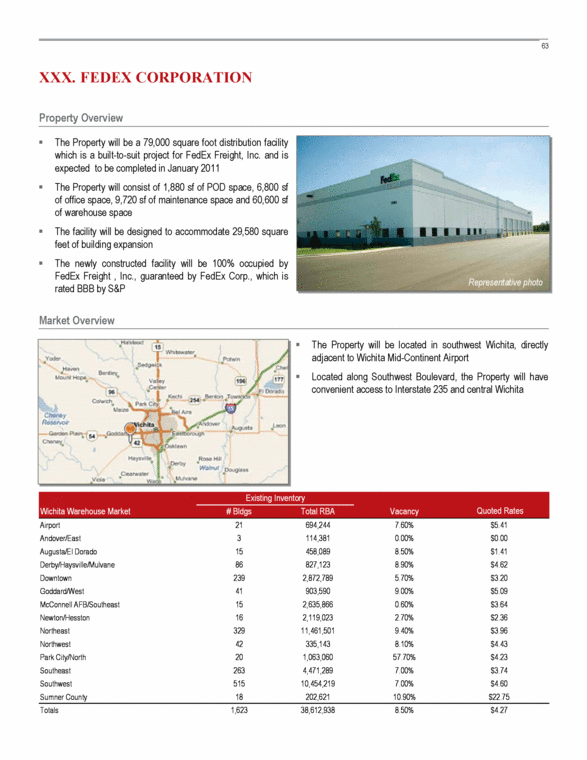
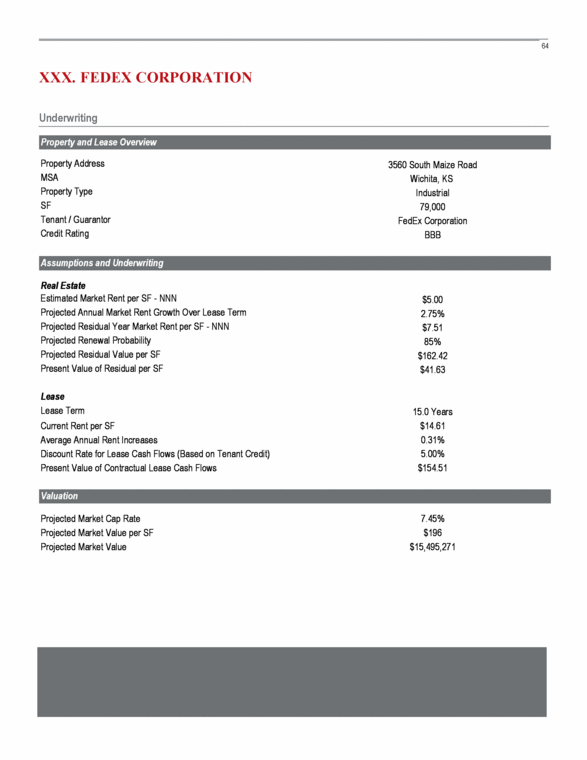
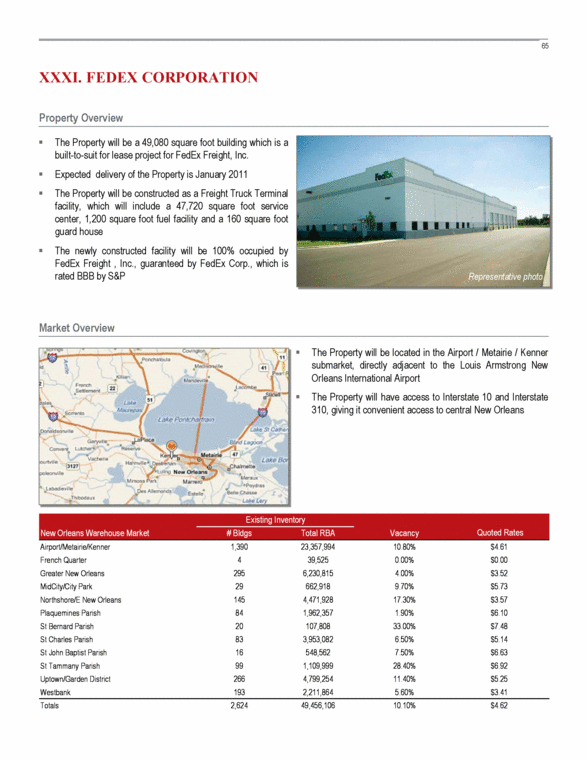
| FedEx Ground Package System, Inc. – Franklin, PA (Pittsburgh, PA) 49 FedEx Ground Package System, Inc. – McComb, MS (New Orleans, LA) 51 FedEx Ground Package System, Inc. – Ann Arbor, MI 53 FedEx Ground Package System, Inc. – Chattanooga, TN 55 FedEx Ground Package System, Inc. – Minneapolis, MN 57 FedEx Ground Package System, Inc. – Bradenton, FL (Tampa, FL) 59 Federal Express Corp. – New York, NY 61 FedEx Corporation – Wichita, KS 63 FedEx Corporation – St. Charles Parish, LA (New Orleans, LA) 65 Aviall Services, Inc. – Dallas, TX (Dallas/Fort Worth, TX) 67 Caterpillar Inc. – Elko, NV 69 Hewlett-Packard Company – Pontiac, MI (Detroit, MI) 71 Walgreen Co. – Dellwood, MO (St. Louis, MO) 73 Walgreen Co. – Lafayette, MO (St. Louis, MO) 75 Walgreen Co. – Troy, IL (St. Louis, MO) 77 Walgreen Co. – Maryville, IL (St. Louis, MO) 79 Walgreen Co. – Wildwood, MO (St. Louis, MO) 81 Express Scripts, Inc. – Bellerive, MO (St. Louis, MO) 83 Express Scripts, Inc. – Berkeley, MO (St. Louis, MO) 85 Table of Contents (cont.) XXIII. XXIV. XXV. XXVI. XXVII. XXVIII. XXIX. XXX. XXXI. XXXII. XXXIII. XXXIV. XXXV. XXXVI. XXXVII. XXXVIII. XXXIX. XL. XLI. |
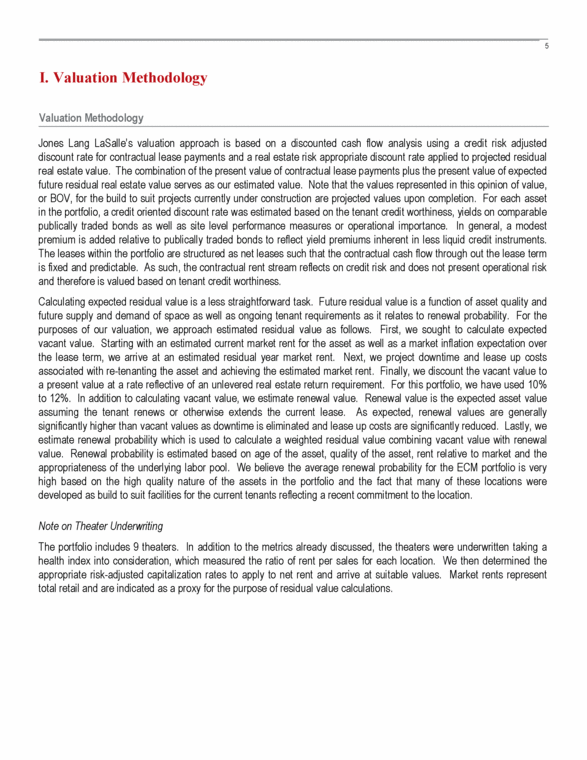
| I. Valuation Methodology Valuation Methodology Jones Lang LaSalle’s valuation approach is based on a discounted cash flow analysis using a credit risk adjusted discount rate for contractual lease payments and a real estate risk appropriate discount rate applied to projected residual real estate value. The combination of the present value of contractual lease payments plus the present value of expected future residual real estate value serves as our estimated value. Note that the values represented in this opinion of value, or BOV, for the build to suit projects currently under construction are projected values upon completion. For each asset in the portfolio, a credit oriented discount rate was estimated based on the tenant credit worthiness, yields on comparable publically traded bonds as well as site level performance measures or operational importance. In general, a modest premium is added relative to publically traded bonds to reflect yield premiums inherent in less liquid credit instruments. The leases within the portfolio are structured as net leases such that the contractual cash flow through out the lease term is fixed and predictable. As such, the contractual rent stream reflects on credit risk and does not present operational risk and therefore is valued based on tenant credit worthiness. Calculating expected residual value is a less straightforward task. Future residual value is a function of asset quality and future supply and demand of space as well as ongoing tenant requirements as it relates to renewal probability. For the purposes of our valuation, we approach estimated residual value as follows. First, we sought to calculate expected vacant value. Starting with an estimated current market rent for the asset as well as a market inflation expectation over the lease term, we arrive at an estimated residual year market rent. Next, we project downtime and lease up costs associated with re-tenanting the asset and achieving the estimated market rent. Finally, we discount the vacant value to a present value at a rate reflective of an unlevered real estate return requirement. For this portfolio, we have used 10% to 12%. In addition to calculating vacant value, we estimate renewal value. Renewal value is the expected asset value assuming the tenant renews or otherwise extends the current lease. As expected, renewal values are generally significantly higher than vacant values as downtime is eliminated and lease up costs are significantly reduced. Lastly, we estimate renewal probability which is used to calculate a weighted residual value combining vacant value with renewal value. Renewal probability is estimated based on age of the asset, quality of the asset, rent relative to market and the appropriateness of the underlying labor pool. We believe the average renewal probability for the ECM portfolio is very high based on the high quality nature of the assets in the portfolio and the fact that many of these locations were developed as build to suit facilities for the current tenants reflecting a recent commitment to the location. Note on Theater Underwriting The portfolio includes 9 theaters. In addition to the metrics already discussed, the theaters were underwritten taking a health index into consideration, which measured the ratio of rent per sales for each location. We then determined the appropriate risk-adjusted capitalization rates to apply to net rent and arrive at suitable values. Market rents represent total retail and are indicated as a proxy for the purpose of residual value calculations. |
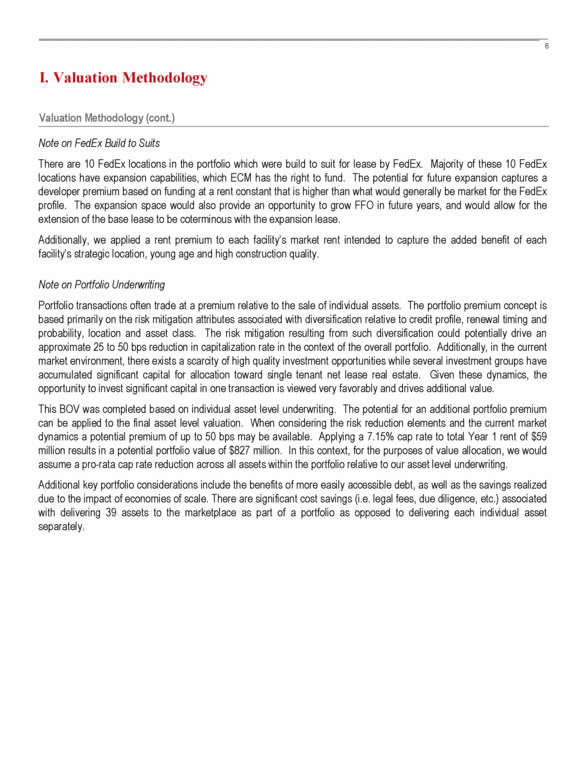
| Valuation Methodology (cont.) Note on FedEx Build to Suits There are 10 FedEx locations in the portfolio which were build to suit for lease by FedEx. Majority of these 10 FedEx locations have expansion capabilities, which ECM has the right to fund. The potential for future expansion captures a developer premium based on funding at a rent constant that is higher than what would generally be market for the FedEx profile. The expansion space would also provide an opportunity to grow FFO in future years, and would allow for the extension of the base lease to be coterminous with the expansion lease. Additionally, we applied a rent premium to each facility’s market rent intended to capture the added benefit of each facility’s strategic location, young age and high construction quality. Note on Portfolio Underwriting Portfolio transactions often trade at a premium relative to the sale of individual assets. The portfolio premium concept is based primarily on the risk mitigation attributes associated with diversification relative to credit profile, renewal timing and probability, location and asset class. The risk mitigation resulting from such diversification could potentially drive an approximate 25 to 50 bps reduction in capitalization rate in the context of the overall portfolio. Additionally, in the current market environment, there exists a scarcity of high quality investment opportunities while several investment groups have accumulated significant capital for allocation toward single tenant net lease real estate. Given these dynamics, the opportunity to invest significant capital in one transaction is viewed very favorably and drives additional value. This BOV was completed based on individual asset level underwriting. The potential for an additional portfolio premium can be applied to the final asset level valuation. When considering the risk reduction elements and the current market dynamics a potential premium of up to 50 bps may be available. Applying a 7.15% cap rate to total Year 1 rent of $59 million results in a potential portfolio value of $827 million. In this context, for the purposes of value allocation, we would assume a pro-rata cap rate reduction across all assets within the portfolio relative to our asset level underwriting. Additional key portfolio considerations include the benefits of more easily accessible debt, as well as the savings realized due to the impact of economies of scale. There are significant cost savings (i.e. legal fees, due diligence, etc.) associated with delivering 39 assets to the marketplace as part of a portfolio as opposed to delivering each individual asset separately. I. Valuation Methodology |
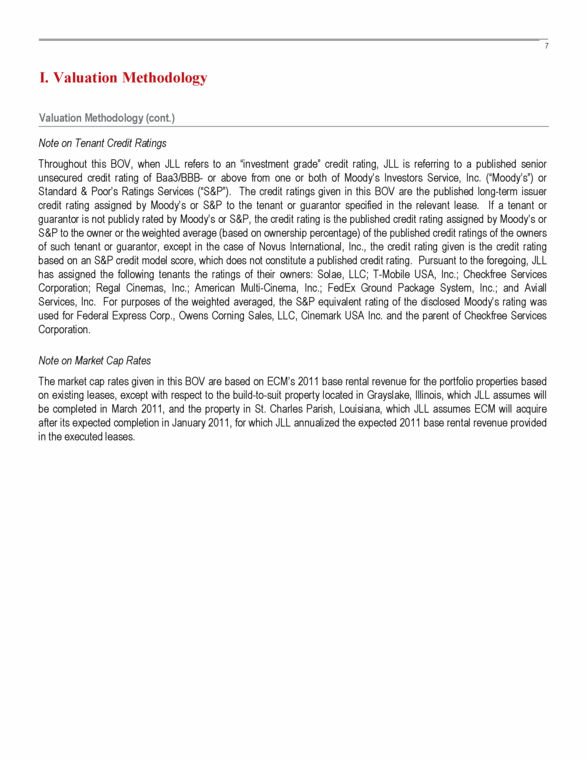
| Valuation Methodology (cont.) Note on Tenant Credit Ratings Throughout this BOV, when JLL refers to an “investment grade” credit rating, JLL is referring to a published senior unsecured credit rating of Baa3/BBB- or above from one or both of Moody’s Investors Service, Inc. (“Moody’s”) or Standard & Poor’s Ratings Services (“S&P”). The credit ratings given in this BOV are the published long-term issuer credit rating assigned by Moody’s or S&P to the tenant or guarantor specified in the relevant lease. If a tenant or guarantor is not publicly rated by Moody’s or S&P, the credit rating is the published credit rating assigned by Moody’s or S&P to the owner or the weighted average (based on ownership percentage) of the published credit ratings of the owners of such tenant or guarantor, except in the case of Novus International, Inc., the credit rating given is the credit rating based on an S&P credit model score, which does not constitute a published credit rating. Pursuant to the foregoing, JLL has assigned the following tenants the ratings of their owners: Solae, LLC; T-Mobile USA, Inc.; Checkfree Services Corporation; Regal Cinemas, Inc.; American Multi-Cinema, Inc.; FedEx Ground Package System, Inc.; and Aviall Services, Inc. For purposes of the weighted averaged, the S&P equivalent rating of the disclosed Moody’s rating was used for Federal Express Corp., Owens Corning Sales, LLC, Cinemark USA Inc. and the parent of Checkfree Services Corporation. Note on Market Cap Rates The market cap rates given in this BOV are based on ECM’s 2011 base rental revenue for the portfolio properties based on existing leases, except with respect to the build-to-suit property located in Grayslake, Illinois, which JLL assumes will be completed in March 2011, and the property in St. Charles Parish, Louisiana, which JLL assumes ECM will acquire after its expected completion in January 2011, for which JLL annualized the expected 2011 base rental revenue provided in the executed leases. I. Valuation Methodology |
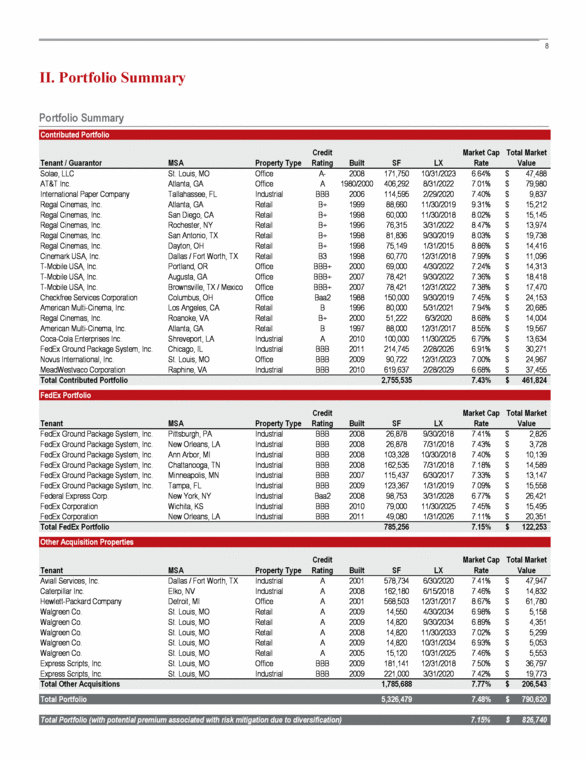
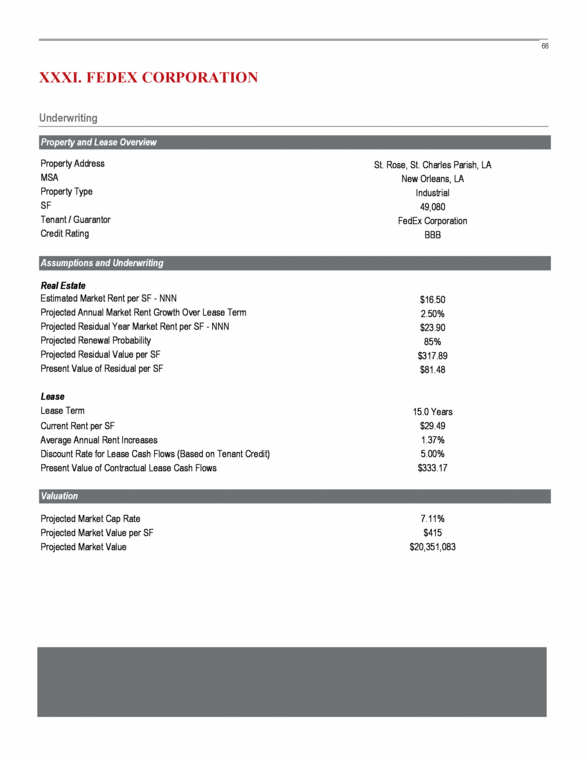
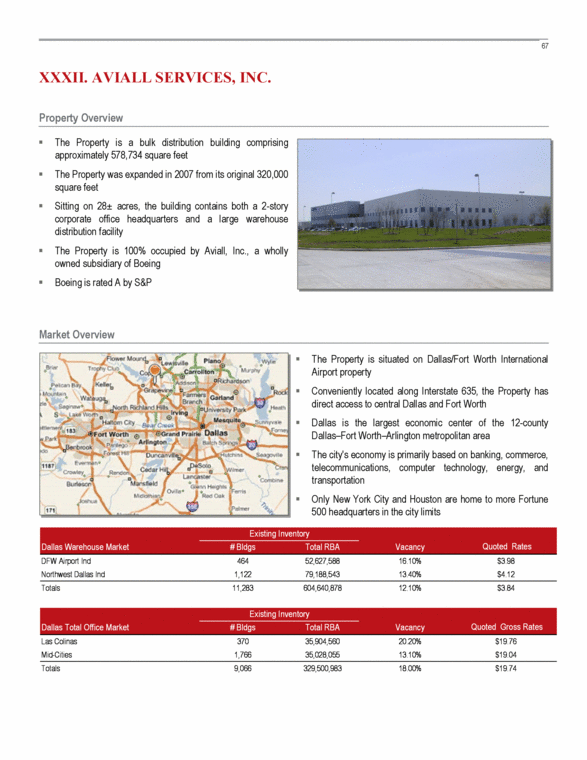
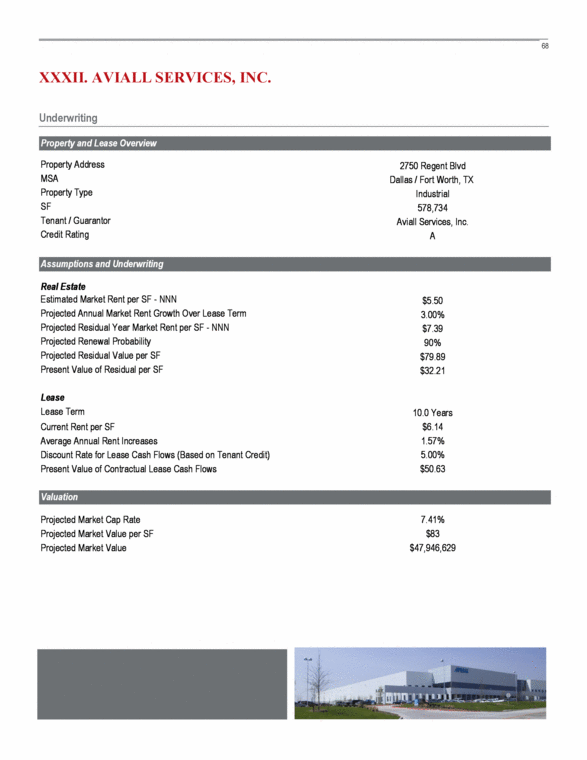
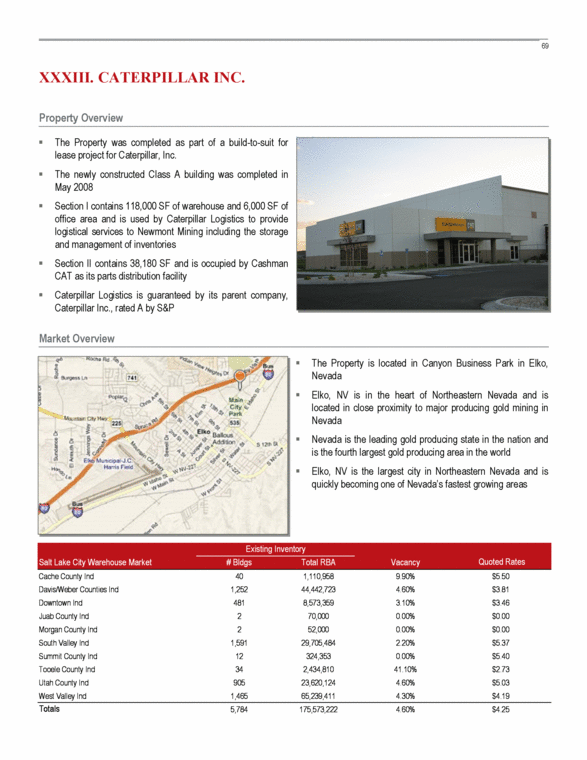
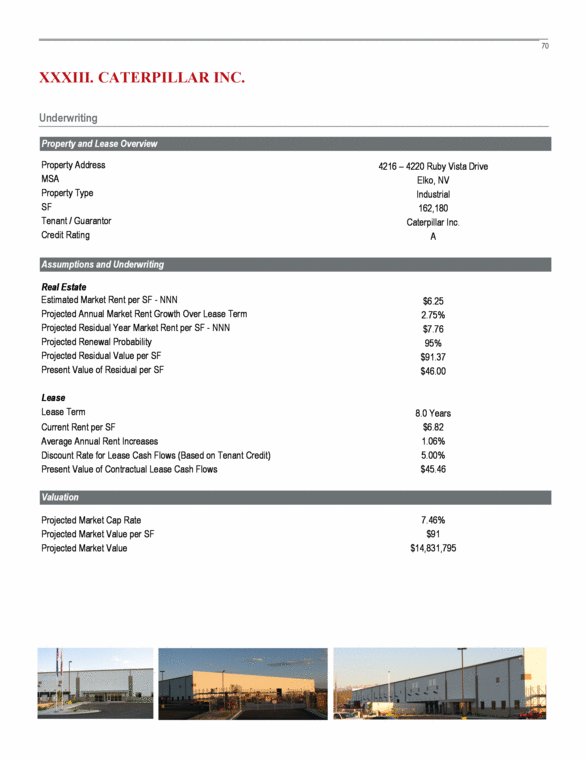
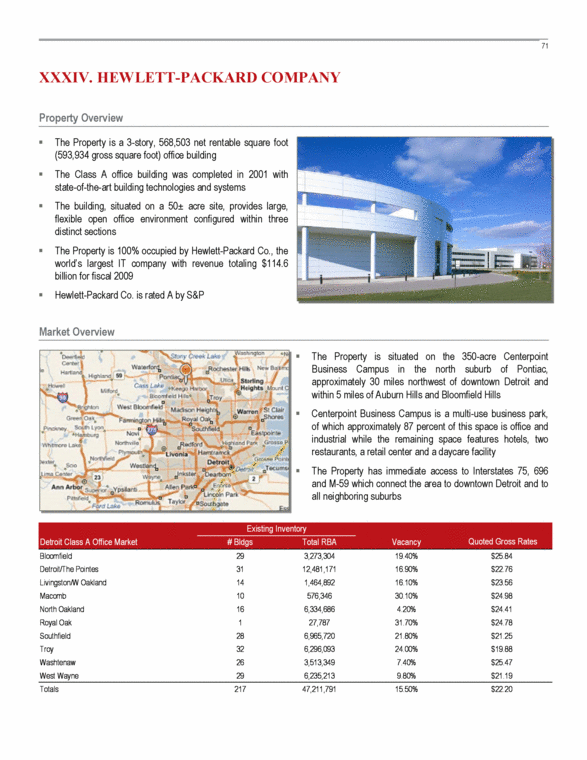
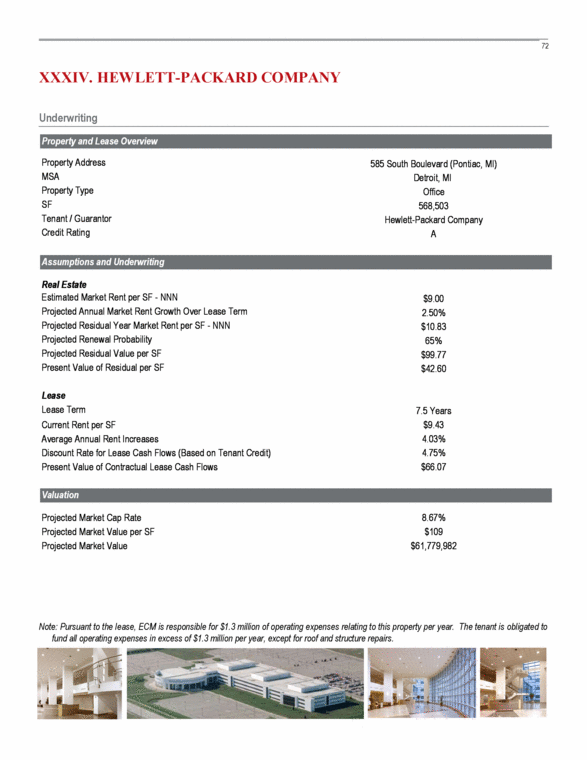
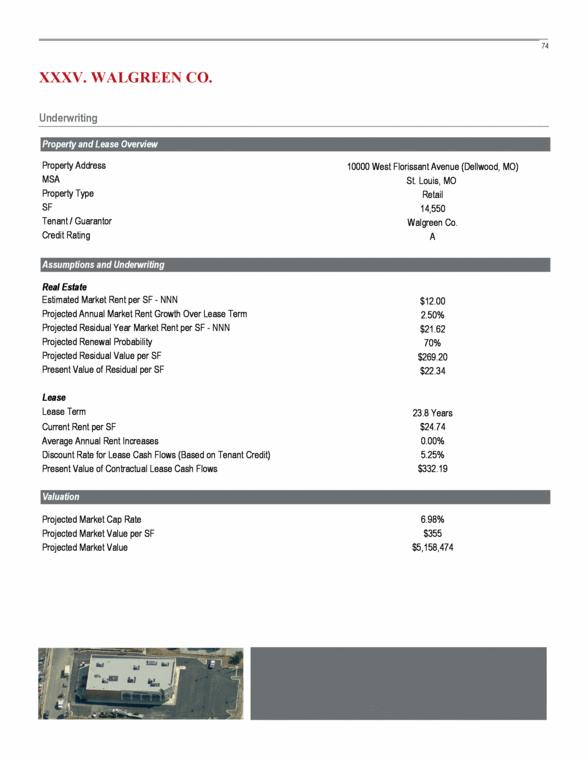
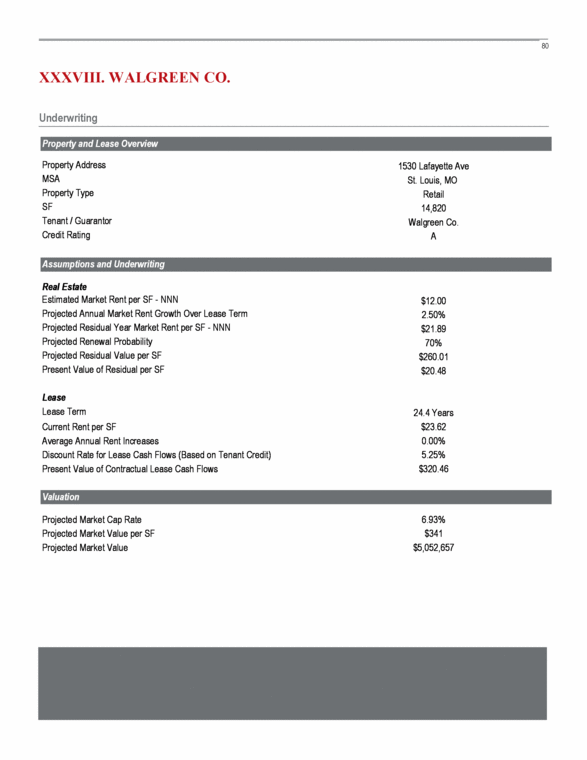
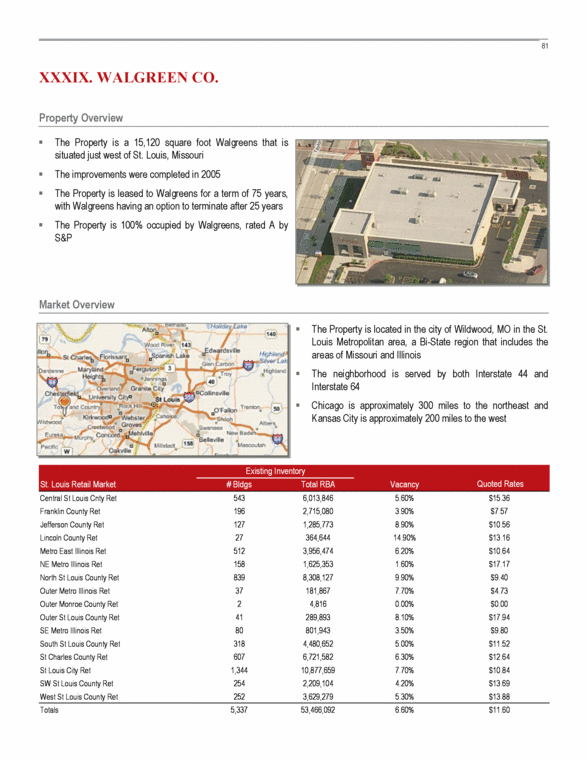
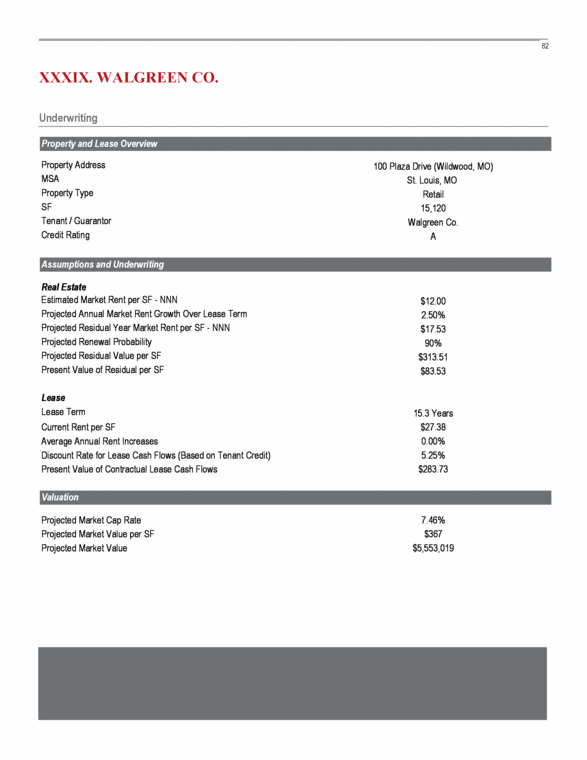
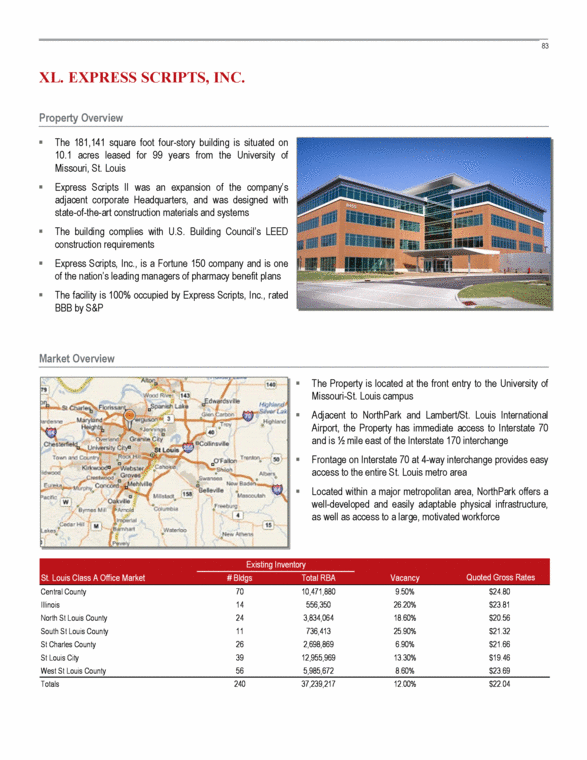
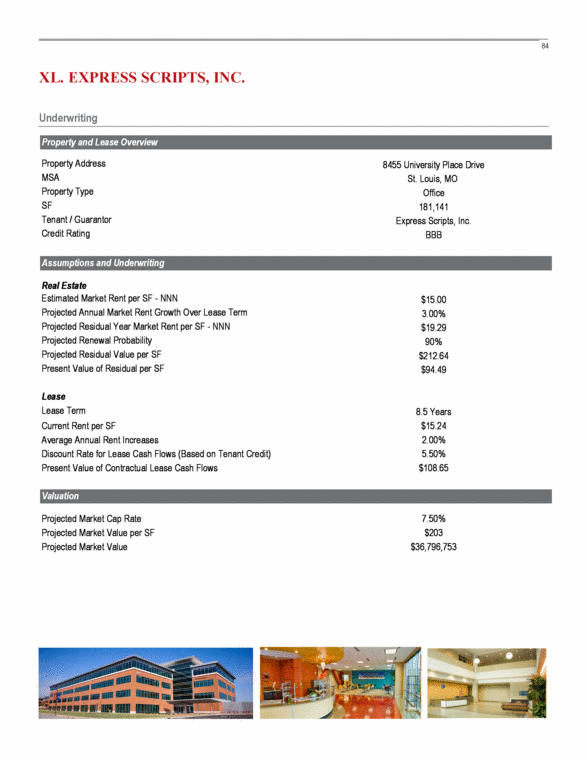
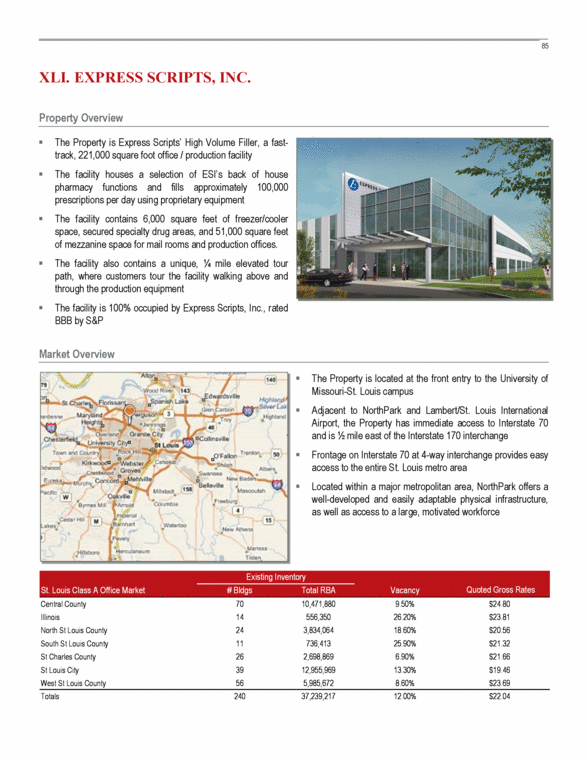
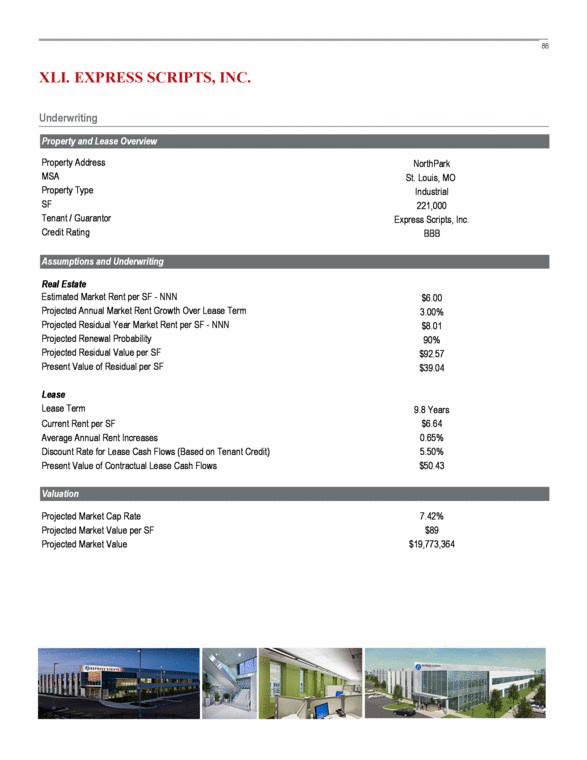
| II. Portfolio Summary Portfolio Summary Contributed Portfolio Tenant / Guarantor MSA Property Type Credit Rating Built SF LX Market Cap Rate Total Market Value Solae, LLC St. Louis, MO Office A- 2008 171,750 10/31/2023 6.64% 47,488 $ AT&T Inc. Atlanta, GA Office A 1980/2000 406,292 8/31/2022 7.01% 79,980 $ International Paper Company Tallahassee, FL Industrial BBB 2006 114,595 2/29/2020 7.40% 9,837 $ Regal Cinemas, Inc. Atlanta, GA Retail B+ 1999 88,660 11/30/2019 9.31% 15,212 $ Regal Cinemas, Inc. San Diego, CA Retail B+ 1998 60,000 11/30/2018 8.02% 15,145 $ Regal Cinemas, Inc. Rochester, NY Retail B+ 1996 76,315 3/31/2022 8.47% 13,974 $ Regal Cinemas, Inc. San Antonio, TX Retail B+ 1998 81,836 9/30/2019 8.03% 19,738 $ Regal Cinemas, Inc. Dayton, OH Retail B+ 1998 75,149 1/31/2015 8.86% 14,416 $ Cinemark USA, Inc. Dallas / Fort Worth, TX Retail B3 1998 60,770 12/31/2018 7.99% 11,096 $ T-Mobile USA, Inc. Portland, OR Office BBB+ 2000 69,000 4/30/2022 7.24% 14,313 $ T-Mobile USA, Inc. Augusta, GA Office BBB+ 2007 78,421 9/30/2022 7.36% 18,418 $ T-Mobile USA, Inc. Brownsville, TX / Mexico Office BBB+ 2007 78,421 12/31/2022 7.38% 17,470 $ Checkfree Services Corporation Columbus, OH Office Baa2 1988 150,000 9/30/2019 7.45% 24,153 $ American Multi-Cinema, Inc. Los Angeles, CA Retail B 1996 80,000 5/31/2021 7.94% 20,685 $ Regal Cinemas, Inc. Roanoke, VA Retail B+ 2000 51,222 6/3/2020 8.68% 14,004 $ American Multi-Cinema, Inc. Atlanta, GA Retail B 1997 88,000 12/31/2017 8.55% 19,567 $ Coca-Cola Enterprises Inc. Shreveport, LA Industrial A 2010 100,000 11/30/2025 6.79% 13,634 $ FedEx Ground Package System, Inc. Chicago, IL Industrial BBB 2011 214,745 2/28/2026 6.91% 30,271 $ Novus International, Inc. St. Louis, MO Office BBB 2009 90,722 12/31/2023 7.00% 24,967 $ MeadWestvaco Corporation Raphine, VA Industrial BBB 2010 619,637 2/28/2029 6.68% 37,455 $ Total Contributed Portfolio 2,755,535 7.43% 461,824 $ FedEx Portfolio Tenant MSA Property Type Credit Rating Built SF LX Market Cap Rate Total Market Value FedEx Ground Package System, Inc. Pittsburgh, PA Industrial BBB 2008 26,878 9/30/2018 7.41% 2,826 $ FedEx Ground Package System, Inc. New Orleans, LA Industrial BBB 2008 26,878 7/31/2018 7.43% 3,728 $ FedEx Ground Package System, Inc. Ann Arbor, MI Industrial BBB 2008 103,328 10/30/2018 7.40% 10,139 $ FedEx Ground Package System, Inc. Chattanooga, TN Industrial BBB 2008 162,535 7/31/2018 7.18% 14,589 $ FedEx Ground Package System, Inc. Minneapolis, MN Industrial BBB 2007 115,437 6/30/2017 7.33% 13,147 $ FedEx Ground Package System, Inc. Tampa, FL Industrial BBB 2009 123,367 1/31/2019 7.09% 15,558 $ Federal Express Corp. New York, NY Industrial Baa2 2008 98,753 3/31/2028 6.77% 26,421 $ FedEx Corporation Wichita, KS Industrial BBB 2010 79,000 11/30/2025 7.45% 15,495 $ FedEx Corporation New Orleans, LA Industrial BBB 2011 49,080 1/31/2026 7.11% 20,351 $ Total FedEx Portfolio 785,256 7.15% 122,253 $ Other Acquisition Properties Tenant MSA Property Type Credit Rating Built SF LX Market Cap Rate Total Market Value Aviall Services, Inc. Dallas / Fort Worth, TX Industrial A 2001 578,734 6/30/2020 7.41% 47,947 $ Caterpillar Inc. Elko, NV Industrial A 2008 162,180 6/15/2018 7.46% 14,832 $ Hewlett-Packard Company Detroit, MI Office A 2001 568,503 12/31/2017 8.67% 61,780 $ Walgreen Co. St. Louis, MO Retail A 2009 14,550 4/30/2034 6.98% 5,158 $ Walgreen Co. St. Louis, MO Retail A 2009 14,820 9/30/2034 6.89% 4,351 $ Walgreen Co. St. Louis, MO Retail A 2008 14,820 11/30/2033 7.02% 5,299 $ Walgreen Co. St. Louis, MO Retail A 2009 14,820 10/31/2034 6.93% 5,053 $ Walgreen Co. St. Louis, MO Retail A 2005 15,120 10/31/2025 7.46% 5,553 $ Express Scripts, Inc. St. Louis, MO Office BBB 2009 181,141 12/31/2018 7.50% 36,797 $ Express Scripts, Inc. St. Louis, MO Industrial BBB 2009 221,000 3/31/2020 7.42% 19,773 $ Total Other Acquisitions 1,785,688 7.77% 206,543 $ Total Portfolio 5,326,479 7.48% 790,620 $ Total Portfolio (with potential premium associated with risk mitigation due to diversification) 7.15% 826,740 $ |
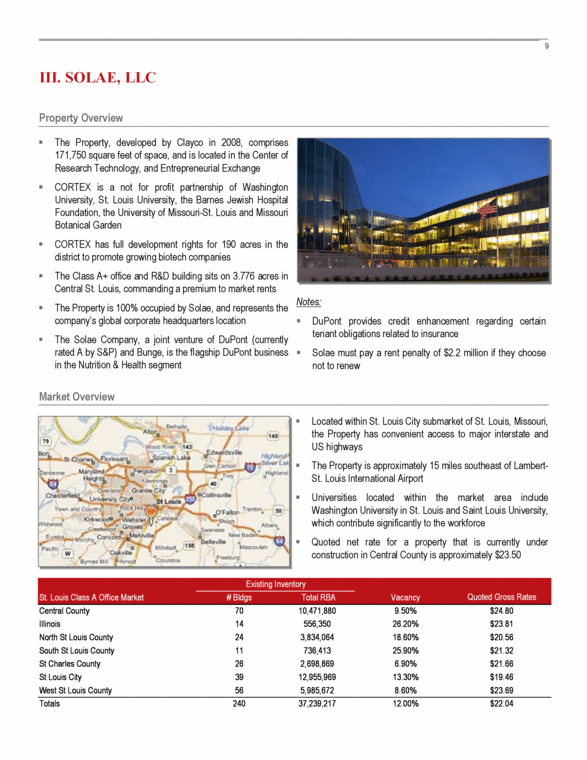
| III. SOLAE, LLC The Property, developed by Clayco in 2008, comprises 171,750 square feet of space, and is located in the Center of Research Technology, and Entrepreneurial Exchange CORTEX is a not for profit partnership of Washington University, St. Louis University, the Barnes Jewish Hospital Foundation, the University of Missouri-St. Louis and Missouri Botanical Garden CORTEX has full development rights for 190 acres in the district to promote growing biotech companies The Class A+ office and R&D building sits on 3.776 acres in Central St. Louis, commanding a premium to market rents The Property is 100% occupied by Solae, and represents the company’s global corporate headquarters location The Solae Company, a joint venture of DuPont (currently rated A by S&P) and Bunge, is the flagship DuPont business in the Nutrition & Health segment Property Overview Market Overview Located within St. Louis City submarket of St. Louis, Missouri, the Property has convenient access to major interstate and US highways The Property is approximately 15 miles southeast of Lambert-St. Louis International Airport Universities located within the market area include Washington University in St. Louis and Saint Louis University, which contribute significantly to the workforce Quoted net rate for a property that is currently under construction in Central County is approximately $23.50 Notes: DuPont provides credit enhancement regarding certain tenant obligations related to insurance Solae must pay a rent penalty of $2.2 million if they choose not to renew St. Louis Class A Office Market # Bldgs Total RBA Central County 70 10,471,880 9.50% $24.80 Illinois 14 556,350 26.20% $23.81 North St Louis County 24 3,834,064 18.60% $20.56 South St Louis County 11 736,413 25.90% $21.32 St Charles County 26 2,698,869 6.90% $21.66 St Louis City 39 12,955,969 13.30% $19.46 West St Louis County 56 5,985,672 8.60% $23.69 Totals 240 37,239,217 12.00% $22.04 Quoted Gross Rates Existing Inventory Vacancy |
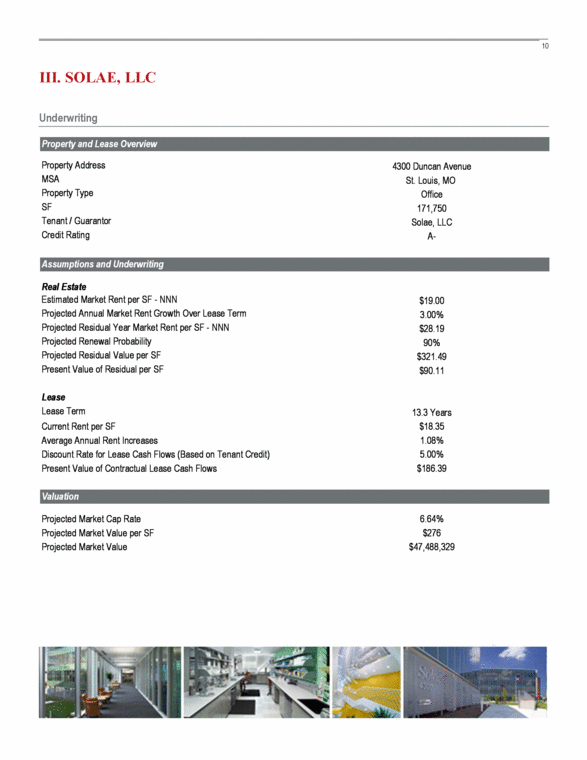
| Underwriting III. SOLAE, LLC Property and Lease Overview Property Address 4300 Duncan Avenue MSA St. Louis, MO Property Type Office SF 171,750 Tenant / Guarantor Solae, LLC Credit Rating A- Assumptions and Underwriting Real Estate Estimated Market Rent per SF - NNN $19.00 Projected Annual Market Rent Growth Over Lease Term 3.00% Projected Residual Year Market Rent per SF - NNN $28.19 Projected Renewal Probability 90% Projected Residual Value per SF $321.49 Present Value of Residual per SF $90.11 Lease Lease Term 13.3 Years Current Rent per SF $18.35 Average Annual Rent Increases 1.08% Discount Rate for Lease Cash Flows (Based on Tenant Credit) 5.00% Present Value of Contractual Lease Cash Flows $186.39 Valuation Projected Market Cap Rate 6.64% Projected Market Value per SF $276 Projected Market Value $47,488,329 |
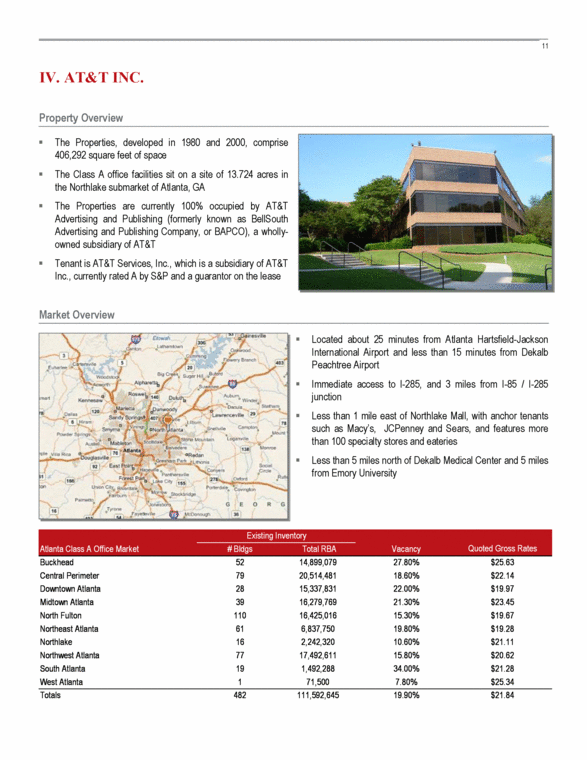
| IV. AT&T INC. The Properties, developed in 1980 and 2000, comprise 406,292 square feet of space The Class A office facilities sit on a site of 13.724 acres in the Northlake submarket of Atlanta, GA The Properties are currently 100% occupied by AT&T Advertising and Publishing (formerly known as BellSouth Advertising and Publishing Company, or BAPCO), a wholly-owned subsidiary of AT&T Tenant is AT&T Services, Inc., which is a subsidiary of AT&T Inc., currently rated A by S&P and a guarantor on the lease Property Overview Market Overview Located about 25 minutes from Atlanta Hartsfield-Jackson International Airport and less than 15 minutes from Dekalb Peachtree Airport Immediate access to I-285, and 3 miles from I-85 / I-285 junction Less than 1 mile east of Northlake Mall, with anchor tenants such as Macy’s, JCPenney and Sears, and features more than 100 specialty stores and eateries Less than 5 miles north of Dekalb Medical Center and 5 miles from Emory University Atlanta Class A Office Market # Bldgs Total RBA Buckhead 52 14,899,079 27.80% $25.63 Central Perimeter 79 20,514,481 18.60% $22.14 Downtown Atlanta 28 15,337,831 22.00% $19.97 Midtown Atlanta 39 16,279,769 21.30% $23.45 North Fulton 110 16,425,016 15.30% $19.67 Northeast Atlanta 61 6,837,750 19.80% $19.28 Northlake 16 2,242,320 10.60% $21.11 Northwest Atlanta 77 17,492,611 15.80% $20.62 South Atlanta 19 1,492,288 34.00% $21.28 West Atlanta 1 71,500 7.80% $25.34 Totals 482 111,592,645 19.90% $21.84 Quoted Gross Rates Existing Inventory Vacancy |
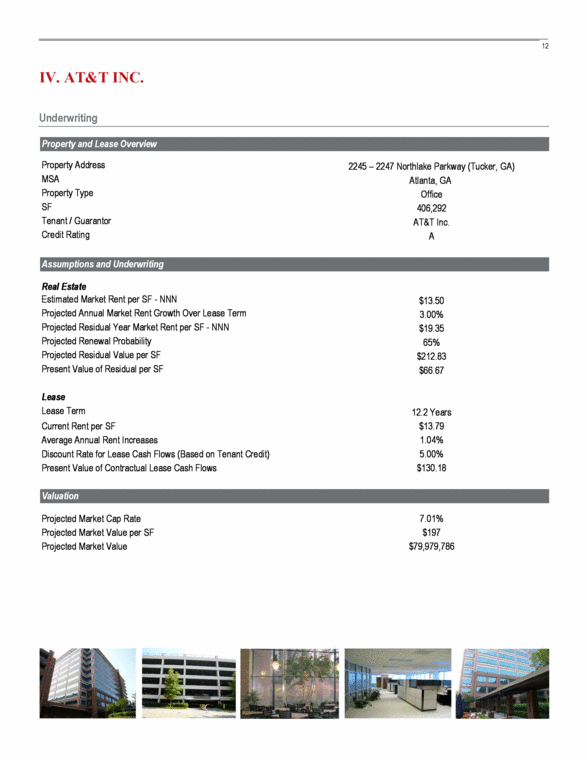
| Underwriting IV. AT&T INC. Property and Lease Overview Property Address 2245 – 2247 Northlake Parkway (Tucker, GA) MSA Atlanta, GA Property Type Office SF 406,292 Tenant / Guarantor AT&T Inc. Credit Rating A Assumptions and Underwriting Real Estate Estimated Market Rent per SF - NNN $13.50 Projected Annual Market Rent Growth Over Lease Term 3.00% Projected Residual Year Market Rent per SF - NNN $19.35 Projected Renewal Probability 65% Projected Residual Value per SF $212.83 Present Value of Residual per SF $66.67 Lease Lease Term 12.2 Years Current Rent per SF $13.79 Average Annual Rent Increases 1.04% Discount Rate for Lease Cash Flows (Based on Tenant Credit) 5.00% Present Value of Contractual Lease Cash Flows $130.18 Valuation Projected Market Cap Rate 7.01% Projected Market Value per SF $197 Projected Market Value $79,979,786 |
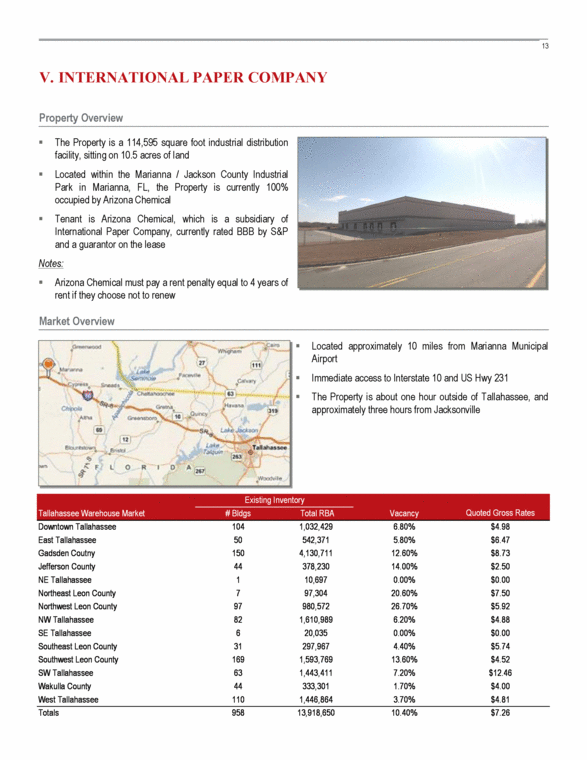
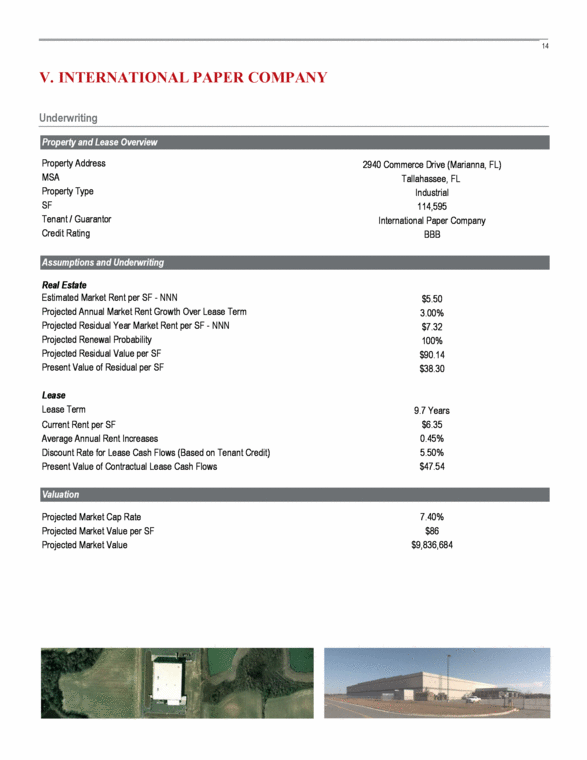
| V. INTERNATIONAL PAPER COMPANY The Property is a 114,595 square foot industrial distribution facility, sitting on 10.5 acres of land Located within the Marianna / Jackson County Industrial Park in Marianna, FL, the Property is currently 100% occupied by Arizona Chemical Tenant is Arizona Chemical, which is a subsidiary of International Paper Company, currently rated BBB by S&P and a guarantor on the lease Notes: Arizona Chemical must pay a rent penalty equal to 4 years of rent if they choose not to renew Property Overview Market Overview Located approximately 10 miles from Marianna Municipal Airport Immediate access to Interstate 10 and US Hwy 231 The Property is about one hour outside of Tallahassee, and approximately three hours from Jacksonville Tallahassee Warehouse Market # Bldgs Total RBA Downtown Tallahassee 104 1,032,429 6.80% $4.98 East Tallahassee 50 542,371 5.80% $6.47 Gadsden Coutny 150 4,130,711 12.60% $8.73 Jefferson County 44 378,230 14.00% $2.50 NE Tallahassee 1 10,697 0.00% $0.00 Northeast Leon County 7 97,304 20.60% $7.50 Northwest Leon County 97 980,572 26.70% $5.92 NW Tallahassee 82 1,610,989 6.20% $4.88 SE Tallahassee 6 20,035 0.00% $0.00 Southeast Leon County 31 297,967 4.40% $5.74 Southwest Leon County 169 1,593,769 13.60% $4.52 SW Tallahassee 63 1,443,411 7.20% $12.46 Wakulla County 44 333,301 1.70% $4.00 West Tallahassee 110 1,446,864 3.70% $4.81 Totals 958 13,918,650 10.40% $7.26 Quoted Gross Rates Existing Inventory Vacancy |
| Underwriting V. INTERNATIONAL PAPER COMPANY Property and Lease Overview Property Address 2940 Commerce Drive (Marianna, FL) MSA Tallahassee, FL Property Type Industrial SF 114,595 Tenant / Guarantor International Paper Company Credit Rating BBB Assumptions and Underwriting Real Estate Estimated Market Rent per SF - NNN $5.50 Projected Annual Market Rent Growth Over Lease Term 3.00% Projected Residual Year Market Rent per SF - NNN $7.32 Projected Renewal Probability 100% Projected Residual Value per SF $90.14 Present Value of Residual per SF $38.30 Lease Lease Term 9.7 Years Current Rent per SF $6.35 Average Annual Rent Increases 0.45% Discount Rate for Lease Cash Flows (Based on Tenant Credit) 5.50% Present Value of Contractual Lease Cash Flows $47.54 Valuation Projected Market Cap Rate 7.40% Projected Market Value per SF $86 Projected Market Value $9,836,684 |
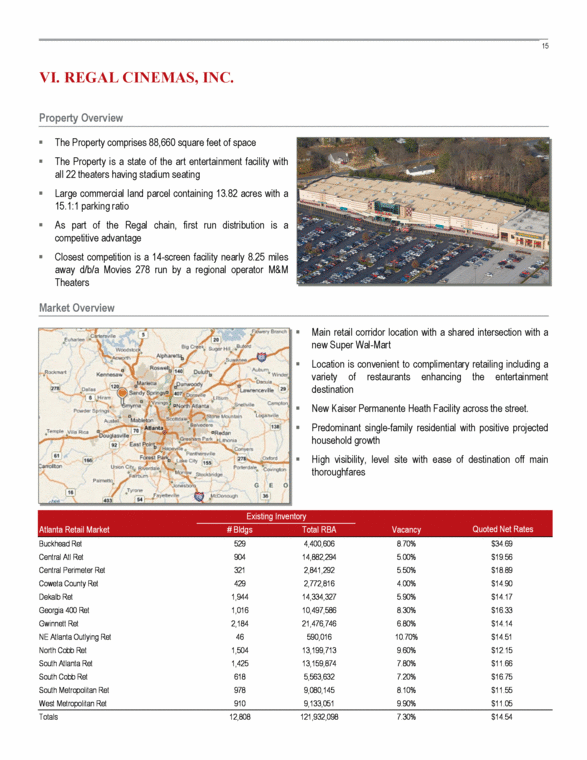
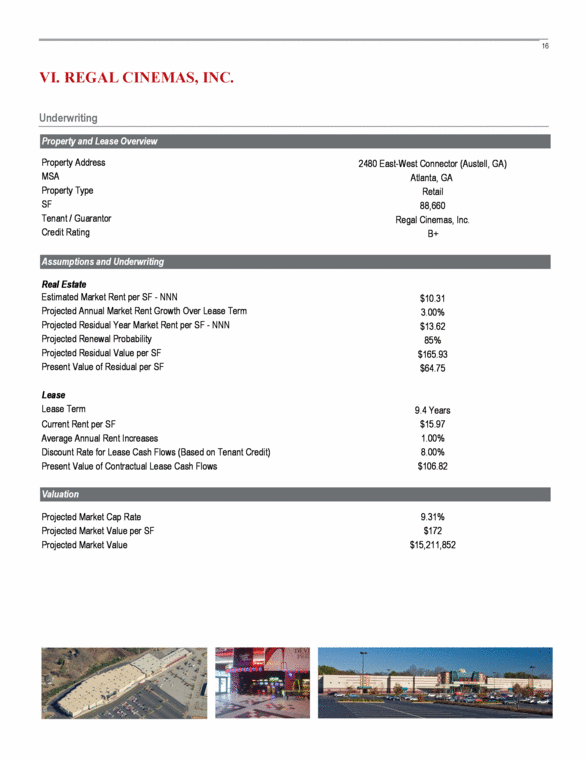
| VI. REGAL CINEMAS, INC. The Property comprises 88,660 square feet of space The Property is a state of the art entertainment facility with all 22 theaters having stadium seating Large commercial land parcel containing 13.82 acres with a 15.1:1 parking ratio As part of the Regal chain, first run distribution is a competitive advantage Closest competition is a 14-screen facility nearly 8.25 miles away d/b/a Movies 278 run by a regional operator M&M Theaters Property Overview Market Overview Main retail corridor location with a shared intersection with a new Super Wal-Mart Location is convenient to complimentary retailing including a variety of restaurants enhancing the entertainment destination New Kaiser Permanente Heath Facility across the street. Predominant single-family residential with positive projected household growth High visibility, level site with ease of destination off main thoroughfares Atlanta Retail Market # Bldgs Total RBA Buckhead Ret 529 4,400,606 8.70% $34.69 Central Atl Ret 904 14,882,294 5.00% $19.56 Central Perimeter Ret 321 2,841,292 5.50% $18.89 Coweta County Ret 429 2,772,816 4.00% $14.90 Dekalb Ret 1,944 14,334,327 5.90% $14.17 Georgia 400 Ret 1,016 10,497,586 8.30% $16.33 Gwinnett Ret 2,184 21,476,746 6.80% $14.14 NE Atlanta Outlying Ret 46 590,016 10.70% $14.51 North Cobb Ret 1,504 13,199,713 9.60% $12.15 South Atlanta Ret 1,425 13,159,874 7.80% $11.66 South Cobb Ret 618 5,563,632 7.20% $16.75 South Metropolitan Ret 978 9,080,145 8.10% $11.55 West Metropolitan Ret 910 9,133,051 9.90% $11.05 Totals 12,808 121,932,098 7.30% $14.54 Quoted Net Rates Existing Inventory Vacancy |
| Underwriting VI. REGAL CINEMAS, INC. Property and Lease Overview Property Address 2480 East-West Connector (Austell, GA) MSA Atlanta, GA Property Type Retail SF 88,660 Tenant / Guarantor Regal Cinemas, Inc. Credit Rating B+ Assumptions and Underwriting Real Estate Estimated Market Rent per SF - NNN $10.31 Projected Annual Market Rent Growth Over Lease Term 3.00% Projected Residual Year Market Rent per SF - NNN $13.62 Projected Renewal Probability 85% Projected Residual Value per SF $165.93 Present Value of Residual per SF $64.75 Lease Lease Term 9.4 Years Current Rent per SF $15.97 Average Annual Rent Increases 1.00% Discount Rate for Lease Cash Flows (Based on Tenant Credit) 8.00% Present Value of Contractual Lease Cash Flows $106.82 Valuation Projected Market Cap Rate 9.31% Projected Market Value per SF $172 Projected Market Value $15,211,852 |
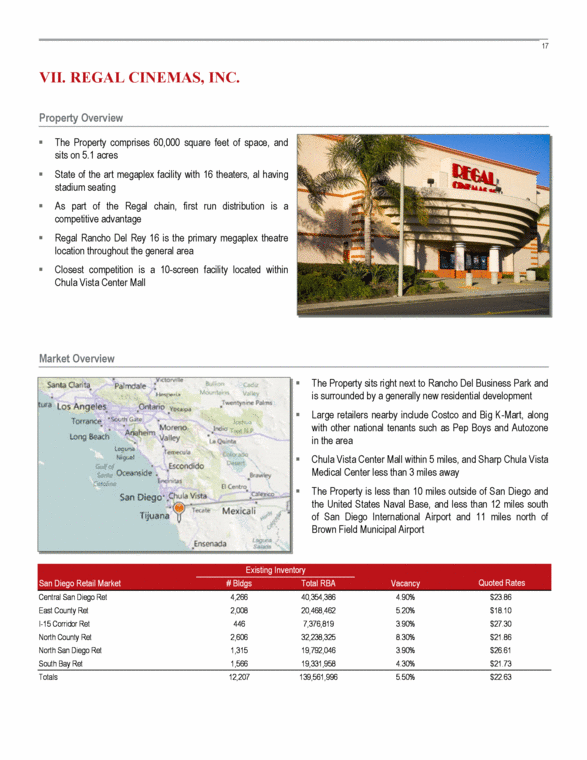
| VII. REGAL CINEMAS, INC. The Property comprises 60,000 square feet of space, and sits on 5.1 acres State of the art megaplex facility with 16 theaters, al having stadium seating As part of the Regal chain, first run distribution is a competitive advantage Regal Rancho Del Rey 16 is the primary megaplex theatre location throughout the general area Closest competition is a 10-screen facility located within Chula Vista Center Mall Property Overview Market Overview The Property sits right next to Rancho Del Business Park and is surrounded by a generally new residential development Large retailers nearby include Costco and Big K-Mart, along with other national tenants such as Pep Boys and Autozone in the area Chula Vista Center Mall within 5 miles, and Sharp Chula Vista Medical Center less than 3 miles away The Property is less than 10 miles outside of San Diego and the United States Naval Base, and less than 12 miles south of San Diego International Airport and 11 miles north of Brown Field Municipal Airport San Diego Retail Market # Bldgs Total RBA Central San Diego Ret 4,266 40,354,386 4.90% $23.86 East County Ret 2,008 20,468,462 5.20% $18.10 I-15 Corridor Ret 446 7,376,819 3.90% $27.30 North County Ret 2,606 32,238,325 8.30% $21.86 North San Diego Ret 1,315 19,792,046 3.90% $26.61 South Bay Ret 1,566 19,331,958 4.30% $21.73 Totals 12,207 139,561,996 5.50% $22.63 Quoted Rates Existing Inventory Vacancy |
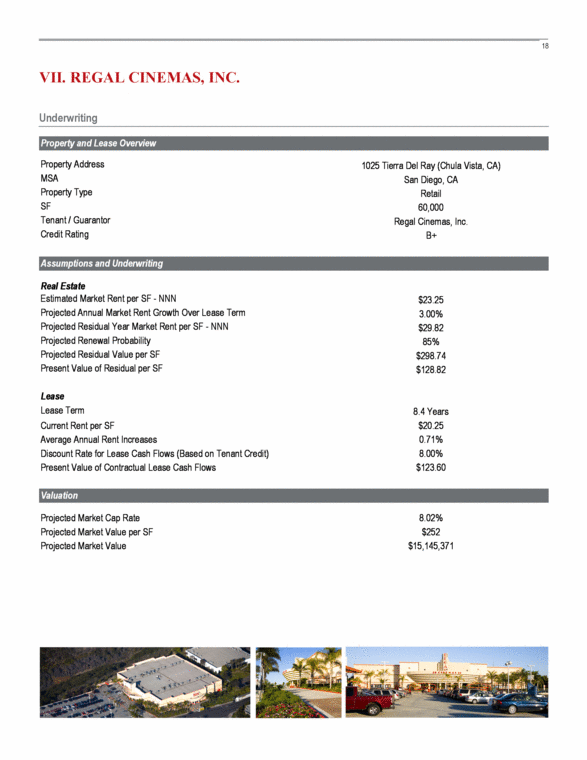
| Underwriting VII. REGAL CINEMAS, INC. Property and Lease Overview Property Address 1025 Tierra Del Ray (Chula Vista, CA) MSA San Diego, CA Property Type Retail SF 60,000 Tenant / Guarantor Regal Cinemas, Inc. Credit Rating B+ Assumptions and Underwriting Real Estate Estimated Market Rent per SF - NNN $23.25 Projected Annual Market Rent Growth Over Lease Term 3.00% Projected Residual Year Market Rent per SF - NNN $29.82 Projected Renewal Probability 85% Projected Residual Value per SF $298.74 Present Value of Residual per SF $128.82 Lease Lease Term 8.4 Years Current Rent per SF $20.25 Average Annual Rent Increases 0.71% Discount Rate for Lease Cash Flows (Based on Tenant Credit) 8.00% Present Value of Contractual Lease Cash Flows $123.60 Valuation Projected Market Cap Rate 8.02% Projected Market Value per SF $252 Projected Market Value $15,145,371 |
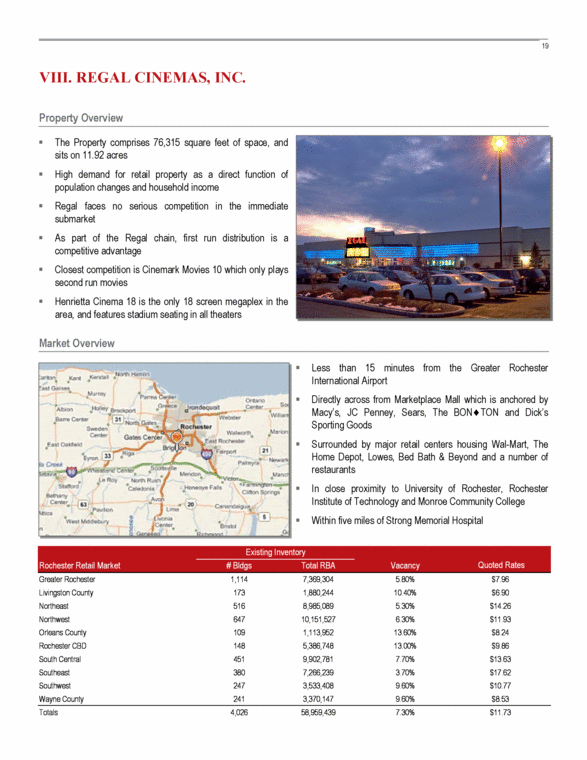
| VIII. REGAL CINEMAS, INC. The Property comprises 76,315 square feet of space, and sits on 11.92 acres High demand for retail property as a direct function of population changes and household income Regal faces no serious competition in the immediate submarket As part of the Regal chain, first run distribution is a competitive advantage Closest competition is Cinemark Movies 10 which only plays second run movies Henrietta Cinema 18 is the only 18 screen megaplex in the area, and features stadium seating in all theaters Property Overview Market Overview Less than 15 minutes from the Greater Rochester International Airport Directly across from Marketplace Mall which is anchored by Macy’s, JC Penney, Sears, The BON TON and Dick’s Sporting Goods Surrounded by major retail centers housing Wal-Mart, The Home Depot, Lowes, Bed Bath & Beyond and a number of restaurants In close proximity to University of Rochester, Rochester Institute of Technology and Monroe Community College Within five miles of Strong Memorial Hospital Rochester Retail Market # Bldgs Total RBA Greater Rochester 1,114 7,369,304 5.80% $7.96 Livingston County 173 1,880,244 10.40% $6.90 Northeast 516 8,985,089 5.30% $14.26 Northwest 647 10,151,527 6.30% $11.93 Orleans County 109 1,113,952 13.60% $8.24 Rochester CBD 148 5,386,748 13.00% $9.86 South Central 451 9,902,781 7.70% $13.63 Southeast 380 7,266,239 3.70% $17.62 Southwest 247 3,533,408 9.60% $10.77 Wayne County 241 3,370,147 9.60% $8.53 Totals 4,026 58,959,439 7.30% $11.73 Quoted Rates Existing Inventory Vacancy |
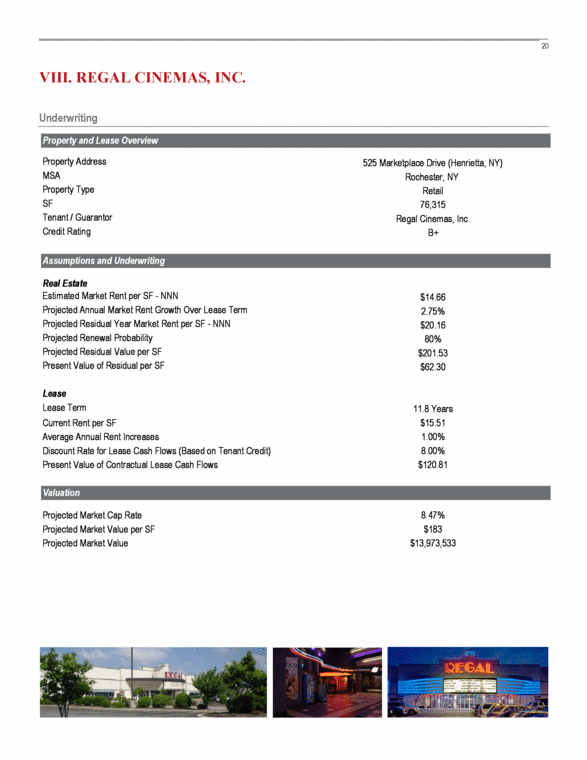
| Underwriting VIII. REGAL CINEMAS, INC. Property and Lease Overview Property Address 525 Marketplace Drive (Henrietta, NY) MSA Rochester, NY Property Type Retail SF 76,315 Tenant / Guarantor Regal Cinemas, Inc. Credit Rating B+ Assumptions and Underwriting Real Estate Estimated Market Rent per SF - NNN $14.66 Projected Annual Market Rent Growth Over Lease Term 2.75% Projected Residual Year Market Rent per SF - NNN $20.16 Projected Renewal Probability 80% Projected Residual Value per SF $201.53 Present Value of Residual per SF $62.30 Lease Lease Term 11.8 Years Current Rent per SF $15.51 Average Annual Rent Increases 1.00% Discount Rate for Lease Cash Flows (Based on Tenant Credit) 8.00% Present Value of Contractual Lease Cash Flows $120.81 Valuation Projected Market Cap Rate 8.47% Projected Market Value per SF $183 Projected Market Value $13,973,533 |
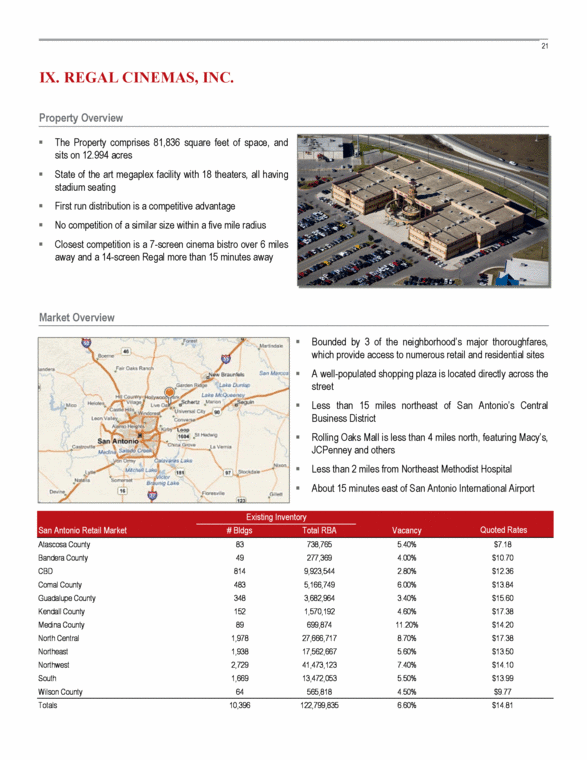
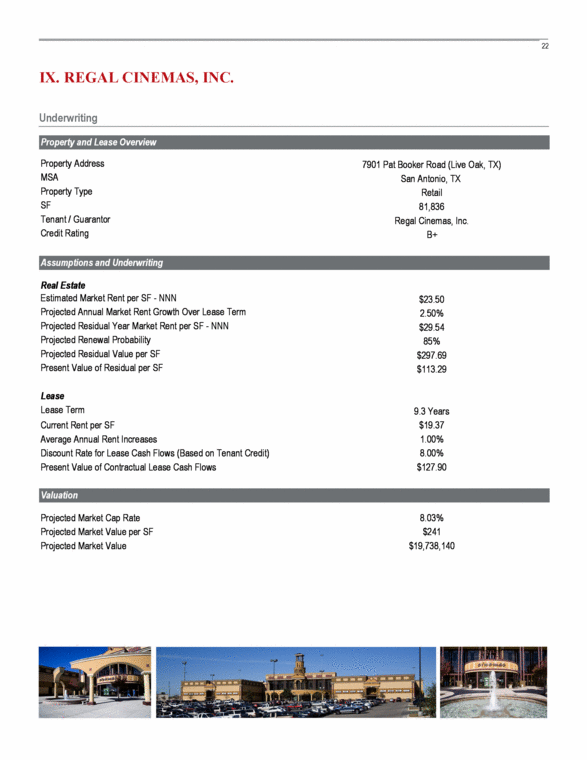
| IX. REGAL CINEMAS, INC. The Property comprises 81,836 square feet of space, and sits on 12.994 acres State of the art megaplex facility with 18 theaters, all having stadium seating First run distribution is a competitive advantage No competition of a similar size within a five mile radius Closest competition is a 7-screen cinema bistro over 6 miles away and a 14-screen Regal more than 15 minutes away Property Overview Market Overview Bounded by 3 of the neighborhood’s major thoroughfares, which provide access to numerous retail and residential sites A well-populated shopping plaza is located directly across the street Less than 15 miles northeast of San Antonio’s Central Business District Rolling Oaks Mall is less than 4 miles north, featuring Macy’s, JCPenney and others Less than 2 miles from Northeast Methodist Hospital About 15 minutes east of San Antonio International Airport San Antonio Retail Market # Bldgs Total RBA Atascosa County 83 738,765 5.40% $7.18 Bandera County 49 277,369 4.00% $10.70 CBD 814 9,923,544 2.80% $12.36 Comal County 483 5,166,749 6.00% $13.84 Guadalupe County 348 3,682,964 3.40% $15.60 Kendall County 152 1,570,192 4.60% $17.38 Medina County 89 699,874 11.20% $14.20 North Central 1,978 27,666,717 8.70% $17.38 Northeast 1,938 17,562,667 5.60% $13.50 Northwest 2,729 41,473,123 7.40% $14.10 South 1,669 13,472,053 5.50% $13.99 Wilson County 64 565,818 4.50% $9.77 Totals 10,396 122,799,835 6.60% $14.81 Quoted Rates Existing Inventory Vacancy |
| Underwriting IX. REGAL CINEMAS, INC. Property and Lease Overview Property Address 7901 Pat Booker Road (Live Oak, TX) MSA San Antonio, TX Property Type Retail SF 81,836 Tenant / Guarantor Regal Cinemas, Inc. Credit Rating B+ Assumptions and Underwriting Real Estate Estimated Market Rent per SF - NNN $23.50 Projected Annual Market Rent Growth Over Lease Term 2.50% Projected Residual Year Market Rent per SF - NNN $29.54 Projected Renewal Probability 85% Projected Residual Value per SF $297.69 Present Value of Residual per SF $113.29 Lease Lease Term 9.3 Years Current Rent per SF $19.37 Average Annual Rent Increases 1.00% Discount Rate for Lease Cash Flows (Based on Tenant Credit) 8.00% Present Value of Contractual Lease Cash Flows $127.90 Valuation Projected Market Cap Rate 8.03% Projected Market Value per SF $241 Projected Market Value $19,738,140 |
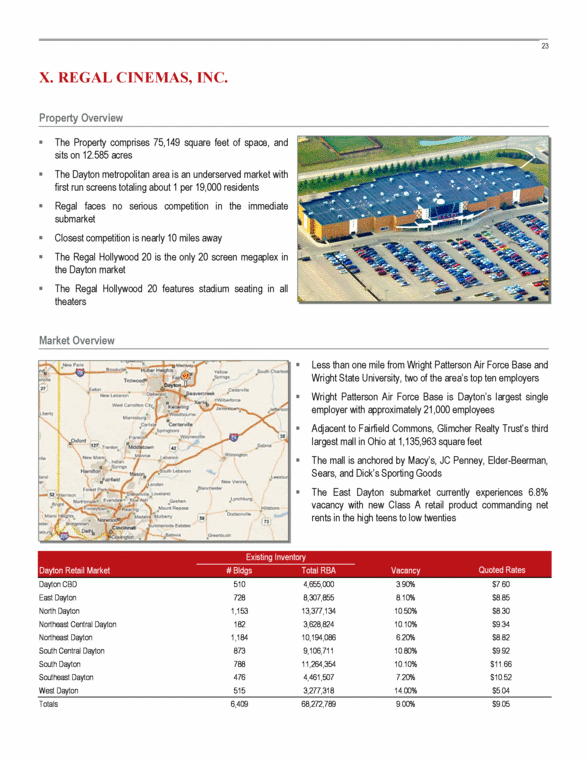
| X. REGAL CINEMAS, INC. The Property comprises 75,149 square feet of space, and sits on 12.585 acres The Dayton metropolitan area is an underserved market with first run screens totaling about 1 per 19,000 residents Regal faces no serious competition in the immediate submarket Closest competition is nearly 10 miles away The Regal Hollywood 20 is the only 20 screen megaplex in the Dayton market The Regal Hollywood 20 features stadium seating in all theaters Property Overview Market Overview Less than one mile from Wright Patterson Air Force Base and Wright State University, two of the area’s top ten employers Wright Patterson Air Force Base is Dayton’s largest single employer with approximately 21,000 employees Adjacent to Fairfield Commons, Glimcher Realty Trust’s third largest mall in Ohio at 1,135,963 square feet The mall is anchored by Macy’s, JC Penney, Elder-Beerman, Sears, and Dick’s Sporting Goods The East Dayton submarket currently experiences 6.8% vacancy with new Class A retail product commanding net rents in the high teens to low twenties Dayton Retail Market # Bldgs Total RBA Dayton CBD 510 4,655,000 3.90% $7.60 East Dayton 728 8,307,855 8.10% $8.85 North Dayton 1,153 13,377,134 10.50% $8.30 Northeast Central Dayton 182 3,628,824 10.10% $9.34 Northeast Dayton 1,184 10,194,086 6.20% $8.82 South Central Dayton 873 9,106,711 10.80% $9.92 South Dayton 788 11,264,354 10.10% $11.66 Southeast Dayton 476 4,461,507 7.20% $10.52 West Dayton 515 3,277,318 14.00% $5.04 Totals 6,409 68,272,789 9.00% $9.05 Quoted Rates Existing Inventory Vacancy |
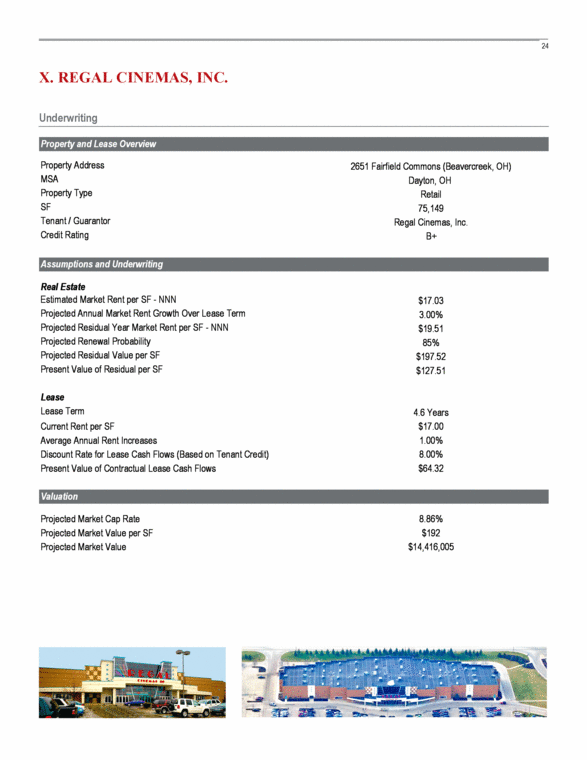
| Underwriting X. REGAL CINEMAS, INC. Property and Lease Overview Property Address 2651 Fairfield Commons (Beavercreek, OH) MSA Dayton, OH Property Type Retail SF 75,149 Tenant / Guarantor Regal Cinemas, Inc. Credit Rating B+ Assumptions and Underwriting Real Estate Estimated Market Rent per SF - NNN $17.03 Projected Annual Market Rent Growth Over Lease Term 3.00% Projected Residual Year Market Rent per SF - NNN $19.51 Projected Renewal Probability 85% Projected Residual Value per SF $197.52 Present Value of Residual per SF $127.51 Lease Lease Term 4.6 Years Current Rent per SF $17.00 Average Annual Rent Increases 1.00% Discount Rate for Lease Cash Flows (Based on Tenant Credit) 8.00% Present Value of Contractual Lease Cash Flows $64.32 Valuation Projected Market Cap Rate 8.86% Projected Market Value per SF $192 Projected Market Value $14,416,005 |
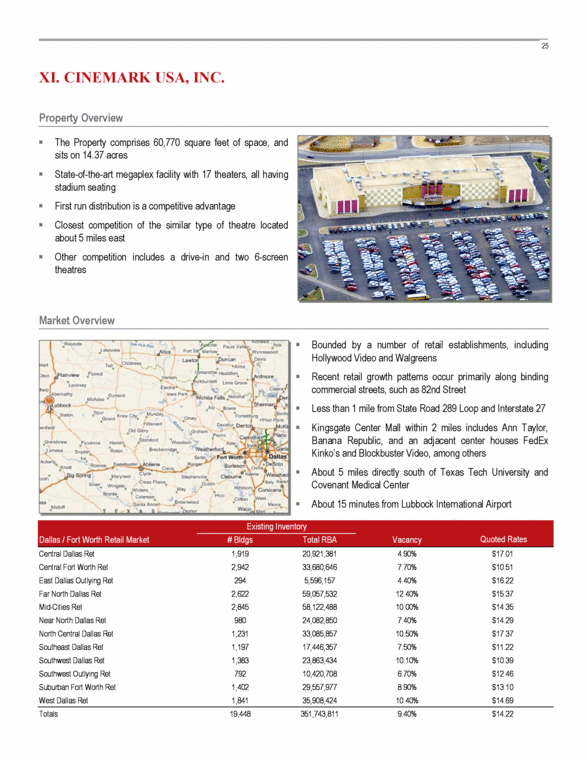
| XI. CINEMARK USA, INC. The Property comprises 60,770 square feet of space, and sits on 14.37 acres State-of-the-art megaplex facility with 17 theaters, all having stadium seating First run distribution is a competitive advantage Closest competition of the similar type of theatre located about 5 miles east Other competition includes a drive-in and two 6-screen theatres Property Overview Market Overview Bounded by a number of retail establishments, including Hollywood Video and Walgreens Recent retail growth patterns occur primarily along binding commercial streets, such as 82nd Street Less than 1 mile from State Road 289 Loop and Interstate 27 Kingsgate Center Mall within 2 miles includes Ann Taylor, Banana Republic, and an adjacent center houses FedEx Kinko’s and Blockbuster Video, among others About 5 miles directly south of Texas Tech University and Covenant Medical Center About 15 minutes from Lubbock International Airport Dallas / Fort Worth Retail Market # Bldgs Total RBA Central Dallas Ret 1,919 20,921,381 4.90% $17.01 Central Fort Worth Ret 2,942 33,680,646 7.70% $10.51 East Dallas Outlying Ret 294 5,596,157 4.40% $16.22 Far North Dallas Ret 2,622 59,057,532 12.40% $15.37 Mid-Cities Ret 2,845 58,122,488 10.00% $14.35 Near North Dallas Ret 980 24,082,850 7.40% $14.29 North Central Dallas Ret 1,231 33,085,857 10.50% $17.37 Southeast Dallas Ret 1,197 17,446,357 7.50% $11.22 Southwest Dallas Ret 1,383 23,863,434 10.10% $10.39 Southwest Outlying Ret 792 10,420,708 6.70% $12.46 Suburban Fort Worth Ret 1,402 29,557,977 8.90% $13.10 West Dallas Ret 1,841 35,908,424 10.40% $14.69 Totals 19,448 351,743,811 9.40% $14.22 Quoted Rates Existing Inventory Vacancy |
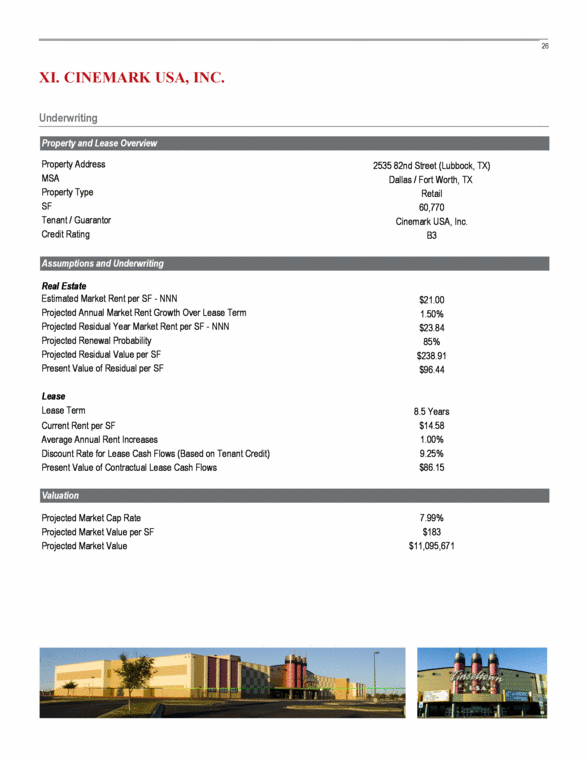
| Underwriting XI. CINEMARK USA, INC. Property and Lease Overview Property Address 2535 82nd Street (Lubbock, TX) MSA Dallas / Fort Worth, TX Property Type Retail SF 60,770 Tenant / Guarantor Cinemark USA, Inc. Credit Rating B3 Assumptions and Underwriting Real Estate Estimated Market Rent per SF - NNN $21.00 Projected Annual Market Rent Growth Over Lease Term 1.50% Projected Residual Year Market Rent per SF - NNN $23.84 Projected Renewal Probability 85% Projected Residual Value per SF $238.91 Present Value of Residual per SF $96.44 Lease Lease Term 8.5 Years Current Rent per SF $14.58 Average Annual Rent Increases 1.00% Discount Rate for Lease Cash Flows (Based on Tenant Credit) 9.25% Present Value of Contractual Lease Cash Flows $86.15 Valuation Projected Market Cap Rate 7.99% Projected Market Value per SF $183 Projected Market Value $11,095,671 |
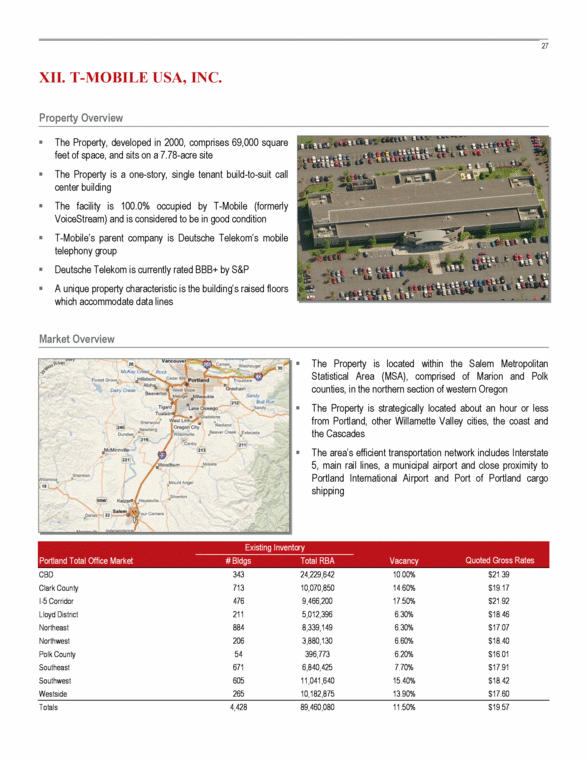
| XII. T-MOBILE USA, INC. The Property, developed in 2000, comprises 69,000 square feet of space, and sits on a 7.78-acre site The Property is a one-story, single tenant build-to-suit call center building The facility is 100.0% occupied by T-Mobile (formerly VoiceStream) and is considered to be in good condition T-Mobile’s parent company is Deutsche Telekom’s mobile telephony group Deutsche Telekom is currently rated BBB+ by S&P A unique property characteristic is the building’s raised floors which accommodate data lines Property Overview Market Overview The Property is located within the Salem Metropolitan Statistical Area (MSA), comprised of Marion and Polk counties, in the northern section of western Oregon The Property is strategically located about an hour or less from Portland, other Willamette Valley cities, the coast and the Cascades The area’s efficient transportation network includes Interstate 5, main rail lines, a municipal airport and close proximity to Portland International Airport and Port of Portland cargo shipping Portland Total Office Market # Bldgs Total RBA CBD 343 24,229,642 10.00% $21.39 Clark County 713 10,070,850 14.60% $19.17 I-5 Corridor 476 9,466,200 17.50% $21.92 Lloyd District 211 5,012,396 6.30% $18.46 Northeast 884 8,339,149 6.30% $17.07 Northwest 206 3,880,130 6.60% $18.40 Polk County 54 396,773 6.20% $16.01 Southeast 671 6,840,425 7.70% $17.91 Southwest 605 11,041,640 15.40% $18.42 Westside 265 10,182,875 13.90% $17.60 Totals 4,428 89,460,080 11.50% $19.57 Quoted Gross Rates Existing Inventory Vacancy |
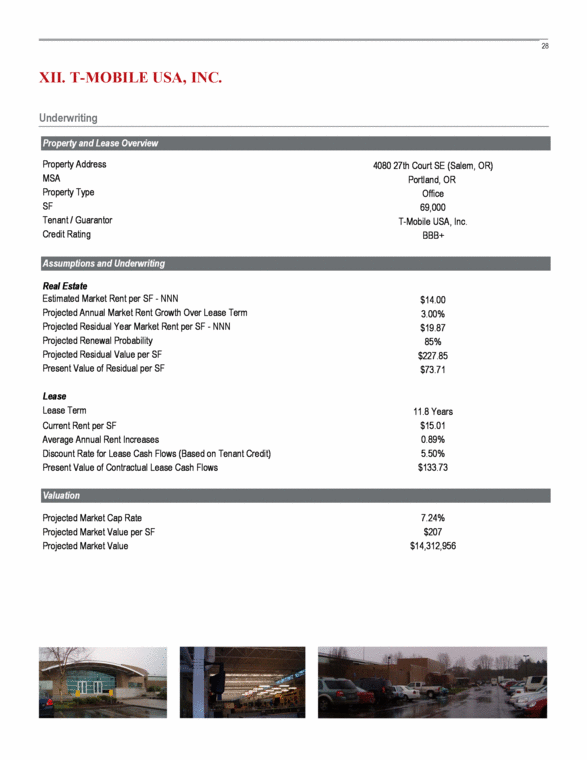
| Underwriting XII. T-MOBILE USA, INC. Property and Lease Overview Property Address 4080 27th Court SE (Salem, OR) MSA Portland, OR Property Type Office SF 69,000 Tenant / Guarantor T-Mobile USA, Inc. Credit Rating BBB+ Assumptions and Underwriting Real Estate Estimated Market Rent per SF - NNN $14.00 Projected Annual Market Rent Growth Over Lease Term 3.00% Projected Residual Year Market Rent per SF - NNN $19.87 Projected Renewal Probability 85% Projected Residual Value per SF $227.85 Present Value of Residual per SF $73.71 Lease Lease Term 11.8 Years Current Rent per SF $15.01 Average Annual Rent Increases 0.89% Discount Rate for Lease Cash Flows (Based on Tenant Credit) 5.50% Present Value of Contractual Lease Cash Flows $133.73 Valuation Projected Market Cap Rate 7.24% Projected Market Value per SF $207 Projected Market Value $14,312,956 |
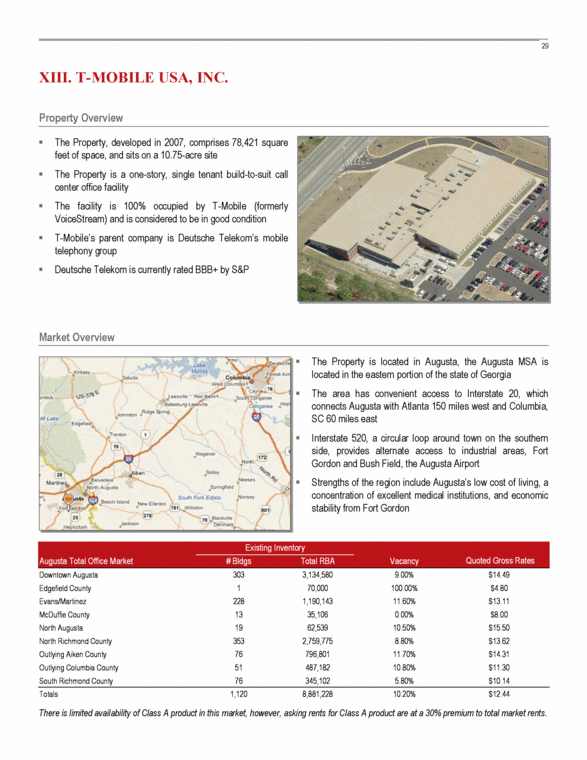
| XIII. T-MOBILE USA, INC. The Property, developed in 2007, comprises 78,421 square feet of space, and sits on a 10.75-acre site The Property is a one-story, single tenant build-to-suit call center office facility The facility is 100% occupied by T-Mobile (formerly VoiceStream) and is considered to be in good condition T-Mobile’s parent company is Deutsche Telekom’s mobile telephony group Deutsche Telekom is currently rated BBB+ by S&P Property Overview Market Overview The Property is located in Augusta, the Augusta MSA is located in the eastern portion of the state of Georgia The area has convenient access to Interstate 20, which connects Augusta with Atlanta 150 miles west and Columbia, SC 60 miles east Interstate 520, a circular loop around town on the southern side, provides alternate access to industrial areas, Fort Gordon and Bush Field, the Augusta Airport Strengths of the region include Augusta’s low cost of living, a concentration of excellent medical institutions, and economic stability from Fort Gordon There is limited availability of Class A product in this market, however, asking rents for Class A product are at a 30% premium to total market rents. Augusta Total Office Market # Bldgs Total RBA Downtown Augusta 303 3,134,580 9.00% $14.49 Edgefield County 1 70,000 100.00% $4.80 Evans/Martinez 228 1,190,143 11.60% $13.11 McDuffie County 13 35,106 0.00% $8.00 North Augusta 19 62,539 10.50% $15.50 North Richmond County 353 2,759,775 8.80% $13.62 Outlying Aiken County 76 796,801 11.70% $14.31 Outlying Columbia County 51 487,182 10.80% $11.30 South Richmond County 76 345,102 5.80% $10.14 Totals 1,120 8,881,228 10.20% $12.44 Quoted Gross Rates Existing Inventory Vacancy |
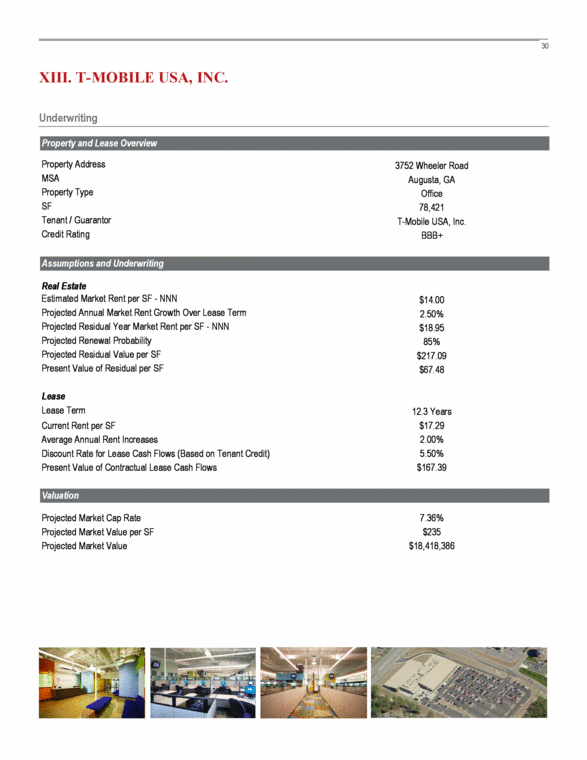
| Underwriting XIII. T-MOBILE USA, INC. Property and Lease Overview Property Address 3752 Wheeler Road MSA Augusta, GA Property Type Office SF 78,421 Tenant / Guarantor T-Mobile USA, Inc. Credit Rating BBB+ Assumptions and Underwriting Real Estate Estimated Market Rent per SF - NNN $14.00 Projected Annual Market Rent Growth Over Lease Term 2.50% Projected Residual Year Market Rent per SF - NNN $18.95 Projected Renewal Probability 85% Projected Residual Value per SF $217.09 Present Value of Residual per SF $67.48 Lease Lease Term 12.3 Years Current Rent per SF $17.29 Average Annual Rent Increases 2.00% Discount Rate for Lease Cash Flows (Based on Tenant Credit) 5.50% Present Value of Contractual Lease Cash Flows $167.39 Valuation Projected Market Cap Rate 7.36% Projected Market Value per SF $235 Projected Market Value $18,418,386 |
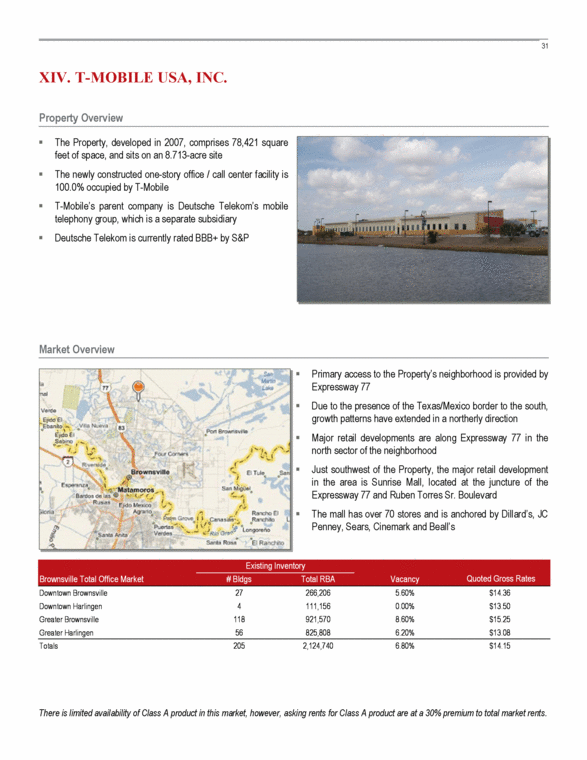
| XIV. T-MOBILE USA, INC. The Property, developed in 2007, comprises 78,421 square feet of space, and sits on an 8.713-acre site The newly constructed one-story office / call center facility is 100.0% occupied by T-Mobile T-Mobile’s parent company is Deutsche Telekom’s mobile telephony group, which is a separate subsidiary Deutsche Telekom is currently rated BBB+ by S&P Property Overview Market Overview Primary access to the Property’s neighborhood is provided by Expressway 77 Due to the presence of the Texas/Mexico border to the south, growth patterns have extended in a northerly direction Major retail developments are along Expressway 77 in the north sector of the neighborhood Just southwest of the Property, the major retail development in the area is Sunrise Mall, located at the juncture of the Expressway 77 and Ruben Torres Sr. Boulevard The mall has over 70 stores and is anchored by Dillard’s, JC Penney, Sears, Cinemark and Beall’s There is limited availability of Class A product in this market, however, asking rents for Class A product are at a 30% premium to total market rents. Brownsville Total Office Market # Bldgs Total RBA Downtown Brownsville 27 266,206 5.60% $14.36 Downtown Harlingen 4 111,156 0.00% $13.50 Greater Brownsville 118 921,570 8.60% $15.25 Greater Harlingen 56 825,808 6.20% $13.08 Totals 205 2,124,740 6.80% $14.15 Quoted Gross Rates Existing Inventory Vacancy |
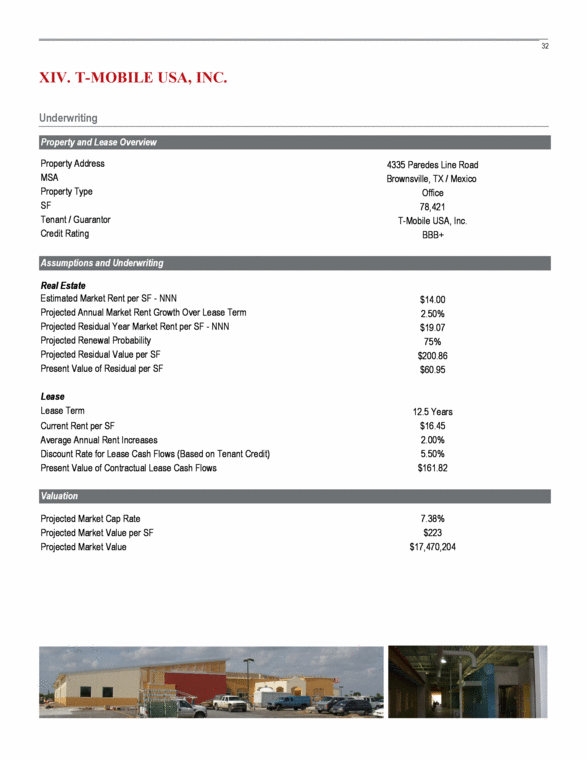
| Underwriting XIV. T-MOBILE USA, INC. Property and Lease Overview Property Address 4335 Paredes Line Road MSA Brownsville, TX / Mexico Property Type Office SF 78,421 Tenant / Guarantor T-Mobile USA, Inc. Credit Rating BBB+ Assumptions and Underwriting Real Estate Estimated Market Rent per SF - NNN $14.00 Projected Annual Market Rent Growth Over Lease Term 2.50% Projected Residual Year Market Rent per SF - NNN $19.07 Projected Renewal Probability 75% Projected Residual Value per SF $200.86 Present Value of Residual per SF $60.95 Lease Lease Term 12.5 Years Current Rent per SF $16.45 Average Annual Rent Increases 2.00% Discount Rate for Lease Cash Flows (Based on Tenant Credit) 5.50% Present Value of Contractual Lease Cash Flows $161.82 Valuation Projected Market Cap Rate 7.38% Projected Market Value per SF $223 Projected Market Value $17,470,204 |
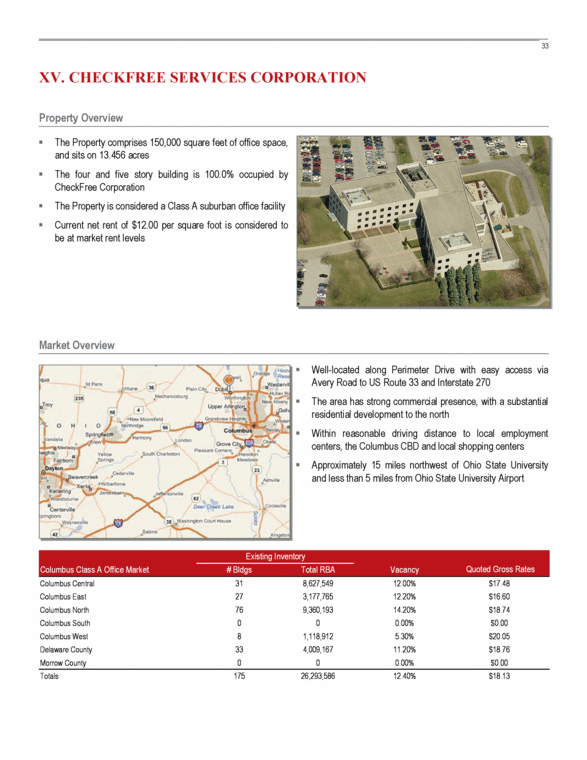
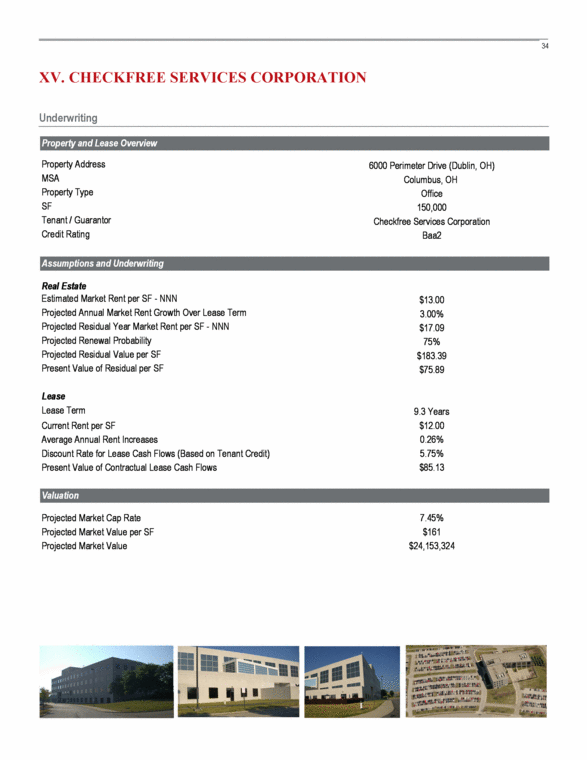
| XV. CHECKFREE SERVICES CORPORATION The Property comprises 150,000 square feet of office space, and sits on 13.456 acres The four and five story building is 100.0% occupied by CheckFree Corporation The Property is considered a Class A suburban office facility Current net rent of $12.00 per square foot is considered to be at market rent levels Property Overview Market Overview Well-located along Perimeter Drive with easy access via Avery Road to US Route 33 and Interstate 270 The area has strong commercial presence, with a substantial residential development to the north Within reasonable driving distance to local employment centers, the Columbus CBD and local shopping centers Approximately 15 miles northwest of Ohio State University and less than 5 miles from Ohio State University Airport Columbus Class A Office Market # Bldgs Total RBA Columbus Central 31 8,627,549 12.00% $17.48 Columbus East 27 3,177,765 12.20% $16.60 Columbus North 76 9,360,193 14.20% $18.74 Columbus South 0 0 0.00% $0.00 Columbus West 8 1,118,912 5.30% $20.05 Delaware County 33 4,009,167 11.20% $18.76 Morrow County 0 0 0.00% $0.00 Totals 175 26,293,586 12.40% $18.13 Quoted Gross Rates Existing Inventory Vacancy |
| Underwriting XV. CHECKFREE SERVICES CORPORATION Property and Lease Overview Property Address 6000 Perimeter Drive (Dublin, OH) MSA Columbus, OH Property Type Office SF 150,000 Tenant / Guarantor Checkfree Services Corporation Credit Rating Baa2 Assumptions and Underwriting Real Estate Estimated Market Rent per SF - NNN $13.00 Projected Annual Market Rent Growth Over Lease Term 3.00% Projected Residual Year Market Rent per SF - NNN $17.09 Projected Renewal Probability 75% Projected Residual Value per SF $183.39 Present Value of Residual per SF $75.89 Lease Lease Term 9.3 Years Current Rent per SF $12.00 Average Annual Rent Increases 0.26% Discount Rate for Lease Cash Flows (Based on Tenant Credit) 5.75% Present Value of Contractual Lease Cash Flows $85.13 Valuation Projected Market Cap Rate 7.45% Projected Market Value per SF $161 Projected Market Value $24,153,324 |
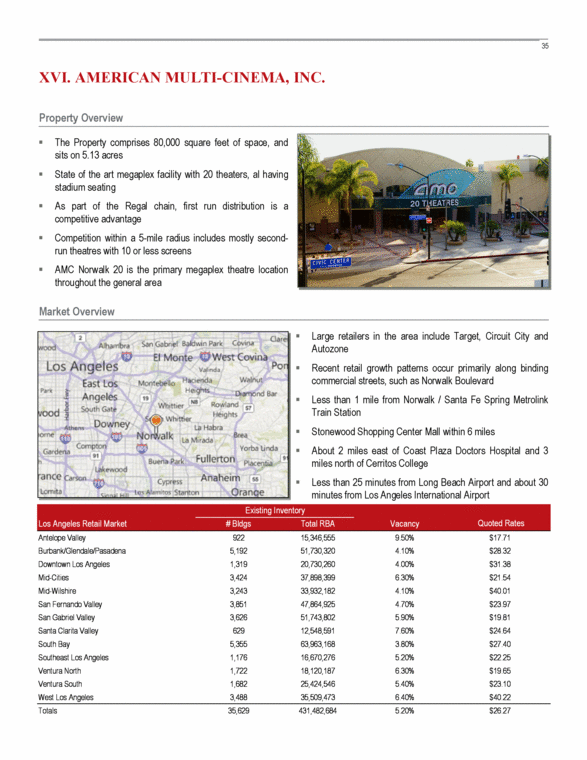
| The Property comprises 80,000 square feet of space, and sits on 5.13 acres State of the art megaplex facility with 20 theaters, al having stadium seating As part of the Regal chain, first run distribution is a competitive advantage Competition within a 5-mile radius includes mostly second-run theatres with 10 or less screens AMC Norwalk 20 is the primary megaplex theatre location throughout the general area Property Overview Market Overview Large retailers in the area include Target, Circuit City and Autozone Recent retail growth patterns occur primarily along binding commercial streets, such as Norwalk Boulevard Less than 1 mile from Norwalk / Santa Fe Spring Metrolink Train Station Stonewood Shopping Center Mall within 6 miles About 2 miles east of Coast Plaza Doctors Hospital and 3 miles north of Cerritos College Less than 25 minutes from Long Beach Airport and about 30 minutes from Los Angeles International Airport XVI. AMERICAN MULTI-CINEMA, INC. Los Angeles Retail Market #Bldgs Total RBA Vacancy Quoted Rates Antelope Valley 922 15,346,555 9.50% $17.71 Burbank/Glendale/Pasadena 5,192 51,730,320 4.10% $28.32 Downtown Los Angeles 1,319 20,730,260 4.00% $31.38 Mid-Cities 3,424 37,898,399 6.30% $21.54 Mid-Wilshire 3,243 33,932,182 4.10% $40.01 San Fernando Valley 3,851 47,864,925 4.70% $23.97 San Gabriel Valley 3,626 51,743,802 5.90% $19.81 Santa Clarita Valley 629 12,548,591 7.60% $24.64 South Bay 5,355 63,963,168 3.80% $27.40 Southeast Los Angeles 1,176 16,670,276 5.20% $22.25 Ventura North 1,722 18,120,187 6.30% $19.65 Ventura South 1,682 25,424,546 5.40% $23.10 West Los Angeles 3,488 35,509,473 6.40% $40.22 Totals 35,629 431,482,684 5.20% $26.27 |
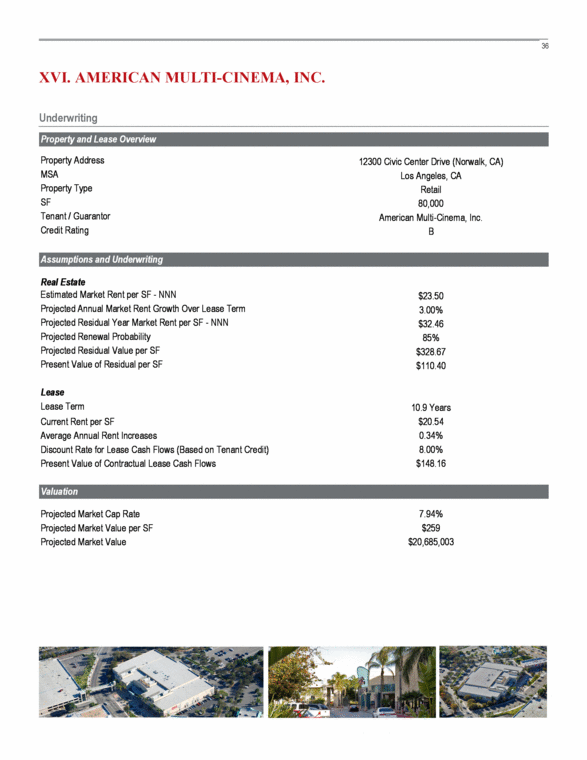
| Underwriting XVI. AMERICAN MULTI-CINEMA, INC. Property and Lease Overview Property Address 12300 Civic Center Drive (Norwalk, CA) MSA Los Angeles, CA Property Type Retail SF 80,000 Tenant / Guarantor American Multi-Cinema, Inc. Credit Rating B Assumptions and Underwriting Real Estate Estimated Market Rent per SF - NNN $23.50 Projected Annual Market Rent Growth Over Lease Term 3.00% Projected Residual Year Market Rent per SF - NNN $32.46 Projected Renewal Probability 85% Projected Residual Value per SF $328.67 Present Value of Residual per SF $110.40 Lease Lease Term 10.9 Years Current Rent per SF $20.54 Average Annual Rent Increases 0.34% Discount Rate for Lease Cash Flows (Based on Tenant Credit) 8.00% Present Value of Contractual Lease Cash Flows $148.16 Valuation Projected Market Cap Rate 7.94% Projected Market Value per SF $259 Projected Market Value $20,685,003 |
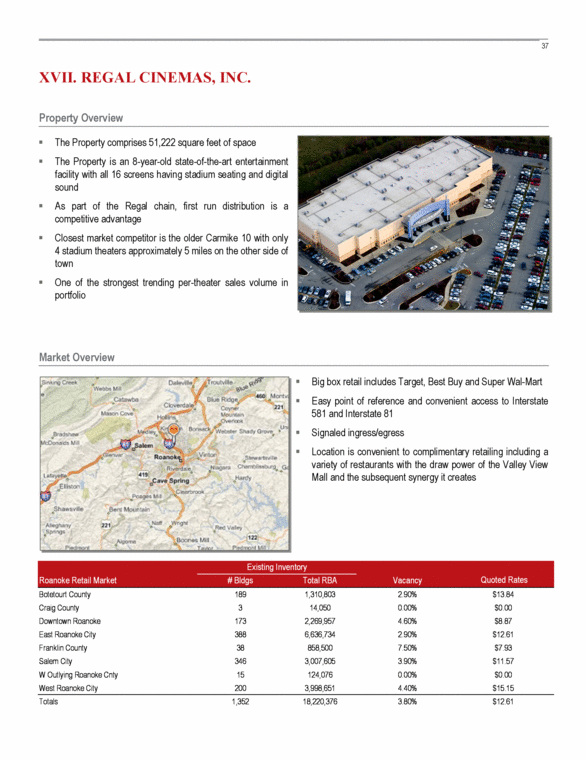
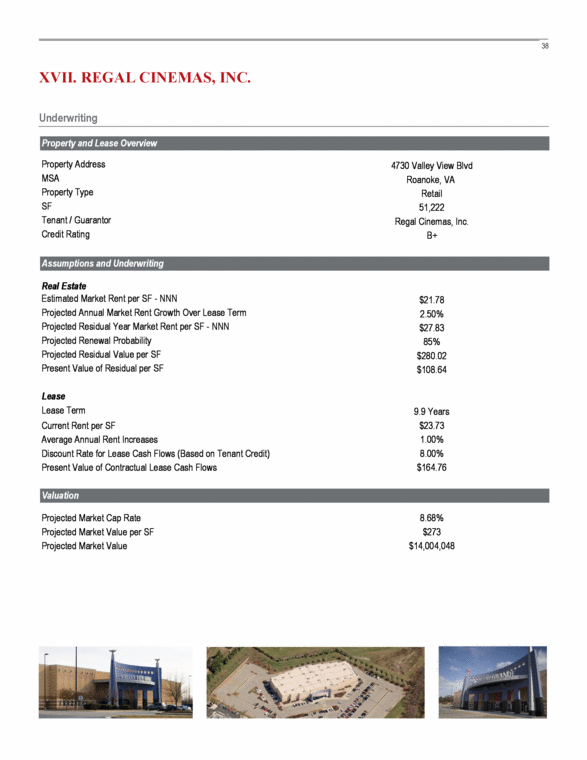
| XVII. REGAL CINEMAS, INC. The Property comprises 51,222 square feet of space The Property is an 8-year-old state-of-the-art entertainment facility with all 16 screens having stadium seating and digital sound As part of the Regal chain, first run distribution is a competitive advantage Closest market competitor is the older Carmike 10 with only 4 stadium theaters approximately 5 miles on the other side of town One of the strongest trending per-theater sales volume in portfolio Property Overview Market Overview Big box retail includes Target, Best Buy and Super Wal-Mart Easy point of reference and convenient access to Interstate 581 and Interstate 81 Signaled ingress/egress Location is convenient to complimentary retailing including a variety of restaurants with the draw power of the Valley View Mall and the subsequent synergy it creates Roanoke Retail Market # Bldgs Total RBA Botetourt County 189 1,310,803 2.90% $13.84 Craig County 3 14,050 0.00% $0.00 Downtown Roanoke 173 2,269,957 4.60% $8.87 East Roanoke City 388 6,636,734 2.90% $12.61 Franklin County 38 858,500 7.50% $7.93 Salem City 346 3,007,605 3.90% $11.57 W Outlying Roanoke Cnty 15 124,076 0.00% $0.00 West Roanoke City 200 3,998,651 4.40% $15.15 Totals 1,352 18,220,376 3.80% $12.61 Quoted Rates Existing Inventory Vacancy |
| Underwriting XVII. REGAL CINEMAS, INC. Property and Lease Overview Property Address 4730 Valley View Blvd MSA Roanoke, VA Property Type Retail SF 51,222 Tenant / Guarantor Regal Cinemas, Inc. Credit Rating B+ Assumptions and Underwriting Real Estate Estimated Market Rent per SF - NNN $21.78 Projected Annual Market Rent Growth Over Lease Term 2.50% Projected Residual Year Market Rent per SF - NNN $27.83 Projected Renewal Probability 85% Projected Residual Value per SF $280.02 Present Value of Residual per SF $108.64 Lease Lease Term 9.9 Years Current Rent per SF $23.73 Average Annual Rent Increases 1.00% Discount Rate for Lease Cash Flows (Based on Tenant Credit) 8.00% Present Value of Contractual Lease Cash Flows $164.76 Valuation Projected Market Cap Rate 8.68% Projected Market Value per SF $273 Projected Market Value $14,004,048 |
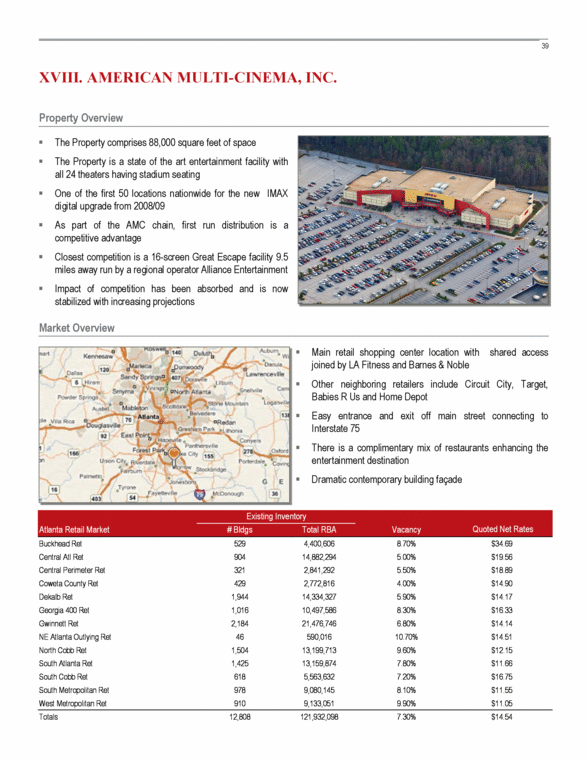
| XVIII. AMERICAN MULTI-CINEMA, INC. The Property comprises 88,000 square feet of space The Property is a state of the art entertainment facility with all 24 theaters having stadium seating One of the first 50 locations nationwide for the new IMAX digital upgrade from 2008/09 As part of the AMC chain, first run distribution is a competitive advantage Closest competition is a 16-screen Great Escape facility 9.5 miles away run by a regional operator Alliance Entertainment Impact of competition has been absorbed and is now stabilized with increasing projections Property Overview Market Overview Main retail shopping center location with shared access joined by LA Fitness and Barnes & Noble Other neighboring retailers include Circuit City, Target, Babies R Us and Home Depot Easy entrance and exit off main street connecting to Interstate 75 There is a complimentary mix of restaurants enhancing the entertainment destination Dramatic contemporary building façade Atlanta Retail Market # Bldgs Total RBA Buckhead Ret 529 4,400,606 8.70% $34.69 Central Atl Ret 904 14,882,294 5.00% $19.56 Central Perimeter Ret 321 2,841,292 5.50% $18.89 Coweta County Ret 429 2,772,816 4.00% $14.90 Dekalb Ret 1,944 14,334,327 5.90% $14.17 Georgia 400 Ret 1,016 10,497,586 8.30% $16.33 Gwinnett Ret 2,184 21,476,746 6.80% $14.14 NE Atlanta Outlying Ret 46 590,016 10.70% $14.51 North Cobb Ret 1,504 13,199,713 9.60% $12.15 South Atlanta Ret 1,425 13,159,874 7.80% $11.66 South Cobb Ret 618 5,563,632 7.20% $16.75 South Metropolitan Ret 978 9,080,145 8.10% $11.55 West Metropolitan Ret 910 9,133,051 9.90% $11.05 Totals 12,808 121,932,098 7.30% $14.54 Quoted Net Rates Existing Inventory Vacancy |
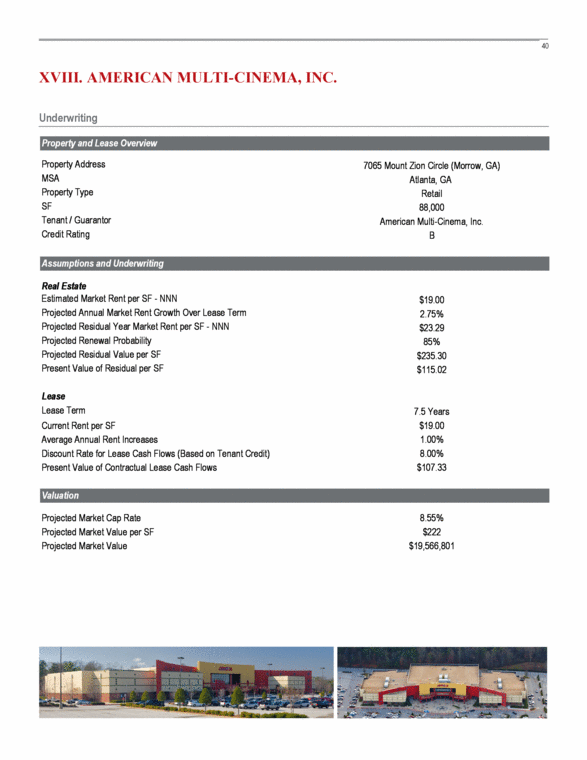
| Underwriting XVIII. AMERICAN MULTI-CINEMA, INC. Property and Lease Overview Property Address 7065 Mount Zion Circle (Morrow, GA) MSA Atlanta, GA Property Type Retail SF 88,000 Tenant / Guarantor American Multi-Cinema, Inc. Credit Rating B Assumptions and Underwriting Real Estate Estimated Market Rent per SF - NNN $19.00 Projected Annual Market Rent Growth Over Lease Term 2.75% Projected Residual Year Market Rent per SF - NNN $23.29 Projected Renewal Probability 85% Projected Residual Value per SF $235.30 Present Value of Residual per SF $115.02 Lease Lease Term 7.5 Years Current Rent per SF $19.00 Average Annual Rent Increases 1.00% Discount Rate for Lease Cash Flows (Based on Tenant Credit) 8.00% Present Value of Contractual Lease Cash Flows $107.33 Valuation Projected Market Cap Rate 8.55% Projected Market Value per SF $222 Projected Market Value $19,566,801 |
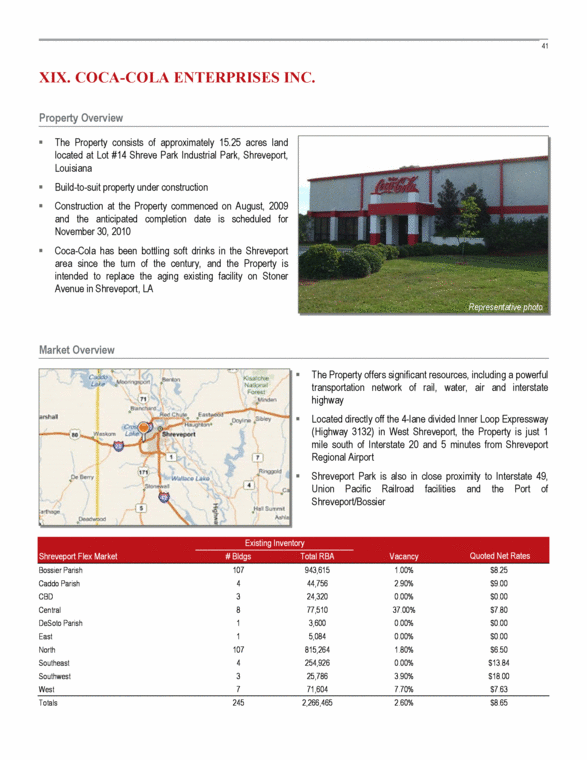
| XIX. COCA-COLA ENTERPRISES INC. The Property consists of approximately 15.25 acres land located at Lot #14 Shreve Park Industrial Park, Shreveport, Louisiana Build-to-suit property under construction Construction at the Property commenced on August, 2009 and the anticipated completion date is scheduled for November 30, 2010 Coca-Cola has been bottling soft drinks in the Shreveport area since the turn of the century, and the Property is intended to replace the aging existing facility on Stoner Avenue in Shreveport, LA Property Overview Market Overview The Property offers significant resources, including a powerful transportation network of rail, water, air and interstate highway Located directly off the 4-lane divided Inner Loop Expressway (Highway 3132) in West Shreveport, the Property is just 1 mile south of Interstate 20 and 5 minutes from Shreveport Regional Airport Shreveport Park is also in close proximity to Interstate 49, Union Pacific Railroad facilities and the Port of Shreveport/Bossier Representative photo Shreveport Flex Market # Bldgs Total RBA Bossier Parish 107 943,615 1.00% $8.25 Caddo Parish 4 44,756 2.90% $9.00 CBD 3 24,320 0.00% $0.00 Central 8 77,510 37.00% $7.80 DeSoto Parish 1 3,600 0.00% $0.00 East 1 5,084 0.00% $0.00 North 107 815,264 1.80% $6.50 Southeast 4 254,926 0.00% $13.84 Southwest 3 25,786 3.90% $18.00 West 7 71,604 7.70% $7.63 Totals 245 2,266,465 2.60% $8.65 Quoted Net Rates Existing Inventory Vacancy |
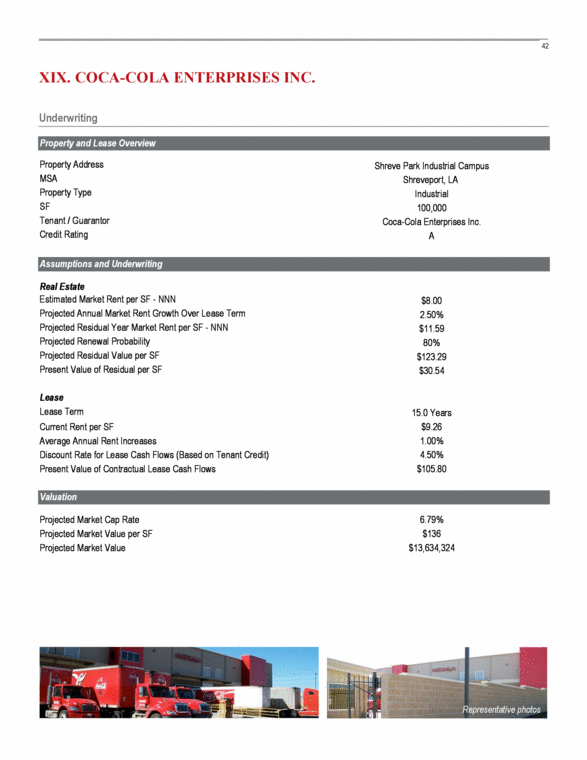
| Underwriting Representative photos XIX. COCA-COLA ENTERPRISES INC. Property and Lease Overview Property Address Shreve Park Industrial Campus MSA Shreveport, LA Property Type Industrial SF 100,000 Tenant / Guarantor Coca-Cola Enterprises Inc. Credit Rating A Assumptions and Underwriting Real Estate Estimated Market Rent per SF - NNN $8.00 Projected Annual Market Rent Growth Over Lease Term 2.50% Projected Residual Year Market Rent per SF - NNN $11.59 Projected Renewal Probability 80% Projected Residual Value per SF $123.29 Present Value of Residual per SF $30.54 Lease Lease Term 15.0 Years Current Rent per SF $9.26 Average Annual Rent Increases 1.00% Discount Rate for Lease Cash Flows (Based on Tenant Credit) 4.50% Present Value of Contractual Lease Cash Flows $105.80 Valuation Projected Market Cap Rate 6.79% Projected Market Value per SF $136 Projected Market Value $13,634,324 |
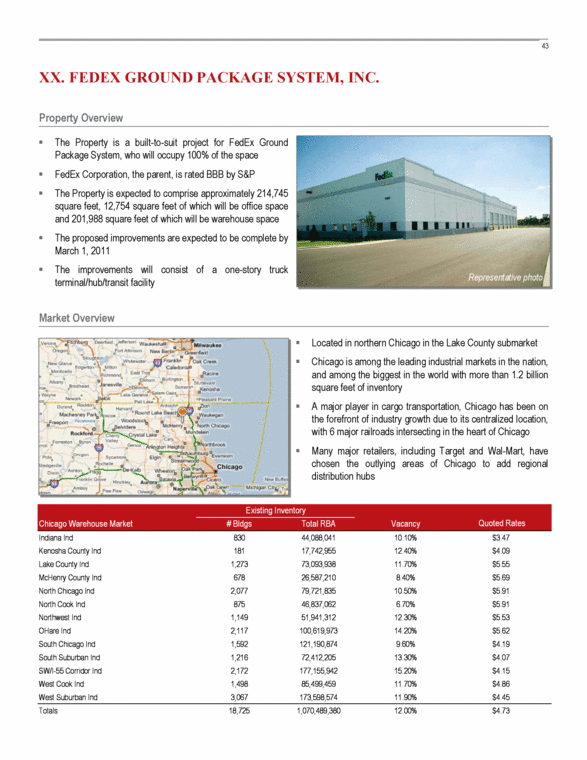
| XX. FEDEX GROUND PACKAGE SYSTEM, INC. The Property is a built-to-suit project for FedEx Ground Package System, who will occupy 100% of the space FedEx Corporation, the parent, is rated BBB by S&P The Property is expected to comprise approximately 214,745 square feet, 12,754 square feet of which will be office space and 201,988 square feet of which will be warehouse space The proposed improvements are expected to be complete by March 1, 2011 The improvements will consist of a one-story truck terminal/hub/transit facility Property Overview Market Overview Located in northern Chicago in the Lake County submarket Chicago is among the leading industrial markets in the nation, and among the biggest in the world with more than 1.2 billion square feet of inventory A major player in cargo transportation, Chicago has been on the forefront of industry growth due to its centralized location, with 6 major railroads intersecting in the heart of Chicago Many major retailers, including Target and Wal-Mart, have chosen the outlying areas of Chicago to add regional distribution hubs Representative photo Chicago Warehouse Market # Bldgs Total RBA Indiana Ind 830 44,088,041 10.10% $3.47 Kenosha County Ind 181 17,742,955 12.40% $4.09 Lake County Ind 1,273 73,093,938 11.70% $5.55 McHenry County Ind 678 26,587,210 8.40% $5.69 North Chicago Ind 2,077 79,721,835 10.50% $5.91 North Cook Ind 875 46,837,062 6.70% $5.91 Northwest Ind 1,149 51,941,312 12.30% $5.53 OHare Ind 2,117 100,619,973 14.20% $5.62 South Chicago Ind 1,592 121,190,874 9.60% $4.19 South Suburban Ind 1,216 72,412,205 13.30% $4.07 SW/I-55 Corridor Ind 2,172 177,155,942 15.20% $4.15 West Cook Ind 1,498 85,499,459 11.70% $4.86 West Suburban Ind 3,067 173,598,574 11.90% $4.45 Totals 18,725 1,070,489,380 12.00% $4.73 Quoted Rates Existing Inventory Vacancy |
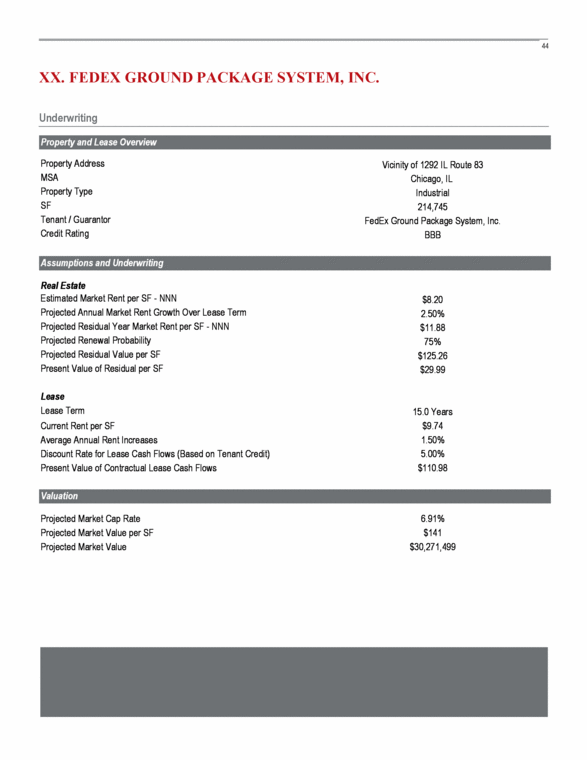
| Underwriting XX. FEDEX GROUND PACKAGE SYSTEM, INC. Property and Lease Overview Property Address Vicinity of 1292 IL Route 83 MSA Chicago, IL Property Type Industrial SF 214,745 Tenant / Guarantor FedEx Ground Package System, Inc. Credit Rating BBB Assumptions and Underwriting Real Estate Estimated Market Rent per SF - NNN $8.20 Projected Annual Market Rent Growth Over Lease Term 2.50% Projected Residual Year Market Rent per SF - NNN $11.88 Projected Renewal Probability 75% Projected Residual Value per SF $125.26 Present Value of Residual per SF $29.99 Lease Lease Term 15.0 Years Current Rent per SF $9.74 Average Annual Rent Increases 1.50% Discount Rate for Lease Cash Flows (Based on Tenant Credit) 5.00% Present Value of Contractual Lease Cash Flows $110.98 Valuation Projected Market Cap Rate 6.91% Projected Market Value per SF $141 Projected Market Value $30,271,499 |
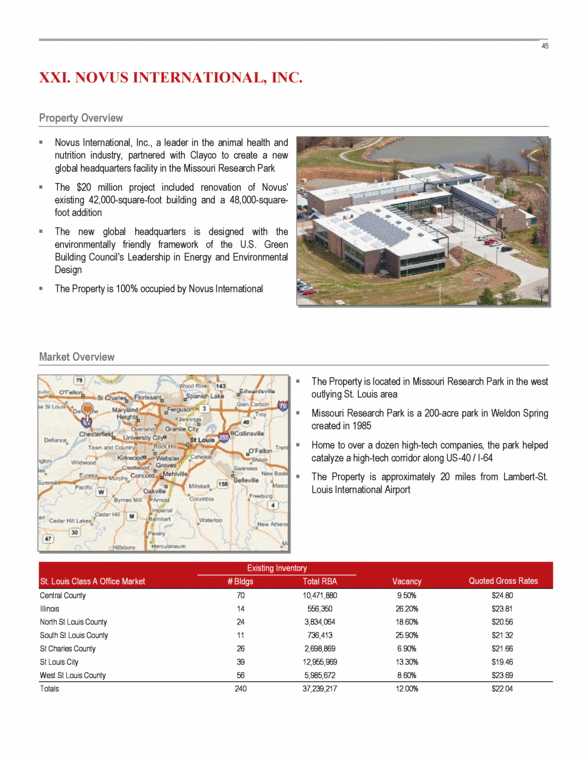
| Property Overview XXI. NOVUS INTERNATIONAL, INC. Novus International, Inc., a leader in the animal health and nutrition industry, partnered with Clayco to create a new global headquarters facility in the Missouri Research Park The $20 million project included renovation of Novus' existing 42,000-square-foot building and a 48,000-square-foot addition The new global headquarters is designed with the environmentally friendly framework of the U.S. Green Building Council's Leadership in Energy and Environmental Design The Property is 100% occupied by Novus International Market Overview The Property is located in Missouri Research Park in the west outlying St. Louis area Missouri Research Park is a 200-acre park in Weldon Spring created in 1985 Home to over a dozen high-tech companies, the park helped catalyze a high-tech corridor along US-40 / I-64 The Property is approximately 20 miles from Lambert-St. Louis International Airport St. Louis Class A Office Market # Bldgs Total RBA Central County 70 10,471,880 9.50% $24.80 Illinois 14 556,350 26.20% $23.81 North St Louis County 24 3,834,064 18.60% $20.56 South St Louis County 11 736,413 25.90% $21.32 St Charles County 26 2,698,869 6.90% $21.66 St Louis City 39 12,955,969 13.30% $19.46 West St Louis County 56 5,985,672 8.60% $23.69 Totals 240 37,239,217 12.00% $22.04 Quoted Gross Rates Existing Inventory Vacancy |
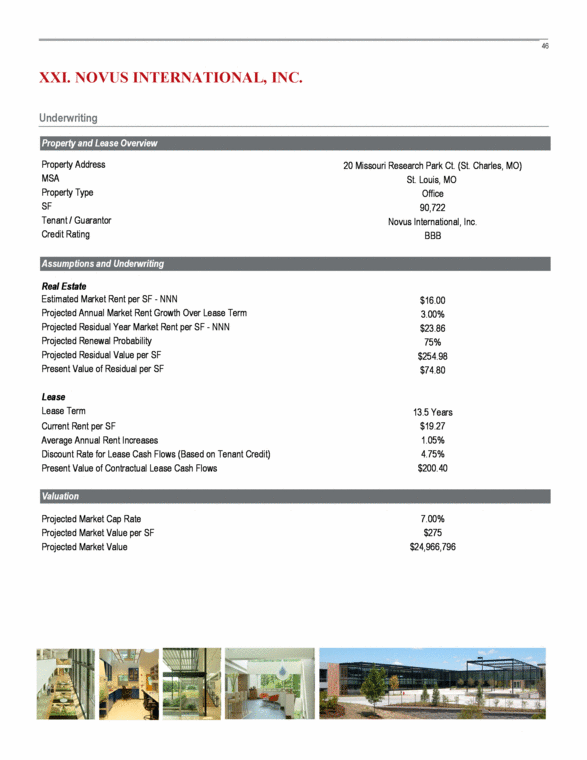
| Underwriting XXI. NOVUS INTERNATIONAL, INC. Property and Lease Overview Property Address 20 Missouri Research Park Ct. (St. Charles, MO) MSA St. Louis, MO Property Type Office SF 90,722 Tenant / Guarantor Novus International, Inc. Credit Rating BBB Assumptions and Underwriting Real Estate Estimated Market Rent per SF - NNN $16.00 Projected Annual Market Rent Growth Over Lease Term 3.00% Projected Residual Year Market Rent per SF - NNN $23.86 Projected Renewal Probability 75% Projected Residual Value per SF $254.98 Present Value of Residual per SF $74.80 Lease Lease Term 13.5 Years Current Rent per SF $19.27 Average Annual Rent Increases 1.05% Discount Rate for Lease Cash Flows (Based on Tenant Credit) 4.75% Present Value of Contractual Lease Cash Flows $200.40 Valuation Projected Market Cap Rate 7.00% Projected Market Value per SF $275 Projected Market Value $24,966,796 |
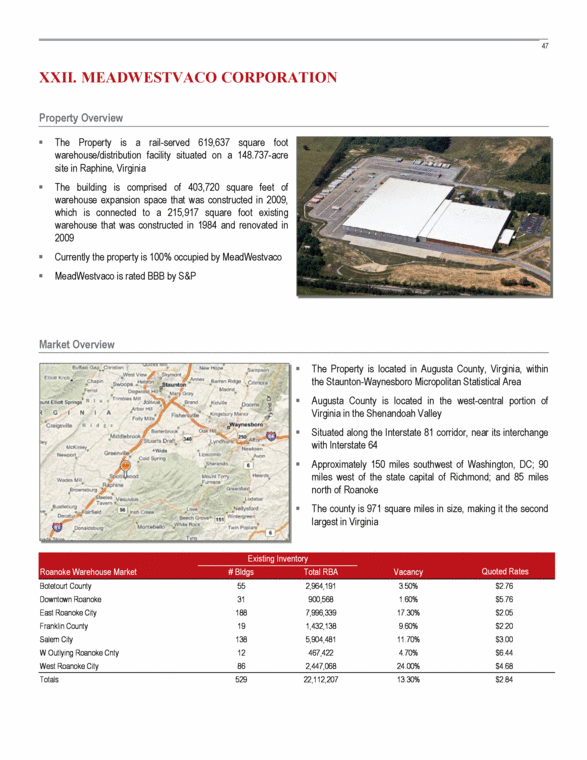
| XXII. MEADWESTVACO CORPORATION The Property is a rail-served 619,637 square foot warehouse/distribution facility situated on a 148.737-acre site in Raphine, Virginia The building is comprised of 403,720 square feet of warehouse expansion space that was constructed in 2009, which is connected to a 215,917 square foot existing warehouse that was constructed in 1984 and renovated in 2009 Currently the property is 100% occupied by MeadWestvaco MeadWestvaco is rated BBB by S&P Property Overview Market Overview The Property is located in Augusta County, Virginia, within the Staunton-Waynesboro Micropolitan Statistical Area Augusta County is located in the west-central portion of Virginia in the Shenandoah Valley Situated along the Interstate 81 corridor, near its interchange with Interstate 64 Approximately 150 miles southwest of Washington, DC; 90 miles west of the state capital of Richmond; and 85 miles north of Roanoke The county is 971 square miles in size, making it the second largest in Virginia Roanoke Warehouse Market # Bldgs Total RBA Botetourt County 55 2,964,191 3.50% $2.76 Downtown Roanoke 31 900,568 1.60% $5.76 East Roanoke City 188 7,996,339 17.30% $2.05 Franklin County 19 1,432,138 9.60% $2.20 Salem City 138 5,904,481 11.70% $3.00 W Outlying Roanoke Cnty 12 467,422 4.70% $6.44 West Roanoke City 86 2,447,068 24.00% $4.68 Totals 529 22,112,207 13.30% $2.84 Quoted Rates Existing Inventory Vacancy |
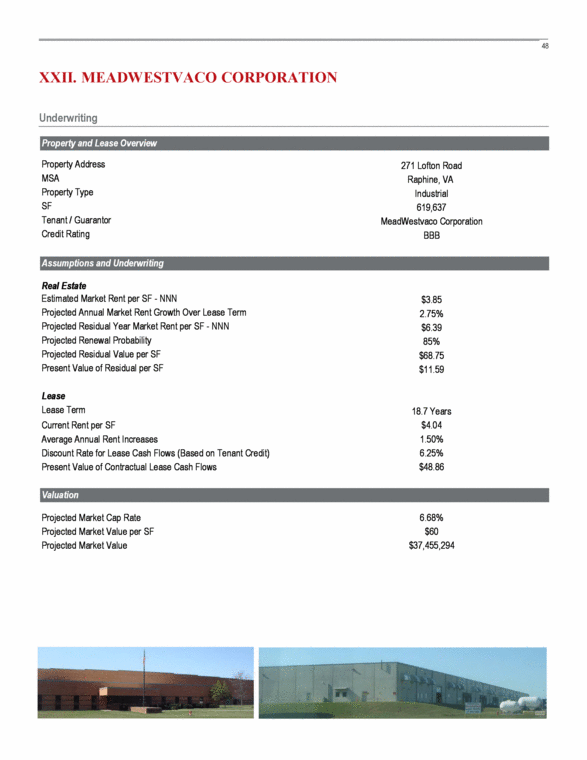
| Underwriting XXII. MEADWESTVACO CORPORATION Property and Lease Overview Property Address 271 Lofton Road MSA Raphine, VA Property Type Industrial SF 619,637 Tenant / Guarantor MeadWestvaco Corporation Credit Rating BBB Assumptions and Underwriting Real Estate Estimated Market Rent per SF - NNN $3.85 Projected Annual Market Rent Growth Over Lease Term 2.75% Projected Residual Year Market Rent per SF - NNN $6.39 Projected Renewal Probability 85% Projected Residual Value per SF $68.75 Present Value of Residual per SF $11.59 Lease Lease Term 18.7 Years Current Rent per SF $4.04 Average Annual Rent Increases 1.50% Discount Rate for Lease Cash Flows (Based on Tenant Credit) 6.25% Present Value of Contractual Lease Cash Flows $48.86 Valuation Projected Market Cap Rate 6.68% Projected Market Value per SF $60 Projected Market Value $37,455,294 |
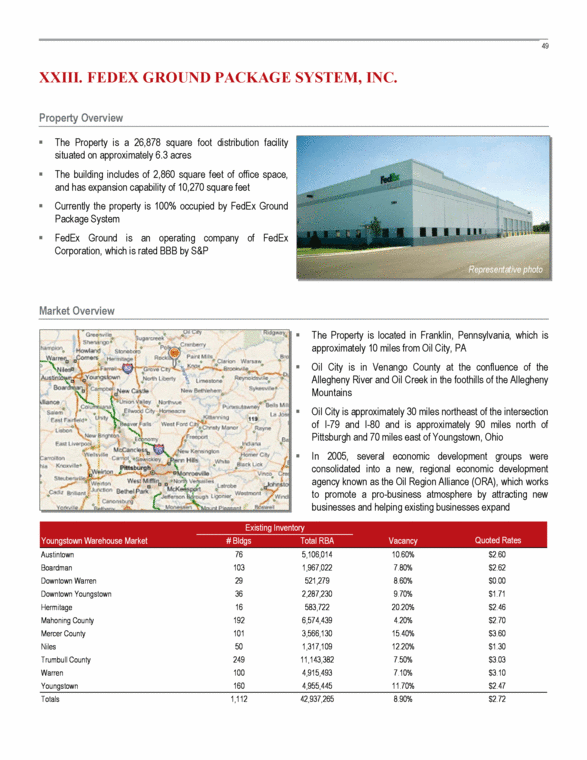
| XXIII. FEDEX GROUND PACKAGE SYSTEM, INC. The Property is a 26,878 square foot distribution facility situated on approximately 6.3 acres The building includes of 2,860 square feet of office space, and has expansion capability of 10,270 square feet Currently the property is 100% occupied by FedEx Ground Package System FedEx Ground is an operating company of FedEx Corporation, which is rated BBB by S&P Property Overview Market Overview The Property is located in Franklin, Pennsylvania, which is approximately 10 miles from Oil City, PA Oil City is in Venango County at the confluence of the Allegheny River and Oil Creek in the foothills of the Allegheny Mountains Oil City is approximately 30 miles northeast of the intersection of I-79 and I-80 and is approximately 90 miles north of Pittsburgh and 70 miles east of Youngstown, Ohio In 2005, several economic development groups were consolidated into a new, regional economic development agency known as the Oil Region Alliance (ORA), which works to promote a pro-business atmosphere by attracting new businesses and helping existing businesses expand Representative photo Youngstown Warehouse Market # Bldgs Total RBA Austintown 76 5,106,014 10.60% $2.60 Boardman 103 1,967,022 7.80% $2.62 Downtown Warren 29 521,279 8.60% $0.00 Downtown Youngstown 36 2,287,230 9.70% $1.71 Hermitage 16 583,722 20.20% $2.46 Mahoning County 192 6,574,439 4.20% $2.70 Mercer County 101 3,566,130 15.40% $3.60 Niles 50 1,317,109 12.20% $1.30 Trumbull County 249 11,143,382 7.50% $3.03 Warren 100 4,915,493 7.10% $3.10 Youngstown 160 4,955,445 11.70% $2.47 Totals 1,112 42,937,265 8.90% $2.72 Quoted Rates Existing Inventory Vacancy |
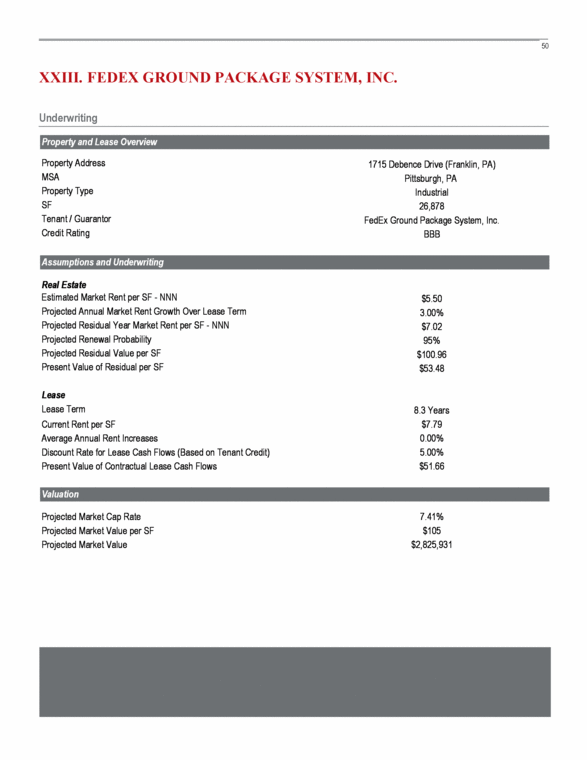
| Underwriting XXIII. FEDEX GROUND PACKAGE SYSTEM, INC. Property and Lease Overview Property Address 1715 Debence Drive (Franklin, PA) MSA Pittsburgh, PA Property Type Industrial SF 26,878 Tenant / Guarantor FedEx Ground Package System, Inc. Credit Rating BBB Assumptions and Underwriting Real Estate Estimated Market Rent per SF - NNN $5.50 Projected Annual Market Rent Growth Over Lease Term 3.00% Projected Residual Year Market Rent per SF - NNN $7.02 Projected Renewal Probability 95% Projected Residual Value per SF $100.96 Present Value of Residual per SF $53.48 Lease Lease Term 8.3 Years Current Rent per SF $7.79 Average Annual Rent Increases 0.00% Discount Rate for Lease Cash Flows (Based on Tenant Credit) 5.00% Present Value of Contractual Lease Cash Flows $51.66 Valuation Projected Market Cap Rate 7.41% Projected Market Value per SF $105 Projected Market Value $2,825,931 |
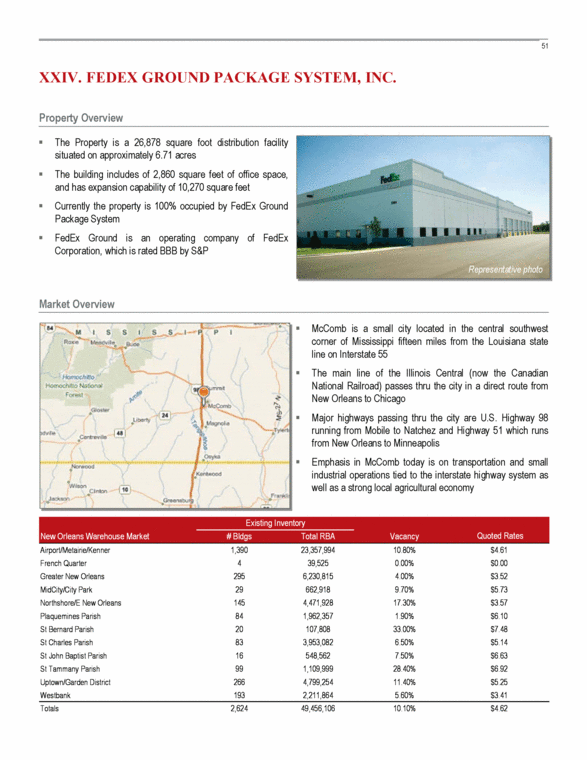
| XXIV. FEDEX GROUND PACKAGE SYSTEM, INC. Property Overview The Property is a 26,878 square foot distribution facility situated on approximately 6.71 acres The building includes of 2,860 square feet of office space, and has expansion capability of 10,270 square feet Currently the property is 100% occupied by FedEx Ground Package System FedEx Ground is an operating company of FedEx Corporation, which is rated BBB by S&P Market Overview McComb is a small city located in the central southwest corner of Mississippi fifteen miles from the Louisiana state line on Interstate 55 The main line of the Illinois Central (now the Canadian National Railroad) passes thru the city in a direct route from New Orleans to Chicago Major highways passing thru the city are U.S. Highway 98 running from Mobile to Natchez and Highway 51 which runs from New Orleans to Minneapolis Emphasis in McComb today is on transportation and small industrial operations tied to the interstate highway system as well as a strong local agricultural economy Representative photo New Orleans Warehouse Market # Bldgs Total RBA Airport/Metairie/Kenner 1,390 23,357,994 10.80% $4.61 French Quarter 4 39,525 0.00% $0.00 Greater New Orleans 295 6,230,815 4.00% $3.52 MidCity/City Park 29 662,918 9.70% $5.73 Northshore/E New Orleans 145 4,471,928 17.30% $3.57 Plaquemines Parish 84 1,962,357 1.90% $6.10 St Bernard Parish 20 107,808 33.00% $7.48 St Charles Parish 83 3,953,082 6.50% $5.14 St John Baptist Parish 16 548,562 7.50% $6.63 St Tammany Parish 99 1,109,999 28.40% $6.92 Uptown/Garden District 266 4,799,254 11.40% $5.25 Westbank 193 2,211,864 5.60% $3.41 Totals 2,624 49,456,106 10.10% $4.62 Quoted Rates Existing Inventory Vacancy |
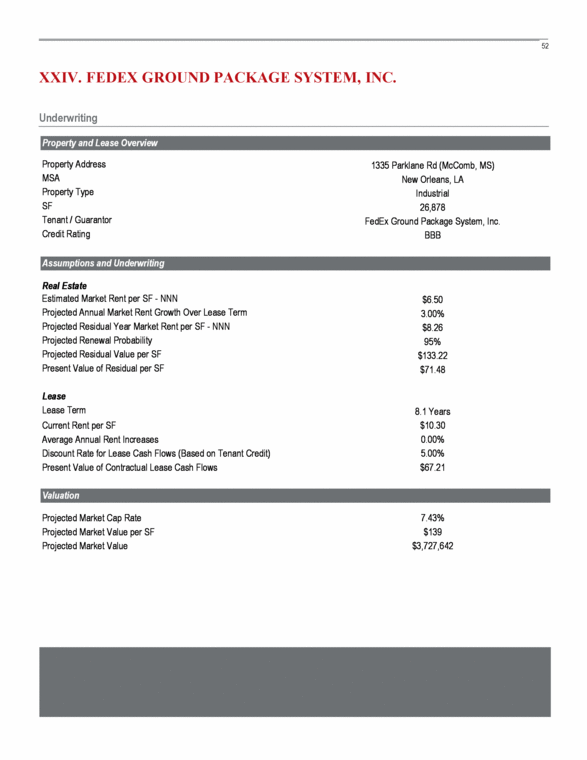
| Underwriting XXIV. FEDEX GROUND PACKAGE SYSTEM, INC. Property and Lease Overview Property Address 1335 Parklane Rd (McComb, MS) MSA New Orleans, LA Property Type Industrial SF 26,878 Tenant / Guarantor FedEx Ground Package System, Inc. Credit Rating BBB Assumptions and Underwriting Real Estate Estimated Market Rent per SF - NNN $6.50 Projected Annual Market Rent Growth Over Lease Term 3.00% Projected Residual Year Market Rent per SF - NNN $8.26 Projected Renewal Probability 95% Projected Residual Value per SF $133.22 Present Value of Residual per SF $71.48 Lease Lease Term 8.1 Years Current Rent per SF $10.30 Average Annual Rent Increases 0.00% Discount Rate for Lease Cash Flows (Based on Tenant Credit) 5.00% Present Value of Contractual Lease Cash Flows $67.21 Valuation Projected Market Cap Rate 7.43% Projected Market Value per SF $139 Projected Market Value $3,727,642 |
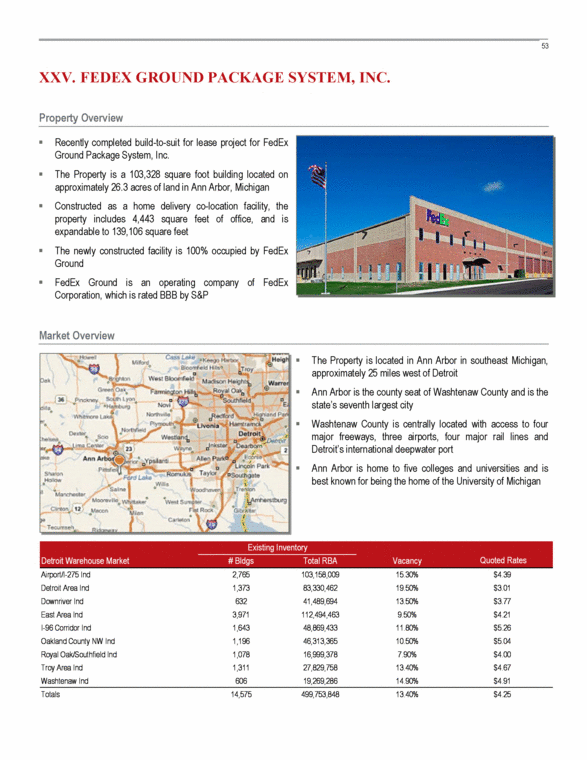
| XXV. FEDEX GROUND PACKAGE SYSTEM, INC. Recently completed build-to-suit for lease project for FedEx Ground Package System, Inc. The Property is a 103,328 square foot building located on approximately 26.3 acres of land in Ann Arbor, Michigan Constructed as a home delivery co-location facility, the property includes 4,443 square feet of office, and is expandable to 139,106 square feet The newly constructed facility is 100% occupied by FedEx Ground FedEx Ground is an operating company of FedEx Corporation, which is rated BBB by S&P Property Overview Market Overview The Property is located in Ann Arbor in southeast Michigan, approximately 25 miles west of Detroit Ann Arbor is the county seat of Washtenaw County and is the state’s seventh largest city Washtenaw County is centrally located with access to four major freeways, three airports, four major rail lines and Detroit’s international deepwater port Ann Arbor is home to five colleges and universities and is best known for being the home of the University of Michigan Detroit Warehouse Market # Bldgs Total RBA Airport/I-275 Ind 2,765 103,158,009 15.30% $4.39 Detroit Area Ind 1,373 83,330,462 19.50% $3.01 Downriver Ind 632 41,489,694 13.50% $3.77 East Area Ind 3,971 112,494,463 9.50% $4.21 I-96 Corridor Ind 1,643 48,869,433 11.80% $5.26 Oakland County NW Ind 1,196 46,313,365 10.50% $5.04 Royal Oak/Southfield Ind 1,078 16,999,378 7.90% $4.00 Troy Area Ind 1,311 27,829,758 13.40% $4.67 Washtenaw Ind 606 19,269,286 14.90% $4.91 Totals 14,575 499,753,848 13.40% $4.25 Quoted Rates Existing Inventory Vacancy |
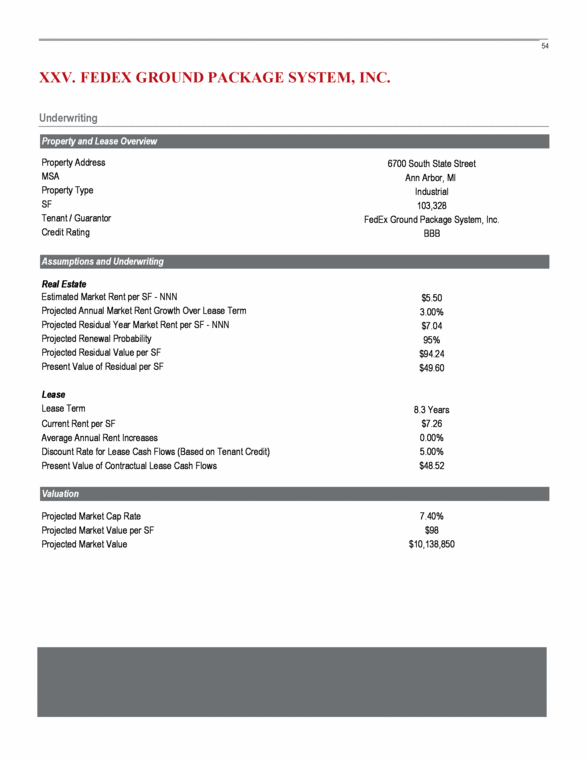
| Underwriting XXV. FEDEX GROUND PACKAGE SYSTEM, INC. Property and Lease Overview Property Address 6700 South State Street MSA Ann Arbor, MI Property Type Industrial SF 103,328 Tenant / Guarantor FedEx Ground Package System, Inc. Credit Rating BBB Assumptions and Underwriting Real Estate Estimated Market Rent per SF - NNN $5.50 Projected Annual Market Rent Growth Over Lease Term 3.00% Projected Residual Year Market Rent per SF - NNN $7.04 Projected Renewal Probability 95% Projected Residual Value per SF $94.24 Present Value of Residual per SF $49.60 Lease Lease Term 8.3 Years Current Rent per SF $7.26 Average Annual Rent Increases 0.00% Discount Rate for Lease Cash Flows (Based on Tenant Credit) 5.00% Present Value of Contractual Lease Cash Flows $48.52 Valuation Projected Market Cap Rate 7.40% Projected Market Value per SF $98 Projected Market Value $10,138,850 |
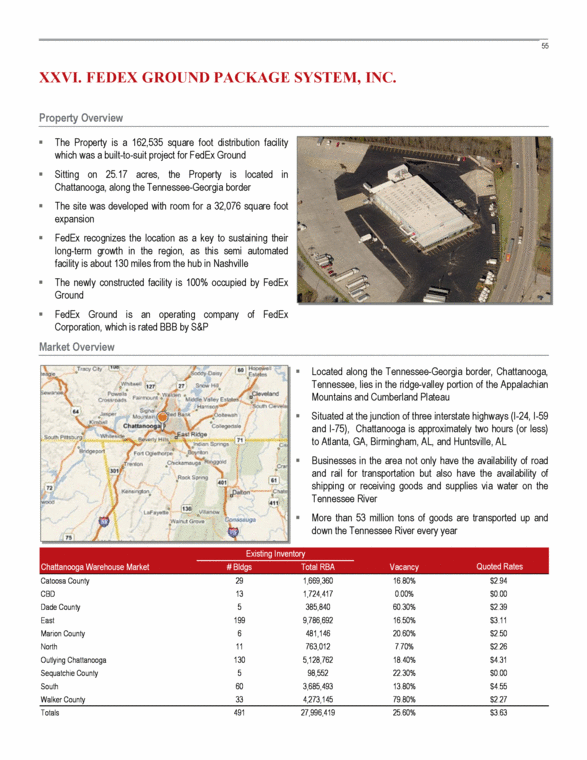
| XXVI. FEDEX GROUND PACKAGE SYSTEM, INC. The Property is a 162,535 square foot distribution facility which was a built-to-suit project for FedEx Ground Sitting on 25.17 acres, the Property is located in Chattanooga, along the Tennessee-Georgia border The site was developed with room for a 32,076 square foot expansion FedEx recognizes the location as a key to sustaining their long-term growth in the region, as this semi automated facility is about 130 miles from the hub in Nashville The newly constructed facility is 100% occupied by FedEx Ground FedEx Ground is an operating company of FedEx Corporation, which is rated BBB by S&P Property Overview Market Overview Located along the Tennessee-Georgia border, Chattanooga, Tennessee, lies in the ridge-valley portion of the Appalachian Mountains and Cumberland Plateau Situated at the junction of three interstate highways (I-24, I-59 and I-75), Chattanooga is approximately two hours (or less) to Atlanta, GA, Birmingham, AL, and Huntsville, AL Businesses in the area not only have the availability of road and rail for transportation but also have the availability of shipping or receiving goods and supplies via water on the Tennessee River More than 53 million tons of goods are transported up and down the Tennessee River every year Chattanooga Warehouse Market # Bldgs Total RBA Catoosa County 29 1,669,360 16.80% $2.94 CBD 13 1,724,417 0.00% $0.00 Dade County 5 385,840 60.30% $2.39 East 199 9,786,692 16.50% $3.11 Marion County 6 481,146 20.60% $2.50 North 11 763,012 7.70% $2.26 Outlying Chattanooga 130 5,128,762 18.40% $4.31 Sequatchie County 5 98,552 22.30% $0.00 South 60 3,685,493 13.80% $4.55 Walker County 33 4,273,145 79.80% $2.27 Totals 491 27,996,419 25.60% $3.63 Quoted Rates Existing Inventory Vacancy |
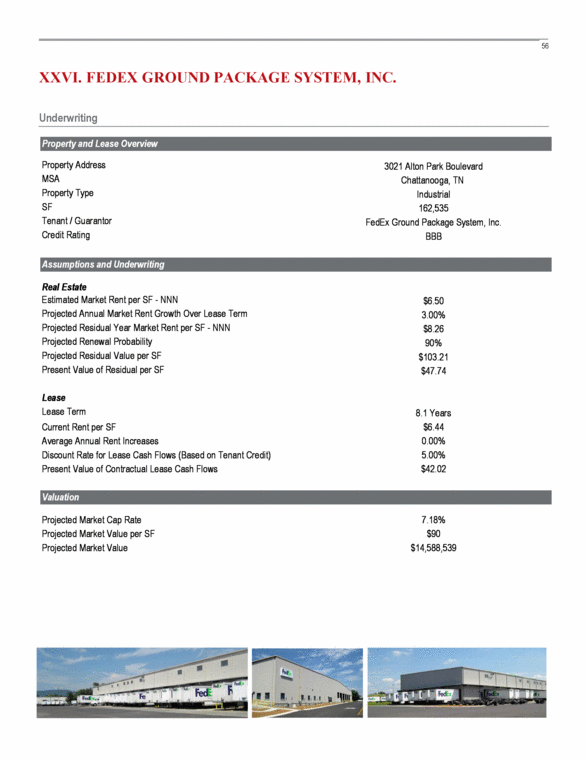
| Underwriting XXVI. FEDEX GROUND PACKAGE SYSTEM, INC. Property and Lease Overview Property Address 3021 Alton Park Boulevard MSA Chattanooga, TN Property Type Industrial SF 162,535 Tenant / Guarantor FedEx Ground Package System, Inc. Credit Rating BBB Assumptions and Underwriting Real Estate Estimated Market Rent per SF - NNN $6.50 Projected Annual Market Rent Growth Over Lease Term 3.00% Projected Residual Year Market Rent per SF - NNN $8.26 Projected Renewal Probability 90% Projected Residual Value per SF $103.21 Present Value of Residual per SF $47.74 Lease Lease Term 8.1 Years Current Rent per SF $6.44 Average Annual Rent Increases 0.00% Discount Rate for Lease Cash Flows (Based on Tenant Credit) 5.00% Present Value of Contractual Lease Cash Flows $42.02 Valuation Projected Market Cap Rate 7.18% Projected Market Value per SF $90 Projected Market Value $14,588,539 |
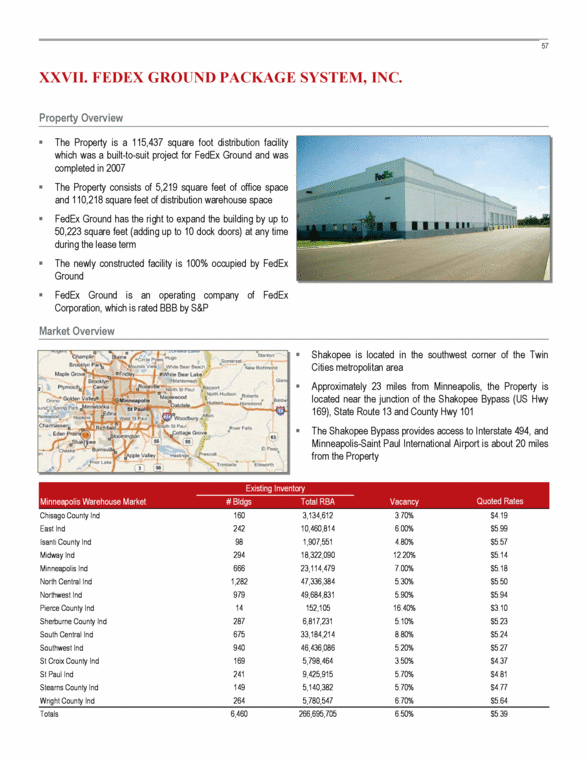
| XXVII. FEDEX GROUND PACKAGE SYSTEM, INC. The Property is a 115,437 square foot distribution facility which was a built-to-suit project for FedEx Ground and was completed in 2007 The Property consists of 5,219 square feet of office space and 110,218 square feet of distribution warehouse space FedEx Ground has the right to expand the building by up to 50,223 square feet (adding up to 10 dock doors) at any time during the lease term The newly constructed facility is 100% occupied by FedEx Ground FedEx Ground is an operating company of FedEx Corporation, which is rated BBB by S&P Property Overview Market Overview Shakopee is located in the southwest corner of the Twin Cities metropolitan area Approximately 23 miles from Minneapolis, the Property is located near the junction of the Shakopee Bypass (US Hwy 169), State Route 13 and County Hwy 101 The Shakopee Bypass provides access to Interstate 494, and Minneapolis-Saint Paul International Airport is about 20 miles from the Property Minneapolis Warehouse Market # Bldgs Total RBA Chisago County Ind 160 3,134,612 3.70% $4.19 East Ind 242 10,460,814 6.00% $5.99 Isanti County Ind 98 1,907,551 4.80% $5.57 Midway Ind 294 18,322,090 12.20% $5.14 Minneapolis Ind 666 23,114,479 7.00% $5.18 North Central Ind 1,282 47,336,384 5.30% $5.50 Northwest Ind 979 49,684,831 5.90% $5.94 Pierce County Ind 14 152,105 16.40% $3.10 Sherburne County Ind 287 6,817,231 5.10% $5.23 South Central Ind 675 33,184,214 8.80% $5.24 Southwest Ind 940 46,436,086 5.20% $5.27 St Croix County Ind 169 5,798,464 3.50% $4.37 St Paul Ind 241 9,425,915 5.70% $4.81 Stearns County Ind 149 5,140,382 5.70% $4.77 Wright County Ind 264 5,780,547 6.70% $5.64 Totals 6,460 266,695,705 6.50% $5.39 Quoted Rates Existing Inventory Vacancy |
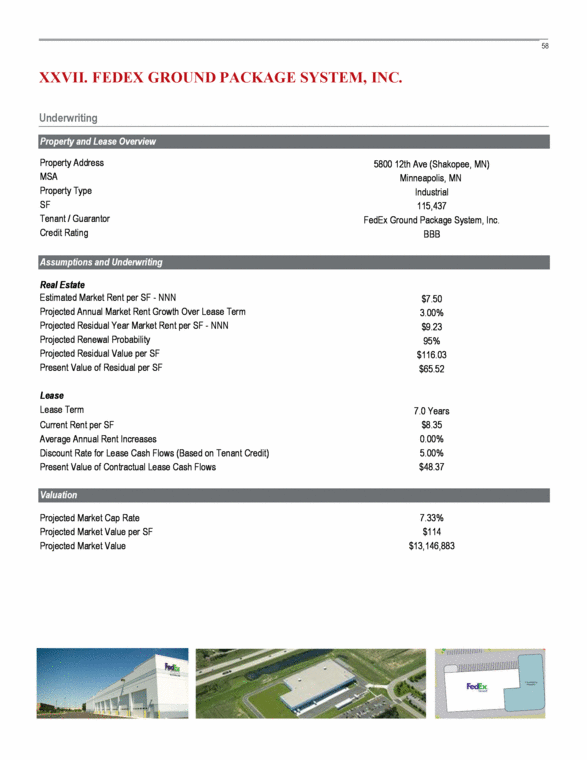
| Underwriting XXVII. FEDEX GROUND PACKAGE SYSTEM, INC. Property and Lease Overview Property Address 5800 12th Ave (Shakopee, MN) MSA Minneapolis, MN Property Type Industrial SF 115,437 Tenant / Guarantor FedEx Ground Package System, Inc. Credit Rating BBB Assumptions and Underwriting Real Estate Estimated Market Rent per SF - NNN $7.50 Projected Annual Market Rent Growth Over Lease Term 3.00% Projected Residual Year Market Rent per SF - NNN $9.23 Projected Renewal Probability 95% Projected Residual Value per SF $116.03 Present Value of Residual per SF $65.52 Lease Lease Term 7.0 Years Current Rent per SF $8.35 Average Annual Rent Increases 0.00% Discount Rate for Lease Cash Flows (Based on Tenant Credit) 5.00% Present Value of Contractual Lease Cash Flows $48.37 Valuation Projected Market Cap Rate 7.33% Projected Market Value per SF $114 Projected Market Value $13,146,883 |
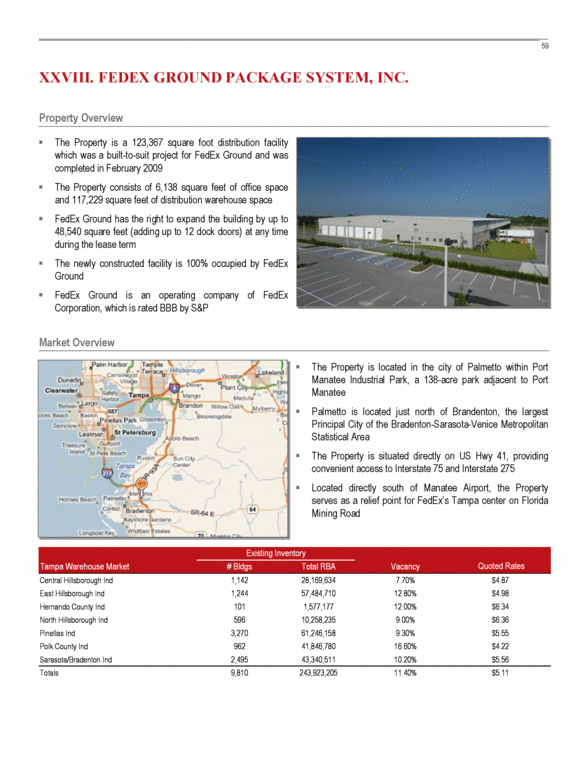
| XXVIII. FEDEX GROUND PACKAGE SYSTEM, INC. The Property is a 123,367 square foot distribution facility which was a built-to-suit project for FedEx Ground and was completed in February 2009 The Property consists of 6,138 square feet of office space and 117,229 square feet of distribution warehouse space FedEx Ground has the right to expand the building by up to 48,540 square feet (adding up to 12 dock doors) at any time during the lease term The newly constructed facility is 100% occupied by FedEx Ground FedEx Ground is an operating company of FedEx Corporation, which is rated BBB by S&P Property Overview Market Overview The Property is located in the city of Palmetto within Port Manatee Industrial Park, a 138-acre park adjacent to Port Manatee Palmetto is located just north of Brandenton, the largest Principal City of the Bradenton-Sarasota-Venice Metropolitan Statistical Area The Property is situated directly on US Hwy 41, providing convenient access to Interstate 75 and Interstate 275 Located directly south of Manatee Airport, the Property serves as a relief point for FedEx’s Tampa center on Florida Mining Road Tampa Warehouse Market # Bldgs Total RBA Central Hillsborough Ind 1,142 28,169,634 7.70% $4.87 East Hillsborough Ind 1,244 57,484,710 12.80% $4.98 Hernando County Ind 101 1,577,177 12.00% $6.34 North Hillsborough Ind 596 10,258,235 9.00% $6.36 Pinellas Ind 3,270 61,246,158 9.30% $5.55 Polk County Ind 962 41,846,780 16.60% $4.22 Sarasota/Bradenton Ind 2,495 43,340,511 10.20% $5.56 Totals 9,810 243,923,205 11.40% $5.11 Quoted Rates Existing Inventory Vacancy |
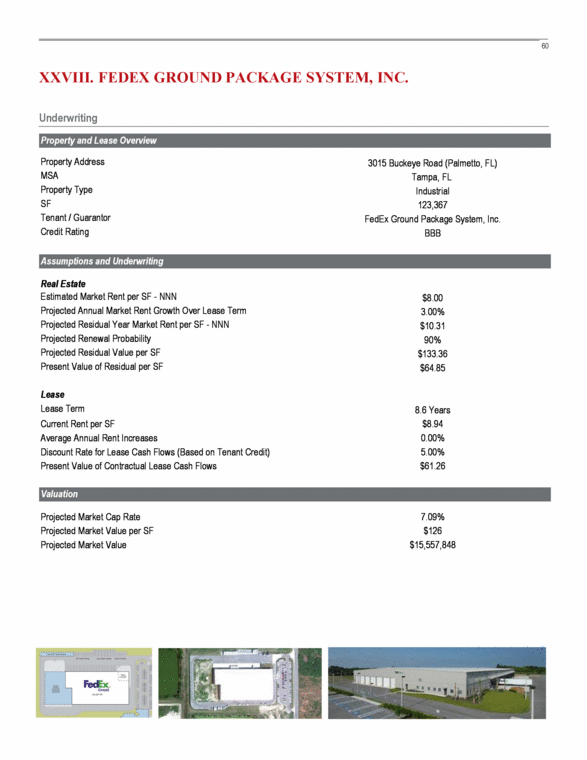
| Underwriting XXVIII. FEDEX GROUND PACKAGE SYSTEM, INC. Property and Lease Overview Property Address 3015 Buckeye Road (Palmetto, FL) MSA Tampa, FL Property Type Industrial SF 123,367 Tenant / Guarantor FedEx Ground Package System, Inc. Credit Rating BBB Assumptions and Underwriting Real Estate Estimated Market Rent per SF - NNN $8.00 Projected Annual Market Rent Growth Over Lease Term 3.00% Projected Residual Year Market Rent per SF - NNN $10.31 Projected Renewal Probability 90% Projected Residual Value per SF $133.36 Present Value of Residual per SF $64.85 Lease Lease Term 8.6 Years Current Rent per SF $8.94 Average Annual Rent Increases 0.00% Discount Rate for Lease Cash Flows (Based on Tenant Credit) 5.00% Present Value of Contractual Lease Cash Flows $61.26 Valuation Projected Market Cap Rate 7.09% Projected Market Value per SF $126 Projected Market Value $15,557,848 |
| XXIX. FEDERAL EXPRESS CORP. The Property was completed as part of a build-to-suit for lease project for Federal Express Corporation Federal Express Corporation is using the premises as a depot that receives incoming packages from Newark Airport, deploys distribution fleets for local deliveries and collections, accumulates mail and packages for departure freight, and provides services for visiting customers The Property is a 98,753 square foot building located on approximately 10.33 acres in South Bronx The facility is 100% occupied by Federal Express Corporation, rated Baa2 by Moody’s Property Overview Market Overview The Property is located within the Harlem River Yard, a 96-acre site located in the South Bronx section of New York City The Bronx is the northernmost of the five boroughs of New York City, and is served by six lines of the New York City Subway with 70 stations in the Bronx Approximately 6 miles from LaGuardia Airport, and 17 miles from John F. Kennedy International Airport The Property is situated with direct access to Interstate 87 and Interstate 278 Several colleges and universities are located in the Bronx, including Fordham University and Albert Einstein College of Medicine, among many others NYC Outer Boroughs Warehouse Market # Bldgs Total RBA Bronx 1 20,000 0.00% $0.00 Central Queens Ind 507 16,278,485 4.00% $9.80 North Brooklyn Ind 1,970 50,474,042 3.30% $13.54 Northeast Queens Ind 465 11,008,121 2.20% $13.94 Northwest Queens Ind 1,119 32,798,903 4.60% $12.87 South Brooklyn Ind 948 27,840,139 6.20% $10.30 South Queens Ind 479 11,511,913 6.50% $11.11 Staten Island Ind 152 4,695,494 5.30% $9.74 Totals 5,641 154,627,097 4.40% $11.70 Quoted Rates Existing Inventory Vacancy |
| Underwriting XXIX. FEDERAL EXPRESS CORP. Property and Lease Overview Property Address 670 E. 132nd Street (Bronx, NY) MSA New York, NY Property Type Industrial SF 98,753 Tenant / Guarantor Federal Express Corp. Credit Rating Baa2 Assumptions and Underwriting Real Estate Estimated Market Rent per SF - NNN $11.50 Projected Annual Market Rent Growth Over Lease Term 3.00% Projected Residual Year Market Rent per SF - NNN $19.44 Projected Renewal Probability 90% Projected Residual Value per SF $205.60 Present Value of Residual per SF $41.01 Lease Lease Term 17.8 Years Current Rent per SF $18.12 Average Annual Rent Increases 1.05% Discount Rate for Lease Cash Flows (Based on Tenant Credit) 5.00% Present Value of Contractual Lease Cash Flows $226.54 Valuation Projected Market Cap Rate 6.77% Projected Market Value per SF $268 Projected Market Value $26,420,806 |
| XXX. FEDEX CORPORATION The Property will be a 79,000 square foot distribution facility which is a built-to-suit project for FedEx Freight, Inc. and is expected to be completed in January 2011 The Property will consist of 1,880 sf of POD space, 6,800 sf of office space, 9,720 sf of maintenance space and 60,600 sf of warehouse space The facility will be designed to accommodate 29,580 square feet of building expansion The newly constructed facility will be 100% occupied by FedEx Freight , Inc., guaranteed by FedEx Corp., which is rated BBB by S&P Property Overview Market Overview The Property will be located in southwest Wichita, directly adjacent to Wichita Mid-Continent Airport Located along Southwest Boulevard, the Property will have convenient access to Interstate 235 and central Wichita Representative photo Wichita Warehouse Market # Bldgs Total RBA Airport 21 694,244 7.60% $5.41 Andover/East 3 114,381 0.00% $0.00 Augusta/El Dorado 15 458,089 8.50% $1.41 Derby/Haysville/Mulvane 86 827,123 8.90% $4.62 Downtown 239 2,872,789 5.70% $3.20 Goddard/West 41 903,590 9.00% $5.09 McConnell AFB/Southeast 15 2,635,866 0.60% $3.64 Newton/Hesston 16 2,119,023 2.70% $2.36 Northeast 329 11,461,501 9.40% $3.96 Northwest 42 335,143 8.10% $4.43 Park City/North 20 1,063,060 57.70% $4.23 Southeast 263 4,471,289 7.00% $3.74 Southwest 515 10,454,219 7.00% $4.60 Sumner County 18 202,621 10.90% $22.75 Totals 1,623 38,612,938 8.50% $4.27 Quoted Rates Existing Inventory Vacancy |
| Underwriting XXX. FEDEX CORPORATION Property and Lease Overview Property Address 3560 South Maize Road MSA Wichita, KS Property Type Industrial SF 79,000 Tenant / Guarantor FedEx Corporation Credit Rating BBB Assumptions and Underwriting Real Estate Estimated Market Rent per SF - NNN $5.00 Projected Annual Market Rent Growth Over Lease Term 2.75% Projected Residual Year Market Rent per SF - NNN $7.51 Projected Renewal Probability 85% Projected Residual Value per SF $162.42 Present Value of Residual per SF $41.63 Lease Lease Term 15.0 Years Current Rent per SF $14.61 Average Annual Rent Increases 0.31% Discount Rate for Lease Cash Flows (Based on Tenant Credit) 5.00% Present Value of Contractual Lease Cash Flows $154.51 Valuation Projected Market Cap Rate 7.45% Projected Market Value per SF $196 Projected Market Value $15,495,271 |
| XXXI. FEDEX CORPORATION The Property will be a 49,080 square foot building which is a built-to-suit for lease project for FedEx Freight, Inc. Expected delivery of the Property is January 2011 The Property will be constructed as a Freight Truck Terminal facility, which will include a 47,720 square foot service center, 1,200 square foot fuel facility and a 160 square foot guard house The newly constructed facility will be 100% occupied by FedEx Freight , Inc., guaranteed by FedEx Corp., which is rated BBB by S&P Property Overview Market Overview The Property will be located in the Airport / Metairie / Kenner submarket, directly adjacent to the Louis Armstrong New Orleans International Airport The Property will have access to Interstate 10 and Interstate 310, giving it convenient access to central New Orleans Representative photo New Orleans Warehouse Market # Bldgs Total RBA Airport/Metairie/Kenner 1,390 23,357,994 10.80% $4.61 French Quarter 4 39,525 0.00% $0.00 Greater New Orleans 295 6,230,815 4.00% $3.52 MidCity/City Park 29 662,918 9.70% $5.73 Northshore/E New Orleans 145 4,471,928 17.30% $3.57 Plaquemines Parish 84 1,962,357 1.90% $6.10 St Bernard Parish 20 107,808 33.00% $7.48 St Charles Parish 83 3,953,082 6.50% $5.14 St John Baptist Parish 16 548,562 7.50% $6.63 St Tammany Parish 99 1,109,999 28.40% $6.92 Uptown/Garden District 266 4,799,254 11.40% $5.25 Westbank 193 2,211,864 5.60% $3.41 Totals 2,624 49,456,106 10.10% $4.62 Quoted Rates Existing Inventory Vacancy |
| Underwriting XXXI. FEDEX CORPORATION Property and Lease Overview Property Address St. Rose, St. Charles Parish, LA MSA New Orleans, LA Property Type Industrial SF 49,080 Tenant / Guarantor FedEx Corporation Credit Rating BBB Assumptions and Underwriting Real Estate Estimated Market Rent per SF - NNN $16.50 Projected Annual Market Rent Growth Over Lease Term 2.50% Projected Residual Year Market Rent per SF - NNN $23.90 Projected Renewal Probability 85% Projected Residual Value per SF $317.89 Present Value of Residual per SF $81.48 Lease Lease Term 15.0 Years Current Rent per SF $29.49 Average Annual Rent Increases 1.37% Discount Rate for Lease Cash Flows (Based on Tenant Credit) 5.00% Present Value of Contractual Lease Cash Flows $333.17 Valuation Projected Market Cap Rate 7.11% Projected Market Value per SF $415 Projected Market Value $20,351,083 |
| Property Overview XXXII. AVIALL SERVICES, INC. The Property is a bulk distribution building comprising approximately 578,734 square feet The Property was expanded in 2007 from its original 320,000 square feet Sitting on 28± acres, the building contains both a 2-story corporate office headquarters and a large warehouse distribution facility The Property is 100% occupied by Aviall, Inc., a wholly owned subsidiary of Boeing Boeing is rated A by S&P Market Overview The Property is situated on Dallas/Fort Worth International Airport property Conveniently located along Interstate 635, the Property has direct access to central Dallas and Fort Worth Dallas is the largest economic center of the 12-county Dallas–Fort Worth–Arlington metropolitan area The city's economy is primarily based on banking, commerce, telecommunications, computer technology, energy, and transportation Only New York City and Houston are home to more Fortune 500 headquarters in the city limits Dallas Warehouse Market # Bldgs Total RBA DFW Airport Ind 464 52,627,588 16.10% $3.98 Northwest Dallas Ind 1,122 79,188,543 13.40% $4.12 Totals 11,283 604,640,878 12.10% $3.84 Dallas Total Office Market # Bldgs Total RBA Las Colinas 370 35,904,560 20.20% $19.76 Mid-Cities 1,766 35,028,055 13.10% $19.04 Totals 9,066 329,500,983 18.00% $19.74 Existing Inventory Vacancy Quoted Gross Rates Quoted Rates Existing Inventory Vacancy |
| Underwriting XXXII. AVIALL SERVICES, INC. Property and Lease Overview Property Address 2750 Regent Blvd MSA Dallas / Fort Worth, TX Property Type Industrial SF 578,734 Tenant / Guarantor Aviall Services, Inc. Credit Rating A Assumptions and Underwriting Real Estate Estimated Market Rent per SF - NNN $5.50 Projected Annual Market Rent Growth Over Lease Term 3.00% Projected Residual Year Market Rent per SF - NNN $7.39 Projected Renewal Probability 90% Projected Residual Value per SF $79.89 Present Value of Residual per SF $32.21 Lease Lease Term 10.0 Years Current Rent per SF $6.14 Average Annual Rent Increases 1.57% Discount Rate for Lease Cash Flows (Based on Tenant Credit) 5.00% Present Value of Contractual Lease Cash Flows $50.63 Valuation Projected Market Cap Rate 7.41% Projected Market Value per SF $83 Projected Market Value $47,946,629 |
| XXXIII. CATERPILLAR INC. The Property was completed as part of a build-to-suit for lease project for Caterpillar, Inc. The newly constructed Class A building was completed in May 2008 Section I contains 118,000 SF of warehouse and 6,000 SF of office area and is used by Caterpillar Logistics to provide logistical services to Newmont Mining including the storage and management of inventories Section II contains 38,180 SF and is occupied by Cashman CAT as its parts distribution facility Caterpillar Logistics is guaranteed by its parent company, Caterpillar Inc., rated A by S&P Property Overview Market Overview The Property is located in Canyon Business Park in Elko, Nevada Elko, NV is in the heart of Northeastern Nevada and is located in close proximity to major producing gold mining in Nevada Nevada is the leading gold producing state in the nation and is the fourth largest gold producing area in the world Elko, NV is the largest city in Northeastern Nevada and is quickly becoming one of Nevada’s fastest growing areas Salt Lake City Warehouse Market # Bldgs Total RBA Cache County Ind 40 1,110,958 9.90% $5.50 Davis/Weber Counties Ind 1,252 44,442,723 4.60% $3.81 Downtown Ind 481 8,573,359 3.10% $3.46 Juab County Ind 2 70,000 0.00% $0.00 Morgan County Ind 2 52,000 0.00% $0.00 South Valley Ind 1,591 29,705,484 2.20% $5.37 Summit County Ind 12 324,353 0.00% $5.40 Tooele County Ind 34 2,434,810 41.10% $2.73 Utah County Ind 905 23,620,124 4.60% $5.03 West Valley Ind 1,465 65,239,411 4.30% $4.19 Totals 5,784 175,573,222 4.60% $4.25 Quoted Rates Existing Inventory Vacancy |
| Underwriting XXXIII. CATERPILLAR INC. Property and Lease Overview Property Address 4216 – 4220 Ruby Vista Drive MSA Elko, NV Property Type Industrial SF 162,180 Tenant / Guarantor Caterpillar Inc. Credit Rating A Assumptions and Underwriting Real Estate Estimated Market Rent per SF - NNN $6.25 Projected Annual Market Rent Growth Over Lease Term 2.75% Projected Residual Year Market Rent per SF - NNN $7.76 Projected Renewal Probability 95% Projected Residual Value per SF $91.37 Present Value of Residual per SF $46.00 Lease Lease Term 8.0 Years Current Rent per SF $6.82 Average Annual Rent Increases 1.06% Discount Rate for Lease Cash Flows (Based on Tenant Credit) 5.00% Present Value of Contractual Lease Cash Flows $45.46 Valuation Projected Market Cap Rate 7.46% Projected Market Value per SF $91 Projected Market Value $14,831,795 |
| Property Overview XXXIV. HEWLETT-PACKARD COMPANY The Property is a 3-story, 568,503 net rentable square foot (593,934 gross square foot) office building The Class A office building was completed in 2001 with state-of-the-art building technologies and systems The building, situated on a 50± acre site, provides large, flexible open office environment configured within three distinct sections The Property is 100% occupied by Hewlett-Packard Co., the world’s largest IT company with revenue totaling $114.6 billion for fiscal 2009 Hewlett-Packard Co. is rated A by S&P Market Overview The Property is situated on the 350-acre Centerpoint Business Campus in the north suburb of Pontiac, approximately 30 miles northwest of downtown Detroit and within 5 miles of Auburn Hills and Bloomfield Hills Centerpoint Business Campus is a multi-use business park, of which approximately 87 percent of this space is office and industrial while the remaining space features hotels, two restaurants, a retail center and a daycare facility The Property has immediate access to Interstates 75, 696 and M-59 which connect the area to downtown Detroit and to all neighboring suburbs Detroit Class A Office Market # Bldgs Total RBA Bloomfield 29 3,273,304 19.40% $25.84 Detroit/The Pointes 31 12,481,171 16.90% $22.76 Livingston/W Oakland 14 1,464,892 16.10% $23.56 Macomb 10 576,346 30.10% $24.98 North Oakland 16 6,334,686 4.20% $24.41 Royal Oak 1 27,787 31.70% $24.78 Southfield 28 6,965,720 21.80% $21.25 Troy 32 6,296,093 24.00% $19.88 Washtenaw 26 3,513,349 7.40% $25.47 West Wayne 29 6,235,213 9.80% $21.19 Totals 217 47,211,791 15.50% $22.20 Quoted Gross Rates Existing Inventory Vacancy |
| Underwriting XXXIV. HEWLETT-PACKARD COMPANY Note: Pursuant to the lease, ECM is responsible for $1.3 million of operating expenses relating to this property per year. The tenant is obligated to fund all operating expenses in excess of $1.3 million per year, except for roof and structure repairs. Property and Lease Overview Property Address 585 South Boulevard (Pontiac, MI) MSA Detroit, MI Property Type Office SF 568,503 Tenant / Guarantor Hewlett-Packard Company Credit Rating A Assumptions and Underwriting Real Estate Estimated Market Rent per SF - NNN $9.00 Projected Annual Market Rent Growth Over Lease Term 2.50% Projected Residual Year Market Rent per SF - NNN $10.83 Projected Renewal Probability 65% Projected Residual Value per SF $99.77 Present Value of Residual per SF $42.60 Lease Lease Term 7.5 Years Current Rent per SF $9.43 Average Annual Rent Increases 4.03% Discount Rate for Lease Cash Flows (Based on Tenant Credit) 4.75% Present Value of Contractual Lease Cash Flows $66.07 Valuation Projected Market Cap Rate 8.67% Projected Market Value per SF $109 Projected Market Value $61,779,982 |
| XXXV. WALGREEN CO. The Property is 14,550-square foot retail property (drug store) located at 10000 West Florissant Avenue in Dellwood, Missouri This Walgreens location was recently constructed at a corner location Walgreens was involved in the tenant improvement finish and design The Property is leased to Walgreens for a term of 75 years, with Walgreens having an option to terminate after 25 years The Property is 100% occupied by Walgreens, rated A by S&P Property Overview Market Overview The Property is located in Dellwood, Missouri, a city in North St. Louis County The Property is located less than 10 miles east of Lambert St. Louis International Airport Major retailers in the area include a number of car dealerships, restaurants and furniture stores St. Louis is home to Washington University St. Louis Retail Market # Bldgs Total RBA Central St Louis Cnty Ret 543 6,013,846 5.60% $15.36 Franklin County Ret 196 2,715,080 3.90% $7.57 Jefferson County Ret 127 1,285,773 8.90% $10.56 Lincoln County Ret 27 364,644 14.90% $13.16 Metro East Illinois Ret 512 3,956,474 6.20% $10.64 NE Metro Illinois Ret 158 1,625,353 1.60% $17.17 North St Louis County Ret 839 8,308,127 9.90% $9.40 Outer Metro Illinois Ret 37 181,867 7.70% $4.73 Outer Monroe County Ret 2 4,816 0.00% $0.00 Outer St Louis County Ret 41 289,893 8.10% $17.94 SE Metro Illinois Ret 80 801,943 3.50% $9.80 South St Louis County Ret 318 4,480,652 5.00% $11.52 St Charles County Ret 607 6,721,582 6.30% $12.64 St Louis City Ret 1,344 10,877,659 7.70% $10.84 SW St Louis County Ret 254 2,209,104 4.20% $13.69 West St Louis County Ret 252 3,629,279 5.30% $13.88 Totals 5,337 53,466,092 6.60% $11.60 Quoted Rates Existing Inventory Vacancy |
| Underwriting XXXV. WALGREEN CO. Property and Lease Overview Property Address 10000 West Florissant Avenue (Dellwood, MO) MSA St. Louis, MO Property Type Retail SF 14,550 Tenant / Guarantor Walgreen Co. Credit Rating A Assumptions and Underwriting Real Estate Estimated Market Rent per SF - NNN $12.00 Projected Annual Market Rent Growth Over Lease Term 2.50% Projected Residual Year Market Rent per SF - NNN $21.62 Projected Renewal Probability 70% Projected Residual Value per SF $269.20 Present Value of Residual per SF $22.34 Lease Lease Term 23.8 Years Current Rent per SF $24.74 Average Annual Rent Increases 0.00% Discount Rate for Lease Cash Flows (Based on Tenant Credit) 5.25% Present Value of Contractual Lease Cash Flows $332.19 Valuation Projected Market Cap Rate 6.98% Projected Market Value per SF $355 Projected Market Value $5,158,474 |
| XXXVI. WALGREEN CO. The Property is a 14,820-square foot retail property (drug store) located at 700 Edwardsville Road in Troy, Madison County, Illinois The improvements, situated on a 1.76-acre site, were completed recently with Walgreens The Property is leased to Walgreens for a term of 75 years, with Walgreens having an option to terminate after 25 years The Class A Property is 100% occupied by Walgreens, rated A by S&P Property Overview Market Overview The Property is located in the city of Troy, IL in the St. Louis Metropolitan area, a Bi-State region that includes the areas of Missouri and Illinois Interstate 55/70 provides primary access to the area, connecting the Property with the St. Louis Central Business District approximately 17 miles to the southwest Interstate 270, approximately one-mile north, also provides primary access to the area Chicago is approximately 300 miles to the northeast and Kansas City is approximately 250 miles to the west St. Louis Retail Market # Bldgs Total RBA Central St Louis Cnty Ret 543 6,013,846 5.60% $15.36 Franklin County Ret 196 2,715,080 3.90% $7.57 Jefferson County Ret 127 1,285,773 8.90% $10.56 Lincoln County Ret 27 364,644 14.90% $13.16 Metro East Illinois Ret 512 3,956,474 6.20% $10.64 NE Metro Illinois Ret 158 1,625,353 1.60% $17.17 North St Louis County Ret 839 8,308,127 9.90% $9.40 Outer Metro Illinois Ret 37 181,867 7.70% $4.73 Outer Monroe County Ret 2 4,816 0.00% $0.00 Outer St Louis County Ret 41 289,893 8.10% $17.94 SE Metro Illinois Ret 80 801,943 3.50% $9.80 South St Louis County Ret 318 4,480,652 5.00% $11.52 St Charles County Ret 607 6,721,582 6.30% $12.64 St Louis City Ret 1,344 10,877,659 7.70% $10.84 SW St Louis County Ret 254 2,209,104 4.20% $13.69 West St Louis County Ret 252 3,629,279 5.30% $13.88 Totals 5,337 53,466,092 6.60% $11.60 Quoted Rates Existing Inventory Vacancy |
| Underwriting XXXVI. WALGREEN CO. Property and Lease Overview Property Address 640 Edwardsville Road (Troy, IL) MSA St. Louis, MO Property Type Retail SF 14,820 Tenant / Guarantor Walgreen Co. Credit Rating A Assumptions and Underwriting Real Estate Estimated Market Rent per SF - NNN $12.00 Projected Annual Market Rent Growth Over Lease Term 2.50% Projected Residual Year Market Rent per SF - NNN $21.85 Projected Renewal Probability 70% Projected Residual Value per SF $244.44 Present Value of Residual per SF $19.42 Lease Lease Term 24.3 Years Current Rent per SF $20.24 Average Annual Rent Increases 0.00% Discount Rate for Lease Cash Flows (Based on Tenant Credit) 5.25% Present Value of Contractual Lease Cash Flows $274.20 Valuation Projected Market Cap Rate 6.89% Projected Market Value per SF $294 Projected Market Value $4,351,398 |
| XXXVII. WALGREEN CO. The Property is a 14,820-square foot retail property (drug store) located in Maryville, Madison County, Illinois The improvements were completed in 2008 and are situated on a 1.82-acre site The Property is leased to Walgreens for a term of 75 years, with Walgreens having an option to terminate after 25 years The Class A Property is 100% occupied by Walgreens, rated A by S&P Property Overview Market Overview The Property is located in the city of Troy, IL in the St. Louis Metropolitan area, a Bi-State region that includes the areas of Missouri and Illinois State Route 159 and State Route 162 provide primary access to the neighborhood The commercial uses includes power centers, big box retail, community centers, fast food and dine-in restaurants, gas stations, strip centers, freestanding retail, and service stations Chicago is approximately 300 miles to the northeast and Kansas City is approximately 250 miles to the west St. Louis Retail Market # Bldgs Total RBA Central St Louis Cnty Ret 543 6,013,846 5.60% $15.36 Franklin County Ret 196 2,715,080 3.90% $7.57 Jefferson County Ret 127 1,285,773 8.90% $10.56 Lincoln County Ret 27 364,644 14.90% $13.16 Metro East Illinois Ret 512 3,956,474 6.20% $10.64 NE Metro Illinois Ret 158 1,625,353 1.60% $17.17 North St Louis County Ret 839 8,308,127 9.90% $9.40 Outer Metro Illinois Ret 37 181,867 7.70% $4.73 Outer Monroe County Ret 2 4,816 0.00% $0.00 Outer St Louis County Ret 41 289,893 8.10% $17.94 SE Metro Illinois Ret 80 801,943 3.50% $9.80 South St Louis County Ret 318 4,480,652 5.00% $11.52 St Charles County Ret 607 6,721,582 6.30% $12.64 St Louis City Ret 1,344 10,877,659 7.70% $10.84 SW St Louis County Ret 254 2,209,104 4.20% $13.69 West St Louis County Ret 252 3,629,279 5.30% $13.88 Totals 5,337 53,466,092 6.60% $11.60 Quoted Rates Existing Inventory Vacancy |
| Underwriting XXXVII. WALGREEN CO. Property and Lease Overview Property Address 6607 State Route 162 (Maryville, IL) MSA St. Louis, MO Property Type Retail SF 14,820 Tenant / Guarantor Walgreen Co. Credit Rating A Assumptions and Underwriting Real Estate Estimated Market Rent per SF - NNN $12.00 Projected Annual Market Rent Growth Over Lease Term 2.50% Projected Residual Year Market Rent per SF - NNN $21.40 Projected Renewal Probability 70% Projected Residual Value per SF $271.81 Present Value of Residual per SF $23.56 Lease Lease Term 23.4 Years Current Rent per SF $25.10 Average Annual Rent Increases 0.00% Discount Rate for Lease Cash Flows (Based on Tenant Credit) 5.25% Present Value of Contractual Lease Cash Flows $333.99 Valuation Projected Market Cap Rate 7.02% Projected Market Value per SF $358 Projected Market Value $5,298,835 |
| XXXVIII. WALGREEN CO. The Property is a 14,820-square foot Walgreens that is located in St. Louis, Missouri The improvements were completed in 2009 and are situated on a 1.54-acre site The Property is leased to Walgreens for a term of 75 years, with Walgreens having an option to terminate after 25 years The Class A Property is 100% occupied by Walgreens, rated A by S&P Property Overview Market Overview The Property is located in the city of Troy, IL in the St. Louis Metropolitan area, a Bi-State region that includes the areas of Missouri and Illinois The neighborhood is served by both Interstate 44 and U.S. Highway 40 Interstate 44 and U.S Highway 40 are both east-west interstate that provides eastward to the St. Louis CBD and westward into St. Louis County Chicago is approximately 300 miles to the northeast and Kansas City is approximately 250 miles to the west St. Louis Retail Market # Bldgs Total RBA Central St Louis Cnty Ret 543 6,013,846 5.60% $15.36 Franklin County Ret 196 2,715,080 3.90% $7.57 Jefferson County Ret 127 1,285,773 8.90% $10.56 Lincoln County Ret 27 364,644 14.90% $13.16 Metro East Illinois Ret 512 3,956,474 6.20% $10.64 NE Metro Illinois Ret 158 1,625,353 1.60% $17.17 North St Louis County Ret 839 8,308,127 9.90% $9.40 Outer Metro Illinois Ret 37 181,867 7.70% $4.73 Outer Monroe County Ret 2 4,816 0.00% $0.00 Outer St Louis County Ret 41 289,893 8.10% $17.94 SE Metro Illinois Ret 80 801,943 3.50% $9.80 South St Louis County Ret 318 4,480,652 5.00% $11.52 St Charles County Ret 607 6,721,582 6.30% $12.64 St Louis City Ret 1,344 10,877,659 7.70% $10.84 SW St Louis County Ret 254 2,209,104 4.20% $13.69 West St Louis County Ret 252 3,629,279 5.30% $13.88 Totals 5,337 53,466,092 6.60% $11.60 Quoted Rates Existing Inventory Vacancy |
| Underwriting XXXVIII. WALGREEN CO. Property and Lease Overview Property Address 1530 Lafayette Ave MSA St. Louis, MO Property Type Retail SF 14,820 Tenant / Guarantor Walgreen Co. Credit Rating A Assumptions and Underwriting Real Estate Estimated Market Rent per SF - NNN $12.00 Projected Annual Market Rent Growth Over Lease Term 2.50% Projected Residual Year Market Rent per SF - NNN $21.89 Projected Renewal Probability 70% Projected Residual Value per SF $260.01 Present Value of Residual per SF $20.48 Lease Lease Term 24.4 Years Current Rent per SF $23.62 Average Annual Rent Increases 0.00% Discount Rate for Lease Cash Flows (Based on Tenant Credit) 5.25% Present Value of Contractual Lease Cash Flows $320.46 Valuation Projected Market Cap Rate 6.93% Projected Market Value per SF $341 Projected Market Value $5,052,657 |
| XXXIX. WALGREEN CO. The Property is a 15,120 square foot Walgreens that is situated just west of St. Louis, Missouri The improvements were completed in 2005 The Property is leased to Walgreens for a term of 75 years, with Walgreens having an option to terminate after 25 years The Property is 100% occupied by Walgreens, rated A by S&P Property Overview Market Overview The Property is located in the city of Wildwood, MO in the St. Louis Metropolitan area, a Bi-State region that includes the areas of Missouri and Illinois The neighborhood is served by both Interstate 44 and Interstate 64 Chicago is approximately 300 miles to the northeast and Kansas City is approximately 200 miles to the west St. Louis Retail Market # Bldgs Total RBA Central St Louis Cnty Ret 543 6,013,846 5.60% $15.36 Franklin County Ret 196 2,715,080 3.90% $7.57 Jefferson County Ret 127 1,285,773 8.90% $10.56 Lincoln County Ret 27 364,644 14.90% $13.16 Metro East Illinois Ret 512 3,956,474 6.20% $10.64 NE Metro Illinois Ret 158 1,625,353 1.60% $17.17 North St Louis County Ret 839 8,308,127 9.90% $9.40 Outer Metro Illinois Ret 37 181,867 7.70% $4.73 Outer Monroe County Ret 2 4,816 0.00% $0.00 Outer St Louis County Ret 41 289,893 8.10% $17.94 SE Metro Illinois Ret 80 801,943 3.50% $9.80 South St Louis County Ret 318 4,480,652 5.00% $11.52 St Charles County Ret 607 6,721,582 6.30% $12.64 St Louis City Ret 1,344 10,877,659 7.70% $10.84 SW St Louis County Ret 254 2,209,104 4.20% $13.69 West St Louis County Ret 252 3,629,279 5.30% $13.88 Totals 5,337 53,466,092 6.60% $11.60 Quoted Rates Existing Inventory Vacancy |
| Underwriting XXXIX. WALGREEN CO. Property and Lease Overview Property Address 100 Plaza Drive (Wildwood, MO) MSA St. Louis, MO Property Type Retail SF 15,120 Tenant / Guarantor Walgreen Co. Credit Rating A Assumptions and Underwriting Real Estate Estimated Market Rent per SF - NNN $12.00 Projected Annual Market Rent Growth Over Lease Term 2.50% Projected Residual Year Market Rent per SF - NNN $17.53 Projected Renewal Probability 90% Projected Residual Value per SF $313.51 Present Value of Residual per SF $83.53 Lease Lease Term 15.3 Years Current Rent per SF $27.38 Average Annual Rent Increases 0.00% Discount Rate for Lease Cash Flows (Based on Tenant Credit) 5.25% Present Value of Contractual Lease Cash Flows $283.73 Valuation Projected Market Cap Rate 7.46% Projected Market Value per SF $367 Projected Market Value $5,553,019 |
| XL. EXPRESS SCRIPTS, INC. Property Overview The 181,141 square foot four-story building is situated on 10.1 acres leased for 99 years from the University of Missouri, St. Louis Express Scripts II was an expansion of the company’s adjacent corporate Headquarters, and was designed with state-of-the-art construction materials and systems The building complies with U.S. Building Council’s LEED construction requirements Express Scripts, Inc., is a Fortune 150 company and is one of the nation’s leading managers of pharmacy benefit plans The facility is 100% occupied by Express Scripts, Inc., rated BBB by S&P Market Overview The Property is located at the front entry to the University of Missouri-St. Louis campus Adjacent to NorthPark and Lambert/St. Louis International Airport, the Property has immediate access to Interstate 70 and is ½ mile east of the Interstate 170 interchange Frontage on Interstate 70 at 4-way interchange provides easy access to the entire St. Louis metro area Located within a major metropolitan area, NorthPark offers a well-developed and easily adaptable physical infrastructure, as well as access to a large, motivated workforce St. Louis Class A Office Market # Bldgs Total RBA Central County 70 10,471,880 9.50% $24.80 Illinois 14 556,350 26.20% $23.81 North St Louis County 24 3,834,064 18.60% $20.56 South St Louis County 11 736,413 25.90% $21.32 St Charles County 26 2,698,869 6.90% $21.66 St Louis City 39 12,955,969 13.30% $19.46 West St Louis County 56 5,985,672 8.60% $23.69 Totals 240 37,239,217 12.00% $22.04 Quoted Gross Rates Existing Inventory Vacancy |
| Underwriting XL. EXPRESS SCRIPTS, INC. Property and Lease Overview Property Address 8455 University Place Drive MSA St. Louis, MO Property Type Office SF 181,141 Tenant / Guarantor Express Scripts, Inc. Credit Rating BBB Assumptions and Underwriting Real Estate Estimated Market Rent per SF - NNN $15.00 Projected Annual Market Rent Growth Over Lease Term 3.00% Projected Residual Year Market Rent per SF - NNN $19.29 Projected Renewal Probability 90% Projected Residual Value per SF $212.64 Present Value of Residual per SF $94.49 Lease Lease Term 8.5 Years Current Rent per SF $15.24 Average Annual Rent Increases 2.00% Discount Rate for Lease Cash Flows (Based on Tenant Credit) 5.50% Present Value of Contractual Lease Cash Flows $108.65 Valuation Projected Market Cap Rate 7.50% Projected Market Value per SF $203 Projected Market Value $36,796,753 |
| Property Overview XLI. EXPRESS SCRIPTS, INC. The Property is Express Scripts’ High Volume Filler, a fast-track, 221,000 square foot office / production facility The facility houses a selection of ESI’s back of house pharmacy functions and fills approximately 100,000 prescriptions per day using proprietary equipment The facility contains 6,000 square feet of freezer/cooler space, secured specialty drug areas, and 51,000 square feet of mezzanine space for mail rooms and production offices. The facility also contains a unique, ¼ mile elevated tour path, where customers tour the facility walking above and through the production equipment The facility is 100% occupied by Express Scripts, Inc., rated BBB by S&P Market Overview The Property is located at the front entry to the University of Missouri-St. Louis campus Adjacent to NorthPark and Lambert/St. Louis International Airport, the Property has immediate access to Interstate 70 and is ½ mile east of the Interstate 170 interchange Frontage on Interstate 70 at 4-way interchange provides easy access to the entire St. Louis metro area Located within a major metropolitan area, NorthPark offers a well-developed and easily adaptable physical infrastructure, as well as access to a large, motivated workforce St. Louis Class A Office Market # Bldgs Total RBA Central County 70 10,471,880 9.50% $24.80 Illinois 14 556,350 26.20% $23.81 North St Louis County 24 3,834,064 18.60% $20.56 South St Louis County 11 736,413 25.90% $21.32 St Charles County 26 2,698,869 6.90% $21.66 St Louis City 39 12,955,969 13.30% $19.46 West St Louis County 56 5,985,672 8.60% $23.69 Totals 240 37,239,217 12.00% $22.04 Quoted Gross Rates Existing Inventory Vacancy |
| Underwriting XLI. EXPRESS SCRIPTS, INC. Property and Lease Overview Property Address NorthPark MSA St. Louis, MO Property Type Industrial SF 221,000 Tenant / Guarantor Express Scripts, Inc. Credit Rating BBB Assumptions and Underwriting Real Estate Estimated Market Rent per SF - NNN $6.00 Projected Annual Market Rent Growth Over Lease Term 3.00% Projected Residual Year Market Rent per SF - NNN $8.01 Projected Renewal Probability 90% Projected Residual Value per SF $92.57 Present Value of Residual per SF $39.04 Lease Lease Term 9.8 Years Current Rent per SF $6.64 Average Annual Rent Increases 0.65% Discount Rate for Lease Cash Flows (Based on Tenant Credit) 5.50% Present Value of Contractual Lease Cash Flows $50.43 Valuation Projected Market Cap Rate 7.42% Projected Market Value per SF $89 Projected Market Value $19,773,364 |

